UNITED STATES
SECURITIES AND EXCHANGE COMMISSION
Washington, D.C. 20549
FORM N-CSR
CERTIFIED SHAREHOLDER REPORT OF REGISTERED MANAGEMENT INVESTMENT COMPANIES
Investment Company Act file number 811- 07584
Rydex Series Funds
(Exact name of registrant as specified in charter)
702 King Farm Boulevard, Suite 200
Rockville, Maryland 20850
(Address of principal executive offices) (Zip code)
Amy J. Lee
Rydex Series Funds
702 King Farm Boulevard, Suite 200
Rockville, Maryland 20850
(Name and address of agent for service)
Registrant's telephone number, including area code: 1-301-296-5100
Date of fiscal year end: March 31
Date of reporting period: April 1, 2020 - March 31, 2021
Form N-CSR is to be used by management investment companies to file reports with the Commission not later than 10 days after the transmission to stockholders of any report that is required to be transmitted to stockholders under Rule 30e-1 under the Investment Company Act of 1940 (17 CFR 270.30e-1). The Commission may use the information provided on Form N-CSR in its regulatory, disclosure review, inspection, and policymaking roles.
A registrant is required to disclose the information specified by Form N-CSR, and the Commission will make this information public. A registrant is not required to respond to the collection of information contained in Form N-CSR unless the Form displays a currently valid Office of Management and Budget ("OMB") control number. Please direct comments concerning the accuracy of the information collection burden estimate and any suggestions for reducing the burden to Secretary, Securities and Exchange Commission, 450 Fifth Street, NW, Washington, DC 20549-0609. The OMB has reviewed this collection of information under the clearance requirements of 44 U.S.C. § 3507.
Item 1. Reports to Stockholders.
The registrant’s annual report transmitted to shareholders pursuant to Rule 30e-1 under the Investment Company Act of 1940, as amended (the “Investment Company Act”), is as follows:
3.31.2021
Rydex Funds Annual Report
Sector Funds |
Banking Fund | | |
Basic Materials Fund | | |
Biotechnology Fund | | |
Consumer Products Fund | | |
Electronics Fund | | |
Energy Fund | | |
Energy Services Fund | | |
Financial Services Fund | | |
Health Care Fund | | |
Internet Fund | | |
Leisure Fund | | |
Precious Metals Fund | | |
Real Estate Fund | | |
Retailing Fund | | |
Technology Fund | | |
Telecommunications Fund | | |
Transportation Fund | | |
Utilities Fund | | |
GuggenheimInvestments.com | RSECF-ANN-2-0321x0322 |

| | |
DEAR SHAREHOLDER | 2 |
ECONOMIC AND MARKET OVERVIEW | 3 |
ABOUT SHAREHOLDERS’ FUND EXPENSES | 5 |
BANKING FUND | 10 |
BASIC MATERIALS FUND | 18 |
BIOTECHNOLOGY FUND | 26 |
CONSUMER PRODUCTS FUND | 34 |
ELECTRONICS FUND | 42 |
ENERGY FUND | 50 |
ENERGY SERVICES FUND | 58 |
FINANCIAL SERVICES FUND | 66 |
HEALTH CARE FUND | 76 |
INTERNET FUND | 84 |
LEISURE FUND | 92 |
PRECIOUS METALS FUND | 101 |
REAL ESTATE FUND | 109 |
RETAILING FUND | 118 |
TECHNOLOGY FUND | 126 |
TELECOMMUNICATIONS FUND | 135 |
TRANSPORTATION FUND | 143 |
UTILITIES FUND | 151 |
NOTES TO FINANCIAL STATEMENTS | 159 |
REPORT OF INDEPENDENT REGISTERED PUBLIC ACCOUNTING FIRM | 172 |
OTHER INFORMATION | 173 |
INFORMATION ON BOARD OF TRUSTEES AND OFFICERS | 175 |
GUGGENHEIM INVESTMENTS PRIVACY NOTICE | 180 |
| | THE RYDEX FUNDS ANNUAL REPORT | 1 |
Dear Shareholder:
Security Investors, LLC (the “Investment Adviser”) is pleased to present the annual shareholder report for Rydex Sector Funds (the “Fund” or “Funds”). This report covers performance for the 12-month period ended March 31, 2021.
The Investment Adviser is part of Guggenheim Investments, which represents the investment management businesses of Guggenheim Partners, LLC (“Guggenheim”), a global, diversified financial services firm.
Guggenheim Funds Distributors, LLC is the distributor of the Funds. Guggenheim Funds Distributors, LLC is affiliated with Guggenheim and the Investment Adviser.
We encourage you to read the Economic and Market Overview section of the report, which follows this letter, and then the Performance Report and Fund Profile for the Fund.
We are committed to providing innovative investment solutions and appreciate the trust you place in us.
Sincerely,
Security Investors, LLC
April 30, 2021
Read a prospectus and summary prospectus (if available) carefully before investing. It contains the investment objectives, risks, charges, expenses and other information, which should be considered carefully before investing. Obtain a prospectus and summary prospectus (if available) at guggenheiminvestments.com or call 800.820.0888.
This material is not intended as a recommendation or as investment advice of any kind, including in connection with rollovers, transfers, and distributions. Such material is not provided in a fiduciary capacity, may not be relied upon for or in connection with the making of investment decisions, and does not constitute a solicitation of an offer to buy or sell securities. All content has been provided for informational or educational purposes only and is not intended to be and should not be construed as legal or tax advice and/or a legal opinion. Always consult a financial, tax and/or legal professional regarding your specific situation.
COVID-19. The global ongoing crisis caused by the outbreak of COVID-19 and the current recovery underway is causing disruption to consumer demand and economic output and supply chains. There are still travel restrictions and quarantines, and adverse impacts on local and global economies. Investors should be aware that in light of the current uncertainty, volatility and distress in economies, the financial markets, and labor and public health conditions around the world, the Funds’ investments and a shareholder’s investment in the Fund are subject to investment risk, including the possible loss of the entire principal amount invested. Firms through which investors invest with the Funds, the Funds, their service providers, the markets in which they invest and market intermediaries are also impacted by quarantines and similar measures intended to respond to and contain the ongoing pandemic, which can obstruct their functioning and subject them to heightened operational and other risks.
Sector funds may not be suitable for all investors. Investing in sector funds is more volatile than investing in broadly diversified funds, as there is a greater risk due to the concentration of the fund’s holdings in issuers within the same sector or industry. Certain of the sector funds are considered non-diversified and can invest a greater portion of their assets in securities of individual issuers than a diversified fund. As a result, changes in the market value of a single security could cause greater fluctuations in the value of fund shares than would occur in a more diversified fund.
2 | THE RYDEX FUNDS ANNUAL REPORT | |
ECONOMIC AND MARKET OVERVIEW (Unaudited) | March 31, 2021 |
In the 12 months ended March 31, 2021, the Standard & Poor’s 500® (“S&P 500®”) Index returned 56.35% as the equity market roared back to life after a sharp COVID-19-related selloff. This increase was in spite of ongoing personal and economic hardships imposed by COVID-19, highlighting the crucial role of policy support in the form of monetary and fiscal stimulus, which has succeeded in averting a lengthy recession in the U.S. These policy initiatives, particularly on the monetary side, increased market liquidity and lowered borrowing rates, reassuring equity investors that the Federal Reserve (the “Fed”) would do everything in its power to maintain market stability.
We upgraded our 2021 U.S. economic growth forecast during the first quarter from 5.5% to over 7%, factoring in more fiscal stimulus than previously anticipated. This forecast captures the effect of stimulus representing roughly 11% of 2020–2021 gross domestic product (“GDP”), versus the previous calculation of about 8%. We see strength in the consumer sector and in housing activity. In addition, U.S. vaccinations for COVID-19 continue to accelerate, nearing 3 million doses per day by the end of the first quarter. More than 213 million doses have been administered in the U.S. so far, and about 35% of the U.S. population has been fully vaccinated. The U.S. is seeing the best-case scenario unfold in its vaccine rollout, but other countries have not been as fortunate.
Europe’s vaccine rollout hit a major speedbump during the first quarter when questions surrounding the safety of the AstraZeneca vaccine led several major European countries to temporarily suspend distribution. Safety concerns, coupled with supply constraints, meant that less than 10% of the populations in Germany, France, and Italy had been vaccinated by the end of the first quarter, well under the pace needed to reach 70% inoculated by summer. Any delay in ending the pandemic on a global scale has implications for other countries too, including the U.S., where travel and hospitality workers represent a large share of the unemployed.
Despite vaccination delays in Europe and its implications abroad, we saw meaningful improvement in the labor market in the first quarter as states moved forward with business re-openings. Seasonally adjusted initial jobless claims fell by 97,000 to 684,000 in the week ending March 20, 2021 the lowest level since the pandemic began, before seeing an uptick the following week to 719,000. We saw more positive news across the board in the March payroll report with 916,000 jobs added, with 156,000 more from revisions. Standing in the way of additional labor market gains are local government restrictions on certain sectors, although easing of these restrictions is expected by summer.
Economic developments drove a sharp increase in U.S. Treasury yields. The market pulled forward expectations of the next Fed rate hike from December 2023 to December 2022, while repricing the long-run terminal fed funds rate estimate to 2.25% from just 0.55% last August. We do not expect the Fed to raise interest rates as early as the market is anticipating, even though we expect strong GDP growth in coming years.
Year-over-year inflation measures will rise over the next several months due to base effects, which may be compounded by supply chain disruptions in the goods sector and potential capacity constraints for certain services. However, we think these factors will prove to be short-lived, with base effects set to dampen inflation starting in the summer months. Moreover, the Fed is focused on generating sustainably higher inflation. Even if core inflation rises above the Fed’s 2% target in 2021, the Fed’s focus is on a long-term average of 2%. With years of shortfalls to make up, and the Fed now targeting labor market disparities as part of an expanded definition of full employment, we expect policymakers to remain resolutely patient. Any tapering of asset purchases will likely be deferred until later in 2022, with the first rate hike likely to come sometime after that.
We expect easy financial conditions and low rates to support credit over the next few years. With market optimism pulling forward rate hike expectations and causing bond yields to rise, we view this as an opportunity to add incremental yield to portfolios.
For the 12-month period ended March 31, 2021, the S&P 500® Index* returned, as noted, 56.35%. The MSCI Europe-Australasia-Far East (“EAFE”) Index* returned 44.57%. The return of the MSCI Emerging Markets Index* was 58.39%.
In the bond market, the Bloomberg Barclays U.S. Aggregate Bond Index* posted a 0.71% return for the 12-month period, while the Bloomberg Barclays U.S. Corporate High Yield Index* returned 23.72%. The return of the ICE Bank of America (“BofA”) Merrill Lynch 3-Month U.S. Treasury Bill Index* was 0.12% for the 12-month period.
The opinions and forecasts expressed may not actually come to pass. This information is subject to change at any time, based on market and other conditions, and should not be construed as a recommendation of any specific security or strategy.
| | THE RYDEX FUNDS ANNUAL REPORT | 3 |
ECONOMIC AND MARKET OVERVIEW (Unaudited)(concluded) | March 31, 2021 |
*Index Definitions:
The following indices are referenced throughout this report. Indices are unmanaged and not available for direct investment. Index performance does not reflect transaction costs, fees, or expenses.
Bloomberg Barclays U.S. Aggregate Bond Index is a broad-based flagship benchmark that measures the investment grade, U.S. dollar-denominated, fixed-rate taxable bond market, including U.S. Treasuries, government-related and corporate securities, mortgage-backed securities or “MBS” (agency fixed-rate and hybrid adjustable-rate mortgage, or “ARM”, pass-throughs), asset-backed securities (“ABS”), and commercial mortgage-backed securities (“CMBS”) (agency and non-agency).
Bloomberg Barclays U.S. Corporate High Yield Index measures the U.S. dollar-denominated, high yield, fixed-rate corporate bond market. Securities are classified as high yield if the middle rating of Moody’s, Fitch, and S&P is Ba1/BB +/BB + or below.
ICE BofA Merrill Lynch 3-Month U.S. Treasury Bill Index is an unmanaged market index of U.S. Treasury securities maturing in 90 days that assumes reinvestment of all income.
MSCI EAFE Index is a free float-adjusted market capitalization index that is designed to measure the equity market performance of developed markets, excluding the U.S. & Canada.
MSCI Emerging Markets Index is a free float-adjusted market capitalization weighted index that is designed to measure equity market performance in the global emerging markets.
MSCI U.S. REIT Index is a free float market capitalization weighted index that is comprised of equity real estate investment trust (“REIT”) securities that belong to the MSCI U.S. Investable Market 2500 Index. The MSCI U.S. REIT Index includes only REIT securities that are of reasonable size in terms of full and free float-adjusted market capitalization to ensure that the performance of the equity REIT universe can be captured and replicated in actual institutional and retail portfolios of different sizes.
S&P 500® is a broad-based index, the performance of which is based on the performance of 500 widely held common stocks chosen for market size, liquidity, and industry group representation.
S&P 500® Consumer Discretionary Index is a sub-index of the S&P 500® . The Consumer Discretionary index includes companies in the following industries: automobiles and components, consumer durables, apparel, hotels, restaurants, leisure, media and retailing.
S&P 500® Consumer Staples Index is a sub-index of the S&P 500® . The Consumer Staples index comprises companies whose businesses are less sensitive to economic cycles. It includes manufacturers and distributors of food, beverages and tobacco and producers of non-durable household goods and personal products. It also includes food & drug retailing companies as well as hypermarkets and consumer super centers.
S&P 500® Energy Index is a sub-index of the S&P 500® . The Energy index comprises companies whose businesses are dominated by either of the following activities: the construction or provision of oil rigs, drilling equipment and other energy-related equipment and services, including seismic data collection; companies engaged in the exploration, production, marketing, refining and/or transportation of oil and gas products, coal and other consumable fuels.
S&P 500® Financials Index is a sub-index of the S&P 500® . The Financials index contains companies involved in activities such as banking, mortgage finance, consumer finance, specialized finance, investment banking and brokerage, asset management and custody, corporate lending, insurance, and financial investment, and real estate, including REITs.
S&P 500® Health Care Index is a sub-index of the S&P 500® . The Health Care index encompasses two main industry groups. The first includes companies which manufacture health care equipment and supplies or provide health care related services, including distributors of health care products, providers of basic health-care services, and owners and operators of health care facilities and organizations. The first group also includes companies operating in the health care technology industry. The second group includes companies primarily involved in the research, development, production and marketing of pharmaceuticals, biotechnology and life sciences products.
S&P 500® Industrials Index is a sub-index of the S&P 500® . The Industrials index includes companies whose businesses are dominated by one of the following activities: the manufacture and distribution of capital goods, including aerospace & defense, construction, engineering & building products, electrical equipment and industrial machinery; the provision of commercial services and supplies, including printing, environmental, office and security services; the provision of professional services, including employment and research & consulting services; or the provision of transportation services, including airlines, couriers, marine, road & rail and transportation infrastructure.
S&P 500® Information Technology Index is a sub-index of the S&P 500® . The Information Technology index covers the following general areas: technology software & services, including companies that primarily develop software in various fields such as the internet, applications, systems, databases management and/or home entertainment, and companies that provide information technology consulting and services, as well as data processing and outsourced services; secondly, technology hardware & equipment, including manufacturers and distributors of communications equipment, computers & peripherals, electronic equipment and related instruments; and thirdly, semiconductors & semiconductor equipment manufacturers.
S&P 500® Materials Index is a sub-index of the S&P 500® . The Materials index encompasses a wide range of commodity-related manufacturing industries. Included in this sector are companies that manufacture chemicals, construction materials, glass, paper, forest products and related packaging products, and metals, minerals and mining companies, including producers of steel.
S&P 500® Telecommunications Services Index is a sub-index of the S&P 500® . The Telecommunications Services index contains companies that provide communications services primarily through a fixed-line, cellular, wireless, high bandwidth and/or fiber optic cable network.
S&P 500® Utilities Index is a sub-index of the S&P 500® . The Utilities index encompasses those companies considered electric, gas or water utilities, or companies that operate as independent producers and/or distributors of power.
4 | THE RYDEX FUNDS ANNUAL REPORT | |
ABOUT SHAREHOLDERS’ FUND EXPENSES (Unaudited) | |
All mutual funds have operating expenses, and it is important for our shareholders to understand the impact of costs on their investments. Shareholders of a fund incur two types of costs: (i) transaction costs, including sales charges (loads) on purchase payments, reinvested dividends, other distributions, and exchange fees, and (ii) ongoing costs, including management fees, administrative services, and shareholder reports, among others. These ongoing costs, or operating expenses, are deducted from a fund’s gross income and reduce the investment return of the fund.
A fund’s expenses are expressed as a percentage of its average net assets, which is known as the expense ratio. The following examples are intended to help investors understand the ongoing costs (in dollars) of investing in a fund and to compare these costs with the ongoing costs of investing in other mutual funds.
The examples are based on an investment of $1,000 made at the beginning of the period and held for the entire six-month period beginning September 30, 2020 and ending March 31, 2021.
The following tables illustrate the Funds’ costs in two ways:
Table 1. Based on actual Fund return: This section helps investors estimate the actual expenses paid over the period. The “Ending Account Value” shown is derived from the Fund’s actual return, and the fifth column shows the dollar amount that would have been paid by an investor who started with $1,000 in the Fund. Investors may use the information here, together with the amount invested, to estimate the expenses paid over the period. Simply divide the Fund’s account value by $1,000 (for example, an $8,600 account value divided by $1,000 = 8.6), then multiply the result by the number provided under the heading “Expenses Paid During Period.”
Table 2. Based on hypothetical 5% return: This section is intended to help investors compare a fund’s cost with those of other mutual funds. The table provides information about hypothetical account values and hypothetical expenses based on the Fund’s actual expense ratio and an assumed rate of return of 5% per year before expenses, which is not the Fund’s actual return. The hypothetical account values and expenses may not be used to estimate the actual ending account balance or expenses paid during the period. The example is useful in making comparisons because the U.S. Securities and Exchange Commission (the “SEC”) requires all mutual funds to calculate expenses based on the 5% return. Investors can assess a fund’s costs by comparing this hypothetical example with the hypothetical examples that appear in shareholder reports of other funds.
The calculations illustrated above assume no shares were bought or sold during the period. Actual costs may have been higher or lower, depending on the amount of investment and the timing of any purchases or redemptions.
Please note that the expenses shown in the table are meant to highlight your ongoing costs only and do not reflect any transactional costs, such as sales charges (loads) on purchase payments, and contingent deferred sales charges (“CDSC”) on redemptions, if any. Therefore, the second table is useful in comparing ongoing costs only, and will not help you determine the relative total costs of owning different funds. In addition, if these transactional costs were included, your costs would have been higher.
More information about the Funds’ expenses, including annual expense ratios for periods up to five years (subject to the Fund’s inception date), can be found in the Financial Highlights section of this report. For additional information on operating expenses and other shareholder costs, please refer to the appropriate Fund prospectus.
| | THE RYDEX FUNDS ANNUAL REPORT | 5 |
ABOUT SHAREHOLDERS’ FUND EXPENSES (Unaudited)(continued) | |
| Expense
Ratio1 | Fund
Return | Beginning
Account Value
September 30, 2020 | Ending
Account Value
March 31, 2021 | Expenses
Paid During
Period2 |
Table 1. Based on actual Fund return3 | | | | | |
Banking Fund | | | | | |
Investor Class | 1.39% | 71.65% | $ 1,000.00 | $ 1,716.50 | $ 9.41 |
A-Class | 1.65% | 71.40% | 1,000.00 | 1,714.00 | 11.16 |
C-Class | 2.40% | 70.79% | 1,000.00 | 1,707.90 | 16.20 |
H-Class | 1.62% | 71.39% | 1,000.00 | 1,713.90 | 10.96 |
Basic Materials Fund | | | | | |
Investor Class | 1.40% | 32.16% | 1,000.00 | 1,321.60 | 8.10 |
A-Class | 1.65% | 31.99% | 1,000.00 | 1,319.90 | 9.54 |
C-Class | 2.40% | 31.50% | 1,000.00 | 1,315.00 | 13.85 |
H-Class | 1.67% | 31.98% | 1,000.00 | 1,319.80 | 9.66 |
Biotechnology Fund | | | | | |
Investor Class | 1.40% | 9.25% | 1,000.00 | 1,092.50 | 7.30 |
A-Class | 1.65% | 9.10% | 1,000.00 | 1,091.00 | 8.60 |
C-Class | 2.40% | 8.69% | 1,000.00 | 1,086.90 | 12.49 |
H-Class | 1.65% | 9.11% | 1,000.00 | 1,091.10 | 8.60 |
Consumer Products Fund | | | | | |
Investor Class | 1.41% | 13.31% | 1,000.00 | 1,133.10 | 7.50 |
A-Class | 1.65% | 13.15% | 1,000.00 | 1,131.50 | 8.77 |
C-Class | 2.41% | 12.73% | 1,000.00 | 1,127.30 | 12.78 |
H-Class | 1.65% | 13.15% | 1,000.00 | 1,131.50 | 8.77 |
Electronics Fund | | | | | |
Investor Class | 1.39% | 40.09% | 1,000.00 | 1,400.90 | 8.32 |
A-Class | 1.65% | 39.92% | 1,000.00 | 1,399.20 | 9.87 |
C-Class | 2.40% | 39.39% | 1,000.00 | 1,393.90 | 14.32 |
H-Class | 1.65% | 39.91% | 1,000.00 | 1,399.10 | 9.87 |
Energy Fund | | | | | |
Investor Class | 1.38% | 71.57% | 1,000.00 | 1,715.70 | 9.34 |
A-Class | 1.63% | 71.37% | 1,000.00 | 1,713.70 | 11.03 |
C-Class | 2.40% | 70.72% | 1,000.00 | 1,707.20 | 16.20 |
H-Class | 1.64% | 71.34% | 1,000.00 | 1,713.40 | 11.09 |
Energy Services Fund | | | | | |
Investor Class | 1.39% | 82.83% | 1,000.00 | 1,828.30 | 9.80 |
A-Class | 1.65% | 82.59% | 1,000.00 | 1,825.90 | 11.62 |
C-Class | 2.39% | 81.93% | 1,000.00 | 1,819.30 | 16.80 |
H-Class | 1.63% | 82.59% | 1,000.00 | 1,825.90 | 11.48 |
Financial Services Fund | | | | | |
Investor Class | 1.38% | 36.89% | 1,000.00 | 1,368.90 | 8.15 |
A-Class | 1.67% | 36.72% | 1,000.00 | 1,367.20 | 9.86 |
C-Class | 2.39% | 36.22% | 1,000.00 | 1,362.20 | 14.08 |
H-Class | 1.64% | 36.71% | 1,000.00 | 1,367.10 | 9.68 |
Health Care Fund | | | | | |
Investor Class | 1.41% | 12.36% | 1,000.00 | 1,123.60 | 7.47 |
A-Class | 1.65% | 12.21% | 1,000.00 | 1,122.10 | 8.73 |
C-Class | 2.40% | 11.79% | 1,000.00 | 1,117.90 | 12.67 |
H-Class | 1.65% | 12.23% | 1,000.00 | 1,122.30 | 8.73 |
6 | THE RYDEX FUNDS ANNUAL REPORT | |
ABOUT SHAREHOLDERS’ FUND EXPENSES (Unaudited)(continued) | |
| Expense
Ratio1 | Fund
Return | Beginning
Account Value
September 30, 2020 | Ending
Account Value
March 31, 2021 | Expenses
Paid During
Period2 |
Internet Fund | | | | | |
Investor Class | 1.40% | 20.37% | $ 1,000.00 | $ 1,203.70 | $ 7.69 |
A-Class | 1.65% | 20.22% | 1,000.00 | 1,202.20 | 9.06 |
C-Class | 2.40% | 19.78% | 1,000.00 | 1,197.80 | 13.15 |
H-Class | 1.65% | 20.21% | 1,000.00 | 1,202.10 | 9.06 |
Leisure Fund | | | | | |
Investor Class | 1.38% | 32.62% | 1,000.00 | 1,326.20 | 8.00 |
A-Class | 1.65% | 32.47% | 1,000.00 | 1,324.70 | 9.56 |
C-Class | 2.40% | 31.96% | 1,000.00 | 1,319.60 | 13.88 |
H-Class | 1.64% | 32.47% | 1,000.00 | 1,324.70 | 9.51 |
Precious Metals Fund | | | | | |
Investor Class | 1.30% | (7.99%) | 1,000.00 | 920.10 | 6.22 |
A-Class | 1.55% | (8.11%) | 1,000.00 | 918.90 | 7.42 |
C-Class | 2.30% | (8.45%) | 1,000.00 | 915.50 | 10.98 |
H-Class | 1.56% | (8.12%) | 1,000.00 | 918.80 | 7.46 |
Real Estate Fund | | | | | |
A-Class | 1.65% | 25.55% | 1,000.00 | 1,255.50 | 9.28 |
C-Class | 2.40% | 25.07% | 1,000.00 | 1,250.70 | 13.47 |
H-Class | 1.62% | 25.58% | 1,000.00 | 1,255.80 | 9.11 |
Retailing Fund | | | | | |
Investor Class | 1.41% | 25.57% | 1,000.00 | 1,255.70 | 7.93 |
A-Class | 1.65% | 25.41% | 1,000.00 | 1,254.10 | 9.27 |
C-Class | 2.40% | 24.91% | 1,000.00 | 1,249.10 | 13.46 |
H-Class | 1.67% | 25.39% | 1,000.00 | 1,253.90 | 9.38 |
Technology Fund | | | | | |
Investor Class | 1.40% | 22.55% | 1,000.00 | 1,225.50 | 7.77 |
A-Class | 1.65% | 22.40% | 1,000.00 | 1,224.00 | 9.15 |
C-Class | 2.40% | 21.95% | 1,000.00 | 1,219.50 | 13.28 |
H-Class | 1.67% | 22.39% | 1,000.00 | 1,223.90 | 9.26 |
Telecommunications Fund | | | | | |
Investor Class | 1.42% | 20.77% | 1,000.00 | 1,207.70 | 7.82 |
A-Class | 1.66% | 20.60% | 1,000.00 | 1,206.00 | 9.13 |
C-Class | 2.40% | 20.17% | 1,000.00 | 1,201.70 | 13.17 |
H-Class | 1.64% | 20.63% | 1,000.00 | 1,206.30 | 9.02 |
Transportation Fund | | | | | |
Investor Class | 1.40% | 42.56% | 1,000.00 | 1,425.60 | 8.47 |
A-Class | 1.65% | 42.38% | 1,000.00 | 1,423.80 | 9.97 |
C-Class | 2.40% | 41.85% | 1,000.00 | 1,418.50 | 14.47 |
H-Class | 1.65% | 42.39% | 1,000.00 | 1,423.90 | 9.97 |
Utilities Fund | | | | | |
Investor Class | 1.41% | 11.31% | 1,000.00 | 1,113.10 | 7.43 |
A-Class | 1.65% | 11.19% | 1,000.00 | 1,111.90 | 8.69 |
C-Class | 2.41% | 10.76% | 1,000.00 | 1,107.60 | 12.66 |
H-Class | 1.66% | 11.19% | 1,000.00 | 1,111.90 | 8.74 |
| | THE RYDEX FUNDS ANNUAL REPORT | 7 |
ABOUT SHAREHOLDERS’ FUND EXPENSES (Unaudited)(continued) | |
| Expense
Ratio1 | Fund
Return | Beginning
Account Value
September 30, 2020 | Ending
Account Value
March 31, 2021 | Expenses
Paid During
Period2 |
Table 2. Based on hypothetical 5% return (before expenses) | | | |
Banking Fund | | | | | |
Investor Class | 1.39% | 5.00% | $ 1,000.00 | $ 1,018.00 | $ 6.99 |
A-Class | 1.65% | 5.00% | 1,000.00 | 1,016.70 | 8.30 |
C-Class | 2.40% | 5.00% | 1,000.00 | 1,012.96 | 12.04 |
H-Class | 1.62% | 5.00% | 1,000.00 | 1,016.85 | 8.15 |
Basic Materials Fund | | | | | |
Investor Class | 1.40% | 5.00% | 1,000.00 | 1,017.95 | 7.04 |
A-Class | 1.65% | 5.00% | 1,000.00 | 1,016.70 | 8.30 |
C-Class | 2.40% | 5.00% | 1,000.00 | 1,012.96 | 12.04 |
H-Class | 1.67% | 5.00% | 1,000.00 | 1,016.60 | 8.40 |
Biotechnology Fund | | | | | |
Investor Class | 1.40% | 5.00% | 1,000.00 | 1,017.95 | 7.04 |
A-Class | 1.65% | 5.00% | 1,000.00 | 1,016.70 | 8.30 |
C-Class | 2.40% | 5.00% | 1,000.00 | 1,012.96 | 12.04 |
H-Class | 1.65% | 5.00% | 1,000.00 | 1,016.70 | 8.30 |
Consumer Products Fund | | | | | |
Investor Class | 1.41% | 5.00% | 1,000.00 | 1,017.90 | 7.09 |
A-Class | 1.65% | 5.00% | 1,000.00 | 1,016.70 | 8.30 |
C-Class | 2.41% | 5.00% | 1,000.00 | 1,012.91 | 12.09 |
H-Class | 1.65% | 5.00% | 1,000.00 | 1,016.70 | 8.30 |
Electronics Fund | | | | | |
Investor Class | 1.39% | 5.00% | 1,000.00 | 1,018.00 | 6.99 |
A-Class | 1.65% | 5.00% | 1,000.00 | 1,016.70 | 8.30 |
C-Class | 2.40% | 5.00% | 1,000.00 | 1,012.96 | 12.04 |
H-Class | 1.65% | 5.00% | 1,000.00 | 1,016.70 | 8.30 |
Energy Fund | | | | | |
Investor Class | 1.38% | 5.00% | 1,000.00 | 1,018.05 | 6.94 |
A-Class | 1.63% | 5.00% | 1,000.00 | 1,016.80 | 8.20 |
C-Class | 2.40% | 5.00% | 1,000.00 | 1,012.96 | 12.04 |
H-Class | 1.64% | 5.00% | 1,000.00 | 1,016.75 | 8.25 |
Energy Services Fund | | | | | |
Investor Class | 1.39% | 5.00% | 1,000.00 | 1,018.00 | 6.99 |
A-Class | 1.65% | 5.00% | 1,000.00 | 1,016.70 | 8.30 |
C-Class | 2.39% | 5.00% | 1,000.00 | 1,013.01 | 11.99 |
H-Class | 1.63% | 5.00% | 1,000.00 | 1,016.80 | 8.20 |
Financial Services Fund | | | | | |
Investor Class | 1.38% | 5.00% | 1,000.00 | 1,018.05 | 6.94 |
A-Class | 1.67% | 5.00% | 1,000.00 | 1,016.60 | 8.40 |
C-Class | 2.39% | 5.00% | 1,000.00 | 1,013.01 | 11.99 |
H-Class | 1.64% | 5.00% | 1,000.00 | 1,016.75 | 8.25 |
Health Care Fund | | | | | |
Investor Class | 1.41% | 5.00% | 1,000.00 | 1,017.90 | 7.09 |
A-Class | 1.65% | 5.00% | 1,000.00 | 1,016.70 | 8.30 |
C-Class | 2.40% | 5.00% | 1,000.00 | 1,012.96 | 12.04 |
H-Class | 1.65% | 5.00% | 1,000.00 | 1,016.70 | 8.30 |
8 | THE RYDEX FUNDS ANNUAL REPORT | |
ABOUT SHAREHOLDERS’ FUND EXPENSES (Unaudited)(concluded) | |
| Expense
Ratio1 | Fund
Return | Beginning
Account Value
September 30, 2020 | Ending
Account Value
March 31, 2021 | Expenses
Paid During
Period2 |
Internet Fund | | | | | |
Investor Class | 1.40% | 5.00% | $ 1,000.00 | $ 1,017.95 | $ 7.04 |
A-Class | 1.65% | 5.00% | 1,000.00 | 1,016.70 | 8.30 |
C-Class | 2.40% | 5.00% | 1,000.00 | 1,012.96 | 12.04 |
H-Class | 1.65% | 5.00% | 1,000.00 | 1,016.70 | 8.30 |
Leisure Fund | | | | | |
Investor Class | 1.38% | 5.00% | 1,000.00 | 1,018.05 | 6.94 |
A-Class | 1.65% | 5.00% | 1,000.00 | 1,016.70 | 8.30 |
C-Class | 2.40% | 5.00% | 1,000.00 | 1,012.96 | 12.04 |
H-Class | 1.64% | 5.00% | 1,000.00 | 1,016.75 | 8.25 |
Precious Metals Fund | | | | | |
Investor Class | 1.30% | 5.00% | 1,000.00 | 1,018.45 | 6.54 |
A-Class | 1.55% | 5.00% | 1,000.00 | 1,017.20 | 7.80 |
C-Class | 2.30% | 5.00% | 1,000.00 | 1,013.46 | 11.55 |
H-Class | 1.56% | 5.00% | 1,000.00 | 1,017.15 | 7.85 |
Real Estate Fund | | | | | |
A-Class | 1.65% | 5.00% | 1,000.00 | 1,016.70 | 8.30 |
C-Class | 2.40% | 5.00% | 1,000.00 | 1,012.96 | 12.04 |
H-Class | 1.62% | 5.00% | 1,000.00 | 1,016.85 | 8.15 |
Retailing Fund | | | | | |
Investor Class | 1.41% | 5.00% | 1,000.00 | 1,017.90 | 7.09 |
A-Class | 1.65% | 5.00% | 1,000.00 | 1,016.70 | 8.30 |
C-Class | 2.40% | 5.00% | 1,000.00 | 1,012.96 | 12.04 |
H-Class | 1.67% | 5.00% | 1,000.00 | 1,016.60 | 8.40 |
Technology Fund | | | | | |
Investor Class | 1.40% | 5.00% | 1,000.00 | 1,017.95 | 7.04 |
A-Class | 1.65% | 5.00% | 1,000.00 | 1,016.70 | 8.30 |
C-Class | 2.40% | 5.00% | 1,000.00 | 1,012.96 | 12.04 |
H-Class | 1.67% | 5.00% | 1,000.00 | 1,016.60 | 8.40 |
Telecommunications Fund | | | | | |
Investor Class | 1.42% | 5.00% | 1,000.00 | 1,017.85 | 7.14 |
A-Class | 1.66% | 5.00% | 1,000.00 | 1,016.65 | 8.35 |
C-Class | 2.40% | 5.00% | 1,000.00 | 1,012.96 | 12.04 |
H-Class | 1.64% | 5.00% | 1,000.00 | 1,016.75 | 8.25 |
Transportation Fund | | | | | |
Investor Class | 1.40% | 5.00% | 1,000.00 | 1,017.95 | 7.04 |
A-Class | 1.65% | 5.00% | 1,000.00 | 1,016.70 | 8.30 |
C-Class | 2.40% | 5.00% | 1,000.00 | 1,012.96 | 12.04 |
H-Class | 1.65% | 5.00% | 1,000.00 | 1,016.70 | 8.30 |
Utilities Fund | | | | | |
Investor Class | 1.41% | 5.00% | 1,000.00 | 1,017.90 | 7.09 |
A-Class | 1.65% | 5.00% | 1,000.00 | 1,016.70 | 8.30 |
C-Class | 2.41% | 5.00% | 1,000.00 | 1,012.91 | 12.09 |
H-Class | 1.66% | 5.00% | 1,000.00 | 1,016.65 | 8.35 |
1 | Annualized and excludes expenses of the underlying funds in which the Funds invest, if any. |
2 | Expenses are equal to the Fund’s annualized expense ratio, net of any applicable fee waivers, multiplied by the average account value over the period, multiplied by 182/365 (to reflect the one-half year period). |
3 | Actual cumulative return at net asset value for the period September 30, 2020 to March 31, 2021. |
| | THE RYDEX FUNDS ANNUAL REPORT | 9 |
PERFORMANCE REPORT AND FUND PROFILE (Unaudited) | March 31, 2021 |
BANKING FUND
OBJECTIVE: Seeks to provide capital appreciation by investing in companies that are involved in the banking sector, including commercial banks (and their holding companies) and savings and loan institutions (“Banking Companies”).
For the one-year period ended March 31, 2021, Banking Fund Investor Class returned 90.06%, compared with 67.50% for the S&P 500 Financials Index. The broader S&P 500 Index returned 56.35%.
All industries contributed to return, led by regional banks, diversified banks, and consumer finance.
Capital One Financial Corp., Truist Financial Corp., and Bank of America Corp. contributed the most to the Fund’s return for the period. HSBC Holdings plc ADR and CVB Financial Corp. detracted the most from return.
Performance displayed represents past performance, which is no guarantee of future results.
Holdings Diversification (Market Exposure as % of Net Assets)

“Holdings Diversification (Market Exposure as % of Net Assets)” excludes any temporary cash investments.
Inception Dates: |
Investor Class | April 1, 1998 |
A-Class | September 1, 2004 |
C-Class | March 30, 2001 |
H-Class | April 1, 1998 |
Ten Largest Holdings (% of Total Net Assets) |
Bank of America Corp. | 4.1% |
Citigroup, Inc. | 4.1% |
JPMorgan Chase & Co. | 4.0% |
Wells Fargo & Co. | 4.0% |
U.S. Bancorp | 3.3% |
Truist Financial Corp. | 3.2% |
PNC Financial Services Group, Inc. | 3.1% |
Capital One Financial Corp. | 2.8% |
Bank of New York Mellon Corp. | 2.4% |
State Street Corp. | 2.0% |
Top Ten Total | 33.0% |
| | |
“Ten Largest Holdings” excludes any temporary cash investments. |
10 | THE RYDEX FUNDS ANNUAL REPORT | |
PERFORMANCE REPORT AND FUND PROFILE (Unaudited)(concluded) | March 31, 2021 |
Cumulative Fund Performance*
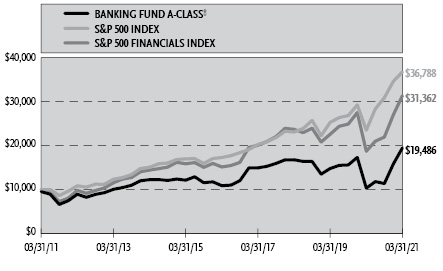
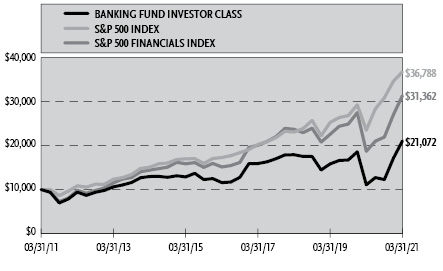
Average Annual Returns*
Periods Ended March 31, 2021
| 1 Year | 5 Year | 10 Year |
Investor Class Shares | 90.06% | 12.72% | 7.74% |
A-Class Shares | 88.72% | 12.35% | 7.42% |
A-Class Shares with sales charge‡ | 79.77% | 11.26% | 6.90% |
C-Class Shares | 87.34% | 11.51% | 6.62% |
C-Class Shares with CDSC§ | 86.34% | 11.51% | 6.62% |
H-Class Shares** | 88.66% | 12.35% | 7.32% |
S&P 500 Financials Index | 67.50% | 15.67% | 12.11% |
S&P 500 Index | 56.35% | 16.29% | 13.91% |
* | The performance data above represents past performance that is not predictive of future results. The investment return and principal value of an investment in the Fund will fluctuate so that an investor’s shares, when redeemed, may be worth more or less than their original cost. Returns are historical and include changes in principal and reinvested dividends and capital gains and do not reflect the effect of taxes. The S&P 500 Index and the S&P 500 Financials Index are unmanaged indices and, unlike the Fund, have no management fees or operating expenses to reduce their reported returns. The graphs are based on Investor Class shares and A-Class shares only; performance for C-Class and H-Class shares will vary due to differences in fee structures. |
** | Effective September 30, 2015, the Fund’s Advisor Class shares were converted into H-Class shares. |
‡ | Fund returns are calculated using the maximum sales charge of 4.75%. |
§ | Fund returns include a CDSC of 1% if redeemed within 12 months of purchase. |
| | THE RYDEX FUNDS ANNUAL REPORT | 11 |
SCHEDULE OF INVESTMENTS | March 31, 2021 |
BANKING FUND | |
| | Shares | | | Value | |
COMMON STOCKS† - 99.5% |
| | | | | | | | | |
Banks - 91.0% |
Bank of America Corp. | | | 19,643 | | | $ | 759,988 | |
Citigroup, Inc. | | | 10,413 | | | | 757,546 | |
JPMorgan Chase & Co. | | | 4,861 | | | | 739,990 | |
Wells Fargo & Co. | | | 18,837 | | | | 735,962 | |
U.S. Bancorp | | | 11,082 | | | | 612,945 | |
Truist Financial Corp. | | | 10,220 | | | | 596,030 | |
PNC Financial Services Group, Inc. | | | 3,294 | | | | 577,800 | |
Bank of New York Mellon Corp. | | | 9,306 | | | | 440,081 | |
State Street Corp. | | | 4,359 | | | | 366,200 | |
First Republic Bank | | | 2,164 | | | | 360,847 | |
Fifth Third Bancorp | | | 9,174 | | | | 343,566 | |
SVB Financial Group* | | | 651 | | | | 321,373 | |
Northern Trust Corp. | | | 3,012 | | | | 316,591 | |
M&T Bank Corp. | | | 1,959 | | | | 297,004 | |
Regions Financial Corp. | | | 14,349 | | | | 296,450 | |
KeyCorp | | | 14,688 | | | | 293,466 | |
Citizens Financial Group, Inc. | | | 6,571 | | | | 290,110 | |
Huntington Bancshares, Inc. | | | 16,982 | | | | 266,957 | |
Signature Bank | | | 1,067 | | | | 241,249 | |
ICICI Bank Ltd. ADR* | | | 14,075 | | | | 225,622 | |
HDFC Bank Ltd. ADR* | | | 2,833 | | | | 220,096 | |
Comerica, Inc. | | | 3,018 | | | | 216,511 | |
East West Bancorp, Inc. | | | 2,861 | | | | 211,142 | |
Toronto-Dominion Bank | | | 3,138 | | | | 204,629 | |
Western Alliance Bancorporation | | | 2,154 | | | | 203,424 | |
Royal Bank of Canada | | | 2,204 | | | | 203,231 | |
First Horizon Corp. | | | 11,935 | | | | 201,821 | |
Bank of Nova Scotia | | | 3,226 | | | | 201,786 | |
Zions Bancorp North America | | | 3,639 | | | | 199,999 | |
Commerce Bancshares, Inc. | | | 2,581 | | | | 197,730 | |
Bank of Montreal | | | 2,214 | | | | 197,312 | |
HSBC Holdings plc ADR | | | 6,727 | | | | 196,025 | |
Popular, Inc. | | | 2,752 | | | | 193,521 | |
First Citizens BancShares, Inc. — Class A | | | 230 | | | | 192,227 | |
UBS Group AG | | | 12,204 | | | | 189,528 | |
Canadian Imperial Bank of Commerce | | | 1,888 | | | | 184,779 | |
Deutsche Bank AG* | | | 14,880 | | | | 178,560 | |
TCF Financial Corp. | | | 3,774 | | | | 175,340 | |
Prosperity Bancshares, Inc. | | | 2,293 | | | | 171,723 | |
Cullen/Frost Bankers, Inc. | | | 1,575 | | | | 171,297 | |
Pinnacle Financial Partners, Inc. | | | 1,921 | | | | 170,316 | |
Synovus Financial Corp. | | | 3,721 | | | | 170,236 | |
First Financial Bankshares, Inc. | | | 3,617 | | | | 169,022 | |
Credit Suisse Group AG ADR1 | | | 14,667 | | | | 155,470 | |
Glacier Bancorp, Inc. | | | 2,648 | | | | 151,148 | |
South State Corp. | | | 1,920 | | | | 150,739 | |
CIT Group, Inc. | | | 2,921 | | | | 150,461 | |
Bank OZK | | | 3,643 | | | | 148,817 | |
United Bankshares, Inc. | | | 3,829 | | | | 147,723 | |
Webster Financial Corp. | | | 2,594 | | | | 142,955 | |
Home BancShares, Inc. | | | 5,195 | | | | 140,525 | |
UMB Financial Corp. | | | 1,504 | | | | 138,864 | |
PacWest Bancorp | | | 3,615 | | | | 137,912 | |
Wintrust Financial Corp. | | | 1,768 | | | | 134,014 | |
Community Bank System, Inc. | | | 1,745 | | | | 133,876 | |
BankUnited, Inc. | | | 2,981 | | | | 131,015 | |
Umpqua Holdings Corp. | | | 7,367 | | | | 129,291 | |
Ameris Bancorp | | | 2,418 | | | | 126,969 | |
Hancock Whitney Corp. | | | 2,986 | | | | 125,442 | |
Bank of Hawaii Corp. | | | 1,388 | | | | 124,212 | |
First Hawaiian, Inc. | | | 4,503 | | | | 123,247 | |
BancorpSouth Bank | | | 3,714 | | | | 120,631 | |
Simmons First National Corp. — Class A | | | 3,981 | | | | 118,116 | |
Old National Bancorp | | | 6,100 | | | | 117,974 | |
Associated Banc-Corp. | | | 5,483 | | | | 117,007 | |
Independent Bank Group, Inc. | | | 1,613 | | | | 116,523 | |
United Community Banks, Inc. | | | 3,348 | | | | 114,234 | |
Texas Capital Bancshares, Inc.* | | | 1,608 | | | | 114,039 | |
Columbia Banking System, Inc. | | | 2,608 | | | | 112,379 | |
Fulton Financial Corp. | | | 6,454 | | | | 109,912 | |
Cadence BanCorp | | | 5,050 | | | | 104,686 | |
Total Banks | | | | | | | 16,898,213 | |
| | | | | | | | | |
Savings & Loans - 3.3% |
People’s United Financial, Inc. | | | 10,437 | | | | 186,823 | |
New York Community Bancorp, Inc. | | | 13,076 | | | | 165,019 | |
Sterling Bancorp | | | 5,902 | | | | 135,864 | |
Investors Bancorp, Inc. | | | 8,819 | | | | 129,551 | |
Total Savings & Loans | | | | | | | 617,257 | |
| | | | | | | | | |
Diversified Financial Services - 2.8% |
Capital One Financial Corp. | | | 4,065 | | | | 517,190 | |
| | | | | | | | | |
Insurance - 2.4% |
Equitable Holdings, Inc. | | | 7,790 | | | | 254,110 | |
Voya Financial, Inc. | | | 2,955 | | | | 188,056 | |
Total Insurance | | | | | | | 442,166 | |
| | | | | | | | | |
Total Common Stocks | | | | |
(Cost $13,133,740) | | | | | | | 18,474,826 | |
| | | | | | | | | |
12 | THE RYDEX FUNDS ANNUAL REPORT | SEE NOTES TO FINANCIAL STATEMENTS. |
SCHEDULE OF INVESTMENTS (concluded) | March 31, 2021 |
BANKING FUND | |
| | Face
Amount | | | Value | |
REPURCHASE AGREEMENTS††,2 - 0.7% |
J.P. Morgan Securities LLC
issued 03/31/21 at 0.01%
due 04/01/21 | | $ | 63,828 | | | $ | 63,828 | |
Barclays Capital, Inc.
issued 03/31/21 at 0.01%
due 04/01/21 | | | 29,019 | | | | 29,019 | |
BofA Securities, Inc.
issued 03/31/21 at 0.01%
due 04/01/21 | | | 26,485 | | | | 26,485 | |
Total Repurchase Agreements | | | | |
(Cost $119,332) | | | | | | | 119,332 | |
| | | | | | | | | |
| | Shares | | | | |
SECURITIES LENDING COLLATERAL†,3 - 0.6% |
Money Market Fund | | | | | | | | |
First American Government Obligations Fund — Class Z, 0.03%4 | | | 115,144 | | | | 115,144 | |
Total Securities Lending Collateral | | | | |
(Cost $115,144) | | | | | | | 115,144 | |
| | | | | | | | | |
Total Investments - 100.8% | | | | |
(Cost $13,368,216) | | $ | 18,709,302 | |
Other Assets & Liabilities, net - (0.8)% | | | (139,476 | ) |
Total Net Assets - 100.0% | | $ | 18,569,826 | |
* | Non-income producing security. |
† | Value determined based on Level 1 inputs — See Note 4. |
†† | Value determined based on Level 2 inputs — See Note 4. |
1 | All or a portion of this security is on loan at March 31, 2021 — See Note 7. |
2 | Repurchase Agreements — See Note 6. |
3 | Securities lending collateral — See Note 7. |
4 | Rate indicated is the 7-day yield as of March 31, 2021. |
| | ADR — American Depositary Receipt |
| | plc — Public Limited Company |
| | |
| | See Sector Classification in Other Information section. |
The following table summarizes the inputs used to value the Fund’s investments at March 31, 2021 (See Note 4 in the Notes to Financial Statements):
Investments in Securities (Assets) | | Level 1
Quoted
Prices | | | Level 2
Significant
Observable
Inputs | | | Level 3
Significant
Unobservable
Inputs | | | Total | |
Common Stocks | | $ | 18,474,826 | | | $ | — | | | $ | — | | | $ | 18,474,826 | |
Repurchase Agreements | | | — | | | | 119,332 | | | | — | | | | 119,332 | |
Securities Lending Collateral | | | 115,144 | | | | — | | | | — | | | | 115,144 | |
Total Assets | | $ | 18,589,970 | | | $ | 119,332 | | | $ | — | | | $ | 18,709,302 | |
SEE NOTES TO FINANCIAL STATEMENTS. | THE RYDEX FUNDS ANNUAL REPORT | 13 |
STATEMENT OF ASSETS AND LIABILITIES |
March 31, 2021 |
Assets: |
Investments, at value - including $108,491 of securities loaned (cost $13,248,884) | | $ | 18,589,970 | |
Repurchase agreements, at value (cost $119,332) | | | 119,332 | |
Receivables: |
Fund shares sold | | | 58,942 | |
Dividends | | | 45,480 | |
Foreign tax reclaims | | | 544 | |
Securities lending income | | | 11 | |
Total assets | | | 18,814,279 | |
| | | | | |
Liabilities: |
Payable for: |
Return of securities lending collateral | | | 115,144 | |
Fund shares redeemed | | | 82,810 | |
Management fees | | | 14,702 | |
Transfer agent and administrative fees | | | 4,653 | |
Distribution and service fees | | | 2,533 | |
Portfolio accounting fees | | | 1,730 | |
Trustees’ fees* | | | 322 | |
Miscellaneous | | | 22,559 | |
Total liabilities | | | 244,453 | |
Commitments and contingent liabilities (Note 10) | | | — | |
Net assets | | $ | 18,569,826 | |
| | | | | |
Net assets consist of: |
Paid in capital | | $ | 26,457,104 | |
Total distributable earnings (loss) | | | (7,887,278 | ) |
Net assets | | $ | 18,569,826 | |
| | | | | |
Investor Class: |
Net assets | | $ | 9,027,335 | |
Capital shares outstanding | | | 94,321 | |
Net asset value per share | | $ | 95.71 | |
| | | | | |
A-Class: |
Net assets | | $ | 4,049,551 | |
Capital shares outstanding | | | 47,168 | |
Net asset value per share | | $ | 85.85 | |
Maximum offering price per share (Net asset value divided by 95.25%) | | $ | 90.13 | |
| | | | | |
C-Class: |
Net assets | | $ | 892,089 | |
Capital shares outstanding | | | 11,884 | |
Net asset value per share | | $ | 75.07 | |
| | | | | |
H-Class: |
Net assets | | $ | 4,600,851 | |
Capital shares outstanding | | | 55,111 | |
Net asset value per share | | $ | 83.48 | |
STATEMENT OF OPERATIONS |
Year Ended March 31, 2021 |
Investment Income: |
Dividends (net of foreign withholding tax of $5,081) | | $ | 343,052 | |
Interest | | | 26 | |
Income from securities lending, net | | | 84 | |
Total investment income | | | 343,162 | |
| | | | | |
Expenses: |
Management fees | | | 90,392 | |
Distribution and service fees: |
A-Class | | | 7,799 | |
C-Class | | | 7,684 | |
H-Class | | | 2,817 | |
Transfer agent and administrative fees | | | 30,713 | |
Portfolio accounting fees | | | 10,636 | |
Professional fees | | | 8,148 | |
Trustees’ fees* | | | 4,200 | |
Custodian fees | | | 1,882 | |
Miscellaneous | | | 5,848 | |
Total expenses | | | 170,119 | |
Net investment income | | | 173,043 | |
| | | | | |
Net Realized and Unrealized Gain (Loss): |
Net realized gain (loss) on: |
Investments | | | (10,139,015 | ) |
Net realized loss | | | (10,139,015 | ) |
Net change in unrealized appreciation (depreciation) on: |
Investments | | | 16,178,865 | |
Net change in unrealized appreciation (depreciation) | | | 16,178,865 | |
Net realized and unrealized gain | | | 6,039,850 | |
Net increase in net assets resulting from operations | | $ | 6,212,893 | |
* | Relates to Trustees not deemed “interested persons” within the meaning of Section 2(a)(19) of the 1940 Act. |
14 | THE RYDEX FUNDS ANNUAL REPORT | SEE NOTES TO FINANCIAL STATEMENTS. |
STATEMENTS OF CHANGES IN NET ASSETS |
| | Year Ended
March 31,
2021 | | | Year Ended
March 31,
2020 | |
Increase (Decrease) in Net Assets from Operations: | | | | | | | | |
Net investment income | | $ | 173,043 | | | $ | 273,567 | |
Net realized gain (loss) on investments | | | (10,139,015 | ) | | | 15,650 | |
Net change in unrealized appreciation (depreciation) on investments | | | 16,178,865 | | | | (12,335,006 | ) |
Net increase (decrease) in net assets resulting from operations | | | 6,212,893 | | | | (12,045,789 | ) |
| | | | | | | | | |
Distributions to shareholders: | | | | | | | | |
Investor Class | | | (123,639 | ) | | | (108,737 | ) |
A-Class | | | (109,741 | ) | | | (31,237 | ) |
C-Class | | | (28,038 | ) | | | (9,418 | ) |
H-Class | | | (12,149 | ) | | | (30,264 | ) |
Total distributions to shareholders | | | (273,567 | ) | | | (179,656 | ) |
| | | | | | | | | |
Capital share transactions: | | | | | | | | |
Proceeds from sale of shares | | | | | | | | |
Investor Class | | | 100,467,394 | | | | 97,783,948 | |
A-Class | | | 776,718 | | | | 840,548 | |
C-Class | | | 1,445,210 | | | | 1,729,649 | |
H-Class | | | 6,995,067 | | | | 8,514,542 | |
Distributions reinvested | | | | | | | | |
Investor Class | | | 120,914 | | | | 108,041 | |
A-Class | | | 106,076 | | | | 30,103 | |
C-Class | | | 27,016 | | | | 9,418 | |
H-Class | | | 12,065 | | | | 30,213 | |
Cost of shares redeemed | | | | | | | | |
Investor Class | | | (111,860,093 | ) | | | (75,479,771 | ) |
A-Class | | | (1,524,259 | ) | | | (1,702,700 | ) |
C-Class | | | (1,789,662 | ) | | | (1,910,665 | ) |
H-Class | | | (3,368,112 | ) | | | (10,167,108 | ) |
Net increase (decrease) from capital share transactions | | | (8,591,666 | ) | | | 19,786,218 | |
Net increase (decrease) in net assets | | | (2,652,340 | ) | | | 7,560,773 | |
| | | | | | | | | |
Net assets: | | | | | | | | |
Beginning of year | | | 21,222,166 | | | | 13,661,393 | |
End of year | | $ | 18,569,826 | | | $ | 21,222,166 | |
| | | | | | | | | |
Capital share activity: | | | | | | | | |
Shares sold | | | | | | | | |
Investor Class | | | 1,395,191 | | | | 1,226,311 | |
A-Class | | | 10,123 | | | | 11,635 | |
C-Class | | | 25,920 | | | | 27,344 | |
H-Class | | | 102,619 | | | | 120,683 | |
Shares issued from reinvestment of distributions | | | | | | | | |
Investor Class | | | 1,596 | | | | 1,272 | |
A-Class | | | 1,560 | | | | 391 | |
C-Class | | | 453 | | | | 138 | |
H-Class | | | 182 | | | | 403 | |
Shares redeemed | | | | | | | | |
Investor Class | | | (1,640,247 | ) | | | (970,220 | ) |
A-Class | | | (23,881 | ) | | | (24,173 | ) |
C-Class | | | (32,869 | ) | | | (30,321 | ) |
H-Class | | | (51,236 | ) | | | (140,736 | ) |
Net increase (decrease) in shares | | | (210,589 | ) | | | 222,727 | |
SEE NOTES TO FINANCIAL STATEMENTS. | THE RYDEX FUNDS ANNUAL REPORT | 15 |
This table is presented to show selected data for a share outstanding throughout each period and to assist shareholders in evaluating a Fund’s performance for the periods presented.
Investor Class | | Year Ended
March 31,
2021 | | | Year Ended
March 31,
2020 | | | Year Ended
March 31,
2019 | | | Year Ended
March 29,
2018 | | | Year Ended
March 31,
2017 | |
Per Share Data |
Net asset value, beginning of period | | $ | 51.83 | | | $ | 74.58 | | | $ | 86.27 | | | $ | 76.86 | | | $ | 56.13 | |
Income (loss) from investment operations: |
Net investment income (loss)a | | | 1.25 | | | | 1.14 | | | | .81 | | | | .60 | | | | .53 | |
Net gain (loss) on investments (realized and unrealized) | | | 44.89 | | | | (23.38 | ) | | | (10.92 | ) | | | 9.12 | | | | 20.51 | |
Total from investment operations | | | 46.14 | | | | (22.24 | ) | | | (10.11 | ) | | | 9.72 | | | | 21.04 | |
Less distributions from: |
Net investment income | | | (2.26 | ) | | | (.51 | ) | | | (1.58 | ) | | | (.31 | ) | | | (.31 | ) |
Total distributions | | | (2.26 | ) | | | (.51 | ) | | | (1.58 | ) | | | (.31 | ) | | | (.31 | ) |
Net asset value, end of period | | $ | 95.71 | | | $ | 51.83 | | | $ | 74.58 | | | $ | 86.27 | | | $ | 76.86 | |
|
Total Return | | | 90.06 | % | | | (30.08 | %) | | | (11.63 | %) | | | 12.63 | % | | | 37.53 | % |
Ratios/Supplemental Data |
Net assets, end of period (in thousands) | | $ | 9,027 | | | $ | 17,507 | | | $ | 5,997 | | | $ | 26,209 | | | $ | 41,473 | |
Ratios to average net assets: |
Net investment income (loss) | | | 1.79 | % | | | 1.47 | % | | | 0.97 | % | | | 0.73 | % | | | 0.74 | % |
Total expenses | | | 1.43 | % | | | 1.48 | % | | | 1.46 | % | | | 1.38 | % | | | 1.38 | % |
Portfolio turnover rate | | | 799 | % | | | 360 | % | | | 633 | % | | | 772 | % | | | 907 | % |
A-Class | | Year Ended
March 31,
2021 | | | Year Ended
March 31,
2020 | | | Year Ended
March 31,
2019 | | | Year Ended
March 29,
2018 | | | Year Ended
March 31,
2017 | |
Per Share Data |
Net asset value, beginning of period | | $ | 46.98 | | | $ | 67.81 | | | $ | 78.80 | | | $ | 70.41 | | | $ | 51.55 | |
Income (loss) from investment operations: |
Net investment income (loss)a | | | 1.02 | | | | .87 | | | | .57 | | | | .37 | | | | .33 | |
Net gain (loss) on investments (realized and unrealized) | | | 40.11 | | | | (21.19 | ) | | | (9.98 | ) | | | 8.33 | | | | 18.84 | |
Total from investment operations | | | 41.13 | | | | (20.32 | ) | | | (9.41 | ) | | | 8.70 | | | | 19.17 | |
Less distributions from: |
Net investment income | | | (2.26 | ) | | | (.51 | ) | | | (1.58 | ) | | | (.31 | ) | | | (.31 | ) |
Total distributions | | | (2.26 | ) | | | (.51 | ) | | | (1.58 | ) | | | (.31 | ) | | | (.31 | ) |
Net asset value, end of period | | $ | 85.85 | | | $ | 46.98 | | | $ | 67.81 | | | $ | 78.80 | | | $ | 70.41 | |
|
Total Returnb | | | 88.72 | % | | | (30.25 | %) | | | (11.85 | %) | | | 12.37 | % | | | 37.21 | % |
Ratios/Supplemental Data |
Net assets, end of period (in thousands) | | $ | 4,050 | | | $ | 2,789 | | | $ | 4,849 | | | $ | 4,076 | | | $ | 5,934 | |
Ratios to average net assets: |
Net investment income (loss) | | | 1.67 | % | | | 1.23 | % | | | 0.76 | % | | | 0.50 | % | | | 0.51 | % |
Total expenses | | | 1.69 | % | | | 1.73 | % | | | 1.72 | % | | | 1.63 | % | | | 1.63 | % |
Portfolio turnover rate | | | 799 | % | | | 360 | % | | | 633 | % | | | 772 | % | | | 907 | % |
16 | THE RYDEX FUNDS ANNUAL REPORT | SEE NOTES TO FINANCIAL STATEMENTS. |
FINANCIAL HIGHLIGHTS (concluded) |
This table is presented to show selected data for a share outstanding throughout each period and to assist shareholders in evaluating a Fund’s performance for the periods presented.
C-Class | | Year Ended
March 31,
2021 | | | Year Ended
March 31,
2020 | | | Year Ended
March 31,
2019 | | | Year Ended
March 29,
2018 | | | Year Ended
March 31,
2017 | |
Per Share Data |
Net asset value, beginning of period | | $ | 41.57 | | | $ | 60.51 | | | $ | 71.05 | | | $ | 63.98 | | | $ | 47.22 | |
Income (loss) from investment operations: |
Net investment income (loss)a | | | .49 | | | | .31 | | | | (.05 | ) | | | (.17 | ) | | | (.05 | ) |
Net gain (loss) on investments (realized and unrealized) | | | 35.27 | | | | (18.74 | ) | | | (8.91 | ) | | | 7.55 | | | | 17.12 | |
Total from investment operations | | | 35.76 | | | | (18.43 | ) | | | (8.96 | ) | | | 7.38 | | | | 17.07 | |
Less distributions from: |
Net investment income | | | (2.26 | ) | | | (.51 | ) | | | (1.58 | ) | | | (.31 | ) | | | (.31 | ) |
Total distributions | | | (2.26 | ) | | | (.51 | ) | | | (1.58 | ) | | | (.31 | ) | | | (.31 | ) |
Net asset value, end of period | | $ | 75.07 | | | $ | 41.57 | | | $ | 60.51 | | | $ | 71.05 | | | $ | 63.98 | |
|
Total Returnb | | | 87.34 | % | | | (30.78 | %) | | | (12.51 | %) | | | 11.54 | % | | | 36.18 | % |
Ratios/Supplemental Data |
Net assets, end of period (in thousands) | | $ | 892 | | | $ | 764 | | | $ | 1,284 | | | $ | 4,079 | | | $ | 5,634 | |
Ratios to average net assets: |
Net investment income (loss) | | | 0.93 | % | | | 0.49 | % | | | (0.07 | %) | | | (0.25 | %) | | | (0.09 | %) |
Total expenses | | | 2.45 | % | | | 2.48 | % | | | 2.46 | % | | | 2.38 | % | | | 2.37 | % |
Portfolio turnover rate | | | 799 | % | | | 360 | % | | | 633 | % | | | 772 | % | | | 907 | % |
H-Class | | Year Ended
March 31,
2021 | | | Year Ended
March 31,
2020 | | | Year Ended
March 31,
2019 | | | Year Ended
March 29,
2018 | | | Year Ended
March 31,
2017 | |
Per Share Data |
Net asset value, beginning of period | | $ | 45.73 | | | $ | 66.00 | | | $ | 76.78 | | | $ | 68.61 | | | $ | 50.22 | |
Income (loss) from investment operations: |
Net investment income (loss)a | | | .85 | | | | .74 | | | | .45 | | | | .39 | | | | .29 | |
Net gain (loss) on investments (realized and unrealized) | | | 39.16 | | | | (20.50 | ) | | | (9.65 | ) | | | 8.09 | | | | 18.41 | |
Total from investment operations | | | 40.01 | | | | (19.76 | ) | | | (9.20 | ) | | | 8.48 | | | | 18.70 | |
Less distributions from: |
Net investment income | | | (2.26 | ) | | | (.51 | ) | | | (1.58 | ) | | | (.31 | ) | | | (.31 | ) |
Total distributions | | | (2.26 | ) | | | (.51 | ) | | | (1.58 | ) | | | (.31 | ) | | | (.31 | ) |
Net asset value, end of period | | $ | 83.48 | | | $ | 45.73 | | | $ | 66.00 | | | $ | 76.78 | | | $ | 68.61 | |
|
Total Return | | | 88.66 | % | | | (30.24 | %) | | | (11.89 | %) | | | 12.38 | % | | | 37.26 | % |
Ratios/Supplemental Data |
Net assets, end of period (in thousands) | | $ | 4,601 | | | $ | 162 | | | $ | 1,531 | | | $ | 14,220 | | | $ | 8,467 | |
Ratios to average net assets: |
Net investment income (loss) | | | 1.15 | % | | | 1.02 | % | | | 0.60 | % | | | 0.52 | % | | | 0.45 | % |
Total expenses | | | 1.63 | % | | | 1.74 | % | | | 1.70 | % | | | 1.62 | % | | | 1.63 | % |
Portfolio turnover rate | | | 799 | % | | | 360 | % | | | 633 | % | | | 772 | % | | | 907 | % |
a | Net investment income (loss) per share was computed using average shares outstanding throughout the period. |
b | Total return does not reflect the impact of any applicable sales charges. |
SEE NOTES TO FINANCIAL STATEMENTS. | THE RYDEX FUNDS ANNUAL REPORT | 17 |
PERFORMANCE REPORT AND FUND PROFILE (Unaudited) | March 31, 2021 |
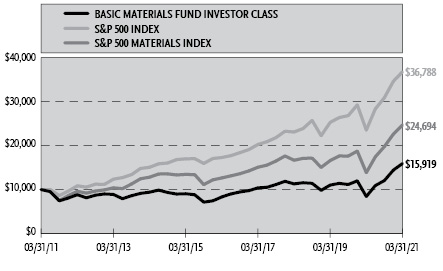
BASIC MATERIALS FUND
OBJECTIVE: Seeks to provide capital appreciation by investing in companies engaged in the mining, manufacture, or sale of basic materials, such as lumber, steel, iron, aluminum, concrete, chemicals, and other basic building and manufacturing materials (“Basic Materials Companies”).
For the one-year period ended March 31, 2021, Basic Materials Fund Investor Class returned 89.00%, compared with 78.29% for the S&P 500 Materials Index. The broader S&P 500 Index returned 56.35%.
All industries contributed to return, led by the specialty chemicals, steel, and gold industries.
Freeport-McMoRan, Inc., DuPont de Nemours, Inc., and Dow, Inc. contributed the most to the Fund’s return for the period. Arconic Corp., Coeur Mining, Inc., and Livent Corp. detracted the most from return.
Performance displayed represents past performance, which is no guarantee of future results.
Holdings Diversification (Market Exposure as % of Net Assets)
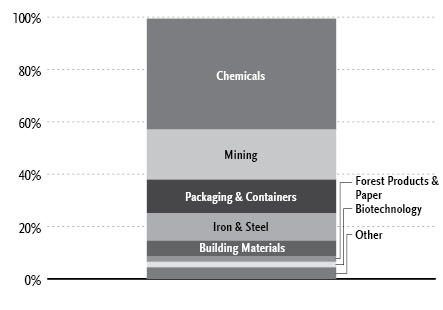
“Holdings Diversification (Market Exposure as % of Net Assets)” excludes any temporary cash investments.
Inception Dates: |
Investor Class | April 1, 1998 |
A-Class | September 1, 2004 |
C-Class | May 3, 2001 |
H-Class | April 14, 1998 |
Ten Largest Holdings (% of Total Net Assets) |
Sherwin-Williams Co. | 3.0% |
Air Products and Chemicals, Inc. | 2.9% |
Ecolab, Inc. | 2.8% |
Dow, Inc. | 2.5% |
Newmont Corp. | 2.5% |
Freeport-McMoRan, Inc. | 2.4% |
DuPont de Nemours, Inc. | 2.3% |
PPG Industries, Inc. | 2.2% |
International Flavors & Fragrances, Inc. | 2.1% |
Corteva, Inc. | 2.1% |
Top Ten Total | 24.8% |
| | |
“Ten Largest Holdings” excludes any temporary cash investments. |
18 | THE RYDEX FUNDS ANNUAL REPORT | |
PERFORMANCE REPORT AND FUND PROFILE (Unaudited)(concluded) | March 31, 2021 |
Cumulative Fund Performance*
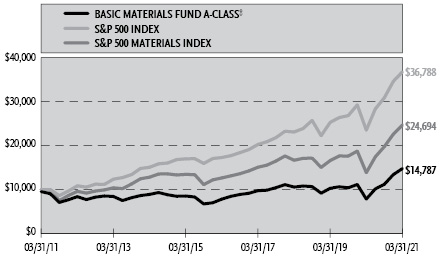
Average Annual Returns*
Periods Ended March 31, 2021
| 1 Year | 5 Year | 10 Year |
Investor Class Shares | 89.00% | 13.84% | 4.76% |
A-Class Shares | 88.52% | 13.56% | 4.50% |
A-Class Shares with sales charge‡ | 79.54% | 12.45% | 3.99% |
C-Class Shares | 87.07% | 12.71% | 3.72% |
C-Class Shares with CDSC§ | 86.07% | 12.71% | 3.72% |
H-Class Shares** | 88.51% | 13.57% | 4.39% |
S&P 500 Materials Index | 78.29% | 14.31% | 9.46% |
S&P 500 Index | 56.35% | 16.29% | 13.91% |
* | The performance data above represents past performance that is not predictive of future results. The investment return and principal value of an investment in the Fund will fluctuate so that an investor’s shares, when redeemed, may be worth more or less than their original cost. Returns are historical and include changes in principal and reinvested dividends and capital gains and do not reflect the effect of taxes. The S&P 500 Index and the S&P 500 Materials Index are unmanaged indices and, unlike the Fund, have no management fees or operating expenses to reduce their reported returns. The graphs are based on Investor Class shares and A-Class shares only; performance for C-Class shares and H-Class shares will vary due to differences in fee structures. |
** | Effective September 30, 2015, the Fund’s Advisor Class shares were converted into H-Class shares. |
‡ | Fund returns are calculated using the maximum sales charge of 4.75%. |
§ | Fund returns include a CDSC of 1% if redeemed within 12 months of purchase. |
| | THE RYDEX FUNDS ANNUAL REPORT | 19 |
SCHEDULE OF INVESTMENTS | March 31, 2021 |
BASIC MATERIALS FUND | |
| | Shares | | | Value | |
COMMON STOCKS† - 98.6% |
| | | | | | | | | |
Chemicals - 42.5% |
Sherwin-Williams Co. | | | 1,959 | | | $ | 1,445,762 | |
Air Products and Chemicals, Inc. | | | 4,998 | | | | 1,406,137 | |
Ecolab, Inc. | | | 6,434 | | | | 1,377,326 | |
Dow, Inc. | | | 18,689 | | | | 1,194,975 | |
DuPont de Nemours, Inc. | | | 14,379 | | | | 1,111,209 | |
PPG Industries, Inc. | | | 6,926 | | | | 1,040,701 | |
International Flavors & Fragrances, Inc. | | | 7,406 | | | | 1,033,952 | |
LyondellBasell Industries N.V. — Class A | | | 9,684 | | | | 1,007,620 | |
Linde plc | | | 3,361 | | | | 941,551 | |
Celanese Corp. — Class A | | | 4,831 | | | | 723,732 | |
Albemarle Corp. | | | 4,813 | | | | 703,227 | |
Eastman Chemical Co. | | | 6,048 | | | | 666,006 | |
FMC Corp. | | | 5,974 | | | | 660,784 | |
RPM International, Inc. | | | 6,660 | | | | 611,721 | |
Mosaic Co. | | | 18,535 | | | | 585,891 | |
Westlake Chemical Corp. | | | 6,461 | | | | 573,672 | |
CF Industries Holdings, Inc. | | | 11,588 | | | | 525,863 | |
Axalta Coating Systems Ltd.* | | | 15,497 | | | | 458,401 | |
Huntsman Corp. | | | 15,252 | | | | 439,715 | |
Olin Corp. | | | 11,106 | | | | 421,695 | |
Nutrien Ltd. | | | 7,747 | | | | 417,486 | |
Sociedad Quimica y Minera de Chile S.A. ADR | | | 7,620 | | | | 404,393 | |
Ashland Global Holdings, Inc. | | | 4,542 | | | | 403,193 | |
Chemours Co. | | | 13,667 | | | | 381,446 | |
Valvoline, Inc. | | | 14,425 | | | | 376,060 | |
Element Solutions, Inc. | | | 19,379 | | | | 354,442 | |
W R Grace & Co. | | | 5,804 | | | | 347,428 | |
HB Fuller Co. | | | 5,100 | | | | 320,841 | |
Sensient Technologies Corp. | | | 4,020 | | | | 313,560 | |
Ingevity Corp.* | | | 4,120 | | | | 311,184 | |
Total Chemicals | | | | | | | 20,559,973 | |
| | | | | | | | | |
Mining - 19.1% |
Newmont Corp. | | | 19,753 | | | | 1,190,513 | |
Freeport-McMoRan, Inc.* | | | 35,338 | | | | 1,163,680 | |
Barrick Gold Corp. | | | 42,305 | | | | 837,639 | |
Rio Tinto plc ADR | | | 6,595 | | | | 512,102 | |
BHP Group Ltd. ADR1 | | | 7,045 | | | | 488,853 | |
Royal Gold, Inc. | | | 4,332 | | | | 466,210 | |
Wheaton Precious Metals Corp. | | | 12,128 | | | | 463,411 | |
Franco-Nevada Corp. | | | 3,663 | | | | 458,937 | |
Agnico Eagle Mines Ltd. | | | 7,782 | | | | 449,878 | |
AngloGold Ashanti Ltd. ADR1 | | | 20,039 | | | | 440,257 | |
Alcoa Corp.* | | | 13,462 | | | | 437,380 | |
Kirkland Lake Gold Ltd. | | | 12,180 | | | | 411,684 | |
Teck Resources Ltd. — Class B | | | 20,135 | | | | 386,189 | |
First Majestic Silver Corp.*,1 | | | 24,280 | | | | 378,282 | |
Pan American Silver Corp. | | | 12,437 | | | | 373,483 | |
Arconic Corp.* | | | 11,000 | | | | 279,290 | |
Livent Corp.* | | | 15,940 | | | | 276,081 | |
Coeur Mining, Inc.* | | | 27,220 | | | | 245,797 | |
Total Mining | | | | | | | 9,259,666 | |
Packaging & Containers - 12.8% |
Ball Corp. | | | 10,973 | | | | 929,852 | |
Westrock Co. | | | 12,371 | | | | 643,910 | |
Amcor plc | | | 54,544 | | | | 637,074 | |
Crown Holdings, Inc. | | | 6,526 | | | | 633,283 | |
Packaging Corporation of America | | | 4,637 | | | | 623,584 | |
AptarGroup, Inc. | | | 3,734 | | | | 528,996 | |
Berry Global Group, Inc.* | | | 8,319 | | | | 510,786 | |
Sealed Air Corp. | | | 10,124 | | | | 463,882 | |
Sonoco Products Co. | | | 6,929 | | | | 438,606 | |
Graphic Packaging Holding Co. | | | 21,126 | | | | 383,648 | |
Silgan Holdings, Inc. | | | 8,902 | | | | 374,151 | |
Total Packaging & Containers | | | | | | | 6,167,772 | |
| | | | | | | | | |
Iron & Steel - 10.6% |
Nucor Corp. | | | 11,337 | | | | 910,021 | |
Vale S.A. ADR | | | 52,060 | | | | 904,803 | |
Cleveland-Cliffs, Inc.* | | | 30,110 | | | | 605,512 | |
Steel Dynamics, Inc. | | | 11,624 | | | | 590,034 | |
Reliance Steel & Aluminum Co. | | | 3,599 | | | | 548,092 | |
United States Steel Corp. | | | 18,977 | | | | 496,628 | |
ArcelorMittal S.A.* | | | 15,363 | | | | 448,139 | |
Commercial Metals Co. | | | 11,259 | | | | 347,227 | |
Allegheny Technologies, Inc.* | | | 13,386 | | | | 281,909 | |
Total Iron & Steel | | | | | | | 5,132,365 | |
| | | | | | | | | |
Building Materials - 5.8% |
Vulcan Materials Co. | | | 4,890 | | | | 825,188 | |
Martin Marietta Materials, Inc. | | | 2,354 | | | | 790,520 | |
Louisiana-Pacific Corp. | | | 7,739 | | | | 429,205 | |
Eagle Materials, Inc. | | | 3,110 | | | | 418,015 | |
Summit Materials, Inc. — Class A* | | | 11,371 | | | | 318,615 | |
Total Building Materials | | | | | | | 2,781,543 | |
| | | | | | | | | |
Forest Products & Paper - 2.2% |
International Paper Co. | | | 14,863 | | | | 803,643 | |
Domtar Corp. | | | 6,717 | | | | 248,193 | |
Total Forest Products & Paper | | | | | | | 1,051,836 | |
| | | | | | | | | |
Biotechnology - 2.1% |
Corteva, Inc. | | | 21,915 | | | | 1,021,677 | |
| | | | | | | | | |
Household Products & Housewares - 1.4% |
Avery Dennison Corp. | | | 3,727 | | | | 684,464 | |
| | | | | | | | | |
Housewares - 1.4% |
Scotts Miracle-Gro Co. — Class A | | | 2,720 | | | | 666,319 | |
| | | | | | | | | |
Distribution & Wholesale - 0.7% |
Avient Corp. | | | 7,360 | | | | 347,907 | |
| | | | | | | | | |
Total Common Stocks | | | | |
(Cost $30,008,400) | | | | | | | 47,673,522 | |
| | | | | | | | | |
20 | THE RYDEX FUNDS ANNUAL REPORT | SEE NOTES TO FINANCIAL STATEMENTS. |
SCHEDULE OF INVESTMENTS (concluded) | March 31, 2021 |
BASIC MATERIALS FUND | |
| | Shares | | | Value | |
RIGHTS† - 0.0% |
Chemicals - 0.0% |
Sociedad Quimica y Minera de Chile S.A. Expires 04/19/21* | | | 1,445 | | | $ | 4,479 | |
Total Rights | | | | |
(Cost $2,642) | | | | | | | 4,479 | |
| | | | | | | | | |
EXCHANGE-TRADED FUNDS† - 0.9% |
VanEck Vectors Junior Gold Miners ETF | | | 10,371 | | | | 466,798 | |
Total Exchange-Traded Funds | | | | |
(Cost $484,048) | | | | | | | 466,798 | |
| | | | | | | | | |
| | | Face
Amount | | | | | |
REPURCHASE AGREEMENTS††,2 - 1.5% |
J.P. Morgan Securities LLC
issued 03/31/21 at 0.01%
due 04/01/21 | | $ | 381,120 | | | | 381,120 | |
Barclays Capital, Inc.
issued 03/31/21 at 0.01%
due 04/01/21 | | | 173,275 | | | | 173,275 | |
BofA Securities, Inc.
issued 03/31/21 at 0.01%
due 04/01/21 | | | 158,141 | | | | 158,141 | |
Total Repurchase Agreements | | | | |
(Cost $712,536) | | | | | | | 712,536 | |
| | | | | | | | | |
SECURITIES LENDING COLLATERAL†,3 - 1.8% |
Money Market Fund | | | | | | | | |
First American Government Obligations Fund — Class Z, 0.03%4 | | | 850,597 | | | $ | 850,597 | |
Total Securities Lending Collateral | | | | |
(Cost $850,597) | | | | | | | 850,597 | |
| | | | | | | | | |
Total Investments - 102.8% | | | | |
(Cost $32,058,223) | | $ | 49,707,932 | |
Other Assets & Liabilities, net - (2.8)% | | | (1,354,150 | ) |
Total Net Assets - 100.0% | | $ | 48,353,782 | |
* | Non-income producing security. |
† | Value determined based on Level 1 inputs — See Note 4. |
†† | Value determined based on Level 2 inputs — See Note 4. |
1 | All or a portion of this security is on loan at March 31, 2021 — See Note 7. |
2 | Repurchase Agreements — See Note 6. |
3 | Securities lending collateral — See Note 7. |
4 | Rate indicated is the 7-day yield as of March 31, 2021. |
| | ADR — American Depositary Receipt |
| | plc — Public Limited Company |
| | |
| | See Sector Classification in Other Information section. |
The following table summarizes the inputs used to value the Fund’s investments at March 31, 2021 (See Note 4 in the Notes to Financial Statements):
Investments in Securities (Assets) | | Level 1
Quoted
Prices | | | Level 2
Significant
Observable
Inputs | | | Level 3
Significant
Unobservable
Inputs | | | Total | |
Common Stocks | | $ | 47,673,522 | | | $ | — | | | $ | — | | | $ | 47,673,522 | |
Rights | | | 4,479 | | | | — | | | | — | | | | 4,479 | |
Exchange-Traded Funds | | | 466,798 | | | | — | | | | — | | | | 466,798 | |
Repurchase Agreements | | | — | | | | 712,536 | | | | — | | | | 712,536 | |
Securities Lending Collateral | | | 850,597 | | | | — | | | | — | | | | 850,597 | |
Total Assets | | $ | 48,995,396 | | | $ | 712,536 | | | $ | — | | | $ | 49,707,932 | |
SEE NOTES TO FINANCIAL STATEMENTS. | THE RYDEX FUNDS ANNUAL REPORT | 21 |
STATEMENT OF ASSETS AND LIABILITIES |
March 31, 2021 |
Assets: |
Investments, at value - including $844,355 of securities loaned (cost $31,345,687) | | $ | 48,995,396 | |
Repurchase agreements, at value (cost $712,536) | | | 712,536 | |
Cash | | | 724 | |
Receivables: |
Securities sold | | | 3,408,063 | |
Dividends | | | 81,847 | |
Fund shares sold | | | 50,512 | |
Securities lending income | | | 915 | |
Foreign tax reclaims | | | 611 | |
Total assets | | | 53,250,604 | |
| | | | | |
Liabilities: |
Payable for: |
Fund shares redeemed | | | 3,810,327 | |
Return of securities lending collateral | | | 850,597 | |
Deferred foreign capital gain taxes | | | 130,382 | |
Management fees | | | 34,575 | |
Transfer agent and administrative fees | | | 10,942 | |
Portfolio accounting fees | | | 4,068 | |
Distribution and service fees | | | 3,687 | |
Trustees’ fees* | | | 735 | |
Miscellaneous | | | 51,509 | |
Total liabilities | | | 4,896,822 | |
Commitments and contingent liabilities (Note 10) | | | — | |
Net assets | | $ | 48,353,782 | |
| | | | | |
Net assets consist of: |
Paid in capital | | $ | 33,681,154 | |
Total distributable earnings (loss) | | | 14,672,628 | |
Net assets | | $ | 48,353,782 | |
| | | | | |
Investor Class: |
Net assets | | $ | 38,112,065 | |
Capital shares outstanding | | | 486,319 | |
Net asset value per share | | $ | 78.37 | |
| | | | | |
A-Class: |
Net assets | | $ | 5,599,300 | |
Capital shares outstanding | | | 77,176 | |
Net asset value per share | | $ | 72.55 | |
Maximum offering price per share (Net asset value divided by 95.25%) | | $ | 76.17 | |
| | | | | |
C-Class: |
Net assets | | $ | 2,533,942 | |
Capital shares outstanding | | | 40,751 | |
Net asset value per share | | $ | 62.18 | |
| | | | | |
H-Class: |
Net assets | | $ | 2,108,475 | |
Capital shares outstanding | | | 30,047 | |
Net asset value per share | | $ | 70.17 | |
STATEMENT OF OPERATIONS |
Year Ended March 31, 2021 |
Investment Income: |
Dividends (net of foreign withholding tax of $8,493) | | $ | 764,231 | |
Interest | | | 172 | |
Income from securities lending, net | | | 4,853 | |
Total investment income | | | 769,256 | |
| | | | | |
Expenses: |
Management fees | | | 311,527 | |
Distribution and service fees: |
A-Class | | | 10,306 | |
C-Class | | | 21,836 | |
H-Class | | | 5,068 | |
Transfer agent and administrative fees | | | 101,847 | |
Portfolio accounting fees | | | 36,657 | |
Professional fees | | | 14,676 | |
Trustees’ fees* | | | 6,028 | |
Custodian fees | | | 5,344 | |
Line of credit fees | | | 27 | |
Miscellaneous | | | 48,737 | |
Total expenses | | | 562,053 | |
Net investment income | | | 207,203 | |
| | | | | |
Net Realized and Unrealized Gain (Loss): |
Net realized gain (loss) on: |
Investments | | | 2,888,261 | |
Net realized gain | | | 2,888,261 | |
Net change in unrealized appreciation (depreciation) on: |
Investments | | | 18,305,356 | |
Net change in unrealized appreciation (depreciation) | | | 18,305,356 | |
Net realized and unrealized gain | | | 21,193,617 | |
Net increase in net assets resulting from operations | | $ | 21,400,820 | |
* | Relates to Trustees not deemed “interested persons” within the meaning of Section 2(a)(19) of the 1940 Act. |
22 | THE RYDEX FUNDS ANNUAL REPORT | SEE NOTES TO FINANCIAL STATEMENTS. |
STATEMENTS OF CHANGES IN NET ASSETS |
| | Year Ended
March 31,
2021 | | | Year Ended
March 31,
2020 | |
Increase (Decrease) in Net Assets from Operations: | | | | | | | | |
Net investment income | | $ | 207,203 | | | $ | 207,953 | |
Net realized gain on investments | | | 2,888,261 | | | | 1,496,946 | |
Net change in unrealized appreciation (depreciation) on investments | | | 18,305,356 | | | | (7,784,086 | ) |
Net increase (decrease) in net assets resulting from operations | | | 21,400,820 | | | | (6,079,187 | ) |
| | | | | | | | | |
Distributions to shareholders: | | | | | | | | |
Investor Class | | | (971,597 | ) | | | (1,041,004 | ) |
A-Class | | | (108,312 | ) | | | (222,796 | ) |
C-Class | | | (69,007 | ) | | | (126,761 | ) |
H-Class | | | (111,942 | ) | | | (70,981 | ) |
Total distributions to shareholders | | | (1,260,858 | ) | | | (1,461,542 | ) |
| | | | | | | | | |
Capital share transactions: | | | | | | | | |
Proceeds from sale of shares | | | | | | | | |
Investor Class | | | 64,177,984 | | | | 29,131,033 | |
A-Class | | | 2,021,511 | | | | 1,863,446 | |
C-Class | | | 1,944,229 | | | | 1,431,379 | |
H-Class | | | 4,011,677 | | | | 5,043,330 | |
Distributions reinvested | | | | | | | | |
Investor Class | | | 960,891 | | | | 1,023,950 | |
A-Class | | | 104,132 | | | | 212,298 | |
C-Class | | | 68,486 | | | | 125,218 | |
H-Class | | | 111,869 | | | | 70,857 | |
Cost of shares redeemed | | | | | | | | |
Investor Class | | | (55,658,771 | ) | | | (37,986,062 | ) |
A-Class | | | (1,861,864 | ) | | | (4,863,920 | ) |
C-Class | | | (2,232,010 | ) | | | (2,316,529 | ) |
H-Class | | | (4,064,114 | ) | | | (5,432,603 | ) |
Net increase (decrease) from capital share transactions | | | 9,584,020 | | | | (11,697,603 | ) |
Net increase (decrease) in net assets | | | 29,723,982 | | | | (19,238,332 | ) |
| | | | | | | | | |
Net assets: | | | | | | | | |
Beginning of year | | | 18,629,800 | | | | 37,868,132 | |
End of year | | $ | 48,353,782 | | | $ | 18,629,800 | |
| | | | | | | | | |
Capital share activity: | | | | | | | | |
Shares sold | | | | | | | | |
Investor Class | | | 1,007,217 | | | | 497,060 | |
A-Class | | | 31,548 | | | | 33,828 | |
C-Class | | | 37,998 | | | | 30,294 | |
H-Class | | | 72,683 | | | | 97,382 | |
Shares issued from reinvestment of distributions | | | | | | | | |
Investor Class | | | 13,676 | | | | 17,636 | |
A-Class | | | 1,600 | | | | 3,930 | |
C-Class | | | 1,225 | | | | 2,668 | |
H-Class | | | 1,777 | | | | 1,355 | |
Shares redeemed | | | | | | | | |
Investor Class | | | (848,607 | ) | | | (660,790 | ) |
A-Class | | | (31,218 | ) | | | (87,985 | ) |
C-Class | | | (43,144 | ) | | | (49,672 | ) |
H-Class | | | (66,030 | ) | | | (104,189 | ) |
Net increase (decrease) in shares | | | 178,725 | | | | (218,483 | ) |
SEE NOTES TO FINANCIAL STATEMENTS. | THE RYDEX FUNDS ANNUAL REPORT | 23 |
This table is presented to show selected data for a share outstanding throughout each period and to assist shareholders in evaluating a Fund’s performance for the periods presented.
Investor Class | | Year Ended
March 31,
2021 | | | Year Ended
March 31,
2020 | | | Year Ended
March 31,
2019 | | | Year Ended
March 29,
2018 | | | Year Ended
March 31,
2017 | |
Per Share Data |
Net asset value, beginning of period | | $ | 42.39 | | | $ | 58.04 | | | $ | 60.37 | | | $ | 55.71 | | | $ | 45.18 | |
Income (loss) from investment operations: |
Net investment income (loss)a | | | .43 | | | | .43 | | | | .35 | | | | .11 | | | | .18 | |
Net gain (loss) on investments (realized and unrealized) | | | 37.12 | | | | (13.42 | ) | | | (1.85 | ) | | | 4.80 | | | | 10.92 | |
Total from investment operations | | | 37.55 | | | | (12.99 | ) | | | (1.50 | ) | | | 4.91 | | | | 11.10 | |
Less distributions from: |
Net investment income | | | (.54 | ) | | | (.90 | ) | | | (.24 | ) | | | (.25 | ) | | | (.57 | ) |
Net realized gains | | | (1.03 | ) | | | (1.76 | ) | | | (.59 | ) | | | — | | | | — | |
Total distributions | | | (1.57 | ) | | | (2.66 | ) | | | (.83 | ) | | | (.25 | ) | | | (.57 | ) |
Net asset value, end of period | | $ | 78.37 | | | $ | 42.39 | | | $ | 58.04 | | | $ | 60.37 | | | $ | 55.71 | |
|
Total Return | | | 89.00 | % | | | (23.61 | %) | | | (2.36 | %) | | | 8.81 | % | | | 24.65 | % |
Ratios/Supplemental Data |
Net assets, end of period (in thousands) | | $ | 38,112 | | | $ | 13,313 | | | $ | 26,704 | | | $ | 51,589 | | | $ | 56,854 | |
Ratios to average net assets: |
Net investment income (loss) | | | 0.67 | % | | | 0.74 | % | | | 0.59 | % | | | 0.18 | % | | | 0.35 | % |
Total expensesb | | | 1.43 | % | | | 1.48 | % | | | 1.47 | % | | | 1.38 | % | | | 1.37 | % |
Portfolio turnover rate | | | 162 | % | | | 67 | % | | | 247 | % | | | 257 | % | | | 361 | % |
A-Class | | Year Ended
March 31,
2021 | | | Year Ended
March 31,
2020 | | | Year Ended
March 31,
2019 | | | Year Ended
March 29,
2018 | | | Year Ended
March 31,
2017 | |
Per Share Data |
Net asset value, beginning of period | | $ | 39.41 | | | $ | 54.27 | | | $ | 56.66 | | | $ | 52.42 | | | $ | 42.65 | |
Income (loss) from investment operations: |
Net investment income (loss)a | | | .25 | | | | .26 | | | | .25 | | | | (.01 | ) | | | .03 | |
Net gain (loss) on investments (realized and unrealized) | | | 34.46 | | | | (12.46 | ) | | | (1.81 | ) | | | 4.50 | | | | 10.31 | |
Total from investment operations | | | 34.71 | | | | (12.20 | ) | | | (1.56 | ) | | | 4.49 | | | | 10.34 | |
Less distributions from: |
Net investment income | | | (.54 | ) | | | (.90 | ) | | | (.24 | ) | | | (.25 | ) | | | (.57 | ) |
Net realized gains | | | (1.03 | ) | | | (1.76 | ) | | | (.59 | ) | | | — | | | | — | |
Total distributions | | | (1.57 | ) | | | (2.66 | ) | | | (.83 | ) | | | (.25 | ) | | | (.57 | ) |
Net asset value, end of period | | $ | 72.55 | | | $ | 39.41 | | | $ | 54.27 | | | $ | 56.66 | | | $ | 52.42 | |
|
Total Returnc | | | 88.52 | % | | | (23.80 | %) | | | (2.60 | %) | | | 8.56 | % | | | 24.33 | % |
Ratios/Supplemental Data |
Net assets, end of period (in thousands) | | $ | 5,599 | | | $ | 2,966 | | | $ | 6,810 | | | $ | 9,070 | | | $ | 16,355 | |
Ratios to average net assets: |
Net investment income (loss) | | | 0.44 | % | | | 0.48 | % | | | 0.45 | % | | | (0.02 | %) | | | 0.06 | % |
Total expensesb | | | 1.69 | % | | | 1.73 | % | | | 1.72 | % | | | 1.63 | % | | | 1.62 | % |
Portfolio turnover rate | | | 162 | % | | | 67 | % | | | 247 | % | | | 257 | % | | | 361 | % |
24 | THE RYDEX FUNDS ANNUAL REPORT | SEE NOTES TO FINANCIAL STATEMENTS. |
FINANCIAL HIGHLIGHTS (concluded) |
This table is presented to show selected data for a share outstanding throughout each period and to assist shareholders in evaluating a Fund’s performance for the periods presented.
C-Class | | Year Ended
March 31,
2021 | | | Year Ended
March 31,
2020 | | | Year Ended
March 31,
2019 | | | Year Ended
March 29,
2018 | | | Year Ended
March 31,
2017 | |
Per Share Data |
Net asset value, beginning of period | | $ | 34.17 | | | $ | 47.73 | | | $ | 50.32 | | | $ | 46.93 | | | $ | 38.52 | |
Income (loss) from investment operations: |
Net investment income (loss)a | | | (.17 | ) | | | (.11 | ) | | | (.21 | ) | | | (.38 | ) | | | (.29 | ) |
Net gain (loss) on investments (realized and unrealized) | | | 29.75 | | | | (10.79 | ) | | | (1.55 | ) | | | 4.02 | | | | 9.27 | |
Total from investment operations | | | 29.58 | | | | (10.90 | ) | | | (1.76 | ) | | | 3.64 | | | | 8.98 | |
Less distributions from: |
Net investment income | | | (.54 | ) | | | (.90 | ) | | | (.24 | ) | | | (.25 | ) | | | (.57 | ) |
Net realized gains | | | (1.03 | ) | | | (1.76 | ) | | | (.59 | ) | | | — | | | | — | |
Total distributions | | | (1.57 | ) | | | (2.66 | ) | | | (.83 | ) | | | (.25 | ) | | | (.57 | ) |
Net asset value, end of period | | $ | 62.18 | | | $ | 34.17 | | | $ | 47.73 | | | $ | 50.32 | | | $ | 46.93 | |
|
Total Returnc | | | 87.07 | % | | | (24.35 | %) | | | (3.35 | %) | | | 7.75 | % | | | 23.41 | % |
Ratios/Supplemental Data |
Net assets, end of period (in thousands) | | $ | 2,534 | | | $ | 1,526 | | | $ | 2,930 | | | $ | 5,494 | | | $ | 5,824 | |
Ratios to average net assets: |
Net investment income (loss) | | | (0.34 | %) | | | (0.23 | %) | | | (0.42 | %) | | | (0.75 | %) | | | (0.66 | %) |
Total expensesb | | | 2.44 | % | | | 2.47 | % | | | 2.47 | % | | | 2.38 | % | | | 2.37 | % |
Portfolio turnover rate | | | 162 | % | | | 67 | % | | | 247 | % | | | 257 | % | | | 361 | % |
H-Class | | Year Ended
March 31,
2021 | | | Year Ended
March 31,
2020 | | | Year Ended
March 31,
2019 | | | Year Ended
March 29,
2018 | | | Year Ended
March 31,
2017 | |
Per Share Data |
Net asset value, beginning of period | | $ | 38.15 | | | $ | 52.62 | | | $ | 54.95 | | | $ | 50.84 | | | $ | 41.37 | |
Income (loss) from investment operations: |
Net investment income (loss)a | | | .19 | | | | .27 | | | | .12 | | | | (.05 | ) | | | .01 | |
Net gain (loss) on investments (realized and unrealized) | | | 33.40 | | | | (12.08 | ) | | | (1.62 | ) | | | 4.41 | | | | 10.03 | |
Total from investment operations | | | 33.59 | | | | (11.81 | ) | | | (1.50 | ) | | | 4.36 | | | | 10.04 | |
Less distributions from: |
Net investment income | | | (.54 | ) | | | (.90 | ) | | | (.24 | ) | | | (.25 | ) | | | (.57 | ) |
Net realized gains | | | (1.03 | ) | | | (1.76 | ) | | | (.59 | ) | | | — | | | | — | |
Total distributions | | | (1.57 | ) | | | (2.66 | ) | | | (.83 | ) | | | (.25 | ) | | | (.57 | ) |
Net asset value, end of period | | $ | 70.17 | | | $ | 38.15 | | | $ | 52.62 | | | $ | 54.95 | | | $ | 50.84 | |
|
Total Return | | | 88.51 | % | | | (23.81 | %) | | | (2.59 | %) | | | 8.57 | % | | | 24.36 | % |
Ratios/Supplemental Data |
Net assets, end of period (in thousands) | | $ | 2,108 | | | $ | 825 | | | $ | 1,424 | | | $ | 9,220 | | | $ | 8,077 | |
Ratios to average net assets: |
Net investment income (loss) | | | 0.33 | % | | | 0.51 | % | | | 0.21 | % | | | (0.09 | %) | | | 0.03 | % |
Total expensesb | | | 1.68 | % | | | 1.72 | % | | | 1.71 | % | | | 1.62 | % | | | 1.62 | % |
Portfolio turnover rate | | | 162 | % | | | 67 | % | | | 247 | % | | | 257 | % | | | 361 | % |
a | Net investment income (loss) per share was computed using average shares outstanding throughout the period. |
b | Does not include expenses of the underlying funds in which the Fund invests. |
c | Total return does not reflect the impact of any applicable sales charges. |
SEE NOTES TO FINANCIAL STATEMENTS. | THE RYDEX FUNDS ANNUAL REPORT | 25 |
PERFORMANCE REPORT AND FUND PROFILE (Unaudited) | March 31, 2021 |
BIOTECHNOLOGY FUND
OBJECTIVE: Seeks to provide capital appreciation by investing in companies that are involved in the biotechnology industry, including companies involved in research and development, genetic, or other biological engineering, and in the design, manufacture, or sale of related biotechnology products or services (“Biotechnology Companies”).
For the one-year period ended March 31, 2021, Biotechnology Fund Investor Class returned 40.80%, compared with 34.04% for the S&P 500 Health Care Index. The broader S&P 500 Index returned 56.35%.
All industries contributed to return, led by biotechnology, life sciences tools & services and pharmaceuticals.
Immunomedics, Inc., Moderna, Inc., and AbbVie, Inc. contributed the most to the Fund’s return for the period. Biogen Inc., Amicus Therapeutics, Inc., and Inovio Pharmaceuticals, Inc. detracted the most from return.
Performance displayed represents past performance, which is no guarantee of future results.
Holdings Diversification (Market Exposure as % of Net Assets)
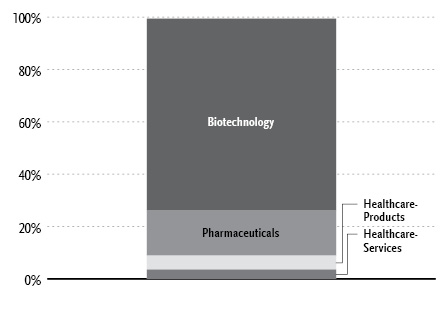
“Holdings Diversification (Market Exposure as % of Net Assets)” excludes any temporary cash investments.
Inception Dates: |
Investor Class | April 1, 1998 |
A-Class | September 1, 2004 |
C-Class | March 30, 2001 |
H-Class | April 1, 1998 |
Ten Largest Holdings (% of Total Net Assets) |
AbbVie, Inc. | 6.2% |
Amgen, Inc. | 5.3% |
Gilead Sciences, Inc. | 4.0% |
Vertex Pharmaceuticals, Inc. | 3.3% |
Illumina, Inc. | 3.2% |
Regeneron Pharmaceuticals, Inc. | 3.1% |
Moderna, Inc. | 3.1% |
Biogen, Inc. | 3.0% |
Corteva, Inc. | 2.6% |
Alexion Pharmaceuticals, Inc. | 2.6% |
Top Ten Total | 36.4% |
| | |
“Ten Largest Holdings” excludes any temporary cash investments. |
26 | THE RYDEX FUNDS ANNUAL REPORT | |
PERFORMANCE REPORT AND FUND PROFILE (Unaudited)(concluded) | March 31, 2021 |
Cumulative Fund Performance*
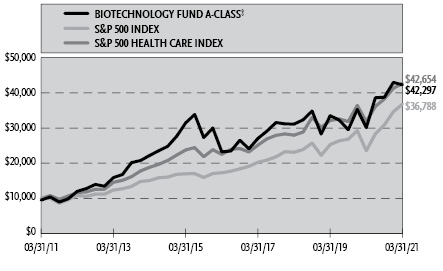
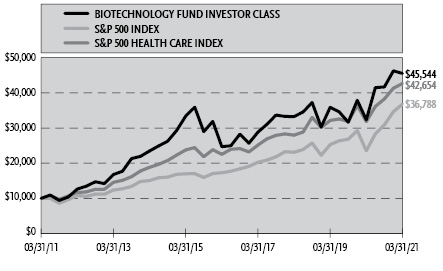
Average Annual Returns*
Periods Ended March 31, 2021
| 1 Year | 5 Year | 10 Year |
Investor Class Shares | 40.80% | 13.01% | 16.37% |
A-Class Shares | 40.44% | 12.72% | 16.08% |
A-Class Shares with sales charge‡ | 33.76% | 11.63% | 15.51% |
C-Class Shares | 39.39% | 11.88% | 15.21% |
C-Class Shares with CDSC§ | 38.39% | 11.88% | 15.21% |
H-Class Shares** | 40.45% | 12.72% | 15.96% |
S&P 500 Health Care Index | 34.04% | 13.61% | 15.61% |
S&P 500 Index | 56.35% | 16.29% | 13.91% |
* | The performance data above represents past performance that is not predictive of future results. The investment return and principal value of an investment in the Fund will fluctuate so that an investor’s shares, when redeemed, may be worth more or less than their original cost. Returns are historical and include changes in principal and reinvested dividends and capital gains and do not reflect the effect of taxes. The S&P 500 Index and the S&P 500 Health Care Index are unmanaged indices and, unlike the Fund, have no management fees or operating expenses to reduce their reported returns. The graphs are based on Investor Class shares and A-Class shares only; performance for C-Class shares and H-Class shares will vary due to differences in fee structures. |
** | Effective September 30, 2015, the Fund’s Advisor Class shares were converted into H-Class shares. |
‡ | Fund returns are calculated using the maximum sales charge of 4.75%. |
§ | Fund returns include a CDSC of 1% if redeemed within 12 months of purchase. |
| | THE RYDEX FUNDS ANNUAL REPORT | 27 |
SCHEDULE OF INVESTMENTS | March 31, 2021 |
BIOTECHNOLOGY FUND | |
| | Shares | | | Value | |
COMMON STOCKS† - 99.5% |
| | | | | | | | | |
Biotechnology - 73.4% |
Amgen, Inc. | | | 41,014 | | | $ | 10,204,693 | |
Gilead Sciences, Inc. | | | 118,157 | | | | 7,636,487 | |
Vertex Pharmaceuticals, Inc.* | | | 29,460 | | | | 6,330,659 | |
Illumina, Inc.* | | | 15,933 | | | | 6,119,228 | |
Regeneron Pharmaceuticals, Inc.* | | | 12,686 | | | | 6,002,254 | |
Moderna, Inc.* | | | 44,894 | | | | 5,878,869 | |
Biogen, Inc.* | | | 20,330 | | | | 5,687,318 | |
Corteva, Inc. | | | 106,161 | | | | 4,949,226 | |
Alexion Pharmaceuticals, Inc.* | | | 32,150 | | | | 4,916,057 | |
Seagen, Inc.* | | | 29,839 | | | | 4,143,444 | |
Exact Sciences Corp.* | | | 30,664 | | | | 4,040,902 | |
Incyte Corp.* | | | 44,724 | | | | 3,634,719 | |
Bio-Rad Laboratories, Inc. — Class A* | | | 6,140 | | | | 3,506,984 | |
Alnylam Pharmaceuticals, Inc.* | | | 24,388 | | | | 3,443,342 | |
Guardant Health, Inc.* | | | 22,476 | | | | 3,430,961 | |
CRISPR Therapeutics AG* | | | 25,540 | | | | 3,112,049 | |
BioMarin Pharmaceutical, Inc.* | | | 40,899 | | | | 3,088,283 | |
BioNTech SE ADR*,1 | | | 26,220 | | | | 2,862,962 | |
Novavax, Inc.* | | | 15,550 | | | | 2,819,370 | |
BeiGene Ltd. ADR* | | | 7,020 | | | | 2,443,522 | |
Mirati Therapeutics, Inc.* | | | 14,233 | | | | 2,438,113 | |
Acceleron Pharma, Inc.* | | | 17,962 | | | | 2,435,827 | |
Fate Therapeutics, Inc.* | | | 27,870 | | | | 2,297,882 | |
United Therapeutics Corp.* | | | 13,638 | | | | 2,281,228 | |
Ultragenyx Pharmaceutical, Inc.* | | | 19,929 | | | | 2,269,116 | |
TG Therapeutics, Inc.* | | | 46,620 | | | | 2,247,084 | |
Exelixis, Inc.* | | | 98,564 | | | | 2,226,561 | |
Arrowhead Pharmaceuticals, Inc.* | | | 32,997 | | | | 2,188,031 | |
Twist Bioscience Corp.* | | | 16,700 | | | | 2,068,462 | |
Blueprint Medicines Corp.* | | | 20,430 | | | | 1,986,409 | |
Halozyme Therapeutics, Inc.* | | | 47,420 | | | | 1,976,940 | |
Ionis Pharmaceuticals, Inc.* | | | 43,579 | | | | 1,959,312 | |
Emergent BioSolutions, Inc.* | | | 20,730 | | | | 1,926,024 | |
Iovance Biotherapeutics, Inc.* | | | 57,964 | | | | 1,835,140 | |
Sage Therapeutics, Inc.* | | | 23,526 | | | | 1,760,921 | |
Biohaven Pharmaceutical Holding Company Ltd.* | | | 25,170 | | | | 1,720,370 | |
Arena Pharmaceuticals, Inc.* | | | 24,270 | | | | 1,684,095 | |
ACADIA Pharmaceuticals, Inc.* | | | 64,903 | | | | 1,674,497 | |
ChemoCentryx, Inc.* | | | 30,430 | | | | 1,559,233 | |
PTC Therapeutics, Inc.* | | | 30,028 | | | | 1,421,826 | |
Editas Medicine, Inc.* | | | 33,300 | | | | 1,398,600 | |
Amicus Therapeutics, Inc.* | | | 136,080 | | | | 1,344,470 | |
Global Blood Therapeutics, Inc.* | | | 32,095 | | | | 1,307,871 | |
Bluebird Bio, Inc.* | | | 39,725 | | | | 1,197,709 | |
Inovio Pharmaceuticals, Inc.*,1 | | | 122,560 | | | | 1,137,357 | |
Total Biotechnology | | | | | | | 140,594,407 | |
| | | | | | | | | |
Pharmaceuticals - 17.2% |
AbbVie, Inc. | | | 110,062 | | | | 11,910,910 | |
Horizon Therapeutics plc* | | | 42,545 | | | | 3,915,842 | |
Viatris, Inc.* | | | 242,687 | | | | 3,390,337 | |
PRA Health Sciences, Inc.* | | | 17,635 | | | | 2,703,975 | |
Neurocrine Biosciences, Inc.* | | | 27,296 | | | | 2,654,536 | |
Jazz Pharmaceuticals plc* | | | 16,047 | | | | 2,637,645 | |
Intellia Therapeutics, Inc.* | | | 27,870 | | | | 2,236,707 | |
Sarepta Therapeutics, Inc.* | | | 26,089 | | | | 1,944,413 | |
Pacira BioSciences, Inc.* | | | 21,190 | | | | 1,485,207 | |
Total Pharmaceuticals | | | | | | | 32,879,572 | |
| | | | | | | | | |
Healthcare-Products - 5.4% |
Bio-Techne Corp. | | | 8,588 | | | | 3,280,015 | |
Novocure Ltd.* | | | 19,933 | | | | 2,634,744 | |
Natera, Inc.* | | | 24,960 | | | | 2,534,438 | |
Adaptive Biotechnologies Corp.* | | | 48,760 | | | | 1,963,078 | |
Total Healthcare-Products | | | | | | | 10,412,275 | |
| | | | | | | | | |
Healthcare-Services - 3.5% |
Syneos Health, Inc.* | | | 31,060 | | | | 2,355,901 | |
Invitae Corp.*,1 | | | 59,390 | | | | 2,269,292 | |
Medpace Holdings, Inc.* | | | 12,570 | | | | 2,062,108 | |
Total Healthcare-Services | | | | | | | 6,687,301 | |
| | | | | | | | | |
Total Common Stocks | | | | |
(Cost $103,366,793) | | | | | | | 190,573,555 | |
| | | | | | | | | |
RIGHTS††† - 0.0% |
Biotechnology - 0.0% |
Clinical Data, Inc.* | | | 24,000 | | | | — | |
Total Rights | | | | |
(Cost $—) | | | | | | | — | |
| | | | | | | | | |
| | | Face
Amount | | | | | |
REPURCHASE AGREEMENTS††,2 - 0.2% |
J.P. Morgan Securities LLC
issued 03/31/21 at 0.01%
due 04/01/21 | | $ | 203,318 | | | | 203,318 | |
Barclays Capital, Inc.
issued 03/31/21 at 0.01%
due 04/01/21 | | | 92,438 | | | | 92,438 | |
BofA Securities, Inc.
issued 03/31/21 at 0.01%
due 04/01/21 | | | 84,365 | | | | 84,365 | |
Total Repurchase Agreements | | | | |
(Cost $380,121) | | | | | | | 380,121 | |
| | | | | | | | | |
| | | Shares | | | | | |
SECURITIES LENDING COLLATERAL†,3 - 2.3% |
Money Market Fund | | | | | | | | |
First American Government Obligations Fund — Class Z, 0.03%4 | | | 4,514,930 | | | | 4,514,930 | |
Total Securities Lending Collateral | | | | |
(Cost $4,514,930) | | | | | | | 4,514,930 | |
| | | | | | | | | |
Total Investments - 102.0% | | | | |
(Cost $108,261,844) | | $ | 195,468,606 | |
Other Assets & Liabilities, net - (2.0)% | | | (3,860,430 | ) |
Total Net Assets - 100.0% | | $ | 191,608,176 | |
28 | THE RYDEX FUNDS ANNUAL REPORT | SEE NOTES TO FINANCIAL STATEMENTS. |
SCHEDULE OF INVESTMENTS (concluded) | March 31, 2021 |
BIOTECHNOLOGY FUND | |
* | Non-income producing security. |
† | Value determined based on Level 1 inputs — See Note 4. |
†† | Value determined based on Level 2 inputs — See Note 4. |
††† | Value determined based on Level 3 inputs — See Note 4. |
1 | All or a portion of this security is on loan at March 31, 2021 — See Note 7. |
2 | Repurchase Agreements — See Note 6. |
3 | Securities lending collateral — See Note 7. |
4 | Rate indicated is the 7-day yield as of March 31, 2021. |
| | ADR — American Depositary Receipt |
| | plc — Public Limited Company |
| | |
| | See Sector Classification in Other Information section. |
The following table summarizes the inputs used to value the Fund’s investments at March 31, 2021 (See Note 4 in the Notes to Financial Statements):
Investments in Securities (Assets) | | Level 1
Quoted
Prices | | | Level 2
Significant
Observable
Inputs | | | Level 3
Significant
Unobservable
Inputs | | | Total | |
Common Stocks | | $ | 190,573,555 | | | $ | — | | | $ | — | | | $ | 190,573,555 | |
Rights | | | — | | | | — | | | | — | * | | | — | |
Repurchase Agreements | | | — | | | | 380,121 | | | | — | | | | 380,121 | |
Securities Lending Collateral | | | 4,514,930 | | | | — | | | | — | | | | 4,514,930 | |
Total Assets | | $ | 195,088,485 | | | $ | 380,121 | | | $ | — | | | $ | 195,468,606 | |
* | Security has a market value of $0. |
SEE NOTES TO FINANCIAL STATEMENTS. | THE RYDEX FUNDS ANNUAL REPORT | 29 |
STATEMENT OF ASSETS AND LIABILITIES |
March 31, 2021 |
Assets: |
Investments, at value - including $4,673,992 of securities loaned (cost $107,881,723) | | $ | 195,088,485 | |
Repurchase agreements, at value (cost $380,121) | | | 380,121 | |
Receivables: |
Securities sold | | | 1,216,606 | |
Fund shares sold | | | 237,755 | |
Securities lending income | | | 1,340 | |
Total assets | | | 196,924,307 | |
| | | | | |
Liabilities: |
Payable for: |
Return of securities lending collateral | | | 4,514,930 | |
Fund shares redeemed | | | 373,309 | |
Management fees | | | 139,346 | |
Transfer agent and administrative fees | | | 44,099 | |
Portfolio accounting fees | | | 16,394 | |
Distribution and service fees | | | 14,129 | |
Trustees’ fees* | | | 3,012 | |
Miscellaneous | | | 210,912 | |
Total liabilities | | | 5,316,131 | |
Commitments and contingent liabilities (Note 10) | | | — | |
Net assets | | $ | 191,608,176 | |
| | | | | |
Net assets consist of: |
Paid in capital | | $ | 78,726,649 | |
Total distributable earnings (loss) | | | 112,881,527 | |
Net assets | | $ | 191,608,176 | |
| | | | | |
Investor Class: |
Net assets | | $ | 151,505,560 | |
Capital shares outstanding | | | 1,611,670 | |
Net asset value per share | | $ | 94.01 | |
| | | | | |
A-Class: |
Net assets | | $ | 22,317,006 | |
Capital shares outstanding | | | 265,013 | |
Net asset value per share | | $ | 84.21 | |
Maximum offering price per share (Net asset value divided by 95.25%) | | $ | 88.41 | |
| | | | | |
C-Class: |
Net assets | | $ | 8,220,868 | |
Capital shares outstanding | | | 115,947 | |
Net asset value per share | | $ | 70.90 | |
| | | | | |
H-Class: |
Net assets | | $ | 9,564,742 | |
Capital shares outstanding | | | 117,944 | |
Net asset value per share | | $ | 81.10 | |
STATEMENT OF OPERATIONS |
Year Ended March 31, 2021 |
Investment Income: |
Dividends (net of foreign withholding tax of $761) | | $ | 1,674,165 | |
Interest | | | 591 | |
Income from securities lending, net | | | 102,040 | |
Total investment income | | | 1,776,796 | |
| | | | | |
Expenses: |
Management fees | | | 1,816,562 | |
Distribution and service fees: |
A-Class | | | 50,806 | |
C-Class | | | 97,505 | |
H-Class | | | 36,336 | |
Transfer agent and administrative fees | | | 601,355 | |
Portfolio accounting fees | | | 213,084 | |
Registration fees | | | 210,650 | |
Professional fees | | | 114,705 | |
Trustees’ fees* | | | 47,919 | |
Custodian fees | | | 31,332 | |
Line of credit fees | | | 267 | |
Miscellaneous | | | 62,919 | |
Total expenses | | | 3,283,440 | |
Net investment loss | | | (1,506,644 | ) |
| | | | | |
Net Realized and Unrealized Gain (Loss): |
Net realized gain (loss) on: |
Investments | | | 57,826,713 | |
Net realized gain | | | 57,826,713 | |
Net change in unrealized appreciation (depreciation) on: |
Investments | | | 17,394,425 | |
Net change in unrealized appreciation (depreciation) | | | 17,394,425 | |
Net realized and unrealized gain | | | 75,221,138 | |
Net increase in net assets resulting from operations | | $ | 73,714,494 | |
* | Relates to Trustees not deemed “interested persons” within the meaning of Section 2(a)(19) of the 1940 Act. |
30 | THE RYDEX FUNDS ANNUAL REPORT | SEE NOTES TO FINANCIAL STATEMENTS. |
STATEMENTS OF CHANGES IN NET ASSETS |
| | Year Ended
March 31,
2021 | | | Year Ended
March 31,
2020 | |
Increase (Decrease) in Net Assets from Operations: | | | | | | | | |
Net investment loss | | $ | (1,506,644 | ) | | $ | (1,260,325 | ) |
Net realized gain on investments | | | 57,826,713 | | | | 30,914,727 | |
Net change in unrealized appreciation (depreciation) on investments | | | 17,394,425 | | | | (50,590,210 | ) |
Net increase (decrease) in net assets resulting from operations | | | 73,714,494 | | | | (20,935,808 | ) |
| | | | | | | | | |
Distributions to shareholders: | | | | | | | | |
Investor Class | | | (10,571,202 | ) | | | (7,452,087 | ) |
A-Class | | | (1,608,477 | ) | | | (840,011 | ) |
C-Class | | | (858,269 | ) | | | (571,551 | ) |
H-Class | | | (793,961 | ) | | | (695,143 | ) |
Total distributions to shareholders | | | (13,831,909 | ) | | | (9,558,792 | ) |
| | | | | | | | | |
Capital share transactions: | | | | | | | | |
Proceeds from sale of shares | | | | | | | | |
Investor Class | | | 165,834,078 | | | | 103,363,667 | |
A-Class | | | 9,368,554 | | | | 2,369,625 | |
C-Class | | | 2,502,770 | | | | 2,263,964 | |
H-Class | | | 30,314,058 | | | | 35,583,269 | |
Distributions reinvested | | | | | | | | |
Investor Class | | | 10,088,167 | | | | 7,185,311 | |
A-Class | | | 1,579,336 | | | | 820,588 | |
C-Class | | | 836,153 | | | | 559,459 | |
H-Class | | | 793,092 | | | | 694,706 | |
Cost of shares redeemed | | | | | | | | |
Investor Class | | | (193,107,505 | ) | | | (142,739,172 | ) |
A-Class | | | (7,656,810 | ) | | | (9,063,961 | ) |
C-Class | | | (6,166,624 | ) | | | (6,580,327 | ) |
H-Class | | | (36,476,360 | ) | | | (38,250,877 | ) |
Net decrease from capital share transactions | | | (22,091,091 | ) | | | (43,793,748 | ) |
Net increase (decrease) in net assets | | | 37,791,494 | | | | (74,288,348 | ) |
| | | | | | | | | |
Net assets: | | | | | | | | |
Beginning of year | | | 153,816,682 | | | | 228,105,030 | |
End of year | | $ | 191,608,176 | | | $ | 153,816,682 | |
| | | | | | | | | |
Capital share activity: | | | | | | | | |
Shares sold | | | | | | | | |
Investor Class | | | 1,912,201 | | | | 1,275,833 | |
A-Class | | | 117,161 | | | | 33,243 | |
C-Class | | | 35,098 | | | | 37,703 | |
H-Class | | | 433,558 | | | | 504,782 | |
Shares issued from reinvestment of distributions | | | | | | | | |
Investor Class | | | 107,584 | | | | 85,509 | |
A-Class | | | 18,788 | | | | 10,780 | |
C-Class | | | 11,787 | | | | 8,524 | |
H-Class | | | 9,797 | | | | 9,449 | |
Shares redeemed | | | | | | | | |
Investor Class | | | (2,111,884 | ) | | | (1,793,859 | ) |
A-Class | | | (95,286 | ) | | | (126,300 | ) |
C-Class | | | (86,567 | ) | | | (106,316 | ) |
H-Class | | | (458,828 | ) | | | (562,751 | ) |
Net decrease in shares | | | (106,591 | ) | | | (623,403 | ) |
SEE NOTES TO FINANCIAL STATEMENTS. | THE RYDEX FUNDS ANNUAL REPORT | 31 |
This table is presented to show selected data for a share outstanding throughout each period and to assist shareholders in evaluating a Fund’s performance for the periods presented.
Investor Class | | Year Ended
March 31,
2021 | | | Year Ended
March 31,
2020 | | | Year Ended
March 31,
2019 | | | Year Ended
March 29,
2018 | | | Year Ended
March 31,
2017 | |
Per Share Data |
Net asset value, beginning of period | | $ | 71.72 | | | $ | 83.02 | | | $ | 87.17 | | | $ | 79.72 | | | $ | 68.30 | |
Income (loss) from investment operations: |
Net investment income (loss)a | | | (.58 | ) | | | (.44 | ) | | | (.68 | ) | | | (.62 | ) | | | (.57 | ) |
Net gain (loss) on investments (realized and unrealized) | | | 29.82 | | | | (7.26 | ) | | | 6.42 | | | | 12.77 | | | | 11.99 | |
Total from investment operations | | | 29.24 | | | | (7.70 | ) | | | 5.74 | | | | 12.15 | | | | 11.42 | |
Less distributions from: |
Net realized gains | | | (6.95 | ) | | | (3.60 | ) | | | (9.89 | ) | | | (4.70 | ) | | | — | |
Total distributions | | | (6.95 | ) | | | (3.60 | ) | | | (9.89 | ) | | | (4.70 | ) | | | — | |
Net asset value, end of period | | $ | 94.01 | | | $ | 71.72 | | | $ | 83.02 | | | $ | 87.17 | | | $ | 79.72 | |
|
Total Return | | | 40.80 | % | | | (9.91 | %) | | | 7.94 | % | | | 15.34 | % | | | 16.71 | % |
Ratios/Supplemental Data |
Net assets, end of period (in thousands) | | $ | 151,506 | | | $ | 122,194 | | | $ | 177,344 | | | $ | 210,564 | | | $ | 238,614 | |
Ratios to average net assets: |
Net investment income (loss) | | | (0.62 | %) | | | (0.56 | %) | | | (0.79 | %) | | | (0.70 | %) | | | (0.76 | %) |
Total expenses | | | 1.45 | % | | | 1.48 | % | | | 1.46 | % | | | 1.37 | % | | | 1.37 | % |
Portfolio turnover rate | | | 115 | % | | | 64 | % | | | 100 | % | | | 105 | % | | | 207 | % |
A-Class | | Year Ended
March 31,
2021 | | | Year Ended
March 31,
2020 | | | Year Ended
March 31,
2019 | | | Year Ended
March 29,
2018 | | | Year Ended
March 31,
2017 | |
Per Share Data |
Net asset value, beginning of period | | $ | 64.92 | | | $ | 75.66 | | | $ | 80.55 | | | $ | 74.16 | | | $ | 63.69 | |
Income (loss) from investment operations: |
Net investment income (loss)a | | | (.73 | ) | | | (.57 | ) | | | (.82 | ) | | | (.76 | ) | | | (.70 | ) |
Net gain (loss) on investments (realized and unrealized) | | | 26.97 | | | | (6.57 | ) | | | 5.82 | | | | 11.85 | | | | 11.17 | |
Total from investment operations | | | 26.24 | | | | (7.14 | ) | | | 5.00 | | | | 11.09 | | | | 10.47 | |
Less distributions from: |
Net realized gains | | | (6.95 | ) | | | (3.60 | ) | | | (9.89 | ) | | | (4.70 | ) | | | — | |
Total distributions | | | (6.95 | ) | | | (3.60 | ) | | | (9.89 | ) | | | (4.70 | ) | | | — | |
Net asset value, end of period | | $ | 84.21 | | | $ | 64.92 | | | $ | 75.66 | | | $ | 80.55 | | | $ | 74.16 | |
|
Total Returnb | | | 40.44 | % | | | (10.14 | %) | | | 7.68 | % | | | 15.04 | % | | | 16.42 | % |
Ratios/Supplemental Data |
Net assets, end of period (in thousands) | | $ | 22,317 | | | $ | 14,565 | | | $ | 23,199 | | | $ | 27,370 | | | $ | 36,849 | |
Ratios to average net assets: |
Net investment income (loss) | | | (0.87 | %) | | | (0.80 | %) | | | (1.04 | %) | | | (0.93 | %) | | | (1.01 | %) |
Total expenses | | | 1.69 | % | | | 1.73 | % | | | 1.71 | % | | | 1.62 | % | | | 1.61 | % |
Portfolio turnover rate | | | 115 | % | | | 64 | % | | | 100 | % | | | 105 | % | | | 207 | % |
32 | THE RYDEX FUNDS ANNUAL REPORT | SEE NOTES TO FINANCIAL STATEMENTS. |
FINANCIAL HIGHLIGHTS (concluded) |
This table is presented to show selected data for a share outstanding throughout each period and to assist shareholders in evaluating a Fund’s performance for the periods presented.
C-Class | | Year Ended
March 31,
2021 | | | Year Ended
March 31,
2020 | | | Year Ended
March 31,
2019 | | | Year Ended
March 29,
2018 | | | Year Ended
March 31,
2017 | |
Per Share Data |
Net asset value, beginning of period | | $ | 55.85 | | | $ | 66.05 | | | $ | 72.14 | | | $ | 67.34 | | | $ | 58.27 | |
Income (loss) from investment operations: |
Net investment income (loss)a | | | (1.15 | ) | | | (.97 | ) | | | (1.27 | ) | | | (1.25 | ) | | | (1.11 | ) |
Net gain (loss) on investments (realized and unrealized) | | | 23.15 | | | | (5.63 | ) | | | 5.07 | | | | 10.75 | | | | 10.18 | |
Total from investment operations | | | 22.00 | | | | (6.60 | ) | | | 3.80 | | | | 9.50 | | | | 9.07 | |
Less distributions from: |
Net realized gains | | | (6.95 | ) | | | (3.60 | ) | | | (9.89 | ) | | | (4.70 | ) | | | — | |
Total distributions | | | (6.95 | ) | | | (3.60 | ) | | | (9.89 | ) | | | (4.70 | ) | | | — | |
Net asset value, end of period | | $ | 70.90 | | | $ | 55.85 | | | $ | 66.05 | | | $ | 72.14 | | | $ | 67.34 | |
|
Total Returnb | | | 39.39 | % | | | (10.80 | %) | | | 6.87 | % | | | 14.18 | % | | | 15.55 | % |
Ratios/Supplemental Data |
Net assets, end of period (in thousands) | | $ | 8,221 | | | $ | 8,692 | | | $ | 14,248 | | | $ | 20,104 | | | $ | 20,997 | |
Ratios to average net assets: |
Net investment income (loss) | | | (1.61 | %) | | | (1.56 | %) | | | (1.79 | %) | | | (1.70 | %) | | | (1.76 | %) |
Total expenses | | | 2.45 | % | | | 2.48 | % | | | 2.46 | % | | | 2.37 | % | | | 2.36 | % |
Portfolio turnover rate | | | 115 | % | | | 64 | % | | | 100 | % | | | 105 | % | | | 207 | % |
H-Class | | Year Ended
March 31,
2021 | | | Year Ended
March 31,
2020 | | | Year Ended
March 31,
2019 | | | Year Ended
March 29,
2018 | | | Year Ended
March 31,
2017 | |
Per Share Data |
Net asset value, beginning of period | | $ | 62.70 | | | $ | 73.18 | | | $ | 78.26 | | | $ | 72.16 | | | $ | 62.00 | |
Income (loss) from investment operations: |
Net investment income (loss)a | | | (.66 | ) | | | (.59 | ) | | | (.82 | ) | | | (.69 | ) | | | (.70 | ) |
Net gain (loss) on investments (realized and unrealized) | | | 26.01 | | | | (6.29 | ) | | | 5.63 | | | | 11.49 | | | | 10.86 | |
Total from investment operations | | | 25.35 | | | | (6.88 | ) | | | 4.81 | | | | 10.80 | | | | 10.16 | |
Less distributions from: |
Net realized gains | | | (6.95 | ) | | | (3.60 | ) | | | (9.89 | ) | | | (4.70 | ) | | | — | |
Total distributions | | | (6.95 | ) | | | (3.60 | ) | | | (9.89 | ) | | | (4.70 | ) | | | — | |
Net asset value, end of period | | $ | 81.10 | | | $ | 62.70 | | | $ | 73.18 | | | $ | 78.26 | | | $ | 72.16 | |
|
Total Return | | | 40.45 | % | | | (10.12 | %) | | | 7.66 | % | | | 15.04 | % | | | 16.39 | % |
Ratios/Supplemental Data |
Net assets, end of period (in thousands) | | $ | 9,565 | | | $ | 8,365 | | | $ | 13,315 | | | $ | 19,905 | | | $ | 19,308 | |
Ratios to average net assets: |
Net investment income (loss) | | | (0.83 | %) | | | (0.85 | %) | | | (1.06 | %) | | | (0.87 | %) | | | (1.04 | %) |
Total expenses | | | 1.72 | % | | | 1.73 | % | | | 1.71 | % | | | 1.62 | % | | | 1.61 | % |
Portfolio turnover rate | | | 115 | % | | | 64 | % | | | 100 | % | | | 105 | % | | | 207 | % |
a | Net investment income (loss) per share was computed using average shares outstanding throughout the period. |
b | Total return does not reflect the impact of any applicable sales charges. |
SEE NOTES TO FINANCIAL STATEMENTS. | THE RYDEX FUNDS ANNUAL REPORT | 33 |
PERFORMANCE REPORT AND FUND PROFILE (Unaudited) | March 31, 2021 |
CONSUMER PRODUCTS FUND
OBJECTIVE: Seeks to provide capital appreciation by investing in companies engaged in manufacturing finished goods and services both domestically and internationally (“Consumer Products Companies”).
For the one-year period ended March 31, 2021, Consumer Products Fund Investor Class returned 36.78%, compared with 28.38% for the S&P 500 Consumer Staples Index. The broader S&P 500 Index returned 56.35%.
All industries contributed to return, led by packaged foods & meats, soft drinks, and household products.
Estee Lauder Companies, Inc. - Class A, Procter & Gamble Co., and Boston Beer Company, Inc. - Class A contributed the most to the Fund’s return for the period. Coty, Inc. - Class A and Unilever plc ADR detracted the most from return.
Performance displayed represents past performance, which is no guarantee of future results.
Holdings Diversification (Market Exposure as % of Net Assets)
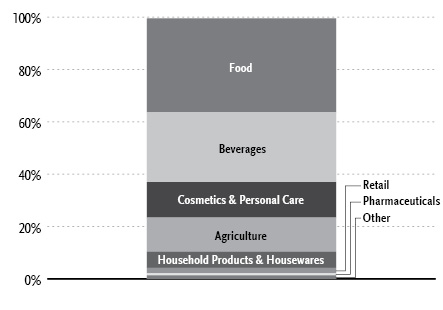
“Holdings Diversification (Market Exposure as % of Net Assets)” excludes any temporary cash investments.
Inception Dates: |
Investor Class | July 6, 1998 |
A-Class | September 1, 2004 |
C-Class | July 24, 2001 |
H-Class | August 17, 1998 |
Ten Largest Holdings (% of Total Net Assets) |
Procter & Gamble Co. | 6.8% |
Coca-Cola Co. | 5.6% |
PepsiCo, Inc. | 5.3% |
Philip Morris International, Inc. | 4.2% |
Estee Lauder Companies, Inc. — Class A | 3.8% |
Altria Group, Inc. | 3.6% |
Mondelez International, Inc. — Class A | 3.3% |
Colgate-Palmolive Co. | 3.0% |
Kraft Heinz Co. | 2.6% |
Monster Beverage Corp. | 2.6% |
Top Ten Total | 40.8% |
| | |
“Ten Largest Holdings” excludes any temporary cash investments. |
34 | THE RYDEX FUNDS ANNUAL REPORT | |
PERFORMANCE REPORT AND FUND PROFILE (Unaudited)(concluded) | March 31, 2021 |
Cumulative Fund Performance*
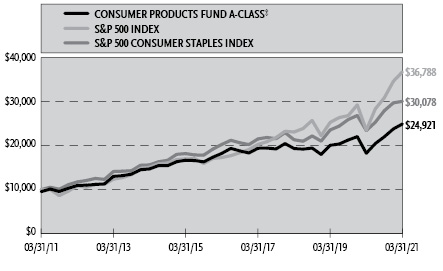
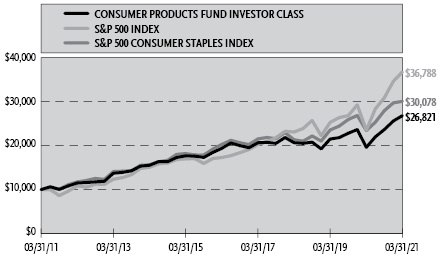
Average Annual Returns*
Periods Ended March 31, 2021
| 1 Year | 5 Year | 10 Year |
Investor Class Shares | 36.78% | 6.71% | 10.37% |
A-Class Shares | 36.43% | 6.44% | 10.10% |
A-Class Shares with sales charge‡ | 29.94% | 5.41% | 9.56% |
C-Class Shares | 35.40% | 5.65% | 9.27% |
C-Class Shares with CDSC§ | 34.40% | 5.65% | 9.27% |
H-Class Shares** | 36.43% | 6.44% | 9.97% |
S&P 500 Consumer Staples Index | 28.38% | 8.21% | 11.64% |
S&P 500 Index | 56.35% | 16.29% | 13.91% |
* | The performance data above represents past performance that is not predictive of future results. The investment return and principal value of an investment in the Fund will fluctuate so that an investor’s shares, when redeemed, may be worth more or less than their original cost. Returns are historical and include changes in principal and reinvested dividends and capital gains and do not reflect the effect of taxes. The S&P 500 Index and the S&P 500 Consumer Staples Index are unmanaged indices and, unlike the Fund, have no management fees or operating expenses to reduce their reported returns. The graphs are based on Investor Class shares and A-Class shares only; performance for C-Class shares and H-Class shares will vary due to differences in fee structures. |
** | Effective September 30, 2015, the Fund’s Advisor Class shares were converted into H-Class shares. |
‡ | Fund returns are calculated using the maximum sales charge of 4.75%. |
§ | Fund returns include a CDSC of 1% if redeemed within 12 months of purchase. |
| | THE RYDEX FUNDS ANNUAL REPORT | 35 |
SCHEDULE OF INVESTMENTS | March 31, 2021 |
CONSUMER PRODUCTS FUND | |
| | Shares | | | Value | |
COMMON STOCKS† - 99.6% |
| | | | | | | | | |
Food - 36.0% |
Mondelez International, Inc. — Class A | | | 61,752 | | | $ | 3,614,345 | |
Kraft Heinz Co. | | | 70,085 | | | | 2,803,400 | |
Sysco Corp. | | | 31,823 | | | | 2,505,743 | |
General Mills, Inc. | | | 39,963 | | | | 2,450,531 | |
Hershey Co. | | | 14,404 | | | | 2,278,137 | |
Kroger Co. | | | 58,582 | | | | 2,108,366 | |
Tyson Foods, Inc. — Class A | | | 27,234 | | | | 2,023,486 | |
Hormel Foods Corp. | | | 41,831 | | | | 1,998,685 | |
McCormick & Company, Inc. | | | 21,986 | | | | 1,960,272 | |
Kellogg Co. | | | 29,625 | | | | 1,875,263 | |
Conagra Brands, Inc. | | | 45,367 | | | | 1,705,799 | |
Campbell Soup Co. | | | 30,935 | | | | 1,555,102 | |
J M Smucker Co. | | | 11,761 | | | | 1,488,119 | |
Lamb Weston Holdings, Inc. | | | 16,923 | | | | 1,311,194 | |
US Foods Holding Corp.* | | | 30,637 | | | | 1,167,882 | |
Performance Food Group Co.* | | | 19,607 | | | | 1,129,559 | |
Beyond Meat, Inc.*,1 | | | 8,580 | | | | 1,116,430 | |
Post Holdings, Inc.* | | | 9,841 | | | | 1,040,391 | |
Ingredion, Inc. | | | 10,718 | | | | 963,763 | |
Flowers Foods, Inc. | | | 37,443 | | | | 891,143 | |
Hain Celestial Group, Inc.* | | | 18,882 | | | | 823,255 | |
Grocery Outlet Holding Corp.* | | | 20,514 | | | | 756,762 | |
Sprouts Farmers Market, Inc.* | | | 27,694 | | | | 737,214 | |
Sanderson Farms, Inc. | | | 4,667 | | | | 727,025 | |
Total Food | | | | | | | 39,031,866 | |
| | | | | | | | | |
Beverages - 26.6% |
Coca-Cola Co. | | | 115,443 | | | | 6,085,001 | |
PepsiCo, Inc. | | | 40,352 | | | | 5,707,790 | |
Monster Beverage Corp.* | | | 30,650 | | | | 2,791,908 | |
Keurig Dr Pepper, Inc. | | | 80,580 | | | | 2,769,535 | |
Constellation Brands, Inc. — Class A | | | 11,505 | | | | 2,623,140 | |
Brown-Forman Corp. — Class B | | | 32,117 | | | | 2,215,109 | |
Boston Beer Company, Inc. — Class A* | | | 1,345 | | | | 1,622,447 | |
Molson Coors Beverage Co. — Class B* | | | 26,419 | | | | 1,351,332 | |
Coca-Cola European Partners plc | | | 19,743 | | | | 1,029,795 | |
Anheuser-Busch InBev S.A. ADR1 | | | 16,029 | | | | 1,007,423 | |
Diageo plc ADR | | | 4,850 | | | | 796,418 | |
Fomento Economico Mexicano SAB de CV ADR | | | 10,544 | | | | 794,280 | |
Total Beverages | | | | | | | 28,794,178 | |
| | | | | | | | | |
Cosmetics & Personal Care - 13.6% |
Procter & Gamble Co. | | | 54,706 | | | | 7,408,834 | |
Estee Lauder Companies, Inc. — Class A | | | 14,058 | | | | 4,088,769 | |
Colgate-Palmolive Co. | | | 41,765 | | | | 3,292,335 | |
Total Cosmetics & Personal Care | | | | | | | 14,789,938 | |
| | | | | | | | | |
Agriculture - 13.1% |
Philip Morris International, Inc. | | | 51,864 | | | | 4,602,411 | |
Altria Group, Inc. | | | 75,817 | | | | 3,878,798 | |
Archer-Daniels-Midland Co. | | | 38,933 | | | | 2,219,181 | |
Darling Ingredients, Inc.* | | | 18,710 | | | | 1,376,682 | |
Bunge Ltd. | | | 16,714 | | | | 1,324,919 | |
British American Tobacco plc ADR | | | 21,314 | | | | 825,704 | |
Total Agriculture | | | | | | | 14,227,695 | |
| | | | | | | | | |
Household Products & Housewares - 6.1% |
Kimberly-Clark Corp. | | | 19,981 | | | | 2,778,358 | |
Clorox Co. | | | 10,330 | | | | 1,992,450 | |
Church & Dwight Company, Inc. | | | 21,591 | | | | 1,885,974 | |
Total Household Products & Housewares | | | | | | | 6,656,782 | |
| | | | | | | | | |
Retail - 2.1% |
Casey’s General Stores, Inc. | | | 5,312 | | | | 1,148,401 | |
Freshpet, Inc.* | | | 6,816 | | | | 1,082,449 | |
Total Retail | | | | | | | 2,230,850 | |
| | | | | | | | | |
Pharmaceuticals - 0.8% |
Herbalife Nutrition Ltd.* | | | 20,178 | | | | 895,096 | |
| | | | | | | | | |
Electrical Components & Equipment - 0.7% |
Energizer Holdings, Inc. | | | 14,996 | | | | 711,710 | |
| | | | | | | | | |
Commercial Services - 0.6% |
Medifast, Inc. | | | 2,800 | | | | 593,096 | |
| | | | | | | | | |
Total Common Stocks | | | | |
(Cost $52,048,757) | | | | | | | 107,931,211 | |
| | | | | | | | | |
| | | Face
Amount | | | | | |
REPURCHASE AGREEMENTS††,2 - 0.4% |
J.P. Morgan Securities LLC
issued 03/31/21 at 0.01%
due 04/01/21 | | $ | 249,789 | | | | 249,789 | |
Barclays Capital, Inc.
issued 03/31/21 at 0.01%
due 04/01/21 | | | 113,566 | | | | 113,566 | |
BofA Securities, Inc.
issued 03/31/21 at 0.01%
due 04/01/21 | | | 103,647 | | | | 103,647 | |
Total Repurchase Agreements | | | | |
(Cost $467,002) | | | | | | | 467,002 | |
| | | | | | | | | |
| | | Shares | | | | | |
SECURITIES LENDING COLLATERAL†,3 - 1.4% |
Money Market Fund | | | | | | | | |
First American Government Obligations Fund — Class Z, 0.03%4 | | | 1,504,750 | | | | 1,504,750 | |
Total Securities Lending Collateral | | | | |
(Cost $1,504,750) | | | | | | | 1,504,750 | |
| | | | | | | | | |
Total Investments - 101.4% | | | | |
(Cost $54,020,509) | | $ | 109,902,963 | |
Other Assets & Liabilities, net - (1.4)% | | | (1,493,926 | ) |
Total Net Assets - 100.0% | | $ | 108,409,037 | |
36 | THE RYDEX FUNDS ANNUAL REPORT | SEE NOTES TO FINANCIAL STATEMENTS. |
SCHEDULE OF INVESTMENTS (concluded) | March 31, 2021 |
CONSUMER PRODUCTS FUND | |
* | Non-income producing security. |
† | Value determined based on Level 1 inputs — See Note 4. |
†† | Value determined based on Level 2 inputs — See Note 4. |
1 | All or a portion of this security is on loan at March 31, 2021 — See Note 7. |
2 | Repurchase Agreements — See Note 6. |
3 | Securities lending collateral — See Note 7. |
4 | Rate indicated is the 7-day yield as of March 31, 2021. |
| | ADR — American Depositary Receipt |
| | plc — Public Limited Company |
| | |
| | See Sector Classification in Other Information section. |
The following table summarizes the inputs used to value the Fund’s investments at March 31, 2021 (See Note 4 in the Notes to Financial Statements):
Investments in Securities (Assets) | | Level 1
Quoted
Prices | | | Level 2
Significant
Observable
Inputs | | | Level 3
Significant
Unobservable
Inputs | | | Total | |
Common Stocks | | $ | 107,931,211 | | | $ | — | | | $ | — | | | $ | 107,931,211 | |
Repurchase Agreements | | | — | | | | 467,002 | | | | — | | | | 467,002 | |
Securities Lending Collateral | | | 1,504,750 | | | | — | | | | — | | | | 1,504,750 | |
Total Assets | | $ | 109,435,961 | | | $ | 467,002 | | | $ | — | | | $ | 109,902,963 | |
SEE NOTES TO FINANCIAL STATEMENTS. | THE RYDEX FUNDS ANNUAL REPORT | 37 |
STATEMENT OF ASSETS AND LIABILITIES |
March 31, 2021 |
Assets: |
Investments, at value - including $1,487,292 of securities loaned (cost $53,553,507) | | $ | 109,435,961 | |
Repurchase agreements, at value (cost $467,002) | | | 467,002 | |
Receivables: |
Securities sold | | | 2,785,328 | |
Dividends | | | 290,017 | |
Fund shares sold | | | 28,136 | |
Securities lending income | | | 146 | |
Total assets | | | 113,006,590 | |
| | | | | |
Liabilities: |
Payable for: |
Fund shares redeemed | | | 2,850,328 | |
Return of securities lending collateral | | | 1,504,750 | |
Management fees | | | 78,462 | |
Transfer agent and administrative fees | | | 24,831 | |
Distribution and service fees | | | 11,041 | |
Portfolio accounting fees | | | 9,230 | |
Trustees’ fees* | | | 1,674 | |
Miscellaneous | | | 117,237 | |
Total liabilities | | | 4,597,553 | |
Commitments and contingent liabilities (Note 10) | | | — | |
Net assets | | $ | 108,409,037 | |
| | | | | |
Net assets consist of: |
Paid in capital | | $ | 50,685,344 | |
Total distributable earnings (loss) | | | 57,723,693 | |
Net assets | | $ | 108,409,037 | |
| | | | | |
Investor Class: |
Net assets | | $ | 83,022,860 | |
Capital shares outstanding | | | 1,244,438 | |
Net asset value per share | | $ | 66.72 | |
| | | | | |
A-Class: |
Net assets | | $ | 10,750,500 | |
Capital shares outstanding | | | 180,002 | |
Net asset value per share | | $ | 59.72 | |
Maximum offering price per share (Net asset value divided by 95.25%) | | $ | 62.70 | |
| | | | | |
C-Class: |
Net assets | | $ | 9,034,794 | |
Capital shares outstanding | | | 185,591 | |
Net asset value per share | | $ | 48.68 | |
| | | | | |
H-Class: |
Net assets | | $ | 5,600,883 | |
Capital shares outstanding | | | 98,156 | |
Net asset value per share | | $ | 57.06 | |
STATEMENT OF OPERATIONS |
Year Ended March 31, 2021 |
Investment Income: |
Dividends (net of foreign withholding tax of $1,559) | | $ | 3,049,235 | |
Interest | | | 239 | |
Income from securities lending, net | | | 6,844 | |
Total investment income | | | 3,056,318 | |
| | | | | |
Expenses: |
Management fees | | | 1,008,771 | |
Distribution and service fees: |
A-Class | | | 23,660 | |
C-Class | | | 102,408 | |
H-Class | | | 13,305 | |
Transfer agent and administrative fees | | | 334,825 | |
Portfolio accounting fees | | | 118,705 | |
Registration fees | | | 101,783 | |
Professional fees | | | 59,265 | |
Trustees’ fees* | | | 29,016 | |
Custodian fees | | | 17,809 | |
Miscellaneous | | | 49,077 | |
Total expenses | | | 1,858,624 | |
Net investment income | | | 1,197,694 | |
| | | | | |
Net Realized and Unrealized Gain (Loss): |
Net realized gain (loss) on: |
Investments | | | 15,927,348 | |
Net realized gain | | | 15,927,348 | |
Net change in unrealized appreciation (depreciation) on: |
Investments | | | 19,705,957 | |
Net change in unrealized appreciation (depreciation) | | | 19,705,957 | |
Net realized and unrealized gain | | | 35,633,305 | |
Net increase in net assets resulting from operations | | $ | 36,830,999 | |
* | Relates to Trustees not deemed “interested persons” within the meaning of Section 2(a)(19) of the 1940 Act. |
38 | THE RYDEX FUNDS ANNUAL REPORT | SEE NOTES TO FINANCIAL STATEMENTS. |
STATEMENTS OF CHANGES IN NET ASSETS |
| | Year Ended
March 31,
2021 | | | Year Ended
March 31,
2020 | |
Increase (Decrease) in Net Assets from Operations: | | | | | | | | |
Net investment income | | $ | 1,197,694 | | | $ | 1,617,838 | |
Net realized gain on investments | | | 15,927,348 | | | | 13,380,802 | |
Net change in unrealized appreciation (depreciation) on investments | | | 19,705,957 | | | | (24,843,578 | ) |
Net increase (decrease) in net assets resulting from operations | | | 36,830,999 | | | | (9,844,938 | ) |
| | | | | | | | | |
Distributions to shareholders: | | | | | | | | |
Investor Class | | | (6,829,808 | ) | | | (2,921,088 | ) |
A-Class | | | (786,012 | ) | | | (339,079 | ) |
C-Class | | | (1,107,873 | ) | | | (437,102 | ) |
H-Class | | | (499,115 | ) | | | (268,490 | ) |
Total distributions to shareholders | | | (9,222,808 | ) | | | (3,965,759 | ) |
| | | | | | | | | |
Capital share transactions: | | | | | | | | |
Proceeds from sale of shares | | | | | | | | |
Investor Class | | | 42,509,338 | | | | 103,025,889 | |
A-Class | | | 2,320,729 | | | | 3,280,213 | |
C-Class | | | 618,758 | | | | 652,064 | |
H-Class | | | 1,759,714 | | | | 17,063,752 | |
Distributions reinvested | | | | | | | | |
Investor Class | | | 6,697,877 | | | | 2,872,298 | |
A-Class | | | 776,293 | | | | 332,113 | |
C-Class | | | 1,079,765 | | | | 427,574 | |
H-Class | | | 498,891 | | | | 268,419 | |
Cost of shares redeemed | | | | | | | | |
Investor Class | | | (68,469,059 | ) | | | (158,047,872 | ) |
A-Class | | | (3,076,742 | ) | | | (7,590,061 | ) |
C-Class | | | (4,446,663 | ) | | | (4,860,834 | ) |
H-Class | | | (2,018,656 | ) | | | (22,448,593 | ) |
Net decrease from capital share transactions | | | (21,749,755 | ) | | | (65,025,038 | ) |
Net increase (decrease) in net assets | | | 5,858,436 | | | | (78,835,735 | ) |
| | | | | | | | | |
Net assets: | | | | | | | | |
Beginning of year | | | 102,550,601 | | | | 181,386,336 | |
End of year | | $ | 108,409,037 | | | $ | 102,550,601 | |
| | | | | | | | | |
Capital share activity: | | | | | | | | |
Shares sold | | | | | | | | |
Investor Class | | | 710,047 | | | | 1,679,253 | |
A-Class | | | 41,057 | | | | 58,717 | |
C-Class | | | 13,217 | | | | 13,969 | |
H-Class | | | 33,333 | | | | 320,741 | |
Shares issued from reinvestment of distributions | | | | | | | | |
Investor Class | | | 106,130 | | | | 46,060 | |
A-Class | | | 13,730 | | | | 5,877 | |
C-Class | | | 23,377 | | | | 9,019 | |
H-Class | | | 9,235 | | | | 4,951 | |
Shares redeemed | | | | | | | | |
Investor Class | | | (1,082,594 | ) | | | (2,609,348 | ) |
A-Class | | | (53,578 | ) | | | (137,756 | ) |
C-Class | | | (95,913 | ) | | | (103,813 | ) |
H-Class | | | (37,693 | ) | | | (426,735 | ) |
Net decrease in shares | | | (319,652 | ) | | | (1,139,065 | ) |
SEE NOTES TO FINANCIAL STATEMENTS. | THE RYDEX FUNDS ANNUAL REPORT | 39 |
This table is presented to show selected data for a share outstanding throughout each period and to assist shareholders in evaluating a Fund’s performance for the periods presented.
Investor Class | | Year Ended
March 31,
2021 | | | Year Ended
March 31,
2020 | | | Year Ended
March 31,
2019 | | | Year Ended
March 29,
2018 | | | Year Ended
March 31,
2017 | |
Per Share Data |
Net asset value, beginning of period | | $ | 52.88 | | | $ | 59.56 | | | $ | 61.08 | | | $ | 66.06 | | | $ | 62.84 | |
Income (loss) from investment operations: |
Net investment income (loss)a | | | .70 | | | | .72 | | | | .92 | | | | .56 | | | | .51 | |
Net gain (loss) on investments (realized and unrealized) | | | 18.44 | | | | (5.71 | ) | | | 1.40 | | | | (.37 | ) | | | 3.58 | |
Total from investment operations | | | 19.14 | | | | (4.99 | ) | | | 2.32 | | | | .19 | | | | 4.09 | |
Less distributions from: |
Net investment income | | | (.73 | ) | | | (.77 | ) | | | (.80 | ) | | | (.44 | ) | | | (.58 | ) |
Net realized gains | | | (4.57 | ) | | | (.92 | ) | | | (3.04 | ) | | | (4.73 | ) | | | (.29 | ) |
Total distributions | | | (5.30 | ) | | | (1.69 | ) | | | (3.84 | ) | | | (5.17 | ) | | | (.87 | ) |
Net asset value, end of period | | $ | 66.72 | | | $ | 52.88 | | | $ | 59.56 | | | $ | 61.08 | | | $ | 66.06 | |
|
Total Return | | | 36.78 | % | | | (8.81 | %) | | | 4.09 | % | | | (0.04 | %) | | | 6.62 | % |
Ratios/Supplemental Data |
Net assets, end of period (in thousands) | | $ | 83,023 | | | $ | 79,890 | | | $ | 142,633 | | | $ | 152,717 | | | $ | 207,683 | |
Ratios to average net assets: |
Net investment income (loss) | | | 1.12 | % | | | 1.17 | % | | | 1.56 | % | | | 0.86 | % | | | 0.79 | % |
Total expenses | | | 1.45 | % | | | 1.47 | % | | | 1.46 | % | | | 1.38 | % | | | 1.36 | % |
Portfolio turnover rate | | | 38 | % | | | 59 | % | | | 84 | % | | | 80 | % | | | 75 | % |
A-Class | | Year Ended
March 31,
2021 | | | Year Ended
March 31,
2020 | | | Year Ended
March 31,
2019 | | | Year Ended
March 29,
2018 | | | Year Ended
March 31,
2017 | |
Per Share Data |
Net asset value, beginning of period | | $ | 47.88 | | | $ | 54.21 | | | $ | 56.08 | | | $ | 61.21 | | | $ | 58.43 | |
Income (loss) from investment operations: |
Net investment income (loss)a | | | .50 | | | | .51 | | | | .69 | | | | .36 | | | | .33 | |
Net gain (loss) on investments (realized and unrealized) | | | 16.64 | | | | (5.15 | ) | | | 1.28 | | | | (.32 | ) | | | 3.32 | |
Total from investment operations | | | 17.14 | | | | (4.64 | ) | | | 1.97 | | | | .04 | | | | 3.65 | |
Less distributions from: |
Net investment income | | | (.73 | ) | | | (.77 | ) | | | (.80 | ) | | | (.44 | ) | | | (.58 | ) |
Net realized gains | | | (4.57 | ) | | | (.92 | ) | | | (3.04 | ) | | | (4.73 | ) | | | (.29 | ) |
Total distributions | | | (5.30 | ) | | | (1.69 | ) | | | (3.84 | ) | | | (5.17 | ) | | | (.87 | ) |
Net asset value, end of period | | $ | 59.72 | | | $ | 47.88 | | | $ | 54.21 | | | $ | 56.08 | | | $ | 61.21 | |
|
Total Returnb | | | 36.43 | % | | | (9.04 | %) | | | 3.82 | % | | | (0.28 | %) | | | 6.35 | % |
Ratios/Supplemental Data |
Net assets, end of period (in thousands) | | $ | 10,751 | | | $ | 8,561 | | | $ | 13,659 | | | $ | 25,698 | | | $ | 40,272 | |
Ratios to average net assets: |
Net investment income (loss) | | | 0.89 | % | | | 0.92 | % | | | 1.28 | % | | | 0.60 | % | | | 0.56 | % |
Total expenses | | | 1.69 | % | | | 1.72 | % | | | 1.71 | % | | | 1.63 | % | | | 1.62 | % |
Portfolio turnover rate | | | 38 | % | | | 59 | % | | | 84 | % | | | 80 | % | | | 75 | % |
40 | THE RYDEX FUNDS ANNUAL REPORT | SEE NOTES TO FINANCIAL STATEMENTS. |
FINANCIAL HIGHLIGHTS (concluded) |
This table is presented to show selected data for a share outstanding throughout each period and to assist shareholders in evaluating a Fund’s performance for the periods presented.
C-Class | | Year Ended
March 31,
2021 | | | Year Ended
March 31,
2020 | | | Year Ended
March 31,
2019 | | | Year Ended
March 29,
2018 | | | Year Ended
March 31,
2017 | |
Per Share Data |
Net asset value, beginning of period | | $ | 40.08 | | | $ | 45.98 | | | $ | 48.50 | | | $ | 54.00 | | | $ | 52.04 | |
Income (loss) from investment operations: |
Net investment income (loss)a | | | .06 | | | | .08 | | | | .28 | | | | (.07 | ) | | | (.10 | ) |
Net gain (loss) on investments (realized and unrealized) | | | 13.84 | | | | (4.29 | ) | | | 1.04 | | | | (.26 | ) | | | 2.93 | |
Total from investment operations | | | 13.90 | | | | (4.21 | ) | | | 1.32 | | | | (.33 | ) | | | 2.83 | |
Less distributions from: |
Net investment income | | | (.73 | ) | | | (.77 | ) | | | (.80 | ) | | | (.44 | ) | | | (.58 | ) |
Net realized gains | | | (4.57 | ) | | | (.92 | ) | | | (3.04 | ) | | | (4.73 | ) | | | (.29 | ) |
Total distributions | | | (5.30 | ) | | | (1.69 | ) | | | (3.84 | ) | | | (5.17 | ) | | | (.87 | ) |
Net asset value, end of period | | $ | 48.68 | | | $ | 40.08 | | | $ | 45.98 | | | $ | 48.50 | | | $ | 54.00 | |
|
Total Returnb | | | 35.40 | % | | | (9.73 | %) | | | 3.06 | % | | | (1.02 | %) | | | 5.55 | % |
Ratios/Supplemental Data |
Net assets, end of period (in thousands) | | $ | 9,035 | | | $ | 9,816 | | | $ | 14,976 | | | $ | 23,531 | | | $ | 28,380 | |
Ratios to average net assets: |
Net investment income (loss) | | | 0.12 | % | | | 0.16 | % | | | 0.60 | % | | | (0.13 | %) | | | (0.20 | %) |
Total expenses | | | 2.45 | % | | | 2.47 | % | | | 2.46 | % | | | 2.38 | % | | | 2.36 | % |
Portfolio turnover rate | | | 38 | % | | | 59 | % | | | 84 | % | | | 80 | % | | | 75 | % |
H-Class | | Year Ended
March 31,
2021 | | | Year Ended
March 31,
2020 | | | Year Ended
March 31,
2019 | | | Year Ended
March 29,
2018 | | | Year Ended
March 31,
2017 | |
Per Share Data |
Net asset value, beginning of period | | $ | 45.93 | | | $ | 52.07 | | | $ | 54.02 | | | $ | 59.15 | | | $ | 56.50 | |
Income (loss) from investment operations: |
Net investment income (loss)a | | | .49 | | | | .46 | | | | .69 | | | | .38 | | | | .31 | |
Net gain (loss) on investments (realized and unrealized) | | | 15.94 | | | | (4.91 | ) | | | 1.20 | | | | (.34 | ) | | | 3.21 | |
Total from investment operations | | | 16.43 | | | | (4.45 | ) | | | 1.89 | | | | .04 | | | | 3.52 | |
Less distributions from: |
Net investment income | | | (.73 | ) | | | (.77 | ) | | | (.80 | ) | | | (.44 | ) | | | (.58 | ) |
Net realized gains | | | (4.57 | ) | | | (.92 | ) | | | (3.04 | ) | | | (4.73 | ) | | | (.29 | ) |
Total distributions | | | (5.30 | ) | | | (1.69 | ) | | | (3.84 | ) | | | (5.17 | ) | | | (.87 | ) |
Net asset value, end of period | | $ | 57.06 | | | $ | 45.93 | | | $ | 52.07 | | | $ | 54.02 | | | $ | 59.15 | |
|
Total Return | | | 36.43 | % | | | (9.05 | %) | | | 3.84 | % | | | (0.32 | %) | | | 6.35 | % |
Ratios/Supplemental Data |
Net assets, end of period (in thousands) | | $ | 5,601 | | | $ | 4,284 | | | $ | 10,118 | | | $ | 10,788 | | | $ | 35,387 | |
Ratios to average net assets: |
Net investment income (loss) | | | 0.90 | % | | | 0.86 | % | | | 1.32 | % | | | 0.65 | % | | | 0.54 | % |
Total expenses | | | 1.69 | % | | | 1.72 | % | | | 1.71 | % | | | 1.63 | % | | | 1.61 | % |
Portfolio turnover rate | | | 38 | % | | | 59 | % | | | 84 | % | | | 80 | % | | | 75 | % |
a | Net investment income (loss) per share was computed using average shares outstanding throughout the period. |
b | Total return does not reflect the impact of any applicable sales charges. |
SEE NOTES TO FINANCIAL STATEMENTS. | THE RYDEX FUNDS ANNUAL REPORT | 41 |
PERFORMANCE REPORT AND FUND PROFILE (Unaudited) | March 31, 2021 |
ELECTRONICS FUND
OBJECTIVE: Seeks to provide capital appreciation by investing in companies that are involved in the electronics sector, including semiconductor manufacturers and distributors, and makers and vendors of other electronic components and devices (“Electronics Companies”).
For the one-year period ended March 31, 2021, Electronics Fund Investor Class returned 109.05%, compared with 66.61% for the S&P 500 Information Technology Index. The broader S&P 500 Index returned 56.35%.
All industries contributed to return, led by semiconductors and semiconductor equipment.
NVIDIA Corp., QUALCOMM, Inc., and Broadcom, Inc. contributed the most to the Fund’s return for the period. National Asset Recovery Corp. detracted the most from return.
Performance displayed represents past performance, which is no guarantee of future results.
Holdings Diversification (Market Exposure as % of Net Assets)
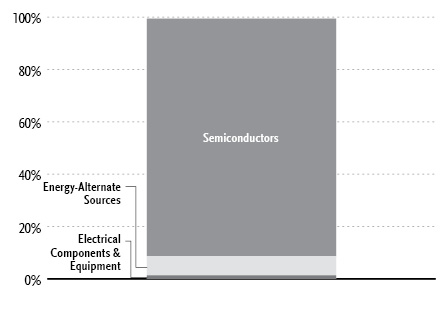
“Holdings Diversification (Market Exposure as % of Net Assets)” excludes any temporary cash investments.
Inception Dates: |
Investor Class | April 1, 1998 |
A-Class | September 1, 2004 |
C-Class | March 26, 2001 |
H-Class | April 2, 1998 |
Ten Largest Holdings (% of Total Net Assets) |
NVIDIA Corp. | 7.2% |
Intel Corp. | 6.3% |
Broadcom, Inc. | 5.3% |
Texas Instruments, Inc. | 5.3% |
QUALCOMM, Inc. | 4.8% |
Applied Materials, Inc. | 4.6% |
Micron Technology, Inc. | 3.8% |
Advanced Micro Devices, Inc. | 3.8% |
Lam Research Corp. | 3.8% |
Analog Devices, Inc. | 3.0% |
Top Ten Total | 47.9% |
| | |
“Ten Largest Holdings” excludes any temporary cash investments. |
42 | THE RYDEX FUNDS ANNUAL REPORT | |
PERFORMANCE REPORT AND FUND PROFILE (Unaudited)(concluded) | March 31, 2021 |
Cumulative Fund Performance*

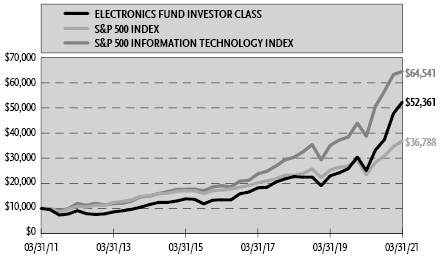
Average Annual Returns*
Periods Ended March 31, 2021
| 1 Year | 5 Year | 10 Year |
Investor Class Shares | 109.05% | 31.25% | 18.01% |
A-Class Shares | 108.53% | 30.94% | 17.71% |
A-Class Shares with sales charge‡ | 98.62% | 29.67% | 17.14% |
C-Class Shares | 106.98% | 29.96% | 16.81% |
C-Class Shares with CDSC§ | 105.98% | 29.96% | 16.81% |
H-Class Shares** | 108.53% | 30.91% | 17.57% |
S&P 500 Information Technology Index | 66.61% | 27.64% | 20.50% |
S&P 500 Index | 56.35% | 16.29% | 13.91% |
* | The performance data above represents past performance that is not predictive of future results. The investment return and principal value of an investment in the Fund will fluctuate so that an investor’s shares, when redeemed, may be worth more or less than their original cost. Returns are historical and include changes in principal and reinvested dividends and capital gains and do not reflect the effect of taxes. The S&P 500 Index and the S&P 500 Information Technology Index are unmanaged indices and, unlike the Fund, have no management fees or operating expenses to reduce their reported returns. The graphs are based on Investor Class shares and A-Class shares only; performance for C-Class and H-Class shares will vary due to differences in fee structures. |
** | Effective September 30, 2015, the Fund’s Advisor Class shares were converted into H-Class shares. |
‡ | Fund returns are calculated using the maximum sales charge of 4.75%. |
§ | Fund returns include a CDSC of 1% if redeemed within 12 months of purchase. |
| | THE RYDEX FUNDS ANNUAL REPORT | 43 |
SCHEDULE OF INVESTMENTS | March 31, 2021 |
ELECTRONICS FUND | |
| | Shares | | | Value | |
COMMON STOCKS† - 99.5% |
| | | | | | | | | |
Semiconductors - 90.8% |
NVIDIA Corp. | | | 9,716 | | | $ | 5,187,664 | |
Intel Corp. | | | 70,290 | | | | 4,498,560 | |
Broadcom, Inc. | | | 8,257 | | | | 3,828,441 | |
Texas Instruments, Inc. | | | 20,257 | | | | 3,828,370 | |
QUALCOMM, Inc. | | | 26,049 | | | | 3,453,837 | |
Applied Materials, Inc. | | | 24,948 | | | | 3,333,053 | |
Micron Technology, Inc.* | | | 31,069 | | | | 2,740,596 | |
Advanced Micro Devices, Inc.* | | | 34,668 | | | | 2,721,438 | |
Lam Research Corp. | | | 4,533 | | | | 2,698,223 | |
Analog Devices, Inc. | | | 13,836 | | | | 2,145,687 | |
KLA Corp. | | | 6,429 | | | | 2,124,142 | |
Taiwan Semiconductor Manufacturing Company Ltd. ADR | | | 17,444 | | | | 2,063,276 | |
Microchip Technology, Inc. | | | 11,981 | | | | 1,859,691 | |
Marvell Technology Group Ltd. | | | 33,902 | | | | 1,660,520 | |
NXP Semiconductor N.V. | | | 7,908 | | | | 1,592,197 | |
Skyworks Solutions, Inc. | | | 8,553 | | | | 1,569,304 | |
Xilinx, Inc. | | | 12,481 | | | | 1,546,396 | |
ASML Holding N.V. — Class G | | | 2,294 | | | | 1,416,224 | |
Maxim Integrated Products, Inc. | | | 15,360 | | | | 1,403,443 | |
Teradyne, Inc. | | | 10,719 | | | | 1,304,288 | |
Qorvo, Inc.* | | | 7,062 | | | | 1,290,227 | |
ON Semiconductor Corp.* | | | 28,555 | | | | 1,188,174 | |
Monolithic Power Systems, Inc. | | | 3,246 | | | | 1,146,520 | |
Entegris, Inc. | | | 10,156 | | | | 1,135,441 | |
Cree, Inc.* | | | 9,201 | | | | 994,904 | |
STMicroelectronics N.V. — Class Y1 | | | 25,895 | | | | 992,555 | |
MKS Instruments, Inc. | | | 4,991 | | | | 925,431 | |
Inphi Corp.* | | | 5,091 | | | | 908,285 | |
Lattice Semiconductor Corp.* | | | 15,500 | | | | 697,810 | |
Silicon Laboratories, Inc.* | | | 4,912 | | | | 692,936 | |
Brooks Automation, Inc. | | | 8,294 | | | | 677,205 | |
Cirrus Logic, Inc.* | | | 7,597 | | | | 644,150 | |
CMC Materials, Inc. | | | 3,619 | | | | 639,803 | |
Power Integrations, Inc. | | | 7,618 | | | | 620,715 | |
Synaptics, Inc.* | | | 4,436 | | | | 600,723 | |
Semtech Corp.* | | | 8,553 | | | | 590,157 | |
Ambarella, Inc.* | | | 5,090 | | | | 510,985 | |
Total Semiconductors | | | | | | | 65,231,371 | |
| | | | | | | | | |
Energy-Alternate Sources - 7.4% |
Enphase Energy, Inc.* | | | 8,209 | | | | 1,331,171 | |
SolarEdge Technologies, Inc.* | | | 4,579 | | | | 1,316,188 | |
Canadian Solar, Inc.*,1 | | | 22,023 | | | | 1,093,002 | |
First Solar, Inc.* | | | 10,284 | | | | 897,793 | |
SunPower Corp. — Class A*,1 | | | 20,761 | | | | 694,455 | |
Total Energy-Alternate Sources | | | | | | | 5,332,609 | |
| | | | | | | | | |
Electrical Components & Equipment - 1.3% |
Universal Display Corp. | | | 4,007 | | | | 948,737 | |
| | | | | | | | | |
Total Common Stocks | | | | |
(Cost $43,014,250) | | | | | | | 71,512,717 | |
| | | | | | | | | |
| | Face
Amount | | | | |
REPURCHASE AGREEMENTS††,2 - 0.7% |
J.P. Morgan Securities LLC
issued 03/31/21 at 0.01%
due 04/01/21 | | $ | 254,509 | | | $ | 254,509 | |
Barclays Capital, Inc.
issued 03/31/21 at 0.01%
due 04/01/21 | | | 115,712 | | | | 115,712 | |
BofA Securities, Inc.
issued 03/31/21 at 0.01%
due 04/01/21 | | | 105,605 | | | | 105,605 | |
Total Repurchase Agreements | | | | |
(Cost $475,826) | | | | | | | 475,826 | |
| | | | | | | | | |
| | | Shares | | | | | |
SECURITIES LENDING COLLATERAL†,3 - 2.0% |
Money Market Fund | | | | | | | | |
First American Government Obligations Fund — Class Z, 0.03%4 | | | 1,476,009 | | | | 1,476,009 | |
Total Securities Lending Collateral | | | | |
(Cost $1,476,009) | | | | | | | 1,476,009 | |
| | | | | | | | | |
Total Investments - 102.2% | | | | |
(Cost $44,966,085) | | $ | 73,464,552 | |
Other Assets & Liabilities, net - (2.2)% | | | (1,614,519 | ) |
Total Net Assets - 100.0% | | $ | 71,850,033 | |
44 | THE RYDEX FUNDS ANNUAL REPORT | SEE NOTES TO FINANCIAL STATEMENTS. |
SCHEDULE OF INVESTMENTS (concluded) | March 31, 2021 |
ELECTRONICS FUND | |
* | Non-income producing security. |
† | Value determined based on Level 1 inputs — See Note 4. |
†† | Value determined based on Level 2 inputs — See Note 4. |
1 | All or a portion of this security is on loan at March 31, 2021 — See Note 7. |
2 | Repurchase Agreements — See Note 6. |
3 | Securities lending collateral — See Note 7. |
4 | Rate indicated is the 7-day yield as of March 31, 2021. |
| | ADR — American Depositary Receipt |
| | |
| | See Sector Classification in Other Information section. |
The following table summarizes the inputs used to value the Fund’s investments at March 31, 2021 (See Note 4 in the Notes to Financial Statements):
Investments in Securities (Assets) | | Level 1
Quoted
Prices | | | Level 2
Significant
Observable
Inputs | | | Level 3
Significant
Unobservable
Inputs | | | Total | |
Common Stocks | | $ | 71,512,717 | | | $ | — | | | $ | — | | | $ | 71,512,717 | |
Repurchase Agreements | | | — | | | | 475,826 | | | | — | | | | 475,826 | |
Securities Lending Collateral | | | 1,476,009 | | | | — | | | | — | | | | 1,476,009 | |
Total Assets | | $ | 72,988,726 | | | $ | 475,826 | | | $ | — | | | $ | 73,464,552 | |
SEE NOTES TO FINANCIAL STATEMENTS. | THE RYDEX FUNDS ANNUAL REPORT | 45 |
STATEMENT OF ASSETS AND LIABILITIES |
March 31, 2021 |
Assets: |
Investments, at value - including $1,494,033 of securities loaned (cost $44,490,259) | | $ | 72,988,726 | |
Repurchase agreements, at value (cost $475,826) | | | 475,826 | |
Receivables: |
Fund shares sold | | | 73,209 | |
Dividends | | | 19,948 | |
Securities lending income | | | 124 | |
Total assets | | | 73,557,833 | |
| | | | | |
Liabilities: |
Payable for: |
Return of securities lending collateral | | | 1,476,009 | |
Fund shares redeemed | | | 81,560 | |
Management fees | | | 49,070 | |
Transfer agent and administrative fees | | | 15,529 | |
Portfolio accounting fees | | | 5,773 | |
Distribution and service fees | | | 5,069 | |
Trustees’ fees* | | | 1,053 | |
Miscellaneous | | | 73,737 | |
Total liabilities | | | 1,707,800 | |
Commitments and contingent liabilities (Note 10) | | | — | |
Net assets | | $ | 71,850,033 | |
| | | | | |
Net assets consist of: |
Paid in capital | | $ | 44,386,546 | |
Total distributable earnings (loss) | | | 27,463,487 | |
Net assets | | $ | 71,850,033 | |
| | | | | |
Investor Class: |
Net assets | | $ | 55,323,881 | |
Capital shares outstanding | | | 196,338 | |
Net asset value per share | | $ | 281.78 | |
| | | | | |
A-Class: |
Net assets | | $ | 5,156,334 | |
Capital shares outstanding | | | 19,909 | |
Net asset value per share | | $ | 259.00 | |
Maximum offering price per share (Net asset value divided by 95.25%) | | $ | 271.92 | |
| | | | | |
C-Class: |
Net assets | | $ | 2,987,267 | |
Capital shares outstanding | | | 13,242 | |
Net asset value per share | | $ | 225.59 | |
| | | | | |
H-Class: |
Net assets | | $ | 8,382,551 | |
Capital shares outstanding | | | 33,367 | |
Net asset value per share | | $ | 251.22 | |
STATEMENT OF OPERATIONS |
Year Ended March 31, 2021 |
Investment Income: |
Dividends (net of foreign withholding tax of $2,110) | | $ | 540,966 | |
Interest | | | 129 | |
Income from securities lending, net | | | 765 | |
Total investment income | | | 541,860 | |
| | | | | |
Expenses: |
Management fees | | | 417,595 | |
Distribution and service fees: |
A-Class | | | 9,149 | |
C-Class | | | 25,305 | |
H-Class | | | 11,740 | |
Transfer agent and administrative fees | | | 138,440 | |
Portfolio accounting fees | | | 49,138 | |
Registration fees | | | 45,145 | |
Professional fees | | | 25,912 | |
Trustees’ fees* | | | 11,706 | |
Custodian fees | | | 7,221 | |
Line of credit fees | | | 472 | |
Miscellaneous | | | 10,793 | |
Total expenses | | | 752,616 | |
Net investment loss | | | (210,756 | ) |
| | | | | |
Net Realized and Unrealized Gain (Loss): |
Net realized gain (loss) on: |
Investments | | | 10,332,689 | |
Net realized gain | | | 10,332,689 | |
Net change in unrealized appreciation (depreciation) on: |
Investments | | | 22,759,187 | |
Net change in unrealized appreciation (depreciation) | | | 22,759,187 | |
Net realized and unrealized gain | | | 33,091,876 | |
Net increase in net assets resulting from operations | | $ | 32,881,120 | |
* | Relates to Trustees not deemed “interested persons” within the meaning of Section 2(a)(19) of the 1940 Act. |
46 | THE RYDEX FUNDS ANNUAL REPORT | SEE NOTES TO FINANCIAL STATEMENTS. |
STATEMENTS OF CHANGES IN NET ASSETS |
| | Year Ended
March 31,
2021 | | | Year Ended
March 31,
2020 | |
Increase (Decrease) in Net Assets from Operations: | | | | | | | | |
Net investment loss | | $ | (210,756 | ) | | $ | (42,169 | ) |
Net realized gain on investments | | | 10,332,689 | | | | 1,148,578 | |
Net change in unrealized appreciation (depreciation) on investments | | | 22,759,187 | | | | (42,610 | ) |
Net increase in net assets resulting from operations | | | 32,881,120 | | | | 1,063,799 | |
| | | | | | | | | |
Distributions to shareholders: | | | | | | | | |
Investor Class | | | (623,279 | ) | | | (5,526 | ) |
A-Class | | | (93,075 | ) | | | (535 | ) |
C-Class | | | (77,886 | ) | | | (238 | ) |
H-Class | | | (152,305 | ) | | | (767 | ) |
Total distributions to shareholders | | | (946,545 | ) | | | (7,066 | ) |
| | | | | | | | | |
Capital share transactions: | | | | | | | | |
Proceeds from sale of shares | | | | | | | | |
Investor Class | | | 83,520,706 | | | | 165,434,553 | |
A-Class | | | 1,981,697 | | | | 9,059,406 | |
C-Class | | | 3,886,515 | | | | 3,919,399 | |
H-Class | | | 12,738,105 | | | | 45,691,721 | |
Distributions reinvested | | | | | | | | |
Investor Class | | | 604,864 | | | | 5,505 | |
A-Class | | | 92,127 | | | | 231 | |
C-Class | | | 77,190 | | | | 236 | |
H-Class | | | 152,296 | | | | 766 | |
Cost of shares redeemed | | | | | | | | |
Investor Class | | | (92,624,886 | ) | | | (145,938,377 | ) |
A-Class | | | (1,453,618 | ) | | | (11,409,121 | ) |
C-Class | | | (4,323,708 | ) | | | (3,756,574 | ) |
H-Class | | | (9,332,257 | ) | | | (47,020,457 | ) |
Net increase (decrease) from capital share transactions | | | (4,680,969 | ) | | | 15,987,288 | |
Net increase in net assets | | | 27,253,606 | | | | 17,044,021 | |
| | | | | | | | | |
Net assets: | | | | | | | | |
Beginning of year | | | 44,596,427 | | | | 27,552,406 | |
End of year | | $ | 71,850,033 | | | $ | 44,596,427 | |
| | | | | | | | | |
Capital share activity: | | | | | | | | |
Shares sold | | | | | | | | |
Investor Class | | | 383,605 | | | | 1,149,672 | |
A-Class | | | 10,825 | | | | 68,041 | |
C-Class | | | 24,885 | | | | 34,152 | |
H-Class | | | 57,798 | | | | 378,999 | |
Shares issued from reinvestment of distributions | | | | | | | | |
Investor Class | | | 2,448 | | | | 35 | |
A-Class | | | 405 | | | | 2 | |
C-Class | | | 389 | | | | 2 | |
H-Class | | | 691 | | | | 5 | |
Shares redeemed | | | | | | | | |
Investor Class | | | (470,379 | ) | | | (1,016,632 | ) |
A-Class | | | (8,003 | ) | | | (84,795 | ) |
C-Class | | | (27,240 | ) | | | (31,651 | ) |
H-Class | | | (42,485 | ) | | | (394,124 | ) |
Net increase (decrease) in shares | | | (67,061 | ) | | | 103,706 | |
SEE NOTES TO FINANCIAL STATEMENTS. | THE RYDEX FUNDS ANNUAL REPORT | 47 |
This table is presented to show selected data for a share outstanding throughout each period and to assist shareholders in evaluating a Fund’s performance for the periods presented.
Investor Class | | Year Ended
March 31,
2021 | | | Year Ended
March 31,
2020 | | | Year Ended
March 31,
2019 | | | Year Ended
March 29,
2018 | | | Year Ended
March 31,
2017 | |
Per Share Data |
Net asset value, beginning of period | | $ | 137.65 | | | $ | 126.31 | | | $ | 136.98 | | | $ | 110.00 | | | $ | 81.23 | |
Income (loss) from investment operations: |
Net investment income (loss)a | | | (.71 | ) | | | — | b | | | .27 | | | | (.11 | ) | | | .15 | |
Net gain (loss) on investments (realized and unrealized) | | | 150.08 | | | | 11.35 | | | | (.29 | ) | | | 27.15 | | | | 28.62 | |
Total from investment operations | | | 149.37 | | | | 11.35 | | | | (.02 | ) | | | 27.04 | | | | 28.77 | |
Less distributions from: |
Net investment income | | | — | | | | (.01 | ) | | | — | | | | (.06 | ) | | | — | |
Net realized gains | | | (5.24 | ) | | | — | | | | (10.65 | ) | | | — | | | | — | |
Total distributions | | | (5.24 | ) | | | (.01 | ) | | | (10.65 | ) | | | (.06 | ) | | | — | |
Net asset value, end of period | | $ | 281.78 | | | $ | 137.65 | | | $ | 126.31 | | | $ | 136.98 | | | $ | 110.00 | |
|
Total Return | | | 109.05 | % | | | 8.99 | % | | | 1.35 | % | | | 24.59 | % | | | 35.41 | % |
Ratios/Supplemental Data |
Net assets, end of period (in thousands) | | $ | 55,324 | | | $ | 38,634 | | | $ | 18,642 | | | $ | 54,505 | | | $ | 51,722 | |
Ratios to average net assets: |
Net investment income (loss) | | | (0.33 | %) | | | — | d | | | 0.21 | % | | | (0.08 | %) | | | 0.16 | % |
Total expenses | | | 1.44 | % | | | 1.48 | % | | | 1.46 | % | | | 1.38 | % | | | 1.38 | % |
Portfolio turnover rate | | | 163 | % | | | 265 | % | | | 521 | % | | | 457 | % | | | 643 | % |
A-Class | | Year Ended
March 31,
2021 | | | Year Ended
March 31,
2020 | | | Year Ended
March 31,
2019 | | | Year Ended
March 29,
2018 | | | Year Ended
March 31,
2017 | |
Per Share Data |
Net asset value, beginning of period | | $ | 127.06 | | | $ | 116.88 | | | $ | 127.98 | | | $ | 103.03 | | | $ | 76.25 | |
Income (loss) from investment operations: |
Net investment income (loss)a | | | (1.15 | ) | | | (.31 | ) | | | (.03 | ) | | | (.33 | ) | | | (.18 | ) |
Net gain (loss) on investments (realized and unrealized) | | | 138.33 | | | | 10.50 | | | | (.42 | ) | | | 25.34 | | | | 26.96 | |
Total from investment operations | | | 137.18 | | | | 10.19 | | | | (.45 | ) | | | 25.01 | | | | 26.78 | |
Less distributions from: |
Net investment income | | | — | | | | (.01 | ) | | | — | | | | (.06 | ) | | | — | |
Net realized gains | | | (5.24 | ) | | | — | | | | (10.65 | ) | | | — | | | | — | |
Total distributions | | | (5.24 | ) | | | (.01 | ) | | | (10.65 | ) | | | (.06 | ) | | | — | |
Net asset value, end of period | | $ | 259.00 | | | $ | 127.06 | | | $ | 116.88 | | | $ | 127.98 | | | $ | 103.03 | |
|
Total Returnc | | | 108.53 | % | | | 8.72 | % | | | 1.10 | % | | | 24.29 | % | | | 35.11 | % |
Ratios/Supplemental Data |
Net assets, end of period (in thousands) | | $ | 5,156 | | | $ | 2,120 | | | $ | 3,908 | | | $ | 3,122 | | | $ | 4,408 | |
Ratios to average net assets: |
Net investment income (loss) | | | (0.58 | %) | | | (0.23 | %) | | | (0.02 | %) | | | (0.29 | %) | | | (0.19 | %) |
Total expenses | | | 1.69 | % | | | 1.73 | % | | | 1.72 | % | | | 1.63 | % | | | 1.63 | % |
Portfolio turnover rate | | | 163 | % | | | 265 | % | | | 521 | % | | | 457 | % | | | 643 | % |
48 | THE RYDEX FUNDS ANNUAL REPORT | SEE NOTES TO FINANCIAL STATEMENTS. |
FINANCIAL HIGHLIGHTS (concluded) |
This table is presented to show selected data for a share outstanding throughout each period and to assist shareholders in evaluating a Fund’s performance for the periods presented.
C-Class | | Year Ended
March 31,
2021 | | | Year Ended
March 31,
2020 | | | Year Ended
March 31,
2019 | | | Year Ended
March 29,
2018 | | | Year Ended
March 31,
2017 | |
Per Share Data |
Net asset value, beginning of period | | $ | 111.87 | | | $ | 103.69 | | | $ | 115.77 | | | $ | 93.90 | | | $ | 70.02 | |
Income (loss) from investment operations: |
Net investment income (loss)a | | | (2.32 | ) | | | (1.14 | ) | | | (.91 | ) | | | (1.14 | ) | | | (.69 | ) |
Net gain (loss) on investments (realized and unrealized) | | | 121.28 | | | | 9.33 | | | | (.52 | ) | | | 23.07 | | | | 24.57 | |
Total from investment operations | | | 118.96 | | | | 8.19 | | | | (1.43 | ) | | | 21.93 | | | | 23.88 | |
Less distributions from: |
Net investment income | | | — | | | | (.01 | ) | | | — | | | | (.06 | ) | | | — | |
Net realized gains | | | (5.24 | ) | | | — | | | | (10.65 | ) | | | — | | | | — | |
Total distributions | | | (5.24 | ) | | | (.01 | ) | | | (10.65 | ) | | | (.06 | ) | | | — | |
Net asset value, end of period | | $ | 225.59 | | | $ | 111.87 | | | $ | 103.69 | | | $ | 115.77 | | | $ | 93.90 | |
|
Total Returnc | | | 106.98 | % | | | 7.91 | % | | | 0.34 | % | | | 23.36 | % | | | 34.09 | % |
Ratios/Supplemental Data |
Net assets, end of period (in thousands) | | $ | 2,987 | | | $ | 1,701 | | | $ | 1,317 | | | $ | 2,855 | | | $ | 2,556 | |
Ratios to average net assets: |
Net investment income (loss) | | | (1.34 | %) | | | (0.96 | %) | | | (0.83 | %) | | | (1.07 | %) | | | (0.85 | %) |
Total expenses | | | 2.44 | % | | | 2.48 | % | | | 2.45 | % | | | 2.38 | % | | | 2.38 | % |
Portfolio turnover rate | | | 163 | % | | | 265 | % | | | 521 | % | | | 457 | % | | | 643 | % |
H-Class | | Year Ended
March 31,
2021 | | | Year Ended
March 31,
2020 | | | Year Ended
March 31,
2019 | | | Year Ended
March 29,
2018 | | | Year Ended
March 31,
2017 | |
Per Share Data |
Net asset value, beginning of period | | $ | 123.34 | | | $ | 113.47 | | | $ | 124.62 | | | $ | 100.33 | | | $ | 74.32 | |
Income (loss) from investment operations: |
Net investment income (loss)a | | | (1.23 | ) | | | (.30 | ) | | | (.54 | ) | | | (.41 | ) | | | (.08 | ) |
Net gain (loss) on investments (realized and unrealized) | | | 134.35 | | | | 10.18 | | | | .04 | e | | | 24.76 | | | | 26.09 | |
Total from investment operations | | | 133.12 | | | | 9.88 | | | | (.50 | ) | | | 24.35 | | | | 26.01 | |
Less distributions from: |
Net investment income | | | — | | | | (.01 | ) | | | — | | | | (.06 | ) | | | — | |
Net realized gains | | | (5.24 | ) | | | — | | | | (10.65 | ) | | | — | | | | — | |
Total distributions | | | (5.24 | ) | | | (.01 | ) | | | (10.65 | ) | | | (.06 | ) | | | — | |
Net asset value, end of period | | $ | 251.22 | | | $ | 123.34 | | | $ | 113.47 | | | $ | 124.62 | | | $ | 100.33 | |
|
Total Return | | | 108.53 | % | | | 8.72 | % | | | 1.08 | % | | | 24.29 | % | | | 34.98 | % |
Ratios/Supplemental Data |
Net assets, end of period (in thousands) | | $ | 8,383 | | | $ | 2,142 | | | $ | 3,686 | | | $ | 31,109 | | | $ | 23,134 | |
Ratios to average net assets: |
Net investment income (loss) | | | (0.60 | %) | | | (0.22 | %) | | | (0.45 | %) | | | (0.36 | %) | | | (0.09 | %) |
Total expenses | | | 1.67 | % | | | 1.73 | % | | | 1.68 | % | | | 1.63 | % | | | 1.63 | % |
Portfolio turnover rate | | | 163 | % | | | 265 | % | | | 521 | % | | | 457 | % | | | 643 | % |
a | Net investment income (loss) per share was computed using average shares outstanding throughout the period. |
b | Less than $0.01 per share. |
c | Total return does not reflect the impact of any applicable sales charges. |
d | Less than 0.01% or (0.01%). |
e | The amount shown for a share outstanding throughout the period does not accord with the aggregate net losses on investments for the year because of the sales and repurchases of fund shares in relation to fluctuating market value of the investments of the Fund. |
SEE NOTES TO FINANCIAL STATEMENTS. | THE RYDEX FUNDS ANNUAL REPORT | 49 |
PERFORMANCE REPORT AND FUND PROFILE (Unaudited) | March 31, 2021 |
ENERGY FUND
OBJECTIVE: Seeks to provide capital appreciation by investing in companies involved in the energy field, including the exploration, production, and development of oil, gas, coal, and alternative sources of energy (“Energy Companies”).
For the one-year period ended March 31, 2021, Energy Fund Investor Class returned 91.43%, compared with 75.16% for the S&P 500 Energy Index. The broader S&P 500 Index returned 56.35%.
All industries contributed to return, led by exploration & production, integrated oil & gas, and equipment & services.
Chevron Corp., Exxon Mobil Corp., and Marathon Petroleum Corp. contributed the most to the Fund’s return for the period. Chesapeake Energy Corp., Golar LNG Ltd., and Scorpio Tankers, Inc. detracted the most from return.
Performance displayed represents past performance, which is no guarantee of future results.
Holdings Diversification (Market Exposure as % of Net Assets)

“Holdings Diversification (Market Exposure as % of Net Assets)” excludes any temporary cash investments.
Inception Dates: |
Investor Class | April 21, 1998 |
A-Class | September 1, 2004 |
C-Class | April 19, 2001 |
H-Class | May 5, 1998 |
Ten Largest Holdings (% of Total Net Assets) |
Exxon Mobil Corp. | 8.3% |
Chevron Corp. | 7.8% |
ConocoPhillips | 4.6% |
EOG Resources, Inc. | 3.6% |
Kinder Morgan, Inc. | 3.4% |
Schlumberger N.V. | 3.4% |
Phillips 66 | 3.3% |
Marathon Petroleum Corp. | 3.2% |
Pioneer Natural Resources Co. | 3.2% |
Williams Companies, Inc. | 3.0% |
Top Ten Total | 43.8% |
| | |
“Ten Largest Holdings” excludes any temporary cash investments. |
50 | THE RYDEX FUNDS ANNUAL REPORT | |
PERFORMANCE REPORT AND FUND PROFILE (Unaudited)(concluded) | March 31, 2021 |
Cumulative Fund Performance*

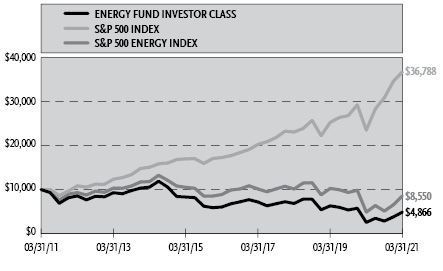
Average Annual Returns*
Periods Ended March 31, 2021
| 1 Year | 5 Year | 10 Year |
Investor Class Shares | 91.43% | (4.21%) | (6.95%) |
A-Class Shares | 90.89% | (4.45%) | (7.18%) |
A-Class Shares with sales charge‡ | 81.85% | (5.37%) | (7.63%) |
C-Class Shares | 89.48% | (5.17%) | (7.88%) |
C-Class Shares with CDSC§ | 88.48% | (5.17%) | (7.88%) |
H-Class Shares** | 90.87% | (4.49%) | (7.30%) |
S&P 500 Energy Index | 75.16% | (0.75%) | (1.55%) |
S&P 500 Index | 56.35% | 16.29% | 13.91% |
* | The performance data above represents past performance that is not predictive of future results. The investment return and principal value of an investment in the Fund will fluctuate so that an investor’s shares, when redeemed, may be worth more or less than their original cost. Returns are historical and include changes in principal and reinvested dividends and capital gains and do not reflect the effect of taxes. The S&P 500 Index and the S&P 500 Energy Index are unmanaged indices and, unlike the Fund, have no management fees or operating expenses to reduce their reported returns. The graphs are based on Investor Class shares and A-Class shares only; performance for C-Class shares and H-Class shares will vary due to differences in fee structures. |
** | Effective September 30, 2015, the Fund’s Advisor Class shares were converted into H-Class shares. |
‡ | Fund returns are calculated using the maximum sales charge of 4.75%. |
§ | Fund returns include a CDSC of 1% if redeemed within 12 months of purchase. |
| | THE RYDEX FUNDS ANNUAL REPORT | 51 |
SCHEDULE OF INVESTMENTS | March 31, 2021 |
ENERGY FUND | |
| | Shares | | | Value | |
COMMON STOCKS† - 99.9% |
| | | | | | | | | |
Oil & Gas - 71.5% |
Exxon Mobil Corp. | | | 33,891 | | | $ | 1,892,134 | |
Chevron Corp. | | | 16,888 | | | | 1,769,693 | |
ConocoPhillips | | | 19,776 | | | | 1,047,535 | |
EOG Resources, Inc. | | | 11,421 | | | | 828,365 | |
Phillips 66 | | | 9,101 | | | | 742,095 | |
Marathon Petroleum Corp. | | | 13,780 | | | | 737,092 | |
Pioneer Natural Resources Co. | | | 4,541 | | | | 721,202 | |
Valero Energy Corp. | | | 9,238 | | | | 661,441 | |
Occidental Petroleum Corp. | | | 23,223 | | | | 618,196 | |
Hess Corp. | | | 8,384 | | | | 593,252 | |
Petroleo Brasileiro S.A. ADR | | | 58,968 | | | | 500,049 | |
Devon Energy Corp. | | | 21,535 | | | | 470,540 | |
Diamondback Energy, Inc. | | | 6,093 | | | | 447,775 | |
BP plc ADR | | | 16,360 | | | | 398,366 | |
Continental Resources, Inc.* | | | 14,888 | | | | 385,153 | |
Cabot Oil & Gas Corp. — Class A | | | 18,553 | | | | 348,425 | |
Cosan S.A. ADR | | | 20,827 | | | | 336,356 | |
APA Corp. | | | 17,393 | | | | 311,335 | |
Ovintiv, Inc. | | | 12,871 | | | | 306,587 | |
Cimarex Energy Co. | | | 5,151 | | | | 305,918 | |
Royal Dutch Shell plc — Class A ADR | | | 7,675 | | | | 300,937 | |
HollyFrontier Corp. | | | 8,338 | | | | 298,334 | |
Equities Corp.* | | | 15,631 | | | | 290,424 | |
PDC Energy, Inc.* | | | 6,785 | | | | 233,404 | |
CNX Resources Corp.* | | | 15,484 | | | | 227,615 | |
Suncor Energy, Inc. | | | 10,608 | | | | 221,707 | |
Matador Resources Co. | | | 8,936 | | | | 209,549 | |
Helmerich & Payne, Inc. | | | 7,411 | | | | 199,800 | |
Murphy Oil Corp. | | | 11,718 | | | | 192,292 | |
Canadian Natural Resources Ltd. | | | 5,895 | | | | 181,979 | |
SM Energy Co. | | | 10,510 | | | | 172,049 | |
Equinor ASA ADR1 | | | 8,192 | | | | 159,416 | |
Delek US Holdings, Inc. | | | 7,206 | | | | 156,947 | |
Total Oil & Gas | | | | | | | 16,265,962 | |
| | | | | | | | | |
Pipelines - 15.3% |
Kinder Morgan, Inc. | | | 47,060 | | | | 783,549 | |
Williams Companies, Inc. | | | 28,679 | | | | 679,405 | |
ONEOK, Inc. | | | 11,927 | | | | 604,222 | |
Cheniere Energy, Inc.* | | | 7,396 | | | | 532,586 | |
Targa Resources Corp. | | | 10,433 | | | | 331,248 | |
Enbridge, Inc. | | | 7,168 | | | | 260,915 | |
TC Energy Corp. | | | 4,655 | | | | 212,966 | |
Pembina Pipeline Corp. | | | 2,786 | | | | 80,348 | |
Total Pipelines | | | | | | | 3,485,239 | |
| | | | | | | | | |
Oil & Gas Services - 10.5% |
Schlumberger N.V. | | | 28,122 | | | | 764,637 | |
Baker Hughes Co. | | | 26,416 | | | | 570,850 | |
Halliburton Co. | | | 24,852 | | | | 533,324 | |
NOV, Inc.* | | | 19,869 | | | | 272,603 | |
ChampionX Corp.* | | | 11,725 | | | | 254,784 | |
Total Oil & Gas Services | | | | | | | 2,396,198 | |
| | | | | | | | | |
Energy-Alternate Sources - 0.9% |
Renewable Energy Group, Inc.* | | | 3,200 | | | | 211,328 | |
| | | | | | | | | |
Retail - 0.8% |
World Fuel Services Corp. | | | 5,209 | | | | 183,357 | |
| | | | | | | | | |
Mining - 0.5% |
Cameco Corp. | | | 6,391 | | | | 106,155 | |
| | | | | | | | | |
Metal Fabricate & Hardware - 0.4% |
Tenaris S.A. ADR | | | 4,171 | | | | 94,640 | |
| | | | | | | | | |
Total Common Stocks | | | | |
(Cost $15,124,210) | | | | | | | 22,742,879 | |
| | | | | | | | | |
| | | Face
Amount | | | | | |
REPURCHASE AGREEMENTS††,2 - 0.8% |
J.P. Morgan Securities LLC
issued 03/31/21 at 0.01%
due 04/01/21 | | $ | 101,160 | | | | 101,160 | |
Barclays Capital, Inc.
issued 03/31/21 at 0.01%
due 04/01/21 | | | 45,993 | | | | 45,993 | |
BofA Securities, Inc.
issued 03/31/21 at 0.01%
due 04/01/21 | | | 41,975 | | | | 41,975 | |
Total Repurchase Agreements | | | | |
(Cost $189,128) | | | | | | | 189,128 | |
| | | | | | | | | |
| | | Shares | | | | | |
SECURITIES LENDING COLLATERAL†,3 - 0.1% |
Money Market Fund | | | | | | | | |
First American Government Obligations Fund — Class Z, 0.03%4 | | | 17,740 | | | | 17,740 | |
Total Securities Lending Collateral | | | | |
(Cost $17,740) | | | | | | | 17,740 | |
| | | | | | | | | |
Total Investments - 100.8% | | | | |
(Cost $15,331,078) | | $ | 22,949,747 | |
Other Assets & Liabilities, net - (0.8)% | | | (191,835 | ) |
Total Net Assets - 100.0% | | $ | 22,757,912 | |
52 | THE RYDEX FUNDS ANNUAL REPORT | SEE NOTES TO FINANCIAL STATEMENTS. |
SCHEDULE OF INVESTMENTS (concluded) | March 31, 2021 |
ENERGY FUND | |
* | Non-income producing security. |
† | Value determined based on Level 1 inputs — See Note 4. |
†† | Value determined based on Level 2 inputs — See Note 4. |
1 | All or a portion of this security is on loan at March 31, 2021 — See Note 7. |
2 | Repurchase Agreements — See Note 6. |
3 | Securities lending collateral — See Note 7. |
4 | Rate indicated is the 7-day yield as of March 31, 2021. |
| | ADR — American Depositary Receipt |
| | plc — Public Limited Company |
| | |
| | See Sector Classification in Other Information section. |
The following table summarizes the inputs used to value the Fund’s investments at March 31, 2021 (See Note 4 in the Notes to Financial Statements):
Investments in Securities (Assets) | | Level 1
Quoted
Prices | | | Level 2
Significant
Observable
Inputs | | | Level 3
Significant
Unobservable
Inputs | | | Total | |
Common Stocks | | $ | 22,742,879 | | | $ | — | | | $ | — | | | $ | 22,742,879 | |
Repurchase Agreements | | | — | | | | 189,128 | | | | — | | | | 189,128 | |
Securities Lending Collateral | | | 17,740 | | | | — | | | | — | | | | 17,740 | |
Total Assets | | $ | 22,760,619 | | | $ | 189,128 | | | $ | — | | | $ | 22,949,747 | |
SEE NOTES TO FINANCIAL STATEMENTS. | THE RYDEX FUNDS ANNUAL REPORT | 53 |
STATEMENT OF ASSETS AND LIABILITIES |
March 31, 2021 |
Assets: |
Investments, at value - including $17,261 of securities loaned (cost $15,141,950) | | $ | 22,760,619 | |
Repurchase agreements, at value (cost $189,128) | | | 189,128 | |
Cash | | | 4,347 | |
Receivables: |
Fund shares sold | | | 28,689 | |
Dividends | | | 12,185 | |
Securities lending income | | | 32 | |
Total assets | | | 22,995,000 | |
| | | | | |
Liabilities: |
Payable for: |
Fund shares redeemed | | | 123,021 | |
Management fees | | | 29,918 | |
Return of securities lending collateral | | | 17,740 | |
Transfer agent and administrative fees | | | 9,468 | |
Registration fees | | | 8,503 | |
Portfolio accounting fees | | | 3,520 | |
Distribution and service fees | | | 2,432 | |
Trustees’ fees* | | | 718 | |
Miscellaneous | | | 41,768 | |
Total liabilities | | | 237,088 | |
Commitments and contingent liabilities (Note 10) | | | — | |
Net assets | | $ | 22,757,912 | |
| | | | | |
Net assets consist of: |
Paid in capital | | $ | 48,691,751 | |
Total distributable earnings (loss) | | | (25,933,839 | ) |
Net assets | | $ | 22,757,912 | |
| | | | | |
Investor Class: |
Net assets | | $ | 18,219,595 | |
Capital shares outstanding | | | 119,129 | |
Net asset value per share | | $ | 152.94 | |
| | | | | |
A-Class: |
Net assets | | $ | 2,214,082 | |
Capital shares outstanding | | | 15,634 | |
Net asset value per share | | $ | 141.62 | |
Maximum offering price per share (Net asset value divided by 95.25%) | | $ | 148.68 | |
| | | | | |
C-Class: |
Net assets | | $ | 746,231 | |
Capital shares outstanding | | | 6,113 | |
Net asset value per share | | $ | 122.07 | |
| | | | | |
H-Class: |
Net assets | | $ | 1,578,004 | |
Capital shares outstanding | | | 11,517 | |
Net asset value per share | | $ | 137.02 | |
STATEMENT OF OPERATIONS |
Year Ended March 31, 2021 |
Investment Income: |
Dividends (net of foreign withholding tax of $5,820) | | $ | 545,286 | |
Interest | | | 33 | |
Income from securities lending, net | | | 5,424 | |
Total investment income | | | 550,743 | |
| | | | | |
Expenses: |
Management fees | | | 137,069 | |
Distribution and service fees: |
A-Class | | | 5,156 | |
C-Class | | | 6,309 | |
H-Class | | | 2,584 | |
Transfer agent and administrative fees | | | 44,852 | |
Portfolio accounting fees | | | 16,128 | |
Professional fees | | | 5,480 | |
Trustees’ fees* | | | 2,643 | |
Custodian fees | | | 2,251 | |
Line of credit fees | | | 80 | |
Miscellaneous | | | 21,368 | |
Total expenses | | | 243,920 | |
Net investment income | | | 306,823 | |
| | | | | |
Net Realized and Unrealized Gain (Loss): |
Net realized gain (loss) on: |
Investments | | | (1,453,340 | ) |
Net realized loss | | | (1,453,340 | ) |
Net change in unrealized appreciation (depreciation) on: |
Investments | | | 7,203,790 | |
Net change in unrealized appreciation (depreciation) | | | 7,203,790 | |
Net realized and unrealized gain | | | 5,750,450 | |
Net increase in net assets resulting from operations | | $ | 6,057,273 | |
* | Relates to Trustees not deemed “interested persons” within the meaning of Section 2(a)(19) of the 1940 Act. |
54 | THE RYDEX FUNDS ANNUAL REPORT | SEE NOTES TO FINANCIAL STATEMENTS. |
STATEMENTS OF CHANGES IN NET ASSETS |
| | Year Ended
March 31,
2021 | | | Year Ended
March 31,
2020 | |
Increase (Decrease) in Net Assets from Operations: | | | | | | | | |
Net investment income | | $ | 306,823 | | | $ | 283,748 | |
Net realized loss on investments | | | (1,453,340 | ) | | | (9,339,262 | ) |
Net change in unrealized appreciation (depreciation) on investments | | | 7,203,790 | | | | (1,785,606 | ) |
Net increase (decrease) in net assets resulting from operations | | | 6,057,273 | | | | (10,841,120 | ) |
| | | | | | | | | |
Distributions to shareholders: | | | | | | | | |
Investor Class | | | (213,265 | ) | | | (106,562 | ) |
A-Class | | | (38,158 | ) | | | (19,401 | ) |
C-Class | | | (19,851 | ) | | | (9,575 | ) |
H-Class | | | (20,784 | ) | | | (13,058 | ) |
Total distributions to shareholders | | | (292,058 | ) | | | (148,596 | ) |
| | | | | | | | | |
Capital share transactions: | | | | | | | | |
Proceeds from sale of shares | | | | | | | | |
Investor Class | | | 150,630,160 | | | | 47,410,108 | |
A-Class | | | 8,452,916 | | | | 1,055,200 | |
C-Class | | | 882,168 | | | | 1,008,571 | |
H-Class | | | 6,045,215 | | | | 36,112,670 | |
Distributions reinvested | | | | | | | | |
Investor Class | | | 209,206 | | | | 104,747 | |
A-Class | | | 36,489 | | | | 18,695 | |
C-Class | | | 19,168 | | | | 9,210 | |
H-Class | | | 20,784 | | | | 12,847 | |
Cost of shares redeemed | | | | | | | | |
Investor Class | | | (141,096,481 | ) | | | (51,362,661 | ) |
A-Class | | | (8,000,632 | ) | | | (1,906,514 | ) |
C-Class | | | (964,963 | ) | | | (1,541,437 | ) |
H-Class | | | (5,521,324 | ) | | | (35,653,612 | ) |
Net increase (decrease) from capital share transactions | | | 10,712,706 | | | | (4,732,176 | ) |
Net increase (decrease) in net assets | | | 16,477,921 | | | | (15,721,892 | ) |
| | | | | | | | | |
Net assets: | | | | | | | | |
Beginning of year | | | 6,279,991 | | | | 22,001,883 | |
End of year | | $ | 22,757,912 | | | $ | 6,279,991 | |
CAPITAL SHARE ACTIVITY:* | | | | | | | | |
Shares sold | | | | | | | | |
Investor Class | | | 1,183,818 | | | | 348,926 | |
A-Class | | | 62,484 | | | | 6,242 | |
C-Class | | | 9,451 | | | | 7,317 | |
H-Class | | | 52,998 | | | | 224,119 | |
Shares issued from reinvestment of distributions | | | | | | | | |
Investor Class | | | 1,689 | | | | 603 | |
A-Class | | | 318 | | | | 116 | |
C-Class | | | 193 | | | | 65 | |
H-Class | | | 187 | | | | 82 | |
Shares redeemed | | | | | | | | |
Investor Class | | | (1,117,957 | ) | | | (377,221 | ) |
A-Class | | | (60,130 | ) | | | (11,099 | ) |
C-Class | | | (10,057 | ) | | | (10,633 | ) |
H-Class | | | (50,445 | ) | | | (219,893 | ) |
Net increase (decrease) in shares | | | 72,549 | | | | (31,376 | ) |
* | Capital share activity for the year ended March 31, 2020, has been restated to reflect a 1:3 reverse share split effective August 10, 2020 — See Note 9. |
SEE NOTES TO FINANCIAL STATEMENTS. | THE RYDEX FUNDS ANNUAL REPORT | 55 |
This table is presented to show selected data for a share outstanding throughout each period and to assist shareholders in evaluating a Fund’s performance for the periods presented.
Investor Class | | Year Ended
March 31,
2021c | | | Year Ended
March 31,
2020c | | | Year Ended
March 31,
2019c | | | Year Ended
March 29,
2018c | | | Year Ended
March 31,
2017c,d | |
Per Share Data |
Net asset value, beginning of period | | $ | 81.74 | | | $ | 204.01 | | | $ | 223.24 | | | $ | 236.20 | | | $ | 199.82 | |
Income (loss) from investment operations: |
Net investment income (loss)a | | | 1.44 | | | | 2.91 | | | | 1.05 | | | | 1.83 | | | | 1.20 | |
Net gain (loss) on investments (realized and unrealized) | | | 72.59 | | | | (123.74 | ) | | | (18.87 | ) | | | (13.11 | ) | | | 36.74 | |
Total from investment operations | | | 74.03 | | | | (120.83 | ) | | | (17.82 | ) | | | (11.28 | ) | | | 37.94 | |
Less distributions from: |
Net investment income | | | (2.83 | ) | | | (1.44 | ) | | | (1.41 | ) | | | (1.68 | ) | | | (1.56 | ) |
Total distributions | | | (2.83 | ) | | | (1.44 | ) | | | (1.41 | ) | | | (1.68 | ) | | | (1.56 | ) |
Net asset value, end of period | | $ | 152.94 | | | $ | 81.74 | | | $ | 204.01 | | | $ | 223.24 | | | $ | 236.20 | |
|
Total Return | | | 91.43 | % | | | (59.61 | %) | | | (7.94 | %) | | | (4.78 | %) | | | 18.99 | % |
Ratios/Supplemental Data |
Net assets, end of period (in thousands) | | $ | 18,220 | | | $ | 4,216 | | | $ | 16,172 | | | $ | 37,253 | | | $ | 24,284 | |
Ratios to average net assets: |
Net investment income (loss) | | | 2.02 | % | | | 1.65 | % | | | 0.46 | % | | | 0.82 | % | | | 0.52 | % |
Total expenses | | | 1.42 | % | | | 1.48 | % | | | 1.46 | % | | | 1.37 | % | | | 1.37 | % |
Portfolio turnover rate | | | 939 | % | | | 428 | % | | | 525 | % | | | 954 | % | | | 996 | % |
A-Class | | Year Ended
March 31,
2021c | | | Year Ended
March 31,
2020c | | | Year Ended
March 31,
2019c | | | Year Ended
March 29,
2018c | | | Year Ended
March 31,
2017c,d | |
Per Share Data |
Net asset value, beginning of period | | $ | 76.01 | | | $ | 190.30 | | | $ | 208.85 | | | $ | 221.57 | | | $ | 188.00 | |
Income (loss) from investment operations: |
Net investment income (loss)a | | | 1.00 | | | | 2.46 | | | | .63 | | | | 1.62 | | | | .69 | |
Net gain (loss) on investments (realized and unrealized) | | | 67.44 | | | | (115.31 | ) | | | (17.77 | ) | | | (12.66 | ) | | | 34.44 | |
Total from investment operations | | | 68.44 | | | | (112.85 | ) | | | (17.14 | ) | | | (11.04 | ) | | | 35.13 | |
Less distributions from: |
Net investment income | | | (2.83 | ) | | | (1.44 | ) | | | (1.41 | ) | | | (1.68 | ) | | | (1.56 | ) |
Total distributions | | | (2.83 | ) | | | (1.44 | ) | | | (1.41 | ) | | | (1.68 | ) | | | (1.56 | ) |
Net asset value, end of period | | $ | 141.62 | | | $ | 76.01 | | | $ | 190.30 | | | $ | 208.85 | | | $ | 221.57 | |
|
Total Returnb | | | 90.89 | % | | | (59.69 | %) | | | (8.16 | %) | | | (4.99 | %) | | | 18.65 | % |
Ratios/Supplemental Data |
Net assets, end of period (in thousands) | | $ | 2,214 | | | $ | 985 | | | $ | 3,369 | | | $ | 3,111 | | | $ | 4,980 | |
Ratios to average net assets: |
Net investment income (loss) | | | 1.60 | % | | | 1.50 | % | | | 0.33 | % | | | 0.78 | % | | | 0.31 | % |
Total expenses | | | 1.68 | % | | | 1.73 | % | | | 1.71 | % | | | 1.63 | % | | | 1.62 | % |
Portfolio turnover rate | | | 939 | % | | | 428 | % | | | 525 | % | | | 954 | % | | | 996 | % |
56 | THE RYDEX FUNDS ANNUAL REPORT | SEE NOTES TO FINANCIAL STATEMENTS. |
FINANCIAL HIGHLIGHTS (concluded) |
This table is presented to show selected data for a share outstanding throughout each period and to assist shareholders in evaluating a Fund’s performance for the periods presented.
C-Class | | Year Ended
March 31,
2021c | | | Year Ended
March 31,
2020c | | | Year Ended
March 31,
2019c | | | Year Ended
March 29,
2018c | | | Year Ended
March 31,
2017c,d | |
Per Share Data |
Net asset value, beginning of period | | $ | 66.27 | | | $ | 167.39 | | | $ | 185.28 | | | $ | 198.29 | | | $ | 169.64 | |
Income (loss) from investment operations: |
Net investment income (loss)a | | | .56 | | | | 1.08 | | | | (1.08 | ) | | | (.03 | ) | | | (.87 | ) |
Net gain (loss) on investments (realized and unrealized) | | | 58.07 | | | | (100.76 | ) | | | (15.40 | ) | | | (11.30 | ) | | | 31.08 | |
Total from investment operations | | | 58.63 | | | | (99.68 | ) | | | (16.48 | ) | | | (11.33 | ) | | | 30.21 | |
Less distributions from: |
Net investment income | | | (2.83 | ) | | | (1.44 | ) | | | (1.41 | ) | | | (1.68 | ) | | | (1.56 | ) |
Total distributions | | | (2.83 | ) | | | (1.44 | ) | | | (1.41 | ) | | | (1.68 | ) | | | (1.56 | ) |
Net asset value, end of period | | $ | 122.07 | | | $ | 66.27 | | | $ | 167.39 | | | $ | 185.28 | | | $ | 198.29 | |
|
Total Returnb | | | 89.48 | % | | | (60.01 | %) | | | (8.83 | %) | | | (5.73 | %) | | | 17.76 | % |
Ratios/Supplemental Data |
Net assets, end of period (in thousands) | | $ | 746 | | | $ | 432 | | | $ | 1,637 | | | $ | 3,721 | | | $ | 4,331 | |
Ratios to average net assets: |
Net investment income (loss) | | | 1.05 | % | | | 0.76 | % | | | (0.56 | %) | | | (0.02 | %) | | | (0.45 | %) |
Total expenses | | | 2.44 | % | | | 2.48 | % | | | 2.45 | % | | | 2.38 | % | | | 2.37 | % |
Portfolio turnover rate | | | 939 | % | | | 428 | % | | | 525 | % | | | 954 | % | | | 996 | % |
H-Class | | Year Ended
March 31,
2021c | | | Year Ended
March 31,
2020c | | | Year Ended
March 31,
2019c | | | Year Ended
March 29,
2018c | | | Year Ended
March 31,
2017c,d | |
Per Share Data |
Net asset value, beginning of period | | $ | 73.61 | | | $ | 184.50 | | | $ | 202.54 | | | $ | 215.03 | | | $ | 182.69 | |
Income (loss) from investment operations: |
Net investment income (loss)a | | | 1.06 | | | | 1.92 | | | | 1.20 | | | | 2.97 | | | | .06 | |
Net gain (loss) on investments (realized and unrealized) | | | 65.18 | | | | (111.37 | ) | | | (17.83 | ) | | | (13.78 | ) | | | 33.84 | |
Total from investment operations | | | 66.24 | | | | (109.45 | ) | | | (16.63 | ) | | | (10.81 | ) | | | 33.90 | |
Less distributions from: |
Net investment income | | | (2.83 | ) | | | (1.44 | ) | | | (1.41 | ) | | | (1.68 | ) | | | (1.56 | ) |
Total distributions | | | (2.83 | ) | | | (1.44 | ) | | | (1.41 | ) | | | (1.68 | ) | | | (1.56 | ) |
Net asset value, end of period | | $ | 137.02 | | | $ | 73.61 | | | $ | 184.50 | | | $ | 202.54 | | | $ | 215.03 | |
|
Total Return | | | 90.87 | % | | | (59.73 | %) | | | (8.16 | %) | | | (5.03 | %) | | | 18.57 | % |
Ratios/Supplemental Data |
Net assets, end of period (in thousands) | | $ | 1,578 | | | $ | 646 | | | $ | 824 | | | $ | 1,480 | | | $ | 2,556 | |
Ratios to average net assets: |
Net investment income (loss) | | | 1.60 | % | | | 1.25 | % | | | 0.54 | % | | | 1.50 | % | | | 0.03 | % |
Total expenses | | | 1.68 | % | | | 1.72 | % | | | 1.70 | % | | | 1.63 | % | | | 1.63 | % |
Portfolio turnover rate | | | 939 | % | | | 428 | % | | | 525 | % | | | 954 | % | | | 996 | % |
a | Net investment income (loss) per share was computed using average shares outstanding throughout the period. |
b | Total return does not reflect the impact of any applicable sales charges. |
c | Reverse share split — Per share amounts for the years presented through March 31, 2020 have been restated to reflect a 1:3 reverse share split effective August 10, 2020 — See Note 9. |
d | Reverse share split — Per share amounts for the year ended March 31, 2017 have been restated to reflect a 1:4 reverse share split effective November 7, 2016. |
SEE NOTES TO FINANCIAL STATEMENTS. | THE RYDEX FUNDS ANNUAL REPORT | 57 |
PERFORMANCE REPORT AND FUND PROFILE (Unaudited) | March 31, 2021 |
ENERGY SERVICES FUND
OBJECTIVE: Seeks to provide capital appreciation by investing in companies that are involved in the energy services field, including those that provide services and equipment in the areas of oil, coal, and gas exploration and production (“Energy Services Companies”).
For the one-year period ended March 31, 2021, Energy Services Fund Investor Class returned 127.06%, compared with 75.16% for the S&P 500 Energy Index. The broader S&P 500 Index returned 56.35%.
All industries contributed to return, led by oil & gas equipment & services and oil & gas drilling.
Baker Hughes Co., Schlumberger N.V., and Halliburton Co. contributed the most to the Fund’s return for the period. Diamond Offshore Drilling, Inc., Transocean Ltd., and Helix Energy Solutions Group, Inc. detracted the most from return.
Performance displayed represents past performance, which is no guarantee of future results.
Holdings Diversification (Market Exposure as % of Net Assets)
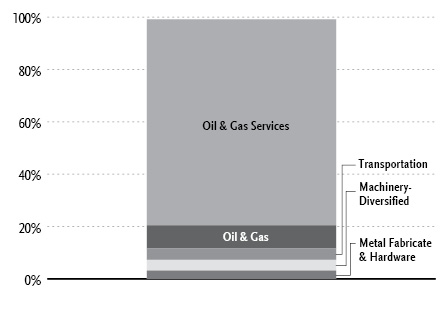
“Holdings Diversification (Market Exposure as % of Net Assets)” excludes any temporary cash investments.
Inception Dates: |
Investor Class | April 1, 1998 |
A-Class | September 1, 2004 |
C-Class | March 30, 2001 |
H-Class | April 2, 1998 |
Ten Largest Holdings (% of Total Net Assets) |
Schlumberger N.V. | 14.4% |
Baker Hughes Co. | 10.8% |
Halliburton Co. | 10.0% |
NOV, Inc. | 5.1% |
ChampionX Corp. | 4.8% |
Cactus, Inc. — Class A | 4.1% |
Helmerich & Payne, Inc. | 3.8% |
TechnipFMC plc | 3.8% |
Liberty Oilfield Services, Inc. — Class A | 3.7% |
Archrock, Inc. | 3.2% |
Top Ten Total | 63.7% |
| | |
“Ten Largest Holdings” excludes any temporary cash investments. |
58 | THE RYDEX FUNDS ANNUAL REPORT | |
PERFORMANCE REPORT AND FUND PROFILE (Unaudited)(concluded) | March 31, 2021 |
Cumulative Fund Performance*


Average Annual Returns*
Periods Ended March 31, 2021
| 1 Year | 5 Year | 10 Year |
Investor Class Shares | 127.06% | (16.14%) | (15.30%) |
A-Class Shares | 126.39% | (16.35%) | (15.51%) |
A-Class Shares with sales charge‡ | 115.83% | (17.16%) | (15.92%) |
C-Class Shares | 124.62% | (16.97%) | (16.14%) |
C-Class Shares with CDSC§ | 123.62% | (16.97%) | (16.14%) |
H-Class Shares** | 126.23% | (16.35%) | (15.61%) |
S&P 500 Energy Index | 75.16% | (0.75%) | (1.55%) |
S&P 500 Index | 56.35% | 16.29% | 13.91% |
* | The performance data above represents past performance that is not predictive of future results. The investment return and principal value of an investment in the Fund will fluctuate so that an investor’s shares, when redeemed, may be worth more or less than their original cost. Returns are historical and include changes in principal and reinvested dividends and capital gains and do not reflect the effect of taxes. The S&P 500 Index and S&P 500 Energy Index are unmanaged indices and, unlike the Fund, have no management fees or operating expenses to reduce their reported return. The graphs are based on Investor Class shares and A-Class shares only; performance for C-Class and H-Class shares will vary due to differences in fee structures. |
** | Effective September 30, 2015, the Fund’s Advisor Class shares were converted into H-Class shares. |
‡ | Fund returns are calculated using the maximum sales charge of 4.75%. |
§ | Fund returns include a CDSC of 1% if redeemed within 12 months of purchase. |
| | THE RYDEX FUNDS ANNUAL REPORT | 59 |
SCHEDULE OF INVESTMENTS | March 31, 2021 |
ENERGY SERVICES FUND | |
| | Shares | | | Value | |
COMMON STOCKS† - 99.2% |
| | | | | | | | | |
Oil & Gas Services - 78.8% |
Schlumberger N.V. | | | 34,690 | | | $ | 943,221 | |
Baker Hughes Co. | | | 32,585 | | | | 704,162 | |
Halliburton Co. | | | 30,663 | | | | 658,028 | |
NOV, Inc.* | | | 24,522 | | | | 336,442 | |
ChampionX Corp.* | | | 14,467 | | | | 314,368 | |
TechnipFMC plc* | | | 31,858 | | | | 245,944 | |
Liberty Oilfield Services, Inc. — Class A* | | | 21,647 | | | | 244,395 | |
Archrock, Inc. | | | 21,999 | | | | 208,771 | |
Dril-Quip, Inc.* | | | 5,558 | | | | 184,692 | |
ProPetro Holding Corp.* | | | 16,915 | | | | 180,314 | |
Oceaneering International, Inc.* | | | 15,758 | | | | 179,956 | |
US Silica Holdings, Inc.* | | | 13,367 | | | | 164,280 | |
DMC Global, Inc.* | | | 2,929 | | | | 158,928 | |
Bristow Group, Inc.* | | | 5,973 | | | | 154,581 | |
Core Laboratories N.V. | | | 5,213 | | | | 150,082 | |
Solaris Oilfield Infrastructure, Inc. — Class A | | | 9,853 | | | | 120,896 | |
Oil States International, Inc.* | | | 17,038 | | | | 102,739 | |
Matrix Service Co.* | | | 7,809 | | | | 102,376 | |
Total Oil & Gas Services | | | | | | | 5,154,175 | |
| | | | | | | | | |
Oil & Gas - 8.8% |
Helmerich & Payne, Inc. | | | 9,141 | | | | 246,441 | |
Patterson-UTI Energy, Inc. | | | 27,361 | | | | 195,084 | |
Nabors Industries Ltd.*,1 | | | 1,437 | | | | 134,288 | |
Total Oil & Gas | | | | | | | 575,813 | |
| | | | | | | | | |
Transportation - 4.4% |
SEACOR Holdings, Inc.* | | | 3,983 | | | | 162,307 | |
Tidewater, Inc.* | | | 9,996 | | | | 125,250 | |
Total Transportation | | | | | | | 287,557 | |
| | | | | | | | | |
Machinery-Diversified - 4.1% |
Cactus, Inc. — Class A | | | 8,794 | | | | 269,273 | |
| | | | | | | | | |
Metal Fabricate & Hardware - 3.1% |
Tenaris S.A. ADR | | | 8,904 | | | | 202,032 | |
| | | | | | | | | |
Total Common Stocks | | | | |
(Cost $3,727,147) | | | | | | | 6,488,850 | |
| | | | | | | | | |
| | Face
Amount | | | | |
REPURCHASE AGREEMENTS††,2 - 0.8% |
J.P. Morgan Securities LLC
issued 03/31/21 at 0.01%
due 04/01/21 | | $ | 28,512 | | | | 28,512 | |
Barclays Capital, Inc.
issued 03/31/21 at 0.01%
due 04/01/21 | | | 12,963 | | | | 12,963 | |
BofA Securities, Inc.
issued 03/31/21 at 0.01%
due 04/01/21 | | | 11,831 | | | | 11,831 | |
Total Repurchase Agreements | | | | |
(Cost $53,306) | | | | | | | 53,306 | |
| | | | | | | | | |
| | | Shares | | | | | |
SECURITIES LENDING COLLATERAL†,3 - 1.5% |
Money Market Fund | | | | | | | | |
First American Government Obligations Fund — Class Z, 0.03%4 | | | 101,115 | | | | 101,115 | |
Total Securities Lending Collateral | | | | |
(Cost $101,115) | | | | | | | 101,115 | |
| | | | | | | | | |
Total Investments - 101.5% | | | | |
(Cost $3,881,568) | | $ | 6,643,271 | |
Other Assets & Liabilities, net - (1.5)% | | | (96,105 | ) |
Total Net Assets - 100.0% | | $ | 6,547,166 | |
* | Non-income producing security. |
† | Value determined based on Level 1 inputs — See Note 4. |
†† | Value determined based on Level 2 inputs — See Note 4. |
1 | All or a portion of this security is on loan at March 31, 2021 — See Note 7. |
2 | Repurchase Agreements — See Note 6. |
3 | Securities lending collateral — See Note 7. |
4 | Rate indicated is the 7-day yield as of March 31, 2021. |
| | ADR — American Depositary Receipt |
| | plc — Public Limited Company |
| | |
| | See Sector Classification in Other Information section. |
60 | THE RYDEX FUNDS ANNUAL REPORT | SEE NOTES TO FINANCIAL STATEMENTS. |
SCHEDULE OF INVESTMENTS (concluded) | March 31, 2021 |
ENERGY SERVICES FUND | |
The following table summarizes the inputs used to value the Fund’s investments at March 31, 2021 (See Note 4 in the Notes to Financial Statements):
Investments in Securities (Assets) | | Level 1
Quoted
Prices | | | Level 2
Significant
Observable
Inputs | | | Level 3
Significant
Unobservable
Inputs | | | Total | |
Common Stocks | | $ | 6,488,850 | | | $ | — | | | $ | — | | | $ | 6,488,850 | |
Repurchase Agreements | | | — | | | | 53,306 | | | | — | | | | 53,306 | |
Securities Lending Collateral | | | 101,115 | | | | — | | | | — | | | | 101,115 | |
Total Assets | | $ | 6,589,965 | | | $ | 53,306 | | | $ | — | | | $ | 6,643,271 | |
SEE NOTES TO FINANCIAL STATEMENTS. | THE RYDEX FUNDS ANNUAL REPORT | 61 |
STATEMENT OF ASSETS AND LIABILITIES |
March 31, 2021 |
Assets: |
Investments, at value - including $99,992 of securities loaned (cost $3,828,262) | | $ | 6,589,965 | |
Repurchase agreements, at value (cost $53,306) | | | 53,306 | |
Receivables: |
Fund shares sold | | | 125,178 | |
Dividends | | | 3,798 | |
Total assets | | | 6,772,247 | |
| | | | | |
Liabilities: |
Payable for: |
Return of securities lending collateral | | | 101,115 | |
Fund shares redeemed | | | 96,918 | |
Management fees | | | 8,236 | |
Transfer agent and administrative fees | | | 2,606 | |
Distribution and service fees | | | 1,317 | |
Portfolio accounting fees | | | 969 | |
Trustees’ fees* | | | 196 | |
Miscellaneous | | | 13,724 | |
Total liabilities | | | 225,081 | |
Commitments and contingent liabilities (Note 10) | | | — | |
Net assets | | $ | 6,547,166 | |
| | | | | |
Net assets consist of: |
Paid in capital | | $ | 42,332,719 | |
Total distributable earnings (loss) | | | (35,785,553 | ) |
Net assets | | $ | 6,547,166 | |
| | | | | |
Investor Class: |
Net assets | | $ | 4,702,925 | |
Capital shares outstanding | | | 27,795 | |
Net asset value per share | | $ | 169.20 | |
| | | | | |
A-Class: |
Net assets | | $ | 676,267 | |
Capital shares outstanding | | | 4,294 | |
Net asset value per share | | $ | 157.49 | |
Maximum offering price per share (Net asset value divided by 95.25%) | | $ | 165.34 | |
| | | | | |
C-Class: |
Net assets | | $ | 478,840 | |
Capital shares outstanding | | | 3,486 | |
Net asset value per share | | $ | 137.36 | |
| | | | | |
H-Class: |
Net assets | | $ | 689,134 | |
Capital shares outstanding | | | 4,515 | |
Net asset value per share | | $ | 152.63 | |
STATEMENT OF OPERATIONS |
Year Ended March 31, 2021 |
Investment Income: |
Dividends (net of foreign withholding tax of $34) | | $ | 107,845 | |
Interest | | | 13 | |
Income from securities lending, net | | | 615 | |
Total investment income | | | 108,473 | |
| | | | | |
Expenses: |
Management fees | | | 42,011 | |
Distribution and service fees: |
A-Class | | | 1,216 | |
C-Class | | | 3,121 | |
H-Class | | | 2,512 | |
Transfer agent and administrative fees | | | 13,758 | |
Portfolio accounting fees | | | 4,943 | |
Professional fees | | | 2,003 | |
Trustees’ fees* | | | 861 | |
Custodian fees | | | 695 | |
Line of credit fees | | | 37 | |
Miscellaneous | | | 6,169 | |
Total expenses | | | 77,326 | |
Net investment income | | | 31,147 | |
| | | | | |
Net Realized and Unrealized Gain (Loss): |
Net realized gain (loss) on: |
Investments | | | (2,872,726 | ) |
Net realized loss | | | (2,872,726 | ) |
Net change in unrealized appreciation (depreciation) on: |
Investments | | | 4,839,953 | |
Net change in unrealized appreciation (depreciation) | | | 4,839,953 | |
Net realized and unrealized gain | | | 1,967,227 | |
Net increase in net assets resulting from operations | | $ | 1,998,374 | |
* | Relates to Trustees not deemed “interested persons” within the meaning of Section 2(a)(19) of the 1940 Act. |
62 | THE RYDEX FUNDS ANNUAL REPORT | SEE NOTES TO FINANCIAL STATEMENTS. |
STATEMENTS OF CHANGES IN NET ASSETS |
| | Year Ended
March 31,
2021 | | | Year Ended
March 31,
2020 | |
Increase (Decrease) in Net Assets from Operations: | | | | | | | | |
Net investment income | | $ | 31,147 | | | $ | 84,822 | |
Net realized loss on investments | | | (2,872,726 | ) | | | (4,960,531 | ) |
Net change in unrealized appreciation (depreciation) on investments | | | 4,839,953 | | | | (3,553,608 | ) |
Net increase (decrease) in net assets resulting from operations | | | 1,998,374 | | | | (8,429,317 | ) |
| | | | | | | | | |
Distributions to shareholders: | | | | | | | | |
Investor Class | | | (58,239 | ) | | | (5,823 | ) |
A-Class | | | (7,763 | ) | | | (749 | ) |
C-Class | | | (5,500 | ) | | | (806 | ) |
H-Class | | | (13,320 | ) | | | (856 | ) |
Total distributions to shareholders | | | (84,822 | ) | | | (8,234 | ) |
| | | | | | | | | |
Capital share transactions: | | | | | | | | |
Proceeds from sale of shares | | | | | | | | |
Investor Class | | | 30,897,142 | | | | 46,095,104 | |
A-Class | | | 1,084,574 | | | | 603,109 | |
C-Class | | | 749,587 | | | | 778,132 | |
H-Class | | | 11,467,298 | | | | 42,129,255 | |
Distributions reinvested | | | | | | | | |
Investor Class | | | 57,067 | | | | 5,544 | |
A-Class | | | 7,098 | | | | 737 | |
C-Class | | | 5,499 | | | | 805 | |
H-Class | | | 13,320 | | | | 848 | |
Cost of shares redeemed | | | | | | | | |
Investor Class | | | (29,134,887 | ) | | | (45,009,881 | ) |
A-Class | | | (973,357 | ) | | | (691,018 | ) |
C-Class | | | (682,420 | ) | | | (885,394 | ) |
H-Class | | | (11,270,764 | ) | | | (47,122,584 | ) |
Net increase (decrease) from capital share transactions | | | 2,220,157 | | | | (4,095,343 | ) |
Net increase (decrease) in net assets | | | 4,133,709 | | | | (12,532,894 | ) |
| | | | | | | | | |
Net assets: | | | | | | | | |
Beginning of year | | | 2,413,457 | | | | 14,946,351 | |
End of year | | $ | 6,547,166 | | | $ | 2,413,457 | |
Capital share activity:* | | | | | | | | |
Shares sold | | | | | | | | |
Investor Class | | | 241,060 | | | | 206,211 | |
A-Class | | | 9,335 | | | | 2,697 | |
C-Class | | | 7,226 | | | | 4,369 | |
H-Class | | | 82,664 | | | | 205,860 | |
Shares issued from reinvestment of distributions | | | | | | | | |
Investor Class | | | 388 | | | | 27 | |
A-Class | | | 52 | | | | 4 | |
C-Class | | | 46 | | | | 5 | |
H-Class | | | 100 | | | | 5 | |
Shares redeemed | | | | | | | | |
Investor Class | | | (233,553 | ) | | | (210,793 | ) |
A-Class | | | (7,803 | ) | | | (3,133 | ) |
C-Class | | | (6,885 | ) | | | (4,800 | ) |
H-Class | | | (85,965 | ) | | | (223,182 | ) |
Net increase (decrease) in shares | | | 6,665 | | | | (22,730 | ) |
* | Capital share activity for the year ended March 31, 2020 has been restated to reflect a 1:15 reverse share split effective August 10, 2020 — See Note 9. |
SEE NOTES TO FINANCIAL STATEMENTS. | THE RYDEX FUNDS ANNUAL REPORT | 63 |
This table is presented to show selected data for a share outstanding throughout each period and to assist shareholders in evaluating a Fund’s performance for the periods presented.
Investor Class | | Year Ended
March 31,
2021 | | | Year Ended
March 31,
2020c | | | Year Ended
March 31,
2019c | | | Year Ended
March 29,
2018c | | | Year Ended
March 31,
2017c | |
Per Share Data |
Net asset value, beginning of period | | $ | 75.50 | | | $ | 281.99 | | | $ | 378.02 | | | $ | 483.58 | | | $ | 426.14 | |
Income (loss) from investment operations: |
Net investment income (loss)a | | | .20 | | | | 2.40 | | | | .15 | | | | 8.85 | d | | | .15 | |
Net gain (loss) on investments (realized and unrealized) | | | 95.34 | | | | (208.59 | ) | | | (92.88 | ) | | | (110.66 | ) | | | 61.04 | |
Total from investment operations | | | 95.54 | | | | (206.19 | ) | | | (92.73 | ) | | | (101.81 | ) | | | 61.19 | |
Less distributions from: |
Net investment income | | | (1.84 | ) | | | (.30 | ) | | | (3.30 | ) | | | (3.75 | ) | | | (3.75 | ) |
Total distributions | | | (1.84 | ) | | | (.30 | ) | | | (3.30 | ) | | | (3.75 | ) | | | (3.75 | ) |
Net asset value, end of period | | $ | 169.20 | | | $ | 75.50 | | | $ | 281.99 | | | $ | 378.02 | | | $ | 483.58 | |
|
Total Return | | | 127.06 | % | | | (73.21 | %) | | | (24.43 | %) | | | (21.11 | %) | | | 14.38 | % |
Ratios/Supplemental Data |
Net assets, end of period (in thousands) | | $ | 4,703 | | | $ | 1,502 | | | $ | 6,896 | | | $ | 8,181 | | | $ | 11,757 | |
Ratios to average net assets: |
Net investment income (loss) | | | 0.82 | % | | | 1.11 | % | | | 0.06 | % | | | 2.19 | %e | | | 0.03 | % |
Total expenses | | | 1.42 | % | | | 1.48 | % | | | 1.46 | % | | | 1.38 | % | | | 1.38 | % |
Portfolio turnover rate | | | 770 | % | | | 810 | % | | | 1,453 | % | | | 1,824 | % | | | 1,830 | % |
A-Class | | Year Ended
March 31,
2021 | | | Year Ended
March 31,
2020c | | | Year Ended
March 31,
2019c | | | Year Ended
March 29,
2018c | | | Year Ended
March 31,
2017c | |
Per Share Data |
Net asset value, beginning of period | | $ | 70.51 | | | $ | 264.03 | | | $ | 355.19 | | | $ | 455.88 | | | $ | 402.86 | |
Income (loss) from investment operations: |
Net investment income (loss)a | | | .19 | | | | 1.95 | | | | 1.80 | | | | 9.00 | d | | | (2.10 | ) |
Net gain (loss) on investments (realized and unrealized) | | | 88.63 | | | | (195.17 | ) | | | (89.66 | ) | | | (105.94 | ) | | | 58.87 | |
Total from investment operations | | | 88.82 | | | | (193.22 | ) | | | (87.86 | ) | | | (96.94 | ) | | | 56.77 | |
Less distributions from: |
Net investment income | | | (1.84 | ) | | | (.30 | ) | | | (3.30 | ) | | | (3.75 | ) | | | (3.75 | ) |
Total distributions | | | (1.84 | ) | | | (.30 | ) | | | (3.30 | ) | | | (3.75 | ) | | | (3.75 | ) |
Net asset value, end of period | | $ | 157.49 | | | $ | 70.51 | | | $ | 264.03 | | | $ | 355.19 | | | $ | 455.88 | |
|
Total Returnb | | | 126.39 | % | | | (73.26 | %) | | | (24.65 | %) | | | (21.31 | %) | | | 14.09 | % |
Ratios/Supplemental Data |
Net assets, end of period (in thousands) | | $ | 676 | | | $ | 191 | | | $ | 829 | | | $ | 811 | | | $ | 1,295 | |
Ratios to average net assets: |
Net investment income (loss) | | | 0.87 | % | | | 0.94 | % | | | 0.60 | % | | | 2.37 | %e | | | (0.47 | %) |
Total expenses | | | 1.68 | % | | | 1.73 | % | | | 1.73 | % | | | 1.63 | % | | | 1.62 | % |
Portfolio turnover rate | | | 770 | % | | | 810 | % | | | 1,453 | % | | | 1,824 | % | | | 1,830 | % |
64 | THE RYDEX FUNDS ANNUAL REPORT | SEE NOTES TO FINANCIAL STATEMENTS. |
FINANCIAL HIGHLIGHTS (concluded) |
This table is presented to show selected data for a share outstanding throughout each period and to assist shareholders in evaluating a Fund’s performance for the periods presented.
C-Class | | Year Ended
March 31,
2021 | | | Year Ended
March 31,
2020c | | | Year Ended
March 31,
2019c | | | Year Ended
March 29,
2018c | | | Year Ended
March 31,
2017c | |
Per Share Data |
Net asset value, beginning of period | | $ | 62.08 | | | $ | 234.26 | | | $ | 317.99 | | | $ | 411.65 | | | $ | 366.84 | |
Income (loss) from investment operations: |
Net investment income (loss)a | | | (.01 | ) | | | .30 | | | | (2.55 | ) | | | 5.70 | d | | | (4.95 | ) |
Net gain (loss) on investments (realized and unrealized) | | | 77.13 | | | | (172.18 | ) | | | (77.88 | ) | | | (95.61 | ) | | | 53.51 | |
Total from investment operations | | | 77.12 | | | | (171.88 | ) | | | (80.43 | ) | | | (89.91 | ) | | | 48.56 | |
Less distributions from: |
Net investment income | | | (1.84 | ) | | | (.30 | ) | | | (3.30 | ) | | | (3.75 | ) | | | (3.75 | ) |
Total distributions | | | (1.84 | ) | | | (.30 | ) | | | (3.30 | ) | | | (3.75 | ) | | | (3.75 | ) |
Net asset value, end of period | | $ | 137.36 | | | $ | 62.08 | | | $ | 234.26 | | | $ | 317.99 | | | $ | 411.65 | |
|
Total Returnb | | | 124.62 | % | | | (73.46 | %) | | | 25.17 | % | | | (21.89 | %) | | | 13.22 | % |
Ratios/Supplemental Data |
Net assets, end of period (in thousands) | | $ | 479 | | | $ | 192 | | | $ | 826 | | | $ | 1,836 | | | $ | 3,258 | |
Ratios to average net assets: |
Net investment income (loss) | | | (0.03 | %) | | | 0.20 | % | | | (0.84 | %) | | | 1.66 | %e | | | (1.23 | %) |
Total expenses | | | 2.43 | % | | | 2.48 | % | | | 2.45 | % | | | 2.38 | % | | | 2.37 | % |
Portfolio turnover rate | | | 770 | % | | | 810 | % | | | 1,453 | % | | | 1,824 | % | | | 1,830 | % |
H-Class | | Year Ended
March 31,
2021 | | | Year Ended
March 31,
2020c | | | Year Ended
March 31,
2019c | | | Year Ended
March 29,
2018c | | | Year Ended
March 31,
2017c | |
Per Share Data |
Net asset value, beginning of period | | $ | 68.37 | | | $ | 255.45 | | | $ | 343.95 | | | $ | 442.11 | | | $ | 391.01 | |
Income (loss) from investment operations: |
Net investment income (loss)a | | | .02 | | | | 1.65 | | | | .45 | | | | 2.85 | d | | | (1.20 | ) |
Net gain (loss) on investments (realized and unrealized) | | | 86.08 | | | | (188.43 | ) | | | (85.65 | ) | | | (97.26 | ) | | | 56.05 | |
Total from investment operations | | | 86.10 | | | | (186.78 | ) | | | (85.20 | ) | | | (94.41 | ) | | | 54.85 | |
Less distributions from: |
Net investment income | | | (1.84 | ) | | | (.30 | ) | | | (3.30 | ) | | | (3.75 | ) | | | (3.75 | ) |
Total distributions | | | (1.84 | ) | | | (.30 | ) | | | (3.30 | ) | | | (3.75 | ) | | | (3.75 | ) |
Net asset value, end of period | | $ | 152.63 | | | $ | 68.37 | | | $ | 255.45 | | | $ | 343.95 | | | $ | 442.11 | |
|
Total Return | | | 126.23 | % | | | (73.19 | %) | | | (24.67 | %) | | | (21.40 | %) | | | 14.02 | % |
Ratios/Supplemental Data |
Net assets, end of period (in thousands) | | $ | 689 | | | $ | 528 | | | $ | 6,395 | | | $ | 15,754 | | | $ | 4,193 | |
Ratios to average net assets: |
Net investment income (loss) | | | 0.11 | % | | | 0.77 | % | | | 0.15 | % | | | 0.76 | %e | | | (0.29 | %) |
Total expenses | | | 1.68 | % | | | 1.72 | % | | | 1.70 | % | | | 1.63 | % | | | 1.62 | % |
Portfolio turnover rate | | | 770 | % | | | 810 | % | | | 1,453 | % | | | 1,824 | % | | | 1,830 | % |
a | Net investment income (loss) per share was computed using average shares outstanding throughout the period. |
b | Total return does not reflect the impact of any applicable sales charges. |
c | Reverse share split — Per share amounts for the years presented through March 31, 2020 have been restated to reflect a 1:15 reverse share split effective August 10, 2020 — See Note 9. |
d | Net investments income per share includes $0.54, $0.50, $0.45, and $0.50 for Investor Class, A-Class, C-Class, and H-Class, respectively resulting from a special dividend from Baker Hughes, a GE Co., LLC on July 05, 2017. |
e | Net investment income to average net assets includes 1.99% from Investor Class, A-Class, C-Class, and H-Class, resulting from a special dividend from Baker Hughes, a GE Co., LLC on July 05, 2017. |
SEE NOTES TO FINANCIAL STATEMENTS. | THE RYDEX FUNDS ANNUAL REPORT | 65 |
PERFORMANCE REPORT AND FUND PROFILE (Unaudited) | March 31, 2021 |
FINANCIAL SERVICES FUND
OBJECTIVE: Seeks to provide capital appreciation by investing in companies that are involved in the financial services sector (“Financial Services Companies”).
For the one-year period ended March 31, 2021, Financial Services Fund Investor Class returned 62.12%, compared with 67.50% for the S&P 500 Financials Index. The broader S&P 500 Index returned 56.35%.
Regional banks, asset management & custody banks, and diversified banks contributed the most to return. Life sciences tools & services was the only industry to detract from return.
JPMorgan Chase & Co., Morgan Stanley, and Bank of America Corp. contributed the most to the Fund’s return for the period. eHealth, Inc., Illumina, Inc., and RenaissanceRe Holdings Ltd. detracted the most from return.
Performance displayed represents past performance, which is no guarantee of future results.
Holdings Diversification (Market Exposure as % of Net Assets)
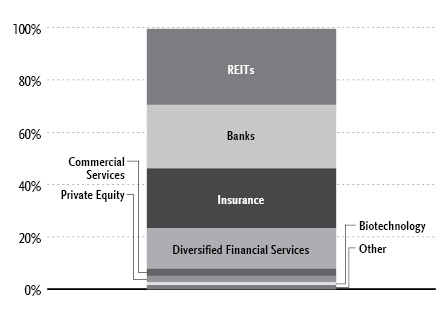
“Holdings Diversification (Market Exposure as % of Net Assets)” excludes any temporary cash investments.
Inception Dates: |
Investor Class | April 2, 1998 |
A-Class | September 1, 2004 |
C-Class | April 19, 2001 |
H-Class | April 6, 1998 |
Ten Largest Holdings (% of Total Net Assets) |
Berkshire Hathaway, Inc. — Class B | 3.1% |
JPMorgan Chase & Co. | 2.7% |
Bank of America Corp. | 2.3% |
Wells Fargo & Co. | 1.6% |
Citigroup, Inc. | 1.6% |
Morgan Stanley | 1.5% |
Charles Schwab Corp. | 1.4% |
BlackRock, Inc. — Class A | 1.4% |
American Tower Corp. — Class A | 1.4% |
American Express Co. | 1.4% |
Top Ten Total | 18.4% |
| | |
“Ten Largest Holdings” excludes any temporary cash investments. |
66 | THE RYDEX FUNDS ANNUAL REPORT | |
PERFORMANCE REPORT AND FUND PROFILE (Unaudited)(concluded) | March 31, 2021 |
Cumulative Fund Performance*
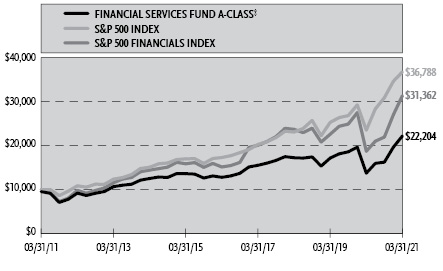
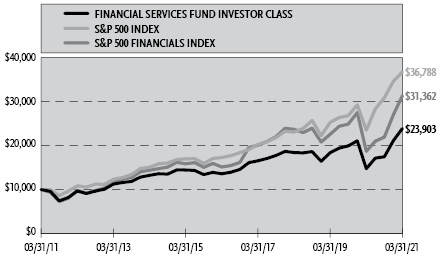
Average Annual Returns*
Periods Ended March 31, 2021
| 1 Year | 5 Year | 10 Year |
Investor Class Shares | 62.12% | 11.95% | 9.11% |
A-Class Shares | 61.74% | 11.67% | 8.83% |
A-Class Shares with sales charge‡ | 54.06% | 10.59% | 8.30% |
C-Class Shares | 60.51% | 10.84% | 8.03% |
C-Class Shares with CDSC§ | 59.51% | 10.84% | 8.03% |
H-Class Shares** | 61.72% | 11.67% | 8.72% |
S&P 500 Financials Index | 67.50% | 15.67% | 12.11% |
S&P 500 Index | 56.35% | 16.29% | 13.91% |
* | The performance data above represents past performance that is not predictive of future results. The investment return and principal value of an investment in the Fund will fluctuate so that an investor’s shares, when redeemed, may be worth more or less than their original cost. Returns are historical and include changes in principal and reinvested dividends and capital gains and do not reflect the effect of taxes. The S&P 500 Index and S&P 500 Financials Index are unmanaged indices and, unlike the Fund, have no management fees or operating expenses to reduce their reported returns. The graphs are based on Investor Class shares and A-Class shares only; performance for C-Class and H-Class shares will vary due to differences in fee structures. |
** | Effective September 30, 2015, the Fund’s Advisor Class shares were converted into H-Class shares. |
‡ | Fund returns are calculated using the maximum sales charge of 4.75%. |
§ | Fund returns include a CDSC of 1% if redeemed within 12 months of purchase. |
| | THE RYDEX FUNDS ANNUAL REPORT | 67 |
SCHEDULE OF INVESTMENTS | March 31, 2021 |
FINANCIAL SERVICES FUND | |
| | Shares | | | Value | |
COMMON STOCKS† - 99.5% |
| | | | | | | | | |
REITs - 29.0% |
American Tower Corp. — Class A | | | 2,258 | | | $ | 539,797 | |
Prologis, Inc. | | | 4,296 | | | | 455,376 | |
Crown Castle International Corp. | | | 2,586 | | | | 445,128 | |
Equinix, Inc. | | | 585 | | | | 397,560 | |
Public Storage | | | 1,361 | | | | 335,840 | |
Digital Realty Trust, Inc. | | | 2,351 | | | | 331,115 | |
Simon Property Group, Inc. | | | 2,681 | | | | 305,017 | |
SBA Communications Corp. | | | 1,026 | | | | 284,766 | |
Welltower, Inc. | | | 3,851 | | | | 275,847 | |
Weyerhaeuser Co. | | | 7,451 | | | | 265,256 | |
Equity Residential | | | 3,604 | | | | 258,155 | |
AvalonBay Communities, Inc. | | | 1,373 | | | | 253,332 | |
Realty Income Corp. | | | 3,886 | | | | 246,761 | |
Alexandria Real Estate Equities, Inc. | | | 1,438 | | | | 236,263 | |
Ventas, Inc. | | | 4,175 | | | | 222,695 | |
Invitation Homes, Inc. | | | 6,832 | | | | 218,556 | |
VICI Properties, Inc. | | | 7,607 | | | | 214,822 | |
Extra Space Storage, Inc. | | | 1,599 | | | | 211,947 | |
Healthpeak Properties, Inc. | | | 6,547 | | | | 207,802 | |
Sun Communities, Inc. | | | 1,381 | | | | 207,205 | |
Essex Property Trust, Inc. | | | 761 | | | | 206,870 | |
Duke Realty Corp. | | | 4,788 | | | | 200,761 | |
Boston Properties, Inc. | | | 1,938 | | | | 196,242 | |
UDR, Inc. | | | 4,112 | | | | 180,352 | |
WP Carey, Inc. | | | 2,545 | | | | 180,084 | |
Medical Properties Trust, Inc. | | | 8,341 | | | | 177,496 | |
Equity LifeStyle Properties, Inc. | | | 2,693 | | | | 171,383 | |
Host Hotels & Resorts, Inc.* | | | 10,010 | | | | 168,668 | |
American Homes 4 Rent — Class A | | | 5,003 | | | | 166,800 | |
Camden Property Trust | | | 1,499 | | | | 164,755 | |
Americold Realty Trust | | | 4,123 | | | | 158,612 | |
Gaming and Leisure Properties, Inc. | | | 3,732 | | | | 158,349 | |
Regency Centers Corp. | | | 2,750 | | | | 155,953 | |
Lamar Advertising Co. — Class A | | | 1,629 | | | | 152,996 | |
AGNC Investment Corp. | | | 9,070 | | | | 152,013 | |
STORE Capital Corp. | | | 4,515 | | | | 151,253 | |
VEREIT, Inc. | | | 3,877 | | | | 149,730 | |
CyrusOne, Inc. | | | 2,160 | | | | 146,275 | |
Omega Healthcare Investors, Inc. | | | 3,988 | | | | 146,080 | |
Vornado Realty Trust | | | 3,183 | | | | 144,476 | |
National Retail Properties, Inc. | | | 3,204 | | | | 141,200 | |
Federal Realty Investment Trust | | | 1,381 | | | | 140,102 | |
CubeSmart | | | 3,658 | | | | 138,382 | |
Kilroy Realty Corp. | | | 2,086 | | | | 136,904 | |
Rexford Industrial Realty, Inc. | | | 2,574 | | | | 129,730 | |
Life Storage, Inc. | | | 1,485 | | | | 127,636 | |
CoreSite Realty Corp. | | | 1,040 | | | | 124,644 | |
American Campus Communities, Inc. | | | 2,850 | | | | 123,035 | |
First Industrial Realty Trust, Inc. | | | 2,684 | | | | 122,900 | |
Healthcare Trust of America, Inc. — Class A | | | 4,447 | | | | 122,648 | |
Brixmor Property Group, Inc. | | | 6,043 | | | | 122,250 | |
EastGroup Properties, Inc. | | | 840 | | | | 120,355 | |
Douglas Emmett, Inc. | | | 3,624 | | | | 113,794 | |
SL Green Realty Corp. | | | 1,547 | | | | 108,275 | |
Agree Realty Corp. | | | 1,543 | | | | 103,859 | |
Healthcare Realty Trust, Inc. | | | 3,415 | | | | 103,543 | |
QTS Realty Trust, Inc. — Class A | | | 1,640 | | | | 101,746 | |
Hudson Pacific Properties, Inc. | | | 3,706 | | | | 100,544 | |
Total REITs | | | | | | | 11,423,935 | |
| | | | | | | | | |
Banks - 24.3% |
JPMorgan Chase & Co. | | | 7,027 | | | | 1,069,720 | |
Bank of America Corp. | | | 23,768 | | | | 919,584 | |
Wells Fargo & Co. | | | 16,075 | | | | 628,050 | |
Citigroup, Inc. | | | 8,488 | | | | 617,502 | |
Morgan Stanley | | | 7,554 | | | | 586,644 | |
Goldman Sachs Group, Inc. | | | 1,621 | | | | 530,067 | |
U.S. Bancorp | | | 8,247 | | | | 456,142 | |
Truist Financial Corp. | | | 7,599 | | | | 443,174 | |
PNC Financial Services Group, Inc. | | | 2,455 | | | | 430,632 | |
Bank of New York Mellon Corp. | | | 6,919 | | | | 327,199 | |
State Street Corp. | | | 3,233 | | | | 271,604 | |
First Republic Bank | | | 1,621 | | | | 270,302 | |
Fifth Third Bancorp | | | 6,819 | | | | 255,371 | |
SVB Financial Group* | | | 486 | | | | 239,919 | |
Northern Trust Corp. | | | 2,255 | | | | 237,023 | |
M&T Bank Corp. | | | 1,458 | | | | 221,047 | |
Regions Financial Corp. | | | 10,685 | | | | 220,752 | |
KeyCorp | | | 10,916 | | | | 218,102 | |
Citizens Financial Group, Inc. | | | 4,890 | | | | 215,893 | |
ICICI Bank Ltd. ADR* | | | 12,565 | | | | 201,417 | |
Huntington Bancshares, Inc. | | | 12,623 | | | | 198,434 | |
HDFC Bank Ltd. ADR* | | | 2,501 | | | | 194,303 | |
Signature Bank | | | 793 | | | | 179,297 | |
Toronto-Dominion Bank | | | 2,692 | | | | 175,545 | |
HSBC Holdings plc ADR | | | 5,712 | | | | 166,448 | |
First Horizon Corp. | | | 8,968 | | | | 151,649 | |
Zions Bancorp North America | | | 2,708 | | | | 148,832 | |
Total Banks | | | | | | | 9,574,652 | |
| | | | | | | | | |
Insurance - 22.9% |
Berkshire Hathaway, Inc. — Class B* | | | 4,825 | | | | 1,232,643 | |
Marsh & McLennan Companies, Inc. | | | 3,295 | | | | 401,331 | |
Willis Towers Watson plc | | | 1,707 | | | | 390,698 | |
Progressive Corp. | | | 4,072 | | | | 389,324 | |
Aon plc — Class A | | | 1,603 | | | | 368,866 | |
MetLife, Inc. | | | 6,039 | | | | 367,111 | |
Chubb Ltd. | | | 2,263 | | | | 357,486 | |
American International Group, Inc. | | | 6,791 | | | | 313,812 | |
Travelers Companies, Inc. | | | 2,018 | | | | 303,507 | |
Prudential Financial, Inc. | | | 3,292 | | | | 299,901 | |
Aflac, Inc. | | | 5,824 | | | | 298,072 | |
Allstate Corp. | | | 2,573 | | | | 295,638 | |
Arthur J Gallagher & Co. | | | 1,973 | | | | 246,171 | |
Hartford Financial Services Group, Inc. | | | 3,655 | | | | 244,118 | |
Arch Capital Group Ltd.* | | | 5,517 | | | | 211,687 | |
Principal Financial Group, Inc. | | | 3,385 | | | | 202,965 | |
Cincinnati Financial Corp. | | | 1,944 | | | | 200,407 | |
Everest Re Group Ltd. | | | 800 | | | | 198,248 | |
Markel Corp.* | | | 170 | | | | 193,735 | |
68 | THE RYDEX FUNDS ANNUAL REPORT | SEE NOTES TO FINANCIAL STATEMENTS. |
SCHEDULE OF INVESTMENTS (continued) | March 31, 2021 |
FINANCIAL SERVICES FUND | |
| | Shares | | | Value | |
Equitable Holdings, Inc. | | | 5,848 | | | $ | 190,762 | |
Athene Holding Ltd. — Class A* | | | 3,731 | | | | 188,042 | |
Loews Corp. | | | 3,592 | | | | 184,198 | |
Brown & Brown, Inc. | | | 3,964 | | | | 181,194 | |
RenaissanceRe Holdings Ltd. | | | 1,120 | | | | 179,480 | |
Fidelity National Financial, Inc. | | | 4,262 | | | | 173,293 | |
Lincoln National Corp. | | | 2,743 | | | | 170,807 | |
Globe Life, Inc. | | | 1,720 | | | | 166,204 | |
American Financial Group, Inc. | | | 1,363 | | | | 155,518 | |
Reinsurance Group of America, Inc. — Class A | | | 1,173 | | | | 147,857 | |
Assurant, Inc. | | | 1,021 | | | | 144,747 | |
Voya Financial, Inc. | | | 2,219 | | | | 141,217 | |
First American Financial Corp. | | | 2,284 | | | | 129,389 | |
Unum Group | | | 4,271 | | | | 118,862 | |
Lemonade, Inc.*,1 | | | 1,275 | | | | 118,741 | |
MGIC Investment Corp. | | | 8,105 | | | | 112,254 | |
Total Insurance | | | | | | | 9,018,285 | |
| | | | | | | | | |
Diversified Financial Services - 15.5% |
Charles Schwab Corp. | | | 8,533 | | | | 556,181 | |
BlackRock, Inc. — Class A | | | 726 | | | | 547,375 | |
American Express Co. | | | 3,797 | | | | 537,048 | |
CME Group, Inc. — Class A | | | 2,113 | | | | 431,538 | |
Intercontinental Exchange, Inc. | | | 3,581 | | | | 399,926 | |
Capital One Financial Corp. | | | 3,021 | | | | 384,362 | |
Rocket Companies, Inc. — Class A1 | | | 14,813 | | | | 342,032 | |
T. Rowe Price Group, Inc. | | | 1,838 | | | | 315,401 | |
Discover Financial Services | | | 2,861 | | | | 271,766 | |
Nasdaq, Inc. | | | 1,704 | | | | 251,272 | |
Synchrony Financial | | | 6,009 | | | | 244,326 | |
Ameriprise Financial, Inc. | | | 1,027 | | | | 238,726 | |
Apollo Global Management, Inc. | | | 4,849 | | | | 227,951 | |
Tradeweb Markets, Inc. — Class A | | | 2,842 | | | | 210,308 | |
Ally Financial, Inc. | | | 4,592 | | | | 207,604 | |
Franklin Resources, Inc. | | | 6,616 | | | | 195,834 | |
Invesco Ltd. | | | 6,827 | | | | 172,177 | |
LPL Financial Holdings, Inc. | | | 1,192 | | | | 169,455 | |
Cboe Global Markets, Inc. | | | 1,630 | | | | 160,865 | |
SLM Corp. | | | 7,387 | | | | 132,744 | |
Credit Acceptance Corp.*,1 | | | 337 | | | | 121,397 | |
Total Diversified Financial Services | | | | | | | 6,118,288 | |
| | | | | | | | | |
Commercial Services - 2.7% |
S&P Global, Inc. | | | 1,334 | | | | 470,729 | |
Moody’s Corp. | | | 1,291 | | | | 385,505 | |
MarketAxess Holdings, Inc. | | | 436 | | | | 217,093 | |
Total Commercial Services | | | | | | | 1,073,327 | |
| | | | | | | | | |
Private Equity - 2.5% |
Blackstone Group, Inc. — Class A | | | 6,479 | | | | 482,880 | |
KKR & Company, Inc. — Class A | | | 6,805 | | | | 332,424 | |
Brookfield Asset Management, Inc. — Class A | | | 4,143 | | | | 184,364 | |
Total Private Equity | | | | | | | 999,668 | |
| | | | | | | | | |
Biotechnology - 1.0% |
Illumina, Inc.* | | | 950 | | | | 364,857 | |
| | | | | | | | | |
Software - 0.8% |
MSCI, Inc. — Class A | | | 721 | | | | 302,301 | |
| | | | | | | | | |
Media - 0.4% |
FactSet Research Systems, Inc. | | | 556 | | | | 171,576 | |
| | | | | | | | | |
Savings & Loans - 0.4% |
People’s United Financial, Inc. | | | 7,753 | | | | 138,779 | |
| | | | | | | | | |
Total Common Stocks | | | | |
(Cost $32,047,775) | | | | | | | 39,185,668 | |
| | | | | | | | | |
| | | Face
Amount | | | | | |
REPURCHASE AGREEMENTS††,2 - 1.0% |
J.P. Morgan Securities LLC
issued 03/31/21 at 0.01%
due 04/01/21 | | $ | 204,704 | | | | 204,704 | |
Barclays Capital, Inc.
issued 03/31/21 at 0.01%
due 04/01/21 | | | 93,068 | | | | 93,068 | |
BofA Securities, Inc.
issued 03/31/21 at 0.01%
due 04/01/21 | | | 84,940 | | | | 84,940 | |
Total Repurchase Agreements | | | | |
(Cost $382,712) | | | | | | | 382,712 | |
| | | | | | | | | |
| | | Shares | | | | | |
SECURITIES LENDING COLLATERAL†,3 - 1.1% |
Money Market Fund | | | | | | | | |
First American Government Obligations Fund — Class Z, 0.03%4 | | | 442,611 | | | | 442,611 | |
Total Securities Lending Collateral | | | | |
(Cost $442,611) | | | | | | | 442,611 | |
| | | | | | | | | |
Total Investments - 101.6% | | | | |
(Cost $32,873,098) | | $ | 40,010,991 | |
Other Assets & Liabilities, net - (1.6)% | | | (617,422 | ) |
Total Net Assets - 100.0% | | $ | 39,393,569 | |
SEE NOTES TO FINANCIAL STATEMENTS. | THE RYDEX FUNDS ANNUAL REPORT | 69 |
SCHEDULE OF INVESTMENTS (concluded) | March 31, 2021 |
FINANCIAL SERVICES FUND | |
* | Non-income producing security. |
† | Value determined based on Level 1 inputs — See Note 4. |
†† | Value determined based on Level 2 inputs — See Note 4. |
1 | All or a portion of this security is on loan at March 31, 2021 — See Note 7. |
2 | Repurchase Agreements — See Note 6. |
3 | Securities lending collateral — See Note 7. |
4 | Rate indicated is the 7-day yield as of March 31, 2021. |
| | ADR — American Depositary Receipt |
| | plc — Public Limited Company |
| | REIT — Real Estate Investment Trust |
| | |
| | See Sector Classification in Other Information section. |
The following table summarizes the inputs used to value the Fund’s investments at March 31, 2021 (See Note 4 in the Notes to Financial Statements):
Investments in Securities (Assets) | | Level 1
Quoted
Prices | | | Level 2
Significant
Observable
Inputs | | | Level 3
Significant
Unobservable
Inputs | | | Total | |
Common Stocks | | $ | 39,185,668 | | | $ | — | | | $ | — | | | $ | 39,185,668 | |
Repurchase Agreements | | | — | | | | 382,712 | | | | — | | | | 382,712 | |
Securities Lending Collateral | | | 442,611 | | | | — | | | | — | | | | 442,611 | |
Total Assets | | $ | 39,628,279 | | | $ | 382,712 | | | $ | — | | | $ | 40,010,991 | |
70 | THE RYDEX FUNDS ANNUAL REPORT | SEE NOTES TO FINANCIAL STATEMENTS. |
STATEMENT OF ASSETS AND LIABILITIES |
March 31, 2021 |
Assets: |
Investments, at value - including $430,876 of securities loaned (cost $32,490,386) | | $ | 39,628,279 | |
Repurchase agreements, at value (cost $382,712) | | | 382,712 | |
Cash | | | 1,664 | |
Receivables: |
Fund shares sold | | | 209,418 | |
Dividends | | | 65,878 | |
Foreign tax reclaims | | | 299 | |
Securities lending income | | | 48 | |
Total assets | | | 40,288,298 | |
| | | | | |
Liabilities: |
Payable for: |
Return of securities lending collateral | | | 442,611 | |
Securities purchased | | | 360,173 | |
Fund shares redeemed | | | 27,175 | |
Management fees | | | 22,127 | |
Transfer agent and administrative fees | | | 7,002 | |
Portfolio accounting fees | | | 2,603 | |
Distribution and service fees | | | 1,703 | |
Trustees’ fees* | | | 441 | |
Miscellaneous | | | 30,894 | |
Total liabilities | | | 894,729 | |
Commitments and contingent liabilities (Note 10) | | | — | |
Net assets | | $ | 39,393,569 | |
| | | | | |
Net assets consist of: |
Paid in capital | | $ | 33,617,543 | |
Total distributable earnings (loss) | | | 5,776,026 | |
Net assets | | $ | 39,393,569 | |
| | | | | |
Investor Class: |
Net assets | | $ | 32,328,127 | |
Capital shares outstanding | | | 363,880 | |
Net asset value per share | | $ | 88.84 | |
| | | | | |
A-Class: |
Net assets | | $ | 2,779,813 | |
Capital shares outstanding | | | 33,635 | |
Net asset value per share | | $ | 82.65 | |
Maximum offering price per share (Net asset value divided by 95.25%) | | $ | 86.77 | |
| | | | | |
C-Class: |
Net assets | | $ | 1,035,623 | |
Capital shares outstanding | | | 14,471 | |
Net asset value per share | | $ | 71.57 | |
| | | | | |
H-Class: |
Net assets | | $ | 3,250,006 | |
Capital shares outstanding | | | 40,574 | |
Net asset value per share | | $ | 80.10 | |
STATEMENT OF OPERATIONS |
Year Ended March 31, 2021 |
Investment Income: |
Dividends (net of foreign withholding tax of $841) | | $ | 437,416 | |
Interest | | | 70 | |
Income from securities lending, net | | | 550 | |
Total investment income | | | 438,036 | |
| | | | | |
Expenses: |
Management fees | | | 144,253 | |
Distribution and service fees: |
A-Class | | | 17,396 | |
C-Class | | | 6,520 | |
H-Class | | | 1,219 | |
Transfer agent and administrative fees | | | 47,427 | |
Portfolio accounting fees | | | 16,974 | |
Professional fees | | | 5,943 | |
Trustees’ fees* | | | 3,307 | |
Custodian fees | | | 2,609 | |
Line of credit fees | | | 24 | |
Miscellaneous | | | 22,425 | |
Total expenses | | | 268,097 | |
Net investment income | | | 169,939 | |
| | | | | |
Net Realized and Unrealized Gain (Loss): |
Net realized gain (loss) on: |
Investments | | | 19,848 | |
Net realized gain | | | 19,848 | |
Net change in unrealized appreciation (depreciation) on: |
Investments | | | 6,560,465 | |
Net change in unrealized appreciation (depreciation) | | | 6,560,465 | |
Net realized and unrealized gain | | | 6,580,313 | |
Net increase in net assets resulting from operations | | $ | 6,750,252 | |
* | Relates to Trustees not deemed “interested persons” within the meaning of Section 2(a)(19) of the 1940 Act. |
SEE NOTES TO FINANCIAL STATEMENTS. | THE RYDEX FUNDS ANNUAL REPORT | 71 |
STATEMENTS OF CHANGES IN NET ASSETS |
| | Year Ended
March 31,
2021 | | | Year Ended
March 31,
2020 | |
Increase (Decrease) in Net Assets from Operations: | | | | | | | | |
Net investment income | | $ | 169,939 | | | $ | 224,910 | |
Net realized gain (loss) on investments | | | 19,848 | | | | 967,033 | |
Net change in unrealized appreciation (depreciation) on investments | | | 6,560,465 | | | | (3,396,384 | ) |
Net increase (decrease) in net assets resulting from operations | | | 6,750,252 | | | | (2,204,441 | ) |
| | | | | | | | | |
Distributions to shareholders: | | | | | | | | |
Investor Class | | | — | | | | (64,630 | ) |
A-Class | | | — | | | | (36,597 | ) |
C-Class | | | — | | | | (5,315 | ) |
H-Class | | | — | | | | (8,748 | ) |
Total distributions to shareholders | | | — | | | | (115,290 | ) |
| | | | | | | | | |
Capital share transactions: | | | | | | | | |
Proceeds from sale of shares | | | | | | | | |
Investor Class | | | 62,886,989 | | | | 49,827,414 | |
A-Class | | | 1,669,156 | | | | 4,186,426 | |
C-Class | | | 1,791,284 | | | | 1,741,582 | |
H-Class | | | 3,147,059 | | | | 18,267,949 | |
Distributions reinvested | | | | | | | | |
Investor Class | | | — | | | | 63,368 | |
A-Class | | | — | | | | 36,296 | |
C-Class | | | — | | | | 5,268 | |
H-Class | | | — | | | | 8,748 | |
Cost of shares redeemed | | | | | | | | |
Investor Class | | | (36,775,287 | ) | | | (51,288,443 | ) |
A-Class | | | (7,580,564 | ) | | | (4,716,834 | ) |
C-Class | | | (1,699,737 | ) | | | (1,914,065 | ) |
H-Class | | | (757,798 | ) | | | (19,106,628 | ) |
Net increase (decrease) from capital share transactions | | | 22,681,102 | | | | (2,888,919 | ) |
Net increase (decrease) in net assets | | | 29,431,354 | | | | (5,208,650 | ) |
| | | | | | | | | |
Net assets: | | | | | | | | |
Beginning of year | | | 9,962,215 | | | | 15,170,865 | |
End of year | | $ | 39,393,569 | | | $ | 9,962,215 | |
| | | | | | | | | |
Capital share activity: | | | | | | | | |
Shares sold | | | | | | | | |
Investor Class | | | 841,230 | | | | 673,773 | |
A-Class | | | 27,662 | | | | 61,997 | |
C-Class | | | 30,564 | | | | 28,914 | |
H-Class | | | 40,856 | | | | 274,440 | |
Shares issued from reinvestment of distributions | | | | | | | | |
Investor Class | | | — | | | | 821 | |
A-Class | | | — | | | | 504 | |
C-Class | | | — | | | | 84 | |
H-Class | | | — | | | | 125 | |
Shares redeemed | | | | | | | | |
Investor Class | | | (531,516 | ) | | | (692,918 | ) |
A-Class | | | (106,444 | ) | | | (68,450 | ) |
C-Class | | | (30,403 | ) | | | (32,121 | ) |
H-Class | | | (12,616 | ) | | | (288,019 | ) |
Net increase (decrease) in shares | | | 259,333 | | | | (40,850 | ) |
72 | THE RYDEX FUNDS ANNUAL REPORT | SEE NOTES TO FINANCIAL STATEMENTS. |
This table is presented to show selected data for a share outstanding throughout each period and to assist shareholders in evaluating a Fund’s performance for the periods presented.
Investor Class | | Year Ended
March 31,
2021 | | | Year Ended
March 31,
2020 | | | Year Ended
March 31,
2019 | | | Year Ended
March 29,
2018 | | | Year Ended
March 31,
2017c | |
Per Share Data |
Net asset value, beginning of period | | $ | 54.80 | | | $ | 68.68 | | | $ | 72.17 | | | $ | 65.14 | | | $ | 53.90 | |
Income (loss) from investment operations: |
Net investment income (loss)a | | | .88 | | | | .83 | | | | .53 | | | | .61 | | | | .55 | |
Net gain (loss) on investments (realized and unrealized) | | | 33.16 | | | | (14.39 | ) | | | (.86 | )e | | | 6.79 | | | | 11.14 | |
Total from investment operations | | | 34.04 | | | | (13.56 | ) | | | (.33 | ) | | | 7.40 | | | | 11.69 | |
Less distributions from: |
Net investment income | | | — | | | | (.32 | ) | | | (.89 | ) | | | (.37 | ) | | | (.45 | ) |
Net realized gains | | | — | | | | — | | | | (2.27 | ) | | | — | | | | — | |
Total distributions | | | — | | | | (.32 | ) | | | (3.16 | ) | | | (.37 | ) | | | (.45 | ) |
Net asset value, end of period | | $ | 88.84 | | | $ | 54.80 | | | $ | 68.68 | | | $ | 72.17 | | | $ | 65.14 | |
|
Total Return | | | 62.12 | % | | | (19.88 | %) | | | (0.14 | %) | | | 11.37 | % | | | 21.72 | % |
Ratios/Supplemental Data |
Net assets, end of period (in thousands) | | $ | 32,328 | | | $ | 2,968 | | | $ | 4,978 | | | $ | 25,183 | | | $ | 39,214 | |
Ratios to average net assets: |
Net investment income (loss) | | | 1.19 | % | | | 1.12 | % | | | 0.74 | % | | | 0.89 | % | | | 0.90 | % |
Total expenses | | | 1.41 | % | | | 1.48 | % | | | 1.45 | % | | | 1.38 | % | | | 1.38 | % |
Portfolio turnover rate | | | 246 | % | | | 249 | % | | | 410 | % | | | 347 | % | | | 389 | % |
A-Class | | Year Ended
March 31,
2021 | | | Year Ended
March 31,
2020 | | | Year Ended
March 31,
2019 | | | Year Ended
March 29,
2018 | | | Year Ended
March 31,
2017c | |
Per Share Data |
Net asset value, beginning of period | | $ | 51.10 | | | $ | 64.22 | | | $ | 67.88 | | | $ | 61.44 | | | $ | 51.00 | |
Income (loss) from investment operations: |
Net investment income (loss)a | | | .55 | | | | .54 | | | | .37 | | | | .53 | | | | .41 | |
Net gain (loss) on investments (realized and unrealized) | | | 31.00 | | | | (13.34 | ) | | | (.87 | )e | | | 6.28 | | | | 10.48 | |
Total from investment operations | | | 31.55 | | | | (12.80 | ) | | | (.50 | ) | | | 6.81 | | | | 10.89 | |
Less distributions from: |
Net investment income | | | — | | | | (.32 | ) | | | (.89 | ) | | | (.37 | ) | | | (.45 | ) |
Net realized gains | | | — | | | | — | | | | (2.27 | ) | | | — | | | | — | |
Total distributions | | | — | | | | (.32 | ) | | | (3.16 | ) | | | (.37 | ) | | | (.45 | ) |
Net asset value, end of period | | $ | 82.65 | | | $ | 51.10 | | | $ | 64.22 | | | $ | 67.88 | | | $ | 61.44 | |
|
Total Returnb | | | 61.74 | % | | | (20.07 | %) | | | (0.41 | %) | | | 11.08 | % | | | 21.42 | % |
Ratios/Supplemental Data |
Net assets, end of period (in thousands) | | $ | 2,780 | | | $ | 5,745 | | | $ | 7,602 | | | $ | 8,293 | | | $ | 1,834 | |
Ratios to average net assets: |
Net investment income (loss) | | | 0.86 | % | | | 0.78 | % | | | 0.55 | % | | | 0.81 | % | | | 0.73 | % |
Total expenses | | | 1.70 | % | | | 1.72 | % | | | 1.71 | % | | | 1.63 | % | | | 1.62 | % |
Portfolio turnover rate | | | 246 | % | | | 249 | % | | | 410 | % | | | 347 | % | | | 389 | % |
SEE NOTES TO FINANCIAL STATEMENTS. | THE RYDEX FUNDS ANNUAL REPORT | 73 |
FINANCIAL HIGHLIGHTS (continued) |
This table is presented to show selected data for a share outstanding throughout each period and to assist shareholders in evaluating a Fund’s performance for the periods presented.
C-Class | | Year Ended
March 31,
2021 | | | Year Ended
March 31,
2020 | | | Year Ended
March 31,
2019 | | | Year Ended
March 29,
2018 | | | Year Ended
March 31,
2017c | |
Per Share Data |
Net asset value, beginning of period | | $ | 44.59 | | | $ | 56.49 | | | $ | 60.56 | | | $ | 55.26 | | | $ | 46.24 | |
Income (loss) from investment operations: |
Net investment income (loss)a | | | (.03 | ) | | | .01 | | | | (.16 | ) | | | — | d | | | (.07 | ) |
Net gain (loss) on investments (realized and unrealized) | | | 27.01 | | | | (11.59 | ) | | | (.75 | )e | | | 5.67 | | | | 9.54 | |
Total from investment operations | | | 26.98 | | | | (11.58 | ) | | | (.91 | ) | | | 5.67 | | | | 9.47 | |
Less distributions from: |
Net investment income | | | — | | | | (.32 | ) | | | (.89 | ) | | | (.37 | ) | | | (.45 | ) |
Net realized gains | | | — | | | | — | | | | (2.27 | ) | | | — | | | | — | |
Total distributions | | | — | | | | (.32 | ) | | | (3.16 | ) | | | (.37 | ) | | | (.45 | ) |
Net asset value, end of period | | $ | 71.57 | | | $ | 44.59 | | | $ | 56.49 | | | $ | 60.56 | | | $ | 55.26 | |
|
Total Returnb | | | 60.51 | % | | | (20.66 | %) | | | (1.15 | %) | | | 10.27 | % | | | 20.51 | % |
Ratios/Supplemental Data |
Net assets, end of period (in thousands) | | $ | 1,036 | | | $ | 638 | | | $ | 985 | | | $ | 2,218 | | | $ | 2,270 | |
Ratios to average net assets: |
Net investment income (loss) | | | (0.06 | %) | | | 0.02 | % | | | (0.27 | %) | | | — | f | | | (0.13 | %) |
Total expenses | | | 2.43 | % | | | 2.47 | % | | | 2.46 | % | | | 2.38 | % | | | 2.37 | % |
Portfolio turnover rate | | | 246 | % | | | 249 | % | | | 410 | % | | | 347 | % | | | 389 | % |
74 | THE RYDEX FUNDS ANNUAL REPORT | SEE NOTES TO FINANCIAL STATEMENTS. |
FINANCIAL HIGHLIGHTS (concluded) |
This table is presented to show selected data for a share outstanding throughout each period and to assist shareholders in evaluating a Fund’s performance for the periods presented.
H-Class | | Year Ended
March 31,
2021 | | | Year Ended
March 31,
2020 | | | Year Ended
March 31,
2019 | | | Year Ended
March 29,
2018 | | | Year Ended
March 31,
2017c | |
Per Share Data |
Net asset value, beginning of period | | $ | 49.53 | | | $ | 62.26 | | | $ | 65.93 | | | $ | 59.67 | | | $ | 49.53 | |
Income (loss) from investment operations: |
Net investment income (loss)a | | | .68 | | | | .54 | | | | .03 | | | | .46 | | | | .33 | |
Net gain (loss) on investments (realized and unrealized) | | | 29.89 | | | | (12.95 | ) | | | (.54 | )e | | | 6.17 | | | | 10.26 | |
Total from investment operations | | | 30.57 | | | | (12.41 | ) | | | (.51 | ) | | | 6.63 | | | | 10.59 | |
Less distributions from: |
Net investment income | | | — | | | | (.32 | ) | | | (.89 | ) | | | (.37 | ) | | | (.45 | ) |
Net realized gains | | | — | | | | — | | | | (2.27 | ) | | | — | | | | — | |
Total distributions | | | — | | | | (.32 | ) | | | (3.16 | ) | | | (.37 | ) | | | (.45 | ) |
Net asset value, end of period | | $ | 80.10 | | | $ | 49.53 | | | $ | 62.26 | | | $ | 65.93 | | | $ | 59.67 | |
|
Total Return | | | 61.72 | % | | | (20.08 | %) | | | (0.42 | %) | | | 11.11 | % | | | 21.43 | % |
Ratios/Supplemental Data |
Net assets, end of period (in thousands) | | $ | 3,250 | | | $ | 611 | | | $ | 1,606 | | | $ | 3,014 | | | $ | 18,259 | |
Ratios to average net assets: |
Net investment income (loss) | | | 1.07 | % | | | 0.81 | % | | | 0.05 | % | | | 0.72 | % | | | 0.58 | % |
Total expenses | | | 1.69 | % | | | 1.72 | % | | | 1.73 | % | | | 1.63 | % | | | 1.63 | % |
Portfolio turnover rate | | | 246 | % | | | 249 | % | | | 410 | % | | | 347 | % | | | 389 | % |
a | Net investment income (loss) per share was computed using average shares outstanding throughout the period. |
b | Total return does not reflect the impact of any applicable sales charges. |
c | Share split — Per share amounts for the periods presented through March 31, 2017 have been restated to reflect a 2:1 share split effective October 31, 2016. |
d | Less than $0.01 per share. |
e | The amount shown for a share outstanding throughout the period does not agree with the aggregate net gain on investments for the year because of the sales and purchases of fund shares in relation to fluctuating market value of the investments of the Fund. |
f | Less than 0.01% or (0.01%). |
SEE NOTES TO FINANCIAL STATEMENTS. | THE RYDEX FUNDS ANNUAL REPORT | 75 |
PERFORMANCE REPORT AND FUND PROFILE (Unaudited) | March 31, 2021 |
HEALTH CARE FUND
OBJECTIVE: Seeks to provide capital appreciation by investing in companies that are involved in the health care industry (“Health Care Companies”).
For the one-year period ended March 31, 2021, Health Care Fund Investor Class returned 41.24%, compared with 34.04% for the S&P 500 Health Care Index. The broader S&P 500 Index returned 56.35%.
All industries contributed to return, led by health care equipment, biotechnology, and pharmaceuticals.
UnitedHealth Group, Inc., Immunomedics, Inc., and Thermo Fisher Scientific, Inc. contributed the most to the Fund’s return for the period. Biogen, Inc., Amarin Corp. plc ADR, and Quidel Corp. detracted the most from return.
Performance displayed represents past performance, which is no guarantee of future results.
Holdings Diversification (Market Exposure as % of Net Assets)
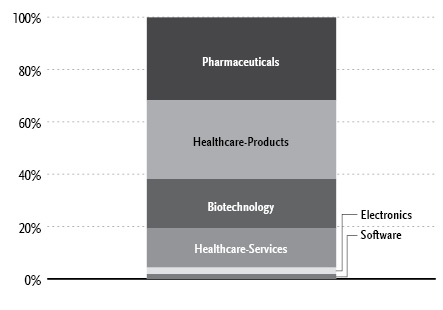
“Holdings Diversification (Market Exposure as % of Net Assets)” excludes any temporary cash investments.
Inception Dates: |
Investor Class | April 17, 1998 |
A-Class | September 1, 2004 |
C-Class | March 30, 2001 |
H-Class | May 11, 1998 |
Ten Largest Holdings (% of Total Net Assets) |
Johnson & Johnson | 3.3% |
UnitedHealth Group, Inc. | 3.0% |
Abbott Laboratories | 2.3% |
Pfizer, Inc. | 2.2% |
AbbVie, Inc. | 2.2% |
Merck & Company, Inc. | 2.2% |
Thermo Fisher Scientific, Inc. | 2.1% |
Eli Lilly & Co. | 2.1% |
Danaher Corp. | 2.0% |
Amgen, Inc. | 1.9% |
Top Ten Total | 23.3% |
| | |
“Ten Largest Holdings” excludes any temporary cash investments. |
76 | THE RYDEX FUNDS ANNUAL REPORT | |
PERFORMANCE REPORT AND FUND PROFILE (Unaudited)(concluded) | March 31, 2021 |
Cumulative Fund Performance*
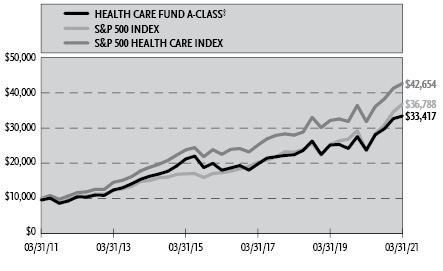
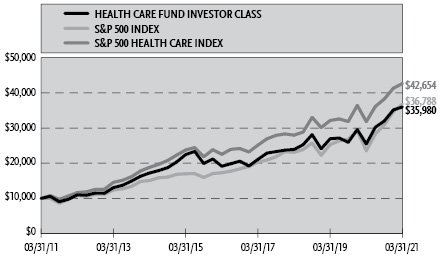
Average Annual Returns*
Periods Ended March 31, 2021
| 1 Year | 5 Year | 10 Year |
Investor Class Shares | 41.24% | 13.46% | 13.66% |
A-Class Shares | 40.87% | 13.16% | 13.37% |
A-Class Shares with sales charge‡ | 34.19% | 12.06% | 12.82% |
C-Class Shares | 39.82% | 12.33% | 12.53% |
C-Class Shares with CDSC§ | 38.82% | 12.33% | 12.53% |
H-Class Shares** | 40.93% | 13.17% | 13.27% |
S&P 500 Health Care Index | 34.04% | 13.61% | 15.61% |
S&P 500 Index | 56.35% | 16.29% | 13.91% |
* | The performance data above represents past performance that is not predictive of future results. The investment return and principal value of an investment in the Fund will fluctuate so that an investor’s shares, when redeemed, may be worth more or less than their original cost. Returns are historical and include changes in principal and reinvested dividends and capital gains and do not reflect the effect of taxes. The S&P 500 Index and the S&P 500 Health Care Index are unmanaged indices and, unlike the Fund, have no management fees or operating expenses to reduce their reported returns. The graphs are based on Investor Class shares and A-Class shares only; performance for C-Class and H-Class shares will vary due to differences in fee structures. |
** | Effective September 20, 215, the Fund’s Advisor Class shares were converted into H-Class shares. |
‡ | Fund returns are calculated using the maximum sales charge of 4.75%. |
§ | Fund returns include a CDSC of 1% if redeemed within 12 months of purchase. |
| | THE RYDEX FUNDS ANNUAL REPORT | 77 |
SCHEDULE OF INVESTMENTS | March 31, 2021 |
HEALTH CARE FUND | |
| | Shares | | | Value | |
COMMON STOCKS† - 99.9% |
| | | | | | | | | |
Pharmaceuticals - 31.7% |
Johnson & Johnson | | | 6,311 | | | $ | 1,037,213 | |
Pfizer, Inc. | | | 19,457 | | | | 704,927 | |
AbbVie, Inc. | | | 6,428 | | | | 695,638 | |
Merck & Company, Inc. | | | 8,913 | | | | 687,103 | |
Eli Lilly & Co. | | | 3,560 | | | | 665,079 | |
Bristol-Myers Squibb Co. | | | 9,339 | | | | 589,571 | |
CVS Health Corp. | | | 6,533 | | | | 491,478 | |
Cigna Corp. | | | 1,871 | | | | 452,296 | |
Canopy Growth Corp.* | | | 13,861 | | | | 443,968 | |
Zoetis, Inc. | | | 2,754 | | | | 433,700 | |
Becton Dickinson and Co. | | | 1,720 | | | | 418,218 | |
DexCom, Inc.* | | | 831 | | | | 298,653 | |
AstraZeneca plc ADR1 | | | 5,708 | | | | 283,802 | |
McKesson Corp. | | | 1,439 | | | | 280,663 | |
AmerisourceBergen Corp. — Class A | | | 2,075 | | | | 244,995 | |
Cardinal Health, Inc. | | | 3,890 | | | | 236,318 | |
Horizon Therapeutics plc* | | | 2,482 | | | | 228,443 | |
Viatris, Inc.* | | | 14,171 | | | | 197,969 | |
Novartis AG ADR | | | 2,288 | | | | 195,578 | |
Jazz Pharmaceuticals plc* | | | 1,185 | | | | 194,778 | |
GlaxoSmithKline plc ADR | | | 5,428 | | | | 193,725 | |
Teva Pharmaceutical Industries Ltd. ADR* | | | 15,690 | | | | 181,063 | |
Perrigo Company plc | | | 4,322 | | | | 174,911 | |
Elanco Animal Health, Inc.* | | | 5,833 | | | | 171,782 | |
Henry Schein, Inc.* | | | 2,260 | | | | 156,482 | |
Neurocrine Biosciences, Inc.* | | | 1,596 | | | | 155,211 | |
Sarepta Therapeutics, Inc.* | | | 1,525 | | | | 113,658 | |
Total Pharmaceuticals | | | | | | | 9,927,222 | |
| | | | | | | | | |
Healthcare-Products - 30.1% |
Abbott Laboratories | | | 6,036 | | | | 723,354 | |
Thermo Fisher Scientific, Inc. | | | 1,463 | | | | 667,684 | |
Danaher Corp. | | | 2,834 | | | | 637,877 | |
Medtronic plc | | | 4,841 | | | | 571,867 | |
Stryker Corp. | | | 1,992 | | | | 485,211 | |
Intuitive Surgical, Inc.* | | | 646 | | | | 477,355 | |
Boston Scientific Corp.* | | | 9,494 | | | | 366,943 | |
Edwards Lifesciences Corp.* | | | 4,387 | | | | 366,929 | |
Align Technology, Inc.* | | | 615 | | | | 333,041 | |
Baxter International, Inc. | | | 3,914 | | | | 330,107 | |
IDEXX Laboratories, Inc.* | | | 652 | | | | 319,030 | |
Zimmer Biomet Holdings, Inc. | | | 1,788 | | | | 286,223 | |
ResMed, Inc. | | | 1,380 | | | | 267,747 | |
West Pharmaceutical Services, Inc. | | | 819 | | | | 230,778 | |
10X Genomics, Inc. — Class A* | | | 1,247 | | | | 225,707 | |
Hologic, Inc.* | | | 2,973 | | | | 221,132 | |
Insulet Corp.* | | | 800 | | | | 208,736 | |
Avantor, Inc.* | | | 7,077 | | | | 204,737 | |
STERIS plc | | | 1,060 | | | | 201,909 | |
Varian Medical Systems, Inc.* | | | 1,124 | | | | 198,420 | |
Novocure Ltd.* | | | 1,476 | | | | 195,098 | |
ABIOMED, Inc.* | | | 612 | | | | 195,063 | |
PerkinElmer, Inc. | | | 1,466 | | | | 188,073 | |
Dentsply Sirona, Inc. | | | 2,902 | | | | 185,177 | |
Masimo Corp.* | | | 779 | | | | 178,905 | |
QIAGEN N.V.* | | | 3,498 | | | | 170,318 | |
Repligen Corp.* | | | 816 | | | | 158,638 | |
Penumbra, Inc.* | | | 562 | | | | 152,066 | |
Hill-Rom Holdings, Inc. | | | 1,216 | | | | 134,344 | |
Tandem Diabetes Care, Inc.* | | | 1,343 | | | | 118,520 | |
Haemonetics Corp.* | | | 1,040 | | | | 115,450 | |
Quidel Corp.* | | | 870 | | | | 111,299 | |
Nevro Corp.* | | | 766 | | | | 106,857 | |
iRhythm Technologies, Inc.* | | | 735 | | | | 102,062 | |
Total Healthcare-Products | | | | | | | 9,436,657 | |
| | | | | | | | | |
Biotechnology - 18.9% |
Amgen, Inc. | | | 2,389 | | | | 594,407 | |
Gilead Sciences, Inc. | | | 6,901 | | | | 446,012 | |
Vertex Pharmaceuticals, Inc.* | | | 1,723 | | | | 370,255 | |
Illumina, Inc.* | | | 933 | | | | 358,328 | |
Regeneron Pharmaceuticals, Inc.* | | | 741 | | | | 350,597 | |
Moderna, Inc.* | | | 2,621 | | | | 343,220 | |
Biogen, Inc.* | | | 1,182 | | | | 330,665 | |
Alexion Pharmaceuticals, Inc.* | | | 1,877 | | | | 287,012 | |
Seagen, Inc.* | | | 1,741 | | | | 241,755 | |
Exact Sciences Corp.* | | | 1,788 | | | | 235,623 | |
CRISPR Therapeutics AG* | | | 1,834 | | | | 223,473 | |
Incyte Corp.* | | | 2,612 | | | | 212,277 | |
BioNTech SE ADR*,1 | | | 1,942 | | | | 212,047 | |
Alnylam Pharmaceuticals, Inc.* | | | 1,423 | | | | 200,913 | |
Guardant Health, Inc.* | | | 1,315 | | | | 200,735 | |
BioMarin Pharmaceutical, Inc.* | | | 2,390 | | | | 180,469 | |
Novavax, Inc.* | | | 904 | | | | 163,904 | |
Mirati Therapeutics, Inc.* | | | 834 | | | | 142,864 | |
United Therapeutics Corp.* | | | 797 | | | | 133,314 | |
Exelixis, Inc.* | | | 5,759 | | | | 130,096 | |
Pacific Biosciences of California, Inc.* | | | 3,838 | | | | 127,844 | |
Arrowhead Pharmaceuticals, Inc.* | | | 1,927 | | | | 127,779 | |
Twist Bioscience Corp.* | | | 972 | | | | 120,392 | |
Emergent BioSolutions, Inc.* | | | 1,213 | | | | 112,700 | |
Inovio Pharmaceuticals, Inc.*,1 | | | 7,157 | | | | 66,417 | |
Total Biotechnology | | | | | | | 5,913,098 | |
| | | | | | | | | |
Healthcare-Services - 14.9% |
UnitedHealth Group, Inc. | | | 2,516 | | | | 936,128 | |
Anthem, Inc. | | | 1,300 | | | | 466,635 | |
HCA Healthcare, Inc. | | | 2,100 | | | | 395,514 | |
Humana, Inc. | | | 873 | | | | 366,005 | |
IQVIA Holdings, Inc.* | | | 1,581 | | | | 305,354 | |
Centene Corp.* | | | 4,708 | | | | 300,888 | |
Teladoc Health, Inc.* | | | 1,411 | | | | 256,449 | |
Laboratory Corporation of America Holdings* | | | 998 | | | | 254,520 | |
Catalent, Inc.* | | | 1,995 | | | | 210,094 | |
Quest Diagnostics, Inc. | | | 1,618 | | | | 207,654 | |
Charles River Laboratories International, Inc.* | | | 652 | | | | 188,969 | |
Molina Healthcare, Inc.* | | | 785 | | | | 183,502 | |
DaVita, Inc.* | | | 1,559 | | | | 168,014 | |
Universal Health Services, Inc. — Class B | | | 1,213 | | | | 161,802 | |
78 | THE RYDEX FUNDS ANNUAL REPORT | SEE NOTES TO FINANCIAL STATEMENTS. |
SCHEDULE OF INVESTMENTS (concluded) | March 31, 2021 |
HEALTH CARE FUND | |
| | Shares | | | Value | |
Encompass Health Corp. | | | 1,729 | | | $ | 141,605 | |
Invitae Corp.*,1 | | | 3,464 | | | | 132,360 | |
Total Healthcare-Services | | | | | | | 4,675,493 | |
| | | | | | | | | |
Electronics - 2.5% |
Agilent Technologies, Inc. | | | 2,454 | | | | 312,001 | |
Mettler-Toledo International, Inc.* | | | 232 | | | | 268,120 | |
Waters Corp.* | | | 751 | | | | 213,412 | |
Total Electronics | | | | | | | 793,533 | |
| | | | | | | | | |
Software - 1.8% |
Veeva Systems, Inc. — Class A* | | | 1,207 | | | | 315,317 | |
Cerner Corp. | | | 3,217 | | | | 231,238 | |
Total Software | | | | | | | 546,555 | |
| | | | | | | | | |
Total Common Stocks | | | | |
(Cost $20,839,241) | | | | | | | 31,292,558 | |
| | | | | | | | | |
| | Face
Amount | | | | |
REPURCHASE AGREEMENTS††,2 - 0.6% |
J.P. Morgan Securities LLC
issued 03/31/21 at 0.01%
due 04/01/21 | | $ | 93,260 | | | | 93,260 | |
Barclays Capital, Inc.
issued 03/31/21 at 0.01%
due 04/01/21 | | | 42,400 | | | | 42,400 | |
BofA Securities, Inc.
issued 03/31/21 at 0.01%
due 04/01/21 | | | 38,697 | | | | 38,697 | |
Total Repurchase Agreements | | | | |
(Cost $174,357) | | | | | | | 174,357 | |
| | | | | | | | | |
| | | Shares | | | | | |
SECURITIES LENDING COLLATERAL†,3 - 1.6% |
Money Market Fund | | | | | | | | |
First American Government Obligations Fund — Class Z, 0.03%4 | | | 504,567 | | | | 504,567 | |
Total Securities Lending Collateral | | | | |
(Cost $504,567) | | | | | | | 504,567 | |
| | | | | | | | | |
Total Investments - 102.1% | | | | |
(Cost $21,518,165) | | $ | 31,971,482 | |
Other Assets & Liabilities, net - (2.1)% | | | (659,555 | ) |
Total Net Assets - 100.0% | | $ | 31,311,927 | |
* | Non-income producing security. |
† | Value determined based on Level 1 inputs — See Note 4. |
†† | Value determined based on Level 2 inputs — See Note 4. |
1 | All or a portion of this security is on loan at March 31, 2021 — See Note 7. |
2 | Repurchase Agreements — See Note 6. |
3 | Securities lending collateral — See Note 7. |
4 | Rate indicated is the 7-day yield as of March 31, 2021. |
| | ADR — American Depositary Receipt |
| | plc — Public Limited Company |
| | |
| | See Sector Classification in Other Information section. |
The following table summarizes the inputs used to value the Fund’s investments at March 31, 2021 (See Note 4 in the Notes to Financial Statements):
Investments in Securities (Assets) | | Level 1
Quoted
Prices | | | Level 2
Significant
Observable
Inputs | | | Level 3
Significant
Unobservable
Inputs | | | Total | |
Common Stocks | | $ | 31,292,558 | | | $ | — | | | $ | — | | | $ | 31,292,558 | |
Repurchase Agreements | | | — | | | | 174,357 | | | | — | | | | 174,357 | |
Securities Lending Collateral | | | 504,567 | | | | — | | | | — | | | | 504,567 | |
Total Assets | | $ | 31,797,125 | | | $ | 174,357 | | | $ | — | | | $ | 31,971,482 | |
SEE NOTES TO FINANCIAL STATEMENTS. | THE RYDEX FUNDS ANNUAL REPORT | 79 |
STATEMENT OF ASSETS AND LIABILITIES |
March 31, 2021 |
Assets: |
Investments, at value - including $508,604 of securities loaned (cost $21,343,808) | | $ | 31,797,125 | |
Repurchase agreements, at value (cost $174,357) | | | 174,357 | |
Receivables: |
Dividends | | | 24,370 | |
Fund shares sold | | | 6,797 | |
Foreign tax reclaims | | | 5,454 | |
Securities lending income | | | 130 | |
Total assets | | | 32,008,233 | |
| | | | | |
Liabilities: |
Payable for: |
Return of securities lending collateral | | | 504,567 | |
Fund shares redeemed | | | 118,474 | |
Management fees | | | 23,217 | |
Transfer agent and administrative fees | | | 7,348 | |
Distribution and service fees | | | 4,253 | |
Portfolio accounting fees | | | 2,731 | |
Trustees’ fees* | | | 503 | |
Miscellaneous | | | 35,213 | |
Total liabilities | | | 696,306 | |
Commitments and contingent liabilities (Note 10) | | | — | |
Net assets | | $ | 31,311,927 | |
| | | | | |
Net assets consist of: |
Paid in capital | | $ | 21,282,996 | |
Total distributable earnings (loss) | | | 10,028,931 | |
Net assets | | $ | 31,311,927 | |
| | | | | |
Investor Class: |
Net assets | | $ | 20,830,604 | |
Capital shares outstanding | | | 530,815 | |
Net asset value per share | | $ | 39.24 | |
| | | | | |
A-Class: |
Net assets | | $ | 5,574,982 | |
Capital shares outstanding | | | 159,310 | |
Net asset value per share | | $ | 34.99 | |
Maximum offering price per share (Net asset value divided by 95.25%) | | $ | 36.73 | |
| | | | | |
C-Class: |
Net assets | | $ | 3,146,635 | |
Capital shares outstanding | | | 108,675 | |
Net asset value per share | | $ | 28.95 | |
| | | | | |
H-Class: |
Net assets | | $ | 1,759,706 | |
Capital shares outstanding | | | 52,421 | |
Net asset value per share | | $ | 33.57 | |
STATEMENT OF OPERATIONS |
Year Ended March 31, 2021 |
Investment Income: |
Dividends (net of foreign withholding tax of $20,015) | | $ | 550,336 | |
Interest | | | 149 | |
Income from securities lending, net | | | 22,156 | |
Total investment income | | | 572,641 | |
| | | | | |
Expenses: |
Management fees | | | 460,871 | |
Distribution and service fees: |
A-Class | | | 12,666 | |
C-Class | | | 33,056 | |
H-Class | | | 14,114 | |
Transfer agent and administrative fees | | | 152,520 | |
Portfolio accounting fees | | | 54,233 | |
Registration fees | | | 53,423 | |
Professional fees | | | 28,391 | |
Trustees’ fees* | | | 11,571 | |
Custodian fees | | | 8,133 | |
Miscellaneous | | | 25,924 | |
Total expenses | | | 854,902 | |
Net investment loss | | | (282,261 | ) |
| | | | | |
Net Realized and Unrealized Gain (Loss): |
Net realized gain (loss) on: |
Investments | | | 15,084,375 | |
Net realized gain | | | 15,084,375 | |
Net change in unrealized appreciation (depreciation) on: |
Investments | | | 7,068,877 | |
Net change in unrealized appreciation (depreciation) | | | 7,068,877 | |
Net realized and unrealized gain | | | 22,153,252 | |
Net increase in net assets resulting from operations | | $ | 21,870,991 | |
* | Relates to Trustees not deemed “interested persons” within the meaning of Section 2(a)(19) of the 1940 Act. |
80 | THE RYDEX FUNDS ANNUAL REPORT | SEE NOTES TO FINANCIAL STATEMENTS. |
STATEMENTS OF CHANGES IN NET ASSETS |
| | Year Ended
March 31,
2021 | | | Year Ended
March 31,
2020 | |
Increase (Decrease) in Net Assets from Operations: | | | | | | | | |
Net investment loss | | $ | (282,261 | ) | | $ | (134,017 | ) |
Net realized gain on investments | | | 15,084,375 | | | | 10,948,048 | |
Net change in unrealized appreciation (depreciation) on investments | | | 7,068,877 | | | | (14,177,522 | ) |
Net increase (decrease) in net assets resulting from operations | | | 21,870,991 | | | | (3,363,491 | ) |
| | | | | | | | | |
Distributions to shareholders: | | | | | | | | |
Investor Class | | | (2,418,155 | ) | | | — | |
A-Class | | | (491,504 | ) | | | — | |
C-Class | | | (364,380 | ) | | | — | |
H-Class | | | (176,167 | ) | | | — | |
Total distributions to shareholders | | | (3,450,206 | ) | | | — | |
| | | | | | | | | |
Capital share transactions: | | | | | | | | |
Proceeds from sale of shares | | | | | | | | |
Investor Class | | | 115,717,597 | | | | 117,439,229 | |
A-Class | | | 1,911,924 | | | | 8,301,767 | |
C-Class | | | 2,607,889 | | | | 2,538,334 | |
H-Class | | | 23,504,676 | | | | 12,331,415 | |
Distributions reinvested | | | | | | | | |
Investor Class | | | 2,326,814 | | | | — | |
A-Class | | | 479,893 | | | | — | |
C-Class | | | 360,081 | | | | — | |
H-Class | | | 175,978 | | | | — | |
Cost of shares redeemed | | | | | | | | |
Investor Class | | | (122,447,090 | ) | | | (166,245,050 | ) |
A-Class | | | (1,528,377 | ) | | | (9,724,774 | ) |
C-Class | | | (3,342,165 | ) | | | (3,855,410 | ) |
H-Class | | | (26,736,481 | ) | | | (18,823,192 | ) |
Net decrease from capital share transactions | | | (6,969,261 | ) | | | (58,037,681 | ) |
Net increase (decrease) in net assets | | | 11,451,524 | | | | (61,401,172 | ) |
| | | | | | | | | |
Net assets: | | | | | | | | |
Beginning of year | | | 19,860,403 | | | | 81,261,575 | |
End of year | | $ | 31,311,927 | | | $ | 19,860,403 | |
| | | | | | | | | |
Capital share activity: | | | | | | | | |
Shares sold | | | | | | | | |
Investor Class | | | 3,315,058 | | | | 3,523,340 | |
A-Class | | | 58,179 | | | | 285,931 | |
C-Class | | | 93,160 | | | | 101,419 | |
H-Class | | | 859,426 | | | | 409,835 | |
Shares issued from reinvestment of distributions | | | | | | | | |
Investor Class | | | 61,589 | | | | — | |
A-Class | | | 14,232 | | | | — | |
C-Class | | | 12,878 | | | | — | |
H-Class | | | 5,440 | | | | — | |
Shares redeemed | | | | | | | | |
Investor Class | | | (3,255,748 | ) | | | (5,117,046 | ) |
A-Class | | | (45,053 | ) | | | (321,745 | ) |
C-Class | | | (119,131 | ) | | | (154,580 | ) |
H-Class | | | (851,233 | ) | | | (653,035 | ) |
Net increase (decrease) in shares | | | 148,797 | | | | (1,925,881 | ) |
SEE NOTES TO FINANCIAL STATEMENTS. | THE RYDEX FUNDS ANNUAL REPORT | 81 |
This table is presented to show selected data for a share outstanding throughout each period and to assist shareholders in evaluating a Fund’s performance for the periods presented.
Investor Class | | Year Ended
March 31,
2021 | | | Year Ended
March 31,
2020 | | | Year Ended
March 31,
2019 | | | Year Ended
March 29,
2018 | | | Year Ended
March 31,
2017 | |
Per Share Data |
Net asset value, beginning of period | | $ | 30.27 | | | $ | 32.03 | | | $ | 28.88 | | | $ | 27.82 | | | $ | 28.65 | |
Income (loss) from investment operations: |
Net investment income (loss)a | | | (.15 | ) | | | (.06 | ) | | | (.13 | ) | | | (.13 | ) | | | (.10 | ) |
Net gain (loss) on investments (realized and unrealized) | | | 12.50 | | | | (1.70 | ) | | | 3.78 | | | | 3.82 | | | | 2.79 | |
Total from investment operations | | | 12.35 | | | | (1.76 | ) | | | 3.65 | | | | 3.69 | | | | 2.69 | |
Less distributions from: |
Net realized gains | | | (3.38 | ) | | | — | | | | (.50 | ) | | | (2.63 | ) | | | (3.52 | ) |
Total distributions | | | (3.38 | ) | | | — | | | | (.50 | ) | | | (2.63 | ) | | | (3.52 | ) |
Net asset value, end of period | | $ | 39.24 | | | $ | 30.27 | | | $ | 32.03 | | | $ | 28.88 | | | $ | 27.82 | |
|
Total Return | | | 41.24 | % | | | (5.49 | %) | | | 12.75 | % | | | 13.38 | % | | | 10.20 | % |
Ratios/Supplemental Data |
Net assets, end of period (in thousands) | | $ | 20,831 | | | $ | 12,408 | | | $ | 64,185 | | | $ | 67,542 | | | $ | 36,468 | |
Ratios to average net assets: |
Net investment income (loss) | | | (0.41 | %) | | | (0.19 | %) | | | (0.42 | %) | | | (0.43 | %) | | | (0.36 | %) |
Total expenses | | | 1.46 | % | | | 1.47 | % | | | 1.46 | % | | | 1.38 | % | | | 1.37 | % |
Portfolio turnover rate | | | 256 | % | | | 248 | % | | | 341 | % | | | 394 | % | | | 699 | % |
A-Class | | Year Ended
March 31,
2021 | | | Year Ended
March 31,
2020 | | | Year Ended
March 31,
2019 | | | Year Ended
March 29,
2018 | | | Year Ended
March 31,
2017 | |
Per Share Data |
Net asset value, beginning of period | | $ | 27.33 | | | $ | 29.00 | | | $ | 26.26 | | | $ | 25.56 | | | $ | 26.68 | |
Income (loss) from investment operations: |
Net investment income (loss)a | | | (.21 | ) | | | (.12 | ) | | | (.19 | ) | | | (.19 | ) | | | (.17 | ) |
Net gain (loss) on investments (realized and unrealized) | | | 11.25 | | | | (1.55 | ) | | | 3.43 | | | | 3.52 | | | | 2.57 | |
Total from investment operations | | | 11.04 | | | | (1.67 | ) | | | 3.24 | | | | 3.33 | | | | 2.40 | |
Less distributions from: |
Net realized gains | | | (3.38 | ) | | | — | | | | (.50 | ) | | | (2.63 | ) | | | (3.52 | ) |
Total distributions | | | (3.38 | ) | | | — | | | | (.50 | ) | | | (2.63 | ) | | | (3.52 | ) |
Net asset value, end of period | | $ | 34.99 | | | $ | 27.33 | | | $ | 29.00 | | | $ | 26.26 | | | $ | 25.56 | |
|
Total Returnb | | | 40.87 | % | | | (5.76 | %) | | | 12.46 | % | | | 13.14 | % | | | 9.85 | % |
Ratios/Supplemental Data |
Net assets, end of period (in thousands) | | $ | 5,575 | | | $ | 3,606 | | | $ | 4,865 | | | $ | 3,102 | | | $ | 4,626 | |
Ratios to average net assets: |
Net investment income (loss) | | | (0.63 | %) | | | (0.43 | %) | | | (0.68 | %) | | | (0.69 | %) | | | (0.62 | %) |
Total expenses | | | 1.69 | % | | | 1.73 | % | | | 1.72 | % | | | 1.63 | % | | | 1.62 | % |
Portfolio turnover rate | | | 256 | % | | | 248 | % | | | 341 | % | | | 394 | % | | | 699 | % |
82 | THE RYDEX FUNDS ANNUAL REPORT | SEE NOTES TO FINANCIAL STATEMENTS. |
FINANCIAL HIGHLIGHTS (concluded) |
This table is presented to show selected data for a share outstanding throughout each period and to assist shareholders in evaluating a Fund’s performance for the periods presented.
C-Class | | Year Ended
March 31,
2021 | | | Year Ended
March 31,
2020 | | | Year Ended
March 31,
2019 | | | Year Ended
March 29,
2018 | | | Year Ended
March 31,
2017 | |
Per Share Data |
Net asset value, beginning of period | | $ | 23.21 | | | $ | 24.81 | | | $ | 22.69 | | | $ | 22.58 | | | $ | 24.13 | |
Income (loss) from investment operations: |
Net investment income (loss)a | | | (.40 | ) | | | (.30 | ) | | | (.35 | ) | | | (.34 | ) | | | (.33 | ) |
Net gain (loss) on investments (realized and unrealized) | | | 9.52 | | | | (1.30 | ) | | | 2.97 | | | | 3.08 | | | | 2.30 | |
Total from investment operations | | | 9.12 | | | | (1.60 | ) | | | 2.62 | | | | 2.74 | | | | 1.97 | |
Less distributions from: |
Net realized gains | | | (3.38 | ) | | | — | | | | (.50 | ) | | | (2.63 | ) | | | (3.52 | ) |
Total distributions | | | (3.38 | ) | | | — | | | | (.50 | ) | | | (2.63 | ) | | | (3.52 | ) |
Net asset value, end of period | | $ | 28.95 | | | $ | 23.21 | | | $ | 24.81 | | | $ | 22.69 | | | $ | 22.58 | |
|
Total Returnb | | | 39.82 | % | | | (6.45 | %) | | | 11.68 | % | | | 12.24 | % | | | 9.07 | % |
Ratios/Supplemental Data |
Net assets, end of period (in thousands) | | $ | 3,147 | | | $ | 2,826 | | | $ | 4,340 | | | $ | 4,940 | | | $ | 4,959 | |
Ratios to average net assets: |
Net investment income (loss) | | | (1.39 | %) | | | (1.20 | %) | | | (1.42 | %) | | | (1.42 | %) | | | (1.37 | %) |
Total expenses | | | 2.45 | % | | | 2.48 | % | | | 2.46 | % | | | 2.38 | % | | | 2.37 | % |
Portfolio turnover rate | | | 256 | % | | | 248 | % | | | 341 | % | | | 394 | % | | | 699 | % |
H-Class | | Year Ended
March 31,
2021 | | | Year Ended
March 31,
2020 | | | Year Ended
March 31,
2019 | | | Year Ended
March 29,
2018 | | | Year Ended
March 31,
2017 | |
Per Share Data |
Net asset value, beginning of period | | $ | 26.31 | | | $ | 27.91 | | | $ | 25.29 | | | $ | 24.72 | | | $ | 25.91 | |
Income (loss) from investment operations: |
Net investment income (loss)a | | | (.21 | ) | | | (.13 | ) | | | (.18 | ) | | | (.21 | ) | | | (.16 | ) |
Net gain (loss) on investments (realized and unrealized) | | | 10.85 | | | | (1.47 | ) | | | 3.30 | | | | 3.41 | | | | 2.49 | |
Total from investment operations | | | 10.64 | | | | (1.60 | ) | | | 3.12 | | | | 3.20 | | | | 2.33 | |
Less distributions from: |
Net realized gains | | | (3.38 | ) | | | — | | | | (.50 | ) | | | (2.63 | ) | | | (3.52 | ) |
Total distributions | | | (3.38 | ) | | | — | | | | (.50 | ) | | | (2.63 | ) | | | (3.52 | ) |
Net asset value, end of period | | $ | 33.57 | | | $ | 26.31 | | | $ | 27.91 | | | $ | 25.29 | | | $ | 24.72 | |
|
Total Return | | | 40.93 | % | | | (5.73 | %) | | | 12.46 | % | | | 13.06 | % | | | 9.87 | % |
Ratios/Supplemental Data |
Net assets, end of period (in thousands) | | $ | 1,760 | | | $ | 1,021 | | | $ | 7,871 | | | $ | 5,225 | | | $ | 4,809 | |
Ratios to average net assets: |
Net investment income (loss) | | | (0.68 | %) | | | (0.45 | %) | | | (0.66 | %) | | | (0.77 | %) | | | (0.62 | %) |
Total expenses | | | 1.76 | % | | | 1.72 | % | | | 1.73 | % | | | 1.64 | % | | | 1.62 | % |
Portfolio turnover rate | | | 256 | % | | | 248 | % | | | 341 | % | | | 394 | % | | | 699 | % |
a | Net investment income (loss) per share was computed using average shares outstanding throughout the period. |
b | Total return does not reflect the impact of any applicable sales charges. |
SEE NOTES TO FINANCIAL STATEMENTS. | THE RYDEX FUNDS ANNUAL REPORT | 83 |
PERFORMANCE REPORT AND FUND PROFILE (Unaudited) | March 31, 2021 |
INTERNET FUND
OBJECTIVE: Seeks to provide capital appreciation by investing in companies that provide products or services designed for or related to the Internet (“Internet Companies”).
For the one-year period ended March 31, 2021, Internet Fund Investor Class returned 85.87%, compared with 66.61% for the S&P 500 Information Technology Index. The broader S&P 500 Index returned 56.35%.
Internet & direct marketing retail, interactive media & services, and application software contributed the most to return. Real estate services and education services were the only industries to detract from return.
Amazon.com, Inc., Alphabet, Inc. - Class A, and PayPal Holdings, Inc. contributed the most to the Fund’s return for the period. Zoom Video Communications, Inc. - Class A, Momo, Inc. ADR - Class A, and Fastly, Inc. - Class A detracted the most from return.
Performance displayed represents past performance, which is no guarantee of future results.
Holdings Diversification (Market Exposure as % of Net Assets)
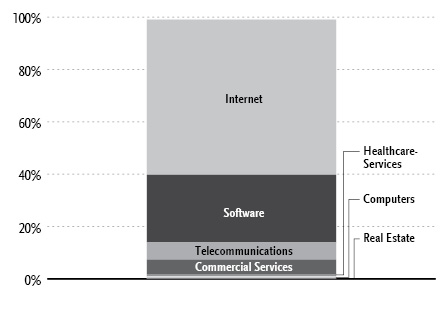
“Holdings Diversification (Market Exposure as % of Net Assets)” excludes any temporary cash investments.
Inception Dates: |
Investor Class | April 6, 2000 |
A-Class | September 1, 2004 |
C-Class | April 19, 2001 |
H-Class | April 6, 2000 |
Ten Largest Holdings (% of Total Net Assets) |
Amazon.com, Inc. | 6.7% |
Alphabet, Inc. — Class A | 6.3% |
Facebook, Inc. — Class A | 5.1% |
Alibaba Group Holding Ltd. ADR | 3.8% |
PayPal Holdings, Inc. | 2.9% |
Adobe, Inc. | 2.7% |
Cisco Systems, Inc. | 2.6% |
Netflix, Inc. | 2.6% |
salesforce.com, Inc. | 2.5% |
Booking Holdings, Inc. | 1.7% |
Top Ten Total | 36.9% |
| | |
“Ten Largest Holdings” excludes any temporary cash investments. |
84 | THE RYDEX FUNDS ANNUAL REPORT | |
PERFORMANCE REPORT AND FUND PROFILE (Unaudited)(concluded) | March 31, 2021 |
Cumulative Fund Performance*
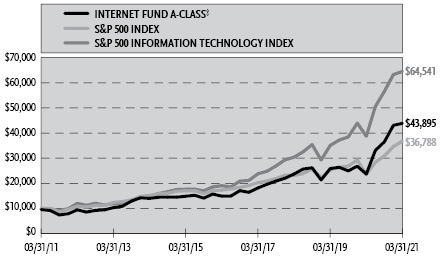

Average Annual Returns*
Periods Ended March 31, 2021
| 1 Year | 5 Year | 10 Year |
Investor Class Shares | 85.87% | 24.48% | 16.80% |
A-Class Shares | 85.41% | 24.16% | 16.51% |
A-Class Shares with sales charge‡ | 76.60% | 22.96% | 15.94% |
C-Class Shares | 84.03% | 23.24% | 15.64% |
C-Class Shares with CDSC§ | 83.03% | 23.24% | 15.64% |
H-Class Shares** | 85.39% | 24.17% | 16.38% |
S&P 500 Information Technology Index | 66.61% | 27.64% | 20.50% |
S&P 500 Index | 56.35% | 16.29% | 13.91% |
* | The performance data above represents past performance that is not predictive of future results. The investment return and principal value of an investment in the Fund will fluctuate so that an investor’s shares, when redeemed, may be worth more or less than their original cost. Returns are historical and include changes in principal and reinvested dividends and capital gains and do not reflect the effect of taxes. The S&P 500 Index and the S&P 500 Information Technology Index are unmanaged indices and, unlike the Fund, have no management fees or operating expenses to reduce their reported returns. The graphs are based on Investor Class shares and A-Class shares only; performance for C-Class and H-Class shares will vary due to differences in fee structures. |
** | Effective September 30, 2015, the Fund’s Advisor Class shares were converted into H-Class shares. |
‡ | Fund returns are calculated using the maximum sales charge of 4.75%. |
§ | Fund returns include a CDSC of 1% if redeemed within 12 months of purchase. |
| | THE RYDEX FUNDS ANNUAL REPORT | 85 |
SCHEDULE OF INVESTMENTS | March 31, 2021 |
INTERNET FUND | |
| | Shares | | | Value | |
COMMON STOCKS† - 99.1% |
| | | | | | | | | |
Internet - 59.4% |
Amazon.com, Inc.* | | | 721 | | | $ | 2,230,832 | |
Alphabet, Inc. — Class A* | | | 1,014 | | | | 2,091,395 | |
Facebook, Inc. — Class A* | | | 5,812 | | | | 1,711,808 | |
Alibaba Group Holding Ltd. ADR* | | | 5,556 | | | | 1,259,712 | |
Netflix, Inc.* | | | 1,675 | | | | 873,780 | |
Booking Holdings, Inc.* | | | 247 | | | | 575,470 | |
Uber Technologies, Inc.* | | | 10,442 | | | | 569,193 | |
Snap, Inc. — Class A* | | | 9,345 | | | | 488,650 | |
Baidu, Inc. ADR* | | | 2,067 | | | | 449,676 | |
JD.com, Inc. ADR* | | | 5,152 | | | | 434,468 | |
Pinterest, Inc. — Class A* | | | 5,579 | | | | 413,013 | |
Twitter, Inc.* | | | 6,358 | | | | 404,560 | |
Shopify, Inc. — Class A* | | | 353 | | | | 390,595 | |
eBay, Inc. | | | 6,165 | | | | 377,545 | |
MercadoLibre, Inc.* | | | 250 | | | | 368,035 | |
Roku, Inc.* | | | 1,127 | | | | 367,143 | |
Pinduoduo, Inc. ADR* | | | 2,726 | | | | 364,957 | |
Chewy, Inc. — Class A* | | | 4,248 | | | | 359,848 | |
Match Group, Inc.* | | | 2,466 | | | | 338,779 | |
Wayfair, Inc. — Class A* | | | 1,046 | | | | 329,229 | |
Zillow Group, Inc. — Class C* | | | 2,496 | | | | 323,581 | |
Okta, Inc.* | | | 1,454 | | | | 320,505 | |
Zillow Group, Inc. — Class A* | | | 2,410 | | | | 316,626 | |
Spotify Technology S.A.* | | | 1,135 | | | | 304,123 | |
Etsy, Inc.* | | | 1,430 | | | | 288,388 | |
Expedia Group, Inc.* | | | 1,641 | | | | 282,449 | |
VeriSign, Inc.* | | | 1,421 | | | | 282,438 | |
Lyft, Inc. — Class A* | | | 4,048 | | | | 255,753 | |
IAC* | | | 1,135 | | | | 245,512 | |
Farfetch Ltd. — Class A* | | | 4,530 | | | | 240,181 | |
Trip.com Group Ltd. ADR* | | | 5,931 | | | | 235,046 | |
Fiverr International Ltd.* | | | 1,061 | | | | 230,428 | |
Wix.com Ltd.* | | | 809 | | | | 225,889 | |
GoDaddy, Inc. — Class A* | | | 2,823 | | | | 219,121 | |
F5 Networks, Inc.* | | | 1,025 | | | | 213,835 | |
Jumia Technologies AG ADR*,1 | | | 5,655 | | | | 200,526 | |
Vipshop Holdings Ltd. ADR* | | | 6,481 | | | | 193,523 | |
JOYY, Inc. ADR | | | 1,971 | | | | 184,742 | |
Anaplan, Inc.* | | | 3,025 | | | | 162,896 | |
TripAdvisor, Inc.* | | | 2,806 | | | | 150,935 | |
Grubhub, Inc.* | | | 2,208 | | | | 132,480 | |
Stitch Fix, Inc. — Class A* | | | 2,617 | | | | 129,646 | |
Stamps.com, Inc.* | | | 575 | | | | 114,718 | |
Overstock.com, Inc.* | | | 1,389 | | | | 92,035 | |
Total Internet | | | | | | | 19,744,064 | |
| | | | | | | | | |
Software - 25.8% |
Adobe, Inc.* | | | 1,911 | | | | 908,432 | |
salesforce.com, Inc.* | | | 3,863 | | | | 818,454 | |
Zoom Video Communications, Inc. — Class A* | | | 1,727 | | | | 554,868 | |
Activision Blizzard, Inc. | | | 5,327 | | | | 495,411 | |
Workday, Inc. — Class A* | | | 1,770 | | | | 439,721 | |
Twilio, Inc. — Class A* | | | 1,288 | | | | 438,899 | |
Sea Ltd. ADR* | | | 1,681 | | | | 375,250 | |
Veeva Systems, Inc. — Class A* | | | 1,427 | | | | 372,789 | |
Electronic Arts, Inc. | | | 2,715 | | | | 367,529 | |
DocuSign, Inc.* | | | 1,707 | | | | 345,582 | |
Pluralsight, Inc. — Class A* | | | 13,613 | | | | 304,114 | |
NetEase, Inc. ADR | | | 2,788 | | | | 287,889 | |
HubSpot, Inc.* | | | 610 | | | | 277,068 | |
Bilibili, Inc. ADR* | | | 2,566 | | | | 274,716 | |
Take-Two Interactive Software, Inc.* | | | 1,530 | | | | 270,351 | |
Coupa Software, Inc.*,1 | | | 1,002 | | | | 254,989 | |
Citrix Systems, Inc. | | | 1,778 | | | | 249,560 | |
Akamai Technologies, Inc.* | | | 2,364 | | | | 240,892 | |
MongoDB, Inc.* | | | 833 | | | | 222,769 | |
Dropbox, Inc. — Class A* | | | 7,298 | | | | 194,565 | |
Five9, Inc.* | | | 1,180 | | | | 184,469 | |
Smartsheet, Inc. — Class A* | | | 2,616 | | | | 167,215 | |
Fastly, Inc. — Class A*,1 | | | 2,367 | | | | 159,252 | |
J2 Global, Inc.* | | | 1,152 | | | | 138,079 | |
BigCommerce Holdings, Inc.* | | | 2,151 | | | | 124,328 | |
New Relic, Inc.* | | | 1,915 | | | | 117,734 | |
Total Software | | | | | | | 8,584,925 | |
| | | | | | | | | |
Telecommunications - 6.7% |
Cisco Systems, Inc. | | | 16,902 | | | | 874,002 | |
Motorola Solutions, Inc. | | | 1,744 | | | | 327,959 | |
Arista Networks, Inc.* | | | 941 | | | | 284,079 | |
GDS Holdings Ltd. ADR* | | | 2,553 | | | | 207,023 | |
Telefonaktiebolaget LM Ericsson ADR | | | 15,618 | | | | 206,002 | |
Ciena Corp.* | | | 3,039 | | | | 166,294 | |
Juniper Networks, Inc. | | | 6,552 | | | | 165,962 | |
Total Telecommunications | | | | | | | 2,231,321 | |
| | | | | | | | | |
Commercial Services - 5.4% |
PayPal Holdings, Inc.* | | | 3,998 | | | | 970,874 | |
CoStar Group, Inc.* | | | 404 | | | | 332,044 | |
Chegg, Inc.* | | | 2,293 | | | | 196,418 | |
Paylocity Holding Corp.* | | | 1,035 | | | | 186,124 | |
2U, Inc.* | | | 2,659 | | | | 101,654 | |
Total Commercial Services | | | | | | | 1,787,114 | |
| | | | | | | | | |
Healthcare-Services - 0.9% |
Teladoc Health, Inc.* | | | 1,668 | | | | 303,159 | |
| | | | | | | | | |
Computers - 0.5% |
Lumentum Holdings, Inc.* | | | 1,717 | | | | 156,848 | |
| | | | | | | | | |
Real Estate - 0.4% |
Redfin Corp.* | | | 2,241 | | | | 149,228 | |
| | | | | | | | | |
Total Common Stocks | | | | |
(Cost $17,952,500) | | | | | | | 32,956,659 | |
| | | | | | | | | |
86 | THE RYDEX FUNDS ANNUAL REPORT | SEE NOTES TO FINANCIAL STATEMENTS. |
SCHEDULE OF INVESTMENTS (concluded) | March 31, 2021 |
INTERNET FUND | |
| | Face
Amount | | | Value | |
REPURCHASE AGREEMENTS††,2 - 0.8% |
J.P. Morgan Securities LLC
issued 03/31/21 at 0.01%
due 04/01/21 | | $ | 143,329 | | | $ | 143,329 | |
Barclays Capital, Inc.
issued 03/31/21 at 0.01%
due 04/01/21 | | | 65,165 | | | | 65,165 | |
BofA Securities, Inc.
issued 03/31/21 at 0.01%
due 04/01/21 | | | 59,473 | | | | 59,473 | |
Total Repurchase Agreements | | | | |
(Cost $267,967) | | | | | | | 267,967 | |
| | | | | | | | | |
| | Shares | | | | |
SECURITIES LENDING COLLATERAL†,3 - 1.4% |
Money Market Fund | | | | | | | | |
First American Government Obligations Fund — Class Z, 0.03%4 | | | 455,086 | | | | 455,086 | |
Total Securities Lending Collateral | | | | |
(Cost $455,086) | | | | | | | 455,086 | |
| | | | | | | | | |
Total Investments - 101.3% | | | | | | | | |
(Cost $18,675,553) | | $ | 33,679,712 | |
Other Assets & Liabilities, net - (1.3)% | | | (424,141 | ) |
Total Net Assets - 100.0% | | $ | 33,255,571 | |
* | Non-income producing security. |
† | Value determined based on Level 1 inputs — See Note 4. |
†† | Value determined based on Level 2 inputs — See Note 4. |
1 | All or a portion of this security is on loan at March 31, 2021 — See Note 7. |
2 | Repurchase Agreements — See Note 6. |
3 | Securities lending collateral — See Note 7. |
4 | Rate indicated is the 7-day yield as of March 31, 2021. |
| | ADR — American Depositary Receipt |
| | |
| | See Sector Classification in Other Information section. |
The following table summarizes the inputs used to value the Fund’s investments at March 31, 2021 (See Note 4 in the Notes to Financial Statements):
Investments in Securities (Assets) | | Level 1
Quoted
Prices | | | Level 2
Significant
Observable
Inputs | | | Level 3
Significant
Unobservable
Inputs | | | Total | |
Common Stocks | | $ | 32,956,659 | | | $ | — | | | $ | — | | | $ | 32,956,659 | |
Repurchase Agreements | | | — | | | | 267,967 | | | | — | | | | 267,967 | |
Securities Lending Collateral | | | 455,086 | | | | — | | | | — | | | | 455,086 | |
Total Assets | | $ | 33,411,745 | | | $ | 267,967 | | | $ | — | | | $ | 33,679,712 | |
SEE NOTES TO FINANCIAL STATEMENTS. | THE RYDEX FUNDS ANNUAL REPORT | 87 |
STATEMENT OF ASSETS AND LIABILITIES |
March 31, 2021 |
Assets: |
Investments, at value - including $460,922 of securities loaned (cost $18,407,586) | | $ | 33,411,745 | |
Repurchase agreements, at value (cost $267,967) | | | 267,967 | |
Cash | | | 78 | |
Receivables: |
Fund shares sold | | | 139,586 | |
Dividends | | | 1,389 | |
Securities lending income | | | 13 | |
Total assets | | | 33,820,778 | |
| | | | | |
Liabilities: |
Payable for: |
Return of securities lending collateral | | | 455,086 | |
Fund shares redeemed | | | 26,521 | |
Management fees | | | 26,370 | |
Transfer agent and administrative fees | | | 8,345 | |
Distribution and service fees | | | 4,470 | |
Portfolio accounting fees | | | 3,102 | |
Trustees’ fees* | | | 582 | |
Miscellaneous | | | 40,731 | |
Total liabilities | | | 565,207 | |
Commitments and contingent liabilities (Note 10) | | | — | |
Net assets | | $ | 33,255,571 | |
| | | | | |
Net assets consist of: |
Paid in capital | | $ | 15,063,618 | |
Total distributable earnings (loss) | | | 18,191,953 | |
Net assets | | $ | 33,255,571 | |
| | | | | |
Investor Class: |
Net assets | | $ | 25,112,739 | |
Capital shares outstanding | | | 128,397 | |
Net asset value per share | | $ | 195.59 | |
| | | | | |
A-Class: |
Net assets | | $ | 2,952,050 | |
Capital shares outstanding | | | 16,402 | |
Net asset value per share | | $ | 179.98 | |
Maximum offering price per share (Net asset value divided by 95.25%) | | $ | 188.96 | |
| | | | | |
C-Class: |
Net assets | | $ | 4,124,028 | |
Capital shares outstanding | | | 27,033 | |
Net asset value per share | | $ | 152.56 | |
| | | | | |
H-Class: |
Net assets | | $ | 1,066,754 | |
Capital shares outstanding | | | 6,141 | |
Net asset value per share | | $ | 173.71 | |
STATEMENT OF OPERATIONS |
Year Ended March 31, 2021 |
Investment Income: |
Dividends (net of foreign withholding tax of $2,939) | | $ | 100,001 | |
Interest | | | 156 | |
Income from securities lending, net | | | 13,913 | |
Total investment income | | | 114,070 | |
| | | | | |
Expenses: |
Management fees | | | 402,138 | |
Distribution and service fees: |
A-Class | | | 6,621 | |
C-Class | | | 36,147 | |
H-Class | | | 13,334 | |
Transfer agent and administrative fees | | | 131,890 | |
Portfolio accounting fees | | | 47,321 | |
Registration fees | | | 41,240 | |
Professional fees | | | 21,106 | |
Trustees’ fees* | | | 8,286 | |
Custodian fees | | | 6,710 | |
Line of credit fees | | | 50 | |
Miscellaneous | | | 25,217 | |
Total expenses | | | 740,060 | |
Net investment loss | | | (625,990 | ) |
| | | | | |
Net Realized and Unrealized Gain (Loss): |
Net realized gain (loss) on: |
Investments | | | 14,063,069 | |
Net realized gain | | | 14,063,069 | |
Net change in unrealized appreciation (depreciation) on: |
Investments | | | 11,989,124 | |
Net change in unrealized appreciation (depreciation) | | | 11,989,124 | |
Net realized and unrealized gain | | | 26,052,193 | |
Net increase in net assets resulting from operations | | $ | 25,426,203 | |
* | Relates to Trustees not deemed “interested persons” within the meaning of Section 2(a)(19) of the 1940 Act. |
88 | THE RYDEX FUNDS ANNUAL REPORT | SEE NOTES TO FINANCIAL STATEMENTS. |
STATEMENTS OF CHANGES IN NET ASSETS |
| | Year Ended
March 31,
2021 | | | Year Ended
March 31,
2020 | |
Increase (Decrease) in Net Assets from Operations: | | | | | | | | |
Net investment loss | | $ | (625,990 | ) | | $ | (392,589 | ) |
Net realized gain (loss) on investments | | | 14,063,069 | | | | (1,629,638 | ) |
Net change in unrealized appreciation (depreciation) on investments | | | 11,989,124 | | | | (5,406,274 | ) |
Net increase (decrease) in net assets resulting from operations | | | 25,426,203 | | | | (7,428,501 | ) |
| | | | | | | | | |
Distributions to shareholders: | | | | | | | | |
Investor Class | | | — | | | | (710,898 | ) |
A-Class | | | — | | | | (61,275 | ) |
C-Class | | | — | | | | (101,725 | ) |
H-Class | | | — | | | | (29,916 | ) |
Total distributions to shareholders | | | — | | | | (903,814 | ) |
| | | | | | | | | |
Capital share transactions: | | | | | | | | |
Proceeds from sale of shares | | | | | | | | |
Investor Class | | | 92,264,221 | | | | 108,639,586 | |
A-Class | | | 1,068,843 | | | | 4,695,934 | |
C-Class | | | 3,618,645 | | | | 2,609,673 | |
H-Class | | | 25,459,994 | | | | 15,624,744 | |
Distributions reinvested | | | | | | | | |
Investor Class | | | — | | | | 702,319 | |
A-Class | | | — | | | | 59,412 | |
C-Class | | | — | | | | 101,270 | |
H-Class | | | — | | | | 29,888 | |
Cost of shares redeemed | | | | | | | | |
Investor Class | | | (93,997,468 | ) | | | (106,635,760 | ) |
A-Class | | | (1,630,302 | ) | | | (4,620,680 | ) |
C-Class | | | (3,287,545 | ) | | | (3,528,541 | ) |
H-Class | | | (31,224,635 | ) | | | (24,253,605 | ) |
Net decrease from capital share transactions | | | (7,728,247 | ) | | | (6,575,760 | ) |
Net increase (decrease) in net assets | | | 17,697,956 | | | | (14,908,075 | ) |
| | | | | | | | | |
Net assets: | | | | | | | | |
Beginning of year | | | 15,557,615 | | | | 30,465,690 | |
End of year | | $ | 33,255,571 | | | $ | 15,557,615 | |
| | | | | | | | | |
Capital share activity: | | | | | | | | |
Shares sold | | | | | | | | |
Investor Class | | | 586,376 | | | | 884,862 | |
A-Class | | | 7,156 | | | | 43,934 | |
C-Class | | | 29,471 | | | | 27,414 | |
H-Class | | | 242,330 | | | | 145,036 | |
Shares issued from reinvestment of distributions | | | | | | | | |
Investor Class | | | — | | | | 6,142 | |
A-Class | | | — | | | | 563 | |
C-Class | | | — | | | | 1,121 | |
H-Class | | | — | | | | 293 | |
Shares redeemed | | | | | | | | |
Investor Class | | | (560,050 | ) | | | (919,270 | ) |
A-Class | | | (11,977 | ) | | | (41,913 | ) |
C-Class | | | (25,736 | ) | | | (37,179 | ) |
H-Class | | | (244,993 | ) | | | (229,294 | ) |
Net increase (decrease) in shares | | | 22,577 | | | | (118,291 | ) |
SEE NOTES TO FINANCIAL STATEMENTS. | THE RYDEX FUNDS ANNUAL REPORT | 89 |
This table is presented to show selected data for a share outstanding throughout each period and to assist shareholders in evaluating a Fund’s performance for the periods presented.
Investor Class | | Year Ended
March 31,
2021 | | | Year Ended
March 31,
2020 | | | Year Ended
March 31,
2019 | | | Year Ended
March 29,
2018 | | | Year Ended
March 31,
2017 | |
Per Share Data |
Net asset value, beginning of period | | $ | 105.23 | | | $ | 118.80 | | | $ | 124.80 | | | $ | 95.33 | | | $ | 77.91 | |
Income (loss) from investment operations: |
Net investment income (loss)a | | | (2.03 | ) | | | (1.30 | ) | | | (1.29 | ) | | | (.80 | ) | | | (.60 | ) |
Net gain (loss) on investments (realized and unrealized) | | | 92.39 | | | | (8.17 | ) | | | 10.79 | | | | 30.27 | | | | 18.02 | |
Total from investment operations | | | 90.36 | | | | (9.47 | ) | | | 9.50 | | | | 29.47 | | | | 17.42 | |
Less distributions from: |
Net realized gains | | | — | | | | (4.10 | ) | | | (15.50 | ) | | | — | | | | — | |
Total distributions | | | — | | | | (4.10 | ) | | | (15.50 | ) | | | — | | | | — | |
Net asset value, end of period | | $ | 195.59 | | | $ | 105.23 | | | $ | 118.80 | | | $ | 124.80 | | | $ | 95.33 | |
|
Total Return | | | 85.87 | % | | | (8.25 | %) | | | 9.39 | % | | | 30.91 | % | | | 22.36 | % |
Ratios/Supplemental Data |
Net assets, end of period (in thousands) | | $ | 25,113 | | | $ | 10,741 | | | $ | 15,484 | | | $ | 40,843 | | | $ | 17,670 | |
Ratios to average net assets: |
Net investment income (loss) | | | (1.21 | %) | | | (1.08 | %) | | | (1.00 | %) | | | (0.71 | %) | | | (0.70 | %) |
Total expenses | | | 1.44 | % | | | 1.47 | % | | | 1.45 | % | | | 1.38 | % | | | 1.37 | % |
Portfolio turnover rate | | | 284 | % | | | 359 | % | | | 349 | % | | | 305 | % | | | 518 | % |
A-Class | | Year Ended
March 31,
2021 | | | Year Ended
March 31,
2020 | | | Year Ended
March 31,
2019 | | | Year Ended
March 29,
2018 | | | Year Ended
March 31,
2017 | |
Per Share Data |
Net asset value, beginning of period | | $ | 97.07 | | | $ | 110.18 | | | $ | 117.20 | | | $ | 89.75 | | | $ | 73.54 | |
Income (loss) from investment operations: |
Net investment income (loss)a | | | (2.22 | ) | | | (1.32 | ) | | | (1.46 | ) | | | (1.01 | ) | | | (.76 | ) |
Net gain (loss) on investments (realized and unrealized) | | | 85.13 | | | | (7.69 | ) | | | 9.94 | | | | 28.46 | | | | 16.97 | |
Total from investment operations | | | 82.91 | | | | (9.01 | ) | | | 8.48 | | | | 27.45 | | | | 16.21 | |
Less distributions from: |
Net realized gains | | | — | | | | (4.10 | ) | | | (15.50 | ) | | | — | | | | — | |
Total distributions | | | — | | | | (4.10 | ) | | | (15.50 | ) | | | — | | | | — | |
Net asset value, end of period | | $ | 179.98 | | | $ | 97.07 | | | $ | 110.18 | | | $ | 117.20 | | | $ | 89.75 | |
|
Total Returnb | | | 85.41 | % | | | (8.48 | %) | | | 9.13 | % | | | 30.57 | % | | | 22.04 | % |
Ratios/Supplemental Data |
Net assets, end of period (in thousands) | | $ | 2,952 | | | $ | 2,060 | | | $ | 2,054 | | | $ | 3,393 | | | $ | 2,139 | |
Ratios to average net assets: |
Net investment income (loss) | | | (1.45 | %) | | | (1.20 | %) | | | (1.27 | %) | | | (0.96 | %) | | | (0.95 | %) |
Total expenses | | | 1.69 | % | | | 1.73 | % | | | 1.71 | % | | | 1.63 | % | | | 1.62 | % |
Portfolio turnover rate | | | 284 | % | | | 359 | % | | | 349 | % | | | 305 | % | | | 518 | % |
90 | THE RYDEX FUNDS ANNUAL REPORT | SEE NOTES TO FINANCIAL STATEMENTS. |
FINANCIAL HIGHLIGHTS (concluded) |
This table is presented to show selected data for a share outstanding throughout each period and to assist shareholders in evaluating a Fund’s performance for the periods presented.
C-Class | | Year Ended
March 31,
2021 | | | Year Ended
March 31,
2020 | | | Year Ended
March 31,
2019 | | | Year Ended
March 29,
2018 | | | Year Ended
March 31,
2017 | |
Per Share Data |
Net asset value, beginning of period | | $ | 82.90 | | | $ | 95.40 | | | $ | 104.40 | | | $ | 80.55 | | | $ | 66.49 | |
Income (loss) from investment operations: |
Net investment income (loss)a | | | (2.91 | ) | | | (1.96 | ) | | | (2.08 | ) | | | (1.60 | ) | | | (1.24 | ) |
Net gain (loss) on investments (realized and unrealized) | | | 72.57 | | | | (6.44 | ) | | | 8.58 | | | | 25.45 | | | | 15.30 | |
Total from investment operations | | | 69.66 | | | | (8.40 | ) | | | 6.50 | | | | 23.85 | | | | 14.06 | |
Less distributions from: |
Net realized gains | | | — | | | | (4.10 | ) | | | (15.50 | ) | | | — | | | | — | |
Total distributions | | | — | | | | (4.10 | ) | | | (15.50 | ) | | | — | | | | — | |
Net asset value, end of period | | $ | 152.56 | | | $ | 82.90 | | | $ | 95.40 | | | $ | 104.40 | | | $ | 80.55 | |
|
Total Returnb | | | 84.03 | % | | | (9.16 | %) | | | 8.31 | % | | | 29.61 | % | | | 21.13 | % |
Ratios/Supplemental Data |
Net assets, end of period (in thousands) | | $ | 4,124 | | | $ | 1,931 | | | $ | 3,047 | | | $ | 2,967 | | | $ | 2,321 | |
Ratios to average net assets: |
Net investment income (loss) | | | (2.21 | %) | | | (2.06 | %) | | | (2.01 | %) | | | (1.70 | %) | | | (1.71 | %) |
Total expenses | | | 2.43 | % | | | 2.47 | % | | | 2.46 | % | | | 2.38 | % | | | 2.37 | % |
Portfolio turnover rate | | | 284 | % | | | 359 | % | | | 349 | % | | | 305 | % | | | 518 | % |
H-Class | | Year Ended
March 31,
2021 | | | Year Ended
March 31,
2020 | | | Year Ended
March 31,
2019 | | | Year Ended
March 29,
2018 | | | Year Ended
March 31,
2017 | |
Per Share Data |
Net asset value, beginning of period | | $ | 93.70 | | | $ | 106.51 | | | $ | 113.84 | | | $ | 87.18 | | | $ | 71.40 | |
Income (loss) from investment operations: |
Net investment income (loss)a | | | (1.75 | ) | | | (1.41 | ) | | | (1.51 | ) | | | (1.07 | ) | | | (.78 | ) |
Net gain (loss) on investments (realized and unrealized) | | | 81.76 | | | | (7.30 | ) | | | 9.68 | | | | 27.73 | | | | 16.56 | |
Total from investment operations | | | 80.01 | | | | (8.71 | ) | | | 8.17 | | | | 26.66 | | | | 15.78 | |
Less distributions from: |
Net realized gains | | | — | | | | (4.10 | ) | | | (15.50 | ) | | | — | | | | — | |
Total distributions | | | — | | | | (4.10 | ) | | | (15.50 | ) | | | — | | | | — | |
Net asset value, end of period | | $ | 173.71 | | | $ | 93.70 | | | $ | 106.51 | | | $ | 113.84 | | | $ | 87.18 | |
|
Total Return | | | 85.39 | % | | | (8.49 | %) | | | 9.12 | % | | | 30.59 | % | | | 22.09 | % |
Ratios/Supplemental Data |
Net assets, end of period (in thousands) | | $ | 1,067 | | | $ | 825 | | | $ | 9,880 | | | $ | 28,889 | | | $ | 2,384 | |
Ratios to average net assets: |
Net investment income (loss) | | | (1.42 | %) | | | (1.30 | %) | | | (1.27 | %) | | | (1.04 | %) | | | (1.03 | %) |
Total expenses | | | 1.76 | % | | | 1.71 | % | | | 1.70 | % | | | 1.63 | % | | | 1.62 | % |
Portfolio turnover rate | | | 284 | % | | | 359 | % | | | 349 | % | | | 305 | % | | | 518 | % |
a | Net investment income (loss) per share was computed using average shares outstanding throughout the period. |
b | Total return does not reflect the impact of any applicable sales charges. |
SEE NOTES TO FINANCIAL STATEMENTS. | THE RYDEX FUNDS ANNUAL REPORT | 91 |
PERFORMANCE REPORT AND FUND PROFILE (Unaudited) | March 31, 2021 |
LEISURE FUND
OBJECTIVE: Seeks to provide capital appreciation by investing in companies engaged in leisure and entertainment businesses (“Leisure Companies”).
For the one-year period ended March 31, 2021, Leisure Fund Investor Class returned 90.42%, compared with 70.29% for the S&P 500 Consumer Discretionary Index. The broader S&P 500 Index returned 56.35%.
All industries contributed to return, led by restaurants, movies & entertainment, and casinos & gaming.
Walt Disney Co., Sea Ltd. ADR, and Comcast Corp. - Class A contributed the most to the Fund’s return for the period. Luckin Coffee, Inc. ADR - Class A and Cable One, Inc. detracted the most from return.
Performance displayed represents past performance, which is no guarantee of future results.
Holdings Diversification (Market Exposure as % of Net Assets)
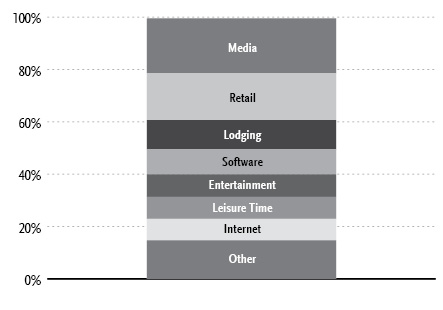
“Holdings Diversification (Market Exposure as % of Net Assets)” excludes any temporary cash investments.
Inception Dates: |
Investor Class | April 1, 1998 |
A-Class | September 1, 2004 |
C-Class | May 3, 2001 |
H-Class | June 3, 1998 |
Ten Largest Holdings (% of Total Net Assets) |
Walt Disney Co. | 4.4% |
Comcast Corp. — Class A | 3.8% |
Netflix, Inc. | 3.8% |
McDonald’s Corp. | 3.2% |
Charter Communications, Inc. — Class A | 3.0% |
Philip Morris International, Inc. | 2.9% |
Starbucks Corp. | 2.8% |
Altria Group, Inc. | 2.4% |
Activision Blizzard, Inc. | 2.1% |
Sea Ltd. ADR | 1.7% |
Top Ten Total | 30.1% |
| | |
“Ten Largest Holdings” excludes any temporary cash investments. |
92 | THE RYDEX FUNDS ANNUAL REPORT | |
PERFORMANCE REPORT AND FUND PROFILE (Unaudited)(concluded) | March 31, 2021 |
Cumulative Fund Performance*
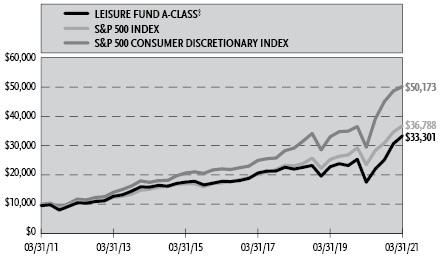
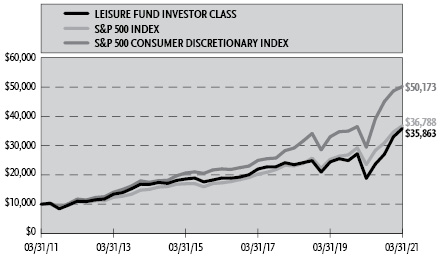
Average Annual Returns*
Periods Ended March 31, 2021
| 1 Year | 5 Year | 10 Year |
Investor Class Shares | 90.42% | 13.61% | 13.62% |
A-Class Shares | 89.96% | 13.33% | 13.33% |
A-Class Shares with sales charge‡ | 80.94% | 12.23% | 12.78% |
C-Class Shares | 88.52% | 12.48% | 12.49% |
C-Class Shares with CDSC§ | 87.52% | 12.48% | 12.49% |
H-Class Shares** | 89.96% | 13.33% | 13.22% |
S&P 500 Consumer Discretionary Index | 70.29% | 17.87% | 17.50% |
S&P 500 Index | 56.35% | 16.29% | 13.91% |
* | The performance data above represents past performance that is not predictive of future results. The investment return and principal value of an investment in the Fund will fluctuate so that an investor’s shares, when redeemed, may be worth more or less than their original cost. Returns are historical and include changes in principal and reinvested dividends and capital gains and do not reflect the effect of taxes. The S&P 500 Index and the S&P 500 Consumer Discretionary Index are unmanaged indices and, unlike the Fund, have no management fees or operating expenses to reduce their reported returns. The graphs are based on Investor Class shares and A-Class shares only; performance for C-Class and H-Class shares will vary due to differences in fee structures. |
** | Effective September 30, 2015, the Fund’s Advisor Class shares were converted into H-Class shares. |
‡ | Fund returns are calculated using the maximum sales charge of 4.75%. |
§ | Fund returns include a CDSC of 1% if redeemed within 12 months of purchase. |
| | THE RYDEX FUNDS ANNUAL REPORT | 93 |
SCHEDULE OF INVESTMENTS | March 31, 2021 |
LEISURE FUND | |
| | Shares | | | Value | |
COMMON STOCKS† - 99.6% |
| | | | | | | | | |
Media - 21.0% |
Walt Disney Co.* | | | 12,619 | | | $ | 2,328,458 | |
Comcast Corp. — Class A | | | 37,210 | | | | 2,013,433 | |
Charter Communications, Inc. — Class A* | | | 2,571 | | | | 1,586,358 | |
Liberty Broadband Corp. — Class C* | | | 4,628 | | | | 694,894 | |
DISH Network Corp. — Class A* | | | 15,363 | | | | 556,141 | |
Fox Corp. — Class A | | | 15,051 | | | | 543,492 | |
Discovery, Inc. — Class A*,1 | | | 11,556 | | | | 502,224 | |
Altice USA, Inc. — Class A* | | | 15,383 | | | | 500,409 | |
News Corp. — Class A | | | 18,935 | | | | 481,517 | |
ViacomCBS, Inc. — Class B | | | 10,399 | | | | 468,995 | |
Cable One, Inc. | | | 239 | | | | 436,978 | |
New York Times Co. — Class A | | | 7,625 | | | | 385,977 | |
Nexstar Media Group, Inc. — Class A | | | 2,168 | | | | 304,452 | |
World Wrestling Entertainment, Inc. — Class A | | | 4,846 | | | | 262,944 | |
Total Media | | | | | | | 11,066,272 | |
| | | | | | | | | |
Retail - 17.9% |
McDonald’s Corp. | | | 7,516 | | | | 1,684,636 | |
Starbucks Corp. | | | 13,585 | | | | 1,484,433 | |
Chipotle Mexican Grill, Inc. — Class A* | | | 573 | | | | 814,130 | |
Yum! Brands, Inc. | | | 6,834 | | | | 739,302 | |
Darden Restaurants, Inc. | | | 3,963 | | | | 562,746 | |
Yum China Holdings, Inc. | | | 8,983 | | | | 531,883 | |
Domino’s Pizza, Inc. | | | 1,343 | | | | 493,942 | |
Restaurant Brands International, Inc. | | | 7,258 | | | | 471,770 | |
Texas Roadhouse, Inc. — Class A* | | | 3,501 | | | | 335,886 | |
Shake Shack, Inc. — Class A* | | | 2,440 | | | | 275,159 | |
Wendy’s Co. | | | 13,563 | | | | 274,786 | |
Cracker Barrel Old Country Store, Inc. | | | 1,538 | | | | 265,890 | |
Wingstop, Inc. | | | 1,978 | | | | 251,542 | |
Brinker International, Inc.* | | | 3,210 | | | | 228,103 | |
Papa John’s International, Inc. | | | 2,534 | | | | 224,614 | |
Cheesecake Factory, Inc.* | | | 3,598 | | | | 210,519 | |
Dave & Buster’s Entertainment, Inc.* | | | 4,201 | | | | 201,228 | |
Jack in the Box, Inc. | | | 1,831 | | | | 201,007 | |
Bloomin’ Brands, Inc.* | | | 7,336 | | | | 198,439 | |
Total Retail | | | | | | | 9,450,015 | |
| | | | | | | | | |
Lodging - 11.2% |
Marriott International, Inc. — Class A* | | | 5,961 | | | | 882,884 | |
Las Vegas Sands Corp.* | | | 14,112 | | | | 857,445 | |
Hilton Worldwide Holdings, Inc.* | | | 6,107 | | | | 738,459 | |
MGM Resorts International | | | 14,542 | | | | 552,451 | |
Wynn Resorts Ltd.* | | | 3,793 | | | | 475,528 | |
Huazhu Group Ltd. ADR* | | | 6,981 | | | | 383,257 | |
Melco Resorts & Entertainment Ltd. ADR* | | | 19,244 | | | | 383,148 | |
Hyatt Hotels Corp. — Class A* | | | 4,426 | | | | 366,030 | |
Wyndham Hotels & Resorts, Inc. | | | 4,785 | | | | 333,897 | |
Boyd Gaming Corp.* | | | 5,569 | | | | 328,348 | |
Choice Hotels International, Inc.* | | | 2,904 | | | | 311,570 | |
Travel + Leisure Co. | | | 4,745 | | | | 290,204 | |
Total Lodging | | | | | | | 5,903,221 | |
| | | | | | | | | |
Software - 9.6% |
Activision Blizzard, Inc. | | | 12,087 | | | | 1,124,091 | |
Sea Ltd. ADR* | | | 4,118 | | | | 919,261 | |
Electronic Arts, Inc. | | | 6,155 | | | | 833,202 | |
NetEase, Inc. ADR | | | 6,411 | | | | 662,000 | |
Bilibili, Inc. ADR* | | | 5,749 | | | | 615,488 | |
Take-Two Interactive Software, Inc.* | | | 3,404 | | | | 601,487 | |
HUYA, Inc. ADR*,1 | | | 17,276 | | | | 336,537 | |
Total Software | | | | | | | 5,092,066 | |
| | | | | | | | | |
Entertainment - 8.6% |
DraftKings, Inc. — Class A* | | | 9,963 | | | | 611,031 | |
Live Nation Entertainment, Inc.* | | | 6,471 | | | | 547,770 | |
Caesars Entertainment, Inc.* | | | 6,227 | | | | 544,551 | |
Penn National Gaming, Inc.* | | | 4,853 | | | | 508,789 | |
Vail Resorts, Inc.* | | | 1,470 | | | | 428,740 | |
Churchill Downs, Inc. | | | 1,655 | | | | 376,380 | |
Marriott Vacations Worldwide Corp.* | | | 1,958 | | | | 341,045 | |
Madison Square Garden Sports Corp. — Class A* | | | 1,444 | | | | 259,140 | |
SeaWorld Entertainment, Inc.* | | | 5,140 | | | | 255,304 | |
Six Flags Entertainment Corp.* | | | 5,424 | | | | 252,053 | |
Scientific Games Corp. — Class A* | | | 6,140 | | | | 236,513 | |
Cinemark Holdings, Inc.* | | | 9,218 | | | | 188,139 | |
Total Entertainment | | | | | | | 4,549,455 | |
| | | | | | | | | |
Leisure Time - 8.4% |
Peloton Interactive, Inc. — Class A* | | | 6,963 | | | | 782,920 | |
Carnival Corp.* | | | 25,199 | | | | 668,781 | |
Royal Caribbean Cruises Ltd.* | | | 6,970 | | | | 596,702 | |
Norwegian Cruise Line Holdings Ltd.*,1 | | | 14,657 | | | | 404,387 | |
Polaris, Inc. | | | 2,789 | | | | 372,331 | |
Brunswick Corp. | | | 3,621 | | | | 345,335 | |
Harley-Davidson, Inc. | | | 8,469 | | | | 339,607 | |
Planet Fitness, Inc. — Class A* | | | 4,262 | | | | 329,452 | |
YETI Holdings, Inc.* | | | 4,489 | | | | 324,151 | |
Callaway Golf Co. | | | 10,318 | | | | 276,006 | |
Total Leisure Time | | | | | | | 4,439,672 | |
| | | | | | | | | |
Internet - 8.2% |
Netflix, Inc.* | | | 3,851 | | | | 2,008,913 | |
Roku, Inc.* | | | 2,523 | | | | 821,918 | |
Spotify Technology S.A.* | | | 2,635 | | | | 706,048 | |
Tencent Music Entertainment Group ADR* | | | 22,642 | | | | 463,934 | |
iQIYI, Inc. ADR* | | | 20,711 | | | | 344,217 | |
Total Internet | | | | | | | 4,345,030 | |
| | | | | | | | | |
Beverages - 6.4% |
Constellation Brands, Inc. — Class A | | | 3,778 | | | | 861,384 | |
Brown-Forman Corp. — Class B | | | 10,557 | | | | 728,116 | |
Boston Beer Company, Inc. — Class A* | | | 452 | | | | 545,239 | |
Molson Coors Beverage Co. — Class B* | | | 8,681 | | | | 444,033 | |
Anheuser-Busch InBev S.A. ADR | | | 6,892 | | | | 433,162 | |
Diageo plc ADR | | | 2,335 | | | | 383,430 | |
Total Beverages | | | | | | | 3,395,364 | |
| | | | | | | | | |
94 | THE RYDEX FUNDS ANNUAL REPORT | SEE NOTES TO FINANCIAL STATEMENTS. |
SCHEDULE OF INVESTMENTS (continued) | March 31, 2021 |
LEISURE FUND | |
| | Shares | | | Value | |
Agriculture - 6.0% |
Philip Morris International, Inc. | | | 17,038 | | | $ | 1,511,952 | |
Altria Group, Inc. | | | 24,910 | | | | 1,274,396 | |
British American Tobacco plc ADR | | | 10,177 | | | | 394,257 | |
Total Agriculture | | | | | | | 3,180,605 | |
| | | | | | | | | |
Toys, Games & Hobbies - 1.5% |
Hasbro, Inc. | | | 4,931 | | | | 473,968 | |
Mattel, Inc.* | | | 16,819 | | | | 335,034 | |
Total Toys, Games & Hobbies | | | | | | | 809,002 | |
| | | | | | | | | |
Food Service - 0.8% |
Aramark | | | 10,318 | | | | 389,814 | |
| | | | | | | | | |
Total Common Stocks | | | | |
(Cost $43,408,392) | | | | | | | 52,620,516 | |
| | | | | | | | | |
RIGHTS††† - 0.0% |
Media - 0.0% |
Nexstar Media Group, Inc.* | | | 8,160 | | | | — | |
Total Rights | | | | |
(Cost $—) | | | | | | | — | |
| | | | | | | | | |
| | Face
Amount | | | | |
REPURCHASE AGREEMENTS††,2 - 0.6% |
J.P. Morgan Securities LLC
issued 03/31/21 at 0.01%
due 04/01/21 | | $ | 158,082 | | | | 158,082 | |
Barclays Capital, Inc.
issued 03/31/21 at 0.01%
due 04/01/21 | | | 71,872 | | | | 71,872 | |
BofA Securities, Inc.
issued 03/31/21 at 0.01%
due 04/01/21 | | | 65,594 | | | | 65,594 | |
Total Repurchase Agreements | | | | |
(Cost $295,548) | | | | | | | 295,548 | |
| | | | | | | | | |
| | | Shares | | | | | |
SECURITIES LENDING COLLATERAL†,3 - 1.7% |
Money Market Fund | | | | | | | | |
First American Government Obligations Fund — Class Z, 0.03%4 | | | 883,846 | | | | 883,846 | |
Total Securities Lending Collateral | | | | |
(Cost $883,846) | | | | | | | 883,846 | |
| | | | | | | | | |
Total Investments - 101.9% | | | | |
(Cost $44,587,786) | | $ | 53,799,910 | |
Other Assets & Liabilities, net - (1.9)% | | | (977,941 | ) |
Total Net Assets - 100.0% | | $ | 52,821,969 | |
* | Non-income producing security. |
† | Value determined based on Level 1 inputs — See Note 4. |
†† | Value determined based on Level 2 inputs — See Note 4. |
††† | Value determined based on Level 3 inputs — See Note 4. |
1 | All or a portion of this security is on loan at March 31, 2021 — See Note 7. |
2 | Repurchase Agreements — See Note 6. |
3 | Securities lending collateral — See Note 7. |
4 | Rate indicated is the 7-day yield as of March 31, 2021. |
| | ADR — American Depositary Receipt |
| | plc — Public Limited Company |
| | |
| | See Sector Classification in Other Information section. |
SEE NOTES TO FINANCIAL STATEMENTS. | THE RYDEX FUNDS ANNUAL REPORT | 95 |
SCHEDULE OF INVESTMENTS (concluded) | March 31, 2021 |
LEISURE FUND | |
The following table summarizes the inputs used to value the Fund’s investments at March 31, 2021 (See Note 4 in the Notes to Financial Statements):
Investments in Securities (Assets) | | Level 1
Quoted
Prices | | | Level 2
Significant
Observable
Inputs | | | Level 3
Significant
Unobservable
Inputs | | | Total | |
Common Stocks | | $ | 52,620,516 | | | $ | — | | | $ | — | | | $ | 52,620,516 | |
Rights | | | — | | | | — | | | | — | * | | | — | |
Repurchase Agreements | | | — | | | | 295,548 | | | | — | | | | 295,548 | |
Securities Lending Collateral | | | 883,846 | | | | — | | | | — | | | | 883,846 | |
Total Assets | | $ | 53,504,362 | | | $ | 295,548 | | | $ | — | | | $ | 53,799,910 | |
* | Security has a market value of $0. |
96 | THE RYDEX FUNDS ANNUAL REPORT | SEE NOTES TO FINANCIAL STATEMENTS. |
STATEMENT OF ASSETS AND LIABILITIES |
March 31, 2021 |
Assets: |
Investments, at value - including $866,939 of securities loaned (cost $44,292,238) | | $ | 53,504,362 | |
Repurchase agreements, at value (cost $295,548) | | | 295,548 | |
Cash | | | 93 | |
Receivables: |
Dividends | | | 64,238 | |
Fund shares sold | | | 57,424 | |
Securities lending income | | | 805 | |
Total assets | | | 53,922,470 | |
| | | | | |
Liabilities: |
Payable for: |
Return of securities lending collateral | | | 883,846 | |
Fund shares redeemed | | | 106,386 | |
Management fees | | | 36,769 | |
Transfer agent and administrative fees | | | 11,636 | |
Portfolio accounting fees | | | 4,326 | |
Distribution and service fees | | | 2,419 | |
Trustees’ fees* | | | 776 | |
Miscellaneous | | | 54,343 | |
Total liabilities | | | 1,100,501 | |
Commitments and contingent liabilities (Note 10) | | | — | |
Net assets | | $ | 52,821,969 | |
| | | | | |
Net assets consist of: |
Paid in capital | | $ | 43,615,666 | |
Total distributable earnings (loss) | | | 9,206,303 | |
Net assets | | $ | 52,821,969 | |
| | | | | |
Investor Class: |
Net assets | | $ | 40,995,319 | |
Capital shares outstanding | | | 406,128 | |
Net asset value per share | | $ | 100.94 | |
| | | | | |
A-Class: |
Net assets | | $ | 4,290,760 | |
Capital shares outstanding | | | 46,660 | |
Net asset value per share | | $ | 91.96 | |
Maximum offering price per share (Net asset value divided by 95.25%) | | $ | 96.55 | |
| | | | | |
C-Class: |
Net assets | | $ | 941,658 | |
Capital shares outstanding | | | 11,769 | |
Net asset value per share | | $ | 80.01 | |
| | | | | |
H-Class: |
Net assets | | $ | 6,594,232 | |
Capital shares outstanding | | | 73,845 | |
Net asset value per share | | $ | 89.30 | |
STATEMENT OF OPERATIONS |
Year Ended March 31, 2021 |
Investment Income: |
Dividends (net of foreign withholding tax of $1,474) | | $ | 209,211 | |
Interest | | | 53 | |
Income from securities lending, net | | | 4,526 | |
Total investment income | | | 213,790 | |
| | | | | |
Expenses: |
Management fees | | | 173,751 | |
Distribution and service fees: |
A-Class | | | 5,668 | |
C-Class | | | 7,232 | |
H-Class | | | 4,432 | |
Transfer agent and administrative fees | | | 56,189 | |
Portfolio accounting fees | | | 20,444 | |
Professional fees | | | 5,945 | |
Custodian fees | | | 2,924 | |
Trustees’ fees* | | | 2,085 | |
Line of credit fees | | | 12 | |
Miscellaneous | | | 27,863 | |
Total expenses | | | 306,545 | |
Net investment loss | | | (92,755 | ) |
| | | | | |
Net Realized and Unrealized Gain (Loss): |
Net realized gain (loss) on: |
Investments | | | 1,161,961 | |
Net realized gain | | | 1,161,961 | |
Net change in unrealized appreciation (depreciation) on: |
Investments | | | 9,340,921 | |
Net change in unrealized appreciation (depreciation) | | | 9,340,921 | |
Net realized and unrealized gain | | | 10,502,882 | |
Net increase in net assets resulting from operations | | $ | 10,410,127 | |
* | Relates to Trustees not deemed “interested persons” within the meaning of Section 2(a)(19) of the 1940 Act. |
SEE NOTES TO FINANCIAL STATEMENTS. | THE RYDEX FUNDS ANNUAL REPORT | 97 |
STATEMENTS OF CHANGES IN NET ASSETS |
| | Year Ended
March 31,
2021 | | | Year Ended
March 31,
2020 | |
Increase (Decrease) in Net Assets from Operations: | | | | | | | | |
Net investment income (loss) | | $ | (92,755 | ) | | $ | 8,139 | |
Net realized gain on investments | | | 1,161,961 | | | | 2,615,962 | |
Net change in unrealized appreciation (depreciation) on investments | | | 9,340,921 | | | | (4,127,911 | ) |
Net increase (decrease) in net assets resulting from operations | | | 10,410,127 | | | | (1,503,810 | ) |
| | | | | | | | | |
Distributions to shareholders: | | | | | | | | |
Investor Class | | | — | | | | (32,961 | ) |
A-Class | | | — | | | | (2,491 | ) |
C-Class | | | — | | | | (1,724 | ) |
H-Class | | | — | | | | (3,983 | ) |
Total distributions to shareholders | | | — | | | | (41,159 | ) |
| | | | | | | | | |
Capital share transactions: | | | | | | | | |
Proceeds from sale of shares | | | | | | | | |
Investor Class | | | 59,053,794 | | | | 42,468,953 | |
A-Class | | | 3,714,091 | | | | 2,130,439 | |
C-Class | | | 440,559 | | | | 73,859 | |
H-Class | | | 5,697,588 | | | | 14,647,439 | |
Distributions reinvested | | | | | | | | |
Investor Class | | | — | | | | 32,394 | |
A-Class | | | — | | | | 2,404 | |
C-Class | | | — | | | | 1,724 | |
H-Class | | | — | | | | 3,946 | |
Cost of shares redeemed | | | | | | | | |
Investor Class | | | (28,790,117 | ) | | | (50,743,318 | ) |
A-Class | | | (1,430,431 | ) | | | (2,347,132 | ) |
C-Class | | | (322,704 | ) | | | (372,260 | ) |
H-Class | | | (980,605 | ) | | | (14,108,477 | ) |
Net increase (decrease) from capital share transactions | | | 37,382,175 | | | | (8,210,029 | ) |
Net increase (decrease) in net assets | | | 47,792,302 | | | | (9,754,998 | ) |
| | | | | | | | | |
Net assets: | | | | | | | | |
Beginning of year | | | 5,029,667 | | | | 14,784,665 | |
End of year | | $ | 52,821,969 | | | $ | 5,029,667 | |
| | | | | | | | | |
Capital share activity: | | | | | | | | |
Shares sold | | | | | | | | |
Investor Class | | | 743,762 | | | | 587,907 | |
A-Class | | | 48,208 | | | | 33,729 | |
C-Class | | | 7,182 | | | | 1,552 | |
H-Class | | | 67,082 | | | | 226,956 | |
Shares issued from reinvestment of distributions | | | | | | | | |
Investor Class | | | — | | | | 440 | |
A-Class | | | — | | | | 36 | |
C-Class | | | — | | | | 29 | |
H-Class | | | — | | | | 60 | |
Shares redeemed | | | | | | | | |
Investor Class | | | (391,183 | ) | | | (704,990 | ) |
A-Class | | | (18,411 | ) | | | (35,774 | ) |
C-Class | | | (4,799 | ) | | | (6,497 | ) |
H-Class | | | (14,000 | ) | | | (223,449 | ) |
Net increase (decrease) in shares | | | 437,841 | | | | (120,001 | ) |
98 | THE RYDEX FUNDS ANNUAL REPORT | SEE NOTES TO FINANCIAL STATEMENTS. |
This table is presented to show selected data for a share outstanding throughout each period and to assist shareholders in evaluating a Fund’s performance for the periods presented.
Investor Class | | Year Ended
March 31,
2021 | | | Year Ended
March 31,
2020 | | | Year Ended
March 31,
2019 | | | Year Ended
March 29,
2018 | | | Year Ended
March 31,
2017 | |
Per Share Data |
Net asset value, beginning of period | | $ | 53.01 | | | $ | 68.98 | | | $ | 71.23 | | | $ | 70.95 | | | $ | 61.36 | |
Income (loss) from investment operations: |
Net investment income (loss)a | | | (.34 | ) | | | .08 | | | | .32 | | | | .36 | | | | .52 | |
Net gain (loss) on investments (realized and unrealized) | | | 48.27 | | | | (15.86 | ) | | | 2.18 | | | | 4.48 | | | | 9.38 | |
Total from investment operations | | | 47.93 | | | | (15.78 | ) | | | 2.50 | | | | 4.84 | | | | 9.90 | |
Less distributions from: |
Net investment income | | | — | | | | (.19 | ) | | | (.52 | ) | | | (1.64 | ) | | | (.31 | ) |
Net realized gains | | | — | | | | — | | | | (4.23 | ) | | | (2.92 | ) | | | — | |
Total distributions | | | — | | | | (.19 | ) | | | (4.75 | ) | | | (4.56 | ) | | | (.31 | ) |
Net asset value, end of period | | $ | 100.94 | | | $ | 53.01 | | | $ | 68.98 | | | $ | 71.23 | | | $ | 70.95 | |
|
Total Return | | | 90.42 | % | | | (22.96 | %) | | | 4.06 | % | | | 6.71 | % | | | 16.20 | % |
Ratios/Supplemental Data |
Net assets, end of period (in thousands) | | $ | 40,995 | | | $ | 2,839 | | | $ | 11,739 | | | $ | 14,625 | | | $ | 14,413 | |
Ratios to average net assets: |
Net investment income (loss) | | | (0.39 | %) | | | 0.11 | % | | | 0.45 | % | | | 0.49 | % | | | 0.81 | % |
Total expenses | | | 1.41 | % | | | 1.48 | % | | | 1.46 | % | | | 1.38 | % | | | 1.38 | % |
Portfolio turnover rate | | | 144 | % | | | 369 | % | | | 323 | % | | | 442 | % | | | 352 | % |
A-Class | | Year Ended
March 31,
2021 | | | Year Ended
March 31,
2020 | | | Year Ended
March 31,
2019 | | | Year Ended
March 29,
2018 | | | Year Ended
March 31,
2017 | |
Per Share Data |
Net asset value, beginning of period | | $ | 48.41 | | | $ | 63.17 | | | $ | 65.82 | | | $ | 66.03 | | | $ | 57.27 | |
Income (loss) from investment operations: |
Net investment income (loss)a | | | (.41 | ) | | | .01 | | | | .11 | | | | .17 | | | | .23 | |
Net gain (loss) on investments (realized and unrealized) | | | 43.96 | | | | (14.58 | ) | | | 1.99 | | | | 4.18 | | | | 8.84 | |
Total from investment operations | | | 43.55 | | | | (14.57 | ) | | | 2.10 | | | | 4.35 | | | | 9.07 | |
Less distributions from: |
Net investment income | | | — | | | | (.19 | ) | | | (.52 | ) | | | (1.64 | ) | | | (.31 | ) |
Net realized gains | | | — | | | | — | | | | (4.23 | ) | | | (2.92 | ) | | | — | |
Total distributions | | | — | | | | (.19 | ) | | | (4.75 | ) | | | (4.56 | ) | | | (.31 | ) |
Net asset value, end of period | | $ | 91.96 | | | $ | 48.41 | | | $ | 63.17 | | | $ | 65.82 | | | $ | 66.03 | |
|
Total Returnb | | | 89.96 | % | | | (23.15 | %) | | | 3.79 | % | | | 6.46 | % | | | 15.91 | % |
Ratios/Supplemental Data |
Net assets, end of period (in thousands) | | $ | 4,291 | | | $ | 816 | | | $ | 1,192 | | | $ | 3,371 | | | $ | 2,180 | |
Ratios to average net assets: |
Net investment income (loss) | | | (0.56 | %) | | | 0.02 | % | | | 0.17 | % | | | 0.24 | % | | | 0.40 | % |
Total expenses | | | 1.68 | % | | | 1.73 | % | | | 1.71 | % | | | 1.63 | % | | | 1.62 | % |
Portfolio turnover rate | | | 144 | % | | | 369 | % | | | 323 | % | | | 442 | % | | | 352 | % |
SEE NOTES TO FINANCIAL STATEMENTS. | THE RYDEX FUNDS ANNUAL REPORT | 99 |
FINANCIAL HIGHLIGHTS (concluded) |
This table is presented to show selected data for a share outstanding throughout each period and to assist shareholders in evaluating a Fund’s performance for the periods presented.
C-Class | | Year Ended
March 31,
2021 | | | Year Ended
March 31,
2020 | | | Year Ended
March 31,
2019 | | | Year Ended
March 29,
2018 | | | Year Ended
March 31,
2017 | |
Per Share Data |
Net asset value, beginning of period | | $ | 42.44 | | | $ | 55.82 | | | $ | 59.16 | | | $ | 60.23 | | | $ | 52.65 | |
Income (loss) from investment operations: |
Net investment income (loss)a | | | (.87 | ) | | | (.42 | ) | | | (.32 | ) | | | (.36 | ) | | | (.18 | ) |
Net gain (loss) on investments (realized and unrealized) | | | 38.44 | | | | (12.77 | ) | | | 1.73 | | | | 3.85 | | | | 8.07 | |
Total from investment operations | | | 37.57 | | | | (13.19 | ) | | | 1.41 | | | | 3.49 | | | | 7.89 | |
Less distributions from: |
Net investment income | | | — | | | | (.19 | ) | | | (.52 | ) | | | (1.64 | ) | | | (.31 | ) |
Net realized gains | | | — | | | | — | | | | (4.23 | ) | | | (2.92 | ) | | | — | |
Total distributions | | | — | | | | (.19 | ) | | | (4.75 | ) | | | (4.56 | ) | | | (.31 | ) |
Net asset value, end of period | | $ | 80.01 | | | $ | 42.44 | | | $ | 55.82 | | | $ | 59.16 | | | $ | 60.23 | |
|
Total Returnb | | | 88.52 | % | | | (23.73 | %) | | | 3.03 | % | | | 5.66 | % | | | 15.05 | % |
Ratios/Supplemental Data |
Net assets, end of period (in thousands) | | $ | 942 | | | $ | 398 | | | $ | 798 | | | $ | 1,311 | | | $ | 1,327 | |
Ratios to average net assets: |
Net investment income (loss) | | | (1.36 | %) | | | (0.74 | %) | | | (0.56 | %) | | | (0.58 | %) | | | (0.33 | %) |
Total expenses | | | 2.44 | % | | | 2.48 | % | | | 2.46 | % | | | 2.38 | % | | | 2.37 | % |
Portfolio turnover rate | | | 144 | % | | | 369 | % | | | 323 | % | | | 442 | % | | | 352 | % |
H-Class | | Year Ended
March 31,
2021 | | | Year Ended
March 31,
2020 | | | Year Ended
March 31,
2019 | | | Year Ended
March 29,
2018 | | | Year Ended
March 31,
2017 | |
Per Share Data |
Net asset value, beginning of period | | $ | 47.01 | | | $ | 61.36 | | | $ | 64.06 | | | $ | 64.38 | | | $ | 55.85 | |
Income (loss) from investment operations: |
Net investment income (loss)a | | | (.40 | ) | | | (.01 | ) | | | (.29 | ) | | | .07 | | | | .20 | |
Net gain (loss) on investments (realized and unrealized) | | | 42.69 | | | | (14.15 | ) | | | 2.34 | | | | 4.17 | | | | 8.64 | |
Total from investment operations | | | 42.29 | | | | (14.16 | ) | | | 2.05 | | | | 4.24 | | | | 8.84 | |
Less distributions from: |
Net investment income | | | — | | | | (.19 | ) | | | (.52 | ) | | | (1.64 | ) | | | (.31 | ) |
Net realized gains | | | — | | | | — | | | | (4.23 | ) | | | (2.92 | ) | | | — | |
Total distributions | | | — | | | | (.19 | ) | | | (4.75 | ) | | | (4.56 | ) | | | (.31 | ) |
Net asset value, end of period | | $ | 89.30 | | | $ | 47.01 | | | $ | 61.36 | | | $ | 64.06 | | | $ | 64.38 | |
|
Total Return | | | 89.96 | % | | | (23.17 | %) | | | 3.81 | % | | | 6.45 | % | | | 15.90 | % |
Ratios/Supplemental Data |
Net assets, end of period (in thousands) | | $ | 6,594 | | | $ | 976 | | | $ | 1,055 | | | $ | 1,910 | | | $ | 3,769 | |
Ratios to average net assets: |
Net investment income (loss) | | | (0.55 | %) | | | (0.01 | %) | | | (0.45 | %) | | | 0.10 | % | | | 0.34 | % |
Total expenses | | | 1.68 | % | | | 1.72 | % | | | 1.69 | % | | | 1.63 | % | | | 1.63 | % |
Portfolio turnover rate | | | 144 | % | | | 369 | % | | | 323 | % | | | 442 | % | | | 352 | % |
a | Net investment income (loss) per share was computed using average shares outstanding throughout the period. |
b | Total return does not reflect the impact of any applicable sales charges. |
100 | THE RYDEX FUNDS ANNUAL REPORT | SEE NOTES TO FINANCIAL STATEMENTS. |
PERFORMANCE REPORT AND FUND PROFILE (Unaudited) | March 31, 2021 |
PRECIOUS METALS FUND
OBJECTIVE: Seeks to provide capital appreciation by investing in U.S. and foreign companies that are involved in the precious metals sector, including exploration, mining, production and development, and other precious metals-related services (“Precious Metals Companies”).
For the one-year period ended March 31, 2021, Precious Metals Fund Investor Class returned 68.71%, compared with 78.29% for the S&P 500 Materials Index. The broader S&P 500 Index returned 56.35%.
The gold industry was the leading contributor to return, followed by the silver and copper industries. Precious metals & minerals segment was the only detractor from return.
Freeport-McMoRan, Inc., Newmont Corp., and Sibanye Stillwater Ltd. ADR contributed the most to the Fund’s return for the period. Equinox Gold Corp., New Gold, Inc., and SilverCrest Metals, Inc. detracted the most from return.
Performance displayed represents past performance, which is no guarantee of future results.
Holdings Diversification (Market Exposure as % of Net Assets)
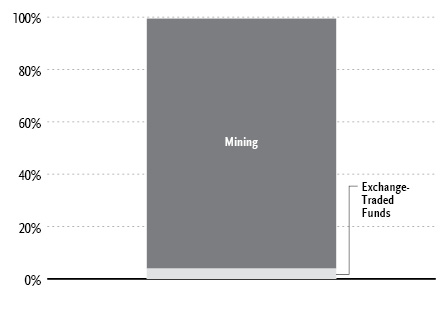
“Holdings Diversification (Market Exposure as % of Net Assets)” excludes any temporary cash investments.
Inception Dates: |
Investor Class | December 1, 1993 |
A-Class | September 1, 2004 |
C-Class | April 27, 2001 |
H-Class | August 1, 2003 |
Ten Largest Holdings (% of Total Net Assets) |
Newmont Corp. | 7.9% |
Freeport-McMoRan, Inc. | 7.7% |
Barrick Gold Corp. | 6.7% |
Franco-Nevada Corp. | 5.7% |
Wheaton Precious Metals Corp. | 4.7% |
Agnico Eagle Mines Ltd. | 4.2% |
Sibanye Stillwater Ltd. ADR | 4.1% |
VanEck Vectors Junior Gold Miners ETF | 3.9% |
AngloGold Ashanti Ltd. ADR | 3.5% |
Kirkland Lake Gold Ltd. | 3.4% |
Top Ten Total | 51.8% |
| | |
“Ten Largest Holdings” excludes any temporary cash investments. |
| | THE RYDEX FUNDS ANNUAL REPORT | 101 |
PERFORMANCE REPORT AND FUND PROFILE (Unaudited)(concluded) | March 31, 2021 |
Cumulative Fund Performance*

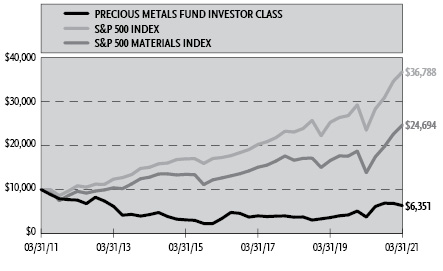
Average Annual Returns*
Periods Ended March 31, 2021
| 1 Year | 5 Year | 10 Year |
Investor Class Shares | 68.71% | 13.24% | (4.44%) |
A-Class Shares | 68.28% | 12.95% | (4.69%) |
A-Class Shares with sales charge‡ | 60.31% | 11.85% | (5.15%) |
C-Class Shares | 67.04% | 12.11% | (5.39%) |
C-Class Shares with CDSC§ | 66.04% | 12.11% | (5.39%) |
H-Class Shares** | 68.30% | 12.93% | (4.80%) |
S&P 500 Materials Index | 78.29% | 14.31% | 9.46% |
S&P 500 Index | 56.35% | 16.29% | 13.91% |
* | The performance data above represents past performance that is not predictive of future results. The investment return and principal value of an investment in the Fund will fluctuate so that an investor’s shares, when redeemed, may be worth more or less than their original cost. Returns are historical and include changes in principal and reinvested dividends and capital gains and do not reflect the effect of taxes. The S&P 500 Index and S&P 500 Materials Index are unmanaged indices and, unlike the Fund, have no management fees or operating expenses to reduce their reported returns. The graphs are based on Investor Class shares and A-Class shares only; performance for C-Class and H-Class shares will vary due to differences in fee structures. |
** | Effective September 30, 2015, the Fund’s Advisor Class shares were converted into H-Class shares. |
‡ | Fund returns are calculated using the maximum sales charge of 4.75%. |
§ | Fund returns include a CDSC of 1% if redeemed within 12 months of purchase. |
102 | THE RYDEX FUNDS ANNUAL REPORT | |
SCHEDULE OF INVESTMENTS | March 31, 2021 |
PRECIOUS METALS FUND | |
| | Shares | | | Value | |
COMMON STOCKS† - 95.6% |
| | | | | | | | | |
Mining - 95.6% |
Newmont Corp. | | | 144,743 | | | $ | 8,723,661 | |
Freeport-McMoRan, Inc. | | | 258,925 | | | | 8,526,400 | |
Barrick Gold Corp. | | | 372,547 | | | | 7,376,431 | |
Franco-Nevada Corp. | | | 50,204 | | | | 6,290,059 | |
Wheaton Precious Metals Corp. | | | 136,261 | | | | 5,206,533 | |
Agnico Eagle Mines Ltd. | | | 81,205 | | | | 4,694,461 | |
Sibanye Stillwater Ltd. ADR | | | 251,197 | | | | 4,486,378 | |
AngloGold Ashanti Ltd. ADR | | | 176,645 | | | | 3,880,891 | |
Kirkland Lake Gold Ltd. | | | 112,613 | | | | 3,806,319 | |
Gold Fields Ltd. ADR | | | 384,985 | | | | 3,653,508 | |
Kinross Gold Corp. | | | 547,280 | | | | 3,650,358 | |
Royal Gold, Inc. | | | 31,785 | | | | 3,420,702 | |
Pan American Silver Corp. | | | 101,149 | | | | 3,037,504 | |
B2Gold Corp. | | | 609,290 | | | | 2,626,040 | |
Yamana Gold, Inc. | | | 589,342 | | | | 2,557,744 | |
First Majestic Silver Corp.*,1 | | | 145,987 | | | | 2,274,477 | |
Alamos Gold, Inc. — Class A | | | 280,805 | | | | 2,193,087 | |
SSR Mining, Inc. | | | 152,221 | | | | 2,173,716 | |
Novagold Resources, Inc.* | | | 242,140 | | | | 2,121,146 | |
Hecla Mining Co. | | | 362,250 | | | | 2,061,202 | |
Harmony Gold Mining Company Ltd. ADR*,1 | | | 472,110 | | | | 2,058,400 | |
Coeur Mining, Inc.* | | | 199,438 | | | | 1,800,925 | |
Equinox Gold Corp.* | | | 218,409 | | | | 1,745,088 | |
Pretium Resources, Inc.* | | | 167,323 | | | | 1,735,140 | |
Osisko Gold Royalties Ltd. | | | 154,726 | | | | 1,705,081 | |
Eldorado Gold Corp.* | | | 154,899 | | | | 1,671,360 | |
MAG Silver Corp.* | | | 97,344 | | | | 1,461,133 | |
IAMGOLD Corp.* | | | 489,477 | | | | 1,458,641 | |
Sandstorm Gold Ltd.*,1 | | | 210,709 | | | | 1,432,821 | |
SilverCrest Metals, Inc.* | | | 168,260 | | | | 1,359,541 | |
Seabridge Gold, Inc.* | | | 82,246 | | | | 1,329,918 | |
Fortuna Silver Mines, Inc.*,1 | | | 202,822 | | | | 1,312,258 | |
New Gold, Inc.* | | | 793,383 | | | | 1,221,810 | |
Silvercorp Metals, Inc.1 | | | 231,866 | | | | 1,138,462 | |
Endeavour Silver Corp.* | | | 208,337 | | | | 1,033,352 | |
Gold Resource Corp. | | | 208,047 | | | | 549,244 | |
Total Mining | | | | | | | 105,773,791 | |
| | | | | | | | | |
Total Common Stocks | | | | |
(Cost $67,209,252) | | | | | | | 105,773,791 | |
| | | | | | | | | |
EXCHANGE-TRADED FUNDS† - 3.9% |
VanEck Vectors Junior Gold Miners ETF | | | 97,114 | | | | 4,371,101 | |
Total Exchange-Traded Funds | | | | |
(Cost $3,315,586) | | | | | | | 4,371,101 | |
| | | | | | | | | |
| | | Face
Amount | | | | | |
REPURCHASE AGREEMENTS††,2 - 0.7% |
J.P. Morgan Securities LLC
issued 03/31/21 at 0.01%
due 04/01/21 | | $ | 391,895 | | | | 391,895 | |
Barclays Capital, Inc.
issued 03/31/21 at 0.01%
due 04/01/21 | | | 178,174 | | | | 178,174 | |
BofA Securities, Inc.
issued 03/31/21 at 0.01%
due 04/01/21 | | | 162,612 | | | | 162,612 | |
Total Repurchase Agreements | | | | |
(Cost $732,681) | | | | | | | 732,681 | |
| | | | | | | | | |
| | | Shares | | | | | |
SECURITIES LENDING COLLATERAL†,3 - 2.1% |
Money Market Fund | | | | | | | | |
First American Government Obligations Fund — Class Z, 0.03%4 | | | 2,325,137 | | | | 2,325,137 | |
Total Securities Lending Collateral | | | | |
(Cost $2,325,137) | | | | | | | 2,325,137 | |
| | | | | | | | | |
Total Investments - 102.3% | | | | |
(Cost $73,582,656) | | $ | 113,202,710 | |
Other Assets & Liabilities, net - (2.3)% | | | (2,514,080 | ) |
Total Net Assets - 100.0% | | $ | 110,688,630 | |
* | Non-income producing security. |
† | Value determined based on Level 1 inputs — See Note 4. |
†† | Value determined based on Level 2 inputs — See Note 4. |
1 | All or a portion of this security is on loan at March 31, 2021 — See Note 7. |
2 | Repurchase Agreements — See Note 6. |
3 | Securities lending collateral — See Note 7. |
4 | Rate indicated is the 7-day yield as of March 31, 2021. |
| | ADR — American Depositary Receipt |
| | |
| | See Sector Classification in Other Information section. |
SEE NOTES TO FINANCIAL STATEMENTS. | THE RYDEX FUNDS ANNUAL REPORT | 103 |
SCHEDULE OF INVESTMENTS (concluded) | March 31, 2021 |
PRECIOUS METALS FUND | |
The following table summarizes the inputs used to value the Fund’s investments at March 31, 2021 (See Note 4 in the Notes to Financial Statements):
Investments in Securities (Assets) | | Level 1
Quoted
Prices | | | Level 2
Significant
Observable
Inputs | | | Level 3
Significant
Unobservable
Inputs | | | Total | |
Common Stocks | | $ | 105,773,791 | | | $ | — | | | $ | — | | | $ | 105,773,791 | |
Exchange-Traded Funds | | | 4,371,101 | | | | — | | | | — | | | | 4,371,101 | |
Repurchase Agreements | | | — | | | | 732,681 | | | | — | | | | 732,681 | |
Securities Lending Collateral | | | 2,325,137 | | | | — | | | | — | | | | 2,325,137 | |
Total Assets | | $ | 112,470,029 | | | $ | 732,681 | | | $ | — | | | $ | 113,202,710 | |
104 | THE RYDEX FUNDS ANNUAL REPORT | SEE NOTES TO FINANCIAL STATEMENTS. |
STATEMENT OF ASSETS AND LIABILITIES |
March 31, 2021 |
Assets: |
Investments, at value - including $2,346,682 of securities loaned (cost $72,849,975) | | $ | 112,470,029 | |
Repurchase agreements, at value (cost $732,681) | | | 732,681 | |
Cash | | | 11,333 | |
Receivables: |
Securities sold | | | 925,294 | |
Dividends | | | 320,750 | |
Fund shares sold | | | 227,514 | |
Foreign tax reclaims | | | 23,180 | |
Securities lending income | | | 5,377 | |
Total assets | | | 114,716,158 | |
| | | | | |
Liabilities: |
Payable for: |
Return of securities lending collateral | | | 2,325,137 | |
Fund shares redeemed | | | 1,188,965 | |
Deferred foreign capital gain taxes | | | 276,532 | |
Management fees | | | 71,454 | |
Transfer agent and administrative fees | | | 25,628 | |
Portfolio accounting fees | | | 9,527 | |
Distribution and service fees | | | 6,466 | |
Trustees’ fees* | | | 1,743 | |
Miscellaneous | | | 122,076 | |
Total liabilities | | | 4,027,528 | |
Commitments and contingent liabilities (Note 10) | | | — | |
Net assets | | $ | 110,688,630 | |
| | | | | |
Net assets consist of: |
Paid in capital | | $ | 130,150,605 | |
Total distributable earnings (loss) | | | (19,461,975 | ) |
Net assets | | $ | 110,688,630 | |
| | | | | |
Investor Class: |
Net assets | | $ | 87,173,578 | |
Capital shares outstanding | | | 1,971,486 | |
Net asset value per share | | $ | 44.22 | |
| | | | | |
A-Class: |
Net assets | | $ | 18,800,711 | |
Capital shares outstanding | | | 449,602 | |
Net asset value per share | | $ | 41.82 | |
Maximum offering price per share (Net asset value divided by 95.25%) | | $ | 43.91 | |
| | | | | |
C-Class: |
Net assets | | $ | 2,086,440 | |
Capital shares outstanding | | | 59,852 | |
Net asset value per share | | $ | 34.86 | |
| | | | | |
H-Class: |
Net assets | | $ | 2,627,901 | |
Capital shares outstanding | | | 65,035 | |
Net asset value per share | | $ | 40.41 | |
STATEMENT OF OPERATIONS |
Year Ended March 31, 2021 |
Investment Income: |
Dividends (net of foreign withholding tax of $169,905) | | $ | 1,308,810 | |
Interest | | | 503 | |
Income from securities lending, net | | | 38,736 | |
Total investment income | | | 1,348,049 | |
| | | | | |
Expenses: |
Management fees | | | 842,684 | |
Distribution and service fees: |
A-Class | | | 45,415 | |
C-Class | | | 24,349 | |
H-Class | | | 9,824 | |
Transfer agent and administrative fees | | | 314,160 | |
Portfolio accounting fees | | | 112,373 | |
Registration fees | | | 109,961 | |
Professional fees | | | 57,348 | |
Trustees’ fees* | | | 21,961 | |
Custodian fees | | | 16,322 | |
Line of credit fees | | | 106 | |
Miscellaneous | | | 29,923 | |
Total expenses | | | 1,584,426 | |
Net investment loss | | | (236,377 | ) |
| | | | | |
Net Realized and Unrealized Gain (Loss): |
Net realized gain (loss) on: |
Investments | | | 6,223,649 | |
Foreign currency transactions | | | (13 | ) |
Net realized gain | | | 6,223,636 | |
Net change in unrealized appreciation (depreciation) on: |
Investments | | | 30,242,553 | |
Net change in unrealized appreciation (depreciation) | | | 30,242,553 | |
Net realized and unrealized gain | | | 36,466,189 | |
Net increase in net assets resulting from operations | | $ | 36,229,812 | |
* | Relates to Trustees not deemed “interested persons” within the meaning of Section 2(a)(19) of the 1940 Act. |
SEE NOTES TO FINANCIAL STATEMENTS. | THE RYDEX FUNDS ANNUAL REPORT | 105 |
STATEMENTS OF CHANGES IN NET ASSETS |
| | Year Ended
March 31,
2021 | | | Year Ended
March 31,
2020 | |
Increase (Decrease) in Net Assets from Operations: | | | | | | | | |
Net investment loss | | $ | (236,377 | ) | | $ | (401,880 | ) |
Net realized gain on investments | | | 6,223,636 | | | | 395,134 | |
Net change in unrealized appreciation (depreciation) on investments | | | 30,242,553 | | | | (1,122,240 | ) |
Net increase (decrease) in net assets resulting from operations | | | 36,229,812 | | | | (1,128,986 | ) |
| | | | | | | | | |
Distributions to shareholders: | | | | | | | | |
Investor Class | | | (1,200,774 | ) | | | (1,495,304 | ) |
A-Class | | | (206,906 | ) | | | (408,150 | ) |
C-Class | | | (35,529 | ) | | | (74,684 | ) |
H-Class | | | (36,834 | ) | | | (76,974 | ) |
Total distributions to shareholders | | | (1,480,043 | ) | | | (2,055,112 | ) |
| | | | | | | | | |
Capital share transactions: | | | | | | | | |
Proceeds from sale of shares | | | | | | | | |
Investor Class | | | 482,894,542 | | | | 345,983,213 | |
A-Class | | | 6,970,513 | | | | 5,044,797 | |
C-Class | | | 3,134,511 | | | | 2,843,601 | |
H-Class | | | 6,011,134 | | | | 27,234,035 | |
Distributions reinvested | | | | | | | | |
Investor Class | | | 1,180,105 | | | | 1,474,406 | |
A-Class | | | 203,578 | | | | 401,562 | |
C-Class | | | 35,407 | | | | 73,474 | |
H-Class | | | 36,758 | | | | 76,042 | |
Cost of shares redeemed | | | | | | | | |
Investor Class | | | (467,241,477 | ) | | | (331,255,162 | ) |
A-Class | | | (9,178,031 | ) | | | (7,292,781 | ) |
C-Class | | | (3,852,490 | ) | | | (3,692,608 | ) |
H-Class | | | (6,727,483 | ) | | | (28,223,011 | ) |
Net increase from capital share transactions | | | 13,467,067 | | | | 12,667,568 | |
Net increase in net assets | | | 48,216,836 | | | | 9,483,470 | |
| | | | | | | | | |
Net assets: | | | | | | | | |
Beginning of year | | | 62,471,794 | | | | 52,988,324 | |
End of year | | $ | 110,688,630 | | | $ | 62,471,794 | |
| | | | | | | | | |
Capital share activity: | | | | | | | | |
Shares sold | | | | | | | | |
Investor Class | | | 10,711,760 | | | | 11,365,343 | |
A-Class | | | 163,822 | | | | 183,721 | |
C-Class | | | 86,046 | | | | 115,029 | |
H-Class | | | 152,479 | | | | 1,041,882 | |
Shares issued from reinvestment of distributions | | | | | | | | |
Investor Class | | | 25,806 | | | | 44,117 | |
A-Class | | | 4,704 | | | | 12,660 | |
C-Class | | | 979 | | | | 2,746 | |
H-Class | | | 879 | | | | 2,479 | |
Shares redeemed | | | | | | | | |
Investor Class | | | (10,507,387 | ) | | | (10,958,332 | ) |
A-Class | | | (228,144 | ) | | | (258,645 | ) |
C-Class | | | (106,823 | ) | | | (151,938 | ) |
H-Class | | | (163,616 | ) | | | (1,078,358 | ) |
Net increase in shares | | | 140,505 | | | | 320,704 | |
106 | THE RYDEX FUNDS ANNUAL REPORT | SEE NOTES TO FINANCIAL STATEMENTS. |
This table is presented to show selected data for a share outstanding throughout each period and to assist shareholders in evaluating a Fund’s performance for the periods presented.
Investor Class | | Year Ended
March 31,
2021 | | | Year Ended
March 31,
2020 | | | Year Ended
March 31,
2019 | | | Year Ended
March 29,
2018 | | | Year Ended
March 31,
2017 | |
Per Share Data |
Net asset value, beginning of period | | $ | 26.50 | | | $ | 26.14 | | | $ | 27.07 | | | $ | 30.82 | | | $ | 27.37 | |
Income (loss) from investment operations: |
Net investment income (loss)a | | | (.06 | ) | | | (.12 | ) | | | (.12 | ) | | | (.17 | ) | | | (.23 | ) |
Net gain (loss) on investments (realized and unrealized) | | | 18.28 | | | | 1.23 | d | | | (.48 | ) | | | (1.96 | ) | | | 4.85 | |
Total from investment operations | | | 18.22 | | | | 1.11 | | | | (.60 | ) | | | (2.13 | ) | | | 4.62 | |
Less distributions from: |
Net investment income | | | (.50 | ) | | | (.75 | ) | | | (.33 | ) | | | (1.62 | ) | | | (1.17 | ) |
Total distributions | | | (.50 | ) | | | (.75 | ) | | | (.33 | ) | | | (1.62 | ) | | | (1.17 | ) |
Net asset value, end of period | | $ | 44.22 | | | $ | 26.50 | | | $ | 26.14 | | | $ | 27.07 | | | $ | 30.82 | |
|
Total Return | | | 68.71 | % | | | 3.65 | % | | | (2.08 | %) | | | (6.98 | %) | | | 16.91 | % |
Ratios/Supplemental Data |
Net assets, end of period (in thousands) | | $ | 87,174 | | | $ | 46,153 | | | $ | 33,724 | | | $ | 33,968 | | | $ | 43,530 | |
Ratios to average net assets: |
Net investment income (loss) | | | (0.13 | %) | | | (0.40 | %) | | | (0.47 | %) | | | (0.57 | %) | | | (0.67 | %) |
Total expensesb | | | 1.34 | % | | | 1.38 | % | | | 1.39 | % | | | 1.28 | % | | | 1.27 | % |
Portfolio turnover rate | | | 281 | % | | | 277 | % | | | 571 | % | | | 630 | % | | | 508 | % |
A-Class | | Year Ended
March 31,
2021 | | | Year Ended
March 31,
2020 | | | Year Ended
March 31,
2019 | | | Year Ended
March 29,
2018 | | | Year Ended
March 31,
2017 | |
Per Share Data |
Net asset value, beginning of period | | $ | 25.14 | | | $ | 24.89 | | | $ | 25.85 | | | $ | 29.59 | | | $ | 26.39 | |
Income (loss) from investment operations: |
Net investment income (loss)a | | | (.17 | ) | | | (.19 | ) | | | (.17 | ) | | | (.22 | ) | | | (.27 | ) |
Net gain (loss) on investments (realized and unrealized) | | | 17.35 | | | | 1.19 | d | | | (.46 | ) | | | (1.90 | ) | | | 4.64 | |
Total from investment operations | | | 17.18 | | | | 1.00 | | | | (.63 | ) | | | (2.12 | ) | | | 4.37 | |
Less distributions from: |
Net investment income | | | (.50 | ) | | | (.75 | ) | | | (.33 | ) | | | (1.62 | ) | | | (1.17 | ) |
Total distributions | | | (.50 | ) | | | (.75 | ) | | | (.33 | ) | | | (1.62 | ) | | | (1.17 | ) |
Net asset value, end of period | | $ | 41.82 | | | $ | 25.14 | | | $ | 24.89 | | | $ | 25.85 | | | $ | 29.59 | |
|
Total Returnc | | | 68.28 | % | | | 3.39 | % | | | (2.30 | %) | | | (7.24 | %) | | | 16.59 | % |
Ratios/Supplemental Data |
Net assets, end of period (in thousands) | | $ | 18,801 | | | $ | 12,803 | | | $ | 14,222 | | | $ | 12,781 | | | $ | 12,085 | |
Ratios to average net assets: |
Net investment income (loss) | | | (0.41 | %) | | | (0.67 | %) | | | (0.73 | %) | | | (0.79 | %) | | | (0.82 | %) |
Total expensesb | | | 1.59 | % | | | 1.63 | % | | | 1.64 | % | | | 1.53 | % | | | 1.52 | % |
Portfolio turnover rate | | | 281 | % | | | 277 | % | | | 571 | % | | | 630 | % | | | 508 | % |
SEE NOTES TO FINANCIAL STATEMENTS. | THE RYDEX FUNDS ANNUAL REPORT | 107 |
FINANCIAL HIGHLIGHTS (concluded) |
This table is presented to show selected data for a share outstanding throughout each period and to assist shareholders in evaluating a Fund’s performance for the periods presented.
C-Class | | Year Ended
March 31,
2021 | | | Year Ended
March 31,
2020 | | | Year Ended
March 31,
2019 | | | Year Ended
March 29,
2018 | | | Year Ended
March 31,
2017 | |
Per Share Data |
Net asset value, beginning of period | | $ | 21.16 | | | $ | 21.19 | | | $ | 22.24 | | | $ | 25.89 | | | $ | 23.38 | |
Income (loss) from investment operations: |
Net investment income (loss)a | | | (.43 | ) | | | (.35 | ) | | | (.32 | ) | | | (.39 | ) | | | (.46 | ) |
Net gain (loss) on investments (realized and unrealized) | | | 14.63 | | | | 1.07 | d | | | (.40 | ) | | | (1.64 | ) | | | 4.14 | |
Total from investment operations | | | 14.20 | | | | .72 | | | | (.72 | ) | | | (2.03 | ) | | | 3.68 | |
Less distributions from: |
Net investment income | | | (.50 | ) | | | (.75 | ) | | | (.33 | ) | | | (1.62 | ) | | | (1.17 | ) |
Total distributions | | | (.50 | ) | | | (.75 | ) | | | (.33 | ) | | | (1.62 | ) | | | (1.17 | ) |
Net asset value, end of period | | $ | 34.86 | | | $ | 21.16 | | | $ | 21.19 | | | $ | 22.24 | | | $ | 25.89 | |
|
Total Returnc | | | 67.04 | % | | | 2.65 | % | | | (3.08 | %) | | | (7.95 | %) | | | 15.76 | % |
Ratios/Supplemental Data |
Net assets, end of period (in thousands) | | $ | 2,086 | | | $ | 1,686 | | | $ | 2,412 | | | $ | 6,697 | | | $ | 7,607 | |
Ratios to average net assets: |
Net investment income (loss) | | | (1.20 | %) | | | (1.41 | %) | | | (1.53 | %) | | | (1.56 | %) | | | (1.59 | %) |
Total expensesb | | | 2.35 | % | | | 2.38 | % | | | 2.37 | % | | | 2.28 | % | | | 2.27 | % |
Portfolio turnover rate | | | 281 | % | | | 277 | % | | | 571 | % | | | 630 | % | | | 508 | % |
H-Class | | Year Ended
March 31,
2021 | | | Year Ended
March 31,
2020 | | | Year Ended
March 31,
2019 | | | Year Ended
March 29,
2018 | | | Year Ended
March 31,
2017 | |
Per Share Data |
Net asset value, beginning of period | | $ | 24.30 | | | $ | 24.06 | | | $ | 25.02 | | | $ | 28.73 | | | $ | 25.64 | |
Income (loss) from investment operations: |
Net investment income (loss)a | | | (.25 | ) | | | (.22 | ) | | | (.18 | ) | | | (.25 | ) | | | (.31 | ) |
Net gain (loss) on investments (realized and unrealized) | | | 16.86 | | | | 1.21 | d | | | (.45 | ) | | | (1.84 | ) | | | 4.57 | |
Total from investment operations | | | 16.61 | | | | .99 | | | | (.63 | ) | | | (2.09 | ) | | | 4.26 | |
Less distributions from: |
Net investment income | | | (.50 | ) | | | (.75 | ) | | | (.33 | ) | | | (1.62 | ) | | | (1.17 | ) |
Total distributions | | | (.50 | ) | | | (.75 | ) | | | (.33 | ) | | | (1.62 | ) | | | (1.17 | ) |
Net asset value, end of period | | $ | 40.41 | | | $ | 24.30 | | | $ | 24.06 | | | $ | 25.02 | | | $ | 28.73 | |
|
Total Return | | | 68.30 | % | | | 3.46 | % | | | (2.33 | %) | | | (7.36 | %) | | | 16.65 | % |
Ratios/Supplemental Data |
Net assets, end of period (in thousands) | | $ | 2,628 | | | $ | 1,830 | | | $ | 2,630 | | | $ | 2,239 | | | $ | 2,954 | |
Ratios to average net assets: |
Net investment income (loss) | | | (0.59 | %) | | | (0.78 | %) | | | (0.78 | %) | | | (0.92 | %) | | | (0.94 | %) |
Total expensesb | | | 1.60 | % | | | 1.63 | % | | | 1.63 | % | | | 1.53 | % | | | 1.52 | % |
Portfolio turnover rate | | | 281 | % | | | 277 | % | | | 571 | % | | | 630 | % | | | 508 | % |
a | Net investment income (loss) per share was computed using average shares outstanding throughout the period. |
b | Does not include expenses of the underlying funds in which the Fund invests. |
c | Total return does not reflect the impact of any applicable sales charges. |
d | The amount shown for a share outstanding throughout the period does not agree with the aggregate net loss on investments for the year because of the sales and repurchases of fund shares in relation to fluctuating market value of investments of the Fund. |
108 | THE RYDEX FUNDS ANNUAL REPORT | SEE NOTES TO FINANCIAL STATEMENTS. |
PERFORMANCE REPORT AND FUND PROFILE (Unaudited) | March 31, 2021 |
REAL ESTATE FUND
OBJECTIVE: Seeks to provide capital appreciation by investing in companies that are involved in the real estate industry, including real estate investment trusts (“REITs”) (collectively, “Real Estate Companies”).
For the one-year period ended March 31, 2021, Real Estate Fund H-Class returned 45.83%, compared with 37.69% for the MSCI U.S. REIT Index. The broader S&P 500 Index returned 56.35%.
All industries contributed to return, led by specialized REITs, retail REITs, and residential REITs.
Simon Property Group, Inc., Prologis, Inc., and Weyerhaeuser Co. contributed the most to the Fund’s return for the period. Opendoor Technologies, Inc., eXp World Holdings, Inc., and Hannon Armstrong Sustainable Infrastructure Capital, Inc. detracted the most from return.
Performance displayed represents past performance, which is no guarantee of future results.
Holdings Diversification (Market Exposure as % of Net Assets)

“Holdings Diversification (Market Exposure as % of Net Assets)” excludes any temporary cash investments.
Inception Dates: |
A-Class | September 1, 2004 |
C-Class | February 20, 2004 |
H-Class | February 20, 2004 |
Ten Largest Holdings (% of Total Net Assets) |
American Tower Corp. — Class A | 3.3% |
Prologis, Inc. | 2.8% |
Crown Castle International Corp. | 2.7% |
Equinix, Inc. | 2.5% |
Public Storage | 2.0% |
Digital Realty Trust, Inc. | 2.0% |
Simon Property Group, Inc. | 1.8% |
SBA Communications Corp. | 1.7% |
Welltower, Inc. | 1.7% |
Weyerhaeuser Co. | 1.6% |
Top Ten Total | 22.1% |
| | |
“Ten Largest Holdings” excludes any temporary cash investments. |
| | THE RYDEX FUNDS ANNUAL REPORT | 109 |
PERFORMANCE REPORT AND FUND PROFILE (Unaudited)(concluded) | March 31, 2021 |
Cumulative Fund Performance*
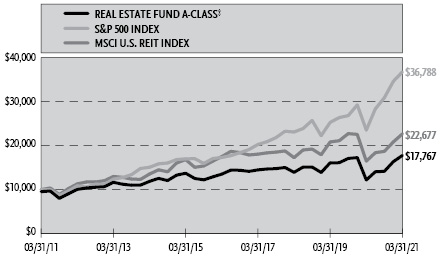

Average Annual Returns*
Periods Ended March 31, 2021
| 1 Year | 5 Year | 10 Year |
A-Class Shares | 45.79% | 5.62% | 6.43% |
A-Class Shares with sales charge‡ | 38.87% | 4.60% | 5.92% |
C-Class Shares | 44.71% | 4.83% | 5.62% |
C-Class Shares with CDSC§ | 43.71% | 4.83% | 5.62% |
H-Class Shares | 45.83% | 5.64% | 6.43% |
MSCI U.S. REIT Index | 37.69% | 5.32% | 8.53% |
S&P 500 Index | 56.35% | 16.29% | 13.91% |
* | The performance data above represents past performance that is not predictive of future results. The investment return and principal value of an investment in the Fund will fluctuate so that an investor’s shares, when redeemed, may be worth more or less than their original cost. Returns are historical and include changes in principal and reinvested dividends and capital gains and do not reflect the effect of taxes. The S&P 500 Index and MSCI U.S. REIT Index are unmanaged indices and, unlike the Fund, have no management fees or operating expenses to reduce their reported returns. The graphs are based on Investor Class shares and A-Class shares only; performance for C-Class and H-Class shares will vary due to differences in fee structures. |
‡ | Fund returns are calculated using the maximum sales charge of 4.75%. |
§ | Fund returns include a CDSC of 1% if redeemed within 12 months of purchase. |
110 | THE RYDEX FUNDS ANNUAL REPORT | |
SCHEDULE OF INVESTMENTS | March 31, 2021 |
REAL ESTATE FUND | |
| | Shares | | | Value | |
COMMON STOCKS† - 99.5% |
| | | | | | | | | |
REITs - 93.2% |
REITs-Diversified - 25.6% |
American Tower Corp. — Class A | | | 1,671 | | | $ | 399,469 | |
Crown Castle International Corp. | | | 1,899 | | | | 326,875 | |
Equinix, Inc. | | | 441 | | | | 299,699 | |
Digital Realty Trust, Inc. | | | 1,724 | | | | 242,808 | |
SBA Communications Corp. | | | 761 | | | | 211,216 | |
Weyerhaeuser Co. | | | 5,461 | | | | 194,412 | |
VICI Properties, Inc. | | | 5,581 | | | | 157,607 | |
Duke Realty Corp. | | | 3,520 | | | | 147,594 | |
WP Carey, Inc. | | | 1,865 | | | | 131,967 | |
Gaming and Leisure Properties, Inc. | | | 2,740 | | | | 116,258 | |
Lamar Advertising Co. — Class A | | | 1,205 | | | | 113,174 | |
Vornado Realty Trust | | | 2,336 | | | | 106,031 | |
CoreSite Realty Corp. | | | 770 | | | | 92,284 | |
New Residential Investment Corp. | | | 7,200 | | | | 81,000 | |
PS Business Parks, Inc. | | | 495 | | | | 76,517 | |
National Storage Affiliates Trust | | | 1,864 | | | | 74,430 | |
PotlatchDeltic Corp. | | | 1,332 | | | | 70,489 | |
EPR Properties | | | 1,460 | | | | 68,021 | |
National Health Investors, Inc. | | | 911 | | | | 65,847 | |
Outfront Media, Inc.* | | | 2,955 | | | | 64,508 | |
Uniti Group, Inc. | | | 5,335 | | | | 58,845 | |
Total REITs-Diversified | | | | | | | 3,099,051 | |
| | | | | | | | | |
REITs-Apartments - 11.6% |
Equity Residential | | | 2,639 | | | | 189,032 | |
AvalonBay Communities, Inc. | | | 1,014 | | | | 187,093 | |
Invitation Homes, Inc. | | | 5,008 | | | | 160,206 | |
Essex Property Trust, Inc. | | | 558 | | | | 151,687 | |
Mid-America Apartment Communities, Inc. | | | 1,043 | | | | 150,567 | |
UDR, Inc. | | | 3,018 | | | | 132,369 | |
Camden Property Trust | | | 1,115 | | | | 122,550 | |
American Homes 4 Rent — Class A | | | 3,669 | | | | 122,324 | |
Apartment Income REIT Corp. | | | 2,136 | | | | 91,335 | |
American Campus Communities, Inc. | | | 2,094 | | | | 90,398 | |
Total REITs-Apartments | | | | | | | 1,397,561 | |
| | | | | | | | | |
REITs-Office Property - 10.7% |
Alexandria Real Estate Equities, Inc. | | | 1,075 | | | | 176,622 | |
Boston Properties, Inc. | | | 1,435 | | | | 145,308 | |
VEREIT, Inc. | | | 2,840 | | | | 109,681 | |
Kilroy Realty Corp. | | | 1,528 | | | | 100,283 | |
Cousins Properties, Inc. | | | 2,397 | | | | 84,734 | |
Douglas Emmett, Inc. | | | 2,660 | | | | 83,524 | |
SL Green Realty Corp. | | | 1,144 | | | | 80,069 | |
Highwoods Properties, Inc. | | | 1,813 | | | | 77,850 | |
JBG SMITH Properties | | | 2,361 | | | | 75,056 | |
Hudson Pacific Properties, Inc. | | | 2,724 | | | | 73,902 | |
Equity Commonwealth | | | 2,435 | | | | 67,693 | |
Lexington Realty Trust | | | 5,813 | | | | 64,582 | |
Corporate Office Properties Trust | | | 2,360 | | | | 62,139 | |
Brandywine Realty Trust | | | 4,162 | | | | 53,731 | |
Piedmont Office Realty Trust, Inc. — Class A | | | 3,062 | | | | 53,187 | |
Total REITs-Office Property | | | | | | | 1,308,361 | |
REITs-Warehouse/Industries - 9.4% |
Prologis, Inc. | | | 3,160 | | | | 334,960 | |
Americold Realty Trust | | | 3,031 | | | | 116,603 | |
CyrusOne, Inc. | | | 1,587 | | | | 107,472 | |
Rexford Industrial Realty, Inc. | | | 1,917 | | | | 96,617 | |
First Industrial Realty Trust, Inc. | | | 1,968 | | | | 90,115 | |
EastGroup Properties, Inc. | | | 628 | | | | 89,980 | |
STAG Industrial, Inc. | | | 2,557 | | | | 85,941 | |
Innovative Industrial Properties, Inc. | | | 429 | | | | 77,289 | |
QTS Realty Trust, Inc. — Class A | | | 1,206 | | | | 74,820 | |
Terreno Realty Corp. | | | 1,291 | | | | 74,581 | |
Total REITs-Warehouse/Industries | | | | | | | 1,148,378 | |
| | | | | | | | | |
REITs-Health Care - 8.8% |
Welltower, Inc. | | | 2,832 | | | | 202,856 | |
Ventas, Inc. | | | 3,059 | | | | 163,167 | |
Healthpeak Properties, Inc. | | | 4,808 | | | | 152,606 | |
Medical Properties Trust, Inc. | | | 6,125 | | | | 130,340 | |
Omega Healthcare Investors, Inc. | | | 2,931 | | | | 107,363 | |
Healthcare Trust of America, Inc. — Class A | | | 3,266 | | | | 90,076 | |
Healthcare Realty Trust, Inc. | | | 2,509 | | | | 76,073 | |
Physicians Realty Trust | | | 3,972 | | | | 70,185 | |
Sabra Health Care REIT, Inc. | | | 4,000 | | | | 69,440 | |
Total REITs-Health Care | | | | | | | 1,062,106 | |
| | | | | | | | | |
REITs-Storage - 5.9% |
Public Storage | | | 1,004 | | | | 247,747 | |
Extra Space Storage, Inc. | | | 1,196 | | | | 158,530 | |
Iron Mountain, Inc. | | | 3,335 | | | | 123,428 | |
CubeSmart | | | 2,685 | | | | 101,574 | |
Life Storage, Inc. | | | 1,097 | | | | 94,287 | |
Total REITs-Storage | | | | | | | 725,566 | |
| | | | | | | | | |
REITs-Hotels - 4.8% |
MGM Growth Properties LLC — Class A | | | 3,827 | | | | 124,837 | |
Host Hotels & Resorts, Inc.* | | | 7,350 | | | | 123,848 | |
Park Hotels & Resorts, Inc.* | | | 3,738 | | | | 80,666 | |
Ryman Hospitality Properties, Inc.* | | | 982 | | | | 76,115 | |
Pebblebrook Hotel Trust | | | 2,672 | | | | 64,903 | |
Apple Hospitality REIT, Inc. | | | 4,446 | | | | 64,778 | |
Sunstone Hotel Investors, Inc.* | | | 4,735 | | | | 58,998 | |
Total REITs-Hotels | | | | | | | 594,145 | |
| | | | | | | | | |
REITs-Single Tenant - 4.6% |
Realty Income Corp. | | | 2,849 | | | | 180,912 | |
STORE Capital Corp. | | | 3,309 | | | | 110,852 | |
National Retail Properties, Inc. | | | 2,355 | | | | 103,785 | |
Spirit Realty Capital, Inc. | | | 1,928 | | | | 81,940 | |
Agree Realty Corp. | | | 1,140 | | | | 76,733 | |
Total REITs-Single Tenant | | | | | | | 554,222 | |
| | | | | | | | | |
REITs-Shopping Centers - 4.4% |
Regency Centers Corp. | | | 2,022 | | | | 114,668 | |
Kimco Realty Corp. | | | 5,584 | | | | 104,700 | |
Federal Realty Investment Trust | | | 1,025 | | | | 103,986 | |
Brixmor Property Group, Inc. | | | 4,436 | | | | 89,740 | |
SEE NOTES TO FINANCIAL STATEMENTS. | THE RYDEX FUNDS ANNUAL REPORT | 111 |
SCHEDULE OF INVESTMENTS (continued) | March 31, 2021 |
REAL ESTATE FUND | |
| | Shares | | | Value | |
Weingarten Realty Investors | | | 2,539 | | | $ | 68,324 | |
Retail Opportunity Investments Corp. | | | 3,120 | | | | 49,514 | |
Total REITs-Shopping Centers | | | | | | | 530,932 | |
| | | | | | | | | |
REITs-Mortgage - 2.9% |
AGNC Investment Corp. | | | 6,655 | | | | 111,538 | |
Starwood Property Trust, Inc. | | | 3,969 | | | | 98,193 | |
Blackstone Mortgage Trust, Inc. — Class A | | | 2,535 | | | | 78,585 | |
Chimera Investment Corp. | | | 5,006 | | | | 63,576 | |
Total REITs-Mortgage | | | | | | | 351,892 | |
| | | | | | | | | |
REITs-Manufactured Homes - 2.3% |
Sun Communities, Inc. | | | 1,032 | | | | 154,841 | |
Equity LifeStyle Properties, Inc. | | | 1,977 | | | | 125,816 | |
Total REITs-Manufactured Homes | | | | | | | 280,657 | |
| | | | | | | | | |
REITs-Regional Malls - 2.2% |
Simon Property Group, Inc. | | | 1,966 | | | | 223,672 | |
Macerich Co.1 | | | 3,996 | | | | 46,753 | |
Total REITs-Regional Malls | | | | | | | 270,425 | |
| | | | | | | | | |
Total REITs | | | | | | | 11,323,296 | |
| | | | | | | | | |
Real Estate - 4.7% |
Real Estate Management/Services - 4.0% |
CBRE Group, Inc. — Class A* | | | 2,432 | | | | 192,396 | |
Jones Lang LaSalle, Inc.* | | | 628 | | | | 112,437 | |
Redfin Corp.* | | | 1,432 | | | | 95,357 | |
eXp World Holdings, Inc.* | | | 2,010 | | | | 91,555 | |
Total Real Estate Management/Services | | | | | | | 491,745 | |
| | | | | | | | | |
Real Estate Operations/Development - 0.7% |
Howard Hughes Corp.* | | | 891 | | | | 84,761 | |
Total Real Estate | | | | | | | 576,506 | |
| | | | | | | | | |
Internet - 0.9% |
Opendoor Technologies, Inc.* | | | 5,440 | | | | 115,273 | |
| | | | | | | | | |
Diversified Financial Services - 0.7% |
Hannon Armstrong Sustainable Infrastructure Capital, Inc. | | | 1,438 | | | $ | 80,672 | |
| | | | | | | | | |
Total Common Stocks | | | | |
(Cost $10,596,884) | | | | | | | 12,095,747 | |
| | | | | | | | | |
| | | Face
Amount | | | | | |
REPURCHASE AGREEMENTS††,2 - 0.4% |
J.P. Morgan Securities LLC
issued 03/31/21 at 0.01%
due 04/01/21 | | $ | 23,977 | | | | 23,977 | |
Barclays Capital, Inc.
issued 03/31/21 at 0.01%
due 04/01/21 | | | 10,901 | | | | 10,901 | |
BofA Securities, Inc.
issued 03/31/21 at 0.01%
due 04/01/21 | | | 9,949 | | | | 9,949 | |
Total Repurchase Agreements | | | | |
(Cost $44,827) | | | | | | | 44,827 | |
| | | | | | | | | |
| | | Shares | | | | | |
SECURITIES LENDING COLLATERAL†,3 - 0.3% |
Money Market Fund | | | | | | | | |
First American Government Obligations Fund — Class Z, 0.03%4 | | | 32,671 | | | | 32,671 | |
Total Securities Lending Collateral | | | | |
(Cost $32,671) | | | | | | | 32,671 | |
| | | | | | | | | |
Total Investments - 100.2% | | | | |
(Cost $10,674,382) | | $ | 12,173,245 | |
Other Assets & Liabilities, net - (0.2)% | | | (23,145 | ) |
Total Net Assets - 100.0% | | $ | 12,150,100 | |
* | Non-income producing security. |
† | Value determined based on Level 1 inputs — See Note 4. |
†† | Value determined based on Level 2 inputs — See Note 4. |
1 | All or a portion of this security is on loan at March 31, 2021 — See Note 7. |
2 | Repurchase Agreements — See Note 6. |
3 | Securities lending collateral — See Note 7. |
4 | Rate indicated is the 7-day yield as of March 31, 2021. |
| | REIT — Real Estate Investment Trust |
| | |
| | See Sector Classification in Other Information section. |
112 | THE RYDEX FUNDS ANNUAL REPORT | SEE NOTES TO FINANCIAL STATEMENTS. |
SCHEDULE OF INVESTMENTS (concluded) | March 31, 2021 |
REAL ESTATE FUND | |
The following table summarizes the inputs used to value the Fund’s investments at March 31, 2021 (See Note 4 in the Notes to Financial Statements):
Investments in Securities (Assets) | | Level 1
Quoted
Prices | | | Level 2
Significant
Observable
Inputs | | | Level 3
Significant
Unobservable
Inputs | | | Total | |
Common Stocks | | $ | 12,095,747 | | | $ | — | | | $ | — | | | $ | 12,095,747 | |
Repurchase Agreements | | | — | | | | 44,827 | | | | — | | | | 44,827 | |
Securities Lending Collateral | | | 32,671 | | | | — | | | | — | | | | 32,671 | |
Total Assets | | $ | 12,128,418 | | | $ | 44,827 | | | $ | — | | | $ | 12,173,245 | |
SEE NOTES TO FINANCIAL STATEMENTS. | THE RYDEX FUNDS ANNUAL REPORT | 113 |
STATEMENT OF ASSETS AND LIABILITIES |
March 31, 2021 |
Assets: |
Investments, at value - including $31,204 of securities loaned (cost $10,629,555) | | $ | 12,128,418 | |
Repurchase agreements, at value (cost $44,827) | | | 44,827 | |
Receivables: |
Fund shares sold | | | 47,134 | |
Dividends | | | 47,077 | |
Securities lending income | | | 22 | |
Total assets | | | 12,267,478 | |
| | | | | |
Liabilities: |
Payable for: |
Fund shares redeemed | | | 54,534 | |
Return of securities lending collateral | | | 32,671 | |
Management fees | | | 9,191 | |
Transfer agent and administrative fees | | | 2,909 | |
Distribution and service fees | | | 2,841 | |
Portfolio accounting fees | | | 1,081 | |
Trustees’ fees* | | | 199 | |
Miscellaneous | | | 13,952 | |
Total liabilities | | | 117,378 | |
Commitments and contingent liabilities (Note 10) | | | — | |
Net assets | | $ | 12,150,100 | |
| | | | | |
Net assets consist of: |
Paid in capital | | $ | 17,880,112 | |
Total distributable earnings (loss) | | | (5,730,012 | ) |
Net assets | | $ | 12,150,100 | |
| | | | | |
A-Class: |
Net assets | | $ | 1,049,078 | |
Capital shares outstanding | | | 25,669 | |
Net asset value per share | | $ | 40.87 | |
Maximum offering price per share (Net asset value divided by 95.25%) | | $ | 42.91 | |
| | | | | |
C-Class: |
Net assets | | $ | 194,421 | |
Capital shares outstanding | | | 5,645 | |
Net asset value per share | | $ | 34.44 | |
| | | | | |
H-Class: |
Net assets | | $ | 10,906,601 | |
Capital shares outstanding | | | 267,460 | |
Net asset value per share | | $ | 40.78 | |
STATEMENT OF OPERATIONS |
Year Ended March 31, 2021 |
Investment Income: |
Dividends | | $ | 116,711 | |
Interest | | | 13 | |
Income from securities lending, net | | | 1,262 | |
Total investment income | | | 117,986 | |
| | | | | |
Expenses: |
Management fees | | | 43,389 | |
Distribution and service fees: |
A-Class | | | 1,694 | |
C-Class | | | 2,675 | |
H-Class | | | 10,399 | |
Transfer agent and administrative fees | | | 14,326 | |
Portfolio accounting fees | | | 5,105 | |
Professional fees | | | 2,882 | |
Trustees’ fees* | | | 1,192 | |
Custodian fees | | | 741 | |
Line of credit fees | | | 20 | |
Miscellaneous | | | 4,742 | |
Total expenses | | | 87,165 | |
Net investment income | | | 30,821 | |
| | | | | |
Net Realized and Unrealized Gain (Loss): |
Net realized gain (loss) on: |
Investments | | | (748,419 | ) |
Net realized loss | | | (748,419 | ) |
Net change in unrealized appreciation (depreciation) on: |
Investments | | | 1,922,770 | |
Net change in unrealized appreciation (depreciation) | | | 1,922,770 | |
Net realized and unrealized gain | | | 1,174,351 | |
Net increase in net assets resulting from operations | | $ | 1,205,172 | |
* | Relates to Trustees not deemed “interested persons” within the meaning of Section 2(a)(19) of the 1940 Act. |
114 | THE RYDEX FUNDS ANNUAL REPORT | SEE NOTES TO FINANCIAL STATEMENTS. |
STATEMENTS OF CHANGES IN NET ASSETS |
| | Year Ended
March 31,
2021 | | | Year Ended
March 31,
2020 | |
Increase (Decrease) in Net Assets from Operations: | | | | | | | | |
Net investment income | | $ | 30,821 | | | $ | 302,126 | |
Net realized gain (loss) on investments | | | (748,419 | ) | | | 1,681,715 | |
Net change in unrealized appreciation (depreciation) on investments | | | 1,922,770 | | | | (2,946,772 | ) |
Net increase (decrease) in net assets resulting from operations | | | 1,205,172 | | | | (962,931 | ) |
| | | | | | | | | |
Distributions to shareholders: | | | | | | | | |
A-Class | | | (50,366 | ) | | | (17,317 | ) |
C-Class | | | (24,613 | ) | | | (21,349 | ) |
H-Class | | | (186,432 | ) | | | (210,026 | ) |
Total distributions to shareholders | | | (261,411 | ) | | | (248,692 | ) |
| | | | | | | | | |
Capital share transactions: | | | | | | | | |
Proceeds from sale of shares | | | | | | | | |
A-Class | | | 504,083 | | | | 1,220,926 | |
C-Class | | | 967,844 | | | | 3,584,439 | |
H-Class | | | 34,310,786 | | | | 147,081,645 | |
Distributions reinvested | | | | | | | | |
A-Class | | | 48,806 | | | | 16,981 | |
C-Class | | | 24,496 | | | | 21,107 | |
H-Class | | | 174,245 | | | | 206,460 | |
Cost of shares redeemed | | | | | | | | |
A-Class | | | (499,509 | ) | | | (853,685 | ) |
C-Class | | | (1,309,690 | ) | | | (3,697,102 | ) |
H-Class | | | (26,510,129 | ) | | | (162,669,284 | ) |
Net increase (decrease) from capital share transactions | | | 7,710,932 | | | | (15,088,513 | ) |
Net increase (decrease) in net assets | | | 8,654,693 | | | | (16,300,136 | ) |
| | | | | | | | | |
Net assets: | | | | | | | | |
Beginning of year | | | 3,495,407 | | | | 19,795,543 | |
End of year | | $ | 12,150,100 | | | $ | 3,495,407 | |
| | | | | | | | | |
Capital share activity: | | | | | | | | |
Shares sold | | | | | | | | |
A-Class | | | 12,731 | | | | 29,793 | |
C-Class | | | 30,808 | | | | 97,673 | |
H-Class | | | 917,563 | | | | 3,500,708 | |
Shares issued from reinvestment of distributions | | | | | | | | |
A-Class | | | 1,334 | | | | 399 | |
C-Class | | | 793 | | | | 573 | |
H-Class | | | 4,775 | | | | 4,858 | |
Shares redeemed | | | | | | | | |
A-Class | | | (13,846 | ) | | | (20,691 | ) |
C-Class | | | (42,183 | ) | | | (101,540 | ) |
H-Class | | | (729,458 | ) | | | (3,879,104 | ) |
Net increase (decrease) in shares | | | 182,517 | | | | (367,331 | ) |
SEE NOTES TO FINANCIAL STATEMENTS. | THE RYDEX FUNDS ANNUAL REPORT | 115 |
This table is presented to show selected data for a share outstanding throughout each period and to assist shareholders in evaluating a Fund’s performance for the periods presented.
A-Class | | Year Ended
March 31,
2021 | | | Year Ended
March 31,
2020 | | | Year Ended
March 31,
2019 | | | Year Ended
March 29,
2018 | | | Year Ended
March 31,
2017 | |
Per Share Data |
Net asset value, beginning of period | | $ | 30.70 | | | $ | 41.24 | | | $ | 35.92 | | | $ | 37.55 | | | $ | 37.31 | |
Income (loss) from investment operations: |
Net investment income (loss)a | | | .32 | | | | .56 | | | | .46 | | | | .65 | | | | .34 | |
Net gain (loss) on investments (realized and unrealized) | | | 13.33 | | | | (10.37 | ) | | | 5.12 | c | | | (2.08 | ) | | | 2.15 | |
Total from investment operations | | | 13.65 | | | | (9.81 | ) | | | 5.58 | | | | (1.43 | ) | | | 2.49 | |
Less distributions from: |
Net investment income | | | (3.48 | ) | | | (.73 | ) | | | (.26 | ) | | | (.20 | ) | | | (2.25 | ) |
Total distributions | | | (3.48 | ) | | | (.73 | ) | | | (.26 | ) | | | (.20 | ) | | | (2.25 | ) |
Net asset value, end of period | | $ | 40.87 | | | $ | 30.70 | | | $ | 41.24 | | | $ | 35.92 | | | $ | 37.55 | |
|
Total Returnb | | | 45.79 | % | | | (24.28 | %) | | | 15.58 | % | | | (3.85 | %) | | | 7.17 | % |
Ratios/Supplemental Data |
Net assets, end of period (in thousands) | | $ | 1,049 | | | $ | 781 | | | $ | 658 | | | $ | 486 | | | $ | 1,762 | |
Ratios to average net assets: |
Net investment income (loss) | | | 0.87 | % | | | 1.33 | % | | | 1.18 | % | | | 1.69 | % | | | 0.89 | % |
Total expenses | | | 1.70 | % | | | 1.72 | % | | | 1.72 | % | | | 1.63 | % | | | 1.63 | % |
Portfolio turnover rate | | | 499 | % | | | 539 | % | | | 877 | % | | | 1,010 | % | | | 1,060 | % |
C-Class | | Year Ended
March 31,
2021 | | | Year Ended
March 31,
2020 | | | Year Ended
March 31,
2019 | | | Year Ended
March 29,
2018 | | | Year Ended
March 31,
2017 | |
Per Share Data |
Net asset value, beginning of period | | $ | 26.48 | | | $ | 35.94 | | | $ | 31.57 | | | $ | 33.28 | | | $ | 33.56 | |
Income (loss) from investment operations: |
Net investment income (loss)a | | | (.03 | ) | | | .26 | | | | .31 | | | | .29 | | | | .19 | |
Net gain (loss) on investments (realized and unrealized) | | | 11.47 | | | | (8.99 | ) | | | 4.32 | c | | | (1.80 | ) | | | 1.78 | |
Total from investment operations | | | 11.44 | | | | (8.73 | ) | | | 4.63 | | | | (1.51 | ) | | | 1.97 | |
Less distributions from: |
Net investment income | | | (3.48 | ) | | | (.73 | ) | | | (.26 | ) | | | (.20 | ) | | | (2.25 | ) |
Total distributions | | | (3.48 | ) | | | (.73 | ) | | | (.26 | ) | | | (.20 | ) | | | (2.25 | ) |
Net asset value, end of period | | $ | 34.44 | | | $ | 26.48 | | | $ | 35.94 | | | $ | 31.57 | | | $ | 33.28 | |
|
Total Returnb | | | 44.71 | % | | | (24.86 | %) | | | 14.72 | % | | | (4.56 | %) | | | 6.37 | % |
Ratios/Supplemental Data |
Net assets, end of period (in thousands) | | $ | 194 | | | $ | 430 | | | $ | 702 | | | $ | 993 | | | $ | 999 | |
Ratios to average net assets: |
Net investment income (loss) | | | (0.09 | %) | | | 0.71 | % | | | 0.94 | % | | | 0.86 | % | | | 0.56 | % |
Total expenses | | | 2.45 | % | | | 2.47 | % | | | 2.46 | % | | | 2.38 | % | | | 2.38 | % |
Portfolio turnover rate | | | 499 | % | | | 539 | % | | | 877 | % | | | 1,010 | % | | | 1,060 | % |
116 | THE RYDEX FUNDS ANNUAL REPORT | SEE NOTES TO FINANCIAL STATEMENTS. |
FINANCIAL HIGHLIGHTS (concluded) |
This table is presented to show selected data for a share outstanding throughout each period and to assist shareholders in evaluating a Fund’s performance for the periods presented.
H-Class | | Year Ended
March 31,
2021 | | | Year Ended
March 31,
2020 | | | Year Ended
March 31,
2019 | | | Year Ended
March 29,
2018 | | | Year Ended
March 31,
2017 | |
Per Share Data |
Net asset value, beginning of period | | $ | 30.63 | | | $ | 41.14 | | | $ | 35.82 | | | $ | 37.45 | | | $ | 37.21 | |
Income (loss) from investment operations: |
Net investment income (loss)a | | | .23 | | | | .55 | | | | .65 | | | | .92 | | | | .27 | |
Net gain (loss) on investments (realized and unrealized) | | | 13.40 | | | | (10.33 | ) | | | 4.93 | c | | | (2.35 | ) | | | 2.22 | |
Total from investment operations | | | 13.63 | | | | (9.78 | ) | | | 5.58 | | | | (1.43 | ) | | | 2.49 | |
Less distributions from: |
Net investment income | | | (3.48 | ) | | | (.73 | ) | | | (.26 | ) | | | (.20 | ) | | | (2.25 | ) |
Total distributions | | | (3.48 | ) | | | (.73 | ) | | | (.26 | ) | | | (.20 | ) | | | (2.25 | ) |
Net asset value, end of period | | $ | 40.78 | | | $ | 30.63 | | | $ | 41.14 | | | $ | 35.82 | | | $ | 37.45 | |
|
Total Return | | | 45.83 | % | | | (24.27 | %) | | | 15.63 | % | | | (3.86 | %) | | | 7.18 | % |
Ratios/Supplemental Data |
Net assets, end of period (in thousands) | | $ | 10,907 | | | $ | 2,284 | | | $ | 18,436 | | | $ | 8,800 | | | $ | 6,322 | |
Ratios to average net assets: |
Net investment income (loss) | | | 0.60 | % | | | 1.30 | % | | | 1.69 | % | | | 2.43 | % | | | 0.70 | % |
Total expenses | | | 1.66 | % | | | 1.72 | % | | | 1.71 | % | | | 1.63 | % | | | 1.62 | % |
Portfolio turnover rate | | | 499 | % | | | 539 | % | | | 877 | % | | | 1,010 | % | | | 1,060 | % |
a | Net investment income (loss) per share was computed using average shares outstanding throughout the period. |
b | Total return does not reflect the impact of any applicable sales charges. |
c | The amount shown for a share outstanding throughout the period does not accord with the aggregate net losses on investments for the year because of the sales and repurchase of fund shares in relation to fluctuating market value of the investments of the Fund. |
SEE NOTES TO FINANCIAL STATEMENTS. | THE RYDEX FUNDS ANNUAL REPORT | 117 |
PERFORMANCE REPORT AND FUND PROFILE (Unaudited) | March 31, 2021 |
RETAILING FUND
OBJECTIVE: Seeks to provide capital appreciation by investing in companies engaged in merchandising finished goods and services, including department stores, mail order operations, and other companies involved in selling products to consumers (“Retailing Companies”).
For the one-year period ended March 31, 2021, Retailing Fund Investor Class returned 99.55%, compared with 70.29% for the S&P 500 Consumer Discretionary Index. The broader S&P 500 Index returned 56.35%.
All industries contributed to return, led by Internet & direct marketing retail, apparel retail, and home improvement retail.
��
Amazon.com, Inc., Lowe’s Companies, Inc., and Wayfair, Inc. Class A contributed the most to the Fund’s return for the period. Jumia Technologies AG ADR, Fiverr International Ltd., and GameStop Corp. Class A detracted the most from return.
Performance displayed represents past performance, which is no guarantee of future results.
Holdings Diversification (Market Exposure as % of Net Assets)
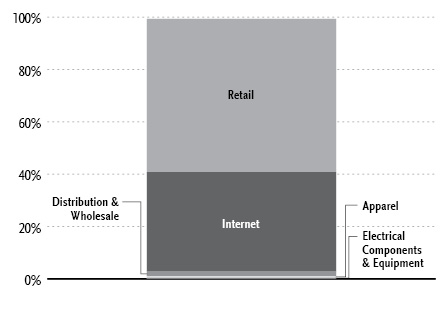
“Holdings Diversification (Market Exposure as % of Net Assets)” excludes any temporary cash investments.
Inception Dates: |
Investor Class | April 1, 1998 |
A-Class | September 1, 2004 |
C-Class | May 9, 2001 |
H-Class | April 21, 1998 |
Ten Largest Holdings (% of Total Net Assets) |
Amazon.com, Inc. | 11.1% |
Walmart, Inc. | 5.6% |
Home Depot, Inc. | 5.2% |
Alibaba Group Holding Ltd. ADR | 3.7% |
Costco Wholesale Corp. | 3.6% |
Lowe’s Companies, Inc. | 3.4% |
Target Corp. | 2.9% |
Booking Holdings, Inc. | 2.7% |
TJX Companies, Inc. | 2.5% |
Dollar General Corp. | 2.1% |
Top Ten Total | 42.8% |
| | |
“Ten Largest Holdings” excludes any temporary cash investments. |
118 | THE RYDEX FUNDS ANNUAL REPORT | |
PERFORMANCE REPORT AND FUND PROFILE (Unaudited)(concluded) | March 31, 2021 |
Cumulative Fund Performance*

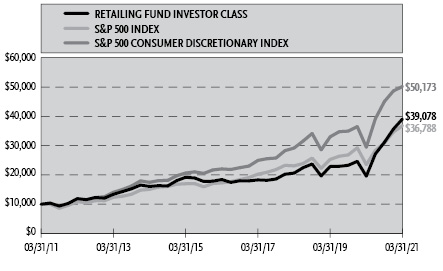
Average Annual Returns*
Periods Ended March 31, 2021
| 1 Year | 5 Year | 10 Year |
Investor Class Shares | 99.55% | 16.21% | 14.60% |
A-Class Shares | 99.07% | 15.95% | 14.32% |
A-Class Shares with sales charge‡ | 89.61% | 14.82% | 13.76% |
C-Class Shares | 97.47% | 15.05% | 13.46% |
C-Class Shares with CDSC§ | 96.47% | 15.05% | 13.46% |
H-Class Shares** | 99.01% | 15.94% | 14.23% |
S&P 500 Consumer Discretionary Index | 70.29% | 17.87% | 17.50% |
S&P 500 Index | 56.35% | 16.29% | 13.91% |
* | The performance data above represents past performance that is not predictive of future results. The investment return and principal value of an investment in the Fund will fluctuate so that an investor’s shares, when redeemed, may be worth more or less than their original cost. Returns are historical and include changes in principal and reinvested dividends and capital gains and do not reflect the effect of taxes. The S&P 500 Index and the S&P 500 Consumer Discretionary Index are unmanaged indices and, unlike the Fund, have no management fees or operating expenses to reduce their reported returns. The graph are based on Investor Class and A-Class shares only; performance for C-Class and H-Class will vary due to differences in fee structures. |
** | Effective September 30, 2015, the Fund’s Advisor Class shares were converted into H-Class shares. |
‡ | Fund returns are calculated using the maximum sales charge of 4.75%. |
§ | Fund returns include a CDSC of 1% if redeemed within 12 months of purchase. |
| | THE RYDEX FUNDS ANNUAL REPORT | 119 |
SCHEDULE OF INVESTMENTS | March 31, 2021 |
RETAILING FUND | |
| | Shares | | | Value | |
COMMON STOCKS† - 99.4% |
| | | | | | | | | |
Retail - 58.6% |
Walmart, Inc. | | | 11,509 | | | $ | 1,563,268 | |
Home Depot, Inc. | | | 4,809 | | | | 1,467,947 | |
Costco Wholesale Corp. | | | 2,884 | | | | 1,016,552 | |
Lowe’s Companies, Inc. | | | 5,042 | | | | 958,888 | |
Target Corp. | | | 4,114 | | | | 814,860 | |
TJX Companies, Inc. | | | 10,483 | | | | 693,451 | |
Dollar General Corp. | | | 2,884 | | | | 584,356 | |
Walgreens Boots Alliance, Inc. | | | 9,989 | | | | 548,396 | |
O’Reilly Automotive, Inc.* | | | 1,001 | | | | 507,757 | |
Ross Stores, Inc. | | | 4,198 | | | | 503,382 | |
AutoZone, Inc.* | | | 343 | | | | 481,675 | |
Best Buy Company, Inc. | | | 3,732 | | | | 428,471 | |
Dollar Tree, Inc.* | | | 3,677 | | | | 420,869 | |
Tractor Supply Co. | | | 2,049 | | | | 362,837 | |
Burlington Stores, Inc.* | | | 1,205 | | | | 360,054 | |
CarMax, Inc.* | | | 2,712 | | | | 359,774 | |
Ulta Beauty, Inc.* | | | 1,077 | | | | 332,976 | |
L Brands, Inc.* | | | 5,301 | | | | 327,920 | |
Genuine Parts Co. | | | 2,756 | | | | 318,566 | |
RH* | | | 523 | | | | 312,022 | |
Williams-Sonoma, Inc. | | | 1,694 | | | | 303,565 | |
Five Below, Inc.* | | | 1,422 | | | | 271,303 | |
Advance Auto Parts, Inc. | | | 1,478 | | | | 271,198 | |
Gap, Inc. | | | 8,593 | | | | 255,900 | |
Lithia Motors, Inc. — Class A | | | 642 | | | | 250,438 | |
Floor & Decor Holdings, Inc. — Class A* | | | 2,603 | | | | 248,534 | |
Kohl’s Corp. | | | 3,989 | | | | 237,784 | |
AutoNation, Inc.* | | | 2,356 | | | | 219,626 | |
BJ’s Wholesale Club Holdings, Inc.* | | | 4,539 | | | | 203,620 | |
Carvana Co.* | | | 770 | | | | 202,048 | |
Dick’s Sporting Goods, Inc. | | | 2,650 | | | | 201,798 | |
Foot Locker, Inc. | | | 3,348 | | | | 188,325 | |
Ollie’s Bargain Outlet Holdings, Inc.* | | | 2,151 | | | | 187,137 | |
Nordstrom, Inc.* | | | 4,747 | | | | 179,769 | |
American Eagle Outfitters, Inc. | | | 5,841 | | | | 170,791 | |
Macy’s, Inc.* | | | 10,049 | | | | 162,693 | |
Murphy USA, Inc. | | | 1,122 | | | | 162,196 | |
Bed Bath & Beyond, Inc.* | | | 4,908 | | | | 143,068 | |
Big Lots, Inc. | | | 1,828 | | | | 124,852 | |
GameStop Corp. — Class A* | | | 528 | | | | 100,225 | |
Total Retail | | | | | | | 16,448,891 | |
| | | | | | | | | |
Internet - 37.9% |
Amazon.com, Inc.* | | | 1,004 | | | | 3,106,456 | |
Alibaba Group Holding Ltd. ADR* | | | 4,608 | | | | 1,044,772 | |
Booking Holdings, Inc.* | | | 325 | | | | 757,198 | |
JD.com, Inc. ADR* | | | 6,435 | | | | 542,664 | |
eBay, Inc. | | | 8,386 | | | | 513,559 | |
MercadoLibre, Inc.* | | | 330 | | | | 485,806 | |
Chewy, Inc. — Class A* | | | 5,692 | | | | 482,169 | |
Wayfair, Inc. — Class A* | | | 1,465 | | | | 461,109 | |
Pinduoduo, Inc. ADR* | | | 3,408 | | | | 456,263 | |
Etsy, Inc.* | | | 1,915 | | | | 386,198 | |
Expedia Group, Inc.* | | | 2,199 | | | | 378,492 | |
Farfetch Ltd. — Class A* | | | 5,840 | | | | 309,637 | |
Fiverr International Ltd.* | | | 1,374 | | | | 298,405 | |
Trip.com Group Ltd. ADR* | | | 7,477 | | | | 296,313 | |
Jumia Technologies AG ADR*,1 | | | 6,938 | | | | 246,021 | |
Vipshop Holdings Ltd. ADR* | | | 8,031 | | | | 239,806 | |
Grubhub, Inc.* | | | 3,000 | | | | 180,000 | |
Stitch Fix, Inc. — Class A* | | | 3,513 | | | | 174,034 | |
Stamps.com, Inc.* | | | 772 | | | | 154,022 | |
Overstock.com, Inc.* | | | 1,865 | | | | 123,575 | |
Total Internet | | | | | | | 10,636,499 | |
| | | | | | | | | |
Distribution & Wholesale - 2.0% |
Pool Corp. | | | 855 | | | | 295,180 | |
LKQ Corp.* | | | 6,509 | | | | 275,526 | |
Total Distribution & Wholesale | | | | | | | 570,706 | |
| | | | | | | | | |
Apparel - 0.5% |
Urban Outfitters, Inc.* | | | 3,870 | | | | 143,926 | |
| | | | | | | | | |
Electrical Components & Equipment - 0.4% |
Blink Charging Co.*,1 | | | 2,750 | | | | 113,025 | |
| | | | | | | | | |
Total Common Stocks | | | | |
(Cost $19,254,743) | | | | | | | 27,913,047 | |
| | | | | | | | | |
| | | Face
Amount | | | | | |
REPURCHASE AGREEMENTS††,2 - 1.2% |
J.P. Morgan Securities LLC
issued 03/31/21 at 0.01%
due 04/01/21 | | $ | 178,083 | | | | 178,083 | |
Barclays Capital, Inc.
issued 03/31/21 at 0.01%
due 04/01/21 | | | 80,965 | | | | 80,965 | |
BofA Securities, Inc.
issued 03/31/21 at 0.01%
due 04/01/21 | | | 73,893 | | | | 73,893 | |
Total Repurchase Agreements | | | | |
(Cost $332,941) | | | | | | | 332,941 | |
| | | | | | | | | |
| | | Shares | | | | | |
SECURITIES LENDING COLLATERAL†,3 - 0.9% |
Money Market Fund | | | | | | | | |
First American Government Obligations Fund — Class Z, 0.03%4 | | | 263,122 | | | | 263,122 | |
Total Securities Lending Collateral | | | | |
(Cost $263,122) | | | | | | | 263,122 | |
| | | | | | | | | |
Total Investments - 101.5% | | | | |
(Cost $19,850,806) | | $ | 28,509,110 | |
Other Assets & Liabilities, net - (1.5)% | | | (433,858 | ) |
Total Net Assets - 100.0% | | $ | 28,075,252 | |
120 | THE RYDEX FUNDS ANNUAL REPORT | SEE NOTES TO FINANCIAL STATEMENTS. |
SCHEDULE OF INVESTMENTS (concluded) | March 31, 2021 |
RETAILING FUND | |
* | Non-income producing security. |
† | Value determined based on Level 1 inputs — See Note 4. |
†† | Value determined based on Level 2 inputs — See Note 4. |
1 | All or a portion of this security is on loan at March 31, 2021 — See Note 7. |
2 | Repurchase Agreements — See Note 6. |
3 | Securities lending collateral — See Note 7. |
4 | Rate indicated is the 7-day yield as of March 31, 2021. |
| | ADR — American Depositary Receipt |
| | |
| | See Sector Classification in Other Information section. |
The following table summarizes the inputs used to value the Fund’s investments at March 31, 2021 (See Note 4 in the Notes to Financial Statements):
Investments in Securities (Assets) | | Level 1
Quoted
Prices | | | Level 2
Significant
Observable
Inputs | | | Level 3
Significant
Unobservable
Inputs | | | Total | |
Common Stocks | | $ | 27,913,047 | | | $ | — | | | $ | — | | | $ | 27,913,047 | |
Repurchase Agreements | | | — | | | | 332,941 | | | | — | | | | 332,941 | |
Securities Lending Collateral | | | 263,122 | | | | — | | | | — | | | | 263,122 | |
Total Assets | | $ | 28,176,169 | | | $ | 332,941 | | | $ | — | | | $ | 28,509,110 | |
SEE NOTES TO FINANCIAL STATEMENTS. | THE RYDEX FUNDS ANNUAL REPORT | 121 |
STATEMENT OF ASSETS AND LIABILITIES |
March 31, 2021 |
Assets: |
Investments, at value - including $265,813 of securities loaned (cost $19,517,865) | | $ | 28,176,169 | |
Repurchase agreements, at value (cost $332,941) | | | 332,941 | |
Receivables: |
Fund shares sold | | | 57,320 | |
Dividends | | | 12,876 | |
Securities lending income | | | 527 | |
Total assets | | | 28,579,833 | |
| | | | | |
Liabilities: |
Payable for: |
Return of securities lending collateral | | | 263,122 | |
Securities purchased | | | 179,935 | |
Management fees | | | 19,746 | |
Transfer agent and administrative fees | | | 6,249 | |
Fund shares redeemed | | | 2,358 | |
Portfolio accounting fees | | | 2,323 | |
Distribution and service fees | | | 831 | |
Trustees’ fees* | | | 422 | |
Miscellaneous | | | 29,595 | |
Total liabilities | | | 504,581 | |
Commitments and contingent liabilities (Note 10) | | | — | |
Net assets | | $ | 28,075,252 | |
| | | | | |
Net assets consist of: |
Paid in capital | | $ | 18,924,425 | |
Total distributable earnings (loss) | | | 9,150,827 | |
Net assets | | $ | 28,075,252 | |
| | | | | |
Investor Class: |
Net assets | | $ | 24,986,879 | |
Capital shares outstanding | | | 437,508 | |
Net asset value per share | | $ | 57.11 | |
| | | | | |
A-Class: |
Net assets | | $ | 2,132,614 | |
Capital shares outstanding | | | 39,679 | |
Net asset value per share | | $ | 53.75 | |
Maximum offering price per share (Net asset value divided by 95.25%) | | $ | 56.43 | |
| | | | | |
C-Class: |
Net assets | | $ | 294,434 | |
Capital shares outstanding | | | 6,299 | |
Net asset value per share | | $ | 46.74 | |
| | | | | |
H-Class: |
Net assets | | $ | 661,325 | |
Capital shares outstanding | | | 12,612 | |
Net asset value per share | | $ | 52.44 | |
STATEMENT OF OPERATIONS |
Year Ended March 31, 2021 |
Investment Income: |
Dividends (net of foreign withholding tax of $722) | | $ | 234,566 | |
Interest | | | 94 | |
Income from securities lending, net | | | 3,254 | |
Total investment income | | | 237,914 | |
| | | | | |
Expenses: |
Management fees | | | 228,117 | |
Distribution and service fees: |
A-Class | | | 3,428 | |
C-Class | | | 3,715 | |
H-Class | | | 5,682 | |
Transfer agent and administrative fees | | | 73,995 | |
Portfolio accounting fees | | | 26,843 | |
Registration fees | | | 21,503 | |
Professional fees | | | 10,349 | |
Custodian fees | | | 3,688 | |
Trustees’ fees* | | | 3,333 | |
Miscellaneous | | | 15,189 | |
Total expenses | | | 395,842 | |
Net investment loss | | | (157,928 | ) |
| | | | | |
Net Realized and Unrealized Gain (Loss): |
Net realized gain (loss) on: |
Investments | | | 4,923,049 | |
Net realized gain | | | 4,923,049 | |
Net change in unrealized appreciation (depreciation) on: |
Investments | | | 8,792,473 | |
Net change in unrealized appreciation (depreciation) | | | 8,792,473 | |
Net realized and unrealized gain | | | 13,715,522 | |
Net increase in net assets resulting from operations | | $ | 13,557,594 | |
* | Relates to Trustees not deemed “interested persons” within the meaning of Section 2(a)(19) of the 1940 Act. |
122 | THE RYDEX FUNDS ANNUAL REPORT | SEE NOTES TO FINANCIAL STATEMENTS. |
STATEMENTS OF CHANGES IN NET ASSETS |
| | Year Ended
March 31,
2021 | | | Year Ended
March 31,
2020 | |
Increase (Decrease) in Net Assets from Operations: | | | | | | | | |
Net investment loss | | $ | (157,928 | ) | | $ | (38,822 | ) |
Net realized gain on investments | | | 4,923,049 | | | | 4,774,021 | |
Net change in unrealized appreciation (depreciation) on investments | | | 8,792,473 | | | | (6,572,492 | ) |
Net increase (decrease) in net assets resulting from operations | | | 13,557,594 | | | | (1,837,293 | ) |
| | | | | | | | | |
Capital share transactions: | | | | | | | | |
Proceeds from sale of shares | | | | | | | | |
Investor Class | | | 79,357,647 | | | | 31,349,501 | |
A-Class | | | 1,348,128 | | | | 3,834,435 | |
C-Class | | | 1,002,664 | | | | 834,190 | |
H-Class | | | 9,281,648 | | | | 3,326,658 | |
Cost of shares redeemed | | | | | | | | |
Investor Class | | | (69,048,353 | ) | | | (48,988,755 | ) |
A-Class | | | (417,961 | ) | | | (9,222,466 | ) |
C-Class | | | (1,175,354 | ) | | | (1,028,876 | ) |
H-Class | | | (10,177,931 | ) | | | (9,207,289 | ) |
Net increase (decrease) from capital share transactions | | | 10,170,488 | | | | (29,102,602 | ) |
Net increase (decrease) in net assets | | | 23,728,082 | | | | (30,939,895 | ) |
| | | | | | | | | |
Net assets: | | | | | | | | |
Beginning of year | | | 4,347,170 | | | | 35,287,065 | |
End of year | | $ | 28,075,252 | | | $ | 4,347,170 | |
| | | | | | | | | |
Capital share activity: | | | | | | | | |
Shares sold | | | | | | | | |
Investor Class | | | 1,758,892 | | | | 925,612 | |
A-Class | | | 32,086 | | | | 124,928 | |
C-Class | | | 24,969 | | | | 29,194 | |
H-Class | | | 230,718 | | | | 105,560 | |
Shares redeemed | | | | | | | | |
Investor Class | | | (1,437,219 | ) | | | (1,489,548 | ) |
A-Class | | | (9,294 | ) | | | (291,563 | ) |
C-Class | | | (28,400 | ) | | | (36,199 | ) |
H-Class | | | (231,204 | ) | | | (295,381 | ) |
Net increase (decrease) in shares | | | 340,548 | | | | (927,397 | ) |
SEE NOTES TO FINANCIAL STATEMENTS. | THE RYDEX FUNDS ANNUAL REPORT | 123 |
This table is presented to show selected data for a share outstanding throughout each period and to assist shareholders in evaluating a Fund’s performance for the periods presented.
Investor Class | | Year Ended
March 31,
2021 | | | Year Ended
March 31,
2020 | | | Year Ended
March 31,
2019 | | | Year Ended
March 29,
2018 | | | Year Ended
March 31,
2017 | |
Per Share Data |
Net asset value, beginning of period | | $ | 28.62 | | | $ | 33.46 | | | $ | 30.17 | | | $ | 26.78 | | | $ | 26.98 | |
Income (loss) from investment operations: |
Net investment income (loss)a | | | (.25 | ) | | | (.06 | ) | | | (.02 | ) | | | .11 | | | | .03 | |
Net gain (loss) on investments (realized and unrealized) | | | 28.74 | | | | (4.78 | ) | | | 3.35 | | | | 3.28 | | | | (.23 | ) |
Total from investment operations | | | 28.49 | | | | (4.84 | ) | | | 3.33 | | | | 3.39 | | | | (.20 | ) |
Less distributions from: |
Net investment income | | | — | | | | — | | | | (.03 | ) | | | — | | | | — | |
Net realized gains | | | — | | | | — | | | | (.01 | ) | | | — | | | | — | |
Total distributions | | | — | | | | — | | | | (.04 | ) | | | — | | | | — | |
Net asset value, end of period | | $ | 57.11 | | | $ | 28.62 | | | $ | 33.46 | | | $ | 30.17 | | | $ | 26.78 | |
|
Total Return | | | 99.55 | % | | | (14.47 | %) | | | 11.06 | % | | | 12.66 | % | | | (0.74 | %) |
Ratios/Supplemental Data |
Net assets, end of period (in thousands) | | $ | 24,987 | | | $ | 3,316 | | | $ | 22,748 | | | $ | 19,876 | | | $ | 8,498 | |
Ratios to average net assets: |
Net investment income (loss) | | | (0.52 | %) | | | (0.17 | %) | | | (0.07 | %) | | | 0.40 | % | | | 0.10 | % |
Total expenses | | | 1.43 | % | | | 1.47 | % | | | 1.45 | % | | | 1.37 | % | | | 1.37 | % |
Portfolio turnover rate | | | 270 | % | | | 228 | % | | | 314 | % | | | 1,306 | % | | | 887 | % |
A-Class | | Year Ended
March 31,
2021 | | | Year Ended
March 31,
2020 | | | Year Ended
March 31,
2019 | | | Year Ended
March 29,
2018 | | | Year Ended
March 31,
2017 | |
Per Share Data |
Net asset value, beginning of period | | $ | 27.00 | | | $ | 31.64 | | | $ | 28.60 | | | $ | 25.44 | | | $ | 25.69 | |
Income (loss) from investment operations: |
Net investment income (loss)a | | | (.38 | ) | | | (.13 | ) | | | (.05 | ) | | | — | b | | | (.08 | ) |
Net gain (loss) on investments (realized and unrealized) | | | 27.13 | | | | (4.51 | ) | | | 3.13 | | | | 3.16 | | | | (.17 | ) |
Total from investment operations | | | 26.75 | | | | (4.64 | ) | | | 3.08 | | | | 3.16 | | | | (.25 | ) |
Less distributions from: |
Net investment income | | | — | | | | — | | | | (.03 | ) | | | — | | | | — | |
Net realized gains | | | — | | | | — | | | | (.01 | ) | | | — | | | | — | |
Total distributions | | | — | | | | — | | | | (.04 | ) | | | — | | | | — | |
Net asset value, end of period | | $ | 53.75 | | | $ | 27.00 | | | $ | 31.64 | | | $ | 28.60 | | | $ | 25.44 | |
|
Total Returnc | | | 99.07 | % | | | (14.66 | %) | | | 10.80 | % | | | 12.42 | % | | | (0.97 | %) |
Ratios/Supplemental Data |
Net assets, end of period (in thousands) | | $ | 2,133 | | | $ | 456 | | | $ | 5,806 | | | $ | 1,260 | | | $ | 1,217 | |
Ratios to average net assets: |
Net investment income (loss) | | | (0.83 | %) | | | (0.42 | %) | | | (0.16 | %) | | | — | d | | | (0.34 | %) |
Total expenses | | | 1.67 | % | | | 1.72 | % | | | 1.72 | % | | | 1.63 | % | | | 1.62 | % |
Portfolio turnover rate | | | 270 | % | | | 228 | % | | | 314 | % | | | 1,306 | % | | | 887 | % |
124 | THE RYDEX FUNDS ANNUAL REPORT | SEE NOTES TO FINANCIAL STATEMENTS. |
FINANCIAL HIGHLIGHTS (concluded) |
This table is presented to show selected data for a share outstanding throughout each period and to assist shareholders in evaluating a Fund’s performance for the periods presented.
C-Class | | Year Ended
March 31,
2021 | | | Year Ended
March 31,
2020 | | | Year Ended
March 31,
2019 | | | Year Ended
March 29,
2018 | | | Year Ended
March 31,
2017 | |
Per Share Data |
Net asset value, beginning of period | | $ | 23.67 | | | $ | 27.95 | | | $ | 25.46 | | | $ | 22.83 | | | $ | 23.23 | |
Income (loss) from investment operations: |
Net investment income (loss)a | | | (.62 | ) | | | (.33 | ) | | | (.31 | ) | | | (.17 | ) | | | (.23 | ) |
Net gain (loss) on investments (realized and unrealized) | | | 23.69 | | | | (3.95 | ) | | | 2.84 | | | | 2.80 | | | | (.17 | ) |
Total from investment operations | | | 23.07 | | | | (4.28 | ) | | | 2.53 | | | | 2.63 | | | | (.40 | ) |
Less distributions from: |
Net investment income | | | — | | | | — | | | | (.03 | ) | | | — | | | | — | |
Net realized gains | | | — | | | | — | | | | (.01 | ) | | | — | | | | — | |
Total distributions | | | — | | | | — | | | | (.04 | ) | | | — | | | | — | |
Net asset value, end of period | | $ | 46.74 | | | $ | 23.67 | | | $ | 27.95 | | | $ | 25.46 | | | $ | 22.83 | |
|
Total Returnc | | | 97.47 | % | | | (15.31 | %) | | | 9.97 | % | | | 11.52 | % | | | (1.76 | %) |
Ratios/Supplemental Data |
Net assets, end of period (in thousands) | | $ | 294 | | | $ | 230 | | | $ | 468 | | | $ | 603 | | | $ | 1,601 | |
Ratios to average net assets: |
Net investment income (loss) | | | (1.65 | %) | | | (1.16 | %) | | | (1.15 | %) | | | (0.71 | %) | | | (1.00 | %) |
Total expenses | | | 2.44 | % | | | 2.48 | % | | | 2.46 | % | | | 2.38 | % | | | 2.37 | % |
Portfolio turnover rate | | | 270 | % | | | 228 | % | | | 314 | % | | | 1,306 | % | | | 887 | % |
H-Class | | Year Ended
March 31,
2021 | | | Year Ended
March 31,
2020 | | | Year Ended
March 31,
2019 | | | Year Ended
March 29,
2018 | | | Year Ended
March 31,
2017 | |
Per Share Data |
Net asset value, beginning of period | | $ | 26.35 | | | $ | 30.87 | | | $ | 27.91 | | | $ | 24.83 | | | $ | 25.07 | |
Income (loss) from investment operations: |
Net investment income (loss)a | | | (.39 | ) | | | (.20 | ) | | | (.11 | ) | | | .05 | | | | (— | )b |
Net gain (loss) on investments (realized and unrealized) | | | 26.48 | | | | (4.32 | ) | | | 3.11 | | | | 3.03 | | | | (.24 | ) |
Total from investment operations | | | 26.09 | | | | (4.52 | ) | | | 3.00 | | | | 3.08 | | | | (.24 | ) |
Less distributions from: |
Net investment income | | | — | | | | — | | | | (.03 | ) | | | — | | | | — | |
Net realized gains | | | — | | | | — | | | | (.01 | ) | | | — | | | | — | |
Total distributions | | | — | | | | — | | | | (.04 | ) | | | — | | | | — | |
Net asset value, end of period | | $ | 52.44 | | | $ | 26.35 | | | $ | 30.87 | | | $ | 27.91 | | | $ | 24.83 | |
|
Total Return | | | 99.01 | % | | | (14.64 | %) | | | 10.81 | % | | | 12.40 | % | | | (0.96 | %) |
Ratios/Supplemental Data |
Net assets, end of period (in thousands) | | $ | 661 | | | $ | 345 | | | $ | 6,265 | | | $ | 5,079 | | | $ | 411 | |
Ratios to average net assets: |
Net investment income (loss) | | | (0.91 | %) | | | (0.64 | %) | | | (0.37 | %) | | | 0.18 | % | | | (— | )d |
Total expenses | | | 1.69 | % | | | 1.72 | % | | | 1.70 | % | | | 1.62 | % | | | 1.62 | % |
Portfolio turnover rate | | | 270 | % | | | 228 | % | | | 314 | % | | | 1,306 | % | | | 887 | % |
a | Net investment income (loss) per share was computed using average shares outstanding throughout the period. |
b | Net investment income is less than $0.01 per share. |
c | Total return does not reflect the impact of any applicable sales charges. |
d | Less than 0.01% or (0.01%). |
SEE NOTES TO FINANCIAL STATEMENTS. | THE RYDEX FUNDS ANNUAL REPORT | 125 |
PERFORMANCE REPORT AND FUND PROFILE (Unaudited) | March 31, 2021 |
TECHNOLOGY FUND
OBJECTIVE: Seeks to provide capital appreciation by investing in companies that are involved in the technology sector, including computer software and service companies, semiconductor manufacturers, networking and telecommunications equipment manufacturers, PC hardware, and peripherals companies (“Technology Companies”).
For the one-year period ended March 31, 2021, Technology Fund Investor Class returned 80.31%, compared with 66.61% for the S&P 500 Information Technology Index. The broader S&P 500 Index returned 56.35%.
All industries contributed to return, led by semiconductors, application software and interactive media & services.
Apple, Inc., Alphabet, Inc. - Class A, and Microsoft Corp. contributed the most to the Fund’s return for the period. Momo, Inc. ADR - Class A, Datadog, Inc. - Class A, and Fastly, Inc. - Class A detracted the most from return.
Performance displayed represents past performance, which is no guarantee of future results.
Holdings Diversification (Market Exposure as % of Net Assets)
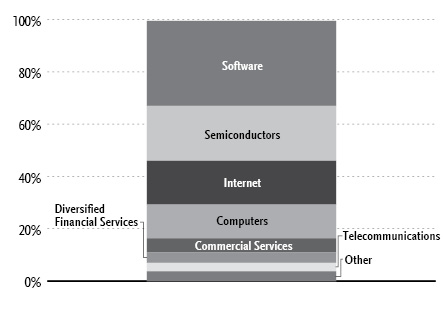
“Holdings Diversification (Market Exposure as % of Net Assets)” excludes any temporary cash investments.
Inception Dates: |
Investor Class | April 14, 1998 |
A-Class | September 1, 2004 |
C-Class | April 18, 2001 |
H-Class | April 29, 1998 |
Ten Largest Holdings (% of Total Net Assets) |
Apple, Inc. | 4.7% |
Microsoft Corp. | 4.4% |
Alphabet, Inc. — Class A | 3.9% |
Facebook, Inc. — Class A | 3.0% |
Visa, Inc. — Class A | 2.2% |
NVIDIA Corp. | 1.9% |
Mastercard, Inc. — Class A | 1.9% |
PayPal Holdings, Inc. | 1.7% |
Intel Corp. | 1.6% |
Adobe, Inc. | 1.6% |
Top Ten Total | 26.9% |
| | |
“Ten Largest Holdings” excludes any temporary cash investments. |
126 | THE RYDEX FUNDS ANNUAL REPORT | |
PERFORMANCE REPORT AND FUND PROFILE (Unaudited)(concluded) | March 31, 2021 |
Cumulative Fund Performance*
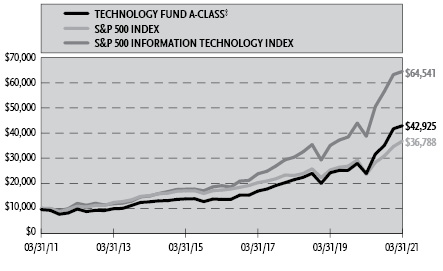
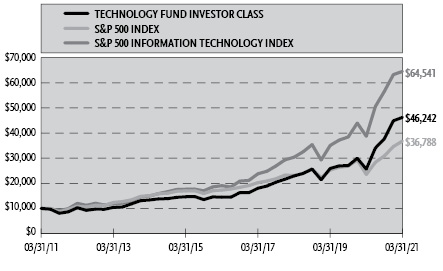
Average Annual Returns*
Periods Ended March 31, 2021
| 1 Year | 5 Year | 10 Year |
Investor Class Shares | 80.31% | 26.15% | 16.55% |
A-Class Shares | 79.86% | 25.84% | 16.25% |
A-Class Shares with sales charge‡ | 71.31% | 24.62% | 15.68% |
C-Class Shares | 78.52% | 24.90% | 15.38% |
C-Class Shares with CDSC§ | 77.52% | 24.90% | 15.38% |
H-Class Shares** | 79.85% | 25.83% | 16.13% |
S&P 500 Information Technology Index | 66.61% | 27.64% | 20.50% |
S&P 500 Index | 56.35% | 16.29% | 13.91% |
* | The performance data above represents past performance that is not predictive of future results. The investment return and principal value of an investment in the Fund will fluctuate so that an investor’s shares, when redeemed, may be worth more or less than their original cost. Returns are historical and include changes in principal and reinvested dividends and capital gains and do not reflect the effect of taxes. The S&P 500 Index and S&P 500 Information Technology Index are unmanaged indices and, unlike the Fund, have no management fees or operating expenses to reduce their reported returns. The graphs are based on Investor Class shares and A-Class shares only; performance for C-Class and H-Class shares will vary due to differences in fee structures. |
** | Effective September 30, 2015, the Fund’s Advisor Class shares were converted into H-Class shares. |
‡ | Fund returns are calculated using the maximum sales charge of 4.75%. |
§ | Fund returns include a CDSC of 1% if redeemed within 12 months of purchase. |
| | THE RYDEX FUNDS ANNUAL REPORT | 127 |
SCHEDULE OF INVESTMENTS | March 31, 2021 |
TECHNOLOGY FUND | |
| | Shares | | | Value | |
COMMON STOCKS† - 99.5% |
| | | | | | | | | |
Software - 32.5% |
Microsoft Corp. | | | 9,740 | | | $ | 2,296,400 | |
Adobe, Inc.* | | | 1,779 | | | | 845,683 | |
Oracle Corp. | | | 11,199 | | | | 785,834 | |
salesforce.com, Inc.* | | | 3,577 | | | | 757,859 | |
Intuit, Inc. | | | 1,469 | | | | 562,715 | |
ServiceNow, Inc.* | | | 1,111 | | | | 555,622 | |
Zoom Video Communications, Inc. — Class A* | | | 1,654 | | | | 531,414 | |
Fidelity National Information Services, Inc. | | | 3,551 | | | | 499,306 | |
Fiserv, Inc.* | | | 3,978 | | | | 473,541 | |
Activision Blizzard, Inc. | | | 5,007 | | | | 465,651 | |
VMware, Inc. — Class A*,1 | | | 2,875 | | | | 432,544 | |
Autodesk, Inc.* | | | 1,558 | | | | 431,800 | |
Workday, Inc. — Class A* | | | 1,682 | | | | 417,859 | |
Twilio, Inc. — Class A* | | | 1,196 | | | | 407,549 | |
Sea Ltd. ADR* | | | 1,676 | | | | 374,133 | |
Cadence Design Systems, Inc.* | | | 2,556 | | | | 350,146 | |
Synopsys, Inc.* | | | 1,407 | | | | 348,626 | |
Electronic Arts, Inc. | | | 2,559 | | | | 346,412 | |
DocuSign, Inc.* | | | 1,639 | | | | 331,815 | |
Paychex, Inc. | | | 3,282 | | | | 321,702 | |
NetEase, Inc. ADR | | | 2,952 | | | | 304,823 | |
Atlassian Corporation plc — Class A* | | | 1,435 | | | | 302,441 | |
ANSYS, Inc.* | | | 885 | | | | 300,511 | |
Bilibili, Inc. ADR* | | | 2,751 | | | | 294,522 | |
Datadog, Inc. — Class A* | | | 3,300 | | | | 275,022 | |
RingCentral, Inc. — Class A* | | | 916 | | | | 272,858 | |
Slack Technologies, Inc. — Class A* | | | 6,447 | | | | 261,942 | |
HubSpot, Inc.* | | | 560 | | | | 254,358 | |
Splunk, Inc.* | | | 1,873 | | | | 253,754 | |
Cloudflare, Inc. — Class A* | | | 3,570 | | | | 250,828 | |
Take-Two Interactive Software, Inc.* | | | 1,413 | | | | 249,677 | |
Coupa Software, Inc.*,1 | | | 929 | | | | 236,412 | |
Broadridge Financial Solutions, Inc. | | | 1,528 | | | | 233,937 | |
Citrix Systems, Inc. | | | 1,658 | | | | 232,717 | |
Tyler Technologies, Inc.* | | | 530 | | | | 225,001 | |
Akamai Technologies, Inc.* | | | 2,199 | | | | 224,078 | |
Fair Isaac Corp.* | | | 440 | | | | 213,862 | |
MongoDB, Inc.* | | | 767 | | | | 205,119 | |
Ceridian HCM Holding, Inc.* | | | 2,280 | | | | 192,136 | |
Nuance Communications, Inc.* | | | 4,376 | | | | 190,969 | |
Jack Henry & Associates, Inc. | | | 1,230 | | | | 186,616 | |
Dropbox, Inc. — Class A* | | | 6,761 | | | | 180,248 | |
Fastly, Inc. — Class A*,1 | | | 2,180 | | | | 146,670 | |
Alteryx, Inc. — Class A* | | | 1,537 | | | | 127,509 | |
Total Software | | | | | | | 17,152,621 | |
| | | | | | | | | |
Semiconductors - 21.1% |
NVIDIA Corp. | | | 1,876 | | | | 1,001,653 | |
Intel Corp. | | | 13,601 | | | | 870,464 | |
Broadcom, Inc. | | | 1,606 | | | | 744,638 | |
Texas Instruments, Inc. | | | 3,924 | | | | 741,597 | |
QUALCOMM, Inc. | | | 5,039 | | | | 668,121 | |
Applied Materials, Inc. | | | 4,826 | | | | 644,754 | |
Micron Technology, Inc.* | | | 6,018 | | | | 530,848 | |
Advanced Micro Devices, Inc.* | | | 6,717 | | | | 527,285 | |
Lam Research Corp. | | | 885 | | | | 526,787 | |
Taiwan Semiconductor Manufacturing Company Ltd. ADR | | | 3,697 | | | | 437,281 | |
Analog Devices, Inc. | | | 2,681 | | | | 415,769 | |
KLA Corp. | | | 1,250 | | | | 413,000 | |
NXP Semiconductor N.V. | | | 1,801 | | | | 362,613 | |
Microchip Technology, Inc. | | | 2,324 | | | | 360,731 | |
ASML Holding N.V. — Class G | | | 567 | | | | 350,043 | |
Marvell Technology Group Ltd. | | | 6,565 | | | | 321,554 | |
Skyworks Solutions, Inc. | | | 1,655 | | | | 303,659 | |
Xilinx, Inc. | | | 2,418 | | | | 299,590 | |
Maxim Integrated Products, Inc. | | | 2,976 | | | | 271,917 | |
Teradyne, Inc. | | | 2,069 | | | | 251,756 | |
Qorvo, Inc.* | | | 1,373 | | | | 250,847 | |
ON Semiconductor Corp.* | | | 5,525 | | | | 229,895 | |
Monolithic Power Systems, Inc. | | | 627 | | | | 221,463 | |
Cree, Inc.* | | | 1,780 | | | | 192,471 | |
Inphi Corp.* | | | 990 | | | | 176,626 | |
Total Semiconductors | | | | | | | 11,115,362 | |
| | | | | | | | | |
Internet - 16.7% |
Alphabet, Inc. — Class A* | | | 992 | | | | 2,046,020 | |
Facebook, Inc. — Class A* | | | 5,443 | | | | 1,603,127 | |
Snap, Inc. — Class A* | | | 8,653 | | | | 452,465 | |
Baidu, Inc. ADR* | | | 1,847 | | | | 401,815 | |
Pinterest, Inc. — Class A* | | | 5,124 | | | | 379,330 | |
Shopify, Inc. — Class A* | | | 341 | | | | 377,316 | |
Twitter, Inc.* | | | 5,893 | | | | 374,972 | |
Match Group, Inc.* | | | 2,310 | | | | 317,348 | |
Palo Alto Networks, Inc.* | | | 946 | | | | 304,669 | |
Zillow Group, Inc. — Class C* | | | 2,309 | | | | 299,339 | |
Okta, Inc.* | | | 1,346 | | | | 296,699 | |
CDW Corp. | | | 1,615 | | | | 267,686 | |
VeriSign, Inc.* | | | 1,326 | | | | 263,556 | |
Wix.com Ltd.* | | | 910 | | | | 254,090 | |
IAC* | | | 1,053 | | | | 227,774 | |
Zendesk, Inc.* | | | 1,651 | | | | 218,956 | |
GoDaddy, Inc. — Class A* | | | 2,600 | | | | 201,812 | |
F5 Networks, Inc.* | | | 954 | | | | 199,023 | |
NortonLifeLock, Inc. | | | 8,935 | | | | 189,958 | |
Anaplan, Inc.* | | | 2,800 | | | | 150,780 | |
Total Internet | | | | | | | 8,826,735 | |
| | | | | | | | | |
Computers - 12.9% |
Apple, Inc. | | | 20,106 | | | | 2,455,948 | |
International Business Machines Corp. | | | 4,463 | | | | 594,740 | |
Accenture plc — Class A | | | 1,637 | | | | 452,221 | |
Dell Technologies, Inc. — Class C* | | | 4,972 | | | | 438,282 | |
Cognizant Technology Solutions Corp. — Class A | | | 4,494 | | | | 351,071 | |
HP, Inc. | | | 10,927 | | | | 346,932 | |
Crowdstrike Holdings, Inc. — Class A* | | | 1,846 | | | | 336,914 | |
Fortinet, Inc.* | | | 1,662 | | | | 306,506 | |
Infosys Ltd. ADR | | | 15,110 | | | | 282,859 | |
Check Point Software Technologies Ltd.* | | | 2,394 | | | | 268,056 | |
128 | THE RYDEX FUNDS ANNUAL REPORT | SEE NOTES TO FINANCIAL STATEMENTS. |
SCHEDULE OF INVESTMENTS (continued) | March 31, 2021 |
TECHNOLOGY FUND | |
| | Shares | | | Value | |
Zscaler, Inc.* | | | 1,491 | | | $ | 255,960 | |
Western Digital Corp. | | | 3,584 | | | | 239,232 | |
Seagate Technology plc | | | 3,008 | | | | 230,864 | |
NetApp, Inc. | | | 3,030 | | | | 220,190 | |
Total Computers | | | | | | | 6,779,775 | |
| | | | | | | | | |
Commercial Services - 5.3% |
PayPal Holdings, Inc.* | | | 3,780 | | | | 917,935 | |
Square, Inc. — Class A* | | | 2,426 | | | | 550,823 | |
Automatic Data Processing, Inc. | | | 2,576 | | | | 485,499 | |
Global Payments, Inc. | | | 2,038 | | | | 410,820 | |
FleetCor Technologies, Inc.* | | | 927 | | | | 249,020 | |
Booz Allen Hamilton Holding Corp. | | | 2,230 | | | | 179,582 | |
Total Commercial Services | | | | | | | 2,793,679 | |
| | | | | | | | | |
Diversified Financial Services - 4.1% |
Visa, Inc. — Class A | | | 5,391 | | | | 1,141,436 | |
Mastercard, Inc. — Class A | | | 2,801 | | | | 997,296 | |
Total Diversified Financial Services | | | | | | | 2,138,732 | |
| | | | | | | | | |
Telecommunications - 3.2% |
Cisco Systems, Inc. | | | 15,847 | | | | 819,448 | |
Motorola Solutions, Inc. | | | 1,639 | | | | 308,214 | |
Arista Networks, Inc.* | | | 892 | | | | 269,286 | |
Ciena Corp.* | | | 2,850 | | | | 155,952 | |
Juniper Networks, Inc. | | | 6,155 | | | | 155,906 | |
Total Telecommunications | | | | | | | 1,708,806 | |
| | | | | | | | | |
Energy-Alternate Sources - 1.4% |
SolarEdge Technologies, Inc.* | | | 1,132 | | | | 325,382 | |
Enphase Energy, Inc.* | | | 1,596 | | | | 258,808 | |
First Solar, Inc.* | | | 1,991 | | | | 173,814 | |
Total Energy-Alternate Sources | | | | | | | 758,004 | |
| | | | | | | | | |
Electronics - 1.2% |
Amphenol Corp. — Class A | | | 5,176 | | | | 341,461 | |
TE Connectivity Ltd. | | | 2,100 | | | | 271,131 | |
Total Electronics | | | | | | | 612,592 | |
| | | | | | | | | |
Advertising - 0.6% |
Trade Desk, Inc. — Class A* | | | 449 | | | | 292,595 | |
| | | | | | | | | |
Office & Business Equipment - 0.5% |
Zebra Technologies Corp. — Class A* | | | 589 | | | | 285,771 | |
| | | | | | | | | |
Total Common Stocks | | | | |
(Cost $21,783,183) | | | | | | | 52,464,672 | |
| | | | | | | | | |
| | | Face
Amount | | | | | |
REPURCHASE AGREEMENTS††,2 - 0.7% |
J.P. Morgan Securities LLC
issued 03/31/21 at 0.01%
due 04/01/21 | | $ | 184,852 | | | | 184,852 | |
Barclays Capital, Inc.
issued 03/31/21 at 0.01%
due 04/01/21 | | | 84,043 | | | | 84,043 | |
BofA Securities, Inc.
issued 03/31/21 at 0.01%
due 04/01/21 | | | 76,702 | | | | 76,702 | |
Total Repurchase Agreements | | | | |
(Cost $345,597) | | | | | | | 345,597 | |
| | | | | | | | | |
| | | Shares | | | | | |
SECURITIES LENDING COLLATERAL†,3 - 1.2% |
Money Market Fund | | | | | | | | |
First American Government Obligations Fund — Class Z, 0.03%4 | | | 606,261 | | | | 606,261 | |
Total Securities Lending Collateral | | | | |
(Cost $606,261) | | | | | | | 606,261 | |
| | | | | | | | | |
Total Investments - 101.4% | | | | |
(Cost $22,735,041) | | $ | 53,416,530 | |
Other Assets & Liabilities, net - (1.4)% | | | (717,146 | ) |
Total Net Assets - 100.0% | | $ | 52,699,384 | |
* | Non-income producing security. |
† | Value determined based on Level 1 inputs — See Note 4. |
†† | Value determined based on Level 2 inputs — See Note 4. |
1 | All or a portion of this security is on loan at March 31, 2021 — See Note 7. |
2 | Repurchase Agreements — See Note 6. |
3 | Securities lending collateral — See Note 7. |
4 | Rate indicated is the 7-day yield as of March 31, 2021. |
| | ADR — American Depositary Receipt |
| | plc — Public Limited Company |
| | |
| | See Sector Classification in Other Information section. |
SEE NOTES TO FINANCIAL STATEMENTS. | THE RYDEX FUNDS ANNUAL REPORT | 129 |
SCHEDULE OF INVESTMENTS (concluded) | March 31, 2021 |
TECHNOLOGY FUND | |
The following table summarizes the inputs used to value the Fund’s investments at March 31, 2021 (See Note 4 in the Notes to Financial Statements):
Investments in Securities (Assets) | | Level 1
Quoted
Prices | | | Level 2
Significant
Observable
Inputs | | | Level 3
Significant
Unobservable
Inputs | | | Total | |
Common Stocks | | $ | 52,464,672 | | | $ | — | | | $ | — | | | $ | 52,464,672 | |
Repurchase Agreements | | | — | | | | 345,597 | | | | — | | | | 345,597 | |
Securities Lending Collateral | | | 606,261 | | | | — | | | | — | | | | 606,261 | |
Total Assets | | $ | 53,070,933 | | | $ | 345,597 | | | $ | — | | | $ | 53,416,530 | |
130 | THE RYDEX FUNDS ANNUAL REPORT | SEE NOTES TO FINANCIAL STATEMENTS. |
STATEMENT OF ASSETS AND LIABILITIES |
March 31, 2021 |
Assets: |
Investments, at value - including $608,783 of securities loaned (cost $22,389,444) | | $ | 53,070,933 | |
Repurchase agreements, at value (cost $345,597) | | | 345,597 | |
Cash | | | 84 | |
Receivables: |
Fund shares sold | | | 132,891 | |
Dividends | | | 14,014 | |
Foreign tax reclaims | | | 1,107 | |
Securities lending income | | | 57 | |
Total assets | | | 53,564,683 | |
| | | | | |
Liabilities: |
Payable for: |
Return of securities lending collateral | | | 606,261 | |
Fund shares redeemed | | | 136,382 | |
Management fees | | | 38,703 | |
Transfer agent and administrative fees | | | 12,248 | |
Distribution and service fees | | | 7,589 | |
Portfolio accounting fees | | | 4,553 | |
Trustees’ fees* | | | 839 | |
Miscellaneous | | | 58,724 | |
Total liabilities | | | 865,299 | |
Commitments and contingent liabilities (Note 10) | | | — | |
Net assets | | $ | 52,699,384 | |
| | | | | |
Net assets consist of: |
Paid in capital | | $ | 17,078,284 | |
Total distributable earnings (loss) | | | 35,621,100 | |
Net assets | | $ | 52,699,384 | |
| | | | | |
Investor Class: |
Net assets | | $ | 35,561,965 | |
Capital shares outstanding | | | 200,136 | |
Net asset value per share | | $ | 177.69 | |
| | | | | |
A-Class: |
Net assets | | $ | 9,189,749 | |
Capital shares outstanding | | | 56,069 | |
Net asset value per share | | $ | 163.90 | |
Maximum offering price per share (Net asset value divided by 95.25%) | | $ | 172.07 | |
| | | | | |
C-Class: |
Net assets | | $ | 6,214,036 | |
Capital shares outstanding | | | 43,211 | |
Net asset value per share | | $ | 143.81 | |
| | | | | |
H-Class: |
Net assets | | $ | 1,733,634 | |
Capital shares outstanding | | | 10,824 | |
Net asset value per share | | $ | 160.17 | |
STATEMENT OF OPERATIONS |
Year Ended March 31, 2021 |
Investment Income: |
Dividends (net of foreign withholding tax of $1,406) | | $ | 498,037 | |
Interest | | | 212 | |
Income from securities lending, net | | | 7,056 | |
Total investment income | | | 505,305 | |
| | | | | |
Expenses: |
Management fees | | | 532,079 | |
Distribution and service fees: |
A-Class | | | 20,089 | |
C-Class | | | 56,328 | |
H-Class | | | 20,410 | |
Transfer agent and administrative fees | | | 175,803 | |
Portfolio accounting fees | | | 62,611 | |
Professional fees | | | 27,897 | |
Trustees’ fees* | | | 13,737 | |
Custodian fees | | | 9,310 | |
Line of credit fees | | | 20 | |
Miscellaneous | | | 83,375 | |
Total expenses | | | 1,001,659 | |
Net investment loss | | | (496,354 | ) |
| | | | | |
Net Realized and Unrealized Gain (Loss): |
Net realized gain (loss) on: |
Investments | | | 16,704,253 | |
Net realized gain | | | 16,704,253 | |
Net change in unrealized appreciation (depreciation) on: |
Investments | | | 17,934,029 | |
Net change in unrealized appreciation (depreciation) | | | 17,934,029 | |
Net realized and unrealized gain | | | 34,638,282 | |
Net increase in net assets resulting from operations | | $ | 34,141,928 | |
* | Relates to Trustees not deemed “interested persons” within the meaning of Section 2(a)(19) of the 1940 Act. |
SEE NOTES TO FINANCIAL STATEMENTS. | THE RYDEX FUNDS ANNUAL REPORT | 131 |
STATEMENTS OF CHANGES IN NET ASSETS |
| | Year Ended
March 31,
2021 | | | Year Ended
March 31,
2020 | |
Increase (Decrease) in Net Assets from Operations: | | | | | | | | |
Net investment loss | | $ | (496,354 | ) | | $ | (238,094 | ) |
Net realized gain on investments | | | 16,704,253 | | | | 7,471,785 | |
Net change in unrealized appreciation (depreciation) on investments | | | 17,934,029 | | | | (9,218,136 | ) |
Net increase (decrease) in net assets resulting from operations | | | 34,141,928 | | | | (1,984,445 | ) |
| | | | | | | | | |
Distributions to shareholders: | | | | | | | | |
Investor Class | | | (626,479 | ) | | | (218,299 | ) |
A-Class | | | (157,334 | ) | | | (36,076 | ) |
C-Class | | | (128,380 | ) | | | (29,921 | ) |
H-Class | | | (148,326 | ) | | | (44,819 | ) |
Total distributions to shareholders | | | (1,060,519 | ) | | | (329,115 | ) |
| | | | | | | | | |
Capital share transactions: | | | | | | | | |
Proceeds from sale of shares | | | | | | | | |
Investor Class | | | 100,514,105 | | | | 114,605,193 | |
A-Class | | | 2,394,726 | | | | 2,836,127 | |
C-Class | | | 4,172,637 | | | | 3,924,183 | |
H-Class | | | 27,010,757 | | | | 30,618,988 | |
Distributions reinvested | | | | | | | | |
Investor Class | | | 611,649 | | | | 214,441 | |
A-Class | | | 153,794 | | | | 35,404 | |
C-Class | | | 127,649 | | | | 29,756 | |
H-Class | | | 147,540 | | | | 44,810 | |
Cost of shares redeemed | | | | | | | | |
Investor Class | | | (108,748,503 | ) | | | (150,527,001 | ) |
A-Class | | | (2,845,095 | ) | | | (3,403,826 | ) |
C-Class | | | (4,736,046 | ) | | | (5,615,143 | ) |
H-Class | | | (34,928,240 | ) | | | (40,117,567 | ) |
Net decrease from capital share transactions | | | (16,125,027 | ) | | | (47,354,635 | ) |
Net increase (decrease) in net assets | | | 16,956,382 | | | | (49,668,195 | ) |
| | | | | | | | | |
Net assets: | | | | | | | | |
Beginning of year | | | 35,743,002 | | | | 85,411,197 | |
End of year | | $ | 52,699,384 | | | $ | 35,743,002 | |
| | | | | | | | | |
Capital share activity: | | | | | | | | |
Shares sold | | | | | | | | |
Investor Class | | | 695,815 | | | | 1,049,477 | |
A-Class | | | 17,600 | | | | 28,267 | |
C-Class | | | 36,933 | | | | 43,711 | |
H-Class | | | 255,121 | | | | 314,033 | |
Shares issued from reinvestment of distributions | | | | | | | | |
Investor Class | | | 3,684 | | | | 1,897 | |
A-Class | | | 1,004 | | | | 338 | |
C-Class | | | 947 | | | | 320 | |
H-Class | | | 985 | | | | 438 | |
Shares redeemed | | | | | | | | |
Investor Class | | | (730,778 | ) | | | (1,419,055 | ) |
A-Class | | | (19,880 | ) | | | (34,820 | ) |
C-Class | | | (40,831 | ) | | | (64,028 | ) |
H-Class | | | (283,151 | ) | | | (415,628 | ) |
Net decrease in shares | | | (62,551 | ) | | | (495,050 | ) |
132 | THE RYDEX FUNDS ANNUAL REPORT | SEE NOTES TO FINANCIAL STATEMENTS. |
This table is presented to show selected data for a share outstanding throughout each period and to assist shareholders in evaluating a Fund’s performance for the periods presented.
Investor Class | | Year Ended
March 31,
2021 | | | Year Ended
March 31,
2020 | | | Year Ended
March 31,
2019 | | | Year Ended
March 29,
2018 | | | Year Ended
March 31,
2017 | |
Per Share Data |
Net asset value, beginning of period | | $ | 100.21 | | | $ | 101.77 | | | $ | 94.62 | | | $ | 75.45 | | | $ | 60.53 | |
Income (loss) from investment operations: |
Net investment income (loss)a | | | (.96 | ) | | | (.22 | ) | | | (.31 | ) | | | (.29 | ) | | | (.09 | ) |
Net gain (loss) on investments (realized and unrealized) | | | 81.24 | | | | (.80 | ) | | | 11.99 | | | | 20.66 | | | | 15.01 | |
Total from investment operations | | | 80.28 | | | | (1.02 | ) | | | 11.68 | | | | 20.37 | | | | 14.92 | |
Less distributions from: |
Net realized gains | | | (2.80 | ) | | | (.54 | ) | | | (4.53 | ) | | | (1.20 | ) | | | — | |
Total distributions | | | (2.80 | ) | | | (.54 | ) | | | (4.53 | ) | | | (1.20 | ) | | | — | |
Net asset value, end of period | | $ | 177.69 | | | $ | 100.21 | | | $ | 101.77 | | | $ | 94.62 | | | $ | 75.45 | |
|
Total Return | | | 80.31 | % | | | (1.06 | %) | | | 13.05 | % | | | 27.11 | % | | | 24.63 | % |
Ratios/Supplemental Data |
Net assets, end of period (in thousands) | | $ | 35,562 | | | $ | 23,190 | | | $ | 60,972 | | | $ | 76,820 | | | $ | 55,016 | |
Ratios to average net assets: |
Net investment income (loss) | | | (0.65 | %) | | | (0.20 | %) | | | (0.32 | %) | | | (0.34 | %) | | | (0.13 | %) |
Total expenses | | | 1.44 | % | | | 1.47 | % | | | 1.46 | % | | | 1.37 | % | | | 1.38 | % |
Portfolio turnover rate | | | 195 | % | | | 165 | % | | | 255 | % | | | 270 | % | | | 320 | % |
A-Class | | Year Ended
March 31,
2021 | | | Year Ended
March 31,
2020 | | | Year Ended
March 31,
2019 | | | Year Ended
March 29,
2018 | | | Year Ended
March 31,
2017 | |
Per Share Data |
Net asset value, beginning of period | | $ | 92.79 | | | $ | 94.51 | | | $ | 88.40 | | | $ | 70.74 | | | $ | 56.88 | |
Income (loss) from investment operations: |
Net investment income (loss)a | | | (1.24 | ) | | | (.41 | ) | | | (.49 | ) | | | (.45 | ) | | | (.25 | ) |
Net gain (loss) on investments (realized and unrealized) | | | 75.15 | | | | (.77 | ) | | | 11.13 | | | | 19.31 | | | | 14.11 | |
Total from investment operations | | | 73.91 | | | | (1.18 | ) | | | 10.64 | | | | 18.86 | | | | 13.86 | |
Less distributions from: |
Net realized gains | | | (2.80 | ) | | | (.54 | ) | | | (4.53 | ) | | | (1.20 | ) | | | — | |
Total distributions | | | (2.80 | ) | | | (.54 | ) | | | (4.53 | ) | | | (1.20 | ) | | | — | |
Net asset value, end of period | | $ | 163.90 | | | $ | 92.79 | | | $ | 94.51 | | | $ | 88.40 | | | $ | 70.74 | |
|
Total Returnb | | | 79.86 | % | | | (1.31 | %) | | | 12.77 | % | | | 26.77 | % | | | 24.37 | % |
Ratios/Supplemental Data |
Net assets, end of period (in thousands) | | $ | 9,190 | | | $ | 5,321 | | | $ | 6,007 | | | $ | 5,033 | | | $ | 3,294 | |
Ratios to average net assets: |
Net investment income (loss) | | | (0.90 | %) | | | (0.40 | %) | | | (0.54 | %) | | | (0.56 | %) | | | (0.40 | %) |
Total expenses | | | 1.69 | % | | | 1.73 | % | | | 1.71 | % | | | 1.63 | % | | | 1.63 | % |
Portfolio turnover rate | | | 195 | % | | | 165 | % | | | 255 | % | | | 270 | % | | | 320 | % |
SEE NOTES TO FINANCIAL STATEMENTS. | THE RYDEX FUNDS ANNUAL REPORT | 133 |
FINANCIAL HIGHLIGHTS (concluded) |
This table is presented to show selected data for a share outstanding throughout each period and to assist shareholders in evaluating a Fund’s performance for the periods presented.
C-Class | | Year Ended
March 31,
2021 | | | Year Ended
March 31,
2020 | | | Year Ended
March 31,
2019 | | | Year Ended
March 29,
2018 | | | Year Ended
March 31,
2017 | |
Per Share Data |
Net asset value, beginning of period | | $ | 82.23 | | | $ | 84.44 | | | $ | 80.06 | | | $ | 64.64 | | | $ | 52.37 | |
Income (loss) from investment operations: |
Net investment income (loss)a | | | (2.01 | ) | | | (1.06 | ) | | | (1.10 | ) | | | (1.02 | ) | | | (.64 | ) |
Net gain (loss) on investments (realized and unrealized) | | | 66.39 | | | | (.61 | ) | | | 10.01 | | | | 17.64 | | | | 12.91 | |
Total from investment operations | | | 64.38 | | | | (1.67 | ) | | | 8.91 | | | | 16.62 | | | | 12.27 | |
Less distributions from: |
Net realized gains | | | (2.80 | ) | | | (.54 | ) | | | (4.53 | ) | | | (1.20 | ) | | | — | |
Total distributions | | | (2.80 | ) | | | (.54 | ) | | | (4.53 | ) | | | (1.20 | ) | | | — | |
Net asset value, end of period | | $ | 143.81 | | | $ | 82.23 | | | $ | 84.44 | | | $ | 80.06 | | | $ | 64.64 | |
|
Total Returnb | | | 78.52 | % | | | (2.05 | %) | | | 11.93 | % | | | 25.85 | % | | | 23.41 | % |
Ratios/Supplemental Data |
Net assets, end of period (in thousands) | | $ | 6,214 | | | $ | 3,796 | | | $ | 5,586 | | | $ | 6,409 | | | $ | 3,203 | |
Ratios to average net assets: |
Net investment income (loss) | | | (1.65 | %) | | | (1.17 | %) | | | (1.33 | %) | | | (1.37 | %) | | | (1.12 | %) |
Total expenses | | | 2.44 | % | | | 2.48 | % | | | 2.46 | % | | | 2.38 | % | | | 2.37 | % |
Portfolio turnover rate | | | 195 | % | | | 165 | % | | | 255 | % | | | 270 | % | | | 320 | % |
H-Class | | Year Ended
March 31,
2021 | | | Year Ended
March 31,
2020 | | | Year Ended
March 31,
2019 | | | Year Ended
March 29,
2018 | | | Year Ended
March 31,
2017 | |
Per Share Data |
Net asset value, beginning of period | | $ | 90.72 | | | $ | 92.40 | | | $ | 86.54 | | | $ | 69.27 | | | $ | 55.72 | |
Income (loss) from investment operations: |
Net investment income (loss)a | | | (1.01 | ) | | | (.47 | ) | | | (.64 | ) | | | (.46 | ) | | | (.30 | ) |
Net gain (loss) on investments (realized and unrealized) | | | 73.26 | | | | (.67 | ) | | | 11.03 | | | | 18.93 | | | | 13.85 | |
Total from investment operations | | | 72.25 | | | | (1.14 | ) | | | 10.39 | | | | 18.47 | | | | 13.55 | |
Less distributions from: |
Net realized gains | | | (2.80 | ) | | | (.54 | ) | | | (4.53 | ) | | | (1.20 | ) | | | — | |
Total distributions | | | (2.80 | ) | | | (.54 | ) | | | (4.53 | ) | | | (1.20 | ) | | | — | |
Net asset value, end of period | | $ | 160.17 | | | $ | 90.72 | | | $ | 92.40 | | | $ | 86.54 | | | $ | 69.27 | |
|
Total Return | | | 79.85 | % | | | (1.30 | %) | | | 12.76 | % | | | 26.78 | % | | | 24.32 | % |
Ratios/Supplemental Data |
Net assets, end of period (in thousands) | | $ | 1,734 | | | $ | 3,435 | | | $ | 12,846 | | | $ | 40,149 | | | $ | 21,504 | |
Ratios to average net assets: |
Net investment income (loss) | | | (0.83 | %) | | | (0.47 | %) | | | (0.71 | %) | | | (0.58 | %) | | | (0.46 | %) |
Total expenses | | | 1.74 | % | | | 1.72 | % | | | 1.70 | % | | | 1.63 | % | | | 1.63 | % |
Portfolio turnover rate | | | 195 | % | | | 165 | % | | | 255 | % | | | 270 | % | | | 320 | % |
a | Net investment income (loss) per share was computed using average shares outstanding throughout the period. |
b | Total return does not reflect the impact of any applicable sales charges. |
134 | THE RYDEX FUNDS ANNUAL REPORT | SEE NOTES TO FINANCIAL STATEMENTS. |
PERFORMANCE REPORT AND FUND PROFILE (Unaudited) | March 31, 2021 |
TELECOMMUNICATIONS FUND
OBJECTIVE: Seeks to provide capital appreciation by investing in companies engaged in the development, manufacture, or sale of communications services or communications equipment (“Telecommunications Companies”).
For the one-year period ended March 31, 2021, Telecommunications Fund Investor Class returned 32.55%, compared with 60.88% for the S&P 500 Telecommunications Services Index. The broader S&P 500 Index returned 56.35%.
All industries contributed to return, led by communications equipment, alternative carriers, and wireless telecommunication services.
T-Mobile US, Inc., Cisco Systems, Inc., and Ubiquiti, Inc. contributed the most to the Fund’s return for the period. China Mobile Ltd. ADR and Charter Communications, Inc. - Class A detracted the most from return.
Performance displayed represents past performance, which is no guarantee of future results.
Holdings Diversification (Market Exposure as % of Net Assets)

“Holdings Diversification (Market Exposure as % of Net Assets)” excludes any temporary cash investments.
Inception Dates: |
Investor Class | April 1, 1998 |
A-Class | September 1, 2004 |
C-Class | April 18, 2001 |
H-Class | April 1, 1998 |
Ten Largest Holdings (% of Total Net Assets) |
Verizon Communications, Inc. | 8.4% |
Cisco Systems, Inc. | 8.1% |
AT&T, Inc. | 7.9% |
T-Mobile US, Inc. | 6.7% |
Comcast Corp. — Class A | 6.6% |
Charter Communications, Inc. — Class A | 5.2% |
Motorola Solutions, Inc. | 3.7% |
Liberty Broadband Corp. — Class C | 3.4% |
Arista Networks, Inc. | 3.2% |
DISH Network Corp. — Class A | 2.7% |
Top Ten Total | 55.9% |
| | |
“Ten Largest Holdings” excludes any temporary cash investments. |
| | THE RYDEX FUNDS ANNUAL REPORT | 135 |
PERFORMANCE REPORT AND FUND PROFILE (Unaudited)(concluded) | March 31, 2021 |
Cumulative Fund Performance*


Average Annual Returns*
Periods Ended March 31, 2021
| 1 Year | 5 Year | 10 Year |
Investor Class Shares | 32.55% | 8.06% | 4.37% |
A-Class Shares | 32.20% | 7.79% | 4.11% |
A-Class Shares with sales charge‡ | 25.93% | 6.74% | 3.61% |
C-Class Shares | 31.22% | 6.98% | 3.40% |
C-Class Shares with CDSC§ | 30.22% | 6.98% | 3.40% |
H-Class Shares** | 32.24% | 7.84% | 4.01% |
S&P 500 Telecommunication Services Index | 60.88% | 10.15% | 10.41% |
S&P 500 Index | 56.35% | 16.29% | 13.91% |
* | The performance data above represents past performance that is not predictive of future results. The investment return and principal value of an investment in the Fund will fluctuate so that an investor’s shares, when redeemed, may be worth more or less than their original cost. Returns are historical and include changes in principal and reinvested dividends and capital gains and do not reflect the effect of taxes. The S&P 500 Index and the S&P 500 Telecommunication Services Index are unmanaged indices and, unlike the Fund, have no management fees or operating expenses to reduce their reported returns. The graphs are based on Investor Class shares and A-Class shares only; performance for C-Class and H-Class shares will vary due to differences in fee structures. |
** | Effective September 30, 2015, the Fund’s Advisor Class shares were converted into H-Class shares. |
‡ | Fund returns are calculated using the maximum sales charge of 4.75%. |
§ | Fund returns include a CDSC of 1% if redeemed within 12 months of purchase. |
136 | THE RYDEX FUNDS ANNUAL REPORT | |
SCHEDULE OF INVESTMENTS | March 31, 2021 |
TELECOMMUNICATIONS FUND | |
| | Shares | | | Value | |
COMMON STOCKS† - 99.5% |
| | | | | | | | | |
Telecommunications - 66.8% |
Verizon Communications, Inc. | | | 3,877 | | | $ | 225,448 | |
Cisco Systems, Inc. | | | 4,206 | | | | 217,492 | |
AT&T, Inc. | | | 6,971 | | | | 211,012 | |
T-Mobile US, Inc.* | | | 1,426 | | | | 178,664 | |
Motorola Solutions, Inc. | | | 524 | | | | 98,538 | |
Arista Networks, Inc.* | | | 282 | | | | 85,133 | |
Ubiquiti, Inc. | | | 234 | | | | 69,802 | |
Lumen Technologies, Inc. | | | 4,809 | | | | 64,200 | |
Ciena Corp.* | | | 909 | | | | 49,741 | |
Juniper Networks, Inc. | | | 1,958 | | | | 49,596 | |
Iridium Communications, Inc.* | | | 1,013 | | | | 41,786 | |
America Movil SAB de CV — Class L ADR | | | 2,744 | | | | 37,264 | |
BCE, Inc. | | | 823 | | | | 37,150 | |
Vodafone Group plc ADR | | | 1,983 | | | | 36,547 | |
TELUS Corp. | | | 1,696 | | | | 33,801 | |
Rogers Communications, Inc. — Class B | | | 714 | | | | 32,915 | |
Viavi Solutions, Inc.* | | | 2,030 | | | | 31,871 | |
Viasat, Inc.* | | | 618 | | | | 29,707 | |
CommScope Holding Company, Inc.* | | | 1,918 | | | | 29,460 | |
Vonage Holdings Corp.* | | | 2,485 | | | | 29,373 | |
Telephone & Data Systems, Inc. | | | 1,219 | | | | 27,988 | |
Shenandoah Telecommunications Co. | | | 546 | | | | 26,650 | |
InterDigital, Inc. | | | 374 | | | | 23,730 | |
Infinera Corp.* | | | 2,444 | | | | 23,536 | |
Calix, Inc.* | | | 627 | | | | 21,732 | |
Plantronics, Inc.* | | | 543 | | | | 21,128 | |
NETGEAR, Inc.* | | | 458 | | | | 18,824 | |
Inseego Corp.*,1 | | | 1,712 | | | | 17,120 | |
Cincinnati Bell, Inc.* | | | 988 | | | | 15,166 | |
Total Telecommunications | | | | | | | 1,785,374 | |
| | | | | | | | | |
Media - 25.3% |
Comcast Corp. — Class A | | | 3,276 | | | | 177,264 | |
Charter Communications, Inc. — Class A* | | | 227 | | | | 140,064 | |
Liberty Broadband Corp. — Class C* | | | 612 | | | | 91,892 | |
DISH Network Corp. — Class A* | | | 2,028 | | | | 73,414 | |
Altice USA, Inc. — Class A* | | | 2,030 | | | | 66,036 | |
Cable One, Inc. | | | 32 | | | | 58,507 | |
Liberty Global plc — Class C* | | | 1,628 | | | | 41,579 | |
Liberty Latin America Ltd. — Class C* | | | 2,199 | | | | 28,543 | |
Total Media | | | | | | | 677,299 | |
Internet - 3.6% |
F5 Networks, Inc.* | | | 301 | | | | 62,795 | |
Cogent Communications Holdings, Inc. | | | 470 | | | | 32,317 | |
Total Internet | | | | | | | 95,112 | |
| | | | | | | | | |
Computers - 2.6% |
Lumentum Holdings, Inc.* | | | 513 | | | | 46,862 | |
NetScout Systems, Inc.* | | | 854 | | | | 24,049 | |
Total Computers | | | | | | | 70,911 | |
| | | | | | | | | |
Software - 1.2% |
Bandwidth, Inc. — Class A* | | | 247 | | | | 31,305 | |
| | | | | | | | | |
Total Common Stocks | | | | |
(Cost $2,174,437) | | | | | | | 2,660,001 | |
| | | | | | | | | |
| | | Face
Amount | | | | | |
REPURCHASE AGREEMENTS††,2 - 0.6% |
J.P. Morgan Securities LLC
issued 03/31/21 at 0.01%
due 04/01/21 | | $ | 8,619 | | | | 8,619 | |
Barclays Capital, Inc.
issued 03/31/21 at 0.01%
due 04/01/21 | | | 3,919 | | | | 3,919 | |
BofA Securities, Inc.
issued 03/31/21 at 0.01%
due 04/01/21 | | | 3,576 | | | | 3,576 | |
Total Repurchase Agreements | | | | |
(Cost $16,114) | | | | | | | 16,114 | |
| | | | | | | | | |
| | | Shares | | | | | |
SECURITIES LENDING COLLATERAL†,3 - 0.3% |
Money Market Fund | | | | | | | | |
First American Government Obligations Fund — Class Z, 0.03%4 | | | 8,570 | | | | 8,570 | |
Total Securities Lending Collateral | | | | |
(Cost $8,570) | | | | | | | 8,570 | |
| | | | | | | | | |
Total Investments - 100.4% | | | | |
(Cost $2,199,121) | | $ | 2,684,685 | |
Other Assets & Liabilities, net - (0.4)% | | | (11,966 | ) |
Total Net Assets - 100.0% | | $ | 2,672,719 | |
* | Non-income producing security. |
† | Value determined based on Level 1 inputs — See Note 4. |
†† | Value determined based on Level 2 inputs — See Note 4. |
1 | All or a portion of this security is on loan at March 31, 2021 — See Note 7. |
2 | Repurchase Agreements — See Note 6. |
3 | Securities lending collateral — See Note 7. |
4 | Rate indicated is the 7-day yield as of March 31, 2021. |
| | ADR — American Depositary Receipt |
| | plc — Public Limited Company |
| | |
| | See Sector Classification in Other Information section. |
SEE NOTES TO FINANCIAL STATEMENTS. | THE RYDEX FUNDS ANNUAL REPORT | 137 |
SCHEDULE OF INVESTMENTS (concluded) | March 31, 2021 |
TELECOMMUNICATIONS FUND | |
The following table summarizes the inputs used to value the Fund’s investments at March 31, 2021 (See Note 4 in the Notes to Financial Statements):
Investments in Securities (Assets) | | Level 1
Quoted
Prices | | | Level 2
Significant
Observable
Inputs | | | Level 3
Significant
Unobservable
Inputs | | | Total | |
Common Stocks | | $ | 2,660,001 | | | $ | — | | | $ | — | | | $ | 2,660,001 | |
Repurchase Agreements | | | — | | | | 16,114 | | | | — | | | | 16,114 | |
Securities Lending Collateral | | | 8,570 | | | | — | | | | — | | | | 8,570 | |
Total Assets | | $ | 2,668,571 | | | $ | 16,114 | | | $ | — | | | $ | 2,684,685 | |
138 | THE RYDEX FUNDS ANNUAL REPORT | SEE NOTES TO FINANCIAL STATEMENTS. |
STATEMENT OF ASSETS AND LIABILITIES |
March 31, 2021 |
Assets: |
Investments, at value - including $8,570 of securities loaned (cost $2,183,007) | | $ | 2,668,571 | |
Repurchase agreements, at value (cost $16,114) | | | 16,114 | |
Receivables: |
Fund shares sold | | | 32,519 | |
Dividends | | | 2,885 | |
Securities lending income | | | 25 | |
Total assets | | | 2,720,114 | |
| | | | | |
Liabilities: |
Payable for: |
Securities purchased | | | 19,161 | |
Fund shares redeemed | | | 14,215 | |
Return of securities lending collateral | | | 8,570 | |
Management fees | | | 1,754 | |
Transfer agent and administrative fees | | | 555 | |
Distribution and service fees | | | 313 | |
Portfolio accounting fees | | | 207 | |
Trustees’ fees* | | | 37 | |
Miscellaneous | | | 2,583 | |
Total liabilities | | | 47,395 | |
Commitments and contingent liabilities (Note 10) | | | — | |
Net assets | | $ | 2,672,719 | |
| | | | | |
Net assets consist of: |
Paid in capital | | $ | 4,398,398 | |
Total distributable earnings (loss) | | | (1,725,679 | ) |
Net assets | | $ | 2,672,719 | |
| | | | | |
Investor Class: |
Net assets | | $ | 1,772,839 | |
Capital shares outstanding | | | 31,639 | |
Net asset value per share | | $ | 56.03 | |
| | | | | |
A-Class: |
Net assets | | $ | 467,215 | |
Capital shares outstanding | | | 9,184 | |
Net asset value per share | | $ | 50.87 | |
Maximum offering price per share (Net asset value divided by 95.25%) | | $ | 53.41 | |
| | | | | |
C-Class: |
Net assets | | $ | 187,967 | |
Capital shares outstanding | | | 4,269 | |
Net asset value per share | | $ | 44.03 | |
| | | | | |
H-Class: |
Net assets | | $ | 244,698 | |
Capital shares outstanding | | | 4,943 | |
Net asset value per share | | $ | 49.50 | |
STATEMENT OF OPERATIONS |
Year Ended March 31, 2021 |
Investment Income: |
Dividends (net of foreign withholding tax of $1,260) | | $ | 117,139 | |
Interest | | | 10 | |
Income from securities lending, net | | | 130 | |
Total investment income | | | 117,279 | |
| | | | | |
Expenses: |
Management fees | | | 36,389 | |
Distribution and service fees: |
A-Class | | | 1,209 | |
C-Class | | | 1,633 | |
H-Class | | | 370 | |
Transfer agent and administrative fees | | | 12,160 | |
Registration fees | | | 4,486 | |
Portfolio accounting fees | | | 4,282 | |
Professional fees | | | 2,575 | |
Trustees’ fees* | | | 1,209 | |
Custodian fees | | | 652 | |
Line of credit fees | | | 11 | |
Miscellaneous | | | 469 | |
Total expenses | | | 65,445 | |
Net investment income | | | 51,834 | |
| | | | | |
Net Realized and Unrealized Gain (Loss): |
Net realized gain (loss) on: |
Investments | | | 452,744 | |
Net realized gain | | | 452,744 | |
Net change in unrealized appreciation (depreciation) on: |
Investments | | | 577,545 | |
Net change in unrealized appreciation (depreciation) | | | 577,545 | |
Net realized and unrealized gain | | | 1,030,289 | |
Net increase in net assets resulting from operations | | $ | 1,082,123 | |
* | Relates to Trustees not deemed “interested persons” within the meaning of Section 2(a)(19) of the 1940 Act. |
SEE NOTES TO FINANCIAL STATEMENTS. | THE RYDEX FUNDS ANNUAL REPORT | 139 |
STATEMENTS OF CHANGES IN NET ASSETS |
| | Year Ended
March 31,
2021 | | | Year Ended
March 31,
2020 | |
Increase (Decrease) in Net Assets from Operations: | | | | | | | | |
Net investment income | | $ | 51,834 | | | $ | 64,953 | |
Net realized gain (loss) on investments | | | 452,744 | | | | (95,584 | ) |
Net change in unrealized appreciation (depreciation) on investments | | | 577,545 | | | | (901,647 | ) |
Net increase (decrease) in net assets resulting from operations | | | 1,082,123 | | | | (932,278 | ) |
| | | | | | | | | |
Distributions to shareholders: | | | | | | | | |
Investor Class | | | (33,285 | ) | | | (113,546 | ) |
A-Class | | | (11,456 | ) | | | (17,634 | ) |
C-Class | | | (5,894 | ) | | | (6,767 | ) |
H-Class | | | (2,961 | ) | | | (15,192 | ) |
Total distributions to shareholders | | | (53,596 | ) | | | (153,139 | ) |
| | | | | | | | | |
Capital share transactions: | | | | | | | | |
Proceeds from sale of shares | | | | | | | | |
Investor Class | | | 11,143,082 | | | | 24,964,902 | |
A-Class | | | 215,071 | | | | 623,152 | |
C-Class | | | 1,114,484 | | | | 1,848,670 | |
H-Class | | | 179,033 | | | | 1,719,340 | |
Distributions reinvested | | | | | | | | |
Investor Class | | | 32,851 | | | | 112,956 | |
A-Class | | | 9,865 | | | | 17,633 | |
C-Class | | | 5,868 | | | | 6,726 | |
H-Class | | | 2,961 | | | | 15,192 | |
Cost of shares redeemed | | | | | | | | |
Investor Class | | | (13,224,675 | ) | | | (24,123,207 | ) |
A-Class | | | (325,159 | ) | | | (640,505 | ) |
C-Class | | | (1,087,947 | ) | | | (1,966,664 | ) |
H-Class | | | (71,584 | ) | | | (1,924,759 | ) |
Net increase (decrease) from capital share transactions | | | (2,006,150 | ) | | | 653,436 | |
Net decrease in net assets | | | (977,623 | ) | | | (431,981 | ) |
| | | | | | | | | |
Net assets: | | | | | | | | |
Beginning of year | | | 3,650,342 | | | | 4,082,323 | |
End of year | | $ | 2,672,719 | | | $ | 3,650,342 | |
| | | | | | | | | |
Capital share activity: | | | | | | | | |
Shares sold | | | | | | | | |
Investor Class | | | 222,275 | | | | 495,964 | |
A-Class | | | 4,543 | | | | 13,794 | |
C-Class | | | 28,170 | | | | 45,924 | |
H-Class | | | 3,760 | | | | 38,272 | |
Shares issued from reinvestment of distributions | | | | | | | | |
Investor Class | | | 622 | | | | 2,364 | |
A-Class | | | 205 | | | | 404 | |
C-Class | | | 141 | | | | 176 | |
H-Class | | | 63 | | | | 358 | |
Shares redeemed | | | | | | | | |
Investor Class | | | (260,351 | ) | | | (488,814 | ) |
A-Class | | | (6,878 | ) | | | (13,917 | ) |
C-Class | | | (27,407 | ) | | | (48,887 | ) |
H-Class | | | (1,601 | ) | | | (43,359 | ) |
Net increase (decrease) in shares | | | (36,458 | ) | | | 2,279 | |
140 | THE RYDEX FUNDS ANNUAL REPORT | SEE NOTES TO FINANCIAL STATEMENTS. |
This table is presented to show selected data for a share outstanding throughout each period and to assist shareholders in evaluating a Fund’s performance for the periods presented.
Investor Class | | Year Ended
March 31,
2021 | | | Year Ended
March 31,
2020 | | | Year Ended
March 31,
2019 | | | Year Ended
March 29,
2018 | | | Year Ended
March 31,
2017 | |
Per Share Data |
Net asset value, beginning of period | | $ | 43.19 | | | $ | 50.17 | | | $ | 47.66 | | | $ | 47.95 | | | $ | 42.91 | |
Income (loss) from investment operations: |
Net investment income (loss)a | | | .66 | | | | .69 | | | | .46 | | | | .43 | | | | .49 | |
Net gain (loss) on investments (realized and unrealized) | | | 13.33 | | | | (5.91 | ) | | | 2.17 | c | | | 1.17 | | | | 5.55 | |
Total from investment operations | | | 13.99 | | | | (5.22 | ) | | | 2.63 | | | | 1.60 | | | | 6.04 | |
Less distributions from: |
Net investment income | | | (1.15 | ) | | | (1.76 | ) | | | (.02 | ) | | | (1.89 | ) | | | (1.00 | ) |
Net realized gains | | | — | | | | — | | | | (.10 | ) | | | — | | | | — | |
Total distributions | | | (1.15 | ) | | | (1.76 | ) | | | (.12 | ) | | | (1.89 | ) | | | (1.00 | ) |
Net asset value, end of period | | $ | 56.03 | | | $ | 43.19 | | | $ | 50.17 | | | $ | 47.66 | | | $ | 47.95 | |
|
Total Return | | | 32.55 | % | | | (10.74 | %) | | | 5.52 | % | | | 3.33 | % | | | 14.21 | % |
Ratios/Supplemental Data |
Net assets, end of period (in thousands) | | $ | 1,773 | | | $ | 2,984 | | | $ | 2,989 | | | $ | 1,309 | | | $ | 12,539 | |
Ratios to average net assets: |
Net investment income (loss) | | | 1.33 | % | | | 1.38 | % | | | 0.94 | % | | | 0.89 | % | | | 1.09 | % |
Total expenses | | | 1.46 | % | | | 1.48 | % | | | 1.47 | % | | | 1.38 | % | | | 1.38 | % |
Portfolio turnover rate | | | 344 | % | | | 561 | % | | | 2,115 | % | | | 1,455 | % | | | 605 | % |
A-Class | | Year Ended
March 31,
2021 | | | Year Ended
March 31,
2020 | | | Year Ended
March 31,
2019 | | | Year Ended
March 29,
2018 | | | Year Ended
March 31,
2017 | |
Per Share Data |
Net asset value, beginning of period | | $ | 39.40 | | | $ | 46.03 | | | $ | 43.84 | | | $ | 44.39 | | | $ | 39.88 | |
Income (loss) from investment operations: |
Net investment income (loss)a | | | .41 | | | | .31 | | | | .43 | | | | .20 | | | | .32 | |
Net gain (loss) on investments (realized and unrealized) | | | 12.21 | | | | (5.18 | ) | | | 1.88 | c | | | 1.14 | | | | 5.19 | |
Total from investment operations | | | 12.62 | | | | (4.87 | ) | | | 2.31 | | | | 1.34 | | | | 5.51 | |
Less distributions from: |
Net investment income | | | (1.15 | ) | | | (1.76 | ) | | | (.02 | ) | | | (1.89 | ) | | | (1.00 | ) |
Net realized gains | | | — | | | | — | | | | (.10 | ) | | | — | | | | — | |
Total distributions | | | (1.15 | ) | | | (1.76 | ) | | | (.12 | ) | | | (1.89 | ) | | | (1.00 | ) |
Net asset value, end of period | | $ | 50.87 | | | $ | 39.40 | | | $ | 46.03 | | | $ | 43.84 | | | $ | 44.39 | |
|
Total Returnb | | | 32.20 | % | | | (10.95 | %) | | | 5.27 | % | | | 3.08 | % | | | 13.88 | % |
Ratios/Supplemental Data |
Net assets, end of period (in thousands) | | $ | 467 | | | $ | 446 | | | $ | 508 | | | $ | 448 | | | $ | 1,081 | |
Ratios to average net assets: |
Net investment income (loss) | | | 0.90 | % | | | 0.69 | % | | | 0.96 | % | | | 0.45 | % | | | 0.75 | % |
Total expenses | | | 1.70 | % | | | 1.73 | % | | | 1.71 | % | | | 1.63 | % | | | 1.62 | % |
Portfolio turnover rate | | | 344 | % | | | 561 | % | | | 2,115 | % | | | 1,455 | % | | | 605 | % |
SEE NOTES TO FINANCIAL STATEMENTS. | THE RYDEX FUNDS ANNUAL REPORT | 141 |
FINANCIAL HIGHLIGHTS (concluded) |
This table is presented to show selected data for a share outstanding throughout each period and to assist shareholders in evaluating a Fund’s performance for the periods presented.
C-Class | | Year Ended
March 31,
2021 | | | Year Ended
March 31,
2020 | | | Year Ended
March 31,
2019 | | | Year Ended
March 29,
2018 | | | Year Ended
March 31,
2017 | |
Per Share Data |
Net asset value, beginning of period | | $ | 34.47 | | | $ | 40.81 | | | $ | 39.17 | | | $ | 40.14 | | | $ | 36.43 | |
Income (loss) from investment operations: |
Net investment income (loss)a | | | .01 | | | | .04 | | | | .06 | | | | (.09 | ) | | | .03 | |
Net gain (loss) on investments (realized and unrealized) | | | 10.70 | | | | (4.62 | ) | | | 1.70 | c | | | 1.01 | | | | 4.68 | |
Total from investment operations | | | 10.71 | | | | (4.58 | ) | | | 1.76 | | | | .92 | | | | 4.71 | |
Less distributions from: |
Net investment income | | | (1.15 | ) | | | (1.76 | ) | | | (.02 | ) | | | (1.89 | ) | | | (1.00 | ) |
Net realized gains | | | — | | | | — | | | | (.10 | ) | | | — | | | | — | |
Total distributions | | | (1.15 | ) | | | (1.76 | ) | | | (.12 | ) | | | (1.89 | ) | | | (1.00 | ) |
Net asset value, end of period | | $ | 44.03 | | | $ | 34.47 | | | $ | 40.81 | | | $ | 39.17 | | | $ | 40.14 | |
|
Total Returnb | | | 31.22 | % | | | (11.62 | %) | | | 4.49 | % | | | 2.30 | % | | | 13.05 | % |
Ratios/Supplemental Data |
Net assets, end of period (in thousands) | | $ | 188 | | | $ | 116 | | | $ | 251 | | | $ | 368 | | | $ | 406 | |
Ratios to average net assets: |
Net investment income (loss) | | | 0.03 | % | | | 0.10 | % | | | 0.15 | % | | | (0.22 | %) | | | 0.07 | % |
Total expenses | | | 2.43 | % | | | 2.48 | % | | | 2.46 | % | | | 2.38 | % | | | 2.37 | % |
Portfolio turnover rate | | | 344 | % | | | 561 | % | | | 2,115 | % | | | 1,455 | % | | | 605 | % |
H-Class | | Year Ended
March 31,
2021 | | | Year Ended
March 31,
2020 | | | Year Ended
March 31,
2019 | | | Year Ended
March 29,
2018 | | | Year Ended
March 31,
2017 | |
Per Share Data |
Net asset value, beginning of period | | $ | 38.36 | | | $ | 44.88 | | | $ | 42.66 | | | $ | 43.21 | | | $ | 38.85 | |
Income (loss) from investment operations: |
Net investment income (loss)a | | | .28 | | | | .44 | | | | 1.16 | | | | (.06 | ) | | | .58 | |
Net gain (loss) on investments (realized and unrealized) | | | 12.01 | | | | (5.20 | ) | | | 1.18 | c | | | 1.40 | | | | 4.78 | |
Total from investment operations | | | 12.29 | | | | (4.76 | ) | | | 2.34 | | | | 1.34 | | | | 5.36 | |
Less distributions from: |
Net investment income | | | (1.15 | ) | | | (1.76 | ) | | | (.02 | ) | | | (1.89 | ) | | | (1.00 | ) |
Net realized gains | | | — | | | | — | | | | (.10 | ) | | | — | | | | — | |
Total distributions | | | (1.15 | ) | | | (1.76 | ) | | | (.12 | ) | | | (1.89 | ) | | | (1.00 | ) |
Net asset value, end of period | | $ | 49.50 | | | $ | 38.36 | | | $ | 44.88 | | | $ | 42.66 | | | $ | 43.21 | |
|
Total Return | | | 32.24 | % | | | (10.98 | %) | | | 5.51 | % | | | 3.07 | % | | | 13.94 | % |
Ratios/Supplemental Data |
Net assets, end of period (in thousands) | | $ | 245 | | | $ | 104 | | | $ | 334 | | | $ | 140 | | | $ | 1,213 | |
Ratios to average net assets: |
Net investment income (loss) | | | 0.61 | % | | | 0.99 | % | | | 2.73 | % | | | (0.14 | %) | | | 1.44 | % |
Total expenses | | | 1.68 | % | | | 1.73 | % | | | 1.74 | % | | | 1.63 | % | | | 1.62 | % |
Portfolio turnover rate | | | 344 | % | | | 561 | % | | | 2,115 | % | | | 1,455 | % | | | 605 | % |
a | Net investment income (loss) per share was computed using average shares outstanding throughout the period. |
b | Total return does not reflect the impact of any applicable sales charges. |
c | The amount shown for a share outstanding throughout the period does not accord with the aggregate net losses on investments for the year because of the sales and repurchases of fund shares in relation to fluctuating market value of the investments of the Fund. |
142 | THE RYDEX FUNDS ANNUAL REPORT | SEE NOTES TO FINANCIAL STATEMENTS. |
PERFORMANCE REPORT AND FUND PROFILE (Unaudited) | March 31, 2021 |
TRANSPORTATION FUND
OBJECTIVE: Seeks to provide capital appreciation by investing in companies engaged in providing transportation services or companies engaged in the design, manufacture, distribution, or sale of transportation equipment (“Transportation Companies”).
For the one-year period ended March 31, 2021, Transportation Fund Investor Class returned 125.41%, compared with 69.61% for the S&P 500 Industrials Index. The broader S&P 500 Index returned 56.35%.
Automobile manufacturers, trucking, and auto parts & equipment contributed the most to return of the Fund for the period. The only industry to detract from return was construction machinery & heavy trucks.
Tesla, Inc., United Parcel Service, Inc. - Class B, and General Motors Co. contributed the most to the Fund’s return for the period. QuantumScape Corp., Hertz Global Holdings, Inc., and Luminar Technologies, Inc. detracted the most from return.
Performance displayed represents past performance, which is no guarantee of future results.
Holdings Diversification (Market Exposure as % of Net Assets)
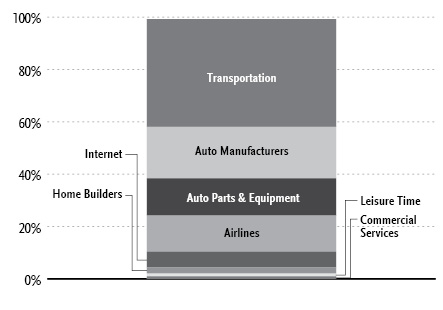
“Holdings Diversification (Market Exposure as % of Net Assets)” excludes any temporary cash investments.
Inception Dates: |
Investor Class | April 2, 1998 |
A-Class | September 1, 2004 |
C-Class | May 14, 2001 |
H-Class | June 9, 1998 |
Ten Largest Holdings (% of Total Net Assets) |
Tesla, Inc. | 8.8% |
United Parcel Service, Inc. — Class B | 5.1% |
Union Pacific Corp. | 5.0% |
Uber Technologies, Inc. | 4.1% |
FedEx Corp. | 3.7% |
General Motors Co. | 3.7% |
CSX Corp. | 3.6% |
Norfolk Southern Corp. | 3.4% |
NIO, Inc. ADR | 2.6% |
Southwest Airlines Co. | 2.5% |
Top Ten Total | 42.5% |
| | |
“Ten Largest Holdings” excludes any temporary cash investments. |
| | THE RYDEX FUNDS ANNUAL REPORT | 143 |
PERFORMANCE REPORT AND FUND PROFILE (Unaudited)(concluded) | March 31, 2021 |
Cumulative Fund Performance*
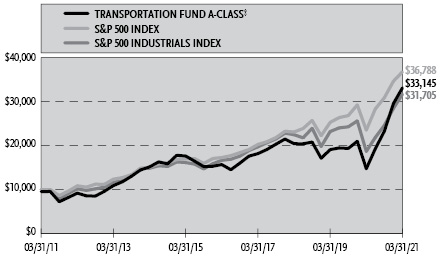
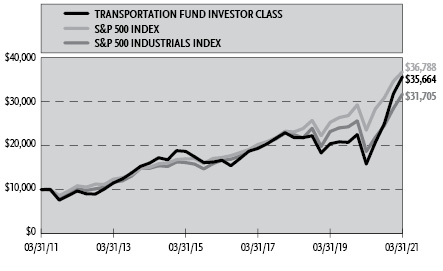
Average Annual Returns*
Periods Ended March 31, 2021
| 1 Year | 5 Year | 10 Year |
Investor Class Shares | 125.41% | 16.42% | 13.56% |
A-Class Shares | 124.81% | 16.13% | 13.28% |
A-Class Shares with sales charge‡ | 114.13% | 15.00% | 12.73% |
C-Class Shares | 123.15% | 15.26% | 12.44% |
C-Class Shares with CDSC§ | 122.15% | 15.26% | 12.44% |
H-Class Shares** | 124.86% | 16.12% | 13.16% |
S&P 500 Industrials Index | 69.61% | 13.72% | 12.23% |
S&P 500 Index | 56.35% | 16.29% | 13.91% |
* | The performance data above represents past performance that is not predictive of future results. The investment return and principal value of an investment in the Fund will fluctuate so that an investor’s shares, when redeemed, may be worth more or less than their original cost. Returns are historical and include changes in principal and reinvested dividends and capital gains and do not reflect the effect of taxes. The S&P 500 Index and the S&P 500 Industrials Index are unmanaged indices and, unlike the Fund, have no management fees or operating expenses to reduce their reported returns. The graphs are based on Investor Class shares and A-Class shares only; performance for C-Class and H-Class shares will vary due to differences in fee structures. |
** | Effective September 30, 2015, the Fund’s Advisor Class shares were converted into H-Class shares |
‡ | Fund returns are calculated using the maximum sales charge of 4.75%. |
§ | Fund returns include a CDSC of 1% if redeemed within 12 months of purchase. |
144 | THE RYDEX FUNDS ANNUAL REPORT | |
SCHEDULE OF INVESTMENTS | March 31, 2021 |
TRANSPORTATION FUND | |
| | Shares | | | Value | |
COMMON STOCKS† - 99.3% |
| | | | | | | | | |
Transportation - 41.2% |
United Parcel Service, Inc. — Class B | | | 22,881 | | | $ | 3,889,541 | |
Union Pacific Corp. | | | 17,361 | | | | 3,826,538 | |
FedEx Corp. | | | 9,904 | | | | 2,813,132 | |
CSX Corp. | | | 28,629 | | | | 2,760,408 | |
Norfolk Southern Corp. | | | 9,576 | | | | 2,571,347 | |
Old Dominion Freight Line, Inc. | | | 6,982 | | | | 1,678,543 | |
Kansas City Southern | | | 6,300 | | | | 1,662,696 | |
Expeditors International of Washington, Inc. | | | 12,574 | | | | 1,354,094 | |
J.B. Hunt Transport Services, Inc. | | | 7,943 | | | | 1,334,980 | |
CH Robinson Worldwide, Inc. | | | 11,620 | | | | 1,108,897 | |
XPO Logistics, Inc.* | | | 8,806 | | | | 1,085,780 | |
ZTO Express Cayman, Inc. ADR | | | 31,918 | | | | 930,410 | |
Canadian Pacific Railway Ltd.1 | | | 2,372 | | | | 899,676 | |
Knight-Swift Transportation Holdings, Inc. | | | 18,640 | | | | 896,398 | |
Canadian National Railway Co. | | | 7,686 | | | | 891,422 | |
Saia, Inc.* | | | 3,367 | | | | 776,363 | |
Landstar System, Inc. | | | 4,701 | | | | 775,947 | |
Ryder System, Inc. | | | 8,311 | | | | 628,727 | |
Werner Enterprises, Inc. | | | 11,830 | | | | 558,021 | |
Kirby Corp.* | | | 9,255 | | | | 557,891 | |
Atlas Air Worldwide Holdings, Inc.* | | | 6,840 | | | | 413,410 | |
Total Transportation | | | | | | | 31,414,221 | |
| | | | | | | | | |
Auto Manufacturers - 19.7% |
Tesla, Inc.* | | | 10,069 | | | | 6,725,387 | |
General Motors Co.* | | | 48,694 | | | | 2,797,957 | |
NIO, Inc. ADR* | | | 51,610 | | | | 2,011,758 | |
Ferrari N.V. | | | 4,500 | | | | 941,760 | |
Stellantis N.V. | | | 47,282 | | | | 841,147 | |
Nikola Corp.*,1 | | | 50,630 | | | | 703,251 | |
Fisker, Inc.* | | | 36,560 | | | | 629,563 | |
Workhorse Group, Inc.*,1 | | | 27,870 | | | | 383,770 | |
Total Auto Manufacturers | | | | | | | 15,034,593 | |
| | | | | | | | | |
Auto Parts & Equipment - 14.2% |
QuantumScape Corp.*,1 | | | 24,970 | | | | 1,117,408 | |
Aptiv plc* | | | 7,692 | | | | 1,060,727 | |
BorgWarner, Inc. | | | 22,007 | | | | 1,020,245 | |
Lear Corp. | | | 5,530 | | | | 1,002,312 | |
Gentex Corp. | | | 25,563 | | | | 911,832 | |
Magna International, Inc. | | | 9,821 | | | | 864,641 | |
Autoliv, Inc.* | | | 9,216 | | | | 855,245 | |
Luminar Technologies, Inc.*,1 | | | 34,530 | | | | 839,424 | |
Fox Factory Holding Corp.* | | | 5,516 | | | | 700,863 | |
Adient plc* | | | 14,361 | | | | 634,756 | |
Goodyear Tire & Rubber Co.* | | | 35,930 | | | | 631,290 | |
Dana, Inc. | | | 23,425 | | | | 569,930 | |
Visteon Corp.* | | | 4,518 | | | | 550,970 | |
Faurecia SE* | | | 659 | | | | 35,109 | |
Total Auto Parts & Equipment | | | | | | | 10,794,752 | |
| | | | | | | | | |
Airlines - 13.9% |
Southwest Airlines Co.* | | | 30,608 | | | | 1,868,924 | |
Delta Air Lines, Inc.* | | | 35,421 | | | | 1,710,126 | |
United Airlines Holdings, Inc.* | | | 22,509 | | | | 1,295,168 | |
American Airlines Group, Inc.* | | | 50,050 | | | | 1,196,195 | |
Alaska Air Group, Inc.* | | | 13,052 | | | | 903,329 | |
Ryanair Holdings plc ADR* | | | 7,524 | | | | 865,260 | |
Copa Holdings S.A. — Class A* | | | 9,866 | | | | 797,074 | |
JetBlue Airways Corp.* | | | 38,430 | | | | 781,666 | |
Allegiant Travel Co. — Class A* | | | 2,477 | | | | 604,537 | |
Spirit Airlines, Inc.* | | | 15,624 | | | | 576,526 | |
Total Airlines | | | | | | | 10,598,805 | |
| | | | | | | | | |
Internet - 5.9% |
Uber Technologies, Inc.* | | | 56,760 | | | | 3,093,988 | |
Lyft, Inc. — Class A* | | | 21,935 | | | | 1,385,853 | |
Total Internet | | | | | | | 4,479,841 | |
| | | | | | | | | |
Home Builders - 2.4% |
Thor Industries, Inc. | | | 6,101 | | | | 822,049 | |
LCI Industries | | | 4,100 | | | | 542,348 | |
Winnebago Industries, Inc. | | | 6,270 | | | | 480,971 | |
Total Home Builders | | | | | | | 1,845,368 | |
| | | | | | | | | |
Leisure Time - 1.1% |
Harley-Davidson, Inc. | | | 20,284 | | | | 813,388 | |
| | | | | | | | | |
Commercial Services - 0.9% |
Avis Budget Group, Inc.* | | | 10,025 | | | | 727,213 | |
| | | | | | | | | |
Total Common Stocks | | | | |
(Cost $53,382,650) | | | | | | | 75,708,181 | |
| | | | | | | | | |
| | | Face
Amount | | | | | |
REPURCHASE AGREEMENTS††,2 - 0.6% |
J.P. Morgan Securities LLC
issued 03/31/21 at 0.01%
due 04/01/21 | | $ | 243,664 | | | | 243,664 | |
Barclays Capital, Inc.
issued 03/31/21 at 0.01%
due 04/01/21 | | | 110,781 | | | | 110,781 | |
BofA Securities, Inc.
issued 03/31/21 at 0.01%
due 04/01/21 | | | 101,105 | | | | 101,105 | |
Total Repurchase Agreements | | | | |
(Cost $455,550) | | | | | | | 455,550 | |
| | | | | | | | | |
SEE NOTES TO FINANCIAL STATEMENTS. | THE RYDEX FUNDS ANNUAL REPORT | 145 |
SCHEDULE OF INVESTMENTS (concluded) | March 31, 2021 |
TRANSPORTATION FUND | |
| | Shares | | | Value | |
SECURITIES LENDING COLLATERAL†,3 - 3.5% |
Money Market Fund | | | | | | | | |
First American Government Obligations Fund — Class Z, 0.03%4 | | | 2,639,008 | | | $ | 2,639,008 | |
Total Securities Lending Collateral | | | | |
(Cost $2,639,008) | | | | | | | 2,639,008 | |
| | | | | | | | | |
Total Investments - 103.4% | | | | |
(Cost $56,477,208) | | $ | 78,802,739 | |
Other Assets & Liabilities, net - (3.4)% | | | (2,612,740 | ) |
Total Net Assets - 100.0% | | $ | 76,189,999 | |
* | Non-income producing security. |
† | Value determined based on Level 1 inputs — See Note 4. |
†† | Value determined based on Level 2 inputs — See Note 4. |
1 | All or a portion of this security is on loan at March 31, 2021 — See Note 7. |
2 | Repurchase Agreements — See Note 6. |
3 | Securities lending collateral — See Note 7. |
4 | Rate indicated is the 7-day yield as of March 31, 2021. |
| | ADR — American Depositary Receipt |
| | plc — Public Limited Company |
| | |
| | See Sector Classification in Other Information section. |
The following table summarizes the inputs used to value the Fund’s investments at March 31, 2021 (See Note 4 in the Notes to Financial Statements):
Investments in Securities (Assets) | | Level 1
Quoted
Prices | | | Level 2
Significant
Observable
Inputs | | | Level 3
Significant
Unobservable
Inputs | | | Total | |
Common Stocks | | $ | 75,708,181 | | | $ | — | | | $ | — | | | $ | 75,708,181 | |
Repurchase Agreements | | | — | | | | 455,550 | | | | — | | | | 455,550 | |
Securities Lending Collateral | | | 2,639,008 | | | | — | | | | — | | | | 2,639,008 | |
Total Assets | | $ | 78,347,189 | | | $ | 455,550 | | | $ | — | | | $ | 78,802,739 | |
146 | THE RYDEX FUNDS ANNUAL REPORT | SEE NOTES TO FINANCIAL STATEMENTS. |
STATEMENT OF ASSETS AND LIABILITIES |
March 31, 2021 |
Assets: |
Investments, at value - including $2,616,657 of securities loaned (cost $56,021,658) | | $ | 78,347,189 | |
Repurchase agreements, at value (cost $455,550) | | | 455,550 | |
Cash | | | 2,083 | |
Receivables: |
Fund shares sold | | | 217,390 | |
Dividends | | | 18,690 | |
Securities lending income | | | 1,354 | |
Foreign tax reclaims | | | 117 | |
Total assets | | | 79,042,373 | |
| | | | | |
Liabilities: |
Payable for: |
Return of securities lending collateral | | | 2,639,008 | |
Fund shares redeemed | | | 60,573 | |
Management fees | | | 50,766 | |
Transfer agent and administrative fees | | | 16,066 | |
Portfolio accounting fees | | | 5,972 | |
Distribution and service fees | | | 3,518 | |
Trustees’ fees* | | | 1,076 | |
Miscellaneous | | | 75,395 | |
Total liabilities | | | 2,852,374 | |
Commitments and contingent liabilities (Note 10) | | | — | |
Net assets | | $ | 76,189,999 | |
| | | | | |
Net assets consist of: |
Paid in capital | | $ | 55,137,645 | |
Total distributable earnings (loss) | | | 21,052,354 | |
Net assets | | $ | 76,189,999 | |
| | | | | |
Investor Class: |
Net assets | | $ | 65,281,223 | |
Capital shares outstanding | | | 774,613 | |
Net asset value per share | | $ | 84.28 | |
| | | | | |
A-Class: |
Net assets | | $ | 7,785,251 | |
Capital shares outstanding | | | 102,403 | |
Net asset value per share | | $ | 76.03 | |
Maximum offering price per share (Net asset value divided by 95.25%) | | $ | 79.82 | |
| | | | | |
C-Class: |
Net assets | | $ | 1,954,079 | |
Capital shares outstanding | | | 29,042 | |
Net asset value per share | | $ | 67.28 | |
| | | | | |
H-Class: |
Net assets | | $ | 1,169,446 | |
Capital shares outstanding | | | 15,905 | |
Net asset value per share | | $ | 73.53 | |
STATEMENT OF OPERATIONS |
Year Ended March 31, 2021 |
Investment Income: |
Dividends (net of foreign withholding tax of $4,972) | | $ | 414,492 | |
Interest | | | 110 | |
Income from securities lending, net | | | 12,906 | |
Total investment income | | | 427,508 | |
| | | | | |
Expenses: |
Management fees | | | 326,247 | |
Distribution and service fees: |
A-Class | | | 11,368 | |
C-Class | | | 11,850 | |
H-Class | | | 2,180 | |
Transfer agent and administrative fees | | | 105,266 | |
Portfolio accounting fees | | | 38,388 | |
Registration fees | | | 29,831 | |
Professional fees | | | 13,955 | |
Custodian fees | | | 5,181 | |
Trustees’ fees* | | | 3,644 | |
Line of credit fees | | | 71 | |
Miscellaneous | | | 20,574 | |
Total expenses | | | 568,555 | |
Net investment loss | | | (141,047 | ) |
| | | | | |
Net Realized and Unrealized Gain (Loss): |
Net realized gain (loss) on: |
Investments | | | 2,044,541 | |
Net realized gain | | | 2,044,541 | |
Net change in unrealized appreciation (depreciation) on: |
Investments | | | 22,930,104 | |
Net change in unrealized appreciation (depreciation) | | | 22,930,104 | |
Net realized and unrealized gain | | | 24,974,645 | |
Net increase in net assets resulting from operations | | $ | 24,833,598 | |
* | Relates to Trustees not deemed “interested persons” within the meaning of Section 2(a)(19) of the 1940 Act. |
SEE NOTES TO FINANCIAL STATEMENTS. | THE RYDEX FUNDS ANNUAL REPORT | 147 |
STATEMENTS OF CHANGES IN NET ASSETS |
| | Year Ended
March 31,
2021 | | | Year Ended
March 31,
2020 | |
Increase (Decrease) in Net Assets from Operations: | | | | | | | | |
Net investment income (loss) | | $ | (141,047 | ) | | $ | 57,459 | |
Net realized gain on investments | | | 2,044,541 | | | | 1,024,892 | |
Net change in unrealized appreciation (depreciation) on investments | | | 22,930,104 | | | | (3,939,790 | ) |
Net increase (decrease) in net assets resulting from operations | | | 24,833,598 | | | | (2,857,439 | ) |
| | | | | | | | | |
Distributions to shareholders: | | | | | | | | |
Investor Class | | | — | | | | (342,945 | ) |
A-Class | | | — | | | | (187,023 | ) |
C-Class | | | — | | | | (58,531 | ) |
H-Class | | | — | | | | (21,428 | ) |
Total distributions to shareholders | | | — | | | | (609,927 | ) |
| | | | | | | | | |
Capital share transactions: | | | | | | | | |
Proceeds from sale of shares | | | | | | | | |
Investor Class | | | 122,795,894 | | | | 61,127,966 | |
A-Class | | | 6,706,823 | | | | 7,233,790 | |
C-Class | | | 1,739,055 | | | | 1,125,341 | |
H-Class | | | 3,126,338 | | | | 10,568,259 | |
Distributions reinvested | | | | | | | | |
Investor Class | | | — | | | | 328,816 | |
A-Class | | | — | | | | 182,137 | |
C-Class | | | — | | | | 57,266 | |
H-Class | | | — | | | | 20,968 | |
Cost of shares redeemed | | | | | | | | |
Investor Class | | | (80,971,211 | ) | | | (63,728,261 | ) |
A-Class | | | (3,846,052 | ) | | | (8,147,172 | ) |
C-Class | | | (1,281,133 | ) | | | (1,742,657 | ) |
H-Class | | | (2,910,829 | ) | | | (10,652,942 | ) |
Net increase (decrease) from capital share transactions | | | 45,358,885 | | | | (3,626,489 | ) |
Net increase (decrease) in net assets | | | 70,192,483 | | | | (7,093,855 | ) |
| | | | | | | | | |
Net assets: | | | | | | | | |
Beginning of year | | | 5,997,516 | | | | 13,091,371 | |
End of year | | $ | 76,189,999 | | | $ | 5,997,516 | |
| | | | | | | | | |
Capital share activity: | | | | | | | | |
Shares sold | | | | | | | | |
Investor Class | | | 1,966,468 | | | | 1,157,931 | |
A-Class | | | 113,534 | | | | 147,945 | |
C-Class | | | 36,253 | | | | 26,473 | |
H-Class | | | 59,463 | | | | 236,551 | |
Shares issued from reinvestment of distributions | | | | | | | | |
Investor Class | | | — | | | | 6,317 | |
A-Class | | | — | | | | 3,866 | |
C-Class | | | — | | | | 1,360 | |
H-Class | | | — | | | | 460 | |
Shares redeemed | | | | | | | | |
Investor Class | | | (1,279,662 | ) | | | (1,236,077 | ) |
A-Class | | | (63,091 | ) | | | (169,311 | ) |
C-Class | | | (28,171 | ) | | | (42,772 | ) |
H-Class | | | (53,494 | ) | | | (237,384 | ) |
Net increase (decrease) in shares | | | 751,300 | | | | (104,641 | ) |
148 | THE RYDEX FUNDS ANNUAL REPORT | SEE NOTES TO FINANCIAL STATEMENTS. |
This table is presented to show selected data for a share outstanding throughout each period and to assist shareholders in evaluating a Fund’s performance for the periods presented.
Investor Class | | Year Ended
March 31,
2021 | | | Year Ended
March 31,
2020 | | | Year Ended
March 31,
2019 | | | Year Ended
March 29,
2018 | | | Year Ended
March 31,
2017 | |
Per Share Data |
Net asset value, beginning of period | | $ | 37.39 | | | $ | 50.08 | | | $ | 59.10 | | | $ | 53.52 | | | $ | 46.23 | |
Income (loss) from investment operations: |
Net investment income (loss)a | | | (.20 | ) | | | .30 | | | | .09 | | | | (.04 | ) | | | .09 | |
Net gain (loss) on investments (realized and unrealized) | | | 47.09 | | | | (11.07 | ) | | | (4.02 | ) | | | 6.85 | | | | 7.37 | |
Total from investment operations | | | 46.89 | | | | (10.77 | ) | | | (3.93 | ) | | | 6.81 | | | | 7.46 | |
Less distributions from: |
Net investment income | | | — | | | | (.15 | ) | | | — | | | | — | | | | (.17 | ) |
Net realized gains | | | — | | | | (1.77 | ) | | | (5.09 | ) | | | (1.23 | ) | | | — | |
Total distributions | | | — | | | | (1.92 | ) | | | (5.09 | ) | | | (1.23 | ) | | | (.17 | ) |
Net asset value, end of period | | $ | 84.28 | | | $ | 37.39 | | | $ | 50.08 | | | $ | 59.10 | | | $ | 53.52 | |
|
Total Return | | | 125.41 | % | | | (22.59 | %) | | | (6.33 | %) | | | 12.67 | % | | | 16.14 | % |
Ratios/Supplemental Data |
Net assets, end of period (in thousands) | | $ | 65,281 | | | $ | 3,283 | | | $ | 7,994 | | | $ | 16,603 | | | $ | 32,911 | |
Ratios to average net assets: |
Net investment income (loss) | | | (0.29 | %) | | | 0.58 | % | | | 0.16 | % | | | (0.07 | %) | | | 0.17 | % |
Total expenses | | | 1.41 | % | | | 1.48 | % | | | 1.46 | % | | | 1.37 | % | | | 1.38 | % |
Portfolio turnover rate | | | 205 | % | | | 483 | % | | | 476 | % | | | 483 | % | | | 676 | % |
A-Class | | Year Ended
March 31,
2021 | | | Year Ended
March 31,
2020 | | | Year Ended
March 31,
2019 | | | Year Ended
March 29,
2018 | | | Year Ended
March 31,
2017 | |
Per Share Data |
Net asset value, beginning of period | | $ | 33.82 | | | $ | 45.58 | | | $ | 54.43 | | | $ | 49.50 | | | $ | 42.87 | |
Income (loss) from investment operations: |
Net investment income (loss)a | | | (.34 | ) | | | .17 | | | | (.01 | ) | | | (.07 | ) | | | (.06 | ) |
Net gain (loss) on investments (realized and unrealized) | | | 42.55 | | | | (10.01 | ) | | | (3.75 | ) | | | 6.23 | | | | 6.86 | |
Total from investment operations | | | 42.21 | | | | (9.84 | ) | | | (3.76 | ) | | | 6.16 | | | | 6.80 | |
Less distributions from: |
Net investment income | | | — | | | | (.15 | ) | | | — | | | | — | | | | (.17 | ) |
Net realized gains | | | — | | | | (1.77 | ) | | | (5.09 | ) | | | (1.23 | ) | | | — | |
Total distributions | | | — | | | | (1.92 | ) | | | (5.09 | ) | | | (1.23 | ) | | | (.17 | ) |
Net asset value, end of period | | $ | 76.03 | | | $ | 33.82 | | | $ | 45.58 | | | $ | 54.43 | | | $ | 49.50 | |
|
Total Returnb | | | 124.81 | % | | | (22.78 | %) | | | (6.57 | %) | | | 12.38 | % | | | 15.87 | % |
Ratios/Supplemental Data |
Net assets, end of period (in thousands) | | $ | 7,785 | | | $ | 1,757 | | | $ | 3,166 | | | $ | 5,760 | | | $ | 4,742 | |
Ratios to average net assets: |
Net investment income (loss) | | | (0.59 | %) | | | 0.37 | % | | | (0.03 | %) | | | (0.12 | %) | | | (0.12 | %) |
Total expenses | | | 1.68 | % | | | 1.73 | % | | | 1.71 | % | | | 1.63 | % | | | 1.63 | % |
Portfolio turnover rate | | | 205 | % | | | 483 | % | | | 476 | % | | | 483 | % | | | 676 | % |
SEE NOTES TO FINANCIAL STATEMENTS. | THE RYDEX FUNDS ANNUAL REPORT | 149 |
FINANCIAL HIGHLIGHTS (concluded) |
This table is presented to show selected data for a share outstanding throughout each period and to assist shareholders in evaluating a Fund’s performance for the periods presented.
C-Class | | Year Ended
March 31,
2021 | | | Year Ended
March 31,
2020 | | | Year Ended
March 31,
2019 | | | Year Ended
March 29,
2018 | | | Year Ended
March 31,
2017 | |
Per Share Data |
Net asset value, beginning of period | | $ | 30.15 | | | $ | 41.14 | | | $ | 50.04 | | | $ | 45.93 | | | $ | 40.09 | |
Income (loss) from investment operations: |
Net investment income (loss)a | | | (.67 | ) | | | (.18 | ) | | | (.41 | ) | | | (.43 | ) | | | (.34 | ) |
Net gain (loss) on investments (realized and unrealized) | | | 37.80 | | | | (8.89 | ) | | | (3.40 | ) | | | 5.77 | | | | 6.35 | |
Total from investment operations | | | 37.13 | | | | (9.07 | ) | | | (3.81 | ) | | | 5.34 | | | | 6.01 | |
Less distributions from: |
Net investment income | | | — | | | | (.15 | ) | | | — | | | | — | | | | (.17 | ) |
Net realized gains | | | — | | | | (1.77 | ) | | | (5.09 | ) | | | (1.23 | ) | | | — | |
Total distributions | | | — | | | | (1.92 | ) | | | (5.09 | ) | | | (1.23 | ) | | | (.17 | ) |
Net asset value, end of period | | $ | 67.28 | | | $ | 30.15 | | | $ | 41.14 | | | $ | 50.04 | | | $ | 45.93 | |
|
Total Returnb | | | 123.15 | % | | | (23.37 | %) | | | (7.27 | %) | | | 11.56 | % | | | 15.00 | % |
Ratios/Supplemental Data |
Net assets, end of period (in thousands) | | $ | 1,954 | | | $ | 632 | | | $ | 1,477 | | | $ | 2,560 | | | $ | 2,307 | |
Ratios to average net assets: |
Net investment income (loss) | | | (1.33 | %) | | | (0.43 | %) | | | (0.87 | %) | | | (0.87 | %) | | | (0.81 | %) |
Total expenses | | | 2.43 | % | | | 2.48 | % | | | 2.46 | % | | | 2.38 | % | | | 2.38 | % |
Portfolio turnover rate | | | 205 | % | | | 483 | % | | | 476 | % | | | 483 | % | | | 676 | % |
H-Class | | Year Ended
March 31,
2021 | | | Year Ended
March 31,
2020 | | | Year Ended
March 31,
2019 | | | Year Ended
March 29,
2018 | | | Year Ended
March 31,
2017 | |
Per Share Data |
Net asset value, beginning of period | | $ | 32.70 | | | $ | 44.14 | | | $ | 52.90 | | | $ | 48.15 | | | $ | 41.71 | |
Income (loss) from investment operations: |
Net investment income (loss)a | | | (.32 | ) | | | (.02 | ) | | | (.02 | ) | | | (.13 | ) | | | (.13 | ) |
Net gain (loss) on investments (realized and unrealized) | | | 41.15 | | | | (9.50 | ) | | | (3.65 | ) | | | 6.11 | | | | 6.74 | |
Total from investment operations | | | 40.83 | | | | (9.52 | ) | | | (3.67 | ) | | | 5.98 | | | | 6.61 | |
Less distributions from: |
Net investment income | | | — | | | | (.15 | ) | | | — | | | | — | | | | (.17 | ) |
Net realized gains | | | — | | | | (1.77 | ) | | | (5.09 | ) | | | (1.23 | ) | | | — | |
Total distributions | | | — | | | | (1.92 | ) | | | (5.09 | ) | | | (1.23 | ) | | | (.17 | ) |
Net asset value, end of period | | $ | 73.53 | | | $ | 32.70 | | | $ | 44.14 | | | $ | 52.90 | | | $ | 48.15 | |
|
Total Return | | | 124.86 | % | | | (22.78 | %) | | | (6.61 | %) | | | 12.33 | % | | | 15.88 | % |
Ratios/Supplemental Data |
Net assets, end of period (in thousands) | | $ | 1,169 | | | $ | 325 | | | $ | 455 | | | $ | 1,929 | | | $ | 4,127 | |
Ratios to average net assets: |
Net investment income (loss) | | | (0.56 | %) | | | (0.03 | %) | | | (0.04 | %) | | | (0.24 | %) | | | (0.30 | %) |
Total expenses | | | 1.68 | % | | | 1.72 | % | | | 1.69 | % | | | 1.63 | % | | | 1.63 | % |
Portfolio turnover rate | | | 205 | % | | | 483 | % | | | 476 | % | | | 483 | % | | | 676 | % |
a | Net investment income (loss) per share was computed using average shares outstanding throughout the period. |
b | Total return does not reflect the impact of any applicable sales charges. |
150 | THE RYDEX FUNDS ANNUAL REPORT | SEE NOTES TO FINANCIAL STATEMENTS. |
PERFORMANCE REPORT AND FUND PROFILE (Unaudited) | March 31, 2021 |
UTILITIES FUND
OBJECTIVE: Seeks to provide capital appreciation by investing in companies that operate public utilities (“Utilities Companies”).
For the one-year period ended March 31, 2021, Utilities Fund Investor Class returned 17.17%, compared with 19.42% for the S&P 500 Utilities Index. The broader S&P 500 Index returned 56.35%.
All industries contributed to return, led by electric utilities, multi-utilities, and independent power producers & energy.
NextEra Energy, Inc., AES Corp., and Duke Energy Corp. contributed the most to the Fund’s return for the period. FirstEnergy Corp., Sunnova Energy International, Inc., and Ormat Technologies, Inc. detracted the most from return.
Performance displayed represents past performance, which is no guarantee of future results.
Holdings Diversification (Market Exposure as % of Net Assets)
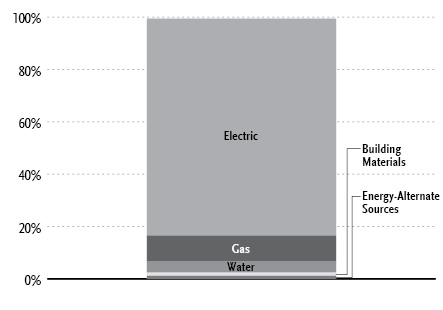
“Holdings Diversification (Market Exposure as % of Net Assets)” excludes any temporary cash investments.
Inception Dates: |
Investor Class | April 3, 2000 |
A-Class | September 1, 2004 |
C-Class | April 27, 2001 |
H-Class | April 3, 2000 |
Ten Largest Holdings (% of Total Net Assets) |
NextEra Energy, Inc. | 6.3% |
Duke Energy Corp. | 4.4% |
Southern Co. | 4.1% |
Dominion Energy, Inc. | 4.0% |
Exelon Corp. | 3.3% |
American Electric Power Company, Inc. | 3.3% |
Sempra Energy | 3.1% |
Xcel Energy, Inc. | 3.1% |
Eversource Energy | 2.8% |
WEC Energy Group, Inc. | 2.8% |
Top Ten Total | 37.2% |
| | |
“Ten Largest Holdings” excludes any temporary cash investments. |
| | THE RYDEX FUNDS ANNUAL REPORT | 151 |
PERFORMANCE REPORT AND FUND PROFILE (Unaudited)(concluded) | March 31, 2021 |
Cumulative Fund Performance*

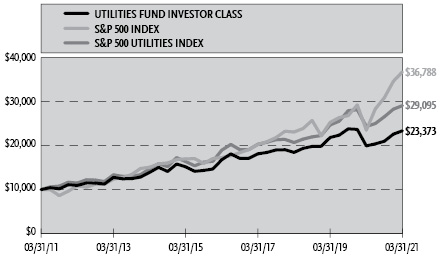
Average Annual Returns*
Periods Ended March 31, 2021
| 1 Year | 5 Year | 10 Year |
Investor Class Shares | 17.17% | 6.84% | 8.86% |
A-Class Shares | 16.91% | 6.57% | 8.59% |
A-Class Shares with sales charge‡ | 11.36% | 5.54% | 8.06% |
C-Class Shares | 16.02% | 5.78% | 7.77% |
C-Class Shares with CDSC§ | 15.02% | 5.78% | 7.77% |
H-Class Shares** | 16.92% | 6.58% | 8.48% |
S&P 500 Utilities Index | 19.42% | 8.92% | 11.27% |
S&P 500 Index | 56.35% | 16.29% | 13.91% |
* | The performance data above represents past performance that is not predictive of future results. The investment return and principal value of an investment in the Fund will fluctuate so that an investor’s shares, when redeemed, may be worth more or less than their original cost. Returns are historical and include changes in principal and reinvested dividends and capital gains and do not reflect the effect of taxes. The S&P 500 Index and S&P 500 Utilities Index are unmanaged indices and, unlike the Fund, have no management fees or operating expenses to reduce their reported returns. The graphs are based on Investor Class shares and A-Class shares only; performance of C-Class and H-Class shares will vary due to differences in fee structures. |
** | Effective September 30, 2015, the Fund’s Advisor Class shares were converted into H-Class shares. |
‡ | Fund returns are calculated using the maximum sales charge of 4.75%. |
§ | Fund returns include a CDSC of 1% if redeemed within 12 months of purchase. |
152 | THE RYDEX FUNDS ANNUAL REPORT | |
SCHEDULE OF INVESTMENTS | March 31, 2021 |
UTILITIES FUND | |
| | Shares | | | Value | |
COMMON STOCKS† - 99.5% |
| | | | | | | | | |
Electric - 83.0% |
NextEra Energy, Inc. | | | 24,810 | | | $ | 1,875,884 | |
Duke Energy Corp. | | | 13,645 | | | | 1,317,152 | |
Southern Co. | | | 19,763 | | | | 1,228,468 | |
Dominion Energy, Inc. | | | 15,648 | | | | 1,188,622 | |
Exelon Corp. | | | 22,609 | | | | 988,918 | |
American Electric Power Company, Inc. | | | 11,590 | | | | 981,673 | |
Sempra Energy | | | 7,052 | | | | 934,954 | |
Xcel Energy, Inc. | | | 13,870 | | | | 922,494 | |
Eversource Energy | | | 9,700 | | | | 839,923 | |
WEC Energy Group, Inc. | | | 8,950 | | | | 837,631 | |
Public Service Enterprise Group, Inc. | | | 13,880 | | | | 835,715 | |
Consolidated Edison, Inc. | | | 10,293 | | | | 769,916 | |
DTE Energy Co. | | | 5,775 | | | | 768,883 | |
PG&E Corp.* | | | 62,639 | | | | 733,503 | |
Edison International | | | 12,029 | | | | 704,899 | |
PPL Corp. | | | 24,058 | | | | 693,833 | |
Ameren Corp. | | | 8,384 | | | | 682,122 | |
Entergy Corp. | | | 6,767 | | | | 673,113 | |
FirstEnergy Corp. | | | 18,724 | | | | 649,536 | |
AES Corp. | | | 24,141 | | | | 647,220 | |
CMS Energy Corp. | | | 10,545 | | | | 645,565 | |
Avangrid, Inc. | | | 12,033 | | | | 599,364 | |
Alliant Energy Corp. | | | 10,386 | | | | 562,506 | |
Evergy, Inc. | | | 9,295 | | | | 553,331 | |
CenterPoint Energy, Inc. | | | 23,695 | | | | 536,692 | |
NRG Energy, Inc. | | | 12,257 | | | | 462,457 | |
Pinnacle West Capital Corp. | | | 5,626 | | | | 457,675 | |
Vistra Corp. | | | 25,372 | | | | 448,577 | |
OGE Energy Corp. | | | 11,723 | | | | 379,356 | |
IDACORP, Inc. | | | 3,367 | | | | 336,599 | |
Ormat Technologies, Inc. | | | 4,030 | | | | 316,476 | |
Portland General Electric Co. | | | 6,511 | | | | 309,077 | |
PNM Resources, Inc. | | | 6,277 | | | | 307,887 | |
Black Hills Corp. | | | 4,611 | | | | 307,876 | |
NorthWestern Corp. | | | 4,216 | | | | 274,883 | |
Total Electric | | | | | | | 24,772,780 | |
| | | | | | | | | |
Gas - 9.7% |
Atmos Energy Corp. | | | 5,536 | | | | 547,234 | |
NiSource, Inc. | | | 19,272 | | | | 464,648 | |
UGI Corp. | | | 10,708 | | | | 439,135 | |
National Fuel Gas Co. | | | 6,446 | | | | 322,236 | |
ONE Gas, Inc. | | | 3,991 | | | | 306,948 | |
Southwest Gas Holdings, Inc. | | | 4,351 | | | | 298,957 | |
Spire, Inc. | | | 3,941 | | | | 291,200 | |
South Jersey Industries, Inc. | | | 10,240 | | | | 231,219 | |
Total Gas | | | | | | | 2,901,577 | |
| | | | | | | | | |
Water - 4.4% |
American Water Works Company, Inc. | | | 5,403 | | | | 810,018 | |
Essential Utilities, Inc. | | | 11,364 | | | | 508,539 | |
Total Water | | | | | | | 1,318,557 | |
| | | | | | | | | |
Building Materials - 1.3% |
MDU Resources Group, Inc. | | | 12,036 | | | | 380,458 | |
| | | | | | | | | |
Energy-Alternate Sources - 1.1% |
Sunnova Energy International, Inc.* | | | 8,440 | | | | 344,521 | |
| | | | | | | | | |
Total Common Stocks | | | | |
(Cost $23,811,879) | | | | | | | 29,717,893 | |
| | | | | | | | | |
| | | Face
Amount | | | | | |
REPURCHASE AGREEMENTS††,1 - 0.3% |
J.P. Morgan Securities LLC
issued 03/31/21 at 0.01%
due 04/01/21 | | $ | 52,354 | | | | 52,354 | |
Barclays Capital, Inc.
issued 03/31/21 at 0.01%
due 04/01/21 | | | 23,803 | | | | 23,803 | |
BofA Securities, Inc.
issued 03/31/21 at 0.01%
due 04/01/21 | | | 21,723 | | | | 21,723 | |
Total Repurchase Agreements | | | | |
(Cost $97,880) | | | | | | | 97,880 | |
| | | | | | | | | |
Total Investments - 99.8% | | | | |
(Cost $23,909,759) | | $ | 29,815,773 | |
Other Assets & Liabilities, net - 0.2% | | | 47,570 | |
Total Net Assets - 100.0% | | $ | 29,863,343 | |
* | Non-income producing security. |
† | Value determined based on Level 1 inputs — See Note 4. |
†† | Value determined based on Level 2 inputs — See Note 4. |
1 | Repurchase Agreements — See Note 6. |
| | |
| | See Sector Classification in Other Information section. |
SEE NOTES TO FINANCIAL STATEMENTS. | THE RYDEX FUNDS ANNUAL REPORT | 153 |
SCHEDULE OF INVESTMENTS (concluded) | March 31, 2021 |
UTILITIES FUND | |
The following table summarizes the inputs used to value the Fund’s investments at March 31, 2021 (See Note 4 in the Notes to Financial Statements):
Investments in Securities (Assets) | | Level 1
Quoted
Prices | | | Level 2
Significant
Observable
Inputs | | | Level 3
Significant
Unobservable
Inputs | | | Total | |
Common Stocks | | $ | 29,717,893 | | | $ | — | | | $ | — | | | $ | 29,717,893 | |
Repurchase Agreements | | | — | | | | 97,880 | | | | — | | | | 97,880 | |
Total Assets | | $ | 29,717,893 | | | $ | 97,880 | | | $ | — | | | $ | 29,815,773 | |
154 | THE RYDEX FUNDS ANNUAL REPORT | SEE NOTES TO FINANCIAL STATEMENTS. |
STATEMENT OF ASSETS AND LIABILITIES |
March 31, 2021 |
Assets: |
Investments, at value (cost $23,811,879) | | $ | 29,717,893 | |
Repurchase agreements, at value (cost $97,880) | | | 97,880 | |
Receivables: |
Securities sold | | | 2,441,081 | |
Fund shares sold | | | 503,268 | |
Dividends | | | 66,325 | |
Total assets | | | 32,826,447 | |
| | | | | |
Liabilities: |
Payable for: |
Fund shares redeemed | | | 2,893,818 | |
Management fees | | | 22,284 | |
Transfer agent and administrative fees | | | 7,052 | |
Distribution and service fees | | | 3,674 | |
Portfolio accounting fees | | | 2,622 | |
Trustees’ fees* | | | 474 | |
Miscellaneous | | | 33,180 | |
Total liabilities | | | 2,963,104 | |
Commitments and contingent liabilities (Note10) | | | — | |
Net assets | | $ | 29,863,343 | |
| | | | | |
Net assets consist of: |
Paid in capital | | $ | 28,333,251 | |
Total distributable earnings (loss) | | | 1,530,092 | |
Net assets | | $ | 29,863,343 | |
| | | | | |
Investor Class: |
Net assets | | $ | 21,099,071 | |
Capital shares outstanding | | | 440,260 | |
Net asset value per share | | $ | 47.92 | |
| | | | | |
A-Class: |
Net assets | | $ | 5,398,623 | |
Capital shares outstanding | | | 123,488 | |
Net asset value per share | | $ | 43.72 | |
Maximum offering price per share (Net asset value divided by 95.25%) | | $ | 45.90 | |
| | | | | |
C-Class: |
Net assets | | $ | 2,646,189 | |
Capital shares outstanding | | | 73,834 | |
Net asset value per share | | $ | 35.84 | |
| | | | | |
H-Class: |
Net assets | | $ | 719,460 | |
Capital shares outstanding | | | 17,115 | |
Net asset value per share | | $ | 42.04 | |
STATEMENT OF OPERATIONS |
Year Ended March 31, 2021 |
Investment Income: |
Dividends | | $ | 1,174,286 | |
Interest | | | 95 | |
Income from securities lending, net | | | 2 | |
Total investment income | | | 1,174,383 | |
| | | | | |
Expenses: |
Management fees | | | 320,784 | |
Distribution and service fees: |
A-Class | | | 10,558 | |
C-Class | | | 43,013 | |
H-Class | | | 2,587 | |
Transfer agent and administrative fees | | | 107,557 | |
Portfolio accounting fees | | | 37,748 | |
Registration fees | | | 37,573 | |
Professional fees | | | 23,096 | |
Trustees’ fees* | | | 11,529 | |
Custodian fees | | | 5,829 | |
Line of credit fees | | | 237 | |
Miscellaneous | | | 3,122 | |
Total expenses | | | 603,633 | |
Net investment income | | | 570,750 | |
| | | | | |
Net Realized and Unrealized Gain (Loss): |
Net realized gain (loss) on: |
Investments | | | 189,416 | |
Net realized gain | | | 189,416 | |
Net change in unrealized appreciation (depreciation) on: |
Investments | | | 5,182,811 | |
Net change in unrealized appreciation (depreciation) | | | 5,182,811 | |
Net realized and unrealized gain | | | 5,372,227 | |
Net increase in net assets resulting from operations | | $ | 5,942,977 | |
* | Relates to Trustees not deemed “interested persons” within the meaning of Section 2(a)(19) of the 1940 Act. |
SEE NOTES TO FINANCIAL STATEMENTS. | THE RYDEX FUNDS ANNUAL REPORT | 155 |
STATEMENTS OF CHANGES IN NET ASSETS |
| | Year Ended
March 31,
2021 | | | Year Ended
March 31,
2020 | |
Increase (Decrease) in Net Assets from Operations: | | | | | | | | |
Net investment income | | $ | 570,750 | | | $ | 1,394,736 | |
Net realized gain on investments | | | 189,416 | | | | 9,293,608 | |
Net change in unrealized appreciation (depreciation) on investments | | | 5,182,811 | | | | (14,274,698 | ) |
Net increase (decrease) in net assets resulting from operations | | | 5,942,977 | | | | (3,586,354 | ) |
| | | | | | | | | |
Distributions to shareholders: | | | | | | | | |
Investor Class | | | (523,813 | ) | | | (798,786 | ) |
A-Class | | | (93,655 | ) | | | (57,991 | ) |
C-Class | | | (122,577 | ) | | | (78,736 | ) |
H-Class | | | (17,476 | ) | | | (30,409 | ) |
Total distributions to shareholders | | | (757,521 | ) | | | (965,922 | ) |
| | | | | | | | | |
Capital share transactions: | | | | | | | | |
Proceeds from sale of shares | | | | | | | | |
Investor Class | | | 70,298,851 | | | | 218,676,498 | |
A-Class | | | 2,254,597 | | | | 4,286,695 | |
C-Class | | | 1,628,826 | | | | 3,360,227 | |
H-Class | | | 662,559 | | | | 17,514,422 | |
Distributions reinvested | | | | | | | | |
Investor Class | | | 520,135 | | | | 795,101 | |
A-Class | | | 90,597 | | | | 55,451 | |
C-Class | | | 119,470 | | | | 77,101 | |
H-Class | | | 17,423 | | | | 30,102 | |
Cost of shares redeemed | | | | | | | | |
Investor Class | | | (87,712,328 | ) | | | (287,798,066 | ) |
A-Class | | | (1,773,796 | ) | | | (5,302,118 | ) |
C-Class | | | (4,696,303 | ) | | | (4,212,655 | ) |
H-Class | | | (2,549,969 | ) | | | (20,710,730 | ) |
Net decrease from capital share transactions | | | (21,139,938 | ) | | | (73,227,972 | ) |
Net decrease in net assets | | | (15,954,482 | ) | | | (77,780,248 | ) |
| | | | | | | | | |
Net assets: | | | | | | | | |
Beginning of year | | | 45,817,825 | | | | 123,598,073 | |
End of year | | $ | 29,863,343 | | | $ | 45,817,825 | |
| | | | | | | | | |
Capital share activity: | | | | | | | | |
Shares sold | | | | | | | | |
Investor Class | | | 1,543,484 | | | | 4,503,840 | |
A-Class | | | 53,928 | | | | 99,339 | |
C-Class | | | 47,899 | | | | 90,910 | |
H-Class | | | 16,939 | | | | 411,293 | |
Shares issued from reinvestment of distributions | | | | | | | | |
Investor Class | | | 11,394 | | | | 16,472 | |
A-Class | | | 2,174 | | | | 1,253 | |
C-Class | | | 3,488 | | | | 2,093 | |
H-Class | | | 435 | | | | 707 | |
Shares redeemed | | | | | | | | |
Investor Class | | | (1,929,734 | ) | | | (5,986,116 | ) |
A-Class | | | (42,912 | ) | | | (122,823 | ) |
C-Class | | | (137,703 | ) | | | (114,995 | ) |
H-Class | | | (66,113 | ) | | | (493,579 | ) |
Net decrease in shares | | | (496,721 | ) | | | (1,591,606 | ) |
156 | THE RYDEX FUNDS ANNUAL REPORT | SEE NOTES TO FINANCIAL STATEMENTS. |
This table is presented to show selected data for a share outstanding throughout each period and to assist shareholders in evaluating a Fund’s performance for the periods presented.
Investor Class | | Year Ended
March 31,
2021 | | | Year Ended
March 31,
2020 | | | Year Ended
March 31,
2019 | | | Year Ended
March 29,
2018 | | | Year Ended
March 31,
2017 | |
Per Share Data |
Net asset value, beginning of period | | $ | 41.80 | | | $ | 46.23 | | | $ | 39.03 | | | $ | 39.34 | | | $ | 40.23 | |
Income (loss) from investment operations: |
Net investment income (loss)a | | | .76 | | | | .74 | | | | .77 | | | | .68 | | | | .59 | |
Net gain (loss) on investments (realized and unrealized) | | | 6.37 | | | | (4.72 | ) | | | 6.43 | | | | .06 | | | | 2.25 | |
Total from investment operations | | | 7.13 | | | | (3.98 | ) | | | 7.20 | | | | .74 | | | | 2.84 | |
Less distributions from: |
Net investment income | | | (1.01 | ) | | | (.45 | ) | | | — | | | | (.53 | ) | | | (.87 | ) |
Net realized gains | | | — | | | | — | | | | — | | | | (.52 | ) | | | (2.86 | ) |
Total distributions | | | (1.01 | ) | | | (.45 | ) | | | — | | | | (1.05 | ) | | | (3.73 | ) |
Net asset value, end of period | | $ | 47.92 | | | $ | 41.80 | | | $ | 46.23 | | | $ | 39.03 | | | $ | 39.34 | |
|
Total Return | | | 17.17 | % | | | (8.74 | %) | | | 18.45 | % | | | 1.72 | % | | | 8.04 | % |
Ratios/Supplemental Data |
Net assets, end of period (in thousands) | | $ | 21,099 | | | $ | 34,073 | | | $ | 105,443 | | | $ | 9,006 | | | $ | 24,116 | |
Ratios to average net assets: |
Net investment income (loss) | | | 1.68 | % | | | 1.53 | % | | | 1.80 | % | | | 1.67 | % | | | 1.47 | % |
Total expenses | | | 1.45 | % | | | 1.48 | % | | | 1.48 | % | | | 1.38 | % | | | 1.38 | % |
Portfolio turnover rate | | | 156 | % | | | 169 | % | | | 390 | % | | | 452 | % | | | 507 | % |
A-Class | | Year Ended
March 31,
2021 | | | Year Ended
March 31,
2020 | | | Year Ended
March 31,
2019 | | | Year Ended
March 29,
2018 | | | Year Ended
March 31,
2017 | |
Per Share Data |
Net asset value, beginning of period | | $ | 38.30 | | | $ | 42.50 | | | $ | 35.97 | | | $ | 36.43 | | | $ | 37.63 | |
Income (loss) from investment operations: |
Net investment income (loss)a | | | .57 | | | | .57 | | | | .47 | | | | .54 | | | | .45 | |
Net gain (loss) on investments (realized and unrealized) | | | 5.86 | | | | (4.32 | ) | | | 6.06 | | | | .05 | | | | 2.08 | |
Total from investment operations | | | 6.43 | | | | (3.75 | ) | | | 6.53 | | | | .59 | | | | 2.53 | |
Less distributions from: |
Net investment income | | | (1.01 | ) | | | (.45 | ) | | | — | | | | (.53 | ) | | | (.87 | ) |
Net realized gains | | | — | | | | — | | | | — | | | | (.52 | ) | | | (2.86 | ) |
Total distributions | | | (1.01 | ) | | | (.45 | ) | | | — | | | | (1.05 | ) | | | (3.73 | ) |
Net asset value, end of period | | $ | 43.72 | | | $ | 38.30 | | | $ | 42.50 | | | $ | 35.97 | | | $ | 36.43 | |
|
Total Returnb | | | 16.91 | % | | | (8.96 | %) | | | 18.15 | % | | | 1.45 | % | | | 7.75 | % |
Ratios/Supplemental Data |
Net assets, end of period (in thousands) | | $ | 5,399 | | | $ | 4,225 | | | $ | 5,633 | | | $ | 3,482 | | | $ | 9,362 | |
Ratios to average net assets: |
Net investment income (loss) | | | 1.39 | % | | | 1.29 | % | | | 1.21 | % | | | 1.43 | % | | | 1.20 | % |
Total expenses | | | 1.70 | % | | | 1.73 | % | | | 1.72 | % | | | 1.63 | % | | | 1.63 | % |
Portfolio turnover rate | | | 156 | % | | | 169 | % | | | 390 | % | | | 452 | % | | | 507 | % |
SEE NOTES TO FINANCIAL STATEMENTS. | THE RYDEX FUNDS ANNUAL REPORT | 157 |
FINANCIAL HIGHLIGHTS (concluded) |
This table is presented to show selected data for a share outstanding throughout each period and to assist shareholders in evaluating a Fund’s performance for the periods presented.
C-Class | | Year Ended
March 31,
2021 | | | Year Ended
March 31,
2020 | | | Year Ended
March 31,
2019 | | | Year Ended
March 29,
2018 | | | Year Ended
March 31,
2017 | |
Per Share Data |
Net asset value, beginning of period | | $ | 31.80 | | | $ | 35.63 | | | $ | 30.39 | | | $ | 31.15 | | | $ | 32.96 | |
Income (loss) from investment operations: |
Net investment income (loss)a | | | .21 | | | | .21 | | | | .26 | | | | .25 | | | | .22 | |
Net gain (loss) on investments (realized and unrealized) | | | 4.84 | | | | (3.59 | ) | | | 4.98 | | | | .04 | | | | 1.70 | |
Total from investment operations | | | 5.05 | | | | (3.38 | ) | | | 5.24 | | | | .29 | | | | 1.92 | |
Less distributions from: |
Net investment income | | | (1.01 | ) | | | (.45 | ) | | | — | | | | (.53 | ) | | | (.87 | ) |
Net realized gains | | | — | | | | — | | | | — | | | | (.52 | ) | | | (2.86 | ) |
Total distributions | | | (1.01 | ) | | | (.45 | ) | | | — | | | | (1.05 | ) | | | (3.73 | ) |
Net asset value, end of period | | $ | 35.84 | | | $ | 31.80 | | | $ | 35.63 | | | $ | 30.39 | | | $ | 31.15 | |
|
Total Returnb | | | 16.02 | % | | | (9.65 | %) | | | 17.24 | % | | | 0.69 | % | | | 6.97 | % |
Ratios/Supplemental Data |
Net assets, end of period (in thousands) | | $ | 2,646 | | | $ | 5,093 | | | $ | 6,489 | | | $ | 6,526 | | | $ | 8,270 | |
Ratios to average net assets: |
Net investment income (loss) | | | 0.61 | % | | | 0.57 | % | | | 0.79 | % | | | 0.78 | % | | | 0.69 | % |
Total expenses | | | 2.45 | % | | | 2.47 | % | | | 2.46 | % | | | 2.38 | % | | | 2.37 | % |
Portfolio turnover rate | | | 156 | % | | | 169 | % | | | 390 | % | | | 452 | % | | | 507 | % |
H-Class | | Year Ended
March 31,
2021 | | | Year Ended
March 31,
2020 | | | Year Ended
March 31,
2019 | | | Year Ended
March 29,
2018 | | | Year Ended
March 31,
2017 | |
Per Share Data |
Net asset value, beginning of period | | $ | 36.86 | | | $ | 40.92 | | | $ | 34.64 | | | $ | 35.12 | | | $ | 36.40 | |
Income (loss) from investment operations: |
Net investment income (loss)a | | | .42 | | | | .50 | | | | .57 | | | | .31 | | | | .41 | |
Net gain (loss) on investments (realized and unrealized) | | | 5.77 | | | | (4.11 | ) | | | 5.71 | | | | .26 | | | | 2.04 | |
Total from investment operations | | | 6.19 | | | | (3.61 | ) | | | 6.28 | | | | .57 | | | | 2.45 | |
Less distributions from: |
Net investment income | | | (1.01 | ) | | | (.45 | ) | | | — | | | | (.53 | ) | | | (.87 | ) |
Net realized gains | | | — | | | | — | | | | — | | | | (.52 | ) | | | (2.86 | ) |
Total distributions | | | (1.01 | ) | | | (.45 | ) | | | — | | | | (1.05 | ) | | | (3.73 | ) |
Net asset value, end of period | | $ | 42.04 | | | $ | 36.86 | | | $ | 40.92 | | | $ | 34.64 | | | $ | 35.12 | |
|
Total Return | | | 16.92 | % | | | (8.97 | %) | | | 18.13 | % | | | 1.44 | % | | | 7.80 | % |
Ratios/Supplemental Data |
Net assets, end of period (in thousands) | | $ | 719 | | | $ | 2,427 | | | $ | 6,033 | | | $ | 810 | | | $ | 5,379 | |
Ratios to average net assets: |
Net investment income (loss) | | | 1.08 | % | | | 1.18 | % | | | 1.51 | % | | | 0.85 | % | | | 1.13 | % |
Total expenses | | | 1.72 | % | | | 1.73 | % | | | 1.72 | % | | | 1.63 | % | | | 1.62 | % |
Portfolio turnover rate | | | 156 | % | | | 169 | % | | | 390 | % | | | 452 | % | | | 507 | % |
a | Net investment income (loss) per share was computed using average shares outstanding throughout the period. |
b | Total return does not reflect the impact of any applicable sales charges. |
158 | THE RYDEX FUNDS ANNUAL REPORT | SEE NOTES TO FINANCIAL STATEMENTS. |
NOTES TO FINANCIAL STATEMENTS |
Note 1 – Organization and Significant Accounting Policies
Organization
The Rydex Series Funds (the “Trust”), a Delaware statutory trust, is registered with the SEC under the Investment Company Act of 1940 (”1940 Act”), as an open-ended investment company of the series type. Each series, in effect, is representing a separate fund (each, a “Fund”). The Trust may issue an unlimited number of authorized shares. The Trust accounts for the assets of each Fund separately.
The Trust offers a combination of seven separate classes of shares: Investor Class shares, A-Class shares, C-Class shares, H-Class shares, P-Class shares, Institutional Class shares and Money Market Class shares. Sales of shares of each Class are made without a front-end sales charge at the net asset value per share (“NAV”), with the exception of A-Class shares. A-Class shares are sold at the NAV, plus the applicable front-end sales charge. The sales charge varies depending on the amount purchased, but will not exceed 4.75%. A-Class share purchases of $1 million or more are exempt from the front-end sales charge but have a 1% contingent deferred sales charge (“CDSC”) if shares are redeemed within 12 months of purchase. C-Class shares have a 1% CDSC if shares are redeemed within 12 months of purchase. C-Class shares of each Fund automatically convert to A-Class shares of the same Fund on or about the 10th day of the month following the 10-year anniversary of the purchase of the C-Class shares. This conversion will be executed without any sales charge, fee or other charge. After the conversion is completed, the shares will be subject to all features and expenses of A-Class shares. Institutional Class shares are offered primarily for direct investment by institutions such as pension and profit sharing plans, endowments, foundations and corporations. Institutional Class shares require a minimum initial investment of $2 million and a minimum account balance of $1 million. At March 31, 2021, the Trust consisted of fifty-two funds.
This report covers the following funds (collectively, the “Funds”):
Fund Name | Investment
Company Type |
Banking Fund | Diversified |
Basic Materials Fund | Diversified |
Biotechnology Fund | Non-diversified |
Consumer Products Fund | Diversified |
Electronics Fund | Non-diversified |
Energy Fund | Diversified |
Energy Services Fund | Non-diversified |
Financial Services Fund | Diversified |
Health Care Fund | Diversified |
Internet Fund | Diversified |
Leisure Fund | Diversified |
Precious Metals Fund | Non-diversified |
Real Estate Fund | Diversified |
Retailing Fund | Diversified |
Technology Fund | Diversified |
Telecommunications Fund | Non-diversified |
Transportation Fund | Diversified |
Utilities Fund | Diversified |
At March 31, 2021, Investor Class, A-Class, C-Class and H-Class shares have been issued by the Funds.
The Funds invest in a specific industry sector. To the extent that investments are concentrated in a single sector, the Funds are subject to legislative or regulatory changes, adverse market conditions and/or increased competition affecting such sector.
The Funds seek capital appreciation and invest substantially all of their assets in equity securities of companies involved in their sector.
The Funds are designed and operated to accommodate frequent trading by shareholders and, unlike most mutual funds, offer unlimited exchange privileges with no minimum holding periods or transactions fees, which may cause the Funds to experience high portfolio turnover.
Security Investors, LLC, which operates under the name Guggenheim Investments (“GI”), provides advisory services. Guggenheim Funds Distributors, LLC (“GFD”) acts as principal underwriter for the Trust. GI and GFD are affiliated entities.
Significant Accounting Policies
The Funds operate as investment companies and, accordingly, follow the investment company accounting and reporting guidance of the Financial Accounting Standards Board (“FASB”) Accounting Standards Codification Topic 946 Financial Services – Investment Companies.
| | THE RYDEX FUNDS ANNUAL REPORT | 159 |
NOTES TO FINANCIAL STATEMENTS (continued) |
The following significant accounting policies are in conformity with U.S. generally accepted accounting principles (“U.S. GAAP”) and are consistently followed by the Trust. This requires management to make estimates and assumptions that affect the reported amount of assets and liabilities, contingent assets and liabilities at the date of the financial statements, and the reported amounts of revenues and expenses during the reporting period. Actual results could differ from these estimates. All time references are based on Eastern Time.
The NAV of each Class of a fund is calculated by dividing the market value of a fund’s securities and other assets, less all liabilities, attributable to the Class by the number of outstanding shares of the Class.
(a) Valuation of Investments
The Board of Trustees of the Funds (the “Board”) has adopted policies and procedures for the valuation of the Funds’ investments (the “Valuation Procedures”). Pursuant to the Valuation Procedures, the Board has delegated to a valuation committee, consisting of representatives from Guggenheim’s investment management, fund administration, legal and compliance departments (the “Valuation Committee”), the day-to-day responsibility for implementing the Valuation Procedures, including, under most circumstances, the responsibility for determining the fair value of the Funds’ securities and/or other assets.
Valuations of the Funds’ securities and other assets are supplied primarily by pricing services appointed pursuant to the processes set forth in the Valuation Procedures. The Valuation Committee convenes monthly, or more frequently as needed, to review the valuation of all assets which have been fair valued for reasonableness. The Funds’ officers, through the Valuation Committee and consistent with the monitoring and review responsibilities set forth in the Valuation Procedures, regularly review procedures used and valuations provided by the pricing services.
If the pricing service cannot or does not provide a valuation for a particular investment or such valuation is deemed unreliable, such investment is fair valued by the Valuation Committee.
Equity securities listed or traded on a recognized U.S. securities exchange or the National Association of Securities Dealers Automated Quotations (“NASDAQ”) National Market System shall generally be valued on the basis of the last sale price on the primary U.S. exchange or market on which the security is listed or traded; provided, however, that securities listed on NASDAQ will be valued at the NASDAQ Official Closing Price, which may not necessarily represent the last sale price. If there is no sale on the valuation date, exchange-traded U.S. equity securities will be valued on the basis of the last bid price.
Open-end investment companies are valued at their NAV as of the close of business, on the valuation date. Exchange-traded funds are valued at the last quoted sale price.
Repurchase agreements are generally valued at amortized cost, provided such amounts approximate market value.
Investments for which market quotations are not readily available are fair-valued as determined in good faith by GI, subject to review and approval by the Valuation Committee, pursuant to methods established or ratified by the Board. Valuations in accordance with these methods are intended to reflect each security’s (or asset’s or liability’s) “fair value”. Each such determination is based on a consideration of all relevant factors, which are likely to vary from one pricing context to another. Examples of such factors may include, but are not limited to market prices; sale prices; broker quotes; and models which derive prices based on inputs such as prices of securities with comparable maturities and characteristics, or based on inputs such as anticipated cash flows or collateral, spread over U.S. Treasury securities, and other information analysis.
(b) Currency Translations
The accounting records of the Funds are maintained in U.S. dollars. All assets and liabilities initially expressed in foreign currencies are converted into U.S. dollars at prevailing exchange rates. Purchases and sales of investment securities, dividend and interest income, and certain expenses are translated at the rates of exchange prevailing on the respective dates of such transactions. Changes in the relationship of these foreign currencies to the U.S. dollar can significantly affect the value of the investments and earnings of the Funds. Foreign investments may also subject the Funds to foreign government exchange restrictions, expropriation, taxation, or other political, social or economic developments, all of which could affect the market and/or credit risk of the investments.
The Funds do not isolate that portion of the results of operations resulting from changes in the foreign exchange rates on investments from the fluctuations arising from changes in the market prices of securities held. Such fluctuations are included with the net realized gain or loss and unrealized appreciation or depreciation on investments.
Reported net realized foreign exchange gains and losses arise from sales of foreign currencies and currency gains or losses realized between the trade and settlement dates on investment transactions. Net unrealized appreciation and depreciation arise
160 | THE RYDEX FUNDS ANNUAL REPORT | |
NOTES TO FINANCIAL STATEMENTS (continued) |
from changes in the fair values of assets and liabilities other than investments in securities at the fiscal period end, resulting from changes in exchange rates.
(c) Foreign Taxes
The Funds may be subject to foreign taxes (a portion of which may be reclaimable) on income, stock dividends, capital gains on investments or certain foreign currency transactions. All foreign taxes are recorded in accordance with the applicable foreign tax regulations and rates that exist in the foreign jurisdictions in which the Funds invest. These foreign taxes, if any, are paid by the Funds and reflected in their Statements of Operations as follows: foreign taxes withheld at source are presented as a reduction of income and foreign taxes on capital gains from sales of investments are included with the net realized gain (loss) on investments. Foreign taxes payable or deferred as of March 31, 2021, if any, are disclosed in the Funds’ Statements of Assets and Liabilities.
(d) Security Transactions
Security transactions are recorded on the trade date for financial reporting purposes. Realized gains and losses from securities transactions are recorded using the identified cost basis. Proceeds from lawsuits related to investment holdings are recorded as a reduction to cost if the securities are still held and as realized gains if no longer held in the respective Fund. Dividend income is recorded on the ex-dividend date, net of applicable taxes withheld by foreign countries, if any. Taxable non-cash dividends are recorded as dividend income. Interest income, including amortization of premiums and accretion of discounts, is accrued on a daily basis. Dividend income from Real Estate Investment Trusts (“REITs”) is recorded based on the income included in the distributions received from the REIT investments using published REIT classifications, including some management estimates when actual amounts are not available. Distributions received in excess of this estimated amount are recorded as a reduction of the cost of investments or reclassified to realized gains. The actual amounts of income, return of capital, and realized gains are only determined by each REIT after its fiscal year-end, and may differ from the estimated amounts.
(e) Distributions
Distributions of net investment income and net realized gains, if any, are declared and paid at least annually. Dividends are reinvested in additional shares, unless shareholders request payment in cash. Distributions are recorded on the ex-dividend date and are determined in accordance with U.S. federal income tax regulations which may differ from U.S. GAAP.
(f) Class Allocations
Interest and dividend income, most expenses, all realized gains and losses, and all unrealized appreciation and depreciation are allocated to the classes based upon the value of the outstanding shares in each Class. Certain costs, such as distribution and service fees are charged directly to specific classes. In addition, certain expenses have been allocated to the individual Funds in the Trust based on the respective net assets of each Fund included in the Trust.
(g) Cash
The Funds may leave cash overnight in their cash account with the custodian. Periodically, a Fund may have cash due to the custodian bank as an overdraft balance. A fee is incurred on this overdraft, calculated by multiplying the overdraft by a rate based on the federal funds rate, which was 0.06% at March 31, 2021.
(h) Indemnifications
Under the Funds’ organizational documents, the Trustees and Officers are indemnified against certain liabilities arising out of the performance of their duties to the Trust. In addition, throughout the normal course of business, the Funds enter into contracts that contain a variety of representations and warranties which provide general indemnifications. The Funds’ maximum exposure under these arrangements is unknown, as this would involve future claims that may be made against the Funds and/or their affiliates that have not yet occurred. However, based on experience, the Funds expect the risk of loss to be remote.
Note 2 – Investment Advisory Agreement and Other Agreements
Under the terms of an investment advisory contract, the Funds pay GI investment advisory fees calculated at the annualized rates below, based on the average daily net assets of the Funds:
Fund | | Management Fees
(as a % of Net Assets) | |
Banking Fund | | | 0.85 | % |
Basic Materials Fund | | | 0.85 | % |
Biotechnology Fund | | | 0.85 | % |
Consumer Products Fund | | | 0.85 | % |
Electronics Fund | | | 0.85 | % |
Energy Fund | | | 0.85 | % |
Energy Services Fund | | | 0.85 | % |
Financial Services Fund | | | 0.85 | % |
Health Care Fund | | | 0.85 | % |
Internet Fund | | | 0.85 | % |
Leisure Fund | | | 0.85 | % |
Precious Metals Fund | | | 0.75 | % |
Real Estate Fund | | | 0.85 | % |
Retailing Fund | | | 0.85 | % |
Technology Fund | | | 0.85 | % |
Telecommunications Fund | | | 0.85 | % |
Transportation Fund | | | 0.85 | % |
Utilities Fund | | | 0.85 | % |
| | THE RYDEX FUNDS ANNUAL REPORT | 161 |
NOTES TO FINANCIAL STATEMENTS (continued) |
When the aggregate assets of each series of the Trust (excluding the Long Short Equity Fund, Managed Futures Strategy Fund and Multi-Hedge Strategies Fund) and each series of Rydex Dynamic Funds equal or exceed $10 billion, the advisory fee rate paid by each individual Fund (excluding the Long Short Equity Fund, Managed Futures Strategy Fund and Multi-Hedge Strategies Fund) will be reduced in accordance with the asset level and breakpoint schedule set forth below.
Fund Assets Under Management | | Fund Asset-Based
Breakpoint Reductions | |
$500 million - $1 billion | | | 0.025 | % |
>$1 billion - $2 billion | | | 0.050 | % |
>$2 billion | | | 0.075 | % |
GI pays operating expenses on behalf of the Trust, such as audit and accounting related services, legal services, custody, printing and mailing, among others, on a pass-through basis. Such expenses are allocated to various Funds within the complex based on relative net assets.
The Board has adopted a Distribution Plan applicable to A-Class shares and H-Class shares for which GFD and other firms that provide distribution and/or shareholder services (“Service Providers”) may receive compensation. If a Service Provider provides distribution services, the Funds will pay distribution fees to GFD at an annual rate not to exceed 0.25% of average daily net assets, pursuant to Rule 12b-1 of the 1940 Act. GFD, in turn, will pay the Service Provider out of its fees. GFD may, at its discretion, retain a portion of such payments to compensate itself for distribution services.
The Board has adopted a separate Distribution and Shareholder Services Plan applicable to C-Class shares that allows the Funds to pay annual distribution and service fees of 1.00% of the Funds’ C-Class shares average daily net assets. The annual 0.25% service fee compensates a shareholder’s financial adviser for providing ongoing services to the shareholder. The annual distribution fee of 0.75% reimburses GFD for paying the shareholder’s financial adviser an ongoing sales commission. GFD advances the first year’s service and distribution fees to the financial adviser. GFD retains the service and distribution fees on accounts with no authorized dealer of record.
For the year ended March 31, 2021, GFD retained sales charges of $128,465 relating to sales of A-Class shares of the Trust.
Certain trustees and officers of the Trust are also officers of GI and/or GFD. The Trust does not compensate its officers or trustees who are officers, directors and/or employees of GI or GFD.
MUFG Investor Services (US), LLC (“MUIS”) acts as the Funds’ administrator, transfer agent and accounting agent. As administrator, transfer agent and accounting agent, MUIS maintains the books and records of the Funds’ securities and cash. U.S. Bank, N.A. (“U.S. Bank”) acts as the Funds’ custodian. As custodian, U.S. Bank is responsible for the custody of the Funds’ assets. For providing the aforementioned services, MUIS and U.S. Bank are entitled to receive a monthly fee equal to an annual percentage of each Fund’s average daily net assets and out of pocket expenses.
Note 3 – Federal Income Tax Information
The Funds intend to comply with the provisions of Subchapter M of the Internal Revenue Code applicable to regulated investment companies and will distribute substantially all taxable net investment income and capital gains sufficient to relieve the Funds from all, or substantially all, federal income, excise and state income taxes. Therefore, no provision for federal or state income tax or federal excise tax is required.
Tax positions taken or expected to be taken in the course of preparing the Funds’ tax returns are evaluated to determine whether the tax positions are “more-likely-than-not” of being sustained by the applicable tax authority. Tax positions not deemed to meet the more-likely-than-not threshold would be recorded as a tax benefit or expense in the current year. Management has analyzed the Funds’ tax positions taken, or to be taken, on U.S. federal income tax returns for all open tax years, and has concluded that no provision for income tax is required in the Funds’ financial statements. The Funds’ U.S. federal income tax returns are subject to examination by the Internal Revenue Service (“IRS”) for a period of three years after they are filed.
162 | THE RYDEX FUNDS ANNUAL REPORT | |
NOTES TO FINANCIAL STATEMENTS (continued) |
The tax character of distributions paid during the year ended March 31, 2021 was as follows:
Fund | | Ordinary
Income | | | Long-Term
Capital Gain | | | Total
Distributions | |
Banking Fund | | $ | 273,567 | | | $ | — | | | $ | 273,567 | |
Basic Materials Fund | | | 836,677 | | | | 424,181 | | | | 1,260,858 | |
Biotechnology Fund | | | 530,216 | | | | 13,301,693 | | | | 13,831,909 | |
Consumer Products Fund | | | 2,597,990 | | | | 6,624,818 | | | | 9,222,808 | |
Electronics Fund | | | — | | | | 946,545 | | | | 946,545 | |
Energy Fund | | | 292,058 | | | | — | | | | 292,058 | |
Energy Services Fund | | | 84,822 | | | | — | | | | 84,822 | |
Health Care Fund | | | 3,450,206 | | | | — | | | | 3,450,206 | |
Precious Metals Fund | | | 1,480,043 | | | | — | | | | 1,480,043 | |
Real Estate Fund | | | 261,411 | | | | — | | | | 261,411 | |
Technology Fund | | | — | | | | 1,060,519 | | | | 1,060,519 | |
Telecommunications Fund | | | 53,596 | | | | — | | | | 53,596 | |
Utilities Fund | | | 757,521 | | | | — | | | | 757,521 | |
The tax character of distributions paid during the year ended March 31, 2020 was as follows:
Fund | | Ordinary
Income | | | Long-Term
Capital Gain | | | Total
Distributions | |
Banking Fund | | $ | 179,656 | | | $ | — | | | $ | 179,656 | |
Basic Materials Fund | | | 1,119,758 | | | | 341,784 | | | | 1,461,542 | |
Biotechnology Fund | | | — | | | | 9,558,792 | | | | 9,558,792 | |
Consumer Products Fund | | | 2,524,545 | | | | 1,441,214 | | | | 3,965,759 | |
Electronics Fund | | | 7,066 | | | | — | | | | 7,066 | |
Energy Fund | | | 148,596 | | | | — | | | | 148,596 | |
Energy Services Fund | | | 8,234 | | | | — | | | | 8,234 | |
Financial Services Fund | | | 115,290 | | | | — | | | | 115,290 | |
Internet Fund | | | — | | | | 903,814 | | | | 903,814 | |
Leisure Fund | | | 41,159 | | | | — | | | | 41,159 | |
Precious Metals Fund | | | 2,055,112 | | | | — | | | | 2,055,112 | |
Real Estate Fund | | | 248,692 | | | | — | | | | 248,692 | |
Technology Fund | | | — | | | | 329,115 | | | | 329,115 | |
Telecommunications Fund | | | 153,139 | | | | — | | | | 153,139 | |
Transportation Fund | | | 139,337 | | | | 470,590 | | | | 609,927 | |
Utilities Fund | | | 965,922 | | | | — | | | | 965,922 | |
Note: For U.S. federal income tax purposes, short-term capital gain distributions are treated as ordinary income distributions.
| | THE RYDEX FUNDS ANNUAL REPORT | 163 |
NOTES TO FINANCIAL STATEMENTS (continued) |
The tax components of distributable earnings/(loss) as of March 31, 2021 were as follows:
Fund | | Undistributed
Ordinary
Income | | | Undistributed
Long-Term
Capital Gain | | | Net
Unrealized
Appreciation
(Depreciation) | | | Accumulated
Capital and
Other Losses | | | Other
Temporary
Differences | | | Total | |
Banking Fund | | $ | 173,043 | | | $ | — | | | $ | 2,234,379 | | | $ | (10,294,700 | ) | | $ | — | | | $ | (7,887,278 | ) |
Basic Materials Fund | | | 993,080 | | | | — | | | | 13,809,930 | | | | — | | | | (130,382 | ) | | | 14,672,628 | |
Biotechnology Fund | | | 20,768,447 | | | | 10,318,863 | | | | 81,794,217 | | | | — | | | | — | | | | 112,881,527 | |
Consumer Products Fund | | | 2,026,650 | | | | 6,050,582 | | | | 49,646,461 | | | | — | | | | — | | | | 57,723,693 | |
Electronics Fund | | | 2,818,384 | | | | 158,561 | | | | 24,486,542 | | | | — | | | | — | | | | 27,463,487 | |
Energy Fund | | | 306,823 | | | | — | | | | (4,348,110 | ) | | | (21,892,552 | ) | | | — | | | | (25,933,839 | ) |
Energy Services Fund | | | 31,147 | | | | — | | | | (4,600,756 | ) | | | (31,215,944 | ) | | | — | | | | (35,785,553 | ) |
Financial Services Fund | | | 440,761 | | | | — | | | | 5,335,265 | | | | — | | | | — | | | | 5,776,026 | |
Health Care Fund | | | 2,349,865 | | | | — | | | | 7,679,066 | | | | — | | | | — | | | | 10,028,931 | |
Internet Fund | | | 5,759,963 | | | | — | | | | 12,431,990 | | | | — | | | | — | | | | 18,191,953 | |
Leisure Fund | | | 1,045,171 | | | | — | | | | 8,161,132 | | | | — | | | | — | | | | 9,206,303 | |
Precious Metals Fund | | | 4,119,129 | | | | — | | | | 2,217,570 | | | | (25,522,142 | ) | | | (276,532 | ) | | | (19,461,975 | ) |
Real Estate Fund | | | 30,821 | | | | — | | | | 564,727 | | | | (6,325,560 | ) | | | — | | | | (5,730,012 | ) |
Retailing Fund | | | 2,322,882 | | | | — | | | | 6,827,945 | | | | — | | | | — | | | | 9,150,827 | |
Technology Fund | | | 6,840,735 | | | | — | | | | 28,780,365 | | | | — | | | | — | | | | 35,621,100 | |
Telecommunications Fund | | | 5,248 | | | | — | | | | 125,937 | | | | (1,856,864 | ) | | | — | | | | (1,725,679 | ) |
Transportation Fund | | | 1,787,255 | | | | — | | | | 19,265,099 | | | | — | | | | — | | | | 21,052,354 | |
Utilities Fund | | | 570,750 | | | | — | | | | 1,979,586 | | | | (1,020,244 | ) | | | — | | | | 1,530,092 | |
For U.S. federal income tax purposes, capital loss carryforwards represent realized losses of the Funds that may be carried forward and applied against future capital gains. The Funds are permitted to carry forward capital losses for an unlimited period and such capital loss carryforwards retain their character as either short-term or long-term capital losses. As of March 31, 2021, capital loss carryforwards for the Funds were as follows:
| | Unlimited | | | | | |
| Fund | | | Short-Term | | | | Long-Term | | | |
Total
Capital Loss
Carryforward | |
Banking Fund | | $ | (8,822,994 | ) | | $ | (1,471,706 | ) | | $ | (10,294,700 | ) |
Energy Fund | | | (6,034,653 | ) | | | (15,857,899 | ) | | | (21,892,552 | ) |
Energy Services Fund | | | (18,418,782 | ) | | | (12,797,162 | ) | | | (31,215,944 | ) |
Precious Metals Fund | | | (1,028,615 | ) | | | (24,493,527 | ) | | | (25,522,142 | ) |
Real Estate Fund | | | (3,734,149 | ) | | | (2,591,411 | ) | | | (6,325,560 | ) |
Telecommunications Fund | | | (1,399,410 | ) | | | (457,454 | ) | | | (1,856,864 | ) |
Utilities Fund | | | — | | | | (1,020,244 | ) | | | (1,020,244 | ) |
For the year ended March 31, 2021, the following capital loss carryforward amounts were utilized:
Fund | | Utilized | |
Basic Materials Fund | | $ | 1,606,895 | |
Internet Fund | | | 1,122,826 | |
Precious Metals Fund | | | 5,839,853 | |
Net investment income and net realized gains (losses) may differ for financial statement and tax purposes because of temporary or permanent book/tax differences. These differences are primarily due to investments in real estate investment trusts, losses deferred due to wash sales, distributions in connection with redemption of fund shares, and the “mark-to-market,” recharacterization, or disposition of certain Passive Foreign Investment Companies (PFICs). Additional differences may result from the tax treatment of net operating losses, certain corporate actions, and foreign capital gains taxes. To the extent these differences are permanent and would require a reclassification between Paid in Capital and Total Distributable Earnings (Loss), such reclassifications are made in the period that the differences arise. These reclassifications have no effect on net assets or NAV per share.
164 | THE RYDEX FUNDS ANNUAL REPORT | |
NOTES TO FINANCIAL STATEMENTS (continued) |
The following adjustments were made on the Statements of Assets and Liabilities as of March 31, 2021 for permanent book/tax differences:
Fund | | Paid In
Capital | | | Total
Distributable
Earnings/(Loss) | |
Basic Materials Fund | | $ | 136,269 | | | $ | (136,269 | ) |
Biotechnology Fund | | | 18,833,106 | | | | (18,833,106 | ) |
Consumer Products Fund | | | 4,655,282 | | | | (4,655,282 | ) |
Electronics Fund | | | 5,990,907 | | | | (5,990,907 | ) |
Financial Services Fund | | | 342,008 | | | | (342,008 | ) |
Health Care Fund | | | 6,082,516 | | | | (6,082,516 | ) |
Internet Fund | | | 5,593,174 | | | | (5,593,174 | ) |
Leisure Fund | | | 389,279 | | | | (389,279 | ) |
Retailing Fund | | | 2,234,406 | | | | (2,234,406 | ) |
Technology Fund | | | 7,103,356 | | | | (7,103,356 | ) |
Transportation Fund | | | 476,973 | | | | (476,973 | ) |
At March 31, 2021, the cost of investments for U.S. federal income tax purposes, the aggregate gross unrealized appreciation for all investments for which there was an excess of value over tax cost and the aggregate gross unrealized depreciation for all investments for which there was an excess of tax cost over value, were as follows:
Fund | | Tax
Cost | | | Tax
Unrealized
Appreciation | | | Tax
Unrealized
Depreciation | | | Net Tax
Unrealized
Appreciation/
(Depreciation) | |
Banking Fund | | $ | 16,474,923 | | | $ | 2,266,319 | | | $ | (31,940 | ) | | $ | 2,234,379 | |
Basic Materials Fund | | | 35,898,002 | | | | 13,953,406 | | | | (143,476 | ) | | | 13,809,930 | |
Biotechnology Fund | | | 113,674,389 | | | | 89,502,726 | | | | (7,708,509 | ) | | | 81,794,217 | |
Consumer Products Fund | | | 60,256,502 | | | | 49,646,461 | | | | — | | | | 49,646,461 | |
Electronics Fund | | | 48,978,010 | | | | 24,519,526 | | | | (32,984 | ) | | | 24,486,542 | |
Energy Fund | | | 27,297,857 | | | | — | | | | (4,348,110 | ) | | | (4,348,110 | ) |
Energy Services Fund | | | 11,244,027 | | | | — | | | | (4,600,756 | ) | | | (4,600,756 | ) |
Financial Services Fund | | | 34,675,726 | | | | 5,388,568 | | | | (53,303 | ) | | | 5,335,265 | |
Health Care Fund | | | 24,292,416 | | | | 7,965,810 | | | | (286,744 | ) | | | 7,679,066 | |
Internet Fund | | | 21,247,722 | | | | 12,980,205 | | | | (548,215 | ) | | | 12,431,990 | |
Leisure Fund | | | 45,638,778 | | | | 8,288,404 | | | | (127,272 | ) | | | 8,161,132 | |
Precious Metals Fund | | | 110,985,140 | | | | 3,972,452 | | | | (1,754,882 | ) | | | 2,217,570 | |
Real Estate Fund | | | 11,608,518 | | | | 656,096 | | | | (91,369 | ) | | | 564,727 | |
Retailing Fund | | | 21,681,165 | | | | 6,886,007 | | | | (58,062 | ) | | | 6,827,945 | |
Technology Fund | | | 24,636,165 | | | | 29,096,170 | | | | (315,805 | ) | | | 28,780,365 | |
Telecommunications Fund | | | 2,558,748 | | | | 165,034 | | | | (39,097 | ) | | | 125,937 | |
Transportation Fund | | | 59,537,640 | | | | 20,411,619 | | | | (1,146,520 | ) | | | 19,265,099 | |
Utilities Fund | | | 27,836,187 | | | | 2,030,597 | | | | (51,011 | ) | | | 1,979,586 | |
Note 4 – Fair Value Measurement
In accordance with U.S. GAAP, fair value is defined as the price that the Funds would receive to sell an investment or pay to transfer a liability in an orderly transaction with an independent buyer in the principal market, or in the absence of a principal market, the most advantageous market for the investment or liability. U.S. GAAP establishes a three-tier fair value hierarchy based on the types of inputs used to value assets and liabilities and requires corresponding disclosure. The hierarchy and the corresponding inputs are summarized below:
Level 1 — | quoted prices in active markets for identical assets or liabilities. |
Level 2 — | significant other observable inputs (for example quoted prices for securities that are similar based on characteristics such as interest rates, prepayment speeds, credit risk, etc.). |
| | THE RYDEX FUNDS ANNUAL REPORT | 165 |
NOTES TO FINANCIAL STATEMENTS (continued) |
Level 3 — | significant unobservable inputs based on the best information available under the circumstances, to the extent observable inputs are not available, which may include assumptions. |
The types of inputs available depend on a variety of factors, such as the type of security and the characteristics of the markets in which it trades, if any. Fair valuation determinations that rely on fewer or no observable inputs require greater judgment. Accordingly, fair value determinations for Level 3 securities require the greatest amount of judgment.
The inputs or methodologies used for valuing securities are not necessarily an indication of the risk associated with investing in those securities. The suitability of the techniques and sources employed to determine fair valuation are regularly monitored and subject to change.
Note 5 – Securities Transactions
For the year ended March 31, 2021, the cost of purchases and proceeds from sales of investment securities, excluding short-term investments, were as follows:
Fund | | Purchases | | | Sales | |
Banking Fund | | $ | 88,981,321 | | | $ | 97,745,488 | |
Basic Materials Fund | | | 65,877,984 | | | | 57,545,952 | |
Biotechnology Fund | | | 240,233,404 | | | | 277,968,919 | |
Consumer Products Fund | | | 43,934,899 | | | | 73,341,187 | |
Electronics Fund | | | 80,876,152 | | | | 86,900,826 | |
Energy Fund | | | 142,328,131 | | | | 131,486,680 | |
Energy Services Fund | | | 35,752,537 | | | | 33,622,620 | |
Financial Services Fund | | | 64,541,284 | | | | 41,691,919 | |
Health Care Fund | | | 130,903,333 | | | | 141,471,041 | |
Internet Fund | | | 130,114,314 | | | | 138,674,086 | |
Leisure Fund | | | 66,383,044 | | | | 29,236,153 | |
Precious Metals Fund | | | 314,093,241 | | | | 302,562,053 | |
Real Estate Fund | | | 33,464,098 | | | | 25,888,616 | |
Retailing Fund | | | 77,198,706 | | | | 67,242,762 | |
Technology Fund | | | 122,045,490 | | | | 139,774,698 | |
Telecommunications Fund | | | 12,181,120 | | | | 14,205,434 | |
Transportation Fund | | | 120,871,333 | | | | 76,034,359 | |
Utilities Fund | | | 58,836,886 | | | | 80,125,872 | |
The Funds are permitted to purchase or sell securities from or to certain affiliated funds under specified conditions outlined in procedures adopted by the Board. The procedures have been designed to ensure that any purchase or sale of securities by a Fund from or to another fund or portfolio that is or could be considered an affiliate by virtue of having a common investment adviser (or affiliated investment advisers), common
166 | THE RYDEX FUNDS ANNUAL REPORT | |
NOTES TO FINANCIAL STATEMENTS (continued) |
trustees and/or common officers complies with Rule 17a-7 of the 1940 Act. Further, as defined under these procedures, each transaction is effected at the current market price to save costs, where permissible. For the year ended March 31, 2021, the Funds engaged in purchases and sales of securities, pursuant to Rule 17a-7 of the 1940 Act, as follows:
Fund | | Purchases | | | Sales | | | Realized
Gain (Loss) | |
Banking Fund | | $ | 7,004,833 | | | $ | 11,488,328 | | | $ | 144,590 | |
Basic Materials Fund | | | 4,686,844 | | | | 3,453,925 | | | | 138,558 | |
Biotechnology Fund | | | 7,711,906 | | | | 10,046,249 | | | | 772,736 | |
Consumer Products Fund | | | 1,762,526 | | | | 8,745,313 | | | | 2,161,370 | |
Electronics Fund | | | 16,916,418 | | | | 11,756,159 | | | | 1,438,314 | |
Energy Fund | | | 8,481,778 | | | | 9,619,549 | | | | (50,141 | ) |
Energy Services Fund | | | 5,608,979 | | | | 6,341,949 | | | | (748,747 | ) |
Financial Services Fund | | | 10,811,228 | | | | 7,412,580 | | | | (174,543 | ) |
Health Care Fund | | | 8,391,241 | | | | 19,869,281 | | | | 1,646,840 | |
Internet Fund | | | 11,676,665 | | | | 28,142,385 | | | | 2,642,520 | |
Leisure Fund | | | 13,257,900 | | | | 2,588,271 | | | | 60,305 | |
Precious Metals Fund | | | 8,279,428 | | | | 7,870,669 | | | | (95,866 | ) |
Real Estate Fund | | | 2,193,441 | | | | 4,056,302 | | | | (61,490 | ) |
Retailing Fund | | | 10,179,264 | | | | 5,248,103 | | | | 216,099 | |
Technology Fund | | | 17,310,984 | | | | 37,389,126 | | | | 3,001,966 | |
Telecommunications Fund | | | 1,593,090 | | | | 1,986,336 | | | | 42,412 | |
Transportation Fund | | | 8,024,576 | | | | 5,586,619 | | | | 546,173 | |
Utilities Fund | | | 2,100,238 | | | | 5,003,078 | | | | 126,266 | |
Note 6 – Repurchase Agreements
The Funds transfer uninvested cash balances into a single joint account, the daily aggregate balance of which is invested in one or more repurchase agreements collateralized by obligations of the U.S. Treasury and U.S. government agencies. The joint account includes other Funds in the Guggenheim complex not covered in this report. The collateral is in the possession of the Funds’ custodian and is evaluated to ensure that its market value exceeds, at a minimum, 102% of the original face amount of the repurchase agreements. Each Fund holds a pro rata share of the collateral based on the dollar amount of the repurchase agreement entered into by each Fund.
At March 31, 2021, the repurchase agreements in the joint account were as follows:
Counterparty and
Terms of Agreement | | Face Value | | | Repurchase Price | | | Collateral | | Par Value | | | Fair Value | |
J.P. Morgan Securities LLC | | | | | | | | | | U.S. Treasury Bond | | | | | | | | |
0.01% | | | | | | | | | | 2.38% | | | | | | | | |
Due 04/01/21 | | $ | 124,999,036 | | | $ | 124,999,053 | | | 11/15/49 | | $ | 126,141,600 | | | $ | 127,499,092 | |
| | | | | | | | | | | | | | | | | | | |
Barclays Capital, Inc. | | | | | | | | | | U.S. Treasury Inflation Indexed Bond | | | | | | | | |
0.01% | | | | | | | | | | 0.13% | | | | | | | | |
Due 04/01/21 | | | 56,830,637 | | | | 56,830,653 | | | 02/15/51 | | | 57,053,077 | | | | 57,967,257 | |
| | | | | | | | | | | | | | | | | | | |
BofA Securities, Inc. | | | | | | | | | | U.S. Treasury Note | | | | | | | | |
0.01% | | | | | | | | | | 0.38% | | | | | | | | |
Due 04/01/21 | | | 51,866,820 | | | | 51,866,827 | | | 04/30/25 | | | 53,449,300 | | | | 52,904,236 | |
In the event of counterparty default, the Funds have the right to collect the collateral to offset losses incurred. There is potential loss to the Funds in the event the Funds are delayed or prevented from exercising their rights to dispose of the collateral securities, including the risk of a possible decline in the value of the underlying securities during the period while the Funds seek to assert their rights. GI, acting under the supervision of the Board, reviews the value of the collateral and the creditworthiness of those banks and dealers with which the Funds enter into repurchase agreements to evaluate potential risks.
| | THE RYDEX FUNDS ANNUAL REPORT | 167 |
NOTES TO FINANCIAL STATEMENTS (continued) |
Note 7 – Portfolio Securities Loaned
The Funds may lend their securities to approved brokers to earn additional income. Security lending income shown on the Statements of Operations is shown net of rebates paid to the borrowers and earnings on cash collateral investments shared with the lending agent. Within this arrangement, the Funds act as the lender, U.S. Bank acts as the lending agent, and other approved registered broker dealers act as the borrowers. The Funds receive cash collateral, valued at 102% of the value of the securities on loan. Under the terms of the Funds’ securities lending agreement with U.S. Bank, cash collateral and proceeds are invested in the First American Government Obligations Fund — Class Z. The Funds bear the risk of loss on cash collateral investments. Collateral is maintained over the life of the loan in an amount not less than the value of loaned securities, as determined at the close of fund business each day; any additional collateral required due to changes in security values is delivered to the Funds the next business day. Although the collateral mitigates the risk, the Funds could experience a delay in recovering their securities and a possible loss of income or value if the borrower fails to return the securities. The Funds have the right under the securities lending agreement to recover the securities from the borrower on demand. Securities lending transactions are accounted for as secured borrowings. The remaining contractual maturity of the securities lending agreement is overnight and continuous.
At March 31, 2021, the Funds participated in securities lending transactions, which are subject to enforceable netting arrangements, as follows:
| | | Gross Amounts Not Offset in the
Statements of Assets and Liabilities | | | | Securities Lending Collateral | |
Fund | | Value of
Securities
Loaned | | | Collateral
Received(a) | | | Net
Amount | | | | Cash
Collateral
Invested | | | Cash
Collateral
Uninvested | | | Total
Collateral | |
Banking Fund | | $ | 108,491 | | | $ | (108,491 | ) | | $ | — | | | | $ | 115,144 | | | $ | — | | | $ | 115,144 | |
Basic Materials Fund | | | 844,355 | | | | (844,355 | ) | | | — | | | | | 850,597 | | | | — | | | | 850,597 | |
Biotechnology Fund | | | 4,673,992 | | | | (4,514,930 | ) | | | 159,062 | | | | | 4,514,930 | * | | | — | | | | 4,514,930 | |
Consumer Products Fund | | | 1,487,292 | | | | (1,487,292 | ) | | | — | | | | | 1,504,750 | | | | — | | | | 1,504,750 | |
Electronics Fund | | | 1,494,033 | | | | (1,476,009 | ) | | | 18,024 | | | | | 1,476,009 | * | | | — | | | | 1,476,009 | |
Energy Fund | | | 17,261 | | | | (17,261 | ) | | | — | | | | | 17,740 | | | | — | | | | 17,740 | |
Energy Services Fund | | | 99,992 | | | | (99,992 | ) | | | — | | | | | 101,115 | | | | — | | | | 101,115 | |
Financial Services Fund | | | 430,876 | | | | (430,876 | ) | | | — | | | | | 442,611 | | | | — | | | | 442,611 | |
Health Care Fund | | | 508,604 | | | | (504,567 | ) | | | 4,037 | | | | | 504,567 | * | | | — | | | | 504,567 | |
Internet Fund | | | 460,922 | | | | (455,086 | ) | | | 5,836 | | | | | 455,086 | * | | | — | | | | 455,086 | |
Leisure Fund | | | 866,939 | | | | (866,939 | ) | | | — | | | | | 883,846 | | | | — | | | | 883,846 | |
Precious Metals Fund | | | 2,346,682 | | | | (2,325,137 | ) | | | 21,545 | | | | | 2,325,137 | * | | | — | | | | 2,325,137 | |
Real Estate Fund | | | 31,204 | | | | (31,204 | ) | | | — | | | | | 32,671 | | | | — | | | | 32,671 | |
Retailing Fund | | | 265,813 | | | | (263,122 | ) | | | 2,691 | | | | | 263,122 | * | | | — | | | | 263,122 | |
Technology Fund | | | 608,783 | | | | (606,261 | ) | | | 2,522 | | | | | 606,261 | * | | | — | | | | 606,261 | |
Telecommunications Fund | | | 8,570 | | | | (8,570 | ) | | | — | | | | | 8,570 | | | | — | | | | 8,570 | |
Transportation Fund | | | 2,616,657 | | | | (2,616,657 | ) | | | — | | | | | 2,639,008 | | | | — | | | | 2,639,008 | |
(a) | Actual collateral received by the Fund is generally greater than the amount shown due to overcollateralization. |
* | Subsequent to March 31, 2021, additional collateral was received. |
In the event of counterparty default, the Funds have the right to collect the collateral to offset losses incurred. There is potential loss to the Funds in the event the Funds are delayed or prevented from exercising their rights to dispose of the collateral securities, including the risk of a possible decline in the value of the underlying securities during the period while the Funds seek to assert their rights. GI, acting under the supervision of the Board, reviews the value of the collateral and the creditworthiness of those banks and dealers to evaluate potential risks.
Note 8 – Line of Credit
The Trust, along with other affiliated trusts, secured an uncommitted $75,000,000 line of credit from U.S. Bank, N.A., which expired June 8, 2020. On June 8, 2020, the line of credit agreement was renewed at an increased amount of $150,000,000 and expires on June 7, 2021. On February 10, 2021, the line of credit was increased from $150,000,000 to $200,000,000. This line of credit is reserved for emergency or temporary purposes. Borrowings, if any, under this arrangement bear interest equal to the Prime Rate, minus 2%, which shall be paid monthly, averaging 1.25% for the year ended March 31, 2021. The Funds did not have any borrowings outstanding under this agreement at March 31, 2021.
168 | THE RYDEX FUNDS ANNUAL REPORT | |
NOTES TO FINANCIAL STATEMENTS (continued) |
The average daily balances borrowed for the year ended March 31, 2021, were as follows:
Fund | | Average Daily Balance | |
Banking Fund | | $ | 312 | |
Basic Materials Fund | | | 2,121 | |
Biotechnology Fund | | | 21,027 | |
Consumer Products Fund | | | 521 | |
Electronics Fund | | | 37,233 | |
Energy Fund | | | 6,312 | |
Energy Services Fund | | | 2,888 | |
Financial Services Fund | | | 1,858 | |
Health Care Fund | | | 581 | |
Internet Fund | | | 3,945 | |
Leisure Fund | | | 945 | |
Precious Metals Fund | | | 8,378 | |
Real Estate Fund | | | 1,570 | |
Retailing | | | 279 | |
Technology Fund | | | 1,581 | |
Telecommunications Fund | | | 885 | |
Transportation Fund | | | 5,616 | |
Utilities Fund | | | 18,737 | |
Note 9 – Reverse Share Splits
Effective on August 10, 2020, reverse share splits occurred for the following Funds:
Fund | Split Type |
Energy Fund | One-for-Three Reverse Share Split |
Energy Services Fund | One-for-Fifteen Reverse Share Split |
The effect of these transactions was to divide the number of outstanding shares of the Energy Fund and the Energy Services Fund by their respective reverse split ratios, resulting in a corresponding increase in the NAV. The share transactions presented in the Statements of Changes in Net Assets and the Per Share Data in the Financial Highlights for each of the periods presented prior to the effective date, have been restated to reflect these respective share splits. There were no changes in net assets, results of operations or total return as a result of these transactions.
Note 10 – Legal Proceedings
Tribune Company
Rydex Series Funds has been named as a defendant and a putative member of the proposed defendant class of shareholders in the case entitled Kirschner v. FitzSimons, No. 12-2652 (S.D.N.Y.) (formerly Official Committee of Unsecured Creditors of Tribune Co. v. FitzSimons, Adv. Pro. No. 10-54010 (Bankr. D. Del.)) (the “FitzSimons action”), as a result of ownership by certain series of the Rydex Series Funds of shares in the Tribune Company (“Tribune”) in 2007, when Tribune effected a leveraged buyout transaction (“LBO”) by which Tribune converted to a privately-held company. In his complaint, the plaintiff has alleged that, in connection with the LBO, Tribune insiders and shareholders were overpaid for their Tribune stock using financing that the insiders knew would, and ultimately did, leave Tribune insolvent. The plaintiff has asserted claims against certain insiders, major shareholders, professional advisers, and others involved in the LBO. The plaintiff is also attempting to obtain from former Tribune shareholders, including the Rydex Series Funds, the proceeds they received in connection with the LBO.
In June 2011, a group of Tribune creditors filed multiple actions against former Tribune shareholders involving state law constructive fraudulent conveyance claims arising out of the 2007 LBO (the “SLCFC actions”). Rydex Series Funds has been named as a defendant in one or more of these suits. In those actions, the creditors seek to recover from Tribune’s former shareholders the proceeds received in connection with the 2007 LBO.
| | THE RYDEX FUNDS ANNUAL REPORT | 169 |
NOTES TO FINANCIAL STATEMENTS (continued) |
The FitzSimons action and the SLCFC actions have been consolidated with the majority of the other Tribune LBO-related lawsuits in a multidistrict litigation proceeding captioned In re Tribune Company Fraudulent Conveyance Litig., No. 11-md-2296 (S.D.N.Y.) (the “MDL Proceeding”).
On September 23, 2013, the District Court granted the defendants’ omnibus motion to dismiss the SLCFC actions, on the basis that the creditors lacked standing. On September 30, 2013, the creditors filed a notice of appeal of the September 23 order. On October 28, 2013, the defendants filed a joint notice of cross-appeal of that same order.
On March 29, 2016, the U.S. Court of Appeals for the Second Circuit issued its opinion on the appeal of the SLCFC actions. The appeals court affirmed the district court’s dismissal of those lawsuits, but on different grounds than the district court. The appeals court held that while the plaintiffs have standing under the U.S. Bankruptcy Code, their claims were preempted by Section 546(e) of the Bankruptcy Code—the statutory safe harbor for settlement payments.
On April 12, 2016, the Plaintiffs in the SLCFC actions filed a petition seeking rehearing en banc before the appeals court. On July 22, 2016, the appeals court denied the petition. On September 9, 2016, the plaintiffs filed a petition for writ of certiorari in the U.S. Supreme Court challenging the Second Circuit’s decision that the safe harbor of Section 546(e) applied to their claims. The shareholder defendants, including the Funds, filed a joint brief in opposition to the petition for certiorari on October 24, 2016. On April 3, 2018, Justice Kennedy and Justice Thomas issued a “Statement” related to the petition for certiorari suggesting that the Second Circuit and/or District Court may want to take steps to reexamine the application of the Section 546(e) safe harbor to the previously dismissed state law constructive fraudulent transfer claims based on the Supreme Court’s decision in Merit Management Group LP v. FTI Consulting, Inc. On April 10, 2018, Plaintiffs filed in the Second Circuit a motion for that court to recall its mandate, vacate its prior decision, and remand to the district court for further proceedings consistent with Merit Management. On April 20, 2018, the shareholder defendants filed an opposition to Plaintiffs’ motion to recall the mandate. On May 15, 2018, the Second Circuit issued an order recalling the mandate “in anticipation of further panel review.” On December 19, 2019, the Second Circuit issued an amended opinion that again affirmed the district court’s ruling on the basis that plaintiffs’ claims were preempted by Section 546(e) of the Bankruptcy Code. Plaintiffs filed a motion for rehearing and rehearing en banc on January 2, 2020. The Second Circuit denied the petition on February 6, 2020. On July 6, 2020, plaintiffs filed a new petition for a writ of certiorari in the U.S. Supreme Court. In that petition, plaintiffs stated that “[t]o make it more likely that there will be a quorum for this petition,” they have “abandon[ed] the case and let the judgment below stand” with respect to certain defendants. That list did not include the Rydex Series Funds. Defendants filed an opposition to the certiorari petition on August 26, 2020, and plaintiffs filed a reply in support of the petition for certiorari on September 8, 2020. On March 12, 2021, the Solicitor General filed an amicus brief recommending that certiorari be denied. Plaintiffs filed a supplemental brief in response to the Solicitor General’s amicus brief on March 31, 2021, and Defendants filed a supplemental brief on April 1, 2021.
On May 23, 2014, the defendants filed motions to dismiss the FitzSimons action, including a global motion to dismiss Count I, which is the claim brought against former Tribune shareholders for intentional fraudulent conveyance under U.S. federal law. On January 6, 2017, the United States District Court for the Southern District of New York granted the shareholder defendants’ motion to dismiss the intentional fraudulent conveyance claim in the FitzSimons action. In dismissing the intentional fraudulent conveyance claim, the Court denied the plaintiff’s request to amend the complaint. The plaintiff requested that the Court direct entry of a final judgment in order to make the order immediately appealable. On February 23, 2017, the Court issued an order stating that it intended to permit an interlocutory appeal of the dismissal order, but would wait to do so until it has resolved outstanding motions to dismiss filed by other defendants.
On July 18, 2017, the plaintiff submitted a letter to the District Court seeking leave to amend its complaint to add a constructive fraudulent transfer claim. The shareholder defendants opposed that request. On August 24, 2017, the Court denied the plaintiff’s request without prejudice to renewal of the request in the event of an intervening change in the law. On March 8, 2018, the plaintiff renewed his request for leave to file a motion to amend the complaint to assert a constructive fraudulent transfer claim based on the Supreme Court’s ruling in Merit Management Group LP v. FTI Consulting, Inc. The shareholder defendants opposed that request. On June 18, 2018 the District Court ordered that the request would be stayed pending further action by the Second Circuit in the SLCFC actions.
On December 18, 2018, plaintiff filed a letter with the District Court requesting that the stay be dissolved in order to permit briefing on the motion to amend the complaint and indicating plaintiff’s intention to file another motion to amend the complaint to reinstate claims for intentional fraudulent transfer. The shareholder defendants opposed that request. On January 14, 2019, the court held a case management conference, during which the court stated that it would not lift the stay prior to further action from the Second Circuit in the SLCFC actions.
170 | THE RYDEX FUNDS ANNUAL REPORT | |
NOTES TO FINANCIAL STATEMENTS (concluded) |
The court further stated that it would allow the plaintiff to file a motion to amend to try to reinstate its intentional fraudulent transfer claim. On January 23, 2019, the court ordered the parties still facing pending claims to participate in a mediation, to commence on January 28, 2019. The mediation did not result in a settlement of the claims against the shareholder defendants.
On April 4, 2019, plaintiff filed a motion to amend the Fifth Amended Complaint to assert a federal constructive fraudulent transfer claim against certain shareholder defendants. On April 10, 2019, the shareholder defendants filed a brief in opposition to plaintiff’s motion to amend. On April 12, 2019, the plaintiff filed a reply brief. On April 23, 2019, the court denied the plaintiff’s motion to amend. On June 13, 2019, the court entered judgment pursuant to Rule 54(b). On July 12, 2019, the Plaintiff filed a notice of appeal with respect to the dismissal of his claims and the District Court’s denial of his motion for leave to amend. Plaintiff filed an appellate brief on January 7, 2020. The shareholder defendants’ brief was filed on April 27, 2020. Plaintiff filed a reply brief on May 18, 2020. The Court held oral argument on August 24, 2020.
None of these lawsuits alleges any wrongdoing on the part of Rydex Series Funds. The following series of Rydex Series Funds held shares of Tribune and tendered these shares as part of Tribune’s LBO: Nova Fund, S&P 500® Pure Value Fund, Multi-Cap Core Equity Fund, S&P 500® Fund, Multi-Hedge Strategies Fund and Hedged Equity Fund (the “Funds”). The value of the proceeds received by the foregoing Funds was $28,220, $109,242, $9,860, $3,400, $1,181,160, and $10,880, respectively. At this stage of the proceedings, Rydex Series Funds is not able to make a reliable predication as to the outcome of these lawsuits or the effect, if any, on a Fund’s net asset value.
Note 11 – COVID-19
The global ongoing crisis caused by the outbreak of COVID-19 and the current recovery underway is causing disruption to consumer demand and economic output and supply chains. There are still travel restrictions and quarantines, and adverse impacts on local and global economies. Investors should be aware that in light of the current uncertainty, volatility and distress in economies, the financial markets, and labor and public health conditions around the world, the Funds’ investments and a shareholder’s investment in the Fund are subject to sudden and substantial losses, increased volatility and other adverse events. Firms through which investors invest with the Funds, the Funds, their service providers, the markets in which they invest and market intermediaries are also impacted by quarantines and similar measures intended to respond to and contain the ongoing pandemic, which can obstruct their functioning and subject them to heightened operational and other risks.
Note 12 – Subsequent Events
The Funds evaluated subsequent events through the date the financial statements were available for issue and determined there were no material events that would require adjustment to or disclosure in the Funds’ financial statements.
| | THE RYDEX FUNDS ANNUAL REPORT | 171 |
REPORT OF INDEPENDENT REGISTERED PUBLIC ACCOUNTING FIRM |
To the Shareholders of Banking Fund, Basic Materials Fund, Biotechnology Fund, Consumer Products Fund, Electronics Fund, Energy Fund, Energy Services Fund, Financial Services Fund, Health Care Fund, Internet Fund, Leisure Fund, Precious Metals Fund, Real Estate Fund, Retailing Fund, Technology Fund, Telecommunications Fund, Transportation Fund and Utilities Fund and the Board of Trustees of Rydex Series Funds
Opinion on the Financial Statements
We have audited the accompanying statements of assets and liabilities of Banking Fund, Basic Materials Fund, Biotechnology Fund, Consumer Products Fund, Electronics Fund, Energy Fund, Energy Services Fund, Financial Services Fund, Health Care Fund, Internet Fund, Leisure Fund, Precious Metals Fund, Real Estate Fund, Retailing Fund, Technology Fund, Telecommunications Fund, Transportation Fund and Utilities Fund (collectively referred to as the “Funds”), (eighteen of the funds constituting Rydex Series Funds (the “Trust”)), including the schedules of investments, as of March 31, 2021, and the related statements of operations for the year then ended, the statements of changes in net assets for each of the two years in the period then ended, the financial highlights for each of the five years in the period then ended and the related notes (collectively referred to as the “financial statements”). In our opinion, the financial statements present fairly, in all material respects, the financial position of each of the Funds (eighteen of the funds constituting Rydex Series Funds) at March 31, 2021, the results of their operations for the year then ended, the changes in their net assets for each of the two years in the period then ended and their financial highlights for each of the five years in the period then ended, in conformity with U.S. generally accepted accounting principles.
Basis for Opinion
These financial statements are the responsibility of the Trust’s management. Our responsibility is to express an opinion on each of the Funds’ financial statements based on our audits. We are a public accounting firm registered with the Public Company Accounting Oversight Board (United States) (“PCAOB”) and are required to be independent with respect to the Trust in accordance with the U.S. federal securities laws and the applicable rules and regulations of the Securities and Exchange Commission and the PCAOB.
We conducted our audits in accordance with the standards of the PCAOB. Those standards require that we plan and perform the audit to obtain reasonable assurance about whether the financial statements are free of material misstatement, whether due to error or fraud. The Trust is not required to have, nor were we engaged to perform, an audit of the Trust’s internal control over financial reporting. As part of our audits, we are required to obtain an understanding of internal control over financial reporting but not for the purpose of expressing an opinion on the effectiveness of the Trust’s internal control over financial reporting. Accordingly, we express no such opinion.
Our audits included performing procedures to assess the risks of material misstatement of the financial statements, whether due to error or fraud, and performing procedures that respond to those risks. Such procedures included examining, on a test basis, evidence regarding the amounts and disclosures in the financial statements. Our procedures included confirmation of securities owned as of March 31, 2021, by correspondence with the custodian and brokers or by other appropriate auditing procedures where replies from brokers were not received. Our audits also included evaluating the accounting principles used and significant estimates made by management, as well as evaluating the overall presentation of the financial statements. We believe that our audits provide a reasonable basis for our opinion.

We have served as the auditor of one or more Guggenheim investment companies since 1979.
Tysons, Virginia
May 26, 2021
172 | THE RYDEX FUNDS ANNUAL REPORT | |
OTHER INFORMATION (Unaudited) |
Federal Income Tax Information
This information is being provided as required by the Internal Revenue Code. Amounts shown may differ from those elsewhere in the report because of differences in tax and financial reporting practice.
In January 2022, shareholders will be advised on IRS Form 1099 DIV or substitute 1099 DIV as to the federal tax status of the distributions received by shareholders in the calendar year 2021.
The Funds’ investment income (dividend income plus short-term capital gains, if any) qualifies as follows:
Of the taxable ordinary income distributions paid during the fiscal year ending March 31, 2021, the following funds had the corresponding percentages qualify for the reduced tax rate pursuant to the Jobs and Growth Tax Relief and Reconciliation Act of 2003 or for the dividends received deduction for corporations. See the qualified dividend income and dividend received deduction columns, respectively, in the table below.
Additionally, of the taxable ordinary income distributions paid during the fiscal year ended March 31, 2021, the following funds had the corresponding percentages qualify as qualified short-term capital gains as permitted by IRC Section 871(k)(2). See qualified short-term capital gain column in the table below.
Fund | | Qualified
Dividend
Income | | | Dividend
Received
Deduction | | | Qualified
Short-Term
Capital Gain | |
Banking Fund | | | 100.00 | % | | | 100.00 | % | | | 0.00 | % |
Basic Materials Fund | | | 36.45 | % | | | 17.83 | % | | | 100.00 | % |
Biotechnology Fund | | | 0.00 | % | | | 0.00 | % | | | 100.00 | % |
Consumer Products Fund | | | 100.00 | % | | | 96.91 | % | | | 100.00 | % |
Energy Fund | | | 100.00 | % | | | 100.00 | % | | | 0.00 | % |
Energy Services Fund | | | 100.00 | % | | | 100.00 | % | | | 0.00 | % |
Health Care Fund | | | 4.73 | % | | | 3.43 | % | | | 100.00 | % |
Precious Metals Fund | | | 15.47 | % | | | 9.48 | % | | | 0.00 | % |
Real Estate Fund | | | 16.90 | % | | | 16.95 | % | | | 0.00 | % |
Telecommunications Fund | | | 98.16 | % | | | 97.52 | % | | | 0.00 | % |
Utilities Fund | | | 100.00 | % | | | 100.00 | % | | | 0.00 | % |
With respect to the taxable year ended March 31, 2021, the Funds hereby designate as capital gain dividends the amounts listed below, or, if subsequently determined to be different, the net capital gain of such year:
Fund | | From long-term
capital gain: | | | From long-term capital
gain, using proceeds
from shareholder
redemptions: | |
Basic Materials Fund | | $ | 424,181 | | | $ | — | |
Biotechnology Fund | | | 13,301,693 | | | | 18,833,106 | |
Consumer Products Fund | | | 6,624,818 | | | | 4,655,282 | |
Electronics Fund | | | 946,545 | | | | 5,990,907 | |
Financial Services Fund | | | — | | | | 155,340 | |
Health Care Fund | | | — | | | | 747,830 | |
Internet Fund | | | — | | | | 1,632,406 | |
Technology Fund | | | 1,060,519 | | | | 7,081,869 | |
Final regulations dated June 24, 2020 enable a regulated investment company to pay Section 199A dividends to its shareholders. Section 199A, enacted as part of the Tax Cuts and Jobs Act of 2017, may allow non-corporate tax payers a deduction of up to 20% of qualified business income from flow-through entities, including dividends from real estate investment trusts. The qualifying percentage of the Fund’s ordinary income and short-term capital gain distributions, if any, for the purposes of the Section 199A deduction was 74.25% for Real Estate Fund.
| | THE RYDEX FUNDS ANNUAL REPORT | 173 |
OTHER INFORMATION (Unaudited)(concluded) |
Delivery of Shareholder Reports
Paper copies of the Funds’ annual and semi-annual shareholder reports are not sent by mail, unless you specifically request paper copies of the reports from a fund or from your financial intermediary. Instead, the reports are made available on a website, and you are notified by mail each time a report is posted and provided with a website link to access the report.
You may elect to receive all future shareholder reports in paper free of charge. If you hold shares of a fund directly, you can inform the Fund that you wish to receive paper copies of reports by calling 800.820.0888. If you hold shares of a fund through a financial intermediary, please contact the financial intermediary to make this election. Your election to receive reports in paper may apply to all Guggenheim Funds in which you are invested and may apply to all Guggenheim funds held with your financial intermediary.
Proxy Voting Information
A description of the policies and procedures that the Trust uses to determine how to vote proxies relating to securities held in the Funds’ portfolios is available, without charge and upon request, by calling 800.820.0888. This information is also available from the EDGAR database on the SEC’s website at https://www.sec.gov.
Information regarding how the Funds’ voted proxies relating to portfolio securities during the most recent 12-month period ended June 30 is available without charge, upon request, by calling 800.820.0888. This information is also available from the EDGAR database on the SEC’s website at https://www.sec.gov.
Sector Classification
Information in the Schedule of Investments is categorized by sectors using sector-level Classifications defined by the Bloomberg Industry Classification System, a widely recognized industry classification system provider. Each Fund’s registration statement has investment policies relating to concentration in specific sectors/industries. For purposes of these investment policies, the Funds usually classify sectors/industries based on industry-level Classifications used by widely recognized industry classification system providers such as Bloomberg Industry Classification System, Global Industry Classification Standards and Barclays Global Classification Scheme.
Quarterly Portfolio Schedules Information
The Trust files its complete schedule of portfolio holdings with the SEC for the first and third quarters of each fiscal year as an exhibit to its reports on Form N-PORT, and for reporting periods ended prior to March 31, 2019, filed such information on Form N-Q. The Funds’ Forms N-PORT and N-Q are available on the SEC’s website at https://www.sec.gov. Copies of the portfolio holdings are also available to shareholders, without charge and upon request, by calling 800.820.0888.
174 | THE RYDEX FUNDS ANNUAL REPORT | |
INFORMATION ON BOARD OF TRUSTEES AND OFFICERS (Unaudited) |
A Board of Trustees oversees the Trust, as well as other trusts of GI, in which its members have no stated term of service, and continue to serve after election until resignation. The Statement of Additional Information includes further information about Fund Trustees and Officers, and can be obtained without charge by visiting guggenheiminvestments.com or by calling 800.820.0888.
Name, Address*
and Year of Birth | Position(s)
Held with
Trust | Term of Office
and Length of
Time Served** | Principal Occupation(s)
During Past Five Years | Number of
Portfolios
in Fund
Complex
Overseen | Other
Directorships Held
by Trustees*** |
INDEPENDENT TRUSTEES | | | |
Randall C. Barnes (1951) | Trustee and Chair of the Valuation Oversight Committee | Since 2019 (Trustee)
Since 2020 (Chair of the Valuation Oversight Committee) | Current: Private Investor (2001-present). Former: Senior Vice President and Treasurer, PepsiCo, Inc. (1993-1997); President, Pizza Hut International (1991-1993); Senior Vice President, Strategic Planning and New Business Development, PepsiCo, Inc. (1987-1990). | 157 | Current: Purpose Investments Funds (2013-present). Former: Managed Duration Investment Grade Municipal Fund (2006-2016). |
Angela Brock-Kyle (1959) | Trustee | Since 2016 | Current: Founder and Chief Executive Officer, B.O.A.R.D.S. (2013-present). Former: Senior Leader, TIAA (1987-2012). | 156 | Current: Bowhead Insurance GP, LLC (2020-present); Hunt Companies, Inc. (2019-present). Former: Infinity Property & Casualty Corp. (2014-2018). |
Thomas F. Lydon, Jr. (1960) | Trustee and Chair of the Contracts Review Committee | Since 2005 (Trustee) Since 2020 (Chair of the Contracts Review Committee) | Current: President, Global Trends Investments (1996-present); Co-Chief Executive Officer, ETF Flows, LLC (2019-present); Chief Executive Officer, Lydon Media (2016-present). | 156 | Current: US Global Investors (GROW) (1995-present).
Former: Harvest Volatility Edge Trust (3) (2017-2019). |
Ronald A. Nyberg (1953) | Trustee and Chair of the Nominating and Governance Committee | Since 2019 | Current: Of Counsel, Momkus LLP (2016-present). Former: Partner, Nyberg & Cassioppi, LLC (2000-2016); Executive Vice President, General Counsel, and Corporate Secretary, Van Kampen Investments (1982-1999). | 157 | Current: PPM Funds (2) (2018-present); Edward-Elmhurst Healthcare System (2012-present). Former: Western Asset Inflation-Linked Opportunities & Income Fund (2004-2020); Western Asset Inflation-Linked Income Fund (2003-2020); Managed Duration Investment Grade Municipal Fund (2003-2016). |
| | THE RYDEX FUNDS ANNUAL REPORT | 175 |
INFORMATION ON BOARD OF TRUSTEES AND OFFICERS (Unaudited)(continued) |
Name, Address*
and Year of Birth | Position(s)
Held with
Trust | Term of Office
and Length of
Time Served** | Principal Occupation(s)
During Past Five Years | Number of
Portfolios
in Fund
Complex
Overseen | Other
Directorships Held
by Trustees*** |
INDEPENDENT TRUSTEES - concluded | | |
Sandra G. Sponem (1958) | Trustee and Chair of the Audit Committee | Since 2016 (Trustee) Since 2019 (Chair of the Audit Committee) | Current: Retired. Former: Senior Vice President and Chief Financial Officer, M.A. Mortenson-Companies, Inc. (2007-2017). | 156 | Current: SPDR Series Trust (81) (2018-present); SPDR Index Shares Funds (30) (2018-present); SSGA Active Trust (14) (2018-present). Former: SSGA Master Trust (1) (2018-2020). |
Ronald E. Toupin, Jr. (1958) | Trustee, Chair of the Board and Chair of the Executive Committee | Since 2019 | Current: Portfolio Consultant (2010-present); Member, Governing Council, Independent Directors Council (2013-present); Governor, Board of Governors, Investment Company Institute (2018-present). Former: Member, Executive Committee, Independent Directors Council (2016-2018); Vice President, Manager and Portfolio Manager, Nuveen Asset Management (1998-1999); Vice President, Nuveen Investment Advisory Corp. (1992-1999); Vice President and Manager, Nuveen Unit Investment Trusts (1991-1999); and Assistant Vice President and Portfolio Manager, Nuveen Unit Investment Trusts (1988-1999), each of John Nuveen & Co., Inc. (1982-1999). | 156 | Former: Western Asset Inflation-Linked Opportunities & Income Fund (2004-2020); Western Asset Inflation-Linked Income Fund (2003-2020); Managed Duration Investment Grade Municipal Fund (2003-2016). |
176 | THE RYDEX FUNDS ANNUAL REPORT | |
INFORMATION ON BOARD OF TRUSTEES AND OFFICERS (Unaudited)(continued) |
Name, Address*
and Year of Birth | Position(s)
Held with
Trust | Term of Office
and Length of
Time Served** | Principal Occupation(s)
During Past Five Years | Number of
Portfolios
in Fund
Complex
Overseen | Other
Directorships Held
by Trustees*** |
INTERESTED TRUSTEE | | | | |
Amy J. Lee**** (1961) | Trustee, Vice President and Chief Legal Officer | Since 2019 | Current: Interested Trustee, certain other funds in the Fund Complex (2018-present); Chief Legal Officer, certain other funds in the Fund Complex (2014-present); Vice President, certain other funds in the Fund Complex (2007-present); Senior Managing Director, Guggenheim Investments (2012-present). Former: President and Chief Executive Officer, certain other funds in the Fund Complex (2017-2019); Vice President, Associate General Counsel and Assistant Secretary, Security Benefit Life Insurance Company and Security Benefit Corporation (2004-2012). | 156 | None. |
* | The business address of each Trustee is c/o Guggenheim Investments, 227 West Monroe Street, Chicago, Illinois 60606. |
** | Each Trustee serves an indefinite term, until his or her successor is elected and qualified. |
*** | Each Trustee also serves on the Boards of Trustees of Guggenheim Funds Trust, Guggenheim Variable Funds Trust, Guggenheim Strategy Funds Trust, Fiduciary/Claymore Energy Infrastructure Fund, Guggenheim Taxable Municipal Bond & Investment Grade Debt Trust, Guggenheim Strategic Opportunities Fund, Guggenheim Enhanced Equity Income Fund, Guggenheim Energy & Income Fund, Guggenheim Credit Allocation Fund, Rydex Series Funds, Rydex Dynamic Funds, Rydex Variable Trust and Transparent Value Trust. Messrs. Barnes and Nyberg also serve on the Board of Trustees of Advent Convertible & Income Fund. |
**** | This Trustee is deemed to be an “interested person” of the Funds under the 1940 Act by reason of her position with the Funds’ Investment Manager and/or the parent of the Investment Manager. |
| | THE RYDEX FUNDS ANNUAL REPORT | 177 |
INFORMATION ON BOARD OF TRUSTEES AND OFFICERS (Unaudited)(continued) |
Name, Address*
and Year of Birth | Position(s)
Held with
Trust | Term of Office
and Length of
Time Served** | Principal Occupation(s)
During Past Five Years |
OFFICERS | | | |
Brian E. Binder (1972) | President and Chief Executive Officer | Since 2019 | Current: President and Chief Executive Officer, certain other funds in the Fund Complex (2018-present); President, Chief Executive Officer and Chairman of the Board of Managers, Guggenheim Funds Investment Advisors, LLC (2018-present); President and Chief Executive Officer, Security Investors, LLC (2018-present); Board Member of Guggenheim Partners Fund Management (Europe) Limited (2018-present); Senior Managing Director and Chief Administrative Officer, Guggenheim Investments (2018-present).
Former: Managing Director and President, Deutsche Funds, and Head of US Product, Trading and Fund Administration, Deutsche Asset Management (2013-2018); Managing Director, Head of Business Management and Consulting, Invesco Ltd. (2010-2012). |
James M. Howley (1972) | Assistant Treasurer | Since 2016 | Current: Managing Director, Guggenheim Investments (2004-present); Assistant Treasurer, certain other funds in the Fund Complex (2006-present).
Former: Manager, Mutual Fund Administration of Van Kampen Investments, Inc. (1996-2004). |
Mark E. Mathiasen (1978) | Secretary | Since 2017 | Current: Secretary, certain other funds in the Fund Complex (2007-present); Managing Director, Guggenheim Investments (2007-present). |
Glenn McWhinnie (1969) | Assistant Treasurer | Since 2016 | Current: Vice President, Guggenheim Investments (2009-present); Assistant Treasurer, certain other funds in the Fund Complex (2016-present). |
Michael P. Megaris (1984) | Assistant Secretary | Since 2018 | Current: Assistant Secretary, certain other funds in the Fund Complex (2014-present); Director, Guggenheim Investments (2012-present). |
Elisabeth Miller (1968) | Chief Compliance Officer | Since 2012 | Current: Chief Compliance Officer, certain other funds in the Fund Complex (2012-present); Senior Managing Director, Guggenheim Investments (2012-present). Vice President, Guggenheim Funds Distributors, LLC (2014-present).
Former: Chief Compliance Officer, Security Investors, LLC and Guggenheim Funds Investment Advisors, LLC (2012-2018); Chief Compliance Officer, Guggenheim Distributors, LLC (2009-2014); Senior Manager, Security Investors, LLC (2004-2014); Senior Manager, Guggenheim Distributors, LLC (2004-2014). |
Margaux Misantone (1978) | AML Officer | Since 2017 | Current: Chief Compliance Officer, Security Investors, LLC and Guggenheim Funds Investment Advisors, LLC (2018-present); AML Officer, Security Investors, LLC and certain other funds in the Fund Complex (2017-present); Managing Director, Guggenheim Investments (2015-present).
Former: Assistant Chief Compliance Officer, Security Investors, LLC and Guggenheim Funds Investments Advisors, LLC (2015-2018). |
178 | THE RYDEX FUNDS ANNUAL REPORT | |
INFORMATION ON BOARD OF TRUSTEES AND OFFICERS (Unaudited)(concluded) |
Name, Address*
and Year of Birth | Position(s)
Held with
Trust | Term of Office
and Length of
Time Served** | Principal Occupation(s)
During Past Five Years |
OFFICERS - concluded | |
Kimberly J. Scott (1974) | Assistant Treasurer | Since 2016 | Current: Director, Guggenheim Investments (2012-present); Assistant Treasurer, certain other funds in the Fund Complex (2012-present).
Former: Financial Reporting Manager, Invesco, Ltd. (2010-2011); Vice President/Assistant Treasurer, Mutual Fund Administration for Van Kampen Investments, Inc./Morgan Stanley Investment Management (2009-2010); Manager of Mutual Fund Administration, Van Kampen Investments, Inc./Morgan Stanley Investment Management (2005-2009). |
Bryan Stone (1979) | Vice President | Since 2019 | Current: Vice President, certain other funds in the Fund Complex (2014-present); Managing Director, Guggenheim Investments (2013-present).
Former: Senior Vice President, Neuberger Berman Group LLC (2009-2013); Vice President, Morgan Stanley (2002-2009). |
John L. Sullivan (1955) | Chief Financial Officer, Chief Accounting Officer and Treasurer | Since 2016 | Current: Chief Financial Officer, Chief Accounting Officer and Treasurer, certain other funds in the Fund Complex (2010-present); Senior Managing Director, Guggenheim Investments (2010-present).
Former: Managing Director and Chief Compliance Officer, each of the funds in the Van Kampen Investments fund complex (2004-2010); Managing Director and Head of Fund Accounting and Administration, Morgan Stanley Investment Management (2002-2004); Chief Financial Officer and Treasurer, Van Kampen Funds (1996-2004). |
Jon Szafran (1989) | Assistant Treasurer | Since 2017 | Current: Vice President, Guggenheim Investments (2017-present); Assistant Treasurer, certain other funds in the Fund Complex (2017-present).
Former: Assistant Treasurer of Henderson Global Funds and Manager of US Fund Administration, Henderson Global Investors (North America) Inc. (“HGINA”), (2017); Senior Analyst of US Fund Administration, HGINA (2014–2017); Senior Associate of Fund Administration, Cortland Capital Market Services, LLC (2013-2014); Experienced Associate, PricewaterhouseCoopers LLP (2012-2013). |
* | The business address of each officer is c/o Guggenheim Investments, 227 West Monroe Street, Chicago, Illinois 60606. |
** | Each officer serves an indefinite term, until his or her successor is duly elected and qualified. |
| | THE RYDEX FUNDS ANNUAL REPORT | 179 |
GUGGENHEIM INVESTMENTS PRIVACY NOTICE (Unaudited) |
Who We Are
This Privacy Notice describes the data protection practices of Guggenheim Investments. Guggenheim Investments as used herein refers to the affiliated investment management businesses of Guggenheim Partners, LLC: Guggenheim Funds Investment Advisors, LLC, Guggenheim Partners Investment Management, LLC, Guggenheim Funds Distributors, LLC, Security Investors, LLC, Guggenheim Investment Advisors (Europe) Limited, Guggenheim Real Estate, LLC, GS Gamma Advisors, LLC, Guggenheim Partners India Management, LLC, Guggenheim Partners Europe Limited, as well as the funds in the Guggenheim Funds complex (the “Funds”) (“Guggenheim Investments,” “we,” “us,” or “our”).
Guggenheim Partners Investment Management Holdings, LLC, located at 330 Madison Avenue, New York, New York 10017 is the data controller for your information. The affiliates who are also controllers of certain of your information are: Guggenheim Investment Advisors (Europe) Limited, Guggenheim Partners Europe Limited, Guggenheim Partners, LLC, Guggenheim Funds Investment Advisors, LLC, Guggenheim Partners Investment Management, LLC, Guggenheim Funds Distributors, LLC and Security Investors, LLC, as well as the Funds.
Our Commitment to You
Guggenheim Investments considers your privacy our utmost concern. When you become our client or investor, you entrust us with not only your hard-earned money but also with your personal and financial information. Because we have access to your private information, we hold ourselves to the highest standards in its safekeeping and use. We strictly limit how we share your information with others, whether you are a current or former Guggenheim Investments client or investor.
The Information We Collect About You
We collect certain nonpublic personal information about you from information you provide on applications, other forms, our website, and/or from third parties including investment advisors. This information includes Social Security or other tax identification number, assets, income, tax information, retirement and estate plan information, transaction history, account balance, payment history, bank account information, marital status, family relationships, information that we collect on our website through the use of “cookies,” and other personal information that you or others provide to us. We may also collect such information through your inquiries by mail, e-mail or telephone. We may also collect customer due diligence information, as required by applicable law and regulation, through third party service providers.
How We Handle Your Personal Information
The legal basis for using your information as set out in this Privacy Notice is as follows: (a) use of your personal data is necessary to perform our obligations under any contract with you (such as a contract for us to provide financial services to you); or (b) where use of your personal data is not necessary for performance of a contract, use of your personal data is necessary for our legitimate interests or the legitimate interests of others (for example, to enforce the legal terms governing our services, operate and market our website and other services we offer, ensure safe environments for our personnel and others, make and receive payments, prevent fraud and to know the customer to whom we are providing the services). Some processing is done to comply with applicable law.
In addition to the specific uses described above, we also use your information in the following manner:
| | ● | We use your information in connection with servicing your accounts. |
| | ● | We use information to respond to your requests or questions. For example, we might use your information to respond to your customer feedback. |
| | ● | We use information to improve our products and services. We may use your information to make our website and products better. We may use your information to customize your experience with us. |
| | ● | We use information for security purposes. We may use your information to protect our company and our customers. |
| | ● | We use information to communicate with you. For example, we will communicate with you about your account or our relationship. We may contact you about your feedback. We might also contact you about this Privacy Notice. We may also enroll you in our email newsletter. |
180 | THE RYDEX FUNDS ANNUAL REPORT | |
GUGGENHEIM INVESTMENTS PRIVACY NOTICE (Unaudited)(continued) |
| | ● | We use information as otherwise permitted by law, as we may notify you. |
| | ● | Aggregate/Anonymous Data. We may aggregate and/or anonymize any information collected through the website so that such information can no longer be linked to you or your device (“Aggregate/Anonymous Information”). We may use Aggregate/Anonymous Information for any purpose, including without limitation for research and marketing purposes, and may also share such data with any third parties, including advertisers, promotional partners, and sponsors. |
We do not sell information about current or former clients or their accounts to third parties. Nor do we share this information, except when necessary to complete transactions at your request, to make you aware of investment products and services that we or our affiliates offer, or as permitted or required by law.
We provide information about you to companies and individuals not affiliated with Guggenheim Investments to complete certain transactions or account changes, or to perform services for us related to your account. For example, if you ask to transfer assets from another financial institution to Guggenheim Investments, we must provide certain information about you to that company to complete the transaction. We provide the third party with only the information necessary to carry out its responsibilities and only for that purpose. And we require these third parties to treat your private information with the same high degree of confidentiality that we do. To alert you to other Guggenheim Investments products and services, we share your information within our family of affiliated companies. You may limit our sharing with affiliated companies as set out below. We may also share information with any successor to all or part of our business, or in connection with steps leading up to a merger or acquisition. For example, if part of our business was sold we may give customer information as part of that transaction. We may also share information about you with your consent.
We will release information about you if you direct us to do so, if we are compelled by law to do so, or in other circumstances as permitted by law (for example, to protect your account from fraud).
If you close your account(s) or become an inactive client or investor, we will continue to adhere to the privacy policies and practices described in this notice.
Opt-Out Provisions and Your Data Choices
The law allows you to “opt out” of certain kinds of information sharing with third parties. We do not share personal information about you with any third parties that triggers this opt-out right. This means YOU ARE ALREADY OPTED OUT.
When you are no longer our client or investor, we continue to share your information as described in this notice, and you may contact us at any time to limit our sharing by sending an email to CorporateDataPrivacy@GuggenheimPartners.com.
European Union Data Subjects and certain others: In addition to the choices set forth above, residents of the European Union and certain other jurisdictions have certain rights to (1) request access to or rectification or deletion of information we collect about them, (2) request a restriction on the processing of their information, (3) object to the processing of their information, or (4) request the portability of certain information. To exercise these or other rights, please contact us using the contact information below. We will consider all requests and provide our response within the time period stated by applicable law. Please note, however, that certain information may be exempt from such requests in some circumstances, which may include if we need to keep processing your information for our legitimate interests or to comply with a legal obligation. We may request you provide us with information necessary to confirm your identity before responding to your request.
Residents of France and certain other jurisdictions may also provide us with instructions regarding the manner in which we may continue to store, erase and share your information after your death, and where applicable, the person you have designated to exercise these rights after your death.
| | THE RYDEX FUNDS ANNUAL REPORT | 181 |
GUGGENHEIM INVESTMENTS PRIVACY NOTICE (Unaudited)(concluded) |
How We Protect Privacy Online
We take steps to protect your privacy when you use our web site – www.guggenheiminvestments.com – by using secure forms of online communication, including encryption technology, Secure Socket Layer (SSL) protocol, firewalls and user names and passwords. These safeguards vary based on the sensitivity of the information that we collect and store. However, we cannot and do not guarantee that these measures will prevent every unauthorized attempt to access, use, or disclose your information since despite our efforts, no Internet and/or other electronic transmissions can be completely secure. Our web site uses “http cookies”—tiny pieces of information that we ask your browser to store. We use cookies for session management and security features on the Guggenheim Investments web site. We do not use them to pull data from your hard drive, to learn your e-mail address, or to view data in cookies created by other web sites. We will not share the information in our cookies or give others access to it. See the legal information area on our web site for more details about web site security and privacy features.
How We Safeguard Your Personal Information and Data Retention
We restrict access to nonpublic personal information about you to our employees and in some cases to third parties (for example, the service providers described above) as permitted by law. We maintain strict physical, electronic and procedural safeguards that comply with federal standards to guard your nonpublic personal information.
We keep your information for no longer than necessary for the purposes for which it is processed. The length of time for which we retain information depends on the purposes for which we collected and use it and/or as required to comply with applicable laws. Information may persist in copies made for backup and business continuity purposes for additional time.
International Visitors
If you are not a resident of the United States, please be aware that your information may be transferred to, stored and processed in the United States where our servers are located and our databases are operated. The data protection and other laws of the United States and other countries might not be as comprehensive as those in your country.
In such cases, we ensure that a legal basis for such a transfer exists and that adequate protection is provided as required by applicable law, for example, by using standard contractual clauses or by transferring your data to a jurisdiction that has obtained an adequacy finding. Individuals whose data may be transferred on the basis of standard contractual clauses may contact us as described below.
We’ll Keep You Informed
If you have any questions or concerns about how we treat your personal data, we encourage you to consult with us first. You may also contact the relevant supervisory authority.
We reserve the right to modify this policy at any time and will inform you promptly of material changes. You may access our privacy policy from our web site at www.guggenheiminvestments.com. Should you have any questions regarding our privacy policy, contact us by email at CorporateDataPrivacy@GuggenheimPartners.com.
182 | THE RYDEX FUNDS ANNUAL REPORT | |
This page intentionally left blank.
This page intentionally left blank.
This page intentionally left blank.
This page intentionally left blank.
This page intentionally left blank.
This page intentionally left blank.
This page intentionally left blank.
3.31.2021
Rydex Funds Annual Report
Domestic Equity Funds |
Nova Fund |
S&P 500® Fund |
Inverse S&P 500® Strategy Fund |
Monthly Rebalance NASDAQ-100® 2x Strategy Fund |
Inverse NASDAQ-100® Strategy Fund |
Mid-Cap 1.5x Strategy Fund |
Inverse Mid-Cap Strategy Fund |
Russell 2000® 1.5x Strategy Fund |
Russell 2000® Fund |
Inverse Russell 2000® Strategy Fund |
Dow Jones Industrial Average® Fund |
Fixed Income Funds |
Government Long Bond 1.2x Strategy Fund |
Inverse Government Long Bond Strategy Fund |
High Yield Strategy Fund |
Inverse High Yield Strategy Fund |
Money Market Fund |
U.S. Government Money Market Fund |
GuggenheimInvestments.com | RBENF-ANN-0321x0322 |

| | |
DEAR SHAREHOLDER | 2 |
ECONOMIC AND MARKET OVERVIEW | 4 |
A BRIEF NOTE ON THE COMPOUNDING OF RETURNS | 6 |
ABOUT SHAREHOLDERS’ FUND EXPENSES | 7 |
NOVA FUND | 12 |
S&P 500® FUND | 28 |
INVERSE S&P 500® STRATEGY FUND | 41 |
MONTHLY REBALANCE NASDAQ-100® 2x STRATEGY FUND | 51 |
INVERSE NASDAQ-100® STRATEGY FUND | 61 |
MID-CAP 1.5x STRATEGY FUND | 71 |
INVERSE MID-CAP STRATEGY FUND | 85 |
RUSSELL 2000® 1.5x STRATEGY FUND | 93 |
RUSSELL 2000® FUND | 102 |
INVERSE RUSSELL 2000® STRATEGY FUND | 110 |
DOW JONES INDUSTRIAL AVERAGE® FUND | 119 |
GOVERNMENT LONG BOND 1.2x STRATEGY FUND | 128 |
INVERSE GOVERNMENT LONG BOND STRATEGY FUND | 138 |
HIGH YIELD STRATEGY FUND | 150 |
INVERSE HIGH YIELD STRATEGY FUND | 161 |
U.S. GOVERNMENT MONEY MARKET FUND | 169 |
NOTES TO FINANCIAL STATEMENTS | 176 |
REPORT OF INDEPENDENT REGISTERED PUBLIC ACCOUNTING FIRM | 197 |
OTHER INFORMATION | 198 |
INFORMATION ON BOARD OF TRUSTEES AND OFFICERS | 200 |
GUGGENHEIM INVESTMENTS PRIVACY NOTICE | 205 |
| | THE RYDEX FUNDS ANNUAL REPORT | 1 |
Dear Shareholder:
Security Investors, LLC (the “Investment Adviser”) is pleased to present the annual shareholder report for a selection of our funds (the “Fund” or “Funds”). This report covers performance for the 12-month period ended March 31, 2021.
The Investment Adviser is part of Guggenheim Investments, which represents the investment management businesses of Guggenheim Partners, LLC (“Guggenheim”), a global, diversified financial services firm.
Guggenheim Funds Distributors, LLC is the distributor of the Funds. Guggenheim Funds Distributors, LLC is affiliated with Guggenheim and the Investment Adviser.
We encourage you to read the Economic and Market Overview section of the report, which follows this letter, and then the Performance Report and Fund Profile for each Fund.
We are committed to providing innovative investment solutions and appreciate the trust you place in us.
Sincerely,
Security Investors, LLC
April 30, 2021
Read a prospectus and summary prospectus (if available) carefully before investing. It contains the investment objectives, risks, charges, expenses and other information, which should be considered carefully before investing. Obtain a prospectus and summary prospectus (if available) at guggenheiminvestments.com or call 800.820.0888.
This material is not intended as a recommendation or as investment advice of any kind, including in connection with rollovers, transfers, and distributions. Such material is not provided in a fiduciary capacity, may not be relied upon for or in connection with the making of investment decisions, and does not constitute a solicitation of an offer to buy or sell securities. All content has been provided for informational or educational purposes only and is not intended to be and should not be construed as legal or tax advice and/or a legal opinion. Always consult a financial, tax and/or legal professional regarding your specific situation.
COVID-19. The ongoing crisis caused by COVID-19 continues to materially impact local, national, and global economies in very unpredictable ways. Notably, it continues to disrupt supply chains, resulting in market closures, travel restrictions and quarantines. Investors should be aware that in light of this uncertainty, volatility and distress in economies, financial markets, and labor and health conditions all over the world, the Funds’ investments and a shareholder’s investment in a Fund are subject to investment risk, including the possible loss of the entire principal amount invested. Firms through which investors invest with the Funds, the Funds, their service providers, the markets in which they invest and market intermediaries are also impacted by quarantines and similar measures intended to respond to and contain the ongoing pandemic, which can obstruct their functioning and subject them to heightened operational and other risks.
2 | THE RYDEX FUNDS ANNUAL REPORT | |
Inverse and leveraged Funds are not suitable for all investors. ● These Funds should be utilized only by investors who (a) understand the risks associated with the use of leverage, (b) understand the consequences of seeking daily leveraged investment results, (c) understand the risk of shorting, and (d) intend to actively monitor and manage their investments. ● The more a Fund invests in leveraged instruments, the more the leverage will magnify any gains or losses on those investments. ● Inverse Funds involve certain risks, which include increased volatility due to the Funds’ possible use of short sales of securities and derivatives, such as options and futures. ● The Funds’ use of derivatives, such as futures, options and swap agreements, may expose the Funds’ shareholders to additional risks that they would not be subject to if they invested directly in the securities underlying those derivatives. ● Short-selling involves increased risks and costs. You risk paying more for a security than you received from its sale. ● Leveraged and inverse Funds seek to provide investment results that match the performance of a specific benchmark, before fees and expenses, on a daily basis. Because the Funds seek to track the performance of their benchmark on a daily basis, mathematical compounding, especially with respect to those Funds that use leverage as part of their investment strategy, may prevent a fund from correlating with the monthly, quarterly, annual or other period performance of its benchmark. Due to the compounding of daily returns, leveraged and inverse Funds’ returns over periods other than one day will likely differ in amount and possibly direction from the benchmark return for the same period. For those Funds that consistently apply leverage, the value of the fund’s shares will tend to increase or decrease more than the value of any increase or decrease in its benchmark index. The Funds rebalance their portfolios on a daily basis, increasing exposure in response to that day’s gains or reducing exposure in response to that day’s losses. Daily rebalancing will impair a fund’s performance if the benchmark experiences volatility. Investors should monitor their leveraged and inverse Funds’ holdings consistent with their strategies, as frequently as daily. ● For more on these and other risks, please read the prospectus.
The Government Long Bond 1.2x Strategy and Inverse Government Long Bond Strategy funds are not suitable for all investors. ● These Funds should be utilized only by investors who (a) understand the risks associated with the use of leverage, (b) understand the consequences of seeking daily leveraged investment results, and (c) intend to actively monitor and manage their investments. ● The more a Fund invests in leveraged instruments, the more the leverage will magnify any gains or losses on those investments. ● The Funds’ use of derivatives, such as futures, options and swap agreements, may expose the Funds’ shareholders to additional risks that they would not be subject to if they invested directly in the securities underlying those derivatives. ● Leveraged and inverse Funds seek to provide investment results that match the performance of a specific benchmark, before fees and expenses, on a daily basis. Because the Funds seek to track the performance of their benchmark on a daily basis, mathematical compounding, especially with respect to those Funds that use leverage as part of their investment strategy, may prevent a fund from correlating with the monthly, quarterly, annual or other period performance of its benchmark. Due to the compounding of daily returns, leveraged Funds’ returns over periods other than one day will likely differ in amount and possibly direction from the benchmark return for the same period. For those Funds that consistently apply leverage, the value of the Fund’s shares will tend to increase or decrease more than the value of any increase or decrease in its benchmark index. The Funds rebalance their portfolios on a daily basis, increasing exposure in response to that day’s gains or reducing exposure in response to that day’s losses. Daily rebalancing will impair a fund’s performance if the benchmark experiences volatility. Investors should monitor their leveraged Funds’ holdings consistent with their strategies, as frequently as daily. ● In general, bond prices rise when interest rates fall, and vice versa. Moreover, while securities with longer maturities tend to produce higher yields, the price of longer maturity securities is also subject to greater fluctuations as a result of changes in interest rates. ● It is important to note that the Funds are not guaranteed by the U.S. government. ● There are no assurances that any Guggenheim fund will achieve its objective and/or strategy. These Funds are subject to active trading and tracking error risks, which may increase volatility, impact the Fund’s ability to achieve its investment objective, and may decrease the Fund’s performance. ● For more on these and other risks, please read the prospectus.
The High Yield Strategy Fund and Inverse High Yield Strategy Fund may not be suitable for all investors. ● The Fund’s use of derivatives such as futures, options, and swap agreements will expose the Fund to additional risks that it would not be subject to if it invested directly in the securities underlying those derivatives. ● A highly liquid secondary market may not exist for the credit default swaps the Fund invests in, and there can be no assurance that a highly liquid secondary market will develop. ● The Fund’s market value will change in response to interest rate changes and market conditions among other factors. ● You may have a gain or loss when you sell your shares. ● In general, bond prices rise when interest rates fall, and vice versa. ● The Fund’s exposure to the high yield bond market may subject the Fund to greater volatility because (i) it will be affected by the ability of high yield security issuers’ ability to make principal and interest payments and (ii) the prices of derivatives linked to high yield bonds may fluctuate unpredictably and not necessarily in relation to interest rates. ● It is important to note that the Fund is not guaranteed by the U.S. government. ● The Fund is subject to active trading risks that may increase volatility and impact its ability to achieve its investment objective. ● For more on these and other risks, please read the prospectus.
Monthly leveraged funds are not suitable for all investors. ● These funds should be utilized only by investors who (a) understand the risks associated with the use of leverage, (b) understand the consequences of seeking monthly leveraged investment results, and (c) intend to actively monitor and manage their investments. ● The more a fund invests in leveraged instruments, the more the leverage will magnify any gains or losses on those investments. ● The funds’ use of derivatives, such as futures, options, and swap agreements, may expose the funds’ shareholders to additional risks that they would not be subject to if they invested directly in the securities underlying those derivatives. ● Monthly leveraged funds seek to provide investment results that match the performance of a specific benchmark, before fees and expenses, on a monthly basis. Because monthly leveraged funds seek to track the performance of their benchmark on a monthly basis, mathematical compounding, especially with respect to those funds that use leverage as part of their investment strategy, may prevent a fund from correlating with the quarterly, annual or other period performance of its benchmark. Due to the compounding of monthly returns, leveraged funds’ returns over periods other than one calendar month will likely differ in amount and possibly direction from the benchmark return for the same period. For those funds that consistently apply leverage, the value of the funds’ shares will tend to increase or decrease more than the value of any increase or decrease in its benchmark index. Monthly leveraged funds rebalance their portfolios on a monthly basis on the last day of each calendar month, increasing exposure in response to that month’s gains or reducing exposure in response to that month’s losses. ● Throughout the month, the amount of leverage that a monthly leveraged fund provides is allowed to float. Purchasing monthly leveraged funds on any day other than the last day of each calendar month will likely mean that the monthly leveraged fund’s actual leverage is different from its monthly leverage target. Investors should monitor their monthly leveraged funds’ holdings consistent with their strategies, as frequently as daily. ● For more on these and other risks, please read the prospectus.
The U.S. Government Money Market Fund may not be suitable for all investors. ● You could lose money by investing in the Fund. Although the Fund seeks to preserve the value of your investment at $1.00 per share, it cannot guarantee it will do so. An investment in the Fund is not insured or guaranteed by the Federal Deposit Insurance Corporation or any other government agency. The Fund’s sponsor has no legal obligation to provide financial support to the Fund, and you should not expect that the sponsor will provide financial support to the Fund at any time. ● For more on these and other risks, please read the prospectus.
| | THE RYDEX FUNDS ANNUAL REPORT | 3 |
ECONOMIC AND MARKET OVERVIEW (Unaudited) | March 31, 2021 |
In the 12 months ended March 31, 2021, the Standard & Poor’s 500® (“S&P 500®”) Index returned 56.35% as the equity market roared back to life after a sharp COVID-19-related selloff. This increase was in spite of ongoing personal and economic hardships imposed by COVID-19, highlighting the crucial role of policy support in the form of monetary and fiscal stimulus, which has succeeded in averting a lengthy recession in the U.S. These policy initiatives, particularly on the monetary side, increased market liquidity and lowered borrowing rates, reassuring equity investors that the Federal Reserve (the “Fed”) would do everything in its power to maintain market stability.
We upgraded our 2021 U.S. economic growth forecast during the first quarter from 5.5% to over 7%, factoring in more fiscal stimulus than previously anticipated. This forecast captures the effect of stimulus representing roughly 11% of 2020–2021 gross domestic product (“GDP”), versus the previous calculation of about 8%. We see strength in the consumer sector and in housing activity. In addition, U.S. vaccinations for COVID-19 continue to accelerate, nearing 3 million doses per day by the end of the first quarter. More than 213 million doses have been administered in the U.S. so far, and about 35% of the U.S. population has been fully vaccinated. The U.S. is seeing the best-case scenario unfold in its vaccine rollout, but other countries have not been as fortunate.
Europe’s vaccine rollout hit a major speedbump during the first quarter when questions surrounding the safety of the AstraZeneca vaccine led several major European countries to temporarily suspend distribution. Safety concerns, coupled with supply constraints, meant that less than 10% of the populations in Germany, France, and Italy had been vaccinated by the end of the first quarter, well under the pace needed to reach 70% inoculated by summer. Any delay in ending the pandemic on a global scale has implications for other countries too, including the U.S., where travel and hospitality workers represent a large share of the unemployed.
Despite vaccination delays in Europe and its implications abroad, we saw meaningful improvement in the labor market in the first quarter as states moved forward with business re-openings. Seasonally adjusted initial jobless claims fell by 97,000 to 684,000 in the week ending March 20, 2021 the lowest level since the pandemic began, before seeing an uptick the following week to 719,000. We saw more positive news across the board in the March payroll report with 916,000 jobs added, with 156,000 more from revisions. Standing in the way of additional labor market gains are local government restrictions on certain sectors, although easing of these restrictions is expected by summer.
Economic developments drove a sharp increase in U.S. Treasury yields. The market pulled forward expectations of the next Fed rate hike from December 2023 to December 2022, while repricing the long-run terminal fed funds rate estimate to 2.25% from just 0.55% last August. We do not expect the Fed to raise interest rates as early as the market is anticipating, even though we expect strong GDP growth in coming years.
Year-over-year inflation measures will rise over the next several months due to base effects, which may be compounded by supply chain disruptions in the goods sector and potential capacity constraints for certain services. However, we think these factors will prove to be short-lived, with base effects set to dampen inflation starting in the summer months. Moreover, the Fed is focused on generating sustainably higher inflation. Even if core inflation rises above the Fed’s 2% target in 2021, the Fed’s focus is on a long-term average of 2%. With years of shortfalls to make up, and the Fed now targeting labor market disparities as part of an expanded definition of full employment, we expect policymakers to remain resolutely patient. Any tapering of asset purchases will likely be deferred until later in 2022, with the first rate hike likely to come sometime after that.
We expect easy financial conditions and low rates to support credit over the next few years. With market optimism pulling forward rate hike expectations and causing bond yields to rise, we view this as an opportunity to add incremental yield to portfolios.
For the 12-month period ended March 31, 2021, the S&P 500® Index* returned, as noted, 56.35%. The MSCI Europe-Australasia-Far East (“EAFE”) Index* returned 44.57%. The return of the MSCI Emerging Markets Index* was 58.39%.
In the bond market, the Bloomberg Barclays U.S. Aggregate Bond Index* posted a 0.71% return for the 12-month period, while the Bloomberg Barclays U.S. Corporate High Yield Index* returned 23.72%. The return of the ICE Bank of America (“BofA”) Merrill Lynch 3-Month U.S. Treasury Bill Index* was 0.12% for the 12-month period.
The opinions and forecasts expressed may not actually come to pass. This information is subject to change at any time, based on market and other conditions, and should not be construed as a recommendation of any specific security or strategy.
4 | THE RYDEX FUNDS ANNUAL REPORT | |
ECONOMIC AND MARKET OVERVIEW (Unaudited)(concluded) | March 31, 2021 |
*Index Definitions:
The following indices are referenced throughout this report. Indices are unmanaged and not available for direct investment. Index performance does not reflect transaction costs, fees, or expenses.
Bloomberg Barclays U.S. Long Treasury Index includes all publicly issued, U.S. Treasury securities that have a remaining maturity of 10 or more years, are rated investment grade, and have $250 million or more of outstanding face value. In addition, the securities must be denominated in U.S. dollars and must be fixed rate and nonconvertible. The U.S. Long Treasury Index is market capitalization weighted and the securities in the index are updated on the last business day of each month.
Bloomberg Barclays U.S. Aggregate Bond Index is a broad-based flagship benchmark that measures the investment grade, U.S. dollar-denominated, fixed-rate taxable bond market, including U.S. Treasuries, government-related and corporate securities, mortgage-backed securities or “MBS” (agency fixed-rate and hybrid adjustable-rate mortgage, or “ARM”, pass-throughs), asset-backed securities (“ABS”), and commercial mortgage-backed securities (“CMBS”) (agency and non-agency).
Bloomberg Barclays U.S. Corporate High Yield Index measures the U.S. dollar-denominated, high yield, fixed-rate corporate bond market. Securities are classified as high yield if the middle rating of Moody’s, Fitch, and S&P is Ba1/BB +/BB + or below.
Dow Jones Industrial Average® is a price-weighted average of 30 significant stocks traded on the New York Stock Exchange and the Nasdaq.
ICE BofA Merrill Lynch 3-Month U.S. Treasury Bill Index is an unmanaged market Index of U.S. Treasury securities maturing in 90 days that assumes reinvestment of all income.
MSCI EAFE Index is a free float-adjusted market capitalization index that is designed to measure the equity market performance of developed markets, excluding the U.S. & Canada.
MSCI Emerging Markets Index is a free float-adjusted market capitalization weighted index that is designed to measure equity market performance in the global emerging markets.
NASDAQ-100® Index includes 100 of the largest domestic and international non-financial securities listed on The Nasdaq Stock Market based on market capitalization. The Index reflects companies across major industry groups including computer hardware and software, telecommunications, retail/wholesale trade and biotechnology. It does not contain securities of financial companies including investment companies.
Russell 2000® Index measures the performance of the small-cap segment of the U.S. equity universe.
S&P 500® is a broad-based index, the performance of which is based on the performance of 500 widely held common stocks chosen for market size, liquidity, and industry group representation.
S&P MidCap 400® Index provides investors with a benchmark for mid-sized companies. The index covers approximately 7% of the U.S. equity market, and seeks to remain an accurate measure of mid-sized companies, reflecting the risk and return characteristics of the broader mid-cap universe on an on-going basis.
| | THE RYDEX FUNDS ANNUAL REPORT | 5 |
A BRIEF NOTE ON THE COMPOUNDING OF RETURNS (Unaudited) | |
Many of the Funds described in this report are benchmarked daily to leveraged and/or inverse leveraged versions of published indices. To properly evaluate the performance of these funds, it is essential to understand the effect of mathematical compounding on their respective returns.
Because of the nonlinear effects of leverage applied over time, it is possible for a fund to perform in-line with its benchmark for several individual periods in a row, yet seem to trail the benchmark over the entire period on a cumulative basis. It is also possible that a fund that performs in-line with its benchmark on a daily basis may seem to outperform its benchmark over longer periods.
An Example of Compounding
For example, consider a hypothetical fund that is designed to produce returns that correspond to 150% of an index. On the first day of a period, the index rises from a level of 100 to a level of 106, producing a 6.0% gain and an expectation that the fund will rise by 9.0%. On the same day, the fund’s net asset value per share (“NAV”) increases from $10.00 to $10.90 for a gain of 9.0% — in line with its benchmark.
On day two, assume the index falls from 106 to 99 for a loss of about 6.6%. The fund, as expected, falls 9.9% to a price of $9.82. On each day, the fund performed exactly in line with its benchmark, but for the two-day period, the fund was down 1.8%, while the index was down only 1.0%. Without taking into account the daily compounding of returns, one would expect the fund to lose 1.5% and would see the fund as trailing by 0.3% when in fact it had performed perfectly. This example is summarized in the table below.
| Index
Level | Index
Performance | Fund
Expectation | Fund
NAV | Fund
Performance | Assessment |
Start | 100 | | | $ 10.00 | | |
Day 1 | 106 | 6.0% | 9.0% | $ 10.90 | 9.0% | In line |
Day 2 | 99 | -6.6% | -9.9% | $ 9.82 | -9.9% | In line |
Cumulative | | -1.0% | -1.5% | | -1.8% | -0.3% |
As illustrated by this simple example, the effect of leverage can make it difficult to form expectations or judgments about fund performance given only the returns of the unleveraged index.
Because certain funds seek to track the performance of their benchmark on a daily basis, mathematical compounding, especially with respect to those funds that use leverage as part of their investment strategy, may prevent a fund from correlating with the monthly, quarterly, annual or other period performance of its benchmark. Due to the compounding of daily returns, leveraged and inverse funds’ returns over periods other than one day will likely differ in amount and possibly direction from the benchmark return for the same period. Investors should monitor their leveraged and inverse funds’ holdings to ensure that they are consistent with their strategies, as frequently as daily. For those funds that consistently apply leverage, the value of the fund’s shares will tend to increase or decrease more than the value of any increase or decrease in its benchmark index. For more on correlation, leverage and other risks, please read the prospectus.
In general, any change in direction in an index will produce compounding that seems to work against an investor. Were the index to move in the same direction (either up or down) for two or more periods in a row, the compounding of those returns would work in an investor’s favor, causing the fund to seemingly beat its benchmark.
As a general rule of thumb, more leverage in a fund will magnify the compounding effect, while less leverage will generally produce results that are more in line with expectations. In addition, periods of high volatility in an underlying index will also cause the effects of compounding to be more pronounced, while lower volatility will produce a more muted effect.
6 | THE RYDEX FUNDS ANNUAL REPORT | |
ABOUT SHAREHOLDERS’ FUND EXPENSES (Unaudited) | |
All mutual funds have operating expenses, and it is important for our shareholders to understand the impact of costs on their investments. Shareholders of a fund incur two types of costs: (i) transaction costs, including sales charges (loads) on purchase payments, reinvested dividends, other distributions, and exchange fees, and (ii) ongoing costs, including management fees, administrative services, and shareholder reports, among others. These ongoing costs, or operating expenses, are deducted from a fund’s gross income and reduce the investment return of the fund.
A fund’s expenses are expressed as a percentage of its average net assets, which is known as the expense ratio. The following examples are intended to help investors understand the ongoing costs (in dollars) of investing in a fund and to compare these costs with the ongoing costs of investing in other mutual funds.
The examples are based on an investment of $1,000 made at the beginning of the period and held for the entire six-month period beginning September 30, 2020 and ending March 31, 2021.
The following tables illustrate the Funds’ costs in two ways:
Table 1. Based on actual Fund return: This section helps investors estimate the actual expenses paid over the period. The “Ending Account Value” shown is derived from the Fund’s actual return, and the fifth column shows the dollar amount that would have been paid by an investor who started with $1,000 in the Fund. Investors may use the information here, together with the amount invested, to estimate the expenses paid over the period. Simply divide the Fund’s account value by $1,000 (for example, an $8,600 account value divided by $1,000 = 8.6), then multiply the result by the number provided under the heading “Expenses Paid During Period.”
Table 2. Based on hypothetical 5% return: This section is intended to help investors compare a fund’s cost with those of other mutual funds. The table provides information about hypothetical account values and hypothetical expenses based on the Fund’s actual expense ratio and an assumed rate of return of 5% per year before expenses, which is not the Fund’s actual return. The hypothetical account values and expenses may not be used to estimate the actual ending account balance or expenses paid during the period. The example is useful in making comparisons because the U.S. Securities and Exchange Commission (the “SEC”) requires all mutual funds to calculate expenses based on the 5% return. Investors can assess a fund’s costs by comparing this hypothetical example with the hypothetical examples that appear in shareholder reports of other funds.
The calculations illustrated above assume no shares were bought or sold during the period. Actual costs may have been higher or lower, depending on the amount of investment and the timing of any purchases or redemptions.
Please note that the expenses shown in the table are meant to highlight your ongoing costs only and do not reflect any transactional costs, such as sales charges (loads) on purchase payments, and contingent deferred sales charges (“CDSC”) on redemptions, if any. Therefore, the second table is useful in comparing ongoing costs only, and will not help you determine the relative total costs of owning different funds. In addition, if these transactional costs were included, your costs would have been higher.
More information about the Funds’ expenses, including annual expense ratios for periods up to five years (subject to the Fund’s inception date), can be found in the Financial Highlights section of this report. For additional information on operating expenses and other shareholder costs, please refer to the appropriate Fund prospectus.
| | THE RYDEX FUNDS ANNUAL REPORT | 7 |
ABOUT SHAREHOLDERS’ FUND EXPENSES (Unaudited)(continued) | |
| Expense
Ratio1 | Fund
Return | Beginning
Account Value
September 30, 2020 | Ending
Account Value
March 31, 2021 | Expenses
Paid During
Period2 |
Table 1. Based on actual Fund return3 | | | | | |
Nova Fund | | | | | |
Investor Class | 1.29% | 28.35% | $ 1,000.00 | $ 1,283.50 | $ 7.34 |
A-Class | 1.54% | 28.21% | 1,000.00 | 1,282.10 | 8.76 |
C-Class | 2.29% | 27.72% | 1,000.00 | 1,277.20 | 13.00 |
H-Class | 1.54% | 28.22% | 1,000.00 | 1,282.20 | 8.76 |
S&P 500® Fund | | | | | |
A-Class | 1.61% | 18.11% | 1,000.00 | 1,181.10 | 8.75 |
C-Class | 2.36% | 17.66% | 1,000.00 | 1,176.60 | 12.81 |
H-Class | 1.61% | 18.09% | 1,000.00 | 1,180.90 | 8.75 |
Inverse S&P 500® Strategy Fund | | | | | |
Investor Class | 1.44% | (17.40%) | 1,000.00 | 826.00 | 6.56 |
A-Class | 1.70% | (17.52%) | 1,000.00 | 824.80 | 7.73 |
C-Class | 2.45% | (17.80%) | 1,000.00 | 822.00 | 11.13 |
H-Class | 1.69% | (17.50%) | 1,000.00 | 825.00 | 7.69 |
Monthly Rebalance NASDAQ-100® 2x Strategy Fund | | | | |
A-Class | 1.32% | 29.37% | 1,000.00 | 1,293.70 | 7.55 |
C-Class | 2.07% | 28.89% | 1,000.00 | 1,288.90 | 11.81 |
H-Class | 1.33% | 29.37% | 1,000.00 | 1,293.70 | 7.61 |
Inverse NASDAQ-100® Strategy Fund | | | | | |
Investor Class | 1.48% | (15.83%) | 1,000.00 | 841.70 | 6.80 |
A-Class | 1.73% | (15.94%) | 1,000.00 | 840.60 | 7.94 |
C-Class | 2.49% | (16.26%) | 1,000.00 | 837.40 | 11.41 |
H-Class | 1.74% | (15.98%) | 1,000.00 | 840.20 | 7.98 |
Mid-Cap 1.5x Strategy Fund | | | | | |
A-Class | 1.67% | 64.48% | 1,000.00 | 1,644.80 | 11.01 |
C-Class | 2.42% | 63.89% | 1,000.00 | 1,638.90 | 15.92 |
H-Class | 1.69% | 64.48% | 1,000.00 | 1,644.80 | 11.14 |
Inverse Mid-Cap Strategy Fund | | | | | |
A-Class | 1.67% | (30.96%) | 1,000.00 | 690.40 | 7.04 |
C-Class | 2.40% | (31.21%) | 1,000.00 | 687.90 | 10.10 |
H-Class | 1.68% | (30.95%) | 1,000.00 | 690.50 | 7.08 |
Russell 2000® 1.5x Strategy Fund | | | | | |
A-Class | 1.73% | 76.57% | 1,000.00 | 1,765.70 | 11.93 |
C-Class | 2.46% | 75.89% | 1,000.00 | 1,758.90 | 16.92 |
H-Class | 1.73% | 76.56% | 1,000.00 | 1,765.60 | 11.93 |
Russell 2000® Fund | | | | | |
A-Class | 1.64% | 46.88% | 1,000.00 | 1,468.80 | 10.09 |
C-Class | 2.39% | 46.36% | 1,000.00 | 1,463.60 | 14.68 |
H-Class | 1.64% | 46.89% | 1,000.00 | 1,468.90 | 10.09 |
Inverse Russell 2000® Strategy Fund | | | | | |
A-Class | 1.73% | (35.09%) | 1,000.00 | 649.10 | 7.11 |
C-Class | 2.49% | (35.32%) | 1,000.00 | 646.80 | 10.22 |
H-Class | 1.72% | (35.07%) | 1,000.00 | 649.30 | 7.07 |
8 | THE RYDEX FUNDS ANNUAL REPORT | |
ABOUT SHAREHOLDERS’ FUND EXPENSES (Unaudited)(continued) | |
| Expense
Ratio1 | Fund
Return | Beginning
Account Value
September 30, 2020 | Ending
Account Value
March 31, 2021 | Expenses
Paid During
Period2 |
Dow Jones Industrial Average® Fund | | | | | |
A-Class | 1.65% | 19.00% | $ 1,000.00 | $ 1,190.00 | $ 9.01 |
C-Class | 2.39% | 18.55% | 1,000.00 | 1,185.50 | 13.02 |
H-Class | 1.64% | 18.99% | 1,000.00 | 1,189.90 | 8.95 |
Government Long Bond 1.2x Strategy Fund | | | | | |
Investor Class | 1.00% | (23.04%) | 1,000.00 | 769.60 | 4.41 |
A-Class | 1.25% | (23.23%) | 1,000.00 | 767.70 | 5.51 |
C-Class | 2.00% | (23.52%) | 1,000.00 | 764.80 | 8.80 |
H-Class | 1.23% | (23.21%) | 1,000.00 | 767.90 | 5.42 |
Inverse Government Long Bond Strategy Fund | | | | |
Investor Class | 2.84% | 21.57% | 1,000.00 | 1,215.70 | 15.69 |
A-Class | 3.05% | 21.40% | 1,000.00 | 1,214.00 | 16.84 |
C-Class | 3.78% | 20.94% | 1,000.00 | 1,209.40 | 20.82 |
H-Class | 3.07% | 21.40% | 1,000.00 | 1,214.00 | 16.95 |
High Yield Strategy Fund | | | | | |
A-Class | 1.53% | 5.47% | 1,000.00 | 1,054.70 | 7.84 |
C-Class | 2.28% | 5.07% | 1,000.00 | 1,050.70 | 11.66 |
H-Class | 1.54% | 5.47% | 1,000.00 | 1,054.70 | 7.89 |
Inverse High Yield Strategy Fund | | | | | |
A-Class | 1.52% | (5.45%) | 1,000.00 | 945.50 | 7.37 |
C-Class | 2.26% | (6.59%) | 1,000.00 | 934.10 | 10.90 |
H-Class | 1.53% | (6.26%) | 1,000.00 | 937.40 | 7.39 |
U.S. Government Money Market Fund | | | | | |
Money Market Class | 0.11% | 0.05% | 1,000.00 | 1,000.50 | 0.55 |
| | THE RYDEX FUNDS ANNUAL REPORT | 9 |
ABOUT SHAREHOLDERS’ FUND EXPENSES (Unaudited)(continued) | |
| Expense
Ratio1 | Fund
Return | Beginning
Account Value
September 30, 2020 | Ending
Account Value
March 31, 2021 | Expenses
Paid During
Period2 |
Table 2. Based on hypothetical 5% return (before expenses) | | | | |
Nova Fund | | | | | |
Investor Class | 1.29% | 5.00% | $ 1,000.00 | $ 1,018.50 | $ 6.49 |
A-Class | 1.54% | 5.00% | 1,000.00 | 1,017.25 | 7.75 |
C-Class | 2.29% | 5.00% | 1,000.00 | 1,013.51 | 11.50 |
H-Class | 1.54% | 5.00% | 1,000.00 | 1,017.25 | 7.75 |
S&P 500® Fund | | | | | |
A-Class | 1.61% | 5.00% | 1,000.00 | 1,016.90 | 8.10 |
C-Class | 2.36% | 5.00% | 1,000.00 | 1,013.16 | 11.85 |
H-Class | 1.61% | 5.00% | 1,000.00 | 1,016.90 | 8.10 |
Inverse S&P 500® Strategy Fund | | | | | |
Investor Class | 1.44% | 5.00% | 1,000.00 | 1,017.75 | 7.24 |
A-Class | 1.70% | 5.00% | 1,000.00 | 1,016.45 | 8.55 |
C-Class | 2.45% | 5.00% | 1,000.00 | 1,012.72 | 12.29 |
H-Class | 1.69% | 5.00% | 1,000.00 | 1,016.50 | 8.50 |
Monthly Rebalance NASDAQ-100® 2x Strategy Fund | | | | |
A-Class | 1.32% | 5.00% | 1,000.00 | 1,018.35 | 6.64 |
C-Class | 2.07% | 5.00% | 1,000.00 | 1,014.61 | 10.40 |
H-Class | 1.33% | 5.00% | 1,000.00 | 1,018.30 | 6.69 |
Inverse NASDAQ-100® Strategy Fund | | | | | |
Investor Class | 1.48% | 5.00% | 1,000.00 | 1,017.55 | 7.44 |
A-Class | 1.73% | 5.00% | 1,000.00 | 1,016.31 | 8.70 |
C-Class | 2.49% | 5.00% | 1,000.00 | 1,012.52 | 12.49 |
H-Class | 1.74% | 5.00% | 1,000.00 | 1,016.26 | 8.75 |
Mid-Cap 1.5x Strategy Fund | | | | | |
A-Class | 1.67% | 5.00% | 1,000.00 | 1,016.60 | 8.40 |
C-Class | 2.42% | 5.00% | 1,000.00 | 1,012.86 | 12.14 |
H-Class | 1.69% | 5.00% | 1,000.00 | 1,016.50 | 8.50 |
Inverse Mid-Cap Strategy Fund | | | | | |
A-Class | 1.67% | 5.00% | 1,000.00 | 1,016.60 | 8.40 |
C-Class | 2.40% | 5.00% | 1,000.00 | 1,012.96 | 12.04 |
H-Class | 1.68% | 5.00% | 1,000.00 | 1,016.55 | 8.45 |
Russell 2000® 1.5x Strategy Fund | | | | | |
A-Class | 1.73% | 5.00% | 1,000.00 | 1,016.31 | 8.70 |
C-Class | 2.46% | 5.00% | 1,000.00 | 1,012.67 | 12.34 |
H-Class | 1.73% | 5.00% | 1,000.00 | 1,016.31 | 8.70 |
Russell 2000® Fund | | | | | |
A-Class | 1.64% | 5.00% | 1,000.00 | 1,016.75 | 8.25 |
C-Class | 2.39% | 5.00% | 1,000.00 | 1,013.01 | 11.99 |
H-Class | 1.64% | 5.00% | 1,000.00 | 1,016.75 | 8.25 |
Inverse Russell 2000® Strategy Fund | | | | | |
A-Class | 1.73% | 5.00% | 1,000.00 | 1,016.31 | 8.70 |
C-Class | 2.49% | 5.00% | 1,000.00 | 1,012.52 | 12.49 |
H-Class | 1.72% | 5.00% | 1,000.00 | 1,016.36 | 8.65 |
10 | THE RYDEX FUNDS ANNUAL REPORT | |
ABOUT SHAREHOLDERS’ FUND EXPENSES (Unaudited)(concluded) | |
| Expense
Ratio1 | Fund
Return | Beginning
Account Value
September 30, 2020 | Ending
Account Value
March 31, 2021 | Expenses
Paid During
Period2 |
Dow Jones Industrial Average® Fund | | | | | |
A-Class | 1.65% | 5.00% | $ 1,000.00 | $ 1,016.70 | $ 8.30 |
C-Class | 2.39% | 5.00% | 1,000.00 | 1,013.01 | 11.99 |
H-Class | 1.64% | 5.00% | 1,000.00 | 1,016.75 | 8.25 |
Government Long Bond 1.2x Strategy Fund | | | | | |
Investor Class | 1.00% | 5.00% | 1,000.00 | 1,019.95 | 5.04 |
A-Class | 1.25% | 5.00% | 1,000.00 | 1,018.70 | 6.29 |
C-Class | 2.00% | 5.00% | 1,000.00 | 1,014.96 | 10.05 |
H-Class | 1.23% | 5.00% | 1,000.00 | 1,018.80 | 6.19 |
Inverse Government Long Bond Strategy Fund | | | | |
Investor Class | 2.84% | 5.00% | 1,000.00 | 1,010.77 | 14.24 |
A-Class | 3.05% | 5.00% | 1,000.00 | 1,009.72 | 15.28 |
C-Class | 3.78% | 5.00% | 1,000.00 | 1,006.08 | 18.91 |
H-Class | 3.07% | 5.00% | 1,000.00 | 1,009.62 | 15.38 |
High Yield Strategy Fund | | | | | |
A-Class | 1.53% | 5.00% | 1,000.00 | 1,017.30 | 7.70 |
C-Class | 2.28% | 5.00% | 1,000.00 | 1,013.56 | 11.45 |
H-Class | 1.54% | 5.00% | 1,000.00 | 1,017.25 | 7.75 |
Inverse High Yield Strategy Fund | | | | | |
A-Class | 1.52% | 5.00% | 1,000.00 | 1,017.35 | 7.64 |
C-Class | 2.26% | 5.00% | 1,000.00 | 1,013.66 | 11.35 |
H-Class | 1.53% | 5.00% | 1,000.00 | 1,017.30 | 7.70 |
U.S. Government Money Market Fund | | | | | |
Money Market Class | 0.11% | 5.00% | 1,000.00 | 1,024.38 | 0.56 |
1 | This ratio represents annualized Net Expense, which includes interest expense related to securities sold short. Excluding short interest expense, the operating ratio of the Inverse Government Long Bond Strategy Fund would be 1.42%, 1.67%, 2.42% and 1.68% for Investor Class, A-Class, C-Class, and H-Class, respectively. Excludes expenses of the underlying funds in which the Funds invests, if any. |
2 | Expenses are equal to the Fund’s annualized expense ratio, net of any applicable fee waivers, multiplied by the average account value over the period, multiplied by 182/365 (to reflect the one-half year period). |
3 | Actual cumulative return at net asset value for the period September 30, 2020 to March 31, 2021. |
| | THE RYDEX FUNDS ANNUAL REPORT | 11 |
PERFORMANCE REPORT AND FUND PROFILE (Unaudited) | March 31, 2021 |
NOVA FUND
OBJECTIVE: Seeks to provide investment results that match, before fees and expenses, the performance of a specific benchmark on a daily basis. The Fund’s current benchmark is 150% of the performance of the S&P 500® Index (the “underlying index”). The Fund does not seek to achieve its investment objective over a period of time greater than one day.
For the one-year period ended March 31, 2021, Nova Fund maintained a daily correlation of over 99% to its benchmark of 150% of the daily price movement of the S&P 500 Index.
Nova Fund Investor Class returned 90.46%, while the S&P 500 Index returned 56.35% over the same time period.
All sectors contributed to the return of the underlying index for the period, led by Information Technology, Consumer Discretionary, and Financials.
The holdings contributing the most to the return of the underlying index were Apple, Inc., Microsoft Corp., and Amazon.com, Inc. The holdings detracting the most were Gilead Sciences, Inc. and Biogen, Inc.
Derivatives in the Fund were used to help provide exposure to the composition of the benchmark in the highest efficient manner and to provide leverage and not for hedging purposes. Derivatives performed as expected.
Due to the compounding of daily returns, leveraged and inverse funds’ returns over periods other than one day will likely differ in amount and possibly direction from the benchmark return for the same period. Investors should monitor their leveraged and inverse funds’ holdings to ensure that they are consistent with their strategies, as frequently as daily.
The effects of compounding may cause the longer-term correlation of the Fund to its benchmark to diminish. The apparent discrepancy between the leveraged and unleveraged indices is the result of compounding, which is described briefly on page 6 of this report.
The Fund may invest in certain of the underlying series of Guggenheim Funds Trust and Guggenheim Strategy Funds Trust, including Guggenheim Ultra Short Duration, Guggenheim Strategy Fund II and Guggenheim Strategy Fund III (collectively, the “Short Term Investment Vehicles”), each of which are open-end management investment companies managed by Guggenheim Investments. The Short Term Investment Vehicles, which launched on March 11, 2014, are offered as short term investment options only to mutual funds, trusts, and other accounts managed by Guggenheim Investments and/or its affiliates, and are not available to the public, with the exception of Guggenheim Ultra Short Duration Fund, which is available to the public. Guggenheim Strategy Fund II and Guggenheim Strategy Fund III do not charge an investment management fee. Guggenheim Ultra Short Duration Fund charges an investment management fee but the Fund’s adviser has agreed to waive fees to the extent necessary to offset the proportionate share of any management fee paid by the Fund with respect to its investment in Guggenheim Ultra Short Duration Fund. For the one-year period ended March 31, 2021, investment in the Short Term Investment Vehicles benefited Fund performance.
Performance displayed represents past performance, which is no guarantee of future results.
Holdings Diversification (Market Exposure as % of Net Assets)
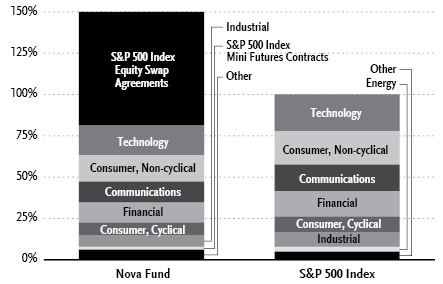
“Holdings Diversification (Market Exposure as % of Net Assets)” excludes any temporary cash investments, investments in Guggenheim Strategy Funds Trust mutual funds, or investments in Guggenheim Ultra Short Duration Fund. Investments in those Funds do not provide “market exposure” to meet the Fund’s investment objective, but will significantly increase the portfolio’s exposure to certain other asset categories (and their associated risks), which may cause the Fund to deviate from its principal investment strategy, including: (i) high yield, high risk debt securities rated below the top four long-term rating categories by a nationally recognized statistical rating organization (also known as “junk bonds”); (ii) securities issued by the U.S. government or its agencies and instrumentalities; (iii) CLOs and similar investments; and (iv) other short-term fixed income securities.
12 | THE RYDEX FUNDS ANNUAL REPORT | |
PERFORMANCE REPORT AND FUND PROFILE (Unaudited)(concluded) | March 31, 2021 |
Inception Dates: |
Investor Class | July 12, 1993 |
A-Class | March 31, 2004 |
C-Class | March 14, 2001 |
H-Class | September 18, 2014 |
Ten Largest Holdings (% of Total Net Assets) |
Guggenheim Ultra Short Duration Fund — Institutional Class | 4.8% |
Apple, Inc. | 4.6% |
Microsoft Corp. | 4.2% |
Amazon.com, Inc. | 3.1% |
Guggenheim Strategy Fund II | 2.7% |
Facebook, Inc. — Class A | 1.7% |
Alphabet, Inc. — Class A | 1.5% |
Alphabet, Inc. — Class C | 1.4% |
Tesla, Inc. | 1.2% |
Guggenheim Strategy Fund III | 1.1% |
Top Ten Total | 26.3% |
| | |
“Ten Largest Holdings” excludes any temporary cash or derivative investments. |
Cumulative Fund Performance*
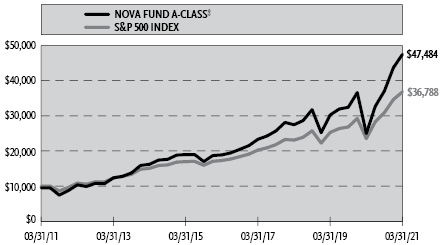
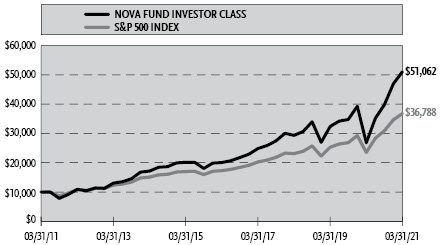
Average Annual Returns*
Periods Ended March 31, 2021
| 1 Year | 5 Year | 10 Year |
Investor Class Shares | 90.46% | 20.54% | 17.71% |
A-Class Shares | 90.00% | 20.25% | 17.43% |
A-Class Shares with sales charge‡ | 80.97% | 19.08% | 16.86% |
C-Class Shares | 88.56% | 19.37% | 16.55% |
C-Class Shares with CDSC§ | 87.56% | 19.37% | 16.55% |
S&P 500 Index | 56.35% | 16.29% | 13.91% |
| 1 Year | 5 Year | Since
Inception
(09/18/14) |
H-Class Shares | 90.03% | 20.28% | 15.86% |
S&P 500 Index | 56.35% | 16.29% | 13.22% |
* | The performance data above represents past performance that is not predictive of future results. The investment return and principal value of an investment in the Fund will fluctuate so that an investor’s shares, when redeemed, may be worth more or less than their original cost. Returns are historical and include changes in principal and reinvested dividends and capital gains and do not reflect the effect of taxes. The S&P 500 Index is an unmanaged index and, unlike the Fund, has no management fees or operating expenses to reduce its reported return. The graphs are based on Investor Class shares and A-Class shares only; performance for C-Class shares and H-Class shares will vary due to differences in fee structures. |
‡ | Fund returns are calculated using the maximum sales charge of 4.75%. |
§ | Fund returns include a CDSC of 1% if redeemed within 12 months of purchase. |
| | THE RYDEX FUNDS ANNUAL REPORT | 13 |
SCHEDULE OF INVESTMENTS | March 31, 2021 |
NOVA FUND | |
| | Shares | | | Value | |
COMMON STOCKS† - 79.3% |
| | | | | | | | | |
Technology - 17.7% |
Apple, Inc. | | | 149,658 | | | $ | 18,280,725 | |
Microsoft Corp. | | | 71,528 | | | | 16,864,157 | |
NVIDIA Corp. | | | 5,880 | | | | 3,139,508 | |
Intel Corp. | | | 38,532 | | | | 2,466,048 | |
Adobe, Inc.* | | | 4,546 | | | | 2,161,032 | |
salesforce.com, Inc.* | | | 8,704 | | | | 1,844,116 | |
Broadcom, Inc. | | | 3,872 | | | | 1,795,291 | |
Accenture plc — Class A | | | 6,015 | | | | 1,661,644 | |
Texas Instruments, Inc. | | | 8,727 | | | | 1,649,316 | |
QUALCOMM, Inc. | | | 10,774 | | | | 1,428,525 | |
Oracle Corp. | | | 17,589 | | | | 1,234,220 | |
Applied Materials, Inc. | | | 8,702 | | | | 1,162,587 | |
International Business Machines Corp. | | | 8,474 | | | | 1,129,245 | |
Intuit, Inc. | | | 2,597 | | | | 994,807 | |
Micron Technology, Inc.* | | | 10,608 | | | | 935,732 | |
ServiceNow, Inc.* | | | 1,860 | | | | 930,205 | |
Advanced Micro Devices, Inc.* | | | 11,492 | | | | 902,122 | |
Fidelity National Information Services, Inc. | | | 5,890 | | | | 828,193 | |
Lam Research Corp. | | | 1,355 | | | | 806,550 | |
Activision Blizzard, Inc. | | | 7,348 | | | | 683,364 | |
Fiserv, Inc.* | | | 5,460 | | | | 649,958 | |
Autodesk, Inc.* | | | 2,085 | | | | 577,858 | |
Analog Devices, Inc. | | | 3,499 | | | | 542,625 | |
NXP Semiconductor N.V. | | | 2,627 | | | | 528,920 | |
KLA Corp. | | | 1,461 | | | | 482,714 | |
Roper Technologies, Inc. | | | 995 | | | | 401,323 | |
Microchip Technology, Inc. | | | 2,554 | | | | 396,432 | |
Cognizant Technology Solutions Corp. — Class A | | | 5,031 | | | | 393,022 | |
HP, Inc. | | | 11,879 | | | | 377,158 | |
Electronic Arts, Inc. | | | 2,727 | | | | 369,154 | |
Cadence Design Systems, Inc.* | | | 2,646 | | | | 362,476 | |
Synopsys, Inc.* | | | 1,445 | | | | 358,042 | |
MSCI, Inc. — Class A | | | 783 | | | | 328,296 | |
Paychex, Inc. | | | 3,044 | | | | 298,373 | |
Xilinx, Inc. | | | 2,331 | | | | 288,811 | |
Skyworks Solutions, Inc. | | | 1,564 | | | | 286,963 | |
ANSYS, Inc.* | | | 823 | | | | 279,458 | |
Zebra Technologies Corp. — Class A* | | | 507 | | | | 245,986 | |
Fortinet, Inc.* | | | 1,285 | | | | 236,980 | |
Maxim Integrated Products, Inc. | | | 2,542 | | | | 232,263 | |
Cerner Corp. | | | 2,905 | | | | 208,811 | |
Qorvo, Inc.* | | | 1,074 | | | | 196,220 | |
Hewlett Packard Enterprise Co. | | | 12,340 | | | | 194,232 | |
Western Digital Corp. | | | 2,903 | | | | 193,775 | |
Take-Two Interactive Software, Inc.* | | | 1,092 | | | | 192,956 | |
Teradyne, Inc. | | | 1,581 | | | | 192,376 | |
Paycom Software, Inc.* | | | 465 | | | | 172,078 | |
Broadridge Financial Solutions, Inc. | | | 1,098 | | | | 168,104 | |
Citrix Systems, Inc. | | | 1,166 | | | | 163,660 | |
Tyler Technologies, Inc.* | | | 385 | | | | 163,444 | |
Akamai Technologies, Inc.* | | | 1,548 | | | | 157,741 | |
NetApp, Inc. | | | 2,111 | | | | 153,406 | |
Seagate Technology plc | | | 1,905 | | | | 146,209 | |
Monolithic Power Systems, Inc. | | | 407 | | | | 143,756 | |
Leidos Holdings, Inc. | | | 1,265 | | | | 121,794 | |
Jack Henry & Associates, Inc. | | | 721 | | | | 109,390 | |
DXC Technology Co.* | | | 2,415 | | | | 75,493 | |
IPG Photonics Corp.* | | | 340 | | | | 71,720 | |
Total Technology | | | | | | | 71,359,364 | |
| | | | | | | | | |
Consumer, Non-cyclical - 16.0% |
Johnson & Johnson | | | 24,929 | | | | 4,097,081 | |
UnitedHealth Group, Inc. | | | 8,965 | | | | 3,335,607 | |
Procter & Gamble Co. | | | 23,354 | | | | 3,162,832 | |
PayPal Holdings, Inc.* | | | 11,107 | | | | 2,697,224 | |
Abbott Laboratories | | | 16,800 | | | | 2,013,312 | |
Coca-Cola Co. | | | 36,782 | | | | 1,938,779 | |
Pfizer, Inc. | | | 52,896 | | | | 1,916,422 | |
PepsiCo, Inc. | | | 13,084 | | | | 1,850,732 | |
Merck & Company, Inc. | | | 23,997 | | | | 1,849,929 | |
AbbVie, Inc. | | | 16,746 | | | | 1,812,252 | |
Thermo Fisher Scientific, Inc. | | | 3,734 | | | | 1,704,123 | |
Medtronic plc | | | 12,785 | | | | 1,510,292 | |
Eli Lilly & Co. | | | 7,544 | | | | 1,409,370 | |
Amgen, Inc. | | | 5,478 | | | | 1,362,981 | |
Danaher Corp. | | | 6,011 | | | | 1,352,956 | |
Bristol-Myers Squibb Co. | | | 21,248 | | | | 1,341,386 | |
Philip Morris International, Inc. | | | 14,769 | | | | 1,310,601 | |
CVS Health Corp. | | | 12,436 | | | | 935,560 | |
Altria Group, Inc. | | | 17,627 | | | | 901,798 | |
Anthem, Inc. | | | 2,323 | | | | 833,841 | |
Intuitive Surgical, Inc.* | | | 1,116 | | | | 824,657 | |
Cigna Corp. | | | 3,337 | | | | 806,686 | |
S&P Global, Inc. | | | 2,283 | | | | 805,602 | |
Mondelez International, Inc. — Class A | | | 13,391 | | | | 783,775 | |
Gilead Sciences, Inc. | | | 11,917 | | | | 770,196 | |
Automatic Data Processing, Inc. | | | 4,058 | | | | 764,811 | |
Stryker Corp. | | | 3,103 | | | | 755,829 | |
Zoetis, Inc. | | | 4,506 | | | | 709,605 | |
Becton Dickinson and Co. | | | 2,756 | | | | 670,122 | |
Colgate-Palmolive Co. | | | 8,048 | | | | 634,424 | |
Estee Lauder Companies, Inc. — Class A | | | 2,179 | | | | 633,762 | |
Global Payments, Inc. | | | 2,799 | | | | 564,223 | |
Illumina, Inc.* | | | 1,384 | | | | 531,539 | |
Vertex Pharmaceuticals, Inc.* | | | 2,465 | | | | 529,704 | |
Boston Scientific Corp.* | | | 13,440 | | | | 519,456 | |
Humana, Inc. | | | 1,222 | | | | 512,323 | |
Edwards Lifesciences Corp.* | | | 5,923 | | | | 495,400 | |
HCA Healthcare, Inc. | | | 2,514 | | | | 473,487 | |
Regeneron Pharmaceuticals, Inc.* | | | 998 | | | | 472,194 | |
Moody’s Corp. | | | 1,525 | | | | 455,380 | |
Kimberly-Clark Corp. | | | 3,205 | | | | 445,655 | |
Biogen, Inc.* | | | 1,445 | | | | 404,239 | |
Baxter International, Inc. | | | 4,790 | | | | 403,989 | |
IDEXX Laboratories, Inc.* | | | 809 | | | | 395,852 | |
Sysco Corp. | | | 4,840 | | | | 381,102 | |
Align Technology, Inc.* | | | 683 | | | | 369,865 | |
Constellation Brands, Inc. — Class A | | | 1,613 | | | | 367,764 | |
General Mills, Inc. | | | 5,798 | | | | 355,533 | |
Centene Corp.* | | | 5,515 | | | | 352,464 | |
14 | THE RYDEX FUNDS ANNUAL REPORT | SEE NOTES TO FINANCIAL STATEMENTS. |
SCHEDULE OF INVESTMENTS (continued) | March 31, 2021 |
NOVA FUND | |
| | Shares | | | Value | |
IQVIA Holdings, Inc.* | | | 1,814 | | | $ | 350,356 | |
IHS Markit Ltd. | | | 3,535 | | | | 342,117 | |
Corteva, Inc. | | | 7,056 | | | | 328,951 | |
DexCom, Inc.* | | | 912 | | | | 327,764 | |
Monster Beverage Corp.* | | | 3,506 | | | | 319,361 | |
Alexion Pharmaceuticals, Inc.* | | | 2,085 | | | | 318,817 | |
Zimmer Biomet Holdings, Inc. | | | 1,971 | | | | 315,518 | |
Archer-Daniels-Midland Co. | | | 5,296 | | | | 301,872 | |
McKesson Corp. | | | 1,508 | | | | 294,120 | |
Cintas Corp. | | | 837 | | | | 285,677 | |
Verisk Analytics, Inc. — Class A | | | 1,544 | | | | 272,809 | |
ResMed, Inc. | | | 1,380 | | | | 267,747 | |
Kroger Co. | | | 7,219 | | | | 259,812 | |
Kraft Heinz Co. | | | 6,148 | | | | 245,920 | |
Laboratory Corporation of America Holdings* | | | 926 | | | | 236,158 | |
Clorox Co. | | | 1,193 | | | | 230,106 | |
United Rentals, Inc.* | | | 684 | | | | 225,248 | |
Hershey Co. | | | 1,389 | | | | 219,684 | |
FleetCor Technologies, Inc.* | | | 791 | | | | 212,486 | |
McCormick & Company, Inc. | | | 2,361 | | | | 210,507 | |
Equifax, Inc. | | | 1,155 | | | | 209,205 | |
Tyson Foods, Inc. — Class A | | | 2,795 | | | | 207,669 | |
Church & Dwight Company, Inc. | | | 2,324 | | | | 203,001 | |
West Pharmaceutical Services, Inc. | | | 703 | | | | 198,091 | |
Teleflex, Inc. | | | 443 | | | | 184,049 | |
Hologic, Inc.* | | | 2,443 | | | | 181,710 | |
MarketAxess Holdings, Inc. | | | 360 | | | | 179,251 | |
Cooper Companies, Inc. | | | 466 | | | | 178,986 | |
Conagra Brands, Inc. | | | 4,634 | | | | 174,238 | |
Catalent, Inc.* | | | 1,614 | | | | 169,970 | |
Cardinal Health, Inc. | | | 2,785 | | | | 169,189 | |
AmerisourceBergen Corp. — Class A | | | 1,397 | | | | 164,944 | |
Quest Diagnostics, Inc. | | | 1,266 | | | | 162,478 | |
Viatris, Inc.* | | | 11,447 | | | | 159,915 | |
STERIS plc | | | 809 | | | | 154,098 | |
Varian Medical Systems, Inc.* | | | 871 | | | | 153,758 | |
Gartner, Inc.* | | | 841 | | | | 153,525 | |
Kellogg Co. | | | 2,414 | | | | 152,806 | |
Avery Dennison Corp. | | | 787 | | | | 144,533 | |
Incyte Corp.* | | | 1,772 | | | | 144,010 | |
ABIOMED, Inc.* | | | 429 | | | | 136,735 | |
PerkinElmer, Inc. | | | 1,063 | | | | 136,372 | |
Dentsply Sirona, Inc. | | | 2,077 | | | | 132,533 | |
J M Smucker Co. | | | 1,039 | | | | 131,465 | |
Hormel Foods Corp. | | | 2,663 | | | | 127,238 | |
Brown-Forman Corp. — Class B | | | 1,732 | | | | 119,456 | |
Bio-Rad Laboratories, Inc. — Class A* | | | 204 | | | | 116,519 | |
Quanta Services, Inc. | | | 1,312 | | | | 115,430 | |
Lamb Weston Holdings, Inc. | | | 1,388 | | | | 107,542 | |
Universal Health Services, Inc. — Class B | | | 738 | | | | 98,442 | |
Campbell Soup Co. | | | 1,925 | | | | 96,770 | |
Henry Schein, Inc.* | | | 1,351 | | | | 93,543 | |
Molson Coors Beverage Co. — Class B* | | | 1,785 | | | | 91,303 | |
Nielsen Holdings plc | | | 3,393 | | | | 85,334 | |
Robert Half International, Inc. | | | 1,073 | | | | 83,769 | |
DaVita, Inc.* | | | 684 | | | | 73,715 | |
Rollins, Inc. | | | 2,100 | | | | 72,282 | |
Perrigo Company plc | | | 1,262 | | | | 51,073 | |
Total Consumer, Non-cyclical | | | | | | | 64,406,693 | |
| | | | | | | | | |
Communications - 12.8% |
Amazon.com, Inc.* | | | 4,059 | | | | 12,558,871 | |
Facebook, Inc. — Class A* | | | 22,812 | | | | 6,718,818 | |
Alphabet, Inc. — Class A* | | | 2,852 | | | | 5,882,307 | |
Alphabet, Inc. — Class C* | | | 2,734 | | | | 5,655,634 | |
Walt Disney Co.* | | | 17,215 | | | | 3,176,512 | |
Comcast Corp. — Class A | | | 43,351 | | | | 2,345,723 | |
Verizon Communications, Inc. | | | 39,245 | | | | 2,282,097 | |
Netflix, Inc.* | | | 4,200 | | | | 2,190,972 | |
Cisco Systems, Inc. | | | 40,037 | | | | 2,070,313 | |
AT&T, Inc. | | | 67,636 | | | | 2,047,342 | |
Booking Holdings, Inc.* | | | 388 | | | | 903,978 | |
Charter Communications, Inc. — Class A* | | | 1,341 | | | | 827,424 | |
T-Mobile US, Inc.* | | | 5,539 | | | | 693,981 | |
Twitter, Inc.* | | | 7,569 | | | | 481,615 | |
eBay, Inc. | | | 6,130 | | | | 375,401 | |
Corning, Inc. | | | 7,286 | | | | 317,014 | |
Motorola Solutions, Inc. | | | 1,603 | | | | 301,444 | |
ViacomCBS, Inc. — Class B | | | 5,385 | | | | 242,863 | |
Etsy, Inc.* | | | 1,195 | | | | 240,996 | |
Expedia Group, Inc.* | | | 1,312 | | | | 225,821 | |
CDW Corp. | | | 1,337 | | | | 221,608 | |
VeriSign, Inc.* | | | 943 | | | | 187,431 | |
Arista Networks, Inc.* | | | 521 | | | | 157,285 | |
Omnicom Group, Inc. | | | 2,038 | | | | 151,117 | |
Lumen Technologies, Inc. | | | 9,361 | | | | 124,969 | |
F5 Networks, Inc.* | | | 585 | | | | 122,043 | |
NortonLifeLock, Inc. | | | 5,518 | | | | 117,313 | |
Fox Corp. — Class A | | | 3,171 | | | | 114,505 | |
Interpublic Group of Companies, Inc. | | | 3,705 | | | | 108,186 | |
Discovery, Inc. — Class C* | | | 2,747 | | | | 101,337 | |
News Corp. — Class A | | | 3,709 | | | | 94,320 | |
DISH Network Corp. — Class A* | | | 2,347 | | | | 84,961 | |
Juniper Networks, Inc. | | | 3,112 | | | | 78,827 | |
Discovery, Inc. — Class A*,1 | | | 1,541 | | | | 66,972 | |
Fox Corp. — Class B | | | 1,458 | | | | 50,928 | |
News Corp. — Class B | | | 1,155 | | | | 27,096 | |
Total Communications | | | | | | | 51,348,024 | |
| | | | | | | | | |
Financial - 12.1% |
Berkshire Hathaway, Inc. — Class B* | | | 18,082 | | | | 4,619,408 | |
JPMorgan Chase & Co. | | | 28,940 | | | | 4,405,536 | |
Visa, Inc. — Class A | | | 16,086 | | | | 3,405,889 | |
Mastercard, Inc. — Class A | | | 8,315 | | | | 2,960,556 | |
Bank of America Corp. | | | 72,049 | | | | 2,787,576 | |
Wells Fargo & Co. | | | 39,207 | | | | 1,531,818 | |
Citigroup, Inc. | | | 19,795 | | | | 1,440,086 | |
Morgan Stanley | | | 14,232 | | | | 1,105,257 | |
Goldman Sachs Group, Inc. | | | 3,263 | | | | 1,067,001 | |
BlackRock, Inc. — Class A | | | 1,346 | | | | 1,014,830 | |
American Tower Corp. — Class A REIT | | | 4,214 | | | | 1,007,399 | |
Charles Schwab Corp. | | | 14,193 | | | | 925,100 | |
SEE NOTES TO FINANCIAL STATEMENTS. | THE RYDEX FUNDS ANNUAL REPORT | 15 |
SCHEDULE OF INVESTMENTS (continued) | March 31, 2021 |
NOVA FUND | |
| | Shares | | | Value | |
American Express Co. | | | 6,188 | | | $ | 875,231 | |
Truist Financial Corp. | | | 12,776 | | | | 745,096 | |
Prologis, Inc. REIT | | | 7,013 | | | | 743,378 | |
U.S. Bancorp | | | 12,964 | | | | 717,039 | |
PNC Financial Services Group, Inc. | | | 4,021 | | | | 705,324 | |
Crown Castle International Corp. REIT | | | 4,090 | | | | 704,012 | |
CME Group, Inc. — Class A | | | 3,404 | | | | 695,199 | |
Chubb Ltd. | | | 4,270 | | | | 674,532 | |
Intercontinental Exchange, Inc. | | | 5,327 | | | | 594,919 | |
Marsh & McLennan Companies, Inc. | | | 4,819 | | | | 586,954 | |
Equinix, Inc. REIT | | | 847 | | | | 575,613 | |
Capital One Financial Corp. | | | 4,355 | | | | 554,086 | |
Progressive Corp. | | | 5,555 | | | | 531,114 | |
Aon plc — Class A | | | 2,143 | | | | 493,126 | |
MetLife, Inc. | | | 7,129 | | | | 433,372 | |
American International Group, Inc. | | | 8,201 | | | | 378,968 | |
Digital Realty Trust, Inc. REIT | | | 2,666 | | | | 375,479 | |
T. Rowe Price Group, Inc. | | | 2,162 | | | | 370,999 | |
Bank of New York Mellon Corp. | | | 7,651 | | | | 361,816 | |
Travelers Companies, Inc. | | | 2,392 | | | | 359,757 | |
Public Storage REIT | | | 1,442 | | | | 355,828 | |
Simon Property Group, Inc. REIT | | | 3,115 | | | | 354,394 | |
Prudential Financial, Inc. | | | 3,765 | | | | 342,991 | |
Allstate Corp. | | | 2,872 | | | | 329,993 | |
Aflac, Inc. | | | 6,073 | | | | 310,816 | |
SBA Communications Corp. REIT | | | 1,037 | | | | 287,819 | |
Welltower, Inc. REIT | | | 3,958 | | | | 283,511 | |
State Street Corp. | | | 3,336 | | | | 280,257 | |
Willis Towers Watson plc | | | 1,223 | | | | 279,920 | |
First Republic Bank | | | 1,669 | | | | 278,306 | |
Discover Financial Services | | | 2,909 | | | | 276,326 | |
Ameriprise Financial, Inc. | | | 1,107 | | | | 257,322 | |
Fifth Third Bancorp | | | 6,743 | | | | 252,525 | |
Weyerhaeuser Co. REIT | | | 7,092 | | | | 252,475 | |
CBRE Group, Inc. — Class A* | | | 3,183 | | | | 251,807 | |
SVB Financial Group* | | | 496 | | | | 244,855 | |
AvalonBay Communities, Inc. REIT | | | 1,323 | | | | 244,107 | |
Equity Residential REIT | | | 3,251 | | | | 232,869 | |
Arthur J Gallagher & Co. | | | 1,837 | | | | 229,202 | |
Hartford Financial Services Group, Inc. | | | 3,389 | | | | 226,351 | |
Realty Income Corp. REIT | | | 3,541 | | | | 224,853 | |
Synchrony Financial | | | 5,151 | | | | 209,440 | |
Northern Trust Corp. | | | 1,976 | | | | 207,697 | |
Alexandria Real Estate Equities, Inc. REIT | | | 1,206 | | | | 198,146 | |
Ventas, Inc. REIT | | | 3,553 | | | | 189,517 | |
Regions Financial Corp. | | | 9,110 | | | | 188,213 | |
M&T Bank Corp. | | | 1,220 | | | | 184,964 | |
KeyCorp | | | 9,187 | | | | 183,556 | |
Citizens Financial Group, Inc. | | | 4,030 | | | | 177,925 | |
Essex Property Trust, Inc. REIT | | | 616 | | | | 167,453 | |
Extra Space Storage, Inc. REIT | | | 1,252 | | | | 165,953 | |
Healthpeak Properties, Inc. REIT | | | 5,109 | | | | 162,160 | |
Nasdaq, Inc. | | | 1,094 | | | | 161,321 | |
Mid-America Apartment Communities, Inc. REIT | | | 1,085 | | | | 156,631 | |
Huntington Bancshares, Inc. | | | 9,647 | | | | 151,651 | |
Duke Realty Corp. REIT | | | 3,544 | | | | 148,600 | |
Cincinnati Financial Corp. | | | 1,422 | | | | 146,594 | |
Principal Financial Group, Inc. | | | 2,404 | | | | 144,144 | |
Raymond James Financial, Inc. | | | 1,162 | | | | 142,415 | |
Boston Properties, Inc. REIT | | | 1,345 | | | | 136,195 | |
UDR, Inc. REIT | | | 2,815 | | | | 123,466 | |
Host Hotels & Resorts, Inc. REIT* | | | 6,690 | | | | 112,726 | |
Loews Corp. | | | 2,153 | | | | 110,406 | |
Lincoln National Corp. | | | 1,711 | | | | 106,544 | |
Iron Mountain, Inc. REIT | | | 2,735 | | | | 101,222 | |
Cboe Global Markets, Inc. | | | 1,017 | | | | 100,368 | |
W R Berkley Corp. | | | 1,329 | | | | 100,140 | |
Western Union Co. | | | 3,897 | | | | 96,100 | |
Comerica, Inc. | | | 1,319 | | | | 94,625 | |
Everest Re Group Ltd. | | | 379 | | | | 93,920 | |
Invesco Ltd. | | | 3,570 | | | | 90,035 | |
Globe Life, Inc. | | | 901 | | | | 87,064 | |
Zions Bancorp North America | | | 1,557 | | | | 85,573 | |
Regency Centers Corp. REIT | | | 1,498 | | | | 84,952 | |
Assurant, Inc. | | | 549 | | | | 77,832 | |
Kimco Realty Corp. REIT | | | 4,101 | | | | 76,894 | |
Franklin Resources, Inc. | | | 2,588 | | | | 76,605 | |
People’s United Financial, Inc. | | | 4,036 | | | | 72,244 | |
Vornado Realty Trust REIT | | | 1,488 | | | | 67,540 | |
Federal Realty Investment Trust REIT | | | 662 | | | | 67,160 | |
Unum Group | | | 1,932 | | | | 53,768 | |
Total Financial | | | | | | | 48,644,756 | |
| | | | | | | | | |
Consumer, Cyclical - 7.8% |
Tesla, Inc.* | | | 7,282 | | | | 4,863,866 | |
Home Depot, Inc. | | | 10,210 | | | | 3,116,602 | |
Walmart, Inc. | | | 13,148 | | | | 1,785,893 | |
NIKE, Inc. — Class B | | | 12,058 | | | | 1,602,388 | |
McDonald’s Corp. | | | 7,070 | | | | 1,584,670 | |
Costco Wholesale Corp. | | | 4,198 | | | | 1,479,711 | |
Lowe’s Companies, Inc. | | | 6,933 | | | | 1,318,518 | |
Starbucks Corp. | | | 11,165 | | | | 1,220,000 | |
Target Corp. | | | 4,750 | | | | 940,833 | |
TJX Companies, Inc. | | | 11,386 | | | | 753,184 | |
General Motors Co.* | | | 12,024 | | | | 690,899 | |
Dollar General Corp. | | | 2,323 | | | | 470,686 | |
Ford Motor Co.* | | | 37,061 | | | | 453,997 | |
Ross Stores, Inc. | | | 3,376 | | | | 404,816 | |
Chipotle Mexican Grill, Inc. — Class A* | | | 267 | | | | 379,359 | |
Marriott International, Inc. — Class A* | | | 2,523 | | | | 373,682 | |
Walgreens Boots Alliance, Inc. | | | 6,801 | | | | 373,375 | |
Cummins, Inc. | | | 1,404 | | | | 363,791 | |
Aptiv plc* | | | 2,561 | | | | 353,162 | |
Southwest Airlines Co.* | | | 5,601 | | | | 341,997 | |
O’Reilly Automotive, Inc.* | | | 665 | | | | 337,321 | |
Hilton Worldwide Holdings, Inc.* | | | 2,633 | | | | 318,382 | |
Yum! Brands, Inc. | | | 2,846 | | | | 307,880 | |
PACCAR, Inc. | | | 3,290 | | | | 305,707 | |
AutoZone, Inc.* | | | 210 | | | | 294,903 | |
Delta Air Lines, Inc.* | | | 6,052 | | | | 292,191 | |
DR Horton, Inc. | | | 3,139 | | | | 279,747 | |
Fastenal Co. | | | 5,447 | | | | 273,875 | |
16 | THE RYDEX FUNDS ANNUAL REPORT | SEE NOTES TO FINANCIAL STATEMENTS. |
SCHEDULE OF INVESTMENTS (continued) | March 31, 2021 |
NOVA FUND | |
| | Shares | | | Value | |
Lennar Corp. — Class A | | | 2,603 | | | $ | 263,502 | |
Dollar Tree, Inc.* | | | 2,231 | | | | 255,360 | |
Best Buy Company, Inc. | | | 2,185 | | | | 250,860 | |
VF Corp. | | | 3,046 | | | | 243,436 | |
Copart, Inc.* | | | 1,972 | | | | 214,179 | |
CarMax, Inc.* | | | 1,541 | | | | 204,429 | |
Carnival Corp.* | | | 7,566 | | | | 200,802 | |
Tractor Supply Co. | | | 1,103 | | | | 195,319 | |
Las Vegas Sands Corp.* | | | 3,114 | | | | 189,207 | |
Royal Caribbean Cruises Ltd.* | | | 2,076 | | | | 177,726 | |
Darden Restaurants, Inc. | | | 1,236 | | | | 175,512 | |
United Airlines Holdings, Inc.* | | | 3,020 | | | | 173,771 | |
Caesars Entertainment, Inc.* | | | 1,975 | | | | 172,714 | |
WW Grainger, Inc. | | | 417 | | | | 167,188 | |
Ulta Beauty, Inc.* | | | 534 | | | | 165,097 | |
Genuine Parts Co. | | | 1,370 | | | | 158,358 | |
NVR, Inc.* | | | 33 | | | | 155,461 | |
MGM Resorts International | | | 3,894 | | | | 147,933 | |
Penn National Gaming, Inc.* | | | 1,410 | | | | 147,824 | |
American Airlines Group, Inc.* | | | 6,066 | | | | 144,977 | |
L Brands, Inc.* | | | 2,216 | | | | 137,082 | |
Domino’s Pizza, Inc. | | | 368 | | | | 135,347 | |
PulteGroup, Inc. | | | 2,521 | | | | 132,201 | |
Pool Corp. | | | 382 | | | | 131,882 | |
Whirlpool Corp. | | | 595 | | | | 131,108 | |
Wynn Resorts Ltd.* | | | 998 | | | | 125,119 | |
Hasbro, Inc. | | | 1,211 | | | | 116,401 | |
Live Nation Entertainment, Inc.* | | | 1,361 | | | | 115,209 | |
Advance Auto Parts, Inc. | | | 621 | | | | 113,947 | |
LKQ Corp.* | | | 2,646 | | | | 112,005 | |
Tapestry, Inc.* | | | 2,635 | | | | 108,588 | |
Mohawk Industries, Inc.* | | | 559 | | | | 107,501 | |
BorgWarner, Inc. | | | 2,267 | | | | 105,098 | |
Newell Brands, Inc. | | | 3,584 | | | | 95,979 | |
Norwegian Cruise Line Holdings Ltd.*,1 | | | 3,445 | | | | 95,048 | |
Alaska Air Group, Inc.* | | | 1,178 | | | | 81,529 | |
PVH Corp.* | | | 674 | | | | 71,242 | |
Hanesbrands, Inc. | | | 3,308 | | | | 65,069 | |
Gap, Inc. | | | 1,951 | | | | 58,101 | |
Leggett & Platt, Inc. | | | 1,261 | | | | 57,565 | |
Ralph Lauren Corp. — Class A* | | | 457 | | | | 56,284 | |
Under Armour, Inc. — Class A* | | | 1,789 | | | | 39,644 | |
Under Armour, Inc. — Class C* | | | 1,848 | | | | 34,114 | |
Total Consumer, Cyclical | | | | | | | 31,311,153 | |
| | | | | | | | | |
Industrial - 6.8% |
Honeywell International, Inc. | | | 6,596 | | | | 1,431,794 | |
Union Pacific Corp. | | | 6,352 | | | | 1,400,044 | |
Boeing Co.* | | | 5,203 | | | | 1,325,308 | |
Caterpillar, Inc. | | | 5,171 | | | | 1,199,000 | |
United Parcel Service, Inc. — Class B | | | 6,824 | | | | 1,160,012 | |
Raytheon Technologies Corp. | | | 14,410 | | | | 1,113,461 | |
Deere & Co. | | | 2,973 | | | | 1,112,318 | |
General Electric Co. | | | 83,152 | | | | 1,091,786 | |
3M Co. | | | 5,491 | | | | 1,058,006 | |
Lockheed Martin Corp. | | | 2,337 | | | | 863,522 | |
CSX Corp. | | | 7,231 | | | | 697,213 | |
FedEx Corp. | | | 2,313 | | | | 656,985 | |
Norfolk Southern Corp. | | | 2,389 | | | | 641,494 | |
Illinois Tool Works, Inc. | | | 2,732 | | | | 605,193 | |
Eaton Corporation plc | | | 3,775 | | | | 522,007 | |
Emerson Electric Co. | | | 5,690 | | | | 513,352 | |
Waste Management, Inc. | | | 3,692 | | | | 476,342 | |
Northrop Grumman Corp. | | | 1,470 | | | | 475,751 | |
Johnson Controls International plc | | | 6,831 | | | | 407,606 | |
TE Connectivity Ltd. | | | 3,138 | | | | 405,147 | |
General Dynamics Corp. | | | 2,199 | | | | 399,250 | |
L3Harris Technologies, Inc. | | | 1,950 | | | | 395,226 | |
Parker-Hannifin Corp. | | | 1,224 | | | | 386,086 | |
Amphenol Corp. — Class A | | | 5,681 | | | | 374,776 | |
Trane Technologies plc | | | 2,261 | | | | 374,331 | |
Agilent Technologies, Inc. | | | 2,890 | | | | 367,435 | |
Carrier Global Corp. | | | 7,749 | | | | 327,163 | |
TransDigm Group, Inc.* | | | 519 | | | | 305,130 | |
Stanley Black & Decker, Inc. | | | 1,526 | | | | 304,697 | |
Rockwell Automation, Inc. | | | 1,101 | | | | 292,249 | |
AMETEK, Inc. | | | 2,187 | | | | 279,346 | |
Otis Worldwide Corp. | | | 3,866 | | | | 264,628 | |
Ball Corp. | | | 3,109 | | | | 263,457 | |
Mettler-Toledo International, Inc.* | | | 222 | | | | 256,563 | |
Keysight Technologies, Inc.* | | | 1,765 | | | | 253,101 | |
Kansas City Southern | | | 862 | | | | 227,499 | |
Fortive Corp. | | | 3,206 | | | | 226,472 | |
Old Dominion Freight Line, Inc. | | | 909 | | | | 218,533 | |
Vulcan Materials Co. | | | 1,257 | | | | 212,119 | |
Martin Marietta Materials, Inc. | | | 591 | | | | 198,469 | |
Republic Services, Inc. — Class A | | | 1,996 | | | | 198,302 | |
Generac Holdings, Inc.* | | | 596 | | | | 195,160 | |
Garmin Ltd. | | | 1,417 | | | | 186,831 | |
Dover Corp. | | | 1,362 | | | | 186,771 | |
Trimble, Inc.* | | | 2,380 | | | | 185,140 | |
Xylem, Inc. | | | 1,710 | | | | 179,858 | |
Ingersoll Rand, Inc.* | | | 3,535 | | | | 173,957 | |
Amcor plc | | | 14,812 | | | | 173,004 | |
Expeditors International of Washington, Inc. | | | 1,606 | | | | 172,950 | |
Waters Corp.* | | | 590 | | | | 167,660 | |
Jacobs Engineering Group, Inc. | | | 1,234 | | | | 159,519 | |
IDEX Corp. | | | 719 | | | | 150,501 | |
Masco Corp. | | | 2,439 | | | | 146,096 | |
Teledyne Technologies, Inc.* | | | 351 | | | | 145,191 | |
Westinghouse Air Brake Technologies Corp. | | | 1,684 | | | | 133,306 | |
J.B. Hunt Transport Services, Inc. | | | 792 | | | | 133,111 | |
Westrock Co. | | | 2,499 | | | | 130,073 | |
Fortune Brands Home & Security, Inc. | | | 1,315 | | | | 126,003 | |
CH Robinson Worldwide, Inc. | | | 1,269 | | | | 121,101 | |
Packaging Corporation of America | | | 899 | | | | 120,897 | |
Textron, Inc. | | | 2,152 | | | | 120,684 | |
Howmet Aerospace, Inc.* | | | 3,701 | | | | 118,913 | |
Snap-on, Inc. | | | 514 | | | | 118,600 | |
Allegion plc | | | 860 | | | | 108,033 | |
Pentair plc | | | 1,575 | | | | 98,154 | |
A O Smith Corp. | | | 1,284 | | | | 86,811 | |
SEE NOTES TO FINANCIAL STATEMENTS. | THE RYDEX FUNDS ANNUAL REPORT | 17 |
SCHEDULE OF INVESTMENTS (continued) | March 31, 2021 |
NOVA FUND | |
| | Shares | | | Value | |
Huntington Ingalls Industries, Inc. | | | 382 | | | $ | 78,635 | |
FLIR Systems, Inc. | | | 1,244 | | | | 70,249 | |
Sealed Air Corp. | | | 1,469 | | | | 67,310 | |
Total Industrial | | | | | | | 27,135,691 | |
| | | | | | | | | |
Energy - 2.3% |
Exxon Mobil Corp. | | | 40,149 | | | | 2,241,519 | |
Chevron Corp. | | | 18,268 | | | | 1,914,304 | |
ConocoPhillips | | | 12,847 | | | | 680,505 | |
EOG Resources, Inc. | | | 5,534 | | | | 401,381 | |
Schlumberger N.V. | | | 13,260 | | | | 360,539 | |
Phillips 66 | | | 4,143 | | | | 337,820 | |
Marathon Petroleum Corp. | | | 6,177 | | | | 330,408 | |
Pioneer Natural Resources Co. | | | 1,951 | | | | 309,858 | |
Kinder Morgan, Inc. | | | 18,462 | | | | 307,392 | |
Valero Energy Corp. | | | 3,875 | | | | 277,450 | |
Williams Companies, Inc. | | | 11,511 | | | | 272,696 | |
ONEOK, Inc. | | | 4,220 | | | | 213,785 | |
Occidental Petroleum Corp. | | | 7,951 | | | | 211,656 | |
Enphase Energy, Inc.* | | | 1,223 | | | | 198,322 | |
Hess Corp. | | | 2,591 | | | | 183,339 | |
Halliburton Co. | | | 8,427 | | | | 180,844 | |
Baker Hughes Co. | | | 6,913 | | | | 149,390 | |
Diamondback Energy, Inc. | | | 1,715 | | | | 126,035 | |
Devon Energy Corp. | | | 5,617 | | | | 122,731 | |
Marathon Oil Corp. | | | 7,486 | | | | 79,950 | |
Cabot Oil & Gas Corp. — Class A | | | 3,788 | | | | 71,139 | |
APA Corp. | | | 3,583 | | | | 64,136 | |
HollyFrontier Corp. | | | 1,417 | | | | 50,700 | |
NOV, Inc.* | | | 3,682 | | | | 50,517 | |
Total Energy | | | | | | | 9,136,416 | |
| | | | | | | | | |
Utilities - 2.1% |
NextEra Energy, Inc. | | | 18,586 | | | | 1,405,288 | |
Duke Energy Corp. | | | 7,289 | | | | 703,607 | |
Southern Co. | | | 10,021 | | | | 622,905 | |
Dominion Energy, Inc. | | | 7,641 | | | | 580,410 | |
Exelon Corp. | | | 9,259 | | | | 404,989 | |
American Electric Power Company, Inc. | | | 4,709 | | | | 398,852 | |
Sempra Energy | | | 2,869 | | | | 380,372 | |
Xcel Energy, Inc. | | | 5,099 | | | | 339,135 | |
Public Service Enterprise Group, Inc. | | | 4,790 | | | | 288,406 | |
Eversource Energy | | | 3,253 | | | | 281,677 | |
WEC Energy Group, Inc. | | | 2,992 | | | | 280,021 | |
American Water Works Company, Inc. | | | 1,721 | | | | 258,012 | |
DTE Energy Co. | | | 1,838 | | | | 244,711 | |
Consolidated Edison, Inc. | | | 3,247 | | | | 242,876 | |
Edison International | | | 3,597 | | | | 210,784 | |
PPL Corp. | | | 7,293 | | | | 210,330 | |
Ameren Corp. | | | 2,403 | | | | 195,508 | |
Entergy Corp. | | | 1,901 | | | | 189,093 | |
FirstEnergy Corp. | | | 5,152 | | | | 178,723 | |
AES Corp. | | | 6,336 | | | | 169,868 | |
CMS Energy Corp. | | | 2,740 | | | | 167,743 | |
Alliant Energy Corp. | | | 2,370 | | | | 128,359 | |
Evergy, Inc. | | | 2,152 | | | | 128,109 | |
Atmos Energy Corp. | | | 1,215 | | | | 120,102 | |
CenterPoint Energy, Inc. | | | 5,231 | | | | 118,482 | |
NiSource, Inc. | | | 3,716 | | | | 89,593 | |
NRG Energy, Inc. | | | 2,320 | | | | 87,534 | |
Pinnacle West Capital Corp. | | | 1,069 | | | | 86,963 | |
Total Utilities | | | | | | | 8,512,452 | |
| | | | | | | | | |
Basic Materials - 1.7% |
Linde plc | | | 4,958 | | | | 1,388,934 | |
Air Products and Chemicals, Inc. | | | 2,099 | | | | 590,533 | |
Sherwin-Williams Co. | | | 765 | | | | 564,578 | |
Ecolab, Inc. | | | 2,359 | | | | 504,991 | |
Newmont Corp. | | | 7,590 | | | | 457,449 | |
Freeport-McMoRan, Inc. | | | 13,831 | | | | 455,455 | |
Dow, Inc. | | | 7,067 | | | | 451,864 | |
DuPont de Nemours, Inc. | | | 5,106 | | | | 394,592 | |
PPG Industries, Inc. | | | 2,247 | | | | 337,634 | |
International Flavors & Fragrances, Inc. | | | 2,359 | | | | 329,340 | |
LyondellBasell Industries N.V. — Class A | | | 2,440 | | | | 253,882 | |
Nucor Corp. | | | 2,826 | | | | 226,843 | |
International Paper Co. | | | 3,728 | | | | 201,573 | |
Celanese Corp. — Class A | | | 1,083 | | | | 162,244 | |
Albemarle Corp. | | | 1,106 | | | | 161,598 | |
Eastman Chemical Co. | | | 1,288 | | | | 141,835 | |
FMC Corp. | | | 1,227 | | | | 135,718 | |
Mosaic Co. | | | 3,271 | | | | 103,396 | |
CF Industries Holdings, Inc. | | | 2,030 | | | | 92,121 | |
Total Basic Materials | | | | | | | 6,954,580 | |
| | | | | | | | | |
Total Common Stocks | | | | |
(Cost $284,103,793) | | | | | | | 318,809,129 | |
| | | | | | | | | |
MUTUAL FUNDS† - 8.6% |
Guggenheim Ultra Short Duration Fund — Institutional Class2 | | | 1,933,234 | | | | 19,255,008 | |
Guggenheim Strategy Fund II2 | | | 428,246 | | | | 10,697,596 | |
Guggenheim Strategy Fund III2 | | | 184,563 | | | | 4,639,905 | |
Total Mutual Funds | | | | |
(Cost $34,381,511) | | | | | | | 34,592,509 | |
18 | THE RYDEX FUNDS ANNUAL REPORT | SEE NOTES TO FINANCIAL STATEMENTS. |
SCHEDULE OF INVESTMENTS (continued) | March 31, 2021 |
NOVA FUND | |
| | Face
Amount | | | Value | |
U.S. TREASURY BILLS†† - 4.2% |
U.S. Treasury Bills |
0.03% due 04/01/213,4 | | $ | 4,660,000 | | | $ | 4,660,000 | |
0.09% due 04/01/213,4 | | | 4,500,000 | | | | 4,500,000 | |
0.01% due 04/22/214,5 | | | 642,000 | | | | 641,995 | |
0.04% due 04/01/213,4 | | | 424,000 | | | | 424,000 | |
U.S. Cash Management Bill |
0.03% due 08/03/214 | | | 6,500,000 | | | | 6,499,356 | |
Total U.S. Treasury Bills | | | | |
(Cost $16,725,350) | | | | | | | 16,725,351 | |
| | | | | | | | | |
REPURCHASE AGREEMENTS††,6 - 7.3% |
J.P. Morgan Securities LLC
issued 03/31/21 at 0.01%
due 04/01/213 | | | 15,661,763 | | | | 15,661,763 | |
Barclays Capital, Inc.
issued 03/31/21 at 0.01%
due 04/01/213 | | | 7,120,599 | | | | 7,120,599 | |
BofA Securities, Inc.
issued 03/31/21 at 0.01%
due 04/01/213 | | | 6,498,657 | | | | 6,498,657 | |
Total Repurchase Agreements | | | | |
(Cost $29,281,019) | | | | | | | 29,281,019 | |
| | | Shares | | | | | |
SECURITIES LENDING COLLATERAL†,7 - 0.0% |
Money Market Fund | | | | | | | | |
First American Government Obligations Fund — Class Z, 0.03%8 | | | 94,247 | | | | 94,247 | |
Total Securities Lending Collateral | | | | |
(Cost $94,247) | | | | | | | 94,247 | |
| | | | | | | | | |
Total Investments - 99.4% | | | | |
(Cost $364,585,920) | | $ | 399,502,255 | |
Other Assets & Liabilities, net - 0.6% | | | 2,566,519 | |
Total Net Assets - 100.0% | | $ | 402,068,774 | |
Futures Contracts |
Description | | Number of
Contracts | | | Expiration
Date | | | Notional
Amount | | | Value and
Unrealized
Appreciation** | |
Equity Futures Contracts Purchased† |
S&P 500 Index Mini Futures Contracts | | | 34 | | | | Jun 2021 | | | $ | 6,746,450 | | | $ | 18,515 | |
Total Return Swap Agreements |
Counterparty | Index | Financing
Rate Pay | Payment
Frequency | | Maturity
Date | | | Units | | | Notional
Amount | | | Value and
Unrealized
Appreciation
(Depreciation) | |
OTC Equity Index Swap Agreements†† |
Barclays Bank plc | S&P 500 Index | 0.54% (1 Week USD LIBOR + 0.45%) | At Maturity | | | 04/07/21 | | | | 16,989 | | | $ | 67,496,262 | | | $ | 845,787 | |
BNP Paribas | S&P 500 Index | 0.66% (1 Month USD LIBOR + 0.55%) | At Maturity | | | 04/08/21 | | | | 6,918 | | | | 27,484,873 | | | | 294,567 | |
Goldman Sachs International | S&P 500 Index | 0.54% (1 Week USD LIBOR + 0.45%) | At Maturity | | | 05/27/21 | | | | 45,872 | | | | 182,244,595 | | | | (70,406 | ) |
| | | | | | | | | | | | | | $ | 277,225,730 | | | $ | 1,069,948 | |
SEE NOTES TO FINANCIAL STATEMENTS. | THE RYDEX FUNDS ANNUAL REPORT | 19 |
SCHEDULE OF INVESTMENTS (continued) | March 31, 2021 |
NOVA FUND | |
* | Non-income producing security. |
** | Includes cumulative appreciation (depreciation). Variation margin is reported within the Statement of Assets and Liabilities. |
† | Value determined based on Level 1 inputs — See Note 4. |
†† | Value determined based on Level 2 inputs — See Note 4. |
1 | All or a portion of this security is on loan at March 31, 2021 — See Note 7. |
2 | Affiliated issuer. |
3 | All or a portion of this security is pledged as equity index swap collateral at March 31, 2021. |
4 | Rate indicated is the effective yield at the time of purchase. |
5 | All or a portion of this security is pledged as futures collateral at March 31, 2021. |
6 | Repurchase Agreements — See Note 6. |
7 | Securities lending collateral — See Note 7. |
8 | Rate indicated is the 7-day yield as of March 31, 2021. |
| | LIBOR — London Interbank Offered Rate |
| | plc — Public Limited Company |
| | REIT — Real Estate Investment Trust |
| | |
| | See Sector Classification in Other Information section. |
The following table summarizes the inputs used to value the Fund’s investments at March 31, 2021 (See Note 4 in the Notes to Financial Statements):
Investments in Securities (Assets) | | Level 1
Quoted
Prices | | | Level 2
Significant
Observable
Inputs | | | Level 3
Significant
Unobservable
Inputs | | | Total | |
Common Stocks | | $ | 318,809,129 | | | $ | — | | | $ | — | | | $ | 318,809,129 | |
Mutual Funds | | | 34,592,509 | | | | — | | | | — | | | | 34,592,509 | |
U.S. Treasury Bills | | | — | | | | 16,725,351 | | | | — | | | | 16,725,351 | |
Repurchase Agreements | | | — | | | | 29,281,019 | | | | — | | | | 29,281,019 | |
Securities Lending Collateral | | | 94,247 | | | | — | | | | — | | | | 94,247 | |
Equity Futures Contracts** | | | 18,515 | | | | — | | | | — | | | | 18,515 | |
Equity Index Swap Agreements** | | | — | | | | 1,140,354 | | | | — | | | | 1,140,354 | |
Total Assets | | $ | 353,514,400 | | | $ | 47,146,724 | | | $ | — | | | $ | 400,661,124 | |
Investments in Securities (Liabilities) | | Level 1
Quoted
Prices | | | Level 2
Significant
Observable
Inputs | | | Level 3
Significant
Unobservable
Inputs | | | Total | |
Equity Index Swap Agreements** | | $ | — | | | $ | 70,406 | | | $ | — | | | $ | 70,406 | |
** | This derivative is reported as unrealized appreciation/depreciation at period end. |
20 | THE RYDEX FUNDS ANNUAL REPORT | SEE NOTES TO FINANCIAL STATEMENTS. |
SCHEDULE OF INVESTMENTS (concluded) | March 31, 2021 |
NOVA FUND | |
Affiliated Transactions
Investments representing 5% or more of the outstanding voting shares of a company, or control of or by, or common control under Guggenheim Investments (“GI”), result in that company being considered an affiliated issuer, as defined in the 1940 Act.
The Fund may invest in certain of the underlying series of Guggenheim Strategy Funds Trust, including Guggenheim Strategy Fund II and Guggenheim Strategy Fund III, (collectively, the “Short Term Investment Vehicles”), each of which are open-end management investment companies managed by GI. The Short Term Investment Vehicles, which launched on March 11, 2014, are offered as short term investment options only to mutual funds, trusts, and other accounts managed by GI and/or its affiliates, and are not available to the public. The Short Term Investment Vehicles pay no investment management fees. The Short Term Investment Vehicles’ annual report on Form N-CSR dated September 30, 2020, is available publicly or upon request. This information is available from the EDGAR database on the SEC’s website at https://www.sec.gov/Archives/edgar/data/1601445/000182126820000133/gug81042-ncsr.htm.
Transactions during the year ended March 31, 2021, in which the company is an affiliated issuer, were as follows:
Security Name | | Value
03/31/20 | | | Additions | | | Reductions | | | Realized
Gain (Loss) | | | Change in
Unrealized
Appreciation
(Depreciation) | | | Value
03/31/21 | | | Shares
03/31/21 | | | Investment
Income | |
Mutual Funds | | | | | | | | | | | | | | | | | | | | | | | | | | | | | | | | |
Guggenheim Strategy Fund II | | $ | 11,261,712 | | | $ | — | | | $ | (1,000,000 | ) | | $ | 5,870 | | | $ | 430,014 | | | $ | 10,697,596 | | | | 428,246 | | | $ | 191,829 | |
Guggenheim Strategy Fund III | | | 1,704,973 | | | | 2,800,000 | | | | — | | | | — | | | | 134,932 | | | | 4,639,905 | | | | 184,563 | | | | 71,229 | |
Guggenheim Ultra Short Duration Fund — Institutional Class | | | 7,748,990 | | | | 17,800,000 | | | | (6,500,000 | ) | | | 3,641 | | | | 202,377 | | | | 19,255,008 | | | | 1,933,234 | | | | 159,530 | |
| | | $ | 20,715,675 | | | $ | 20,600,000 | | | $ | (7,500,000 | ) | | $ | 9,511 | | | $ | 767,323 | | | $ | 34,592,509 | | | | | | | $ | 422,588 | |
SEE NOTES TO FINANCIAL STATEMENTS. | THE RYDEX FUNDS ANNUAL REPORT | 21 |
STATEMENT OF ASSETS AND LIABILITIES |
March 31, 2021 |
Assets: |
Investments in unaffiliated issuers, at value - including $92,813 of securities loaned (cost $300,923,390) | | $ | 335,628,727 | |
Investments in affiliated issuers, at value (cost $34,381,511) | | | 34,592,509 | |
Repurchase agreements, at value (cost $29,281,019) | | | 29,281,019 | |
Cash | | | 2,869 | |
Unrealized appreciation on OTC swap agreements | | | 1,140,354 | |
Receivables: |
Fund shares sold | | | 14,068,125 | |
Dividends | | | 240,519 | |
Variation margin on futures contracts | | | 35,360 | |
Securities lending income | | | 9 | |
Interest | | | 5 | |
Total assets | | | 414,989,496 | |
| | | | | |
Liabilities: |
Unrealized depreciation on OTC swap agreements | | | 70,406 | |
Payable for: |
Securities purchased | | | 11,450,578 | |
Fund shares redeemed | | | 331,417 | |
Management fees | | | 229,228 | |
Swap settlement | | | 208,200 | |
Return of securities lending collateral | | | 94,247 | |
Transfer agent and administrative fees | | | 83,574 | |
Portfolio accounting fees | | | 28,609 | |
Distribution and service fees | | | 17,723 | |
Trustees’ fees* | | | 5,593 | |
Miscellaneous | | | 401,147 | |
Total liabilities | | | 12,920,722 | |
Commitments and contingent liabilities (Note 12) | | | — | |
Net assets | | $ | 402,068,774 | |
| | | | | |
Net assets consist of: |
Paid in capital | | $ | 362,235,859 | |
Total distributable earnings (loss) | | | 39,832,915 | |
Net assets | | $ | 402,068,774 | |
| | | | | |
Investor Class: |
Net assets | | $ | 326,237,076 | |
Capital shares outstanding | | | 2,707,091 | |
Net asset value per share | | $ | 120.51 | |
| | | | | |
A-Class: |
Net assets | | $ | 18,595,796 | |
Capital shares outstanding | | | 167,190 | |
Net asset value per share | | $ | 111.23 | |
Maximum offering price per share (Net asset value divided by 95.25%) | | $ | 116.78 | |
| | | | | |
C-Class: |
Net assets | | $ | 3,576,171 | |
Capital shares outstanding | | | 36,883 | |
Net asset value per share | | $ | 96.96 | |
| | | | | |
H-Class: |
Net assets | | $ | 53,659,731 | |
Capital shares outstanding | | | 481,930 | |
Net asset value per share | | $ | 111.34 | |
* | Relates to Trustees not deemed “interested persons” within the meaning of Section 2(a)(19) of the 1940 Act. |
22 | THE RYDEX FUNDS ANNUAL REPORT | SEE NOTES TO FINANCIAL STATEMENTS. |
STATEMENT OF OPERATIONS |
Year Ended March 31, 2021 |
Investment Income: |
Dividends from securities of unaffiliated issuers | | $ | 3,210,519 | |
Dividends from securities of affiliated issuers | | | 422,588 | |
Interest | | | 25,267 | |
Income from securities lending, net | | | 1,663 | |
Total investment income | | | 3,660,037 | |
| | | | | |
Expenses: |
Management fees | | | 2,001,410 | |
Distribution and service fees: |
A-Class | | | 40,363 | |
C-Class | | | 38,048 | |
H-Class | | | 103,134 | |
Transfer agent and administrative fees | | | 740,040 | |
Portfolio accounting fees | | | 255,066 | |
Professional fees | | | 81,101 | |
Trustees’ fees* | | | 39,678 | |
Custodian fees | | | 37,292 | |
Line of credit fees | | | 1,635 | |
Interest expense | | | 83 | |
Miscellaneous | | | 404,392 | |
Total expenses | | | 3,742,242 | |
Less: |
Expenses waived by Adviser | | | (34,760 | ) |
Net expenses | | | 3,707,482 | |
Net investment loss | | | (47,445 | ) |
| | | | | |
Net Realized and Unrealized Gain (Loss): |
Net realized gain (loss) on: |
Investments in unaffiliated issuers | | $ | 32,820,295 | |
Investments in affiliated issuers | | | 9,511 | |
Swap agreements | | | 55,840,352 | |
Futures contracts | | | 24,288,964 | |
Net realized gain | | | 112,959,122 | |
Net change in unrealized appreciation (depreciation) on: |
Investments in unaffiliated issuers | | | 34,654,389 | |
Investments in affiliated issuers | | | 767,323 | |
Swap agreements | | | 2,322,272 | |
Futures contracts | | | 12,728 | |
Net change in unrealized appreciation (depreciation) | | | 37,756,712 | |
Net realized and unrealized gain | | | 150,715,834 | |
Net increase in net assets resulting from operations | | $ | 150,668,389 | |
* | Relates to Trustees not deemed “interested persons” within the meaning of Section 2(a)(19) of the 1940 Act. |
SEE NOTES TO FINANCIAL STATEMENTS. | THE RYDEX FUNDS ANNUAL REPORT | 23 |
STATEMENTS OF CHANGES IN NET ASSETS |
| | Year Ended
March 31,
2021 | | | Year Ended
March 31,
2020 | |
Increase (Decrease) in Net Assets from Operations: | | | | | | | | |
Net investment income | | $ | (47,445 | ) | | $ | 1,903,401 | |
Net realized gain (loss) on investments | | | 112,959,122 | | | | (3,430,932 | ) |
Net change in unrealized appreciation (depreciation) on investments | | | 37,756,712 | | | | (25,554,771 | ) |
Net increase (decrease) in net assets resulting from operations | | | 150,668,389 | | | | (27,082,302 | ) |
| | | | | | | | | |
Distributions to shareholders: | | | | | | | | |
Investor Class | | | (1,491,578 | ) | | | — | |
A-Class | | | (113,091 | ) | | | — | |
C-Class | | | (25,544 | ) | | | — | |
H-Class | | | (282,790 | ) | | | — | |
Total distributions to shareholders | | | (1,913,003 | ) | | | — | |
| | | | | | | | | |
Capital share transactions: | | | | | | | | |
Proceeds from sale of shares | | | | | | | | |
Investor Class | | | 1,819,212,195 | | | | 1,884,601,216 | |
A-Class | | | 91,209,558 | | | | 134,948,538 | |
C-Class | | | 135,213 | | | | 1,007,068 | |
H-Class | | | 388,284,290 | | | | 389,155,191 | |
Distributions reinvested | | | | | | | | |
Investor Class | | | 1,356,726 | | | | — | |
A-Class | | | 110,585 | | | | — | |
C-Class | | | 25,096 | | | | — | |
H-Class | | | 282,790 | | | | — | |
Cost of shares redeemed | | | | | | | | |
Investor Class | | | (1,645,409,127 | ) | | | (2,067,340,105 | ) |
A-Class | | | (89,125,245 | ) | | | (150,323,713 | ) |
C-Class | | | (2,253,309 | ) | | | (1,175,937 | ) |
H-Class | | | (363,214,241 | ) | | | (433,198,924 | ) |
Net increase (decrease) from capital share transactions | | | 200,614,531 | | | | (242,326,666 | ) |
Net increase (decrease) in net assets | | | 349,369,917 | | | | (269,408,968 | ) |
| | | | | | | | | |
Net assets: | | | | | | | | |
Beginning of year | | | 52,698,857 | | | | 322,107,825 | |
End of year | | $ | 402,068,774 | | | $ | 52,698,857 | |
| | | | | | | | | |
Capital share activity: | | | | | | | | |
Shares sold | | | | | | | | |
Investor Class | | | 19,353,964 | | | | 22,279,494 | |
A-Class | | | 1,009,467 | | | | 1,760,253 | |
C-Class | | | 1,947 | | | | 16,542 | |
H-Class | | | 4,730,952 | | | | 4,984,254 | |
Shares issued from reinvestment of distributions | | | | | | | | |
Investor Class | | | 12,683 | | | | — | |
A-Class | | | 1,119 | | | | — | |
C-Class | | | 291 | | | | — | |
H-Class | | | 2,860 | | | | — | |
Shares redeemed | | | | | | | | |
Investor Class | | | (17,254,830 | ) | | | (24,844,947 | ) |
A-Class | | | (969,642 | ) | | | (1,999,067 | ) |
C-Class | | | (29,742 | ) | | | (18,108 | ) |
H-Class | | | (4,320,709 | ) | | | (5,603,433 | ) |
Net increase (decrease) in shares | | | 2,538,360 | | | | (3,425,012 | ) |
24 | THE RYDEX FUNDS ANNUAL REPORT | SEE NOTES TO FINANCIAL STATEMENTS. |
This table is presented to show selected data for a share outstanding throughout each period and to assist shareholders in evaluating a Fund’s performance for the periods presented.
Investor Class | | Year Ended
March 31,
2021 | | | Year Ended
March 31,
2020 | | | Year Ended
March 31,
2019 | | | Year Ended
March 29,
2018 | | | Year Ended
March 31,
2017 | |
Per Share Data |
Net asset value, beginning of period | | $ | 63.62 | | | $ | 76.83 | | | $ | 69.63 | | | $ | 60.14 | | | $ | 49.18 | |
Income (loss) from investment operations: |
Net investment income (loss)a | | | .05 | | | | .61 | | | | .48 | | | | .40 | | | | .08 | |
Net gain (loss) on investments (realized and unrealized) | | | 57.43 | | | | (13.82 | ) | | | 6.72 | | | | 10.50 | | | | 11.56 | |
Total from investment operations | | | 57.48 | | | | (13.21 | ) | | | 7.20 | | | | 10.90 | | | | 11.64 | |
Less distributions from: |
Net investment income | | | (.59 | ) | | | — | | | | — | | | | (.02 | ) | | | (.02 | ) |
Net realized gains | | | — | | | | — | | | | — | | | | (1.39 | ) | | | (.66 | ) |
Total distributions | | | (.59 | ) | | | — | | | | — | | | | (1.41 | ) | | | (.68 | ) |
Net asset value, end of period | | $ | 120.51 | | | $ | 63.62 | | | $ | 76.83 | | | $ | 69.63 | | | $ | 60.14 | |
|
Total Return | | | 90.46 | % | | | (17.19 | %) | | | 10.34 | % | | | 18.09 | % | | | 23.84 | % |
Ratios/Supplemental Data |
Net assets, end of period (in thousands) | | $ | 326,237 | | | $ | 37,874 | | | $ | 242,831 | | | $ | 451,764 | | | $ | 78,531 | |
Ratios to average net assets: |
Net investment income (loss) | | | 0.05 | % | | | 0.71 | % | | | 0.65 | % | | | 0.58 | % | | | 0.15 | % |
Total expensesb | | | 1.33 | % | | | 1.37 | % | | | 1.35 | % | | | 1.26 | % | | | 1.28 | % |
Net expenses c | | | 1.32 | % | | | 1.36 | % | | | 1.35 | % | | | 1.26 | % | | | 1.28 | % |
Portfolio turnover rate | | | 785 | % | | | 690 | % | | | 1,078 | % | | | 2,067 | % | | | 1,288 | % |
A-Class | | Year Ended
March 31,
2021 | | | Year Ended
March 31,
2020 | | | Year Ended
March 31,
2019 | | | Year Ended
March 29,
2018 | | | Year Ended
March 31,
2017 | |
Per Share Data |
Net asset value, beginning of period | | $ | 58.89 | | | $ | 71.28 | | | $ | 64.72 | | | $ | 56.18 | | | $ | 46.08 | |
Income (loss) from investment operations: |
Net investment income (loss)a | | | (.18 | ) | | | .40 | | | | .28 | | | | .25 | | | | (.02 | ) |
Net gain (loss) on investments (realized and unrealized) | | | 53.11 | | | | (12.79 | ) | | | 6.28 | | | | 9.70 | | | | 10.80 | |
Total from investment operations | | | 52.93 | | | | (12.39 | ) | | | 6.56 | | | | 9.95 | | | | 10.78 | |
Less distributions from: |
Net investment income | | | (.59 | ) | | | — | | | | — | | | | (.02 | ) | | | (.02 | ) |
Net realized gains | | | — | | | | — | | | | — | | | | (1.39 | ) | | | (.66 | ) |
Total distributions | | | (.59 | ) | | | — | | | | — | | | | (1.41 | ) | | | (.68 | ) |
Net asset value, end of period | | $ | 111.23 | | | $ | 58.89 | | | $ | 71.28 | | | $ | 64.72 | | | $ | 56.18 | |
TotalReturnd | | | 90.00 | % | | | (17.38 | %) | | | 10.14 | % | | | 17.68 | % | | | 23.57 | % |
Ratios/Supplemental Data |
Net assets, end of period (in thousands) | | $ | 18,596 | | | $ | 7,435 | | | $ | 26,022 | | | $ | 35,094 | | | $ | 3,528 | |
Ratios to average net assets: |
Net investment income (loss) | | | (0.20 | %) | | | 0.52 | % | | | 0.41 | % | | | 0.39 | % | | | (0.05 | %) |
Total expensesb | | | 1.59 | % | | | 1.62 | % | | | 1.60 | % | | | 1.51 | % | | | 1.53 | % |
Net expenses c | | | 1.58 | % | | | 1.61 | % | | | 1.60 | % | | | 1.51 | % | | | 1.53 | % |
Portfolio turnover rate | | | 785 | % | | | 690 | % | | | 1,078 | % | | | 2,067 | % | | | 1,288 | % |
SEE NOTES TO FINANCIAL STATEMENTS. | THE RYDEX FUNDS ANNUAL REPORT | 25 |
FINANCIAL HIGHLIGHTS (continued) |
This table is presented to show selected data for a share outstanding throughout each period and to assist shareholders in evaluating a Fund’s performance for the periods presented.
C-Class | | Year Ended
March 31,
2021 | | | Year Ended
March 31,
2020 | | | Year Ended
March 31,
2019 | | | Year Ended
March 29,
2018 | | | Year Ended
March 31,
2017 | |
Per Share Data |
Net asset value, beginning of period | | $ | 51.77 | | | $ | 63.15 | | | $ | 57.77 | | | $ | 50.57 | | | $ | 41.86 | |
Income (loss) from investment operations: |
Net investment income (loss)a | | | (.74 | ) | | | (.22 | ) | | | (.20 | ) | | | (.27 | ) | | | (.40 | ) |
Net gain (loss) on investments (realized and unrealized) | | | 46.52 | | | | (11.16 | ) | | | 5.58 | | | | 8.88 | | | | 9.79 | |
Total from investment operations | | | 45.78 | | | | (11.38 | ) | | | 5.38 | | | | 8.61 | | | | 9.39 | |
Less distributions from: |
Net investment income | | | (.59 | ) | | | — | | | | — | | | | (.02 | ) | | | (.02 | ) |
Net realized gains | | | — | | | | — | | | | — | | | | (1.39 | ) | | | (.66 | ) |
Total distributions | | | (.59 | ) | | | — | | | | — | | | | (1.41 | ) | | | (.68 | ) |
Net asset value, end of period | | $ | 96.96 | | | $ | 51.77 | | | $ | 63.15 | | | $ | 57.77 | | | $ | 50.57 | |
|
Total Returnd | | | 88.56 | % | | | (18.02 | %) | | | 9.31 | % | | | 17.01 | % | | | 22.60 | % |
Ratios/Supplemental Data |
Net assets, end of period (in thousands) | | $ | 3,576 | | | $ | 3,333 | | | $ | 4,165 | | | $ | 9,952 | | | $ | 9,676 | |
Ratios to average net assets: |
Net investment income (loss) | | | (0.97 | %) | | | (0.32 | %) | | | (0.33 | %) | | | (0.48 | %) | | | (0.89 | %) |
Total expensesb | | | 2.35 | % | | | 2.38 | % | | | 2.35 | % | | | 2.28 | % | | | 2.27 | % |
Net expenses c | | | 2.33 | % | | | 2.37 | % | | | 2.35 | % | | | 2.28 | % | | | 2.27 | % |
Portfolio turnover rate | | | 785 | % | | | 690 | % | | | 1,078 | % | | | 2,067 | % | | | 1,288 | % |
26 | THE RYDEX FUNDS ANNUAL REPORT | SEE NOTES TO FINANCIAL STATEMENTS. |
FINANCIAL HIGHLIGHTS (concluded) |
This table is presented to show selected data for a share outstanding throughout each period and to assist shareholders in evaluating a Fund’s performance for the periods presented.
H-Class | | Year Ended
March 31,
2021 | | | Year Ended
March 31,
2020 | | | Year Ended
March 31,
2019 | | | Year Ended
March 29,
2018 | | | Year Ended
March 31,
2017 | |
Per Share Data |
Net asset value, beginning of period | | $ | 58.94 | | | $ | 71.35 | | | $ | 64.80 | | | $ | 56.15 | | | $ | 46.06 | |
Income (loss) from investment operations: |
Net investment income (loss)a | | | (.18 | ) | | | .36 | | | | .30 | | | | .19 | | | | (.07 | ) |
Net gain (loss) on investments (realized and unrealized) | | | 53.17 | | | | (12.77 | ) | | | 6.25 | | | | 9.87 | | | | 10.84 | |
Total from investment operations | | | 52.99 | | | | (12.41 | ) | | | 6.55 | | | | 10.06 | | | | 10.77 | |
Less distributions from: |
Net investment income | | | (.59 | ) | | | — | | | | — | | | | (.02 | ) | | | (.02 | ) |
Net realized gains | | | — | | | | — | | | | — | | | | (1.39 | ) | | | (.66 | ) |
Total distributions | | | (.59 | ) | | | — | | | | — | | | | (1.41 | ) | | | (.68 | ) |
Net asset value, end of period | | $ | 111.34 | | | $ | 58.94 | | | $ | 71.35 | | | $ | 64.80 | | | $ | 56.15 | |
|
Total Return | | | 90.03 | % | | | (17.39 | %) | | | 10.11 | % | | | 17.88 | % | | | 23.56 | % |
Ratios/Supplemental Data |
Net assets, end of period (in thousands) | | $ | 53,660 | | | $ | 4,057 | | | $ | 49,090 | | | $ | 28,985 | | | $ | 17,716 | |
Ratios to average net assets: |
Net investment income (loss) | | | (0.20 | %) | | | 0.46 | % | | | 0.44 | % | | | 0.30 | % | | | (0.15 | %) |
Total expensesb | | | 1.59 | % | | | 1.62 | % | | | 1.61 | % | | | 1.52 | % | | | 1.52 | % |
Net expenses c | | | 1.58 | % | | | 1.61 | % | | | 1.61 | % | | | 1.52 | % | | | 1.52 | % |
Portfolio turnover rate | | | 785 | % | | | 690 | % | | | 1,078 | % | | | 2,067 | % | | | 1,288 | % |
a | Net investment income (loss) per share was computed using average shares outstanding throughout the period. |
b | Does not include expenses of the underlying funds in which the Fund invests. |
c | Net expense information reflects the expense ratios after expense waivers and reimbursements, as applicable. |
d | Total return does not reflect the impact of any applicable sales charges. |
SEE NOTES TO FINANCIAL STATEMENTS. | THE RYDEX FUNDS ANNUAL REPORT | 27 |
PERFORMANCE REPORT AND FUND PROFILE (Unaudited) | March 31, 2021 |
S&P 500® FUND
OBJECTIVE: Seeks to provide investment results that match, before fees and expenses, the performance of a specific benchmark on a daily basis. The Fund’s current benchmark is the S&P 500® Index (the “underlying index”).
For the one-year period ended March 31, 2021, S&P 500® Fund maintained a daily correlation of over 99% to its benchmark of the daily price movement of the S&P 500 Index.
S&P 500® Fund H-Class returned 53.64%, while the S&P 500 Index returned 56.35%.
All sectors contributed to the return of the underlying index for the period, led by Information Technology, Consumer Discretionary, and Financials.
The holdings contributing the most to the return of the underlying index were Apple, Inc., Microsoft Corp., and Amazon.com, Inc. The holdings detracting the most were Gilead Sciences, Inc. and Biogen, Inc.
Derivatives in the Fund were used to help provide exposure to the composition of the benchmark in the most efficient manner possible and not for hedging purposes. Derivatives performed as expected.
Performance displayed represents past performance, which is no guarantee of future results.
Holdings Diversification (Market Exposure as % of Net Assets)
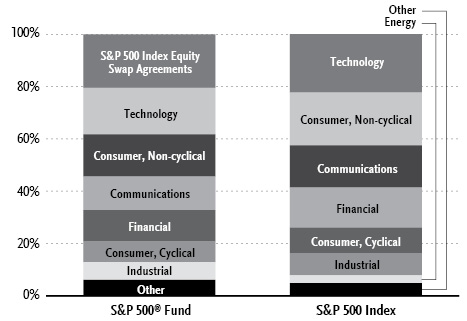
“Holdings Diversification (Market Exposure as % of Net Assets)” excludes any temporary cash investments.
Inception Dates: |
A-Class | May 31, 2006 |
C-Class | May 31, 2006 |
H-Class | May 31, 2006 |
Ten Largest Holdings (% of Total Net Assets) |
Apple, Inc. | 4.6% |
Microsoft Corp. | 4.2% |
Amazon.com, Inc. | 3.1% |
Facebook, Inc. — Class A | 1.7% |
Alphabet, Inc. — Class A | 1.5% |
Alphabet, Inc. — Class C | 1.4% |
Tesla, Inc. | 1.2% |
Berkshire Hathaway, Inc. — Class B | 1.2% |
JPMorgan Chase & Co. | 1.1% |
Johnson & Johnson | 1.0% |
Top Ten Total | 21.0% |
| | |
“Ten Largest Holdings” excludes any temporary cash or derivative investments. |
28 | THE RYDEX FUNDS ANNUAL REPORT | |
PERFORMANCE REPORT AND FUND PROFILE (Unaudited)(concluded) | March 31, 2021 |
Cumulative Fund Performance*
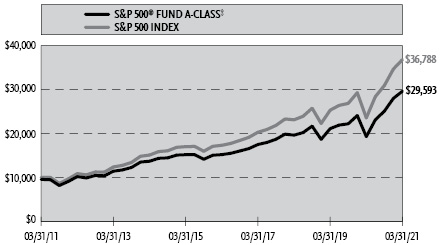
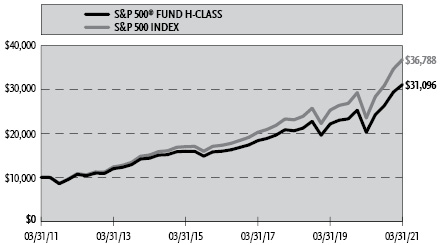
Average Annual Returns*
Periods Ended March 31, 2021
| 1 Year | 5 Year | 10 Year |
A-Class Shares | 53.64% | 14.29% | 12.00% |
A-Class Shares with sales charge‡ | 46.33% | 13.18% | 11.46% |
C-Class Shares | 52.49% | 13.44% | 11.16% |
C-Class Shares with CDSC§ | 51.49% | 13.44% | 11.16% |
H-Class Shares | 53.64% | 14.30% | 12.01% |
S&P 500 Index | 56.35% | 16.29% | 13.91% |
* | The performance data above represents past performance that is not predictive of future results. The investment return and principal value of an investment in the Fund will fluctuate so that an investor’s shares, when redeemed, may be worth more or less than their original cost. Returns are historical and include changes in principal and reinvested dividends and capital gains and do not reflect the effect of taxes. The S&P 500 Index is an unmanaged index and, unlike the Fund, has no management fees or operating expenses to reduce its reported return. The graphs are based on A-Class shares and H-Class shares only; performance for C-Class shares will vary due to differences in fees structures. |
‡ | Fund returns are calculated using the maximum sales charge of 4.75%. |
§ | Fund returns include a CDSC of 1% if redeemed within 12 months of purchase. |
| | THE RYDEX FUNDS ANNUAL REPORT | 29 |
SCHEDULE OF INVESTMENTS | March 31, 2021 |
S&P 500® FUND | |
| | Shares | | | Value | |
COMMON STOCKS† - 79.5% |
| | | | | | | | | |
Technology - 17.8% |
Apple, Inc. | | | 57,568 | | | $ | 7,031,931 | |
Microsoft Corp. | | | 27,513 | | | | 6,486,740 | |
NVIDIA Corp. | | | 2,262 | | | | 1,207,750 | |
Intel Corp. | | | 14,821 | | | | 948,544 | |
Adobe, Inc.* | | | 1,749 | | | | 831,422 | |
salesforce.com, Inc.* | | | 3,348 | | | | 709,341 | |
Broadcom, Inc. | | | 1,489 | | | | 690,390 | |
Accenture plc — Class A | | | 2,314 | | | | 639,242 | |
Texas Instruments, Inc. | | | 3,357 | | | | 634,439 | |
QUALCOMM, Inc. | | | 4,144 | | | | 549,453 | |
Oracle Corp. | | | 6,766 | | | | 474,770 | |
Applied Materials, Inc. | | | 3,348 | | | | 447,293 | |
International Business Machines Corp. | | | 3,260 | | | | 434,428 | |
Intuit, Inc. | | | 999 | | | | 382,677 | |
Micron Technology, Inc.* | | | 4,081 | | | | 359,985 | |
ServiceNow, Inc.* | | | 715 | | | | 357,579 | |
Advanced Micro Devices, Inc.* | | | 4,421 | | | | 347,049 | |
Fidelity National Information Services, Inc. | | | 2,266 | | | | 318,622 | |
Lam Research Corp. | | | 521 | | | | 310,120 | |
Activision Blizzard, Inc. | | | 2,826 | | | | 262,818 | |
Fiserv, Inc.* | | | 2,100 | | | | 249,984 | |
Autodesk, Inc.* | | | 802 | | | | 222,274 | |
Analog Devices, Inc. | | | 1,346 | | | | 208,738 | |
NXP Semiconductor N.V. | | | 1,010 | | | | 203,353 | |
KLA Corp. | | | 562 | | | | 185,685 | |
Roper Technologies, Inc. | | | 383 | | | | 154,479 | |
Microchip Technology, Inc. | | | 982 | | | | 152,426 | |
Cognizant Technology Solutions Corp. — Class A | | | 1,936 | | | | 151,240 | |
HP, Inc. | | | 4,569 | | | | 145,066 | |
Electronic Arts, Inc. | | | 1,049 | | | | 142,003 | |
Cadence Design Systems, Inc.* | | | 1,018 | | | | 139,456 | |
Synopsys, Inc.* | | | 556 | | | | 137,766 | |
MSCI, Inc. — Class A | | | 301 | | | | 126,203 | |
Paychex, Inc. | | | 1,171 | | | | 114,781 | |
Xilinx, Inc. | | | 897 | | | | 111,138 | |
Skyworks Solutions, Inc. | | | 602 | | | | 110,455 | |
ANSYS, Inc.* | | | 316 | | | | 107,301 | |
Zebra Technologies Corp. — Class A* | | | 195 | | | | 94,610 | |
Fortinet, Inc.* | | | 494 | | | | 91,103 | |
Maxim Integrated Products, Inc. | | | 978 | | | | 89,360 | |
Cerner Corp. | | | 1,117 | | | | 80,290 | |
Qorvo, Inc.* | | | 413 | | | | 75,455 | |
Hewlett Packard Enterprise Co. | | | 4,746 | | | | 74,702 | |
Western Digital Corp. | | | 1,117 | | | | 74,560 | |
Take-Two Interactive Software, Inc.* | | | 420 | | | | 74,214 | |
Teradyne, Inc. | | | 608 | | | | 73,981 | |
Paycom Software, Inc.* | | | 179 | | | | 66,241 | |
Broadridge Financial Solutions, Inc. | | | 422 | | | | 64,608 | |
Citrix Systems, Inc. | | | 449 | | | | 63,022 | |
Tyler Technologies, Inc.* | | | 148 | | | | 62,831 | |
Akamai Technologies, Inc.* | | | 595 | | | | 60,631 | |
NetApp, Inc. | | | 812 | | | | 59,008 | |
Seagate Technology plc | | | 733 | | | | 56,258 | |
Monolithic Power Systems, Inc. | | | 156 | | | | 55,101 | |
Leidos Holdings, Inc. | | | 487 | | | | 46,888 | |
Jack Henry & Associates, Inc. | | | 278 | | | | 42,178 | |
DXC Technology Co.* | | | 929 | | | | 29,041 | |
IPG Photonics Corp.* | | | 131 | | | | 27,633 | |
Total Technology | | | | | | | 27,448,656 | |
| | | | | | | | | |
Consumer, Non-cyclical - 16.1% |
Johnson & Johnson | | | 9,589 | | | | 1,575,952 | |
UnitedHealth Group, Inc. | | | 3,448 | | | | 1,282,897 | |
Procter & Gamble Co. | | | 8,983 | | | | 1,216,568 | |
PayPal Holdings, Inc.* | | | 4,272 | | | | 1,037,412 | |
Abbott Laboratories | | | 6,462 | | | | 774,406 | |
Coca-Cola Co. | | | 14,148 | | | | 745,741 | |
Pfizer, Inc. | | | 20,347 | | | | 737,172 | |
PepsiCo, Inc. | | | 5,033 | | | | 711,918 | |
Merck & Company, Inc. | | | 9,230 | | | | 711,541 | |
AbbVie, Inc. | | | 6,442 | | | | 697,153 | |
Thermo Fisher Scientific, Inc. | | | 1,437 | | | | 655,818 | |
Medtronic plc | | | 4,918 | | | | 580,963 | |
Eli Lilly & Co. | | | 2,902 | | | | 542,152 | |
Amgen, Inc. | | | 2,107 | | | | 524,242 | |
Danaher Corp. | | | 2,312 | | | | 520,385 | |
Bristol-Myers Squibb Co. | | | 8,173 | | | | 515,962 | |
Philip Morris International, Inc. | | | 5,681 | | | | 504,132 | |
CVS Health Corp. | | | 4,784 | | | | 359,900 | |
Altria Group, Inc. | | | 6,780 | | | | 346,865 | |
Anthem, Inc. | | | 893 | | | | 320,542 | |
Intuitive Surgical, Inc.* | | | 429 | | | | 317,005 | |
Cigna Corp. | | | 1,283 | | | | 310,152 | |
S&P Global, Inc. | | | 878 | | | | 309,820 | |
Mondelez International, Inc. — Class A | | | 5,151 | | | | 301,488 | |
Gilead Sciences, Inc. | | | 4,584 | | | | 296,264 | |
Automatic Data Processing, Inc. | | | 1,561 | | | | 294,202 | |
Stryker Corp. | | | 1,194 | | | | 290,835 | |
Zoetis, Inc. | | | 1,733 | | | | 272,913 | |
Becton Dickinson and Co. | | | 1,060 | | | | 257,739 | |
Colgate-Palmolive Co. | | | 3,095 | | | | 243,979 | |
Estee Lauder Companies, Inc. — Class A | | | 838 | | | | 243,732 | |
Global Payments, Inc. | | | 1,077 | | | | 217,102 | |
Illumina, Inc.* | | | 532 | | | | 204,320 | |
Vertex Pharmaceuticals, Inc.* | | | 948 | | | | 203,716 | |
Boston Scientific Corp.* | | | 5,170 | | | | 199,820 | |
Humana, Inc. | | | 470 | | | | 197,047 | |
Edwards Lifesciences Corp.* | | | 2,278 | | | | 190,532 | |
HCA Healthcare, Inc. | | | 967 | | | | 182,125 | |
Regeneron Pharmaceuticals, Inc.* | | | 384 | | | | 181,686 | |
Moody’s Corp. | | | 587 | | | | 175,284 | |
Kimberly-Clark Corp. | | | 1,233 | | | | 171,448 | |
Biogen, Inc.* | | | 556 | | | | 155,541 | |
Baxter International, Inc. | | | 1,843 | | | | 155,439 | |
IDEXX Laboratories, Inc.* | | | 312 | | | | 152,665 | |
Sysco Corp. | | | 1,862 | | | | 146,614 | |
Align Technology, Inc.* | | | 263 | | | | 142,422 | |
Constellation Brands, Inc. — Class A | | | 620 | | | | 141,360 | |
General Mills, Inc. | | | 2,230 | | | | 136,744 | |
Centene Corp.* | | | 2,122 | | | | 135,617 | |
30 | THE RYDEX FUNDS ANNUAL REPORT | SEE NOTES TO FINANCIAL STATEMENTS. |
SCHEDULE OF INVESTMENTS (continued) | March 31, 2021 |
S&P 500® FUND | |
| | Shares | | | Value | |
IQVIA Holdings, Inc.* | | | 698 | | | $ | 134,812 | |
IHS Markit Ltd. | | | 1,360 | | | | 131,621 | |
Corteva, Inc. | | | 2,714 | | | | 126,527 | |
DexCom, Inc.* | | | 351 | | | | 126,146 | |
Monster Beverage Corp.* | | | 1,349 | | | | 122,880 | |
Alexion Pharmaceuticals, Inc.* | | | 802 | | | | 122,634 | |
Zimmer Biomet Holdings, Inc. | | | 758 | | | | 121,341 | |
Archer-Daniels-Midland Co. | | | 2,037 | | | | 116,109 | |
McKesson Corp. | | | 580 | | | | 113,123 | |
Cintas Corp. | | | 322 | | | | 109,902 | |
Verisk Analytics, Inc. — Class A | | | 594 | | | | 104,954 | |
ResMed, Inc. | | | 531 | | | | 103,025 | |
Kroger Co. | | | 2,777 | | | | 99,944 | |
Kraft Heinz Co. | | | 2,365 | | | | 94,600 | |
Laboratory Corporation of America Holdings* | | | 356 | | | | 90,791 | |
Clorox Co. | | | 459 | | | | 88,532 | |
United Rentals, Inc.* | | | 263 | | | | 86,608 | |
Hershey Co. | | | 535 | | | | 84,616 | |
FleetCor Technologies, Inc.* | | | 304 | | | | 81,663 | |
McCormick & Company, Inc. | | | 908 | | | | 80,957 | |
Equifax, Inc. | | | 444 | | | | 80,422 | |
Tyson Foods, Inc. — Class A | | | 1,075 | | | | 79,872 | |
Church & Dwight Company, Inc. | | | 894 | | | | 78,091 | |
West Pharmaceutical Services, Inc. | | | 270 | | | | 76,081 | |
Teleflex, Inc. | | | 170 | | | | 70,628 | |
Hologic, Inc.* | | | 940 | | | | 69,917 | |
MarketAxess Holdings, Inc. | | | 139 | | | | 69,211 | |
Cooper Companies, Inc. | | | 179 | | | | 68,752 | |
Conagra Brands, Inc. | | | 1,782 | | | | 67,003 | |
Catalent, Inc.* | | | 621 | | | | 65,397 | |
Cardinal Health, Inc. | | | 1,071 | | | | 65,063 | |
AmerisourceBergen Corp. — Class A | | | 538 | | | | 63,522 | |
Quest Diagnostics, Inc. | | | 487 | | | | 62,502 | |
Viatris, Inc.* | | | 4,403 | | | | 61,510 | |
STERIS plc | | | 311 | | | | 59,239 | |
Gartner, Inc.* | | | 324 | | | | 59,146 | |
Varian Medical Systems, Inc.* | | | 335 | | | | 59,138 | |
Kellogg Co. | | | 928 | | | | 58,742 | |
Avery Dennison Corp. | | | 303 | | | | 55,646 | |
Incyte Corp.* | | | 682 | | | | 55,426 | |
ABIOMED, Inc.* | | | 165 | | | | 52,590 | |
PerkinElmer, Inc. | | | 409 | | | | 52,471 | |
Dentsply Sirona, Inc. | | | 799 | | | | 50,984 | |
J M Smucker Co. | | | 400 | | | | 50,612 | |
Hormel Foods Corp. | | | 1,025 | | | | 48,975 | |
Brown-Forman Corp. — Class B | | | 666 | | | | 45,934 | |
Bio-Rad Laboratories, Inc. — Class A* | | | 79 | | | | 45,122 | |
Quanta Services, Inc. | | | 505 | | | | 44,430 | |
Lamb Weston Holdings, Inc. | | | 534 | | | | 41,374 | |
Universal Health Services, Inc. — Class B | | | 284 | | | | 37,883 | |
Campbell Soup Co. | | | 740 | | | | 37,200 | |
Henry Schein, Inc.* | | | 520 | | | | 36,005 | |
Molson Coors Beverage Co. — Class B* | | | 687 | | | | 35,140 | |
Nielsen Holdings plc | | | 1,305 | | | | 32,821 | |
Robert Half International, Inc. | | | 413 | | | | 32,243 | |
DaVita, Inc.* | | | 263 | | | | 28,344 | |
Rollins, Inc. | | | 808 | | | | 27,811 | |
Perrigo Company plc | | | 486 | | | | 19,668 | |
Total Consumer, Non-cyclical | | | | | | | 24,775,032 | |
| | | | | | | | | |
Communications - 12.8% |
Amazon.com, Inc.* | | | 1,561 | | | | 4,829,859 | |
Facebook, Inc. — Class A* | | | 8,775 | | | | 2,584,501 | |
Alphabet, Inc. — Class A* | | | 1,097 | | | | 2,262,584 | |
Alphabet, Inc. — Class C* | | | 1,051 | | | | 2,174,130 | |
Walt Disney Co.* | | | 6,622 | | | | 1,221,891 | |
Comcast Corp. — Class A | | | 16,675 | | | | 902,284 | |
Verizon Communications, Inc. | | | 15,095 | | | | 877,774 | |
Netflix, Inc.* | | | 1,616 | | | | 843,003 | |
Cisco Systems, Inc. | | | 15,401 | | | | 796,386 | |
AT&T, Inc. | | | 26,016 | | | | 787,504 | |
Booking Holdings, Inc.* | | | 149 | | | | 347,146 | |
Charter Communications, Inc. — Class A* | | | 516 | | | | 318,382 | |
T-Mobile US, Inc.* | | | 2,131 | | | | 266,993 | |
Twitter, Inc.* | | | 2,912 | | | | 185,291 | |
eBay, Inc. | | | 2,358 | | | | 144,404 | |
Corning, Inc. | | | 2,803 | | | | 121,959 | |
Motorola Solutions, Inc. | | | 617 | | | | 116,027 | |
ViacomCBS, Inc. — Class B | | | 2,143 | | | | 96,649 | |
Etsy, Inc.* | | | 460 | | | | 92,768 | |
Expedia Group, Inc.* | | | 505 | | | | 86,921 | |
CDW Corp. | | | 514 | | | | 85,195 | |
VeriSign, Inc.* | | | 363 | | | | 72,150 | |
Arista Networks, Inc.* | | | 200 | | | | 60,378 | |
Omnicom Group, Inc. | | | 784 | | | | 58,134 | |
Lumen Technologies, Inc. | | | 3,601 | | | | 48,073 | |
F5 Networks, Inc.* | | | 225 | | | | 46,939 | |
NortonLifeLock, Inc. | | | 2,123 | | | | 45,135 | |
Fox Corp. — Class A | | | 1,220 | | | | 44,054 | |
Interpublic Group of Companies, Inc. | | | 1,425 | | | | 41,610 | |
Discovery, Inc. — Class C* | | | 1,057 | | | | 38,993 | |
News Corp. — Class A | | | 1,427 | | | | 36,289 | |
DISH Network Corp. — Class A* | | | 903 | | | | 32,689 | |
Juniper Networks, Inc. | | | 1,197 | | | | 30,320 | |
Discovery, Inc. — Class A*,1 | | | 593 | | | | 25,772 | |
Fox Corp. — Class B | | | 561 | | | | 19,596 | |
News Corp. — Class B | | | 444 | | | | 10,416 | |
Total Communications | | | | | | | 19,752,199 | |
| | | | | | | | | |
Financial - 12.1% |
Berkshire Hathaway, Inc. — Class B* | | | 6,955 | | | | 1,776,794 | |
JPMorgan Chase & Co. | | | 11,132 | | | | 1,694,624 | |
Visa, Inc. — Class A | | | 6,187 | | | | 1,309,974 | |
Mastercard, Inc. — Class A | | | 3,198 | | | | 1,138,648 | |
Bank of America Corp. | | | 27,714 | | | | 1,072,255 | |
Wells Fargo & Co. | | | 15,081 | | | | 589,215 | |
Citigroup, Inc. | | | 7,614 | | | | 553,918 | |
Morgan Stanley | | | 5,474 | | | | 425,111 | |
Goldman Sachs Group, Inc. | | | 1,255 | | | | 410,385 | |
BlackRock, Inc. — Class A | | | 518 | | | | 390,551 | |
American Tower Corp. — Class A REIT | | | 1,621 | | | | 387,516 | |
Charles Schwab Corp. | | | 5,459 | | | | 355,818 | |
SEE NOTES TO FINANCIAL STATEMENTS. | THE RYDEX FUNDS ANNUAL REPORT | 31 |
SCHEDULE OF INVESTMENTS (continued) | March 31, 2021 |
S&P 500® FUND | |
| | Shares | | | Value | |
American Express Co. | | | 2,380 | | | $ | 336,627 | |
Truist Financial Corp. | | | 4,914 | | | | 286,584 | |
Prologis, Inc. REIT | | | 2,698 | | | | 285,988 | |
U.S. Bancorp | | | 4,986 | | | | 275,776 | |
PNC Financial Services Group, Inc. | | | 1,547 | | | | 271,359 | |
Crown Castle International Corp. REIT | | | 1,573 | | | | 270,761 | |
CME Group, Inc. — Class A | | | 1,310 | | | | 267,541 | |
Chubb Ltd. | | | 1,642 | | | | 259,387 | |
Intercontinental Exchange, Inc. | | | 2,049 | | | | 228,832 | |
Marsh & McLennan Companies, Inc. | | | 1,854 | | | | 225,817 | |
Equinix, Inc. REIT | | | 326 | | | | 221,546 | |
Capital One Financial Corp. | | | 1,675 | | | | 213,110 | |
Progressive Corp. | | | 2,137 | | | | 204,319 | |
Aon plc — Class A | | | 824 | | | | 189,611 | |
MetLife, Inc. | | | 2,742 | | | | 166,686 | |
American International Group, Inc. | | | 3,155 | | | | 145,792 | |
Digital Realty Trust, Inc. REIT | | | 1,025 | | | | 144,361 | |
T. Rowe Price Group, Inc. | | | 832 | | | | 142,771 | |
Bank of New York Mellon Corp. | | | 2,943 | | | | 139,174 | |
Travelers Companies, Inc. | | | 920 | | | | 138,368 | |
Public Storage REIT | | | 555 | | | | 136,952 | |
Simon Property Group, Inc. REIT | | | 1,198 | | | | 136,296 | |
Prudential Financial, Inc. | | | 1,448 | | | | 131,913 | |
Allstate Corp. | | | 1,105 | | | | 126,964 | |
Aflac, Inc. | | | 2,336 | | | | 119,556 | |
SBA Communications Corp. REIT | | | 399 | | | | 110,742 | |
Welltower, Inc. REIT | | | 1,523 | | | | 109,093 | |
State Street Corp. | | | 1,283 | | | | 107,785 | |
Willis Towers Watson plc | | | 470 | | | | 107,574 | |
First Republic Bank | | | 642 | | | | 107,054 | |
Discover Financial Services | | | 1,119 | | | | 106,294 | |
Ameriprise Financial, Inc. | | | 426 | | | | 99,024 | |
SVB Financial Group* | | | 197 | | | | 97,251 | |
Fifth Third Bancorp | | | 2,594 | | | | 97,145 | |
Weyerhaeuser Co. REIT | | | 2,728 | | | | 97,117 | |
CBRE Group, Inc. — Class A* | | | 1,224 | | | | 96,830 | |
AvalonBay Communities, Inc. REIT | | | 509 | | | | 93,916 | |
Equity Residential REIT | | | 1,251 | | | | 89,609 | |
Arthur J Gallagher & Co. | | | 707 | | | | 88,212 | |
Hartford Financial Services Group, Inc. | | | 1,304 | | | | 87,094 | |
Realty Income Corp. REIT | | | 1,362 | | | | 86,487 | |
Synchrony Financial | | | 1,981 | | | | 80,547 | |
Northern Trust Corp. | | | 760 | | | | 79,884 | |
Alexandria Real Estate Equities, Inc. REIT | | | 464 | | | | 76,235 | |
Ventas, Inc. REIT | | | 1,367 | | | | 72,916 | |
Regions Financial Corp. | | | 3,504 | | | | 72,393 | |
M&T Bank Corp. | | | 469 | | | | 71,105 | |
KeyCorp | | | 3,534 | | | | 70,609 | |
Citizens Financial Group, Inc. | | | 1,551 | | | | 68,477 | |
Essex Property Trust, Inc. REIT | | | 237 | | | | 64,426 | |
Extra Space Storage, Inc. REIT | | | 482 | | | | 63,889 | |
Healthpeak Properties, Inc. REIT | | | 1,965 | | | | 62,369 | |
Nasdaq, Inc. | | | 421 | | | | 62,081 | |
Mid-America Apartment Communities, Inc. REIT | | | 417 | | | | 60,198 | |
Huntington Bancshares, Inc. | | | 3,711 | | | | 58,337 | |
Duke Realty Corp. REIT | | | 1,363 | | | | 57,151 | |
Cincinnati Financial Corp. | | | 547 | | | | 56,390 | |
Principal Financial Group, Inc. | | | 925 | | | | 55,463 | |
Raymond James Financial, Inc. | | | 447 | | | | 54,784 | |
Boston Properties, Inc. REIT | | | 517 | | | | 52,351 | |
UDR, Inc. REIT | | | 1,083 | | | | 47,500 | |
Host Hotels & Resorts, Inc. REIT* | | | 2,573 | | | | 43,355 | |
Loews Corp. | | | 828 | | | | 42,460 | |
Lincoln National Corp. | | | 658 | | | | 40,974 | |
Iron Mountain, Inc. REIT | | | 1,052 | | | | 38,935 | |
Cboe Global Markets, Inc. | | | 391 | | | | 38,588 | |
W R Berkley Corp. | | | 511 | | | | 38,504 | |
Western Union Co. | | | 1,499 | | | | 36,965 | |
Comerica, Inc. | | | 508 | | | | 36,444 | |
Everest Re Group Ltd. | | | 146 | | | | 36,180 | |
Invesco Ltd. | | | 1,373 | | | | 34,627 | |
Globe Life, Inc. | | | 347 | | | | 33,531 | |
Zions Bancorp North America | | | 599 | | | | 32,921 | |
Regency Centers Corp. REIT | | | 576 | | | | 32,665 | |
Assurant, Inc. | | | 211 | | | | 29,913 | |
Kimco Realty Corp. REIT | | | 1,577 | | | | 29,569 | |
Franklin Resources, Inc. | | | 996 | | | | 29,482 | |
People’s United Financial, Inc. | | | 1,552 | | | | 27,781 | |
Vornado Realty Trust REIT | | | 572 | | | | 25,963 | |
Federal Realty Investment Trust REIT | | | 255 | | | | 25,870 | |
Unum Group | | | 743 | | | | 20,678 | |
Total Financial | | | | | | | 18,714,637 | |
| | | | | | | | | |
Consumer, Cyclical - 7.8% |
Tesla, Inc.* | | | 2,801 | | | | 1,870,872 | |
Home Depot, Inc. | | | 3,927 | | | | 1,198,717 | |
Walmart, Inc. | | | 5,057 | | | | 686,892 | |
NIKE, Inc. — Class B | | | 4,638 | | | | 616,344 | |
McDonald’s Corp. | | | 2,720 | | | | 609,661 | |
Costco Wholesale Corp. | | | 1,615 | | | | 569,255 | |
Lowe’s Companies, Inc. | | | 2,667 | | | | 507,210 | |
Starbucks Corp. | | | 4,295 | | | | 469,315 | |
Target Corp. | | | 1,827 | | | | 361,874 | |
TJX Companies, Inc. | | | 4,380 | | | | 289,737 | |
General Motors Co.* | | | 4,626 | | | | 265,810 | |
Dollar General Corp. | | | 894 | | | | 181,142 | |
Ford Motor Co.* | | | 14,255 | | | | 174,624 | |
Ross Stores, Inc. | | | 1,299 | | | | 155,763 | |
Chipotle Mexican Grill, Inc. — Class A* | | | 103 | | | | 146,345 | |
Marriott International, Inc. — Class A* | | | 970 | | | | 143,667 | |
Walgreens Boots Alliance, Inc. | | | 2,616 | | | | 143,618 | |
Cummins, Inc. | | | 540 | | | | 139,919 | |
Aptiv plc* | | | 985 | | | | 135,831 | |
Southwest Airlines Co.* | | | 2,155 | | | | 131,584 | |
O’Reilly Automotive, Inc.* | | | 256 | | | | 129,856 | |
Hilton Worldwide Holdings, Inc.* | | | 1,013 | | | | 122,492 | |
Yum! Brands, Inc. | | | 1,095 | | | | 118,457 | |
PACCAR, Inc. | | | 1,266 | | | | 117,637 | |
AutoZone, Inc.* | | | 81 | | | | 113,748 | |
Delta Air Lines, Inc.* | | | 2,328 | | | | 112,396 | |
DR Horton, Inc. | | | 1,207 | | | | 107,568 | |
Fastenal Co. | | | 2,095 | | | | 105,337 | |
32 | THE RYDEX FUNDS ANNUAL REPORT | SEE NOTES TO FINANCIAL STATEMENTS. |
SCHEDULE OF INVESTMENTS (continued) | March 31, 2021 |
S&P 500® FUND | |
| | Shares | | | Value | |
Lennar Corp. — Class A | | | 1,001 | | | $ | 101,331 | |
Dollar Tree, Inc.* | | | 858 | | | | 98,207 | |
Best Buy Company, Inc. | | | 841 | | | | 96,555 | |
VF Corp. | | | 1,172 | | | | 93,666 | |
Copart, Inc.* | | | 759 | | | | 82,435 | |
CarMax, Inc.* | | | 593 | | | | 78,667 | |
Carnival Corp.* | | | 2,910 | | | | 77,232 | |
Tractor Supply Co. | | | 424 | | | | 75,082 | |
Las Vegas Sands Corp.* | | | 1,198 | | | | 72,790 | |
Royal Caribbean Cruises Ltd.* | | | 799 | | | | 68,402 | |
Darden Restaurants, Inc. | | | 475 | | | | 67,450 | |
United Airlines Holdings, Inc.* | | | 1,162 | | | | 66,861 | |
Caesars Entertainment, Inc.* | | | 760 | | | | 66,462 | |
WW Grainger, Inc. | | | 160 | | | | 64,149 | |
Ulta Beauty, Inc.* | | | 206 | | | | 63,689 | |
NVR, Inc.* | | | 13 | | | | 61,242 | |
Genuine Parts Co. | | | 527 | | | | 60,916 | |
MGM Resorts International | | | 1,498 | | | | 56,909 | |
Penn National Gaming, Inc.* | | | 542 | | | | 56,823 | |
American Airlines Group, Inc.* | | | 2,333 | | | | 55,759 | |
L Brands, Inc.* | | | 852 | | | | 52,705 | |
Domino’s Pizza, Inc. | | | 142 | | | | 52,226 | |
PulteGroup, Inc. | | | 970 | | | | 50,867 | |
Pool Corp. | | | 147 | | | | 50,750 | |
Whirlpool Corp. | | | 229 | | | | 50,460 | |
Wynn Resorts Ltd.* | | | 384 | | | | 48,142 | |
Hasbro, Inc. | | | 466 | | | | 44,792 | |
Live Nation Entertainment, Inc.* | | | 524 | | | | 44,357 | |
Advance Auto Parts, Inc. | | | 239 | | | | 43,854 | |
LKQ Corp.* | | | 1,018 | | | | 43,092 | |
Tapestry, Inc.* | | | 1,014 | | | | 41,787 | |
Mohawk Industries, Inc.* | | | 215 | | | | 41,347 | |
BorgWarner, Inc. | | | 872 | | | | 40,426 | |
Newell Brands, Inc. | | | 1,379 | | | | 36,930 | |
Norwegian Cruise Line Holdings Ltd.*,1 | | | 1,325 | | | | 36,557 | |
Alaska Air Group, Inc.* | | | 453 | | | | 31,352 | |
PVH Corp.* | | | 259 | | | | 27,377 | |
Hanesbrands, Inc. | | | 1,272 | | | | 25,020 | |
Gap, Inc. | | | 750 | | | | 22,335 | |
Leggett & Platt, Inc. | | | 485 | | | | 22,140 | |
Ralph Lauren Corp. — Class A* | | | 176 | | | | 21,676 | |
Under Armour, Inc. — Class A* | | | 688 | | | | 15,246 | |
Under Armour, Inc. — Class C* | | | 711 | | | | 13,125 | |
Total Consumer, Cyclical | | | | | | | 12,046,861 | |
| | | | | | | | | |
Industrial - 6.8% |
Honeywell International, Inc. | | | 2,537 | | | | 550,707 | |
Union Pacific Corp. | | | 2,443 | | | | 538,462 | |
Boeing Co.* | | | 2,001 | | | | 509,695 | |
Caterpillar, Inc. | | | 1,989 | | | | 461,189 | |
United Parcel Service, Inc. — Class B | | | 2,625 | | | | 446,224 | |
Raytheon Technologies Corp. | | | 5,543 | | | | 428,308 | |
Deere & Co. | | | 1,143 | | | | 427,642 | |
General Electric Co. | | | 31,984 | | | | 419,950 | |
3M Co. | | | 2,112 | | | | 406,940 | |
Lockheed Martin Corp. | | | 899 | | | | 332,180 | |
CSX Corp. | | | 2,782 | | | | 268,240 | |
FedEx Corp. | | | 890 | | | | 252,796 | |
Norfolk Southern Corp. | | | 919 | | | | 246,770 | |
Illinois Tool Works, Inc. | | | 1,051 | | | | 232,817 | |
Eaton Corporation plc | | | 1,452 | | | | 200,783 | |
Emerson Electric Co. | | | 2,189 | | | | 197,492 | |
Waste Management, Inc. | | | 1,420 | | | | 183,208 | |
Northrop Grumman Corp. | | | 566 | | | | 183,180 | |
Johnson Controls International plc | | | 2,627 | | | | 156,753 | |
TE Connectivity Ltd. | | | 1,207 | | | | 155,836 | |
General Dynamics Corp. | | | 846 | | | | 153,600 | |
L3Harris Technologies, Inc. | | | 750 | | | | 152,010 | |
Parker-Hannifin Corp. | | | 471 | | | | 148,568 | |
Amphenol Corp. — Class A | | | 2,186 | | | | 144,210 | |
Trane Technologies plc | | | 870 | | | | 144,037 | |
Agilent Technologies, Inc. | | | 1,112 | | | | 141,380 | |
Carrier Global Corp. | | | 2,981 | | | | 125,858 | |
Stanley Black & Decker, Inc. | | | 587 | | | | 117,206 | |
TransDigm Group, Inc.* | | | 199 | | | | 116,996 | |
Rockwell Automation, Inc. | | | 424 | | | | 112,546 | |
AMETEK, Inc. | | | 841 | | | | 107,421 | |
Otis Worldwide Corp. | | | 1,487 | | | | 101,785 | |
Ball Corp. | | | 1,196 | | | | 101,349 | |
Mettler-Toledo International, Inc.* | | | 85 | | | | 98,234 | |
Keysight Technologies, Inc.* | | | 679 | | | | 97,369 | |
Kansas City Southern | | | 331 | | | | 87,358 | |
Fortive Corp. | | | 1,233 | | | | 87,099 | |
Old Dominion Freight Line, Inc. | | | 350 | | | | 84,143 | |
Vulcan Materials Co. | | | 484 | | | | 81,675 | |
Republic Services, Inc. — Class A | | | 768 | | | | 76,301 | |
Martin Marietta Materials, Inc. | | | 227 | | | | 76,231 | |
Generac Holdings, Inc.* | | | 229 | | | | 74,986 | |
Garmin Ltd. | | | 545 | | | | 71,858 | |
Dover Corp. | | | 524 | | | | 71,856 | |
Trimble, Inc.* | | | 916 | | | | 71,256 | |
Xylem, Inc. | | | 658 | | | | 69,208 | |
Ingersoll Rand, Inc.* | | | 1,360 | | | | 66,926 | |
Amcor plc | | | 5,698 | | | | 66,553 | |
Expeditors International of Washington, Inc. | | | 618 | | | | 66,552 | |
Waters Corp.* | | | 227 | | | | 64,506 | |
Jacobs Engineering Group, Inc. | | | 475 | | | | 61,403 | |
IDEX Corp. | | | 277 | | | | 57,982 | |
Masco Corp. | | | 938 | | | | 56,186 | |
Teledyne Technologies, Inc.* | | | 135 | | | | 55,843 | |
Westinghouse Air Brake Technologies Corp. | | | 648 | | | | 51,296 | |
J.B. Hunt Transport Services, Inc. | | | 305 | | | | 51,261 | |
Westrock Co. | | | 961 | | | | 50,020 | |
Fortune Brands Home & Security, Inc. | | | 506 | | | | 48,485 | |
CH Robinson Worldwide, Inc. | | | 488 | | | | 46,570 | |
Packaging Corporation of America | | | 346 | | | | 46,530 | |
Textron, Inc. | | | 828 | | | | 46,434 | |
Howmet Aerospace, Inc.* | | | 1,424 | | | | 45,753 | |
Snap-on, Inc. | | | 198 | | | | 45,687 | |
Allegion plc | | | 331 | | | | 41,580 | |
Pentair plc | | | 606 | | | | 37,766 | |
A O Smith Corp. | | | 494 | | | | 33,399 | |
SEE NOTES TO FINANCIAL STATEMENTS. | THE RYDEX FUNDS ANNUAL REPORT | 33 |
SCHEDULE OF INVESTMENTS (continued) | March 31, 2021 |
S&P 500® FUND | |
| | Shares | | | Value | |
Huntington Ingalls Industries, Inc. | | | 147 | | | $ | 30,260 | |
FLIR Systems, Inc. | | | 479 | | | | 27,049 | |
Sealed Air Corp. | | | 565 | | | | 25,888 | |
Total Industrial | | | | | | | 10,437,641 | |
| | | | | | | | | |
Energy - 2.3% |
Exxon Mobil Corp. | | | 15,443 | | | | 862,183 | |
Chevron Corp. | | | 7,027 | | | | 736,359 | |
ConocoPhillips | | | 4,942 | | | | 261,778 | |
EOG Resources, Inc. | | | 2,129 | | | | 154,416 | |
Schlumberger N.V. | | | 5,101 | | | | 138,696 | |
Phillips 66 | | | 1,593 | | | | 129,893 | |
Marathon Petroleum Corp. | | | 2,376 | | | | 127,092 | |
Pioneer Natural Resources Co. | | | 751 | | | | 119,274 | |
Kinder Morgan, Inc. | | | 7,102 | | | | 118,248 | |
Valero Energy Corp. | | | 1,490 | | | | 106,684 | |
Williams Companies, Inc. | | | 4,428 | | | | 104,900 | |
ONEOK, Inc. | | | 1,623 | | | | 82,221 | |
Occidental Petroleum Corp. | | | 3,058 | | | | 81,404 | |
Enphase Energy, Inc.* | | | 471 | | | | 76,377 | |
Hess Corp. | | | 997 | | | | 70,548 | |
Halliburton Co. | | | 3,242 | | | | 69,573 | |
Baker Hughes Co. | | | 2,659 | | | | 57,461 | |
Diamondback Energy, Inc. | | | 660 | | | | 48,503 | |
Devon Energy Corp. | | | 2,161 | | | | 47,218 | |
Marathon Oil Corp. | | | 2,880 | | | | 30,759 | |
Cabot Oil & Gas Corp. — Class A | | | 1,457 | | | | 27,363 | |
APA Corp. | | | 1,378 | | | | 24,666 | |
HollyFrontier Corp. | | | 545 | | | | 19,500 | |
NOV, Inc.* | | | 1,416 | | | | 19,428 | |
Total Energy | | | | | | | 3,514,544 | |
| | | | | | | | | |
Utilities - 2.1% |
NextEra Energy, Inc. | | | 7,149 | | | | 540,536 | |
Duke Energy Corp. | | | 2,804 | | | | 270,670 | |
Southern Co. | | | 3,854 | | | | 239,565 | |
Dominion Energy, Inc. | | | 2,939 | | | | 223,246 | |
Exelon Corp. | | | 3,562 | | | | 155,802 | |
American Electric Power Company, Inc. | | | 1,812 | | | | 153,476 | |
Sempra Energy | | | 1,104 | | | | 146,368 | |
Xcel Energy, Inc. | | | 1,961 | | | | 130,426 | |
Public Service Enterprise Group, Inc. | | | 1,843 | | | | 110,967 | |
Eversource Energy | | | 1,251 | | | | 108,324 | |
WEC Energy Group, Inc. | | | 1,151 | | | | 107,722 | |
American Water Works Company, Inc. | | | 662 | | | | 99,247 | |
DTE Energy Co. | | | 707 | | | | 94,130 | |
Consolidated Edison, Inc. | | | 1,249 | | | | 93,425 | |
Edison International | | | 1,384 | | | | 81,102 | |
PPL Corp. | | | 2,805 | | | | 80,896 | |
Ameren Corp. | | | 924 | | | | 75,177 | |
Entergy Corp. | | | 731 | | | | 72,713 | |
FirstEnergy Corp. | | | 1,982 | | | | 68,756 | |
AES Corp. | | | 2,437 | | | | 65,336 | |
CMS Energy Corp. | | | 1,054 | | | | 64,526 | |
Alliant Energy Corp. | | | 912 | | | | 49,394 | |
Evergy, Inc. | | | 828 | | | | 49,291 | |
Atmos Energy Corp. | | | 468 | | | | 46,262 | |
CenterPoint Energy, Inc. | | | 2,012 | | | | 45,572 | |
NiSource, Inc. | | | 1,429 | | | | 34,453 | |
NRG Energy, Inc. | | | 893 | | | | 33,693 | |
Pinnacle West Capital Corp. | | | 411 | | | | 33,435 | |
Total Utilities | | | | | | | 3,274,510 | |
| | | | | | | | | |
Basic Materials - 1.7% |
Linde plc | | | 1,907 | | | | 534,227 | |
Air Products and Chemicals, Inc. | | | 807 | | | | 227,041 | |
Sherwin-Williams Co. | | | 294 | | | | 216,975 | |
Ecolab, Inc. | | | 907 | | | | 194,161 | |
Newmont Corp. | | | 2,919 | | | | 175,928 | |
Freeport-McMoRan, Inc. | | | 5,320 | | | | 175,188 | |
Dow, Inc. | | | 2,718 | | | | 173,789 | |
DuPont de Nemours, Inc. | | | 1,964 | | | | 151,778 | |
PPG Industries, Inc. | | | 864 | | | | 129,825 | |
International Flavors & Fragrances, Inc. | | | 907 | | | | 126,626 | |
LyondellBasell Industries N.V. — Class A | | | 939 | | | | 97,703 | |
Nucor Corp. | | | 1,087 | | | | 87,253 | |
International Paper Co. | | | 1,434 | | | | 77,536 | |
Celanese Corp. — Class A | | | 416 | | | | 62,321 | |
Albemarle Corp. | | | 425 | | | | 62,097 | |
Eastman Chemical Co. | | | 496 | | | | 54,620 | |
FMC Corp. | | | 472 | | | | 52,208 | |
Mosaic Co. | | | 1,258 | | | | 39,765 | |
CF Industries Holdings, Inc. | | | 781 | | | | 35,442 | |
Total Basic Materials | | | | | | | 2,674,483 | |
| | | | | | | | | |
Total Common Stocks | | | | |
(Cost $84,468,825) | | | | | | | 122,638,563 | |
| | | | | | | | | |
| | | Face
Amount | | | | | |
U.S. TREASURY BILLS†† - 4.2% |
U.S. Treasury Bills |
0.01% due 04/27/212 | | $ | 5,100,000 | | | | 5,099,935 | |
0.09% due 04/01/212,3 | | | 500,000 | | | | 500,000 | |
U.S. Cash Management Bill |
0.03% due 08/03/212 | | | 900,000 | | | | 899,911 | |
Total U.S. Treasury Bills | | | | |
(Cost $6,499,893) | | | | | | | 6,499,846 | |
| | | | | | | | | |
REPURCHASE AGREEMENTS††,4 - 13.8% |
J.P. Morgan Securities LLC
issued 03/31/21 at 0.01%
due 04/01/213 | | | 11,356,244 | | | | 11,356,244 | |
Barclays Capital, Inc.
issued 03/31/21 at 0.01%
due 04/01/213 | | | 5,163,101 | | | | 5,163,101 | |
BofA Securities, Inc.
issued 03/31/21 at 0.01%
due 04/01/213 | | | 4,712,135 | | | | 4,712,135 | |
Total Repurchase Agreements | | | | |
(Cost $21,231,480) | | | | | | | 21,231,480 | |
| | | | | | | | | |
34 | THE RYDEX FUNDS ANNUAL REPORT | SEE NOTES TO FINANCIAL STATEMENTS. |
SCHEDULE OF INVESTMENTS (continued) | March 31, 2021 |
S&P 500® FUND | |
| | Shares | | | Value | |
SECURITIES LENDING COLLATERAL†,5 - 0.0% |
Money Market Fund | | | | | | | | |
First American Government Obligations Fund — Class Z, 0.03%6 | | | 41,708 | | | | 41,708 | |
Total Securities Lending Collateral | | | | |
(Cost $41,708) | | | | | | | 41,708 | |
| | | | | | | | | |
Total Investments - 97.5% | | | | |
(Cost $112,241,906) | | $ | 150,411,597 | |
Other Assets & Liabilities, net - 2.5% | | | 3,893,996 | |
Total Net Assets - 100.0% | | $ | 154,305,593 | |
Total Return Swap Agreements |
Counterparty | Index | Financing
Rate Pay | Payment
Frequency | | Maturity
Date | | | Units | | | Notional
Amount | | | Value and
Unrealized
Appreciation | |
OTC Equity Index Swap Agreements†† |
Goldman Sachs International | S&P 500 Index | 0.54% (1 Week USD LIBOR + 0.45%) | At Maturity | | | 04/08/21 | | | | 4,576 | | | $ | 18,178,343 | | | $ | 24,350 | |
BNP Paribas | S&P 500 Index | 0.66% (1 Month USD LIBOR + 0.55%) | At Maturity | | | 04/08/21 | | | | 251 | | | | 997,152 | | | | 10,430 | |
Barclays Bank plc | S&P 500 Index | 0.54% (1 Week USD LIBOR + 0.45%) | At Maturity | | | 04/07/21 | | | | 3,133 | | | | 12,446,419 | | | | 7,786 | |
| | | | | | | | | | | | | | $ | 31,621,914 | | | $ | 42,566 | |
* | Non-income producing security. |
† | Value determined based on Level 1 inputs — See Note 4. |
†† | Value determined based on Level 2 inputs — See Note 4. |
1 | All or a portion of this security is on loan at March 31, 2021 — See Note 7. |
2 | Rate indicated is the effective yield at the time of purchase. |
3 | All or a portion of this security is pledged as equity index swap collateral at March 31, 2021. |
4 | Repurchase Agreements — See Note 6. |
5 | Securities lending collateral — See Note 7. |
6 | Rate indicated is the 7-day yield as of March 31, 2021. |
| | LIBOR — London Interbank Offered Rate |
| | plc — Public Limited Company |
| | REIT — Real Estate Investment Trust |
| | |
| | See Sector Classification in Other Information section. |
SEE NOTES TO FINANCIAL STATEMENTS. | THE RYDEX FUNDS ANNUAL REPORT | 35 |
SCHEDULE OF INVESTMENTS (concluded) | March 31, 2021 |
S&P 500® FUND | |
The following table summarizes the inputs used to value the Fund’s investments at March 31, 2021 (See Note 4 in the Notes to Financial Statements):
Investments in Securities (Assets) | | Level 1
Quoted
Prices | | | Level 2
Significant
Observable
Inputs | | | Level 3
Significant
Unobservable
Inputs | | | Total | |
Common Stocks | | $ | 122,638,563 | | | $ | — | | | $ | — | | | $ | 122,638,563 | |
U.S. Treasury Bills | | | — | | | | 6,499,846 | | | | — | | | | 6,499,846 | |
Repurchase Agreements | | | — | | | | 21,231,480 | | | | — | | | | 21,231,480 | |
Securities Lending Collateral | | | 41,708 | | | | — | | | | — | | | | 41,708 | |
Equity Index Swap Agreements** | | | — | | | | 42,566 | | | | — | | | | 42,566 | |
Total Assets | | $ | 122,680,271 | | | $ | 27,773,892 | | | $ | — | | | $ | 150,454,163 | |
** | This derivative is reported as unrealized appreciation/depreciation at period end. |
36 | THE RYDEX FUNDS ANNUAL REPORT | SEE NOTES TO FINANCIAL STATEMENTS. |
STATEMENT OF ASSETS AND LIABILITIES |
March 31, 2021 |
Assets: |
Investments, at value - including $41,120 of securities loaned (cost $91,010,426) | | $ | 129,180,117 | |
Repurchase agreements, at value (cost $21,231,480) | | | 21,231,480 | |
Cash | | | 7,069 | |
Segregated cash with broker | | | 160,000 | |
Unrealized appreciation on OTC swap agreements | | | 42,566 | |
Receivables: |
Fund shares sold | | | 4,999,377 | |
Dividends | | | 94,980 | |
Swap settlement | | | 36,383 | |
Variation margin on futures contracts | | | 4,788 | |
Securities lending income | | | 4 | |
Interest | | | 4 | |
Total assets | | | 155,756,768 | |
| | | | | |
Liabilities: |
Payable for: |
Securities purchased | | | 899,911 | |
Fund shares redeemed | | | 139,624 | |
Management fees | | | 98,361 | |
Return of securities lending collateral | | | 41,708 | |
Distribution and service fees | | | 40,657 | |
Transfer agent and administrative fees | | | 35,279 | |
Portfolio accounting fees | | | 19,672 | |
Trustees’ fees* | | | 2,408 | |
Miscellaneous | | | 173,555 | |
Total liabilities | | | 1,451,175 | |
Commitments and contingent liabilities (Note 12) | | | — | |
Net assets | | $ | 154,305,593 | |
| | | | | |
Net assets consist of: |
Paid in capital | | $ | 130,922,288 | |
Total distributable earnings (loss) | | | 23,383,305 | |
Net assets | | $ | 154,305,593 | |
| | | | | |
A-Class: |
Net assets | | $ | 18,653,165 | |
Capital shares outstanding | | | 295,777 | |
Net asset value per share | | $ | 63.06 | |
Maximum offering price per share (Net asset value divided by 95.25%) | | $ | 66.20 | |
| | | | | |
C-Class: |
Net assets | | $ | 12,039,796 | |
Capital shares outstanding | | | 220,828 | |
Net asset value per share | | $ | 54.52 | |
| | | | | |
H-Class: |
Net assets | | $ | 123,612,632 | |
Capital shares outstanding | | | 1,960,030 | |
Net asset value per share | | $ | 63.07 | |
STATEMENT OF OPERATIONS |
Year Ended March 31, 2021 |
Investment Income: |
Dividends | | $ | 2,335,476 | |
Interest | | | 8,532 | |
Income from securities lending, net | | | 1,074 | |
Total investment income | | | 2,345,082 | |
| | | | | |
Expenses: |
Management fees | | | 1,158,635 | |
Distribution and service fees: |
A-Class | | | 42,281 | |
C-Class | | | 113,638 | |
H-Class | | | 315,522 | |
Transfer agent and administrative fees | | | 432,296 | |
Portfolio accounting fees | | | 231,706 | |
Professional fees | | | 70,728 | |
Trustees’ fees* | | | 30,599 | |
Custodian fees | | | 22,462 | |
Interest expense | | | 13 | |
Miscellaneous | | | 213,943 | |
Total expenses | | | 2,631,823 | |
Net investment loss | | | (286,741 | ) |
| | | | | |
Net Realized and Unrealized Gain (Loss): |
Net realized gain (loss) on: |
Investments | | | 23,842,043 | |
Swap agreements | | | 2,625,337 | |
Futures contracts | | | 2,389,472 | |
Net realized gain | | | 28,856,852 | |
Net change in unrealized appreciation (depreciation) on: |
Investments | | | 28,649,981 | |
Swap agreements | | | 681,773 | |
Futures contracts | | | (794,086 | ) |
Net change in unrealized appreciation (depreciation) | | | 28,537,668 | |
Net realized and unrealized gain | | | 57,394,520 | |
Net increase in net assets resulting from operations | | $ | 57,107,779 | |
* | Relates to Trustees not deemed “interested persons” within the meaning of Section 2(a)(19) of the 1940 Act. |
SEE NOTES TO FINANCIAL STATEMENTS. | THE RYDEX FUNDS ANNUAL REPORT | 37 |
STATEMENTS OF CHANGES IN NET ASSETS |
| | Year Ended
March 31,
2021 | | | Year Ended
March 31,
2020 | |
Increase (Decrease) in Net Assets from Operations: | | | | | | | | |
Net investment income (loss) | | $ | (286,741 | ) | | $ | 303,913 | |
Net realized gain on investments | | | 28,856,852 | | | | 28,531,508 | |
Net change in unrealized appreciation (depreciation) on investments | | | 28,537,668 | | | | (30,796,646 | ) |
Net increase (decrease) in net assets resulting from operations | | | 57,107,779 | | | | (1,961,225 | ) |
| | | | | | | | | |
Distributions to shareholders: | | | | | | | | |
A-Class | | | (2,097,148 | ) | | | (170,248 | ) |
C-Class | | | (1,988,516 | ) | | | (224,547 | ) |
H-Class | | | (17,353,786 | ) | | | (1,236,817 | ) |
Total distributions to shareholders | | | (21,439,450 | ) | | | (1,631,612 | ) |
| | | | | | | | | |
Capital share transactions: | | | | | | | | |
Proceeds from sale of shares | | | | | | | | |
A-Class | | | 81,748,960 | | | | 87,906,591 | |
C-Class | | | 10,752,839 | | | | 29,691,610 | |
H-Class | | | 770,668,766 | | | | 769,142,083 | |
Distributions reinvested | | | | | | | | |
A-Class | | | 2,020,425 | | | | 161,590 | |
C-Class | | | 1,870,486 | | | | 215,561 | |
H-Class | | | 17,262,763 | | | | 1,225,304 | |
Cost of shares redeemed | | | | | | | | |
A-Class | | | (82,637,657 | ) | | | (95,911,253 | ) |
C-Class | | | (12,101,344 | ) | | | (34,726,021 | ) |
H-Class | | | (805,526,433 | ) | | | (774,454,754 | ) |
Net decrease from capital share transactions | | | (15,941,195 | ) | | | (16,749,289 | ) |
Net increase (decrease) in net assets | | | 19,727,134 | | | | (20,342,126 | ) |
| | | | | | | | | |
Net assets: | | | | | | | | |
Beginning of year | | | 134,578,459 | | | | 154,920,585 | |
End of year | | $ | 154,305,593 | | | $ | 134,578,459 | |
| | | | | | | | | |
Capital share activity: | | | | | | | | |
Shares sold | | | | | | | | |
A-Class | | | 1,376,150 | | | | 1,691,515 | |
C-Class | | | 204,841 | | | | 615,341 | |
H-Class | | | 13,337,703 | | | | 14,338,970 | |
Shares issued from reinvestment of distributions | | | | | | | | |
A-Class | | | 34,379 | | | | 2,804 | |
C-Class | | | 36,734 | | | | 4,209 | |
H-Class | | | 293,734 | | | | 21,273 | |
Shares redeemed | | | | | | | | |
A-Class | | | (1,389,174 | ) | | | (1,813,839 | ) |
C-Class | | | (237,843 | ) | | | (718,973 | ) |
H-Class | | | (14,090,159 | ) | | | (14,269,930 | ) |
Net decrease in shares | | | (433,635 | ) | | | (128,630 | ) |
38 | THE RYDEX FUNDS ANNUAL REPORT | SEE NOTES TO FINANCIAL STATEMENTS. |
This table is presented to show selected data for a share outstanding throughout each period and to assist shareholders in evaluating a Fund’s performance for the periods presented.
A-Class | | Year Ended
March 31,
2021 | | | Year Ended
March 31,
2020 | | | Year Ended
March 31,
2019 | | | Year Ended
March 29,
2018 | | | Year Ended
March 31,
2017 | |
Per Share Data |
Net asset value, beginning of period | | $ | 46.64 | | | $ | 51.55 | | | $ | 48.72 | | | $ | 45.52 | | | $ | 39.85 | |
Income (loss) from investment operations: |
Net investment income (loss)a | | | (.08 | ) | | | .17 | | | | .15 | | | | .13 | | | | .06 | |
Net gain (loss) on investments (realized and unrealized) | | | 24.50 | | | | (4.54 | ) | | | 3.45 | | | | 5.44 | | | | 5.97 | |
Total from investment operations | | | 24.42 | | | | (4.37 | ) | | | 3.60 | | | | 5.57 | | | | 6.03 | |
Less distributions from: |
Net investment income | | | (.02 | ) | | | (.12 | ) | | | (.05 | ) | | | (.12 | ) | | | (.05 | ) |
Net realized gains | | | (7.98 | ) | | | (.42 | ) | | | (.72 | ) | | | (2.25 | ) | | | (.31 | ) |
Total distributions | | | (8.00 | ) | | | (.54 | ) | | | (.77 | ) | | | (2.37 | ) | | | (.36 | ) |
Net asset value, end of period | | $ | 63.06 | | | $ | 46.64 | | | $ | 51.55 | | | $ | 48.72 | | | $ | 45.52 | |
|
Total Returnb | | | 53.64 | % | | | (8.67 | %) | | | 7.59 | % | | | 12.16 | % | | | 15.17 | % |
Ratios/Supplemental Data |
Net assets, end of period (in thousands) | | $ | 18,653 | | | $ | 12,798 | | | $ | 20,307 | | | $ | 21,041 | | | $ | 20,960 | |
Ratios to average net assets: |
Net investment income (loss) | | | (0.13 | %) | | | 0.31 | % | | | 0.30 | % | | | 0.27 | % | | | 0.14 | % |
Total expenses | | | 1.65 | % | | | 1.68 | % | | | 1.67 | % | | | 1.58 | % | | | 1.57 | % |
Portfolio turnover rate | | | 284 | % | | | 227 | % | | | 157 | % | | | 151 | % | | | 133 | % |
C-Class | | Year Ended
March 31,
2021 | | | Year Ended
March 31,
2020 | | | Year Ended
March 31,
2019 | | | Year Ended
March 29,
2018 | | | Year Ended
March 31,
2017 | |
Per Share Data |
Net asset value, beginning of period | | $ | 41.37 | | | $ | 46.12 | | | $ | 44.00 | | | $ | 41.62 | | | $ | 36.74 | |
Income (loss) from investment operations: |
Net investment income (loss)a | | | (.46 | ) | | | (.24 | ) | | | (.20 | ) | | | (.19 | ) | | | (.22 | ) |
Net gain (loss) on investments (realized and unrealized) | | | 21.61 | | | | (3.97 | ) | | | 3.09 | | | | 4.94 | | | | 5.46 | |
Total from investment operations | | | 21.15 | | | | (4.21 | ) | | | 2.89 | | | | 4.75 | | | | 5.24 | |
Less distributions from: |
Net investment income | | | (.02 | ) | | | (.12 | ) | | | (.05 | ) | | | (.12 | ) | | | (.05 | ) |
Net realized gains | | | (7.98 | ) | | | (.42 | ) | | | (.72 | ) | | | (2.25 | ) | | | (.31 | ) |
Total distributions | | | (8.00 | ) | | | (.54 | ) | | | (.77 | ) | | | (2.37 | ) | | | (.36 | ) |
Net asset value, end of period | | $ | 54.52 | | | $ | 41.37 | | | $ | 46.12 | | | $ | 44.00 | | | $ | 41.62 | |
|
Total Returnb | | | 52.49 | % | | | (9.35 | %) | | | 6.78 | % | | | 11.29 | % | | | 14.33 | % |
Ratios/Supplemental Data |
Net assets, end of period (in thousands) | | $ | 12,040 | | | $ | 8,981 | | | $ | 14,599 | | | $ | 20,484 | | | $ | 20,931 | |
Ratios to average net assets: |
Net investment income (loss) | | | (0.88 | %) | | | (0.50 | %) | | | (0.45 | %) | | | (0.44 | %) | | | (0.57 | %) |
Total expenses | | | 2.39 | % | | | 2.43 | % | | | 2.41 | % | | | 2.33 | % | | | 2.33 | % |
Portfolio turnover rate | | | 284 | % | | | 227 | % | | | 157 | % | | | 151 | % | | | 133 | % |
SEE NOTES TO FINANCIAL STATEMENTS. | THE RYDEX FUNDS ANNUAL REPORT | 39 |
FINANCIAL HIGHLIGHTS (concluded) |
This table is presented to show selected data for a share outstanding throughout each period and to assist shareholders in evaluating a Fund’s performance for the periods presented.
H-Class | | Year Ended
March 31,
2021 | | | Year Ended
March 31,
2020 | | | Year Ended
March 31,
2019 | | | Year Ended
March 29,
2018 | | | Year Ended
March 31,
2017 | |
Per Share Data |
Net asset value, beginning of period | | $ | 46.64 | | | $ | 51.54 | | | $ | 48.71 | | | $ | 45.51 | | | $ | 39.84 | |
Income (loss) from investment operations: |
Net investment income (loss)a | | | (.08 | ) | | | .15 | | | | .16 | | | | .15 | | | | .07 | |
Net gain (loss) on investments (realized and unrealized) | | | 24.51 | | | | (4.51 | ) | | | 3.44 | | | | 5.42 | | | | 5.96 | |
Total from investment operations | | | 24.43 | | | | (4.36 | ) | | | 3.60 | | | | 5.57 | | | | 6.03 | |
Less distributions from: |
Net investment income | | | (.02 | ) | | | (.12 | ) | | | (.05 | ) | | | (.12 | ) | | | (.05 | ) |
Net realized gains | | | (7.98 | ) | | | (.42 | ) | | | (.72 | ) | | | (2.25 | ) | | | (.31 | ) |
Total distributions | | | (8.00 | ) | | | (.54 | ) | | | (.77 | ) | | | (2.37 | ) | | | (.36 | ) |
Net asset value, end of period | | $ | 63.07 | | | $ | 46.64 | | | $ | 51.54 | | | $ | 48.71 | | | $ | 45.51 | |
|
Total Return | | | 53.64 | % | | | (8.65 | %) | | | 7.59 | % | | | 12.14 | % | | | 15.20 | % |
Ratios/Supplemental Data |
Net assets, end of period (in thousands) | | $ | 123,613 | | | $ | 112,799 | | | $ | 120,014 | | | $ | 178,533 | | | $ | 226,744 | |
Ratios to average net assets: |
Net investment income (loss) | | | (0.13 | %) | | | 0.28 | % | | | 0.32 | % | | | 0.31 | % | | | 0.16 | % |
Total expenses | | | 1.65 | % | | | 1.68 | % | | | 1.66 | % | | | 1.58 | % | | | 1.58 | % |
Portfolio turnover rate | | | 284 | % | | | 227 | % | | | 157 | % | | | 151 | % | | | 133 | % |
a | Net investment income (loss) per share was computed using average shares outstanding throughout the period. |
b | Total return does not reflect the impact of any applicable sales charges. |
40 | THE RYDEX FUNDS ANNUAL REPORT | SEE NOTES TO FINANCIAL STATEMENTS. |
PERFORMANCE REPORT AND FUND PROFILE (Unaudited) | March 31, 2021 |
INVERSE S&P 500® STRATEGY FUND
OBJECTIVE: Seeks to provide investment results that match, before fees and expenses, the performance of a specific benchmark on a daily basis. The Fund’s current benchmark is the inverse (opposite) of the performance of the S&P 500® Index (the “underlying index”). The Fund does not seek to achieve its investment objective over a period of time greater than one day.
For the one-year period ended March 31, 2021, Inverse S&P 500® Strategy Fund maintained a daily correlation of over 99% to its benchmark of -100% of the daily price movement of the S&P 500 Index.
Inverse S&P 500® Strategy Fund Investor Class returned -39.21%, while the S&P 500 Index returned 56.35% over the same time period.
All sectors contributed to the return of the underlying index for the period, led by Information Technology, Consumer Discretionary, and Financials.
The holdings contributing the most to the return of the underlying index were Apple, Inc., Microsoft Corp., and Amazon.com, Inc. The holdings detracting the most were Gilead Sciences, Inc. and Biogen, Inc.
Derivatives in the Fund were used to help provide exposure to the composition of the benchmark in the highest efficient manner and to provide leverage and not for hedging purposes. Derivatives performed as expected.
Due to the compounding of daily returns, leveraged and inverse funds’ returns over periods other than one day will likely differ in amount and possibly direction from the benchmark return for the same period. Investors should monitor their leveraged and inverse funds’ holdings to ensure that they are consistent with their strategies, as frequently as daily.
The effects of compounding may cause the longer-term correlation of the Fund to its benchmark to diminish. The apparent discrepancy between the leveraged and unleveraged indices is the result of compounding, which is described briefly on page 6 of this report.
The Fund may invest in certain of the underlying series of Guggenheim Funds Trust and Guggenheim Strategy Funds Trust, including Guggenheim Ultra Short Duration, Guggenheim Strategy Fund II and Guggenheim Strategy Fund III (collectively, the “Short Term Investment Vehicles”), each of which are open-end management investment companies managed by Guggenheim Investments. The Short Term Investment Vehicles, which launched on March 11, 2014, are offered as short term investment options only to mutual funds, trusts, and other accounts managed by Guggenheim Investments and/or its affiliates, and are not available to the public, with the exception of Guggenheim Ultra Short Duration Fund, which is available to the public. Guggenheim Strategy Fund II and Guggenheim Strategy Fund III do not charge an investment management fee. Guggenheim Ultra Short Duration Fund charges an investment management fee but the Fund’s adviser has agreed to waive fees to the extent necessary to offset the proportionate share of any management fee paid by the Fund with respect to its investment in Guggenheim Ultra Short Duration Fund. For the one-year period ended March 31, 2021, investment in the Short Term Investment Vehicles benefited Fund performance.
Performance displayed represents past performance, which is no guarantee of future results.
Holdings Diversification (Market Exposure as % of Net Assets)
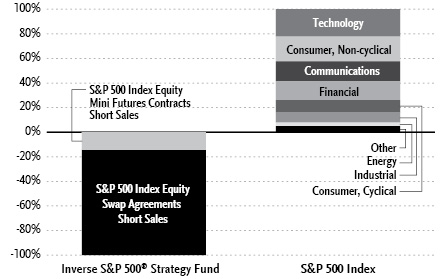
“Holdings Diversification (Market Exposure as % of Net Assets)” excludes any temporary cash investments, investments in Guggenheim Strategy Funds Trust mutual funds, or investments in Guggenheim Ultra Short Duration Fund. Investments in those Funds do not provide “market exposure” to meet the Fund’s investment objective, but will significantly increase the portfolio’s exposure to certain other asset categories (and their associated risks), which may cause the Fund to deviate from its principal investment strategy, including: (i) high yield, high risk debt securities rated below the top four long-term rating categories by a nationally recognized statistical rating organization (also known as “junk bonds”); (ii) securities issued by the U.S. government or its agencies and instrumentalities; (iii) CLOs and similar investments; and (iv) other short-term fixed income securities.
| | THE RYDEX FUNDS ANNUAL REPORT | 41 |
PERFORMANCE REPORT AND FUND PROFILE (Unaudited)(concluded) | March 31, 2021 |
Inception Dates: |
Investor Class | January 7, 1994 |
A-Class | March 31, 2004 |
C-Class | March 15, 2001 |
H-Class | September 18, 2014 |
The Fund invests principally in derivative investments such as swap agreements and futures contracts.
Largest Holdings (% of Total Net Assets) |
Guggenheim Strategy Fund II | 12.4% |
Guggenheim Ultra Short Duration Fund — Institutional Class | 9.3% |
Total | 21.7% |
| | |
“Largest Holdings” excludes any temporary cash or derivative investments. |
Cumulative Fund Performance*
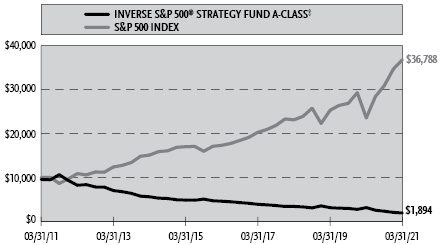
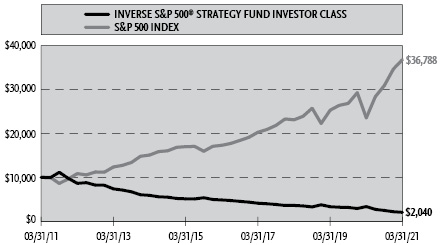
Average Annual Returns*
Periods Ended March 31, 2021
| 1 Year | 5 Year | 10 Year |
Investor Class Shares | (39.21%) | (15.93%) | (14.70%) |
A-Class Shares | (39.38%) | (16.15%) | (14.91%) |
A-Class Shares with sales charge‡ | (42.26%) | (16.96%) | (15.33%) |
C-Class Shares | (39.82%) | (16.78%) | (15.55%) |
C-Class Shares with CDSC§ | (40.41%) | (16.78%) | (15.55%) |
S&P 500 Index | 56.35% | 16.29% | 13.91% |
| 1 Year | 5 Year | Since
Inception
(09/18/14) |
H-Class Shares | (39.37%) | (16.14%) | (14.06%) |
S&P 500 Index | 56.35% | 16.29% | 13.22% |
* | The performance data above represents past performance that is not predictive of future results. The investment return and principal value of an investment in the Fund will fluctuate so that an investor’s shares, when redeemed, may be worth more or less than their original cost. Returns are historical and include changes in principal and reinvested dividends and capital gains and do not reflect the effect of taxes. The S&P 500 Index is an unmanaged index and, unlike the Fund, has no management fees or operating expenses to reduce its reported return. The graphs are based on Investor Class shares and A-Class shares only; performance for C-Class shares and H-Class shares will vary due to differences in fee structures. |
‡ | Fund returns are calculated using the maximum sales charge of 4.75%. |
§ | Fund returns include a CDSC of 1% if redeemed within 12 months of purchase. |
42 | THE RYDEX FUNDS ANNUAL REPORT | |
SCHEDULE OF INVESTMENTS | March 31, 2021 |
INVERSE S&P 500® STRATEGY FUND | |
| | Shares | | | Value | |
MUTUAL FUNDS† - 21.7% |
Guggenheim Strategy Fund II1 | | | 282,633 | | | $ | 7,060,175 | |
Guggenheim Ultra Short Duration Fund — Institutional Class1 | | | 527,442 | | | | 5,253,327 | |
Total Mutual Funds | | | | |
(Cost $12,230,892) | | | | | | | 12,313,502 | |
| | | | | | | | | |
| | | Face
Amount | | | | | |
FEDERAL AGENCY NOTES†† - 43.2% |
Federal Farm Credit Bank |
0.28% (U.S. Prime Rate - 2.98%, Rate Floor: 0.00%) due 05/10/212 | | $ | 5,000,000 | | | | 5,001,259 | |
0.45% (U.S. Prime Rate - 2.80%, Rate Floor: 0.00%) due 03/14/222 | | | 4,500,000 | | | | 4,514,247 | |
0.29% (3 Month U.S. Treasury Bill Rate + 0.27%, Rate Floor: 0.00%) due 05/16/222 | | | 4,000,000 | | | | 4,009,137 | |
0.44% (U.S. Prime Rate - 2.81%, Rate Floor: 0.00%) due 05/20/222 | | | 3,040,000 | | | | 3,052,231 | |
0.31% (3 Month U.S. Treasury Bill Rate + 0.29%, Rate Floor: 0.00%) due 04/11/222 | | | 3,000,000 | | | | 3,006,890 | |
Fannie Mae |
0.23% (U.S. Secured Overnight Financing Rate + 0.22%, Rate Floor: 0.00%) due 03/16/222 | | | 5,000,000 | | | | 5,009,753 | |
Total Federal Agency Notes | | | | |
(Cost $24,539,656) | | | | | | | 24,593,517 | |
U.S. GOVERNMENT SECURITIES†† - 12.4% |
U.S. Treasury Note |
1.75% due 11/30/21 | | | 7,000,000 | | | | 7,078,750 | |
Total U.S. Government Securities | | | | |
(Cost $7,076,274) | | | | | | | 7,078,750 | |
| | | | | | | | | |
U.S. TREASURY BILLS†† - 8.1% |
U.S. Treasury Bills |
0.04% due 04/01/213,4 | | | 2,000,000 | | | | 2,000,000 | |
0.09% due 04/01/213,4 | | | 1,500,000 | | | | 1,500,000 | |
0.01% due 04/22/214,5 | | | 100,000 | | | | 99,999 | |
U.S. Cash Management Bill |
0.03% due 08/03/214 | | | 1,000,000 | | | | 999,901 | |
Total U.S. Treasury Bills | | | | |
(Cost $4,599,900) | | | | | | | 4,599,900 | |
| | | | | | | | | |
REPURCHASE AGREEMENTS††,6 - 17.3% |
J.P. Morgan Securities LLC
issued 03/31/21 at 0.01%
due 04/01/213 | | | 5,258,783 | | | | 5,258,783 | |
Barclays Capital, Inc.
issued 03/31/21 at 0.01%
due 04/01/213 | | | 2,390,898 | | | | 2,390,898 | |
BofA Securities, Inc.
issued 03/31/21 at 0.01%
due 04/01/213 | | | 2,182,067 | | | | 2,182,067 | |
Total Repurchase Agreements | | | | |
(Cost $9,831,748) | | | | | | | 9,831,748 | |
| | | | | | | | | |
Total Investments - 102.7% | | | | |
(Cost $58,278,470) | | $ | 58,417,417 | |
Other Assets & Liabilities, net - (2.7)% | | | (1,558,253 | ) |
Total Net Assets - 100.0% | | $ | 56,859,164 | |
Futures Contracts |
Description | | Number of
Contracts | | | Expiration
Date | | | Notional
Amount | | | Value and
Unrealized
Depreciation** | |
Equity Futures Contracts Sold Short† |
S&P 500 Index Mini Futures Contracts | | | 41 | | | | Jun 2021 | | | $ | 8,135,425 | | | $ | (24,089 | ) |
Total Return Swap Agreements |
Counterparty | Index | Financing
Rate Receive | Payment
Frequency | | Maturity
Date | | | Units | | | Notional
Amount | | | Value and
Unrealized
Depreciation | |
OTC Equity Index Swap Agreements Sold Short†† |
Barclays Bank plc | S&P 500 Index | 0.39% (1 Week USD LIBOR + 0.30%) | At Maturity | | | 04/07/21 | | | | 1,793 | | | $ | 7,121,758 | | | $ | (72,241 | ) |
Goldman Sachs International | S&P 500 Index | 0.44% (1 Week USD LIBOR + 0.35%) | At Maturity | | | 04/08/21 | | | | 4,015 | | | | 15,952,603 | | | | (163,358 | ) |
BNP Paribas | S&P 500 Index | 0.16% (1 Month USD LIBOR + 0.05%) | At Maturity | | | 04/08/21 | | | | 6,457 | | | | 25,651,071 | | | | (273,402 | ) |
| | | | | | | | | | | | | | $ | 48,725,432 | | | $ | (509,001 | ) |
SEE NOTES TO FINANCIAL STATEMENTS. | THE RYDEX FUNDS ANNUAL REPORT | 43 |
SCHEDULE OF INVESTMENTS (continued) | March 31, 2021 |
INVERSE S&P 500® STRATEGY FUND | |
** | Includes cumulative appreciation (depreciation). Variation margin is reported within the Statement of Assets and Liabilities. |
† | Value determined based on Level 1 inputs — See Note 4. |
†† | Value determined based on Level 2 inputs — See Note 4. |
1 | Affiliated issuer. |
2 | Variable rate security. Rate indicated is the rate effective at March 31, 2021. In some instances, the effective rate is limited by a minimum rate floor or a maximum rate cap established by the issuer. The settlement status of a position may also impact the effective rate indicated. In some cases, a position may be unsettled at period end and may not have a stated effective rate. In instances where multiple underlying reference rates and spread amounts are shown, the effective rate is based on a weighted average. |
3 | All or a portion of this security is pledged as equity index swap collateral at March 31, 2021. |
4 | Rate indicated is the effective yield at the time of purchase. |
5 | All or a portion of this security is pledged as futures collateral at March 31, 2021. |
6 | Repurchase Agreements — See Note 6. |
| | LIBOR — London Interbank Offered Rate |
| | plc — Public Limited Company |
| | |
| | See Sector Classification in Other Information section. |
The following table summarizes the inputs used to value the Fund’s investments at March 31, 2021 (See Note 4 in the Notes to Financial Statements):
Investments in Securities (Assets) | | Level 1
Quoted
Prices | | | Level 2
Significant
Observable
Inputs | | | Level 3
Significant
Unobservable
Inputs | | | Total | |
Mutual Funds | | $ | 12,313,502 | | | $ | — | | | $ | — | | | $ | 12,313,502 | |
Federal Agency Notes | | | — | | | | 24,593,517 | | | | — | | | | 24,593,517 | |
U.S. Government Securities | | | — | | | | 7,078,750 | | | | — | | | | 7,078,750 | |
U.S. Treasury Bills | | | — | | | | 4,599,900 | | | | — | | | | 4,599,900 | |
Repurchase Agreements | | | — | | | | 9,831,748 | | | | — | | | | 9,831,748 | |
Total Assets | | $ | 12,313,502 | | | $ | 46,103,915 | | | $ | — | | | $ | 58,417,417 | |
Investments in Securities (Liabilities) | | Level 1
Quoted
Prices | | | Level 2
Significant
Observable
Inputs | | | Level 3
Significant
Unobservable
Inputs | | | Total | |
Equity Futures Contracts** | | $ | 24,089 | | | $ | — | | | $ | — | | | $ | 24,089 | |
Equity Index Swap Agreements** | | | — | | | | 509,001 | | | | — | | | | 509,001 | |
Total Liabilities | | $ | 24,089 | | | $ | 509,001 | | | $ | — | | | $ | 533,090 | |
** | This derivative is reported as unrealized appreciation/depreciation at period end. |
44 | THE RYDEX FUNDS ANNUAL REPORT | SEE NOTES TO FINANCIAL STATEMENTS. |
SCHEDULE OF INVESTMENTS (concluded) | March 31, 2021 |
INVERSE S&P 500® STRATEGY FUND | |
Affiliated Transactions
Investments representing 5% or more of the outstanding voting shares of a company, or control of or by, or common control under Guggenheim Investments (“GI”), result in that company being considered an affiliated issuer, as defined in the 1940 Act.
The Fund may invest in certain of the underlying series of Guggenheim Strategy Funds Trust, including Guggenheim Strategy Fund II and Guggenheim Strategy Fund III, (collectively, the “Short Term Investment Vehicles”), each of which are open-end management investment companies managed by GI. The Short Term Investment Vehicles, which launched on March 11, 2014, are offered as short term investment options only to mutual funds, trusts, and other accounts managed by GI and/or its affiliates, and are not available to the public. The Short Term Investment Vehicles pay no investment management fees. The Short Term Investment Vehicles’ annual report on Form N-CSR dated September 30, 2020, is available publicly or upon request. This information is available from the EDGAR database on the SEC’s website at https://www.sec.gov/Archives/edgar/data/1601445/000182126820000133/gug81042-ncsr.htm.
Transactions during the year ended March 31, 2021, in which the company is an affiliated issuer, were as follows:
Security Name | | Value
03/31/20 | | | Additions | | | Reductions | | | Realized
Gain (Loss) | | | Change in
Unrealized
Appreciation
(Depreciation) | | | Value
03/31/21 | | | Shares
03/31/21 | | | Investment
Income | |
Mutual Funds | | | | | | | | | | | | | | | | | | | | | | | | | | | | | | | | |
Guggenheim Strategy Fund II | | $ | 6,797,326 | | | $ | — | | | $ | — | | | $ | — | | | $ | 262,849 | | | $ | 7,060,175 | | | | 282,633 | | | $ | 119,880 | |
Guggenheim Ultra Short Duration Fund — Institutional Class | | | 4,355,562 | | | | 800,000 | | | | — | | | | — | | | | 97,765 | | | | 5,253,327 | | | | 527,442 | | | | 60,246 | |
| | | $ | 11,152,888 | | | $ | 800,000 | | | $ | — | | | $ | — | | | $ | 360,614 | | | $ | 12,313,502 | | | | | | | $ | 180,126 | |
SEE NOTES TO FINANCIAL STATEMENTS. | THE RYDEX FUNDS ANNUAL REPORT | 45 |
INVERSE S&P 500® STRATEGY FUND | |
STATEMENT OF ASSETS AND LIABILITIES |
March 31, 2021 |
Assets: |
Investments in unaffiliated issuers, at value (cost $36,215,830) | | $ | 36,272,167 | |
Investments in affiliated issuers, at value (cost $12,230,892) | | | 12,313,502 | |
Repurchase agreements, at value (cost $9,831,748) | | | 9,831,748 | |
Segregated cash with broker | | | 351,501 | |
Receivables: |
Interest | | | 49,723 | |
Fund shares sold | | | 16,095 | |
Dividends | | | 12,740 | |
Total assets | | | 58,847,476 | |
| | | | | |
Liabilities: |
Unrealized depreciation on OTC swap agreements | | | 509,001 | |
Payable for: |
Securities purchased | | | 999,901 | |
Swap settlement | | | 183,179 | |
Fund shares redeemed | | | 120,226 | |
Management fees | | | 44,705 | |
Variation margin on futures contracts | | | 42,640 | |
Transfer agent and administrative fees | | | 13,696 | |
Portfolio accounting fees | | | 5,091 | |
Distribution and service fees | | | 1,271 | |
Trustees’ fees* | | | 934 | |
Miscellaneous | | | 67,668 | |
Total liabilities | | | 1,988,312 | |
Commitments and contingent liabilities (Note 12) | | | — | |
Net assets | | $ | 56,859,164 | |
| | | | | |
Net assets consist of: |
Paid in capital | | $ | 314,920,181 | |
Total distributable earnings (loss) | | | (258,061,017 | ) |
Net assets | | $ | 56,859,164 | |
| | | | | |
Investor Class: |
Net assets | | $ | 53,937,182 | |
Capital shares outstanding | | | 1,565,114 | |
Net asset value per share | | $ | 34.46 | |
| | | | | |
A-Class: |
Net assets | | $ | 1,540,286 | |
Capital shares outstanding | | | 48,767 | |
Net asset value per share | | $ | 31.58 | |
Maximum offering price per share (Net asset value divided by 95.25%) | | $ | 33.15 | |
| | | | | |
C-Class: |
Net assets | | $ | 448,528 | |
Capital shares outstanding | | | 16,113 | |
Net asset value per share | | $ | 27.84 | |
| | | | | |
H-Class: |
Net assets | | $ | 933,168 | |
Capital shares outstanding | | | 29,546 | |
Net asset value per share | | $ | 31.58 | |
STATEMENT OF OPERATIONS |
Year Ended March 31, 2021 |
Investment Income: |
Dividends from securities of affiliated issuers | | $ | 180,126 | |
Interest | | | 162,442 | |
Total investment income | | | 342,568 | |
| | | | | |
Expenses: |
Management fees | | | 813,520 | |
Distribution and service fees: |
A-Class | | | 8,339 | |
C-Class | | | 27,826 | |
H-Class | | | 8,229 | |
Transfer agent and administrative fees | | | 256,298 | |
Registration fees | | | 108,698 | |
Portfolio accounting fees | | | 90,406 | |
Professional fees | | | 59,457 | |
Trustees’ fees* | | | 24,220 | |
Custodian fees | | | 13,653 | |
Miscellaneous | | | 1,296 | |
Total expenses | | | 1,411,942 | |
Less: |
Expenses waived by Adviser | | | (13,060 | ) |
Net expenses | | | 1,398,882 | |
Net investment loss | | | (1,056,314 | ) |
| | | | | |
Net Realized and Unrealized Gain (Loss): |
Net realized gain (loss) on: |
Investments in unaffiliated issuers | | | 7,090 | |
Swap agreements | | | (45,285,886 | ) |
Futures contracts | | | (2,730,560 | ) |
Net realized loss | | | (48,009,356 | ) |
Net change in unrealized appreciation (depreciation) on: |
Investments in unaffiliated issuers | | | 51,135 | |
Investments in affiliated issuers | | | 360,614 | |
Swap agreements | | | (1,877,952 | ) |
Futures contracts | | | 855,464 | |
Net change in unrealized appreciation (depreciation) | | | (610,739 | ) |
Net realized and unrealized loss | | | (48,620,095 | ) |
Net decrease in net assets resulting from operations | | $ | (49,676,409 | ) |
* | Relates to Trustees not deemed “interested persons” within the meaning of Section 2(a)(19) of the 1940 Act. |
46 | THE RYDEX FUNDS ANNUAL REPORT | SEE NOTES TO FINANCIAL STATEMENTS. |
INVERSE S&P 500® STRATEGY FUND | |
STATEMENTS OF CHANGES IN NET ASSETS |
| | Year Ended
March 31,
2021 | | | Year Ended
March 31,
2020 | |
Increase (Decrease) in Net Assets from Operations: | | | | | | | | |
Net investment income (loss) | | $ | (1,056,314 | ) | | $ | 300,608 | |
Net realized loss on investments | | | (48,009,356 | ) | | | (4,221,749 | ) |
Net change in unrealized appreciation (depreciation) on investments | | | (610,739 | ) | | | 787,183 | |
Net decrease in net assets resulting from operations | | | (49,676,409 | ) | | | (3,133,958 | ) |
| | | | | | | | | |
Distributions to shareholders: | | | | | | | | |
Investor Class | | | (277,176 | ) | | | (404,392 | ) |
A-Class | | | (9,604 | ) | | | (30,961 | ) |
C-Class | | | (3,226 | ) | | | (17,735 | ) |
H-Class | | | (10,602 | ) | | | (31,456 | ) |
Total distributions to shareholders | | | (300,608 | ) | | | (484,544 | ) |
| | | | | | | | | |
Capital share transactions: | | | | | | | | |
Proceeds from sale of shares | | | | | | | | |
Investor Class | | | 178,190,566 | | | | 191,676,284 | |
A-Class | | | 12,807,868 | | | | 32,213,820 | |
C-Class | | | 2,841,557 | | | | 14,599,836 | |
H-Class | | | 63,823,950 | | | | 55,422,179 | |
Distributions reinvested | | | | | | | | |
Investor Class | | | 272,737 | | | | 392,366 | |
A-Class | | | 9,367 | | | | 30,236 | |
C-Class | | | 3,194 | | | | 17,213 | |
H-Class | | | 10,599 | | | | 30,608 | |
Cost of shares redeemed | | | | | | | | |
Investor Class | | | (167,214,983 | ) | | | (150,547,290 | ) |
A-Class | | | (16,491,894 | ) | | | (27,995,128 | ) |
C-Class | | | (6,780,375 | ) | | | (10,836,227 | ) |
H-Class | | | (69,316,249 | ) | | | (51,569,418 | ) |
Net increase (decrease) from capital share transactions | | | (1,843,663 | ) | | | 53,434,479 | |
Net increase (decrease) in net assets | | | (51,820,680 | ) | | | 49,815,977 | |
| | | | | | | | | |
Net assets: | | | | | | | | |
Beginning of year | | | 108,679,844 | | | | 58,863,867 | |
End of year | | $ | 56,859,164 | | | $ | 108,679,844 | |
| | | | | | | | | |
Capital share activity: | | | | | | | | |
Shares sold | | | | | | | | |
Investor Class | | | 3,928,771 | | | | 3,369,987 | |
A-Class | | | 303,444 | | | | 638,191 | |
C-Class | | | 70,485 | | | | 327,353 | |
H-Class | | | 1,571,175 | | | | 1,099,080 | |
Shares issued from reinvestment of distributions | | | | | | | | |
Investor Class | | | 7,211 | | | | 7,737 | |
A-Class | | | 270 | | | | 648 | |
C-Class | | | 104 | | | | 414 | |
H-Class | | | 305 | | | | 656 | |
Shares redeemed | | | | | | | | |
Investor Class | | | (3,878,838 | ) | | | (2,681,827 | ) |
A-Class | | | (399,699 | ) | | | (557,215 | ) |
C-Class | | | (191,634 | ) | | | (247,750 | ) |
H-Class | | | (1,711,838 | ) | | | (1,059,178 | ) |
Net increase (decrease) in shares | | | (300,244 | ) | | | 898,096 | |
SEE NOTES TO FINANCIAL STATEMENTS. | THE RYDEX FUNDS ANNUAL REPORT | 47 |
INVERSE S&P 500® STRATEGY FUND | |
This table is presented to show selected data for a share outstanding throughout each period and to assist shareholders in evaluating a Fund’s performance for the periods presented.
Investor Class | | Year Ended
March 31,
2021 | | | Year Ended
March 31,
2020 | | | Year Ended
March 31,
2019 | | | Year Ended
March 29,
2018 | | | Year Ended
March 31,
2017 e | |
Per Share Data |
Net asset value, beginning of period | | $ | 56.92 | | | $ | 56.77 | | | $ | 61.76 | | | $ | 70.35 | | | $ | 83.09 | |
Income (loss) from investment operations: |
Net investment income (loss)a | | | (.47 | ) | | | .31 | | | | .46 | | | | (.07 | ) | | | (.55 | ) |
Net gain (loss) on investments (realized and unrealized) | | | (21.84 | ) | | | .26 | | | | (5.45 | ) | | | (8.52 | ) | | | (12.19 | ) |
Total from investment operations | | | (22.31 | ) | | | .57 | | | | (4.99 | ) | | | (8.59 | ) | | | (12.74 | ) |
Less distributions from: |
Net investment income | | | (.15 | ) | | | (.42 | ) | | | — | | | | — | | | | — | |
Total distributions | | | (.15 | ) | | | (.42 | ) | | | — | | | | — | | | | — | |
Net asset value, end of period | | $ | 34.46 | | | $ | 56.92 | | | $ | 56.77 | | | $ | 61.76 | | | $ | 70.35 | |
|
Total Return | | | (39.21 | %) | | | 1.10 | % | | | (8.08 | %) | | | (12.21 | %) | | | (15.34 | %) |
Ratios/Supplemental Data |
Net assets, end of period (in thousands) | | $ | 53,937 | | | $ | 85,839 | | | $ | 46,105 | | | $ | 57,342 | | | $ | 76,404 | |
Ratios to average net assets: |
Net investment income (loss) | | | (1.12 | %) | | | 0.58 | % | | | 0.78 | % | | | (0.10 | %) | | | (0.70 | %) |
Total expensesb | | | 1.51 | % | | | 1.53 | % | | | 1.52 | % | | | 1.43 | % | | | 1.42 | % |
Net expensesc | | | 1.50 | % | | | 1.51 | % | | | 1.51 | % | | | 1.43 | % | | | 1.42 | % |
Portfolio turnover rate | | | — | | | | — | | | | — | | | | 56 | % | | | 114 | % |
A-Class | | Year Ended
March 31,
2021 | | | Year Ended
March 31,
2020 | | | Year Ended
March 31,
2019 | | | Year Ended
March 29,
2018 | | | Year Ended
March 31,
2017 e | |
Per Share Data |
Net asset value, beginning of period | | $ | 52.33 | | | $ | 52.36 | | | $ | 57.11 | | | $ | 65.22 | | | $ | 77.21 | |
Income (loss) from investment operations: |
Net investment income (loss)a | | | (.56 | ) | | | .21 | | | | .27 | | | | (.22 | ) | | | (.70 | ) |
Net gain (loss) on investments (realized and unrealized) | | | (20.04 | ) | | | .18 | | | | (5.02 | ) | | | (7.89 | ) | | | (11.29 | ) |
Total from investment operations | | | (20.60 | ) | | | .39 | | | | (4.75 | ) | | | (8.11 | ) | | | (11.99 | ) |
Less distributions from: |
Net investment income | | | (.15 | ) | | | (.42 | ) | | | — | | | | — | | | | — | |
Total distributions | | | (.15 | ) | | | (.42 | ) | | | — | | | | — | | | | — | |
Net asset value, end of period | | $ | 31.58 | | | $ | 52.33 | | | $ | 52.36 | | | $ | 57.11 | | | $ | 65.22 | |
|
Total Returnd | | | (39.38 | %) | | | 0.85 | % | | | (8.32 | %) | | | (12.43 | %) | | | (15.54 | %) |
Ratios/Supplemental Data |
Net assets, end of period (in thousands) | | $ | 1,540 | | | $ | 7,575 | | | $ | 3,306 | | | $ | 4,637 | | | $ | 6,331 | |
Ratios to average net assets: |
Net investment income (loss) | | | (1.39 | %) | | | 0.43 | % | | | 0.50 | % | | | (0.37 | %) | | | (0.96 | %) |
Total expensesb | | | 1.78 | % | | | 1.78 | % | | | 1.76 | % | | | 1.68 | % | | | 1.67 | % |
Net expensesc | | | 1.77 | % | | | 1.76 | % | | | 1.76 | % | | | 1.68 | % | | | 1.67 | % |
Portfolio turnover rate | | | — | | | | — | | | | — | | | | 56 | % | | | 114 | % |
48 | THE RYDEX FUNDS ANNUAL REPORT | SEE NOTES TO FINANCIAL STATEMENTS. |
INVERSE S&P 500® STRATEGY FUND | |
FINANCIAL HIGHLIGHTS (continued) |
This table is presented to show selected data for a share outstanding throughout each period and to assist shareholders in evaluating a Fund’s performance for the periods presented.
C-Class | | Year Ended
March 31,
2021 | | | Year Ended
March 31,
2020 | | | Year Ended
March 31,
2019 | | | Year Ended
March 29,
2018 | | | Year Ended
March 31,
2017 e | |
Per Share Data |
Net asset value, beginning of period | | $ | 46.49 | | | $ | 46.92 | | | $ | 51.56 | | | $ | 59.34 | | | $ | 70.79 | |
Income (loss) from investment operations: |
Net investment income (loss)a | | | (.80 | ) | | | (.22 | ) | | | (.13 | ) | | | (.63 | ) | | | (1.12 | ) |
Net gain (loss) on investments (realized and unrealized) | | | (17.70 | ) | | | .21 | | | | (4.51 | ) | | | (7.15 | ) | | | (10.33 | ) |
Total from investment operations | | | (18.50 | ) | | | (.01 | ) | | | (4.64 | ) | | | (7.78 | ) | | | (11.45 | ) |
Less distributions from: |
Net investment income | | | (.15 | ) | | | (.42 | ) | | | — | | | | — | | | | — | |
Total distributions | | | (.15 | ) | | | (.42 | ) | | | — | | | | — | | | | — | |
Net asset value, end of period | | $ | 27.84 | | | $ | 46.49 | | | $ | 46.92 | | | $ | 51.56 | | | $ | 59.34 | |
|
Total Returnd | | | (39.82 | %) | | | 0.09 | % | | | (9.00 | %) | | | (13.11 | %) | | | (16.20 | %) |
Ratios/Supplemental Data |
Net assets, end of period (in thousands) | | $ | 449 | | | $ | 6,376 | | | $ | 2,681 | | | $ | 4,203 | | | $ | 6,760 | |
Ratios to average net assets: |
Net investment income (loss) | | | (2.16 | %) | | | (0.51 | %) | | | (0.27 | %) | | | (1.14 | %) | | | (1.69 | %) |
Total expensesb | | | 2.54 | % | | | 2.53 | % | | | 2.51 | % | | | 2.43 | % | | | 2.42 | % |
Net expensesc | | | 2.53 | % | | | 2.51 | % | | | 2.51 | % | | | 2.43 | % | | | 2.42 | % |
Portfolio turnover rate | | | — | | | | — | | | | — | | | | 56 | % | | | 114 | % |
SEE NOTES TO FINANCIAL STATEMENTS. | THE RYDEX FUNDS ANNUAL REPORT | 49 |
INVERSE S&P 500® STRATEGY FUND | |
FINANCIAL HIGHLIGHTS (concluded) |
This table is presented to show selected data for a share outstanding throughout each period and to assist shareholders in evaluating a Fund’s performance for the periods presented.
H-Class | | Year Ended
March 31,
2021 | | | Year Ended
March 31,
2020 | | | Year Ended
March 31,
2019 | | | Year Ended
March 29,
2018 | | | Year Ended
March 31,
2017 e | |
Per Share Data |
Net asset value, beginning of period | | $ | 52.32 | | | $ | 52.35 | | | $ | 57.11 | | | $ | 65.22 | | | $ | 77.17 | |
Income (loss) from investment operations: |
Net investment income (loss)a | | | (.56 | ) | | | .17 | | | | .29 | | | | (.27 | ) | | | (.70 | ) |
Net gain (loss) on investments (realized and unrealized) | | | (20.03 | ) | | | .22 | | | | (5.05 | ) | | | (7.84 | ) | | | (11.25 | ) |
Total from investment operations | | | (20.59 | ) | | | .39 | | | | (4.76 | ) | | | (8.11 | ) | | | (11.95 | ) |
Less distributions from: |
Net investment income | | | (.15 | ) | | | (.42 | ) | | | — | | | | — | | | | — | |
Total distributions | | | (.15 | ) | | | (.42 | ) | | | — | | | | — | | | | — | |
Net asset value, end of period | | $ | 31.58 | | | $ | 52.32 | | | $ | 52.35 | | | $ | 57.11 | | | $ | 65.22 | |
|
Total Return | | | (39.37 | %) | | | 0.85 | % | | | (8.33 | %) | | | (12.43 | %) | | | (15.47 | %) |
Ratios/Supplemental Data |
Net assets, end of period (in thousands) | | $ | 933 | | | $ | 8,890 | | | $ | 6,772 | | | $ | 4,672 | | | $ | 2,857 | |
Ratios to average net assets: |
Net investment income (loss) | | | (1.38 | %) | | | 0.34 | % | | | 0.52 | % | | | (0.45 | %) | | | (0.96 | %) |
Total expensesb | | | 1.78 | % | | | 1.78 | % | | | 1.77 | % | | | 1.69 | % | | | 1.67 | % |
Net expensesc | | | 1.76 | % | | | 1.76 | % | | | 1.76 | % | | | 1.69 | % | | | 1.67 | % |
Portfolio turnover rate | | | — | | | | — | | | | — | | | | 56 | % | | | 114 | % |
a | Net investment income (loss) per share was computed using average shares outstanding throughout the period. |
b | Does not include expenses of the underlying funds in which the Fund invests. |
c | Net expense information reflect the expense ratios after expense waivers and reimbursements, as applicable. |
d | Total return does not reflect the impact of any applicable sales charges. |
e | Reverse share split — Per share amounts for the periods presented through March 31, 2017 have been restated to reflect 1:6 reverse share split effective October 28, 2016. |
50 | THE RYDEX FUNDS ANNUAL REPORT | SEE NOTES TO FINANCIAL STATEMENTS. |
PERFORMANCE REPORT AND FUND PROFILE (Unaudited) | March 31, 2021 |
MONTHLY REBALANCE NASDAQ-100® 2x STRATEGY FUND
OBJECTIVE: Seeks to provide investment results that match, before fees and expenses, the performance of a specific benchmark on a calendar month basis. The Fund’s current benchmark is 200% of the performance of the NASDAQ-100 Index® (the “underlying index”). The Fund does not seek to achieve its investment objective over a period of time different than a full calendar month.
For the one-year period ended March 31, 2021, the Monthly Rebalance NASDAQ-100® 2X Strategy Fund H-Class returned 164.81%, while the NASDAQ-100 Index returned 68.88%.
All sectors contributed to the return of the underlying index for the period, led by Information Technology, Consumer Discretionary, and Communication Services.
The holdings contributing the most to the return of the underlying index were Apple, Inc., Amazon.com, Inc., and Microsoft Corp. The holdings detracting the most were Biogen, Inc., Gilead Sciences, Inc., and Peloton Interactive, Inc. Class A.
Derivatives in the Fund were used to help provide exposure to the composition of the benchmark in the most efficient manner possible and to provide leverage and not for hedging purposes. Derivatives performed as expected.
Due to compounding, the Fund’s performance generally will not correlate to the performance of the benchmark over periods greater than a full calendar month. For example, the Fund’s compounded returns for periods greater than a full calendar month will be different than the performance of the benchmark over the same period. The effects of compounding on the performance of the Fund will be more pronounced when the underlying index experiences increased volatility, the greater the leverage employed in the Fund, and over longer holding periods. Investors in the Fund should actively monitor and manage their investments to ensure they are consistent with their strategies. The effects of compounding are discussed in more detail on page 6 of this report.
The Fund may invest in certain of the underlying series of Guggenheim Funds Trust and Guggenheim Strategy Funds Trust, including Guggenheim Ultra Short Duration, Guggenheim Strategy Fund II and Guggenheim Strategy Fund III (collectively, the “Short Term Investment Vehicles”), each of which are open-end management investment companies managed by Guggenheim Investments. The Short Term Investment Vehicles, which launched on March 11, 2014, are offered as short term investment options only to mutual funds, trusts, and other accounts managed by Guggenheim Investments and/or its affiliates, and are not available to the public, with the exception of Guggenheim Ultra Short Duration Fund, which is available to the public. Guggenheim Strategy Fund II and Guggenheim Strategy Fund III do not charge an investment management fee. Guggenheim Ultra Short Duration Fund charges an investment management fee but the Fund’s adviser has agreed to waive fees to the extent necessary to offset the proportionate share of any management fee paid by the Fund with respect to its investment in Guggenheim Ultra Short Duration Fund. For the one-year period ended March 31, 2021, investment in the Short Term Investment Vehicles benefited Fund performance.
Performance displayed represents past performance which is no guarantee of future results.
Holdings Diversification (Market Exposure as % of Net Assets)
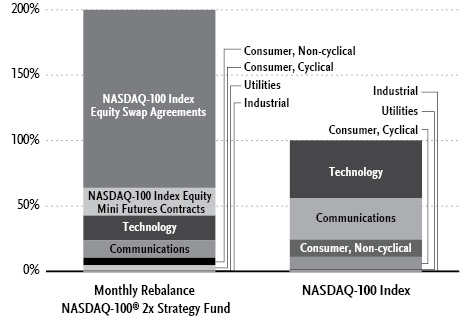
“Holdings Diversification (Market Exposure as % of Net Assets)” excludes any temporary cash investments, investments in Guggenheim Strategy Funds Trust mutual funds, or investments in Guggenheim Ultra Short Duration Fund. Investments in those Funds do not provide “market exposure” to meet the Fund’s investment objective, but will significantly increase the portfolio’s exposure to certain other asset categories (and their associated risks), which may cause the Fund to deviate from its principal investment strategy, including: (i) high yield, high risk debt securities rated below the top four long-term rating categories by a nationally recognized statistical rating organization (also known as “junk bonds”); (ii) securities issued by the U.S. government or its agencies and instrumentalities; (iii) CLOs and similar investments; and (iv) other short-term fixed income securities.
| | THE RYDEX FUNDS ANNUAL REPORT | 51 |
PERFORMANCE REPORT AND FUND PROFILE (Unaudited)(concluded) | March 31, 2021 |
Inception Dates: |
A-Class | November 28, 2014 |
C-Class | November 28, 2014 |
H-Class | November 28, 2014 |
Ten Largest Holdings (% of Total Net Assets) |
Guggenheim Ultra Short Duration Fund — Institutional Class | 22.2% |
Guggenheim Strategy Fund II | 10.3% |
Apple, Inc. | 4.7% |
Microsoft Corp. | 4.1% |
Amazon.com, Inc. | 3.6% |
Tesla, Inc. | 1.8% |
Facebook, Inc. — Class A | 1.6% |
Alphabet, Inc. — Class C | 1.5% |
Alphabet, Inc. — Class A | 1.4% |
NVIDIA Corp. | 1.2% |
Top Ten Total | 52.4% |
| | |
“Ten Largest Holdings” excludes any temporary cash or derivative investments. |
Cumulative Fund Performance*
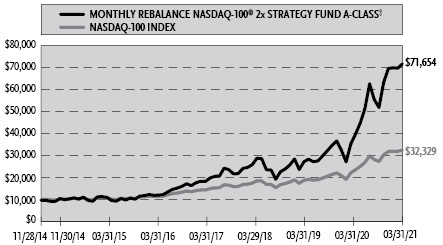
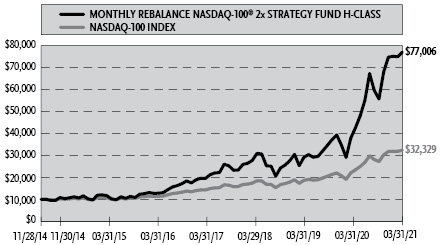
Average Annual Returns*
Periods Ended March 31, 2021
| 1 Year | 5 Year | Since
Inception
(11/28/14) |
A-Class Shares | 164.83% | 47.18% | 37.50% |
A-Class Shares with sales charge‡ | 152.27% | 45.75% | 36.45% |
C-Class Shares | 162.86% | 46.08% | 36.43% |
C-Class Shares with CDSC§ | 161.86% | 46.08% | 36.43% |
H-Class Shares | 164.81% | 47.16% | 38.01% |
NASDAQ-100 Index | 68.88% | 25.22% | 20.34% |
* | The performance data above represents past performance that is not predictive of future results. The investment return and principal value of an investment in the Fund will fluctuate so that an investor’s shares, when redeemed, may be worth more or less than their original cost. Returns are historical and include changes in principal and reinvested dividends and capital gains and do not reflect the effect of taxes. The NASDAQ-100 Index is an unmanaged index and, unlike the Fund, has no management fees or operating expenses to reduce its reported return. The graphs are based on A-Class shares and H-Class shares only; performance for C-Class shares will vary due to difference in fee structures. |
‡ | Fund returns are calculated using the maximum sales charge of 4.75%. |
§ | Fund returns include a CDSC of 1% if redeemed within 12 months of purchase. |
52 | THE RYDEX FUNDS ANNUAL REPORT | |
SCHEDULE OF INVESTMENTS | March 31, 2021 |
MONTHLY REBALANCE NASDAQ-100® 2x STRATEGY FUND | |
| | Shares | | | Value | |
COMMON STOCKS† - 42.6% |
| | | | | | | | | |
Technology - 18.9% |
Apple, Inc. | | | 37,580 | | | $ | 4,590,397 | |
Microsoft Corp. | | | 16,884 | | | | 3,980,741 | |
NVIDIA Corp. | | | 2,112 | | | | 1,127,660 | |
Intel Corp. | | | 13,840 | | | | 885,760 | |
Adobe, Inc.* | | | 1,631 | | | | 775,328 | |
Broadcom, Inc. | | | 1,391 | | | | 644,951 | |
Texas Instruments, Inc. | | | 3,135 | | | | 592,484 | |
QUALCOMM, Inc. | | | 3,870 | | | | 513,123 | |
Applied Materials, Inc. | | | 3,126 | | | | 417,634 | |
Intuit, Inc. | | | 933 | | | | 357,395 | |
Micron Technology, Inc.* | | | 3,811 | | | | 336,168 | |
Advanced Micro Devices, Inc.* | | | 4,126 | | | | 323,891 | |
Lam Research Corp. | | | 487 | | | | 289,882 | |
Fiserv, Inc.* | | | 2,280 | | | | 271,411 | |
Activision Blizzard, Inc. | | | 2,639 | | | | 245,427 | |
Zoom Video Communications, Inc. — Class A* | | | 694 | | | | 222,975 | |
Autodesk, Inc.* | | | 749 | | | | 207,585 | |
Analog Devices, Inc. | | | 1,257 | | | | 194,936 | |
NXP Semiconductor N.V. | | | 944 | | | | 190,065 | |
KLA Corp. | | | 525 | | | | 173,460 | |
ASML Holding N.V. — Class G | | | 265 | | | | 163,600 | |
Workday, Inc. — Class A* | | | 613 | | | | 152,288 | |
Microchip Technology, Inc. | | | 917 | | | | 142,337 | |
Cognizant Technology Solutions Corp. — Class A | | | 1,808 | | | | 141,241 | |
Electronic Arts, Inc. | | | 980 | | | | 132,663 | |
Cadence Design Systems, Inc.* | | | 950 | | | | 130,140 | |
Synopsys, Inc.* | | | 519 | | | | 128,598 | |
DocuSign, Inc.* | | | 635 | | | | 128,556 | |
Paychex, Inc. | | | 1,228 | | | | 120,369 | |
Marvell Technology Group Ltd. | | | 2,288 | | | | 112,066 | |
NetEase, Inc. ADR | | | 1,021 | | | | 105,428 | |
Xilinx, Inc. | | | 836 | | | | 103,580 | |
Skyworks Solutions, Inc. | | | 562 | | | | 103,116 | |
ANSYS, Inc.* | | | 296 | | | | 100,510 | |
Atlassian Corporation plc — Class A* | | | 453 | | | | 95,474 | |
Maxim Integrated Products, Inc. | | | 913 | | | | 83,421 | |
Cerner Corp. | | | 1,043 | | | | 74,971 | |
Splunk, Inc.* | | | 551 | | | | 74,649 | |
Check Point Software Technologies Ltd.* | | | 478 | | | | 53,522 | |
Total Technology | | | | | | | 18,487,802 | |
| | | | | | | | | |
Communications - 13.5% |
Amazon.com, Inc.* | | | 1,127 | | | | 3,487,028 | |
Facebook, Inc. — Class A* | | | 5,385 | | | | 1,586,044 | |
Alphabet, Inc. — Class C* | | | 733 | | | | 1,516,306 | |
Alphabet, Inc. — Class A* | | | 673 | | | | 1,388,076 | |
Comcast Corp. — Class A | | | 15,572 | | | | 842,601 | |
Netflix, Inc.* | | | 1,509 | | | | 787,185 | |
Cisco Systems, Inc. | | | 14,381 | | | | 743,641 | |
T-Mobile US, Inc.* | | | 4,234 | | | | 530,478 | |
Charter Communications, Inc. — Class A* | | | 660 | | | | 407,233 | |
Booking Holdings, Inc.* | | | 140 | | | | 326,178 | |
MercadoLibre, Inc.* | | | 170 | | | | 250,264 | |
JD.com, Inc. ADR* | | | 2,830 | | | | 238,654 | |
Baidu, Inc. ADR* | | | 924 | | | | 201,016 | |
Pinduoduo, Inc. ADR* | | | 1,177 | | | | 157,577 | |
eBay, Inc. | | | 2,318 | | | | 141,954 | |
Match Group, Inc.* | | | 916 | | | | 125,840 | |
Okta, Inc.* | | | 413 | | | | 91,037 | |
Sirius XM Holdings, Inc.1 | | | 14,103 | | | | 85,887 | |
CDW Corp. | | | 480 | | | | 79,560 | |
VeriSign, Inc.* | | | 385 | | | | 76,523 | |
Trip.com Group Ltd. ADR* | | | 1,795 | | | | 71,136 | |
Fox Corp. — Class A | | | 1,139 | | | | 41,130 | |
Fox Corp. — Class B | | | 873 | | | | 30,494 | |
Total Communications | | | | | | | 13,205,842 | |
| | | | | | | | | |
Consumer, Non-cyclical - 5.6% |
PayPal Holdings, Inc.* | | | 3,990 | | | | 968,932 | |
PepsiCo, Inc. | | | 4,700 | | | | 664,815 | |
Amgen, Inc. | | | 1,967 | | | | 489,409 | |
Intuitive Surgical, Inc.* | | | 401 | | | | 296,315 | |
Mondelez International, Inc. — Class A | | | 4,810 | | | | 281,529 | |
Gilead Sciences, Inc. | | | 4,281 | | | | 276,681 | |
Automatic Data Processing, Inc. | | | 1,458 | | | | 274,789 | |
Illumina, Inc.* | | | 497 | | | | 190,878 | |
Vertex Pharmaceuticals, Inc.* | | | 886 | | | | 190,392 | |
Moderna, Inc.* | | | 1,362 | | | | 178,354 | |
Regeneron Pharmaceuticals, Inc.* | | | 359 | | | | 169,857 | |
Kraft Heinz Co. | | | 4,167 | | | | 166,680 | |
Keurig Dr Pepper, Inc. | | | 4,794 | | | | 164,770 | |
Monster Beverage Corp.* | | | 1,798 | | | | 163,780 | |
Align Technology, Inc.* | | | 270 | | | | 146,213 | |
Biogen, Inc.* | | | 519 | | | | 145,190 | |
IDEXX Laboratories, Inc.* | | | 291 | | | | 142,389 | |
Cintas Corp. | | | 358 | | | | 122,189 | |
DexCom, Inc.* | | | 328 | | | | 117,880 | |
Alexion Pharmaceuticals, Inc.* | | | 749 | | | | 114,530 | |
Verisk Analytics, Inc. — Class A | | | 555 | | | | 98,063 | |
Seagen, Inc.* | | | 617 | | | | 85,677 | |
Incyte Corp.* | | | 749 | | | | 60,871 | |
Total Consumer, Non-cyclical | | | | | | | 5,510,183 | |
| | | | | | | | | |
Consumer, Cyclical - 4.0% |
Tesla, Inc.* | | | 2,659 | | | | 1,776,026 | |
Costco Wholesale Corp. | | | 1,509 | | | | 531,892 | |
Starbucks Corp. | | | 4,010 | | | | 438,173 | |
Marriott International, Inc. — Class A* | | | 1,105 | | | | 163,662 | |
Walgreens Boots Alliance, Inc. | | | 2,943 | | | | 161,571 | |
Ross Stores, Inc. | | | 1,214 | | | | 145,571 | |
Lululemon Athletica, Inc.* | | | 426 | | | | 130,658 | |
O’Reilly Automotive, Inc.* | | | 239 | | | | 121,233 | |
PACCAR, Inc. | | | 1,182 | | | | 109,831 | |
Peloton Interactive, Inc. — Class A* | | | 898 | | | | 100,971 | |
Fastenal Co. | | | 1,956 | | | | 98,348 | |
Dollar Tree, Inc.* | | | 801 | | | | 91,682 | |
Copart, Inc.* | | | 805 | | | | 87,431 | |
Total Consumer, Cyclical | | | | | | | 3,957,049 | |
| | | | | | | | | |
SEE NOTES TO FINANCIAL STATEMENTS. | THE RYDEX FUNDS ANNUAL REPORT | 53 |
SCHEDULE OF INVESTMENTS (continued) | March 31, 2021 |
MONTHLY REBALANCE NASDAQ-100® 2x STRATEGY FUND | |
| | Shares | | | Value | |
Utilities - 0.4% |
Exelon Corp. | | | 3,326 | | | $ | 145,479 | |
American Electric Power Company, Inc. | | | 1,692 | | | | 143,312 | |
Xcel Energy, Inc. | | | 1,831 | | | | 121,780 | |
Total Utilities | | | | | | | 410,571 | |
| | | | | | | | | |
Industrial - 0.2% |
CSX Corp. | | | 2,597 | | | | 250,403 | |
| | | | | | | | | |
Total Common Stocks | | | | |
(Cost $34,157,537) | | | | | | | 41,821,850 | |
| | | | | | | | | |
MUTUAL FUNDS† - 32.5% |
Guggenheim Ultra Short Duration Fund — Institutional Class2 | | | 2,183,560 | | | | 21,748,256 | |
Guggenheim Strategy Fund II2 | | | 403,950 | | | | 10,090,677 | |
Total Mutual Funds | | | | |
(Cost $31,544,280) | | | | | | | 31,838,933 | |
| | | | | | | | | |
| | | Face
Amount | | | | | |
U.S. TREASURY BILLS†† - 24.7% |
U.S. Treasury Bills |
0.09% due 04/01/213,4 | | $ | 12,907,000 | | | | 12,907,000 | |
0.01% due 04/22/214,5 | | | 1,351,000 | | | | 1,350,990 | |
U.S. Cash Management Bill |
0.03% due 08/03/214 | | | 10,000,000 | | | | 9,999,009 | |
Total U.S. Treasury Bills | | | | |
(Cost $24,256,997) | | | | | | | 24,256,999 | |
REPURCHASE AGREEMENTS††,6 - 15.7% |
J.P. Morgan Securities LLC
issued 03/31/21 at 0.01%
due 04/01/213 | | | 8,224,345 | | | | 8,224,345 | |
Barclays Capital, Inc.
issued 03/31/21 at 0.01%
due 04/01/213 | | | 3,739,187 | | | | 3,739,187 | |
BofA Securities, Inc.
issued 03/31/21 at 0.01%
due 04/01/213 | | | 3,412,591 | | | | 3,412,591 | |
Total Repurchase Agreements | | | | |
(Cost $15,376,123) | | | | | | | 15,376,123 | |
| | | | | | | | | |
| | | Shares | | | | | |
SECURITIES LENDING COLLATERAL†,7 - 0.1% |
Money Market Fund | | | | | | | | |
First American Government Obligations Fund — Class Z, 0.03%8 | | | 50,356 | | | | 50,356 | |
Total Securities Lending Collateral | | | | |
(Cost $50,356) | | | | | | | 50,356 | |
| | | | | | | | | |
Total Investments - 115.6% | | | | |
(Cost $105,385,293) | | $ | 113,344,261 | |
Other Assets & Liabilities, net - (15.6)% | | | (15,312,917 | ) |
Total Net Assets - 100.0% | | $ | 98,031,344 | |
Futures Contracts |
Description | | Number of
Contracts | | | Expiration
Date | | | Notional
Amount | | | Value and
Unrealized
Appreciation** | |
Equity Futures Contracts Purchased† |
NASDAQ-100 Index Mini Futures Contracts | | | 79 | | | | Jun 2021 | | | $ | 20,673,905 | | | $ | 255,378 | |
Total Return Swap Agreements |
Counterparty | Index | Financing
Rate Pay | Payment
Frequency | | Maturity
Date | | | Units | | | Notional
Amount | | | Value and
Unrealized
Appreciation
(Depreciation) | |
OTC Equity Index Swap Agreements†† |
Goldman Sachs International | NASDAQ-100 Index | 0.64% (1 Week USD LIBOR + 0.55%) | At Maturity | | | 04/08/21 | | | | 2,346 | | | $ | 30,714,347 | | | $ | 973,157 | |
Barclays Bank plc | NASDAQ-100 Index | 0.59% (1 Week USD LIBOR + 0.50%) | At Maturity | | | 05/26/21 | | | | 7,427 | | | | 97,232,622 | | | | 834,244 | |
BNP Paribas | NASDAQ-100 Index | 0.76% (1 Month USD LIBOR + 0.65%) | At Maturity | | | 04/08/21 | | | | 429 | | | | 5,611,601 | | | | (260,733 | ) |
| | | | | | | | | | | | | | $ | 133,558,570 | | | $ | 1,546,668 | |
54 | THE RYDEX FUNDS ANNUAL REPORT | SEE NOTES TO FINANCIAL STATEMENTS. |
SCHEDULE OF INVESTMENTS (continued) | March 31, 2021 |
MONTHLY REBALANCE NASDAQ-100® 2x STRATEGY FUND | |
* | Non-income producing security. |
** | Includes cumulative appreciation (depreciation). Variation margin is reported within the Statement of Assets and Liabilities. |
† | Value determined based on Level 1 inputs — See Note 4. |
†† | Value determined based on Level 2 inputs — See Note 4. |
1 | All or a portion of this security is on loan at March 31, 2021 — See Note 7. |
2 | Affiliated issuer. |
3 | All or a portion of this security is pledged as equity index swap collateral at March 31, 2021. |
4 | Rate indicated is the effective yield at the time of purchase. |
5 | All or a portion of this security is pledged as futures collateral at March 31, 2021. |
6 | Repurchase Agreements — See Note 6. |
7 | Securities lending collateral — See Note 7. |
8 | Rate indicated is the 7-day yield as of March 31, 2021. |
| | ADR — American Depositary Receipt |
| | LIBOR — London Interbank Offered Rate |
| | plc — Public Limited Company |
| | |
| | See Sector Classification in Other Information section. |
The following table summarizes the inputs used to value the Fund’s investments at March 31, 2021 (See Note 4 in the Notes to Financial Statements):
Investments in Securities (Assets) | | Level 1
Quoted
Prices | | | Level 2
Significant
Observable
Inputs | | | Level 3
Significant
Unobservable
Inputs | | | Total | |
Common Stocks | | $ | 41,821,850 | | | $ | — | | | $ | — | | | $ | 41,821,850 | |
Mutual Funds | | | 31,838,933 | | | | — | | | | — | | | | 31,838,933 | |
U.S. Treasury Bills | | | — | | | | 24,256,999 | | | | — | | | | 24,256,999 | |
Repurchase Agreements | | | — | | | | 15,376,123 | | | | — | | | | 15,376,123 | |
Securities Lending Collateral | | | 50,356 | | | | — | | | | — | | | | 50,356 | |
Equity Futures Contracts** | | | 255,378 | | | | — | | | | — | | | | 255,378 | |
Equity Index Swap Agreements** | | | — | | | | 1,807,401 | | | | — | | | | 1,807,401 | |
Total Assets | | $ | 73,966,517 | | | $ | 41,440,523 | | | $ | — | | | $ | 115,407,040 | |
Investments in Securities (Liabilities) | | Level 1
Quoted
Prices | | | Level 2
Significant
Observable
Inputs | | | Level 3
Significant
Unobservable
Inputs | | | Total | |
Equity Index Swap Agreements** | | $ | — | | | $ | 260,733 | | | $ | — | | | $ | 260,733 | |
** | This derivative is reported as unrealized appreciation/depreciation at period end. |
SEE NOTES TO FINANCIAL STATEMENTS. | THE RYDEX FUNDS ANNUAL REPORT | 55 |
SCHEDULE OF INVESTMENTS (concluded) | March 31, 2021 |
MONTHLY REBALANCE NASDAQ-100® 2x STRATEGY FUND | |
Affiliated Transactions
Investments representing 5% or more of the outstanding voting shares of a company, or control of or by, or common control under Guggenheim Investments (“GI”), result in that company being considered an affiliated issuer, as defined in the 1940 Act.
The Fund may invest in certain of the underlying series of Guggenheim Strategy Funds Trust, including Guggenheim Strategy Fund II and Guggenheim Strategy Fund III, (collectively, the “Short Term Investment Vehicles”), each of which are open-end management investment companies managed by GI. The Short Term Investment Vehicles, which launched on March 11, 2014, are offered as short term investment options only to mutual funds, trusts, and other accounts managed by GI and/or its affiliates, and are not available to the public. The Short Term Investment Vehicles pay no investment management fees. The Short Term Investment Vehicles’ annual report on Form N-CSR dated September 30, 2020, is available publicly or upon request. This information is available from the EDGAR database on the SEC’s website at https://www.sec.gov/Archives/edgar/data/1601445/000182126820000133/gug81042-ncsr.htm.
Transactions during the year ended March 31, 2021, in which the company is an affiliated issuer, were as follows:
Security Name | | Value
03/31/20 | | | Additions | | | Reductions | | | Realized
Gain (Loss) | | | Change in
Unrealized
Appreciation
(Depreciation) | | | Value
03/31/21 | | | Shares
03/31/21 | | | Investment
Income | |
Mutual Funds | | | | | | | | | | | | | | | | | | | | | | | | | | | | | | | | |
Guggenheim Strategy Fund II | | $ | 1,209,488 | | | $ | 8,650,000 | | | $ | — | | | $ | — | | | $ | 231,189 | | | $ | 10,090,677 | | | | 403,950 | | | $ | 153,251 | |
Guggenheim Ultra Short Duration Fund — Institutional Class | | | 1,143,698 | | | | 21,500,000 | | | | (1,000,000 | ) | | | 284 | | | | 104,274 | | | | 21,748,256 | | | | 2,183,560 | | | | 151,357 | |
| | | $ | 2,353,186 | | | $ | 30,150,000 | | | $ | (1,000,000 | ) | | $ | 284 | | | $ | 335,463 | | | $ | 31,838,933 | | | | | | | $ | 304,608 | |
56 | THE RYDEX FUNDS ANNUAL REPORT | SEE NOTES TO FINANCIAL STATEMENTS. |
MONTHLY REBALANCE NASDAQ-100® 2x STRATEGY FUND | |
STATEMENT OF ASSETS AND LIABILITIES |
March 31, 2021 |
Assets: |
Investments in unaffiliated issuers, at value - including $49,067 of securities loaned (cost $58,464,890) | | $ | 66,129,205 | |
Investments in affiliated issuers, at value (cost $31,544,280) | | | 31,838,933 | |
Repurchase agreements, at value (cost $15,376,123) | | | 15,376,123 | |
Segregated cash with broker | | | 311,769 | |
Unrealized appreciation on OTC swap agreements | | | 1,807,401 | |
Receivables: |
Fund shares sold | | | 7,607,576 | |
Variation margin on futures contracts | | | 284,405 | |
Investment Adviser | | | 53,996 | |
Dividends | | | 38,682 | |
Securities lending income | | | 42 | |
Interest | | | 3 | |
Total assets | | | 123,448,135 | |
| | | | | |
Liabilities: |
Unrealized depreciation on OTC swap agreements | | | 260,733 | |
Payable for: |
Securities purchased | | | 19,961,552 | |
Swap settlement | | | 4,382,561 | |
Fund shares redeemed | | | 254,736 | |
Management fees | | | 138,554 | |
Return of securities lending collateral | | | 50,356 | |
Transfer agent and administrative fees | | | 42,794 | |
Distribution and service fees | | | 40,848 | |
Portfolio accounting fees | | | 14,957 | |
Trustees’ fees* | | | 3,304 | |
Miscellaneous | | | 266,396 | |
Total liabilities | | | 25,416,791 | |
Commitments and contingent liabilities (Note 12) | | | — | |
Net assets | | $ | 98,031,344 | |
| | | | | |
Net assets consist of: |
Paid in capital | | $ | 95,952,879 | |
Total distributable earnings (loss) | | | 2,078,465 | |
Net assets | | $ | 98,031,344 | |
| | | | | |
A-Class: |
Net assets | | $ | 5,504,387 | |
Capital shares outstanding | | | 15,487 | |
Net asset value per share | | $ | 355.42 | |
Maximum offering price per share (Net asset value divided by 95.25%) | | $ | 373.14 | |
| | | | | |
C-Class: |
Net assets | | $ | 1,750,646 | |
Capital shares outstanding | | | 5,189 | |
Net asset value per share | | $ | 337.38 | |
| | | | | |
H-Class: |
Net assets | | $ | 90,776,311 | |
Capital shares outstanding | | | 249,152 | |
Net asset value per share | | $ | 364.34 | |
STATEMENT OF OPERATIONS |
Year Ended March 31, 2021 |
Investment Income: |
Dividends from securities of unaffiliated issuers (net of foreign withholding tax of $2,038) | | $ | 1,715,497 | |
Dividends from securities of affiliated issuers | | | 304,608 | |
Interest | | | 36,146 | |
Income from securities lending, net | | | 510 | |
Total investment income | | | 2,056,761 | |
| | | | | |
Expenses: |
Management fees | | | 2,521,668 | |
Distribution and service fees: |
A-Class | | | 14,247 | |
C-Class | | | 15,710 | |
H-Class | | | 682,296 | |
Transfer agent and administrative fees | | | 775,088 | |
Portfolio accounting fees | | | 263,786 | |
Professional fees | | | 118,019 | |
Custodian fees | | | 38,860 | |
Trustees’ fees* | | | 38,550 | |
Line of credit fees | | | 610 | |
Interest expense | | | 95 | |
Miscellaneous | | | 488,646 | |
Total expenses | | | 4,957,575 | |
Less: |
Expenses waived by Adviser | | | (1,207,139 | ) |
Net expenses | | | 3,750,436 | |
Net investment loss | | | (1,693,675 | ) |
| | | | | |
Net Realized and Unrealized Gain (Loss): |
Net realized gain (loss) on: |
Investments in unaffiliated issuers | | | 57,691,524 | |
Investments in affiliated issuers | | | 284 | |
Swap agreements | | | 103,455,523 | |
Futures contracts | | | 27,183,266 | |
Net realized gain | | | 188,330,597 | |
Net change in unrealized appreciation (depreciation) on: |
Investments in unaffiliated issuers | | | 7,417,426 | |
Investments in affiliated issuers | | | 335,463 | |
Swap agreements | | | 1,879,026 | |
Futures contracts | | | (89,874 | ) |
Net change in unrealized appreciation (depreciation) | | | 9,542,041 | |
Net realized and unrealized gain | | | 197,872,638 | |
Net increase in net assets resulting from operations | | $ | 196,178,963 | |
* | Relates to Trustees not deemed “interested persons” within the meaning of Section 2(a)(19) of the 1940 Act. |
SEE NOTES TO FINANCIAL STATEMENTS. | THE RYDEX FUNDS ANNUAL REPORT | 57 |
MONTHLY REBALANCE NASDAQ-100® 2x STRATEGY FUND | |
STATEMENTS OF CHANGES IN NET ASSETS |
| | Year Ended
March 31,
2021 | | | Year Ended
March 31,
2020 | |
Increase (Decrease) in Net Assets from Operations: | | | | | | | | |
Net investment income (loss) | | $ | (1,693,675 | ) | | $ | 100,881 | |
Net realized gain (loss) on investments | | | 188,330,597 | | | | (5,559,290 | ) |
Net change in unrealized appreciation (depreciation) on investments | | | 9,542,041 | | | | (8,523,966 | ) |
Net increase (decrease) in net assets resulting from operations | | | 196,178,963 | | | | (13,982,375 | ) |
| | | | | | | | | |
Distributions to shareholders: | | | | | | | | |
A-Class | | | (432,118 | ) | | | (3,735 | ) |
C-Class | | | (107,529 | ) | | | (832 | ) |
H-Class | | | (18,988,998 | ) | | | (203,974 | ) |
Total distributions to shareholders | | | (19,528,645 | ) | | | (208,541 | ) |
| | | | | | | | | |
Capital share transactions: | | | | | | | | |
Proceeds from sale of shares | | | | | | | | |
A-Class | | | 9,606,083 | | | | 14,654,383 | |
C-Class | | | 1,448,846 | | | | 737,827 | |
H-Class | | | 1,221,379,062 | | | | 1,626,392,692 | |
Distributions reinvested | | | | | | | | |
A-Class | | | 339,817 | | | | 2,826 | |
C-Class | | | 102,321 | | | | 735 | |
H-Class | | | 18,765,952 | | | | 202,106 | |
Cost of shares redeemed | | | | | | | | |
A-Class | | | (10,958,122 | ) | | | (14,843,489 | ) |
C-Class | | | (1,479,784 | ) | | | (746,073 | ) |
H-Class | | | (1,343,395,643 | ) | | | (1,718,544,874 | ) |
Net decrease from capital share transactions | | | (104,191,468 | ) | | | (92,143,867 | ) |
Net increase (decrease) in net assets | | | 72,458,850 | | | | (106,334,783 | ) |
| | | | | | | | | |
Net assets: | | | | | | | | |
Beginning of year | | | 25,572,494 | | | | 131,907,277 | |
End of year | | $ | 98,031,344 | | | $ | 25,572,494 | |
| | | | | | | | | |
Capital share activity: | | | | | | | | |
Shares sold | | | | | | | | |
A-Class | | | 36,828 | | | | 92,924 | |
C-Class | | | 5,768 | | | | 5,051 | |
H-Class | | | 4,521,174 | | | | 9,985,485 | |
Shares issued from reinvestment of distributions | | | | | | | | |
A-Class | | | 1,061 | | | | 17 | |
C-Class | | | 336 | | | | 5 | |
H-Class | | | 57,156 | | | | 1,173 | |
Shares redeemed | | | | | | | | |
A-Class | | | (39,563 | ) | | | (98,653 | ) |
C-Class | | | (4,971 | ) | | | (4,660 | ) |
H-Class | | | (4,484,693 | ) | | | (10,762,621 | ) |
Net increase (decrease) in shares | | | 93,096 | | | | (781,279 | ) |
58 | THE RYDEX FUNDS ANNUAL REPORT | SEE NOTES TO FINANCIAL STATEMENTS. |
MONTHLY REBALANCE NASDAQ-100® 2x STRATEGY FUND | |
This table is presented to show selected data for a share outstanding throughout each period and to assist shareholders in evaluating a Fund’s performance for the periods presented.
A-Class | | Year Ended
March 31,
2021 | | | Year Ended
March 31,
2020 | | | Year Ended
March 31,
2019 | | | Year Ended
March 29,
2018 | | | Year Ended
March 31,
2017 | |
Per Share Data |
Net asset value, beginning of period | | $ | 141.86 | | | $ | 134.54 | | | $ | 113.31 | | | $ | 79.32 | | | $ | 54.45 | |
Income (loss) from investment operations: |
Net investment income (loss)a | | | (1.74 | ) | | | .23 | | | | .25 | | | | (.23 | ) | | | (.18 | ) |
Net gain (loss) on investments (realized and unrealized) | | | 233.57 | | | | 7.28 | | | | 20.98 | | | | 34.22 | | | | 25.05 | |
Total from investment operations | | | 231.83 | | | | 7.51 | | | | 21.23 | | | | 33.99 | | | | 24.87 | |
Less distributions from: |
Net investment income | | | — | | | | (.19 | ) | | | — | | | | — | | | | — | |
Net realized gains | | | (18.27 | ) | | | — | | | | — | | | | — | | | | — | |
Total distributions | | | (18.27 | ) | | | (.19 | ) | | | — | | | | — | | | | — | |
Net asset value, end of period | | $ | 355.42 | | | $ | 141.86 | | | $ | 134.54 | | | $ | 113.31 | | | $ | 79.32 | |
|
Total Returnb | | | 164.83 | % | | | 5.56 | % | | | 18.74 | % | | | 42.85 | % | | | 45.65 | % |
Ratios/Supplemental Data |
Net assets, end of period (in thousands) | | $ | 5,504 | | | $ | 2,434 | | | $ | 3,077 | | | $ | 1,990 | | | $ | 1,010 | |
Ratios to average net assets: |
Net investment income (loss) | | | (0.60 | %) | | | 0.15 | % | | | 0.19 | % | | | (0.23 | %) | | | (0.28 | %) |
Total expensesc | | | 1.77 | % | | | 1.83 | % | | | 1.81 | % | | | 1.71 | % | | | 1.72 | % |
Net expensesd,e | | | 1.33 | % | | | 1.34 | % | | | 1.35 | % | | | 1.35 | % | | | 1.35 | % |
Portfolio turnover rate | | | 509 | % | | | 990 | % | | | 467 | % | | | 385 | % | | | 259 | % |
C-Class | | Year Ended
March 31,
2021 | | | Year Ended
March 31,
2020 | | | Year Ended
March 31,
2019 | | | Year Ended
March 29,
2018 | | | Year Ended
March 31,
2017 | |
Per Share Data |
Net asset value, beginning of period | | $ | 136.06 | | | $ | 130.01 | | | $ | 110.32 | | | $ | 77.79 | | | $ | 53.80 | |
Income (loss) from investment operations: |
Net investment income (loss)a | | | (3.70 | ) | | | (.83 | ) | | | (.64 | ) | | | (1.00 | ) | | | (.73 | ) |
Net gain (loss) on investments (realized and unrealized) | | | 223.29 | | | | 7.07 | | | | 20.33 | | | | 33.53 | | | | 24.72 | |
Total from investment operations | | | 219.59 | | | | 6.24 | | | | 19.69 | | | | 32.53 | | | | 23.99 | |
Less distributions from: |
Net investment income | | | — | | | | (.19 | ) | | | — | | | | — | | | | — | |
Net realized gains | | | (18.27 | ) | | | — | | | | — | | | | — | | | | — | |
Total distributions | | | (18.27 | ) | | | (.19 | ) | | | — | | | | — | | | | — | |
Net asset value, end of period | | $ | 337.38 | | | $ | 136.06 | | | $ | 130.01 | | | $ | 110.32 | | | $ | 77.79 | |
|
Total Returnb | | | 162.86 | % | | | 4.77 | % | | | 17.85 | % | | | 41.82 | % | | | 44.52 | % |
Ratios/Supplemental Data |
Net assets, end of period (in thousands) | | $ | 1,751 | | | $ | 552 | | | $ | 476 | | | $ | 170 | | | $ | 89 | |
Ratios to average net assets: |
Net investment income (loss) | | | (1.34 | %) | | | (0.55 | %) | | | (0.52 | %) | | | (1.02 | %) | | | (1.10 | %) |
Total expensesc | | | 2.52 | % | | | 2.58 | % | | | 2.57 | % | | | 2.46 | % | | | 2.47 | % |
Net expensesd,e | | | 2.08 | % | | | 2.09 | % | | | 2.11 | % | | | 2.10 | % | | | 2.10 | % |
Portfolio turnover rate | | | 509 | % | | | 990 | % | | | 467 | % | | | 385 | % | | | 259 | % |
SEE NOTES TO FINANCIAL STATEMENTS. | THE RYDEX FUNDS ANNUAL REPORT | 59 |
MONTHLY REBALANCE NASDAQ-100® 2x STRATEGY FUND | |
FINANCIAL HIGHLIGHTS (concluded) |
This table is presented to show selected data for a share outstanding throughout each period and to assist shareholders in evaluating a Fund’s performance for the periods presented.
H-Class | | Year Ended
March 31,
2021 | | | Year Ended
March 31,
2020 | | | Year Ended
March 31,
2019 | | | Year Ended
March 29,
2018 | | | Year Ended
March 31,
2017 | |
Per Share Data |
Net asset value, beginning of period | | $ | 145.23 | | | $ | 137.80 | | | $ | 116.07 | | | $ | 81.25 | | | $ | 55.79 | |
Income (loss) from investment operations: |
Net investment income (loss)a | | | (1.81 | ) | | | .12 | | | | .19 | | | | (.25 | ) | | | (.23 | ) |
Net gain (loss) on investments (realized and unrealized) | | | 239.19 | | | | 7.50 | | | | 21.54 | | | | 35.07 | | | | 25.69 | |
Total from investment operations | | | 237.38 | | | | 7.62 | | | | 21.73 | | | | 34.82 | | | | 25.46 | |
Less distributions from: |
Net investment income | | | — | | | | (.19 | ) | | | — | | | | — | | | | — | |
Net realized gains | | | (18.27 | ) | | | — | | | | — | | | | — | | | | — | |
Total distributions | | | (18.27 | ) | | | (.19 | ) | | | — | | | | — | | | | — | |
Net asset value, end of period | | $ | 364.34 | | | $ | 145.23 | | | $ | 137.80 | | | $ | 116.07 | | | $ | 81.25 | |
|
Total Return | | | 164.81 | % | | | 5.51 | % | | | 18.72 | % | | | 42.86 | % | | | 45.64 | % |
Ratios/Supplemental Data |
Net assets, end of period (in thousands) | | $ | 90,776 | | | $ | 22,586 | | | $ | 128,354 | | | $ | 25,304 | | | $ | 28,573 | |
Ratios to average net assets: |
Net investment income (loss) | | | (0.60 | %) | | | 0.08 | % | | | 0.15 | % | | | (0.24 | %) | | | (0.35 | %) |
Total expensesc | | | 1.77 | % | | | 1.82 | % | | | 1.81 | % | | | 1.71 | % | | | 1.72 | % |
Net expensesd,e | | | 1.33 | % | | | 1.34 | % | | | 1.35 | % | | | 1.35 | % | | | 1.35 | % |
Portfolio turnover rate | | | 509 | % | | | 990 | % | | | 467 | % | | | 385 | % | | | 259 | % |
a | Net investment income (loss) per share was computed using average shares outstanding throughout the period. |
b | Total return does not reflect the impact of any applicable sales charges. |
c | Does not include expenses of the underlying funds in which the Fund invests. |
d | Net expense information reflects the expense ratios after expense waivers and reimbursements, as applicable. |
e | Net expenses may include expenses that are excluded from the expense limitation agreement. Excluding these expenses, the net expense ratios for the years ended would be: |
| | | 03/31/21 | 03/31/20 | 03/31/19 | 03/29/18 | 03/31/17 |
| | A-Class | 1.33% | 1.33% | 1.35% | 1.35% | 1.35% |
| | C-Class | 2.08% | 2.08% | 2.10% | 2.10% | 2.10% |
| | H-Class | 1.33% | 1.34% | 1.35% | 1.35% | 1.35% |
60 | THE RYDEX FUNDS ANNUAL REPORT | SEE NOTES TO FINANCIAL STATEMENTS. |
PERFORMANCE REPORT AND FUND PROFILE (Unaudited) | March 31, 2021 |
INVERSE NASDAQ-100® STRATEGY FUND
OBJECTIVE: Seeks to provide investment results that match, before fees and expenses, the performance of a specific benchmark on a daily basis. The Fund’s current benchmark is the inverse (opposite) of the performance of the NASDAQ-100® Index (the “underlying index”). The Fund does not seek to achieve its investment objective over a period of time greater than one day.
For the one-year period ended March 31, 2021, Inverse NASDAQ-100® Strategy Fund maintained a daily correlation of over 99% to its benchmark of -100% of the daily price movement of the NASDAQ-100 Index.
Inverse NASDAQ-100® Strategy Fund Investor Class returned -45.03%, while the NASDAQ-100 Index returned 68.88%.
All sectors contributed to the return of the underlying index for the period, led by Information Technology, Consumer Discretionary, and Communication Services.
The holdings contributing the most to the return of the underlying index were Apple, Inc., Amazon.com, Inc., and Microsoft Corp. The holdings detracting the most were Biogen, Inc., Gilead Sciences, Inc., and Peloton Interactive, Inc. Class A.
Due to the compounding of daily returns, leveraged and inverse funds’ returns over periods other than one day will likely differ in amount and possibly direction from the benchmark return for the same period. Investors should monitor their leveraged and inverse funds’ holdings to ensure that they are consistent with their strategies, as frequently as daily.
The effects of compounding may cause the longer-term correlation of the Fund to its benchmark to diminish. The apparent discrepancy between the leveraged and unleveraged indices is the result of compounding, which is described briefly on page 6 of this report.
The Fund may invest in certain of the underlying series of Guggenheim Funds Trust and Guggenheim Strategy Funds Trust, including Guggenheim Ultra Short Duration, Guggenheim Strategy Fund II and Guggenheim Strategy Fund III (collectively, the “Short Term Investment Vehicles”), each of which are open-end management investment companies managed by Guggenheim Investments. The Short Term Investment Vehicles, which launched on March 11, 2014, are offered as short term investment options only to mutual funds, trusts, and other accounts managed by Guggenheim Investments and/or its affiliates, and are not available to the public, with the exception of Guggenheim Ultra Short Duration Fund, which is available to the public. Guggenheim Strategy Fund II and Guggenheim Strategy Fund III do not charge an investment management fee. Guggenheim Ultra Short Duration Fund charges an investment management fee but the Fund’s adviser has agreed to waive fees to the extent necessary to offset the proportionate share of any management fee paid by the Fund with respect to its investment in Guggenheim Ultra Short Duration Fund. For the one-year period ended March 31, 2021, investment in the Short Term Investment Vehicles benefited Fund performance.
Performance displayed represents past performance, which is no guarantee of future results.
Holdings Diversification (Market Exposure as % of Net Assets)
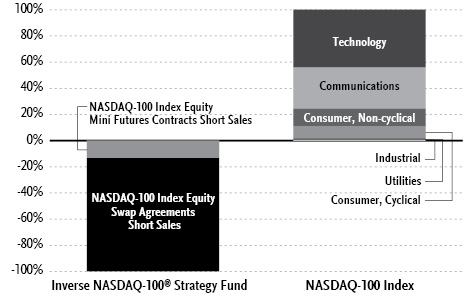
“Holdings Diversification (Market Exposure as % of Net Assets)” excludes any temporary cash investments, investments in Guggenheim Strategy Funds Trust mutual funds, or investments in Guggenheim Ultra Short Duration Fund. Investments in those Funds do not provide “market exposure” to meet the Fund’s investment objective, but will significantly increase the portfolio’s exposure to certain other asset categories (and their associated risks), which may cause the Fund to deviate from its principal investment strategy, including: (i) high yield, high risk debt securities rated below the top four long-term rating categories by a nationally recognized statistical rating organization (also known as “junk bonds”); (ii) securities issued by the U.S. government or its agencies and instrumentalities; (iii) CLOs and similar investments; and (iv) other short-term fixed income securities.
| | THE RYDEX FUNDS ANNUAL REPORT | 61 |
PERFORMANCE REPORT AND FUND PROFILE (Unaudited)(concluded) | March 31, 2021 |
Inception Dates: |
Investor Class | September 3, 1998 |
A-Class | March 31, 2004 |
C-Class | March 7, 2001 |
H-Class | September 18, 2014 |
The Fund invests principally in derivative investments such as swap agreements and futures contracts.
Largest Holdings (% of Total Net Assets) |
Guggenheim Strategy Fund II | 5.5% |
Guggenheim Ultra Short Duration Fund — Institutional Class | 5.4% |
Total | 10.9% |
| | |
“Largest Holdings” excludes any temporary cash or derivative investments. |
Cumulative Fund Performance*
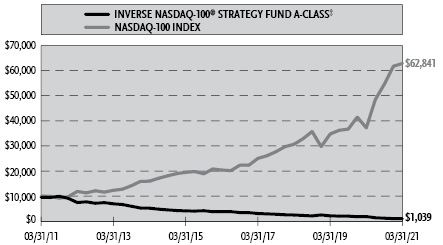

Average Annual Returns*
Periods Ended March 31, 2021
| 1 Year | 5 Year | 10 Year |
Investor Class Shares | (45.03%) | (22.83%) | (19.76%) |
A-Class Shares | (45.17%) | (23.01%) | (19.88%) |
A-Class Shares with sales charge‡ | (47.78%) | (23.76%) | (20.27%) |
C-Class Shares | (45.58%) | (23.61%) | (20.59%) |
C-Class Shares with CDSC§ | (46.12%) | (23.61%) | (20.59%) |
NASDAQ-100 Index | 68.88% | 25.22% | 20.18% |
| 1 Year | 5 Year | Since
Inception
(09/18/14) |
H-Class Shares | (45.21%) | (23.05%) | (20.28%) |
NASDAQ-100 Index | 68.88% | 25.22% | 20.75% |
* | The performance data above represents past performance that is not predictive of future results. The investment return and principal value of an investment in the Fund will fluctuate so that an investor’s shares, when redeemed, may be worth more or less than their original cost. Returns are historical and include changes in principal and reinvested dividends and capital gains and do not reflect the effect of taxes. The NASDAQ-100 Index is an unmanaged index and, unlike the Fund, has no management fees or operating expenses to reduce its reported return. The graphs are based on Investor Class shares and A-Class shares only; performance for C-Class shares and H-Class shares will vary due to differences in fee structures. |
‡ | Fund returns are calculated using the maximum sales charge of 4.75%. |
§ | Fund returns include a CDSC of 1% if redeemed within 12 months of purchase. |
62 | THE RYDEX FUNDS ANNUAL REPORT | |
SCHEDULE OF INVESTMENTS | March 31, 2021 |
INVERSE NASDAQ-100® STRATEGY FUND | |
| | Shares | | | Value | |
MUTUAL FUNDS† - 10.9% |
Guggenheim Strategy Fund II1 | | | 61,417 | | | $ | 1,534,196 | |
Guggenheim Ultra Short Duration Fund — Institutional Class1 | | | 152,495 | | | | 1,518,853 | |
Total Mutual Funds | | | | |
(Cost $2,973,832) | | | | | | | 3,053,049 | |
| | | | | | | | | |
| | | Face
Amount | | | | | |
FEDERAL AGENCY DISCOUNT NOTES†† - 28.7% |
Federal Home Loan Bank |
0.01% due 04/12/212 | | $ | 3,400,000 | | | | 3,399,990 | |
0.01% due 04/14/212 | | | 3,000,000 | | | | 2,999,992 | |
0.01% due 04/09/212 | | | 1,600,000 | | | | 1,599,996 | |
Total Federal Agency Discount Notes | | | | |
(Cost $7,999,978) | | | | | | | 7,999,978 | |
| | | | | | | | | |
FEDERAL AGENCY NOTES†† - 17.9% |
Federal Farm Credit Bank |
0.23% due 06/09/22 | | | 2,500,000 | | | | 2,500,566 | |
0.45% (U.S. Prime Rate - 2.80%, Rate Floor: 0.00%) due 03/14/223 | | | 750,000 | | | | 752,374 | |
0.29% (3 Month U.S. Treasury Bill Rate + 0.27%, Rate Floor: 0.00%) due 05/16/223 | | | 500,000 | | | | 501,142 | |
0.44% (U.S. Prime Rate - 2.81%, Rate Floor: 0.00%) due 05/20/223 | | | 240,000 | | | | 240,966 | |
Farmer Mac |
0.09% (3 Month USD LIBOR - 0.10%, Rate Floor: 0.00%) due 11/22/213 | | | 1,000,000 | | | | 1,000,018 | |
Total Federal Agency Notes | | | | |
(Cost $4,990,320) | | | | | | | 4,995,066 | |
U.S. TREASURY BILLS†† - 12.3% |
U.S. Treasury Bills |
0.09% due 04/01/212,4 | | | 2,000,000 | | | | 2,000,000 | |
0.01% due 04/22/212,5 | | | 226,000 | | | | 225,998 | |
U.S. Cash Management Bill |
0.03% due 08/03/212 | | | 1,200,000 | | | | 1,199,881 | |
Total U.S. Treasury Bills | | | | |
(Cost $3,425,879) | | | | | | | 3,425,879 | |
| | | | | | | | | |
REPURCHASE AGREEMENTS††,6 - 31.8% |
J.P. Morgan Securities LLC
issued 03/31/21 at 0.01%
due 04/01/214 | | | 4,754,350 | | | | 4,754,350 | |
Barclays Capital, Inc.
issued 03/31/21 at 0.01%
due 04/01/214 | | | 2,161,559 | | | | 2,161,559 | |
BofA Securities, Inc.
issued 03/31/21 at 0.01%
due 04/01/214 | | | 1,972,759 | | | | 1,972,759 | |
Total Repurchase Agreements | | | | |
(Cost $8,888,668) | | | | | | | 8,888,668 | |
| | | | | | | | | |
Total Investments - 101.6% | | | | |
(Cost $28,278,677) | | $ | 28,362,640 | |
Other Assets & Liabilities, net - (1.6)% | | | (445,254 | ) |
Total Net Assets - 100.0% | | $ | 27,917,386 | |
Futures Contracts |
Description | | Number of
Contracts | | | Expiration
Date | | | Notional
Amount | | | Value and
Unrealized
Depreciation** | |
Equity Futures Contracts Sold Short† |
NASDAQ-100 Index Mini Futures Contracts | | | 14 | | | | Jun 2021 | | | $ | 3,663,730 | | | $ | (44,931 | ) |
Total Return Swap Agreements |
Counterparty | Index | Financing
Rate Receive | Payment
Frequency | | Maturity
Date | | | Units | | | Notional
Amount | | | Value and
Unrealized
Appreciation | |
OTC Equity Index Swap Agreements Sold Short†† |
Barclays Bank plc | NASDAQ-100 Index | 0.44% (1 Week USD LIBOR + 0.35%) | At Maturity | | | 04/07/21 | | | | 792 | | | $ | 10,364,253 | | | $ | 540,183 | |
BNP Paribas | NASDAQ-100 Index | 0.26% (1 Month USD LIBOR + 0.15%) | At Maturity | | | 04/08/21 | | | | 510 | | | | 6,675,620 | | | | 310,165 | |
Goldman Sachs International | NASDAQ-100 Index | 0.34% (1 Week USD LIBOR + 0.25%) | At Maturity | | | 04/08/21 | | | | 550 | | | | 7,202,048 | | | | 267,473 | |
| | | | | | | | | | | | | | $ | 24,241,921 | | | $ | 1,117,821 | |
SEE NOTES TO FINANCIAL STATEMENTS. | THE RYDEX FUNDS ANNUAL REPORT | 63 |
SCHEDULE OF INVESTMENTS (continued) | March 31, 2021 |
INVERSE NASDAQ-100® STRATEGY FUND | |
** | Includes cumulative appreciation (depreciation). Variation margin is reported within the Statement of Assets and Liabilities. |
† | Value determined based on Level 1 inputs — See Note 4. |
†† | Value determined based on Level 2 inputs — See Note 4. |
1 | Affiliated issuer. |
2 | Rate indicated is the effective yield at the time of purchase. |
3 | Variable rate security. Rate indicated is the rate effective at March 31, 2021. In some instances, the effective rate is limited by a minimum rate floor or a maximum rate cap established by the issuer. The settlement status of a position may also impact the effective rate indicated. In some cases, a position may be unsettled at period end and may not have a stated effective rate. In instances where multiple underlying reference rates and spread amounts are shown, the effective rate is based on a weighted average. |
4 | All or a portion of this security is pledged as equity index swap collateral at March 31, 2021. |
5 | All or a portion of this security is pledged as futures collateral at March 31, 2021. |
6 | Repurchase Agreements — See Note 6. |
| | LIBOR — London Interbank Offered Rate |
| | plc — Public Limited Company |
| | |
| | See Sector Classification in Other Information section. |
The following table summarizes the inputs used to value the Fund’s investments at March 31, 2021 (See Note 4 in the Notes to Financial Statements):
Investments in Securities (Assets) | | Level 1
Quoted
Prices | | | Level 2
Significant
Observable
Inputs | | | Level 3
Significant
Unobservable
Inputs | | | Total | |
Mutual Funds | | $ | 3,053,049 | | | $ | — | | | $ | — | | | $ | 3,053,049 | |
Federal Agency Discount Notes | | | — | | | | 7,999,978 | | | | — | | | | 7,999,978 | |
Federal Agency Notes | | | — | | | | 4,995,066 | | | | — | | | | 4,995,066 | |
U.S. Treasury Bills | | | — | | | | 3,425,879 | | | | — | | | | 3,425,879 | |
Repurchase Agreements | | | — | | | | 8,888,668 | | | | — | | | | 8,888,668 | |
Equity Index Swap Agreements** | | | — | | | | 1,117,821 | | | | — | | | | 1,117,821 | |
Total Assets | | $ | 3,053,049 | | | $ | 26,427,412 | | | $ | — | | | $ | 29,480,461 | |
Investments in Securities (Liabilities) | | Level 1
Quoted
Prices | | | Level 2
Significant
Observable
Inputs | | | Level 3
Significant
Unobservable
Inputs | | | Total | |
Equity Futures Contracts** | | $ | 44,931 | | | $ | — | | | $ | — | | | $ | 44,931 | |
** | This derivative is reported as unrealized appreciation/depreciation at period end. |
64 | THE RYDEX FUNDS ANNUAL REPORT | SEE NOTES TO FINANCIAL STATEMENTS. |
SCHEDULE OF INVESTMENTS (concluded) | March 31, 2021 |
INVERSE NASDAQ-100® STRATEGY FUND | |
Affiliated Transactions
Investments representing 5% or more of the outstanding voting shares of a company, or control of or by, or common control under Guggenheim Investments (“GI”), result in that company being considered an affiliated issuer, as defined in the 1940 Act.
The Fund may invest in certain of the underlying series of Guggenheim Strategy Funds Trust, including Guggenheim Strategy Fund II and Guggenheim Strategy Fund III, (collectively, the “Short Term Investment Vehicles”), each of which are open-end management investment companies managed by GI. The Short Term Investment Vehicles, which launched on March 11, 2014, are offered as short term investment options only to mutual funds, trusts, and other accounts managed by GI and/or its affiliates, and are not available to the public. The Short Term Investment Vehicles pay no investment management fees. The Short Term Investment Vehicles’ annual report on Form N-CSR dated September 30, 2020, is available publicly or upon request. This information is available from the EDGAR database on the SEC’s website at https://www.sec.gov/Archives/edgar/data/1601445/000182126820000133/gug81042-ncsr.htm.
Transactions during the year ended March 31, 2021, in which the company is an affiliated issuer, were as follows:
Security Name | | Value
03/31/20 | | | Additions | | | Reductions | | | Realized
Gain (Loss) | | | Change in
Unrealized
Appreciation
(Depreciation) | | | Value
03/31/21 | | | Shares
03/31/21 | | | Investment
Income | |
Mutual Funds | | | | | | | | | | | | | | | | | | | | | | | | | | | | | | | | |
Guggenheim Strategy Fund II | | $ | 1,621,432 | | | $ | 1,150,000 | | | $ | (1,300,000 | ) | | $ | (23,890 | ) | | $ | 86,654 | | | $ | 1,534,196 | | | | 61,417 | | | $ | 25,931 | |
Guggenheim Ultra Short Duration Fund — Institutional Class | | | 2,781,641 | | | | — | | | | (1,299,999 | ) | | | (15,470 | ) | | | 52,681 | | | | 1,518,853 | | | | 152,495 | | | | 18,729 | |
| | | $ | 4,403,073 | | | $ | 1,150,000 | | | $ | (2,599,999 | ) | | $ | (39,360 | ) | | $ | 139,335 | | | $ | 3,053,049 | | | | | | | $ | 44,660 | |
SEE NOTES TO FINANCIAL STATEMENTS. | THE RYDEX FUNDS ANNUAL REPORT | 65 |
INVERSE NASDAQ-100® STRATEGY FUND | |
STATEMENT OF ASSETS AND LIABILITIES |
March 31, 2021 |
Assets: |
Investments in unaffiliated issuers, at value (cost $16,416,177) | | $ | 16,420,923 | |
Investments in affiliated issuers, at value (cost $2,973,832) | | | 3,053,049 | |
Repurchase agreements, at value (cost $8,888,668) | | | 8,888,668 | |
Unrealized appreciation on OTC swap agreements | | | 1,117,821 | |
Receivables: |
Fund shares sold | | | 52,198 | |
Dividends | | | 3,108 | |
Interest | | | 2,353 | |
Total assets | | | 29,538,120 | |
| | | | | |
Liabilities: |
Payable for: |
Securities purchased | | | 1,199,881 | |
Swap settlement | | | 242,001 | |
Variation margin on futures contracts | | | 57,820 | |
Fund shares redeemed | | | 54,088 | |
Management fees | | | 22,093 | |
Transfer agent and administrative fees | | | 6,700 | |
Portfolio accounting fees | | | 2,490 | |
Trustees’ fees* | | | 457 | |
Distribution and service fees | | | 376 | |
Miscellaneous | | | 34,828 | |
Total liabilities | | | 1,620,734 | |
Commitments and contingent liabilities (Note 12 ) | | | — | |
Net assets | | $ | 27,917,386 | |
| | | | | |
Net assets consist of: |
Paid in capital | | $ | 83,320,856 | |
Total distributable earnings (loss) | | | (55,403,470 | ) |
Net assets | | $ | 27,917,386 | |
| | | | | |
Investor Class: |
Net assets | | $ | 26,017,809 | |
Capital shares outstanding | | | 994,328 | |
Net asset value per share | | $ | 26.17 | |
| | | | | |
A-Class: |
Net assets | | $ | 1,489,371 | |
Capital shares outstanding | | | 59,062 | |
Net asset value per share | | $ | 25.22 | |
Maximum offering price per share (Net asset value divided by 95.25%) | | $ | 26.48 | |
| | | | | |
C-Class: |
Net assets | | $ | 73,344 | |
Capital shares outstanding | | | 3,481 | |
Net asset value per share | | $ | 21.07 | |
| | | | | |
H-Class: |
Net assets | | $ | 336,862 | |
Capital shares outstanding | | | 13,566 | |
Net asset value per share | | $ | 24.83 | |
STATEMENT OF OPERATIONS |
Year Ended March 31, 2021 |
Investment Income: |
Dividends from securities of affiliated issuers | | $ | 44,660 | |
Interest | | | 28,418 | |
Total investment income | | | 73,078 | |
| | | | | |
Expenses: |
Management fees | | | 267,391 | |
Distribution and service fees: |
A-Class | | | 2,946 | |
C-Class | | | 978 | |
H-Class | | | 1,339 | |
Transfer agent and administrative fees | | | 85,110 | |
Registration fees | | | 35,623 | |
Portfolio accounting fees | | | 29,715 | |
Professional fees | | | 22,922 | |
Trustees’ fees* | | | 10,039 | |
Custodian fees | | | 4,662 | |
Interest expense | | | 5 | |
Miscellaneous | | | 883 | |
Total expenses | | | 461,613 | |
Less: |
Expenses waived by Adviser | | | (4,040 | ) |
Net expenses | | | 457,573 | |
Net investment loss | | | (384,495 | ) |
| | | | | |
Net Realized and Unrealized Gain (Loss): |
Net realized gain (loss) on: |
Investments in unaffiliated issuers | | | 7,989 | |
Investments in affiliated issuers | | | (39,360 | ) |
Swap agreements | | | (18,186,753 | ) |
Futures contracts | | | (1,072,867 | ) |
Net realized loss | | | (19,290,991 | ) |
Net change in unrealized appreciation (depreciation) on: |
Investments in unaffiliated issuers | | | (5,203 | ) |
Investments in affiliated issuers | | | 139,335 | |
Swap agreements | | | 573,266 | |
Futures contracts | | | 312,304 | |
Net change in unrealized appreciation (depreciation) | | | 1,019,702 | |
Net realized and unrealized loss | | | (18,271,289 | ) |
Net decrease in net assets resulting from operations | | $ | (18,655,784 | ) |
* | Relates to Trustees not deemed “interested persons” within the meaning of Section 2(a)(19) of the 1940 Act. |
66 | THE RYDEX FUNDS ANNUAL REPORT | SEE NOTES TO FINANCIAL STATEMENTS. |
INVERSE NASDAQ-100® STRATEGY FUND | |
STATEMENTS OF CHANGES IN NET ASSETS |
| | Year Ended
March 31,
2021 | | | Year Ended
March 31,
2020 | |
Increase (Decrease) in Net Assets from Operations: | | | | | | | | |
Net investment income (loss) | | $ | (384,495 | ) | | $ | 23,879 | |
Net realized loss on investments | | | (19,290,991 | ) | | | (3,760,361 | ) |
Net change in unrealized appreciation (depreciation) on investments | | | 1,019,702 | | | | 218,274 | |
Net decrease in net assets resulting from operations | | | (18,655,784 | ) | | | (3,518,208 | ) |
| | | | | | | | | |
Distributions to shareholders: | | | | | | | | |
Investor Class | | | (22,226 | ) | | | (110,169 | ) |
A-Class | | | (1,054 | ) | | | (5,386 | ) |
C-Class | | | (91 | ) | | | (975 | ) |
H-Class | | | (508 | ) | | | (3,185 | ) |
Total distributions to shareholders | | | (23,879 | ) | | | (119,715 | ) |
| | | | | | | | | |
Capital share transactions: | | | | | | | | |
Proceeds from sale of shares | | | | | | | | |
Investor Class | | | 144,882,020 | | | | 178,666,654 | |
A-Class | | | 3,667,695 | | | | 2,499,290 | |
C-Class | | | 193,217 | | | | 232,896 | |
H-Class | | | 6,088,524 | | | | 22,452,898 | |
Distributions reinvested | | | | | | | | |
Investor Class | | | 22,181 | | | | 110,048 | |
A-Class | | | 1,054 | | | | 5,386 | |
C-Class | | | 91 | | | | 940 | |
H-Class | | | 508 | | | | 3,185 | |
Cost of shares redeemed | | | | | | | | |
Investor Class | | | (160,545,957 | ) | | | (122,161,471 | ) |
A-Class | | | (2,125,089 | ) | | | (2,798,481 | ) |
C-Class | | | (281,311 | ) | | | (106,531 | ) |
H-Class | | | (5,965,750 | ) | | | (22,382,916 | ) |
Net increase (decrease) from capital share transactions | | | (14,062,817 | ) | | | 56,521,898 | |
Net increase (decrease) in net assets | | | (32,742,480 | ) | | | 52,883,975 | |
| | | | | | | | | |
Net assets: | | | | | | | | |
Beginning of year | | | 60,659,866 | | | | 7,775,891 | |
End of year | | $ | 27,917,386 | | | $ | 60,659,866 | |
| | | | | | | | | |
Capital share activity: | | | | | | | | |
Shares sold | | | | | | | | |
Investor Class | | | 3,947,180 | | | | 3,532,372 | |
A-Class | | | 119,568 | | | | 52,824 | |
C-Class | | | 7,518 | | | | 5,698 | |
H-Class | | | 185,652 | | | | 484,862 | |
Shares issued from reinvestment of distributions | | | | | | | | |
Investor Class | | | 785 | | | | 2,293 | |
A-Class | | | 39 | | | | 116 | |
C-Class | | | 4 | | | | 24 | |
H-Class | | | 19 | | | | 70 | |
Shares redeemed | | | | | | | | |
Investor Class | | | (4,198,573 | ) | | | (2,408,027 | ) |
A-Class | | | (71,894 | ) | | | (57,338 | ) |
C-Class | | | (10,068 | ) | | | (2,529 | ) |
H-Class | | | (184,954 | ) | | | (478,602 | ) |
Net increase (decrease) in shares | | | (204,724 | ) | | | 1,131,763 | |
SEE NOTES TO FINANCIAL STATEMENTS. | THE RYDEX FUNDS ANNUAL REPORT | 67 |
INVERSE NASDAQ-100® STRATEGY FUND | |
This table is presented to show selected data for a share outstanding throughout each period and to assist shareholders in evaluating a Fund’s performance for the periods presented.
Investor Class | | Year Ended
March 31,
2021 | | | Year Ended
March 31,
2020 | | | Year Ended
March 31,
2019 | | | Year Ended
March 29,
2018 | | | Year Ended
March 31,
2017e | |
Per Share Data |
Net asset value, beginning of period | | $ | 47.65 | | | $ | 54.72 | | | $ | 63.05 | | | $ | 77.68 | | | $ | 96.42 | |
Income (loss) from investment operations: |
Net investment income (loss)a | | | (.40 | ) | | | .09 | | | | .56 | | | | .11 | | | | (.51 | ) |
Net gain (loss) on investments (realized and unrealized) | | | (21.05 | ) | | | (6.83 | ) | | | (8.89 | ) | | | (14.74 | ) | | | (18.23 | ) |
Total from investment operations | | | (21.45 | ) | | | (6.74 | ) | | | (8.33 | ) | | | (14.63 | ) | | | (18.74 | ) |
Less distributions from: |
Net investment income | | | (.03 | ) | | | (.33 | ) | | | — | | | | — | | | | — | |
Total distributions | | | (.03 | ) | | | (.33 | ) | | | — | | | | — | | | | — | |
Net asset value, end of period | | $ | 26.17 | | | $ | 47.65 | | | $ | 54.72 | | | $ | 63.05 | | | $ | 77.68 | |
|
Total Return | | | (45.03 | %) | | | (12.32 | %) | | | (13.21 | %) | | | (18.83 | %) | | | (19.42 | %) |
Ratios/Supplemental Data |
Net assets, end of period (in thousands) | | $ | 26,018 | | | $ | 59,321 | | | $ | 6,473 | | | $ | 5,474 | | | $ | 6,286 | |
Ratios to average net assets: |
Net investment income (loss) | | | (1.28 | %) | | | 0.17 | % | | | 0.93 | % | | | 0.16 | % | | | (0.57 | %) |
Total expensesb | | | 1.54 | % | | | 1.57 | % | | | 1.56 | % | | | 1.46 | % | | | 1.46 | % |
Net expensesc | | | 1.52 | % | | | 1.54 | % | | | 1.54 | % | | | 1.46 | % | | | 1.46 | % |
Portfolio turnover rate | | | 37 | % | | | 37 | % | | | 38 | % | | | — | | | | 486 | % |
A-Class | | Year Ended
March 31,
2021 | | | Year Ended
March 31,
2020 | | | Year Ended
March 31,
2019 | | | Year Ended
March 29,
2018 | | | Year Ended
March 31,
2017e | |
Per Share Data |
Net asset value, beginning of period | | $ | 46.04 | | | $ | 53.01 | | | $ | 61.24 | | | $ | 75.63 | | | $ | 94.01 | |
Income (loss) from investment operations: |
Net investment income (loss)a | | | (0.45 | ) | | | .19 | | | | .41 | | | | (.08 | ) | | | (1.00 | ) |
Net gain (loss) on investments (realized and unrealized) | | | (20.34 | ) | | | (6.83 | ) | | | (8.64 | ) | | | (14.31 | ) | | | (17.38 | ) |
Total from investment operations | | | (20.79 | ) | | | (6.64 | ) | | | (8.23 | ) | | | (14.39 | ) | | | (18.38 | ) |
Less distributions from: |
Net investment income | | | (.03 | ) | | | (.33 | ) | | | — | | | | — | | | | — | |
Total distributions | | | (.03 | ) | | | (.33 | ) | | | — | | | | — | | | | — | |
Net asset value, end of period | | $ | 25.22 | | | $ | 46.04 | | | $ | 53.01 | | | $ | 61.24 | | | $ | 75.63 | |
|
Total Returnd | | | (45.17 | %) | | | (12.53 | %) | | | (13.44 | %) | | | (19.03 | %) | | | (19.54 | %) |
Ratios/Supplemental Data |
Net assets, end of period (in thousands) | | $ | 1,489 | | | $ | 523 | | | $ | 835 | | | $ | 1,037 | | | $ | 2,626 | |
Ratios to average net assets: |
Net investment income (loss) | | | (1.51 | %) | | | 0.39 | % | | | 0.72 | % | | | (0.12 | %) | | | (1.08 | %) |
Total expensesb | | | 1.78 | % | | | 1.81 | % | | | 1.81 | % | | | 1.72 | % | | | 1.70 | % |
Net expensesc | | | 1.76 | % | | | 1.76 | % | | | 1.79 | % | | | 1.72 | % | | | 1.70 | % |
Portfolio turnover rate | | | 37 | % | | | 37 | % | | | 38 | % | | | — | | | | 486 | % |
68 | THE RYDEX FUNDS ANNUAL REPORT | SEE NOTES TO FINANCIAL STATEMENTS. |
INVERSE NASDAQ-100® STRATEGY FUND | |
FINANCIAL HIGHLIGHTS (continued) |
This table is presented to show selected data for a share outstanding throughout each period and to assist shareholders in evaluating a Fund’s performance for the periods presented.
C-Class | | Year Ended
March 31,
2021 | | | Year Ended
March 31,
2020 | | | Year Ended
March 31,
2019 | | | Year Ended
March 29,
2018 | | | Year Ended
March 31,
2017e | |
Per Share Data |
Net asset value, beginning of period | | $ | 38.76 | | | $ | 45.03 | | | $ | 52.43 | | | $ | 65.23 | | | $ | 81.79 | |
Income (loss) from investment operations: |
Net investment income (loss)a | | | (.60 | ) | | | (.17 | ) | | | (.06 | ) | | | (.48 | ) | | | (1.14 | ) |
Net gain (loss) on investments (realized and unrealized) | | | (17.06 | ) | | | (5.77 | ) | | | (7.34 | ) | | | (12.32 | ) | | | (15.42 | ) |
Total from investment operations | | | (17.66 | ) | | | (5.94 | ) | | | (7.40 | ) | | | (12.80 | ) | | | (16.56 | ) |
Less distributions from: |
Net investment income | | | (.03 | ) | | | (.33 | ) | | | — | | | | — | | | | — | |
Total distributions | | | (.03 | ) | | | (.33 | ) | | | — | | | | — | | | | — | |
Net asset value, end of period | | $ | 21.07 | | | $ | 38.76 | | | $ | 45.03 | | | $ | 52.43 | | | $ | 65.23 | |
|
Total Returnd | | | (45.58 | %) | | | (13.19 | %) | | | (14.11 | %) | | | (19.62 | %) | | | (20.26 | %) |
Ratios/Supplemental Data |
Net assets, end of period (in thousands) | | $ | 73 | | | $ | 234 | | | $ | 128 | | | $ | 881 | | | $ | 1,247 | |
Ratios to average net assets: |
Net investment income (loss) | | | (2.26 | %) | | | (0.41 | %) | | | (0.13 | %) | | | (0.84 | %) | | | (1.51 | %) |
Total expensesb | | | 2.55 | % | | | 2.57 | % | | | 2.53 | % | | | 2.46 | % | | | 2.46 | % |
Net expensesc | | | 2.54 | % | | | 2.53 | % | | | 2.53 | % | | | 2.46 | % | | | 2.46 | % |
Portfolio turnover rate | | | 37 | % | | | 37 | % | | | 38 | % | | | — | | | | 486 | % |
SEE NOTES TO FINANCIAL STATEMENTS. | THE RYDEX FUNDS ANNUAL REPORT | 69 |
INVERSE NASDAQ-100® STRATEGY FUND | |
FINANCIAL HIGHLIGHTS (concluded) |
This table is presented to show selected data for a share outstanding throughout each period and to assist shareholders in evaluating a Fund’s performance for the periods presented.
H-Class | | Year Ended
March 31,
2021 | | | Year Ended
March 31,
2020 | | | Year Ended
March 31,
2019 | | | Year Ended
March 29,
2018 | | | Year Ended
March 31,
2017e | |
Per Share Data |
Net asset value, beginning of period | | $ | 45.36 | | | $ | 52.24 | | | $ | 60.37 | | | $ | 74.56 | | | $ | 92.82 | |
Income (loss) from investment operations: |
Net investment income (loss)a | | | (.46 | ) | | | (.02 | ) | | | .37 | | | | .07 | | | | (.86 | ) |
Net gain (loss) on investments (realized and unrealized) | | | (20.04 | ) | | | (6.53 | ) | | | (8.50 | ) | | | (14.26 | ) | | | (17.40 | ) |
Total from investment operations | | | (20.50 | ) | | | (6.55 | ) | | | (8.13 | ) | | | (14.19 | ) | | | (18.26 | ) |
Less distributions from: |
Net investment income | | | (.03 | ) | | | (.33 | ) | | | — | | | | — | | | | — | |
Total distributions | | | (.03 | ) | | | (.33 | ) | | | — | | | | — | | | | — | |
Net asset value, end of period | | $ | 24.83 | | | $ | 45.36 | | | $ | 52.24 | | | $ | 60.37 | | | $ | 74.56 | |
|
Total Return | | | (45.21 | %) | | | (12.54 | %) | | | (13.47 | %) | | | (19.03 | %) | | | (19.65 | %) |
Ratios/Supplemental Data |
Net assets, end of period (in thousands) | | $ | 337 | | | $ | 583 | | | $ | 341 | | | $ | 2,403 | | | $ | 460 | |
Ratios to average net assets: |
Net investment income (loss) | | | (1.51 | %) | | | (0.05 | %) | | | 0.63 | % | | | 0.11 | % | | | (0.95 | %) |
Total expensesb | | | 1.79 | % | | | 1.82 | % | | | 1.81 | % | | | 1.71 | % | | | 1.70 | % |
Net expensesc | | | 1.78 | % | | | 1.79 | % | | | 1.79 | % | | | 1.71 | % | | | 1.70 | % |
Portfolio turnover rate | | | 37 | % | | | 37 | % | | | 38 | % | | | — | | | | 486 | % |
a | Net investment income (loss) per share was computed using average shares outstanding throughout the period. |
b | Does not include expenses of the underlying funds in which the Fund invests. |
c | Net expense information reflects the expense ratios after expense waivers and reimbursements, as applicable. |
d | Total return does not reflect the impact of any applicable sales charges. |
e | Reverse share split — Per share amounts for the periods presented through March 31, 2017, have been restated to reflect a 1:4 reverse share split effective November 4, 2016. |
70 | THE RYDEX FUNDS ANNUAL REPORT | SEE NOTES TO FINANCIAL STATEMENTS. |
PERFORMANCE REPORT AND FUND PROFILE (Unaudited) | March 31, 2021 |
MID-CAP 1.5x STRATEGY FUND
OBJECTIVE: Seeks to provide investment results that correlate, before fees and expenses, to the performance of a specific benchmark for midcap securities on a daily basis. The Fund’s current benchmark is 150% of the performance of the S&P MidCap 400® Index (the “underlying index”). The Fund does not seek to achieve its investment objective over a period of time greater than one day.
For the one-year period ended March 31, 2021, Mid-Cap 1.5x Strategy Fund had a correlation of more than 99% to its benchmark of 150% of the daily price movement of the S&P MidCap 400 Index.
Mid-Cap 1.5x Strategy Fund H-Class returned 136.39%, while the S&P MidCap 400 Index returned 83.46% over the same period.
All sectors contributed to the return of the underlying index for the period, led by Consumer Discretionary, Information Technology, and Industrials.
The holdings contributing the most to the return of the underlying index were Enphase Energy, Inc., Penn National Gaming, Inc., and Etsy, Inc. The holdings detracting the most were Strategic Education, Inc., Quidel Corp., and Kinsdale Capital Group, Inc.
Derivatives in the Fund were used to help provide exposure to the composition of the benchmark in the highest efficient manner and to provide leverage and not for hedging purposes. Derivatives performed as expected.
Due to the compounding of daily returns, leveraged and inverse funds’ returns over periods other than one day will likely differ in amount and possibly direction from the benchmark return for the same period. Investors should monitor their leveraged and inverse funds’ holdings to ensure that they are consistent with their strategies, as frequently as daily.
The effects of compounding may cause the longer-term correlation of the Fund to its benchmark to diminish. The apparent discrepancy between the leveraged and unleveraged indices is the result of compounding, which is described briefly on page 6 of this report.
The Fund may invest in certain of the underlying series of Guggenheim Funds Trust and Guggenheim Strategy Funds Trust, including Guggenheim Ultra Short Duration, Guggenheim Strategy Fund II and Guggenheim Strategy Fund III (collectively, the “Short Term Investment Vehicles”), each of which are open-end management investment companies managed by Guggenheim Investments. The Short Term Investment Vehicles, which launched on March 11, 2014, are offered as short term investment options only to mutual funds, trusts, and other accounts managed by Guggenheim Investments and/or its affiliates, and are not available to the public, with the exception of Guggenheim Ultra Short Duration Fund, which is available to the public. Guggenheim Strategy Fund II and Guggenheim Strategy Fund III do not charge an investment management fee. Guggenheim Ultra Short Duration Fund charges an investment management fee but the Fund’s adviser has agreed to waive fees to the extent necessary to offset the proportionate share of any management fee paid by the Fund with respect to its investment in Guggenheim Ultra Short Duration Fund. For the one-year period ended March 31, 2021, investment in the Short Term Investment Vehicles benefited Fund performance.
Performance displayed represents past performance, which is no guarantee of future results.
Holdings Diversification (Market Exposure as % of Net Assets)

“Holdings Diversification (Market Exposure as % of Net Assets)” excludes any temporary cash investments, investments in Guggenheim Strategy Funds Trust mutual funds, or investments in Guggenheim Ultra Short Duration Fund. Investments in those Funds do not provide “market exposure” to meet the Fund’s investment objective, but will significantly increase the portfolio’s exposure to certain other asset categories (and their associated risks), which may cause the Fund to deviate from its principal investment strategy, including: (i) high yield, high risk debt securities rated below the top four long-term rating categories by a nationally recognized statistical rating organization (also known as “junk bonds”); (ii) securities issued by the U.S. government or its agencies and instrumentalities; (iii) CLOs and similar investments; and (iv) other short-term fixed income securities.
| | THE RYDEX FUNDS ANNUAL REPORT | 71 |
PERFORMANCE REPORT AND FUND PROFILE (Unaudited)(concluded) | March 31, 2021 |
Inception Dates: |
A-Class | March 31, 2004 |
C-Class | August 20, 2001 |
H-Class | August 16, 2001 |
Ten Largest Holdings (% of Total Net Assets) |
Guggenheim Ultra Short Duration Fund — Institutional Class | 13.8% |
Guggenheim Strategy Fund II | 7.4% |
SolarEdge Technologies, Inc. | 0.3% |
Bio-Techne Corp. | 0.3% |
Cognex Corp. | 0.3% |
PTC, Inc. | 0.3% |
Charles River Laboratories International, Inc. | 0.3% |
Fair Isaac Corp. | 0.3% |
Williams-Sonoma, Inc. | 0.3% |
Molina Healthcare, Inc. | 0.3% |
Top Ten Total | 23.6% |
| | |
“Ten Largest Holdings” excludes any temporary cash or derivative investments. |
Cumulative Fund Performance*
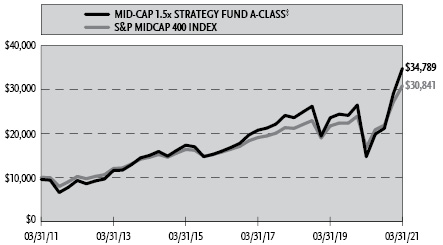
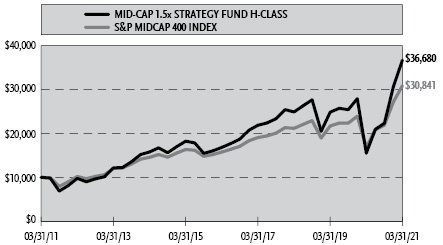
Average Annual Returns*
Periods Ended March 31, 2021
| 1 Year | 5 Year | 10 Year |
A-Class Shares | 136.41% | 16.86% | 13.83% |
A-Class Shares with sales charge‡ | 125.20% | 15.73% | 13.28% |
C-Class Shares | 134.67% | 16.00% | 12.99% |
C-Class Shares with CDSC§ | 133.67% | 16.00% | 12.99% |
H-Class Shares | 136.39% | 16.87% | 13.88% |
S&P MidCap 400 Index | 83.46% | 14.37% | 11.92% |
* | The performance data above represents past performance that is not predictive of future results. The investment return and principal value of an investment in the Fund will fluctuate so that an investor’s shares, when redeemed, may be worth more or less than their original cost. Returns are historical and include changes in principal and reinvested dividends and capital gains and do not reflect the effect of taxes. The S&P MidCap 400 Index is an unmanaged index and, unlike the Fund, has no management fees or operating expenses to reduce its reported return. The graphs are based on A-Class shares and H-Class shares only; performance for C-Class shares will vary due to differences in fee structures. |
‡ | Fund returns are calculated using the maximum sales charge of 4.75%. |
§ | Fund returns include a CDSC of 1% if redeemed within 12 months of purchase. |
72 | THE RYDEX FUNDS ANNUAL REPORT | |
SCHEDULE OF INVESTMENTS | March 31, 2021 |
MID-CAP 1.5x STRATEGY FUND | |
| | Shares | | | Value | |
COMMON STOCKS† - 52.6% |
| | | | | | | | | |
Financial - 12.9% |
Signature Bank | | | 227 | | | $ | 51,325 | |
Medical Properties Trust, Inc. REIT | | | 2,306 | | | | 49,072 | |
Camden Property Trust REIT | | | 388 | | | | 42,645 | |
Brown & Brown, Inc. | | | 931 | | | | 42,556 | |
East West Bancorp, Inc. | | | 563 | | | | 41,549 | |
First Horizon Corp. | | | 2,208 | | | | 37,337 | |
Jones Lang LaSalle, Inc.* | | | 203 | | | | 36,345 | |
Alleghany Corp.* | | | 56 | | | | 35,072 | |
Reinsurance Group of America, Inc. — Class A | | | 270 | | | | 34,033 | |
Omega Healthcare Investors, Inc. REIT | | | 922 | | | | 33,773 | |
CyrusOne, Inc. REIT | | | 479 | | | | 32,438 | |
RenaissanceRe Holdings Ltd. | | | 202 | | | | 32,371 | |
Lamar Advertising Co. — Class A REIT | | | 344 | | | | 32,309 | |
Commerce Bancshares, Inc. | | | 419 | | | | 32,100 | |
STORE Capital Corp. REIT | | | 954 | | | | 31,959 | |
American Financial Group, Inc. | | | 278 | | | | 31,720 | |
National Retail Properties, Inc. REIT | | | 697 | | | | 30,717 | |
SEI Investments Co. | | | 474 | | | | 28,881 | |
TCF Financial Corp. | | | 607 | | | | 28,201 | |
Prosperity Bancshares, Inc. | | | 369 | | | | 27,634 | |
Kilroy Realty Corp. REIT | | | 421 | | | | 27,630 | |
Synovus Financial Corp. | | | 591 | | | | 27,038 | |
Pinnacle Financial Partners, Inc. | | | 302 | | | | 26,775 | |
Stifel Financial Corp. | | | 417 | | | | 26,713 | |
First Financial Bankshares, Inc. | | | 566 | | | | 26,449 | |
Rexford Industrial Realty, Inc. REIT | | | 523 | | | | 26,359 | |
Life Storage, Inc. REIT | | | 300 | | | | 25,785 | |
Apartment Income REIT Corp. | | | 592 | | | | 25,314 | |
Affiliated Managers Group, Inc. | | | 169 | | | | 25,186 | |
First American Financial Corp. | | | 437 | | | | 24,756 | |
Old Republic International Corp. | | | 1,125 | | | | 24,570 | |
Cullen/Frost Bankers, Inc. | | | 224 | | | | 24,362 | |
Jefferies Financial Group, Inc. | | | 805 | | | | 24,230 | |
SLM Corp. | | | 1,333 | | | | 23,954 | |
Brixmor Property Group, Inc. REIT | | | 1,180 | | | | 23,871 | |
American Campus Communities, Inc. REIT | | | 547 | | | | 23,614 | |
First Industrial Realty Trust, Inc. REIT | | | 513 | | | | 23,490 | |
Interactive Brokers Group, Inc. — Class A | | | 321 | | | | 23,446 | |
New York Community Bancorp, Inc. | | | 1,852 | | | | 23,372 | |
Primerica, Inc. | | | 156 | | | | 23,060 | |
EastGroup Properties, Inc. REIT | | | 158 | | | | 22,638 | |
Alliance Data Systems Corp. | | | 198 | | | | 22,194 | |
Valley National Bancorp | | | 1,613 | | | | 22,163 | |
Evercore, Inc. — Class A | | | 167 | | | | 22,000 | |
Glacier Bancorp, Inc. | | | 379 | | | | 21,633 | |
Essent Group Ltd. | | | 449 | | | | 21,323 | |
Janus Henderson Group plc | | | 678 | | | | 21,120 | |
Cousins Properties, Inc. REIT | | | 591 | | | | 20,892 | |
Douglas Emmett, Inc. REIT | | | 656 | | | | 20,598 | |
CoreSite Realty Corp. REIT | | | 170 | | | | 20,375 | |
Park Hotels & Resorts, Inc. REIT* | | | 940 | | | | 20,285 | |
CIT Group, Inc. | | | 392 | | | | 20,192 | |
United Bankshares, Inc. | | | 513 | | | | 19,792 | |
Webster Financial Corp. | | | 359 | | | | 19,785 | |
Bank OZK | | | 481 | | | | 19,649 | |
Kemper Corp. | | | 245 | | | | 19,531 | |
Spirit Realty Capital, Inc. REIT | | | 457 | | | | 19,423 | |
SL Green Realty Corp. REIT | | | 276 | | | | 19,317 | |
Hanover Insurance Group, Inc. | | | 145 | | | | 18,772 | |
MGIC Investment Corp. | | | 1,346 | | | | 18,642 | |
Highwoods Properties, Inc. REIT | | | 413 | | | | 17,734 | |
Sterling Bancorp | | | 769 | | | | 17,702 | |
PacWest Bancorp | | | 464 | | | | 17,702 | |
Rayonier, Inc. REIT | | | 548 | | | | 17,673 | |
RLI Corp. | | | 158 | | | | 17,628 | |
Selective Insurance Group, Inc. | | | 238 | | | | 17,265 | |
Wintrust Financial Corp. | | | 226 | | | | 17,131 | |
Healthcare Realty Trust, Inc. REIT | | | 556 | | | | 16,858 | |
Home BancShares, Inc. | | | 604 | | | | 16,338 | |
Hudson Pacific Properties, Inc. REIT | | | 600 | | | | 16,278 | |
FNB Corp. | | | 1,278 | | | | 16,231 | |
UMB Financial Corp. | | | 172 | | | | 15,881 | |
Umpqua Holdings Corp. | | | 876 | | | | 15,374 | |
Brighthouse Financial, Inc.* | | | 347 | | | | 15,355 | |
Physicians Realty Trust REIT | | | 837 | | | | 14,790 | |
Sabra Health Care REIT, Inc. | | | 838 | | | | 14,548 | |
Hancock Whitney Corp. | | | 345 | | | | 14,493 | |
Bank of Hawaii Corp. | | | 160 | | | | 14,318 | |
Texas Capital Bancshares, Inc.* | | | 201 | | | | 14,255 | |
PotlatchDeltic Corp. REIT | | | 266 | | | | 14,077 | |
Kinsale Capital Group, Inc. | | | 85 | | | | 14,008 | |
JBG SMITH Properties REIT | | | 440 | | | | 13,988 | |
EPR Properties REIT | | | 297 | | | | 13,837 | |
CNO Financial Group, Inc. | | | 535 | | | | 12,995 | |
Associated Banc-Corp. | | | 608 | | | | 12,975 | |
Weingarten Realty Investors REIT | | | 477 | | | | 12,836 | |
Pebblebrook Hotel Trust REIT | | | 522 | | | | 12,679 | |
BancorpSouth Bank | | | 383 | | | | 12,440 | |
PS Business Parks, Inc. REIT | | | 80 | | | | 12,366 | |
Cathay General Bancorp | | | 297 | | | | 12,112 | |
Corporate Office Properties Trust REIT | | | 446 | | | | 11,743 | |
Federated Hermes, Inc. — Class B | | | 374 | | | | 11,706 | |
PROG Holdings, Inc. | | | 269 | | | | 11,645 | |
Fulton Financial Corp. | | | 645 | | | | 10,984 | |
Navient Corp. | | | 731 | | | | 10,461 | |
International Bancshares Corp. | | | 221 | | | | 10,259 | |
Washington Federal, Inc. | | | 302 | | | | 9,302 | |
LendingTree, Inc.* | | | 43 | | | | 9,159 | |
Trustmark Corp. | | | 252 | | | | 8,482 | |
Service Properties Trust REIT | | | 655 | | | | 7,768 | |
Urban Edge Properties REIT | | | 437 | | | | 7,219 | |
Genworth Financial, Inc. — Class A* | | | 2,012 | | | | 6,680 | |
Mercury General Corp. | | | 106 | | | | 6,446 | |
Macerich Co. REIT1 | | | 461 | | | | 5,394 | |
Total Financial | | | | | | | 2,201,450 | |
| | | | | | | | | |
Industrial - 10.7% |
Cognex Corp. | | | 700 | | | | 58,093 | |
XPO Logistics, Inc.* | | | 406 | | | | 50,060 | |
Graco, Inc. | | | 671 | | | | 48,057 | |
SEE NOTES TO FINANCIAL STATEMENTS. | THE RYDEX FUNDS ANNUAL REPORT | 73 |
SCHEDULE OF INVESTMENTS (continued) | March 31, 2021 |
MID-CAP 1.5x STRATEGY FUND | |
| | Shares | | | Value | |
Toro Co. | | | 428 | | | $ | 44,144 | |
Nordson Corp. | | | 215 | | | | 42,716 | |
Lennox International, Inc. | | | 137 | | | | 42,688 | |
Trex Company, Inc.* | | | 460 | | | | 42,108 | |
Hubbell, Inc. | | | 216 | | | | 40,368 | |
Universal Display Corp. | | | 170 | | | | 40,251 | |
Owens Corning | | | 417 | | | | 38,401 | |
Builders FirstSource, Inc.* | | | 821 | | | | 38,070 | |
AECOM* | | | 587 | | | | 37,632 | |
AptarGroup, Inc. | | | 259 | | | | 36,692 | |
Middleby Corp.* | | | 221 | | | | 36,631 | |
Axon Enterprise, Inc.* | | | 254 | | | | 36,175 | |
AGCO Corp. | | | 245 | | | | 35,194 | |
Carlisle Companies, Inc. | | | 212 | | | | 34,891 | |
Arrow Electronics, Inc.* | | | 297 | | | | 32,914 | |
Oshkosh Corp. | | | 272 | | | | 32,276 | |
ITT, Inc. | | | 344 | | | | 31,273 | |
Tetra Tech, Inc. | | | 216 | | | | 29,315 | |
Donaldson Company, Inc. | | | 501 | | | | 29,138 | |
Lincoln Electric Holdings, Inc. | | | 237 | | | | 29,137 | |
II-VI, Inc.* | | | 417 | | | | 28,510 | |
Woodward, Inc. | | | 233 | | | | 28,107 | |
Jabil, Inc. | | | 538 | | | | 28,062 | |
TopBuild Corp.* | | | 131 | | | | 27,435 | |
Littelfuse, Inc. | | | 98 | | | | 25,915 | |
Sonoco Products Co. | | | 399 | | | | 25,257 | |
Landstar System, Inc. | | | 153 | | | | 25,254 | |
MDU Resources Group, Inc. | | | 797 | | | | 25,193 | |
Stericycle, Inc.* | | | 364 | | | | 24,574 | |
Coherent, Inc.* | | | 97 | | | | 24,530 | |
EMCOR Group, Inc. | | | 218 | | | | 24,451 | |
Acuity Brands, Inc. | | | 143 | | | | 23,595 | |
Louisiana-Pacific Corp. | | | 423 | | | | 23,460 | |
Knight-Swift Transportation Holdings, Inc. | | | 487 | | | | 23,420 | |
Regal Beloit Corp. | | | 161 | | | | 22,971 | |
National Instruments Corp. | | | 523 | | | | 22,586 | |
Eagle Materials, Inc.* | | | 167 | | | | 22,446 | |
Timken Co. | | | 271 | | | | 21,997 | |
MSA Safety, Inc. | | | 145 | | | | 21,753 | |
KBR, Inc. | | | 560 | | | | 21,498 | |
MasTec, Inc.* | | | 224 | | | | 20,989 | |
Vontier Corp.* | | | 670 | | | | 20,281 | |
Colfax Corp.* | | | 459 | | | | 20,109 | |
Flowserve Corp. | | | 518 | | | | 20,104 | |
Valmont Industries, Inc. | | | 84 | | | | 19,964 | |
Curtiss-Wright Corp. | | | 163 | | | | 19,332 | |
SYNNEX Corp. | | | 164 | | | | 18,834 | |
nVent Electric plc | | | 669 | | | | 18,672 | |
Hexcel Corp.* | | | 332 | | | | 18,592 | |
Crane Co. | | | 197 | | | | 18,500 | |
Simpson Manufacturing Company, Inc. | | | 172 | | | | 17,842 | |
Clean Harbors, Inc.* | | | 200 | | | | 16,812 | |
Avnet, Inc. | | | 395 | | | | 16,396 | |
Ryder System, Inc. | | | 213 | | | | 16,113 | |
Mercury Systems, Inc.* | | | 223 | | | | 15,755 | |
EnerSys | | | 170 | | | | 15,436 | |
Kirby Corp.* | | | 239 | | | | 14,407 | |
Kennametal, Inc. | | | 332 | | | | 13,270 | |
Silgan Holdings, Inc. | | | 311 | | | | 13,071 | |
GATX Corp. | | | 140 | | | | 12,984 | |
Terex Corp. | | | 276 | | | | 12,715 | |
Vishay Intertechnology, Inc. | | | 527 | | | | 12,690 | |
Fluor Corp.* | | | 498 | | | | 11,499 | |
Dycom Industries, Inc.* | | | 122 | | | | 11,328 | |
Energizer Holdings, Inc. | | | 231 | | | | 10,963 | |
Werner Enterprises, Inc. | | | 227 | | | | 10,708 | |
Trinity Industries, Inc. | | | 326 | | | | 9,288 | |
Worthington Industries, Inc. | | | 137 | | | | 9,192 | |
Belden, Inc. | | | 178 | | | | 7,898 | |
Greif, Inc. — Class A | | | 105 | | | | 5,985 | |
Total Industrial | | | | | | | 1,826,967 | |
| | | | | | | | | |
Consumer, Non-cyclical - 9.4% |
Bio-Techne Corp. | | | 154 | | | | 58,817 | |
Charles River Laboratories International, Inc.* | | | 198 | | | | 57,386 | |
Molina Healthcare, Inc.* | | | 231 | | | | 53,999 | |
Darling Ingredients, Inc.* | | | 646 | | | | 47,533 | |
Masimo Corp.* | | | 202 | | | | 46,391 | |
Boston Beer Company, Inc. — Class A* | | | 37 | | | | 44,632 | |
Repligen Corp.* | | | 203 | | | | 39,465 | |
PRA Health Sciences, Inc.* | | | 257 | | | | 39,406 | |
WEX, Inc.* | | | 176 | | | | 36,823 | |
Jazz Pharmaceuticals plc* | | | 224 | | | | 36,819 | |
Penumbra, Inc.* | | | 135 | | | | 36,528 | |
Neurocrine Biosciences, Inc.* | | | 372 | | | | 36,177 | |
Amedisys, Inc.* | | | 131 | | | | 34,688 | |
Service Corporation International | | | 674 | | | | 34,408 | |
Encompass Health Corp. | | | 395 | | | | 32,351 | |
United Therapeutics Corp.* | | | 177 | | | | 29,607 | |
Chemed Corp. | | | 64 | | | | 29,428 | |
Hill-Rom Holdings, Inc. | | | 264 | | | | 29,167 | |
Exelixis, Inc.* | | | 1,240 | | | | 28,011 | |
Arrowhead Pharmaceuticals, Inc.* | | | 413 | | | | 27,386 | |
Paylocity Holding Corp.* | | | 149 | | | | 26,795 | |
Post Holdings, Inc.* | | | 238 | | | | 25,161 | |
Syneos Health, Inc.* | | | 329 | | | | 24,955 | |
LHC Group, Inc.* | | | 126 | | | | 24,092 | |
Ingredion, Inc. | | | 267 | | | | 24,009 | |
CoreLogic, Inc. | | | 291 | | | | 23,062 | |
HealthEquity, Inc.* | | | 330 | | | | 22,440 | |
Haemonetics Corp.* | | | 202 | | | | 22,424 | |
Tenet Healthcare Corp.* | | | 422 | | | | 21,944 | |
ManpowerGroup, Inc. | | | 219 | | | | 21,659 | |
Halozyme Therapeutics, Inc.* | | | 506 | | | | 21,095 | |
Helen of Troy Ltd.* | | | 97 | | | | 20,434 | |
Acadia Healthcare Company, Inc.* | | | 354 | | | | 20,228 | |
ASGN, Inc.* | | | 211 | | | | 20,138 | |
Grand Canyon Education, Inc.* | | | 186 | | | | 19,920 | |
Quidel Corp.* | | | 153 | | | | 19,573 | |
STAAR Surgical Co.* | | | 185 | | | | 19,501 | |
Integra LifeSciences Holdings Corp.* | | | 282 | | | | 19,484 | |
FTI Consulting, Inc.* | | | 136 | | | | 19,055 | |
74 | THE RYDEX FUNDS ANNUAL REPORT | SEE NOTES TO FINANCIAL STATEMENTS. |
SCHEDULE OF INVESTMENTS (continued) | March 31, 2021 |
MID-CAP 1.5x STRATEGY FUND | |
| | Shares | | | Value | |
Globus Medical, Inc. — Class A* | | | 307 | | | $ | 18,933 | |
Neogen Corp.* | | | 212 | | | | 18,845 | |
Sabre Corp.* | | | 1,262 | | | | 18,690 | |
Flowers Foods, Inc. | | | 783 | | | | 18,635 | |
Medpace Holdings, Inc.* | | | 109 | | | | 17,881 | |
Emergent BioSolutions, Inc.* | | | 180 | | | | 16,724 | |
ICU Medical, Inc.* | | | 78 | | | | 16,024 | |
H&R Block, Inc. | | | 729 | | | | 15,892 | |
Brink’s Co. | | | 197 | | | | 15,608 | |
Avis Budget Group, Inc.* | | | 205 | | | | 14,871 | |
Nektar Therapeutics* | | | 724 | | | | 14,480 | |
LivaNova plc* | | | 193 | | | | 14,230 | |
Hain Celestial Group, Inc.* | | | 326 | | | | 14,214 | |
LiveRamp Holdings, Inc.* | | | 266 | | | | 13,800 | |
Lancaster Colony Corp. | | | 78 | | | | 13,678 | |
NuVasive, Inc.* | | | 204 | | | | 13,374 | |
Grocery Outlet Holding Corp.* | | | 345 | | | | 12,727 | |
Sprouts Farmers Market, Inc.* | | | 469 | | | | 12,485 | |
Sanderson Farms, Inc. | | | 79 | | | | 12,307 | |
Cantel Medical Corp.* | | | 150 | | | | 11,976 | |
Insperity, Inc. | | | 141 | | | | 11,807 | |
TreeHouse Foods, Inc.* | | | 222 | | | | 11,597 | |
Patterson Companies, Inc. | | | 346 | | | | 11,055 | |
Coty, Inc. — Class A* | | | 1,128 | | | | 10,163 | |
Ligand Pharmaceuticals, Inc. — Class B* | | | 66 | | | | 10,062 | |
John Wiley & Sons, Inc. — Class A | | | 173 | | | | 9,377 | |
Graham Holdings Co. — Class B | | | 16 | | | | 8,999 | |
Strategic Education, Inc. | | | 97 | | | | 8,915 | |
Avanos Medical, Inc.* | | | 191 | | | | 8,354 | |
Adtalem Global Education, Inc.* | | | 199 | | | | 7,868 | |
WW International, Inc.* | | | 189 | | | | 5,912 | |
Pilgrim’s Pride Corp.* | | | 194 | | | | 4,615 | |
Tootsie Roll Industries, Inc. | | | 72 | | | | 2,384 | |
Total Consumer, Non-cyclical | | | | | | | 1,611,473 | |
| | | | | | | | | |
Consumer, Cyclical - 8.4% |
Williams-Sonoma, Inc. | | | 305 | | | | 54,656 | |
Five Below, Inc.* | | | 222 | | | | 42,355 | |
Lithia Motors, Inc. — Class A | | | 106 | | | | 41,350 | |
Scotts Miracle-Gro Co. — Class A | | | 162 | | | | 39,685 | |
Lear Corp. | | | 217 | | | | 39,331 | |
RH* | | | 65 | | | | 38,779 | |
Kohl’s Corp. | | | 627 | | | | 37,375 | |
Deckers Outdoor Corp.* | | | 112 | | | | 37,007 | |
Gentex Corp. | | | 969 | | | | 34,564 | |
Watsco, Inc. | | | 131 | | | | 34,158 | |
Casey’s General Stores, Inc. | | | 147 | | | | 31,780 | |
Churchill Downs, Inc. | | | 138 | | | | 31,384 | |
Polaris, Inc. | | | 232 | | | | 30,972 | |
Capri Holdings Ltd.* | | | 601 | | | | 30,651 | |
Thor Industries, Inc. | | | 220 | | | | 29,643 | |
IAA, Inc.* | | | 535 | | | | 29,500 | |
Brunswick Corp. | | | 309 | | | | 29,469 | |
Marriott Vacations Worldwide Corp.* | | | 164 | | | | 28,566 | |
Tempur Sealy International, Inc. | | | 759 | | | | 27,749 | |
Mattel, Inc.* | | | 1,384 | | | | 27,569 | |
Wyndham Hotels & Resorts, Inc. | | | 370 | | | | 25,819 | |
JetBlue Airways Corp.* | | | 1,256 | | | | 25,547 | |
Toll Brothers, Inc. | | | 445 | | | | 25,245 | |
Texas Roadhouse, Inc. — Class A* | | | 260 | | | | 24,944 | |
BJ’s Wholesale Club Holdings, Inc.* | | | 546 | | | | 24,494 | |
Harley-Davidson, Inc. | | | 610 | | | | 24,461 | |
Foot Locker, Inc. | | | 414 | | | | 23,287 | |
Skechers USA, Inc. — Class A* | | | 544 | | | | 22,690 | |
YETI Holdings, Inc.* | | | 298 | | | | 21,519 | |
Fox Factory Holding Corp.* | | | 166 | | | | 21,092 | |
Travel + Leisure Co. | | | 342 | | | | 20,917 | |
AutoNation, Inc.* | | | 219 | | | | 20,415 | |
Dick’s Sporting Goods, Inc. | | | 261 | | | | 19,875 | |
Ollie’s Bargain Outlet Holdings, Inc.* | | | 226 | | | | 19,662 | |
Boyd Gaming Corp.* | | | 320 | | | | 18,867 | |
American Eagle Outfitters, Inc. | | | 595 | | | | 17,398 | |
Avient Corp. | | | 363 | | | | 17,159 | |
MSC Industrial Direct Company, Inc. — Class A | | | 186 | | | | 16,775 | |
Adient plc* | | | 374 | | | | 16,531 | |
KB Home | | | 354 | | | | 16,471 | |
Nordstrom, Inc.* | | | 433 | | | | 16,398 | |
Goodyear Tire & Rubber Co.* | | | 928 | | | | 16,305 | |
Cracker Barrel Old Country Store, Inc. | | | 94 | | | | 16,251 | |
Taylor Morrison Home Corp. — Class A* | | | 512 | | | | 15,775 | |
Carter’s, Inc.* | | | 175 | | | | 15,563 | |
Wingstop, Inc. | | | 118 | | | | 15,006 | |
Murphy USA, Inc. | | | 101 | | | | 14,601 | |
Univar Solutions, Inc.* | | | 673 | | | | 14,497 | |
Wendy’s Co. | | | 712 | | | | 14,425 | |
Dana, Inc. | | | 575 | | | | 13,990 | |
Six Flags Entertainment Corp.* | | | 301 | | | | 13,987 | |
Visteon Corp.* | | | 111 | | | | 13,536 | |
Columbia Sportswear Co. | | | 121 | | | | 12,781 | |
Choice Hotels International, Inc.* | | | 115 | | | | 12,338 | |
Papa John’s International, Inc. | | | 131 | | | | 11,612 | |
FirstCash, Inc. | | | 163 | | | | 10,704 | |
Nu Skin Enterprises, Inc. — Class A | | | 202 | | | | 10,684 | |
Urban Outfitters, Inc.* | | | 272 | | | | 10,116 | |
Jack in the Box, Inc. | | | 91 | | | | 9,990 | |
Tri Pointe Homes, Inc.* | | | 474 | | | | 9,651 | |
Herman Miller, Inc. | | | 234 | | | | 9,629 | |
World Fuel Services Corp. | | | 251 | | | | 8,835 | |
Cinemark Holdings, Inc.* | | | 429 | | | | 8,756 | |
Scientific Games Corp. — Class A* | | | 224 | | | | 8,628 | |
Healthcare Services Group, Inc. | | | 297 | | | | 8,325 | |
KAR Auction Services, Inc.* | | | 516 | | | | 7,740 | |
Total Consumer, Cyclical | | | | | | | 1,439,834 | |
| | | | | | | | | |
Technology - 4.3% |
PTC, Inc.* | | | 418 | | | | 57,538 | |
Fair Isaac Corp.* | | | 116 | | | | 56,382 | |
Cree, Inc.* | | | 458 | | | | 49,524 | |
Ceridian HCM Holding, Inc.* | | | 521 | | | | 43,905 | |
MKS Instruments, Inc. | | | 220 | | | | 40,792 | |
Manhattan Associates, Inc.* | | | 254 | | | | 29,815 | |
Lumentum Holdings, Inc.* | | | 301 | | | | 27,496 | |
CDK Global, Inc. | | | 484 | | | | 26,165 | |
SEE NOTES TO FINANCIAL STATEMENTS. | THE RYDEX FUNDS ANNUAL REPORT | 75 |
SCHEDULE OF INVESTMENTS (continued) | March 31, 2021 |
MID-CAP 1.5x STRATEGY FUND | |
| | Shares | | | Value | |
Concentrix Corp.* | | | 165 | | | $ | 24,704 | |
Silicon Laboratories, Inc.* | | | 175 | | | | 24,687 | |
CACI International, Inc. — Class A* | | | 100 | | | | 24,666 | |
Brooks Automation, Inc. | | | 295 | | | | 24,087 | |
MAXIMUS, Inc. | | | 244 | | | | 21,726 | |
CMC Materials, Inc. | | | 116 | | | | 20,508 | |
J2 Global, Inc.* | | | 169 | | | | 20,256 | |
NCR Corp.* | | | 517 | | | | 19,620 | |
Cirrus Logic, Inc.* | | | 231 | | | | 19,587 | |
Science Applications International Corp. | | | 231 | | | | 19,309 | |
Synaptics, Inc.* | | | 139 | | | | 18,823 | |
Sailpoint Technologies Holdings, Inc.* | | | 364 | | | | 18,433 | |
Semtech Corp.* | | | 258 | | | | 17,802 | |
ACI Worldwide, Inc.* | | | 466 | | | | 17,731 | |
Teradata Corp.* | | | 433 | | | | 16,688 | |
Xerox Holdings Corp. | | | 663 | | | | 16,091 | |
Perspecta, Inc. | | | 544 | | | | 15,803 | |
Qualys, Inc.* | | | 134 | | | | 14,041 | |
Blackbaud, Inc.* | | | 192 | | | | 13,647 | |
CommVault Systems, Inc.* | | | 187 | | | | 12,061 | |
Amkor Technology, Inc. | | | 426 | | | | 10,100 | |
NetScout Systems, Inc.* | | | 292 | | | | 8,223 | |
Total Technology | | | | | | | 730,210 | |
| | | | | | | | | |
Basic Materials - 2.3% |
RPM International, Inc. | | | 517 | | | | 47,486 | |
Steel Dynamics, Inc. | | | 797 | | | | 40,456 | |
Reliance Steel & Aluminum Co. | | | 253 | | | | 38,529 | |
Cleveland-Cliffs, Inc.* | | | 1,825 | | | | 36,701 | |
Royal Gold, Inc. | | | 261 | | | | 28,089 | |
United States Steel Corp. | | | 1,044 | | | | 27,321 | |
Olin Corp. | | | 568 | | | | 21,567 | |
Ashland Global Holdings, Inc. | | | 217 | | | | 19,263 | |
Valvoline, Inc. | | | 721 | | | | 18,797 | |
Chemours Co. | | | 657 | | | | 18,337 | |
Commercial Metals Co. | | | 477 | | | | 14,711 | |
Sensient Technologies Corp. | | | 169 | | | | 13,182 | |
Ingevity Corp.* | | | 161 | | | | 12,160 | |
Cabot Corp. | | | 225 | | | | 11,799 | |
NewMarket Corp. | | | 29 | | | | 11,025 | |
Minerals Technologies, Inc. | | | 135 | | | | 10,168 | |
Compass Minerals International, Inc. | | | 135 | | | | 8,467 | |
Domtar Corp. | | | 219 | | | | 8,092 | |
Total Basic Materials | | | | | | | 386,150 | |
| | | | | | | | | |
Utilities - 1.6% |
Essential Utilities, Inc. | | | 888 | | | | 39,738 | |
UGI Corp. | | | 829 | | | | 33,997 | |
OGE Energy Corp. | | | 795 | | | | 25,726 | |
IDACORP, Inc. | | | 201 | | | | 20,094 | |
Hawaiian Electric Industries, Inc. | | | 434 | | | | 19,283 | |
National Fuel Gas Co. | | | 362 | | | | 18,096 | |
PNM Resources, Inc. | | | 341 | | | | 16,726 | |
Black Hills Corp. | | | 250 | | | | 16,693 | |
ONE Gas, Inc. | | | 212 | | | | 16,305 | |
Southwest Gas Holdings, Inc. | | | 228 | | | | 15,666 | |
New Jersey Resources Corp. | | | 383 | | | | 15,270 | |
Spire, Inc. | | | 205 | | | | 15,148 | |
ALLETE, Inc. | | | 207 | | | | 13,908 | |
NorthWestern Corp. | | | 201 | | | | 13,105 | |
Total Utilities | | | | | | | 279,755 | |
| | | | | | | | | |
Communications - 1.6% |
FactSet Research Systems, Inc. | | | 151 | | | | 46,597 | |
Cable One, Inc. | | | 22 | | | | 40,224 | |
Ciena Corp.* | | | 617 | | | | 33,762 | |
New York Times Co. — Class A | | | 576 | | | | 29,157 | |
Grubhub, Inc.* | | | 371 | | | | 22,260 | |
TripAdvisor, Inc.* | | | 383 | | | | 20,602 | |
Iridium Communications, Inc.* | | | 470 | | | | 19,388 | |
TEGNA, Inc. | | | 873 | | | | 16,439 | |
Viasat, Inc.* | | | 259 | | | | 12,450 | |
Yelp, Inc. — Class A* | | | 280 | | | | 10,920 | |
World Wrestling Entertainment, Inc. — Class A | | | 186 | | | | 10,092 | |
Telephone & Data Systems, Inc. | | | 396 | | | | 9,092 | |
InterDigital, Inc. | | | 123 | | | | 7,804 | |
Total Communications | | | | | | | 278,787 | |
| | | | | | | | | |
Energy - 1.4% |
SolarEdge Technologies, Inc.* | | | 205 | | | | 58,925 | |
Sunrun, Inc.* | | | 636 | | | | 38,465 | |
First Solar, Inc.* | | | 337 | | | | 29,420 | |
Cimarex Energy Co. | | | 409 | | | | 24,291 | |
Equities Corp.* | | | 1,109 | | | | 20,605 | |
ChampionX Corp.* | | | 741 | | | | 16,102 | |
Equitrans Midstream Corp. | | | 1,622 | | | | 13,236 | |
CNX Resources Corp.* | | | 874 | | | | 12,848 | |
Antero Midstream Corp. | | | 1,138 | | | | 10,276 | |
Murphy Oil Corp. | | | 574 | | | | 9,419 | |
Total Energy | | | | | | | 233,587 | |
| | | | | | | | | |
Total Common Stocks | | | | |
(Cost $5,925,213) | | | | | | | 8,988,213 | |
| | | | | | | | | |
MUTUAL FUNDS† - 21.2% |
Guggenheim Ultra Short Duration Fund — Institutional Class2 | | | 236,138 | | | | 2,351,937 | |
Guggenheim Strategy Fund II2 | | | 50,475 | | | | 1,260,878 | |
Total Mutual Funds | | | | |
(Cost $3,604,246) | | | | | | | 3,612,815 | |
| | | | | | | | | |
| | | Face
Amount | | | | | |
U.S. TREASURY BILLS†† - 13.8% |
U.S. Treasury Bills |
0.03% due 04/01/213,4 | | $ | 590,000 | | | | 590,000 | |
0.09% due 04/01/213,4 | | | 540,000 | | | | 540,000 | |
0.02% due 04/01/213,4 | | | 200,000 | | | | 200,000 | |
0.01% due 04/22/214,5 | | | 28,000 | | | | 28,000 | |
76 | THE RYDEX FUNDS ANNUAL REPORT | SEE NOTES TO FINANCIAL STATEMENTS. |
SCHEDULE OF INVESTMENTS (continued) | March 31, 2021 |
MID-CAP 1.5x STRATEGY FUND | |
| | Face
Amount | | | Values | |
U.S. Cash Management Bill |
0.03% due 08/03/214 | | $ | 1,000,000 | | | $ | 999,901 | |
Total U.S. Treasury Bills | | | | |
(Cost $2,357,901) | | | | | | | 2,357,901 | |
| | | | | | | | | |
REPURCHASE AGREEMENTS††,6 - 14.9% |
J.P. Morgan Securities LLC
issued 03/31/21 at 0.01%
due 04/01/213 | | | 1,361,489 | | | | 1,361,489 | |
Barclays Capital, Inc.
issued 03/31/21 at 0.01%
due 04/01/213 | | | 618,999 | | | | 618,999 | |
BofA Securities, Inc.
issued 03/31/21 at 0.01%
due 04/01/213 | | | 564,933 | | | | 564,933 | |
Total Repurchase Agreements | | | | |
(Cost $2,545,421) | | | | | | $ | 2,545,421 | |
| | | | | | | | |
| | | Shares | | | | | |
SECURITIES LENDING COLLATERAL†,7 - 0.0% |
Money Market Fund | | | | | | | | |
First American Government Obligations Fund — Class Z, 0.03%8 | | | 4,226 | | | | 4,226 | |
Total Securities Lending Collateral | | | | |
(Cost $4,226) | | | | | | | 4,226 | |
| | | | | | | | | |
Total Investments - 102.5% | | | | |
(Cost $14,437,007) | | $ | 17,508,576 | |
Other Assets & Liabilities, net - (2.5)% | | | (429,810 | ) |
Total Net Assets - 100.0% | | $ | 17,078,766 | |
Futures Contracts |
Description | | Number of
Contracts | | | Expiration
Date | | | Notional
Amount | | | Value and
Unrealized
Depreciation** | |
Equity Futures Contracts Purchased† |
S&P MidCap 400 Index Mini Futures Contracts | | | 4 | | | | Jun 2021 | | | $ | 1,042,640 | | | $ | (2,707 | ) |
Total Return Swap Agreements |
Counterparty | Index | Financing
Rate Pay | Payment
Frequency | | Maturity
Date | | | Units | | | Notional
Amount | | | Value and
Unrealized
Appreciation
(Depreciation) | |
OTC Equity Index Swap Agreements†† |
Barclays Bank plc | S&P MidCap 400 Index | 0.44% (1 Week USD LIBOR + 0.35%) | At Maturity | | | 04/07/21 | | | | 3,842 | | | $ | 10,025,230 | | | $ | 268,994 | |
BNP Paribas | S&P MidCap 400 Index | 0.56% (1 Month USD LIBOR + 0.45%) | At Maturity | | | 04/08/21 | | | | 560 | | | | 1,460,030 | | | | 30,075 | |
Goldman Sachs International | S&P MidCap 400 Index | 0.49% (1 Week USD LIBOR + 0.40%) | At Maturity | | | 05/27/21 | | | | 1,593 | | | | 4,156,784 | | | | (26,949 | ) |
| | | | | | | | | | | | | | $ | 15,642,044 | | | $ | 272,120 | |
SEE NOTES TO FINANCIAL STATEMENTS. | THE RYDEX FUNDS ANNUAL REPORT | 77 |
SCHEDULE OF INVESTMENTS (continued) | March 31, 2021 |
MID-CAP 1.5x STRATEGY FUND | |
* | Non-income producing security. |
** | Includes cumulative appreciation (depreciation). Variation margin is reported within the Statement of Assets and Liabilities. |
† | Value determined based on Level 1 inputs — See Note 4. |
†† | Value determined based on Level 2 inputs — See Note 4. |
1 | All or a portion of this security is on loan at March 31, 2021 — See Note 7. |
2 | Affiliated issuer. |
3 | All or a portion of this security is pledged as equity index swap collateral at March 31, 2021. |
4 | Rate indicated is the effective yield at the time of purchase. |
5 | All or a portion of this security is pledged as futures collateral at March 31, 2021. |
6 | Repurchase Agreements — See Note 6. |
7 | Securities lending collateral — See Note 7. |
8 | Rate indicated is the 7-day yield as of March 31, 2021. |
| | LIBOR — London Interbank Offered Rate |
| | plc — Public Limited Company |
| | REIT — Real Estate Investment Trust |
| | |
| | See Sector Classification in Other Information section. |
The following table summarizes the inputs used to value the Fund’s investments at March 31, 2021 (See Note 4 in the Notes to Financial Statements):
Investments in Securities (Assets) | | Level 1
Quoted
Prices | | | Level 2
Significant
Observable
Inputs | | | Level 3
Significant
Unobservable
Inputs | | | Total | |
Common Stocks | | $ | 8,988,213 | | | $ | — | | | $ | — | | | $ | 8,988,213 | |
Mutual Funds | | | 3,612,815 | | | | — | | | | — | | | | 3,612,815 | |
U.S. Treasury Bills | | | — | | | | 2,357,901 | | | | — | | | | 2,357,901 | |
Repurchase Agreements | | | — | | | | 2,545,421 | | | | — | | | | 2,545,421 | |
Securities Lending Collateral | | | 4,226 | | | | — | | | | — | | | | 4,226 | |
Equity Index Swap Agreements** | | | — | | | | 299,069 | | | | — | | | | 299,069 | |
Total Assets | | $ | 12,605,254 | | | $ | 5,202,391 | | | $ | — | | | $ | 17,807,645 | |
Investments in Securities (Liabilities) | | Level 1
Quoted
Prices | | | Level 2
Significant
Observable
Inputs | | | Level 3
Significant
Unobservable
Inputs | | | Total | |
Equity Futures Contracts** | | $ | 2,707 | | | $ | — | | | $ | — | | | $ | 2,707 | |
Equity Index Swap Agreements** | | | — | | | | 26,949 | | | | — | | | | 26,949 | |
Total Liabilities | | $ | 2,707 | | | $ | 26,949 | | | $ | — | | | $ | 29,656 | |
** | This derivative is reported as unrealized appreciation/depreciation at period end. |
78 | THE RYDEX FUNDS ANNUAL REPORT | SEE NOTES TO FINANCIAL STATEMENTS. |
SCHEDULE OF INVESTMENTS (concluded) | March 31, 2021 |
MID-CAP 1.5x STRATEGY FUND | |
Affiliated Transactions
Investments representing 5% or more of the outstanding voting shares of a company, or control of or by, or common control under Guggenheim Investments (“GI”), result in that company being considered an affiliated issuer, as defined in the 1940 Act.
The Fund may invest in certain of the underlying series of Guggenheim Strategy Funds Trust, including Guggenheim Strategy Fund II and Guggenheim Strategy Fund III, (collectively, the “Short Term Investment Vehicles”), each of which are open-end management investment companies managed by GI. The Short Term Investment Vehicles, which launched on March 11, 2014, are offered as short term investment options only to mutual funds, trusts, and other accounts managed by GI and/or its affiliates, and are not available to the public. The Short Term Investment Vehicles pay no investment management fees. The Short Term Investment Vehicles’ annual report on Form N-CSR dated September 30, 2020, is available publicly or upon request. This information is available from the EDGAR database on the SEC’s website at https://www.sec.gov/Archives/edgar/data/1601445/000182126820000133/gug81042-ncsr.htm.
Transactions during the year ended March 31, 2021, in which the company is an affiliated issuer, were as follows:
Security Name | | Value
03/31/20 | | | Additions | | | Reductions | | | Realized
Gain (Loss) | | | Change in
Unrealized
Appreciation
(Depreciation) | | | Value
03/31/21 | | | Shares
03/31/21 | | | Investment
Income | |
Mutual Funds | | | | | | | | | | | | | | | | | | | | | | | | | | | | | | | | |
Guggenheim Strategy Fund II | | $ | 492,048 | | | $ | 745,000 | | | $ | — | | | $ | — | | | $ | 23,830 | | | $ | 1,260,878 | | | | 50,475 | | | $ | 16,230 | |
Guggenheim Ultra Short Duration Fund — Institutional Class | | | 509,945 | | | | 2,732,000 | | | | (900,000 | ) | | | 196 | | | | 9,796 | | | | 2,351,937 | | | | 236,138 | | | | 15,352 | |
| | | $ | 1,001,993 | | | $ | 3,477,000 | | | $ | (900,000 | ) | | $ | 196 | | | $ | 33,626 | | | $ | 3,612,815 | | | | | | | $ | 31,582 | |
SEE NOTES TO FINANCIAL STATEMENTS. | THE RYDEX FUNDS ANNUAL REPORT | 79 |
MID-CAP 1.5x STRATEGY FUND | |
STATEMENT OF ASSETS AND LIABILITIES |
March 31, 2021 |
Assets: |
Investments in unaffiliated issuers, at value - including $4,037 of securities loaned (cost $8,287,340) | | $ | 11,350,340 | |
Investments in affiliated issuers, at value (cost $3,604,246) | | | 3,612,815 | |
Repurchase agreements, at value (cost $2,545,421) | | | 2,545,421 | |
Cash | | | 68 | |
Unrealized appreciation on OTC swap agreements | | | 299,069 | |
Receivables: |
Fund shares sold | | | 465,663 | |
Dividends | | | 11,368 | |
Swap settlement | | | 10,878 | |
Variation margin on futures contracts | | | 716 | |
Securities lending income | | | 2 | |
Total assets | | | 18,296,340 | |
| | | | | |
Liabilities: |
Unrealized depreciation on OTC swap agreements | | | 26,949 | |
Payable for: |
Securities purchased | | | 999,901 | |
Fund shares redeemed | | | 143,881 | |
Management fees | | | 12,821 | |
Return of securities lending collateral | | | 4,226 | |
Distribution and service fees | | | 4,184 | |
Transfer agent and administrative fees | | | 3,981 | |
Portfolio accounting fees | | | 1,480 | |
Trustees’ fees* | | | 274 | |
Miscellaneous | | | 19,877 | |
Total liabilities | | | 1,217,574 | |
Commitments and contingent liabilities (Note 12) | | | — | |
Net assets | | $ | 17,078,766 | |
| | | | | |
Net assets consist of: |
Paid in capital | | $ | 11,657,964 | |
Total distributable earnings (loss) | | | 5,420,802 | |
Net assets | | $ | 17,078,766 | |
| | | | | |
A-Class: |
Net assets | | $ | 4,336,584 | |
Capital shares outstanding | | | 32,873 | |
Net asset value per share | | $ | 131.92 | |
Maximum offering price per share (Net asset value divided by 95.25%) | | $ | 138.50 | |
| | | | | |
C-Class: |
Net assets | | $ | 652,809 | |
Capital shares outstanding | | | 5,800 | |
Net asset value per share | | $ | 112.55 | |
| | | | | |
H-Class: |
Net assets | | $ | 12,089,373 | |
Capital shares outstanding | | | 91,292 | |
Net asset value per share | | $ | 132.43 | |
* | Relates to Trustees not deemed “interested persons” within the meaning of Section 2(a)(19) of the 1940 Act. |
80 | THE RYDEX FUNDS ANNUAL REPORT | SEE NOTES TO FINANCIAL STATEMENTS. |
MID-CAP 1.5x STRATEGY FUND | |
STATEMENT OF OPERATIONS |
Year Ended March 31, 2021 |
Investment Income: |
Dividends from securities of unaffiliated issuers | | $ | 127,436 | |
Dividends from securities of affiliated issuers | | | 31,582 | |
Interest | | | 4,423 | |
Income from securities lending, net | | | 393 | |
Total investment income | | | 163,834 | |
| | | | | |
Expenses: |
Management fees | | | 141,597 | |
Distribution and service fees: |
A-Class | | | 7,565 | |
C-Class | | | 11,060 | |
H-Class | | | 29,003 | |
Transfer agent and administrative fees | | | 43,821 | |
Portfolio accounting fees | | | 15,735 | |
Professional fees | | | 6,931 | |
Trustees’ fees* | | | 2,871 | |
Custodian fees | | | 2,266 | |
Line of credit fees | | | 94 | |
Interest expense | | | 38 | |
Miscellaneous | | | 21,458 | |
Total expenses | | | 282,439 | |
Less: |
Expenses waived by Adviser | | | (3,595 | ) |
Net expenses | | | 278,844 | |
Net investment loss | | | (115,010 | ) |
| | | | | |
Net Realized and Unrealized Gain (Loss): |
Net realized gain (loss) on: |
Investments in unaffiliated issuers | | | 4,456,103 | |
Investments in affiliated issuers | | | 196 | |
Swap agreements | | | 7,299,869 | |
Futures contracts | | | 3,429,084 | |
Net realized gain | | | 15,185,252 | |
Net change in unrealized appreciation (depreciation) on: |
Investments in unaffiliated issuers | | | 3,094,818 | |
Investments in affiliated issuers | | | 33,626 | |
Swap agreements | | | 167,347 | |
Futures contracts | | | (107,305 | ) |
Net change in unrealized appreciation (depreciation) | | | 3,188,486 | |
Net realized and unrealized gain | | | 18,373,738 | |
Net increase in net assets resulting from operations | | $ | 18,258,728 | |
* | Relates to Trustees not deemed “interested persons” within the meaning of Section 2(a)(19) of the 1940 Act. |
SEE NOTES TO FINANCIAL STATEMENTS. | THE RYDEX FUNDS ANNUAL REPORT | 81 |
MID-CAP 1.5x STRATEGY FUND | |
STATEMENTS OF CHANGES IN NET ASSETS |
| | Year Ended
March 31,
2021 | | | Year Ended
March 31,
2020 | |
Increase (Decrease) in Net Assets from Operations: | | | | | | | | |
Net investment income (loss) | | $ | (115,010 | ) | | $ | 89,713 | |
Net realized gain on investments | | | 15,185,252 | | | | 2,791,371 | |
Net change in unrealized appreciation (depreciation) on investments | | | 3,188,486 | | | | (165,198 | ) |
Net increase in net assets resulting from operations | | | 18,258,728 | | | | 2,715,886 | |
| | | | | | | | | |
Distributions to shareholders: | | | | | | | | |
A-Class | | | (10,762 | ) | | | (6,471 | ) |
C-Class | | | (3,249 | ) | | | (7,932 | ) |
H-Class | | | (75,702 | ) | | | (209,346 | ) |
Total distributions to shareholders | | | (89,713 | ) | | | (223,749 | ) |
| | | | | | | | | |
Capital share transactions: | | | | | | | | |
Proceeds from sale of shares | | | | | | | | |
A-Class | | | 2,852,099 | | | | 1,361,417 | |
C-Class | | | 274,431 | | | | 75,744 | |
H-Class | | | 117,613,646 | | | | 326,944,951 | |
Distributions reinvested | | | | | | | | |
A-Class | | | 10,667 | | | | 6,428 | |
C-Class | | | 3,249 | | | | 7,890 | |
H-Class | | | 72,127 | | | | 84,839 | |
Cost of shares redeemed | | | | | | | | |
A-Class | | | (2,938,816 | ) | | | (1,750,513 | ) |
C-Class | | | (2,613,497 | ) | | | (639,883 | ) |
H-Class | | | (124,300,488 | ) | | | (341,855,663 | ) |
Net decrease from capital share transactions | | | (9,026,582 | ) | | | (15,764,790 | ) |
Net increase (decrease) in net assets | | | 9,142,433 | | | | (13,272,653 | ) |
| | | | | | | | | |
Net assets: | | | | | | | | |
Beginning of year | | | 7,936,333 | | | | 21,208,986 | |
End of year | | $ | 17,078,766 | | | $ | 7,936,333 | |
| | | | | | | | | |
Capital share activity: | | | | | | | | |
Shares sold | | | | | | | | |
A-Class | | | 32,695 | | | | 16,057 | |
C-Class | | | 2,977 | | | | 951 | |
H-Class | | | 1,334,264 | | | | 3,423,458 | |
Shares issued from reinvestment of distributions | | | | | | | | |
A-Class | | | 101 | | | | 66 | |
C-Class | | | 36 | | | | 94 | |
H-Class | | | 678 | | | | 869 | |
Shares redeemed | | | | | | | | |
A-Class | | | (34,729 | ) | | | (19,942 | ) |
C-Class | | | (37,321 | ) | | | (8,742 | ) |
H-Class | | | (1,315,725 | ) | | | (3,507,691 | ) |
Net decrease in shares | | | (17,024 | ) | | | (94,880 | ) |
82 | THE RYDEX FUNDS ANNUAL REPORT | SEE NOTES TO FINANCIAL STATEMENTS. |
MID-CAP 1.5x STRATEGY FUND | |
This table is presented to show selected data for a share outstanding throughout each period and to assist shareholders in evaluating a Fund’s performance for the periods presented.
A-Class | | Year Ended
March 31,
2021 | | | Year Ended
March 31,
2020 | | | Year Ended
March 31,
2019 | | | Year Ended
March 29,
2018 | | | Year Ended
March 31,
2017 | |
Per Share Data |
Net asset value, beginning of period | | $ | 56.02 | | | $ | 89.82 | | | $ | 90.38 | | | $ | 79.90 | | | $ | 61.64 | |
Income (loss) from investment operations: |
Net investment income (loss)a | | | (.68 | ) | | | .37 | | | | .58 | | | | .15 | | | | (.09 | ) |
Net gain (loss) on investments (realized and unrealized) | | | 77.00 | | | | (33.98 | ) | | | (.73 | ) | | | 10.83 | | | | 18.50 | |
Total from investment operations | | | 76.32 | | | | (33.61 | ) | | | (.15 | ) | | | 10.98 | | | | 18.41 | |
Less distributions from: |
Net investment income | | | (.42 | ) | | | (.19 | ) | | | (.11 | ) | | | — | | | | — | |
Net realized gains | | | — | | | | — | | | | (.30 | ) | | | (.50 | ) | | | (.15 | ) |
Total distributions | | | (.42 | ) | | | (.19 | ) | | | (.41 | ) | | | (.50 | ) | | | (.15 | ) |
Net asset value, end of period | | $ | 131.92 | | | $ | 56.02 | | | $ | 89.82 | | | $ | 90.38 | | | $ | 79.90 | |
|
Total Returnb | | | 136.41 | % | | | (37.52 | %) | | | (0.11 | %) | | | 13.74 | % | | | 29.88 | % |
Ratios/Supplemental Data |
Net assets, end of period (in thousands) | | $ | 4,337 | | | $ | 1,950 | | | $ | 3,469 | | | $ | 2,382 | | | $ | 1,935 | |
Ratios to average net assets: |
Net investment income (loss) | | | (0.75 | %) | | | 0.40 | % | | | 0.64 | % | | | 0.17 | % | | | (0.13 | %) |
Total expensesc | | | 1.75 | % | | | 1.77 | % | | | 1.77 | % | | | 1.67 | % | | | 1.68 | % |
Net expensesd | | | 1.72 | % | | | 1.72 | % | | | 1.75 | % | | | 1.67 | % | | | 1.68 | % |
Portfolio turnover rate | | | 501 | % | | | 617 | % | | | 721 | % | | | 722 | % | | | 1,216 | % |
C-Class | | Year Ended
March 31,
2021 | | | Year Ended
March 31,
2020 | | | Year Ended
March 31,
2019 | | | Year Ended
March 29,
2018 | | | Year Ended
March 31,
2017 | |
Per Share Data |
Net asset value, beginning of period | | $ | 48.18 | | | $ | 77.86 | | | $ | 78.99 | | | $ | 70.42 | | | $ | 54.73 | |
Income (loss) from investment operations: |
Net investment income (loss)a | | | (1.12 | ) | | | (.27 | ) | | | (.09 | ) | | | (.51 | ) | | | (.65 | ) |
Net gain (loss) on investments (realized and unrealized) | | | 65.91 | | | | (29.22 | ) | | | (.63 | ) | | | 9.58 | | | | 16.49 | |
Total from investment operations | | | 64.79 | | | | (29.49 | ) | | | (.72 | ) | | | 9.07 | | | | 15.84 | |
Less distributions from: |
Net investment income | | | (.42 | ) | | | (.19 | ) | | | (.11 | ) | | | — | | | | — | |
Net realized gains | | | — | | | | — | | | | (.30 | ) | | | (.50 | ) | | | (.15 | ) |
Total distributions | | | (.42 | ) | | | (.19 | ) | | | (.41 | ) | | | (.50 | ) | | | (.15 | ) |
Net asset value, end of period | | $ | 112.55 | | | $ | 48.18 | | | $ | 77.86 | | | $ | 78.99 | | | $ | 70.42 | |
|
Total Returnb | | | 134.67 | % | | | (37.98 | %) | | | (0.86 | %) | | | 12.89 | % | | | 28.94 | % |
Ratios/Supplemental Data |
Net assets, end of period (in thousands) | | $ | 653 | | | $ | 1,933 | | | $ | 3,722 | | | $ | 5,875 | | | $ | 7,720 | |
Ratios to average net assets: |
Net investment income (loss) | | | (1.59 | %) | | | (0.34 | %) | | | (0.12 | %) | | | (0.68 | %) | | | (1.05 | %) |
Total expensesc | | | 2.52 | % | | | 2.52 | % | | | 2.51 | % | | | 2.43 | % | | | 2.42 | % |
Net expensesd | | | 2.50 | % | | | 2.47 | % | | | 2.50 | % | | | 2.43 | % | | | 2.42 | % |
Portfolio turnover rate | | | 501 | % | | | 617 | % | | | 721 | % | | | 722 | % | | | 1,216 | % |
SEE NOTES TO FINANCIAL STATEMENTS. | THE RYDEX FUNDS ANNUAL REPORT | 83 |
MID-CAP 1.5x STRATEGY FUND | |
FINANCIAL HIGHLIGHTS (concluded) |
This table is presented to show selected data for a share outstanding throughout each period and to assist shareholders in evaluating a Fund’s performance for the periods presented.
H-Class | | Year Ended
March 31,
2021 | | | Year Ended
March 31,
2020 | | | Year Ended
March 31,
2019 | | | Year Ended
March 29,
2018 | | | Year Ended
March 31,
2017 | |
Per Share Data |
Net asset value, beginning of period | | $ | 56.24 | | | $ | 90.18 | | | $ | 90.82 | | | $ | 80.23 | | | $ | 61.85 | |
Income (loss) from investment operations: |
Net investment income (loss)a | | | (.60 | ) | | | .27 | | | | .42 | | | | .35 | | | | (.37 | ) |
Net gain (loss) on investments (realized and unrealized) | | | 77.21 | | | | (34.02 | ) | | | (.65 | ) | | | 10.74 | | | | 18.90 | |
Total from investment operations | | | 76.61 | | | | (33.75 | ) | | | (.23 | ) | | | 11.09 | | | | 18.53 | |
Less distributions from: |
Net investment income | | | (.42 | ) | | | (.19 | ) | | | (.11 | ) | | | — | | | | — | |
Net realized gains | | | — | | | | — | | | | (.30 | ) | | | (.50 | ) | | | (.15 | ) |
Total distributions | | | (.42 | ) | | | (.19 | ) | | | (.41 | ) | | | (.50 | ) | | | (.15 | ) |
Net asset value, end of period | | $ | 132.43 | | | $ | 56.24 | | | $ | 90.18 | | | $ | 90.82 | | | $ | 80.23 | |
|
Total Return | | | 136.39 | % | | | (37.52 | %) | | | (0.21 | %) | | | 13.82 | % | | | 29.97 | % |
Ratios/Supplemental Data |
Net assets, end of period (in thousands) | | $ | 12,089 | | | $ | 4,054 | | | $ | 14,017 | | | $ | 13,956 | | | $ | 20,071 | |
Ratios to average net assets: |
Net investment income (loss) | | | (0.64 | %) | | | 0.28 | % | | | 0.49 | % | | | 0.39 | % | | | (0.50 | %) |
Total expensesc | | | 1.74 | % | | | 1.79 | % | | | 1.78 | % | | | 1.66 | % | | | 1.68 | % |
Net expensesd | | | 1.72 | % | | | 1.77 | % | | | 1.77 | % | | | 1.66 | % | | | 1.68 | % |
Portfolio turnover rate | | | 501 | % | | | 617 | % | | | 721 | % | | | 722 | % | | | 1,216 | % |
a | Net investment income (loss) per share was computed using average shares outstanding throughout the period. |
b | Total return does not reflect the impact of any applicable sales charges. |
c | Does not include expenses of the underlying funds in which the Fund invests. |
d | Net expense information reflects the expense ratios after expense waivers and reimbursements, as applicable. |
84 | THE RYDEX FUNDS ANNUAL REPORT | SEE NOTES TO FINANCIAL STATEMENTS. |
PERFORMANCE REPORT AND FUND PROFILE (Unaudited) | March 31, 2021 |
INVERSE MID-CAP STRATEGY FUND
OBJECTIVE: Seeks to provide investment results that match, before fees and expenses, the performance of a specific benchmark on a daily basis. The Fund’s current benchmark is the inverse (opposite) of the performance of the S&P MidCap 400® Index (the “underlying index”). The Fund does not seek to achieve its investment objective over a period of time greater than one day.
For the year ended March 31, 2021, Inverse Mid-Cap Strategy Fund achieved a daily correlation of 99% to its benchmark of -100% of the daily price movement of the S&P MidCap 400 Index.
Inverse Mid-Cap Strategy Fund H-Class returned -49.94%, while the S&P MidCap 400 Index returned 83.46% over the same period.
All sectors contributed to the return of the underlying index for the period, led by Consumer Discretionary, Information Technology, and Industrials.
The holdings contributing the most to the return of the underlying index were Enphase Energy, Inc., Penn National Gaming, Inc., and Etsy, Inc. The holdings detracting the most were Strategic Education, Inc., Quidel Corp., and Kinsdale Capital Group, Inc.
Derivatives in the Fund were used to help provide exposure to the composition of the benchmark in the highest efficient manner and to provide leverage and not for hedging purposes. Derivatives performed as expected.
Due to the compounding of daily returns, leveraged and inverse funds’ returns over periods other than one day will likely differ in amount and possibly direction from the benchmark return for the same period. Investors should monitor their leveraged and inverse funds’ holdings to ensure that they are consistent with their strategies, as frequently as daily.
The effects of compounding may cause the longer-term correlation of the Fund to its benchmark to diminish. The apparent discrepancy between the leveraged and unleveraged indices is the result of compounding, which is described briefly on page 6 of this report.
The Fund may invest in certain of the underlying series of Guggenheim Funds Trust and Guggenheim Strategy Funds Trust, including Guggenheim Ultra Short Duration, Guggenheim Strategy Fund II and Guggenheim Strategy Fund III (collectively, the “Short Term Investment Vehicles”), each of which are open-end management investment companies managed by Guggenheim Investments. The Short Term Investment Vehicles, which launched on March 11, 2014, are offered as short term investment options only to mutual funds, trusts, and other accounts managed by Guggenheim Investments and/or its affiliates, and are not available to the public, with the exception of Guggenheim Ultra Short Duration Fund, which is available to the public. Guggenheim Strategy Fund II and Guggenheim Strategy Fund III do not charge an investment management fee. Guggenheim Ultra Short Duration Fund charges an investment management fee but the Fund’s adviser has agreed to waive fees to the extent necessary to offset the proportionate share of any management fee paid by the Fund with respect to its investment in Guggenheim Ultra Short Duration Fund. For the one-year period ended March 31, 2021, investment in the Short Term Investment Vehicles benefited Fund performance.
Performance displayed represents past performance, which is no guarantee of future results.
“Holdings Diversification (Market Exposure as % of Net Assets)” excludes any temporary cash investments, investments in Guggenheim Strategy Funds Trust mutual funds, or investments in Guggenheim Ultra Short Duration Fund. Investments in those Funds do not provide “market exposure” to meet the Fund’s investment objective, but will significantly increase the portfolio’s exposure to certain other asset categories (and their associated risks), which may cause the Fund to deviate from its principal investment strategy, including: (i) high yield, high risk debt securities rated below the top four long-term rating categories by a nationally recognized statistical rating organization (also known as “junk bonds”); (ii) securities issued by the U.S. government or its agencies and instrumentalities; (iii) CLOs and similar investments; and (iv) other short-term fixed income securities.
Holdings Diversification (Market Exposure as % of Net Assets)
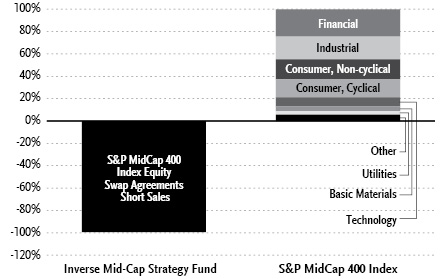
| | THE RYDEX FUNDS ANNUAL REPORT | 85 |
PERFORMANCE REPORT AND FUND PROFILE (Unaudited)(concluded) | March 31, 2021 |
Inception Dates: |
A-Class | March 31, 2004 |
C-Class | February 20, 2004 |
H-Class | February 20, 2004 |
The Fund invests principally in derivative investments such as swap agreements and futures contracts.
Largest Holdings (% of Total Net Assets) |
Guggenheim Ultra Short Duration Fund — Institutional Class | 9.2% |
Guggenheim Strategy Fund II | 9.2% |
Total | 18.4% |
| | |
“Largest Holdings” excludes any temporary cash or derivative investments. |
Cumulative Fund Performance*
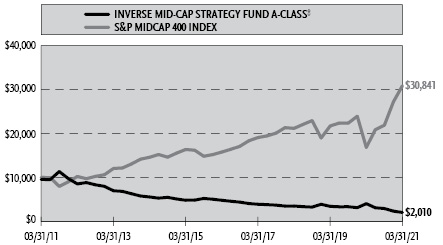

Average Annual Returns*
Periods Ended March 31, 2021
| 1 Year | 5 Year | 10 Year |
A-Class Shares | (49.94%) | (15.92%) | (14.41%) |
A-Class Shares with sales charge‡ | (52.33%) | (16.74%) | (14.82%) |
C-Class Shares | (50.08%) | (16.52%) | (15.04%) |
C-Class Shares with CDSC§ | (50.58%) | (16.52%) | (15.04%) |
H-Class Shares | (49.94%) | (15.90%) | (14.39%) |
S&P MidCap 400 Index | 83.46% | 14.37% | 11.92% |
* | The performance data above represents past performance that is not predictive of future results. The investment return and principal value of an investment in the Fund will fluctuate so that an investor’s shares, when redeemed, may be worth more or less than their original cost. Returns are historical and include changes in principal and reinvested dividends and capital gains and do not reflect the effect of taxes. The S&P MidCap 400 Index is an unmanaged index and, unlike the Fund, has no management fees or operating expenses to reduce its reported return. The graphs are based on A-Class shares and H-Class shares only; performance for C-Class shares will vary due to differences in fee structures. |
‡ | Fund returns are calculated using the maximum sales charge of 4.75%. |
§ | Fund returns include a CDSC of 1% if redeemed within 12 months of purchase. |
86 | THE RYDEX FUNDS ANNUAL REPORT | |
SCHEDULE OF INVESTMENTS | March 31, 2021 |
INVERSE MID-CAP STRATEGY FUND | |
| | Shares | | | Value | |
MUTUAL FUNDS† - 18.4% |
Guggenheim Ultra Short Duration Fund — Institutional Class1 | | | 8,145 | | | $ | 81,121 | |
Guggenheim Strategy Fund II1 | | | 3,222 | | | | 80,483 | |
Total Mutual Funds | | | | |
(Cost $160,346) | | | | | | | 161,604 | |
| | | | | | | | | |
| | | Face
Amount | | | | | |
REPURCHASE AGREEMENTS††,2 - 83.4% |
J.P. Morgan Securities LLC
issued 03/31/21 at 0.01%
due 04/01/213 | | $ | 393,548 | | | | 393,548 | |
Barclays Capital, Inc.
issued 03/31/21 at 0.01%
due 04/01/213 | | | 178,926 | | | | 178,926 | |
BofA Securities, Inc.
issued 03/31/21 at 0.01%
due 04/01/213 | | | 163,298 | | | | 163,298 | |
Total Repurchase Agreements | | | | |
(Cost $735,772) | | | | | | | 735,772 | |
| | | | | | | | | |
Total Investments - 101.8% | | | | |
(Cost $896,118) | | $ | 897,376 | |
Other Assets & Liabilities, net - (1.8)% | | | (15,662 | ) |
Total Net Assets - 100.0% | | $ | 881,714 | |
Total Return Swap Agreements |
Counterparty | Index | Financing
Rate Receive | Payment
Frequency | | Maturity
Date | | | Units | | | Notional
Amount | | | Value and
Unrealized
Appreciation
(Depreciation) | |
OTC Equity Index Swap Agreements Sold Short†† |
Goldman Sachs International | S&P MidCap 400 Index | 0.19% (1 Week USD LIBOR + 0.10%) | At Maturity | | | 04/08/21 | | | | 123 | | | $ | 319,937 | | | $ | 5,004 | |
Barclays Bank plc | S&P MidCap 400 Index | 0.29% (1 Week USD LIBOR + 0.20%) | At Maturity | | | 04/07/21 | | | | 43 | | | | 111,055 | | | | (2,980 | ) |
BNP Paribas | S&P MidCap 400 Index | 0.06% (1 Month USD LIBOR - 0.05%) | At Maturity | | | 04/08/21 | | | | 171 | | | | 445,838 | | | | (10,711 | ) |
| | | | | | | | | | | | | | $ | 876,830 | | | $ | (8,687 | ) |
† | Value determined based on Level 1 inputs — See Note 4. |
†† | Value determined based on Level 2 inputs — See Note 4. |
1 | Affiliated issuer. |
2 | Repurchase Agreements — See Note 6. |
3 | All or a portion of this security is pledged as equity index swap collateral at March 31, 2021. |
| | LIBOR — London Interbank Offered Rate |
| | plc — Public Limited Company |
| | |
| | See Sector Classification in Other Information section. |
SEE NOTES TO FINANCIAL STATEMENTS. | THE RYDEX FUNDS ANNUAL REPORT | 87 |
SCHEDULE OF INVESTMENTS (concluded) | March 31, 2021 |
INVERSE MID-CAP STRATEGY FUND | |
The following table summarizes the inputs used to value the Fund’s investments at March 31, 2021 (See Note 4 in the Notes to Financial Statements):
Investments in Securities (Assets) | | Level 1
Quoted
Prices | | | Level 2
Significant
Observable
Inputs | | | Level 3
Significant
Unobservable
Inputs | | | Total | |
Mutual Funds | | $ | 161,604 | | | $ | — | | | $ | — | | | $ | 161,604 | |
Repurchase Agreements | | | — | | | | 735,772 | | | | — | | | | 735,772 | |
Equity Index Swap Agreements** | | | — | | | | 5,004 | | | | — | | | | 5,004 | |
Total Assets | | $ | 161,604 | | | $ | 740,776 | | | $ | — | | | $ | 902,380 | |
Investments in Securities (Liabilities) | | Level 1
Quoted
Prices | | | Level 2
Significant
Observable
Inputs | | | Level 3
Significant
Unobservable
Inputs | | | Total | |
Equity Index Swap Agreements** | | $ | — | | | $ | 13,691 | | | $ | — | | | $ | 13,691 | |
** | This derivative is reported as unrealized appreciation/depreciation at period end. |
Affiliated Transactions
Investments representing 5% or more of the outstanding voting shares of a company, or control of or by, or common control under Guggenheim Investments (“GI”), result in that company being considered an affiliated issuer, as defined in the 1940 Act.
The Fund may invest in certain of the underlying series of Guggenheim Strategy Funds Trust, including Guggenheim Strategy Fund II and Guggenheim Strategy Fund III, (collectively, the “Short Term Investment Vehicles”), each of which are open-end management investment companies managed by GI. The Short Term Investment Vehicles, which launched on March 11, 2014, are offered as short term investment options only to mutual funds, trusts, and other accounts managed by GI and/or its affiliates, and are not available to the public. The Short Term Investment Vehicles pay no investment management fees. The Short Term Investment Vehicles’ annual report on Form N-CSR dated September 30, 2020, is available publicly or upon request. This information is available from the EDGAR database on the SEC’s website at https://www.sec.gov/Archives/edgar/data/1601445/000182126820000133/gug81042-ncsr.htm.
Transactions during the year ended March 31, 2021, in which the company is an affiliated issuer, were as follows:
Security Name | | Value
03/31/20 | | | Additions | | | Reductions | | | Realized
Gain (Loss) | | | Change in
Unrealized
Appreciation
(Depreciation) | | | Value
03/31/21 | | | Shares
03/31/21 | | | Investment
Income | |
Mutual Funds | | | | | | | | | | | | | | | | | | | | | | | | | | | | | | | | |
Guggenheim Strategy Fund II | | $ | 105,850 | | | $ | 50,000 | | | $ | (80,000 | ) | | $ | 521 | | | $ | 4,112 | | | $ | 80,483 | | | | 3,222 | | | $ | 2,271 | |
Guggenheim Ultra Short Duration Fund — Institutional Class | | | 103,595 | | | | 55,018 | | | | (80,000 | ) | | | 317 | | | | 2,191 | | | | 81,121 | | | | 8,145 | | | | 1,499 | |
| | | $ | 209,445 | | | $ | 105,018 | | | $ | (160,000 | ) | | $ | 838 | | | $ | 6,303 | | | $ | 161,604 | | | | | | | $ | 3,770 | |
88 | THE RYDEX FUNDS ANNUAL REPORT | SEE NOTES TO FINANCIAL STATEMENTS. |
INVERSE MID-CAP STRATEGY FUND | |
STATEMENT OF ASSETS AND LIABILITIES |
March 31, 2021 |
Assets: |
Investments in affiliated issuers, at value (cost $160,346) | | $ | 161,604 | |
Repurchase agreements, at value (cost $735,772) | | | 735,772 | |
Unrealized appreciation on OTC swap agreements | | | 5,004 | |
Receivables: |
Fund shares sold | | | 1,030 | |
Dividends | | | 164 | |
Total assets | | | 903,574 | |
| | | | | |
Liabilities: |
Unrealized depreciation on OTC swap agreements | | | 13,691 | |
Payable for: |
Swap settlement | | | 6,690 | |
Management fees | | | 476 | |
Transfer agent and administrative fees | | | 147 | |
Distribution and service fees | | | 139 | |
Portfolio accounting fees | | | 55 | |
Trustees’ fees* | | | 9 | |
Miscellaneous | | | 653 | |
Total liabilities | | | 21,860 | |
Commitments and contingent liabilities (Note 12) | | | — | |
Net assets | | $ | 881,714 | |
| | | | | |
Net assets consist of: |
Paid in capital | | $ | 6,641,691 | |
Total distributable earnings (loss) | | | (5,759,977 | ) |
Net assets | | $ | 881,714 | |
| | | | | |
A-Class: |
Net assets | | $ | 99,666 | |
Capital shares outstanding | | | 1,567 | |
Net asset value per share | | $ | 63.60 | |
Maximum offering price per share (Net asset value divided by 95.25%) | | $ | 66.77 | |
| | | | | |
C-Class: |
Net assets | | $ | 3,431 | |
Capital shares outstanding | | | 62 | |
Net asset value per share | | $ | 55.65 | |
| | | | | |
H-Class: |
Net assets | | $ | 778,617 | |
Capital shares outstanding | | | 12,232 | |
Net asset value per share | | $ | 63.65 | |
STATEMENT OF OPERATIONS |
Year Ended March 31, 2021 |
Investment Income: |
Dividends from securities of affiliated issuers | | $ | 3,770 | |
Interest | | | 444 | |
Total investment income | | | 4,214 | |
| | | | | |
Expenses: |
Management fees | | | 10,055 | |
Distribution and service fees: |
A-Class | | | 332 | |
C-Class | | | 33 | |
H-Class | | | 2,453 | |
Transfer agent and administrative fees | | | 3,164 | |
Registration fees | | | 1,310 | |
Portfolio accounting fees | | | 1,118 | |
Professional fees | | | 707 | |
Trustees’ fees* | | | 285 | |
Custodian fees | | | 168 | |
Miscellaneous | | | 209 | |
Total expenses | | | 19,834 | |
Less: |
Expenses waived by Adviser | | | (322 | ) |
Net expenses | | | 19,512 | |
Net investment loss | | | (15,298 | ) |
| | | | | |
Net Realized and Unrealized Gain (Loss): |
Net realized gain (loss) on: |
Investments in affiliated issuers | | | 838 | |
Swap agreements | | | (847,113 | ) |
Futures contracts | | | (11,374 | ) |
Net realized loss | | | (857,649 | ) |
Net change in unrealized appreciation (depreciation) on: |
Investments in affiliated issuers | | | 6,303 | |
Swap agreements | | | (29,801 | ) |
Net change in unrealized appreciation (depreciation) | | | (23,498 | ) |
Net realized and unrealized loss | | | (881,147 | ) |
Net decrease in net assets resulting from operations | | $ | (896,445 | ) |
* | Relates to Trustees not deemed “interested persons” within the meaning of Section 2(a)(19) of the 1940 Act. |
SEE NOTES TO FINANCIAL STATEMENTS. | THE RYDEX FUNDS ANNUAL REPORT | 89 |
INVERSE MID-CAP STRATEGY FUND | |
STATEMENTS OF CHANGES IN NET ASSETS |
| | Year Ended
March 31,
2021 | | | Year Ended
March 31,
2020 | |
Increase (Decrease) in Net Assets from Operations: | | | | | | | | |
Net investment income (loss) | | $ | (15,298 | ) | | $ | 5,436 | |
Net realized loss on investments | | | (857,649 | ) | | | (47,542 | ) |
Net change in unrealized appreciation (depreciation) on investments | | | (23,498 | ) | | | 25,491 | |
Net decrease in net assets resulting from operations | | | (896,445 | ) | | | (16,615 | ) |
| | | | | | | | | |
Distributions to shareholders: | | | | | | | | |
A-Class | | | (726 | ) | | | (688 | ) |
C-Class | | | (30 | ) | | | — | |
H-Class | | | (4,681 | ) | | | (4,900 | ) |
Total distributions to shareholders | | | (5,437 | ) | | | (5,588 | ) |
| | | | | | | | | |
Capital share transactions: | | | | | | | | |
Proceeds from sale of shares | | | | | | | | |
A-Class | | | 231,753 | | | | 79,204 | |
C-Class | | | 10,000 | | | | — | |
H-Class | | | 6,299,520 | | | | 9,983,986 | |
Distributions reinvested | | | | | | | | |
A-Class | | | 726 | | | | 688 | |
C-Class | | | 30 | | | | — | |
H-Class | | | 4,677 | | | | 4,841 | |
Cost of shares redeemed | | | | | | | | |
A-Class | | | (79,006 | ) | | | (170,994 | ) |
C-Class | | | (4,247 | ) | | | (107 | ) |
H-Class | | | (6,227,459 | ) | | | (9,229,767 | ) |
Net increase from capital share transactions | | | 235,994 | | | | 667,851 | |
Net increase (decrease) in net assets | | | (665,888 | ) | | | 645,648 | |
| | | | | | | | | |
Net assets: | | | | | | | | |
Beginning of year | | | 1,547,602 | | | | 901,954 | |
End of year | | $ | 881,714 | | | $ | 1,547,602 | |
| | | | | | | | | |
Capital share activity:* | | | | | | | | |
Shares sold | | | | | | | | |
A-Class | | | 2,034 | | | | 622 | |
C-Class | | | 109 | | | | — | |
H-Class | | | 67,331 | | | | 90,347 | |
Shares issued from reinvestment of distributions | | | | | | | | |
A-Class | | | 10 | | | | 7 | |
H-Class | | | 62 | | | | 47 | |
Shares redeemed | | | | | | | | |
A-Class | | | (944 | ) | | | (1,380 | ) |
C-Class | | | (48 | ) | | | (1 | ) |
H-Class | | | (66,785 | ) | | | (85,812 | ) |
Net increase in shares | | | 1,769 | | | | 3,830 | |
* | Capital share activity for the year ended March 31, 2020, has been restated to reflect a 1:5 reverse share split effective August 17, 2020 — See Note 11. |
90 | THE RYDEX FUNDS ANNUAL REPORT | SEE NOTES TO FINANCIAL STATEMENTS. |
INVERSE MID-CAP STRATEGY FUND | |
This table is presented to show selected data for a share outstanding throughout each period and to assist shareholders in evaluating a Fund’s performance for the periods presented.
A-Class | | Year Ended
March 31,
2021 | | | Year Ended
March 31,
2020i | | | Year Ended
March 31,
2019i | | | Year Ended
March 29,
2018i | | | Year Ended
March 31,
2017i | |
Per Share Data |
Net asset value, beginning of period | | $ | 127.90 | | | $ | 109.10 | | | $ | 111.55 | | | $ | 124.57 | | | $ | 153.53 | |
Income (loss) from investment operations: |
Net investment income (loss)a | | | (.45 | ) | | | .75 | | | | .65 | | | | (.55 | ) | | | (1.40 | ) |
Net gain (loss) on investments (realized and unrealized) | | | (63.36 | ) | | | 18.85 | e | | | (3.10 | ) | | | (12.47 | ) | | | (27.56 | ) |
Total from investment operations | | | (63.81 | ) | | | 19.60 | | | | (2.45 | ) | | | (13.02 | ) | | | (28.96 | ) |
Less distributions from: |
Net investment income | | | (.49 | ) | | | (.80 | ) | | | — | | | | — | | | | — | |
Total distributions | | | (.49 | ) | | | (.80 | ) | | | — | | | | — | | | | — | |
Net asset value, end of period | | $ | 63.60 | | | $ | 127.90 | | | $ | 109.10 | | | $ | 111.55 | | | $ | 124.57 | |
|
Total Returnb | | | (49.94 | %) | | | 18.13 | % | | | (2.20 | %) | | | (10.47 | %) | | | (18.89 | %) |
Ratios/Supplemental Data |
Net assets, end of period (in thousands) | | $ | 100 | | | $ | 60 | | | $ | 133 | | | $ | 156 | | | $ | 226 | |
Ratios to average net assets: |
Net investment income (loss) | | | (1.29 | %) | | | 0.68 | % | | | 0.60 | % | | | (0.49 | %) | | | (1.02 | %) |
Total expensesc | | | 1.76 | % | | | 1.77 | % | | | 1.77 | % | | | 1.68 | % | | | 1.68 | % |
Net expensesd | | | 1.73 | % | | | 1.70 | % | | | 1.75 | % | | | 1.68 | % | | | 1.68 | % |
Portfolio turnover rate | | | 42 | % | | | — | | | | 48 | % | | | 37 | % | | | 120 | % |
C-Class | | Year Ended
March 31,
2021 | | | Year Ended
March 31,
2020i | | | Year Ended
March 31,
2019i | | | Year Ended
March 29,
2018i | | | Year Ended
March 31,
2017i | |
Per Share Data |
Net asset value, beginning of period | | $ | 112.07 | | | $ | 97.04 | | | $ | 99.70 | | | $ | 112.28 | | | $ | 139.43 | |
Income (loss) from investment operations: |
Net investment income (loss)a | | | (.83 | ) | | | — | f | | | (.30 | ) | | | (1.40 | ) | | | (2.40 | ) |
Net gain (loss) on investments (realized and unrealized) | | | (55.10 | ) | | | 15.83 | e | | | (2.36 | ) | | | (11.18 | ) | | | (24.75 | ) |
Total from investment operations | | | (55.93 | ) | | | 15.83 | | | | (2.66 | ) | | | (12.58 | ) | | | (27.15 | ) |
Less distributions from: |
Net investment income | | | (.49 | ) | | | (.80 | ) | | | — | | | | — | | | | — | |
Total distributions | | | (.49 | ) | | | (.80 | ) | | | — | | | | — | | | | — | |
Net asset value, end of period | | $ | 55.65 | | | $ | 112.07 | | | $ | 97.04 | | | $ | 99.70 | | | $ | 112.28 | |
|
Total Returnb | | | (50.08 | %) | | | 16.78 | % | | | (2.71 | %) | | | (11.22 | %) | | | (19.51 | %) |
Ratios/Supplemental Data |
Net assets, end of period (in thousands) | | $ | 3 | | | $ | — | g | | $ | — | g | | $ | 2 | | | $ | 36 | |
Ratios to average net assets: |
Net investment income (loss) | | | (1.95 | %) | | | 0.00 | %h | | | (0.33 | %) | | | (1.30 | %) | | | (1.85 | %) |
Total expensesc | | | 2.49 | % | | | 2.63 | % | | | 2.47 | % | | | 2.44 | % | | | 2.42 | % |
Net expensesd | | | 2.46 | % | | | 2.63 | % | | | 2.47 | % | | | 2.44 | % | | | 2.42 | % |
Portfolio turnover rate | | | 42 | % | | | — | | | | 48 | % | | | 37 | % | | | 120 | % |
SEE NOTES TO FINANCIAL STATEMENTS. | THE RYDEX FUNDS ANNUAL REPORT | 91 |
INVERSE MID-CAP STRATEGY FUND | |
FINANCIAL HIGHLIGHTS (concluded) |
This table is presented to show selected data for a share outstanding throughout each period and to assist shareholders in evaluating a Fund’s performance for the periods presented.
H-Class | | Year Ended
March 31,
2021 | | | Year Ended
March 31,
2020i | | | Year Ended
March 31,
2019i | | | Year Ended
March 29,
2018i | | | Year Ended
March 31,
2017i | |
Per Share Data |
Net asset value, beginning of period | | $ | 128.00 | | | $ | 109.20 | | | $ | 111.46 | | | $ | 124.52 | | | $ | 153.44 | |
Income (loss) from investment operations: |
Net investment income (loss)a | | | (.42 | ) | | | .70 | | | | .65 | | | | (.45 | ) | | | (1.55 | ) |
Net gain (loss) on investments (realized and unrealized) | | | (63.44 | ) | | | 18.90 | e | | | (2.91 | ) | | | (12.61 | ) | | | (27.37 | ) |
Total from investment operations | | | (63.86 | ) | | | 19.60 | | | | (2.26 | ) | | | (13.06 | ) | | | (28.92 | ) |
Less distributions from: |
Net investment income | | | (.49 | ) | | | (.80 | ) | | | — | | | | — | | | | — | |
Total distributions | | | (.49 | ) | | | (.80 | ) | | | — | | | | — | | | | — | |
Net asset value, end of period | | $ | 63.65 | | | $ | 128.00 | | | $ | 109.20 | | | $ | 111.46 | | | $ | 124.52 | |
|
Total Return | | | (49.94 | %) | | | 18.11 | % | | | (2.02 | %) | | | (10.48 | %) | | | (18.87 | %) |
Ratios/Supplemental Data |
Net assets, end of period (in thousands) | | $ | 779 | | | $ | 1,488 | | | $ | 769 | | | $ | 509 | | | $ | 606 | |
Ratios to average net assets: |
Net investment income (loss) | | | (1.38 | %) | | | 0.65 | % | | | 0.61 | % | | | (0.39 | %) | | | (1.10 | %) |
Total expensesc | | | 1.77 | % | | | 1.78 | % | | | 1.77 | % | | | 1.68 | % | | | 1.67 | % |
Net expensesd | | | 1.75 | % | | | 1.70 | % | | | 1.75 | % | | | 1.68 | % | | | 1.67 | % |
Portfolio turnover rate | | | 42 | % | | | — | | | | 48 | % | | | 37 | % | | | 120 | % |
a | Net investment income (loss) per share was computed using average shares outstanding throughout the period. |
b | Total return does not reflect the impact of any applicable sales charges. |
c | Does not include expenses of the underlying funds in which the Fund invests. |
d | Net expense information reflects the expense ratios after expense waivers and reimbursements, as applicable. |
e | The amount shown for a share outstanding throughout the period does not agree with the aggregate net loss on investments for the year because of the sales and repurchases of fund shares in relation to fluctuating market value of the investments of the Fund. |
f | Less than $0.01 per share. |
g | Less than $1,000 in Net Assets. |
h | Less than 0.01%. |
i | Reverse share split — Per share amounts for the periods presented through March 31, 2020 have been restated to reflect a 1:5 reverse share split effective August 17, 2020 — See Note 11. |
92 | THE RYDEX FUNDS ANNUAL REPORT | SEE NOTES TO FINANCIAL STATEMENTS. |
PERFORMANCE REPORT AND FUND PROFILE (Unaudited) | March 31, 2021 |
RUSSELL 2000® 1.5x STRATEGY FUND
OBJECTIVE: Seeks to provide investment results that correlate, before fees and expenses, to the performance of a specific benchmark for small-cap securities on a daily basis. The Fund’s current benchmark is 150% of the Russell 2000® Index (the “underlying index”). The Fund does not seek to achieve its investment objective over a period of time greater than one day.
For the one-year period ended March 31, 2021, Russell 2000® 1.5x Strategy Fund maintained a daily correlation of over 99% to its benchmark of 150% of the daily price movement of the Russell 2000 Index.
Russell 2000® 1.5x Strategy Fund H-Class returned 159.27%, while the Russell 2000 Index returned 94.85% over the same time period.
All sectors contributed to the return of the underlying index for the period, led by Health Care, Consumer Discretionary, and Industrials.
The holdings contributing the most to the return of the underlying index were Penn National Gaming, Inc., Plug Power, Inc., and MyoKardia, Inc. The holdings detracting the most were eHealth, Inc., Green Dot Corp. Class A, and Merit Medical Systems, Inc.
Derivatives in the Fund were used to help provide exposure to the composition of the benchmark in the highest efficient manner and to provide leverage and not for hedging purposes. Derivatives performed as expected.
Due to the compounding of daily returns, leveraged and inverse funds’ returns over periods other than one day will likely differ in amount and possibly direction from the benchmark return for the same period. Investors should monitor their leveraged and inverse funds’ holdings to ensure that they are consistent with their strategies, as frequently as daily.
The effects of compounding may cause the longer-term correlation of the Fund to its benchmark to diminish. The apparent discrepancy between the leveraged and unleveraged indices is the result of compounding, which is described briefly on page 6 of this report.
The Fund may invest in certain of the underlying series of Guggenheim Funds Trust and Guggenheim Strategy Funds Trust, including Guggenheim Ultra Short Duration, Guggenheim Strategy Fund II and Guggenheim Strategy Fund III (collectively, the “Short Term Investment Vehicles”), each of which are open-end management investment companies managed by Guggenheim Investments. The Short Term Investment Vehicles, which launched on March 11, 2014, are offered as short term investment options only to mutual funds, trusts, and other accounts managed by Guggenheim Investments and/or its affiliates, and are not available to the public, with the exception of Guggenheim Ultra Short Duration Fund, which is available to the public. Guggenheim Strategy Fund II and Guggenheim Strategy Fund III do not charge an investment management fee. Guggenheim Ultra Short Duration Fund charges an investment management fee but the Fund’s adviser has agreed to waive fees to the extent necessary to offset the proportionate share of any management fee paid by the Fund with respect to its investment in Guggenheim Ultra Short Duration Fund. For the one-year period ended March 31, 2021, investment in the Short Term Investment Vehicles benefited Fund performance.
Performance displayed represents past performance, which is no guarantee of future results.
Holdings Diversification (Market Exposure as % of Net Assets)

“Holdings Diversification (Market Exposure as % of Net Assets)” excludes any temporary cash investments, investments in Guggenheim Strategy Funds Trust mutual funds, or investments in Guggenheim Ultra Short Duration Fund. Investments in those Funds do not provide “market exposure” to meet the Fund’s investment objective, but will significantly increase the portfolio’s exposure to certain other asset categories (and their associated risks), which may cause the Fund to deviate from its principal investment strategy, including: (i) high yield, high risk debt securities rated below the top four long-term rating categories by a nationally recognized statistical rating organization (also known as “junk bonds”); (ii) securities issued by the U.S. government or its agencies and instrumentalities; (iii) CLOs and similar investments; and (iv) other short-term fixed income securities.
| | THE RYDEX FUNDS ANNUAL REPORT | 93 |
PERFORMANCE REPORT AND FUND PROFILE (Unaudited)(concluded) | March 31, 2021 |
Inception Dates: |
A-Class | March 31, 2004 |
C-Class | January 23, 2001 |
H-Class | November 1, 2000 |
The Fund invests principally in derivative investments such as swap agreements and futures contracts.
Largest Holdings (% of Total Net Assets) |
Guggenheim Ultra Short Duration Fund — Institutional Class | 9.9% |
Guggenheim Strategy Fund II | 8.2% |
Total | 18.1% |
| | |
“Largest Holdings” excludes any temporary cash or derivative investments. |
Cumulative Fund Performance*
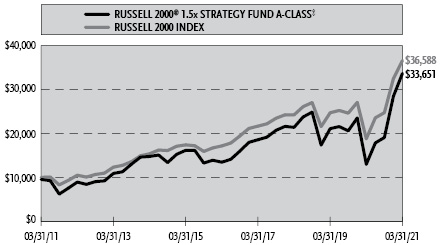
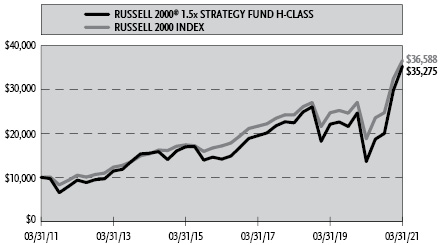
Average Annual Returns*
Periods Ended March 31, 2021
| 1 Year | 5 Year | 10 Year |
A-Class Shares | 159.26% | 20.14% | 13.45% |
A-Class Shares with sales charge‡ | 146.96% | 18.97% | 12.90% |
C-Class Shares | 157.38% | 19.24% | 12.60% |
C-Class Shares with CDSC§ | 156.38% | 19.24% | 12.60% |
H-Class Shares | 159.27% | 20.06% | 13.43% |
Russell 2000 Index | 94.85% | 16.35% | 13.85% |
* | The performance data above represents past performance that is not predictive of future results. The investment return and principal value of an investment in the Fund will fluctuate so that an investor’s shares, when redeemed, may be worth more or less than their original cost. Returns are historical and include changes in principal and reinvested dividends and capital gains and do not reflect the effect of taxes. The Russell 2000 Index is an unmanaged index and, unlike the Fund, has no management fees or operating expenses to reduce its reported return. The graphs are based on A-Class shares and H-Class shares only; performance for C-Class shares will vary due to differences in fee structures. |
‡ | Fund returns are calculated using the maximum sales charge of 4.75%. |
§ | Fund returns include a CDSC of 1% if redeemed within 12 months of purchase. |
94 | THE RYDEX FUNDS ANNUAL REPORT | |
SCHEDULE OF INVESTMENTS | March 31, 2021 |
RUSSELL 2000® 1.5x STRATEGY FUND | |
| | Shares | | | Value | |
RIGHTS††† - 0.0% |
| | | | | | | | | |
Consumer, Non-cyclical - 0.0% |
Tobira Therapeutics, Inc.* | | | 14 | | | $ | — | |
Omthera Pharmaceuticals, Inc.* | | | 57 | | | | — | |
Total Consumer, Non-cyclical | | | | | | | — | |
| | | | | | | | | |
Communications - 0.0% |
Nexstar Media Group, Inc.* | | | 85 | | | | — | |
Total Rights | | | | |
(Cost $—) | | | | | | | — | |
| | | | | | | | | |
MUTUAL FUNDS† - 18.1% |
Guggenheim Ultra Short Duration Fund — Institutional Class1 | | | 112,170 | | | | 1,117,210 | |
Guggenheim Strategy Fund II1 | | | 36,876 | | | | 921,165 | |
Total Mutual Funds | | | | |
(Cost $2,023,780) | | | | | | | 2,038,375 | |
| | | | | | | | | |
| | | Face
Amount | | | | | |
U.S. TREASURY BILLS†† - 33.6% |
U.S. Treasury Bills |
0.09% due 04/01/212,3 | | $ | 1,100,000 | | | | 1,100,000 | |
0.01% due 04/20/212 | | | 800,000 | | | | 799,991 | |
0.03% due 04/01/212,3 | | | 380,000 | | | | 380,000 | |
0.01% due 04/22/212,4 | | | 20,000 | | | | 20,000 | |
U.S. Cash Management Bill |
0.03% due 08/03/212 | | | 1,500,000 | | | | 1,499,851 | |
Total U.S. Treasury Bills | | | | |
(Cost $3,799,848) | | | | | | | 3,799,842 | |
FEDERAL AGENCY NOTES†† - 15.5% |
Federal Farm Credit Bank |
0.40% (U.S. Prime Rate - 2.85%, Rate Floor: 0.00%) due 08/30/225 | | | 1,000,000 | | | | 1,003,796 | |
0.14% (1 Month USD LIBOR + 0.03%, Rate Floor: 0.00%) due 12/29/215 | | | 500,000 | | | | 500,232 | |
0.45% (U.S. Prime Rate - 2.80%, Rate Floor: 0.00%) due 03/14/225 | | | 250,000 | | | | 250,791 | |
Total Federal Agency Notes | | | | |
(Cost $1,750,305) | | | | | | | 1,754,819 | |
| | | | | | | | | |
FEDERAL AGENCY DISCOUNT NOTES†† - 11.5% |
Federal Home Loan Bank |
0.01% due 04/14/212 | | | 1,300,000 | | | | 1,299,997 | |
Total Federal Agency Discount Notes | | | | |
(Cost $1,299,997) | | | | | | | 1,299,997 | |
| | | | | | | | | |
REPURCHASE AGREEMENTS††,6 - 34.6% |
J.P. Morgan Securities LLC
issued 03/31/21 at 0.01%
due 04/01/213 | | | 2,093,998 | | | | 2,093,998 | |
Barclays Capital, Inc.
issued 03/31/21 at 0.01%
due 04/01/213 | | | 952,033 | | | | 952,033 | |
BofA Securities, Inc.
issued 03/31/21 at 0.01%
due 04/01/213 | | | 868,879 | | | | 868,879 | |
Total Repurchase Agreements | | | | |
(Cost $3,914,910) | | | | | | | 3,914,910 | |
| | | | | | | | | |
Total Investments - 113.3% | | | | |
(Cost $12,788,840) | | $ | 12,807,943 | |
Other Assets & Liabilities, net - (13.3)% | | | (1,502,287 | ) |
Total Net Assets - 100.0% | | $ | 11,305,656 | |
Futures Contracts |
Description | | Number of
Contracts | | | Expiration
Date | | | Notional
Amount | | | Value and
Unrealized
Depreciation** | |
Equity Futures Contracts Purchased† |
Russell 2000 Index Mini Futures Contracts | | | 5 | | | | Jun 2021 | | | $ | 555,825 | | | $ | (31,803 | ) |
Total Return Swap Agreements |
Counterparty | Index | Financing
Rate Pay | Payment
Frequency | | Maturity
Date | | | Units | | | Notional
Amount | | | Value and
Unrealized
Depreciation | |
OTC Equity Index Swap Agreements†† |
Goldman Sachs International | Russell 2000 Index | 0.34% (1 Week USD LIBOR + 0.25%) | At Maturity | | | 05/27/21 | | | | 2,278 | | | $ | 5,058,807 | | | $ | (1,324 | ) |
Barclays Bank plc | Russell 2000 Index | 0.09% (1 Week USD LIBOR) | At Maturity | | | 05/26/21 | | | | 4,266 | | | | 9,471,722 | | | | (4,037 | ) |
BNP Paribas | Russell 2000 Index | 0.21% (1 Month USD LIBOR + 0.10%) | At Maturity | | | 04/08/21 | | | | 854 | | | | 1,896,427 | | | | (27,507 | ) |
| | | | | | | | | | | | | | $ | 16,426,956 | | | $ | (32,868 | ) |
SEE NOTES TO FINANCIAL STATEMENTS. | THE RYDEX FUNDS ANNUAL REPORT | 95 |
SCHEDULE OF INVESTMENTS (continued) | March 31, 2021 |
RUSSELL 2000® 1.5x STRATEGY FUND | |
* | Non-income producing security. |
** | Includes cumulative appreciation (depreciation). Variation margin is reported within the Statement of Assets and Liabilities. |
† | Value determined based on Level 1 inputs — See Note 4. |
†† | Value determined based on Level 2 inputs — See Note 4. |
††† | Value determined based on Level 3 inputs — See Note 4. |
1 | Affiliated issuer. |
2 | Rate indicated is the effective yield at the time of purchase. |
3 | All or a portion of this security is pledged as equity index swap collateral at March 31, 2021. |
4 | All or a portion of this security is pledged as futures collateral at March 31, 2021. |
5 | Variable rate security. Rate indicated is the rate effective at March 31, 2021. In some instances, the effective rate is limited by a minimum rate floor or a maximum rate cap established by the issuer. The settlement status of a position may also impact the effective rate indicated. In some cases, a position may be unsettled at period end and may not have a stated effective rate. In instances where multiple underlying reference rates and spread amounts are shown, the effective rate is based on a weighted average. |
6 | Repurchase Agreements — See Note 6. |
| | LIBOR — London Interbank Offered Rate |
| | plc — Public Limited Company |
| | |
| | See Sector Classification in Other Information section. |
The following table summarizes the inputs used to value the Fund’s investments at March 31, 2021 (See Note 4 in the Notes to Financial Statements):
Investments in Securities (Assets) | | Level 1
Quoted
Prices | | | Level 2
Significant
Observable
Inputs | | | Level 3
Significant
Unobservable
Inputs | | | Total | |
Rights | | $ | — | | | $ | — | | | $ | — | * | | $ | — | |
Mutual Funds | | | 2,038,375 | | | | — | | | | — | | | | 2,038,375 | |
U.S. Treasury Bills | | | — | | | | 3,799,842 | | | | — | | | | 3,799,842 | |
Federal Agency Notes | | | — | | | | 1,754,819 | | | | — | | | | 1,754,819 | |
Federal Agency Discount Notes | | | — | | | | 1,299,997 | | | | — | | | | 1,299,997 | |
Repurchase Agreements | | | — | | | | 3,914,910 | | | | — | | | | 3,914,910 | |
Total Assets | | $ | 2,038,375 | | | $ | 10,769,568 | | | $ | — | | | $ | 12,807,943 | |
Investments in Securities (Liabilities) | | Level 1
Quoted
Prices | | | Level 2
Significant
Observable
Inputs | | | Level 3
Significant
Unobservable
Inputs | | | Total | |
Equity Futures Contracts** | | $ | 31,803 | | | $ | — | | | $ | — | | | $ | 31,803 | |
Equity Index Swap Agreements** | | | — | | | | 32,868 | | | | — | | | | 32,868 | |
Total Liabilities | | $ | 31,803 | | | $ | 32,868 | | | $ | — | | | $ | 64,671 | |
* | Includes securities with a market value of $0. |
** | This derivative is reported as unrealized appreciation/depreciation at period end. |
96 | THE RYDEX FUNDS ANNUAL REPORT | SEE NOTES TO FINANCIAL STATEMENTS. |
SCHEDULE OF INVESTMENTS (concluded) | March 31, 2021 |
RUSSELL 2000® 1.5x STRATEGY FUND | |
Affiliated Transactions
Investments representing 5% or more of the outstanding voting shares of a company, or control of or by, or common control under Guggenheim Investments (“GI”), result in that company being considered an affiliated issuer, as defined in the 1940 Act.
The Fund may invest in certain of the underlying series of Guggenheim Strategy Funds Trust, including Guggenheim Strategy Fund II and Guggenheim Strategy Fund III, (collectively, the “Short Term Investment Vehicles”), each of which are open-end management investment companies managed by GI. The Short Term Investment Vehicles, which launched on March 11, 2014, are offered as short term investment options only to mutual funds, trusts, and other accounts managed by GI and/or its affiliates, and are not available to the public. The Short Term Investment Vehicles pay no investment management fees. The Short Term Investment Vehicles’ annual report on Form N-CSR dated September 30, 2020, is available publicly or upon request. This information is available from the EDGAR database on the SEC’s website at https://www.sec.gov/Archives/edgar/data/1601445/000182126820000133/gug81042-ncsr.htm.
Transactions during the year ended March 31, 2021, in which the company is an affiliated issuer, were as follows:
Security Name | | Value
03/31/20 | | | Additions | | | Reductions | | | Realized
Gain (Loss) | | | Change in
Unrealized
Appreciation
(Depreciation) | | | Value
03/31/21 | | | Shares
03/31/21 | | | Investment
Income | |
Mutual Funds | | | | | | | | | | | | | | | | | | | | | | | | | | | | | | | | |
Guggenheim Strategy Fund II | | $ | 205,017 | | | $ | 704,999 | | | $ | — | | | $ | — | | | $ | 11,149 | | | $ | 921,165 | | | | 36,876 | | | $ | 10,250 | |
Guggenheim Ultra Short Duration Fund — Institutional Class | | | 204,752 | | | | 908,000 | | | | — | | | | — | | | | 4,458 | | | | 1,117,210 | | | | 112,170 | | | | 7,045 | |
| | | $ | 409,769 | | | $ | 1,612,999 | | | $ | — | | | $ | — | | | $ | 15,607 | | | $ | 2,038,375 | | | | | | | $ | 17,295 | |
SEE NOTES TO FINANCIAL STATEMENTS. | THE RYDEX FUNDS ANNUAL REPORT | 97 |
RUSSELL 2000® 1.5x STRATEGY FUND | |
STATEMENT OF ASSETS AND LIABILITIES |
March 31, 2021 |
Assets: |
Investments in unaffiliated issuers, at value (cost $6,850,150) | | $ | 6,854,658 | |
Investments in affiliated issuers, at value (cost $2,023,780) | | | 2,038,375 | |
Repurchase agreements, at value (cost $3,914,910) | | | 3,914,910 | |
Segregated cash with broker | | | 12,600 | |
Receivables: |
Fund shares sold | | | 31,023 | |
Variation margin on futures contracts | | | 7,725 | |
Swap settlement | | | 5,466 | |
Dividends | | | 2,050 | |
Interest | | | 418 | |
Total assets | | | 12,867,225 | |
| | | | | |
Liabilities: |
Unrealized depreciation on OTC swap agreements | | | 32,868 | |
Payable for: |
Securities purchased | | | 1,499,851 | |
Management fees | | | 8,560 | |
Transfer agent and administrative fees | | | 2,630 | |
Distribution and service fees | | | 2,493 | |
Portfolio accounting fees | | | 978 | |
Trustees’ fees* | | | 180 | |
Fund shares redeemed | | | 7 | |
Miscellaneous | | | 14,002 | |
Total liabilities | | | 1,561,569 | |
Commitments and contingent liabilities (Note 12) | | | — | |
Net assets | | $ | 11,305,656 | |
| | | | | |
Net assets consist of: |
Paid in capital | | $ | 7,364,887 | |
Total distributable earnings (loss) | | | 3,940,769 | |
Net assets | | $ | 11,305,656 | |
| | | | | |
A-Class: |
Net assets | | $ | 1,748,715 | |
Capital shares outstanding | | | 17,276 | |
Net asset value per share | | $ | 101.22 | |
Maximum offering price per share (Net asset value divided by 95.25%) | | $ | 106.27 | |
| | | | | |
C-Class: |
Net assets | | $ | 74,602 | |
Capital shares outstanding | | | 882 | |
Net asset value per share | | $ | 84.58 | |
| | | | | |
H-Class: |
Net assets | | $ | 9,482,339 | |
Capital shares outstanding | | | 94,058 | |
Net asset value per share | | $ | 100.81 | |
STATEMENT OF OPERATIONS |
Year Ended March 31, 2021 |
Investment Income: |
Dividends from securities of affiliated issuers | | $ | 17,295 | |
Interest | | | 11,430 | |
Total investment income | | | 28,725 | |
| | | | | |
Expenses: |
Management fees | | | 75,361 | |
Distribution and service fees: |
A-Class | | | 3,545 | |
C-Class | | | 416 | |
H-Class | | | 17,285 | |
Transfer agent and administrative fees | | | 23,322 | |
Portfolio accounting fees | | | 8,375 | |
Professional fees | | | 2,187 | |
Trustees’ fees* | | | 1,457 | |
Custodian fees | | | 1,186 | |
Interest expense | | | 65 | |
Miscellaneous | | | 16,285 | |
Total expenses | | | 149,484 | |
Less: |
Expenses waived by Adviser | | | (1,635 | ) |
Net expenses | | | 147,849 | |
Net investment loss | | | (119,124 | ) |
| | | | | |
Net Realized and Unrealized Gain (Loss): |
Net realized gain (loss) on: |
Investments in unaffiliated issuers | | | 2,520 | |
Swap agreements | | | 8,079,448 | |
Futures contracts | | | 611,821 | |
Net realized gain | | | 8,693,789 | |
Net change in unrealized appreciation (depreciation) on: |
Investments in unaffiliated issuers | | | 337 | |
Investments in affiliated issuers | | | 15,607 | |
Swap agreements | | | (135,523 | ) |
Futures contracts | | | (112,041 | ) |
Net change in unrealized appreciation (depreciation) | | | (231,620 | ) |
Net realized and unrealized gain | | | 8,462,169 | |
Net increase in net assets resulting from operations | | $ | 8,343,045 | |
* | Relates to Trustees not deemed “interested persons” within the meaning of Section 2(a)(19) of the 1940 Act. |
98 | THE RYDEX FUNDS ANNUAL REPORT | SEE NOTES TO FINANCIAL STATEMENTS. |
RUSSELL 2000® 1.5x STRATEGY FUND | |
STATEMENTS OF CHANGES IN NET ASSETS |
| | Year Ended
March 31,
2021 | | | Year Ended
March 31,
2020 | |
Increase (Decrease) in Net Assets from Operations: | | | | | | | | |
Net investment income (loss) | | $ | (119,124 | ) | | $ | 25,700 | |
Net realized gain (loss) on investments | | | 8,693,789 | | | | (99,789 | ) |
Net change in unrealized appreciation (depreciation) on investments | | | (231,620 | ) | | | (79,838 | ) |
Net increase (decrease) in net assets resulting from operations | | | 8,343,045 | | | | (153,927 | ) |
| | | | | | | | | |
Distributions to shareholders: | | | | | | | | |
A-Class | | | (4,708 | ) | | | — | |
C-Class | | | (156 | ) | | | — | |
H-Class | | | (20,841 | ) | | | — | |
Total distributions to shareholders | | | (25,705 | ) | | | — | |
| | | | | | | | | |
Capital share transactions: | | | | | | | | |
Proceeds from sale of shares | | | | | | | | |
A-Class | | | 57,548 | | | | 193,205 | |
C-Class | | | 39,120 | | | | 11,734 | |
H-Class | | | 35,843,045 | | | | 212,569,841 | |
Distributions reinvested | | | | | | | | |
A-Class | | | 4,547 | | | | — | |
C-Class | | | 156 | | | | — | |
H-Class | | | 20,710 | | | | — | |
Cost of shares redeemed | | | | | | | | |
A-Class | | | (556,001 | ) | | | (674,399 | ) |
C-Class | | | (19,899 | ) | | | (54,294 | ) |
H-Class | | | (36,717,049 | ) | | | (216,394,438 | ) |
Net decrease from capital share transactions | | | (1,327,823 | ) | | | (4,348,351 | ) |
Net increase (decrease) in net assets | | | 6,989,517 | | | | (4,502,278 | ) |
| | | | | | | | | |
Net assets: | | | | | | | | |
Beginning of year | | | 4,316,139 | | | | 8,818,417 | |
End of year | | $ | 11,305,656 | | | $ | 4,316,139 | |
| | | | | | | | | |
Capital share activity: | | | | | | | | |
Shares sold | | | | | | | | |
A-Class | | | 969 | | | | 3,369 | |
C-Class | | | 588 | | | | 210 | |
H-Class | | | 558,116 | | | | 3,198,054 | |
Shares issued from reinvestment of distributions | | | | | | | | |
A-Class | | | 55 | | | | — | |
C-Class | | | 2 | | | | — | |
H-Class | | | 253 | | | | — | |
Shares redeemed | | | | | | | | |
A-Class | | | (7,944 | ) | | | (11,618 | ) |
C-Class | | | (368 | ) | | | (995 | ) |
H-Class | | | (550,126 | ) | | | (3,217,593 | ) |
Net increase (decrease) in shares | | | 1,545 | | | | (28,573 | ) |
SEE NOTES TO FINANCIAL STATEMENTS. | THE RYDEX FUNDS ANNUAL REPORT | 99 |
RUSSELL 2000® 1.5x STRATEGY FUND | |
This table is presented to show selected data for a share outstanding throughout each period and to assist shareholders in evaluating a Fund’s performance for the periods presented.
A-Class | | Year Ended
March 31,
2021 | | | Year Ended
March 31,
2020 | | | Year Ended
March 31,
2019 | | | Year Ended
March 29,
2018 | | | Year Ended
March 31,
2017 | |
Per Share Data |
Net asset value, beginning of period | | $ | 39.16 | | | $ | 63.62 | | | $ | 64.49 | | | $ | 55.99 | | | $ | 44.78 | |
Income (loss) from investment operations: |
Net investment income (loss)a | | | (.94 | ) | | | .32 | | | | .34 | | | | .02 | | | | (.32 | ) |
Net gain (loss) on investments (realized and unrealized) | | | 63.25 | | | | (24.78 | ) | | | (1.21 | )e | | | 8.48 | | | | 16.87 | |
Total from investment operations | | | 62.31 | | | | (24.46 | ) | | | (.87 | ) | | | 8.50 | | | | 16.55 | |
Less distributions from: |
Net investment income | | | (.25 | ) | | | — | | | | — | | | | — | | | | — | |
Net realized gains | | | — | | | | — | | | | — | | | | — | | | | (5.34 | ) |
Total distributions | | | (.25 | ) | | | — | | | | — | | | | — | | | | (5.34 | ) |
Net asset value, end of period | | $ | 101.22 | | | $ | 39.16 | | | $ | 63.62 | | | $ | 64.49 | | | $ | 55.99 | |
|
Total Returnb | | | 159.26 | % | | | (38.45 | %) | | | (1.35 | %) | | | 15.18 | % | | | 38.01 | % |
Ratios/Supplemental Data |
Net assets, end of period (in thousands) | | $ | 1,749 | | | $ | 948 | | | $ | 2,064 | | | $ | 1,400 | | | $ | 1,172 | |
Ratios to average net assets: |
Net investment income (loss) | | | (1.40 | %) | | | 0.50 | % | | | 0.52 | % | | | 0.03 | % | | | (0.62 | %) |
Total expensesc | | | 1.79 | % | | | 1.82 | % | | | 1.80 | % | | | 1.72 | % | | | 1.73 | % |
Net expensesd | | | 1.77 | % | | | 1.76 | % | | | 1.78 | % | | | 1.72 | % | | | 1.73 | % |
Portfolio turnover rate | | | — | | | | 93 | % | | | 258 | % | | | 580 | % | | | 1,315 | % |
C-Class | | Year Ended
March 31,
2021 | | | Year Ended
March 31,
2020 | | | Year Ended
March 31,
2019 | | | Year Ended
March 29,
2018 | | | Year Ended
March 31,
2017 | |
Per Share Data |
Net asset value, beginning of period | | $ | 32.98 | | | $ | 54.00 | | | $ | 55.14 | | | $ | 48.24 | | | $ | 39.44 | |
Income (loss) from investment operations: |
Net investment income (loss)a | | | (1.27 | ) | | | (.12 | ) | | | (.30 | ) | | | (.40 | ) | | | (.63 | ) |
Net gain (loss) on investments (realized and unrealized) | | | 53.12 | | | | (20.90 | ) | | | (.84 | )e | | | 7.30 | | | | 14.77 | |
Total from investment operations | | | 51.85 | | | | (21.02 | ) | | | (1.14 | ) | | | 6.90 | | | | 14.14 | |
Less distributions from: |
Net investment income | | | (.25 | ) | | | — | | | | — | | | | — | | | | — | |
Net realized gains | | | — | | | | — | | | | — | | | | — | | | | (5.34 | ) |
Total distributions | | | (.25 | ) | | | — | | | | — | | | | — | | | | (5.34 | ) |
Net asset value, end of period | | $ | 84.58 | | | $ | 32.98 | | | $ | 54.00 | | | $ | 55.14 | | | $ | 48.24 | |
|
Total Returnb | | | 157.38 | % | | | (38.93 | %) | | | (2.07 | %) | | | 14.30 | % | | | 36.98 | % |
Ratios/Supplemental Data |
Net assets, end of period (in thousands) | | $ | 75 | | | $ | 22 | | | $ | 78 | | | $ | 1,017 | | | $ | 1,494 | |
Ratios to average net assets: |
Net investment income (loss) | | | (2.16 | %) | | | (0.22 | %) | | | (0.50 | %) | | | (0.78 | %) | | | (1.41 | %) |
Total expensesc | | | 2.52 | % | | | 2.57 | % | | | 2.54 | % | | | 2.48 | % | | | 2.47 | % |
Net expensesd | | | 2.50 | % | | | 2.51 | % | | | 2.53 | % | | | 2.48 | % | | | 2.47 | % |
Portfolio turnover rate | | | — | | | | 93 | % | | | 258 | % | | | 580 | % | | | 1,315 | % |
100 | THE RYDEX FUNDS ANNUAL REPORT | SEE NOTES TO FINANCIAL STATEMENTS. |
RUSSELL 2000® 1.5x STRATEGY FUND | |
FINANCIAL HIGHLIGHTS (concluded) |
This table is presented to show selected data for a share outstanding throughout each period and to assist shareholders in evaluating a Fund’s performance for the periods presented.
H-Class | | Year Ended
March 31,
2021 | | | Year Ended
March 31,
2020 | | | Year Ended
March 31,
2019 | | | Year Ended
March 29,
2018 | | | Year Ended
March 31,
2017 | |
Per Share Data |
Net asset value, beginning of period | | $ | 39.00 | | | $ | 63.37 | | | $ | 64.22 | | | $ | 55.86 | | | $ | 44.75 | |
Income (loss) from investment operations: |
Net investment income (loss)a | | | (.98 | ) | | | .09 | | | | .29 | | | | (.11 | ) | | | (.51 | ) |
Net gain (loss) on investments (realized and unrealized) | | | 63.04 | | | | (24.46 | ) | | | (1.14 | )e | | | 8.47 | | | | 16.96 | |
Total from investment operations | | | 62.06 | | | | (24.37 | ) | | | (.85 | ) | | | 8.36 | | | | 16.45 | |
Less distributions from: |
Net investment income | | | (.25 | ) | | | — | | | | — | | | | — | | | | — | |
Net realized gains | | | — | | | | — | | | | — | | | | — | | | | (5.34 | ) |
Total distributions | | | (.25 | ) | | | — | | | | — | | | | — | | | | (5.34 | ) |
Net asset value, end of period | | $ | 100.81 | | | $ | 39.00 | | | $ | 63.37 | | | $ | 64.22 | | | $ | 55.86 | |
|
Total Return | | | 159.27 | % | | | (38.46 | %) | | | (1.32 | %) | | | 14.97 | % | | | 37.80 | % |
Ratios/Supplemental Data |
Net assets, end of period (in thousands) | | $ | 9,482 | | | $ | 3,347 | | | $ | 6,676 | | | $ | 7,178 | | | $ | 8,447 | |
Ratios to average net assets: |
Net investment income (loss) | | | (1.42 | %) | | | 0.14 | % | | | 0.46 | % | | | (0.18 | %) | | | (0.98 | %) |
Total expensesc | | | 1.78 | % | | | 1.84 | % | | | 1.81 | % | | | 1.72 | % | | | 1.73 | % |
Net expensesd | | | 1.76 | % | | | 1.80 | % | | | 1.80 | % | | | 1.72 | % | | | 1.73 | % |
Portfolio turnover rate | | | — | | | | 93 | % | | | 258 | % | | | 580 | % | | | 1,315 | % |
a | Net investment income (loss) per share was computed using average shares outstanding throughout the period. |
b | Total return does not reflect the impact of any applicable sales charges. |
c | Does not include expenses of the underlying funds in which the Fund invests. |
d | Net expense information reflects the expense ratios after expense waivers and reimbursements, as applicable. |
e | The amount shown for a share outstanding throughout the period does not agree with the aggregate net gain on investments for the year because of the sales and repurchases of fund shares in relation to fluctuating market value of the investments of the Fund. |
SEE NOTES TO FINANCIAL STATEMENTS. | THE RYDEX FUNDS ANNUAL REPORT | 101 |
PERFORMANCE REPORT AND FUND PROFILE (Unaudited) | March 31, 2021 |
RUSSELL 2000® FUND
OBJECTIVE: Seeks to provide investment results that match, before fees and expenses, the performance of a specific benchmark on a daily basis. The Fund’s current benchmark is the Russell 2000® Index (the “underlying index”).
For the one-year period ended March 31, 2021, Russell 2000® Fund maintained a daily correlation of over 99% to its benchmark of the daily price movement of the Russell 2000 Index.
Russell 2000® Fund H-Class returned 91.73%, while the Russell 2000 Index returned 94.85% over the same time period.
All sectors contributed to the return of the underlying index for the period, led by Health Care, Consumer Discretionary, and Industrials.
The holdings contributing the most to the return of the underlying index were Penn National Gaming, Inc., Plug Power, Inc., and MyoKardia, Inc. The holdings detracting the most were eHealth, Inc., Green Dot Corp. Class A, and Merit Medical Systems, Inc.
Derivatives in the Fund were used to help provide exposure to the composition of the benchmark in the most efficient manner possible and not for hedging purposes. Derivatives performed as expected.
Performance displayed represents past performance, which is no guarantee of future results.
Holdings Diversification (Market Exposure as % of Net Assets)
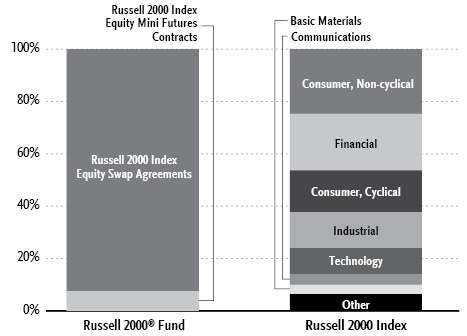
“Holdings Diversification (Market Exposure as % of Net Assets)” excludes any temporary cash investments.
Inception Dates: |
A-Class | May 31, 2006 |
C-Class | May 31, 2006 |
H-Class | May 31, 2006 |
The Fund invests principally in derivative investments such as swap agreements and futures contracts.
102 | THE RYDEX FUNDS ANNUAL REPORT | |
PERFORMANCE REPORT AND FUND PROFILE (Unaudited)(concluded) | March 31, 2021 |
Cumulative Fund Performance*
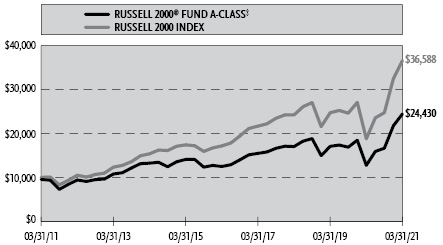
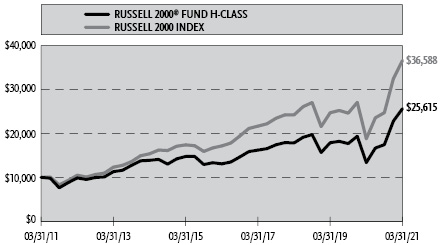
Average Annual Returns*
Periods Ended March 31, 2021
| 1 Year | 5 Year | 10 Year |
A-Class Shares | 91.75% | 14.40% | 9.88% |
A-Class Shares with sales charge‡ | 82.63% | 13.29% | 9.34% |
C-Class Shares | 90.32% | 13.54% | 9.03% |
C-Class Shares with CDSC§ | 89.32% | 13.54% | 9.03% |
H-Class Shares | 91.73% | 14.40% | 9.86% |
Russell 2000 Index | 94.85% | 16.35% | 13.85% |
* | The performance data above represents past performance that is not predictive of future results. The investment return and principal value of an investment in the Fund will fluctuate so that an investor’s shares, when redeemed, may be worth more or less than their original cost. Returns are historical and include changes in principal and reinvested dividends and capital gains and do not reflect the effect of taxes. The Russell 2000 Index is an unmanaged index and, unlike the Fund, has no management fees or operating expenses to reduce its reported return. The graphs are based on A-Class shares and H-Class shares only; performance for C-Class shares will vary due to differences in fee structures. |
‡ | Fund returns are calculated using the maximum sales charge of 4.75%. |
§ | Fund returns include a CDSC of 1% if redeemed within 12 months of purchase. |
| | THE RYDEX FUNDS ANNUAL REPORT | 103 |
SCHEDULE OF INVESTMENTS | March 31, 2021 |
RUSSELL 2000® FUND | |
| | Shares | | | Value | |
RIGHTS††† - 0.0% |
| | | | | | | | | |
Consumer, Non-cyclical - 0.0% |
Elanco Animal Health, Inc.* | | | 505 | | | $ | — | |
Oncternal Therapeutics, Inc.* | | | 7 | | | | — | |
Omthera Pharmaceuticals, Inc.* | | | 86 | | | | — | |
Tobira Therapeutics, Inc.* | | | 141 | | | | — | |
Total Consumer, Non-cyclical | | | | | | | — | |
| | | | | | | | | |
Communications - 0.0% |
Nexstar Media Group, Inc.* | | | 2,530 | | | | — | |
Total Rights | | | | |
(Cost $103) | | | | | | | — | |
| | | | | | | | | |
| | | Face
Amount | | | | | |
FEDERAL AGENCY NOTES†† - 78.5% |
Federal Farm Credit Bank |
1.20% due 04/01/24 | | $ | 10,000,000 | | | | 10,000,000 | |
0.09% (3 Month USD LIBOR - 0.10%, Rate Floor: 0.00%) due 05/28/211 | | | 6,000,000 | | | | 6,000,320 | |
0.23% due 06/09/22 | | | 5,000,000 | | | | 5,001,131 | |
0.45% (U.S. Prime Rate - 2.80%, Rate Floor: 0.00%) due 03/14/221 | | | 4,000,000 | | | | 4,012,664 | |
0.31% (3 Month U.S. Treasury Bill Rate + 0.29%, Rate Floor: 0.00%) due 04/11/221 | | | 2,000,000 | | | | 2,004,593 | |
0.14% (1 Month USD LIBOR + 0.03%, Rate Floor: 0.00%) due 12/29/211 | | | 2,000,000 | | | | 2,000,926 | |
0.40% (U.S. Prime Rate - 2.85%, Rate Floor: 0.00%) due 08/30/221 | | | 1,000,000 | | | | 1,003,795 | |
Farmer Mac |
0.09% (3 Month USD LIBOR - 0.10%, Rate Floor: 0.00%) due 11/22/211 | | | 4,000,000 | | | | 4,000,072 | |
0.10% (3 Month USD LIBOR - 0.10%, Rate Floor: 0.00%) due 08/03/211 | | | 2,000,000 | | | | 2,000,147 | |
Total Federal Agency Notes | | | | |
(Cost $36,002,834) | | | | | | | 36,023,648 | |
| | | | | | | | | |
U.S. TREASURY BILLS†† - 38.8% |
U.S. Treasury Bills |
0.09% due 04/01/212,3 | | | 4,500,000 | | | | 4,500,000 | |
0.01% due 04/27/212 | | | 3,500,000 | | | | 3,499,956 | |
0.03% due 04/01/212,3 | | | 2,871,000 | | | | 2,871,000 | |
0.04% due 04/01/212,3 | | | 1,000,000 | | | | 1,000,000 | |
0.01% due 04/22/212,4 | | | 210,000 | | | | 209,998 | |
0.02% due 04/01/212,3 | | | 200,000 | | | | 200,000 | |
U.S. Cash Management Bill | | | | | | | | |
0.03% due 08/03/212 | | | 5,500,000 | | | | 5,499,455 | |
Total U.S. Treasury Bills | | | | |
(Cost $17,780,440) | | | | | | | 17,780,409 | |
| | | | | | | | | |
REPURCHASE AGREEMENTS††,5 - 2.6% |
J.P. Morgan Securities LLC
issued 03/31/21 at 0.01%
due 04/01/213 | | | 639,774 | | | | 639,774 | |
Barclays Capital, Inc.
issued 03/31/21 at 0.01%
due 04/01/213 | | | 290,873 | | | | 290,873 | |
BofA Securities, Inc.
issued 03/31/21 at 0.01%
due 04/01/213 | | | 265,467 | | | | 265,467 | |
Total Repurchase Agreements | | | | |
(Cost $1,196,114) | | | | | | | 1,196,114 | |
| | | | | | | | | |
Total Investments - 119.9% | | | | |
(Cost $54,979,491) | | $ | 55,000,171 | |
Other Assets & Liabilities, net - (19.9)% | | | (9,119,755 | ) |
Total Net Assets - 100.0% | | $ | 45,880,416 | |
Futures Contracts |
Description | | Number of
Contracts | | | Expiration
Date | | | Notional
Amount | | | Value and
Unrealized
Depreciation** | |
Equity Futures Contracts Purchased† |
Russell 2000 Index Mini Futures Contracts | | | 31 | | | | Jun 2021 | | | $ | 3,446,115 | | | $ | (178,332 | ) |
104 | THE RYDEX FUNDS ANNUAL REPORT | SEE NOTES TO FINANCIAL STATEMENTS. |
SCHEDULE OF INVESTMENTS (concluded) | March 31, 2021 |
RUSSELL 2000® FUND | |
Total Return Swap Agreements |
Counterparty | Index | Financing
Rate Pay | Payment
Frequency | | Maturity
Date | | | Units | | | Notional
Amount | | | Value and
Unrealized
Appreciation
(Depreciation) | |
OTC Equity Index Swap Agreements†† |
BNP Paribas | Russell 2000 Index | 0.21% (1 Month USD LIBOR + 0.10%) | At Maturity | | | 04/08/21 | | | | 640 | | | $ | 1,422,165 | | | $ | 40,414 | |
Goldman Sachs International | Russell 2000 Index | 0.34% (1 Week USD LIBOR + 0.25%) | At Maturity | | | 04/08/21 | | | | 926 | | | | 2,055,109 | | | | 34,429 | |
Barclays Bank plc | Russell 2000 Index | 0.09% (1 Week USD LIBOR) | At Maturity | | | 05/26/21 | | | | 17,542 | | | | 38,952,415 | | | | (2,348 | ) |
| | | | | | | | | | | | | | $ | 42,429,689 | | | $ | 72,495 | |
* | Non-income producing security. |
** | Includes cumulative appreciation (depreciation). Variation margin is reported within the Statement of Assets and Liabilities. |
† | Value determined based on Level 1 inputs — See Note 4. |
†† | Value determined based on Level 2 inputs — See Note 4. |
††† | Value determined based on Level 3 inputs — See Note 4. |
1 | Variable rate security. Rate indicated is the rate effective at March 31, 2021. In some instances, the effective rate is limited by a minimum rate floor or a maximum rate cap established by the issuer. The settlement status of a position may also impact the effective rate indicated. In some cases, a position may be unsettled at period end and may not have a stated effective rate. In instances where multiple underlying reference rates and spread amounts are shown, the effective rate is based on a weighted average. |
2 | Rate indicated is the effective yield at the time of purchase. |
3 | All or a portion of this security is pledged as equity index swap collateral at March 31, 2021. |
4 | All or a portion of this security is pledged as futures collateral at March 31, 2021. |
5 | Repurchase Agreements — See Note 6. |
| | LIBOR — London Interbank Offered Rate |
| | plc — Public Limited Company |
| | |
| | See Sector Classification in Other Information section. |
The following table summarizes the inputs used to value the Fund’s investments at March 31, 2021 (See Note 4 in the Notes to Financial Statements):
Investments in Securities (Assets) | | Level 1
Quoted
Prices | | | Level 2
Significant
Observable
Inputs | | | Level 3
Significant
Unobservable
Inputs | | | Total | |
Rights | | $ | — | | | $ | — | | | $ | — | * | | $ | — | |
Federal Agency Notes | | | — | | | | 36,023,648 | | | | — | | | | 36,023,648 | |
U.S. Treasury Bills | | | — | | | | 17,780,409 | | | | — | | | | 17,780,409 | |
Repurchase Agreements | | | — | | | | 1,196,114 | | | | — | | | | 1,196,114 | |
Equity Index Swap Agreements** | | | — | | | | 74,843 | | | | — | | | | 74,843 | |
Total Assets | | $ | — | | | $ | 55,075,014 | | | $ | — | | | $ | 55,075,014 | |
Investments in Securities (Liabilities) | | Level 1
Quoted
Prices | | | Level 2
Significant
Observable
Inputs | | | Level 3
Significant
Unobservable
Inputs | | | Total | |
Equity Futures Contracts** | | $ | 178,332 | | | $ | — | | | $ | — | | | $ | 178,332 | |
Equity Index Swap Agreements** | | | — | | | | 2,348 | | | | — | | | | 2,348 | |
Total Liabilities | | $ | 178,332 | | | $ | 2,348 | | | $ | — | | | $ | 180,680 | |
* | Includes securities with a market value of $0. |
** | This derivative is reported as unrealized appreciation/depreciation at period end. |
SEE NOTES TO FINANCIAL STATEMENTS. | THE RYDEX FUNDS ANNUAL REPORT | 105 |
STATEMENT OF
ASSETS AND LIABILITIES |
March 31, 2021 |
Assets: |
Investments, at value (cost $53,783,377) | | $ | 53,804,057 | |
Repurchase agreements, at value (cost $1,196,114) | | | 1,196,114 | |
Unrealized appreciation on OTC swap agreements | | | 74,843 | |
Receivables: |
Fund shares sold | | | 155,133 | |
Interest | | | 62,701 | |
Variation margin on futures contracts | | | 47,895 | |
Total assets | | | 55,340,743 | |
| | | | | |
Liabilities: |
Unrealized depreciation on OTC swap agreements | | | 2,348 | |
Payable for: |
Securities purchased | | | 5,499,455 | |
Fund shares redeemed | | | 3,698,924 | |
Swap settlement | | | 97,192 | |
Management fees | | | 42,301 | |
Distribution and service fees | | | 16,452 | |
Transfer agent and administrative fees | | | 15,172 | |
Portfolio accounting fees | | | 8,460 | |
Trustees’ fees* | | | 1,090 | |
Miscellaneous | | | 78,933 | |
Total liabilities | | | 9,460,327 | |
Commitments and contingent liabilities (Note 12) | | | — | |
Net assets | | $ | 45,880,416 | |
| | | | | |
Net assets consist of: |
Paid in capital | | $ | 41,649,211 | |
Total distributable earnings (loss) | | | 4,231,205 | |
Net assets | | $ | 45,880,416 | |
| | | | | |
A-Class: |
Net assets | | $ | 12,420,874 | |
Capital shares outstanding | | | 200,915 | |
Net asset value per share | | $ | 61.82 | |
Maximum offering price per share (Net asset value divided by 95.25%) | | $ | 64.90 | |
| | | | | |
C-Class: |
Net assets | | $ | 3,716,617 | |
Capital shares outstanding | | | 68,517 | |
Net asset value per share | | $ | 54.24 | |
| | | | | |
H-Class: |
Net assets | | $ | 29,742,925 | |
Capital shares outstanding | | | 482,192 | |
Net asset value per share | | $ | 61.68 | |
STATEMENT OF OPERATIONS |
Year Ended March 31, 2021 |
Investment Income: |
Interest | | $ | 48,619 | |
Total investment income | | | 48,619 | |
| | | | | |
Expenses: |
Management fees | | | 253,551 | |
Distribution and service fees: |
A-Class | | | 31,512 | |
C-Class | | | 22,395 | |
H-Class | | | 47,410 | |
Transfer agent and administrative fees | | | 94,122 | |
Portfolio accounting fees | | | 50,708 | |
Professional fees | | | 13,824 | |
Trustees’ fees* | | | 5,973 | |
Custodian fees | | | 4,755 | |
Interest expense | | | 103 | |
Miscellaneous | | | 57,138 | |
Total expenses | | | 581,491 | |
Net investment loss | | | (532,872 | ) |
| | | | | |
Net Realized and Unrealized Gain (Loss): |
Net realized gain (loss) on: |
Investments | | | (2,516 | ) |
Swap agreements | | | 18,290,067 | |
Futures contracts | | | 801,037 | |
Net realized gain | | | 19,088,588 | |
Net change in unrealized appreciation (depreciation) on: |
Investments | | | 28,271 | |
Swap agreements | | | (335,233 | ) |
Futures contracts | | | (342,408 | ) |
Net change in unrealized appreciation (depreciation) | | | (649,370 | ) |
Net realized and unrealized gain | | | 18,439,218 | |
Net increase in net assets resulting from operations | | $ | 17,906,346 | |
* | Relates to Trustees not deemed “interested persons” within the meaning of Section 2(a)(19) of the 1940 Act. |
106 | THE RYDEX FUNDS ANNUAL REPORT | SEE NOTES TO FINANCIAL STATEMENTS. |
STATEMENTS OF CHANGES IN NET ASSETS |
| | Year Ended
March 31,
2021 | | | Year Ended
March 31,
2020 | |
Increase (Decrease) in Net Assets from Operations: | | | | | | | | |
Net investment loss | | $ | (532,872 | ) | | $ | (17,866 | ) |
Net realized gain (loss) on investments | | | 19,088,588 | | | | (4,222,937 | ) |
Net change in unrealized appreciation (depreciation) on investments | | | (649,370 | ) | | | (3,894,018 | ) |
Net increase (decrease) in net assets resulting from operations | | | 17,906,346 | | | | (8,134,821 | ) |
| | | | | | | | | |
Distributions to shareholders: | | | | | | | | |
A-Class | | | — | | | | (245,858 | ) |
C-Class | | | — | | | | (43,126 | ) |
H-Class | | | — | | | | (276,721 | ) |
Total distributions to shareholders | | | — | | | | (565,705 | ) |
| | | | | | | | | |
Capital share transactions: | | | | | | | | |
Proceeds from sale of shares | | | | | | | | |
A-Class | | | 16,968,164 | | | | 3,057,098 | |
C-Class | | | 2,759,107 | | | | 815,695 | |
H-Class | | | 106,439,279 | | | | 178,802,664 | |
Distributions reinvested | | | | | | | | |
A-Class | | | — | | | | 241,990 | |
C-Class | | | — | | | | 36,271 | |
H-Class | | | — | | | | 274,144 | |
Cost of shares redeemed | | | | | | | | |
A-Class | | | (22,364,500 | ) | | | (7,262,452 | ) |
C-Class | | | (2,002,731 | ) | | | (1,845,375 | ) |
H-Class | | | (92,858,855 | ) | | | (187,602,791 | ) |
Net increase (decrease) from capital share transactions | | | 8,940,464 | | | | (13,482,756 | ) |
Net increase (decrease) in net assets | | | 26,846,810 | | | | (22,183,282 | ) |
| | | | | | | | | |
Net assets: | | | | | | | | |
Beginning of year | | | 19,033,606 | | | | 41,216,888 | |
End of year | | $ | 45,880,416 | | | $ | 19,033,606 | |
| | | | | | | | | |
Capital share activity: | | | | | | | | |
Shares sold | | | | | | | | |
A-Class | | | 323,213 | | | | 73,128 | |
C-Class | | | 61,590 | | | | 21,433 | |
H-Class | | | 2,060,052 | | | | 4,120,156 | |
Shares issued from reinvestment of distributions | | | | | | | | |
A-Class | | | — | | | | 5,216 | |
C-Class | | | — | | | | 883 | |
H-Class | | | — | | | | 5,922 | |
Shares redeemed | | | | | | | | |
A-Class | | | (454,528 | ) | | | (169,984 | ) |
C-Class | | | (48,862 | ) | | | (50,018 | ) |
H-Class | | | (1,787,076 | ) | | | (4,360,424 | ) |
Net increase (decrease) in shares | | | 154,389 | | | | (353,688 | ) |
SEE NOTES TO FINANCIAL STATEMENTS. | THE RYDEX FUNDS ANNUAL REPORT | 107 |
This table is presented to show selected data for a share outstanding throughout each period and to assist shareholders in evaluating a Fund’s performance for the periods presented.
A-Class | | Year Ended
March 31,
2021 | | | Year Ended
March 31,
2020 | | | Year Ended
March 31,
2019 | | | Year Ended
March 29,
2018 | | | Year Ended
March 31,
2017 | |
Per Share Data |
Net asset value, beginning of period | | $ | 32.24 | | | $ | 43.81 | | | $ | 43.67 | | | $ | 41.61 | | | $ | 33.56 | |
Income (loss) from investment operations: |
Net investment income (loss)a | | | (.77 | ) | | | — | c | | | (.05 | ) | | | (.17 | ) | | | (.21 | ) |
Net gain (loss) on investments (realized and unrealized) | | | 30.35 | | | | (10.89 | ) | | | .19 | d | | | 4.34 | | | | 8.26 | |
Total from investment operations | | | 29.58 | | | | (10.89 | ) | | | .14 | | | | 4.17 | | | | 8.05 | |
Less distributions from: |
Net investment income | | | — | | | | (.01 | ) | | | — | | | | — | | | | — | |
Net realized gains | | | — | | | | (.67 | ) | | | — | | | | (2.11 | ) | | | — | |
Total distributions | | | — | | | | (.68 | ) | | | — | | | | (2.11 | ) | | | — | |
Net asset value, end of period | | $ | 61.82 | | | $ | 32.24 | | | $ | 43.81 | | | $ | 43.67 | | | $ | 41.61 | |
|
Total Returnb | | | 91.75 | % | | | (25.32 | %) | | | 0.32 | % | | | 10.03 | % | | | 23.96 | % |
Ratios/Supplemental Data |
Net assets, end of period (in thousands) | | $ | 12,421 | | | $ | 10,712 | | | $ | 18,569 | | | $ | 17,163 | | | $ | 14,650 | |
Ratios to average net assets: |
Net investment income (loss) | | | (1.53 | %) | | | — | e | | | (0.11 | %) | | | (0.40 | %) | | | (0.54 | %) |
Total expenses | | | 1.67 | % | | | 1.73 | % | | | 1.71 | % | | | 1.63 | % | | | 1.62 | % |
Portfolio turnover rate | | | — | | | | 35 | % | | | 112 | % | | | 167 | % | | | 203 | % |
C-Class | | Year Ended
March 31,
2021 | | | Year Ended
March 31,
2020 | | | Year Ended
March 31,
2019 | | | Year Ended
March 29,
2018 | | | Year Ended
March 31,
2017 | |
Per Share Data |
Net asset value, beginning of period | | $ | 28.50 | | | $ | 39.09 | | | $ | 39.26 | | | $ | 37.87 | | | $ | 30.78 | |
Income (loss) from investment operations: |
Net investment income (loss)a | | | (.95 | ) | | | (.29 | ) | | | (.37 | ) | | | (.45 | ) | | | (.44 | ) |
Net gain (loss) on investments (realized and unrealized) | | | 26.69 | | | | (9.62 | ) | | | .20 | d | | | 3.95 | | | | 7.53 | |
Total from investment operations | | | 25.74 | | | | (9.91 | ) | | | (.17 | ) | | | 3.50 | | | | 7.09 | |
Less distributions from: |
Net investment income | | | — | | | | (.01 | ) | | | — | | | | — | | | | — | |
Net realized gains | | | — | | | | (.67 | ) | | | — | | | | (2.11 | ) | | | — | |
Total distributions | | | — | | | | (.68 | ) | | | — | | | | (2.11 | ) | | | — | |
Net asset value, end of period | | $ | 54.24 | | | $ | 28.50 | | | $ | 39.09 | | | $ | 39.26 | | | $ | 37.87 | |
|
Total Returnb | | | 90.32 | % | | | (25.88 | %) | | | (0.43 | %) | | | 9.21 | % | | | 23.03 | % |
Ratios/Supplemental Data |
Net assets, end of period (in thousands) | | $ | 3,717 | | | $ | 1,590 | | | $ | 3,264 | | | $ | 5,277 | | | $ | 5,841 | |
Ratios to average net assets: |
Net investment income (loss) | | | (2.28 | %) | | | (0.74 | %) | | | (0.91 | %) | | | (1.16 | %) | | | (1.27 | %) |
Total expenses | | | 2.43 | % | | | 2.48 | % | | | 2.46 | % | | | 2.38 | % | | | 2.38 | % |
Portfolio turnover rate | | | — | | | | 35 | % | | | 112 | % | | | 167 | % | | | 203 | % |
108 | THE RYDEX FUNDS ANNUAL REPORT | SEE NOTES TO FINANCIAL STATEMENTS. |
FINANCIAL HIGHLIGHTS (concluded) |
This table is presented to show selected data for a share outstanding throughout each period and to assist shareholders in evaluating a Fund’s performance for the periods presented.
H-Class | | Year Ended
March 31,
2021 | | | Year Ended
March 31,
2020 | | | Year Ended
March 31,
2019 | | | Year Ended
March 29,
2018 | | | Year Ended
March 31,
2017 | |
Per Share Data |
Net asset value, beginning of period | | $ | 32.17 | | | $ | 43.70 | | | $ | 43.57 | | | $ | 41.51 | | | $ | 33.48 | |
Income (loss) from investment operations: |
Net investment income (loss)a | | | (.75 | ) | | | .01 | | | | (.06 | ) | | | (.19 | ) | | | (.21 | ) |
Net gain (loss) on investments (realized and unrealized) | | | 30.26 | | | | (10.86 | ) | | | .19 | d | | | 4.36 | | | | 8.24 | |
Total from investment operations | | | 29.51 | | | | (10.85 | ) | | | .13 | | | | 4.17 | | | | 8.03 | |
Less distributions from: |
Net investment income | | | — | | | | (.01 | ) | | | — | | | | — | | | | — | |
Net realized gains | | | — | | | | (.67 | ) | | | — | | | | (2.11 | ) | | | — | |
Total distributions | | | — | | | | (.68 | ) | | | — | | | | (2.11 | ) | | | — | |
Net asset value, end of period | | $ | 61.68 | | | $ | 32.17 | | | $ | 43.70 | | | $ | 43.57 | | | $ | 41.51 | |
|
Total Return | | | 91.73 | % | | | (25.30 | %) | | | 0.30 | % | | | 10.03 | % | | | 23.95 | % |
Ratios/Supplemental Data |
Net assets, end of period (in thousands) | | $ | 29,743 | | | $ | 6,731 | | | $ | 19,384 | | | $ | 24,713 | | | $ | 29,466 | |
Ratios to average net assets: |
Net investment income (loss) | | | (1.52 | %) | | | 0.01 | % | | | (0.14 | %) | | | (0.43 | %) | | | (0.54 | %) |
Total expenses | | | 1.67 | % | | | 1.73 | % | | | 1.71 | % | | | 1.63 | % | | | 1.63 | % |
Portfolio turnover rate | | | — | | | | 35 | % | | | 112 | % | | | 167 | % | | | 203 | % |
a | Net investment income (loss) per share was computed using average shares outstanding throughout the period. |
b | Total return does not reflect the impact of any applicable sales charges. |
c | Less than $0.01 per share. |
d | The amount shown for a share outstanding throughout the period does not agree with the aggregate net loss on investments for the year because of the sales and repurchases of fund shares in relation to fluctuating market value of the investments of the Fund. |
e | Less than 0.01%. |
SEE NOTES TO FINANCIAL STATEMENTS. | THE RYDEX FUNDS ANNUAL REPORT | 109 |
PERFORMANCE REPORT AND FUND PROFILE (Unaudited) | March 31, 2021 |
INVERSE RUSSELL 2000® STRATEGY FUND
OBJECTIVE: Seeks to provide investment results that match, before fees and expenses, the performance of a specific benchmark on a daily basis. The Fund’s current benchmark is the inverse (opposite) of the performance of the Russell 2000® Index (the “underlying index”). The Fund does not seek to achieve its investment objective over a period of time greater than one day.
For the one-year period ended March 31, 2021, Inverse Russell 2000® Strategy Fund maintained a daily correlation of over 99% to its benchmark of -100% of the daily price movement of the Russell 2000 Index.
Inverse Russell 2000® Strategy Fund H-Class returned -54.13%, while the Russell 2000 Index returned 94.85% over the same time period.
All sectors contributed to the return of the underlying index for the period, led by Health Care, Consumer Discretionary, and Industrials.
The holdings contributing the most to the return of the underlying index were Penn National Gaming, Inc., Plug Power, Inc., and MyoKardia, Inc. The holdings detracting the most were eHealth, Inc., Green Dot Corp. Class A, and Merit Medical Systems, Inc.
Derivatives in the Fund were used to help provide exposure to the composition of the benchmark in the highest efficient manner and to provide leverage and not for hedging purposes. Derivatives performed as expected.
Due to the compounding of daily returns, leveraged and inverse funds’ returns over periods other than one day will likely differ in amount and possibly direction from the benchmark return for the same period. Investors should monitor their leveraged and inverse funds’ holdings to ensure that they are consistent with their strategies, as frequently as daily.
The effects of compounding may cause the longer-term correlation of the Fund to its benchmark to diminish. The apparent discrepancy between the leveraged and unleveraged indices is the result of compounding, which is described briefly on page 6 of this report.
The Fund may invest in certain of the underlying series of Guggenheim Funds Trust and Guggenheim Strategy Funds Trust, including Guggenheim Ultra Short Duration, Guggenheim Strategy Fund II and Guggenheim Strategy Fund III (collectively, the “Short Term Investment Vehicles”), each of which are open-end management investment companies managed by Guggenheim Investments. The Short Term Investment Vehicles, which launched on March 11, 2014, are offered as short term investment options only to mutual funds, trusts, and other accounts managed by Guggenheim Investments and/or its affiliates, and are not available to the public, with the exception of Guggenheim Ultra Short Duration Fund, which is available to the public. Guggenheim Strategy Fund II and Guggenheim Strategy Fund III do not charge an investment management fee. Guggenheim Ultra Short Duration Fund charges an investment management fee but the Fund’s adviser has agreed to waive fees to the extent necessary to offset the proportionate share of any management fee paid by the Fund with respect to its investment in Guggenheim Ultra Short Duration Fund. For the one-year period ended March 31, 2021, investment in the Short Term Investment Vehicles benefited Fund performance.
Performance displayed represents past performance, which is no guarantee of future results.
“Holdings Diversification (Market Exposure as % of Net Assets)” excludes any temporary cash investments, investments in Guggenheim Strategy Funds Trust mutual funds, or investments in Guggenheim Ultra Short Duration Fund. Investments in those Funds do not provide “market exposure” to meet the Fund’s investment objective, but will significantly increase the portfolio’s exposure to certain other asset categories (and their associated risks), which may cause the Fund to deviate from its principal investment strategy, including: (i) high yield, high risk debt securities rated below the top four long-term rating categories by a nationally recognized statistical rating organization (also known as “junk bonds”); (ii) securities issued by the U.S. government or its agencies and instrumentalities; (iii) CLOs and similar investments; and (iv) other short-term fixed income securities.
Holdings Diversification (Market Exposure as % of Net Assets)
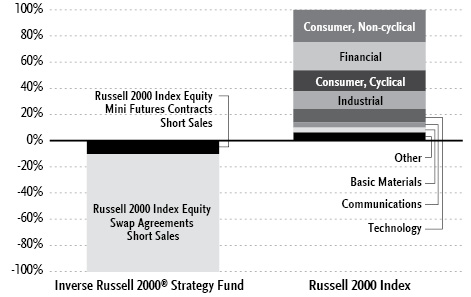
110 | THE RYDEX FUNDS ANNUAL REPORT | |
PERFORMANCE REPORT AND FUND PROFILE (Unaudited)(concluded) | March 31, 2021 |
Inception Dates: |
A-Class | March 31, 2004 |
C-Class | February 20, 2004 |
H-Class | February 20, 2004 |
The Fund invests principally in derivative investments such as swap agreements and futures contracts.
Largest Holdings (% of Total Net Assets) |
Guggenheim Strategy Fund II | 23.5% |
Guggenheim Ultra Short Duration Fund — Institutional Class | 23.4% |
Total | 46.9% |
| | |
“Largest Holdings” excludes any temporary cash or derivative investments. |
Cumulative Fund Performance*

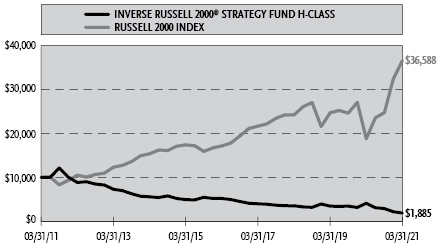
Average Annual Returns*
Periods Ended March 31, 2021
| 1 Year | 5 Year | 10 Year |
A-Class Shares | (54.13%) | (18.37%) | (15.39%) |
A-Class Shares with sales charge‡ | (56.30%) | (19.16%) | (15.81%) |
C-Class Shares | (54.49%) | (18.98%) | (16.02%) |
C-Class Shares with CDSC§ | (54.95%) | (18.98%) | (16.02%) |
H-Class Shares | (54.13%) | (18.34%) | (15.37%) |
Russell 2000 Index | 94.85% | 16.35% | 13.85% |
* | The performance data above represents past performance that is not predictive of future results. The investment return and principal value of an investment in the Fund will fluctuate so that an investor’s shares, when redeemed, may be worth more or less than their original cost. Returns are historical and include changes in principal and reinvested dividends and capital gains and do not reflect the effect of taxes. The Russell 2000 Index is an unmanaged index and, unlike the Fund, has no management fees or operating expenses to reduce its reported return. The graphs are based on A-Class shares and H-Class shares only; performance for C-Class shares will vary due to differences in fee structures. |
‡ | Fund returns are calculated using the maximum sales charge of 4.75%. |
§ | Fund returns include a CDSC of 1% if redeemed within 12 months of purchase. |
| | THE RYDEX FUNDS ANNUAL REPORT | 111 |
SCHEDULE OF INVESTMENTS | March 31, 2021 |
INVERSE RUSSELL 2000® STRATEGY FUND | |
| | Shares | | | Value | |
MUTUAL FUNDS† - 46.9% |
Guggenheim Strategy Fund II1 | | | 51,129 | | | $ | 1,277,205 | |
Guggenheim Ultra Short Duration Fund — Institutional Class1 | | | 127,491 | | | | 1,269,811 | |
Total Mutual Funds | | | | |
(Cost $2,512,853) | | | | | | | 2,547,016 | |
| | | | | | | | | |
| | | Face
Amount | | | | | |
U.S. TREASURY BILLS†† - 27.2% |
U.S. Treasury Bills |
0.01% due 04/20/212 | | $ | 900,000 | | | | 899,990 | |
0.09% due 04/01/212,3 | | | 200,000 | | | | 200,000 | |
0.01% due 04/22/212,4 | | | 177,000 | | | | 176,999 | |
U.S. Cash Management Bill | | | | | | | | |
0.03% due 08/03/212 | | | 200,000 | | | | 199,980 | |
Total U.S. Treasury Bills | | | | |
(Cost $1,476,975) | | | | | | | 1,476,969 | |
FEDERAL AGENCY NOTES†† - 2.2% |
Federal Farm Credit Bank |
0.44% (U.S. Prime Rate - 2.81%, Rate Floor: 0.00%) due 05/20/225 | | | 120,000 | | | | 120,483 | |
Total Federal Agency Notes | | | | |
(Cost $120,000) | | | | | | | 120,483 | |
| | | | | | | | | |
REPURCHASE AGREEMENTS††,6 - 18.8% |
J.P. Morgan Securities LLC
issued 03/31/21 at 0.01%
due 04/01/213 | | | 545,975 | | | | 545,975 | |
Barclays Capital, Inc.
issued 03/31/21 at 0.01%
due 04/01/213 | | | 248,227 | | | | 248,227 | |
BofA Securities, Inc.
issued 03/31/21 at 0.01%
due 04/01/213 | | | 226,545 | | | | 226,545 | |
Total Repurchase Agreements | | | | |
(Cost $1,020,747) | | | | | | | 1,020,747 | |
| | | | | | | | | |
Total Investments - 95.1% | | | | |
(Cost $5,130,575) | | $ | 5,165,215 | |
Other Assets & Liabilities, net - 4.9% | | | 268,439 | |
Total Net Assets - 100.0% | | $ | 5,433,654 | |
Futures Contracts |
Description | | Number of
Contracts | | | Expiration
Date | | | Notional
Amount | | | Value and
Unrealized
Appreciation** | |
Equity Futures Contracts Sold Short† |
Russell 2000 Index Mini Futures Contracts | | | 5 | | | | Jun 2021 | | | $ | 555,825 | | | $ | 31,475 | |
Total Return Swap Agreements |
Counterparty | Index | Financing Rate
Pay (Receive) | Payment
Frequency | | Maturity
Date | | | Units | | | Notional
Amount | | | Value and
Unrealized
Appreciation
(Depreciation) | |
OTC Equity Index Swap Agreements Sold Short†† |
Goldman Sachs International | Russell 2000 Index | (0.04)% (1 Week USD LIBOR - 0.05%) | At Maturity | | | 04/08/21 | | | | 1,182 | | | $ | 2,624,333 | | | $ | 108,634 | |
Barclays Bank plc | Russell 2000 Index | 0.41% (1 Week USD LIBOR - 0.50%) | At Maturity | | | 04/07/21 | | | | 438 | | | | 973,425 | | | | 14,181 | |
BNP Paribas | Russell 2000 Index | 0.29% (1 Month USD LIBOR - 0.40%) | At Maturity | | | 04/08/21 | | | | 583 | | | | 1,295,286 | | | | (11,559 | ) |
| | | | | | | | | | | | | | $ | 4,893,044 | | | $ | 111,256 | |
112 | THE RYDEX FUNDS ANNUAL REPORT | SEE NOTES TO FINANCIAL STATEMENTS. |
SCHEDULE OF INVESTMENTS (continued) | March 31, 2021 |
INVERSE RUSSELL 2000® STRATEGY FUND | |
** | Includes cumulative appreciation (depreciation). Variation margin is reported within the Statement of Assets and Liabilities. |
† | Value determined based on Level 1 inputs — See Note 4. |
†† | Value determined based on Level 2 inputs — See Note 4. |
1 | Affiliated issuer. |
2 | Rate indicated is the effective yield at the time of purchase. |
3 | All or a portion of this security is pledged as equity index swap collateral at March 31, 2021. |
4 | All or a portion of this security is pledged as futures collateral at March 31, 2021. |
5 | Variable rate security. Rate indicated is the rate effective at March 31, 2021. In some instances, the effective rate is limited by a minimum rate floor or a maximum rate cap established by the issuer. The settlement status of a position may also impact the effective rate indicated. In some cases, a position may be unsettled at period end and may not have a stated effective rate. In instances where multiple underlying reference rates and spread amounts are shown, the effective rate is based on a weighted average. |
6 | Repurchase Agreements — See Note 6. |
| | LIBOR — London Interbank Offered Rate |
| | plc — Public Limited Company |
| | |
| | See Sector Classification in Other Information section. |
The following table summarizes the inputs used to value the Fund’s investments at March 31, 2021 (See Note 4 in the Notes to Financial Statements):
Investments in Securities (Assets) | | Level 1
Quoted
Prices | | | Level 2
Significant
Observable
Inputs | | | Level 3
Significant
Unobservable
Inputs | | | Total | |
Mutual Funds | | $ | 2,547,016 | | | $ | — | | | $ | — | | | $ | 2,547,016 | |
U.S. Treasury Bills | | | — | | | | 1,476,969 | | | | — | | | | 1,476,969 | |
Federal Agency Notes | | | — | | | | 120,483 | | | | — | | | | 120,483 | |
Repurchase Agreements | | | — | | | | 1,020,747 | | | | — | | | | 1,020,747 | |
Equity Futures Contracts** | | | 31,475 | | | | — | | | | — | | | | 31,475 | |
Equity Index Swap Agreements** | | | — | | | | 122,815 | | | | — | | | | 122,815 | |
Total Assets | | $ | 2,578,491 | | | $ | 2,741,014 | | | $ | — | | | $ | 5,319,505 | |
Investments in Securities (Liabilities) | | Level 1
Quoted
Prices | | | Level 2
Significant
Observable
Inputs | | | Level 3
Significant
Unobservable
Inputs | | | Total | |
Equity Index Swap Agreements** | | $ | — | | | $ | 11,559 | | | $ | — | | | $ | 11,559 | |
** | This derivative is reported as unrealized appreciation/depreciation at period end. |
SEE NOTES TO FINANCIAL STATEMENTS. | THE RYDEX FUNDS ANNUAL REPORT | 113 |
SCHEDULE OF INVESTMENTS (concluded) | March 31, 2021 |
INVERSE RUSSELL 2000® STRATEGY FUND | |
Affiliated Transactions
Investments representing 5% or more of the outstanding voting shares of a company, or control of or by, or common control under Guggenheim Investments (“GI”), result in that company being considered an affiliated issuer, as defined in the 1940 Act.
The Fund may invest in certain of the underlying series of Guggenheim Strategy Funds Trust, including Guggenheim Strategy Fund II and Guggenheim Strategy Fund III, (collectively, the “Short Term Investment Vehicles”), each of which are open-end management investment companies managed by GI. The Short Term Investment Vehicles, which launched on March 11, 2014, are offered as short term investment options only to mutual funds, trusts, and other accounts managed by GI and/or its affiliates, and are not available to the public. The Short Term Investment Vehicles pay no investment management fees. The Short Term Investment Vehicles’ annual report on Form N-CSR dated September 30, 2020, is available publicly or upon request. This information is available from the EDGAR database on the SEC’s website at https://www.sec.gov/Archives/edgar/data/1601445/000182126820000133/gug81042-ncsr.htm.
Transactions during the year ended March 31, 2021, in which the company is an affiliated issuer, were as follows:
Security Name | | Value
03/31/20 | | | Additions | | | Reductions | | | Realized
Gain (Loss) | | | Change in
Unrealized
Appreciation
(Depreciation) | | | Value
03/31/21 | | | Shares
03/31/21 | | | Investment
Income | |
Mutual Funds | | | | | | | | | | | | | | | | | | | | | | | | | | | | | | | | |
Guggenheim Strategy Fund II | | $ | 826,823 | | | $ | 600,000 | | | $ | (200,000 | ) | | $ | 1,320 | | | $ | 49,062 | | | $ | 1,277,205 | | | | 51,129 | | | $ | 24,640 | |
Guggenheim Ultra Short Duration Fund — Institutional Class | | | 1,068,939 | | | | 375,000 | | | | (200,000 | ) | | | 200 | | | | 25,672 | | | | 1,269,811 | | | | 127,491 | | | | 16,613 | |
| | | $ | 1,895,762 | | | $ | 975,000 | | | $ | (400,000 | ) | | $ | 1,520 | | | $ | 74,734 | | | $ | 2,547,016 | | | | | | | $ | 41,253 | |
114 | THE RYDEX FUNDS ANNUAL REPORT | SEE NOTES TO FINANCIAL STATEMENTS. |
INVERSE RUSSELL 2000® STRATEGY FUND | |
STATEMENT OF ASSETS AND LIABILITIES |
March 31, 2021 |
Assets: |
Investments in unaffiliated issuers, at value (cost $1,596,975) | | $ | 1,597,452 | |
Investments in affiliated issuers, at value (cost $2,512,853) | | | 2,547,016 | |
Repurchase agreements, at value (cost $1,020,747) | | | 1,020,747 | |
Unrealized appreciation on OTC swap agreements | | | 122,815 | |
Receivables: |
Swap settlement | | | 210,035 | |
Fund shares sold | | | 198,314 | |
Dividends | | | 2,892 | |
Interest | | | 59 | |
Total assets | | | 5,699,330 | |
| | | | | |
Liabilities: |
Unrealized depreciation on OTC swap agreements | | | 11,559 | |
Payable for: |
Securities purchased | | | 199,980 | |
Fund shares redeemed | | | 14,716 | |
Management fees | | | 8,902 | |
Variation margin on futures contracts | | | 7,725 | |
Transfer agent and administrative fees | | | 2,752 | |
Distribution and service fees | | | 2,575 | |
Portfolio accounting fees | | | 1,023 | |
Trustees’ fees* | | | 210 | |
Miscellaneous | | | 16,234 | |
Total liabilities | | | 265,676 | |
Commitments and contingent liabilities (Note 12) | | | — | |
Net assets | | $ | 5,433,654 | |
| | | | | |
Net assets consist of: |
Paid in capital | | $ | 46,512,226 | |
Total distributable earnings (loss) | | | (41,078,572 | ) |
Net assets | | $ | 5,433,654 | |
| | | | | |
A-Class: |
Net assets | | $ | 319,922 | |
Capital shares outstanding | | | 5,787 | |
Net asset value per share | | $ | 55.28 | |
Maximum offering price per share (Net asset value divided by 95.25%) | | $ | 58.04 | |
| | | | | |
C-Class: |
Net assets | | $ | 26,339 | |
Capital shares outstanding | | | 543 | |
Net asset value per share | | $ | 48.51 | |
| | | | | |
H-Class: |
Net assets | | $ | 5,087,393 | |
Capital shares outstanding | | | 91,653 | |
Net asset value per share | | $ | 55.51 | |
STATEMENT OF OPERATIONS |
Year Ended March 31, 2021 |
Investment Income: |
Dividends from securities of affiliated issuers | | $ | 41,253 | |
Interest | | | 17,585 | |
Total investment income | | | 58,838 | |
| | | | | |
Expenses: |
Management fees | | | 143,828 | |
Distribution and service fees: |
A-Class | | | 1,108 | |
C-Class | | | 615 | |
H-Class | | | 38,691 | |
Transfer agent and administrative fees | | | 45,404 | |
Registration fees | | | 22,960 | |
Portfolio accounting fees | | | 15,984 | |
Professional fees | | | 12,256 | |
Trustees’ fees* | | | 4,408 | |
Custodian fees | | | 2,429 | |
Miscellaneous | | | 2,409 | |
Total expenses | | | 290,092 | |
Less: |
Expenses waived by Adviser | | | (3,610 | ) |
Net expenses | | | 286,482 | |
Net investment loss | | | (227,644 | ) |
| | | | | |
Net Realized and Unrealized Gain (Loss): |
Net realized gain (loss) on: |
Investments in unaffiliated issuers | | | 1,732 | |
Investments in affiliated issuers | | | 1,520 | |
Swap agreements | | | (11,789,560 | ) |
Futures contracts | | | (1,451,853 | ) |
Net realized loss | | | (13,238,161 | ) |
Net change in unrealized appreciation (depreciation) on: |
Investments in unaffiliated issuers | | | (7,083 | ) |
Investments in affiliated issuers | | | 74,734 | |
Swap agreements | | | (333,033 | ) |
Futures contracts | | | 31,475 | |
Net change in unrealized appreciation (depreciation) | | | (233,907 | ) |
Net realized and unrealized loss | | | (13,472,068 | ) |
Net decrease in net assets resulting from operations | | $ | (13,699,712 | ) |
* | Relates to Trustees not deemed “interested persons” within the meaning of Section 2(a)(19) of the 1940 Act. |
SEE NOTES TO FINANCIAL STATEMENTS. | THE RYDEX FUNDS ANNUAL REPORT | 115 |
INVERSE RUSSELL 2000® STRATEGY FUND | |
STATEMENTS OF CHANGES IN NET ASSETS |
| | Year Ended
March 31,
2021 | | | Year Ended
March 31,
2020 | |
Increase (Decrease) in Net Assets from Operations: | | | | | | | | |
Net investment income (loss) | | $ | (227,644 | ) | | $ | 6,140 | |
Net realized loss on investments | | | (13,238,161 | ) | | | (1,841,497 | ) |
Net change in unrealized appreciation (depreciation) on investments | | | (233,907 | ) | | | 532,960 | |
Net decrease in net assets resulting from operations | | | (13,699,712 | ) | | | (1,302,397 | ) |
| | | | | | | | | |
Distributions to shareholders: | | | | | | | | |
A-Class | | | (286 | ) | | | (1,975 | ) |
C-Class | | | (39 | ) | | | (2,914 | ) |
H-Class | | | (5,815 | ) | | | (47,851 | ) |
Total distributions to shareholders | | | (6,140 | ) | | | (52,740 | ) |
| | | | | | | | | |
Capital share transactions: | | | | | | | | |
Proceeds from sale of shares | | | | | | | | |
A-Class | | | 1,016,352 | | | | 504,699 | |
C-Class | | | 69,459 | | | | 42,769 | |
H-Class | | | 86,070,796 | | | | 83,248,259 | |
Distributions reinvested | | | | | | | | |
A-Class | | | 286 | | | | 1,705 | |
C-Class | | | 39 | | | | 2,557 | |
H-Class | | | 5,776 | | | | 47,493 | |
Cost of shares redeemed | | | | | | | | |
A-Class | | | (566,925 | ) | | | (1,102,154 | ) |
C-Class | | | (85,226 | ) | | | (512,240 | ) |
H-Class | | | (90,085,151 | ) | | | (68,762,044 | ) |
Net increase (decrease) from capital share transactions | | | (3,574,594 | ) | | | 13,471,044 | |
Net increase (decrease) in net assets | | | (17,280,446 | ) | | | 12,115,907 | |
| | | | | | | | | |
Net assets: | | | | | | | | |
Beginning of year | | | 22,714,100 | | | | 10,598,193 | |
End of year | | $ | 5,433,654 | | | $ | 22,714,100 | |
| | | | | | | | | |
Capital share activity:* | | | | | | | | |
Shares sold | | | | | | | | |
A-Class | | | 10,628 | | | | 4,925 | |
C-Class | | | 895 | | | | 408 | |
H-Class | | | 1,035,477 | | | | 755,791 | |
Shares issued from reinvestment of distributions | | | | | | | | |
A-Class | | | 4 | | | | 18 | |
C-Class | | | 1 | | | | 31 | |
H-Class | | | 87 | | | | 500 | |
Shares redeemed | | | | | | | | |
A-Class | | | (6,557 | ) | | | (10,540 | ) |
C-Class | | | (1,230 | ) | | | (4,610 | ) |
H-Class | | | (1,129,019 | ) | | | (662,873 | ) |
Net increase (decrease) in shares | | | (89,714 | ) | | | 83,650 | |
* | Capital share activity for the year ended March 31, 2020, has been restated to reflect a 1:5 reverse share split effective August 17, 2020 — See Note 11. |
116 | THE RYDEX FUNDS ANNUAL REPORT | SEE NOTES TO FINANCIAL STATEMENTS. |
INVERSE RUSSELL 2000® STRATEGY FUND | |
This table is presented to show selected data for a share outstanding throughout each period and to assist shareholders in evaluating a Fund’s performance for the periods presented.
A-Class | | Year Ended
March 31,
2021 | | | Year Ended
March 31,
2020e | | | Year Ended
March 31,
2019e | | | Year Ended
March 29,
2018e | | | Year Ended
March 31,
2017e | |
Per Share Data |
Net asset value, beginning of period | | $ | 120.61 | | | $ | 102.08 | | | $ | 104.50 | | | $ | 118.12 | | | $ | 153.78 | |
Income (loss) from investment operations: |
Net investment income (loss)a | | | (.45 | ) | | | .50 | | | | .70 | | | | (.90 | ) | | | (1.55 | ) |
Net gain (loss) on investments (realized and unrealized) | | | (64.83 | ) | | | 18.73 | f | | | (3.12 | ) | | | (12.72 | ) | | | (34.11 | ) |
Total from investment operations | | | (65.28 | ) | | | 19.23 | | | | (2.42 | ) | | | (13.62 | ) | | | (35.66 | ) |
Less distributions from: |
Net investment income | | | (.05 | ) | | | (.70 | ) | | | — | | | | — | | | | — | |
Total distributions | | | (.05 | ) | | | (.70 | ) | | | — | | | | — | | | | — | |
Net asset value, end of period | | $ | 55.28 | | | $ | 120.61 | | | $ | 102.08 | | | $ | 104.50 | | | $ | 118.12 | |
|
Total Returnb | | | (54.13 | %) | | | 19.00 | % | | | (2.30 | %) | | | (11.52 | %) | | | (23.21 | %) |
Ratios/Supplemental Data |
Net assets, end of period (in thousands) | | $ | 320 | | | $ | 207 | | | $ | 746 | | | $ | 262 | | | $ | 8,645 | |
Ratios to average net assets: |
Net investment income (loss) | | | (1.38 | %) | | | 0.51 | % | | | 0.65 | % | | | (0.76 | %) | | | (1.11 | %) |
Total expensesc | | | 1.80 | % | | | 1.82 | % | | | 1.83 | % | | | 1.74 | % | | | 1.71 | % |
Net expensesd | | | 1.78 | % | | | 1.78 | % | | | 1.81 | % | | | 1.74 | % | | | 1.71 | % |
Portfolio turnover rate | | | 14 | % | | | 7 | % | | | 40 | % | | | — | | | | 58 | % |
C-Class | | Year Ended
March 31,
2021 | | | Year Ended
March 31,
2020e | | | Year Ended
March 31,
2019e | | | Year Ended
March 29,
2018e | | | Year Ended
March 31,
2017e | |
Per Share Data |
Net asset value, beginning of period | | $ | 106.73 | | | $ | 91.07 | | | $ | 93.97 | | | $ | 107.05 | | | $ | 140.35 | |
Income (loss) from investment operations: |
Net investment income (loss)a | | | (.61 | ) | | | (.30 | ) | | | (.25 | ) | | | (1.25 | ) | | | (2.25 | ) |
Net gain (loss) on investments (realized and unrealized) | | | (57.56 | ) | | | 16.66 | f | | | (2.65 | ) | | | (11.83 | ) | | | (31.05 | ) |
Total from investment operations | | | (58.17 | ) | | | 16.36 | | | | (2.90 | ) | | | (13.08 | ) | | | (33.30 | ) |
Less distributions from: |
Net investment income | | | (.05 | ) | | | (.70 | ) | | | — | | | | — | | | | — | |
Total distributions | | | (.05 | ) | | | (.70 | ) | | | — | | | | — | | | | — | |
Net asset value, end of period | | $ | 48.51 | | | $ | 106.73 | | | $ | 91.07 | | | $ | 93.97 | | | $ | 107.05 | |
|
Total Returnb | | | (54.49 | %) | | | 18.22 | % | | | (3.09 | %) | | | (12.24 | %) | | | (23.73 | %) |
Ratios/Supplemental Data |
Net assets, end of period (in thousands) | | $ | 26 | | | $ | 94 | | | $ | 460 | | | $ | 607 | | | $ | 1,028 | |
Ratios to average net assets: |
Net investment income (loss) | | | (2.15 | %) | | | (0.34 | %) | | | (0.26 | %) | | | (1.22 | %) | | | 1.83 | % |
Total expensesc | | | 2.57 | % | | | 2.57 | % | | | 2.56 | % | | | 2.48 | % | | | 2.47 | % |
Net expensesd | | | 2.54 | % | | | 2.53 | % | | | 2.55 | % | | | 2.48 | % | | | 2.47 | % |
Portfolio turnover rate | | | 14 | % | | | 7 | % | | | 40 | % | | | — | | | | 58 | % |
SEE NOTES TO FINANCIAL STATEMENTS. | THE RYDEX FUNDS ANNUAL REPORT | 117 |
INVERSE RUSSELL 2000® STRATEGY FUND | |
FINANCIAL HIGHLIGHTS (concluded) |
This table is presented to show selected data for a share outstanding throughout each period and to assist shareholders in evaluating a Fund’s performance for the periods presented.
H-Class | | Year Ended
March 31,
2021 | | | Year Ended
March 31,
2020e | | | Year Ended
March 31,
2019e | | | Year Ended
March 29,
2018e | | | Year Ended
March 31,
2017e | |
Per Share Data |
Net asset value, beginning of period | | $ | 121.09 | | | $ | 102.43 | | | $ | 104.78 | | | $ | 118.47 | | | $ | 154.15 | |
Income (loss) from investment operations: |
Net investment income (loss)a | | | (.44 | ) | | | .10 | | | | .55 | | | | (.45 | ) | | | (1.60 | ) |
Net gain (loss) on investments (realized and unrealized) | | | (65.09 | ) | | | 19.26 | f | | | (2.90 | ) | | | (13.24 | ) | | | (34.08 | ) |
Total from investment operations | | | (65.53 | ) | | | 19.36 | | | | (2.35 | ) | | | (13.69 | ) | | | (35.68 | ) |
Less distributions from: |
Net investment income | | | (.05 | ) | | | (.70 | ) | | | — | | | | — | | | | — | |
Total distributions | | | (.05 | ) | | | (.70 | ) | | | — | | | | — | | | | — | |
Net asset value, end of period | | $ | 55.51 | | | $ | 121.09 | | | $ | 102.43 | | | $ | 104.78 | | | $ | 118.47 | |
|
Total Return | | | (54.13 | %) | | | 19.08 | % | | | (2.24 | %) | | | (11.52 | %) | | | (23.16 | %) |
Ratios/Supplemental Data |
Net assets, end of period (in thousands) | | $ | 5,087 | | | $ | 22,414 | | | $ | 9,392 | | | $ | 3,543 | | | $ | 5,777 | |
Ratios to average net assets: |
Net investment income (loss) | | | (1.42 | %) | | | 0.07 | % | | | 0.53 | % | | | (0.39 | %) | | | (1.14 | %) |
Total expensesc | | | 1.81 | % | | | 1.82 | % | | | 1.82 | % | | | 1.72 | % | | | 1.72 | % |
Net expensesd | | | 1.79 | % | | | 1.79 | % | | | 1.81 | % | | | 1.72 | % | | | 1.72 | % |
Portfolio turnover rate | | | 14 | % | | | 7 | % | | | 40 | % | | | — | | | | 58 | % |
a | Net investment income (loss) per share was computed using average shares outstanding throughout the period. |
b | Total return does not reflect the impact of any applicable sales charges. |
c | Does not include expenses of the underlying funds in which the Fund invests. |
d | Net expense information reflects the expense ratios after expense waivers and reimbursements, as applicable. |
e | Reverse share split — Per share amounts for the periods presented through March 31, 2020 have been restated to reflect a 1:5 reverse share split effective August 17, 2020 — See Note 11. |
f | The amount shown for a share outstanding throughout the period does not agree with the aggregate net loss on investments for the year because of the sales and repurchases of fund shares in relation to fluctuating market value of the investments of the Fund. |
118 | THE RYDEX FUNDS ANNUAL REPORT | SEE NOTES TO FINANCIAL STATEMENTS. |
PERFORMANCE REPORT AND FUND PROFILE (Unaudited) | March 31, 2021 |
DOW JONES INDUSTRIAL AVERAGE® FUND
OBJECTIVE: Seeks to provide investment results that match, before fees and expenses, the performance of a specific benchmark on a daily basis. The Fund’s current benchmark is the Dow Jones Industrials Average® (the “underlying index”).
For the one-year period ended March 31, 2021, Dow Jones Industrial Average® Fund maintained a daily correlation of over 99% to its benchmark of 100% of the daily price movement of the Dow Jones Industrial Average Index.
Dow Jones Industrial Average® Fund H-Class returned 51.64%, while the Dow Jones Industrial Average Index returned 53.78% over the same time period.
All sectors contributed to the return of the underlying index for the period, led by Financials, Information Technology, and Industrials.
The holdings contributing the most to the return of the underlying index were Boeing Co., Goldman Sachs Group, Inc., and Apple, Inc. The holdings detracting the most were Merck & Co., Inc., Verizon Communications, Inc., and Coca-Cola Co.
Derivatives in the Fund were used to help provide exposure to the composition of the benchmark in the most efficient manner possible and not for hedging purposes. Derivatives performed as expected.
The Fund may invest in certain of the underlying series of Guggenheim Funds Trust and Guggenheim Strategy Funds Trust, including Guggenheim Ultra Short Duration, Guggenheim Strategy Fund II and Guggenheim Strategy Fund III (collectively, the “Short Term Investment Vehicles”), each of which are open-end management investment companies managed by Guggenheim Investments. The Short Term Investment Vehicles, which launched on March 11, 2014, are offered as short term investment options only to mutual funds, trusts, and other accounts managed by Guggenheim Investments and/or its affiliates, and are not available to the public, with the exception of Guggenheim Ultra Short Duration Fund, which is available to the public. Guggenheim Strategy Fund II and Guggenheim Strategy Fund III do not charge an investment management fee. Guggenheim Ultra Short Duration Fund charges an investment management fee but the Fund’s adviser has agreed to waive fees to the extent necessary to offset the proportionate share of any management fee paid by the Fund with respect to its investment in Guggenheim Ultra Short Duration Fund. For the one-year period ended March 31, 2021, investment in the Short Term Investment Vehicles benefited Fund performance.
Performance displayed represents past performance, which is no guarantee of future results.
“Holdings Diversification (Market Exposure as % of Net Assets)” excludes any temporary cash investments, investments in Guggenheim Strategy Funds Trust mutual funds, or investments in Guggenheim Ultra Short Duration Fund. Investments in those Funds do not provide “market exposure” to meet the Fund’s investment objective, but will significantly increase the portfolio’s exposure to certain other asset categories (and their associated risks), which may cause the Fund to deviate from its principal investment strategy, including: (i) high yield, high risk debt securities rated below the top four long-term rating categories by a nationally recognized statistical rating organization (also known as “junk bonds”); (ii) securities issued by the U.S. government or its agencies and instrumentalities; (iii) CLOs and similar investments; and (iv) other short-term fixed income securities.
Holdings Diversification (Market Exposure as % of Net Assets)
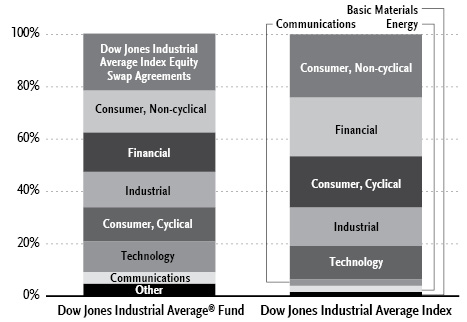
| | THE RYDEX FUNDS ANNUAL REPORT | 119 |
PERFORMANCE REPORT AND FUND PROFILE (Unaudited)(concluded) | March 31, 2021 |
Inception Dates: |
A-Class | December 1, 2015 |
C-Class | December 1, 2015 |
H-Class | December 1, 2015 |
Ten Largest Holdings (% of Total Net Assets) |
Guggenheim Strategy Fund II | 7.9% |
UnitedHealth Group, Inc. | 5.7% |
Goldman Sachs Group, Inc. | 5.0% |
Home Depot, Inc. | 4.6% |
Boeing Co. | 3.9% |
Amgen, Inc. | 3.8% |
Microsoft Corp. | 3.6% |
Caterpillar, Inc. | 3.5% |
McDonald’s Corp. | 3.4% |
Honeywell International, Inc. | 3.3% |
Top Ten Total | 44.7% |
| | |
“Ten Largest Holdings” excludes any temporary cash or derivative investments. |
Cumulative Fund Performance*

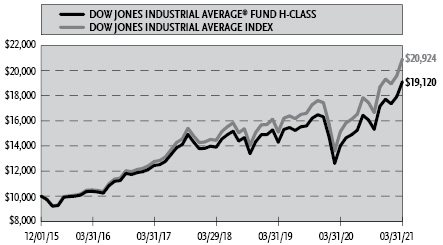
Average Annual Returns*
Periods Ended March 31, 2021
| 1 Year | 5 Year | Since
Inception
(12/01/15) |
A-Class Shares | 51.61% | 14.01% | 12.91% |
A-Class Shares with sales charge‡ | 44.41% | 12.91% | 11.89% |
C-Class Shares | 50.52% | 13.16% | 12.07% |
C-Class Shares with CDSC§ | 49.52% | 13.16% | 12.07% |
H-Class Shares | 51.64% | 14.03% | 12.93% |
Dow Jones Industrial Average Index | 53.78% | 15.99% | 14.85% |
* | The performance data above represents past performance that is not predictive of future results. The investment return and principal value of an investment in the Fund will fluctuate so that an investor’s shares, when redeemed, may be worth more or less than their original cost. Returns are historical and include changes in principal and reinvested dividends and capital gains and do not reflect the effect of taxes. The Dow Jones Industrial Average Index is an unmanaged index and, unlike the Fund, has no management fees or operating expenses to reduce its reported return. The graphs are based on A-Class shares and H-Class shares only; performance for C-Class shares will vary due to differences in fee structures. |
‡ | Fund returns are calculated using the maximum sales charge of 4.75%. |
§ | Fund returns include a CDSC of 1% if redeemed within 12 months of purchase. |
120 | THE RYDEX FUNDS ANNUAL REPORT | |
SCHEDULE OF INVESTMENTS | March 31, 2021 |
DOW JONES INDUSTRIAL AVERAGE® FUND | |
| | Shares | | | Value | |
COMMON STOCKS† - 76.3% |
| | | | | | | | | |
Consumer, Non-cyclical - 16.0% |
UnitedHealth Group, Inc. | | | 3,545 | | | $ | 1,318,988 | |
Amgen, Inc. | | | 3,545 | | | | 882,032 | |
Johnson & Johnson | | | 3,545 | | | | 582,621 | |
Procter & Gamble Co. | | | 3,545 | | | | 480,099 | |
Merck & Company, Inc. | | | 3,545 | | | | 273,284 | |
Coca-Cola Co. | | | 3,545 | | | | 186,857 | |
Total Consumer, Non-cyclical | | | | | | | 3,723,881 | |
| | | | | | | | | |
Financial - 14.9% |
Goldman Sachs Group, Inc. | | | 3,545 | | | | 1,159,215 | |
Visa, Inc. — Class A | | | 3,545 | | | | 750,583 | |
JPMorgan Chase & Co. | | | 3,545 | | | | 539,655 | |
Travelers Companies, Inc. | | | 3,545 | | | | 533,168 | |
American Express Co. | | | 3,545 | | | | 501,405 | |
Total Financial | | | | | | | 3,484,026 | |
| | | | | | | | | |
Industrial - 13.6% |
Boeing Co.* | | | 3,545 | | | | 902,982 | |
Caterpillar, Inc. | | | 3,545 | | | | 821,979 | |
Honeywell International, Inc. | | | 3,545 | | | | 769,513 | |
3M Co. | | | 3,545 | | | | 683,051 | |
Total Industrial | | | | | | | 3,177,525 | |
| | | | | | | | | |
Consumer, Cyclical - 13.0% |
Home Depot, Inc. | | | 3,545 | | | | 1,082,111 | |
McDonald’s Corp. | | | 3,545 | | | | 794,576 | |
Walmart, Inc. | | | 3,545 | | | | 481,518 | |
NIKE, Inc. — Class B | | | 3,545 | | | | 471,095 | |
Walgreens Boots Alliance, Inc. | | | 3,545 | | | | 194,621 | |
Total Consumer, Cyclical | | | | | | | 3,023,921 | |
| | | | | | | | | |
Technology - 11.7% |
Microsoft Corp. | | | 3,545 | | | | 835,805 | |
salesforce.com, Inc.* | | | 3,545 | | | | 751,079 | |
International Business Machines Corp. | | | 3,545 | | | | 472,406 | |
Apple, Inc. | | | 3,545 | | | | 433,022 | |
Intel Corp. | | | 3,545 | | | | 226,880 | |
Total Technology | | | | | | | 2,719,192 | |
| | | | | | | | | |
Communications - 4.5% |
Walt Disney Co.* | | | 3,545 | | | | 654,123 | |
Verizon Communications, Inc. | | | 3,545 | | | | 206,142 | |
Cisco Systems, Inc. | | | 3,545 | | | | 183,312 | |
Total Communications | | | | | | | 1,043,577 | |
| | | | | | | | | |
Energy - 1.6% |
Chevron Corp. | | | 3,545 | | | | 371,481 | |
| | | | | | | | | |
Basic Materials - 1.0% |
Dow, Inc. | | | 3,545 | | | | 226,667 | |
| | | | | | | | | |
Total Common Stocks | | | | |
(Cost $12,526,161) | | | | | | | 17,770,270 | |
| | | | | | | | | |
MUTUAL FUNDS† - 10.5% |
Guggenheim Strategy Fund II1 | | | 73,498 | | | | 1,835,969 | |
Guggenheim Ultra Short Duration Fund — Institutional Class1 | | | 62,558 | | | | 623,081 | |
Total Mutual Funds | | | | |
(Cost $2,442,626) | | | | | | | 2,459,050 | |
| | | | | | | | | |
| | | Face
Amount | | | | | |
U.S. TREASURY BILLS†† - 1.8% |
U.S. Treasury Bills |
0.09% due 04/01/212,3 | | $ | 200,000 | | | | 200,000 | |
0.01% due 04/22/213,4 | | | 10,000 | | | | 10,000 | |
U.S. Cash Management Bill | | | | | | | | |
0.03% due 08/03/213 | | | 200,000 | | | | 199,980 | |
Total U.S. Treasury Bills | | | | |
(Cost $409,980) | | | | | | | 409,980 | |
| | | | | | | | | |
REPURCHASE AGREEMENTS††,5 - 11.0% |
J.P. Morgan Securities LLC
issued 03/31/21 at 0.01%
due 04/01/212 | | | 1,367,738 | | | | 1,367,738 | |
Barclays Capital, Inc.
issued 03/31/21 at 0.01%
due 04/01/212 | | | 621,840 | | | | 621,840 | |
BofA Securities, Inc.
issued 03/31/21 at 0.01%
due 04/01/212 | | | 567,526 | | | | 567,526 | |
Total Repurchase Agreements | | | | |
(Cost $2,557,104) | | | | | | | 2,557,104 | |
| | | | | | | | | |
Total Investments - 99.6% | | | | |
(Cost $17,935,871) | | $ | 23,196,404 | |
Other Assets & Liabilities, net - 0.4% | | | 97,226 | |
Total Net Assets - 100.0% | | $ | 23,293,630 | |
Futures Contracts |
Description | | Number of
Contracts | | | Expiration
Date | | | Notional
Amount | | | Value and
Unrealized
Appreciation** | |
Equity Futures Contracts Purchased† |
Dow Jones Industrial Average Index Mini Futures Contracts | | | 3 | | | | Jun 2021 | | | $ | 493,575 | | | $ | 1,836 | |
SEE NOTES TO FINANCIAL STATEMENTS. | THE RYDEX FUNDS ANNUAL REPORT | 121 |
SCHEDULE OF INVESTMENTS (continued) | March 31, 2021 |
DOW JONES INDUSTRIAL AVERAGE® FUND | |
Total Return Swap Agreements |
Counterparty | Index | Financing
Rate Pay | Payment
Frequency | | Maturity
Date | | | Units | | | Notional
Amount | | | Value and
Unrealized
Appreciation | |
OTC Equity Index Swap Agreements†† |
BNP Paribas | Dow Jones Industrial Average Index | 0.61% (1 Month USD LIBOR + 0.50%) | At Maturity | | | 04/08/21 | | | | 91 | | | $ | 2,987,710 | | | $ | 102,222 | |
Barclays Bank plc | Dow Jones Industrial Average Index | 0.59% (1 Week USD LIBOR + 0.50%) | At Maturity | | | 04/07/21 | | | | 63 | | | | 2,082,336 | | | | 52,246 | |
| | | | | | | | | | | | | | $ | 5,070,046 | | | $ | 154,468 | |
* | Non-income producing security. |
** | Includes cumulative appreciation (depreciation). Variation margin is reported within the Statement of Assets and Liabilities. |
† | Value determined based on Level 1 inputs — See Note 4. |
†† | Value determined based on Level 2 inputs — See Note 4. |
1 | Affiliated issuer. |
2 | All or a portion of this security is pledged as equity index swap collateral at March 31, 2021. |
3 | Rate indicated is the effective yield at the time of purchase. |
4 | All or a portion of this security is pledged as futures collateral at March 31, 2021. |
5 | Repurchase Agreements — See Note 6. |
| | LIBOR — London Interbank Offered Rate |
| | plc — Public Limited Company |
| | |
| | See Sector Classification in Other Information section. |
The following table summarizes the inputs used to value the Fund’s investments at March 31, 2021 (See Note 4 in the Notes to Financial Statements):
Investments in Securities (Assets) | | Level 1
Quoted
Prices | | | Level 2
Significant
Observable
Inputs | | | Level 3
Significant
Unobservable
Inputs | | | Total | |
Common Stocks | | $ | 17,770,270 | | | $ | — | | | $ | — | | | $ | 17,770,270 | |
Mutual Funds | | | 2,459,050 | | | | — | | | | — | | | | 2,459,050 | |
U.S. Treasury Bills | | | — | | | | 409,980 | | | | — | | | | 409,980 | |
Repurchase Agreements | | | — | | | | 2,557,104 | | | | — | | | | 2,557,104 | |
Equity Futures Contracts** | | | 1,836 | | | | — | | | | — | | | | 1,836 | |
Equity Index Swap Agreements** | | | — | | | | 154,468 | | | | — | | | | 154,468 | |
Total Assets | | $ | 20,231,156 | | | $ | 3,121,552 | | | $ | — | | | $ | 23,352,708 | |
** | This derivative is reported as unrealized appreciation/depreciation at period end. |
122 | THE RYDEX FUNDS ANNUAL REPORT | SEE NOTES TO FINANCIAL STATEMENTS. |
SCHEDULE OF INVESTMENTS (concluded) | March 31, 2021 |
DOW JONES INDUSTRIAL AVERAGE® FUND | |
Affiliated Transactions
Investments representing 5% or more of the outstanding voting shares of a company, or control of or by, or common control under Guggenheim Investments (“GI”), result in that company being considered an affiliated issuer, as defined in the 1940 Act.
The Fund may invest in certain of the underlying series of Guggenheim Strategy Funds Trust, including Guggenheim Strategy Fund II and Guggenheim Strategy Fund III, (collectively, the “Short Term Investment Vehicles”), each of which are open-end management investment companies managed by GI. The Short Term Investment Vehicles, which launched on March 11, 2014, are offered as short term investment options only to mutual funds, trusts, and other accounts managed by GI and/or its affiliates, and are not available to the public. The Short Term Investment Vehicles pay no investment management fees. The Short Term Investment Vehicles’ annual report on Form N-CSR dated September 30, 2020, is available publicly or upon request. This information is available from the EDGAR database on the SEC’s website at https://www.sec.gov/Archives/edgar/data/1601445/000182126820000133/gug81042-ncsr.htm.
Transactions during the year ended March 31, 2021, in which the company is an affiliated issuer, were as follows:
Security Name | | Value
03/31/20 | | | Additions | | | Reductions | | | Realized
Gain (Loss) | | | Change in
Unrealized
Appreciation
(Depreciation) | | | Value
03/31/21 | | | Shares
03/31/21 | | | Investment
Income | |
Mutual Funds | | | | | | | | | | | | | | | | | | | | | | | | | | | | | | | | |
Guggenheim Strategy Fund II | | $ | 1,767,616 | | | $ | — | | | $ | — | | | $ | — | | | $ | 68,353 | | | $ | 1,835,969 | | | | 73,498 | | | $ | 31,174 | |
Guggenheim Ultra Short Duration Fund — Institutional Class | | | 1,493,141 | | | | — | | | | (900,000 | ) | | | 2,634 | | | | 27,306 | | | | 623,081 | | | | 62,558 | | | | 13,125 | |
| | | $ | 3,260,757 | | | $ | — | | | $ | (900,000 | ) | | $ | 2,634 | | | $ | 95,659 | | | $ | 2,459,050 | | | | | | | $ | 44,299 | |
SEE NOTES TO FINANCIAL STATEMENTS. | THE RYDEX FUNDS ANNUAL REPORT | 123 |
DOW JONES INDUSTRIAL AVERAGE® FUND | |
STATEMENT OF ASSETS AND LIABILITIES |
March 31, 2021 |
Assets: |
Investments in unaffiliated issuers, at value (cost $12,936,141) | | $ | 18,180,250 | |
Investments in affiliated issuers, at value (cost $2,442,626) | | | 2,459,050 | |
Repurchase agreements, at value (cost $2,557,104) | | | 2,557,104 | |
Segregated cash with broker | | | 17,050 | |
Unrealized appreciation on OTC swap agreements | | | 154,468 | |
Receivables: |
Fund shares sold | | | 179,210 | |
Swap settlement | | | 19,674 | |
Dividends | | | 10,230 | |
Total assets | | | 23,577,036 | |
| | | | | |
Liabilities: |
Payable for: |
Securities purchased | | | 199,980 | |
Fund shares redeemed | | | 28,291 | |
Management fees | | | 13,022 | |
Distribution and service fees | | | 6,121 | |
Transfer agent and administrative fees | | | 4,718 | |
Portfolio accounting fees | | | 1,754 | |
Trustees’ fees* | | | 313 | |
Variation margin on futures contracts | | | 300 | |
Miscellaneous | | | 28,907 | |
Total liabilities | | | 283,406 | |
Commitments and contingent liabilities (Note 12) | | | — | |
Net assets | | $ | 23,293,630 | |
| | | | | |
Net assets consist of: |
Paid in capital | | $ | 18,920,305 | |
Total distributable earnings (loss) | | | 4,373,325 | |
Net assets | | $ | 23,293,630 | |
| | | | | |
A-Class: |
Net assets | | $ | 2,951,816 | |
Capital shares outstanding | | | 35,641 | |
Net asset value per share | | $ | 82.82 | |
Maximum offering price per share (Net asset value divided by 95.25%) | | $ | 86.95 | |
| | | | | |
C-Class: |
Net assets | | $ | 2,842,144 | |
Capital shares outstanding | | | 35,865 | |
Net asset value per share | | $ | 79.25 | |
| | | | | |
H-Class: |
Net assets | | $ | 17,499,670 | |
Capital shares outstanding | | | 211,146 | |
Net asset value per share | | $ | 82.88 | |
STATEMENT OF OPERATIONS |
Year Ended March 31, 2021 |
Investment Income: |
Dividends from securities of unaffiliated issuers | | $ | 332,087 | |
Dividends from securities of affiliated issuers | | | 44,299 | |
Interest | | | 2,109 | |
Total investment income | | | 378,495 | |
| | | | | |
Expenses: |
Management fees | | | 163,894 | |
Distribution and service fees: |
A-Class | | | 8,550 | |
C-Class | | | 21,831 | |
H-Class | | | 40,623 | |
Transfer agent and administrative fees | | | 61,619 | |
Portfolio accounting fees | | | 21,856 | |
Licensing fees | | | 21,804 | |
Professional fees | | | 9,996 | |
Trustees’ fees* | | | 5,228 | |
Custodian fees | | | 3,238 | |
Miscellaneous | | | 29,314 | |
Total expenses | | | 387,953 | |
Less: |
Expenses waived by Adviser | | | (2,744 | ) |
Net expenses | | | 385,209 | |
Net investment loss | | | (6,714 | ) |
| | | | | |
Net Realized and Unrealized Gain (Loss): |
Net realized gain (loss) on: |
Investments in unaffiliated issuers | | | 1,856,528 | |
Investments in affiliated issuers | | | 2,634 | |
Swap agreements | | | 1,322,980 | |
Futures contracts | | | 660,570 | |
Net realized gain | | | 3,842,712 | |
Net change in unrealized appreciation (depreciation) on: |
Investments in unaffiliated issuers | | | 4,403,089 | |
Investments in affiliated issuers | | | 95,659 | |
Swap agreements | | | 421,783 | |
Futures contracts | | | (175,221 | ) |
Net change in unrealized appreciation (depreciation) | | | 4,745,310 | |
Net realized and unrealized gain | | | 8,588,022 | |
Net increase in net assets resulting from operations | | $ | 8,581,308 | |
* | Relates to Trustees not deemed “interested persons” within the meaning of Section 2(a)(19) of the 1940 Act. |
124 | THE RYDEX FUNDS ANNUAL REPORT | SEE NOTES TO FINANCIAL STATEMENTS. |
DOW JONES INDUSTRIAL AVERAGE® FUND | |
STATEMENTS OF CHANGES IN NET ASSETS |
| | Year Ended
March 31,
2021 | | | Year Ended
March 31,
2020 | |
Increase (Decrease) in Net Assets from Operations: | | | | | | | | |
Net investment income (loss) | | $ | (6,714 | ) | | $ | 201,192 | |
Net realized gain on investments | | | 3,842,712 | | | | 5,067,156 | |
Net change in unrealized appreciation (depreciation) on investments | | | 4,745,310 | | | | (7,146,849 | ) |
Net increase (decrease) in net assets resulting from operations | | | 8,581,308 | | | | (1,878,501 | ) |
| | | | | | | | | |
Distributions to shareholders: | | | | | | | | |
A-Class | | | (219,502 | ) | | | (159,709 | ) |
C-Class | | | (100,677 | ) | | | (98,345 | ) |
H-Class | | | (667,482 | ) | | | (892,516 | ) |
Total distributions to shareholders | | | (987,661 | ) | | | (1,150,570 | ) |
| | | | | | | | | |
Capital share transactions: | | | | | | | | |
Proceeds from sale of shares | | | | | | | | |
A-Class | | | 16,573,038 | | | | 16,273,565 | |
C-Class | | | 1,170,506 | | | | 2,489,125 | |
H-Class | | | 55,034,990 | | | | 141,553,466 | |
Distributions reinvested | | | | | | | | |
A-Class | | | 124,588 | | | | 127,980 | |
C-Class | | | 100,157 | | | | 93,396 | |
H-Class | | | 665,388 | | | | 889,793 | |
Cost of shares redeemed | | | | | | | | |
A-Class | | | (17,549,236 | ) | | | (32,450,685 | ) |
C-Class | | | (806,262 | ) | | | (2,248,063 | ) |
H-Class | | | (68,232,740 | ) | | | (156,450,347 | ) |
Net decrease from capital share transactions | | | (12,919,571 | ) | | | (29,721,770 | ) |
Net decrease in net assets | | | (5,325,924 | ) | | | (32,750,841 | ) |
| | | | | | | | | |
Net assets: | | | | | | | | |
Beginning of year | | | 28,619,554 | | | | 61,370,395 | |
End of year | | $ | 23,293,630 | | | $ | 28,619,554 | |
| | | | | | | | | |
Capital share activity: | | | | | | | | |
Shares sold | | | | | | | | |
A-Class | | | 229,982 | | | | 272,947 | |
C-Class | | | 16,492 | | | | 35,697 | |
H-Class | | | 787,958 | | | | 2,026,607 | |
Shares issued from reinvestment of distributions | | | | | | | | |
A-Class | | | 1,651 | | | | 1,746 | |
C-Class | | | 1,384 | | | | 1,316 | |
H-Class | | | 8,811 | | | | 12,134 | |
Shares redeemed | | | | | | | | |
A-Class | | | (242,246 | ) | | | (498,107 | ) |
C-Class | | | (11,565 | ) | | | (32,647 | ) |
H-Class | | | (1,009,796 | ) | | | (2,189,993 | ) |
Net decrease in shares | | | (217,329 | ) | | | (370,300 | ) |
SEE NOTES TO FINANCIAL STATEMENTS. | THE RYDEX FUNDS ANNUAL REPORT | 125 |
DOW JONES INDUSTRIAL AVERAGE® FUND | |
This table is presented to show selected data for a share outstanding throughout each period and to assist shareholders in evaluating a Fund’s performance for the periods presented.
A-Class | | Year Ended
March 31,
2021 | | | Year Ended
March 31,
2020 | | | Year Ended
March 31,
2019 | | | Year Ended
March 29,
2018 | | | Year Ended
March 31,
2017 | |
Per Share Data |
Net asset value, beginning of period | | $ | 57.33 | | | $ | 70.54 | | | $ | 66.00 | | | $ | 58.25 | | | $ | 49.60 | |
Income (loss) from investment operations: |
Net investment income (loss)a | | | .02 | | | | .47 | | | | .55 | | | | .34 | | | | .23 | |
Net gain (loss) on investments (realized and unrealized) | | | 29.21 | | | | (10.67 | ) | | | 4.78 | | | | 9.91 | | | | 8.73 | |
Total from investment operations | | | 29.23 | | | | (10.20 | ) | | | 5.33 | | | | 10.25 | | | | 8.96 | |
Less distributions from: |
Net investment income | | | (.06 | ) | | | (.31 | ) | | | (.64 | ) | | | (.35 | ) | | | (.02 | ) |
Net realized gains | | | (3.68 | ) | | | (2.70 | ) | | | (.15 | ) | | | (2.15 | ) | | | (.29 | ) |
Total distributions | | | (3.74 | ) | | | (3.01 | ) | | | (.79 | ) | | | (2.50 | ) | | | (.31 | ) |
Net asset value, end of period | | $ | 82.82 | | | $ | 57.33 | | | $ | 70.54 | | | $ | 66.00 | | | $ | 58.25 | |
|
Total Returnb | | | 51.61 | % | | | (15.38 | %) | | | 8.15 | % | | | 17.55 | % | | | 18.10 | % |
Ratios/Supplemental Data |
Net assets, end of period (in thousands) | | $ | 2,952 | | | $ | 2,652 | | | $ | 19,022 | | | $ | 20,953 | | | $ | 19,523 | |
Ratios to average net assets: |
Net investment income (loss) | | | 0.02 | % | | | 0.65 | % | | | 0.80 | % | | | 0.54 | % | | | 0.44 | % |
Total expensesc | | | 1.69 | % | | | 1.66 | % | | | 1.61 | % | | | 1.56 | % | | | 1.56 | % |
Net expensesd | | | 1.68 | % | | | 1.64 | % | | | 1.61 | % | | | 1.56 | % | | | 1.56 | % |
Portfolio turnover rate | | | 110 | % | | | 186 | % | | | 465 | % | | | 168 | % | | | 668 | % |
C-Class | | Year Ended
March 31,
2021 | | | Year Ended
March 31,
2020 | | | Year Ended
March 31,
2019 | | | Year Ended
March 29,
2018 | | | Year Ended
March 31,
2017 | |
Per Share Data |
Net asset value, beginning of period | | $ | 55.37 | | | $ | 68.74 | | | $ | 64.81 | | | $ | 57.66 | | | $ | 49.47 | |
Income (loss) from investment operations: |
Net investment income (loss)a | | | (.49 | ) | | | (.02 | ) | | | .03 | | | | (.09 | ) | | | (.11 | ) |
Net gain (loss) on investments (realized and unrealized) | | | 28.11 | | | | (10.34 | ) | | | 4.69 | | | | 9.74 | | | | 8.61 | |
Total from investment operations | | | 27.62 | | | | (10.36 | ) | | | 4.72 | | | | 9.65 | | | | 8.50 | |
Less distributions from: |
Net investment income | | | (.06 | ) | | | (.31 | ) | | | (.64 | ) | | | (.35 | ) | | | (.02 | ) |
Net realized gains | | | (3.68 | ) | | | (2.70 | ) | | | (.15 | ) | | | (2.15 | ) | | | (.29 | ) |
Total distributions | | | (3.74 | ) | | | (3.01 | ) | | | (.79 | ) | | | (2.50 | ) | | | (.31 | ) |
Net asset value, end of period | | $ | 79.25 | | | $ | 55.37 | | | $ | 68.74 | | | $ | 64.81 | | | $ | 57.66 | |
|
Total Returnb | | | 50.52 | % | | | (16.03 | %) | | | 7.37 | % | | | 16.66 | % | | | 17.21 | % |
Ratios/Supplemental Data |
Net assets, end of period (in thousands) | | $ | 2,842 | | | $ | 1,637 | | | $ | 1,731 | | | $ | 3,294 | | | $ | 2,144 | |
Ratios to average net assets: |
Net investment income (loss) | | | (0.70 | %) | | | (0.03 | %) | | | 0.04 | % | | | (0.14 | %) | | | (0.21 | %) |
Total expensesc | | | 2.44 | % | | | 2.42 | % | | | 2.36 | % | | | 2.30 | % | | | 2.32 | % |
Net expensesd | | | 2.43 | % | | | 2.40 | % | | | 2.36 | % | | | 2.36 | % | | | 2.32 | % |
Portfolio turnover rate | | | 110 | % | | | 186 | % | | | 465 | % | | | 168 | % | | | 668 | % |
126 | THE RYDEX FUNDS ANNUAL REPORT | SEE NOTES TO FINANCIAL STATEMENTS. |
DOW JONES INDUSTRIAL AVERAGE® FUND | |
FINANCIAL HIGHLIGHTS (concluded) |
This table is presented to show selected data for a share outstanding throughout each period and to assist shareholders in evaluating a Fund’s performance for the periods presented.
H-Class | | Year Ended
March 31,
2021 | | | Year Ended
March 31,
2020 | | | Year Ended
March 31,
2019 | | | Year Ended
March 29,
2018 | | | Year Ended
March 31,
2017 | |
Per Share Data |
Net asset value, beginning of period | | $ | 57.36 | | | $ | 70.59 | | | $ | 66.04 | | | $ | 58.28 | | | $ | 49.59 | |
Income (loss) from investment operations: |
Net investment income (loss)a | | | .03 | | | | .51 | | | | .55 | | | | .39 | | | | .28 | |
Net gain (loss) on investments (realized and unrealized) | | | 29.23 | | | | (10.73 | ) | | | 4.79 | | | | 9.87 | | | | 8.72 | |
Total from investment operations | | | 29.26 | | | | (10.22 | ) | | | 5.34 | | | | 10.26 | | | | 9.00 | |
Less distributions from: |
Net investment income | | | (.06 | ) | | | (.31 | ) | | | (.64 | ) | | | (.35 | ) | | | (.02 | ) |
Net realized gains | | | (3.68 | ) | | | (2.70 | ) | | | (.15 | ) | | | (2.15 | ) | | | (.29 | ) |
Total distributions | | | (3.74 | ) | | | (3.01 | ) | | | (.79 | ) | | | (2.50 | ) | | | (.31 | ) |
Net asset value, end of period | | $ | 82.88 | | | $ | 57.36 | | | $ | 70.59 | | | $ | 66.04 | | | $ | 58.28 | |
|
Total Return | | | 51.64 | % | | | (15.40 | %) | | | 8.16 | % | | | 17.54 | % | | | 18.20 | % |
Ratios/Supplemental Data |
Net assets, end of period (in thousands) | | $ | 17,500 | | | $ | 24,331 | | | $ | 40,617 | | | $ | 68,766 | | | $ | 42,495 | |
Ratios to average net assets: |
Net investment income (loss) | | | 0.05 | % | | | 0.70 | % | | | 0.80 | % | | | 0.61 | % | | | 0.52 | % |
Total expensesc | | | 1.70 | % | | | 1.66 | % | | | 1.62 | % | | | 1.55 | % | | | 1.57 | % |
Net expensesd | | | 1.69 | % | | | 1.64 | % | | | 1.62 | % | | | 1.55 | % | | | 1.57 | % |
Portfolio turnover rate | | | 110 | % | | | 186 | % | | | 465 | % | | | 168 | % | | | 668 | % |
a | Net investment income (loss) per share was computed using average shares outstanding throughout the period. |
b | Total return does not reflect the impact of any applicable sales charges. |
c | Does not include expenses of the underlying funds in which the Fund invests. |
d | Net expense information reflects the expense ratios after expense waivers and reimbursements, as applicable. |
SEE NOTES TO FINANCIAL STATEMENTS. | THE RYDEX FUNDS ANNUAL REPORT | 127 |
PERFORMANCE REPORT AND FUND PROFILE (Unaudited) | March 31, 2021 |
GOVERNMENT LONG BOND 1.2x STRATEGY FUND
OBJECTIVE: Seeks to provide investment results that correspond, before fees and expenses, to a benchmark for U.S. government securities on a daily basis. The Fund’s current benchmark is 120% of the daily price movement of the Long Treasury Bond. The Long Treasury Bond is the most recently issued 30 Year U.S. Treasury Bond. The price movement of the Long Treasury Bond is based on the daily price change of the most recently issued Long Treasury Bond. The Fund does not seek to achieve its investment objective over a period of time greater than one day.
For the one-year period ended March 31, 2021, the Government Long Bond 1.2x Strategy Fund Investor Class returned -24.72%.
The Price Movement of the Long Treasury Bond was -21.49% for the period.
The return of a comparison index, the Bloomberg Barclays U.S. Long Treasury Index was -15.80%.
As prices of long-term Treasury bonds fell over the period, their yields rose, from 1.32% to 2.41%. This performance masked considerable volatility, as investors fearful of global economic fallout from the coronavirus outbreak and oil price instability early in the period rushed into safe havens and sent prices of U.S. Treasuries skyrocketing. In April 2020, the yield on the 30-year Treasury yield dipped to its period low of 1.17%. Yields gradually creeped back to end the year at their highest level since the pandemic, and on the strength of the economic recovery continued to rise until mid-March 2021, when the yield on the 30-year Treasury yield reached its period high of 2.45%. Investors shifted from Treasuries to higher-yielding corners of the market, and reacted to a substantial increase in Treasury supply, as the U.S. Government continued its emergency fiscal measures and stimulus spending. The market also has been absorbing expected increases in economic growth and inflation. The Treasury yield curve steepened significantly over the period, as short-term yields fell slightly and longer-term yields jumped.
Derivatives in the Fund are used to provide additional exposure to composition of the benchmark in the most efficient manner possible and to provide leverage and not for hedging purposes. Derivatives performed as expected.
Due to the compounding of daily returns, leveraged and inverse funds’ returns over periods other than one day will likely differ in amounts and possibly direction from the benchmark return for the same period. Investors should monitor their leveraged and inverse funds’ holdings to ensure that they are consistent with their strategies, as frequently as daily.
The effects of compounding may cause the longer-term correlation of the Fund to its benchmark to diminish. The apparent discrepancy between the leveraged and unleveraged indices is the result of compounding, which is described briefly on page 6 of this report.
The Fund may invest in certain of the underlying series of Guggenheim Funds Trust and Guggenheim Strategy Funds Trust, including Guggenheim Ultra Short Duration, Guggenheim Strategy Fund II and Guggenheim Strategy Fund III (collectively, the “Short Term Investment Vehicles”), each of which are open-end management investment companies managed by Guggenheim Investments. The Short Term Investment Vehicles, which launched on March 11, 2014, are offered as short term investment options only to mutual funds, trusts, and other accounts managed by Guggenheim Investments and/or its affiliates, and are not available to the public, with the exception of Guggenheim Ultra Short Duration Fund, which is available to the public. Guggenheim Strategy Fund II and Guggenheim Strategy Fund III do not charge an investment management fee. Guggenheim Ultra Short Duration Fund charges an investment management fee but the Fund’s adviser has agreed to waive fees to the extent necessary to offset the proportionate share of any management fee paid by the Fund with respect to its investment in Guggenheim Ultra Short Duration Fund. For the one-year period ended March 31, 2021, investment in the Short Term Investment Vehicles benefited Fund performance.
Performance displayed represents past performance, which is no guarantee of future results.
128 | THE RYDEX FUNDS ANNUAL REPORT | |
PERFORMANCE REPORT AND FUND PROFILE (Unaudited)(continued) | March 31, 2021 |
Holdings Diversification (Market Exposure as % of Net Assets)

“Holdings Diversification (Market Exposure as % of Net Assets)” excludes any temporary cash investments, investments in Guggenheim Strategy Funds Trust mutual funds, or investments in Guggenheim Ultra Short Duration Fund. Investments in those Funds do not provide “market exposure” to meet the Fund’s investment objective, but will significantly increase the portfolio’s exposure to certain other asset categories (and their associated risks), which may cause the Fund to deviate from its principal investment strategy, including: (i) high yield, high risk debt securities rated below the top four long-term rating categories by a nationally recognized statistical rating organization (also known as “junk bonds”); (ii) securities issued by the U.S. government or its agencies and instrumentalities; (iii) CLOs and similar investments; and (iv) other short-term fixed income securities.
Inception Dates: |
Investor Class | January 3, 1994 |
A-Class | March 31, 2004 |
C-Class | May 2, 2001 |
H-Class | September 18, 2014 |
The Fund invests principally in U.S. Government securities and in derivative investments such as futures contracts.
Largest Holdings (% of Total Net Assets) |
U.S. Treasury Bonds | 78.9% |
Guggenheim Ultra Short Duration Fund — Institutional Class | 3.6% |
Guggenheim Strategy Fund II | 3.6% |
Total | 86.1% |
| | |
“Largest Holdings” excludes any temporary cash or derivative investments. |
| | THE RYDEX FUNDS ANNUAL REPORT | 129 |
PERFORMANCE REPORT AND FUND PROFILE (Unaudited)(concluded) | March 31, 2021 |
Cumulative Fund Performance*
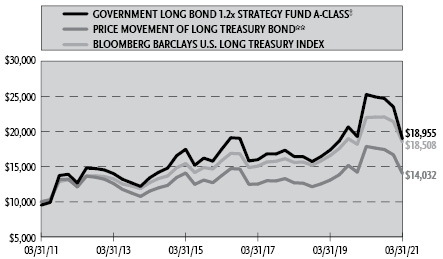
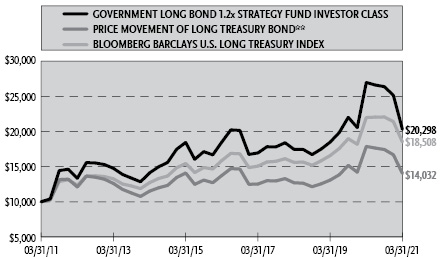
Average Annual Returns*
Periods Ended March 31, 2021
| 1 Year | 5 Year | 10 Year |
Investor Class Shares | (24.72%) | 1.88% | 7.34% |
A-Class Shares | (24.98%) | 1.62% | 7.12% |
A-Class Shares with sales charge‡ | (28.55%) | 0.64% | 6.60% |
C-Class Shares | (25.55%) | 0.86% | 6.29% |
C-Class Shares with CDSC§ | (26.06%) | 0.86% | 6.29% |
Bloomberg Barclays U.S. Long Treasury Index | (15.80%) | 3.13% | 6.35% |
Price Movement of Long Treasury Bond** | (21.49%) | 0.42% | 3.45% |
| 1 Year | 5 Year | Since
Inception
(09/18/14) |
H-Class Shares | (24.98%) | 1.62% | 4.44% |
Bloomberg Barclays U.S. Long Treasury Index | (15.80%) | 3.13% | 5.15% |
Price Movement of Long Treasury Bond** | (21.49%) | 0.42% | 2.44% |
* | The performance data above represents past performance that is not predictive of future results. The investment return and principal value of an investment in the Fund will fluctuate so that an investor’s shares, when redeemed, may be worth more or less than their original cost. Returns are historical and include changes in principal and reinvested dividends and capital gains and do not reflect the effect of taxes. The Bloomberg Barclays U.S. Long Treasury Index and the Price Movement of Long Treasury Bond are unmanaged indices and, unlike the Fund, have no management fees or operating expenses to reduce their reported returns. The graphs are based on Investor Class shares and A-Class shares only; performance for C-Class shares and H-Class shares will vary due to differences in fee structures. |
** | Does not reflect any interest. |
‡ | Fund returns are calculated using the maximum sales charge of 4.75%. |
§ | Fund returns include a CDSC of 1% if redeemed within 12 months of purchase. |
130 | THE RYDEX FUNDS ANNUAL REPORT | |
SCHEDULE OF INVESTMENTS | March 31, 2021 |
GOVERNMENT LONG BOND 1.2x STRATEGY FUND | |
| | Shares | | | Value | |
MUTUAL FUNDS† - 7.2% |
Guggenheim Ultra Short Duration Fund — Institutional Class1 | | | 563,138 | | | $ | 5,608,852 | |
Guggenheim Strategy Fund II1 | | | 222,800 | | | | 5,565,542 | |
Total Mutual Funds | | | | |
(Cost $11,153,238) | | | | | | | 11,174,394 | |
| | | | | | | | | |
| | | Face
Amount | | | | | |
U.S. GOVERNMENT SECURITIES†† - 78.9% |
U.S. Treasury Bonds |
1.88% due 02/15/51 | | $ | 138,850,000 | | | | 123,251,070 | |
Total U.S. Government Securities | | | | |
(Cost $124,485,184) | | | | | | | 123,251,070 | |
| | | | | | | | | |
U.S. TREASURY BILLS†† - 9.2% |
U.S. Treasury Bills |
0.01% due 04/20/212 | | | 12,400,000 | | | | 12,399,869 | |
0.01% due 04/22/212,3 | | | 2,049,000 | | | | 2,048,985 | |
Total U.S. Treasury Bills | | | | |
(Cost $14,448,933) | | | | | | | 14,448,854 | |
REPURCHASE AGREEMENTS††,4 - 7.8% |
J.P. Morgan Securities LLC
issued 03/31/21 at 0.01%
due 04/01/21 | | | 6,502,400 | | | | 6,502,400 | |
Barclays Capital, Inc.
issued 03/31/21 at 0.01%
due 04/01/21 | | | 2,956,307 | | | | 2,956,307 | |
BofA Securities, Inc.
issued 03/31/21 at 0.01%
due 04/01/21 | | | 2,698,092 | | | | 2,698,092 | |
Total Repurchase Agreements | | | | |
(Cost $12,156,799) | | | | | | | 12,156,799 | |
| | | | | | | | | |
Total Investments - 103.1% | | | | |
(Cost $162,244,154) | | $ | 161,031,117 | |
Other Assets & Liabilities, net - (3.1)% | | | (4,805,494 | ) |
Total Net Assets - 100.0% | | $ | 156,225,623 | |
Futures Contracts |
Description | | Number of
Contracts | | | Expiration
Date | | | Notional
Amount | | | Value and
Unrealized
Appreciation** | |
Interest Rate Futures Contracts Purchased† |
U.S. Treasury Ultra Long Bond Futures Contracts | | | 421 | | | | Jun 2021 | | | $ | 76,635,156 | | | $ | 352,265 | |
** | Includes cumulative appreciation (depreciation). Variation margin is reported within the Statement of Assets and Liabilities. |
† | Value determined based on Level 1 inputs — See Note 4. |
†† | Value determined based on Level 2 inputs — See Note 4. |
1 | Affiliated issuer. |
2 | Rate indicated is the effective yield at the time of purchase. |
3 | All or a portion of this security is pledged as futures collateral at March 31, 2021. |
4 | Repurchase Agreements — See Note 6. |
| | |
| | See Sector Classification in Other Information section. |
SEE NOTES TO FINANCIAL STATEMENTS. | THE RYDEX FUNDS ANNUAL REPORT | 131 |
SCHEDULE OF INVESTMENTS (concluded) | March 31, 2021 |
GOVERNMENT LONG BOND 1.2x STRATEGY FUND | |
The following table summarizes the inputs used to value the Fund’s investments at March 31, 2021 (See Note 4 in the Notes to Financial Statements):
Investments in Securities (Assets) | | Level 1
Quoted
Prices | | | Level 2
Significant
Observable
Inputs | | | Level 3
Significant
Unobservable
Inputs | | | Total | |
Mutual Funds | | $ | 11,174,394 | | | $ | — | | | $ | — | | | $ | 11,174,394 | |
U.S. Government Securities | | | — | | | | 123,251,070 | | | | — | | | | 123,251,070 | |
U.S. Treasury Bills | | | — | | | | 14,448,854 | | | | — | | | | 14,448,854 | |
Repurchase Agreements | | | — | | | | 12,156,799 | | | | — | | | | 12,156,799 | |
Interest Rate Futures Contracts** | | | 352,265 | | | | — | | | | — | | | | 352,265 | |
Total Assets | | $ | 11,526,659 | | | $ | 149,856,723 | | | $ | — | | | $ | 161,383,382 | |
** | This derivative is reported as unrealized appreciation/depreciation at period end. |
Affiliated Transactions
Investments representing 5% or more of the outstanding voting shares of a company, or control of or by, or common control under Guggenheim Investments (“GI”), result in that company being considered an affiliated issuer, as defined in the 1940 Act.
The Fund may invest in certain of the underlying series of Guggenheim Strategy Funds Trust, including Guggenheim Strategy Fund II and Guggenheim Strategy Fund III, (collectively, the “Short Term Investment Vehicles”), each of which are open-end management investment companies managed by GI. The Short Term Investment Vehicles, which launched on March 11, 2014, are offered as short term investment options only to mutual funds, trusts, and other accounts managed by GI and/or its affiliates, and are not available to the public. The Short Term Investment Vehicles pay no investment management fees. The Short Term Investment Vehicles’ annual report on Form N-CSR dated September 30, 2020, is available publicly or upon request. This information is available from the EDGAR database on the SEC’s website at https://www.sec.gov/Archives/edgar/data/1601445/000182126820000133/gug81042-ncsr.htm.
Transactions during the year ended March 31, 2021, in which the company is an affiliated issuer, were as follows:
Security Name | | Value
03/31/20 | | | Additions | | | Reductions | | | Realized
Gain (Loss) | | | Change in
Unrealized
Appreciation
(Depreciation) | | | Value
03/31/21 | | | Shares
03/31/21 | | | Investment
Income | |
Mutual Funds | | | | | | | | | | | | | | | | | | | | | | | | | | | | | | | | |
Guggenheim Strategy Fund II | | $ | 10,417,042 | | | $ | 2,150,000 | | | $ | (7,300,000 | ) | | $ | (69,128 | ) | | $ | 367,628 | | | $ | 5,565,542 | | | | 222,800 | | | $ | 98,204 | |
Guggenheim Ultra Short Duration Fund — Institutional Class | | | 10,511,293 | | | | 6,450,000 | | | | (11,500,000 | ) | | | (59,184 | ) | | | 206,743 | | | | 5,608,852 | | | | 563,138 | | | | 63,281 | |
| | | $ | 20,928,335 | | | $ | 8,600,000 | | | $ | (18,800,000 | ) | | $ | (128,312 | ) | | $ | 574,371 | | | $ | 11,174,394 | | | | | | | $ | 161,485 | |
132 | THE RYDEX FUNDS ANNUAL REPORT | SEE NOTES TO FINANCIAL STATEMENTS. |
GOVERNMENT LONG BOND 1.2x STRATEGY FUND | |
STATEMENT OF ASSETS AND LIABILITIES |
March 31, 2021 |
Assets: |
Investments in unaffiliated issuers, at value (cost $138,934,117) | | $ | 137,699,924 | |
Investments in affiliated issuers, at value (cost $11,153,238) | | | 11,174,394 | |
Repurchase agreements, at value (cost $12,156,799) | | | 12,156,799 | |
Segregated cash with broker | | | 1,800,665 | |
Receivables: |
Securities sold | | | 9,764,219 | |
Fund shares sold | | | 569,624 | |
Interest | | | 373,634 | |
Dividends | | | 10,385 | |
Total assets | | | 173,549,644 | |
| | | | | |
Liabilities: |
Payable for: |
Fund shares redeemed | | | 16,888,717 | |
Variation margin on futures contracts | | | 169,426 | |
Management fees | | | 54,247 | |
Transfer agent and administrative fees | | | 24,210 | |
Distribution and service fees | | | 19,836 | |
Portfolio accounting fees | | | 11,055 | |
Trustees’ fees* | | | 1,852 | |
Distributions to shareholders | | | 547 | |
Miscellaneous | | | 154,131 | |
Total liabilities | | | 17,324,021 | |
Commitments and contingent liabilities (Note 12) | | | — | |
Net assets | | $ | 156,225,623 | |
| | | | | |
Net assets consist of: |
Paid in capital | | $ | 174,304,402 | |
Total distributable earnings (loss) | | | (18,078,779 | ) |
Net assets | | $ | 156,225,623 | |
| | | | | |
Investor Class: |
Net assets | | $ | 69,359,695 | |
Capital shares outstanding | | | 1,828,689 | |
Net asset value per share | | $ | 37.93 | |
| | | | | |
A-Class: |
Net assets | | $ | 1,609,500 | |
Capital shares outstanding | | | 41,976 | |
Net asset value per share | | $ | 38.34 | |
Maximum offering price per share (Net asset value divided by 95.25%) | | $ | 40.25 | |
| | | | | |
C-Class: |
Net assets | | $ | 169,309 | |
Capital shares outstanding | | | 4,499 | |
Net asset value per share | | $ | 37.63 | |
| | | | | |
H-Class: |
Net assets | | $ | 85,087,119 | |
Capital shares outstanding | | | 2,217,061 | |
Net asset value per share | | $ | 38.38 | |
STATEMENT OF OPERATIONS |
Year Ended March 31, 2021 |
Investment Income: |
Dividends from securities of affiliated issuers | | $ | 161,485 | |
Interest | | | 1,169,545 | |
Total investment income | | | 1,331,030 | |
| | | | | |
Expenses: |
Management fees | | | 447,780 | |
Distribution and service fees: |
A-Class | | | 6,545 | |
C-Class | | | 6,941 | |
H-Class | | | 132,330 | |
Transfer agent and administrative fees | | | 214,224 | |
Portfolio accounting fees | | | 89,568 | |
Registration fees | | | 82,715 | |
Professional fees | | | 57,292 | |
Trustees’ fees* | | | 35,165 | |
Custodian fees | | | 14,458 | |
Line of credit fees | | | 440 | |
Miscellaneous | | | 1,952 | |
Total expenses | | | 1,089,410 | |
Less: |
Expenses waived by Adviser | | | (13,186 | ) |
Net expenses | | | 1,076,224 | |
Net investment income | | | 254,806 | |
| | | | | |
Net Realized and Unrealized Gain (Loss): |
Net realized gain (loss) on: |
Investments in unaffiliated issuers | | | (6,270,120 | ) |
Investments in affiliated issuers | | | (128,312 | ) |
Futures contracts | | | (186,535 | ) |
Net realized loss | | | (6,584,967 | ) |
Net change in unrealized appreciation (depreciation) on: |
Investments in unaffiliated issuers | | | (12,718,685 | ) |
Investments in affiliated issuers | | | 574,371 | |
Futures contracts | | | (7,122,200 | ) |
Net change in unrealized appreciation (depreciation) | | | (19,266,514 | ) |
Net realized and unrealized loss | | | (25,851,481 | ) |
Net decrease in net assets resulting from operations | | $ | (25,596,675 | ) |
* | Relates to Trustees not deemed “interested persons” within the meaning of Section 2(a)(19) of the 1940 Act. |
SEE NOTES TO FINANCIAL STATEMENTS. | THE RYDEX FUNDS ANNUAL REPORT | 133 |
GOVERNMENT LONG BOND 1.2x STRATEGY FUND | |
STATEMENTS OF CHANGES IN NET ASSETS |
| | Year Ended
March 31,
2021 | | | Year Ended
March 31,
2020 | |
Increase (Decrease) in Net Assets from Operations: | | | | | | | | |
Net investment income | | $ | 254,806 | | | $ | 1,630,386 | |
Net realized gain (loss) on investments | | | (6,584,967 | ) | | | 42,346,916 | |
Net change in unrealized appreciation (depreciation) on investments | | | (19,266,514 | ) | | | 11,247,858 | |
Net increase (decrease) in net assets resulting from operations | | | (25,596,675 | ) | | | 55,225,160 | |
| | | | | | | | | |
Distributions to shareholders: | | | | | | | | |
Investor Class | | | (4,960,713 | ) | | | (2,108,783 | ) |
A-Class | | | (901,622 | ) | | | (435,810 | ) |
C-Class | | | (236,487 | ) | | | (21,938 | ) |
H-Class | | | (9,855,303 | ) | | | (1,738,251 | ) |
Total distributions to shareholders | | | (15,954,125 | ) | | | (4,304,782 | ) |
| | | | | | | | | |
Capital share transactions: | | | | | | | | |
Proceeds from sale of shares | | | | | | | | |
Investor Class | | | 1,148,184,621 | | | | 962,124,357 | |
A-Class | | | 3,059,120 | | | | 4,581,047 | |
C-Class | | | 2,804,995 | | | | 7,550,985 | |
H-Class | | | 1,008,418,309 | | | | 790,950,225 | |
Distributions reinvested | | | | | | | | |
Investor Class | | | 4,881,667 | | | | 1,970,914 | |
A-Class | | | 837,688 | | | | 423,677 | |
C-Class | | | 220,470 | | | | 20,877 | |
H-Class | | | 9,847,832 | | | | 1,736,665 | |
Cost of shares redeemed | | | | | | | | |
Investor Class | | | (1,108,072,277 | ) | | | (1,014,887,608 | ) |
A-Class | | | (3,431,050 | ) | | | (32,933,999 | ) |
C-Class | | | (3,616,674 | ) | | | (7,268,837 | ) |
H-Class | | | (985,371,192 | ) | | | (779,922,941 | ) |
Net increase (decrease) from capital share transactions | | | 77,763,509 | | | | (65,654,638 | ) |
Net increase (decrease) in net assets | | | 36,212,709 | | | | (14,734,260 | ) |
| | | | | | | | | |
Net assets: | | | | | | | | |
Beginning of year | | | 120,012,914 | | | | 134,747,174 | |
End of year | | $ | 156,225,623 | | | $ | 120,012,914 | |
| | | | | | | | | |
Capital share activity: | | | | | | | | |
Shares sold | | | | | | | | |
Investor Class | | | 18,090,039 | | | | 16,000,438 | |
A-Class | | | 49,028 | | | | 74,378 | |
C-Class | | | 48,918 | | | | 126,059 | |
H-Class | | | 16,125,875 | | | | 13,427,183 | |
Shares issued from reinvestment of distributions | | | | | | | | |
Investor Class | | | 104,624 | | | | 33,535 | |
A-Class | | | 17,803 | | | | 7,261 | |
C-Class | | | 4,770 | | | | 359 | |
H-Class | | | 209,359 | | | | 29,371 | |
Shares redeemed | | | | | | | | |
Investor Class | | | (16,877,614 | ) | | | (16,783,183 | ) |
A-Class | | | (62,007 | ) | | | (503,938 | ) |
C-Class | | | (66,029 | ) | | | (120,980 | ) |
H-Class | | | (15,162,526 | ) | | | (13,202,385 | ) |
Net increase (decrease) in shares | | | 2,482,240 | | | | (911,902 | ) |
134 | THE RYDEX FUNDS ANNUAL REPORT | SEE NOTES TO FINANCIAL STATEMENTS. |
GOVERNMENT LONG BOND 1.2x STRATEGY FUND | |
This table is presented to show selected data for a share outstanding throughout each period and to assist shareholders in evaluating a Fund’s performance for the periods presented.
Investor Class | | Year Ended
March 31,
2021 | | | Year Ended
March 31,
2020 | | | Year Ended
March 31,
2019 | | | Year Ended
March 29,
2018 | | | Year Ended
March 31,
2017 | |
Per Share Data |
Net asset value, beginning of period | | $ | 74.11 | | | $ | 53.22 | | | $ | 51.21 | | | $ | 50.49 | | | $ | 58.12 | |
Income (loss) from investment operations: |
Net investment income (loss)a | | | .25 | | | | .77 | | | | .96 | | | | .80 | | | | .70 | |
Net gain (loss) on investments (realized and unrealized) | | | (14.59 | ) | | | 22.86 | | | | 2.00 | | | | .72 | | | | (5.50 | ) |
Total from investment operations | | | (14.34 | ) | | | 23.63 | | | | 2.96 | | | | 1.52 | | | | (4.80 | ) |
Less distributions from: |
Net investment income | | | (.25 | ) | | | (.77 | ) | | | (.95 | ) | | | (.80 | ) | | | (.72 | ) |
Net realized gains | | | (21.59 | ) | | | (1.97 | ) | | | — | | | | — | | | | (2.11 | ) |
Total distributions | | | (21.84 | ) | | | (2.74 | ) | | | (.95 | ) | | | (.80 | ) | | | (2.83 | ) |
Net asset value, end of period | | $ | 37.93 | | | $ | 74.11 | | | $ | 53.22 | | | $ | 51.21 | | | $ | 50.49 | |
|
Total Return | | | (24.72 | %) | | | 45.84 | % | | | 5.93 | % | | | 3.01 | % | | | (8.39 | %) |
Ratios/Supplemental Data |
Net assets, end of period (in thousands) | | $ | 69,360 | | | $ | 37,919 | | | $ | 67,103 | | | $ | 37,496 | | | $ | 16,496 | |
Ratios to average net assets: |
Net investment income (loss) | | | 0.40 | % | | | 1.28 | % | | | 1.94 | % | | | 1.52 | % | | | 1.21 | % |
Total expensesb | | | 1.07 | % | | | 1.07 | % | | | 1.07 | % | | | 0.98 | % | | | 0.98 | % |
Net expensesd | | | 1.05 | % | | | 1.05 | % | | | 1.06 | % | | | 0.98 | % | | | 0.98 | % |
Portfolio turnover rate | | | 1,938 | % | | | 1,130 | % | | | 1,182 | % | | | 1,468 | % | | | 2,490 | % |
A-Class | | Year Ended
March 31,
2021 | | | Year Ended
March 31,
2020 | | | Year Ended
March 31,
2019 | | | Year Ended
March 29,
2018 | | | Year Ended
March 31,
2017 | |
Per Share Data |
Net asset value, beginning of period | | $ | 74.70 | | | $ | 53.63 | | | $ | 51.62 | | | $ | 50.87 | | | $ | 58.50 | |
Income (loss) from investment operations: |
Net investment income (loss)a | | | .11 | | | | .72 | | | | .83 | | | | .69 | | | | .63 | |
Net gain (loss) on investments (realized and unrealized) | | | (14.78 | ) | | | 22.95 | | | | 2.01 | | | | .74 | | | | (5.57 | ) |
Total from investment operations | | | (14.67 | ) | | | 23.67 | | | | 2.84 | | | | 1.43 | | | | (4.94 | ) |
Less distributions from: |
Net investment income | | | (.10 | ) | | | (.63 | ) | | | (.83 | ) | | | (.68 | ) | | | (.58 | ) |
Net realized gains | | | (21.59 | ) | | | (1.97 | ) | | | — | | | | — | | | | (2.11 | ) |
Total distributions | | | (21.69 | ) | | | (2.60 | ) | | | (.83 | ) | | | (.68 | ) | | | (2.69 | ) |
Net asset value, end of period | | $ | 38.34 | | | $ | 74.70 | | | $ | 53.63 | | | $ | 51.62 | | | $ | 50.87 | |
|
Total Returnc | | | (24.98 | %) | | | 45.48 | % | | | 5.63 | % | | | 2.78 | % | | | (8.54 | %) |
Ratios/Supplemental Data |
Net assets, end of period (in thousands) | | $ | 1,610 | | | $ | 2,775 | | | $ | 24,639 | | | $ | 6,158 | | | $ | 15,827 | |
Ratios to average net assets: |
Net investment income (loss) | | | 0.18 | % | | | 1.24 | % | | | 1.65 | % | | | 1.31 | % | | | 1.19 | % |
Total expensesb | | | 1.30 | % | | | 1.32 | % | | | 1.33 | % | | | 1.23 | % | | | 1.24 | % |
Net expensesd | | | 1.29 | % | | | 1.30 | % | | | 1.32 | % | | | 1.23 | % | | | 1.24 | % |
Portfolio turnover rate | | | 1,938 | % | | | 1,130 | % | | | 1,182 | % | | | 1,468 | % | | | 2,490 | % |
SEE NOTES TO FINANCIAL STATEMENTS. | THE RYDEX FUNDS ANNUAL REPORT | 135 |
GOVERNMENT LONG BOND 1.2x STRATEGY FUND | |
FINANCIAL HIGHLIGHTS (continued) |
This table is presented to show selected data for a share outstanding throughout each period and to assist shareholders in evaluating a Fund’s performance for the periods presented.
C-Class | | Year Ended
March 31,
2021 | | | Year Ended
March 31,
2020 | | | Year Ended
March 31,
2019 | | | Year Ended
March 29,
2018 | | | Year Ended
March 31,
2017 | |
Per Share Data |
Net asset value, beginning of period | | $ | 74.15 | | | $ | 53.27 | | | $ | 51.24 | | | $ | 50.52 | | | $ | 58.13 | |
Income (loss) from investment operations: |
Net investment income (loss)a | | | (.33 | ) | | | .13 | | | | .45 | | | | .27 | | | | .13 | |
Net gain (loss) on investments (realized and unrealized) | | | (14.60 | ) | | | 22.92 | | | | 2.04 | | | | .73 | | | | (5.47 | ) |
Total from investment operations | | | (14.93 | ) | | | 23.05 | | | | 2.49 | | | | 1.00 | | | | (5.34 | ) |
Less distributions from: |
Net investment income | | | — | | | | (.20 | ) | | | (.46 | ) | | | (.28 | ) | | | (.16 | ) |
Net realized gains | | | (21.59 | ) | | | (1.97 | ) | | | — | | | | — | | | | (2.11 | ) |
Total distributions | | | (21.59 | ) | | | (2.17 | ) | | | (.46 | ) | | | (.28 | ) | | | (2.27 | ) |
Net asset value, end of period | | $ | 37.63 | | | $ | 74.15 | | | $ | 53.27 | | | $ | 51.24 | | | $ | 50.52 | |
|
Total Returnc | | | (25.55 | %) | | | 44.41 | % | | | 4.92 | % | | | 1.97 | % | | | (9.24 | %) |
Ratios/Supplemental Data |
Net assets, end of period (in thousands) | | $ | 169 | | | $ | 1,249 | | | $ | 607 | | | $ | 724 | | | $ | 1,770 | |
Ratios to average net assets: |
Net investment income (loss) | | | (0.55 | %) | | | 0.21 | % | | | 0.91 | % | | | 0.52 | % | | | 0.22 | % |
Total expensesb | | | 2.05 | % | | | 2.08 | % | | | 2.07 | % | | | 1.98 | % | | | 1.97 | % |
Net expensesd | | | 2.03 | % | | | 2.06 | % | | | 2.06 | % | | | 1.98 | % | | | 1.97 | % |
Portfolio turnover rate | | | 1,938 | % | | | 1,130 | % | | | 1,182 | % | | | 1,468 | % | | | 2,490 | % |
136 | THE RYDEX FUNDS ANNUAL REPORT | SEE NOTES TO FINANCIAL STATEMENTS. |
GOVERNMENT LONG BOND 1.2x STRATEGY FUND | |
FINANCIAL HIGHLIGHTS (concluded) |
This table is presented to show selected data for a share outstanding throughout each period and to assist shareholders in evaluating a Fund’s performance for the periods presented.
H-Class | | Year Ended
March 31,
2021 | | | Year Ended
March 31,
2020 | | | Year Ended
March 31,
2019 | | | Year Ended
March 29,
2018 | | | Year Ended
March 31,
2017 | |
Per Share Data |
Net asset value, beginning of period | | $ | 74.75 | | | $ | 53.65 | | | $ | 51.64 | | | $ | 50.91 | | | $ | 58.55 | |
Income (loss) from investment operations: |
Net investment income (loss)a | | | .13 | | | | .61 | | | | .84 | | | | .69 | | | | .58 | |
Net gain (loss) on investments (realized and unrealized) | | | (14.82 | ) | | | 23.09 | | | | 2.01 | | | | .72 | | | | (5.53 | ) |
Total from investment operations | | | (14.69 | ) | | | 23.70 | | | | 2.85 | | | | 1.41 | | | | (4.95 | ) |
Less distributions from: |
Net investment income | | | (.09 | ) | | | (.63 | ) | | | (.84 | ) | | | (.68 | ) | | | (.58 | ) |
Net realized gains | | | (21.59 | ) | | | (1.97 | ) | | | — | | | | — | | | | (2.11 | ) |
Total distributions | | | (21.68 | ) | | | (2.60 | ) | | | (.84 | ) | | | (.68 | ) | | | (2.69 | ) |
Net asset value, end of period | | $ | 38.38 | | | $ | 74.75 | | | $ | 53.65 | | | $ | 51.64 | | | $ | 50.91 | |
|
Total Return | | | (24.98 | %) | | | 45.55 | % | | | 5.63 | % | | | 2.74 | % | | | (8.55 | %) |
Ratios/Supplemental Data |
Net assets, end of period (in thousands) | | $ | 85,087 | | | $ | 78,070 | | | $ | 42,397 | | | $ | 76,018 | | | $ | 12,077 | |
Ratios to average net assets: |
Net investment income (loss) | | | 0.23 | % | | | 1.02 | % | | | 1.67 | % | | | 1.31 | % | | | 1.00 | % |
Total expensesb | | | 1.29 | % | | | 1.32 | % | | | 1.32 | % | | | 1.23 | % | | | 1.22 | % |
Net expensesd | | | 1.28 | % | | | 1.30 | % | | | 1.31 | % | | | 1.23 | % | | | 1.22 | % |
Portfolio turnover rate | | | 1,938 | % | | | 1,130 | % | | | 1,182 | % | | | 1,468 | % | | | 2,490 | % |
a | Net investment income (loss) per share was computed using average shares outstanding throughout the period. |
b | Does not include expenses of the underlying funds in which the Fund invests. |
c | Total return does not reflect the impact of any applicable sales charges. |
d | Net expense information reflects the expense ratios after expense waivers and reimbursements, as applicable. |
SEE NOTES TO FINANCIAL STATEMENTS. | THE RYDEX FUNDS ANNUAL REPORT | 137 |
PERFORMANCE REPORT AND FUND PROFILE (Unaudited) | March 31, 2021 |
INVERSE GOVERNMENT LONG BOND STRATEGY FUND
OBJECTIVE: Seeks to provide total returns that inversely correlate, before fees and expenses, to the price movements of a benchmark for U.S. Treasury debt instruments or futures contract on a specified debt instrument on a daily basis. The Fund’s current benchmark is the daily price movement of the Long Treasury Bond. The Long Treasury Bond is the most recently issued 30 Year U.S. Treasury Bond. The price movement of the Long Treasury Bond is based on the daily price change of the most recently issued Long Treasury Bond. The Fund does not seek to achieve its investment objective over a period of time greater than one day.
For the one-year period ended March 31, 2021, the Inverse Government Long Bond Strategy Fund Investor Class returned 22.19%.
The Price Movement of the Long Treasury Bond was -21.49% for the period.
The return of a comparison index, the Bloomberg Barclays U.S. Long Treasury Index was -15.80%.
As prices of long-term Treasury bonds fell over the period, their yields rose, from 1.32% to 2.41%. This performance masked considerable volatility, as investors fearful of global economic fallout from the coronavirus outbreak and oil price instability early in the period rushed into safe havens and sent prices of U.S. Treasuries skyrocketing. In April 2020, the yield on the 30-year Treasury yield dipped to its period low of 1.17%. Yields gradually creeped back to end the year at their highest level since the pandemic, and on the strength of the economic recovery continued to rise until mid-March 2021, when the yield on the 30-year Treasury yield reached its period high of 2.45%. Investors shifted from Treasuries to higher-yielding corners of the market, and reacted to a substantial increase in Treasury supply, as the U.S. Government continued its emergency fiscal measures and stimulus spending. The market also has been absorbing expected increases in economic growth and inflation. The Treasury yield curve steepened significantly over the period, as short-term yields fell slightly and longer-term yields jumped.
Derivatives in the Fund are used to provide additional exposure to composition of the benchmark in the most efficient manner possible and to provide leverage and not for hedging purposes. Derivatives performed as expected.
Due to the compounding of daily returns, leveraged and inverse funds’ returns over periods other than one day will likely differ in amounts and possibly direction from the benchmark return for the same period. Investors should monitor their leveraged and inverse funds’ holdings to ensure that they are consistent with their strategies, as frequently as daily.
The effects of compounding may cause the longer-term correlation of the Fund to its benchmark to diminish. The apparent discrepancy between the leveraged and unleveraged indices is the result of compounding, which is described briefly on page 6 of this report.
The Fund may invest in certain of the underlying series of Guggenheim Funds Trust and Guggenheim Strategy Funds Trust, including Guggenheim Ultra Short Duration, Guggenheim Strategy Fund II and Guggenheim Strategy Fund III (collectively, the “Short Term Investment Vehicles”), each of which are open-end management investment companies managed by Guggenheim Investments. The Short Term Investment Vehicles, which launched on March 11, 2014, are offered as short term investment options only to mutual funds, trusts, and other accounts managed by Guggenheim Investments and/or its affiliates, and are not available to the public, with the exception of Guggenheim Ultra Short Duration Fund, which is available to the public. Guggenheim Strategy Fund II and Guggenheim Strategy Fund III do not charge an investment management fee. Guggenheim Ultra Short Duration Fund charges an investment management fee but the Fund’s adviser has agreed to waive fees to the extent necessary to offset the proportionate share of any management fee paid by the Fund with respect to its investment in Guggenheim Ultra Short Duration Fund. For the one-year period ended March 31, 2021, investment in the Short Term Investment Vehicles benefited Fund performance.
Performance displayed represents past performance, which is no guarantee of future results.
138 | THE RYDEX FUNDS ANNUAL REPORT | |
PERFORMANCE REPORT AND FUND PROFILE (Unaudited)(continued) | March 31, 2021 |
Holdings Diversification (Market Exposure as % of Net Assets)
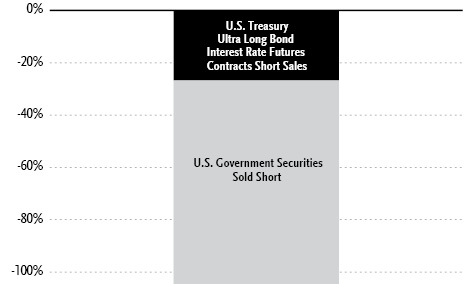
“Holdings Diversification (Market Exposure as % of Net Assets)” excludes any temporary cash investments, investments in Guggenheim Strategy Funds Trust mutual funds, or investments in Guggenheim Ultra Short Duration Fund. Investments in those Funds do not provide “market exposure” to meet the Fund’s investment objective, but will significantly increase the portfolio’s exposure to certain other asset categories (and their associated risks), which may cause the Fund to deviate from its principal investment strategy, including: (i) high yield, high risk debt securities rated below the top four long-term rating categories by a nationally recognized statistical rating organization (also known as “junk bonds”); (ii) securities issued by the U.S. government or its agencies and instrumentalities; (iii) CLOs and similar investments; and (iv) other short-term fixed income securities.
Inception Dates: |
Investor Class | March 3, 1995 |
A-Class | March 31, 2004 |
C-Class | March 28, 2001 |
H-Class | September 18, 2014 |
The Fund invests principally in short sales and derivative investments such as futures contracts.
Largest Holdings (% of Total Net Assets) |
Guggenheim Ultra Short Duration Fund — Institutional Class | 10.4% |
Guggenheim Strategy Fund II | 10.4% |
Total | 20.8% |
| | |
“Largest Holdings” excludes any temporary cash or derivative investments. |
| | THE RYDEX FUNDS ANNUAL REPORT | 139 |
PERFORMANCE REPORT AND FUND PROFILE (Unaudited)(concluded) | March 31, 2021 |
Cumulative Fund Performance*

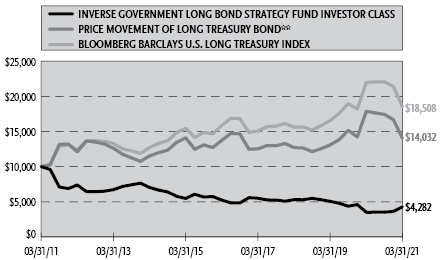
Average Annual Returns*
Periods Ended March 31, 2021
| 1 Year | 5 Year | 10 Year |
Investor Class Shares | 22.19% | (3.96%) | (8.13%) |
A-Class Shares | 21.95% | (4.19%) | (8.36%) |
A-Class Shares with sales charge‡ | 16.17% | (5.12%) | (8.81%) |
C-Class Shares | 21.00% | (4.91%) | (9.04%) |
C-Class Shares with CDSC§ | 20.00% | (4.91%) | (9.04%) |
Bloomberg Barclays U.S. Long Treasury Index | (15.80%) | 3.13% | 6.35% |
Price Movement of Long Treasury Bond** | (21.49%) | 0.42% | 3.45% |
| 1 Year | 5 Year | Since
Inception
(09/18/14) |
H-Class Shares | 22.18% | (4.12%) | (6.57%) |
Bloomberg Barclays U.S. Long Treasury Index | (15.80%) | 3.13% | 5.15% |
Price Movement of Long Treasury Bond** | (21.49%) | 0.42% | 2.44% |
* | The performance data above represents past performance that is not predictive of future results. The investment return and principal value of an investment in the Fund will fluctuate so that an investor’s shares, when redeemed, may be worth more or less than their original cost. Returns are historical and include changes in principal and reinvested dividends and capital gains and do not reflect the effect of taxes. The Bloomberg Barclays U.S. Long Treasury Index and the Price Movement of Long Treasury Bond are unmanaged indices and, unlike the Fund, have no management fees or operating expenses to reduce their reported returns. The graphs are based on Investor Class shares and A-Class shares only; performance for C-Class shares and H-Class shares will vary due to differences in fee structures. |
** | Does not reflect any interest. |
‡ | Fund returns are calculated using the maximum sales charge of 4.75%. |
§ | Fund returns include a CDSC of 1% if redeemed within 12 months of purchase. |
140 | THE RYDEX FUNDS ANNUAL REPORT | |
SCHEDULE OF INVESTMENTS | March 31, 2021 |
INVERSE GOVERNMENT LONG BOND STRATEGY FUND | |
| | Shares | | | Value | |
MUTUAL FUNDS† - 20.8% |
Guggenheim Ultra Short Duration Fund — Institutional Class1 | | | 528,512 | | | $ | 5,263,977 | |
Guggenheim Strategy Fund II1 | | | 210,588 | | | | 5,260,486 | |
Total Mutual Funds | | | | |
(Cost $10,470,929) | | | | | | | 10,524,463 | |
| | | | | | | | | |
| | | Face
Amount | | | | | |
FEDERAL AGENCY NOTES†† - 35.0% |
Federal Farm Credit Bank |
0.14% (1 Month USD LIBOR + 0.03%, Rate Floor: 0.00%) due 12/29/212 | | $ | 3,500,000 | | | | 3,501,621 | |
0.40% (U.S. Prime Rate - 2.85%, Rate Floor: 0.00%) due 08/30/222 | | | 3,000,000 | | | | 3,011,387 | |
0.23% due 06/09/22 | | | 2,500,000 | | | | 2,500,566 | |
0.44% (U.S. Prime Rate - 2.81%, Rate Floor: 0.00%) due 05/20/222 | | | 2,220,000 | | | | 2,228,932 | |
3.78% due 08/02/28 | | | 2,000,000 | | | | 2,024,076 | |
Farmer Mac |
0.10% (3 Month USD LIBOR - 0.10%, Rate Floor: 0.00%) due 08/03/212 | | | 2,000,000 | | | | 2,000,147 | |
Freddie Mac |
0.32% due 10/20/22 | | | 1,775,000 | | | | 1,775,583 | |
0.15% (U.S. Secured Overnight Financing Rate + 0.14%, Rate Floor: 0.00%) due 12/10/212 | | | 140,000 | | | | 140,066 | |
Fannie Mae |
0.18% (U.S. Secured Overnight Financing Rate + 0.17%, Rate Floor: 0.00%) due 03/11/222 | | | 100,000 | | | | 100,133 | |
0.18% (U.S. Secured Overnight Financing Rate + 0.17%, Rate Floor: 0.00%) due 03/09/222 | | | 100,000 | | | | 100,128 | |
0.16% (U.S. Secured Overnight Financing Rate + 0.15%, Rate Floor: 0.00%) due 12/10/212 | | | 100,000 | | | | 100,080 | |
0.15% (U.S. Secured Overnight Financing Rate + 0.14%, Rate Floor: 0.00%) due 09/10/212 | | | 100,000 | | | | 100,042 | |
0.16% (U.S. Secured Overnight Financing Rate + 0.15%, Rate Floor: 0.00%) due 12/09/212 | | | 25,000 | | | | 25,014 | |
Federal Home Loan Bank |
0.13% (U.S. Secured Overnight Financing Rate + 0.12%, Rate Floor: 0.00%) due 02/10/222 | | | 100,000 | | | | 100,070 | |
Total Federal Agency Notes | | | | |
(Cost $17,686,873) | | | | | | | 17,707,845 | |
FEDERAL AGENCY DISCOUNT NOTES†† - 23.1% |
Federal Home Loan Bank |
0.01% due 05/14/213 | | | 7,000,000 | | | | 6,999,941 | |
0.01% due 04/0/213 | | | 700,000 | | | | 699,995 | |
0.01% due 04/06/213 | | | 4,000,000 | | | | 3,999,997 | |
Total Federal Agency Discount Notes | | | | |
(Cost $11,699,933) | | | | | | | 11,699,933 | |
| | | | | | | | | |
U.S. TREASURY BILLS†† - 2.0% |
U.S. Treasury Bills |
0.01% due 04/22/213,4 | | | 1,049,000 | | | | 1,048,993 | |
Total U.S. Treasury Bills | | | | |
(Cost $1,048,991) | | | | | | | 1,048,993 | |
| | | | | | | | | |
REPURCHASE AGREEMENTS†† - 87.2% |
Individual Repurchase Agreements6 | | | | | | | | |
Mizuho Securities USA LLC
issued 03/31/21 at (0.25)%
due 04/01/21 (secured by a U.S.
Treasury Bond, at a rate of 1.88%
and maturing 02/15/51 as collateral,
with a value of $25,760,635) to
be repurchased at $25,255,349 | | | 25,255,525 | | | | 25,255,525 | |
Barclays Capital, Inc.
issued 03/31/21 at (0.25)%
due 04/01/21 (secured by a
U.S. Treasury Bond, at a rate of 1.88%
and maturing 02/15/51 as collateral,
with a value of $13,138,492) to
be repurchased at $12,880,786 | | | 12,880,875 | | | | 12,880,875 | |
Joint Repurchase Agreements5 | | | | | | | | |
J.P. Morgan Securities LLC
issued 03/31/21 at 0.01%
due 04/01/21 | | | 3,220,978 | | | | 3,220,978 | |
Barclays Capital, Inc.
issued 03/31/21 at 0.01%
due 04/01/21 | | | 1,464,413 | | | | 1,464,413 | |
BofA Securities, Inc.
issued 03/31/21 at 0.01%
due 04/01/21 | | | 1,336,506 | | | | 1,336,506 | |
Total Repurchase Agreements | | | | |
(Cost $44,158,297) | | | | | | | 44,158,297 | |
| | | | | | | | | |
Total Investments - 168.1% | | | | |
(Cost $85,065,023) | | $ | 85,139,531 | |
| | | | | | | | | |
U.S. Government Securities Sold Short†† - (78.0)% |
U.S. Treasury Bonds |
1.88% due 02/15/51 | | | 44,500,000 | | | | (39,500,703 | ) |
| | | | | | | | | |
Total U.S. Government Securities Sold Short | | | | |
(Proceeds $41,970,260) | | $ | (39,500,703 | ) |
Other Assets & Liabilities, net - 9.9% | | | 4,994,190 | |
Total Net Assets - 100.0% | | $ | 50,633,018 | |
SEE NOTES TO FINANCIAL STATEMENTS. | THE RYDEX FUNDS ANNUAL REPORT | 141 |
SCHEDULE OF INVESTMENTS (continued) | March 31, 2021 |
INVERSE GOVERNMENT LONG BOND STRATEGY FUND | |
Futures Contracts |
Description | | Number of
Contracts | | | Expiration
Date | | | Notional
Amount | | | Value and
Unrealized
Appreciation** | |
Interest Rate Futures Contracts Sold Short† |
U.S. Treasury Ultra Long Bond Futures Contracts | | | 74 | | | | Jun 2021 | | | $ | 13,470,313 | | | $ | 328,417 | |
** | Includes cumulative appreciation (depreciation). Variation margin is reported within the Statement of Assets and Liabilities. |
† | Value determined based on Level 1 inputs — See Note 4. |
†† | Value determined based on Level 2 inputs — See Note 4. |
1 | Affiliated issuer. |
2 | Variable rate security. Rate indicated is the rate effective at March 31, 2021. In some instances, the effective rate is limited by a minimum rate floor or a maximum rate cap established by the issuer. The settlement status of a position may also impact the effective rate indicated. In some cases, a position may be unsettled at period end and may not have a stated effective rate. In instances where multiple underlying reference rates and spread amounts are shown, the effective rate is based on a weighted average. |
3 | Rate indicated is the effective yield at the time of purchase. |
4 | All or a portion of this security is pledged as futures collateral at March 31, 2021. |
5 | Repurchase Agreements — See Note 6. |
6 | All or a portion of this security is pledged as short security collateral at March 31, 2021. |
| | LIBOR — London Interbank Offered Rate |
| | |
| | See Sector Classification in Other Information section. |
The following table summarizes the inputs used to value the Fund’s investments at March 31, 2021 (See Note 4 in the Notes to Financial Statements):
Investments in Securities (Assets) | | Level 1
Quoted
Prices | | | Level 2
Significant
Observable
Inputs | | | Level 3
Significant
Unobservable
Inputs | | | Total | |
Mutual Funds | | $ | 10,524,463 | | | $ | — | | | $ | — | | | $ | 10,524,463 | |
Federal Agency Notes | | | — | | | | 17,707,845 | | | | — | | | | 17,707,845 | |
Federal Agency Discount Notes | | | — | | | | 11,699,933 | | | | — | | | | 11,699,933 | |
U.S. Treasury Bills | | | — | | | | 1,048,993 | | | | — | | | | 1,048,993 | |
Repurchase Agreements | | | — | | | | 44,158,297 | | | | — | | | | 44,158,297 | |
Interest Rate Futures Contracts** | | | 328,417 | | | | — | | | | — | | | | 328,417 | |
Total Assets | | $ | 10,852,880 | | | $ | 74,615,068 | | | $ | — | | | $ | 85,467,948 | |
Investments in Securities (Liabilities) | | Level 1
Quoted
Prices | | | Level 2
Significant
Observable
Inputs | | | Level 3
Significant
Unobservable
Inputs | | | Total | |
U.S. Government Securities | | $ | — | | | $ | 39,500,703 | | | $ | — | | | $ | 39,500,703 | |
** | This derivative is reported as unrealized appreciation/depreciation at period end. |
142 | THE RYDEX FUNDS ANNUAL REPORT | SEE NOTES TO FINANCIAL STATEMENTS. |
SCHEDULE OF INVESTMENTS (concluded) | March 31, 2021 |
INVERSE GOVERNMENT LONG BOND STRATEGY FUND | |
Affiliated Transactions
Investments representing 5% or more of the outstanding voting shares of a company, or control of or by, or common control under Guggenheim Investments (“GI”), result in that company being considered an affiliated issuer, as defined in the 1940 Act.
The Fund may invest in certain of the underlying series of Guggenheim Strategy Funds Trust, including Guggenheim Strategy Fund II and Guggenheim Strategy Fund III, (collectively, the “Short Term Investment Vehicles”), each of which are open-end management investment companies managed by GI. The Short Term Investment Vehicles, which launched on March 11, 2014, are offered as short term investment options only to mutual funds, trusts, and other accounts managed by GI and/or its affiliates, and are not available to the public. The Short Term Investment Vehicles pay no investment management fees. The Short Term Investment Vehicles’ annual report on Form N-CSR dated September 30, 2020, is available publicly or upon request. This information is available from the EDGAR database on the SEC’s website at https://www.sec.gov/Archives/edgar/data/1601445/000182126820000133/gug81042-ncsr.htm.
Transactions during the year ended March 31, 2021, in which the company is an affiliated issuer, were as follows:
Security Name | | Value
03/31/20 | | | Additions | | | Reductions | | | Realized
Gain (Loss) | | | Change in
Unrealized
Appreciation
(Depreciation) | | | Value
03/31/21 | | | Shares
03/31/21 | | | Investment
Income | |
Mutual Funds | | | | | | | | | | | | | | | | | | | | | | | | | | | | | | | | |
Guggenheim Strategy Fund II | | $ | 3,812,960 | | | $ | 1,300,000 | | | $ | — | | | $ | — | | | $ | 147,526 | | | $ | 5,260,486 | | | | 210,588 | | | $ | 71,786 | |
Guggenheim Ultra Short Duration Fund — Institutional Class | | | 3,399,177 | | | | 1,800,001 | | | | — | | | | — | | | | 64,799 | | | | 5,263,977 | | | | 528,512 | | | | 44,498 | |
| | | $ | 7,212,137 | | | $ | 3,100,001 | | | $ | — | | | $ | — | | | $ | 212,325 | | | $ | 10,524,463 | | | | | | | $ | 116,284 | |
SEE NOTES TO FINANCIAL STATEMENTS. | THE RYDEX FUNDS ANNUAL REPORT | 143 |
INVERSE GOVERNMENT LONG BOND STRATEGY FUND | |
STATEMENT OF ASSETS AND LIABILITIES |
March 31, 2021 |
Assets: |
Investments in unaffiliated issuers, at value (cost $30,435,797) | | $ | 30,456,771 | |
Investments in affiliated issuers, at value (cost $10,470,929) | | | 10,524,463 | |
Repurchase agreements, at value (cost $44,158,297) | | | 44,158,297 | |
Receivables: |
Fund shares sold | | | 4,379,353 | |
Securities sold | | | 887,656 | |
Interest | | | 20,145 | |
Variation margin on futures contracts | | | 15,175 | |
Dividends | | | 10,298 | |
Total assets | | | 90,452,158 | |
| | | | | |
Liabilities: |
Securities sold short, at value (proceeds $(41,970,260) | | | 39,500,703 | |
Payable for: |
Interest payable on short sales | | | 103,721 | |
Management fees | | | 65,568 | |
Transfer agent and administrative fees | | | 19,917 | |
Fund shares redeemed | | | 9,939 | |
Portfolio accounting fees | | | 7,404 | |
Distribution and service fees | | | 3,897 | |
Trustees’ fees* | | | 1,521 | |
Miscellaneous | | | 106,470 | |
Total liabilities | | | 39,819,140 | |
Commitments and contingent liabilities (Note 12) | | | — | |
Net assets | | $ | 50,633,018 | |
| | | | | |
Net assets consist of: |
Paid in capital | | $ | 307,532,554 | |
Total distributable earnings (loss) | | | (256,899,536 | ) |
Net assets | | $ | 50,633,018 | |
| | | | | |
Investor Class: |
Net assets | | $ | 36,863,446 | |
Capital shares outstanding | | | 264,221 | |
Net asset value per share | | $ | 139.52 | |
| | | | | |
A-Class: |
Net assets | | $ | 4,798,043 | |
Capital shares outstanding | | | 36,039 | |
Net asset value per share | | $ | 133.13 | |
Maximum offering price per share (Net asset value divided by 95.25%) | | $ | 139.77 | |
| | | | | |
C-Class: |
Net assets | | $ | 1,499,691 | |
Capital shares outstanding | | | 13,152 | |
Net asset value per share | | $ | 114.03 | |
| | | | | |
H-Class: |
Net assets | | $ | 7,471,838 | |
Capital shares outstanding | | | 55,887 | |
Net asset value per share | | $ | 133.70 | |
* | Relates to Trustees not deemed “interested persons” within the meaning of Section 2(a)(19) of the 1940 Act. |
144 | THE RYDEX FUNDS ANNUAL REPORT | SEE NOTES TO FINANCIAL STATEMENTS. |
INVERSE GOVERNMENT LONG BOND STRATEGY FUND | |
STATEMENT OF OPERATIONS |
Year Ended March 31, 2021 |
Investment Income: |
Dividends from securities of affiliated issuers | | $ | 116,284 | |
Interest | | | 29,300 | |
Total investment income | | | 145,584 | |
| | | | | |
Expenses: |
Management fees | | | 462,376 | |
Distribution and service fees: |
A-Class | | | 10,414 | |
C-Class | | | 18,438 | |
H-Class | | | 18,852 | |
Transfer agent and administrative fees | | | 143,411 | |
Short interest expense | | | 642,115 | |
Portfolio accounting fees | | | 51,382 | |
Professional fees | | | 20,938 | |
Trustees’ fees* | | | 9,684 | |
Custodian fees | | | 7,339 | |
Miscellaneous | | | 68,198 | |
Total expenses | | | 1,453,147 | |
Less: |
Expenses waived by Adviser | | | (9,762 | ) |
Net expenses | | | 1,443,385 | |
Net investment loss | | | (1,297,801 | ) |
| | | | | |
Net Realized and Unrealized Gain (Loss): |
Net realized gain (loss) on: |
Investments | | $ | 30,271 | |
Investments sold short | | | 4,587,021 | |
Futures contracts | | | 2,288,042 | |
Net realized gain | | | 6,905,334 | |
Net change in unrealized appreciation (depreciation) on: |
Investments in unaffiliated issuers | | | (10,775 | ) |
Investments in affiliated issuers | | | 212,325 | |
Investments sold short | | | 4,045,660 | |
Futures contracts | | | 1,409,965 | |
Net change in unrealized appreciation (depreciation) | | | 5,657,175 | |
Net realized and unrealized gain | | | 12,562,509 | |
Net increase in net assets resulting from operations | | $ | 11,264,708 | |
* | Relates to Trustees not deemed “interested persons” within the meaning of Section 2(a)(19) of the 1940 Act. |
SEE NOTES TO FINANCIAL STATEMENTS. | THE RYDEX FUNDS ANNUAL REPORT | 145 |
INVERSE GOVERNMENT LONG BOND STRATEGY FUND | |
STATEMENTS OF CHANGES IN NET ASSETS |
| | Year Ended
March 31,
2021 | | | Year Ended
March 31,
2020 | |
Increase (Decrease) in Net Assets from Operations: | | | | | | | | |
Net investment income (loss) | | $ | (1,297,801 | ) | | $ | 136,337 | |
Net realized gain (loss) on investments | | | 6,905,334 | | | | (14,164,556 | ) |
Net change in unrealized appreciation (depreciation) on investments | | | 5,657,175 | | | | (1,003,492 | ) |
Net increase (decrease) in net assets resulting from operations | | | 11,264,708 | | | | (15,031,711 | ) |
| | | | | | | | | |
Distributions to shareholders: | | | | | | | | |
Investor Class | | | (56,720 | ) | | | — | |
A-Class | | | (14,821 | ) | | | — | |
C-Class | | | (6,967 | ) | | | — | |
H-Class | | | (44,328 | ) | | | — | |
Total distributions to shareholders | | | (122,836 | ) | | | — | |
| | | | | | | | | |
Capital share transactions: | | | | | | | | |
Proceeds from sale of shares | | | | | | | | |
Investor Class | | | 997,313,292 | | | | 196,858,764 | |
A-Class | | | 916,083 | | | | 1,089,420 | |
C-Class | | | 301,809 | | | | 286,088 | |
H-Class | | | 319,883,148 | | | | 268,283,102 | |
Distributions reinvested | | | | | | | | |
Investor Class | | | 52,751 | | | | — | |
A-Class | | | 13,927 | | | | — | |
C-Class | | | 6,457 | | | | — | |
H-Class | | | 44,310 | | | | — | |
Cost of shares redeemed | | | | | | | | |
Investor Class | | | (990,204,987 | ) | | | (209,131,964 | ) |
A-Class | | | (1,748,207 | ) | | | (5,068,402 | ) |
C-Class | | | (1,576,934 | ) | | | (3,361,315 | ) |
H-Class | | | (319,678,304 | ) | | | (270,810,021 | ) |
Net increase (decrease) from capital share transactions | | | 5,323,345 | | | | (21,854,328 | ) |
Net increase (decrease) in net assets | | | 16,465,217 | | | | (36,886,039 | ) |
| | | | | | | | | |
Net assets: | | | | | | | | |
Beginning of year | | | 34,167,801 | | | | 71,053,840 | |
End of year | | $ | 50,633,018 | | | $ | 34,167,801 | |
| | | | | | | | | |
Capital share activity:* | | | | | | | | |
Shares sold | | | | | | | | |
Investor Class | | | 8,356,273 | | | | 1,263,769 | |
A-Class | | | 7,562 | | | | 7,642 | |
C-Class | | | 2,878 | | | | 2,490 | |
H-Class | | | 2,875,315 | | | | 1,761,507 | |
Shares issued from reinvestment of distributions | | | | | | | | |
Investor Class | | | 440 | | | | — | |
A-Class | | | 122 | | | | — | |
C-Class | | | 66 | | | | — | |
H-Class | | | 386 | | | | — | |
Shares redeemed | | | | | | | | |
Investor Class | | | (8,275,612 | ) | | | (1,341,454 | ) |
A-Class | | | (15,730 | ) | | | (35,469 | ) |
C-Class | | | (15,918 | ) | | | (26,633 | ) |
H-Class | | | (2,873,346 | ) | | | (1,768,085 | ) |
Net increase (decrease) in shares | | | 62,436 | | | | (136,233 | ) |
* | Capital share activity for the year ended March 31, 2020, has been restated to reflect a 1:5 reverse share split effective August 17, 2020 — See Note 11. |
146 | THE RYDEX FUNDS ANNUAL REPORT | SEE NOTES TO FINANCIAL STATEMENTS. |
INVERSE GOVERNMENT LONG BOND STRATEGY FUND | |
This table is presented to show selected data for a share outstanding throughout each period and to assist shareholders in evaluating a Fund’s performance for the periods presented.
Investor Class | | Year Ended
March 31,
2021 | | | Year Ended
March 31,
2020f | | | Year Ended
March 31,
2019f | | | Year Ended
March 29,
2018f | | | Year Ended
March 31,
2017f | |
Per Share Data |
Net asset value, beginning of period | | $ | 114.58 | | | $ | 165.45 | | | $ | 173.19 | | | $ | 180.08 | | | $ | 171.34 | |
Income (loss) from investment operations: |
Net investment income (loss)a | | | (1.30 | ) | | | .60 | | | | (.65 | ) | | | (2.80 | ) | | | (4.40 | ) |
Net gain (loss) on investments (realized and unrealized) | | | 26.68 | | | | (51.47 | ) | | | (7.09 | ) | | | (4.09 | ) | | | 13.14 | |
Total from investment operations | | | 25.38 | | | | (50.87 | ) | | | (7.74 | ) | | | (6.89 | ) | | | 8.74 | |
Less distributions from: |
Net investment income | | | (.44 | ) | | | — | | | | — | | | | — | | | | — | |
Total distributions | | | (.44 | ) | | | — | | | | — | | | | — | | | | — | |
Net asset value, end of period | | $ | 139.52 | | | $ | 114.58 | | | $ | 165.45 | | | $ | 173.19 | | | $ | 180.08 | |
|
Total Return | | | 22.19 | % | | | (30.73 | %) | | | (4.47 | %) | | | (3.83 | %) | | | 5.08 | % |
Ratios/Supplemental Data |
Net assets, end of period (in thousands) | | $ | 36,863 | | | $ | 20,983 | | | $ | 43,149 | | | $ | 78,110 | | | $ | 84,123 | |
Ratios to average net assets: |
Net investment income (loss) | | | (2.46 | %) | | | 0.40 | % | | | (0.37 | %) | | | (1.63 | %) | | | (2.59 | %) |
Total expensesb | | | 2.75 | % | | | 2.91 | % | | | 4.12 | % | | | 3.71 | % | | | 3.38 | % |
Net expensesd,e | | | 2.73 | % | | | 2.89 | % | | | 4.12 | % | | | 3.71 | % | | | 3.38 | % |
Portfolio turnover rate | | | 2,159 | % | | | 864 | % | | | 603 | % | | | 908 | % | | | 1,436 | % |
A-Class | | Year Ended
March 31,
2021 | | | Year Ended
March 31,
2020f | | | Year Ended
March 31,
2019f | | | Year Ended
March 29,
2018f | | | Year Ended
March 31,
2017f | |
Per Share Data |
Net asset value, beginning of period | | $ | 109.61 | | | $ | 158.62 | | | $ | 166.49 | | | $ | 173.55 | | | $ | 165.55 | |
Income (loss) from investment operations: |
Net investment income (loss)a | | | (1.09 | ) | | | .20 | | | | (.95 | ) | | | (3.15 | ) | | | (4.70 | ) |
Net gain (loss) on investments (realized and unrealized) | | | 25.05 | | | | (49.21 | ) | | | (6.92 | ) | | | (3.91 | ) | | | 12.70 | |
Total from investment operations | | | 23.96 | | | | (49.01 | ) | | | (7.87 | ) | | | (7.06 | ) | | | 8.00 | |
Less distributions from: |
Net investment income | | | (.44 | ) | | | — | | | | — | | | | — | | | | — | |
Total distributions | | | (.44 | ) | | | — | | | | — | | | | — | | | | — | |
Net asset value, end of period | | $ | 133.13 | | | $ | 109.61 | | | $ | 158.62 | | | $ | 166.49 | | | $ | 173.55 | |
|
Total Returnc | | | 21.95 | % | | | (30.90 | %) | | | (4.74 | %) | | | (4.06 | %) | | | 4.83 | % |
Ratios/Supplemental Data |
Net assets, end of period (in thousands) | | $ | 4,798 | | | $ | 4,832 | | | $ | 11,407 | | | $ | 14,455 | | | $ | 18,678 | |
Ratios to average net assets: |
Net investment income (loss) | | | (2.59 | %) | | | 0.15 | % | | | (0.57 | %) | | | (1.90 | %) | | | (2.85 | %) |
Total expensesb | | | 2.97 | % | | | 3.17 | % | | | 4.38 | % | | | 3.97 | % | | | 3.67 | % |
Net expensesd,e | | | 2.94 | % | | | 3.15 | % | | | 4.37 | % | | | 3.97 | % | | | 3.67 | % |
Portfolio turnover rate | | | 2,159 | % | | | 864 | % | | | 603 | % | | | 908 | % | | | 1,436 | % |
SEE NOTES TO FINANCIAL STATEMENTS. | THE RYDEX FUNDS ANNUAL REPORT | 147 |
INVERSE GOVERNMENT LONG BOND STRATEGY FUND | |
FINANCIAL HIGHLIGHTS (continued) |
This table is presented to show selected data for a share outstanding throughout each period and to assist shareholders in evaluating a Fund’s performance for the periods presented.
C-Class | | Year Ended
March 31,
2021 | | | Year Ended
March 31,
2020f | | | Year Ended
March 31,
2019f | | | Year Ended
March 29,
2018f | | | Year Ended
March 31,
2017f | |
Per Share Data |
Net asset value, beginning of period | | $ | 94.64 | | | $ | 138.00 | | | $ | 145.93 | | | $ | 153.27 | | | $ | 147.30 | |
Income (loss) from investment operations: |
Net investment income (loss)a | | | (1.11 | ) | | | (.75 | ) | | | (2.15 | ) | | | (3.85 | ) | | | (5.25 | ) |
Net gain (loss) on investments (realized and unrealized) | | | 20.94 | | | | (42.61 | ) | | | (5.78 | ) | | | (3.49 | ) | | | 11.22 | |
Total from investment operations | | | 19.83 | | | | (43.36 | ) | | | (7.93 | ) | | | (7.34 | ) | | | 5.97 | |
Less distributions from: |
Net investment income | | | (.44 | ) | | | — | | | | — | | | | — | | | | — | |
Total distributions | | | (.44 | ) | | | — | | | | — | | | | — | | | | — | |
Net asset value, end of period | | $ | 114.03 | | | $ | 94.64 | | | $ | 138.00 | | | $ | 145.93 | | | $ | 153.27 | |
|
Total Returnc | | | 21.00 | % | | | (31.41 | %) | | | (5.45 | %) | | | (4.76 | %) | | | 4.04 | % |
Ratios/Supplemental Data |
Net assets, end of period (in thousands) | | $ | 1,500 | | | $ | 2,472 | | | $ | 6,937 | | | $ | 18,296 | | | $ | 23,343 | |
Ratios to average net assets: |
Net investment income (loss) | | | (3.32 | %) | | | (0.59 | %) | | | (1.44 | %) | | | (2.63 | %) | | | (3.59 | %) |
Total expensesb | | | 3.70 | % | | | 3.93 | % | | | 5.14 | % | | | 4.71 | % | | | 4.41 | % |
Net expensesd,e | | | 3.68 | % | | | 3.91 | % | | | 5.13 | % | | | 4.71 | % | | | 4.41 | % |
Portfolio turnover rate | | | 2,159 | % | | | 864 | % | | | 603 | % | | | 908 | % | | | 1,436 | % |
148 | THE RYDEX FUNDS ANNUAL REPORT | SEE NOTES TO FINANCIAL STATEMENTS. |
INVERSE GOVERNMENT LONG BOND STRATEGY FUND | |
FINANCIAL HIGHLIGHTS (concluded) |
This table is presented to show selected data for a share outstanding throughout each period and to assist shareholders in evaluating a Fund’s performance for the periods presented.
H-Class | | Year Ended
March 31,
2021 | | | Year Ended
March 31,
2020f | | | Year Ended
March 31,
2019f | | | Year Ended
March 29,
2018f | | | Year Ended
March 31,
2017f | |
Per Share Data |
Net asset value, beginning of period | | $ | 109.85 | | | $ | 159.05 | | | $ | 166.92 | | | $ | 174.14 | | | $ | 165.60 | |
Income (loss) from investment operations: |
Net investment income (loss)a | | | (.98 | ) | | | .25 | | | | (1.00 | ) | | | (3.25 | ) | | | (4.60 | ) |
Net gain (loss) on investments (realized and unrealized) | | | 25.27 | | | | (49.45 | ) | | | (6.87 | ) | | | (3.97 | ) | | | 13.14 | |
Total from investment operations | | | 24.29 | | | | (49.20 | ) | | | (7.87 | ) | | | (7.22 | ) | | | 8.54 | |
Less distributions from: |
Net investment income | | | (.44 | ) | | | — | | | | — | | | | — | | | | — | |
Total distributions | | | (.44 | ) | | | — | | | | — | | | | — | | | | — | |
Net asset value, end of period | | $ | 133.70 | | | $ | 109.85 | | | $ | 159.05 | | | $ | 166.92 | | | $ | 174.14 | |
|
Total Return | | | 22.18 | % | | | (30.93 | %) | | | (4.70 | %) | | | (4.16 | %) | | | 5.13 | % |
Ratios/Supplemental Data |
Net assets, end of period (in thousands) | | $ | 7,472 | | | $ | 5,881 | | | $ | 9,561 | | | $ | 4,858 | | | $ | 43,784 | |
Ratios to average net assets: |
Net investment income (loss) | | | (2.62 | %) | | | 0.16 | % | | | (0.58 | %) | | | (1.94 | %) | | | (2.80 | %) |
Total expensesb | | | 2.94 | % | | | 3.30 | % | | | 4.37 | % | | | 4.00 | % | | | 3.60 | % |
Net expensesd,e | | | 2.92 | % | | | 3.28 | % | | | 4.36 | % | | | 4.00 | % | | | 3.60 | % |
Portfolio turnover rate | | | 2,159 | % | | | 872 | % | | | 603 | % | | | 908 | % | | | 1,436 | % |
a | Net investment income (loss) per share was computed using average shares outstanding throughout the period. |
b | Does not include expenses of the underlying funds in which the Fund invests. |
c | Total return does not reflect the impact of any applicable sales charges. |
d | Net expense information reflects the expense ratios after expense waivers and reimbursements, as applicable. |
e | Total expenses may include interest expense related to short sales. Excluding interest expense, the operating expense ratios for the years presented were as follows: |
| | | 03/31/21 | 03/31/20 | 03/31/19 | 03/29/18 | 03/31/17 |
| | Investor Class | 1.47% | 1.50% | 1.50% | 1.43% | 1.43% |
| | A-Class | 1.73% | 1.75% | 1.75% | 1.68% | 1.63% |
| | C-Class | 2.48% | 2.50% | 2.50% | 2.43% | 2.43% |
| | H-Class | 1.73% | 1.75% | 1.75% | 1.68% | 1.68% |
f | Reverse share split — Per share amounts for the periods presented through March 31, 2020 have been restated to reflect a 1:5 reverse share split effective August 17, 2020 — See Note 11. |
SEE NOTES TO FINANCIAL STATEMENTS. | THE RYDEX FUNDS ANNUAL REPORT | 149 |
PERFORMANCE REPORT AND FUND PROFILE (Unaudited) | March 31, 2021 |
HIGH YIELD STRATEGY FUND
OBJECTIVE: Seeks to provide investment results that correlate, before fees and expenses, to the performance of the high yield bond market.
For the one-year period ended March 31, 2021, High Yield Strategy Fund H-Class returned 12.87%. For comparison, the Bloomberg Barclays U.S. Corporate High Yield Index returned 23.72% for the same period.
The Fund primarily invests in credit default swaps to gain exposure similar to the high yield bond market. Credit default swaps are instruments which allow for the full or partial transfer of third party credit risk, with respect to a particular entity or entities, from one counterparty to the other. A buyer of credit default swaps is buying credit protection or mitigating credit risk. A seller of credit default swaps is selling credit protection or assuming credit risk. The Fund will normally be a seller of credit protection (assuming credit risk) as it seeks to gain exposure to the high yield bond market. In addition, the Fund may invest in bond futures for the purpose of managing duration risk. For cash management purposes, the Fund may invest in other fixed income securities and money market instruments.
The economy in 2020 experienced an abrupt and unprecedented decline in output, corporate leverage spiked, and default volume and negative rating migration were the worst in over a decade. In contrast, equity indexes touched new highs, corporate bond yields set record lows, and primary credit issuance saw record volumes. High-yield corporate bond spreads tightened over the period as investors gained confidence that the economy will eventually make a full recovery, owing in part to the vast amount of policy support that continues to buttress financial conditions.
It is hard to estimate the volume of defaults, restructurings and personal bankruptcies that global policy support helped prevent. Nevertheless, there was still $150 billion in total U.S. defaulted corporate debt, mostly in energy, but also in cable/satellite, retail, and services. Given that the peak-to-trough decline in U.S. economic activity was 3.8 times that of the last financial crisis, defaults could have been more than double were it not for the tidal wave of government liquidity that turned this shock into a V-shaped recovery.
Derivatives in the Fund are used to help provide exposure to the composition of the benchmark in the most efficient manner possible and not for hedging purposes. Derivatives performed as expected.
The Fund may invest in certain of the underlying series of Guggenheim Funds Trust and Guggenheim Strategy Funds Trust, including Guggenheim Ultra Short Duration, Guggenheim Strategy Fund II and Guggenheim Strategy Fund III (collectively, the “Short Term Investment Vehicles”), each of which are open-end management investment companies managed by Guggenheim Investments. The Short Term Investment Vehicles, which launched on March 11, 2014, are offered as short term investment options only to mutual funds, trusts, and other accounts managed by Guggenheim Investments and/or its affiliates, and are not available to the public, with the exception of Guggenheim Ultra Short Duration Fund, which is available to the public. Guggenheim Strategy Fund II and Guggenheim Strategy Fund III do not charge an investment management fee. Guggenheim Ultra Short Duration Fund charges an investment management fee but the Fund’s adviser has agreed to waive fees to the extent necessary to offset the proportionate share of any management fee paid by the Fund with respect to its investment in Guggenheim Ultra Short Duration Fund. For the one-year period ended March 31, 2021, investment in the Short Term Investment Vehicles benefited Fund performance.
Performance displayed represents past performance, which is no guarantee of future results.
150 | THE RYDEX FUNDS ANNUAL REPORT | |
PERFORMANCE REPORT AND FUND PROFILE (Unaudited)(continued) | March 31, 2021 |
Holdings Diversification (Market Exposure as % of Net Assets)

“Holdings Diversification (Market Exposure as % of Net Assets)” excludes any temporary cash investments, investments in Guggenheim Strategy Funds Trust mutual funds, or investments in Guggenheim Ultra Short Duration Fund. Investments in those Funds do not provide “market exposure” to meet the Fund’s investment objective, but will significantly increase the portfolio’s exposure to certain other asset categories (and their associated risks), which may cause the Fund to deviate from its principal investment strategy, including: (i) high yield, high risk debt securities rated below the top four long-term rating categories by a nationally recognized statistical rating organization (also known as “junk bonds”); (ii) securities issued by the U.S. government or its agencies and instrumentalities; (iii) CLOs and similar investments; and (iv) other short-term fixed income securities.
Inception Dates: |
A-Class | April 16, 2007 |
C-Class | April 16, 2007 |
H-Class | April 16, 2007 |
The Fund invests principally in derivative investments such as high yield credit default swap agreements and futures contracts.
Largest Holdings (% of Total Net Assets) |
Guggenheim Strategy Fund III | 10.9% |
Guggenheim Ultra Short Duration Fund — Institutional Class | 8.7% |
Guggenheim Strategy Fund II | 5.1% |
Total | 24.7% |
| | |
“ Largest Holdings” excludes any temporary cash or derivative investments. |
| | THE RYDEX FUNDS ANNUAL REPORT | 151 |
PERFORMANCE REPORT AND FUND PROFILE (Unaudited)(concluded) | March 31, 2021 |
Cumulative Fund Performance*
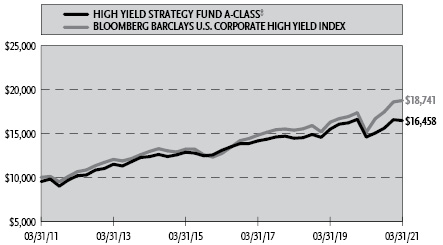
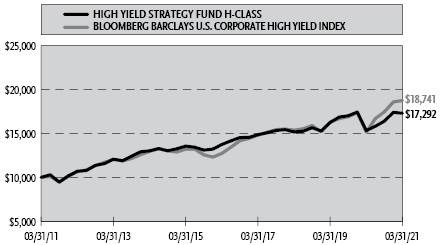
Average Annual Returns*
Periods Ended March 31, 2021
| 1 Year | 5 Year | 10 Year |
A- Class Shares | 12.81% | 4.71% | 5.62% |
A-Class Shares with sales charge‡ | 7.47% | 3.70% | 5.11% |
C-Class Shares | 11.97% | 3.94% | 4.82% |
C-Class Shares with CDSC§ | 10.97% | 3.94% | 4.82% |
H-Class Shares | 12.87% | 4.71% | 5.63% |
Bloomberg Barclays U.S. Corporate High Yield Index | 23.72% | 8.06% | 6.48% |
* | The performance data above represents past performance that is not predictive of future results. The investment return and principal value of an investment in the Fund will fluctuate so that an investor’s shares, when redeemed, may be worth more or less than their original cost. Returns are historical and include changes in principal and reinvested dividends and capital gains and do not reflect the effect of taxes. The Bloomberg Barclays U.S. Corporate High Yield Index is an unmanaged index and, unlike the Fund, has no management fees or operating expenses to reduce its reported return. The graphs are based on A-Class shares and H-Class shares only; performance for C-Class shares will vary due to differences in fee structures. |
‡ | Fund returns are calculated using the maximum sales charge of 4.75%. |
§ | Fund returns include a CDSC of 1% if redeemed within 12 months of purchase. |
152 | THE RYDEX FUNDS ANNUAL REPORT | |
SCHEDULE OF INVESTMENTS | March 31, 2021 |
HIGH YIELD STRATEGY FUND | |
| | Shares | | | Value | |
MUTUAL FUNDS† - 24.7% |
Guggenheim Strategy Fund III1 | | | 112,348 | | | $ | 2,824,433 | |
Guggenheim Ultra Short Duration Fund — Institutional Class1 | | | 227,842 | | | | 2,269,308 | |
Guggenheim Strategy Fund II1 | | | 53,173 | | | | 1,328,255 | |
Total Mutual Funds | | | | |
(Cost $6,316,655) | | | | | | | 6,421,996 | |
| | | | | | | | | |
| | | Face
Amount | | | | | |
FEDERAL AGENCY NOTES†† - 49.3% |
Federal Farm Credit Bank |
0.23% due 06/09/22 | | $ | 3,200,000 | | | | 3,200,724 | |
0.31% (3 Month U.S. Treasury Bill Rate + 0.29%, Rate Floor: 0.00%) due 04/11/222 | | | 2,500,000 | | | | 2,505,742 | |
0.14% (1 Month USD LIBOR + 0.03%, Rate Floor: 0.00%) due 12/29/212 | | | 2,000,000 | | | | 2,000,926 | |
0.28% (U.S. Prime Rate - 2.97%, Rate Floor: 0.00%) due 05/27/222 | | | 620,000 | | | | 620,802 | |
Fannie Mae |
2.50% due 04/13/21 | | | 3,487,000 | | | | 3,489,856 | |
Farmer Mac |
0.09% (3 Month USD LIBOR - 0.10%, Rate Floor: 0.00%) due 11/22/212 | | | 1,000,000 | | | | 1,000,018 | |
Total Federal Agency Notes | | | | |
(Cost $12,812,576) | | | | | | | 12,818,068 | |
U.S. TREASURY BILLS†† - 5.2% |
U.S. Treasury Bills |
0.01% due 04/22/213,4 | | | 1,346,000 | | | | 1,345,990 | |
Total U.S. Treasury Bills | | | | |
(Cost $1,345,988) | | | | | | | 1,345,990 | |
| | | | | | | | | |
REPURCHASE AGREEMENTS††,5 - 3.2% |
J.P. Morgan Securities LLC
issued 03/31/21 at 0.01%
due 04/01/216 | | | 445,308 | | | | 445,308 | |
Barclays Capital, Inc.
issued 03/31/21 at 0.01%
due 04/01/216 | | | 202,459 | | | | 202,459 | |
BofA Securities, Inc.
issued 03/31/21 at 0.01%
due 04/01/216 | | | 184,775 | | | | 184,775 | |
Total Repurchase Agreements | | | | |
(Cost $832,542) | | | | | | | 832,542 | |
| | | | | | | | | |
Total Investments - 82.4% | | | | |
(Cost $21,307,761) | | $ | 21,418,596 | |
Other Assets & Liabilities, net - 17.6% | | | 4,573,657 | |
Total Net Assets - 100.0% | | $ | 25,992,253 | |
Futures Contracts |
Description | | Number of
Contracts | | | Expiration
Date | | | Notional
Amount | | | Value and
Unrealized
Depreciation** | |
Interest Rate Futures Contracts Purchased† |
U.S. Treasury 5 Year Note Futures Contracts | | | 161 | | | | Jun 2021 | | | $ | 19,877,211 | | | $ | (168,134 | ) |
Centrally Cleared Credit Default Swap Agreements Protection Sold†† |
Counterparty | Exchange | Index | | Protection
Premium
Rate | | Payment
Frequency | | Maturity
Date | | | Notional
Amount | | | Value | | | Upfront
Premiums
Paid | | | Unrealized
Appreciation** | |
Goldman Sachs International | ICE | CDX.NA.HY.36.V1 | | | 5.00 | % | Quarterly | 06/20/26 | | $ | 13,800,000 | | | $ | 1,234,072 | | | $ | 1,167,028 | | | $ | 67,044 | |
Barclays Bank plc | ICE | CDX.NA.HY.36.V1 | | | 5.00 | % | Quarterly | 06/20/26 | | | 6,050,000 | | | | 541,024 | | | | 530,186 | | | | 10,838 | |
| | | | | | | | | | | | | | | | | | $ | 1,775,096 | | | $ | 1,697,214 | | | $ | 77,882 | |
SEE NOTES TO FINANCIAL STATEMENTS. | THE RYDEX FUNDS ANNUAL REPORT | 153 |
SCHEDULE OF INVESTMENTS (continued) | March 31, 2021 |
HIGH YIELD STRATEGY FUND | |
Total Return Swap Agreements |
Counterparty | Index | Financing
Rate Pay | Payment
Frequency | | Maturity
Date | | | Units | | | Notional
Amount | | | Value and
Unrealized
Appreciation
(Depreciation) | |
OTC Credit Index Swap Agreements†† |
Goldman Sachs International | iShares iBoxx $ High Yield Corporate Bond ETF | 0.43% (1 Week USD LIBOR + 0.35%) | At Maturity | | | 04/29/21 | | | | 9,924 | | | $ | 865,174 | | | $ | 2,084 | |
BNP Paribas | iShares iBoxx $ High Yield Corporate Bond ETF | 0.46% (1 Month USD LIBOR + 0.35%) | At Maturity | | | 04/08/21 | | | | 32,659 | | | | 2,847,254 | | | | (12,848 | ) |
BNP Paribas | SPDR Bloomberg Barclays High Yield Bond ETF | 0.51% (1 Month USD LIBOR + 0.40%) | At Maturity | | | 04/08/21 | | | | 25,578 | | | | 2,782,889 | | | | (13,773 | ) |
| | | | | | | | | | | | | | $ | 6,495,317 | | | $ | (24,537 | ) |
** | Includes cumulative appreciation (depreciation). Variation margin is reported within the Statement of Assets and Liabilities. |
† | Value determined based on Level 1 inputs — See Note 4. |
†† | Value determined based on Level 2 inputs — See Note 4. |
1 | Affiliated issuer. |
2 | Variable rate security. Rate indicated is the rate effective at March 31, 2021. In some instances, the effective rate is limited by a minimum rate floor or a maximum rate cap established by the issuer. The settlement status of a position may also impact the effective rate indicated. In some cases, a position may be unsettled at period end and may not have a stated effective rate. In instances where multiple underlying reference rates and spread amounts are shown, the effective rate is based on a weighted average. |
3 | All or a portion of this security is pledged as futures and credit default swap collateral at March 31, 2021. |
4 | Rate indicated is the effective yield at the time of purchase. |
5 | Repurchase Agreements — See Note 6. |
6 | All or a portion of this security is pledged as credit index swap collateral at March 31, 2021. |
| | CDX.NA.HY.36.V1 — Credit Default Swap North American High Yield Series 36 Index Version 1 |
| | ICE — Intercontinental Exchange |
| | LIBOR — London Interbank Offered Rate |
| | plc — Public Limited Company |
| | |
| | See Sector Classification in Other Information section. |
The following table summarizes the inputs used to value the Fund’s investments at March 31, 2021 (See Note 4 in the Notes to Financial Statements):
Investments in Securities (Assets) | | Level 1
Quoted
Prices | | | Level 2
Significant
Observable
Inputs | | | Level 3
Significant
Unobservable
Inputs | | | Total | |
Mutual Funds | | $ | 6,421,996 | | | $ | — | | | $ | — | | | $ | 6,421,996 | |
Federal Agency Notes | | | — | | | | 12,818,068 | | | | — | | | | 12,818,068 | |
U.S. Treasury Bills | | | — | | | | 1,345,990 | | | | — | | | | 1,345,990 | |
Repurchase Agreements | | | — | | | | 832,542 | | | | — | | | | 832,542 | |
Credit Default Swap Agreements** | | | — | | | | 77,882 | | | | — | | | | 77,882 | |
Credit Index Swap Agreements** | | | — | | | | 2,084 | | | | — | | | | 2,084 | |
Total Assets | | $ | 6,421,996 | | | $ | 15,076,566 | | | $ | — | | | $ | 21,498,562 | |
Investments in Securities (Liabilities) | | Level 1
Quoted
Prices | | | Level 2
Significant
Observable
Inputs | | | Level 3
Significant
Unobservable
Inputs | | | Total | |
Interest Rate Futures Contracts** | | $ | 168,134 | | | $ | — | | | $ | — | | | $ | 168,134 | |
Credit Index Swap Agreements** | | | — | | | | 26,621 | | | | — | | | | 26,621 | |
Total Liabilities | | $ | 168,134 | | | $ | 26,621 | | | $ | — | | | $ | 194,755 | |
** | This derivative is reported as unrealized appreciation/depreciation at period end. |
154 | THE RYDEX FUNDS ANNUAL REPORT | SEE NOTES TO FINANCIAL STATEMENTS. |
SCHEDULE OF INVESTMENTS (concluded) | March 31, 2021 |
HIGH YIELD STRATEGY FUND | |
Affiliated Transactions
Investments representing 5% or more of the outstanding voting shares of a company, or control of or by, or common control under Guggenheim Investments (“GI”), result in that company being considered an affiliated issuer, as defined in the 1940 Act.
The Fund may invest in certain of the underlying series of Guggenheim Strategy Funds Trust, including Guggenheim Strategy Fund II and Guggenheim Strategy Fund III, (collectively, the “Short Term Investment Vehicles”), each of which are open-end management investment companies managed by GI. The Short Term Investment Vehicles, which launched on March 11, 2014, are offered as short term investment options only to mutual funds, trusts, and other accounts managed by GI and/or its affiliates, and are not available to the public. The Short Term Investment Vehicles pay no investment management fees. The Short Term Investment Vehicles’ annual report on Form N-CSR dated September 30, 2020, is available publicly or upon request. This information is available from the EDGAR database on the SEC’s website at https://www.sec.gov/Archives/edgar/data/1601445/000182126820000133/gug81042-ncsr.htm.
Transactions during the year ended March 31, 2021, in which the company is an affiliated issuer, were as follows:
Security Name | | Value
03/31/20 | | | Additions | | | Reductions | | | Realized
Gain (Loss) | | | Change in
Unrealized
Appreciation
(Depreciation) | | | Value
03/31/21 | | | Shares
03/31/21 | | | Investment
Income | |
Mutual Funds | | | | | | | | | | | | | | | | | | | | | | | | | | | | | | | | |
Guggenheim Strategy Fund II | | $ | 692,308 | | | $ | 3,800,000 | | | $ | (3,225,000 | ) | | $ | 4,953 | | | $ | 55,994 | | | $ | 1,328,255 | | | | 53,173 | | | $ | 26,297 | |
Guggenheim Strategy Fund III | | | 2,704,221 | | | | — | | | | — | | | | — | | | | 120,212 | | | | 2,824,433 | | | | 112,348 | | | | 48,912 | |
Guggenheim Ultra Short Duration Fund — Institutional Class | | | 1,907,641 | | | | 6,800,000 | | | | (6,500,000 | ) | | | 4,772 | | | | 56,895 | | | | 2,269,308 | | | | 227,842 | | | | 37,990 | |
| | | $ | 5,304,170 | | | $ | 10,600,000 | | | $ | (9,725,000 | ) | | $ | 9,725 | | | $ | 233,101 | | | $ | 6,421,996 | | | | | | | $ | 113,199 | |
SEE NOTES TO FINANCIAL STATEMENTS. | THE RYDEX FUNDS ANNUAL REPORT | 155 |
STATEMENT OF ASSETS AND LIABILITIES |
March 31, 2021 |
Assets: |
Investments in unaffiliated issuers, at value (cost $14,158,564) | | $ | 14,164,058 | |
Investments in affiliated issuers, at value (cost $6,316,655) | | | 6,421,996 | |
Repurchase agreements, at value (cost $832,542) | | | 832,542 | |
Segregated cash with broker | | | 30,212 | |
Unamortized upfront premiums paid on credit default swap agreements | | | 1,697,214 | |
Unrealized appreciation on OTC swap agreements | | | 2,084 | |
Receivables: |
Fund shares sold | | | 4,369,427 | |
Variation margin on credit default swap agreements | | | 75,044 | |
Interest | | | 45,138 | |
Protection fees on credit default swap agreements | | | 22,569 | |
Dividends | | | 7,410 | |
Total assets | | | 27,667,694 | |
| | | | | |
Liabilities: |
Segregated cash due to broker | | | 1,186,515 | |
Unrealized depreciation on OTC swap agreements | | | 26,621 | |
Payable for: |
Securities purchased | | | 321,430 | |
Swap settlement | | | 40,130 | |
Fund shares redeemed | | | 22,126 | |
Management fees | | | 17,345 | |
Variation margin on futures contracts | | | 13,254 | |
Distribution and service fees | | | 7,340 | |
Transfer agent and administrative fees | | | 6,409 | |
Portfolio accounting fees | | | 2,383 | |
Trustees’ fees* | | | 449 | |
Miscellaneous | | | 31,439 | |
Total liabilities | | | 1,675,441 | |
Commitments and contingent liabilities (Note 12) | | | — | |
Net assets | | $ | 25,992,253 | |
| | | | | |
Net assets consist of: |
Paid in capital | | $ | 35,811,733 | |
Total distributable earnings (loss) | | | (9,819,480 | ) |
Net assets | | $ | 25,992,253 | |
| | | | | |
A-Class: |
Net assets | | $ | 4,020,512 | |
Capital shares outstanding | | | 32,795 | |
Net asset value per share | | $ | 122.60 | |
Maximum offering price per share (Net asset value divided by 95.25%) | | $ | 128.71 | |
| | | | | |
C-Class: |
Net assets | | $ | 2,136,439 | |
Capital shares outstanding | | | 20,307 | |
Net asset value per share | | $ | 105.21 | |
| | | | | |
H-Class: |
Net assets | | $ | 19,835,302 | |
Capital shares outstanding | | | 161,906 | |
Net asset value per share | | $ | 122.51 | |
* | Relates to Trustees not deemed “interested persons” within the meaning of Section 2(a)(19) of the 1940 Act. |
156 | THE RYDEX FUNDS ANNUAL REPORT | SEE NOTES TO FINANCIAL STATEMENTS. |
STATEMENT OF OPERATIONS |
Year Ended March 31, 2021 |
Investment Income: |
Dividends from securities of affiliated issuers | | $ | 113,199 | |
Interest | | | 44,570 | |
Total investment income | | | 157,769 | |
| | | | | |
Expenses: |
Management fees | | | 327,084 | |
Distribution and service fees: |
A-Class | | | 10,991 | |
C-Class | | | 20,464 | |
H-Class | | | 92,921 | |
Transfer agent and administrative fees | | | 122,626 | |
Portfolio accounting fees | | | 43,618 | |
Registration fees | | | 39,297 | |
Professional fees | | | 22,185 | |
Trustees’ fees* | | | 9,544 | |
Custodian fees | | | 6,414 | |
Miscellaneous | | | 22,292 | |
Total expenses | | | 717,436 | |
Less: |
Expenses waived by Adviser | | | (8,248 | ) |
Net expenses | | | 709,188 | |
Net investment loss | | | (551,419 | ) |
| | | | | |
Net Realized and Unrealized Gain (Loss): |
Net realized gain (loss) on: |
Investments in unaffiliated issuers | | $ | 2,350 | |
Investments in affiliated issuers | | | 9,725 | |
Swap agreements | | | (559,812 | ) |
Futures contracts | | | 274,116 | |
Net realized loss | | | (273,621 | ) |
Net change in unrealized appreciation (depreciation) on: |
Investments in unaffiliated issuers | | | 9,655 | |
Investments in affiliated issuers | | | 233,101 | |
Swap agreements | | | 438,167 | |
Futures contracts | | | (470,106 | ) |
Net change in unrealized appreciation (depreciation) | | | 210,817 | |
Net realized and unrealized loss | | | (62,804 | ) |
Net decrease in net assets resulting from operations | | $ | (614,223 | ) |
* | Relates to Trustees not deemed “interested persons” within the meaning of Section 2(a)(19) of the 1940 Act. |
SEE NOTES TO FINANCIAL STATEMENTS. | THE RYDEX FUNDS ANNUAL REPORT | 157 |
STATEMENTS OF CHANGES IN NET ASSETS |
| | Year Ended
March 31,
2021 | | | Year Ended
March 31,
2020 | |
Increase (Decrease) in Net Assets from Operations: | | | | | | | | |
Net investment income (loss) | | $ | (551,419 | ) | | $ | 493,714 | |
Net realized gain (loss) on investments | | | (273,621 | ) | | | 1,518,599 | |
Net change in unrealized appreciation (depreciation) on investments | | | 210,817 | | | | (1,798,543 | ) |
Net increase (decrease) in net assets resulting from operations | | | (614,223 | ) | | | 213,770 | |
| | | | | | | | | |
Distributions to shareholders: | | | | | | | | |
A-Class | | | — | | | | (196,039 | ) |
C-Class | | | — | | | | (45,921 | ) |
H-Class | | | — | | | | (3,642,315 | ) |
Total distributions to shareholders | | | — | | | | (3,884,275 | ) |
| | | | | | | | | |
Capital share transactions: | | | | | | | | |
Proceeds from sale of shares | | | | | | | | |
A-Class | | | 1,259,400 | | | | 6,892,359 | |
C-Class | | | 2,018,920 | | | | 1,043,362 | |
H-Class | | | 378,213,977 | | | | 285,721,192 | |
Distributions reinvested | | | | | | | | |
A-Class | | | — | | | | 182,416 | |
C-Class | | | — | | | | 40,065 | |
H-Class | | | — | | | | 3,613,386 | |
Cost of shares redeemed | | | | | | | | |
A-Class | | | (1,703,972 | ) | | | (10,370,325 | ) |
C-Class | | | (992,031 | ) | | | (1,586,654 | ) |
H-Class | | | (380,114,068 | ) | | | (364,232,406 | ) |
Net decrease from capital share transactions | | | (1,317,774 | ) | | | (78,696,605 | ) |
Net decrease in net assets | | | (1,931,997 | ) | | | (82,367,110 | ) |
| | | | | | | | | |
Net assets: | | | | | | | | |
Beginning of year | | | 27,924,250 | | | | 110,291,360 | |
End of year | | $ | 25,992,253 | | | $ | 27,924,250 | |
| | | | | | | | | |
Capital share activity:* | | | | | | | | |
Shares sold | | | | | | | | |
A-Class | | | 11,120 | | | | 56,141 | |
C-Class | | | 21,128 | | | | 9,667 | |
H-Class | | | 3,287,792 | | | | 2,315,105 | |
Shares issued from reinvestment of distributions | | | | | | | | |
A-Class | | | — | | | | 1,496 | |
C-Class | | | — | | | | 379 | |
H-Class | | | — | | | | 29,667 | |
Shares redeemed | | | | | | | | |
A-Class | | | (14,515 | ) | | | (84,787 | ) |
C-Class | | | (10,037 | ) | | | (14,843 | ) |
H-Class | | | (3,338,954 | ) | | | (2,972,658 | ) |
Net decrease in shares | | | (43,466 | ) | | | (659,833 | ) |
* | Capital share activity for the year ended March 31, 2020, has been restated to reflect a 1:5 reverse share split effective August 17, 2020 — See Note 11. |
158 | THE RYDEX FUNDS ANNUAL REPORT | SEE NOTES TO FINANCIAL STATEMENTS. |
This table is presented to show selected data for a share outstanding throughout each period and to assist shareholders in evaluating a Fund’s performance for the periods presented.
A-Class | | Year Ended
March 31,
2021 | | | Year Ended
March 31,
2020f | | | Year Ended
March 31,
2019f | | | Year Ended
March 29,
2018f | | | Year Ended
March 31,
2017f | |
Per Share Data |
Net asset value, beginning of period | | $ | 108.68 | | | $ | 120.48 | | | $ | 116.32 | | | $ | 123.71 | | | $ | 116.62 | |
Income (loss) from investment operations: |
Net investment income (loss)a | | | (.55 | ) | | | .70 | | | | .70 | | | | (.40 | ) | | | (1.00 | ) |
Net gain (loss) on investments (realized and unrealized) | | | 14.47 | e | | | (7.05 | ) | | | 7.41 | | | | 3.11 | | | | 10.44 | |
Total from investment operations | | | 13.92 | | | | (6.35 | ) | | | (8.11 | ) | | | 2.71 | | | | 9.44 | |
Less distributions from: |
Net investment income | | | — | | | | (5.45 | ) | | | (3.95 | ) | | | (8.30 | ) | | | (2.35 | ) |
Net realized gains | | | — | | | | — | | | | — | | | | (1.80 | ) | | | — | |
Total distributions | | | — | | | | (5.45 | ) | | | (3.95 | ) | | | (10.10 | ) | | | (2.35 | ) |
Net asset value, end of period | | $ | 122.60 | | | $ | 108.68 | | | $ | 120.48 | | | $ | 116.32 | | | $ | 123.71 | |
|
Total Returnb | | | 12.81 | % | | | (5.76 | %) | | | 7.18 | % | | | 2.08 | % | | | 8.24 | % |
Ratios/Supplemental Data |
Net assets, end of period (in thousands) | | $ | 4,021 | | | $ | 3,933 | | | $ | 7,631 | | | $ | 8,427 | | | $ | 20,290 | |
Ratios to average net assets: |
Net investment income (loss) | | | (1.21 | %) | | | 0.58 | % | | | 0.59 | % | | | (0.31 | %) | | | (0.85 | %) |
Total expensesc | | | 1.60 | % | | | 1.63 | % | | | 1.61 | % | | | 1.52 | % | | | 1.51 | % |
Net expensesd | | | 1.57 | % | | | 1.61 | % | | | 1.60 | % | | | 1.52 | % | | | 1.51 | % |
Portfolio turnover rate | | | 134 | % | | | — | | | | 21 | % | | | 422 | % | | | 97 | % |
C-Class | | Year Ended
March 31,
2021 | | | Year Ended
March 31,
2020f | | | Year Ended
March 31,
2019f | | | Year Ended
March 29,
2018f | | | Year Ended
March 31,
2017f | |
Per Share Data |
Net asset value, beginning of period | | $ | 93.96 | | | $ | 105.62 | | | $ | 103.17 | | | $ | 111.65 | | | $ | 106.26 | |
Income (loss) from investment operations: |
Net investment income (loss)a | | | (.81 | ) | | | (.20 | ) | | | (.20 | ) | | | (1.10 | ) | | | (1.80 | ) |
Net gain (loss) on investments (realized and unrealized) | | | 12.06 | e | | | (6.01 | ) | | | 6.60 | | | | 2.72 | | | | 9.54 | |
Total from investment operations | | | 11.25 | | | | (6.21 | ) | | | 6.40 | | | | 1.62 | | | | 7.74 | |
Less distributions from: |
Net investment income | | | — | | | | (5.45 | ) | | | (3.95 | ) | | | (8.30 | ) | | | (2.35 | ) |
Net realized gains | | | — | | | | — | | | | — | | | | (1.80 | ) | | | — | |
Total distributions | | | — | | | | (5.45 | ) | | | (3.95 | ) | | | (10.10 | ) | | | (2.35 | ) |
Net asset value, end of period | | $ | 105.21 | | | $ | 93.96 | | | $ | 105.62 | | | $ | 103.17 | | | $ | 111.65 | |
|
Total Returnb | | | 11.97 | % | | | (6.45 | %) | | | 6.39 | % | | | 1.35 | % | | | 7.38 | % |
Ratios/Supplemental Data |
Net assets, end of period (in thousands) | | $ | 2,136 | | | $ | 866 | | | $ | 1,480 | | | $ | 3,994 | | | $ | 4,533 | |
Ratios to average net assets: |
Net investment income (loss) | | | (1.96 | %) | | | (0.20 | %) | | | (0.21 | %) | | | (1.00 | %) | | | (1.65 | %) |
Total expensesc | | | 2.34 | % | | | 2.38 | % | | | 2.35 | % | | | 2.27 | % | | | 2.26 | % |
Net expensesd | | | 2.32 | % | | | 2.36 | % | | | 2.35 | % | | | 2.27 | % | | | 2.26 | % |
Portfolio turnover rate | | | 134 | % | | | — | | | | 21 | % | | | 422 | % | | | 97 | % |
SEE NOTES TO FINANCIAL STATEMENTS. | THE RYDEX FUNDS ANNUAL REPORT | 159 |
FINANCIAL HIGHLIGHTS (concluded) |
This table is presented to show selected data for a share outstanding throughout each period and to assist shareholders in evaluating a Fund’s performance for the periods presented.
H-Class | | Year Ended
March 31,
2021 | | | Year Ended
March 31,
2020f | | | Year Ended
March 31,
2019f | | | Year Ended
March 29,
2018f | | | Year Ended
March 31,
2017f | |
Per Share Data |
Net asset value, beginning of period | | $ | 108.54 | | | $ | 120.32 | | | $ | 116.17 | | | $ | 123.58 | | | $ | 116.56 | |
Income (loss) from investment operations: |
Net investment income (loss)a | | | (.47 | ) | | | .75 | | | | .60 | | | | (.50 | ) | | | (.90 | ) |
Net gain (loss) on investments (realized and unrealized) | | | 14.44 | e | | | (7.08 | ) | | | 7.50 | | | | 3.19 | | | | 10.27 | |
Total from investment operations | | | 13.97 | | | | (6.33 | ) | | | 8.10 | | | | 2.69 | | | | 9.37 | |
Less distributions from: |
Net investment income | | | — | | | | (5.45 | ) | | | (3.95 | ) | | | (8.30 | ) | | | (2.35 | ) |
Net realized gains | | | — | | | | — | | | | — | | | | (1.80 | ) | | | — | |
Total distributions | | | — | | | | (5.45 | ) | | | (3.95 | ) | | | (10.10 | ) | | | (2.35 | ) |
Net asset value, end of period | | $ | 122.51 | | | $ | 108.54 | | | $ | 120.32 | | | $ | 116.17 | | | $ | 123.58 | |
|
Total Return | | | 12.87 | % | | | (5.73 | %) | | | 7.15 | % | | | 2.08 | % | | | 8.15 | % |
Ratios/Supplemental Data |
Net assets, end of period (in thousands) | | $ | 19,835 | | | $ | 23,125 | | | $ | 101,180 | | | $ | 23,860 | | | $ | 435,334 | |
Ratios to average net assets: |
Net investment income (loss) | | | (1.23 | %) | | | 0.59 | % | | | 0.49 | % | | | (0.41 | %) | | | (0.74 | %) |
Total expensesc | | | 1.61 | % | | | 1.63 | % | | | 1.60 | % | | | 1.52 | % | | | 1.51 | % |
Net expensesd | | | 1.59 | % | | | 1.61 | % | | | 1.60 | % | | | 1.52 | % | | | 1.51 | % |
Portfolio turnover rate | | | 134 | % | | | — | | | | 21 | % | | | 422 | % | | | 97 | % |
a | Net investment income (loss) per share was computed using average shares outstanding throughout the period. |
b | Total return does not reflect the impact of any applicable sales charges. |
c | Does not include expenses of the underlying funds in which the Fund invests. |
d | Net expense information reflects the expense ratios after expense waivers and reimbursements, as applicable. |
e | The amount shown for a share outstanding throughout the period does not agree with the aggregate net loss on investments for the year because of sales and repurchases of fund shares in relation to fluctuating market value of the investments of the Fund. |
f | Reverse share split — Per share amounts for the periods presented through March 31, 2020 have been restated to reflect a 1:5 reverse share split effective August 17, 2020 — See Note 11. |
160 | THE RYDEX FUNDS ANNUAL REPORT | SEE NOTES TO FINANCIAL STATEMENTS. |
PERFORMANCE REPORT AND FUND PROFILE (Unaudited) | March 31, 2021 |
INVERSE HIGH YIELD STRATEGY FUND
OBJECTIVE: Seeks to provide investment results that inversely correlate, before fees and expenses, to the performance of the high yield bond market.
For the one-year period ended March 31, 2021, Inverse High Yield Strategy Fund H-Class returned -13.58%. For comparison, the Bloomberg Barclays U.S. Corporate High Yield Index returned 23.72% for the same period.
The economy in 2020 experienced an abrupt and unprecedented decline in output, corporate leverage spiked, and default volume and negative rating migration were the worst in over a decade. In contrast, equity indexes touched new highs, corporate bond yields set record lows, and primary credit issuance saw record volumes. High-yield corporate bond spreads tightened over the period as investors gained confidence that the economy will eventually make a full recovery, owing in part to the vast amount of policy support that continues to buttress financial conditions.
It is hard to estimate the volume of defaults, restructurings and personal bankruptcies that global policy support helped prevent. Nevertheless, there was still $150 billion in total U.S. defaulted corporate debt, mostly in energy, but also in cable/satellite, retail, and services. Given that the peak-to-trough decline in U.S. economic activity was 3.8 times that of the last financial crisis, defaults could have been more than double were it not for the tidal wave of government liquidity that turned this shock into a V-shaped recovery.
Derivatives in the Fund are used to help provide exposure to the composition of the benchmark in the most efficient manner possible and not for hedging purposes. Derivatives performed as expected.
The Fund may invest in certain of the underlying series of Guggenheim Funds Trust and Guggenheim Strategy Funds Trust, including Guggenheim Ultra Short Duration, Guggenheim Strategy Fund II and Guggenheim Strategy Fund III (collectively, the “Short Term Investment Vehicles”), each of which are open-end management investment companies managed by Guggenheim Investments. The Short Term Investment Vehicles, which launched on March 11, 2014, are offered as short term investment options only to mutual funds, trusts, and other accounts managed by Guggenheim Investments and/or its affiliates, and are not available to the public, with the exception of Guggenheim Ultra Short Duration Fund, which is available to the public. Guggenheim Strategy Fund II and Guggenheim Strategy Fund III do not charge an investment management fee. Guggenheim Ultra Short Duration Fund charges an investment management fee but the Fund’s adviser has agreed to waive fees to the extent necessary to offset the proportionate share of any management fee paid by the Fund with respect to its investment in Guggenheim Ultra Short Duration Fund. For the one-year period ended March 31, 2021, investment in the Short Term Investment Vehicles benefited Fund performance.
Performance displayed represents past performance, which is no guarantee of future results.
Holdings Diversification (Market Exposure as % of Net Assets)

“Holdings Diversification (Market Exposure as % of Net Assets)” excludes any temporary cash investments, investments in Guggenheim Strategy Funds Trust mutual funds, or investments in Guggenheim Ultra Short Duration Fund. Investments in those Funds do not provide “market exposure” to meet the Fund’s investment objective, but will significantly increase the portfolio’s exposure to certain other asset categories (and their associated risks), which may cause the Fund to deviate from its principal investment strategy, including: (i) high yield, high risk debt securities rated below the top four long-term rating categories by a nationally recognized statistical rating organization (also known as “junk bonds”); (ii) securities issued by the U.S. government or its agencies and instrumentalities; (iii) CLOs and similar investments; and (iv) other short-term fixed income securities.
| | THE RYDEX FUNDS ANNUAL REPORT | 161 |
PERFORMANCE REPORT AND FUND PROFILE (Unaudited)(concluded) | March 31, 2021 |
Inception Dates: |
A-Class | April 16, 2007 |
C-Class | April 16, 2007 |
H-Class | April 16, 2007 |
The Fund invests principally in derivative investments such as high yield credit default swap agreements and futures contracts.
Largest Holdings (% of Total Net Assets) |
Guggenheim Strategy Fund II | 9.2% |
Guggenheim Ultra Short Duration Fund — Institutional Class | 9.2% |
Total | 18.4% |
| | |
“Largest Holdings” excludes any temporary cash or derivative investments. |
Cumulative Fund Performance*


Average Annual Returns*
Periods Ended March 31, 2021
| 1 Year | 5 Year | 10 Year |
A-Class Shares | (12.88%) | (5.50%) | (8.26%) |
A-Class Shares with sales charge‡ | (17.01%) | (6.41%) | (8.70%) |
C-Class Shares | (14.23%) | (6.42%) | (8.98%) |
C-Class Shares with CDSC§ | (15.02%) | (6.42%) | (8.98%) |
H-Class Shares | (13.58%) | (5.49%) | (8.14%) |
Bloomberg Barclays U.S. Corporate High Yield Index | 23.72% | 8.06% | 6.48% |
* | The performance data above represents past performance that is not predictive of future results. The investment return and principal value of an investment in the Fund will fluctuate so that an investor’s shares, when redeemed, may be worth more or less than their original cost. Returns are historical and include changes in principal and reinvested dividends and capital gains and do not reflect the effect of taxes. The Bloomberg Barclays U.S. Corporate High Yield Index is an unmanaged index and, unlike the Fund, has no management fees or operating expenses to reduce its reported return. The graphs are based on A-Class shares and H-Class shares only; performance for C-Class shares will vary due to differences in fee structures. |
‡ | Fund returns are calculated using the maximum sales charge of 4.75%. |
§ | Fund returns include a CDSC of 1% if redeemed within 12 months of purchase. |
162 | THE RYDEX FUNDS ANNUAL REPORT | |
SCHEDULE OF INVESTMENTS | March 31, 2021 |
INVERSE HIGH YIELD STRATEGY FUND | |
| | Shares | | | Value | |
MUTUAL FUNDS† - 18.4% |
Guggenheim Strategy Fund II1 | | | 35,046 | | | $ | 875,453 | |
Guggenheim Ultra Short Duration Fund — Institutional Class1 | | | 87,773 | | | | 874,218 | |
Total Mutual Funds | | | | |
(Cost $1,747,665) | | | | | | | 1,749,671 | |
| | | | | | | | | |
| | | Face
Amount | | | | | |
FEDERAL AGENCY NOTES†† - 2.1% |
Federal Farm Credit Bank |
0.31% (3 Month U.S. Treasury Bill Rate + 0.29%, Rate Floor: 0.00%) due 04/11/222 | | $ | 200,000 | | | | 200,459 | |
Total Federal Agency Notes | | | | |
(Cost $200,000) | | | | | | | 200,459 | |
| | | | | | | | | |
U.S. TREASURY BILLS†† - 0.3% |
U.S. Treasury Bills |
0.01% due 04/22/213,4 | | | 25,000 | | | | 25,000 | |
Total U.S. Treasury Bills | | | | |
(Cost $25,000) | | | | | | | 25,000 | |
REPURCHASE AGREEMENTS††,5 - 76.2% |
J.P. Morgan Securities LLC
issued 03/31/21 at 0.01%
due 04/01/21 | | | 3,867,732 | | | | 3,867,732 | |
Barclays Capital, Inc.
issued 03/31/21 at 0.01%
due 04/01/21 | | | 1,758,459 | | | | 1,758,459 | |
BofA Securities, Inc.
issued 03/31/21 at 0.01%
due 04/01/21 | | | 1,604,868 | | | | 1,604,868 | |
Total Repurchase Agreements | | | | |
(Cost $7,231,059) | | | | | | | 7,231,059 | |
| | | | | | | | | |
Total Investments - 97.0% | | | | |
(Cost $9,203,724) | | $ | 9,206,189 | |
Other Assets & Liabilities, net - 3.0% | | | 287,663 | |
Total Net Assets - 100.0% | | $ | 9,493,852 | |
Futures Contracts |
Description | | Number of
Contracts | | | Expiration
Date | | | Notional
Amount | | | Value and
Unrealized
Appreciation** | |
Interest Rate Futures Contracts Sold Short† |
U.S. Treasury 5 Year Note Futures Contracts | | | 71 | | | | Jun 2021 | | | $ | 8,765,727 | | | $ | 32,177 | |
Centrally Cleared Credit Default Swap Agreements Protection Purchased†† |
Counterparty | Exchange | Index | | Protection
Premium
Rate | | Payment
Frequency | | Maturity
Date | | | Notional
Amount | | | Value | | | Upfront
Premiums
Received | | | Unrealized
Depreciation** | |
Barclays Bank plc | ICE | CDX.NA.HY.36.V1 | | | 5.00 | % | Quarterly | 06/20/26 | | $ | 8,800,000 | | | $ | (786,944 | ) | | $ | (753,761 | ) | | $ | (33,183 | ) |
** | Includes cumulative appreciation (depreciation). Variation margin is reported within the Statement of Assets and Liabilities. |
† | Value determined based on Level 1 inputs — See Note 4. |
†† | Value determined based on Level 2 inputs — See Note 4. |
1 | Affiliated issuer. |
2 | Variable rate security. Rate indicated is the rate effective at March 31, 2021. In some instances, the effective rate is limited by a minimum rate floor or a maximum rate cap established by the issuer. The settlement status of a position may also impact the effective rate indicated. In some cases, a position may be unsettled at period end and may not have a stated effective rate. In instances where multiple underlying reference rates and spread amounts are shown, the effective rate is based on a weighted average. |
3 | All or a portion of this security is pledged as futures collateral at March 31, 2021. |
4 | Rate indicated is the effective yield at the time of purchase. |
5 | Repurchase Agreements — See Note 6. |
| | CDX.NA.HY.36.V1 — Credit Default Swap North American High Yield Series 36 Index Version 1 |
| | ICE — Intercontinental Exchange |
| | plc — Public Limited Company |
| | |
| | See Sector Classification in Other Information section. |
SEE NOTES TO FINANCIAL STATEMENTS. | THE RYDEX FUNDS ANNUAL REPORT | 163 |
SCHEDULE OF INVESTMENTS (concluded) | March 31, 2021 |
INVERSE HIGH YIELD STRATEGY FUND | |
The following table summarizes the inputs used to value the Fund’s investments at March 31, 2021 (See Note 4 in the Notes to Financial Statements):
Investments in Securities (Assets) | | Level 1
Quoted
Prices | | | Level 2
Significant
Observable
Inputs | | | Level 3
Significant
Unobservable
Inputs | | | Total | |
Mutual Funds | | $ | 1,749,671 | | | $ | — | | | $ | — | | | $ | 1,749,671 | |
Federal Agency Notes | | | — | | | | 200,459 | | | | — | | | | 200,459 | |
U.S. Treasury Bills | | | — | | | | 25,000 | | | | — | | | | 25,000 | |
Repurchase Agreements | | | — | | | | 7,231,059 | | | | — | | | | 7,231,059 | |
Interest Rate Futures Contracts** | | | 32,177 | | | | — | | | | — | | | | 32,177 | |
Total Assets | | $ | 1,781,848 | | | $ | 7,456,518 | | | $ | — | | | $ | 9,238,366 | |
Investments in Securities (Liabilities) | | Level 1
Quoted
Prices | | | Level 2
Significant
Observable
Inputs | | | Level 3
Significant
Unobservable
Inputs | | | Total | |
Credit Default Swap Agreements** | | $ | — | | | $ | 33,183 | | | $ | — | | | $ | 33,183 | |
** | This derivative is reported as unrealized appreciation/depreciation at period end. |
Affiliated Transactions
Investments representing 5% or more of the outstanding voting shares of a company, or control of or by, or common control under Guggenheim Investments (“GI”), result in that company being considered an affiliated issuer, as defined in the 1940 Act.
The Fund may invest in certain of the underlying series of Guggenheim Strategy Funds Trust, including Guggenheim Strategy Fund II and Guggenheim Strategy Fund III, (collectively, the “Short Term Investment Vehicles”), each of which are open-end management investment companies managed by GI. The Short Term Investment Vehicles, which launched on March 11, 2014, are offered as short term investment options only to mutual funds, trusts, and other accounts managed by GI and/or its affiliates, and are not available to the public. The Short Term Investment Vehicles pay no investment management fees. The Short Term Investment Vehicles’ annual report on Form N-CSR dated September 30, 2020, is available publicly or upon request. This information is available from the EDGAR database on the SEC’s website at https://www.sec.gov/Archives/edgar/data/1601445/000182126820000133/gug81042-ncsr.htm.
Transactions during the year ended March 31, 2021, in which the company is an affiliated issuer, were as follows:
Security Name | | Value
03/31/20 | | | Additions | | | Reductions | | | Realized
Gain (Loss) | | | Change in
Unrealized
Appreciation
(Depreciation) | | | Value
03/31/21 | | | Shares
03/31/21 | | | Investment
Income | |
Mutual Funds | | | | | | | | | | | | | | | | | | | | | | | | | | | | | | | | |
Guggenheim Strategy Fund II | | $ | 1,537,959 | | | $ | 3,110,000 | | | $ | (3,805,000 | ) | | $ | (17,699 | ) | | $ | 50,193 | | | $ | 875,453 | | | | 35,046 | | | $ | 9,436 | |
Guggenheim Ultra Short Duration Fund — Institutional Class | | | 1,550,914 | | | | 2,760,000 | | | | (3,455,000 | ) | | | (13,849 | ) | | | 32,153 | | | | 874,218 | | | | 87,773 | | | | 8,134 | |
| | | $ | 3,088,873 | | | $ | 5,870,000 | | | $ | (7,260,000 | ) | | $ | (31,548 | ) | | $ | 82,346 | | | $ | 1,749,671 | | | | | | | $ | 17,570 | |
164 | THE RYDEX FUNDS ANNUAL REPORT | SEE NOTES TO FINANCIAL STATEMENTS. |
INVERSE HIGH YIELD STRATEGY FUND | |
STATEMENT OF ASSETS AND LIABILITIES |
March 31, 2021 |
Assets: |
Investments in unaffiliated issuers, at value (cost $225,000) | | $ | 225,459 | |
Investments in affiliated issuers, at value (cost $1,747,665) | | | 1,749,671 | |
Repurchase agreements, at value (cost $7,231,059) | | | 7,231,059 | |
Segregated cash with broker | | | 1,362,685 | |
Receivables: |
Variation margin on futures contracts | | | 7,311 | |
Dividends | | | 1,521 | |
Fund shares sold | | | 341 | |
Interest | | | 152 | |
Total assets | | | 10,578,199 | |
| | | | | |
Liabilities: |
Unamortized upfront premiums received on credit default swap agreements | | | 753,761 | |
Payable for: |
Fund shares redeemed | | | 236,584 | |
Variation margin on credit default swap agreements | | | 40,335 | |
Swap settlement | | | 17,857 | |
Protection fees on credit default swap agreements | | | 12,500 | |
Management fees | | | 6,219 | |
Transfer agent and administrative fees | | | 2,285 | |
Distribution and service fees | | | 2,248 | |
Portfolio accounting fees | | | 850 | |
Trustees’ fees* | | | 165 | |
Miscellaneous | | | 11,543 | |
Total liabilities | | | 1,084,347 | |
Commitments and contingent liabilities (Note 12) | | | — | |
Net assets | | $ | 9,493,852 | |
| | | | | |
Net assets consist of: |
Paid in capital | | $ | 19,896,738 | |
Total distributable earnings (loss) | | | (10,402,886 | ) |
Net assets | | $ | 9,493,852 | |
| | | | | |
A-Class: |
Net assets | | $ | 5,612,112 | |
Capital shares outstanding | | | 111,896 | |
Net asset value per share | | $ | 50.15 | |
Maximum offering price per share (Net asset value divided by 95.25%) | | $ | 52.65 | |
| | | | | |
C-Class: |
Net assets | | $ | 162,259 | |
Capital shares outstanding | | | 3,627 | |
Net asset value per share | | $ | 44.74 | |
| | | | | |
H-Class: |
Net assets | | $ | 3,719,481 | |
Capital shares outstanding | | | 72,951 | |
Net asset value per share | | $ | 50.99 | |
STATEMENT OF OPERATIONS |
Year Ended March 31, 2021 |
Investment Income: |
Dividends from securities of affiliated issuers | | $ | 17,570 | |
Interest | | | 4,267 | |
Total investment income | | | 21,837 | |
| | | | | |
Expenses: |
Management fees | | | 49,031 | |
Distribution and service fees: |
A-Class | | | 2,844 | |
C-Class | | | 3,017 | |
H-Class | | | 12,745 | |
Transfer agent and administrative fees | | | 19,220 | |
Portfolio accounting fees | | | 6,538 | |
Registration fees | | | 6,083 | |
Professional fees | | | 4,978 | |
Trustees’ fees* | | | 1,776 | |
Custodian fees | | | 1,149 | |
Miscellaneous | | | 97 | |
Total expenses | | | 107,478 | |
Less: |
Expenses waived by Adviser | | | (1,666 | ) |
Net expenses | | | 105,812 | |
Net investment loss | | | (83,975 | ) |
| | | | | |
Net Realized and Unrealized Gain (Loss): |
Net realized gain (loss) on: |
Investments in unaffiliated issuers | | | 461 | |
Investments in affiliated issuers | | | (31,548 | ) |
Swap agreements | | | (857,303 | ) |
Futures contracts | | | (16,355 | ) |
Net realized loss | | | (904,745 | ) |
Net change in unrealized appreciation (depreciation) on: |
Investments in unaffiliated issuers | | | 204 | |
Investments in affiliated issuers | | | 82,346 | |
Swap agreements | | | (188,678 | ) |
Futures contracts | | | 67,789 | |
Net change in unrealized appreciation (depreciation) | | | (38,339 | ) |
Net realized and unrealized loss | | | (943,084 | ) |
Net decrease in net assets resulting from operations | | $ | (1,027,059 | ) |
* | Relates to Trustees not deemed “interested persons” within the meaning of Section 2(a)(19) of the 1940 Act. |
SEE NOTES TO FINANCIAL STATEMENTS. | THE RYDEX FUNDS ANNUAL REPORT | 165 |
INVERSE HIGH YIELD STRATEGY FUND | |
STATEMENTS OF CHANGES IN NET ASSETS |
| | Year Ended
March 31,
2021 | | | Year Ended
March 31,
2020 | |
Increase (Decrease) in Net Assets from Operations: | | | | | | | | |
Net investment income (loss) | | $ | (83,975 | ) | | $ | 6,901 | |
Net realized gain (loss) on investments | | | (904,745 | ) | | | 463,322 | |
Net change in unrealized appreciation (depreciation) on investments | | | (38,339 | ) | | | 118,038 | |
Net increase (decrease) in net assets resulting from operations | | | (1,027,059 | ) | | | 588,261 | |
| | | | | | | | | |
Distributions to shareholders: | | | | | | | | |
A-Class | | | (5,744 | ) | | | — | |
C-Class | | | (21,683 | ) | | | — | |
H-Class | | | (45,200 | ) | | | — | |
Total distributions to shareholders | | | (72,627 | ) | | | — | |
| | | | | | | | | |
Capital share transactions: | | | | | | | | |
Proceeds from sale of shares | | | | | | | | |
A-Class | | | 74,155,944 | | | | 43,047,779 | |
C-Class | | | 14,384 | | | | 40,360 | |
H-Class | | | 245,184,512 | | | | 120,594,884 | |
Distributions reinvested | | | | | | | | |
A-Class | | | 5,708 | | | | — | |
C-Class | | | 21,683 | | | | — | |
H-Class | | | 44,957 | | | | — | |
Cost of shares redeemed | | | | | | | | |
A-Class | | | (68,655,970 | ) | | | (43,306,242 | ) |
C-Class | | | (164,080 | ) | | | (411,911 | ) |
H-Class | | | (254,110,821 | ) | | | (112,151,071 | ) |
Net increase (decrease) from capital share transactions | | | (3,503,683 | ) | | | 7,813,799 | |
Net increase (decrease) in net assets | | | (4,603,369 | ) | | | 8,402,060 | |
| | | | | | | | | |
Net assets: | | | | | | | | |
Beginning of year | | | 14,097,221 | | | | 5,695,161 | |
End of year | | $ | 9,493,852 | | | $ | 14,097,221 | |
| | | | | | | | | |
Capital share activity: | | | | | | | | |
Shares sold | | | | | | | | |
A-Class | | | 1,387,615 | | | | 731,426 | |
C-Class | | | 283 | | | | 724 | |
H-Class | | | 4,244,689 | | | | 1,978,712 | |
Shares issued from reinvestment of distributions | | | | | | | | |
A-Class | | | 114 | | | | — | |
C-Class | | | 480 | | | | — | |
H-Class | | | 875 | | | | — | |
Shares redeemed | | | | | | | | |
A-Class | | | (1,279,966 | ) | | | (731,958 | ) |
C-Class | | | (3,521 | ) | | | (7,581 | ) |
H-Class | | | (4,385,063 | ) | | | (1,841,697 | ) |
Net increase (decrease) in shares | | | (34,494 | ) | | | 129,626 | |
166 | THE RYDEX FUNDS ANNUAL REPORT | SEE NOTES TO FINANCIAL STATEMENTS. |
INVERSE HIGH YIELD STRATEGY FUND | |
This table is presented to show selected data for a share outstanding throughout each period and to assist shareholders in evaluating a Fund’s performance for the periods presented.
A-Class | | Year Ended
March 31,
2021 | | | Year Ended
March 31,
2020 | | | Year Ended
March 31,
2019 | | | Year Ended
March 29,
2018 | | | Year Ended
March 31,
2017e | |
Per Share Data |
Net asset value, beginning of period | | $ | 62.01 | | | $ | 60.47 | | | $ | 64.28 | | | $ | 65.78 | | | $ | 71.69 | |
Income (loss) from investment operations: |
Net investment income (loss)a | | | (.68 | ) | | | .24 | | | | .42 | | | | (.07 | ) | | | (.51 | ) |
Net gain (loss) on investments (realized and unrealized) | | | (7.31 | ) | | | 1.30 | | | | (4.23 | ) | | | (1.43 | ) | | | (5.40 | ) |
Total from investment operations | | | (7.99 | ) | | | 1.54 | | | | (3.81 | ) | | | (1.50 | ) | | | (5.91 | ) |
Less distributions from: |
Net investment income | | | (3.87 | ) | | | — | | | | — | | | | — | | | | — | |
Total distributions | | | (3.87 | ) | | | — | | | | — | | | | — | | | | — | |
Net asset value, end of period | | $ | 50.15 | | | $ | 62.01 | | | $ | 60.47 | | | $ | 64.28 | | | $ | 65.78 | |
|
Total Returnb | | | (12.88 | %) | | | 2.56 | % | | | (5.93 | %) | | | (2.28 | %) | | | (8.26 | %) |
Ratios/Supplemental Data |
Net assets, end of period (in thousands) | | $ | 5,612 | | | $ | 256 | | | $ | 282 | | | $ | 8,746 | | | $ | 915 | |
Ratios to average net assets: |
Net investment income (loss) | | | (1.28 | %) | | | 0.40 | % | | | 0.66 | % | | | (0.12 | %) | | | (0.74 | %) |
Total expensesc | | | 1.56 | % | | | 1.62 | % | | | 1.60 | % | | | 1.52 | % | | | 1.52 | % |
Net expensesd | | | 1.54 | % | | | 1.61 | % | | | 1.60 | % | | | 1.52 | % | | | 1.52 | % |
Portfolio turnover rate | | | 438 | % | | | 254 | % | | | — | | | | 41 | % | | | 480 | % |
C-Class | | Year Ended
March 31,
2021 | | | Year Ended
March 31,
2020 | | | Year Ended
March 31,
2019 | | | Year Ended
March 29,
2018 | | | Year Ended
March 31,
2017e | |
Per Share Data |
Net asset value, beginning of period | | $ | 56.62 | | | $ | 55.76 | | | $ | 59.73 | | | $ | 61.63 | | | $ | 67.67 | |
Income (loss) from investment operations: |
Net investment income (loss)a | | | (.90 | ) | | | (.05 | ) | | | .01 | | | | (.39 | ) | | | (.85 | ) |
Net gain (loss) on investments (realized and unrealized) | | | (7.11 | ) | | | .91 | | | | (3.98 | ) | | | (1.51 | ) | | | (5.19 | ) |
Total from investment operations | | | (8.01 | ) | | | .86 | | | | (3.97 | ) | | | (1.90 | ) | | | (6.04 | ) |
Less distributions from: |
Net investment income | | | (3.87 | ) | | | — | | | | — | | | | — | | | | — | |
Total distributions | | | (3.87 | ) | | | — | | | | — | | | | — | | | | — | |
Net asset value, end of period | | $ | 44.74 | | | $ | 56.62 | | | $ | 55.76 | | | $ | 59.73 | | | $ | 61.63 | |
|
Total Returnb | | | (14.23 | %) | | | 1.54 | % | | | (6.65 | %) | | | (3.08 | %) | | | (8.97 | %) |
Ratios/Supplemental Data |
Net assets, end of period (in thousands) | | $ | 162 | | | $ | 362 | | | $ | 738 | | | $ | 769 | | | $ | 1,042 | |
Ratios to average net assets: |
Net investment income (loss) | | | (1.78 | %) | | | (0.09 | %) | | | 0.02 | % | | | (0.65 | %) | | | (1.32 | %) |
Total expensesc | | | 2.36 | % | | | 2.37 | % | | | 2.36 | % | | | 2.27 | % | | | 2.27 | % |
Net expensesd | | | 2.31 | % | | | 2.34 | % | | | 2.35 | % | | | 2.27 | % | | | 2.27 | % |
Portfolio turnover rate | | | 438 | % | | | 254 | % | | | — | | | | 41 | % | | | 480 | % |
SEE NOTES TO FINANCIAL STATEMENTS. | THE RYDEX FUNDS ANNUAL REPORT | 167 |
INVERSE HIGH YIELD STRATEGY FUND | |
FINANCIAL HIGHLIGHTS (concluded) |
This table is presented to show selected data for a share outstanding throughout each period and to assist shareholders in evaluating a Fund’s performance for the periods presented.
H-Class | | Year Ended
March 31,
2021 | | | Year Ended
March 31,
2020 | | | Year Ended
March 31,
2019 | | | Year Ended
March 29,
2018 | | | Year Ended
March 31,
2017e | |
Per Share Data |
Net asset value, beginning of period | | $ | 63.45 | | | $ | 61.97 | | | $ | 65.89 | | | $ | 67.70 | | | $ | 72.70 | |
Income (loss) from investment operations: |
Net investment income (loss)a | | | (.74 | ) | | | .06 | | | | .41 | | | | (.12 | ) | | | (.74 | ) |
Net gain (loss) on investments (realized and unrealized) | | | (7.85 | ) | | | 1.42 | | | | (4.33 | ) | | | (1.69 | ) | | | (4.26 | ) |
Total from investment operations | | | (8.59 | ) | | | 1.48 | | | | (3.92 | ) | | | (1.81 | ) | | | (5.00 | ) |
Less distributions from: |
Net investment income | | | (3.87 | ) | | | — | | | | — | | | | — | | | | — | |
Total distributions | | | (3.87 | ) | | | — | | | | — | | | | — | | | | — | |
Net asset value, end of period | | $ | 50.99 | | | $ | 63.45 | | | $ | 61.97 | | | $ | 65.89 | | | $ | 67.70 | |
|
Total Return | | | (13.58 | %) | | | 2.39 | % | | | (5.95 | %) | | | (2.67 | %) | | | (6.90 | %) |
Ratios/Supplemental Data |
Net assets, end of period (in thousands) | | $ | 3,719 | | | $ | 13,479 | | | $ | 4,675 | | | $ | 8,755 | | | $ | 14,855 | |
Ratios to average net assets: |
Net investment income (loss) | | | (1.26 | %) | | | 0.09 | % | | | 0.63 | % | | | (0.18 | %) | | | (1.06 | %) |
Total expensesc | | | 1.62 | % | | | 1.64 | % | | | 1.61 | % | | | 1.52 | % | | | 1.52 | % |
Net expensesd | | | 1.60 | % | | | 1.62 | % | | | 1.59 | % | | | 1.52 | % | | | 1.52 | % |
Portfolio turnover rate | | | 438 | % | | | 254 | % | | | — | | | | 41 | % | | | 480 | % |
a | Net investment income (loss) per share was computed using average shares outstanding throughout the period. |
b | Total return does not reflect the impact of any applicable sales charges. |
c | Does not include expenses of the underlying funds in which the Fund invests. |
d | Net expense information reflects the expense ratios after expense waivers and reimbursements, as applicable. |
e | Reverse share split — Per share amounts for the years presented through March 31, 2017 have been restated to reflect a 1:4 share split effective November 4, 2016. |
168 | THE RYDEX FUNDS ANNUAL REPORT | SEE NOTES TO FINANCIAL STATEMENTS. |
PERFORMANCE REPORT AND FUND PROFILE (Unaudited) | March 31, 2021 |
U.S. GOVERNMENT MONEY MARKET FUND
OBJECTIVE: Seeks to provide security of principal, high current income, and liquidity.
For the year ended March 31, 2021, U.S. Government Money Market Fund returned 0.05%.
The U.S. Federal Reserve (“Fed”) target range for interest rates remained in the 0.00% to 0.25% range over the past year. It is not expected that the Fed will increase interest rates over the coming year.
The U.S. economy was hit hard due to the COVID-19 pandemic, with 2nd quarter GDP falling 31%. Most economic indicators improved over the second half of the year. However, most indicators remain below early 2020 levels. The combination of vaccinations, multiple rounds of government stimulus, and a gradual reopening has helped improve economic conditions in recent months. The Fed has indicated a willingness to tolerate higher inflation after a decade of undershooting their 2% target level. This new policy is described as “average inflation targeting.” The most recent dot plot in March 2021 indicated that no members of the Fed expected to raise interest rates in 2021 and only four members expect an increase in interest rates by the end of 2022.
Performance displayed represents past performance, which is no guarantee of future results.
An investment in the Fund is not insured or guaranteed by the Federal Deposit Insurance Corporation or any other government agency. Although the Fund seeks to preserve the value of your investment at $1.00 per share, it is possible to lose money by investing in the Fund.
Holdings Diversification (Market Exposure as % of Net Assets)
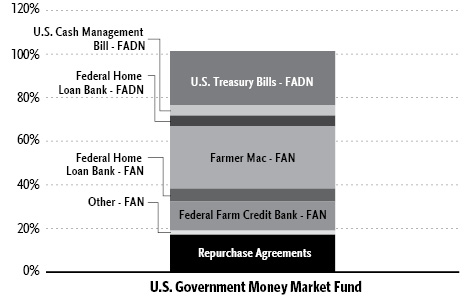
“Holdings Diversification (Market Exposure as % of Net Assets)” excludes any temporary cash investments.
FADN – Federal Agency Discount Note
FAN – Federal Agency Note
Inception Date: June 18, 2012 |
The Fund invests principally in money market instruments issued or guaranteed as to principal and interest by the U.S. Government, its agencies or instrumentalities and enters into repurchase agreements fully collateralized by U.S. government securities.
| | THE RYDEX FUNDS ANNUAL REPORT | 169 |
PERFORMANCE REPORT AND FUND PROFILE (Unaudited)(concluded) | March 31, 2021 |
Average Annual Returns*
Periods Ended March 31, 2021
| 1 Year | 5 Year | Since
Inception
(06/18/12) |
U.S. Government Money Market Fund | 0.05% | 0.47% | 0.27% |
* | The performance data above represents past performance that is not predictive of future results. The investment return and principal value of an investment in the Fund will fluctuate so that an investor’s shares, when redeemed, may be worth more or less than their original cost. Returns are historical and include changes in principal and reinvested dividends and capital gains and do not reflect the effect of taxes. |
170 | THE RYDEX FUNDS ANNUAL REPORT | |
SCHEDULE OF INVESTMENTS | March 31, 2021 |
U.S. GOVERNMENT MONEY MARKET FUND | |
| | Face
Amount | | | Value | |
FEDERAL AGENCY NOTES†† - 49.7% |
Farmer Mac |
0.15% (U.S. Prime Rate - 3.10%, Rate Floor: 0.00%) due 01/07/221 | | $ | 29,000,000 | | | $ | 29,000,000 | |
0.09% (3 Month USD LIBOR - 0.10%, Rate Floor: 0.00%) due 11/22/211 | | | 25,000,000 | | | | 25,000,000 | |
0.07% (3 Month USD LIBOR - 0.13%) due 08/13/211 | | | 17,525,000 | | | | 17,523,101 | |
0.10% (3 Month USD LIBOR - 0.10%, Rate Floor: 0.00%) due 08/03/211 | | | 15,000,000 | | | | 15,000,000 | |
0.14% (3 Month USD LIBOR - 0.10%, Rate Floor: 0.00%) due 10/06/211 | | | 14,160,000 | | | | 14,160,822 | |
Federal Farm Credit Bank |
0.06% due 02/10/22 | | | 10,000,000 | | | | 9,998,062 | |
0.28% (U.S. Prime Rate - 2.98%, Rate Floor: 0.00%) due 05/10/211 | | | 9,500,000 | | | | 9,500,598 | |
0.09% (3 Month USD LIBOR - 0.10%, Rate Floor: 0.00%) due 05/28/211 | | | 9,185,000 | | | | 9,185,313 | |
0.17% (U.S. Prime Rate - 3.08%, Rate Floor: 0.00%) due 06/29/211 | | | 6,000,000 | | | | 5,999,558 | |
0.17% due 02/17/22 | | | 5,000,000 | | | | 5,000,602 | |
0.14% due 01/05/22 | | | 1,965,000 | | | | 1,965,010 | |
0.15% (1 Month USD LIBOR + 0.03%, Rate Floor: 0.00%) due 11/02/211 | | | 1,900,000 | | | | 1,900,492 | |
2.54% due 04/05/21 | | | 1,500,000 | | | | 1,500,395 | |
0.19% (3 Month USD LIBOR, Rate Floor: 0.00%) due 11/16/211 | | | 835,000 | | | | 835,602 | |
0.19% (1 Month USD LIBOR + 0.08%, Rate Floor: 0.00%) due 07/26/211 | | | 785,000 | | | | 785,253 | |
0.38% (1 Month USD LIBOR + 0.27%, Rate Floor: 0.00%) due 05/25/211 | | | 145,000 | | | | 145,065 | |
Federal Home Loan Bank |
0.05% (3 Month USD LIBOR - 0.14%, Rate Floor: 0.00%) due 06/02/211 | | | 10,475,000 | | | | 10,475,152 | |
1.88% due 07/07/21 | | | 5,515,000 | | | | 5,541,124 | |
0.09% (3 Month USD LIBOR - 0.10%, Rate Floor: 0.00%) due 09/13/211 | | | 2,135,000 | | | | 2,135,015 | |
0.10% (3 Month USD LIBOR - 0.08%, Rate Floor: 0.00%) due 08/24/211 | | | 930,000 | | | | 930,070 | |
3.00% due 10/12/21 | | | 765,000 | | | | 776,790 | |
Fannie Mae |
1.88% due 04/05/22 | | | 2,281,000 | | | | 2,321,539 | |
1.25% due 08/17/21 | | | 1,100,000 | | | | 1,104,804 | |
2.50% due 04/13/21 | | | 1,446,000 | | | | 1,447,146 | |
Freddie Mac |
2.38% due 01/13/22 | | | 1,259,000 | | | | 1,281,273 | |
1.76% due 08/09/21 | | | 100,000 | | | | 100,593 | |
Total Federal Agency Notes | | | | |
(Cost $173,613,379) | | | | | | | 173,613,379 | |
| | | | | | | | | |
U.S. TREASURY BILLS†† - 29.6% |
U.S. Treasury Bills |
0.09% due 04/29/212 | | | 47,000,000 | | | | 46,996,527 | |
0.01% due 05/06/212 | | | 20,000,000 | | | | 19,999,767 | |
0.03% due 04/01/212 | | | 17,000,000 | | | | 17,000,000 | |
0.09% due 04/01/212 | | | 2,200,000 | | | | 2,200,000 | |
U.S. Cash Management Bill |
0.05% due 07/06/212 | | | 17,000,000 | | | | 16,997,711 | |
Total U.S. Treasury Bills | | | | |
(Cost $103,194,005) | | | | | | | 103,194,005 | |
| | | | | | | | | |
FEDERAL AGENCY DISCOUNT NOTES†† - 4.8% |
Federal Home Loan Bank |
0.01% due 04/28/212 | | | 15,000,000 | | | | 14,999,887 | |
0.01% due 05/14/212 | | | 1,600,000 | | | | 1,599,981 | |
Total Federal Agency Discount Notes | | | | |
(Cost $16,599,868) | | | | | | | 16,599,868 | |
| | | | | | | | | |
REPURCHASE AGREEMENTS††,3 - 17.2% |
J.P. Morgan Securities LLC
issued 03/31/21 at 0.01%
due 04/01/21 | | | 32,123,102 | | | | 32,123,102 | |
Barclays Capital, Inc.
issued 03/31/21 at 0.01%
due 04/01/21 | | | 14,604,723 | | | | 14,604,723 | |
BofA Securities, Inc.
issued 03/31/21 at 0.01%
due 04/01/21 | | | 13,329,088 | | | | 13,329,088 | |
Total Repurchase Agreements | | | | |
(Cost $60,056,913) | | | | | | | 60,056,913 | |
| | | | | | | | | |
Total Investments - 101.3% | | | | |
(Cost $353,464,165) | | $ | 353,464,165 | |
Other Assets & Liabilities, net - (1.3)% | | | (4,493,088 | ) |
Total Net Assets - 100.0% | | $ | 348,971,077 | |
SEE NOTES TO FINANCIAL STATEMENTS. | THE RYDEX FUNDS ANNUAL REPORT | 171 |
SCHEDULE OF INVESTMENTS (concluded) | March 31, 2021 |
U.S. GOVERNMENT MONEY MARKET FUND | |
†† | Value determined based on Level 2 inputs — See Note 4. |
1 | Variable rate security. Rate indicated is the rate effective at March 31, 2021. In some instances, the effective rate is limited by a minimum rate floor or a maximum rate cap established by the issuer. The settlement status of a position may also impact the effective rate indicated. In some cases, a position may be unsettled at period end and may not have a stated effective rate. In instances where multiple underlying reference rates and spread amounts are shown, the effective rate is based on a weighted average. |
2 | Rate indicated is the effective yield at the time of purchase. |
3 | Repurchase Agreements — See Note 6. |
| | LIBOR — London Interbank Offered Rate |
| | |
| | See Sector Classification in Other Information section. |
The following table summarizes the inputs used to value the Fund’s investments at March 31, 2021 (See Note 4 in the Notes to Financial Statements):
Investments in Securities (Assets) | | Level 1
Quoted
Prices | | | Level 2
Significant
Observable
Inputs | | | Level 3
Significant
Unobservable
Inputs | | | Total | |
Federal Agency Notes | | $ | — | | | $ | 173,613,379 | | | $ | — | | | $ | 173,613,379 | |
U.S. Treasury Bills | | | — | | | | 103,194,005 | | | | — | | | | 103,194,005 | |
Federal Agency Discount Notes | | | — | | | | 16,599,868 | | | | — | | | | 16,599,868 | |
Repurchase Agreements | | | — | | | | 60,056,913 | | | | — | | | | 60,056,913 | |
Total Assets | | $ | — | | | $ | 353,464,165 | | | $ | — | | | $ | 353,464,165 | |
172 | THE RYDEX FUNDS ANNUAL REPORT | SEE NOTES TO FINANCIAL STATEMENTS. |
U.S. GOVERNMENT MONEY MARKET FUND | |
STATEMENT OF ASSETS AND LIABILITIES |
March 31, 2021 |
Assets: |
Investments, at value (cost $293,407,252) | | $ | 293,407,252 | |
Repurchase agreements, at value (cost $60,056,913) | | | 60,056,913 | |
Receivables: |
Fund shares sold | | | 30,372,696 | |
Interest | | | 128,548 | |
Total assets | | | 383,965,409 | |
| | | | | |
Liabilities: |
Overdraft due to custodian bank | | | 331 | |
Payable for: |
Fund shares redeemed | | | 34,622,805 | |
Trustees’ fees* | | | 5,483 | |
Miscellaneous | | | 365,713 | |
Total liabilities | | | 34,994,332 | |
Commitments and contingent liabilities (Note 12) | | | — | |
Net assets | | $ | 348,971,077 | |
| | | | | |
Net assets consist of: |
Paid in capital | | $ | 348,966,514 | |
Total distributable earnings (loss) | | | 4,563 | |
Net assets | | $ | 348,971,077 | |
Capital shares outstanding | | | 348,945,598 | |
Net asset value per share | | $ | 1.00 | |
STATEMENT OF OPERATIONS |
Year Ended March 31, 2021 |
Investment Income: |
Interest | | $ | 469,979 | |
Total investment income | | | 469,979 | |
| | | | | |
Expenses: |
Management fees | | | 1,515,037 | |
Transfer agent and administrative fees | | | 706,635 | |
Registration fees | | | 289,827 | |
Portfolio accounting fees | | | 289,789 | |
Professional fees | | | 170,447 | |
Trustees’ fees* | | | 81,211 | |
Custodian fees | | | 45,624 | |
Miscellaneous | | | 57,969 | |
Total expenses | | | 3,156,539 | |
Less: |
Expenses reimbursed by Adviser | | | (948,520 | ) |
Expenses waived by Adviser | | | (1,738,150 | ) |
Total waived/reimbursed expenses | | | (2,686,670 | ) |
Net expenses | | | 469,869 | |
Net investment income | | | 110 | |
| | | | | |
Net Realized and Unrealized Gain (Loss): |
Net realized gain (loss) on: |
Investments | | | 4,498 | |
Net realized gain | | | 4,498 | |
Net increase in net assets resulting from operations | | $ | 4,608 | |
* | Relates to Trustees not deemed “interested persons” within the meaning of Section 2(a)(19) of the 1940 Act. |
SEE NOTES TO FINANCIAL STATEMENTS. | THE RYDEX FUNDS ANNUAL REPORT | 173 |
U.S. GOVERNMENT MONEY MARKET FUND | |
STATEMENTS OF CHANGES IN NET ASSETS |
| | Year Ended
March 31,
2021 | | | Year Ended
March 31,
2020 | |
Increase (Decrease) in Net Assets from Operations: | | | | | | | | |
Net investment income | | $ | 110 | | | $ | 4,103,787 | |
Net realized gain on investments | | | 4,498 | | | | 55,390 | |
Net change in unrealized appreciation (depreciation) on investments | | | — | | | | — | |
Net increase in net assets resulting from operations | | | 4,608 | | | | 4,159,177 | |
| | | | | | | | | |
Distributions to shareholders | | | (150,937 | ) | | | (4,103,774 | ) |
| | | | | | | | | |
Capital share transactions: | | | | | | | | |
Proceeds from sale of shares | | | 6,163,255,356 | | | | 5,994,438,512 | |
Distributions reinvested | | | 150,049 | | | | 4,076,467 | |
Cost of shares redeemed | | | (6,205,079,456 | ) | | | (6,020,978,588 | ) |
Net decrease from capital share transactions | | | (41,674,051 | ) | | | (22,463,609 | ) |
Net decrease in net assets | | | (41,820,380 | ) | | | (22,408,206 | ) |
| | | | | | | | | |
Net assets: | | | | | | | | |
Beginning of year | | | 390,791,457 | | | | 413,199,663 | |
End of year | | $ | 348,971,077 | | | $ | 390,791,457 | |
| | | | | | | | | |
Capital share activity: | | | | | | | | |
Shares sold | | | 6,163,255,356 | | | | 5,994,438,513 | |
Shares issued from reinvestment of distributions | | | 150,020 | | | | 4,076,837 | |
Shares redeemed | | | (6,205,079,456 | ) | | | (6,020,978,588 | ) |
Net decrease in shares | | | (41,674,080 | ) | | | (22,463,238 | ) |
174 | THE RYDEX FUNDS ANNUAL REPORT | SEE NOTES TO FINANCIAL STATEMENTS. |
U.S. GOVERNMENT MONEY MARKET FUND | |
This table is presented to show selected data for a share outstanding throughout each period and to assist shareholders in evaluating a Fund’s performance for the periods presented.
| | Year Ended
March 31,
2021 | | | Year Ended
March 31,
2020 | | | Year Ended
March 31,
2019 | | | Year Ended
March 29,
2018 | | | Year Ended
March 31,
2017 | |
Per Share Data |
Net asset value, beginning of period | | $ | 1.00 | | | $ | 1.00 | | | $ | 1.00 | | | $ | 1.00 | | | $ | 1.00 | |
Income (loss) from investment operations: |
Net investment income (loss)a | | | — | b | | | .01 | | | | .01 | | | | — | b | | | — | b |
Net gain (loss) on investments (realized and unrealized) | | | — | b | | | — | b | | | — | b | | | — | b | | | — | b |
Total from investment operations | | | — | b | | | .01 | | | | .01 | | | | — | b | | | — | b |
Less distributions from: |
Net investment income | | | — | | | | (.01 | ) | | | (.01 | ) | | | (— | )b | | | (— | )b |
Net realized gains | | | — | | | | — | | | | — | | | | — | | | | (— | )b |
Total distributions | | | — | | | | (.01 | ) | | | (.01 | ) | | | (— | )b | | | (— | )b |
Net asset value, end of period | | $ | 1.00 | | | $ | 1.00 | | | $ | 1.00 | | | $ | 1.00 | | | $ | 0.99 | |
|
Total Return | | | 0.05 | % | | | 0.99 | % | | | 1.10 | % | | | 0.22 | % | | | 0.01 | % |
Ratios/Supplemental Data |
Net assets, end of period (in thousands) | | $ | 348,971 | | | $ | 390,791 | | | $ | 413,200 | | | $ | 544,528 | | | $ | 627,514 | |
Ratios to average net assets: |
Net investment income (loss) | | | 0.00 | %d | | | 1.01 | % | | | 1.10 | % | | | 0.22 | % | | | 0.00 | %d |
Total expenses | | | 1.04 | % | | | 1.06 | % | | | 1.05 | % | | | 0.96 | % | | | 0.95 | % |
Net expensesc | | | 0.16 | % | | | 1.03 | % | | | 1.05 | % | | | 0.94 | % | | | 0.47 | % |
Portfolio turnover rate | | | — | | | | — | | | | — | | | | — | | | | — | |
a | Net investment income (loss) per share was computed using average shares outstanding throughout the period. |
b | Less than $0.01 per share. |
c | Net expense information reflects the expense ratios after expense waivers and reimbursements, as applicable. |
d | Less than 0.01%. |
SEE NOTES TO FINANCIAL STATEMENTS. | THE RYDEX FUNDS ANNUAL REPORT | 175 |
NOTES TO FINANCIAL STATEMENTS |
Note 1 – Organization and Significant Accounting Policies
Organization
The Rydex Series Funds (the “Trust”), a Delaware statutory trust, is registered with the SEC under the Investment Company Act of 1940 (”1940 Act”), as an open-ended investment company of the series type. Each series, in effect, is representing a separate fund (each, a “Fund”). The Trust may issue an unlimited number of authorized shares. The Trust accounts for the assets of each Fund separately.
The Trust offers a combination of seven separate classes of shares: Investor Class shares, A-Class shares, C-Class shares, H-Class shares, P-Class shares, Institutional Class shares and Money Market Class shares. Sales of shares of each Class are made without a front-end sales charge at the net asset value per share (“NAV”), with the exception of A-Class shares. A-Class shares are sold at the NAV, plus the applicable front-end sales charge. The sales charge varies depending on the amount purchased, but will not exceed 4.75%. A-Class share purchases of $1 million or more are exempt from the front-end sales charge but have a 1% contingent deferred sales charge (“CDSC”) if shares are redeemed within 12 months of purchase. C-Class shares have a 1% CDSC if shares are redeemed within 12 months of purchase. C-Class shares of each Fund automatically convert to A-Class shares of the same Fund on or about the 10th day of the month following the 10-year anniversary of the purchase of the C-Class shares. This conversion will be executed without any sales charge, fee or other charge. After the conversion is completed, the shares will be subject to all features and expenses of A-Class shares. Institutional Class shares are offered primarily for direct investment by institutions such as pension and profit sharing plans, endowments, foundations and corporations. Institutional Class shares require a minimum initial investment of $2 million and a minimum account balance of $1 million. At March 31, 2021, the Trust consisted of fifty-two funds.
This report covers the following funds (collectively, the “Funds”):
Fund Name | Investment
Company Type |
Nova Fund | Non-diversified |
S&P 500® Fund | Non-diversified |
Inverse S&P 500® Strategy Fund | Non-diversified |
Monthly Rebalance NASDAQ-100® 2x Strategy Fund | Non-diversified |
Inverse NASDAQ-100® Strategy Fund | Non-diversified |
Mid-Cap 1.5x Strategy Fund | Non-diversified |
Inverse Mid-Cap Strategy Fund | Non-diversified |
Russell 2000® 1.5x Strategy Fund | Non-diversified |
Russell 2000® Fund | Non-diversified |
Inverse Russell 2000® Strategy Fund | Non-diversified |
Dow Jones Industrial Average® Fund | Non-diversified |
Government Long Bond 1.2x Strategy Fund | Diversified |
Inverse Government Long Bond Strategy Fund | Diversified |
High Yield Strategy Fund | Non-diversified |
Inverse High Yield Strategy Fund | Non-diversified |
U.S. Government Money Market Fund | Diversified |
At March 31, 2021, Investor Class, A-Class, C-Class, H-Class and Money Market Class shares have been issued by the Funds.
The Funds are designed and operated to accommodate frequent trading by shareholders and, unlike most mutual funds, offer unlimited exchange privileges with no minimum holding periods or transactions fees, which may cause the Funds to experience high portfolio turnover.
Security Investors, LLC, which operates under the name Guggenheim Investments (“GI”), provides advisory services. Guggenheim Funds Distributors, LLC (“GFD”) acts as principal underwriter for the Trust. GI and GFD are affiliated entities.
Significant Accounting Policies
The Funds operate as investment companies and, accordingly, follow the investment company accounting and reporting guidance of the Financial Accounting Standards Board (“FASB”) Accounting Standards Codification Topic 946 Financial Services – Investment Companies.
The following significant accounting policies are in conformity with U.S. generally accepted accounting principles (“U.S. GAAP”) and are consistently followed by the Trust. This requires management to make estimates and assumptions that affect the reported amount of assets and liabilities, contingent assets and liabilities at the date of the financial statements, and the reported amounts of revenues and expenses during the reporting period. Actual results could differ from these estimates. All time references are based on Eastern Time.
The NAV of each Class of a fund is calculated by dividing the market value of a fund’s securities and other assets, less all liabilities, attributable to the Class by the number of outstanding shares of the Class.
The Trust calculates a NAV twice each business day; at 10:45 a.m. and at the close of the New York Stock Exchange (“NYSE”), usually 4:00 p.m. for the Russell 2000® Fund and the S&P 500® Fund. All other Funds in this report will price at the afternoon NAV. The NAV is calculated using the current market value of each Fund’s total assets as of the respective time of calculation. These financial statements are based on the March 31, 2021, afternoon NAV.
(a) Valuation of Investments
The Board of Trustees of the Funds (the “Board”) has adopted policies and procedures for the valuation of the Funds’ investments (the “Valuation Procedures”). Pursuant to the Valuation Procedures, the Board has delegated to a valuation committee, consisting of representatives from Guggenheim’s investment management, fund administration, legal and compliance departments (the “Valuation Committee”), the day-to-day responsibility for implementing the Valuation Procedures,
176 | THE RYDEX FUNDS ANNUAL REPORT | |
NOTES TO FINANCIAL STATEMENTS (continued) |
including, under most circumstances, the responsibility for determining the fair value of the Funds’ securities and/or other assets.
Valuations of the Funds’ securities and other assets are supplied primarily by pricing services appointed pursuant to the processes set forth in the Valuation Procedures. The Valuation Committee convenes monthly, or more frequently as needed, to review the valuation of all assets which have been fair valued for reasonableness. The Funds’ officers, through the Valuation Committee and consistent with the monitoring and review responsibilities set forth in the Valuation Procedures, regularly review procedures used and valuations provided by the pricing services.
If the pricing service cannot or does not provide a valuation for a particular investment or such valuation is deemed unreliable, such investment is fair valued by the Valuation Committee.
Equity securities listed or traded on a recognized U.S. securities exchange or the National Association of Securities Dealers Automated Quotations (“NASDAQ”) National Market System shall generally be valued on the basis of the last sale price on the primary U.S. exchange or market on which the security is listed or traded; provided, however, that securities listed on NASDAQ will be valued at the NASDAQ Official Closing Price, which may not necessarily represent the last sale price. If there is no sale on the valuation date, exchange-traded U.S. equity securities will be valued on the basis of the last bid price.
Open-end investment companies are valued at their NAV as of the close of business, on the valuation date. Exchange-traded funds are valued at the last quoted sale price.
The U.S. Government Money Market Fund values debt securities at amortized cost pursuant to Rule 2a-7 of the 1940 Act, which approximates market value.
With the exception of the U.S. Government Money Market Fund, U.S. government securities are valued by either independent pricing services, the last traded fill price, or at the reported bid price at the close of business.
Debt securities with a maturity of greater than 60 days at acquisition are valued at prices that reflect broker-dealer supplied valuations or are obtained from independent pricing services, which may consider the trade activity, treasury spreads, yields or price of bonds of comparable quality, coupon, maturity, and type, as well as prices quoted by dealers who make markets in such securities. Short-term debt securities with a maturity of 60 days or less at acquisition are valued at amortized cost, provided such amount approximates market value.
Repurchase agreements are generally valued at amortized cost, provided such amounts approximate market value.
The value of futures contracts is accounted for using the unrealized appreciation or depreciation on the contracts that is determined by marking the contracts to their current realized settlement prices. Financial futures contracts are valued at the 4:00 p.m. price on the valuation date. In the event that the exchange for a specific futures contract closes earlier than 4:00 p.m., the futures contract is valued at the official settlement price of the exchange. However, the underlying securities from which the futures contract value is derived are monitored until 4:00 p.m. to determine if fair valuation would provide a more accurate valuation.
The values of swap agreements entered into by a fund are accounted for using the unrealized appreciation or depreciation on the agreements that are determined by marking the agreements to the last quoted value of the index or other underlying position that the swaps pertain to at the close of the NYSE.
Investments for which market quotations are not readily available are fair-valued as determined in good faith by GI, subject to review and approval by the Valuation Committee, pursuant to methods established or ratified by the Board. Valuations in accordance with these methods are intended to reflect each security’s (or asset’s or liability’s) “fair value”. Each such determination is based on a consideration of all relevant factors, which are likely to vary from one pricing context to another. Examples of such factors may include, but are not limited to market prices; sale prices; broker quotes; and models which derive prices based on inputs such as prices of securities with comparable maturities and characteristics, or based on inputs such as anticipated cash flows or collateral, spread over U.S. Treasury securities, and other information analysis. In connection with futures contracts and other derivative investments, such factors may include obtaining information as to how (a) these contracts and other derivative investments trade in the futures or other derivative markets, respectively, and (b) the securities underlying these contracts and other derivative investments trade in the cash market.
(b) U.S. Government and Agency Obligations
Certain U.S. Government and Agency Obligations are traded on a discount basis; the interest rates shown on the Schedules of Investments reflect the effective rates paid at the time of purchase by the Funds. Other securities bear interest at the rates shown, payable at fixed dates through maturity.
(c) Short Sales
When a Fund engages in a short sale of a security, an amount equal to the proceeds is reflected as an asset and an equivalent liability. The amount of the liability is subsequently marked-to-market to reflect the market value of the short sale. The Fund maintains a segregated account of cash and/or securities as collateral for short sales.
| | THE RYDEX FUNDS ANNUAL REPORT | 177 |
NOTES TO FINANCIAL STATEMENTS (continued) |
Fees, if any, paid to brokers to borrow securities in connection with short sales are recorded as interest expense. In addition, the Fund must pay out the dividend rate of the equity or coupon rate of the obligation to the lender and record this as an expense. Short dividend or interest expense is a cost associated with the investment objective of short sales transactions, rather than an operational cost associated with the day-to-day management of any mutual fund. The Fund may also receive rebate income from the broker resulting from the investment of the proceeds from securities sold short.
(d) Futures Contracts
Upon entering into a futures contract, a Fund deposits and maintains as collateral such initial margin as required by the exchange on which the transaction is affected. Pursuant to the contract, the Fund agrees to receive from or pay to the broker an amount of cash equal to the daily fluctuation in value of the contract. Such receipts or payments are known as variation margin and are recorded by the Fund as unrealized appreciation or depreciation. When the contract is closed, the Fund records a realized gain or loss equal to the difference between the value of the contract at the time it was opened and the value at the time it was closed.
(e) Swap Agreements
Swap agreements are marked-to-market daily and the change, if any, is recorded as unrealized appreciation or depreciation. Payments received or made as a result of an agreement or termination of an agreement are recognized as realized gains or losses.
Upon entering into certain centrally-cleared swap transactions, a Fund is required to deposit with its clearing broker an amount of cash or securities as an initial margin. Subsequent variation margin receipts or payments are received or made by the Fund depending on fluctuations in the fair value of the reference entity and are recorded by the Fund as unrealized appreciation or depreciation. When the contract is closed, the Fund records a realized gain or loss equal to the difference between the value of the contract at the time it was opened and the value at the time it was closed.
Upfront payments received or made by a Fund on credit default swap agreements and interest rate swap agreements are amortized over the expected life of the agreement. Periodic payments received or paid by a Fund are recorded as realized gains or losses. Payments received or made as a result of a credit event or termination of the contract are recognized, net of a proportional amount of the upfront payment, as realized gains or losses.
(f) Foreign Taxes
The Funds may be subject to foreign taxes (a portion of which may be reclaimable) on income, stock dividends, capital gains on investments or certain foreign currency transactions. All foreign taxes are recorded in accordance with the applicable foreign tax regulations and rates that exist in the foreign jurisdictions in which the Funds invest. These foreign taxes, if any, are paid by the Funds and reflected in their Statements of Operations as follows: foreign taxes withheld at source are presented as a reduction of income and foreign taxes on capital gains from sales of investments are included with the net realized gain (loss) on investments. Foreign taxes payable or deferred as of March 31, 2021, if any, are disclosed in the Funds’ Statements of Assets and Liabilities.
(g) Security Transactions
Security transactions are recorded on the trade date for financial reporting purposes. Realized gains and losses from securities transactions are recorded using the identified cost basis. Proceeds from lawsuits related to investment holdings are recorded as a reduction to cost if the securities are still held and as realized gains if no longer held in the respective Fund. Dividend income is recorded on the ex-dividend date, net of applicable taxes withheld by foreign countries, if any. Taxable non-cash dividends are recorded as dividend income. Interest income, including amortization of premiums and accretion of discounts, is accrued on a daily basis. Dividend income from Real Estate Investment Trusts (“REITs”) is recorded based on the income included in the distributions received from the REIT investments using published REIT classifications, including some management estimates when actual amounts are not available. Distributions received in excess of this estimated amount are recorded as a reduction of the cost of investments or reclassified to realized gains. The actual amounts of income, return of capital, and realized gains are only determined by each REIT after its fiscal year-end, and may differ from the estimated amounts.
(h) Distributions
Dividends from net investment income are declared daily in the Government Long Bond 1.2x Strategy Fund and the U.S. Government Money Market Fund. Distributions of net investment income in the remaining Funds and distributions of net realized gains, if any, in all Funds are declared at least annually. Dividends are reinvested in additional shares unless shareholders request payment in cash. Distributions are recorded on the ex-dividend date and are determined in accordance with U.S. federal income tax regulations which may differ from U.S. GAAP.
(i) Class Allocations
Interest and dividend income, most expenses, all realized gains and losses, and all unrealized appreciation and depreciation are allocated to the classes based upon the value of the outstanding shares in
178 | THE RYDEX FUNDS ANNUAL REPORT | |
NOTES TO FINANCIAL STATEMENTS (continued) |
each Class. Certain costs, such as distribution and service fees are charged directly to specific classes. In addition, certain expenses have been allocated to the individual Funds in the Trust based on the respective net assets of each Fund included in the Trust.
(j) Cash
The Funds may leave cash overnight in their cash account with the custodian. Periodically, a Fund may have cash due to the custodian bank as an overdraft balance. A fee is incurred on this overdraft, calculated by multiplying the overdraft by a rate based on the federal funds rate, which was 0.06% at March 31, 2021.
(k) Indemnifications
Under the Funds’ organizational documents, the Trustees and Officers are indemnified against certain liabilities arising out of the performance of their duties to the Trust. In addition, throughout the normal course of business, the Funds enter into contracts that contain a variety of representations and warranties which provide general indemnifications. The Funds’ maximum exposure under these arrangements is unknown, as this would involve future claims that may be made against the Funds and/or their affiliates that have not yet occurred. However, based on experience, the Funds expect the risk of loss to be remote.
Note 2 – Financial Instruments and Derivatives
As part of their investment strategy, the Funds may utilize short sales and a variety of derivative instruments. These investments involve, to varying degrees, elements of market risk and risks in excess of amounts recognized on the Statements of Assets and Liabilities. Valuation and accounting treatment of these instruments can be found under Significant Accounting Policies in Note 1 of these Notes to Financial Statements.
Short Sales
A short sale is a transaction in which a Fund sells a security it does not own. If the security sold short decreases in price between the time the Fund sells the security and closes its short position, the Fund will realize a gain on the transaction. Conversely, if the security increases in price during the period, the Fund will realize a loss on the transaction. The risk of such price increases is the principal risk of engaging in short sales.
Derivatives
Derivatives are instruments whose values depend on, or are derived from, in whole or in part, the value of one or more other assets, such as securities, currencies, commodities or indices. Derivative instruments may be used to increase investment flexibility (including to maintain cash reserves while maintaining exposure to certain other assets), for risk management (hedging) purposes, to facilitate trading, to reduce transaction costs and to pursue higher investment returns. Derivative instruments may also be used to mitigate certain investment risks, such as foreign currency exchange rate risk, interest rate risk and credit risk. U.S. GAAP requires disclosures to enable investors to better understand how and why a Fund uses derivative instruments, how these derivative instruments are accounted for and their effects on the Fund’s financial position and results of operations.
The Funds may utilize derivatives for the following purposes:
Duration: the use of an instrument to manage the interest rate risk of a portfolio.
Index Exposure: the use of an instrument to obtain exposure to a listed or other type of index.
Leverage: gaining total exposure to equities or other assets on the long and short sides at greater than 100% of invested capital.
Liquidity: the ability to buy or sell exposure with little price/market impact.
For any Fund whose investment strategy consistently involves applying leverage, the value of the Fund’s shares will tend to increase or decrease more than the value of any increase or decrease in the underlying index or other asset. In addition, because an investment in derivative instruments generally requires a small investment relative to the amount of investment exposure assumed, an opportunity for increased net income is created; but, at the same time, leverage risk will increase. The Fund’s use of leverage, through borrowings or instruments such as derivatives, may cause the Fund to be more volatile and riskier than if they had not been leveraged.
Futures Contracts
A futures contract is an agreement to purchase (long) or sell (short) an agreed amount of securities or other instruments at a set price for delivery at a future date. There are significant risks associated with a Fund’s use of futures contracts, including (i) there may be an imperfect or no correlation between the changes in market value of the underlying asset and the prices of futures contracts; (ii) there may not be a liquid secondary market for a futures contract; (iii) trading restrictions or limitations may be imposed by an exchange; and (iv) government regulations may restrict trading in futures contracts. When investing in futures, there is minimal counterparty credit risk to a Fund because futures are exchange-traded and the exchange’s clearinghouse, as counterparty to all exchange-traded futures, guarantees against default. Cash deposits are shown as segregated cash with broker on the Statements of Assets and Liabilities; securities held as collateral are noted on the Schedules of Investments.
| | THE RYDEX FUNDS ANNUAL REPORT | 179 |
NOTES TO FINANCIAL STATEMENTS (continued) |
The following table represents the Funds’ use and volume of futures on a monthly basis:
| | | | Average Notional Amount | |
Fund | Use | | Long | | | Short | |
Nova Fund | Index exposure, Leverage, Liquidity | | $ | 37,384,031 | | | $ | 6,260,880 | |
S&P 500® Fund | Index exposure, Liquidity | | | 3,675,799 | | | | — | |
Inverse S&P 500® Strategy Fund | Index exposure, Liquidity | | | 633,021 | | | | 3,101,617 | |
Monthly Rebalance NASDAQ-100® 2x Strategy Fund | Index exposure, Leverage, Liquidity | | | 73,983,105 | | | | — | |
Inverse NASDAQ-100® Strategy Fund | Index exposure, Liquidity | | | — | | | | 1,699,624 | |
Mid-Cap 1.5x Strategy Fund | Index exposure, Leverage, Liquidity | | | 4,773,889 | | | | 345,390 | |
Inverse Mid-Cap Strategy Fund | Index exposure, Liquidity | | | — | | | | 19,188 | |
Russell 2000® 1.5x Strategy Fund | Index exposure, Leverage, Liquidity | | | 892,925 | | | | — | |
Russell 2000® Fund | Index exposure, Liquidity | | | 1,588,403 | | | | — | |
Inverse Russell 2000® Strategy Fund | Index exposure, Liquidity | | | — | | | | 2,989,180 | |
Dow Jones Industrial Average® Fund | Index exposure, Liquidity | | | 1,171,642 | | | | — | |
Government Long Bond 1.2x Strategy Fund | Duration, Index exposure, Leverage, Liquidity | | | 37,649,081 | | | | — | |
Inverse Government Long Bond Strategy Fund | Duration, Index exposure, Liquidity | | | — | | | | 12,443,206 | |
High Yield Strategy Fund | Duration, Index exposure, Liquidity | | | 25,452,276 | | | | — | |
Inverse High Yield Strategy Fund | Duration, Index exposure, Liquidity | | | — | | | | 4,286,897 | |
Swap Agreements
A swap is an agreement that obligates two parties to exchange a series of cash flows at specified intervals based upon or calculated by reference to changes in specified prices or rates for a specified amount of an underlying asset. When utilizing over-the-counter (“OTC”) swaps, a fund bears the risk of loss of the amount expected to be received under a swap agreement in the event of the default or bankruptcy of a swap agreement counterparty or if the underlying asset declines in value. Certain standardized swaps are subject to mandatory central clearing and are executed on a multi-lateral or other trade facility platform, such as a registered exchange. There is limited counterparty credit risk with respect to centrally-cleared swaps as the transaction is facilitated through a central clearinghouse, much like exchange-traded futures contracts. For a fund utilizing centrally-cleared swaps, the exchange bears the risk of loss resulting from a counterparty not being able to pay. There is no guarantee that a fund or an underlying fund could eliminate its exposure under an outstanding swap agreement by entering into an offsetting swap agreement with the same or another party.
Total return swaps involve commitments where single or multiple cash flows are exchanged based on the price of an underlying reference asset (such as an index) for a fixed or variable interest rate. Total return swaps will usually be computed based on the current value of the reference asset as of the close of regular trading on the NYSE or other exchange, with the swap value being adjusted to include dividends accrued, financing charges and/or interest associated with the swap agreement. When utilizing total return swaps, a fund bears the risk of loss of the amount expected to be received under a swap agreement in the event of the default or bankruptcy of a swap agreement counterparty or if the underlying reference asset declines in value.
The following table represents the Funds’ use and volume of total return swaps on a monthly basis:
| | | | Average Notional Amount | |
Fund | Use | | Long | | | Short | |
Nova Fund | Index exposure, Leverage, Liquidity | | $ | 167,647,831 | | | $ | — | |
S&P 500® Fund | Index exposure, Liquidity | | | 11,523,952 | | | | — | |
Inverse S&P 500® Strategy Fund | Index exposure, Liquidity | | | — | | | | 84,719,539 | |
Monthly Rebalance NASDAQ-100® 2x Strategy Fund | Index exposure, Leverage, Liquidity | | | 274,329,297 | | | | — | |
Inverse NASDAQ-100® Strategy Fund | Index exposure, Liquidity | | | — | | | | 26,812,923 | |
Mid-Cap 1.5x Strategy Fund | Index exposure, Leverage, Liquidity | | | 11,826,926 | | | | — | |
Inverse Mid-Cap Strategy Fund | Index exposure, Liquidity | | | — | | | | 1,036,952 | |
Russell 2000® 1.5x Strategy Fund | Index exposure, Leverage, Liquidity | | | 14,146,579 | | | | — | |
Russell 2000® Fund | Index exposure, Liquidity | | | 32,062,046 | | | | — | |
Inverse Russell 2000® Strategy Fund | Index exposure, Liquidity | | | — | | | | 12,442,345 | |
Dow Jones Industrial Average® Fund | Index exposure, Liquidity | | | 5,579,319 | | | | — | |
High Yield Strategy Fund | Duration, Index exposure, Liquidity | | | 9,199,704 | | | | — | |
180 | THE RYDEX FUNDS ANNUAL REPORT | |
NOTES TO FINANCIAL STATEMENTS (continued) |
Credit default swaps are instruments which allow for the full or partial transfer of third party credit risk, with respect to a particular entity or entities, from one counterparty to the other. A fund enters into credit default swaps as a “seller” or “buyer” of protection primarily to gain or reduce exposure to the investment grade and/or high yield bond market. A seller of credit default swaps is selling credit protection or assuming credit risk with respect to the underlying entity or entities. The buyer in a credit default swap is obligated to pay the seller a periodic stream of payments over the term of the contract provided that no event of default on an underlying reference obligation has occurred. If a credit event occurs, as defined under the terms of the swap agreement, the seller will either (i) pay to the buyer of protection an amount equal to the notional amount of the swap and take delivery of the referenced obligation or underlying securities comprising the referenced index or (ii) pay a net settlement amount in the form of cash or securities equal to the notional amount of the swap less the recovery value of the referenced obligation or underlying securities comprising the referenced index. The notional amount reflects the maximum potential amount the seller of credit protection could be required to pay to the buyer if a credit event occurs. The seller of protection receives periodic premium payments from the buyer and may also receive or pay an upfront premium adjustment to the stated periodic payments. In the event a credit default occurs on a credit default swap referencing an index, a factor adjustment will take place and the buyer of protection will receive a payment reflecting the par less the default recovery rate of the defaulted index component based on its weighting in the index. If no default occurs, the counterparty will pay the stream of payments and have no further obligations to the fund selling the credit protection. For a fund utilizing centrally cleared credit default swaps, the exchange bears the risk of loss resulting from a counterparty not being able to pay. For OTC credit default swaps, a fund bears the risk of loss of the amount expected to be received under a swap agreement in the event of the default or bankruptcy of a swap agreement counterparty, or in the case of a credit default swap in which a fund is selling credit protection, the default of a third party issuer.
The quoted market prices and resulting market values for credit default swap agreements on securities and credit indices serve as an indicator of the current status of the payment/performance risk and represent the likelihood of an expected liability (or profit) for the credit derivative had the notional amount of the swap agreement been closed/sold as of the period end. Increasing market values, in absolute terms when compared to the notional amount of the swap, represent a deterioration of the referenced entity’s credit soundness and a greater likelihood or risk of default or other credit event occurring as defined under the terms of the agreement.
The following table represents the Funds’ use and volume of credit default swaps on a monthly basis:
| | | | Average Notional Amount | |
Fund | Use | | Protection Purchased | | | Protection Sold | |
High Yield Strategy Fund | Duration, Index exposure, Liquidity | | $ | — | | | $ | 30,644,750 | |
Inverse High Yield Strategy Fund | Duration, Index exposure, Liquidity | | | 5,026,042 | | | | — | |
Derivative Investment Holdings Categorized by Risk Exposure
The following is a summary of the location of derivative investments on the Funds’ Statements of Assets and Liabilities as of March 31, 2021:
Derivative Investment Type | Asset Derivatives | Liability Derivatives |
Equity/Interest Rate contracts | Variation margin on futures contracts | Variation margin on futures contracts |
Equity/Credit contracts | Unrealized appreciation on OTC swap agreements | Unrealized depreciation on OTC swap agreements |
Credit contracts | Variation margin on credit default swap agreements | Variation margin on credit default swap agreements |
| | Unamortized upfront premiums paid on credit default swap agreements | Unamortized upfront premiums received on credit default swap agreements |
| | THE RYDEX FUNDS ANNUAL REPORT | 181 |
NOTES TO FINANCIAL STATEMENTS (continued) |
The following tables set forth the fair value of the Funds’ derivative investments categorized by primary risk exposure at March 31, 2021:
Asset Derivative Investments Value |
Fund | | Futures
Equity
Risk* | | | Swaps
Equity
Risk | | | Futures
Interest Rate
Risk* | | | Swaps
Credit
Risk* | | | Total Value at
March 31, 2021 | |
Nova Fund | | $ | 18,515 | | | $ | 1,140,354 | | | $ | — | | | $ | — | | | $ | 1,158,869 | |
S&P 500® Fund | | | — | | | | 42,566 | | | | — | | | | — | | | | 42,566 | |
Monthly Rebalance NASDAQ-100® 2x Strategy Fund | | | 255,378 | | | | 1,807,401 | | | | — | | | | — | | | | 2,062,779 | |
Inverse NASDAQ-100® Strategy Fund | | | — | | | | 1,117,821 | | | | — | | | | — | | | | 1,117,821 | |
Mid-Cap 1.5x Strategy Fund | | | — | | | | 299,069 | | | | — | | | | — | | | | 299,069 | |
Inverse Mid-Cap Strategy Fund | | | — | | | | 5,004 | | | | — | | | | — | | | | 5,004 | |
Russell 2000® Fund | | | — | | | | 74,843 | | | | — | | | | — | | | | 74,843 | |
Inverse Russell 2000® Strategy Fund | | | 31,475 | | | | 122,815 | | | | — | | | | — | | | | 154,290 | |
Dow Jones Industrial Average® Fund | | | 1,836 | | | | 154,468 | | | | — | | | | — | | | | 156,304 | |
Government Long Bond 1.2x Strategy Fund | | | — | | | | — | | | | 352,265 | | | | — | | | | 352,265 | |
Inverse Government Long Bond Strategy Fund | | | — | | | | — | | | | 328,417 | | | | — | | | | 328,417 | |
High Yield Strategy Fund | | | — | | | | — | | | | — | | | | 79,966 | | | | 79,966 | |
Inverse High Yield Strategy Fund | | | — | | | | — | | | | 32,177 | | | | — | | | | 32,177 | |
Liability Derivative Investments Value |
Fund | | Futures
Equity
Risk* | | | Swaps
Equity
Risk | | | Futures
Interest Rate
Risk* | | | Swaps
Credit
Risk* | | | Total Value at
March 31, 2021 | |
Nova Fund | | $ | — | | | $ | 70,406 | | | $ | — | | | $ | — | | | $ | 70,406 | |
Inverse S&P 500® Strategy Fund | | | 24,089 | | | | 509,001 | | | | — | | | | — | | | | 533,090 | |
Monthly Rebalance NASDAQ-100® 2x Strategy Fund | | | — | | | | 260,733 | | | | — | | | | — | | | | 260,733 | |
Inverse NASDAQ-100® Strategy Fund | | | 44,931 | | | | — | | | | — | | | | — | | | | 44,931 | |
Mid-Cap 1.5x Strategy Fund | | | 2,707 | | | | 26,949 | | | | — | | | | — | | | | 29,656 | |
Inverse Mid-Cap Strategy Fund | | | — | | | | 13,691 | | | | — | | | | — | | | | 13,691 | |
Russell 2000® 1.5x Strategy Fund | | | 31,803 | | | | 32,868 | | | | — | | | | — | | | | 64,671 | |
Russell 2000® Fund | | | 178,332 | | | | 2,348 | | | | — | | | | — | | | | 180,680 | |
Inverse Russell 2000® Strategy Fund | | | — | | | | 11,559 | | | | — | | | | — | | | | 11,559 | |
High Yield Strategy Fund | | | — | | | | — | | | | 168,134 | | | | 26,621 | | | | 194,755 | |
Inverse High Yield Strategy Fund | | | — | | | | — | | | | — | | | | 33,183 | | | | 33,183 | |
* | Includes cumulative appreciation (depreciation) of futures contracts and centrally-cleared swaps as reported on the Schedules of Investments. Variation margin is reported within the Statements of Assets and Liabilities. |
The following is a summary of the location of derivative investments on the Funds’ Statements of Operations for the year ended March 31, 2021:
Derivative Investment Type | Location of Gain (Loss) on Derivatives |
Equity/Interest Rate contracts | Net realized gain (loss) on futures contracts |
| Net change in unrealized appreciation (depreciation) on futures contracts |
Equity/Credit contracts | Net realized gain (loss) on swap agreements |
| Net change in unrealized appreciation (depreciation) on swap agreements |
182 | THE RYDEX FUNDS ANNUAL REPORT | |
NOTES TO FINANCIAL STATEMENTS (continued) |
The following is a summary of the Funds’ realized gain (loss) and change in unrealized appreciation (depreciation) on derivative investments recognized on the Statements of Operations categorized by primary risk exposure for the year ended March 31, 2021:
Realized Gain (Loss) on Derivative Investments Recognized on the Statements of Operations |
Fund | | Futures
Equity
Risk | | | Swaps
Equity
Risk | | | Futures
Interest Rate
Risk | | | Swaps
Credit
Risk | | | Total | |
Nova Fund | | $ | 24,288,964 | | | $ | 55,840,352 | | | $ | — | | | $ | — | | | $ | 80,129,316 | |
S&P 500® Fund | | | 2,389,472 | | | | 2,625,337 | | | | — | | | | — | | | | 5,014,809 | |
Inverse S&P 500® Strategy Fund | | | (2,730,560 | ) | | | (45,285,886 | ) | | | — | | | | — | | | | (48,016,446 | ) |
Monthly Rebalance NASDAQ-100® 2x Strategy Fund | | | 27,183,266 | | | | 103,455,523 | | | | — | | | | — | | | | 130,638,789 | |
Inverse NASDAQ-100® Strategy Fund | | | (1,072,867 | ) | | | (18,186,753 | ) | | | — | | | | — | | | | (19,259,620 | ) |
Mid-Cap 1.5x Strategy Fund | | | 3,429,084 | | | | 7,299,869 | | | | — | | | | — | | | | 10,728,953 | |
Inverse Mid-Cap Strategy Fund | | | (11,374 | ) | | | (847,113 | ) | | | — | | | | — | | | | (858,487 | ) |
Russell 2000® 1.5x Strategy Fund | | | 611,821 | | | | 8,079,448 | | | | — | | | | — | | | | 8,691,269 | |
Russell 2000® Fund | | | 801,037 | | | | 18,290,067 | | | | — | | | | — | | | | 19,091,104 | |
Inverse Russell 2000® Strategy Fund | | | (1,451,853 | ) | | | (11,789,560 | ) | | | — | | | | — | | | | (13,241,413 | ) |
Dow Jones Industrial Average® Fund | | | 660,570 | | | | 1,322,980 | | | | — | | | | — | | | | 1,983,550 | |
Government Long Bond 1.2x Strategy Fund | | | — | | | | — | | | | (186,535 | ) | | | — | | | | (186,535 | ) |
Inverse Government Long Bond Strategy Fund | | | — | | | | — | | | | 2,288,042 | | | | — | | | | 2,288,042 | |
High Yield Strategy Fund | | | — | | | | — | | | | 274,116 | | | | (559,812 | ) | | | (285,696 | ) |
Inverse High Yield Strategy Fund | | | — | | | | — | | | | (16,355 | ) | | | (857,303 | ) | | | (873,658 | ) |
Change in Unrealized Appreciation (Depreciation) on Derivative Investments Recognized on the Statements of Operations |
Fund | | Futures
Equity
Risk | | | Swaps
Equity
Risk | | | Futures
Interest Rate
Risk | | | Swaps
Credit
Risk | | | Total | |
Nova Fund | | $ | 12,728 | | | $ | 2,322,272 | | | $ | — | | | $ | — | | | $ | 2,335,000 | |
S&P 500® Fund | | | (794,086 | ) | | | 681,773 | | | | — | | | | — | | | | (112,313 | ) |
Inverse S&P 500® Strategy Fund | | | 855,464 | | | | (1,877,952 | ) | | | — | | | | — | | | | (1,022,488 | ) |
Monthly Rebalance NASDAQ-100® 2x Strategy Fund | | | (89,874 | ) | | | 1,879,026 | | | | — | | | | — | | | | 1,789,152 | |
Inverse NASDAQ-100® Strategy Fund | | | 312,304 | | | | 573,266 | | | | — | | | | — | | | | 885,570 | |
Mid-Cap 1.5x Strategy Fund | | | (107,305 | ) | | | 167,347 | | | | — | | | | — | | | | 60,042 | |
Inverse Mid-Cap Strategy Fund | | | — | | | | (29,801 | ) | | | — | | | | — | | | | (29,801 | ) |
Russell 2000® 1.5x Strategy Fund | | | (112,041 | ) | | | (135,523 | ) | | | — | | | | — | | | | (247,564 | ) |
Russell 2000® Fund | | | (342,408 | ) | | | (335,233 | ) | | | — | | | | — | | | | (677,641 | ) |
Inverse Russell 2000® Strategy Fund | | | 31,475 | | | | (333,033 | ) | | | — | | | | — | | | | (301,558 | ) |
Dow Jones Industrial Average® Fund | | | (175,221 | ) | | | 421,783 | | | | — | | | | — | | | | 246,562 | |
Government Long Bond 1.2x Strategy Fund | | | — | | | | — | | | | (7,122,200 | ) | | | — | | | | (7,122,200 | ) |
Inverse Government Long Bond Strategy Fund | | | — | | | | — | | | | 1,409,965 | | | | — | | | | 1,409,965 | |
High Yield Strategy Fund | | | — | | | | — | | | | (470,106 | ) | | | 438,167 | | | | (31,939 | ) |
Inverse High Yield Strategy Fund | | | — | | | | — | | | | 67,789 | | | | (188,678 | ) | | | (120,889 | ) |
In conjunction with short sales and the use of derivative instruments, the Funds are required to maintain collateral in various forms. Depending on the financial instrument utilized and the broker involved, the Funds use margin deposits at the broker, cash and/or securities segregated at the custodian bank, discount notes or repurchase agreements allocated to the Funds as collateral.
The Trust has established counterparty credit guidelines and enters into transactions only with financial institutions of investment grade or better. The Trust monitors the counterparty credit risk.
Note 3 – Offsetting
In the normal course of business, the Funds enter into transactions subject to enforceable master netting arrangements or other similar arrangements. Generally, the right to offset in those agreements allows the Funds to counteract the exposure to a specific counterparty with collateral received from or delivered to that counterparty based on the terms of the arrangements. These arrangements provide for the right to liquidate upon the occurrence of an event of default, credit event upon merger or additional termination event.
| | THE RYDEX FUNDS ANNUAL REPORT | 183 |
NOTES TO FINANCIAL STATEMENTS (continued) |
In order to better define their contractual rights and to secure rights that will help the Funds mitigate their counterparty risk, the Funds may enter into an International Swaps and Derivatives Association, Inc. Master Agreement (“ISDA Master Agreement”) or similar agreement with their derivative contract counterparties. An ISDA Master Agreement is a bilateral agreement between a fund and a counterparty that governs OTC derivatives, including foreign exchange contracts, and typically contains, among other things, collateral posting terms and netting provisions in the event of a default and/or termination event. The provisions of the ISDA Master Agreement typically permit a single net payment in the event of a default (close-out netting) or similar event, including the bankruptcy or insolvency of the counterparty.
For derivatives traded under an ISDA Master Agreement, the collateral requirements are typically calculated by netting the mark-to-market amount for each transaction under such agreement and comparing that amount to the value of any collateral currently pledged by the Funds and the counterparty. For financial reporting purposes, cash collateral that has been pledged to cover obligations of the Funds and cash collateral received from the counterparty, if any, are reported separately on the Statements of Assets and Liabilities as segregated cash with broker/receivable for variation margin, or payable for swap settlement/variation margin. Cash and/or securities pledged or received as collateral by the Funds in connection with an OTC derivative subject to an ISDA Master Agreement generally may not be invested, sold or rehypothecated by the counterparty or the Funds, as applicable, absent an event of default under such agreement, in which case such collateral generally may be applied towards obligations due to and payable by such counterparty or the Funds, as applicable. Generally, the amount of collateral due from or to a counterparty must exceed a minimum transfer amount threshold (e.g., $300,000) before a transfer is required to be made. To the extent amounts due to the Funds from their counterparties are not fully collateralized, contractually or otherwise, the Funds bear the risk of loss from counterparty nonperformance. The Funds attempt to mitigate counterparty risk by only entering into agreements with counterparties that they believe to be of good standing and by monitoring the financial stability of those counterparties.
For financial reporting purposes, the Funds do not offset derivative assets and derivative liabilities that are subject to netting arrangements in the Statements of Assets and Liabilities.
The following tables present derivative financial instruments and secured financing transactions that are subject to enforceable netting arrangements:
| | | | | | | | | | | | | | | | Gross Amounts Not Offset
in the Statements of
Assets and Liabilities | | | | | |
Fund | Instrument | | Gross
Amounts of
Recognized
Assets1 | | | Gross
Amounts
Offset In the
Statements
of Assets and
Liabilities | | | Net Amount
of Assets
Presented on
the Statements
of Assets and
Liabilities | | | Financial
Instruments | | | Cash
Collateral
Received | | | Net
Amount | |
Nova Fund | Swap equity contracts | | $ | 1,140,354 | | | $ | — | | | $ | 1,140,354 | | | $ | — | | | $ | — | | | $ | 1,140,354 | |
S&P 500® Fund | Swap equity contracts | | | 42,566 | | | | — | | | | 42,566 | | | | — | | | | — | | | | 42,566 | |
Monthly Rebalance NASDAQ-100® 2x Strategy Fund | Swap equity contracts | | | 1,807,401 | | | | — | | | | 1,807,401 | | | | — | | | | — | | | | 1,807,401 | |
Inverse NASDAQ-100® Strategy Fund | Swap equity contracts | | | 1,117,821 | | | | — | | | | 1,117,821 | | | | — | | | | — | | | | 1,117,821 | |
Mid-Cap 1.5x Strategy Fund | Swap equity contracts | | | 299,069 | | | | — | | | | 299,069 | | | | — | | | | — | | | | 299,069 | |
Inverse Mid-Cap Strategy Fund | Swap equity contracts | | | 5,004 | | | | — | | | | 5,004 | | | | — | | | | — | | | | 5,004 | |
Russell 2000® Fund | Swap equity contracts | | | 74,843 | | | | — | | | | 74,843 | | | | — | | | | — | | | | 74,843 | |
Inverse Russell 2000® Strategy Fund | Swap equity contracts | | | 122,815 | | | | — | | | | 122,815 | | | | — | | | | — | | | | 122,815 | |
Dow Jones Industrial Average® Fund | Swap equity contracts | | | 154,468 | | | | — | | | | 154,468 | | | | — | | | | — | | | | 154,468 | |
High Yield Strategy Fund | Swap credit contracts | | | 2,084 | | | | — | | | | 2,084 | | | | — | | | | (2,084 | ) | | | — | |
184 | THE RYDEX FUNDS ANNUAL REPORT | |
NOTES TO FINANCIAL STATEMENTS (continued) |
| | | | | | | | | | | | | | | | Gross Amounts Not Offset
in the Statements of
Assets and Liabilities | | | | | |
Fund | Instrument | | Gross
Amounts of
Recognized
Liabilities1 | | | Gross
Amounts
Offset In the
Statements
of Assets and
Liabilities | | | Net Amount
of Liabilities
Presented on
the Statements
of Assets and
Liabilities | | | Financial
Instruments | | | Cash
Collateral
Pledged | | | Net
Amount | |
Nova Fund | Swap equity contracts | | $ | 70,406 | | | $ | — | | | $ | 70,406 | | | $ | (70,406 | ) | | $ | — | | | $ | — | |
Inverse S&P 500® Strategy Fund | Swap equity contracts | | | 509,001 | | | | — | | | | 509,001 | | | | (509,001 | ) | | | — | | | | — | |
Monthly Rebalance NASDAQ-100® 2x Strategy Fund | Swap equity contracts | | | 260,733 | | | | — | | | | 260,733 | | | | (260,733 | ) | | | — | | | | — | |
Mid-Cap 1.5x Strategy Fund | Swap equity contracts | | | 26,949 | | | | — | | | | 26,949 | | | | (26,949 | ) | | | — | | | | — | |
Inverse Mid-Cap Strategy Fund | Swap equity contracts | | | 13,691 | | | | — | | | | 13,691 | | | | — | | | | — | | | | 13,691 | |
Russell 2000® 1.5x Strategy Fund | Swap equity contracts | | | 32,868 | | | | — | | | | 32,868 | | | | (5,361 | ) | | | — | | | | 27,507 | |
Russell 2000® Fund | Swap equity contracts | | | 2,348 | | | | — | | | | 2,348 | | | | (2,348 | ) | | | — | | | | — | |
Inverse Russell 2000® Strategy Fund | Swap equity contracts | | | 11,559 | | | | — | | | | 11,559 | | | | (3 | ) | | | — | | | | 11,556 | |
High Yield Strategy Fund | Swap credit contracts | | | 26,621 | | | | — | | | | 26,621 | | | | (26,621 | ) | | | — | | | | — | |
1 | Exchange-traded or centrally-cleared derivatives are excluded from these reported amounts. |
The Funds have the right to offset deposits against any related derivative liabilities outstanding with each counterparty with the exception of exchange-traded or centrally-cleared derivatives. The following table presents deposits held by others in connection with derivative investments as of March 31, 2021.
Fund | Counterparty | Asset Type | | Cash Pledged | | | Cash Received | |
S&P 500® Fund | Barclays Bank plc | Total return swap agreements | | $ | 50,000 | | | $ | — | |
| Goldman Sachs International | Futures contracts | | | 110,000 | | | | — | |
S&P 500® Fund Total | | | | | 160,000 | | | | — | |
Inverse S&P 500® Strategy Fund | Goldman Sachs International | Futures contracts | | | 351,501 | | | | — | |
Monthly Rebalance NASDAQ-100® 2x Strategy Fund | Goldman Sachs International | Futures contracts | | | 311,769 | | | | — | |
Russell 2000® 1.5x Strategy Fund | Goldman Sachs International | Futures contracts | | | 12,600 | | | | — | |
Dow Jones Industrial Average® Fund | Goldman Sachs International | Futures contracts | | | 17,050 | | | | — | |
Government Long Bond 1.2x Strategy Fund | Goldman Sachs International | Futures contracts | | | 1,800,665 | | | | — | |
High Yield Strategy Fund | Barclays Bank plc | Credit default swap agreements | | | 25,711 | | | | — | |
| | Goldman Sachs International | Credit default swap agreements | | | — | | | | 1,186,515 | |
| Goldman Sachs International | Futures contracts | | | 4,501 | | | | — | |
High Yield Strategy Fund Total | | | | | 30,212 | | | | 1,186,515 | |
Inverse High Yield Strategy Fund | Barclays Bank plc | Credit default swap agreements | | | 1,329,960 | | | | — | |
| Goldman Sachs International | Futures contracts | | | 32,725 | | | | — | |
Inverse High Yield Strategy Fund Total | | | | | 1,362,685 | | | | — | |
| | THE RYDEX FUNDS ANNUAL REPORT | 185 |
NOTES TO FINANCIAL STATEMENTS (continued) |
Note 4 – Fair Value Measurement
In accordance with U.S. GAAP, fair value is defined as the price that the Funds would receive to sell an investment or pay to transfer a liability in an orderly transaction with an independent buyer in the principal market, or in the absence of a principal market, the most advantageous market for the investment or liability. U.S. GAAP establishes a three-tier fair value hierarchy based on the types of inputs used to value assets and liabilities and requires corresponding disclosure. The hierarchy and the corresponding inputs are summarized below:
Level 1 — | quoted prices in active markets for identical assets or liabilities. |
Level 2 — | significant other observable inputs (for example quoted prices for securities that are similar based on characteristics such as interest rates, prepayment speeds, credit risk, etc.). |
Level 3 — | significant unobservable inputs based on the best information available under the circumstances, to the extent observable inputs are not available, which may include assumptions. |
The types of inputs available depend on a variety of factors, such as the type of security and the characteristics of the markets in which it trades, if any. Fair valuation determinations that rely on fewer or no observable inputs require greater judgment. Accordingly, fair value determinations for Level 3 securities require the greatest amount of judgment.
The inputs or methodologies used for valuing securities are not necessarily an indication of the risk associated with investing in those securities. The suitability of the techniques and sources employed to determine fair valuation are regularly monitored and subject to change.
Note 5 – Investment Advisory Agreement and Other Agreements
Under the terms of an investment advisory contract, the Funds pay GI investment advisory fees calculated at the annualized rates below, based on the average daily net assets of the Funds:
Fund | | Management Fees
(as a % of Net Assets) | |
Nova Fund | | | 0.75 | % |
S&P 500® Fund | | | 0.75 | % |
Inverse S&P 500® Strategy Fund | | | 0.90 | % |
Monthly Rebalance NASDAQ-100® 2x Strategy Fund | | | 0.90 | % |
Inverse NASDAQ-100® Strategy Fund | | | 0.90 | % |
Mid-Cap 1.5x Strategy Fund | | | 0.90 | % |
Inverse Mid-Cap Strategy Fund | | | 0.90 | % |
Russell 2000® 1.5x Strategy Fund | | | 0.90 | % |
Russell 2000® Fund | | | 0.75 | % |
Inverse Russell 2000® Strategy Fund | | | 0.90 | % |
Dow Jones Industrial Average® Fund | | | 0.75 | % |
Government Long Bond 1.2x Strategy Fund | | | 0.50 | % |
Inverse Government Long Bond Strategy Fund | | | 0.90 | % |
High Yield Strategy Fund | | | 0.75 | % |
Inverse High Yield Strategy Fund | | | 0.75 | % |
U.S. Government Money Market Fund | | | 0.50 | % |
186 | THE RYDEX FUNDS ANNUAL REPORT | |
NOTES TO FINANCIAL STATEMENTS (continued) |
When the aggregate assets of each series of the Trust (excluding the Long Short Equity Fund, Managed Futures Strategy Fund and Multi-Hedge Strategies Fund) and each series of Rydex Dynamic Funds equal or exceed $10 billion, the advisory fee rate paid by each individual Fund (excluding the Long Short Equity Fund, Managed Futures Strategy Fund and Multi-Hedge Strategies Fund) will be reduced in accordance with the asset level and breakpoint schedule set forth below.
Fund Assets Under Management | | Fund Asset-Based
Breakpoint Reductions | |
$500 million - $1 billion | | | 0.025 | % |
> $1 billion - $2 billion | | | 0.050 | % |
> $2 billion | | | 0.075 | % |
GI pays operating expenses on behalf of the Trust, such as audit and accounting related services, legal services, custody, printing and mailing, among others, on a pass-through basis. Such expenses are allocated to various Funds within the complex based on relative net assets.
The Board has adopted a Distribution Plan applicable to A-Class shares and H-Class shares for which GFD and other firms that provide distribution and/or shareholder services (“Service Providers”) may receive compensation. If a Service Provider provides distribution services, the Funds will pay distribution fees to GFD at an annual rate not to exceed 0.25% of average daily net assets, pursuant to Rule 12b-1 of the 1940 Act. GFD, in turn, will pay the Service Provider out of its fees. GFD may, at its discretion, retain a portion of such payments to compensate itself for distribution services.
The Board has adopted a separate Distribution and Shareholder Services Plan applicable to C-Class shares that allows the Funds to pay annual distribution and service fees of 1.00% of the Funds’ C-Class shares average daily net assets. The annual 0.25% service fee compensates a shareholder’s financial adviser for providing ongoing services to the shareholder. The annual distribution fee of 0.75% reimburses GFD for paying the shareholder’s financial adviser an ongoing sales commission. GFD advances the first year’s service and distribution fees to the financial adviser. GFD retains the service and distribution fees on accounts with no authorized dealer of record.
For the year ended March 31, 2021, GFD retained sales charges of $128,465 relating to sales of A-Class shares of the Trust.
If a Fund invests in a fund that is advised by the same adviser or an affiliated adviser, the investing Fund’s adviser has agreed to waive fees at the investing fund level to the extent necessary to offset the proportionate share of any management fee paid by each Fund with respect to its investment in such affiliated fund. Fee waivers will be calculated at the investing Fund level without regard to any expense cap in effect for the investing Fund. Fees waived under this arrangement are not subject to reimbursement to GI. For the year ended March 31, 2021, the following Funds waived fees related to investments in affiliated funds:
Fund | | Amount Waived | |
Nova Fund | | $ | 34,760 | |
Inverse S&P 500® Strategy Fund | | | 13,060 | |
Monthly Rebalance NASDAQ-100® 2x Strategy Fund | | | 34,337 | |
Inverse NASDAQ-100® Strategy Fund | | | 4,040 | |
Mid-Cap 1.5x Strategy Fund | | | 3,595 | |
Inverse Mid-Cap Strategy Fund | | | 322 | |
Russell 2000® 1.5x Strategy Fund | | | 1,635 | |
Inverse Russell 2000® Strategy Fund | | | 3,610 | |
Dow Jones Industrial Average® Fund | | | 2,744 | |
Government Long Bond 1.2x Strategy Fund | | | 13,186 | |
Inverse Government Long Bond Strategy Fund | | | 9,762 | |
High Yield Strategy Fund | | | 8,248 | |
Inverse High Yield Strategy Fund | | | 1,666 | |
GI and its affiliates have voluntarily agreed to waive their fees, including but not limited to accounting, shareholder investor services and investment advisory fees, in an attempt to maintain a positive net yield for the U.S. Government Money Market Fund. GI or its affiliates may terminate this voluntary waiver at any time upon notice to the Fund. When shareholder investor services fees are waived, dealer compensation will be reduced to the extent of such waiver.
| | THE RYDEX FUNDS ANNUAL REPORT | 187 |
NOTES TO FINANCIAL STATEMENTS (continued) |
GI has contractually agreed to reduce fees and/or reimburse expenses for the Monthly Rebalance NASDAQ-100® 2x Strategy Fund to the extent necessary to keep net operating expenses for A-Class, C-Class and H-Class shares ( including Rule 12b-1 fees if any) (excluding brokerage, dividends on securities sold short, acquired fund fees and expenses, interest, taxes, litigation, indemnifi cation, and extraordinary expenses) from exceeding 1.35%, 2.10% and 1.35% of the Fund’s A-Class, C-Class and H-Class shares average daily net assets, respectively. The Total Annual Fund Operating Expenses After Fee Waiver and/or Expense Reimbursement includes Excluded Expenses and, thus, from time to time may be higher than 1.35%, 2.10% and 1.35%, respectively. This agreement may be terminated only with the approval of the Fund’s Board of Trustees.
Certain trustees and officers of the Trust are also officers of GI and/or GFD. The Trust does not compensate its officers or trustees who are officers, directors and/or employees of GI or GFD.
MUFG Investor Services (US), LLC (“MUIS”) acts as the Funds’ administrator, transfer agent and accounting agent. As administrator, transfer agent and accounting agent, MUIS maintains the books and records of the Funds’ securities and cash. U.S. Bank, N.A. (“U.S. Bank”) acts as the Funds’ custodian. As custodian, U.S. Bank is responsible for the custody of the Funds’ assets. For providing the aforementioned services, MUIS and U.S. Bank are entitled to receive a monthly fee equal to an annual percentage of each Fund’s average daily net assets and out of pocket expenses.
Note 6 – Repurchase Agreements
The Funds transfer uninvested cash balances into a single joint account, the daily aggregate balance of which is invested in one or more repurchase agreements collateralized by obligations of the U.S. Treasury and U.S. government agencies. The joint account includes other Funds in the Guggenheim complex not covered in this report. The collateral is in the possession of the Funds’ custodian and is evaluated to ensure that its market value exceeds, at a minimum, 102% of the original face amount of the repurchase agreements. Each Fund holds a pro rata share of the collateral based on the dollar amount of the repurchase agreement entered into by each Fund.
At March 31, 2021, the repurchase agreements in the joint account were as follows:
Counterparty and
Terms of Agreement | | Face Value | | | Repurchase Price | | | Collateral | | Par Value | | | Fair Value | |
J.P. Morgan Securities LLC | | | | | | | | | | U.S. Treasury Bond | | | | | | | | |
0.01% | | | | | | | | | | 2.38% | | | | | | | | |
Due 04/01/21 | | $ | 124,999,036 | | | $ | 124,999,053 | | | 11/15/49 | | $ | 126,141,600 | | | $ | 127,499,092 | |
| | | | | | | | | | | | | | | | | | | |
Barclays Capital, Inc. | | | | | | | | | | U.S. Treasury Inflation Indexed Bond | | | | | | | | |
0.01% | | | | | | | | | | 0.13% | | | | | | | | |
Due 04/01/21 | | | 56,830,637 | | | | 56,830,653 | | | 02/15/51 | | | 57,053,077 | | | | 57,967,257 | |
| | | | | | | | | | | | | | | | | | | |
BofA Securities, Inc. | | | | | | | | | | U.S. Treasury Note | | | | | | | | |
0.01% | | | | | | | | | | 0.38% | | | | | | | | |
Due 04/01/21 | | | 51,866,820 | | | | 51,866,827 | | | 04/30/25 | | | 53,449,300 | | | | 52,904,236 | |
In the event of counterparty default, the Funds have the right to collect the collateral to offset losses incurred. There is potential loss to the Funds in the event the Funds are delayed or prevented from exercising their rights to dispose of the collateral securities, including the risk of a possible decline in the value of the underlying securities during the period while the Funds seek to assert their rights. GI, acting under the supervision of the Board, reviews the value of the collateral and the creditworthiness of those banks and dealers with which the Funds enter into repurchase agreements to evaluate potential risks.
Note 7 – Portfolio Securities Loaned
The Funds may lend their securities to approved brokers to earn additional income. Security lending income shown on the Statements of Operations is shown net of rebates paid to the borrowers and earnings on cash collateral investments shared with the lending agent. Within this arrangement, the Funds act as the lender, U.S. Bank acts as the lending agent, and other approved registered broker dealers act as the borrowers. The Funds receive cash collateral, valued at 102% of the value of the securities on loan. Under the terms of the Funds’ securities lending agreement with U.S. Bank, cash collateral and proceeds are invested in the First American Government Obligations Fund — Class Z.
188 | THE RYDEX FUNDS ANNUAL REPORT | |
NOTES TO FINANCIAL STATEMENTS (continued) |
The Funds bear the risk of loss on cash collateral investments. Collateral is maintained over the life of the loan in an amount not less than the value of loaned securities, as determined at the close of fund business each day; any additional collateral required due to changes in security values is delivered to the Funds the next business day. Although the collateral mitigates the risk, the Funds could experience a delay in recovering their securities and a possible loss of income or value if the borrower fails to return the securities. The Funds have the right under the securities lending agreement to recover the securities from the borrower on demand. Securities lending transactions are accounted for as secured borrowings. The remaining contractual maturity of the securities lending agreement is overnight and continuous.
At March 31, 2021, the Funds participated in securities lending transactions, which are subject to enforceable netting arrangements, as follows:
| | | Gross Amounts Not Offset in the
Statements of Assets and Liabilities | | | | Securities Lending Collateral | |
Fund | | Value of
Securities
Loaned | | | Collateral
Received(a) | | | Net
Amount | | | | Cash
Collateral
Invested | | | Cash
Collateral
Uninvested | | | Total
Collateral | |
Nova Fund | | $ | 92,813 | | | $ | (92,813 | ) | | $ | — | | | | $ | 94,247 | | | $ | — | | | $ | 94,247 | |
S&P 500® Fund | | | 41,120 | | | | (41,120 | ) | | | — | | | | | 41,708 | | | | — | | | | 41,708 | |
Monthly Rebalance NASDAQ-100® 2x Strategy Fund | | | 49,067 | | | | (49,067 | ) | | | — | | | | | 50,356 | | | | — | | | | 50,356 | |
Mid-Cap 1.5x Strategy Fund | | | 4,037 | | | | (4,037 | ) | | | — | | | | | 4,226 | | | | — | | | | 4,226 | |
(a) | Actual collateral received by the Fund is generally greater than the amount shown due to overcollateralization. |
In the event of counterparty default, the Funds have the right to collect the collateral to offset losses incurred. There is potential loss to the Funds in the event the Funds are delayed or prevented from exercising their rights to dispose of the collateral securities, including the risk of a possible decline in the value of the underlying securities during the period while the Funds seek to assert their rights. GI, acting under the supervision of the Board, reviews the value of the collateral and the creditworthiness of those banks and dealers to evaluate potential risks.
Note 8 – Federal Income Tax Information
The Funds intend to comply with the provisions of Subchapter M of the Internal Revenue Code applicable to regulated investment companies and will distribute substantially all taxable net investment income and capital gains sufficient to relieve the Funds from all, or substantially all, federal income, excise and state income taxes. Therefore, no provision for federal or state income tax or federal excise tax is required.
Tax positions taken or expected to be taken in the course of preparing the Funds’ tax returns are evaluated to determine whether the tax positions are “more-likely-than-not” of being sustained by the applicable tax authority. Tax positions not deemed to meet the more-likely-than-not threshold would be recorded as a tax benefit or expense in the current year. Management has analyzed the Funds’ tax positions taken, or to be taken, on U.S. federal income tax returns for all open tax years, and has concluded that no provision for income tax is required in the Funds’ financial statements. The Funds’ U.S. federal income tax returns are subject to examination by the Internal Revenue Service (“IRS”) for a period of three years after they are filed.
| | THE RYDEX FUNDS ANNUAL REPORT | 189 |
NOTES TO FINANCIAL STATEMENTS (continued) |
The tax character of distributions paid during the year ended March 31, 2021 was as follows:
Fund | | Ordinary
Income | | | Long-Term
Capital Gain | | | Total
Distributions | |
Nova Fund | | $ | 1,913,003 | | | $ | — | | | $ | 1,913,003 | |
S&P 500® Fund | | | 11,038,973 | | | | 10,400,477 | | | | 21,439,450 | |
Inverse S&P 500® Strategy Fund | | | 300,608 | | | | — | | | | 300,608 | |
Monthly Rebalance NASDAQ-100® 2x Strategy Fund | | | 19,528,645 | | | | — | | | | 19,528,645 | |
Inverse NASDAQ-100® Strategy Fund | | | 23,879 | | | | — | | | | 23,879 | |
Mid-Cap 1.5x Strategy Fund | | | 89,713 | | | | — | | | | 89,713 | |
Inverse Mid-Cap Strategy Fund | | | 5,437 | | | | — | | | | 5,437 | |
Russell 2000® 1.5x Strategy Fund | | | 25,705 | | | | — | | | | 25,705 | |
Inverse Russell 2000® Strategy Fund | | | 6,140 | | | | — | | | | 6,140 | |
Dow Jones Industrial Average® Fund | | | 987,661 | | | | — | | | | 987,661 | |
Government Long Bond 1.2x Strategy Fund | | | 15,954,125 | | | | — | | | | 15,954,125 | |
Inverse Government Long Bond Strategy Fund | | | 122,836 | | | | — | | | | 122,836 | |
Inverse High Yield Strategy Fund | | | 72,627 | | | | — | | | | 72,627 | |
U.S. Government Money Market Fund | | | 146,286 | | | | 4,651 | | | | 150,937 | |
The tax character of distributions paid during the year ended March 31, 2020 was as follows:
Fund | | Ordinary
Income | | | Long-Term
Capital Gain | | | Total
Distributions | |
S&P 500® Fund | | $ | 1,631,612 | | | $ | — | | | $ | 1,631,612 | |
Inverse S&P 500® Strategy Fund | | | 484,544 | | | | — | | | | 484,544 | |
Monthly Rebalance NASDAQ-100® 2x Strategy Fund | | | 208,541 | | | | — | | | | 208,541 | |
Inverse NASDAQ-100® Strategy Fund | | | 119,715 | | | | — | | | | 119,715 | |
Mid-Cap 1.5x Strategy Fund | | | 223,749 | | | | — | | | | 223,749 | |
Inverse Mid-Cap Strategy Fund | | | 5,588 | | | | — | | | | 5,588 | |
Russell 2000® Fund | | | 120,988 | | | | 444,717 | | | | 565,705 | |
Inverse Russell 2000® Strategy Fund | | | 52,740 | | | | — | | | | 52,740 | |
Dow Jones Industrial Average® Fund | | | 1,150,570 | | | | — | | | | 1,150,570 | |
Government Long Bond 1.2x Strategy Fund | | | 2,384,007 | | | | 1,920,775 | | | | 4,304,782 | |
High Yield Strategy Fund | | | 3,884,275 | | | | — | | | | 3,884,275 | |
U.S. Government Money Market Fund | | | 4,103,774 | | | | — | | | | 4,103,774 | |
Note: For U.S. federal income tax purposes, short-term capital gain distributions are treated as ordinary income distributions.
The tax components of distributable earnings/(loss) as of March 31, 2021 were as follows:
Fund | | Undistributed
Ordinary
Income | | | Undistributed
Long-Term
Capital Gain | | | Net Unrealized
Appreciation
(Depreciation) | | | Accumulated
Capital and
Other Losses | | | Total | |
Nova Fund | | $ | 20,301,386 | | | $ | — | | | $ | 19,531,529 | | | $ | — | | | $ | 39,832,915 | |
S&P 500® Fund | | | 2,781,735 | | | | — | | | | 20,601,570 | | | | — | | | | 23,383,305 | |
Inverse S&P 500® Strategy Fund | | | — | | | | — | | | | (370,053 | ) | | | (257,690,964 | ) | | | (258,061,017 | ) |
Monthly Rebalance NASDAQ-100® 2x Strategy Fund | | | 2,061,637 | | | | — | | | | 16,828 | | | | — | | | | 2,078,465 | |
Inverse NASDAQ-100® Strategy Fund | | | — | | | | — | | | | 1,177,505 | | | | (56,580,975 | ) | | | (55,403,470 | ) |
Mid-Cap 1.5x Strategy Fund | | | 2,302,154 | | | | — | | | | 3,118,648 | | | | — | | | | 5,420,802 | |
Inverse Mid-Cap Strategy Fund | | | — | | | | — | | | | (7,429 | ) | | | (5,752,548 | ) | | | (5,759,977 | ) |
Russell 2000® 1.5x Strategy Fund | | | 3,956,807 | | | | — | | | | (16,038 | ) | | | — | | | | 3,940,769 | |
Russell 2000® Fund | | | 4,144,986 | | | | — | | | | 86,219 | | | | — | | | | 4,231,205 | |
Inverse Russell 2000® Strategy Fund | | | — | | | | — | | | | 145,896 | | | | (41,224,468 | ) | | | (41,078,572 | ) |
Dow Jones Industrial Average® Fund | | | 441,042 | | | | — | | | | 3,932,283 | | | | — | | | | 4,373,325 | |
Government Long Bond 1.2x Strategy Fund | | | — | | | | — | | | | (5,827,002 | ) | | | (12,251,777 | ) | | | (18,078,779 | ) |
Inverse Government Long Bond Strategy Fund | | | — | | | | — | | | | 1,845,407 | | | | (258,744,943 | ) | | | (256,899,536 | ) |
High Yield Strategy Fund | | | — | | | | — | | | | 137,169 | | | | (9,956,649 | ) | | | (9,819,480 | ) |
Inverse High Yield Strategy Fund | | | 111,114 | | | | — | | | | (32,085 | ) | | | (10,481,915 | ) | | | (10,402,886 | ) |
U.S. Government Money Market Fund | | | 4,475 | | | | 88 | | | | — | | | | — | | | | 4,563 | |
190 | THE RYDEX FUNDS ANNUAL REPORT | |
NOTES TO FINANCIAL STATEMENTS (continued) |
For U.S. federal income tax purposes, capital loss carryforwards represent realized losses of the Funds that may be carried forward and applied against future capital gains. The Funds are permitted to carry forward capital losses for an unlimited period and such capital loss carryforwards retain their character as either short-term or long-term capital losses. As of March 31, 2021, capital loss carryforwards for the Funds were as follows:
| | | Unlimited | | | | | |
Fund | | Short-Term | | | Long-Term | | | Total
Capital Loss
Carryforward | |
Inverse S&P 500® Strategy Fund | | $ | (231,536,836 | ) | | $ | (26,154,128 | ) | | $ | (257,690,964 | ) |
Inverse NASDAQ-100® Strategy Fund | | | (53,273,999 | ) | | | (3,216,792 | ) | | | (56,490,791 | ) |
Inverse Mid-Cap Strategy Fund | | | (5,011,555 | ) | | | (739,562 | ) | | | (5,751,117 | ) |
Inverse Russell 2000® Strategy Fund | | | (34,470,922 | ) | | | (6,710,344 | ) | | | (41,181,266 | ) |
Government Long Bond 1.2x Strategy Fund | | | (7,742,154 | ) | | | (4,509,623 | ) | | | (12,251,777 | ) |
Inverse Government Long Bond Strategy Fund | | | (210,133,078 | ) | | | (48,148,308 | ) | | | (258,281,386 | ) |
High Yield Strategy Fund | | | (8,262,739 | ) | | | (132,124 | ) | | | (8,394,863 | ) |
Inverse High Yield Strategy Fund | | | (8,431,474 | ) | | | (2,050,441 | ) | | | (10,481,915 | ) |
For the year ended March 31, 2021, the following capital loss carryforward amounts were utilized:
Fund | | Utilized | |
Nova Fund | | $ | 32,724,511 | |
Monthly Rebalance NASDAQ-100® 2x Strategy Fund | | | 42,677,565 | |
Mid-Cap 1.5x Strategy Fund | | | 8,023,914 | |
Russell 2000® 1.5x Strategy Fund | | | 58,086 | |
Inverse Government Long Bond Strategy Fund | | | 6,921,290 | |
High Yield Strategy Fund | | | 371,806 | |
Net investment income and net realized gains (losses) may differ for financial statement and tax purposes because of temporary or permanent book/tax differences. These differences are primarily due to investments in real estate investment trusts, investments in swaps, losses deferred due to wash sales, distributions in connection with redemption of fund shares, distribution reclasses, return of capital distributions received, taxable overdistributions, and the deferral of qualified late-year losses. Additional differences may result from the tax treatment of net operating losses, bond premium/discount amortization, and the “mark-to-market” of certain derivatives. To the extent these differences are permanent and would require a reclassification between Paid in Capital and Total Distributable Earnings (Loss), such reclassifications are made in the period that the differences arise. These reclassifications have no effect on net assets or NAV per share.
The following adjustments were made on the Statements of Assets and Liabilities as of March 31, 2021 for permanent book/tax differences:
Fund | | Paid In
Capital | | | Total
Distributable
Earnings/(Loss) | |
Nova Fund | | $ | 72,539,640 | | | $ | (72,539,640 | ) |
S&P 500® Fund | | | 22,515,202 | | | | (22,515,202 | ) |
Inverse S&P 500® Strategy Fund | | | (1,034,656 | ) | | | 1,034,656 | |
Monthly Rebalance NASDAQ-100® 2x Strategy Fund | | | 111,103,562 | | | | (111,103,562 | ) |
Inverse NASDAQ-100® Strategy Fund | | | (288,424 | ) | | | 288,424 | |
Mid-Cap 1.5x Strategy Fund | | | 4,681,985 | | | | (4,681,985 | ) |
Inverse Mid-Cap Strategy Fund | | | (13,868 | ) | | | 13,868 | |
Russell 2000® 1.5x Strategy Fund | | | 4,447,730 | | | | (4,447,730 | ) |
Russell 2000® Fund | | | 5,886,793 | | | | (5,886,793 | ) |
Inverse Russell 2000® Strategy Fund | | | (182,652 | ) | | | 182,652 | |
Dow Jones Industrial Average® Fund | | | 1,839,290 | | | | (1,839,290 | ) |
Government Long Bond 1.2x Strategy Fund | | | (3,960 | ) | | | 3,960 | |
Inverse Government Long Bond Strategy Fund | | | (821,805 | ) | | | 821,805 | |
High Yield Strategy Fund | | | (1,494,758 | ) | | | 1,494,758 | |
| | THE RYDEX FUNDS ANNUAL REPORT | 191 |
NOTES TO FINANCIAL STATEMENTS (continued) |
At March 31, 2021, the cost of investments for U.S. federal income tax purposes, the aggregate gross unrealized appreciation for all investments for which there was an excess of value over tax cost and the aggregate gross unrealized depreciation for all investments for which there was an excess of tax cost over value, were as follows:
Fund | | Tax
Cost | | | Tax
Unrealized
Appreciation | | | Tax
Unrealized
Depreciation | | | Net Tax
Unrealized
Appreciation/
(Depreciation) | |
Nova Fund | | $ | 381,040,674 | | | $ | 20,470,348 | | | $ | (938,819 | ) | | $ | 19,531,529 | |
S&P 500® Fund | | | 129,852,593 | | | | 20,763,988 | | | | (162,418 | ) | | | 20,601,570 | |
Inverse S&P 500® Strategy Fund | | | 58,278,469 | | | | 138,947 | | | | (509,000 | ) | | | (370,053 | ) |
Monthly Rebalance NASDAQ-100® 2x Strategy Fund | | | 114,874,101 | | | | 326,567 | | | | (309,739 | ) | | | 16,828 | |
Inverse NASDAQ-100® Strategy Fund | | | 28,302,956 | | | | 1,220,700 | | | | (43,195 | ) | | | 1,177,505 | |
Mid-Cap 1.5x Strategy Fund | | | 14,662,048 | | | | 3,166,241 | | | | (47,593 | ) | | | 3,118,648 | |
Inverse Mid-Cap Strategy Fund | | | 896,118 | | | | 6,262 | | | | (13,691 | ) | | | (7,429 | ) |
Russell 2000® 1.5x Strategy Fund | | | 12,791,113 | | | | 16,917 | | | | (32,955 | ) | | | (16,038 | ) |
Russell 2000® Fund | | | 54,986,447 | | | | 141,774 | | | | (55,555 | ) | | | 86,219 | |
Inverse Russell 2000® Strategy Fund | | | 5,130,575 | | | | 159,655 | | | | (13,759 | ) | | | 145,896 | |
Dow Jones Industrial Average® Fund | | | 19,418,589 | | | | 4,128,945 | | | | (196,662 | ) | | | 3,932,283 | |
Government Long Bond 1.2x Strategy Fund | | | 166,858,119 | | | | — | | | | (5,827,002 | ) | | | (5,827,002 | ) |
Inverse Government Long Bond Strategy Fund | | | 43,793,421 | | | | 1,846,632 | | | | (1,225 | ) | | | 1,845,407 | |
High Yield Strategy Fund | | | 21,334,772 | | | | 213,274 | | | | (76,105 | ) | | | 137,169 | |
Inverse High Yield Strategy Fund | | | 9,205,091 | | | | 17,560 | | | | (49,645 | ) | | | (32,085 | ) |
U.S. Government Money Market Fund | | | 353,464,165 | | | | — | | | | — | | | | — | |
Pursuant to U.S. federal income tax regulations applicable to regulated investment companies, the Funds have elected to treat net capital losses and certain ordinary losses realized between November 1 and March 31 of each year as occurring on the first day of the following tax year. The Funds have also elected to treat certain ordinary losses realized between January 1 and March 31 of each year as occurring on the first day of the following tax year. For the year ended March 31, 2021, the following losses reflected in the accompanying financial statements were deferred for U.S. federal income tax purposes until April 1, 2021:
Fund | | Ordinary | | | Capital | |
Inverse NASDAQ-100® Strategy Fund | | $ | (90,184 | ) | | $ | — | |
Inverse Mid-Cap Strategy Fund | | | (1,431 | ) | | | — | |
Inverse Russell 2000® Strategy Fund | | | (43,202 | ) | | | — | |
Inverse Government Long Bond Strategy Fund | | | (463,557 | ) | | | — | |
High Yield Strategy Fund | | | (1,561,786 | ) | | | — | |
192 | THE RYDEX FUNDS ANNUAL REPORT | |
NOTES TO FINANCIAL STATEMENTS (continued) |
Note 9 – Securities Transactions
For the year ended March 31, 2021, the cost of purchases and proceeds from sales of investment securities, excluding government securities, short-term investments and derivatives, were as follows:
Fund | | Purchases | | | Sales | |
Nova Fund | | $ | 1,893,942,976 | | | $ | 1,629,582,120 | |
S&P 500® Fund | | | 380,846,135 | | | | 392,296,817 | |
Inverse S&P 500® Strategy Fund | | | 800,000 | | | | — | |
Monthly Rebalance NASDAQ-100® 2x Strategy Fund | | | 1,101,857,015 | | | | 1,110,090,216 | |
Inverse NASDAQ-100® Strategy Fund | | | 1,150,000 | | | | 2,600,000 | |
Mid-Cap 1.5x Strategy Fund | | | 70,178,417 | | | | 66,323,259 | |
Inverse Mid-Cap Strategy Fund | | | 105,018 | | | | 160,000 | |
Russell 2000® 1.5x Strategy Fund | | | 1,612,999 | | | | — | |
Russell 2000® Fund | | | — | | | | — | |
Inverse Russell 2000® Strategy Fund | | | 975,000 | | | | 400,000 | |
Dow Jones Industrial Average® Fund | | | 20,272,865 | | | | 23,315,664 | |
Government Long Bond 1.2x Strategy Fund | | | 8,600,000 | | | | 18,800,000 | |
Inverse Government Long Bond Strategy Fund | | | 3,100,000 | | | | — | |
High Yield Strategy Fund | | | 10,600,000 | | | | 9,725,000 | |
Inverse High Yield Strategy Fund | | | 5,870,000 | | | | 7,260,000 | |
U.S. Government Money Market Fund | | | 3,613,539 | | | | — | |
For the year ended March 31, 2021, the cost of purchases and proceeds from sales of government securities were as follows:
Fund | | Purchases | | | Sales | |
Government Long Bond 1.2x Strategy Fund | | $ | 1,841,747,086 | | | $ | 1,785,130,336 | |
Inverse Government Long Bond Strategy Fund | | | 972,700,477 | | | | 995,619,188 | |
The Funds are permitted to purchase or sell securities from or to certain affiliated funds under specified conditions outlined in procedures adopted by the Board. The procedures have been designed to ensure that any purchase or sale of securities by a Fund from or to another fund or portfolio that is or could be considered an affiliate by virtue of having a common investment adviser (or affiliated investment advisers), common trustees and/or common officers complies with Rule 17a-7 of the 1940 Act. Further, as defined under these procedures, each transaction is effected at the current market price to save costs, where permissible. For the year ended March 31, 2021, the Funds engaged in purchases and sales of securities, pursuant to Rule 17a-7 of the 1940 Act, as follows:
Fund | | Purchases | | | Sales | | | Realized
Gain (Loss) | |
Nova Fund | | $ | 597,332,194 | | | $ | 412,840,069 | | | $ | 9,235,681 | |
S&P 500® Fund | | | 202,758,088 | | | | 275,312,049 | | | | 6,146,086 | |
Monthly Rebalance NASDAQ-100® 2x Strategy Fund | | | 472,112,100 | | | | 193,892,753 | | | | 1,151,928 | |
Mid-Cap 1.5x Strategy Fund | | | 3,002,105 | | | | 4,289,263 | | | | 116,695 | |
Dow Jones Industrial Average® Fund | | | 8,990,542 | | | | 11,491,700 | | | | 745,578 | |
Note 10 – Line of Credit
The Trust, along with other affiliated trusts, secured an uncommitted $75,000,000 line of credit from U.S. Bank, N.A., which expired June 8, 2020. On June 8, 2020, the line of credit agreement was renewed at an increased amount of $150,000,000 and expires on June 7, 2021. On February 10, 2021, the line of credit was increased from $150,000,000 to $200,000,000. This line of credit is reserved for emergency or temporary purposes. Borrowings, if any, under this arrangement bear interest equal to the Prime Rate, minus 2%, which shall be paid monthly, averaging 1.25% for the year ended March 31, 2021. The Funds did not have any borrowings outstanding under this agreement at March 31, 2021.
| | THE RYDEX FUNDS ANNUAL REPORT | 193 |
NOTES TO FINANCIAL STATEMENTS (continued) |
The average daily balances borrowed for the year ended March 31, 2021, were as follows:
Fund | | Average Daily Balance | |
Nova Fund | | $ | 129,000 | |
S&P 500® Strategy Fund | | | 526 | |
Monthly Rebalance NASDAQ-100® 2x Strategy Fund | | | 48,170 | |
Inverse NASDAQ-100® Strategy Fund | | | 30 | |
Mid-Cap 1.5x Strategy Fund | | | 7,386 | |
Government Long Bond 1.2x Strategy Fund | | | 34,693 | |
Note 11 – Reverse Share Splits
Effective on August 17, 2020, reverse share splits occurred for the following Funds:
Fund | Split Type |
Inverse Mid-Cap Strategy Fund | One-for-Five Reverse Share Split |
Inverse Russell 2000® Strategy Fund | One-for-Five Reverse Share Split |
Inverse Government Long Bond Strategy Fund | One-for-Five Reverse Share Split |
High Yield Strategy Fund | One-for-Five Reverse Share Split |
The effect of these transactions was to divide the number of outstanding shares of the Inverse Mid-Cap Strategy Fund, the Inverse Russell 2000 Strategy Fund, the Inverse Government Long Bond Strategy Fund and the High Yield Strategy Fund, by their respective reverse share split ratios, resulting in a corresponding increase in the NAV. The share transactions presented in the Statement of Changes in Net Assets and the Per Share Data in the Financial Highlights for each of the periods presented prior to the effective date, have been restated to reflect these respective share splits. There were no changes in net assets, results of operations or total return as a result of these transactions.
Note 12 – Legal Proceedings
Tribune Company
Rydex Series Funds has been named as a defendant and a putative member of the proposed defendant class of shareholders in the case entitled Kirschner v. FitzSimons, No. 12-2652 (S.D.N.Y.) (formerly Official Committee of Unsecured Creditors of Tribune Co. v. FitzSimons, Adv. Pro. No. 10-54010 (Bankr. D. Del.)) (the “FitzSimons action”), as a result of ownership by certain series of the Rydex Series Funds of shares in the Tribune Company (“Tribune”) in 2007, when Tribune effected a leveraged buyout transaction (“LBO”) by which Tribune converted to a privately-held company. In his complaint, the plaintiff has alleged that, in connection with the LBO, Tribune insiders and shareholders were overpaid for their Tribune stock using financing that the insiders knew would, and ultimately did, leave Tribune insolvent. The plaintiff has asserted claims against certain insiders, major shareholders, professional advisers, and others involved in the LBO. The plaintiff is also attempting to obtain from former Tribune shareholders, including the Rydex Series Funds, the proceeds they received in connection with the LBO.
In June 2011, a group of Tribune creditors filed multiple actions against former Tribune shareholders involving state law constructive fraudulent conveyance claims arising out of the 2007 LBO (the “SLCFC actions”). Rydex Series Funds has been named as a defendant in one or more of these suits. In those actions, the creditors seek to recover from Tribune’s former shareholders the proceeds received in connection with the 2007 LBO.
The FitzSimons action and the SLCFC actions have been consolidated with the majority of the other Tribune LBO-related lawsuits in a multidistrict litigation proceeding captioned In re Tribune Company Fraudulent Conveyance Litig., No. 11-md-2296 (S.D.N.Y.) (the “MDL Proceeding”).
On September 23, 2013, the District Court granted the defendants’ omnibus motion to dismiss the SLCFC actions, on the basis that the creditors lacked standing. On September 30, 2013, the creditors filed a notice of appeal of the September 23 order. On October 28, 2013, the defendants filed a joint notice of cross-appeal of that same order.
194 | THE RYDEX FUNDS ANNUAL REPORT | |
NOTES TO FINANCIAL STATEMENTS (continued) |
On March 29, 2016, the U.S. Court of Appeals for the Second Circuit issued its opinion on the appeal of the SLCFC actions. The appeals court affirmed the district court’s dismissal of those lawsuits, but on different grounds than the district court. The appeals court held that while the plaintiffs have standing under the U.S. Bankruptcy Code, their claims were preempted by Section 546(e) of the Bankruptcy Code—the statutory safe harbor for settlement payments.
On April 12, 2016, the Plaintiffs in the SLCFC actions filed a petition seeking rehearing en banc before the appeals court. On July 22, 2016, the appeals court denied the petition. On September 9, 2016, the plaintiffs filed a petition for writ of certiorari in the U.S. Supreme Court challenging the Second Circuit’s decision that the safe harbor of Section 546(e) applied to their claims. The shareholder defendants, including the Funds, filed a joint brief in opposition to the petition for certiorari on October 24, 2016. On April 3, 2018, Justice Kennedy and Justice Thomas issued a “Statement” related to the petition for certiorari suggesting that the Second Circuit and/or District Court may want to take steps to reexamine the application of the Section 546(e) safe harbor to the previously dismissed state law constructive fraudulent transfer claims based on the Supreme Court’s decision in Merit Management Group LP v. FTI Consulting, Inc. On April 10, 2018, Plaintiffs filed in the Second Circuit a motion for that court to recall its mandate, vacate its prior decision, and remand to the district court for further proceedings consistent with Merit Management. On April 20, 2018, the shareholder defendants filed an opposition to Plaintiffs’ motion to recall the mandate. On May 15, 2018, the Second Circuit issued an order recalling the mandate “in anticipation of further panel review.” On December 19, 2019, the Second Circuit issued an amended opinion that again affirmed the district court’s ruling on the basis that plaintiffs’ claims were preempted by Section 546(e) of the Bankruptcy Code. Plaintiffs filed a motion for rehearing and rehearing en banc on January 2, 2020. The Second Circuit denied the petition on February 6, 2020. On July 6, 2020, plaintiffs filed a new petition for a writ of certiorari in the U.S. Supreme Court. In that petition, plaintiffs stated that “[t]o make it more likely that there will be a quorum for this petition,” they have “abandon[ed] the case and let the judgment below stand” with respect to certain defendants. That list did not include the Rydex Series Funds. Defendants filed an opposition to the certiorari petition on August 26, 2020, and plaintiffs filed a reply in support of the petition for certiorari on September 8, 2020. On March 12, 2021, the Solicitor General filed an amicus brief recommending that certiorari be denied. Plaintiffs filed a supplemental brief in response to the Solicitor General’s amicus brief on March 31, 2021, and Defendants filed a supplemental brief on April 1, 2021.
On May 23, 2014, the defendants filed motions to dismiss the FitzSimons action, including a global motion to dismiss Count I, which is the claim brought against former Tribune shareholders for intentional fraudulent conveyance under U.S. federal law. On January 6, 2017, the United States District Court for the Southern District of New York granted the shareholder defendants’ motion to dismiss the intentional fraudulent conveyance claim in the FitzSimons action. In dismissing the intentional fraudulent conveyance claim, the Court denied the plaintiff’s request to amend the complaint. The plaintiff requested that the Court direct entry of a final judgment in order to make the order immediately appealable. On February 23, 2017, the Court issued an order stating that it intended to permit an interlocutory appeal of the dismissal order, but would wait to do so until it has resolved outstanding motions to dismiss filed by other defendants.
On July 18, 2017, the plaintiff submitted a letter to the District Court seeking leave to amend its complaint to add a constructive fraudulent transfer claim. The shareholder defendants opposed that request. On August 24, 2017, the Court denied the plaintiff’s request without prejudice to renewal of the request in the event of an intervening change in the law. On March 8, 2018, the plaintiff renewed his request for leave to file a motion to amend the complaint to assert a constructive fraudulent transfer claim based on the Supreme Court’s ruling in Merit Management Group LP v. FTI Consulting, Inc. The shareholder defendants opposed that request. On June 18, 2018 the District Court ordered that the request would be stayed pending further action by the Second Circuit in the SLCFC actions.
On December 18, 2018, plaintiff filed a letter with the District Court requesting that the stay be dissolved in order to permit briefing on the motion to amend the complaint and indicating plaintiff’s intention to file another motion to amend the complaint to reinstate claims for intentional fraudulent transfer. The shareholder defendants opposed that request. On January 14, 2019, the court held a case management conference, during which the court stated that it would not lift the stay prior to further action from the Second Circuit in the SLCFC actions. The court further stated that it would allow the plaintiff to file a motion to amend to try to reinstate its intentional fraudulent transfer claim. On January 23, 2019, the court ordered the parties still facing pending claims to participate in a mediation, to commence on January 28, 2019. The mediation did not result in a settlement of the claims against the shareholder defendants.
On April 4, 2019, plaintiff filed a motion to amend the Fifth Amended Complaint to assert a federal constructive fraudulent transfer claim against certain shareholder defendants. On April 10, 2019, the shareholder defendants filed a brief in opposition to plaintiff’s motion to amend. On April 12, 2019, the plaintiff filed a reply brief. On April 23, 2019, the court denied the plaintiff’s motion to amend. On June 13, 2019, the court entered judgment pursuant to Rule 54(b). On July 12, 2019, the Plaintiff filed a notice of appeal with respect to the dismissal of his claims and the District Court’s denial of his motion for leave to amend. Plaintiff filed an appellate brief on January 7, 2020. The shareholder defendants’ brief was filed on April 27, 2020. Plaintiff filed a reply brief on May 18, 2020. The Court held oral argument on August 24, 2020.
| | THE RYDEX FUNDS ANNUAL REPORT | 195 |
NOTES TO FINANCIAL STATEMENTS (concluded) |
None of these lawsuits alleges any wrongdoing on the part of Rydex Series Funds. The following series of Rydex Series Funds held shares of Tribune and tendered these shares as part of Tribune’s LBO: Nova Fund, S&P 500® Pure Value Fund, Multi-Cap Core Equity Fund, S&P 500® Fund, Multi-Hedge Strategies Fund and Hedged Equity Fund (the “Funds”). The value of the proceeds received by the foregoing Funds was $28,220, $109,242, $9,860, $3,400, $1,181,160, and $10,880, respectively. At this stage of the proceedings, Rydex Series Funds is not able to make a reliable predication as to the outcome of these lawsuits or the effect, if any, on a Fund’s net asset value.
Note 13 – COVID-19
The global ongoing crisis caused by the outbreak of COVID-19 and the current recovery underway is causing disruption to consumer demand and economic output and supply chains. There are still travel restrictions and quarantines, and adverse impacts on local and global economies. Investors should be aware that in light of the current uncertainty, volatility and distress in economies, financial markets, and labor and public health conditions around the world, the Funds’ investments and a shareholder’s investment in a Fund are subject to sudden and substantial losses, increased volatility and other adverse events. Firms through which investors invest with the Funds, the Funds, their service providers, the markets in which they invest and market intermediaries are also impacted by quarantines and similar measures intended to respond to and contain the ongoing pandemic, which can obstruct their functioning and subject them to heightened operational and other risks.
Note 14 – Subsequent Events
The Funds evaluated subsequent events through the date the financial statements were available for issue and determined there were no material events that would require adjustment to or disclosure in the Funds’ financial statements.
196 | THE RYDEX FUNDS ANNUAL REPORT | |
REPORT OF INDEPENDENT REGISTERED PUBLIC ACCOUNTING FIRM |
To the Shareholders of Nova Fund, S&P 500® Fund, Inverse S&P 500® Strategy Fund, Monthly Rebalance NASDAQ-100® 2x Strategy Fund, Inverse NASDAQ-100® Strategy Fund, Mid-Cap 1.5x Strategy Fund, Inverse Mid-Cap Strategy Fund, Russell 2000® 1.5x Strategy Fund, Russell 2000® Fund, Inverse Russell 2000® Strategy Fund, Dow Jones Industrial Average® Fund, Government Long Bond 1.2x Strategy Fund, Inverse Government Long Bond Strategy Fund, High Yield Strategy Fund, Inverse High Yield Strategy Fund and U.S. Government Money Market Fund and the Board of Trustees of Rydex Series Funds
Opinion on the Financial Statements
We have audited the accompanying statements of assets and liabilities of Nova Fund, S&P 500® Fund, Inverse S&P 500® Strategy Fund, Monthly Rebalance NASDAQ-100® 2x Strategy Fund, Inverse NASDAQ-100® Strategy Fund, Mid-Cap 1.5x Strategy Fund, Inverse Mid-Cap Strategy Fund, Russell 2000® 1.5x Strategy Fund, Russell 2000® Fund, Inverse Russell 2000® Strategy Fund, Dow Jones Industrial Average® Fund, Government Long Bond 1.2x Strategy Fund, Inverse Government Long Bond Strategy Fund, High Yield Strategy Fund, Inverse High Yield Strategy Fund and U.S. Government Money Market Fund (collectively referred to as the “Funds”), (sixteen of the funds constituting Rydex Series Funds (the “Trust”)), including the schedules of investments, as of March 31, 2021, and the related statements of operations for the year then ended, the statements of changes in net assets for each of the two years in the period then ended, the financial highlights for each of the five years in the period then ended and the related notes (collectively referred to as the “financial statements”). In our opinion, the financial statements present fairly, in all material respects, the financial position of each of the Funds (sixteen of the funds constituting Rydex Series Funds) at March 31, 2021, the results of their operations for the year then ended, the changes in their net assets for each of the two years in the period then ended and their financial highlights for each of the five years in the period then ended, in conformity with U.S. generally accepted accounting principles.
Basis for Opinion
These financial statements are the responsibility of the Trust’s management. Our responsibility is to express an opinion on each of the Funds’ financial statements based on our audits. We are a public accounting firm registered with the Public Company Accounting Oversight Board (United States) (“PCAOB”) and are required to be independent with respect to the Trust in accordance with the U.S. federal securities laws and the applicable rules and regulations of the Securities and Exchange Commission and the PCAOB.
We conducted our audits in accordance with the standards of the PCAOB. Those standards require that we plan and perform the audit to obtain reasonable assurance about whether the financial statements are free of material misstatement, whether due to error or fraud. The Trust is not required to have, nor were we engaged to perform, an audit of the Trust’s internal control over financial reporting. As part of our audits, we are required to obtain an understanding of internal control over financial reporting but not for the purpose of expressing an opinion on the effectiveness of the Trust’s internal control over financial reporting. Accordingly, we express no such opinion.
Our audits included performing procedures to assess the risks of material misstatement of the financial statements, whether due to error or fraud, and performing procedures that respond to those risks. Such procedures included examining, on a test basis, evidence regarding the amounts and disclosures in the financial statements. Our procedures included confirmation of securities owned as of March 31, 2021, by correspondence with the custodian, transfer agent, and brokers or by other appropriate auditing procedures where replies from brokers were not received. Our audits also included evaluating the accounting principles used and significant estimates made by management, as well as evaluating the overall presentation of the financial statements. We believe that our audits provide a reasonable basis for our opinion.
We have served as the auditor of one or more Guggenheim investment companies since 1979.

Tysons, Virginia
May 26, 2021
| | THE RYDEX FUNDS ANNUAL REPORT | 197 |
OTHER INFORMATION (Unaudited) |
Federal Income Tax Information
This information is being provided as required by the Internal Revenue Code. Amounts shown may differ from those elsewhere in the report because of differences in tax and financial reporting practice.
In January 2022, shareholders will be advised on IRS Form 1099 DIV or substitute 1099 DIV as to the federal tax status of the distributions received by shareholders in the calendar year 2021.
The Funds’ investment income (dividend income plus short-term capital gains, if any) qualifies as follows:
Of the taxable ordinary income distributions paid during the fiscal year ending March 31, 2021, the following funds had the corresponding percentages qualify for the reduced tax rate pursuant to the Jobs and Growth Tax Relief and Reconciliation Act of 2003 or for the dividends received deduction for corporations. See the qualified dividend income and dividend received deduction columns, respectively, in the table below.
Additionally, of the taxable ordinary income distributions paid during the fiscal year ended March 31, 2021, the following funds had the corresponding percentages qualify as interest related dividends and qualified short-term capital gains as permitted by IRC Section 871(k)(1) and IRC Section 871(k)(2), respectively. See qualified interest income and qualified short-term capital gain columns, respectively, in the table below.
Fund | | Qualified
Dividend
Income | | | Dividend
Received
Deduction | | | Qualified
Interest
Income | | | Qualified
Short-Term
Capital Gain | |
Nova Fund | | | 0.00 | % | | | 0.00 | % | | | 0.17 | % | | | 0.00 | % |
S&P 500® Fund | | | 24.87 | % | | | 24.83 | % | | | 1.54 | % | | | 100.00 | % |
Monthly Rebalance NASDAQ-100® 2x Strategy Fund | | | 1.00 | % | | | 1.31 | % | | | 0.20 | % | | | 100.00 | % |
Mid-Cap 1.5x Strategy Fund | | | 86.40 | % | | | 99.12 | % | | | 0.25 | % | | | 0.00 | % |
Russell 2000® 1.5x Strategy Fund | | | 0.00 | % | | | 0.00 | % | | | 0.10 | % | | | 0.00 | % |
Dow Jones Industrial Average® Fund | | | 13.33 | % | | | 13.47 | % | | | 0.00 | % | | | 100.00 | % |
Government Long Bond 1.2x Strategy Fund | | | 0.00 | % | | | 0.00 | % | | | 52.14 | % | | | 100.00 | % |
Inverse High Yield Strategy Fund | | | 0.16 | % | | | 0.16 | % | | | 5.59 | % | | | 0.00 | % |
U.S. Government Money Market Fund | | | 0.00 | % | | | 0.00 | % | | | 99.13 | % | | | 100.00 | % |
With respect to the taxable year ended March 31, 2021, the Funds hereby designate as capital gain dividends the amounts listed below, or, if subsequently determined to be different, the net capital gain of such year:
Fund | | From long-term
capital gain: | | | From long-term capital
gain, using proceeds
from shareholder
redemptions: | |
S&P 500® Fund | | $ | 10,400,477 | | | $ | 14,419,235 | |
Monthly Rebalance NASDAQ-100® 2x Strategy Fund | | | — | | | | 13,152,316 | |
Mid-Cap 1.5x Strategy Fund | | | — | | | | 768,173 | |
Russell 2000® 1.5x Strategy Fund | | | — | | | | 302,260 | |
Dow Jones Industrial Average® Fund | | | — | | | | 866,215 | |
U.S. Government Money Market Fund | | | 4,651 | | | | — | |
Delivery of Shareholder Reports
Paper copies of the Funds’ annual and semi-annual shareholder reports are not sent by mail, unless you specifically request paper copies of the reports from a fund or from your financial intermediary. Instead, the reports are made available on a website, and you are notified by mail each time a report is posted and provided with a website link to access the report.
198 | THE RYDEX FUNDS ANNUAL REPORT | |
OTHER INFORMATION (Unaudited)(concluded) |
You may elect to receive all future shareholder reports in paper free of charge. If you hold shares of a fund directly, you can inform the Fund that you wish to receive paper copies of reports by calling 800.820.0888. If you hold shares of a fund through a financial intermediary, please contact the financial intermediary to make this election. Your election to receive reports in paper may apply to all Guggenheim Funds in which you are invested and may apply to all Guggenheim funds held with your financial intermediary.
Proxy Voting Information
A description of the policies and procedures that the Trust uses to determine how to vote proxies relating to securities held in the Funds’ portfolios is available, without charge and upon request, by calling 800.820.0888. This information is also available from the EDGAR database on the SEC’s website at https://www.sec.gov.
Information regarding how the Funds’ voted proxies relating to portfolio securities during the most recent 12-month period ended June 30 is available without charge, upon request, by calling 800.820.0888. This information is also available from the EDGAR database on the SEC’s website at https://www.sec.gov.
Sector Classification
Information in the Schedule of Investments is categorized by sectors using sector-level Classifications defined by the Bloomberg Industry Classification System, a widely recognized industry classification system provider. Each Fund’s registration statement has investment policies relating to concentration in specific sectors/industries. For purposes of these investment policies, the Funds usually classify sectors/industries based on industry-level Classifications used by widely recognized industry classification system providers such as Bloomberg Industry Classification System, Global Industry Classification Standards and Barclays Global Classification Scheme.
Quarterly Portfolio Schedules Information
The Trust files its complete schedule of portfolio holdings with the SEC for the first and third quarters of each fiscal year as an exhibit to its reports on Form N-PORT, and for reporting periods ended prior to March 31, 2019, filed such information on Form N-Q. The Funds’ Forms N-PORT and N-Q are available on the SEC’s website at https://www.sec.gov. Copies of the portfolio holdings are also available to shareholders, without charge and upon request, by calling 800.820.0888.
| | THE RYDEX FUNDS ANNUAL REPORT | 199 |
INFORMATION ON BOARD OF TRUSTEES AND OFFICERS (Unaudited) |
A Board of Trustees oversees the Trust, as well as other trusts of GI, in which its members have no stated term of service, and continue to serve after election until resignation. The Statement of Additional Information includes further information about Fund Trustees and Officers, and can be obtained without charge by visiting guggenheiminvestments.com or by calling 800.820.0888.
Name, Address*
and Year of Birth | Position(s)
Held with
Trust | Term of Office
and Length of
Time Served** | Principal Occupation(s)
During Past Five Years | Number of
Portfolios
in Fund
Complex
Overseen | Other
Directorships Held
by Trustees*** |
INDEPENDENT TRUSTEES | | | |
Randall C. Barnes (1951) | Trustee and Chair of the Valuation Oversight Committee | Since 2019 (Trustee) Since 2020 (Chair of the Valuation Oversight Committee) | Current: Private Investor (2001-present). Former: Senior Vice President and Treasurer, PepsiCo, Inc. (1993-1997); President, Pizza Hut International (1991-1993); Senior Vice President, Strategic Planning and New Business Development, PepsiCo, Inc. (1987-1990). | 157 | Current: Purpose Investments Funds (2013-present). Former: Managed Duration Investment Grade Municipal Fund (2006-2016). |
Angela Brock-Kyle (1959) | Trustee | Since 2016 | Current: Founder and Chief Executive Officer, B.O.A.R.D.S. (2013-present). Former: Senior Leader, TIAA (1987-2012). | 156 | Current: Bowhead Insurance GP, LLC (2020-present); Hunt Companies, Inc. (2019-present). Former: Infinity Property & Casualty Corp. (2014-2018). |
Thomas F. Lydon, Jr. (1960) | Trustee and Chair of the Contracts Review Committee | Since 2005 (Trustee) Since 2020 (Chair of the Contracts Review Committee) | Current: President, Global Trends Investments (1996-present); Co-Chief Executive Officer, ETF Flows, LLC (2019-present); Chief Executive Officer, Lydon Media (2016-present). | 156 | Current: US Global Investors (GROW) (1995-present). Former: Harvest Volatility Edge Trust (3) (2017-2019). |
Ronald A. Nyberg (1953) | Trustee and Chair of the Nominating and Governance Committee | Since 2019 | Current: Of Counsel, Momkus LLP (2016-present). Former: Partner, Nyberg & Cassioppi, LLC (2000-2016); Executive Vice President, General Counsel, and Corporate Secretary, Van Kampen Investments (1982-1999). | 157 | Current: PPM Funds (2) (2018-present); Edward-Elmhurst Healthcare System (2012-present). Former: Western Asset Inflation-Linked Opportunities & Income Fund (2004-2020); Western Asset Inflation-Linked Income Fund (2003-2020); Managed Duration Investment Grade Municipal Fund (2003-2016). |
200 | THE RYDEX FUNDS ANNUAL REPORT | |
INFORMATION ON BOARD OF TRUSTEES AND OFFICERS (Unaudited)(continued) |
Name, Address*
and Year of Birth | Position(s)
Held with
Trust | Term of Office
and Length of
Time Served** | Principal Occupation(s)
During Past Five Years | Number of
Portfolios
in Fund
Complex
Overseen | Other
Directorships Held
by Trustees*** |
INDEPENDENT TRUSTEES - concluded | | |
Sandra G. Sponem (1958) | Trustee and Chair of the Audit Committee | Since 2016 (Trustee) Since 2019 (Chair of the Audit Committee) | Current: Retired. Former: Senior Vice President and Chief Financial Officer, M.A. Mortenson-Companies, Inc. (2007-2017). | 156 | Current: SPDR Series Trust (81) (2018-present); SPDR Index Shares Funds (30) (2018-present); SSGA Active Trust (14) (2018-present). Former: SSGA Master Trust (1) (2018-2020). |
Ronald E. Toupin, Jr. (1958) | Trustee, Chair of the Board and Chair of the Executive Committee | Since 2019 | Current: Portfolio Consultant (2010-present); Member, Governing Council, Independent Directors Council (2013-present); Governor, Board of Governors, Investment Company Institute (2018-present). Former: Member, Executive Committee, Independent Directors Council (2016-2018); Vice President, Manager and Portfolio Manager, Nuveen Asset Management (1998-1999); Vice President, Nuveen Investment Advisory Corp. (1992-1999); Vice President and Manager, Nuveen Unit Investment Trusts (1991-1999); and Assistant Vice President and Portfolio Manager, Nuveen Unit Investment Trusts (1988-1999), each of John Nuveen & Co., Inc. (1982-1999). | 156 | Former: Western Asset Inflation-Linked Opportunities & Income Fund (2004-2020); Western Asset Inflation-Linked Income Fund (2003-2020); Managed Duration Investment Grade Municipal Fund (2003-2016). |
| | THE RYDEX FUNDS ANNUAL REPORT | 201 |
INFORMATION ON BOARD OF TRUSTEES AND OFFICERS (Unaudited)(continued) |
Name, Address*
and Year of Birth | Position(s)
Held with
Trust | Term of Office
and Length of
Time Served** | Principal Occupation(s)
During Past Five Years | Number of
Portfolios
in Fund
Complex
Overseen | Other
Directorships Held
by Trustees*** |
INTERESTED TRUSTEE | | | | |
Amy J. Lee**** (1961) | Trustee, Vice President and Chief Legal Officer | Since 2019 | Current: Interested Trustee, certain other funds in the Fund Complex (2018-present); Chief Legal Officer, certain other funds in the Fund Complex (2014-present); Vice President, certain other funds in the Fund Complex (2007-present); Senior Managing Director, Guggenheim Investments (2012-present). Former: President and Chief Executive Officer, certain other funds in the Fund Complex (2017-2019); Vice President, Associate General Counsel and Assistant Secretary, Security Benefit Life Insurance Company and Security Benefit Corporation (2004-2012). | 156 | None. |
* | The business address of each Trustee is c/o Guggenheim Investments, 227 West Monroe Street, Chicago, Illinois 60606. |
** | Each Trustee serves an indefinite term, until his or her successor is elected and qualified. |
*** | Each Trustee also serves on the Boards of Trustees of Guggenheim Funds Trust, Guggenheim Variable Funds Trust, Guggenheim Strategy Funds Trust, Fiduciary/Claymore Energy Infrastructure Fund, Guggenheim Taxable Municipal Bond & Investment Grade Debt Trust, Guggenheim Strategic Opportunities Fund, Guggenheim Enhanced Equity Income Fund, Guggenheim Energy & Income Fund, Guggenheim Credit Allocation Fund, Rydex Series Funds, Rydex Dynamic Funds, Rydex Variable Trust and Transparent Value Trust. Messrs. Barnes and Nyberg also serve on the Board of Trustees of Advent Convertible & Income Fund. |
**** | This Trustee is deemed to be an “interested person” of the Funds under the 1940 Act by reason of her position with the Funds’ Investment Manager and/or the parent of the Investment Manager. |
202 | THE RYDEX FUNDS ANNUAL REPORT | |
INFORMATION ON BOARD OF TRUSTEES AND OFFICERS (Unaudited)(continued) |
Name, Address*
and Year of Birth | Position(s)
Held with
Trust | Term of Office
and Length of
Time Served** | Principal Occupation(s)
During Past Five Years |
OFFICERS | | | |
Brian E. Binder (1972) | President and Chief Executive Officer | Since 2019 | Current: President and Chief Executive Officer, certain other funds in the Fund Complex (2018-present); President, Chief Executive Officer and Chairman of the Board of Managers, Guggenheim Funds Investment Advisors, LLC (2018-present); President and Chief Executive Officer, Security Investors, LLC (2018-present); Board Member of Guggenheim Partners Fund Management (Europe) Limited (2018-present); Senior Managing Director and Chief Administrative Officer, Guggenheim Investments (2018-present).
Former: Managing Director and President, Deutsche Funds, and Head of US Product, Trading and Fund Administration, Deutsche Asset Management (2013-2018); Managing Director, Head of Business Management and Consulting, Invesco Ltd. (2010-2012). |
James M. Howley (1972) | Assistant Treasurer | Since 2016 | Current: Managing Director, Guggenheim Investments (2004-present); Assistant Treasurer, certain other funds in the Fund Complex (2006-present).
Former: Manager, Mutual Fund Administration of Van Kampen Investments, Inc. (1996-2004). |
Mark E. Mathiasen (1978) | Secretary | Since 2017 | Current: Secretary, certain other funds in the Fund Complex (2007-present); Managing Director, Guggenheim Investments (2007-present). |
Glenn McWhinnie (1969) | Assistant Treasurer | Since 2016 | Current: Vice President, Guggenheim Investments (2009-present); Assistant Treasurer, certain other funds in the Fund Complex (2016-present). |
Michael P. Megaris (1984) | Assistant Secretary | Since 2018 | Current: Assistant Secretary, certain other funds in the Fund Complex (2014-present); Director, Guggenheim Investments (2012-present). |
Elisabeth Miller (1968) | Chief Compliance Officer | Since 2012 | Current: Chief Compliance Officer, certain other funds in the Fund Complex (2012-present); Senior Managing Director, Guggenheim Investments (2012-present). Vice President, Guggenheim Funds Distributors, LLC (2014-present).
Former: Chief Compliance Officer, Security Investors, LLC and Guggenheim Funds Investment Advisors, LLC (2012-2018); Chief Compliance Officer, Guggenheim Distributors, LLC (2009-2014); Senior Manager, Security Investors, LLC (2004-2014); Senior Manager, Guggenheim Distributors, LLC (2004-2014). |
Margaux Misantone (1978) | AML Officer | Since 2017 | Current: Chief Compliance Officer, Security Investors, LLC and Guggenheim Funds Investment Advisors, LLC (2018-present); AML Officer, Security Investors, LLC and certain other funds in the Fund Complex (2017-present); Managing Director, Guggenheim Investments (2015-present).
Former: Assistant Chief Compliance Officer, Security Investors, LLC and Guggenheim Funds Investments Advisors, LLC (2015-2018). |
| | THE RYDEX FUNDS ANNUAL REPORT | 203 |
INFORMATION ON BOARD OF TRUSTEES AND OFFICERS (Unaudited)(concluded) |
Name, Address*
and Year of Birth | Position(s)
Held with
Trust | Term of Office
and Length of
Time Served** | Principal Occupation(s)
During Past Five Years |
OFFICERS - concluded | |
Kimberly J. Scott (1974) | Assistant Treasurer | Since 2016 | Current: Director, Guggenheim Investments (2012-present); Assistant Treasurer, certain other funds in the Fund Complex (2012-present).
Former: Financial Reporting Manager, Invesco, Ltd. (2010-2011); Vice President/Assistant Treasurer, Mutual Fund Administration for Van Kampen Investments, Inc./Morgan Stanley Investment Management (2009-2010); Manager of Mutual Fund Administration, Van Kampen Investments, Inc./Morgan Stanley Investment Management (2005-2009). |
Bryan Stone (1979) | Vice President | Since 2019 | Current: Vice President, certain other funds in the Fund Complex (2014-present); Managing Director, Guggenheim Investments (2013-present).
Former: Senior Vice President, Neuberger Berman Group LLC (2009-2013); Vice President, Morgan Stanley (2002-2009). |
John L. Sullivan (1955) | Chief Financial Officer, Chief Accounting Officer and Treasurer | Since 2016 | Current: Chief Financial Officer, Chief Accounting Officer and Treasurer, certain other funds in the Fund Complex (2010-present); Senior Managing Director, Guggenheim Investments (2010-present).
Former: Managing Director and Chief Compliance Officer, each of the funds in the Van Kampen Investments fund complex (2004-2010); Managing Director and Head of Fund Accounting and Administration, Morgan Stanley Investment Management (2002-2004); Chief Financial Officer and Treasurer, Van Kampen Funds (1996-2004). |
Jon Szafran (1989) | Assistant Treasurer | Since 2017 | Current: Vice President, Guggenheim Investments (2017-present); Assistant Treasurer, certain other funds in the Fund Complex (2017-present).
Former: Assistant Treasurer of Henderson Global Funds and Manager of US Fund Administration, Henderson Global Investors (North America) Inc. (“HGINA”), (2017); Senior Analyst of US Fund Administration, HGINA (2014–2017); Senior Associate of Fund Administration, Cortland Capital Market Services, LLC (2013-2014); Experienced Associate, PricewaterhouseCoopers LLP (2012-2013). |
* | The business address of each officer is c/o Guggenheim Investments, 227 West Monroe Street, Chicago, Illinois 60606. |
** | Each officer serves an indefinite term, until his or her successor is duly elected and qualified. |
204 | THE RYDEX FUNDS ANNUAL REPORT | |
GUGGENHEIM INVESTMENTS PRIVACY NOTICE (Unaudited) |
Who We Are
This Privacy Notice describes the data protection practices of Guggenheim Investments. Guggenheim Investments as used herein refers to the affiliated investment management businesses of Guggenheim Partners, LLC: Guggenheim Funds Investment Advisors, LLC, Guggenheim Partners Investment Management, LLC, Guggenheim Funds Distributors, LLC, Security Investors, LLC, Guggenheim Investment Advisors (Europe) Limited, Guggenheim Real Estate, LLC, GS Gamma Advisors, LLC, Guggenheim Partners India Management, LLC, Guggenheim Partners Europe Limited, as well as the funds in the Guggenheim Funds complex (the “Funds”) (“Guggenheim Investments,” “we,” “us,” or “our”).
Guggenheim Partners Investment Management Holdings, LLC, located at 330 Madison Avenue, New York, New York 10017 is the data controller for your information. The affiliates who are also controllers of certain of your information are: Guggenheim Investment Advisors (Europe) Limited, Guggenheim Partners Europe Limited, Guggenheim Partners, LLC, Guggenheim Funds Investment Advisors, LLC, Guggenheim Partners Investment Management, LLC, Guggenheim Funds Distributors, LLC and Security Investors, LLC, as well as the Funds.
Our Commitment to You
Guggenheim Investments considers your privacy our utmost concern. When you become our client or investor, you entrust us with not only your hard-earned money but also with your personal and financial information. Because we have access to your private information, we hold ourselves to the highest standards in its safekeeping and use. We strictly limit how we share your information with others, whether you are a current or former Guggenheim Investments client or investor.
The Information We Collect About You
We collect certain nonpublic personal information about you from information you provide on applications, other forms, our website, and/or from third parties including investment advisors. This information includes Social Security or other tax identification number, assets, income, tax information, retirement and estate plan information, transaction history, account balance, payment history, bank account information, marital status, family relationships, information that we collect on our website through the use of “cookies,” and other personal information that you or others provide to us. We may also collect such information through your inquiries by mail, e-mail or telephone. We may also collect customer due diligence information, as required by applicable law and regulation, through third party service providers.
How We Handle Your Personal Information
The legal basis for using your information as set out in this Privacy Notice is as follows: (a) use of your personal data is necessary to perform our obligations under any contract with you (such as a contract for us to provide financial services to you); or (b) where use of your personal data is not necessary for performance of a contract, use of your personal data is necessary for our legitimate interests or the legitimate interests of others (for example, to enforce the legal terms governing our services, operate and market our website and other services we offer, ensure safe environments for our personnel and others, make and receive payments, prevent fraud and to know the customer to whom we are providing the services). Some processing is done to comply with applicable law.
In addition to the specific uses described above, we also use your information in the following manner:
| | ● | We use your information in connection with servicing your accounts. |
| | ● | We use information to respond to your requests or questions. For example, we might use your information to respond to your customer feedback. |
| | ● | We use information to improve our products and services. We may use your information to make our website and products better. We may use your information to customize your experience with us. |
| | ● | We use information for security purposes. We may use your information to protect our company and our customers. |
| | ● | We use information to communicate with you. For example, we will communicate with you about your account or our relationship. We may contact you about your feedback. We might also contact you about this Privacy Notice. We may also enroll you in our email newsletter. |
| | THE RYDEX FUNDS ANNUAL REPORT | 205 |
GUGGENHEIM INVESTMENTS PRIVACY NOTICE (Unaudited)(continued) |
| | ● | We use information as otherwise permitted by law, as we may notify you. |
| | ● | Aggregate/Anonymous Data. We may aggregate and/or anonymize any information collected through the website so that such information can no longer be linked to you or your device (“Aggregate/Anonymous Information”). We may use Aggregate/Anonymous Information for any purpose, including without limitation for research and marketing purposes, and may also share such data with any third parties, including advertisers, promotional partners, and sponsors. |
We do not sell information about current or former clients or their accounts to third parties. Nor do we share this information, except when necessary to complete transactions at your request, to make you aware of investment products and services that we or our affiliates offer, or as permitted or required by law.
We provide information about you to companies and individuals not affiliated with Guggenheim Investments to complete certain transactions or account changes, or to perform services for us related to your account. For example, if you ask to transfer assets from another financial institution to Guggenheim Investments, we must provide certain information about you to that company to complete the transaction. We provide the third party with only the information necessary to carry out its responsibilities and only for that purpose. And we require these third parties to treat your private information with the same high degree of confidentiality that we do. To alert you to other Guggenheim Investments products and services, we share your information within our family of affiliated companies. You may limit our sharing with affiliated companies as set out below. We may also share information with any successor to all or part of our business, or in connection with steps leading up to a merger or acquisition. For example, if part of our business was sold we may give customer information as part of that transaction. We may also share information about you with your consent.
We will release information about you if you direct us to do so, if we are compelled by law to do so, or in other circumstances as permitted by law (for example, to protect your account from fraud).
If you close your account(s) or become an inactive client or investor, we will continue to adhere to the privacy policies and practices described in this notice.
Opt-Out Provisions and Your Data Choices
The law allows you to “opt out” of certain kinds of information sharing with third parties. We do not share personal information about you with any third parties that triggers this opt-out right. This means YOU ARE ALREADY OPTED OUT.
When you are no longer our client or investor, we continue to share your information as described in this notice, and you may contact us at any time to limit our sharing by sending an email to CorporateDataPrivacy@GuggenheimPartners.com.
European Union Data Subjects and certain others: In addition to the choices set forth above, residents of the European Union and certain other jurisdictions have certain rights to (1) request access to or rectification or deletion of information we collect about them, (2) request a restriction on the processing of their information, (3) object to the processing of their information, or (4) request the portability of certain information. To exercise these or other rights, please contact us using the contact information below. We will consider all requests and provide our response within the time period stated by applicable law. Please note, however, that certain information may be exempt from such requests in some circumstances, which may include if we need to keep processing your information for our legitimate interests or to comply with a legal obligation. We may request you provide us with information necessary to confirm your identity before responding to your request.
Residents of France and certain other jurisdictions may also provide us with instructions regarding the manner in which we may continue to store, erase and share your information after your death, and where applicable, the person you have designated to exercise these rights after your death.
206 | THE RYDEX FUNDS ANNUAL REPORT | |
GUGGENHEIM INVESTMENTS PRIVACY NOTICE (Unaudited)(concluded) |
How We Protect Privacy Online
We take steps to protect your privacy when you use our web site – www.guggenheiminvestments.com – by using secure forms of online communication, including encryption technology, Secure Socket Layer (SSL) protocol, firewalls and user names and passwords. These safeguards vary based on the sensitivity of the information that we collect and store. However, we cannot and do not guarantee that these measures will prevent every unauthorized attempt to access, use, or disclose your information since despite our efforts, no Internet and/or other electronic transmissions can be completely secure. Our web site uses “http cookies”—tiny pieces of information that we ask your browser to store. We use cookies for session management and security features on the Guggenheim Investments web site. We do not use them to pull data from your hard drive, to learn your e-mail address, or to view data in cookies created by other web sites. We will not share the information in our cookies or give others access to it. See the legal information area on our web site for more details about web site security and privacy features.
How We Safeguard Your Personal Information and Data Retention
We restrict access to nonpublic personal information about you to our employees and in some cases to third parties (for example, the service providers described above) as permitted by law. We maintain strict physical, electronic and procedural safeguards that comply with federal standards to guard your nonpublic personal information.
We keep your information for no longer than necessary for the purposes for which it is processed. The length of time for which we retain information depends on the purposes for which we collected and use it and/or as required to comply with applicable laws. Information may persist in copies made for backup and business continuity purposes for additional time.
International Visitors
If you are not a resident of the United States, please be aware that your information may be transferred to, stored and processed in the United States where our servers are located and our databases are operated. The data protection and other laws of the United States and other countries might not be as comprehensive as those in your country.
In such cases, we ensure that a legal basis for such a transfer exists and that adequate protection is provided as required by applicable law, for example, by using standard contractual clauses or by transferring your data to a jurisdiction that has obtained an adequacy finding. Individuals whose data may be transferred on the basis of standard contractual clauses may contact us as described below.
We’ll Keep You Informed
If you have any questions or concerns about how we treat your personal data, we encourage you to consult with us first. You may also contact the relevant supervisory authority.
We reserve the right to modify this policy at any time and will inform you promptly of material changes. You may access our privacy policy from our web site at www.guggenheiminvestments.com. Should you have any questions regarding our privacy policy, contact us by email at CorporateDataPrivacy@GuggenheimPartners.com.
| | THE RYDEX FUNDS ANNUAL REPORT | 207 |
This page intentionally left blank.
This page intentionally left blank.
This page intentionally left blank.
This page intentionally left blank.
This page intentionally left blank.
This page intentionally left blank.
3.31.2021
Rydex Funds Annual Report
Domestic Equity Funds |
S&P 500® Pure Growth Fund |
S&P 500® Pure Value Fund |
S&P MidCap 400® Pure Growth Fund |
S&P MidCap 400® Pure Value Fund |
S&P SmallCap 600® Pure Growth Fund |
S&P SmallCap 600® Pure Value Fund |
International Equity Funds |
Europe 1.25x Strategy Fund |
Japan 2x Strategy Fund |
Specialty Funds |
Strengthening Dollar 2x Strategy Fund |
Weakening Dollar 2x Strategy Fund |
GuggenheimInvestments.com | RBENF2-ANN-0321x0322 |

| | |
DEAR SHAREHOLDER | 2 |
ECONOMIC AND MARKET OVERVIEW | 4 |
A BRIEF NOTE ON THE COMPOUNDING OF RETURNS | 6 |
ABOUT SHAREHOLDERS’ FUND EXPENSES | 7 |
S&P 500® PURE GROWTH FUND | 10 |
S&P 500® PURE VALUE FUND | 18 |
S&P MIDCAP 400® PURE GROWTH FUND | 27 |
S&P MIDCAP 400® PURE VALUE FUND | 35 |
S&P SMALLCAP 600® PURE GROWTH FUND | 43 |
S&P SMALLCAP 600® PURE VALUE FUND | 52 |
EUROPE 1.25x STRATEGY FUND | 61 |
JAPAN 2x STRATEGY FUND | 70 |
STRENGTHENING DOLLAR 2x STRATEGY FUND | 78 |
WEAKENING DOLLAR 2x STRATEGY FUND | 86 |
NOTES TO FINANCIAL STATEMENTS | 94 |
REPORT OF INDEPENDENT REGISTERED PUBLIC ACCOUNTING FIRM | 110 |
OTHER INFORMATION | 111 |
INFORMATION ON BOARD OF TRUSTEES AND OFFICERS | 113 |
GUGGENHEIM INVESTMENTS PRIVACY NOTICE | 118 |
| | THE RYDEX FUNDS ANNUAL REPORT | 1 |
Dear Shareholder:
Security Investors, LLC (the “Investment Adviser”) is pleased to present the annual shareholder report for a selection of our funds (the “Fund” or “Funds”). This report covers performance for the 12-month period ended March 31, 2021.
The Investment Adviser is part of Guggenheim Investments, which represents the investment management businesses of Guggenheim Partners, LLC (“Guggenheim”), a global, diversified financial services firm.
Guggenheim Funds Distributors, LLC is the distributor of the Funds. Guggenheim Funds Distributors, LLC is affiliated with Guggenheim and the Investment Adviser.
We encourage you to read the Economic and Market Overview section of the report, which follows this letter, and then the Performance Report and Fund Profile for each Fund.
We are committed to providing innovative investment solutions and appreciate the trust you place in us.
Sincerely,
Security Investors, LLC
April 30, 2021
Read a prospectus and summary prospectus (if available) carefully before investing. It contains the investment objectives, risks, charges, expenses and other information, which should be considered carefully before investing. Obtain a prospectus and summary prospectus (if available) at guggenheiminvestments.com or call 800.820.0888.
This material is not intended as a recommendation or as investment advice of any kind, including in connection with rollovers, transfers, and distributions. Such material is not provided in a fiduciary capacity, may not be relied upon for or in connection with the making of investment decisions, and does not constitute a solicitation of an offer to buy or sell securities. All content has been provided for informational or educational purposes only and is not intended to be and should not be construed as legal or tax advice and/or a legal opinion. Always consult a financial, tax and/or legal professional regarding your specific situation.
COVID-19. The global ongoing crisis caused by the outbreak of COVID-19 and the current recovery underway is causing disruption to consumer demand and economic output and supply chains. There are still travel restrictions and quarantines, and adverse impacts on local and global economies. Investors should be aware that in light of the current uncertainty, volatility and distress in economies, financial markets, and labor and public health conditions around the world, the Funds’ investments and a shareholder’s investment in a Fund are subject to investment risk, including the possible loss of the entire principal amount invested. Firms through which investors invest with the Funds, the Funds, their service providers, the markets in which they invest and market intermediaries are also impacted by quarantines and similar measures intended to respond to and contain the ongoing pandemic, which can obstruct their functioning and subject them to heightened operational and other risks.
Inverse and leveraged Funds are not suitable for all investors. ● These Funds should be utilized only by investors who (a) understand the risks associated with the use of leverage, (b) understand the consequences of seeking daily leveraged investment results, (c) understand the risk of shorting, and (d) intend to actively monitor and manage their investments. ● The more a Fund invests in leveraged instruments, the more the leverage will magnify any gains or losses on those investments. ● Inverse Funds involve certain risks, which include increased volatility due to the Funds’ possible use of short sales of securities and derivatives, such as options and futures. ● The Funds’ use of derivatives, such as futures, options, and swap agreements, may expose the Funds’ shareholders to additional risks that they would not be subject to if they invested directly in the securities underlying those derivatives. ● Short-selling involves increased risks and costs. You risk paying more for a security than you received from its sale. ● Leveraged and inverse Funds seek to provide investment results that match the performance of a specific benchmark, before fees and expenses, on a daily basis. Because the Funds seek to track the performance of their benchmark on a daily basis, mathematical compounding, especially with respect to those Funds that use leverage as part of their investment strategy, may prevent a Fund from correlating with the monthly, quarterly, annual, or other period performance of its benchmark. Due to the compounding of daily returns, leveraged and inverse Funds’ returns over periods other than one day will likely differ in amount and possibly direction from the benchmark return for the same period. For those Funds that consistently apply leverage, the value of the Fund’s shares will tend to increase or decrease more than the value of any increase or decrease in its benchmark index. The Funds rebalance their portfolios on a daily basis, increasing exposure in response to that day’s gains or reducing exposure in response to that day’s losses. Daily rebalancing will impair a Fund’s performance if the benchmark experiences volatility. Investors should monitor their leveraged and inverse Funds’ holdings consistent with their strategies, as frequently as daily. ● For more on these and other risks, please read the prospectus.
2 | THE RYDEX FUNDS ANNUAL REPORT | |
Pure Style Funds may not be suitable for all investors. ● The Funds are subject to the risk that large, medium and small-capitalization stocks may under-perform other segments of the equity market or the equity market as a whole. ● Value stocks are subject to the risk that the intrinsic value of the stock may never be realized by the market or that the price goes down. Growth stocks typically invest a high portion of their earnings back into their business and may lack the dividend yield that could cushion their decline in a market downturn. Growth stocks may be more volatile than other stocks because they are more sensitive to investor perceptions regarding the growth potential of the issuing company. ● The Funds are subject to the risk that unanticipated early closings of securities exchanges and other financial markets may result in the Funds’ inability to buy or sell securities or other financial instruments on that day. In certain circumstances, it may be difficult for the Funds to purchase and sell particular investments within a reasonable time at a fair price. ● Unlike many investment companies, the Funds are not actively “managed.” This means that based on market and economic conditions, the Funds’ performance could be lower than other types of funds that may actively shift their portfolio assets to take advantage of market opportunities or to lessen the impact of a market decline ● The Funds are subject to active trading and tracking error risks, which may increase volatility, impact the Funds’ ability to achieve its investment objective and may decrease the Fund’s performance. ● These Funds are considered non-diversified and can invest a greater portion of its assets in securities of individual issuers than a diversified fund. As a result, changes in the market value of a single security could cause greater fluctuations in the value of Fund shares than would occur in a more diversified fund. ● Securities are not deposits or obligations of any bank, are not guaranteed by any bank, are not insured by the FDIC or any other agency, and involve investment risks, including the possible loss of the principal amount invested. ● Please read the prospectus for more detailed information regarding these and other risks.
The Strengthening Dollar 2x Strategy Fund is subject to a number of risks and may not be suitable for all investors. ● The Fund’s use of derivatives such as futures and swap agreements may expose the Fund to additional risks that it would not be subject to if it invested directly in the securities underlying those derivatives. ● The Fund’s exposure to foreign currencies subjects the Fund to the risk that those currencies will decline in value relative to the U.S. dollar, or, in the case of short positions, that the U.S. dollar will decline in value relative to the currency being hedged. ● The more the Fund invests in leveraged instruments, the more the leverage will magnify any gains or losses on those investments. These risks may cause the Fund to experience higher losses and/or volatility than a fund that does not invest in derivatives, use leverage or have exposure to foreign currencies. ● Also, the Fund is subject to active trading and tracking error risks that may increase volatility, decrease performance and impact the Fund’s ability to achieve its investment objective. This Fund is considered non-diversified and can invest a greater portion of its assets in securities of individual issuers than a diversified fund. As a result, changes in the market value of a single security could cause greater fluctuations in the value of Fund shares than would occur in a more diversified fund. ● For more on these and other risks, please read the prospectus.
The Weakening Dollar 2x Strategy Fund is subject to a number of risks and may not be suitable for all investors. ● The Fund’s use of derivatives such as futures and swap agreements may expose the Fund to additional risks that it would not be subject to if it invested directly in the securities underlying those derivatives. ● The Fund’s indirect exposure to foreign currencies subjects the Fund to the risk that those currencies will decline in value relative to the U.S. dollar, or, in the case of short positions, that the U.S. dollar will decline in value relative to the currency being hedged. ● The more the Fund invests in leveraged instruments, the more the leverage will magnify any gains or losses on those investments. These risks may cause the Fund to experience higher losses and/or volatility than a fund that does not invest in derivatives, use leverage or have exposure to foreign currencies. ● Also, the Fund is subject to active trading and tracking error risks that may increase volatility, decrease performance and impact the Fund’s ability to achieve its investment objective. This Fund is considered non-diversified and can invest a greater portion of its assets in securities of individual issuers than a diversified fund. As a result, changes in the market value of a single security could cause greater fluctuations in the value of Fund shares than would occur in a more diversified fund. ● For more on these and other risks, please read the prospectus.
| | THE RYDEX FUNDS ANNUAL REPORT | 3 |
ECONOMIC AND MARKET OVERVIEW (Unaudited) | March 31, 2021 |
For the 12-month period ended March 31, 2021, the Standard & Poor’s 500® (“S&P 500®”) Index returned 56.35% as the equity market roared back to life after a sharp selloff following the outbreak of COVID-19. This increase was in spite of ongoing personal and economic hardships imposed by COVID-19, highlighting the crucial role of policy support in the form of monetary and fiscal stimulus, which has succeeded in averting a lengthy recession in the U.S. These policy initiatives, particularly on the monetary side, increased market liquidity and lowered borrowing rates, reassuring equity investors that the Federal Reserve (the “Fed”) would do everything in its power to maintain market stability.
Our 2021 U.S. economic growth forecast increased during the first quarter of 2021 from an annualized 5.5% to over 7%, factoring in more fiscal stimulus than previously anticipated. This forecast captures the effect of stimulus representing roughly 11% of 2020–2021 gross domestic product (“GDP”), versus the previous calculation of about 8%. We see strength in the consumer sector and in housing activity. In addition, U.S. vaccinations for COVID-19 continue to accelerate, nearing 3 million doses per day by the end of the first quarter. More than 213 million doses have been administered in the U.S. so far, and about 35% of the U.S. population has been fully vaccinated. The U.S. is seeing the best-case scenario unfold in its vaccine rollout, but other countries have not been as fortunate.
Europe’s vaccine rollout hit a major speedbump during the first quarter when questions surrounding the safety of the AstraZeneca vaccine led several major European countries to temporarily suspend distribution. Safety concerns, coupled with supply constraints, meant that less than 10% of the populations of Germany, France, and Italy had been vaccinated by the end of the first quarter, well under the pace needed to reach 70% inoculated by summer. Any delay in ending the pandemic on a global scale has implications for other countries too, including the U.S., where travel and hospitality workers represent a large share of the unemployed.
Despite vaccination delays in Europe and its implications abroad, we saw meaningful improvement in the domestic labor market during the first quarter as states moved forward with business re-openings. Seasonally adjusted initial jobless claims fell by 97,000 to 684,000 in the week ending March 20, 2021, the lowest level since the pandemic began, before seeing an uptick the following week to 719,000. We saw more positive news across the board in the March payroll report with 916,000 jobs added, and with 156,000 more from revisions. Standing in the way of additional labor market gains are local government restrictions on certain sectors, although easing of these restrictions is expected by summer.
Economic developments drove a sharp increase in U.S. Treasury yields. The market pulled forward expectations of the next Fed rate hike from December 2023 to December 2022, while repricing the long-run terminal Fed funds rate estimate to 2.25% from just 0.55% last August. We do not expect the Fed to raise interest rates as early as the market is anticipating, even though we expect strong GDP growth in coming years.
Year-over-year inflation measures will rise over the next several months due to base effects, which may be compounded by supply chain disruptions in the goods sector and potential capacity constraints for certain services. However, these factors could prove to be short-lived, with base effects set to dampen inflation starting in the summer months. Moreover, the Fed is focused on generating sustainably higher inflation. Even if core inflation rises above the Fed’s 2% target in 2021, the Fed’s focus is on a long-term average of 2%. With years of shortfalls to make up, and the Fed now targeting labor market disparities as part of an expanded definition of full employment, we expect policymakers to remain resolutely patient. Any tapering of asset purchases will likely be deferred until later in 2022, with the first rate hike likely to come sometime after that.
Easy financial conditions and low rates will likely support credit over the next few years. With market optimism pulling forward rate hike expectations and causing bond yields to rise, we view this as an opportunity to add incremental yield to portfolios.
For the 12-month period ended March 31, 2021, the S&P 500® Index* returned, as noted, 56.35%. The MSCI Europe-Australasia-Far East (“EAFE”) Index* returned 44.57%. The return of the MSCI Emerging Markets Index* was 58.39%.
In the bond market, the Bloomberg Barclays U.S. Aggregate Bond Index* posted a 0.71% return for the 12-month period, while the Bloomberg Barclays U.S. Corporate High Yield Index* returned 23.72%. The return of the ICE Bank of America (“BofA”) Merrill Lynch 3-Month U.S. Treasury Bill Index* was 0.12% for the 12-month period.
The opinions and forecasts expressed may not actually come to pass. This information is subject to change at any time, based on market and other conditions, and should not be construed as a recommendation of any specific security or strategy.
4 | THE RYDEX FUNDS ANNUAL REPORT | |
ECONOMIC AND MARKET OVERVIEW (Unaudited)(concluded) | March 31, 2021 |
*Index Definitions:
The following indices are referenced throughout this report. Indices are unmanaged and not available for direct investment. Index performance does not reflect transaction costs, fees, or expenses.
Bloomberg Barclays U.S. Aggregate Bond Index is a broad-based flagship benchmark that measures the investment grade, U.S. dollar-denominated, fixed-rate taxable bond market, including U.S. Treasuries, government-related and corporate securities, mortgage-backed securities or “MBS” (agency fixed-rate and hybrid adjustable-rate mortgage, or “ARM”, pass-throughs), asset-backed securities (“ABS”), and commercial mortgage-backed securities (“CMBS”) (agency and non-agency).
Bloomberg Barclays U.S. Corporate High Yield Index measures the U.S. dollar-denominated, high yield, fixed-rate corporate bond market. Securities are classified as high yield if the middle rating of Moody’s, Fitch, and S&P is Ba1/BB +/BB + or below.
ICE BofA Merrill Lynch 3-Month U.S. Treasury Bill Index is an unmanaged market Index of U.S. Treasury securities maturing in 90 days that assumes reinvestment of all income.
MSCI EAFE Index is a free float-adjusted market capitalization index that is designed to measure the equity market performance of developed markets, excluding the U.S. & Canada.
MSCI Emerging Markets Index is a free float-adjusted market capitalization weighted index that is designed to measure equity market performance in the global emerging markets.
Nikkei-225 Stock Average Index is a price-weighted index comprised of Japan’s top 225 blue-chip companies on the Tokyo Stock Exchange.
S&P 500® is a broad-based index, the performance of which is based on the performance of 500 widely held common stocks chosen for market size, liquidity, and industry group representation.
S&P 500® Pure Growth Index is narrow in focus, containing only those S&P 500 Index companies with strong growth characteristics as selected by S&P. The S&P 500 Index is a capitalization-weighted index covering 500 industrial, utility, transportation and financial companies of the U.S. markets (mostly NYSE Euronext issues).
S&P 500® Pure Value Index is narrow in focus, containing only those S&P 500 Index companies with strong value characteristics as selected by S&P. The S&P 500 Index is a capitalization-weighted index covering 500 industrial, utility, transportation and financial companies of the U.S. markets (mostly NYSE Euronext issues).
S&P MidCap 400® Pure Growth Index is narrow in focus, containing only those S&P MidCap 400 Index companies with strong growth characteristics as selected by S&P. The S&P MidCap 400 Index measures the performance of the mid-capitalization sector of the U.S. equity market.
S&P MidCap 400® Pure Value Index is narrow in focus, containing only those S&P MidCap 400 Index companies with strong value characteristics as selected by S&P. The S&P MidCap 400 Index measures the performance of the mid-capitalization sector of the U.S. equity market.
S&P SmallCap 600® Pure Growth Index is narrow in focus, containing only those S&P SmallCap 600 Index companies with strong growth characteristics as selected by S&P. The S&P SmallCap 600 Index measures the performance of the small-capitalization sector of the U.S. equity market.
S&P SmallCap 600® Pure Value Index is narrow in focus, containing only those S&P SmallCap 600 Index companies with strong value characteristics as selected by S&P. The S&P SmallCap 600 Index measures the performance of the small-capitalization sector of the U.S. equity market.
STOXX Europe 50® Index provides a blue-chip representation of supersector leaders in Europe. The index covers 50 stocks from 17 European countries: Austria, Belgium, Denmark, Finland, France, Germany, Ireland, Italy, Luxembourg, the Netherlands, Norway, Poland, Portugal, Spain, Sweden, Switzerland and the United Kingdom.
USD or U.S. Dollar Index® (USDX) is an index that determines the relative value of the United States dollar to a basket of foreign currencies. This formulated “basket” of currencies comprises the weighting of six other currencies as follows: Euro (EUR), 57.6% + Japanese Yen (JPY), 13.6% + Pound Sterling (GBP), 11.9% + Canadian Dollar (CAD), 9.1% + Swedish Krona (SEK), 4.2% + Swiss Franc (CHF) 3.6%.
| | THE RYDEX FUNDS ANNUAL REPORT | 5 |
A BRIEF NOTE ON THE COMPOUNDING OF RETURNS (Unaudited) | March 31, 2021 |
Many of the Funds described in this report are benchmarked daily to leveraged and/or inverse leveraged versions of published indices. To properly evaluate the performance of these funds, it is essential to understand the effect of mathematical compounding on their respective returns.
Because of the nonlinear effects of leverage applied over time, it is possible for a fund to perform in-line with its benchmark for several individual periods in a row, yet seem to trail the benchmark over the entire period on a cumulative basis. It is also possible that a fund that performs in-line with its benchmark on a daily basis may seem to outperform its benchmark over longer periods.
An Example of Compounding
For example, consider a hypothetical fund that is designed to produce returns that correspond to 150% of an index. On the first day of a period, the index rises from a level of 100 to a level of 106, producing a 6.0% gain and an expectation that the fund will rise by 9.0%. On the same day, the fund’s net asset value per share (“NAV”) increases from $10.00 to $10.90 for a gain of 9.0% — in line with its benchmark.
On day two, assume the index falls from 106 to 99 for a loss of about 6.6%. The fund, as expected, falls 9.9% to a price of $9.82. On each day, the fund performed exactly in line with its benchmark, but for the two-day period, the fund was down 1.8%, while the index was down only 1.0%. Without taking into account the daily compounding of returns, one would expect the fund to lose 1.5% and would see the fund as trailing by 0.3% when in fact it had performed perfectly. This example is summarized in the table below.
| Index
Level | Index
Performance | Fund
Expectation | Fund
NAV | Fund
Performance | Assessment |
Start | 100 | | | $ 10.00 | | |
Day 1 | 106 | 6.0% | 9.0% | $ 10.90 | 9.0% | In line |
Day 2 | 99 | -6.6% | -9.9% | $ 9.82 | -9.9% | In line |
Cumulative | | -1.0% | -1.5% | | -1.8% | -0.3% |
As illustrated by this simple example, the effect of leverage can make it difficult to form expectations or judgments about fund performance given only the returns of the unleveraged index.
Because certain funds seek to track the performance of their benchmark on a daily basis, mathematical compounding, especially with respect to those funds that use leverage as part of their investment strategy, may prevent a fund from correlating with the monthly, quarterly, annual or other period performance of its benchmark. Due to the compounding of daily returns, leveraged and inverse funds’ returns over periods other than one day will likely differ in amount and possibly direction from the benchmark return for the same period. Investors should monitor their leveraged and inverse funds’ holdings to ensure that they are consistent with their strategies, as frequently as daily. For those funds that consistently apply leverage, the value of the fund’s shares will tend to increase or decrease more than the value of any increase or decrease in its benchmark index. For more on correlation, leverage and other risks, please read the prospectus.
In general, any change in direction in an index will produce compounding that seems to work against an investor. Were the index to move in the same direction (either up or down) for two or more periods in a row, the compounding of those returns would work in an investor’s favor, causing the fund to seemingly beat its benchmark.
As a general rule of thumb, more leverage in a fund will magnify the compounding effect, while less leverage will generally produce results that are more in line with expectations. In addition, periods of high volatility in an underlying index will also cause the effects of compounding to be more pronounced, while lower volatility will produce a more muted effect.
6 | THE RYDEX FUNDS ANNUAL REPORT | |
ABOUT SHAREHOLDERS’ FUND EXPENSES (Unaudited) | |
All mutual funds have operating expenses, and it is important for our shareholders to understand the impact of costs on their investments. Shareholders of a fund incur two types of costs: (i) transaction costs, including sales charges (loads) on purchase payments, reinvested dividends, other distributions, and exchange fees, and (ii) ongoing costs, including management fees, administrative services, and shareholder reports, among others. These ongoing costs, or operating expenses, are deducted from a fund’s gross income and reduce the investment return of the fund.
A fund’s expenses are expressed as a percentage of its average net assets, which is known as the expense ratio. The following examples are intended to help investors understand the ongoing costs (in dollars) of investing in a fund and to compare these costs with the ongoing costs of investing in other mutual funds.
The examples are based on an investment of $1,000 made at the beginning of the period and held for the entire six-month period beginning September 30, 2020 and ending March 31, 2021.
The following tables illustrate the Funds’ costs in two ways:
Table 1. Based on actual Fund return: This section helps investors estimate the actual expenses paid over the period. The “Ending Account Value” shown is derived from the Fund’s actual return, and the fifth column shows the dollar amount that would have been paid by an investor who started with $1,000 in the Fund. Investors may use the information here, together with the amount invested, to estimate the expenses paid over the period. Simply divide the Fund’s account value by $1,000 (for example, an $8,600 account value divided by $1,000 = 8.6), then multiply the result by the number provided under the heading “Expenses Paid During Period.”
Table 2. Based on hypothetical 5% return: This section is intended to help investors compare a fund’s cost with those of other mutual funds. The table provides information about hypothetical account values and hypothetical expenses based on the Fund’s actual expense ratio and an assumed rate of return of 5% per year before expenses, which is not the Fund’s actual return. The hypothetical account values and expenses may not be used to estimate the actual ending account balance or expenses paid during the period. The example is useful in making comparisons because the U.S. Securities and Exchange Commission (the “SEC”) requires all mutual funds to calculate expenses based on the 5% return. Investors can assess a fund’s costs by comparing this hypothetical example with the hypothetical examples that appear in shareholder reports of other funds.
The calculations illustrated above assume no shares were bought or sold during the period. Actual costs may have been higher or lower, depending on the amount of investment and the timing of any purchases or redemptions.
Please note that the expenses shown in the table are meant to highlight your ongoing costs only and do not reflect any transactional costs, such as sales charges (loads) on purchase payments, and contingent deferred sales charges (“CDSC”) on redemptions, if any. Therefore, the second table is useful in comparing ongoing costs only, and will not help you determine the relative total costs of owning different funds. In addition, if these transactional costs were included, your costs would have been higher.
More information about the Funds’ expenses, including annual expense ratios for periods up to five years (subject to the Fund’s inception date), can be found in the Financial Highlights section of this report. For additional information on operating expenses and other shareholder costs, please refer to the appropriate Fund prospectus.
| | THE RYDEX FUNDS ANNUAL REPORT | 7 |
ABOUT SHAREHOLDERS’ FUND EXPENSES (Unaudited)(continued) | |
| Expense
Ratio1 | Fund
Return | Beginning
Account Value
September 30, 2020 | Ending
Account Value
March 31, 2021 | Expenses
Paid During
Period2 |
Table 1. Based on actual Fund return3 | | | | | |
S&P 500® Pure Growth Fund | | | | | |
A-Class | 1.56% | 15.19% | $ 1,000.00 | $ 1,151.90 | $ 8.37 |
C-Class | 2.31% | 14.76% | 1,000.00 | 1,147.60 | 12.37 |
H-Class | 1.56% | 15.20% | 1,000.00 | 1,152.00 | 8.37 |
S&P 500® Pure Value Fund | | | | | |
A-Class | 1.56% | 50.57% | 1,000.00 | 1,505.70 | 9.75 |
C-Class | 2.31% | 50.01% | 1,000.00 | 1,500.10 | 14.40 |
H-Class | 1.55% | 50.57% | 1,000.00 | 1,505.70 | 9.68 |
S&P MidCap 400® Pure Growth Fund | | | | | |
A-Class | 1.56% | 29.51% | 1,000.00 | 1,295.10 | 8.93 |
C-Class | 2.31% | 29.04% | 1,000.00 | 1,290.40 | 13.19 |
H-Class | 1.56% | 29.51% | 1,000.00 | 1,295.10 | 8.93 |
S&P MidCap 400® Pure Value Fund | | | | | |
A-Class | 1.55% | 64.53% | 1,000.00 | 1,645.30 | 10.22 |
C-Class | 2.30% | 63.94% | 1,000.00 | 1,639.40 | 15.13 |
H-Class | 1.54% | 64.55% | 1,000.00 | 1,645.50 | 10.16 |
S&P SmallCap 600® Pure Growth Fund | | | | | |
A-Class | 1.55% | 46.66% | 1,000.00 | 1,466.60 | 9.53 |
C-Class | 2.31% | 46.09% | 1,000.00 | 1,460.90 | 14.17 |
H-Class | 1.53% | 46.68% | 1,000.00 | 1,466.80 | 9.41 |
S&P SmallCap 600® Pure Value Fund | | | | | |
A-Class | 1.55% | 72.98% | 1,000.00 | 1,729.80 | 10.55 |
C-Class | 2.30% | 72.34% | 1,000.00 | 1,723.40 | 15.62 |
H-Class | 1.53% | 72.96% | 1,000.00 | 1,729.60 | 10.41 |
Europe 1.25x Strategy Fund | | | | | |
A-Class | 1.69% | 19.61% | 1,000.00 | 1,196.10 | 9.25 |
C-Class | 2.43% | 18.82% | 1,000.00 | 1,188.20 | 13.26 |
H-Class | 1.69% | 19.23% | 1,000.00 | 1,192.30 | 9.24 |
Japan 2x Strategy Fund | | | | | |
A-Class | 1.53% | 41.29% | 1,000.00 | 1,412.90 | 9.20 |
C-Class | 2.28% | 40.76% | 1,000.00 | 1,407.60 | 13.69 |
H-Class | 1.53% | 41.29% | 1,000.00 | 1,412.90 | 9.20 |
Strengthening Dollar 2x Strategy Fund | | | | | |
A-Class | 1.86% | (2.06%) | 1,000.00 | 979.40 | 9.18 |
C-Class | 2.61% | (2.45%) | 1,000.00 | 975.50 | 12.85 |
H-Class | 1.86% | (2.05%) | 1,000.00 | 979.50 | 9.18 |
Weakening Dollar 2x Strategy Fund | | | | | |
A-Class | 1.86% | 0.06% | 1,000.00 | 1,000.60 | 9.28 |
C-Class | 2.61% | (0.30%) | 1,000.00 | 997.00 | 12.99 |
H-Class | 1.86% | 0.07% | 1,000.00 | 1,000.70 | 9.28 |
8 | THE RYDEX FUNDS ANNUAL REPORT | |
ABOUT SHAREHOLDERS’ FUND EXPENSES (Unaudited)(concluded) | |
| Expense
Ratio1 | Fund
Return | Beginning
Account Value
September 30, 2020 | Ending
Account Value
March 31, 2021 | Expenses
Paid During
Period2 |
Table 2. Based on hypothetical 5% return (before expenses) | | | | |
S&P 500® Pure Growth Fund | | | | | |
A-Class | 1.56% | 5.00% | $ 1,000.00 | $ 1,017.15 | $ 7.85 |
C-Class | 2.31% | 5.00% | 1,000.00 | 1,013.41 | 11.60 |
H-Class | 1.56% | 5.00% | 1,000.00 | 1,017.15 | 7.85 |
S&P 500® Pure Value Fund | | | | | |
A-Class | 1.56% | 5.00% | 1,000.00 | 1,017.15 | 7.85 |
C-Class | 2.31% | 5.00% | 1,000.00 | 1,013.41 | 11.60 |
H-Class | 1.55% | 5.00% | 1,000.00 | 1,017.20 | 7.80 |
S&P MidCap 400® Pure Growth Fund | | | | | |
A-Class | 1.56% | 5.00% | 1,000.00 | 1,017.15 | 7.85 |
C-Class | 2.31% | 5.00% | 1,000.00 | 1,013.41 | 11.60 |
H-Class | 1.56% | 5.00% | 1,000.00 | 1,017.15 | 7.85 |
S&P MidCap 400® Pure Value Fund | | | | | |
A-Class | 1.55% | 5.00% | 1,000.00 | 1,017.20 | 7.80 |
C-Class | 2.30% | 5.00% | 1,000.00 | 1,013.46 | 11.55 |
H-Class | 1.54% | 5.00% | 1,000.00 | 1,017.25 | 7.75 |
S&P SmallCap 600® Pure Growth Fund | | | | | |
A-Class | 1.55% | 5.00% | 1,000.00 | 1,017.20 | 7.80 |
C-Class | 2.31% | 5.00% | 1,000.00 | 1,013.41 | 11.60 |
H-Class | 1.53% | 5.00% | 1,000.00 | 1,017.30 | 7.70 |
S&P SmallCap 600® Pure Value Fund | | | | | |
A-Class | 1.55% | 5.00% | 1,000.00 | 1,017.20 | 7.80 |
C-Class | 2.30% | 5.00% | 1,000.00 | 1,013.46 | 11.55 |
H-Class | 1.53% | 5.00% | 1,000.00 | 1,017.30 | 7.70 |
Europe 1.25x Strategy Fund | | | | | |
A-Class | 1.69% | 5.00% | 1,000.00 | 1,016.50 | 8.50 |
C-Class | 2.43% | 5.00% | 1,000.00 | 1,012.81 | 12.19 |
H-Class | 1.69% | 5.00% | 1,000.00 | 1,016.50 | 8.50 |
Japan 2x Strategy Fund | | | | | |
A-Class | 1.53% | 5.00% | 1,000.00 | 1,017.30 | 7.70 |
C-Class | 2.28% | 5.00% | 1,000.00 | 1,013.56 | 11.45 |
H-Class | 1.53% | 5.00% | 1,000.00 | 1,017.30 | 7.70 |
Strengthening Dollar 2x Strategy Fund | | | | | |
A-Class | 1.86% | 5.00% | 1,000.00 | 1,015.66 | 9.35 |
C-Class | 2.61% | 5.00% | 1,000.00 | 1,011.92 | 13.09 |
H-Class | 1.86% | 5.00% | 1,000.00 | 1,015.66 | 9.35 |
Weakening Dollar 2x Strategy Fund | | | | | |
A-Class | 1.86% | 5.00% | 1,000.00 | 1,015.66 | 9.35 |
C-Class | 2.61% | 5.00% | 1,000.00 | 1,011.92 | 13.09 |
H-Class | 1.86% | 5.00% | 1,000.00 | 1,015.66 | 9.35 |
1 | Annualized and excludes expenses of the underlying funds in which the Funds invest, if any. |
2 | Expenses are equal to the Fund’s annualized expense ratio, net of any applicable fee waivers, multiplied by the average account value over the period, multiplied by 182/365 (to reflect the one-half year period). |
3 | Actual cumulative return at net asset value for the period September 30, 2020 to March 31, 2021. |
| | THE RYDEX FUNDS ANNUAL REPORT | 9 |
PERFORMANCE REPORT AND FUND PROFILE (Unaudited) | March 31, 2021 |
S&P 500® PURE GROWTH FUND
OBJECTIVE: Seeks to provide investment results that match, before fees and expenses, the performance of a benchmark for large-cap growth securities on a daily basis. The Fund’s current benchmark is the S&P 500® Pure Growth Index (the “underlying index”).
For the year ended March 31, 2021, S&P 500® Pure Growth Fund H-Class returned 61.92%, compared with a return of 64.96% for the underlying index. The Fund maintained a daily correlation of over 99% to its benchmark for the period.
All sectors contributed to the return of the underlying index for the period, led by Information Technology, Consumer Discretionary, and Industrials.
The holdings contributing the most to the return of the underlying index were United Rentals, Inc., Lam Research Corp., and PayPal Holdings, Inc. The holdings detracting the most from return were Enphase Energy, Inc., DexCom, Inc., and Monolithic Power Systems, Inc.
Performance displayed represents past performance, which is no guarantee of future results.
Holdings Diversification (Market Exposure as % of Net Assets)
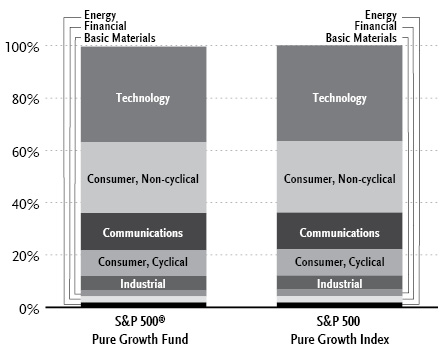
“Holdings Diversification (Market Exposure as % of Net Assets)” excludes any temporary cash investments.
Inception Dates: |
A-Class | September 1, 2004 |
C-Class | February 20, 2004 |
H-Class | February 20, 2004 |
Ten Largest Holdings (% of Total Net Assets) |
Etsy, Inc. | 2.7% |
PayPal Holdings, Inc. | 2.4% |
Tesla, Inc. | 2.4% |
SVB Financial Group | 2.3% |
Monolithic Power Systems, Inc. | 2.3% |
Align Technology, Inc. | 2.1% |
Teradyne, Inc. | 2.1% |
ServiceNow, Inc. | 2.0% |
Amazon.com, Inc. | 2.0% |
Generac Holdings, Inc. | 2.0% |
Top Ten Total | 22.3% |
| | |
“Ten Largest Holdings” excludes any temporary cash investments. |
10 | THE RYDEX FUNDS ANNUAL REPORT | |
PERFORMANCE REPORT AND FUND PROFILE (Unaudited)(concluded) | March 31, 2021 |
Cumulative Fund Performance*

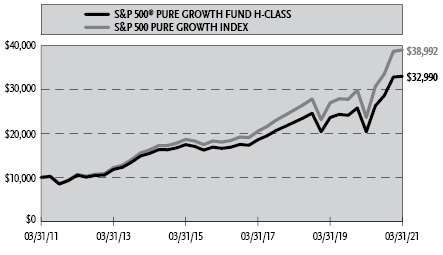
Average Annual Returns*
Periods Ended March 31, 2021
| 1 Year | 5 Year | 10 Year |
A-Class Shares | 61.92% | 14.73% | 12.67% |
A-Class Shares with sales charge‡ | 54.22% | 13.62% | 12.13% |
C-Class Shares | 60.69% | 13.87% | 11.83% |
C-Class Shares with CDSC§ | 59.69% | 13.87% | 11.83% |
H-Class Shares | 61.92% | 14.73% | 12.68% |
S&P 500 Pure Growth Index | 64.96% | 16.68% | 14.58% |
* | The performance data above represents past performance that is not predictive of future results. The investment return and principal value of an investment in the Fund will fluctuate so that an investor’s shares, when redeemed, may be worth more or less than their original cost. Returns are historical and include changes in principal and reinvested dividends and capital gains and do not reflect the effect of taxes. The S&P 500 Pure Growth Index is an unmanaged index and, unlike the Fund, has no management fees or operating expenses to reduce its reported return. The graphs are based on A-Class and H-Class shares only; performance for C-Class shares will vary due to differences in fee structure. |
‡ | Fund returns are calculated using the maximum sales charge of 4.75%. |
§ | Fund returns include a CDSC of 1% if redeemed within 12 months of purchase. |
| | THE RYDEX FUNDS ANNUAL REPORT | 11 |
SCHEDULE OF INVESTMENTS | March 31, 2021 |
S&P 500® PURE GROWTH FUND | |
| | Shares | | | Value | |
COMMON STOCKS† - 99.6% |
| | | | | | | | | |
Technology - 36.5% |
Monolithic Power Systems, Inc. | | | 2,524 | | | $ | 891,502 | |
Teradyne, Inc. | | | 6,740 | | | | 820,123 | |
ServiceNow, Inc.* | | | 1,550 | | | | 775,170 | |
NVIDIA Corp. | | | 1,440 | | | | 768,859 | |
KLA Corp. | | | 2,235 | | | | 738,444 | |
Fortinet, Inc.* | | | 3,662 | | | | 675,346 | |
Autodesk, Inc.* | | | 2,341 | | | | 648,808 | |
Lam Research Corp. | | | 1,070 | | | | 636,907 | |
Adobe, Inc.* | | | 1,320 | | | | 627,488 | |
Apple, Inc. | | | 4,890 | | | | 597,314 | |
Cadence Design Systems, Inc.* | | | 4,140 | | | | 567,139 | |
Advanced Micro Devices, Inc.* | | | 7,211 | | | | 566,064 | |
Applied Materials, Inc. | | | 4,180 | | | | 558,448 | |
salesforce.com, Inc.* | | | 2,557 | | | | 541,752 | |
Paycom Software, Inc.* | | | 1,449 | | | | 536,217 | |
Take-Two Interactive Software, Inc.* | | | 2,914 | | | | 514,904 | |
Microsoft Corp. | | | 2,150 | | | | 506,905 | |
MSCI, Inc. — Class A | | | 1,199 | | | | 502,717 | |
Synopsys, Inc.* | | | 1,980 | | | | 490,604 | |
QUALCOMM, Inc. | | | 3,600 | | | | 477,324 | |
Qorvo, Inc.* | | | 2,487 | | | | 454,375 | |
Intuit, Inc. | | | 1,047 | | | | 401,064 | |
ANSYS, Inc.* | | | 1,076 | | | | 365,367 | |
Tyler Technologies, Inc.* | | | 748 | | | | 317,548 | |
Xilinx, Inc. | | | 2,460 | | | | 304,794 | |
Total Technology | | | | | | | 14,285,183 | |
| | | | | | | | | |
Consumer, Non-cyclical - 27.1% |
PayPal Holdings, Inc.* | | | 3,929 | | | | 954,118 | |
Align Technology, Inc.* | | | 1,535 | | | | 831,248 | |
United Rentals, Inc.* | | | 2,304 | | | | 758,730 | |
IDEXX Laboratories, Inc.* | | | 1,320 | | | | 645,889 | |
DaVita, Inc.* | | | 5,690 | | | | 613,211 | |
DexCom, Inc.* | | | 1,700 | | | | 610,963 | |
West Pharmaceutical Services, Inc. | | | 2,120 | | | | 597,374 | |
Bio-Rad Laboratories, Inc. — Class A* | | | 1,010 | | | | 576,882 | |
Catalent, Inc.* | | | 5,340 | | | | 562,356 | |
ABIOMED, Inc.* | | | 1,730 | | | | 551,403 | |
Regeneron Pharmaceuticals, Inc.* | | | 1,130 | | | | 534,648 | |
MarketAxess Holdings, Inc. | | | 868 | | | | 432,195 | |
Thermo Fisher Scientific, Inc. | | | 941 | | | | 429,454 | |
Monster Beverage Corp.* | | | 4,530 | | | | 412,638 | |
Vertex Pharmaceuticals, Inc.* | | | 1,867 | | | | 401,199 | |
PerkinElmer, Inc. | | | 2,980 | | | | 382,304 | |
Rollins, Inc. | | | 10,980 | | | | 377,932 | |
ResMed, Inc. | | | 1,760 | | | | 341,475 | |
S&P Global, Inc. | | | 889 | | | | 313,701 | |
Verisk Analytics, Inc. — Class A | | | 1,580 | | | | 279,170 | |
Total Consumer, Non-cyclical | | | | | | | 10,606,890 | |
| | | | | | | | | |
Communications - 14.1% |
Etsy, Inc.* | | | 5,310 | | | | 1,070,868 | |
Amazon.com, Inc.* | | | 250 | | | | 773,520 | |
Netflix, Inc.* | | | 1,308 | | | | 682,331 | |
Facebook, Inc. — Class A* | | | 1,993 | | | | 586,998 | |
eBay, Inc. | | | 9,180 | | | | 562,183 | |
Twitter, Inc.* | | | 6,850 | | | | 435,865 | |
Arista Networks, Inc.* | | | 1,315 | | | | 396,985 | |
Charter Communications, Inc. — Class A* | | | 630 | | | | 388,723 | |
Alphabet, Inc. — Class A* | | | 153 | | | | 315,566 | |
Alphabet, Inc. — Class C* | | | 141 | | | | 291,677 | |
Total Communications | | | | | | | 5,504,716 | |
| | | | | | | | | |
Consumer, Cyclical - 10.0% |
Tesla, Inc.* | | | 1,380 | | | | 921,743 | |
Tractor Supply Co. | | | 3,780 | | | | 669,362 | |
Pool Corp. | | | 1,530 | | | | 528,217 | |
Domino’s Pizza, Inc. | | | 1,397 | | | | 513,803 | |
Chipotle Mexican Grill, Inc. — Class A* | | | 335 | | | | 475,975 | |
Dollar General Corp. | | | 2,232 | | | | 452,248 | |
Copart, Inc.* | | | 3,126 | | | | 339,515 | |
Total Consumer, Cyclical | | | | | | | 3,900,863 | |
| | | | | | | | | |
Industrial - 5.3% |
Generac Holdings, Inc.* | | | 2,350 | | | | 769,507 | |
Old Dominion Freight Line, Inc. | | | 2,009 | | | | 482,984 | |
Trimble, Inc.* | | | 5,900 | | | | 458,961 | |
Mettler-Toledo International, Inc.* | | | 300 | | | | 346,707 | |
Total Industrial | | | | | | | 2,058,159 | |
| | | | | | | | | |
Basic Materials - 2.4% |
Albemarle Corp. | | | 3,530 | | | | 515,768 | |
FMC Corp. | | | 4,010 | | | | 443,546 | |
Total Basic Materials | | | | | | | 959,314 | |
| | | | | | | | | |
Financial - 2.3% |
SVB Financial Group* | | | 1,860 | | | | 918,208 | |
| | | | | | | | | |
Energy - 1.9% |
Enphase Energy, Inc.* | | | 4,661 | | | | 755,828 | |
| | | | | | | | | |
Total Common Stocks | | | | |
(Cost $28,828,472) | | | | | | | 38,989,161 | |
| | | | | | | | | |
12 | THE RYDEX FUNDS ANNUAL REPORT | SEE NOTES TO FINANCIAL STATEMENTS. |
SCHEDULE OF INVESTMENTS (concluded) | March 31, 2021 |
S&P 500® PURE GROWTH FUND | |
| | Face
Amount | | | Value | |
REPURCHASE AGREEMENTS††,1 - 0.2% |
J.P. Morgan Securities LLC
issued 03/31/21 at 0.01%
due 04/01/21 | | $ | 49,869 | | | $ | 49,869 | |
Barclays Capital, Inc.
issued 03/31/21 at 0.01%
due 04/01/21 | | | 22,673 | | | | 22,673 | |
BofA Securities, Inc.
issued 03/31/21 at 0.01%
due 04/01/21 | | | 20,693 | | | | 20,693 | |
Total Repurchase Agreements | | | | |
(Cost $93,235) | | | | | | | 93,235 | |
| | | | | | | | | |
Total Investments - 99.8% | | | | |
(Cost $28,921,707) | | $ | 39,082,396 | |
Other Assets & Liabilities, net - 0.2% | | | 95,720 | |
Total Net Assets - 100.0% | | $ | 39,178,116 | |
* | Non-income producing security. |
† | Value determined based on Level 1 inputs — See Note 4. |
†† | Value determined based on Level 2 inputs — See Note 4. |
1 | Repurchase Agreements — See Note 6. |
| | |
| | See Sector Classification in Other Information section. |
The following table summarizes the inputs used to value the Fund’s investments at March 31, 2021 (See Note 4 in the Notes to Financial Statements):
Investments in Securities (Assets) | | Level 1
Quoted
Prices | | | Level 2
Significant
Observable
Inputs | | | Level 3
Significant
Unobservable
Inputs | | | Total | |
Common Stocks | | $ | 38,989,161 | | | $ | — | | | $ | — | | | $ | 38,989,161 | |
Repurchase Agreements | | | — | | | | 93,235 | | | | — | | | | 93,235 | |
Total Assets | | $ | 38,989,161 | | | $ | 93,235 | | | $ | — | | | $ | 39,082,396 | |
SEE NOTES TO FINANCIAL STATEMENTS. | THE RYDEX FUNDS ANNUAL REPORT | 13 |
S&P 500® PURE GROWTH FUND | |
STATEMENT OF ASSETS AND LIABILITIES |
March 31, 2021 |
Assets: |
Investments, at value (cost $28,828,472) | | $ | 38,989,161 | |
Repurchase agreements, at value (cost $93,235) | | | 93,235 | |
Receivables: |
Securities sold | | | 228,221 | |
Fund shares sold | | | 27,766 | |
Dividends | | | 6,461 | |
Total assets | | | 39,344,844 | |
| | | | | |
Liabilities: |
Payable for: |
Fund shares redeemed | | | 74,508 | |
Management fees | | | 24,253 | |
Distribution and service fees | | | 12,799 | |
Professional fees | | | 11,404 | |
Printing fees | | | 9,321 | |
Transfer agent and administrative fees | | | 8,699 | |
Portfolio accounting fees | | | 3,234 | |
Trustees’ fees* | | | 588 | |
Miscellaneous | | | 21,922 | |
Total liabilities | | | 166,728 | |
Commitments and contingent liabilities (Note 12) | | | — | |
Net assets | | $ | 39,178,116 | |
| | | | | |
Net assets consist of: |
Paid in capital | | $ | 27,394,243 | |
Total distributable earnings (loss) | | | 11,783,873 | |
Net assets | | $ | 39,178,116 | |
| | | | | |
A-Class: |
Net assets | | $ | 9,723,592 | |
Capital shares outstanding | | | 115,715 | |
Net asset value per share | | $ | 84.03 | |
Maximum offering price per share (Net asset value divided by 95.25%) | | $ | 88.22 | |
| | | | | |
C-Class: |
Net assets | | $ | 7,313,693 | |
Capital shares outstanding | | | 102,401 | |
Net asset value per share | | $ | 71.42 | |
| | | | | |
H-Class: |
Net assets | | $ | 22,140,831 | |
Capital shares outstanding | | | 263,586 | |
Net asset value per share | | $ | 84.00 | |
STATEMENT OF OPERATIONS |
Year Ended March 31, 2021 |
Investment Income: |
Dividends | | $ | 252,471 | |
Interest | | | 141 | |
Income from securities lending, net | | | 7 | |
Total investment income | | | 252,619 | |
| | | | | |
Expenses: |
Management fees | | | 337,861 | |
Distribution and service fees: |
A-Class | | | 22,561 | |
C-Class | | | 85,197 | |
H-Class | | | 68,758 | |
Transfer agent and administrative fees | | | 127,498 | |
Registration fees | | | 50,347 | |
Portfolio accounting fees | | | 45,055 | |
Professional fees | | | 28,195 | |
Trustees’ fees* | | | 12,000 | |
Custodian fees | | | 6,764 | |
Miscellaneous | | | 1,828 | |
Total expenses | | | 786,064 | |
Net investment loss | | | (533,445 | ) |
| | | | | |
Net Realized and Unrealized Gain (Loss): |
Net realized gain (loss) on: |
Investments | | | 5,985,795 | |
Net realized gain | | | 5,985,795 | |
Net change in unrealized appreciation (depreciation) on: |
Investments | | | 14,848,012 | |
Net change in unrealized appreciation (depreciation) | | | 14,848,012 | |
Net realized and unrealized gain | | | 20,833,807 | |
Net increase in net assets resulting from operations | | $ | 20,300,362 | |
* | Relates to Trustees not deemed “interested persons” within the meaning of Section 2(a)(19) of the 1940 Act. |
14 | THE RYDEX FUNDS ANNUAL REPORT | SEE NOTES TO FINANCIAL STATEMENTS. |
S&P 500® PURE GROWTH FUND | |
STATEMENTS OF CHANGES IN NET ASSETS |
| | Year Ended
March 31,
2021 | | | Year Ended
March 31,
2020 | |
Increase (Decrease) in Net Assets from Operations: | | | | | | | | |
Net investment loss | | $ | (533,445 | ) | | $ | (453,701 | ) |
Net realized gain on investments | | | 5,985,795 | | | | 17,941,754 | |
Net change in unrealized appreciation (depreciation) on investments | | | 14,848,012 | | | | (22,350,953 | ) |
Net increase (decrease) in net assets resulting from operations | | | 20,300,362 | | | | (4,862,900 | ) |
| | | | | | | | | |
Distributions to shareholders: | | | | | | | | |
A-Class | | | (347,944 | ) | | | (584,364 | ) |
C-Class | | | (375,991 | ) | | | (524,964 | ) |
H-Class | | | (942,938 | ) | | | (3,413,894 | ) |
Total distributions to shareholders | | | (1,666,873 | ) | | | (4,523,222 | ) |
| | | | | | | | | |
Capital share transactions: | | | | | | | | |
Proceeds from sale of shares | | | | | | | | |
A-Class | | | 3,027,956 | | | | 2,672,682 | |
C-Class | | | 3,741,861 | | | | 2,747,902 | |
H-Class | | | 89,764,435 | | | | 238,586,181 | |
Distributions reinvested | | | | | | | | |
A-Class | | | 342,450 | | | | 579,514 | |
C-Class | | | 373,797 | | | | 521,531 | |
H-Class | | | 923,354 | | | | 3,389,391 | |
Cost of shares redeemed | | | | | | | | |
A-Class | | | (5,118,294 | ) | | | (9,216,614 | ) |
C-Class | | | (6,297,073 | ) | | | (5,821,318 | ) |
H-Class | | | (105,900,746 | ) | | | (292,741,951 | ) |
Net decrease from capital share transactions | | | (19,142,260 | ) | | | (59,282,682 | ) |
Net decrease in net assets | | | (508,771 | ) | | | (68,668,804 | ) |
| | | | | | | | | |
Net assets: | | | | | | | | |
Beginning of year | | | 39,686,887 | | | | 108,355,691 | |
End of year | | $ | 39,178,116 | | | $ | 39,686,887 | |
| | | | | | | | | |
Capital share activity: | | | | | | | | |
Shares sold | | | | | | | | |
A-Class | | | 39,994 | | | | 39,759 | |
C-Class | | | 65,460 | | | | 46,633 | |
H-Class | | | 1,203,307 | | | | 3,527,207 | |
Shares issued from reinvestment of distributions | | | | | | | | |
A-Class | | | 4,216 | | | | 8,697 | |
C-Class | | | 5,402 | | | | 9,061 | |
H-Class | | | 11,370 | | | | 50,884 | |
Shares redeemed | | | | | | | | |
A-Class | | | (70,507 | ) | | | (141,129 | ) |
C-Class | | | (98,665 | ) | | | (104,655 | ) |
H-Class | | | (1,433,175 | ) | | | (4,350,136 | ) |
Net decrease in shares | | | (272,598 | ) | | | (913,679 | ) |
SEE NOTES TO FINANCIAL STATEMENTS. | THE RYDEX FUNDS ANNUAL REPORT | 15 |
S&P 500® PURE GROWTH FUND | |
This table is presented to show selected data for a share outstanding throughout each period and to assist shareholders in evaluating a Fund’s performance for the periods presented.
A-Class | | Year Ended
March 31,
2021 | | | Year Ended
March 31,
2020 | | | Year Ended
March 31,
2019 | | | Year Ended
March 29,
2018 | | | Year Ended
March 31,
2017 | |
Per Share Data |
Net asset value, beginning of period | | $ | 53.91 | | | $ | 65.86 | | | $ | 66.50 | | | $ | 57.84 | | | $ | 51.74 | |
Income (loss) from investment operations: |
Net investment income (loss)a | | | (.80 | ) | | | (.29 | ) | | | (.50 | ) | | | (.36 | ) | | | (.44 | ) |
Net gain (loss) on investments (realized and unrealized) | | | 34.07 | | | | (8.09 | ) | | | 3.42 | | | | 12.57 | | | | 6.56 | |
Total from investment operations | | | 33.27 | | | | (8.38 | ) | | | 2.92 | | | | 12.21 | | | | 6.12 | |
Less distributions from: |
Net realized gains | | | (3.15 | ) | | | (3.57 | ) | | | (3.56 | ) | | | (3.55 | ) | | | (.02 | ) |
Total distributions | | | (3.15 | ) | | | (3.57 | ) | | | (3.56 | ) | | | (3.55 | ) | | | (.02 | ) |
Net asset value, end of period | | $ | 84.03 | | | $ | 53.91 | | | $ | 65.86 | | | $ | 66.50 | | | $ | 57.84 | |
|
Total Returnb | | | 61.92 | % | | | (13.76 | %) | | | 4.88 | % | | | 21.39 | % | | | 11.84 | % |
Ratios/Supplemental Data |
Net assets, end of period (in thousands) | | $ | 9,724 | | | $ | 7,656 | | | $ | 15,456 | | | $ | 17,254 | | | $ | 15,575 | |
Ratios to average net assets: |
Net investment income (loss) | | | (1.06 | %) | | | (0.43 | %) | | | (0.75 | %) | | | (0.56 | %) | | | (0.82 | %) |
Total expenses | | | 1.60 | % | | | 1.63 | % | | | 1.61 | % | | | 1.53 | % | | | 1.53 | % |
Portfolio turnover rate | | | 240 | % | | | 282 | % | | | 177 | % | | | 215 | % | | | 184 | % |
C-Class | | Year Ended
March 31,
2021 | | | Year Ended
March 31,
2020 | | | Year Ended
March 31,
2019 | | | Year Ended
March 29,
2018 | | | Year Ended
March 31,
2017 | |
Per Share Data |
Net asset value, beginning of period | | $ | 46.47 | | | $ | 57.65 | | | $ | 59.10 | | | $ | 52.13 | | | $ | 46.99 | |
Income (loss) from investment operations: |
Net investment income (loss)a | | | (1.16 | ) | | | (.69 | ) | | | (.90 | ) | | | (.75 | ) | | | (.77 | ) |
Net gain (loss) on investments (realized and unrealized) | | | 29.26 | | | | (6.92 | ) | | | 3.01 | | | | 11.27 | | | | 5.93 | |
Total from investment operations | | | 28.10 | | | | (7.61 | ) | | | 2.11 | | | | 10.52 | | | | 5.16 | |
Less distributions from: |
Net realized gains | | | (3.15 | ) | | | (3.57 | ) | | | (3.56 | ) | | | (3.55 | ) | | | (.02 | ) |
Total distributions | | | (3.15 | ) | | | (3.57 | ) | | | (3.56 | ) | | | (3.55 | ) | | | (.02 | ) |
Net asset value, end of period | | $ | 71.42 | | | $ | 46.47 | | | $ | 57.65 | | | $ | 59.10 | | | $ | 52.13 | |
|
Total Returnb | | | 60.69 | % | | | (14.40 | %) | | | 4.09 | % | | | 20.50 | % | | | 10.99 | % |
Ratios/Supplemental Data |
Net assets, end of period (in thousands) | | $ | 7,314 | | | $ | 6,050 | | | $ | 10,329 | | | $ | 13,442 | | | $ | 10,951 | |
Ratios to average net assets: |
Net investment income (loss) | | | (1.80 | %) | | | (1.18 | %) | | | (1.52 | %) | | | (1.32 | %) | | | (1.57 | %) |
Total expenses | | | 2.35 | % | | | 2.38 | % | | | 2.36 | % | | | 2.28 | % | | | 2.27 | % |
Portfolio turnover rate | | | 240 | % | | | 282 | % | | | 177 | % | | | 215 | % | | | 184 | % |
16 | THE RYDEX FUNDS ANNUAL REPORT | SEE NOTES TO FINANCIAL STATEMENTS. |
S&P 500® PURE GROWTH FUND | |
FINANCIAL HIGHLIGHTS (concluded) |
This table is presented to show selected data for a share outstanding throughout each period and to assist shareholders in evaluating a Fund’s performance for the periods presented.
H-Class | | Year Ended
March 31,
2021 | | | Year Ended
March 31,
2020 | | | Year Ended
March 31,
2019 | | | Year Ended
March 29,
2018 | | | Year Ended
March 31,
2017 | |
Per Share Data |
Net asset value, beginning of period | | $ | 53.89 | | | $ | 65.84 | | | $ | 66.49 | | | $ | 57.83 | | | $ | 51.73 | |
Income (loss) from investment operations: |
Net investment income (loss)a | | | (.77 | ) | | | (.29 | ) | | | (.53 | ) | | | (.38 | ) | | | (.44 | ) |
Net gain (loss) on investments (realized and unrealized) | | | 34.03 | | | | (8.09 | ) | | | 3.44 | | | | 12.59 | | | | 6.56 | |
Total from investment operations | | | 33.26 | | | | (8.38 | ) | | | 2.91 | | | | 12.21 | | | | 6.12 | |
Less distributions from: |
Net realized gains | | | (3.15 | ) | | | (3.57 | ) | | | (3.56 | ) | | | (3.55 | ) | | | (.02 | ) |
Total distributions | | | (3.15 | ) | | | (3.57 | ) | | | (3.56 | ) | | | (3.55 | ) | | | (.02 | ) |
Net asset value, end of period | | $ | 84.00 | | | $ | 53.89 | | | $ | 65.84 | | | $ | 66.49 | | | $ | 57.83 | |
|
Total Return | | | 61.92 | % | | | (13.77 | %) | | | 4.86 | % | | | 21.40 | % | | | 11.84 | % |
Ratios/Supplemental Data |
Net assets, end of period (in thousands) | | $ | 22,141 | | | $ | 25,981 | | | $ | 82,570 | | | $ | 109,644 | | | $ | 78,673 | |
Ratios to average net assets: |
Net investment income (loss) | | | (1.03 | %) | | | (0.44 | %) | | | (0.79 | %) | | | (0.59 | %) | | | (0.81 | %) |
Total expenses | | | 1.61 | % | | | 1.63 | % | | | 1.61 | % | | | 1.53 | % | | | 1.52 | % |
Portfolio turnover rate | | | 240 | % | | | 282 | % | | | 177 | % | | | 215 | % | | | 184 | % |
a | Net investment income (loss) per share was computed using average shares outstanding throughout the period. |
b | Total return does not reflect the impact of any applicable sales charges. |
SEE NOTES TO FINANCIAL STATEMENTS. | THE RYDEX FUNDS ANNUAL REPORT | 17 |
PERFORMANCE REPORT AND FUND PROFILE (Unaudited) | March 31, 2021 |
S&P 500® PURE VALUE FUND
OBJECTIVE: Seeks to provide investment results that match, before fees and expenses, the performance of a benchmark for large-cap value securities on a daily basis. The Fund’s current benchmark is the S&P 500® Pure Value Index (the “underlying index”).
For the year ended March 31, 2021, S&P 500® Pure Value Fund H-Class returned 85.15%, compared with a return of 89.80% for the underlying index. The Fund maintained a daily correlation of over 99% to its benchmark for the period.
All sectors contributed to the return of the underlying index for the period, led by Financials, Consumer Discretionary, and Energy.
The holdings contributing the most to the return of the underlying index for the period were General Motors Co., Gap, Inc., and Ford Motor Co. The holdings detracting the most from return were Perrigo Company plc, Macy’s, Inc., and Walmart, Inc.
Performance displayed represents past performance, which is no guarantee of future results.
Holdings Diversification (Market Exposure as % of Net Assets)

“Holdings Diversification (Market Exposure as % of Net Assets)” excludes any temporary cash investments.
Inception Dates: |
A-Class | September 1, 2004 |
C-Class | February 20, 2004 |
H-Class | February 20, 2004 |
Ten Largest Holdings (% of Total Net Assets) |
Unum Group | 2.2% |
Berkshire Hathaway, Inc. — Class B | 2.1% |
Lumen Technologies, Inc. | 2.0% |
HollyFrontier Corp. | 2.0% |
Lincoln National Corp. | 1.9% |
MetLife, Inc. | 1.8% |
Ford Motor Co. | 1.8% |
Prudential Financial, Inc. | 1.7% |
Valero Energy Corp. | 1.7% |
Hartford Financial Services Group, Inc. | 1.6% |
Top Ten Total | 18.8% |
| | |
“Ten Largest Holdings” excludes any temporary cash investments. |
18 | THE RYDEX FUNDS ANNUAL REPORT | |
PERFORMANCE REPORT AND FUND PROFILE (Unaudited)(concluded) | March 31, 2021 |
Cumulative Fund Performance*
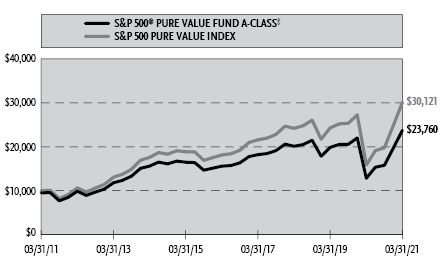

Average Annual Returns*
Periods Ended March 31, 2021
| 1 Year | 5 Year | 10 Year |
A-Class Shares | 85.10% | 8.79% | 9.57% |
A-Class Shares with sales charge‡ | 76.30% | 7.74% | 9.04% |
C-Class Shares | 83.72% | 7.98% | 8.76% |
C-Class Shares with CDSC§ | 82.72% | 7.98% | 8.76% |
H-Class Shares | 85.15% | 8.80% | 9.58% |
S&P 500 Pure Value Index | 89.80% | 10.66% | 11.66% |
* | The performance data above represents past performance that is not predictive of future results. The investment return and principal value of an investment in the Fund will fluctuate so that an investor’s shares, when redeemed, may be worth more or less than their original cost. Returns are historical and include changes in principal and reinvested dividends and capital gains and do not reflect the effect of taxes. The S&P 500 Pure Value Index is an unmanaged index and, unlike the Fund, has no management fees or operating expenses to reduce its reported return. The graphs are based on A-Class and H-Class shares only; performance for C-Class shares will vary due to differences in fee structure. |
‡ | Fund returns are calculated using the maximum sales charge of 4.75%. |
§ | Fund returns include a CDSC of 1% if redeemed within 12 months of purchase. |
| | THE RYDEX FUNDS ANNUAL REPORT | 19 |
SCHEDULE OF INVESTMENTS | March 31, 2021 |
S&P 500® PURE VALUE FUND | |
| | Shares | | | Value | |
COMMON STOCKS† - 99.3% |
| | | | | | | | | |
Financial - 43.4% |
Unum Group | | | 45,503 | | | $ | 1,266,349 | |
Berkshire Hathaway, Inc. — Class B* | | | 4,730 | | | | 1,208,373 | |
Lincoln National Corp. | | | 17,472 | | | | 1,087,981 | |
MetLife, Inc. | | | 17,325 | | | | 1,053,187 | |
Prudential Financial, Inc. | | | 10,513 | | | | 957,734 | |
Hartford Financial Services Group, Inc. | | | 14,176 | | | | 946,815 | |
Invesco Ltd. | | | 34,930 | | | | 880,935 | |
Principal Financial Group, Inc. | | | 12,859 | | | | 771,026 | |
People’s United Financial, Inc. | | | 38,918 | | | | 696,632 | |
Citigroup, Inc. | | | 9,356 | | | | 680,649 | |
Wells Fargo & Co. | | | 16,477 | | | | 643,756 | |
Capital One Financial Corp. | | | 4,895 | | | | 622,791 | |
Citizens Financial Group, Inc. | | | 13,923 | | | | 614,700 | |
Fifth Third Bancorp | | | 16,328 | | | | 611,484 | |
Allstate Corp. | | | 5,221 | | | | 599,893 | |
American International Group, Inc. | | | 12,852 | | | | 593,891 | |
Loews Corp. | | | 11,570 | | | | 593,310 | |
Everest Re Group Ltd. | | | 2,363 | | | | 585,575 | |
Bank of New York Mellon Corp. | | | 12,033 | | | | 569,040 | |
Comerica, Inc. | | | 7,866 | | | | 564,307 | |
Aflac, Inc. | | | 10,885 | | | | 557,094 | |
Zions Bancorp North America | | | 9,778 | | | | 537,399 | |
Goldman Sachs Group, Inc. | | | 1,620 | | | | 529,740 | |
Assurant, Inc. | | | 3,614 | | | | 512,357 | |
Regions Financial Corp. | | | 24,331 | | | | 502,678 | |
Travelers Companies, Inc. | | | 3,261 | | | | 490,454 | |
KeyCorp | | | 24,362 | | | | 486,753 | |
Bank of America Corp. | | | 12,288 | | | | 475,423 | |
Franklin Resources, Inc. | | | 15,430 | | | | 456,728 | |
M&T Bank Corp. | | | 2,907 | | | | 440,730 | |
State Street Corp. | | | 5,122 | | | | 430,299 | |
Truist Financial Corp. | | | 7,074 | | | | 412,556 | |
Cincinnati Financial Corp. | | | 3,770 | | | | 388,649 | |
Morgan Stanley | | | 4,963 | | | | 385,427 | |
Kimco Realty Corp. REIT | | | 18,140 | | | | 340,125 | |
Huntington Bancshares, Inc. | | | 21,099 | | | | 331,676 | |
Globe Life, Inc. | | | 3,310 | | | | 319,845 | |
Chubb Ltd. | | | 1,880 | | | | 296,984 | |
PNC Financial Services Group, Inc. | | | 1,670 | | | | 292,935 | |
Raymond James Financial, Inc. | | | 2,286 | | | | 280,172 | |
CBRE Group, Inc. — Class A* | | | 3,300 | | | | 261,063 | |
U.S. Bancorp | | | 4,420 | | | | 244,470 | |
Synchrony Financial | | | 5,450 | | | | 221,597 | |
JPMorgan Chase & Co. | | | 1,400 | | | | 213,122 | |
Total Financial | | | | | | | 24,956,704 | |
| | | | | | | | | |
Consumer, Non-cyclical - 16.2% |
CVS Health Corp. | | | 11,279 | | | | 848,519 | |
Archer-Daniels-Midland Co. | | | 13,783 | | | | 785,631 | |
Centene Corp.* | | | 12,220 | | | | 780,980 | |
Kroger Co. | | | 20,521 | | | | 738,551 | |
Molson Coors Beverage Co. — Class B* | | | 13,462 | | | | 688,581 | |
Cigna Corp. | | | 2,830 | | | | 684,124 | |
Tyson Foods, Inc. — Class A | | | 8,460 | | | | 628,578 | |
McKesson Corp. | | | 2,968 | | | | 578,879 | |
Viatris, Inc.* | | | 40,184 | | | | 561,370 | |
Kraft Heinz Co. | | | 13,298 | | | | 531,920 | |
Cardinal Health, Inc. | | | 8,170 | | | | 496,328 | |
Anthem, Inc. | | | 1,150 | | | | 412,793 | |
Corteva, Inc. | | | 6,713 | | | | 312,960 | |
Universal Health Services, Inc. — Class B | | | 2,320 | | | | 309,465 | |
Perrigo Company plc | | | 6,890 | | | | 278,838 | |
J M Smucker Co. | | | 2,036 | | | | 257,615 | |
AmerisourceBergen Corp. — Class A | | | 1,855 | | | | 219,020 | |
Henry Schein, Inc.* | | | 2,900 | | | | 200,796 | |
Total Consumer, Non-cyclical | | | | | | | 9,314,948 | |
| | | | | | | | | |
Consumer, Cyclical - 11.1% |
Ford Motor Co.* | | | 84,664 | | | | 1,037,134 | |
Walgreens Boots Alliance, Inc. | | | 16,166 | | | | 887,513 | |
General Motors Co.* | | | 13,060 | | | | 750,428 | |
Mohawk Industries, Inc.* | | | 3,600 | | | | 692,316 | |
Lennar Corp. — Class A | | | 5,497 | | | | 556,461 | |
Whirlpool Corp. | | | 1,699 | | | | 374,375 | |
Hanesbrands, Inc. | | | 17,130 | | | | 336,947 | |
LKQ Corp.* | | | 7,710 | | | | 326,364 | |
BorgWarner, Inc. | | | 6,979 | | | | 323,546 | |
CarMax, Inc.* | | | 2,140 | | | | 283,892 | |
PVH Corp.* | | | 2,467 | | | | 260,762 | |
Gap, Inc. | | | 7,179 | | | | 213,791 | |
Advance Auto Parts, Inc. | | | 1,150 | | | | 211,014 | |
Walmart, Inc. | | | 1,120 | | | | 152,130 | |
Total Consumer, Cyclical | | | | | | | 6,406,673 | |
| | | | | | | | | |
Energy - 9.3% |
HollyFrontier Corp. | | | 31,583 | | | | 1,130,040 | |
Valero Energy Corp. | | | 13,337 | | | | 954,929 | |
Exxon Mobil Corp. | | | 13,476 | | | | 752,365 | |
Phillips 66 | | | 8,830 | | | | 719,998 | |
Marathon Petroleum Corp. | | | 8,317 | | | | 444,876 | |
Marathon Oil Corp. | | | 35,650 | | | | 380,742 | |
Kinder Morgan, Inc. | | | 18,853 | | | | 313,902 | |
Pioneer Natural Resources Co. | | | 1,530 | | | | 242,995 | |
Chevron Corp. | | | 2,041 | | | | 213,877 | |
EOG Resources, Inc. | | | 2,940 | | | | 213,238 | |
Total Energy | | | | | | | 5,366,962 | |
| | | | | | | | | |
Communications - 6.6% |
Lumen Technologies, Inc. | | | 84,880 | | | | 1,133,148 | |
ViacomCBS, Inc. — Class B | | | 11,100 | | | | 500,610 | |
AT&T, Inc. | | | 12,577 | | | | 380,706 | |
DISH Network Corp. — Class A* | | | 8,586 | | | | 310,813 | |
Juniper Networks, Inc. | | | 10,477 | | | | 265,382 | |
Discovery, Inc. — Class C* | | | 7,050 | | | | 260,075 | |
Fox Corp. — Class A | | | 6,668 | | | | 240,781 | |
Interpublic Group of Companies, Inc. | | | 7,070 | | | | 206,444 | |
News Corp. — Class A | | | 7,117 | | | | 180,985 | |
Discovery, Inc. — Class A*,1 | | | 3,660 | | | | 159,064 | |
Fox Corp. — Class B | | | 3,070 | | | | 107,235 | |
News Corp. — Class B | | | 2,208 | | | | 51,800 | |
Total Communications | | | | | | | 3,797,043 | |
20 | THE RYDEX FUNDS ANNUAL REPORT | SEE NOTES TO FINANCIAL STATEMENTS. |
SCHEDULE OF INVESTMENTS (continued) | March 31, 2021 |
S&P 500® PURE VALUE FUND | |
| | Shares | | | Value | |
Industrial - 4.4% |
Westrock Co. | | | 11,640 | | | $ | 605,862 | |
Textron, Inc. | | | 6,279 | | | | 352,126 | |
Huntington Ingalls Industries, Inc. | | | 1,670 | | | | 343,769 | |
Howmet Aerospace, Inc.* | | | 9,800 | | | | 314,874 | |
Raytheon Technologies Corp. | | | 3,430 | | | | 265,036 | |
Westinghouse Air Brake Technologies Corp. | | | 3,060 | | | | 242,230 | |
General Dynamics Corp. | | | 1,150 | | | | 208,794 | |
General Electric Co. | | | 14,650 | | | | 192,355 | |
Total Industrial | | | | | | | 2,525,046 | |
| | | | | | | | | |
Technology - 3.5% |
Hewlett Packard Enterprise Co. | | | 59,497 | | | | 936,483 | |
Western Digital Corp. | | | 7,060 | | | | 471,255 | |
HP, Inc. | | | 12,122 | | | | 384,874 | |
DXC Technology Co.* | | | 7,028 | | | | 219,695 | |
Total Technology | | | | | | | 2,012,307 | |
| | | | | | | | | |
Utilities - 2.8% |
Exelon Corp. | | | 9,324 | | | | 407,832 | |
Consolidated Edison, Inc. | | | 3,210 | | | | 240,108 | |
Evergy, Inc. | | | 3,590 | | | | 213,713 | |
FirstEnergy Corp. | | | 5,940 | | | | 206,058 | |
Pinnacle West Capital Corp. | | | 2,260 | | | | 183,851 | |
PPL Corp. | | | 6,060 | | | | 174,770 | |
Edison International | | | 2,530 | | | | 148,258 | |
Total Utilities | | | | | | | 1,574,590 | |
| | | | | | | | | |
Basic Materials - 2.0% |
Nucor Corp. | | | 6,341 | | | | 508,992 | |
Mosaic Co. | | | 14,245 | | | | 450,285 | |
International Paper Co. | | | 3,644 | | | | 197,031 | |
Total Basic Materials | | | | | | | 1,156,308 | |
| | | | | | | | | |
Total Common Stocks | | | | |
(Cost $50,932,241) | | | | | | | 57,110,581 | |
| | | | | | | | | |
| | Face
Amount | | | Value | |
REPURCHASE AGREEMENTS††,2 - 0.6% |
J.P. Morgan Securities LLC
issued 03/31/21 at 0.01%
due 04/01/21 | | $ | 192,183 | | | | 192,183 | |
Barclays Capital, Inc.
issued 03/31/21 at 0.01%
due 04/01/21 | | | 87,376 | | | | 87,376 | |
BofA Securities, Inc.
issued 03/31/21 at 0.01%
due 04/01/21 | | | 79,744 | | | | 79,744 | |
Total Repurchase Agreements | | | | |
(Cost $359,303) | | | | | | | 359,303 | |
| | | | | | | | | |
| | | Shares | | | | | |
SECURITIES LENDING COLLATERAL†,3 - 0.2% |
Money Market Fund | | | | | | | | |
First American Government Obligations Fund — Class Z, 0.03%4 | | | 119,794 | | | | 119,794 | |
Total Securities Lending Collateral | | | | |
(Cost $119,794) | | | | | | | 119,794 | |
| | | | | | | | | |
Total Investments - 100.1% | | | | |
(Cost $51,411,338) | | $ | 57,589,678 | |
Other Assets & Liabilities, net - (0.1)% | | | (62,595 | ) |
Total Net Assets - 100.0% | | $ | 57,527,083 | |
* | Non-income producing security. |
† | Value determined based on Level 1 inputs — See Note 4. |
†† | Value determined based on Level 2 inputs — See Note 4. |
1 | All or a portion of this security is on loan at March 31, 2021 — See Note 7. |
2 | Repurchase Agreements — See Note 6. |
3 | Securities lending collateral — See Note 7. |
4 | Rate indicated is the 7-day yield as of March 31, 2021. |
| | plc — Public Limited Company |
| | REIT — Real Estate Investment Trust |
| | |
| | See Sector Classification in Other Information section. |
SEE NOTES TO FINANCIAL STATEMENTS. | THE RYDEX FUNDS ANNUAL REPORT | 21 |
SCHEDULE OF INVESTMENTS (concluded) | March 31, 2021 |
S&P 500® PURE VALUE FUND | |
The following table summarizes the inputs used to value the Fund’s investments at March 31, 2021 (See Note 4 in the Notes to Financial Statements):
Investments in Securities (Assets) | | Level 1
Quoted
Prices | | | Level 2
Significant
Observable
Inputs | | | Level 3
Significant
Unobservable
Inputs | | | Total | |
Common Stocks | | $ | 57,110,581 | | | $ | — | | | $ | — | | | $ | 57,110,581 | |
Repurchase Agreements | | | — | | | | 359,303 | | | | — | | | | 359,303 | |
Securities Lending Collateral | | | 119,794 | | | | — | | | | — | | | | 119,794 | |
Total Assets | | $ | 57,230,375 | | | $ | 359,303 | | | $ | — | | | $ | 57,589,678 | |
22 | THE RYDEX FUNDS ANNUAL REPORT | SEE NOTES TO FINANCIAL STATEMENTS. |
STATEMENT OF ASSETS AND LIABILITIES |
March 31, 2021 |
Assets: |
Investments, at value - including $116,994 of securities loaned (cost $51,052,035) | | $ | 57,230,375 | |
Repurchase agreements, at value (cost $359,303) | | | 359,303 | |
Cash | | | 2,345 | |
Receivables: |
Fund shares sold | | | 117,093 | |
Dividends | | | 51,014 | |
Securities lending income | | | 1 | |
Total assets | | | 57,760,131 | |
| | | | | |
Liabilities: |
Payable for: |
Return of securities lending collateral | | | 119,794 | |
Management fees | | | 31,687 | |
Distribution and service fees | | | 11,467 | |
Transfer agent and administrative fees | | | 11,365 | |
Fund shares redeemed | | | 7,649 | |
Portfolio accounting fees | | | 4,225 | |
Trustees’ fees* | | | 647 | |
Miscellaneous | | | 46,214 | |
Total liabilities | | | 233,048 | |
Commitments and contingent liabilities (Note 12) | | | — | |
Net assets | | $ | 57,527,083 | |
| | | | | |
Net assets consist of: |
Paid in capital | | $ | 60,570,333 | |
Total distributable earnings (loss) | | | (3,043,250 | ) |
Net assets | | $ | 57,527,083 | |
| | | | | |
A-Class: |
Net assets | | $ | 2,925,205 | |
Capital shares outstanding | | | 32,781 | |
Net asset value per share | | $ | 89.23 | |
Maximum offering price per share (Net asset value divided by 95.25%) | | $ | 93.68 | |
| | | | | |
C-Class: |
Net assets | | $ | 1,805,228 | |
Capital shares outstanding | | | 24,169 | |
Net asset value per share | | $ | 74.69 | |
| | | | | |
H-Class: |
Net assets | | $ | 52,796,650 | |
Capital shares outstanding | | | 588,983 | |
Net asset value per share | | $ | 89.64 | |
STATEMENT OF OPERATIONS |
Year Ended March 31, 2021 |
Investment Income: |
Dividends | | $ | 532,027 | |
Interest | | | 54 | |
Income from securities lending, net | | | 1,658 | |
Total investment income | | | 533,739 | |
| | | | | |
Expenses: |
Management fees | | | 146,633 | |
Distribution and service fees: |
A-Class | | | 4,813 | |
C-Class | | | 13,085 | |
H-Class | | | 40,793 | |
Transfer agent and administrative fees | | | 54,370 | |
Portfolio accounting fees | | | 19,553 | |
Professional fees | | | 8,261 | |
Trustees’ fees* | | | 3,449 | |
Custodian fees | | | 2,944 | |
Line of credit fees | | | 215 | |
Miscellaneous | | | 24,595 | |
Total expenses | | | 318,711 | |
Net investment income | | | 215,028 | |
| | | | | |
Net Realized and Unrealized Gain (Loss): |
Net realized gain (loss) on: |
Investments | | | (3,593,666 | ) |
Net realized loss | | | (3,593,666 | ) |
Net change in unrealized appreciation (depreciation) on: |
Investments | | | 9,801,986 | |
Net change in unrealized appreciation (depreciation) | | | 9,801,986 | |
Net realized and unrealized gain | | | 6,208,320 | |
Net increase in net assets resulting from operations | | $ | 6,423,348 | |
* | Relates to Trustees not deemed “interested persons” within the meaning of Section 2(a)(19) of the 1940 Act. |
SEE NOTES TO FINANCIAL STATEMENTS. | THE RYDEX FUNDS ANNUAL REPORT | 23 |
STATEMENTS OF CHANGES IN NET ASSETS |
| | Year Ended
March 31,
2021 | | | Year Ended
March 31,
2020 | |
Increase (Decrease) in Net Assets from Operations: | | | | | | | | |
Net investment income | | $ | 215,028 | | | $ | 504,854 | |
Net realized gain (loss) on investments | | | (3,593,666 | ) | | | 1,699,354 | |
Net change in unrealized appreciation (depreciation) on investments | | | 9,801,986 | | | | (8,983,225 | ) |
Net increase (decrease) in net assets resulting from operations | | | 6,423,348 | | | | (6,779,017 | ) |
| | | | | | | | | |
Distributions to shareholders: | | | | | | | | |
A-Class | | | (18,692 | ) | | | (35,656 | ) |
C-Class | | | (15,043 | ) | | | (34,327 | ) |
H-Class | | | (268,123 | ) | | | (345,333 | ) |
Total distributions to shareholders | | | (301,858 | ) | | | (415,316 | ) |
| | | | | | | | | |
Capital share transactions: | | | | | | | | |
Proceeds from sale of shares | | | | | | | | |
A-Class | | | 874,138 | | | | 1,349,084 | |
C-Class | | | 4,340,519 | | | | 8,884,403 | |
H-Class | | | 277,399,114 | | | | 97,623,692 | |
Distributions reinvested | | | | | | | | |
A-Class | | | 18,484 | | | | 34,706 | |
C-Class | | | 14,913 | | | | 32,664 | |
H-Class | | | 262,826 | | | | 344,762 | |
Cost of shares redeemed | | | | | | | | |
A-Class | | | (835,197 | ) | | | (2,191,323 | ) |
C-Class | | | (4,645,403 | ) | | | (9,179,384 | ) |
H-Class | | | (234,482,610 | ) | | | (130,456,068 | ) |
Net increase (decrease) from capital share transactions | | | 42,946,784 | | | | (33,557,464 | ) |
Net increase (decrease) in net assets | | | 49,068,274 | | | | (40,751,797 | ) |
| | | | | | | | | |
Net assets: | | | | | | | | |
Beginning of year | | | 8,458,809 | | | | 49,210,606 | |
End of year | | $ | 57,527,083 | | | $ | 8,458,809 | |
| | | | | | | | | |
Capital share activity: | | | | | | | | |
Shares sold | | | | | | | | |
A-Class | | | 10,614 | | | | 17,823 | |
C-Class | | | 72,449 | | | | 137,298 | |
H-Class | | | 3,827,657 | | | | 1,239,820 | |
Shares issued from reinvestment of distributions | | | | | | | | |
A-Class | | | 247 | | | | 428 | |
C-Class | | | 238 | | | | 475 | |
H-Class | | | 3,496 | | | | 4,229 | |
Shares redeemed | | | | | | | | |
A-Class | | | (13,352 | ) | | | (29,223 | ) |
C-Class | | | (80,649 | ) | | | (141,719 | ) |
H-Class | | | (3,353,123 | ) | | | (1,700,575 | ) |
Net increase (decrease) in shares | | | 467,577 | | | | (471,444 | ) |
24 | THE RYDEX FUNDS ANNUAL REPORT | SEE NOTES TO FINANCIAL STATEMENTS. |
This table is presented to show selected data for a share outstanding throughout each period and to assist shareholders in evaluating a Fund’s performance for the periods presented.
A-Class | | Year Ended
March 31,
2021 | | | Year Ended
March 31,
2020 | | | Year Ended
March 31,
2019 | | | Year Ended
March 29,
2018 | | | Year Ended
March 31,
2017c | |
Per Share Data |
Net asset value, beginning of period | | $ | 48.65 | | | $ | 76.07 | | | $ | 83.46 | | | $ | 76.42 | | | $ | 66.03 | |
Income (loss) from investment operations: |
Net investment income (loss)a | | | .70 | | | | 1.02 | | | | .85 | | | | .60 | | | | .55 | |
Net gain (loss) on investments (realized and unrealized) | | | 40.58 | | | | (27.62 | ) | | | (2.17 | ) | | | 7.41 | | | | 10.52 | |
Total from investment operations | | | 41.28 | | | | (26.60 | ) | | | (1.32 | ) | | | 8.01 | | | | 11.07 | |
Less distributions from: |
Net investment income | | | (.70 | ) | | | (.82 | ) | | | (1.14 | ) | | | (.27 | ) | | | (.68 | ) |
Net realized gains | | | — | | | | — | | | | (4.93 | ) | | | (.70 | ) | | | — | |
Total distributions | | | (.70 | ) | | | (.82 | ) | | | (6.07 | ) | | | (.97 | ) | | | (.68 | ) |
Net asset value, end of period | | $ | 89.23 | | | $ | 48.65 | | | $ | 76.07 | | | $ | 83.46 | | | $ | 76.42 | |
|
Total Returnb | | | 85.10 | % | | | (35.38 | %) | | | (1.26 | %) | | | 10.48 | % | | | 16.80 | % |
Ratios/Supplemental Data |
Net assets, end of period (in thousands) | | $ | 2,925 | | | $ | 1,716 | | | $ | 3,518 | | | $ | 6,108 | | | $ | 6,686 | |
Ratios to average net assets: |
Net investment income (loss) | | | 1.06 | % | | | 1.32 | % | | | 1.01 | % | | | 0.74 | % | | | 0.79 | % |
Total expenses | | | 1.60 | % | | | 1.63 | % | | | 1.61 | % | | | 1.53 | % | | | 1.53 | % |
Portfolio turnover rate | | | 1,207 | % | | | 254 | % | | | 190 | % | | | 252 | % | | | 321 | % |
C-Class | | Year Ended
March 31,
2021 | | | Year Ended
March 31,
2020 | | | Year Ended
March 31,
2019 | | | Year Ended
March 29,
2018 | | | Year Ended
March 31,
2017c | |
Per Share Data |
Net asset value, beginning of period | | $ | 41.11 | | | $ | 64.87 | | | $ | 72.64 | | | $ | 67.13 | | | $ | 58.51 | |
Income (loss) from investment operations: |
Net investment income (loss)a | | | .18 | | | | .17 | | | | .12 | | | | (.03 | ) | | | (.01 | ) |
Net gain (loss) on investments (realized and unrealized) | | | 34.10 | | | | (23.11 | ) | | | (1.82 | ) | | | 6.51 | | | | 9.31 | |
Total from investment operations | | | 34.28 | | | | (22.94 | ) | | | (1.70 | ) | | | 6.48 | | | | 9.30 | |
Less distributions from: |
Net investment income | | | (.70 | ) | | | (.82 | ) | | | (1.14 | ) | | | (.27 | ) | | | (.68 | ) |
Net realized gains | | | — | | | | — | | | | (4.93 | ) | | | (.70 | ) | | | — | |
Total distributions | | | (.70 | ) | | | (.82 | ) | | | (6.07 | ) | | | (.97 | ) | | | (.68 | ) |
Net asset value, end of period | | $ | 74.69 | | | $ | 41.11 | | | $ | 64.87 | | | $ | 72.64 | | | $ | 67.13 | |
|
Total Returnb | | | 83.72 | % | | | (35.87 | %) | | | (2.00 | %) | | | 9.66 | % | | | 15.94 | % |
Ratios/Supplemental Data |
Net assets, end of period (in thousands) | | $ | 1,805 | | | $ | 1,321 | | | $ | 2,340 | | | $ | 4,058 | | | $ | 3,913 | |
Ratios to average net assets: |
Net investment income (loss) | | | 0.32 | % | | | 0.26 | % | | | 0.17 | % | | | (0.05 | %) | | | (0.01 | %) |
Total expenses | | | 2.35 | % | | | 2.38 | % | | | 2.36 | % | | | 2.28 | % | | | 2.28 | % |
Portfolio turnover rate | | | 1,207 | % | | | 254 | % | | | 190 | % | | | 252 | % | | | 321 | % |
SEE NOTES TO FINANCIAL STATEMENTS. | THE RYDEX FUNDS ANNUAL REPORT | 25 |
FINANCIAL HIGHLIGHTS (concluded) |
This table is presented to show selected data for a share outstanding throughout each period and to assist shareholders in evaluating a Fund’s performance for the periods presented.
H-Class | | Year Ended
March 31,
2021 | | | Year Ended
March 31,
2020 | | | Year Ended
March 31,
2019 | | | Year Ended
March 29,
2018 | | | Year Ended
March 31,
2017c | |
Per Share Data |
Net asset value, beginning of period | | $ | 48.87 | | | $ | 76.39 | | | $ | 83.78 | | | $ | 76.71 | | | $ | 66.28 | |
Income (loss) from investment operations: |
Net investment income (loss)a | | | .84 | | | | .96 | | | | .81 | | | | .57 | | | | .59 | |
Net gain (loss) on investments (realized and unrealized) | | | 40.63 | | | | (27.66 | ) | | | (2.13 | ) | | | 7.47 | | | | 10.52 | |
Total from investment operations | | | 41.47 | | | | (26.70 | ) | | | (1.32 | ) | | | 8.04 | | | | 11.11 | |
Less distributions from: |
Net investment income | | | (.70 | ) | | | (.82 | ) | | | (1.14 | ) | | | (.27 | ) | | | (.68 | ) |
Net realized gains | | | — | | | | — | | | | (4.93 | ) | | | (.70 | ) | | | — | |
Total distributions | | | (.70 | ) | | | (.82 | ) | | | (6.07 | ) | | | (.97 | ) | | | (.68 | ) |
Net asset value, end of period | | $ | 89.64 | | | $ | 48.87 | | | $ | 76.39 | | | $ | 83.78 | | | $ | 76.71 | |
|
Total Return | | | 85.15 | % | | | (35.38 | %) | | | (1.25 | %) | | | 10.48 | % | | | 16.81 | % |
Ratios/Supplemental Data |
Net assets, end of period (in thousands) | | $ | 52,797 | | | $ | 5,422 | | | $ | 43,352 | | | $ | 59,536 | | | $ | 55,613 | |
Ratios to average net assets: |
Net investment income (loss) | | | 1.17 | % | | | 1.22 | % | | | 0.97 | % | | | 0.70 | % | | | 0.83 | % |
Total expenses | | | 1.58 | % | | | 1.63 | % | | | 1.61 | % | | | 1.53 | % | | | 1.53 | % |
Portfolio turnover rate | | | 1,207 | % | | | 254 | % | | | 190 | % | | | 252 | % | | | 321 | % |
a | Net investment income (loss) per share was computed using average shares outstanding throughout the period. |
b | Total return does not reflect the impact of any applicable sales charges. |
c | Share split — Per share amounts for the year ended March 31, 2017 have been restated to reflect a 2:1 share split effective October 28, 2016. |
26 | THE RYDEX FUNDS ANNUAL REPORT | SEE NOTES TO FINANCIAL STATEMENTS. |
PERFORMANCE REPORT AND FUND PROFILE (Unaudited) | March 31, 2021 |
S&P MIDCAP 400® PURE GROWTH FUND
OBJECTIVE: Seeks to provide investment results that match, before fees and expenses, the performance of a benchmark for mid-cap growth securities on a daily basis. The Fund’s current benchmark is the S&P MidCap 400® Pure Growth Index (the “underlying index”).
For the year ended March 31, 2021, S&P MidCap 400® Pure Growth Fund H-Class returned 93.53%, compared with a return of 96.96% for the underlying index. The Fund maintained a daily correlation of over 99% to its benchmark for the period.
All sectors contributed to the return of the underlying index for the period, led by Consumer Discretionary, Information Technology, and Industrials.
The holdings contributing the most to the return of the underlying index for the period were SolarEdge Technologies, Inc., RH, and Generac Holdings Inc. The holdings detracting the most from return were Quidel Corp., Kinsale Capital Group, Inc., and Grubhub, Inc.
Performance displayed represents past performance, which is no guarantee of future results.
Holdings Diversification (Market Exposure as % of Net Assets)

“Holdings Diversification (Market Exposure as % of Net Assets)” excludes any temporary cash investments.
Inception Dates: |
A-Class | September 1, 2004 |
C-Class | February 20, 2004 |
H-Class | February 20, 2004 |
Ten Largest Holdings (% of Total Net Assets) |
RH | 2.6% |
Boston Beer Company, Inc. — Class A | 2.6% |
Scotts Miracle-Gro Co. — Class A | 2.4% |
STAAR Surgical Co. | 2.3% |
Brighthouse Financial, Inc. | 2.2% |
Repligen Corp. | 2.2% |
SolarEdge Technologies, Inc. | 2.1% |
Medpace Holdings, Inc. | 2.1% |
Lithia Motors, Inc. — Class A | 2.1% |
SLM Corp. | 2.0% |
Top Ten Total | 22.6% |
| | |
“Ten Largest Holdings” excludes any temporary cash investments. |
| | THE RYDEX FUNDS ANNUAL REPORT | 27 |
PERFORMANCE REPORT AND FUND PROFILE (Unaudited)(concluded) | March 31, 2021 |
Cumulative Fund Performance*
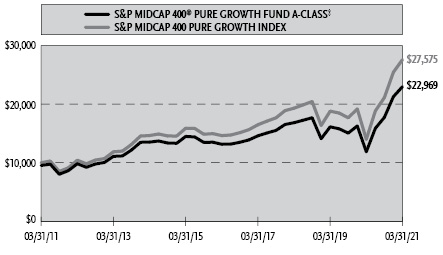
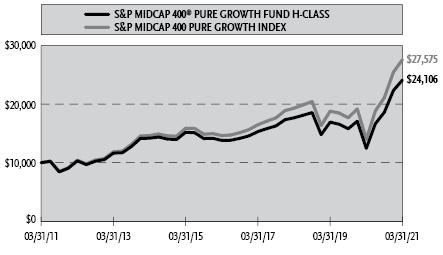
Average Annual Returns*
Periods Ended March 31, 2021
| 1 Year | 5 Year | 10 Year |
A-Class Shares | 93.55% | 11.81% | 9.20% |
A-Class Shares with sales charge‡ | 84.38% | 10.72% | 8.67% |
C-Class Shares | 92.12% | 10.97% | 8.38% |
C-Class Shares with CDSC§ | 91.12% | 10.97% | 8.38% |
H-Class Shares | 93.53% | 11.81% | 9.20% |
S&P MidCap 400 Pure Growth Index | 96.96% | 13.51% | 10.67% |
* | The performance data above represents past performance that is not predictive of future results. The investment return and principal value of an investment in the Fund will fluctuate so that an investor’s shares, when redeemed, may be worth more or less than their original cost. Returns are historical and include changes in principal and reinvested dividends and capital gains and do not reflect the effect of taxes. The S&P MidCap 400 Pure Growth Index is an unmanaged index and, unlike the Fund, has no management fees or operating expenses to reduce its reported return. The graphs are based on A-Class and H-Class shares only; performance for C-Class shares will vary due to differences in fee structure. |
‡ | Fund returns are calculated using the maximum sales charge of 4.75%. |
§ | Fund returns include a CDSC of 1% if redeemed within 12 months of purchase. |
28 | THE RYDEX FUNDS ANNUAL REPORT | |
SCHEDULE OF INVESTMENTS | March 31, 2021 |
S&P MIDCAP 400® PURE GROWTH FUND | |
| | Shares | | | Value | |
COMMON STOCKS† - 99.9% |
| | | | | | | | | |
Consumer, Non-cyclical - 36.6% |
Boston Beer Company, Inc. — Class A* | | | 1,420 | | | $ | 1,712,918 | |
STAAR Surgical Co.* | | | 14,660 | | | | 1,545,311 | |
Repligen Corp.* | | | 7,340 | | | | 1,426,969 | |
Medpace Holdings, Inc.* | | | 8,350 | | | | 1,369,817 | |
Emergent BioSolutions, Inc.* | | | 12,290 | | | | 1,141,864 | |
Darling Ingredients, Inc.* | | | 14,430 | | | | 1,061,759 | |
Charles River Laboratories International, Inc.* | | | 3,570 | | | | 1,034,693 | |
Paylocity Holding Corp.* | | | 5,700 | | | | 1,025,031 | |
Syneos Health, Inc.* | | | 12,860 | | | | 975,431 | |
Quidel Corp.* | | | 7,440 | | | | 951,799 | |
Halozyme Therapeutics, Inc.* | | | 21,480 | | | | 895,501 | |
Avanos Medical, Inc.* | | | 19,900 | | | | 870,426 | |
Penumbra, Inc.* | | | 3,160 | | | | 855,033 | |
Exelixis, Inc.* | | | 37,050 | | | | 836,959 | |
Amedisys, Inc.* | | | 2,820 | | | | 746,708 | |
CoreLogic, Inc. | | | 9,090 | | | | 720,382 | |
HealthEquity, Inc.* | | | 10,250 | | | | 697,000 | |
ASGN, Inc.* | | | 7,090 | | | | 676,670 | |
Bio-Techne Corp. | | | 1,730 | | | | 660,739 | |
Masimo Corp.* | | | 2,689 | | | | 617,556 | |
PRA Health Sciences, Inc.* | | | 3,981 | | | | 610,407 | |
Helen of Troy Ltd.* | | | 2,870 | | | | 604,594 | |
FTI Consulting, Inc.* | | | 4,080 | | | | 571,649 | |
Neurocrine Biosciences, Inc.* | | | 5,220 | | | | 507,645 | |
LHC Group, Inc.* | | | 2,300 | | | | 439,783 | |
Arrowhead Pharmaceuticals, Inc.* | | | 6,580 | | | | 436,320 | |
Insperity, Inc. | | | 5,160 | | | | 432,098 | |
Jazz Pharmaceuticals plc* | | | 2,270 | | | | 373,120 | |
Chemed Corp. | | | 651 | | | | 299,343 | |
Total Consumer, Non-cyclical | | | | | | | 24,097,525 | |
| | | | | | | | | |
Consumer, Cyclical - 21.6% |
RH* | | | 2,920 | | | | 1,742,072 | |
Scotts Miracle-Gro Co. — Class A | | | 6,510 | | | | 1,594,755 | |
Lithia Motors, Inc. — Class A | | | 3,490 | | | | 1,361,414 | |
Williams-Sonoma, Inc. | | | 7,180 | | | | 1,286,656 | |
YETI Holdings, Inc.* | | | 15,210 | | | | 1,098,314 | |
Wingstop, Inc. | | | 8,330 | | | | 1,059,326 | |
Fox Factory Holding Corp.* | | | 8,020 | | | | 1,019,021 | |
Churchill Downs, Inc. | | | 4,341 | | | | 987,230 | |
Ollie’s Bargain Outlet Holdings, Inc.* | | | 10,510 | | | | 914,370 | |
Deckers Outdoor Corp.* | | | 2,610 | | | | 862,396 | |
Five Below, Inc.* | | | 3,760 | | | | 717,370 | |
Tempur Sealy International, Inc. | | | 14,410 | | | | 526,830 | |
Texas Roadhouse, Inc. — Class A* | | | 3,820 | | | | 366,491 | |
Mattel, Inc.* | | | 18,100 | | | | 360,552 | |
Jack in the Box, Inc. | | | 2,820 | | | | 309,580 | |
Total Consumer, Cyclical | | | | | | | 14,206,377 | |
| | | | | | | | | |
Industrial - 14.4% |
TopBuild Corp.* | | | 5,890 | | | | 1,233,543 | |
II-VI, Inc.* | | | 17,740 | | | | 1,212,884 | |
Axon Enterprise, Inc.* | | | 8,510 | | | | 1,211,994 | |
Trex Company, Inc.* | | | 13,190 | | | | 1,207,412 | |
Knight-Swift Transportation Holdings, Inc. | | | 17,740 | | | | 853,117 | |
Timken Co. | | | 7,210 | | | | 585,236 | |
Simpson Manufacturing Company, Inc. | | | 5,090 | �� | | | 527,986 | |
Tetra Tech, Inc. | | | 3,570 | | | | 484,520 | |
Toro Co. | | | 3,820 | | | | 393,995 | |
Cognex Corp. | | | 4,720 | | | | 391,713 | |
Graco, Inc. | | | 5,370 | | | | 384,599 | |
Mercury Systems, Inc.* | | | 5,350 | | | | 377,977 | |
Universal Display Corp. | | | 1,460 | | | | 345,684 | |
Lincoln Electric Holdings, Inc. | | | 2,450 | | | | 301,203 | |
Total Industrial | | | | | | | 9,511,863 | |
| | | | | | | | | |
Technology - 8.5% |
Brooks Automation, Inc. | | | 15,800 | | | | 1,290,070 | |
CMC Materials, Inc. | | | 4,860 | | | | 859,199 | |
Sailpoint Technologies Holdings, Inc.* | | | 16,440 | | | | 832,522 | |
PTC, Inc.* | | | 4,440 | | | | 611,166 | |
Fair Isaac Corp.* | | | 1,201 | | | | 583,746 | |
Qualys, Inc.* | | | 5,250 | | | | 550,095 | |
Lumentum Holdings, Inc.* | | | 5,730 | | | | 523,435 | |
MKS Instruments, Inc. | | | 2,040 | | | | 378,257 | |
Total Technology | | | | | | | 5,628,490 | |
| | | | | | | | | |
Financial - 7.9% |
Brighthouse Financial, Inc.* | | | 33,460 | | | | 1,480,605 | |
SLM Corp. | | | 73,450 | | | | 1,319,897 | |
Kinsale Capital Group, Inc. | | | 6,120 | | | | 1,008,576 | |
Brown & Brown, Inc. | | | 10,250 | | | | 468,528 | |
Primerica, Inc. | | | 3,161 | | | | 467,259 | |
Interactive Brokers Group, Inc. — Class A | | | 6,110 | | | | 446,274 | |
Total Financial | | | | | | | 5,191,139 | |
| | | | | | | | | |
Energy - 7.0% |
SolarEdge Technologies, Inc.* | | | 4,870 | | | | 1,399,833 | |
Sunrun, Inc.* | | | 18,470 | | | | 1,117,066 | |
Antero Midstream Corp. | | | 89,040 | | | | 804,031 | |
First Solar, Inc.* | | | 9,130 | | | | 797,049 | |
CNX Resources Corp.* | | | 31,610 | | | | 464,667 | |
Total Energy | | | | | | | 4,582,646 | |
| | | | | | | | | |
Communications - 2.9% |
Grubhub, Inc.* | | | 14,160 | | | | 849,600 | |
Cable One, Inc. | | | 266 | | | | 486,344 | |
FactSet Research Systems, Inc. | | | 1,080 | | | | 333,277 | |
New York Times Co. — Class A | | | 5,030 | | | | 254,619 | |
Total Communications | | | | | | | 1,923,840 | |
| | | | | | | | | |
Basic Materials - 1.0% |
Cleveland-Cliffs, Inc.* | | | 33,300 | | | | 669,663 | |
| | | | | | | | | |
Total Common Stocks | | | | |
(Cost $48,861,529) | | | | | | | 65,811,543 | |
| | | | | | | | | |
SEE NOTES TO FINANCIAL STATEMENTS. | THE RYDEX FUNDS ANNUAL REPORT | 29 |
SCHEDULE OF INVESTMENTS (concluded) | March 31, 2021 |
S&P MIDCAP 400® PURE GROWTH FUND | |
| | Face
Amount | | | Value | |
REPURCHASE AGREEMENTS††,1 - 0.9% |
J.P. Morgan Securities LLC
issued 03/31/21 at 0.01%
due 04/01/21 | | $ | 306,408 | | | $ | 306,408 | |
Barclays Capital, Inc.
issued 03/31/21 at 0.01%
due 04/01/21 | | | 139,308 | | | | 139,308 | |
BofA Securities, Inc.
issued 03/31/21 at 0.01%
due 04/01/21 | | | 127,141 | | | | 127,141 | |
Total Repurchase Agreements | | | | |
(Cost $572,857) | | | | | | | 572,857 | |
| | | | | | | | | |
Total Investments - 100.8% | | | | |
(Cost $49,434,386) | | $ | 66,384,400 | |
Other Assets & Liabilities, net - (0.8)% | | | (508,451 | ) |
Total Net Assets - 100.0% | | $ | 65,875,949 | |
* | Non-income producing security. |
† | Value determined based on Level 1 inputs — See Note 4. |
†† | Value determined based on Level 2 inputs — See Note 4. |
1 | Repurchase Agreements — See Note 6. |
| | plc — Public Limited Company |
| | |
| | See Sector Classification in Other Information section. |
The following table summarizes the inputs used to value the Fund’s investments at March 31, 2021 (See Note 4 in the Notes to Financial Statements):
Investments in Securities (Assets) | | Level 1
Quoted
Prices | | | Level 2
Significant
Observable
Inputs | | | Level 3
Significant
Unobservable
Inputs | | | Total | |
Common Stocks | | $ | 65,811,543 | | | $ | — | | | $ | — | | | $ | 65,811,543 | |
Repurchase Agreements | | | — | | | | 572,857 | | | | — | | | | 572,857 | |
Total Assets | | $ | 65,811,543 | | | $ | 572,857 | | | $ | — | | | $ | 66,384,400 | |
30 | THE RYDEX FUNDS ANNUAL REPORT | SEE NOTES TO FINANCIAL STATEMENTS. |
S&P MIDCAP 400® PURE GROWTH FUND | |
STATEMENT OF ASSETS AND LIABILITIES |
March 31, 2021 |
Assets: |
Investments, at value (cost $48,861,529) | | $ | 65,811,543 | |
Repurchase agreements, at value (cost $572,857) | | | 572,857 | |
Receivables: |
Dividends | | | 4,656 | |
Fund shares sold | | | 2,300 | |
Securities lending income | | | 1 | |
Total assets | | | 66,391,357 | |
| | | | | |
Liabilities: |
Payable for: |
Fund shares redeemed | | | 364,890 | |
Management fees | | | 40,989 | |
Distribution and service fees | | | 16,395 | |
Transfer agent and administrative fees | | | 14,701 | |
Portfolio accounting fees | | | 5,465 | |
Trustees’ fees* | | | 998 | |
Miscellaneous | | | 71,970 | |
Total liabilities | | | 515,408 | |
Commitments and contingent liabilities (Note 12) | | | — | |
Net assets | | $ | 65,875,949 | |
| | | | | |
Net assets consist of: |
Paid in capital | | $ | 45,363,990 | |
Total distributable earnings (loss) | | | 20,511,959 | |
Net assets | | $ | 65,875,949 | |
| | | | | |
A-Class: |
Net assets | | $ | 11,272,219 | |
Capital shares outstanding | | | 174,350 | |
Net asset value per share | | $ | 64.65 | |
Maximum offering price per share (Net asset value divided by 95.25%) | | $ | 67.87 | |
| | | | | |
C-Class: |
Net assets | | $ | 4,004,680 | |
Capital shares outstanding | | | 74,985 | |
Net asset value per share | | $ | 53.41 | |
| | | | | |
H-Class: |
Net assets | | $ | 50,599,050 | |
Capital shares outstanding | | | 781,545 | |
Net asset value per share | | $ | 64.74 | |
STATEMENT OF OPERATIONS |
Year Ended March 31, 2021 |
Investment Income: |
Dividends | | $ | 336,796 | |
Interest | | | 197 | |
Income from securities lending, net | | | 2,980 | |
Total investment income | | | 339,973 | |
| | | | | |
Expenses: |
Management fees | | | 480,358 | |
Distribution and service fees: |
A-Class | | | 19,339 | |
C-Class | | | 56,274 | |
H-Class | | | 126,711 | |
Transfer agent and administrative fees | | | 178,388 | |
Portfolio accounting fees | | | 64,056 | |
Registration fees | | | 53,621 | |
Professional fees | | | 28,122 | |
Trustees’ fees* | | | 11,167 | |
Custodian fees | | | 9,099 | |
Line of credit fees | | | 117 | |
Miscellaneous | | | 35,745 | |
Total expenses | | | 1,062,997 | |
Net investment loss | | | (723,024 | ) |
| | | | | |
Net Realized and Unrealized Gain (Loss): |
Net realized gain (loss) on: |
Investments | | | 13,406,949 | |
Net realized gain | | | 13,406,949 | |
Net change in unrealized appreciation (depreciation) on: |
Investments | | | 23,828,110 | |
Net change in unrealized appreciation (depreciation) | | | 23,828,110 | |
Net realized and unrealized gain | | | 37,235,059 | |
Net increase in net assets resulting from operations | | $ | 36,512,035 | |
* | Relates to Trustees not deemed “interested persons” within the meaning of Section 2(a)(19) of the 1940 Act. |
SEE NOTES TO FINANCIAL STATEMENTS. | THE RYDEX FUNDS ANNUAL REPORT | 31 |
S&P MIDCAP 400® PURE GROWTH FUND | |
STATEMENTS OF CHANGES IN NET ASSETS |
| | Year Ended
March 31,
2021 | | | Year Ended
March 31,
2020 | |
Increase (Decrease) in Net Assets from Operations: | | | | | | | | |
Net investment loss | | $ | (723,024 | ) | | $ | (417,707 | ) |
Net realized gain on investments | | | 13,406,949 | | | | 6,126,223 | |
Net change in unrealized appreciation (depreciation) on investments | | | 23,828,110 | | | | (18,577,132 | ) |
Net increase (decrease) in net assets resulting from operations | | | 36,512,035 | | | | (12,868,616 | ) |
| | | | | | | | | |
Distributions to shareholders: | | | | | | | | |
A-Class | | | (92,247 | ) | | | — | |
C-Class | | | (79,217 | ) | | | — | |
H-Class | | | (619,526 | ) | | | — | |
Total distributions to shareholders | | | (790,990 | ) | | | — | |
| | | | | | | | | |
Capital share transactions: | | | | | | | | |
Proceeds from sale of shares | | | | | | | | |
A-Class | | | 5,361,892 | | | | 2,320,669 | |
C-Class | | | 2,087,074 | | | | 734,313 | |
H-Class | | | 219,371,534 | | | | 57,910,692 | |
Distributions reinvested | | | | | | | | |
A-Class | | | 90,297 | | | | — | |
C-Class | | | 77,936 | | | | — | |
H-Class | | | 615,438 | | | | — | |
Cost of shares redeemed | | | | | | | | |
A-Class | | | (3,203,286 | ) | | | (6,586,092 | ) |
C-Class | | | (5,492,423 | ) | | | (3,685,518 | ) |
H-Class | | | (225,113,804 | ) | | | (68,683,226 | ) |
Net decrease from capital share transactions | | | (6,205,342 | ) | | | (17,989,162 | ) |
Net increase (decrease) in net assets | | | 29,515,703 | | | | (30,857,778 | ) |
| | | | | | | | | |
Net assets: | | | | | | | | |
Beginning of year | | | 36,360,246 | | | | 67,218,024 | |
End of year | | $ | 65,875,949 | | | $ | 36,360,246 | |
| | | | | | | | | |
Capital share activity: | | | | | | | | |
Shares sold | | | | | | | | |
A-Class | | | 101,948 | | | | 52,212 | |
C-Class | | | 49,253 | | | | 19,823 | |
H-Class | | | 4,529,915 | | | | 1,345,912 | |
Shares issued from reinvestment of distributions | | | | | | | | |
A-Class | | | 1,559 | | | | — | |
C-Class | | | 1,626 | | | | — | |
H-Class | | | 10,613 | | | | — | |
Shares redeemed | | | | | | | | |
A-Class | | | (64,073 | ) | | | (150,079 | ) |
C-Class | | | (116,347 | ) | | | (102,639 | ) |
H-Class | | | (4,582,472 | ) | | | (1,565,661 | ) |
Net decrease in shares | | | (67,978 | ) | | | (400,432 | ) |
32 | THE RYDEX FUNDS ANNUAL REPORT | SEE NOTES TO FINANCIAL STATEMENTS. |
S&P MIDCAP 400® PURE GROWTH FUND | |
This table is presented to show selected data for a share outstanding throughout each period and to assist shareholders in evaluating a Fund’s performance for the periods presented.
A-Class | | Year Ended
March 31,
2021 | | | Year Ended
March 31,
2020 | | | Year Ended
March 31,
2019 | | | Year Ended
March 29,
2018 | | | Year Ended
March 31,
2017 | |
Per Share Data |
Net asset value, beginning of period | | $ | 33.77 | | | $ | 45.88 | | | $ | 54.96 | | | $ | 50.84 | | | $ | 46.51 | |
Income (loss) from investment operations: |
Net investment income (loss)a | | | (.57 | ) | | | (.32 | ) | | | (.30 | ) | | | (.41 | ) | | | (.34 | ) |
Net gain (loss) on investments (realized and unrealized) | | | 32.09 | | | | (11.79 | ) | | | (2.39 | ) | | | 8.09 | | | | 5.41 | |
Total from investment operations | | | 31.52 | | | | (12.11 | ) | | | (2.69 | ) | | | 7.68 | | | | 5.07 | |
Less distributions from: |
Net realized gains | | | (.64 | ) | | | — | | | | (6.39 | ) | | | (3.56 | ) | | | (.74 | ) |
Total distributions | | | (.64 | ) | | | — | | | | (6.39 | ) | | | (3.56 | ) | | | (.74 | ) |
Net asset value, end of period | | $ | 64.65 | | | $ | 33.77 | | | $ | 45.88 | | | $ | 54.96 | | | $ | 50.84 | |
|
Total Returnb | | | 93.55 | % | | | (26.39 | %) | | | (4.19 | %) | | | 15.33 | % | | | 10.98 | % |
Ratios/Supplemental Data |
Net assets, end of period (in thousands) | | $ | 11,272 | | | $ | 4,556 | | | $ | 10,681 | | | $ | 11,327 | | | $ | 16,269 | |
Ratios to average net assets: |
Net investment income (loss) | | | (1.08 | %) | | | (0.72 | %) | | | (0.59 | %) | | | (0.77 | %) | | | (0.71 | %) |
Total expenses | | | 1.59 | % | | | 1.63 | % | | | 1.62 | % | | | 1.53 | % | | | 1.52 | % |
Portfolio turnover rate | | | 407 | % | | | 190 | % | | | 165 | % | | | 160 | % | | | 127 | % |
C-Class | | Year Ended
March 31,
2021 | | | Year Ended
March 31,
2020 | | | Year Ended
March 31,
2019 | | | Year Ended
March 29,
2018 | | | Year Ended
March 31,
2017 | |
Per Share Data |
Net asset value, beginning of period | | $ | 28.17 | | | $ | 38.56 | | | $ | 47.66 | | | $ | 44.83 | | | $ | 41.41 | |
Income (loss) from investment operations: |
Net investment income (loss)a | | | (.78 | ) | | | (.54 | ) | | | (.62 | ) | | | (.71 | ) | | | (.61 | ) |
Net gain (loss) on investments (realized and unrealized) | | | 26.66 | | | | (9.85 | ) | | | (2.09 | ) | | | 7.10 | | | | 4.77 | |
Total from investment operations | | | 25.88 | | | | (10.39 | ) | | | (2.71 | ) | | | 6.39 | | | | 4.16 | |
Less distributions from: |
Net realized gains | | | (.64 | ) | | | — | | | | (6.39 | ) | | | (3.56 | ) | | | (.74 | ) |
Total distributions | | | (.64 | ) | | | — | | | | (6.39 | ) | | | (3.56 | ) | | | (.74 | ) |
Net asset value, end of period | | $ | 53.41 | | | $ | 28.17 | | | $ | 38.56 | | | $ | 47.66 | | | $ | 44.83 | |
|
Total Returnb | | | 92.12 | % | | | (26.95 | %) | | | (4.90 | %) | | | 14.47 | % | | | 10.16 | % |
Ratios/Supplemental Data |
Net assets, end of period (in thousands) | | $ | 4,005 | | | $ | 3,956 | | | $ | 8,609 | | | $ | 14,046 | | | $ | 15,049 | |
Ratios to average net assets: |
Net investment income (loss) | | | (1.82 | %) | | | (1.47 | %) | | | (1.37 | %) | | | (1.49 | %) | | | (1.44 | %) |
Total expenses | | | 2.35 | % | | | 2.38 | % | | | 2.36 | % | | | 2.28 | % | | | 2.27 | % |
Portfolio turnover rate | | | 407 | % | | | 190 | % | | | 165 | % | | | 160 | % | | | 127 | % |
SEE NOTES TO FINANCIAL STATEMENTS. | THE RYDEX FUNDS ANNUAL REPORT | 33 |
S&P MIDCAP 400® PURE GROWTH FUND | |
FINANCIAL HIGHLIGHTS (concluded) |
This table is presented to show selected data for a share outstanding throughout each period and to assist shareholders in evaluating a Fund’s performance for the periods presented.
H-Class | | Year Ended
March 31,
2021 | | | Year Ended
March 31,
2020 | | | Year Ended
March 31,
2019 | | | Year Ended
March 29,
2018 | | | Year Ended
March 31,
2017 | |
Per Share Data |
Net asset value, beginning of period | | $ | 33.82 | | | $ | 45.94 | | | $ | 55.03 | | | $ | 50.89 | | | $ | 46.56 | |
Income (loss) from investment operations: |
Net investment income (loss)a | | | (.56 | ) | | | (.31 | ) | | | (.34 | ) | | | (.40 | ) | | | (.33 | ) |
Net gain (loss) on investments (realized and unrealized) | | | 32.12 | | | | (11.81 | ) | | | (2.36 | ) | | | 8.10 | | | | 5.40 | |
Total from investment operations | | | 31.56 | | | | (12.12 | ) | | | (2.70 | ) | | | 7.70 | | | | 5.07 | |
Less distributions from: |
Net realized gains | | | (.64 | ) | | | — | | | | (6.39 | ) | | | (3.56 | ) | | | (.74 | ) |
Total distributions | | | (.64 | ) | | | — | | | | (6.39 | ) | | | (3.56 | ) | | | (.74 | ) |
Net asset value, end of period | | $ | 64.74 | | | $ | 33.82 | | | $ | 45.94 | | | $ | 55.03 | | | $ | 50.89 | |
|
Total Return | | | 93.53 | % | | | (26.38 | %) | | | (4.19 | %) | | | 15.32 | % | | | 10.99 | % |
Ratios/Supplemental Data |
Net assets, end of period (in thousands) | | $ | 50,599 | | | $ | 27,848 | | | $ | 47,929 | | | $ | 73,714 | | | $ | 78,373 | |
Ratios to average net assets: |
Net investment income (loss) | | | (1.06 | %) | | | (0.71 | %) | | | (0.64 | %) | | | (0.74 | %) | | | (0.68 | %) |
Total expenses | | | 1.59 | % | | | 1.63 | % | | | 1.61 | % | | | 1.53 | % | | | 1.53 | % |
Portfolio turnover rate | | | 407 | % | | | 190 | % | | | 165 | % | | | 160 | % | | | 127 | % |
a | Net investment income (loss) per share was computed using average shares outstanding throughout the period. |
b | Total return does not reflect the impact of any applicable sales charges. |
34 | THE RYDEX FUNDS ANNUAL REPORT | SEE NOTES TO FINANCIAL STATEMENTS. |
PERFORMANCE REPORT AND FUND PROFILE (Unaudited) | March 31, 2021 |
S&P MIDCAP 400® PURE VALUE FUND
OBJECTIVE: Seeks to provide investment results that match, before fees and expenses, the performance of a benchmark for mid-cap value securities on a daily basis. The Fund’s current benchmark is the S&P MidCap 400® Pure Value Index (the “underlying index”).
For the year ended March 31, 2021, S&P MidCap 400® Pure Value Fund H-Class returned 129.92%, compared with a return of 136.36% for the underlying index. The Fund maintained a daily correlation of over 99% to its benchmark for the period.
All sectors contributed to the return of the underlying index for the period, led by Consumer Discretionary, Industrials, and Financials.
The holdings contributing the most to the return of the underlying index for the period were Penn National Gaming, Inc., CNX Resources Corp., and SYNNEX Corp. The holdings detracting the most from return were Kemper Corp., Concentrix Corp., and SL Green Realty Corp.
Performance displayed represents past performance, which is no guarantee of future results.
Holdings Diversification (Market Exposure as % of Net Assets)
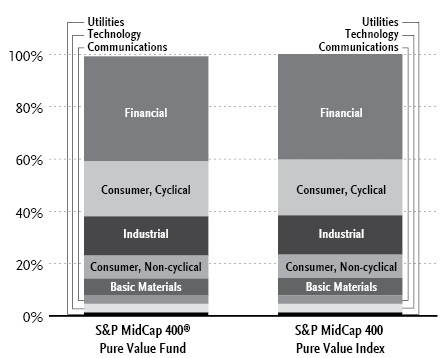
“Holdings Diversification (Market Exposure as % of Net Assets)” excludes any temporary cash investments.
Inception Dates: |
A-Class | September 1, 2004 |
C-Class | February 20, 2004 |
H-Class | February 20, 2004 |
Ten Largest Holdings (% of Total Net Assets) |
Telephone & Data Systems, Inc. | 2.2% |
Avnet, Inc. | 2.2% |
Commercial Metals Co. | 2.0% |
Kohl’s Corp. | 2.0% |
World Fuel Services Corp. | 2.0% |
Domtar Corp. | 1.9% |
Xerox Holdings Corp. | 1.8% |
AutoNation, Inc. | 1.7% |
Taylor Morrison Home Corp. — Class A | 1.7% |
Reinsurance Group of America, Inc. — Class A | 1.7% |
Top Ten Total | 19.2% |
| | |
“Ten Largest Holdings” excludes any temporary cash investments. |
| | THE RYDEX FUNDS ANNUAL REPORT | 35 |
PERFORMANCE REPORT AND FUND PROFILE (Unaudited)(concluded) | March 31, 2021 |
Cumulative Fund Performance*
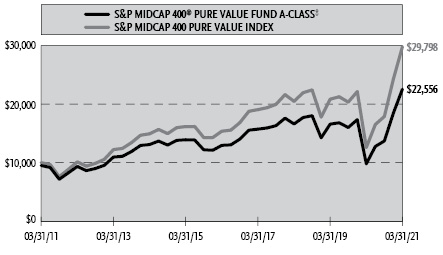

Average Annual Returns*
Periods Ended March 31, 2021
| 1 Year | 5 Year | 10 Year |
A-Class Shares | 129.91% | 11.72% | 9.00% |
A-Class Shares with sales charge‡ | 119.00% | 10.63% | 8.47% |
C-Class Shares | 128.24% | 10.89% | 8.18% |
C-Class Shares with CDSC§ | 127.24% | 10.89% | 8.18% |
H-Class Shares | 129.92% | 11.71% | 8.99% |
S&P MidCap 400 Pure Value Index | 136.36% | 14.15% | 11.54% |
* | The performance data above represents past performance that is not predictive of future results. The investment return and principal value of an investment in the Fund will fluctuate so that an investor’s shares, when redeemed, may be worth more or less than their original cost. Returns are historical and include changes in principal and reinvested dividends and capital gains and do not reflect the effect of taxes. The S&P MidCap 400 Pure Value Index is an unmanaged index and, unlike the Fund, has no management fees or operating expenses to reduce its reported return. The graphs are based on A-Class and H-Class shares only; performance for C-Class shares will vary due to differences in fee structure. |
‡ | Fund returns are calculated using the maximum sales charge of 4.75%. |
§ | Fund returns include a CDSC of 1% if redeemed within 12 months of purchase. |
36 | THE RYDEX FUNDS ANNUAL REPORT | |
SCHEDULE OF INVESTMENTS | March 31, 2021 |
S&P MIDCAP 400® PURE VALUE FUND | |
| | Shares | | | Value | |
COMMON STOCKS† - 99.2% |
| | | | | | | | | |
Financial - 40.0% |
Reinsurance Group of America, Inc. — Class A | | | 20,712 | | | $ | 2,610,748 | |
Navient Corp. | | | 173,718 | | | | 2,485,905 | |
Jefferies Financial Group, Inc. | | | 74,861 | | | | 2,253,316 | |
Genworth Financial, Inc. — Class A* | | | 675,569 | | | | 2,242,889 | |
CNO Financial Group, Inc. | | | 85,845 | | | | 2,085,175 | |
Old Republic International Corp. | | | 89,997 | | | | 1,965,534 | |
Mercury General Corp. | | | 31,762 | | | | 1,931,447 | |
Associated Banc-Corp. | | | 86,404 | | | | 1,843,861 | |
FNB Corp. | | | 139,868 | | | | 1,776,324 | |
Sterling Bancorp | | | 69,729 | | | | 1,605,162 | |
Valley National Bancorp | | | 114,558 | | | | 1,574,027 | |
First American Financial Corp. | | | 27,650 | | | | 1,566,373 | |
Fulton Financial Corp. | | | 90,370 | | | | 1,539,001 | |
Wintrust Financial Corp. | | | 20,206 | | | | 1,531,615 | |
Jones Lang LaSalle, Inc.* | | | 8,370 | | | | 1,498,565 | |
New York Community Bancorp, Inc. | | | 117,970 | | | | 1,488,781 | |
First Horizon Corp. | | | 82,776 | | | | 1,399,742 | |
Pinnacle Financial Partners, Inc. | | | 15,366 | | | | 1,362,349 | |
Trustmark Corp. | | | 39,780 | | | | 1,338,995 | |
Bank OZK | | | 31,806 | | | | 1,299,275 | |
SL Green Realty Corp. REIT | | | 18,450 | | | | 1,291,316 | |
Washington Federal, Inc. | | | 41,890 | | | | 1,290,212 | |
Alleghany Corp.* | | | 2,030 | | | | 1,271,369 | |
Kemper Corp. | | | 15,835 | | | | 1,262,366 | |
United Bankshares, Inc. | | | 31,330 | | | | 1,208,711 | |
Cathay General Bancorp | | | 29,510 | | | | 1,203,418 | |
Hancock Whitney Corp. | | | 28,602 | | | | 1,201,570 | |
Hanover Insurance Group, Inc. | | | 9,200 | | | | 1,191,032 | |
Alliance Data Systems Corp. | | | 10,398 | | | | 1,165,512 | |
Synovus Financial Corp. | | | 25,210 | | | | 1,153,357 | |
MGIC Investment Corp. | | | 83,180 | | | | 1,152,043 | |
TCF Financial Corp. | | | 24,531 | | | | 1,139,710 | |
International Bancshares Corp. | | | 24,130 | | | | 1,120,115 | |
Macerich Co. REIT1 | | | 95,020 | | | | 1,111,734 | |
American Financial Group, Inc. | | | 9,690 | | | | 1,105,629 | |
BancorpSouth Bank | | | 32,420 | | | | 1,053,002 | |
Prosperity Bancshares, Inc. | | | 12,280 | | | | 919,649 | |
Webster Financial Corp. | | | 16,190 | | | | 892,231 | |
East West Bancorp, Inc. | | | 11,860 | | | | 875,268 | |
Pebblebrook Hotel Trust REIT | | | 34,196 | | | | 830,621 | |
Service Properties Trust REIT | | | 68,570 | | | | 813,240 | |
UMB Financial Corp. | | | 8,400 | | | | 775,572 | |
CIT Group, Inc. | | | 14,510 | | | | 747,410 | |
Texas Capital Bancshares, Inc.* | | | 9,602 | | | | 680,974 | |
Selective Insurance Group, Inc. | | | 8,810 | | | | 639,077 | |
Sabra Health Care REIT, Inc. | | | 32,910 | | | | 571,318 | |
Cousins Properties, Inc. REIT | | | 16,050 | | | | 567,367 | |
Janus Henderson Group plc | | | 16,610 | | | | 517,401 | |
Total Financial | | | | | | | 63,150,308 | |
| | | | | | | | | |
Consumer, Cyclical - 21.1% |
Kohl’s Corp. | | | 52,674 | | | | 3,139,897 | |
World Fuel Services Corp. | | | 88,527 | | | | 3,116,150 | |
AutoNation, Inc.* | | | 29,620 | | | | 2,761,177 | |
Taylor Morrison Home Corp. — Class A* | | | 86,181 | | | | 2,655,237 | |
Dana, Inc. | | | 95,947 | | | | 2,334,391 | |
Foot Locker, Inc. | | | 38,424 | | | | 2,161,350 | |
Tri Pointe Homes, Inc.* | | | 103,142 | | | | 2,099,971 | |
KB Home | | | 42,670 | | | | 1,985,435 | |
Univar Solutions, Inc.* | | | 90,912 | | | | 1,958,244 | |
Dick’s Sporting Goods, Inc. | | | 22,885 | | | | 1,742,693 | |
Murphy USA, Inc. | | | 11,620 | | | | 1,679,787 | |
Goodyear Tire & Rubber Co.* | | | 80,237 | | | | 1,409,764 | |
Thor Industries, Inc. | | | 10,021 | | | | 1,350,229 | |
BJ’s Wholesale Club Holdings, Inc.* | | | 28,672 | | | | 1,286,226 | |
Lear Corp. | | | 6,959 | | | | 1,261,319 | |
Adient plc* | | | 21,387 | | | | 945,305 | |
Urban Outfitters, Inc.* | | | 23,771 | | | | 884,044 | |
KAR Auction Services, Inc.* | | | 34,215 | | | | 513,225 | |
Total Consumer, Cyclical | | | | | | | 33,284,444 | |
| | | | | | | | | |
Industrial - 15.0% |
Avnet, Inc. | | | 82,339 | | | | 3,417,892 | |
SYNNEX Corp. | | | 22,684 | | | | 2,605,031 | |
Arrow Electronics, Inc.* | | | 21,772 | | | | 2,412,773 | |
Ryder System, Inc. | | | 26,165 | | | | 1,979,382 | |
Jabil, Inc. | | | 33,170 | | | | 1,730,147 | |
Greif, Inc. — Class A | | | 24,572 | | | | 1,400,604 | |
MasTec, Inc.* | | | 14,460 | | | | 1,354,902 | |
EMCOR Group, Inc. | | | 11,300 | | | | 1,267,408 | |
MDU Resources Group, Inc. | | | 34,450 | | | | 1,088,964 | |
Oshkosh Corp. | | | 9,130 | | | | 1,083,366 | |
Dycom Industries, Inc.* | | | 10,932 | | | | 1,015,036 | |
AECOM* | | | 15,372 | | | | 985,499 | |
KBR, Inc. | | | 20,060 | | | | 770,104 | |
Kirby Corp.* | | | 11,520 | | | | 694,426 | |
Trinity Industries, Inc. | | | 23,162 | | | | 659,885 | |
Colfax Corp.* | | | 14,750 | | | | 646,197 | |
GATX Corp. | | | 5,790 | | | | 536,965 | |
Total Industrial | | | | | | | 23,648,581 | |
| | | | | | | | | |
Consumer, Non-cyclical - 8.8% |
Graham Holdings Co. — Class B | | | 4,430 | | | | 2,491,609 | |
Sprouts Farmers Market, Inc.* | | | 78,144 | | | | 2,080,193 | |
Pilgrim’s Pride Corp.* | | | 84,650 | | | | 2,013,823 | |
ManpowerGroup, Inc. | | | 18,230 | | | | 1,802,947 | |
TreeHouse Foods, Inc.* | | | 32,978 | | | | 1,722,771 | |
Adtalem Global Education, Inc.* | | | 32,018 | | | | 1,265,992 | |
Tenet Healthcare Corp.* | | | 23,501 | | | | 1,222,052 | |
Ingredion, Inc. | | | 9,080 | | | | 816,474 | |
Strategic Education, Inc. | | | 5,530 | | | | 508,262 | |
Total Consumer, Non-cyclical | | | | | | | 13,924,123 | |
| | | | | | | | | |
Basic Materials - 6.5% |
Commercial Metals Co. | | | 104,639 | | | | 3,227,067 | |
Domtar Corp. | | | 79,796 | | | | 2,948,462 | |
Reliance Steel & Aluminum Co. | | | 7,860 | | | | 1,196,999 | |
United States Steel Corp. | | | 41,009 | | | | 1,073,205 | |
SEE NOTES TO FINANCIAL STATEMENTS. | THE RYDEX FUNDS ANNUAL REPORT | 37 |
SCHEDULE OF INVESTMENTS (concluded) | March 31, 2021 |
S&P MIDCAP 400® PURE VALUE FUND | |
| | Shares | | | Value | |
Steel Dynamics, Inc. | | | 21,060 | | | $ | 1,069,006 | |
Minerals Technologies, Inc. | | | 10,244 | | | | 771,578 | |
Total Basic Materials | | | | | | | 10,286,317 | |
| | | | | | | | | |
Communications - 3.2% |
Telephone & Data Systems, Inc. | | | 153,686 | | | | 3,528,630 | |
Viasat, Inc.* | | | 32,800 | | | | 1,576,696 | |
Total Communications | | | | | | | 5,105,326 | |
| | | | | | | | | |
Technology - 3.2% |
Xerox Holdings Corp. | | | 114,310 | | | | 2,774,304 | |
NCR Corp.* | | | 31,180 | | | | 1,183,281 | |
NetScout Systems, Inc.* | | | 37,556 | | | | 1,057,577 | |
Total Technology | | | | | | | 5,015,162 | |
| | | | | | | | | |
Utilities - 1.4% |
Southwest Gas Holdings, Inc. | | | 12,870 | | | | 884,298 | |
UGI Corp. | | | 16,820 | | | | 689,788 | |
ALLETE, Inc. | | | 8,530 | | | | 573,131 | |
Total Utilities | | | | | | | 2,147,217 | |
| | | | | | | | | |
Total Common Stocks | | | | |
(Cost $133,754,998) | | | | | | | 156,561,478 | |
| | | | | | | | | |
| | Face
Amount | | | Value | |
REPURCHASE AGREEMENTS††,2 - 0.6% |
J.P. Morgan Securities LLC
issued 03/31/21 at 0.01%
due 04/01/21 | | $ | 544,253 | | | | 544,253 | |
Barclays Capital, Inc.
issued 03/31/21 at 0.01%
due 04/01/21 | | | 247,444 | | | | 247,444 | |
BofA Securities, Inc.
issued 03/31/21 at 0.01%
due 04/01/21 | | | 225,831 | | | | 225,831 | |
Total Repurchase Agreements | | | | |
(Cost $1,017,528) | | | | | | | 1,017,528 | |
| | | | | | | | | |
| | | Shares | | | | | |
SECURITIES LENDING COLLATERAL†,3 - 0.5% |
Money Market Fund | | | | | | | | |
First American Government Obligations Fund — Class Z, 0.03%4 | | | 744,237 | | | | 744,237 | |
Total Securities Lending Collateral | | | | |
(Cost $744,237) | | | | | | | 744,237 | |
| | | | | | | | | |
Total Investments - 100.3% | | | | |
(Cost $135,516,763) | | $ | 158,323,243 | |
Other Assets & Liabilities, net - (0.3)% | | | (497,039 | ) |
Total Net Assets - 100.0% | | $ | 157,826,204 | |
* | Non-income producing security. |
† | Value determined based on Level 1 inputs — See Note 4. |
†† | Value determined based on Level 2 inputs — See Note 4. |
1 | All or a portion of this security is on loan at March 31, 2021 — See Note 7. |
2 | Repurchase Agreements — See Note 6. |
3 | Securities lending collateral — See Note 7. |
4 | Rate indicated is the 7-day yield as of March 31, 2021. |
| | plc — Public Limited Company |
| | REIT — Real Estate Investment Trust |
| | |
| | See Sector Classification in Other Information section. |
The following table summarizes the inputs used to value the Fund’s investments at March 31, 2021 (See Note 4 in the Notes to Financial Statements):
Investments in Securities (Assets) | | Level 1
Quoted
Prices | | | Level 2
Significant
Observable
Inputs | | | Level 3
Significant
Unobservable
Inputs | | | Total | |
Common Stocks | | $ | 156,561,478 | | | $ | — | | | $ | — | | | $ | 156,561,478 | |
Repurchase Agreements | | | — | | | | 1,017,528 | | | | — | | | | 1,017,528 | |
Securities Lending Collateral | | | 744,237 | | | | — | | | | — | | | | 744,237 | |
Total Assets | | $ | 157,305,715 | | | $ | 1,017,528 | | | $ | — | | | $ | 158,323,243 | |
38 | THE RYDEX FUNDS ANNUAL REPORT | SEE NOTES TO FINANCIAL STATEMENTS. |
S&P MIDCAP 400® PURE VALUE FUND | |
STATEMENT OF ASSETS AND LIABILITIES |
March 31, 2021 |
Assets: |
Investments, at value - including $710,822 of securities loaned (cost $134,499,235) | | $ | 157,305,715 | |
Repurchase agreements, at value (cost $1,017,528) | | | 1,017,528 | |
Receivables: |
Fund shares sold | | | 425,489 | |
Dividends | | | 162,540 | |
Securities lending income | | | 211 | |
Total assets | | | 158,911,483 | |
| | | | | |
Liabilities: |
Payable for: |
Return of securities lending collateral | | | 744,237 | |
Management fees | | | 90,255 | |
Transfer agent and administrative fees | | | 32,372 | |
Distribution and service fees | | | 30,755 | |
Fund shares redeemed | | | 19,999 | |
Portfolio accounting fees | | | 12,034 | |
Trustees’ fees* | | | 2,165 | |
Miscellaneous | | | 153,462 | |
Total liabilities | | | 1,085,279 | |
Commitments and contingent liabilities (Note 12) | | | — | |
Net assets | | $ | 157,826,204 | |
| | | | | |
Net assets consist of: |
Paid in capital | | $ | 137,102,305 | |
Total distributable earnings (loss) | | | 20,723,899 | |
Net assets | | $ | 157,826,204 | |
| | | | | |
A-Class: |
Net assets | | $ | 1,867,500 | |
Capital shares outstanding | | | 26,617 | |
Net asset value per share | | $ | 70.16 | |
Maximum offering price per share (Net asset value divided by 95.25%) | | $ | 73.66 | |
| | | | | |
C-Class: |
Net assets | | $ | 1,690,063 | |
Capital shares outstanding | | | 27,863 | |
Net asset value per share | | $ | 60.66 | |
| | | | | |
H-Class: |
Net assets | | $ | 154,268,641 | |
Capital shares outstanding | | | 2,202,292 | |
Net asset value per share | | $ | 70.05 | |
STATEMENT OF OPERATIONS |
Year Ended March 31, 2021 |
Investment Income: |
Dividends | | $ | 766,241 | |
Interest | | | 89 | |
Income from securities lending, net | | | 10,860 | |
Total investment income | | | 777,190 | |
| | | | | |
Expenses: |
Management fees | | | 284,033 | |
Distribution and service fees: |
A-Class | | | 2,537 | |
C-Class | | | 7,464 | |
H-Class | | | 90,275 | |
Transfer agent and administrative fees | | | 102,785 | |
Portfolio accounting fees | | | 37,873 | |
Professional fees | | | 9,377 | |
Custodian fees | | | 4,800 | |
Trustees’ fees* | | | 1,528 | |
Line of credit fees | | | 204 | |
Miscellaneous | | | 48,755 | |
Total expenses | | | 589,631 | |
Net investment income | | | 187,559 | |
| | | | | |
Net Realized and Unrealized Gain (Loss): |
Net realized gain (loss) on: |
Investments | | | 1,068,767 | |
Net realized gain | | | 1,068,767 | |
Net change in unrealized appreciation (depreciation) on: |
Investments | | | 23,654,933 | |
Net change in unrealized appreciation (depreciation) | | | 23,654,933 | |
Net realized and unrealized gain | | | 24,723,700 | |
Net increase in net assets resulting from operations | | $ | 24,911,259 | |
* | Relates to Trustees not deemed “interested persons” within the meaning of Section 2(a)(19) of the 1940 Act. |
SEE NOTES TO FINANCIAL STATEMENTS. | THE RYDEX FUNDS ANNUAL REPORT | 39 |
S&P MIDCAP 400® PURE VALUE FUND | |
STATEMENTS OF CHANGES IN NET ASSETS |
| | Year Ended
March 31,
2021 | | | Year Ended
March 31,
2020 | |
Increase (Decrease) in Net Assets from Operations: | | | | | | | | |
Net investment income | | $ | 187,559 | | | $ | 53,489 | |
Net realized gain on investments | | | 1,068,767 | | | | 93,505 | |
Net change in unrealized appreciation (depreciation) on investments | | | 23,654,933 | | | | (2,510,628 | ) |
Net increase (decrease) in net assets resulting from operations | | | 24,911,259 | | | | (2,363,634 | ) |
| | | | | | | | | |
Distributions to shareholders: | | | | | | | | |
A-Class | | | (543 | ) | | | — | |
C-Class | | | (537 | ) | | | — | |
H-Class | | | (27,686 | ) | | | — | |
Total distributions to shareholders | | | (28,766 | ) | | | — | |
| | | | | | | | | |
Capital share transactions: | | | | | | | | |
Proceeds from sale of shares | | | | | | | | |
A-Class | | | 1,287,192 | | | | 2,888,368 | |
C-Class | | | 1,653,870 | | | | 801,208 | |
H-Class | | | 284,454,714 | | | | 151,848,364 | |
Distributions reinvested | | | | | | | | |
A-Class | | | 492 | | | | — | |
C-Class | | | 456 | | | | — | |
H-Class | | | 27,659 | | | | — | |
Cost of shares redeemed | | | | | | | | |
A-Class | | | (981,623 | ) | | | (2,875,817 | ) |
C-Class | | | (1,321,500 | ) | | | (1,579,032 | ) |
H-Class | | | (155,253,673 | ) | | | (159,616,730 | ) |
Net increase (decrease) from capital share transactions | | | 129,867,587 | | | | (8,533,639 | ) |
Net increase (decrease) in net assets | | | 154,750,080 | | | | (10,897,273 | ) |
| | | | | | | | | |
Net assets: | | | | | | | | |
Beginning of year | | | 3,076,124 | | | | 13,973,397 | |
End of year | | $ | 157,826,204 | | | $ | 3,076,124 | |
| | | | | | | | | |
Capital share activity: | | | | | | | | |
Shares sold | | | | | | | | |
A-Class | | | 22,547 | | | | 56,905 | |
C-Class | | | 32,691 | | | | 22,021 | |
H-Class | | | 5,152,410 | | | | 2,970,212 | |
Shares issued from reinvestment of distributions | | | | | | | | |
A-Class | | | 9 | | | | — | |
C-Class | | | 9 | | | | — | |
H-Class | | | 486 | | | | — | |
Shares redeemed | | | | | | | | |
A-Class | | | (20,488 | ) | | | (55,665 | ) |
C-Class | | | (31,471 | ) | | | (36,039 | ) |
H-Class | | | (3,003,708 | ) | | | (3,129,154 | ) |
Net increase (decrease) in shares | | | 2,152,485 | | | | (171,720 | ) |
40 | THE RYDEX FUNDS ANNUAL REPORT | SEE NOTES TO FINANCIAL STATEMENTS. |
S&P MIDCAP 400® PURE VALUE FUND | |
This table is presented to show selected data for a share outstanding throughout each period and to assist shareholders in evaluating a Fund’s performance for the periods presented.
A-Class | | Year Ended
March 31,
2021 | | | Year Ended
March 31,
2020 | | | Year Ended
March 31,
2019 | | | Year Ended
March 29,
2018 | | | Year Ended
March 31,
2017 | |
Per Share Data |
Net asset value, beginning of period | | $ | 30.53 | | | $ | 51.62 | | | $ | 53.32 | | | $ | 51.39 | | | $ | 42.43 | |
Income (loss) from investment operations: |
Net investment income (loss)a | | | .20 | | | | .34 | | | | (.04 | ) | | | .02 | | | | (.08 | ) |
Net gain (loss) on investments (realized and unrealized) | | | 39.45 | | | | (21.43 | ) | | | (.17 | ) | | | 2.89 | | | | 9.14 | |
Total from investment operations | | | 39.65 | | | | (21.09 | ) | | | (.21 | ) | | | 2.91 | | | | 9.06 | |
Less distributions from: |
Net investment income | | | (.02 | ) | | | — | | | | (.02 | ) | | | — | | | | (.10 | ) |
Net realized gains | | | — | | | | — | | | | (1.47 | ) | | | (.98 | ) | | | — | |
Total distributions | | | (.02 | ) | | | — | | | | (1.49 | ) | | | (.98 | ) | | | (.10 | ) |
Net asset value, end of period | | $ | 70.16 | | | $ | 30.53 | | | $ | 51.62 | | | $ | 53.32 | | | $ | 51.39 | |
|
Total Returnb | | | 129.91 | % | | | (40.86 | %) | | | (0.16 | %) | | | 5.63 | % | | | 21.34 | % |
Ratios/Supplemental Data |
Net assets, end of period (in thousands) | | $ | 1,868 | | | $ | 749 | | | $ | 1,203 | | | $ | 1,084 | | | $ | 2,957 | |
Ratios to average net assets: |
Net investment income (loss) | | | 0.41 | % | | | 0.68 | % | | | (0.07 | %) | | | 0.03 | % | | | (0.17 | %) |
Total expenses | | | 1.59 | % | | | 1.63 | % | | | 1.62 | % | | | 1.54 | % | | | 1.53 | % |
Portfolio turnover rate | | | 454 | % | | | 993 | % | | | 558 | % | | | 506 | % | | | 628 | % |
C-Class | | Year Ended
March 31,
2021 | | | Year Ended
March 31,
2020 | | | Year Ended
March 31,
2019 | | | Year Ended
March 29,
2018 | | | Year Ended
March 31,
2017 | |
Per Share Data |
Net asset value, beginning of period | | $ | 26.59 | | | $ | 45.31 | | | $ | 47.35 | | | $ | 46.08 | | | $ | 38.33 | |
Income (loss) from investment operations: |
Net investment income (loss)a | | | (.13 | ) | | | (.05 | ) | | | (.41 | ) | | | (.29 | ) | | | (.36 | ) |
Net gain (loss) on investments (realized and unrealized) | | | 34.22 | | | | (18.67 | ) | | | (.14 | ) | | | 2.54 | | | | 8.21 | |
Total from investment operations | | | 34.09 | | | | (18.72 | ) | | | (.55 | ) | | | 2.25 | | | | 7.85 | |
Less distributions from: |
Net investment income | | | (.02 | ) | | | — | | | | (.02 | ) | | | — | | | | (.10 | ) |
Net realized gains | | | — | | | | — | | | | (1.47 | ) | | | (.98 | ) | | | — | |
Total distributions | | | (.02 | ) | | | — | | | | (1.49 | ) | | | (.98 | ) | | | (.10 | ) |
Net asset value, end of period | | $ | 60.66 | | | $ | 26.59 | | | $ | 45.31 | | | $ | 47.35 | | | $ | 46.08 | |
|
Total Returnb | | | 128.24 | % | | | (41.32 | %) | | | (0.88 | %) | | | 4.82 | % | | | 20.46 | % |
Ratios/Supplemental Data |
Net assets, end of period (in thousands) | | $ | 1,690 | | | $ | 708 | | | $ | 1,842 | | | $ | 1,859 | | | $ | 3,266 | |
Ratios to average net assets: |
Net investment income (loss) | | | (0.30 | %) | | | (0.12 | %) | | | (0.85 | %) | | | (0.62 | %) | | | (0.85 | %) |
Total expenses | | | 2.34 | % | | | 2.37 | % | | | 2.37 | % | | | 2.28 | % | | | 2.28 | % |
Portfolio turnover rate | | | 454 | % | | | 993 | % | | | 558 | % | | | 506 | % | | | 628 | % |
SEE NOTES TO FINANCIAL STATEMENTS. | THE RYDEX FUNDS ANNUAL REPORT | 41 |
S&P MIDCAP 400® PURE VALUE FUND | |
FINANCIAL HIGHLIGHTS (concluded) |
This table is presented to show selected data for a share outstanding throughout each period and to assist shareholders in evaluating a Fund’s performance for the periods presented.
H-Class | | Year Ended
March 31,
2021 | | | Year Ended
March 31,
2020 | | | Year Ended
March 31,
2019 | | | Year Ended
March 29,
2018 | | | Year Ended
March 31,
2017 | |
Per Share Data |
Net asset value, beginning of period | | $ | 30.48 | | | $ | 51.54 | | | $ | 53.25 | | | $ | 51.33 | | | $ | 42.38 | |
Income (loss) from investment operations: |
Net investment income (loss)a | | | .31 | | | | .20 | | | | (.07 | ) | | | .04 | | | | (.07 | ) |
Net gain (loss) on investments (realized and unrealized) | | | 39.28 | | | | (21.26 | ) | | | (.15 | ) | | | 2.86 | | | | 9.12 | |
Total from investment operations | | | 39.59 | | | | (21.06 | ) | | | (.22 | ) | | | 2.90 | | | | 9.05 | |
Less distributions from: |
Net investment income | | | (.02 | ) | | | — | | | | (.02 | ) | | | — | | | | (.10 | ) |
Net realized gains | | | — | | | | — | | | | (1.47 | ) | | | (.98 | ) | | | — | |
Total distributions | | | (.02 | ) | | | — | | | | (1.49 | ) | | | (.98 | ) | | | (.10 | ) |
Net asset value, end of period | | $ | 70.05 | | | $ | 30.48 | | | $ | 51.54 | | | $ | 53.25 | | | $ | 51.33 | |
|
Total Return | | | 129.92 | % | | | (40.86 | %) | | | (0.16 | %) | | | 5.58 | % | | | 21.36 | % |
Ratios/Supplemental Data |
Net assets, end of period (in thousands) | | $ | 154,269 | | | $ | 1,618 | | | $ | 10,928 | | | $ | 7,888 | | | $ | 21,143 | |
Ratios to average net assets: |
Net investment income (loss) | | | 0.51 | % | | | 0.39 | % | | | (0.13 | %) | | | 0.08 | % | | | (0.16 | %) |
Total expenses | | | 1.54 | % | | | 1.63 | % | | | 1.62 | % | | | 1.53 | % | | | 1.53 | % |
Portfolio turnover rate | | | 454 | % | | | 993 | % | | | 558 | % | | | 506 | % | | | 628 | % |
a | Net investment income (loss) per share was computed using average shares outstanding throughout the period. |
b | Total return does not reflect the impact of any applicable sales charges. |
42 | THE RYDEX FUNDS ANNUAL REPORT | SEE NOTES TO FINANCIAL STATEMENTS. |
PERFORMANCE REPORT AND FUND PROFILE (Unaudited) | March 31, 2021 |
S&P SMALLCAP 600® PURE GROWTH FUND
OBJECTIVE: Seeks to provide investment results that match, before fees and expenses, the performance of a benchmark for small-cap growth securities on a daily basis. The Fund’s current benchmark is the S&P SmallCap 600® Pure Growth Index (the “underlying index”).
For the year ended March 31, 2021, S&P SmallCap 600® Pure Growth Fund H-Class return was 103.49%, compared with a return of 107.53% for the underlying index. The Fund maintained a daily correlation of over 99% to its benchmark for the period.
All sectors contributed to the return of the underlying index for the period, led by Consumer Discretionary, Information Technology, and Health Care.
The holdings contributing the most to the return of the underlying index for the period were Sleep Number Corp., Kinsale Capital Group, Inc., and LGI Homes, Inc. The holdings detracting the most from return were eHealth, Inc., Zynex, Inc., and Safehold, Inc.
Performance displayed represents past performance, which is no guarantee of future results.
Holdings Diversification (Market Exposure as % of Net Assets)

“Holdings Diversification (Market Exposure as % of Net Assets)” excludes any temporary cash investments.
Inception Dates: |
A-Class | September 1, 2004 |
C-Class | February 20, 2004 |
H-Class | February 20, 2004 |
Ten Largest Holdings (% of Total Net Assets) |
Fulgent Genetics, Inc. | 2.6% |
Mr Cooper Group, Inc. | 2.0% |
MarineMax, Inc. | 1.9% |
Big Lots, Inc. | 1.9% |
iRobot Corp. | 1.8% |
Vista Outdoor, Inc. | 1.7% |
Glu Mobile, Inc. | 1.7% |
Sleep Number Corp. | 1.6% |
MicroStrategy, Inc. — Class A | 1.6% |
Community Health Systems, Inc. | 1.6% |
Top Ten Total | 18.4% |
| | |
“Ten Largest Holdings” excludes any temporary cash investments. |
| | THE RYDEX FUNDS ANNUAL REPORT | 43 |
PERFORMANCE REPORT AND FUND PROFILE (Unaudited)(concluded) | March 31, 2021 |
Cumulative Fund Performance*
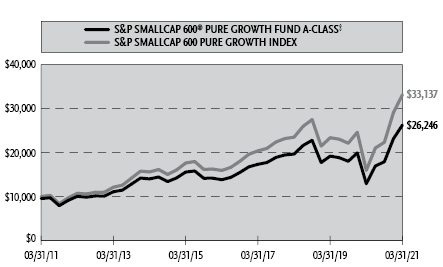
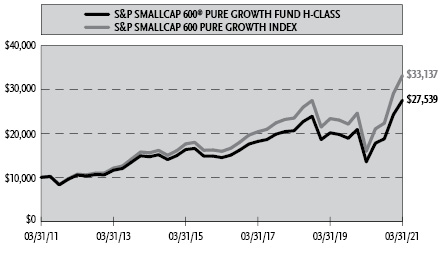
Average Annual Returns*
Periods Ended March 31, 2021
| 1 Year | 5 Year | 10 Year |
A-Class Shares | 103.49% | 13.71% | 10.67% |
A-Class Shares with sales charge‡ | 93.81% | 12.60% | 10.13% |
C-Class Shares | 102.00% | 12.85% | 9.84% |
C-Class Shares with CDSC§ | 101.00% | 12.85% | 9.84% |
H-Class Shares | 103.49% | 13.70% | 10.66% |
S&P SmallCap 600 Pure Growth Index | 107.53% | 15.78% | 12.73% |
* | The performance data above represents past performance that is not predictive of future results. The investment return and principal value of an investment in the Fund will fluctuate so that an investor’s shares, when redeemed, may be worth more or less than their original cost. Returns are historical and include changes in principal and reinvested dividends and capital gains and do not reflect the effect of taxes. The S&P SmallCap 600 Pure Growth Index is an unmanaged index and, unlike the Fund, has no management fees or operating expenses to reduce its reported return. The graphs are based on A-Class and H-Class shares only; performance for C-Class shares will vary due to differences in fee structure. |
‡ | Fund returns are calculated using the maximum sales charge of 4.75%. |
§ | Fund returns include a CDSC of 1% if redeemed within 12 months of purchase. |
44 | THE RYDEX FUNDS ANNUAL REPORT | |
SCHEDULE OF INVESTMENTS | March 31, 2021 |
S&P SMALLCAP 600® PURE GROWTH FUND | |
| | Shares | | | Value | |
COMMON STOCKS† - 99.5% |
| | | | | | | | | |
Consumer, Non-cyclical - 29.0% |
Fulgent Genetics, Inc.*,1 | | | 8,180 | | | $ | 790,351 | |
Community Health Systems, Inc.* | | | 35,930 | | | | 485,774 | |
Medifast, Inc. | | | 1,904 | | | | 403,305 | |
Meridian Bioscience, Inc.* | | | 14,530 | | | | 381,412 | |
Alarm.com Holdings, Inc.* | | | 4,337 | | | | 374,630 | |
Celsius Holdings, Inc.* | | | 7,560 | | | | 363,258 | |
R1 RCM, Inc.* | | | 13,830 | | | | 341,325 | |
Corcept Therapeutics, Inc.* | | | 14,181 | | | | 337,366 | |
Rent-A-Center, Inc. | | | 5,144 | | | | 296,603 | |
Zynex, Inc.*,1 | | | 18,880 | | | | 288,298 | |
Coherus Biosciences, Inc.* | | | 19,730 | | | | 288,255 | |
Collegium Pharmaceutical, Inc.* | | | 11,260 | | | | 266,862 | |
Ensign Group, Inc. | | | 2,770 | | | | 259,937 | |
National Beverage Corp. | | | 5,190 | | | | 253,843 | |
Pacira BioSciences, Inc.* | | | 3,570 | | | | 250,222 | |
Pennant Group, Inc.* | | | 5,439 | | | | 249,106 | |
NeoGenomics, Inc.* | | | 5,149 | | | | 248,336 | |
Merit Medical Systems, Inc.* | | | 4,050 | | | | 242,514 | |
B&G Foods, Inc.1 | | | 7,430 | | | | 230,776 | |
Vericel Corp.* | | | 4,110 | | | | 228,311 | |
Green Dot Corp. — Class A* | | | 4,930 | | | | 225,745 | |
Innoviva, Inc.* | | | 18,871 | | | | 225,508 | |
Supernus Pharmaceuticals, Inc.* | | | 8,240 | | | | 215,723 | |
Xencor, Inc.* | | | 4,460 | | | | 192,048 | |
ModivCare, Inc.* | | | 1,280 | | | | 189,594 | |
Arlo Technologies, Inc.* | | | 23,490 | | | | 147,517 | |
Cytokinetics, Inc.* | | | 5,900 | | | | 137,234 | |
REGENXBIO, Inc.* | | | 3,744 | | | | 127,708 | |
Luminex Corp. | | | 3,780 | | | | 120,582 | |
Omnicell, Inc.* | | | 910 | | | | 118,182 | |
Addus HomeCare Corp.* | | | 1,094 | | | | 114,421 | |
WD-40 Co. | | | 350 | | | | 107,163 | |
EVERTEC, Inc. | | | 2,547 | | | | 94,799 | |
Tactile Systems Technology, Inc.* | | | 1,690 | | | | 92,088 | |
LeMaitre Vascular, Inc. | | | 1,818 | | | | 88,682 | |
Forrester Research, Inc.* | | | 1,880 | | | | 79,862 | |
Heska Corp.* | | | 470 | | | | 79,176 | |
Total Consumer, Non-cyclical | | | | | | | 8,936,516 | |
| | | | | | | | | |
Consumer, Cyclical - 18.8% |
MarineMax, Inc.* | | | 12,070 | | | | 595,775 | |
Big Lots, Inc. | | | 8,612 | | | | 588,200 | |
iRobot Corp.* | | | 4,560 | | | | 557,141 | |
Vista Outdoor, Inc.* | | | 16,480 | | | | 528,514 | |
Sleep Number Corp.* | | | 3,462 | | | | 496,762 | |
Century Communities, Inc.* | | | 7,260 | | | | 437,923 | |
Hibbett Sports, Inc.* | | | 6,220 | | | | 428,496 | |
LGI Homes, Inc.* | | | 2,698 | | | | 402,838 | |
Crocs, Inc.* | | | 3,937 | | | | 316,732 | |
Installed Building Products, Inc. | | | 2,560 | | | | 283,853 | |
Meritage Homes Corp.* | | | 2,490 | | | | 228,881 | |
Lumber Liquidators Holdings, Inc.* | | | 8,840 | | | | 222,061 | |
Dine Brands Global, Inc.* | | | 2,040 | | | | 183,661 | |
PetMed Express, Inc. | | | 3,960 | | | | 139,293 | |
LCI Industries | | | 842 | | | | 111,380 | |
Shake Shack, Inc. — Class A* | | | 968 | | | | 109,161 | |
Dorman Products, Inc.* | | | 1,020 | | | | 104,693 | |
Tupperware Brands Corp.* | | | 2,860 | | | | 75,532 | |
Total Consumer, Cyclical | | | | | | | 5,810,896 | |
| | | | | | | | | |
Financial - 16.0% |
Mr Cooper Group, Inc.* | | | 18,090 | | | | 628,808 | |
Innovative Industrial Properties, Inc. REIT | | | 2,436 | | | | 438,870 | |
St. Joe Co. | | | 9,506 | | | | 407,807 | |
StoneX Group, Inc.* | | | 5,344 | | | | 349,391 | |
Safehold, Inc. REIT | | | 4,673 | | | | 327,577 | |
Brightsphere Investment Group, Inc. | | | 13,890 | | | | 283,078 | |
Trupanion, Inc.* | | | 3,590 | | | | 273,594 | |
Axos Financial, Inc.* | | | 5,290 | | | | 248,683 | |
Triumph Bancorp, Inc.* | | | 3,130 | | | | 242,231 | |
Virtus Investment Partners, Inc. | | | 1,003 | | | | 236,207 | |
HCI Group, Inc. | | | 2,880 | | | | 221,242 | |
Palomar Holdings, Inc.* | | | 3,160 | | | | 211,846 | |
ServisFirst Bancshares, Inc. | | | 3,201 | | | | 196,317 | |
Walker & Dunlop, Inc. | | | 1,759 | | | | 180,720 | |
eHealth, Inc.* | | | 2,331 | | | | 169,534 | |
Essential Properties Realty Trust, Inc. REIT | | | 6,959 | | | | 158,874 | |
PRA Group, Inc.* | | | 3,460 | | | | 128,262 | |
NMI Holdings, Inc. — Class A* | | | 5,374 | | | | 127,041 | |
Community Healthcare Trust, Inc. REIT | | | 2,064 | | | | 95,192 | |
Total Financial | | | | | | | 4,925,274 | |
| | | | | | | | | |
Technology - 13.7% |
Glu Mobile, Inc.* | | | 41,132 | | | | 513,327 | |
MicroStrategy, Inc. — Class A* | | | 730 | | | | 495,524 | |
Simulations Plus, Inc. | | | 4,810 | | | | 304,184 | |
SPS Commerce, Inc.* | | | 2,777 | | | | 275,784 | |
TTEC Holdings, Inc. | | | 2,527 | | | | 253,837 | |
Ultra Clean Holdings, Inc.* | | | 4,219 | | | | 244,871 | |
FormFactor, Inc.* | | | 5,000 | | | | 225,550 | |
Onto Innovation, Inc.* | | | 3,100 | | | | 203,701 | |
CEVA, Inc.* | | | 3,320 | | | | 186,418 | |
Power Integrations, Inc. | | | 2,072 | | | | 168,827 | |
LivePerson, Inc.* | | | 3,160 | | | | 166,658 | |
Diodes, Inc.* | | | 2,034 | | | | 162,394 | |
Ebix, Inc. | | | 4,720 | | | | 151,182 | |
Agilysys, Inc.* | | | 3,032 | | | | 145,415 | |
8x8, Inc.* | | | 4,475 | | | | 145,169 | |
Cohu, Inc.* | | | 3,100 | | | | 129,704 | |
Allscripts Healthcare Solutions, Inc.* | | | 8,300 | | | | 124,625 | |
ExlService Holdings, Inc.* | | | 1,350 | | | | 121,716 | |
Tabula Rasa HealthCare, Inc.*,1 | | | 2,340 | | | | 107,757 | |
OneSpan, Inc.* | | | 3,680 | | | | 90,160 | |
Total Technology | | | | | | | 4,216,803 | |
| | | | | | | | | |
Industrial - 12.0% |
Chart Industries, Inc.* | | | 2,530 | | | | 360,145 | |
Saia, Inc.* | | | 1,392 | | | | 320,967 | |
Advanced Energy Industries, Inc. | | | 2,689 | | | | 293,558 | |
Comfort Systems USA, Inc. | | | 3,770 | | | | 281,883 | |
AeroVironment, Inc.* | | | 2,250 | | | | 261,135 | |
SEE NOTES TO FINANCIAL STATEMENTS. | THE RYDEX FUNDS ANNUAL REPORT | 45 |
SCHEDULE OF INVESTMENTS (continued) | March 31, 2021 |
S&P SMALLCAP 600® PURE GROWTH FUND | |
| | Shares | | | Value | |
Patrick Industries, Inc. | | | 3,014 | | | $ | 256,190 | |
Vicor Corp.* | | | 2,901 | | | | 246,672 | |
PGT Innovations, Inc.* | | | 8,800 | | | | 222,200 | |
AAON, Inc. | | | 2,466 | | | | 172,645 | |
Matson, Inc. | | | 2,460 | | | | 164,082 | |
Proto Labs, Inc.* | | | 1,190 | | | | 144,883 | |
Gibraltar Industries, Inc.* | | | 1,550 | | | | 141,840 | |
Alamo Group, Inc. | | | 886 | | | | 138,349 | |
Forward Air Corp. | | | 1,517 | | | | 134,725 | |
Exponent, Inc. | | | 1,377 | | | | 134,189 | |
Marten Transport Ltd. | | | 7,090 | | | | 120,317 | |
Federal Signal Corp. | | | 3,045 | | | | 116,624 | |
Franklin Electric Company, Inc. | | | 1,259 | | | | 99,385 | |
Badger Meter, Inc. | | | 1,020 | | | | 94,932 | |
Total Industrial | | | | | | | 3,704,721 | |
| | | | | | | | | |
Communications - 5.5% |
TechTarget, Inc.* | | | 5,228 | | | | 363,085 | |
Stamps.com, Inc.* | | | 1,662 | | | | 331,586 | |
Shutterstock, Inc. | | | 2,817 | | | | 250,826 | |
Cincinnati Bell, Inc.* | | | 9,942 | | | | 152,609 | |
QuinStreet, Inc.* | | | 7,505 | | | | 152,351 | |
Vonage Holdings Corp.* | | | 12,028 | | | | 142,171 | |
Perficient, Inc.* | | | 2,296 | | | | 134,821 | |
NIC, Inc. | | | 2,697 | | | | 91,509 | |
Viavi Solutions, Inc.* | | | 5,780 | | | | 90,746 | |
Total Communications | | | | | | | 1,709,704 | |
| | | | | | | | | |
Energy - 3.3% |
Renewable Energy Group, Inc.* | | | 6,950 | | | | 458,978 | |
Bonanza Creek Energy, Inc.* | | | 12,500 | | | | 446,625 | |
DMC Global, Inc.* | | | 2,050 | | | | 111,233 | |
Total Energy | | | | | | | 1,016,836 | |
Basic Materials - 1.2% |
Quaker Chemical Corp. | | | 840 | | | $ | 204,767 | |
Livent Corp.* | | | 9,530 | | | | 165,059 | |
Total Basic Materials | | | | | | | 369,826 | |
| | | | | | | | | |
Total Common Stocks | | | | |
(Cost $23,474,186) | | | | | | | 30,690,576 | |
| | | | | | | | | |
| | | Face
Amount | | | | | |
REPURCHASE AGREEMENTS††,2 - 0.8% |
J.P. Morgan Securities LLC
issued 03/31/21 at 0.01%
due 04/01/21 | | $ | 132,126 | | | | 132,126 | |
Barclays Capital, Inc.
issued 03/31/21 at 0.01%
due 04/01/21 | | | 60,071 | | | | 60,071 | |
BofA Securities, Inc.
issued 03/31/21 at 0.01%
due 04/01/21 | | | 54,824 | | | | 54,824 | |
Total Repurchase Agreements | | | | |
(Cost $247,021) | | | | | | | 247,021 | |
| | | | | | | | | |
| | | Shares | | | | | |
SECURITIES LENDING COLLATERAL†,3 - 3.5% |
Money Market Fund | | | | | | | | |
First American Government Obligations Fund — Class Z, 0.03%4 | | | 1,068,144 | | | | 1,068,144 | |
Total Securities Lending Collateral | | | | |
(Cost $1,068,144) | | | | | | | 1,068,144 | |
| | | | | | | | | |
Total Investments - 103.8% | | | | |
(Cost $24,789,351) | | $ | 32,005,741 | |
Other Assets & Liabilities, net - (3.8)% | | | (1,158,091 | ) |
Total Net Assets - 100.0% | | $ | 30,847,650 | |
* | Non-income producing security. |
† | Value determined based on Level 1 inputs — See Note 4. |
†† | Value determined based on Level 2 inputs — See Note 4. |
1 | All or a portion of this security is on loan at March 31, 2021 — See Note 7. |
2 | Repurchase Agreements — See Note 6. |
3 | Securities lending collateral — See Note 7. |
4 | Rate indicated is the 7-day yield as of March 31, 2021. |
| | REIT — Real Estate Investment Trust |
| | |
| | See Sector Classification in Other Information section. |
46 | THE RYDEX FUNDS ANNUAL REPORT | SEE NOTES TO FINANCIAL STATEMENTS. |
SCHEDULE OF INVESTMENTS (concluded) | March 31, 2021 |
S&P SMALLCAP 600® PURE GROWTH FUND | |
The following table summarizes the inputs used to value the Fund’s investments at March 31, 2021 (See Note 4 in the Notes to Financial Statements):
Investments in Securities (Assets) | | Level 1
Quoted
Prices | | | Level 2
Significant
Observable
Inputs | | | Level 3
Significant
Unobservable
Inputs | | | Total | |
Common Stocks | | $ | 30,690,576 | | | $ | — | | | $ | — | | | $ | 30,690,576 | |
Repurchase Agreements | | | — | | | | 247,021 | | | | — | | | | 247,021 | |
Securities Lending Collateral | | | 1,068,144 | | | | — | | | | — | | | | 1,068,144 | |
Total Assets | | $ | 31,758,720 | | | $ | 247,021 | | | $ | — | | | $ | 32,005,741 | |
SEE NOTES TO FINANCIAL STATEMENTS. | THE RYDEX FUNDS ANNUAL REPORT | 47 |
S&P SMALLCAP 600® PURE GROWTH FUND | |
STATEMENT OF ASSETS AND LIABILITIES |
March 31, 2021 |
Assets: |
Investments, at value - including $1,078,312 of securities loaned (cost $24,542,330) | | $ | 31,758,720 | |
Repurchase agreements, at value (cost $247,021) | | | 247,021 | |
Receivables: | | | | |
Securities sold | | | 784,294 | |
Fund shares sold | | | 117,451 | |
Dividends | | | 17,457 | |
Securities lending income | | | 1,721 | |
Total assets | | | 32,926,664 | |
| | | | | |
Liabilities: |
Payable for: |
Return of securities lending collateral | | | 1,068,144 | |
Fund shares redeemed | | | 885,340 | |
Management fees | | | 32,856 | |
Distribution and service fees | | | 12,223 | |
Transfer agent and administrative fees | | | 11,784 | |
Portfolio accounting fees | | | 4,381 | |
Trustees’ fees* | | | 887 | |
Miscellaneous | | | 63,399 | |
Total liabilities | | | 2,079,014 | |
Commitments and contingent liabilities (Note 12) | | | — | |
Net assets | | $ | 30,847,650 | |
| | | | | |
Net assets consist of: |
Paid in capital | | $ | 21,979,990 | |
Total distributable earnings (loss) | | | 8,867,660 | |
Net assets | | $ | 30,847,650 | |
| | | | | |
A-Class: |
Net assets | | $ | 3,447,756 | |
Capital shares outstanding | | | 38,641 | |
Net asset value per share | | $ | 89.23 | |
Maximum offering price per share (Net asset value divided by 95.25%) | | $ | 93.68 | |
| | | | | |
C-Class: |
Net assets | | $ | 2,328,596 | |
Capital shares outstanding | | | 30,011 | |
Net asset value per share | | $ | 77.59 | |
| | | | | |
H-Class: |
Net assets | | $ | 25,071,298 | |
Capital shares outstanding | | | 281,052 | |
Net asset value per share | | $ | 89.21 | |
STATEMENT OF OPERATIONS |
Year Ended March 31, 2021 |
Investment Income: |
Dividends | | $ | 139,371 | |
Interest | | | 70 | |
Income from securities lending, net | | | 14,931 | |
Total investment income | | | 154,372 | |
| | | | | |
EXPENSES: |
Management fees | | | 219,671 | |
Distribution and service fees: |
A-Class | | | 6,975 | |
C-Class | | | 14,972 | |
H-Class | | | 62,505 | |
Transfer agent and administrative fees | | | 79,939 | |
Portfolio accounting fees | | | 29,291 | |
Professional fees | | | 9,074 | |
Custodian fees | | | 3,772 | |
Trustees’ fees* | | | 1,861 | |
Line of credit fees | | | 145 | |
Miscellaneous | | | 36,705 | |
Total expenses | | | 464,910 | |
Net investment loss | | | (310,538 | ) |
| | | | | |
Net Realized and Unrealized Gain (Loss): |
Net realized gain (loss) on: |
Investments | | | 6,147,682 | |
Net realized gain | | | 6,147,682 | |
Net change in unrealized appreciation (depreciation) on: |
Investments | | | 7,971,113 | |
Net change in unrealized appreciation (depreciation) | | | 7,971,113 | |
Net realized and unrealized gain | | | 14,118,795 | |
Net increase in net assets resulting from operations | | $ | 13,808,257 | |
* | Relates to Trustees not deemed “interested persons” within the meaning of Section 2(a)(19) of the 1940 Act. |
48 | THE RYDEX FUNDS ANNUAL REPORT | SEE NOTES TO FINANCIAL STATEMENTS. |
S&P SMALLCAP 600® PURE GROWTH FUND | |
STATEMENTS OF CHANGES IN NET ASSETS |
| | Year Ended
March 31,
2021 | | | Year Ended
March 31,
2020 | |
Increase (Decrease) in Net Assets from Operations: | | | | | | | | |
Net investment loss | | $ | (310,538 | ) | | $ | (73,979 | ) |
Net realized gain (loss) on investments | | | 6,147,682 | | | | (384,045 | ) |
Net change in unrealized appreciation (depreciation) on investments | | | 7,971,113 | | | | (2,835,633 | ) |
Net increase (decrease) in net assets resulting from operations | | | 13,808,257 | | | | (3,293,657 | ) |
| | | | | | | | | |
Capital share transactions: | | | | | | | | |
Proceeds from sale of shares | | | | | | | | |
A-Class | | | 5,066,328 | | | | 719,908 | |
C-Class | | | 1,838,147 | | | | 378,469 | |
H-Class | | | 184,102,636 | | | | 56,396,230 | |
Cost of shares redeemed | | | | | | | | |
A-Class | | | (4,727,157 | ) | | | (1,307,711 | ) |
C-Class | | | (1,154,354 | ) | | | (595,749 | ) |
H-Class | | | (172,363,238 | ) | | | (59,193,712 | ) |
Net increase (decrease) from capital share transactions | | | 12,762,362 | | | | (3,602,565 | ) |
Net increase (decrease) in net assets | | | 26,570,619 | | | | (6,896,222 | ) |
| | | | | | | | | |
Net assets: | | | | | | | | |
Beginning of year | | | 4,277,031 | | | | 11,173,253 | |
End of year | | $ | 30,847,650 | | | $ | 4,277,031 | |
| | | | | | | | | |
Capital share activity: | | | | | | | | |
Shares sold | | | | | | | | |
A-Class | | | 72,794 | | | | 11,355 | |
C-Class | | | 30,205 | | | | 6,675 | |
H-Class | | | 2,423,701 | | | | 877,834 | |
Shares redeemed | | | | | | | | |
A-Class | | | (60,805 | ) | | | (21,456 | ) |
C-Class | | | (17,857 | ) | | | (10,753 | ) |
H-Class | | | (2,198,078 | ) | | | (937,806 | ) |
Net increase (decrease) in shares | | | 249,960 | | | | (74,151 | ) |
SEE NOTES TO FINANCIAL STATEMENTS. | THE RYDEX FUNDS ANNUAL REPORT | 49 |
S&P SMALLCAP 600® PURE GROWTH FUND | |
This table is presented to show selected data for a share outstanding throughout each period and to assist shareholders in evaluating a Fund’s performance for the periods presented.
A-Class | | Year Ended
March 31,
2021 | | | Year Ended
March 31,
2020 | | | Year Ended
March 31,
2019 | | | Year Ended
March 29,
2018 | | | Year Ended
March 31,
2017 | |
Per Share Data |
Net asset value, beginning of period | | $ | 43.85 | | | $ | 65.22 | | | $ | 71.79 | | | $ | 65.58 | | | $ | 52.28 | |
Income (loss) from investment operations: |
Net investment income (loss)a | | | (.62 | ) | | | (.44 | ) | | | (.70 | ) | | | (.63 | ) | | | (.41 | ) |
Net gain (loss) on investments (realized and unrealized) | | | 46.00 | | | | (20.93 | ) | | | (.94 | ) | | | 9.35 | | | | 13.71 | |
Total from investment operations | | | 45.38 | | | | (21.37 | ) | | | (1.64 | ) | | | 8.72 | | | | 13.30 | |
Less distributions from: |
Net realized gains | | | — | | | | — | | | | (4.93 | ) | | | (2.51 | ) | | | — | |
Total distributions | | | — | | | | — | | | | (4.93 | ) | | | (2.51 | ) | | | — | |
Net asset value, end of period | | $ | 89.23 | | | $ | 43.85 | | | $ | 65.22 | | | $ | 71.79 | | | $ | 65.58 | |
|
Total Returnb | | | 103.49 | % | | | (32.77 | %) | | | (2.34 | %) | | | 13.41 | % | | | 25.44 | % |
Ratios/Supplemental Data |
Net assets, end of period (in thousands) | | $ | 3,448 | | | $ | 1,169 | | | $ | 2,397 | | | $ | 1,857 | | | $ | 2,526 | |
Ratios to average net assets: |
Net investment income (loss) | | | (0.86 | %) | | | (0.69 | %) | | | (0.93 | %) | | | (0.91 | %) | | | (0.71 | %) |
Total expenses | | | 1.58 | % | | | 1.63 | % | | | 1.62 | % | | | 1.53 | % | | | 1.52 | % |
Portfolio turnover rate | | | 752 | % | | | 628 | % | | | 421 | % | | | 643 | % | | | 818 | % |
C-Class | | Year Ended
March 31,
2021 | | | Year Ended
March 31,
2020 | | | Year Ended
March 31,
2019 | | | Year Ended
March 29,
2018 | | | Year Ended
March 31,
2017 | |
Per Share Data |
Net asset value, beginning of period | | $ | 38.41 | | | $ | 57.57 | | | $ | 64.43 | | | $ | 59.55 | | | $ | 47.82 | |
Income (loss) from investment operations: |
Net investment income (loss)a | | | (.96 | ) | | | (.79 | ) | | | (1.16 | ) | | | (.96 | ) | | | (.79 | ) |
Net gain (loss) on investments (realized and unrealized) | | | 40.14 | | | | (18.37 | ) | | | (.77 | ) | | | 8.35 | | | | 12.52 | |
Total from investment operations | | | 39.18 | | | | (19.16 | ) | | | (1.93 | ) | | | 7.39 | | | | 11.73 | |
Less distributions from: |
Net realized gains | | | — | | | | — | | | | (4.93 | ) | | | (2.51 | ) | | | — | |
Total distributions | | | — | | | | — | | | | (4.93 | ) | | | (2.51 | ) | | | — | |
Net asset value, end of period | | $ | 77.59 | | | $ | 38.41 | | | $ | 57.57 | | | $ | 64.43 | | | $ | 59.55 | |
|
Total Returnb | | | 102.00 | % | | | (33.28 | %) | | | (3.06 | %) | | | 12.52 | % | | | 24.51 | % |
Ratios/Supplemental Data |
Net assets, end of period (in thousands) | | $ | 2,329 | | | $ | 678 | | | $ | 1,252 | | | $ | 2,354 | | | $ | 3,054 | |
Ratios to average net assets: |
Net investment income (loss) | | | (1.59 | %) | | | (1.43 | %) | | | (1.70 | %) | | | (1.52 | %) | | | (1.48 | %) |
Total expenses | | | 2.33 | % | | | 2.38 | % | | | 2.36 | % | | | 2.28 | % | | | 2.28 | % |
Portfolio turnover rate | | | 752 | % | | | 628 | % | | | 421 | % | | | 643 | % | | | 818 | % |
50 | THE RYDEX FUNDS ANNUAL REPORT | SEE NOTES TO FINANCIAL STATEMENTS. |
S&P SMALLCAP 600® PURE GROWTH FUND | |
FINANCIAL HIGHLIGHTS (concluded) |
This table is presented to show selected data for a share outstanding throughout each period and to assist shareholders in evaluating a Fund’s performance for the periods presented.
H-Class | | Year Ended
March 31,
2021 | | | Year Ended
March 31,
2020 | | | Year Ended
March 31,
2019 | | | Year Ended
March 29,
2018 | | | Year Ended
March 31,
2017 | |
Per Share Data |
Net asset value, beginning of period | | $ | 43.84 | | | $ | 65.21 | | | $ | 71.78 | | | $ | 65.58 | | | $ | 52.27 | |
Income (loss) from investment operations: |
Net investment income (loss)a | | | (.86 | ) | | | (.40 | ) | | | (.77 | ) | | | (.55 | ) | | | (.44 | ) |
Net gain (loss) on investments (realized and unrealized) | | | 46.23 | | | | (20.97 | ) | | | (.87 | ) | | | 9.26 | | | | 13.75 | |
Total from investment operations | | | 45.37 | | | | (21.37 | ) | | | (1.64 | ) | | | 8.71 | | | | 13.31 | |
Less distributions from: |
Net realized gains | | | — | | | | — | | | | (4.93 | ) | | | (2.51 | ) | | | — | |
Total distributions | | | — | | | | — | | | | (4.93 | ) | | | (2.51 | ) | | | — | |
Net asset value, end of period | | $ | 89.21 | | | $ | 43.84 | | | $ | 65.21 | | | $ | 71.78 | | | $ | 65.58 | |
|
Total Return | | | 103.49 | % | | | (32.77 | %) | | | (2.33 | %) | | | 13.38 | % | | | 25.46 | % |
Ratios/Supplemental Data |
Net assets, end of period (in thousands) | | $ | 25,071 | | | $ | 2,430 | | | $ | 7,525 | | | $ | 15,523 | | | $ | 31,750 | |
Ratios to average net assets: |
Net investment income (loss) | | | (1.05 | %) | | | (0.63 | %) | | | (0.99 | %) | | | (0.80 | %) | | | (0.75 | %) |
Total expenses | | | 1.54 | % | | | 1.63 | % | | | 1.61 | % | | | 1.53 | % | | | 1.53 | % |
Portfolio turnover rate | | | 752 | % | | | 628 | % | | | 421 | % | | | 643 | % | | | 818 | % |
a | Net investment income (loss) per share was computed using average shares outstanding throughout the period. |
b | Total return does not reflect the impact of any applicable sales charges. |
SEE NOTES TO FINANCIAL STATEMENTS. | THE RYDEX FUNDS ANNUAL REPORT | 51 |
PERFORMANCE REPORT AND FUND PROFILE (Unaudited) | March 31, 2021 |
S&P SMALLCAP 600® PURE VALUE FUND
OBJECTIVE: Seeks to provide investment results that match, before fees and expenses, the performance of a benchmark for small-cap value securities on a daily basis. The Fund’s current benchmark is the S&P SmallCap 600® Pure Value Index (the “underlying index”).
For the year ended March 31, 2021, S&P SmallCap 600® Pure Value Fund H-Class returned 149.16%, compared with a return of 156.94% for the underlying index. The Fund maintained a daily correlation of over 99% to its benchmark for the period.
All sectors contributed to the return of the underlying index for the period, led by Consumer Discretionary, Industrials, and Energy.
The holdings contributing the most to the return of the underlying index for the period were Renewable Energy Group, Inc., Atlas Air Worldwide Holdings, Inc., and MarineMax, Inc. The holdings detracting the most from return were CoreCivic, Inc., Oasis Petroleum, Inc., and KLX Energy Services Holdings, Inc.
Performance displayed represents past performance, which is no guarantee of future results.
Holdings Diversification (Market Exposure as % of Net Assets)
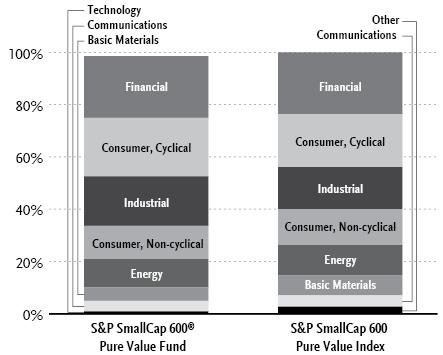
“Holdings Diversification (Market Exposure as % of Net Assets)” excludes any temporary cash investments.
Inception Dates: |
A-Class | September 1, 2004 |
C-Class | February 20, 2004 |
H-Class | February 20, 2004 |
Ten Largest Holdings (% of Total Net Assets) |
Veritiv Corp. | 1.9% |
Olympic Steel, Inc. | 1.5% |
Aaron’s Company, Inc. | 1.4% |
Conn’s, Inc. | 1.3% |
CONSOL Energy, Inc. | 1.3% |
Green Plains, Inc. | 1.2% |
Greenbrier Companies, Inc. | 1.2% |
SunCoke Energy, Inc. | 1.2% |
US Concrete, Inc. | 1.1% |
G-III Apparel Group Ltd. | 1.1% |
Top Ten Total | 13.2% |
| | |
“Ten Largest Holdings” excludes any temporary cash investments. |
52 | THE RYDEX FUNDS ANNUAL REPORT | |
PERFORMANCE REPORT AND FUND PROFILE (Unaudited)(concluded) | March 31, 2021 |
Cumulative Fund Performance*
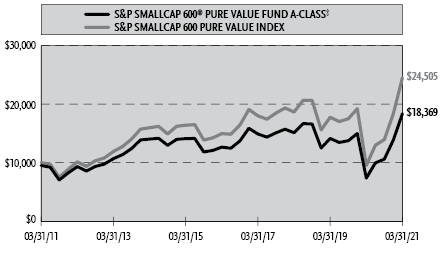
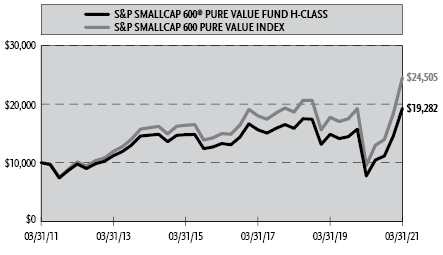
Average Annual Returns*
Periods Ended March 31, 2021
| 1 Year | 5 Year | 10 Year |
A-Class Shares | 149.04% | 7.72% | 6.79% |
A-Class Shares with sales charge‡ | 137.21% | 6.68% | 6.27% |
C-Class Shares | 147.34% | 6.93% | 5.99% |
C-Class Shares with CDSC§ | 146.34% | 6.93% | 5.99% |
H-Class Shares | 149.16% | 7.75% | 6.79% |
S&P SmallCap 600 Pure Value Index | 156.94% | 10.35% | 9.38% |
* | The performance data above represents past performance that is not predictive of future results. The investment return and principal value of an investment in the Fund will fluctuate so that an investor’s shares, when redeemed, may be worth more or less than their original cost. Returns are historical and include changes in principal and reinvested dividends and capital gains and do not reflect the effect of taxes. The S&P SmallCap 600 Pure Value Index is an unmanaged index and, unlike the Fund, has no management fees or operating expenses to reduce its reported return. The graphs are based on A-Class and H-Class shares only; performance for C-Class shares will vary due to differences in fee structure. |
‡ | Fund returns are calculated using the maximum sales charge of 4.75%. |
§ | Fund returns include a CDSC of 1% if redeemed within 12 months of purchase. |
| | THE RYDEX FUNDS ANNUAL REPORT | 53 |
SCHEDULE OF INVESTMENTS | March 31, 2021 |
S&P SMALLCAP 600® PURE VALUE FUND | |
| | Shares | | | Value | |
COMMON STOCKS† - 98.5% |
| | | | | | | | | |
Financial - 23.6% |
Customers Bancorp, Inc.* | | | 10,013 | | | $ | 318,614 | |
Hanmi Financial Corp. | | | 14,765 | | | | 291,313 | |
Realogy Holdings Corp.* | | | 18,589 | | | | 281,252 | |
United Insurance Holdings Corp. | | | 37,224 | | | | 268,385 | |
Stewart Information Services Corp. | | | 5,087 | | | | 264,677 | |
Boston Private Financial Holdings, Inc. | | | 19,724 | | | | 262,724 | |
Universal Insurance Holdings, Inc. | | | 18,032 | | | | 258,579 | |
Employers Holdings, Inc. | | | 5,992 | | | | 258,015 | |
American Equity Investment Life Holding Co. | | | 8,112 | | | | 255,771 | |
EZCORP, Inc. — Class A* | | | 51,131 | | | | 254,121 | |
United Fire Group, Inc. | | | 7,151 | | | | 248,855 | |
Investors Bancorp, Inc. | | | 16,080 | | | | 236,215 | |
Enova International, Inc.* | | | 6,570 | | | | 233,104 | |
Dime Community Bancshares, Inc. | | | 7,730 | | | | 232,982 | |
Encore Capital Group, Inc.* | | | 5,459 | | | | 219,615 | |
First Midwest Bancorp, Inc. | | | 9,526 | | | | 208,715 | |
Hope Bancorp, Inc. | | | 13,790 | | | | 207,677 | |
Simmons First National Corp. — Class A | | | 6,978 | | | | 207,037 | |
GEO Group, Inc. REIT1 | | | 26,655 | | | | 206,843 | |
First Financial Bancorp | | | 8,355 | | | | 200,520 | |
Central Pacific Financial Corp. | | | 7,499 | | | | 200,073 | |
Assured Guaranty Ltd. | | | 4,577 | | | | 193,516 | |
SiriusPoint Ltd.* | | | 19,018 | | | | 193,413 | |
Office Properties Income Trust REIT | | | 6,664 | | | | 183,393 | |
Provident Financial Services, Inc. | | | 7,938 | | | | 176,859 | |
RPT Realty REIT | | | 15,251 | | | | 174,014 | |
Northfield Bancorp, Inc. | | | 10,279 | | | | 163,642 | |
First BanCorp | | | 13,790 | | | | 155,275 | |
First Commonwealth Financial Corp. | | | 10,488 | | | | 150,713 | |
Diversified Healthcare Trust REIT | | | 31,487 | | | | 150,508 | |
Ameris Bancorp | | | 2,861 | | | | 150,231 | |
WSFS Financial Corp. | | | 2,860 | | | | 142,399 | |
S&T Bancorp, Inc. | | | 4,195 | | | | 140,533 | |
Renasant Corp. | | | 3,337 | | | | 138,085 | |
Horace Mann Educators Corp. | | | 3,187 | | | | 137,710 | |
OFG Bancorp | | | 6,061 | | | | 137,100 | |
Ready Capital Corp. REIT | | | 10,209 | | | | 137,005 | |
Franklin Street Properties Corp. REIT | | | 25,055 | | | | 136,550 | |
PennyMac Mortgage Investment Trust REIT | | | 6,885 | | | | 134,946 | |
Banner Corp. | | | 2,410 | | | | 128,525 | |
Allegiance Bancshares, Inc. | | | 3,024 | | | | 122,593 | |
Veritex Holdings, Inc. | | | 3,719 | | | | 121,686 | |
BankUnited, Inc. | | | 2,720 | | | | 119,544 | |
Old National Bancorp | | | 5,981 | | | | 115,673 | |
HomeStreet, Inc. | | | 2,561 | | | | 112,863 | |
Eagle Bancorp, Inc. | | | 2,052 | | | | 109,187 | |
Apollo Commercial Real Estate Finance, Inc. REIT | | | 7,209 | | | | 100,710 | |
Acadia Realty Trust REIT | | | 5,261 | | | | 99,801 | |
Safety Insurance Group, Inc. | | | 1,136 | | | | 95,708 | |
Whitestone REIT — Class B | | | 9,793 | | | | 94,992 | |
First Bancorp | | | 2,122 | | | | 92,307 | |
Waddell & Reed Financial, Inc. — Class A | | | 3,649 | | | | 91,407 | |
Independent Bank Group, Inc. | | | 1,229 | | | | 88,783 | |
DiamondRock Hospitality Co. REIT* | | | 8,192 | | | | 84,377 | |
Total Financial | | | | | | | 9,489,135 | |
| | | | | | | | | |
Consumer, Cyclical - 22.3% |
Veritiv Corp.* | | | 17,870 | | | | 760,190 | |
Conn’s, Inc.* | | | 26,771 | | | | 520,696 | |
G-III Apparel Group Ltd.* | | | 14,602 | | | | 440,104 | |
ODP Corp.* | | | 9,085 | | | | 393,290 | |
Daktronics, Inc.* | | | 59,818 | | | | 375,059 | |
M/I Homes, Inc.* | | | 6,328 | | | | 373,795 | |
Signet Jewelers Ltd.* | | | 5,957 | | | | 345,387 | |
Cato Corp. — Class A* | | | 28,277 | | | | 339,324 | |
Group 1 Automotive, Inc. | | | 2,053 | | | | 323,943 | |
Vera Bradley, Inc.* | | | 29,725 | | | | 300,222 | |
Bed Bath & Beyond, Inc.* | | | 9,723 | | | | 283,425 | |
Asbury Automotive Group, Inc.* | | | 1,367 | | | | 268,615 | |
Unifi, Inc.* | | | 9,746 | | | | 268,600 | |
GMS, Inc.* | | | 6,397 | | | | 267,075 | |
Resideo Technologies, Inc.* | | | 9,411 | | | | 265,861 | |
Abercrombie & Fitch Co. — Class A* | | | 7,696 | | | | 264,050 | |
Genesco, Inc.* | | | 5,528 | | | | 262,580 | |
Barnes & Noble Education, Inc.* | | | 31,290 | | | | 254,701 | |
ScanSource, Inc.* | | | 8,286 | | | | 248,166 | |
Core-Mark Holding Company, Inc. | | | 6,050 | | | | 234,074 | |
Shoe Carnival, Inc. | | | 3,593 | | | | 222,335 | |
Michaels Companies, Inc.* | | | 9,862 | | | | 216,372 | |
Chico’s FAS, Inc.* | | | 63,160 | | | | 209,060 | |
Sally Beauty Holdings, Inc.* | | | 10,210 | | | | 205,527 | |
SkyWest, Inc.* | | | 3,477 | | | | 189,427 | |
PC Connection, Inc. | | | 3,847 | | | | 178,462 | |
Sonic Automotive, Inc. — Class A | | | 3,569 | | | | 176,915 | |
Cooper Tire & Rubber Co. | | | 2,770 | | | | 155,065 | |
Interface, Inc. — Class A | | | 12,134 | | | | 151,432 | |
Marcus Corp.* | | | 6,721 | | | | 134,353 | |
Ethan Allen Interiors, Inc. | | | 4,508 | | | | 124,466 | |
Motorcar Parts of America, Inc.* | | | 4,705 | | | | 105,862 | |
HNI Corp. | | | 2,640 | | | | 104,439 | |
Total Consumer, Cyclical | | | | | | | 8,962,872 | |
| | | | | | | | | |
Industrial - 19.0% |
Olympic Steel, Inc. | | | 20,898 | | | | 615,446 | |
Greenbrier Companies, Inc. | | | 10,037 | | | | 473,947 | |
US Concrete, Inc.* | | | 6,224 | | | | 456,344 | |
Bel Fuse, Inc. — Class B | | | 20,688 | | | | 411,484 | |
ArcBest Corp. | | | 5,829 | | | | 410,187 | |
Granite Construction, Inc. | | | 9,688 | | | | 389,942 | |
Benchmark Electronics, Inc. | | | 11,450 | | | | 354,034 | |
Sanmina Corp.* | | | 8,495 | | | | 351,523 | |
Griffon Corp. | | | 11,983 | | | | 325,578 | |
DXP Enterprises, Inc.* | | | 9,793 | | | | 295,455 | |
Powell Industries, Inc. | | | 8,494 | | | | 287,692 | |
Boise Cascade Co. | | | 4,693 | | | | 280,782 | |
O-I Glass, Inc.* | | | 18,980 | | | | 279,765 | |
Apogee Enterprises, Inc. | | | 6,745 | | | | 275,736 | |
Comtech Telecommunications Corp. | | | 9,769 | | | | 242,662 | |
Atlas Air Worldwide Holdings, Inc.* | | | 3,999 | | | | 241,699 | |
54 | THE RYDEX FUNDS ANNUAL REPORT | SEE NOTES TO FINANCIAL STATEMENTS. |
SCHEDULE OF INVESTMENTS (continued) | March 31, 2021 |
S&P SMALLCAP 600® PURE VALUE FUND | |
| | Shares | | | Value | |
AAR Corp.* | | | 5,795 | | | $ | 241,362 | |
TTM Technologies, Inc.* | | | 15,993 | | | | 231,899 | |
Aegion Corp. — Class A* | | | 7,996 | | | | 229,885 | |
Haynes International, Inc. | | | 7,568 | | | | 224,543 | |
TimkenSteel Corp.* | | | 18,438 | | | | 216,646 | |
SEACOR Holdings, Inc.* | | | 4,453 | | | | 181,460 | |
Hub Group, Inc. — Class A* | | | 2,690 | | | | 180,983 | |
Matthews International Corp. — Class A | | | 3,302 | | | | 130,594 | |
Encore Wire Corp. | | | 1,924 | | | | 129,158 | |
Trinseo S.A. | | | 1,993 | | | | 126,894 | |
Tredegar Corp. | | | 3,059 | | | | 45,916 | |
Total Industrial | | | | | | | 7,631,616 | |
| | | | | | | | | |
Consumer, Non-cyclical - 12.7% |
Aaron’s Company, Inc. | | | 21,660 | | | | 556,229 | |
CoreCivic, Inc. | | | 47,631 | | | | 431,060 | |
Seneca Foods Corp. — Class A* | | | 8,657 | | | | 407,658 | |
Andersons, Inc. | | | 14,834 | | | | 406,155 | |
Fresh Del Monte Produce, Inc. | | | 14,035 | | | | 401,822 | |
SpartanNash Co. | | | 19,087 | | | | 374,678 | |
Magellan Health, Inc.* | | | 3,315 | | | | 309,090 | |
Kelly Services, Inc. — Class A* | | | 13,454 | | | | 299,621 | |
Universal Corp. | | | 4,879 | | | | 287,812 | |
ABM Industries, Inc. | | | 4,438 | | | | 226,382 | |
Invacare Corp. | | | 26,586 | | | | 213,220 | |
Edgewell Personal Care Co. | | | 5,210 | | | | 206,316 | |
Cross Country Healthcare, Inc.* | | | 16,131 | | | | 201,476 | |
Lannett Company, Inc.* | | | 37,978 | | | | 200,524 | |
Resources Connection, Inc. | | | 14,590 | | | | 197,549 | |
Deluxe Corp. | | | 3,510 | | | | 147,280 | |
TrueBlue, Inc.* | | | 5,748 | | | | 126,571 | |
Prestige Consumer Healthcare, Inc.* | | | 2,500 | | | | 110,200 | |
Total Consumer, Non-cyclical | | | | | | | 5,103,643 | |
| | | | | | | | | |
Energy - 10.8% |
CONSOL Energy, Inc.* | | | 53,286 | | | | 517,940 | |
Green Plains, Inc.* | | | 17,917 | | | | 485,013 | |
SunCoke Energy, Inc. | | | 67,401 | | | | 472,481 | |
ProPetro Holding Corp.* | | | 34,970 | | | | 372,780 | |
Matrix Service Co.* | | | 26,574 | | | | 348,385 | |
SM Energy Co. | | | 17,964 | | | | 294,071 | |
Helix Energy Solutions Group, Inc.* | | | 57,934 | | | | 292,567 | |
Callon Petroleum Co.*,1 | | | 7,220 | | | | 278,331 | |
Talos Energy, Inc.* | | | 19,829 | | | | 238,741 | |
US Silica Holdings, Inc.* | | | 16,903 | | | | 207,738 | |
PBF Energy, Inc. — Class A* | | | 12,679 | | | | 179,408 | |
NOW, Inc.* | | | 13,756 | | | | 138,798 | |
Nabors Industries Ltd.*,1 | | | 1,483 | | | | 138,586 | |
Oil States International, Inc.* | | | 19,773 | | | | 119,231 | |
Penn Virginia Corp.* | | | 8,147 | | | | 109,170 | |
Bristow Group, Inc.* | | | 3,594 | | | | 93,013 | |
Warrior Met Coal, Inc. | | | 4,206 | | | | 72,049 | |
Total Energy | | | | | | | 4,358,302 | |
| | | | | | | | | |
Basic Materials - 5.1% |
Mercer International, Inc. | | | 22,749 | | | | 327,358 | |
AdvanSix, Inc.* | | | 12,169 | | | | 326,373 | |
Clearwater Paper Corp.* | | | 8,170 | | | | 307,355 | |
Rayonier Advanced Materials, Inc.* | | | 33,492 | | | | 303,772 | |
Carpenter Technology Corp. | | | 7,150 | | | | 294,222 | |
Koppers Holdings, Inc.* | | | 7,972 | | | | 277,107 | |
Allegheny Technologies, Inc.* | | | 7,070 | | | | 148,894 | |
Glatfelter Corp. | | | 4,577 | | | | 78,496 | |
Total Basic Materials | | | | | | | 2,063,577 | |
| | | | | | | | | |
Communications - 4.0% |
Consolidated Communications Holdings, Inc.* | | | 57,887 | | | | 416,786 | |
Scholastic Corp. | | | 9,828 | | | | 295,921 | |
EW Scripps Co. — Class A | | | 13,246 | | | | 255,250 | |
AMC Networks, Inc. — Class A* | | | 3,012 | | | | 160,118 | |
Spok Holdings, Inc. | | | 13,578 | | | | 142,433 | |
Gannett Company, Inc.* | | | 25,263 | | | | 135,915 | |
NETGEAR, Inc.* | | | 2,365 | | | | 97,202 | |
ePlus, Inc.* | | | 882 | | | | 87,883 | |
Total Communications | | | | | | | 1,591,508 | |
| | | | | | | | | |
Technology - 1.0% |
Insight Enterprises, Inc.* | | | 2,954 | | | | 281,871 | |
MTS Systems Corp.* | | | 1,623 | | | | 94,458 | |
BM Technologies, Inc.* | | | 428 | | | | 4,986 | |
Total Technology | | | | | | | 381,315 | |
| | | | | | | | | |
Total Common Stocks | | | | |
(Cost $35,306,115) | | | | | | | 39,581,968 | |
| | | | | | | | | |
| | | Face
Amount | | | | | |
REPURCHASE AGREEMENTS††,2 - 0.8% |
J.P. Morgan Securities LLC
issued 03/31/21 at 0.01%
due 04/01/21 | | $ | 176,712 | | | | 176,712 | |
Barclays Capital, Inc.
issued 03/31/21 at 0.01%
due 04/01/21 | | | 80,342 | | | | 80,342 | |
BofA Securities, Inc.
issued 03/31/21 at 0.01%
due 04/01/21 | | | 73,325 | | | | 73,325 | |
Total Repurchase Agreements | | | | |
(Cost $330,379) | | | | | | | 330,379 | |
| | | | | | | | | |
SEE NOTES TO FINANCIAL STATEMENTS. | THE RYDEX FUNDS ANNUAL REPORT | 55 |
SCHEDULE OF INVESTMENTS (concluded) | March 31, 2021 |
S&P SMALLCAP 600® PURE VALUE FUND | |
| | Shares | | | Value | |
SECURITIES LENDING COLLATERAL†,3 - 0.8% |
Money Market Fund | | | | | | | | |
First American Government Obligations Fund — Class Z, 0.03%4 | | | 332,723 | | | $ | 332,723 | |
Total Securities Lending Collateral | | | | |
(Cost $332,723) | | | | | | | 332,723 | |
| | | | | | | | | |
Total Investments - 100.1% | | | | |
(Cost $35,969,217) | | $ | 40,245,070 | |
Other Assets & Liabilities, net - (0.1)% | | | (31,640 | ) |
Total Net Assets - 100.0% | | $ | 40,213,430 | |
* | Non-income producing security. |
† | Value determined based on Level 1 inputs — See Note 4. |
†† | Value determined based on Level 2 inputs — See Note 4. |
1 | All or a portion of this security is on loan at March 31, 2021 — See Note 7. |
2 | Repurchase Agreements — See Note 6. |
3 | Securities lending collateral — See Note 7. |
4 | Rate indicated is the 7-day yield as of March 31, 2021. |
| | REIT — Real Estate Investment Trust |
| | |
| | See Sector Classification in Other Information section. |
The following table summarizes the inputs used to value the Fund’s investments at March 31, 2021 (See Note 4 in the Notes to Financial Statements):
Investments in Securities (Assets) | | Level 1
Quoted
Prices | | | Level 2
Significant
Observable
Inputs | | | Level 3
Significant
Unobservable
Inputs | | | Total | |
Common Stocks | | $ | 39,581,968 | | | $ | — | | | $ | — | | | $ | 39,581,968 | |
Repurchase Agreements | | | — | | | | 330,379 | | | | — | | | | 330,379 | |
Securities Lending Collateral | | | 332,723 | | | | — | | | | — | | | | 332,723 | |
Total Assets | | $ | 39,914,691 | | | $ | 330,379 | | | $ | — | | | $ | 40,245,070 | |
56 | THE RYDEX FUNDS ANNUAL REPORT | SEE NOTES TO FINANCIAL STATEMENTS. |
S&P SMALLCAP 600® PURE VALUE FUND | |
STATEMENT OF ASSETS AND LIABILITIES |
March 31, 2021 |
Assets: |
Investments, at value - including $330,025 of securities loaned (cost $35,638,838) | | $ | 39,914,691 | |
Repurchase agreements, at value (cost $330,379) | | | 330,379 | |
Receivables: |
Fund shares sold | | | 445,070 | |
Dividends | | | 30,590 | |
Securities lending income | | | 142 | |
Total assets | | | 40,720,872 | |
| | | | | |
Liabilities: |
Payable for: |
Return of securities lending collateral | | | 332,723 | |
Management fees | | | 42,995 | |
Fund shares redeemed | | | 15,985 | |
Transfer agent and administrative fees | | | 15,421 | |
Distribution and service fees | | | 15,074 | |
Portfolio accounting fees | | | 5,733 | |
Trustees’ fees* | | | 1,112 | |
Miscellaneous | | | 78,399 | |
Total liabilities | | | 507,442 | |
Commitments and contingent liabilities (Note 12) | | | — | |
Net assets | | $ | 40,213,430 | |
| | | | | |
Net assets consist of: |
Paid in capital | | $ | 50,249,965 | |
Total distributable earnings (loss) | | | (10,036,535 | ) |
Net assets | | $ | 40,213,430 | |
| | | | | |
A-Class: |
Net assets | | $ | 3,242,145 | |
Capital shares outstanding | | | 19,301 | |
Net asset value per share | | $ | 167.98 | |
Maximum offering price per share (Net asset value divided by 95.25%) | | $ | 176.36 | |
| | | | | |
C-Class: |
Net assets | | $ | 1,472,491 | |
Capital shares outstanding | | | 10,388 | |
Net asset value per share | | $ | 141.75 | |
| | | | | |
H-Class: |
Net assets | | $ | 35,498,794 | |
Capital shares outstanding | | | 211,861 | |
Net asset value per share | | $ | 167.56 | |
STATEMENT OF OPERATIONS |
Year Ended March 31, 2021 |
Investment Income: |
Dividends (net of foreign withholding tax of $254) | | $ | 168,282 | |
Interest | | | 28 | |
Income from securities lending, net | | | 6,918 | |
Total investment income | | | 175,228 | |
| | | | | |
Expenses: |
Management fees | | | 96,915 | |
Distribution and service fees: |
A-Class | | | 2,972 | |
C-Class | | | 6,129 | |
H-Class | | | 27,800 | |
Transfer agent and administrative fees | | | 35,374 | |
Portfolio accounting fees | | | 12,923 | |
Professional fees | | | 2,943 | |
Custodian fees | | | 1,700 | |
Trustees’ fees* | | | 1,161 | |
Line of credit fees | | | 32 | |
Miscellaneous | | | 17,609 | |
Total expenses | | | 205,558 | |
Net investment loss | | | (30,330 | ) |
| | | | | |
Net Realized and Unrealized Gain (Loss): |
Net realized gain (loss) on: |
Investments | | | (6,205,696 | ) |
Net realized loss | | | (6,205,696 | ) |
Net change in unrealized appreciation (depreciation) on: |
Investments | | | 4,636,470 | |
Net change in unrealized appreciation (depreciation) | | | 4,636,470 | |
Net realized and unrealized loss | | | (1,569,226 | ) |
Net decrease in net assets resulting from operations | | $ | (1,599,556 | ) |
* | Relates to Trustees not deemed “interested persons” within the meaning of Section 2(a)(19) of the 1940 Act. |
SEE NOTES TO FINANCIAL STATEMENTS. | THE RYDEX FUNDS ANNUAL REPORT | 57 |
S&P SMALLCAP 600® PURE VALUE FUND | |
STATEMENTS OF CHANGES IN NET ASSETS |
| | Year Ended
March 31,
2021 | | | Year Ended
March 31,
2020 | |
Increase (Decrease) in Net Assets from Operations: | | | | | | | | |
Net investment loss | | $ | (30,330 | ) | | $ | (52,458 | ) |
Net realized loss on investments | | | (6,205,696 | ) | | | (777,560 | ) |
Net change in unrealized appreciation (depreciation) on investments | | | 4,636,470 | | | | (1,353,130 | ) |
Net decrease in net assets resulting from operations | | | (1,599,556 | ) | | | (2,183,148 | ) |
| | | | | | | | | |
Capital share transactions: | | | | | | | | |
Proceeds from sale of shares | | | | | | | | |
A-Class | | | 2,465,579 | | | | 1,507,622 | |
C-Class | | | 1,663,534 | | | | 873,764 | |
H-Class | | | 203,832,028 | | | | 136,769,330 | |
Cost of shares redeemed | | | | | | | | |
A-Class | | | (1,084,818 | ) | | | (1,281,826 | ) |
C-Class | | | (1,347,358 | ) | | | (1,203,729 | ) |
H-Class | | | (166,730,073 | ) | | | (142,913,535 | ) |
Net increase (decrease) from capital share transactions | | | 38,798,892 | | | | (6,248,374 | ) |
Net increase (decrease) in net assets | | | 37,199,336 | | | | (8,431,522 | ) |
| | | | | | | | | |
Net assets: | | | | | | | | |
Beginning of year | | | 3,014,094 | | | | 11,445,616 | |
End of year | | $ | 40,213,430 | | | $ | 3,014,094 | |
| | | | | | | | | |
Capital share activity:* | | | | | | | | |
Shares sold | | | | | | | | |
A-Class | | | 15,794 | | | | 13,594 | |
C-Class | | | 14,505 | | | | 11,634 | |
H-Class | | | 1,508,948 | | | | 1,100,304 | |
Shares redeemed | | | | | | | | |
A-Class | | | (10,365 | ) | | | (10,001 | ) |
C-Class | | | (14,088 | ) | | | (11,191 | ) |
H-Class | | | (1,319,497 | ) | | | (1,148,134 | ) |
Net increase (decrease) in shares | | | 195,297 | | | | (43,794 | ) |
* | Capital share activity for the year ended March 31, 2020 has been restated to reflect a 1:5 reverse share split effective August 17, 2020 — See Note 11. |
58 | THE RYDEX FUNDS ANNUAL REPORT | SEE NOTES TO FINANCIAL STATEMENTS. |
S&P SMALLCAP 600® PURE VALUE FUND | |
This table is presented to show selected data for a share outstanding throughout each period and to assist shareholders in evaluating a Fund’s performance for the periods presented.
A-Class | | Year Ended
March 31,
2021 | | | Year Ended
March 31,
2020c | | | Year Ended
March 31,
2019c | | | Year Ended
March 29,
2018c | | | Year Ended
March 31,
2017c | |
Per Share Data |
Net asset value, beginning of period | | $ | 67.45 | | | $ | 129.32 | | | $ | 138.22 | | | $ | 136.22 | | | $ | 115.78 | |
Income (loss) from investment operations: |
Net investment income (loss)a | | | (.14 | ) | | | (.50 | ) | | | .30 | | | | (.40 | ) | | | (.70 | ) |
Net gain (loss) on investments (realized and unrealized) | | | 100.67 | d | | | (61.37 | ) | | | (9.20 | ) | | | 2.40 | | | | 21.14 | |
Total from investment operations | | | 100.53 | | | | (61.87 | ) | | | (8.90 | ) | | | 2.00 | | | | 20.44 | |
Net asset value, end of period | | $ | 167.98 | | | $ | 67.45 | | | $ | 129.32 | | | $ | 138.22 | | | $ | 136.22 | |
|
Total Returnb | | | 149.04 | % | | | (47.83 | %) | | | (6.44 | %) | | | 1.47 | % | | | 17.62 | % |
Ratios/Supplemental Data |
Net assets, end of period (in thousands) | | $ | 3,242 | | | $ | 936 | | | $ | 1,329 | | | $ | 762 | | | $ | 1,720 | |
Ratios to average net assets: |
Net investment income (loss) | | | (0.31 | %) | | | (0.42 | %) | | | 0.21 | % | | | (0.30 | %) | | | (0.50 | %) |
Total expenses | | | 1.59 | % | | | 1.63 | % | | | 1.62 | % | | | 1.53 | % | | | 1.53 | % |
Portfolio turnover rate | | | 1,503 | % | | | 1,104 | % | | | 534 | % | | | 1,832 | % | | | 1,449 | % |
C-Class | | Year Ended
March 31,
2021 | | | Year Ended
March 31,
2020c | | | Year Ended
March 31,
2019c | | | Year Ended
March 29,
2018c | | | Year Ended
March 31,
2017c | |
Per Share Data |
Net asset value, beginning of period | | $ | 57.31 | | | $ | 110.69 | | | $ | 119.22 | | | $ | 118.40 | | | $ | 101.41 | |
Income (loss) from investment operations: |
Net investment income (loss)a | | | (.40 | ) | | | (1.25 | ) | | | (.65 | ) | | | (1.05 | ) | | | (1.40 | ) |
Net gain (loss) on investments (realized and unrealized) | | | 84.84 | d | | | (52.13 | ) | | | (7.88 | ) | | | 1.87 | | | | 18.39 | |
Total from investment operations | | | 84.44 | | | | (53.38 | ) | | | (8.53 | ) | | | .82 | | | | 16.99 | |
Net asset value, end of period | | $ | 141.75 | | | $ | 57.31 | | | $ | 110.69 | | | $ | 119.22 | | | $ | 118.40 | |
|
Total Returnb | | | 147.34 | % | | | (48.24 | %) | | | (7.13 | %) | | | 0.68 | % | | | 16.77 | % |
Ratios/Supplemental Data |
Net assets, end of period (in thousands) | | $ | 1,472 | | | $ | 571 | | | $ | 1,055 | | | $ | 1,532 | | | $ | 1,778 | |
Ratios to average net assets: |
Net investment income (loss) | | | (1.07 | %) | | | (1.20 | %) | | | (0.53 | %) | | | (0.90 | %) | | | (1.26 | %) |
Total expenses | | | 2.34 | % | | | 2.38 | % | | | 2.36 | % | | | 2.28 | % | | | 2.28 | % |
Portfolio turnover rate | | | 1,503 | % | | | 1,104 | % | | | 534 | % | | | 1,832 | % | | | 1,449 | % |
SEE NOTES TO FINANCIAL STATEMENTS. | THE RYDEX FUNDS ANNUAL REPORT | 59 |
S&P SMALLCAP 600® PURE VALUE FUND | |
FINANCIAL HIGHLIGHTS (concluded) |
This table is presented to show selected data for a share outstanding throughout each period and to assist shareholders in evaluating a Fund’s performance for the periods presented.
H-Class | | Year Ended
March 31,
2021 | | | Year Ended
March 31,
2020c | | | Year Ended
March 31,
2019c | | | Year Ended
March 29,
2018c | | | Year Ended
March 31,
2017c | |
Per Share Data |
Net asset value, beginning of period | | $ | 67.25 | | | $ | 129.01 | | | $ | 137.86 | | | $ | 135.65 | | | $ | 115.35 | |
Income (loss) from investment operations: |
Net investment income (loss)a | | | (.13 | ) | | | (.55 | ) | | | .10 | | | | (.45 | ) | | | (.60 | ) |
Net gain (loss) on investments (realized and unrealized) | | | 100.44 | d | | | (61.21 | ) | | | (8.95 | ) | | | 2.66 | | | | 20.90 | |
Total from investment operations | | | 100.31 | | | | (61.76 | ) | | | (8.85 | ) | | | 2.21 | | | | 20.30 | |
Net asset value, end of period | | $ | 167.56 | | | $ | 67.25 | | | $ | 129.01 | | | $ | 137.86 | | | $ | 135.65 | |
|
Total Return | | | 149.16 | % | | | (47.87 | %) | | | (6.42 | %) | | | 1.62 | % | | | 17.60 | % |
Ratios/Supplemental Data |
Net assets, end of period (in thousands) | | $ | 35,499 | | | $ | 1,507 | | | $ | 9,062 | | | $ | 7,595 | | | $ | 19,782 | |
Ratios to average net assets: |
Net investment income (loss) | | | (0.18 | %) | | | (0.44 | %) | | | 0.06 | % | | | (0.32 | %) | | | (0.47 | %) |
Total expenses | | | 1.55 | % | | | 1.64 | % | | | 1.62 | % | | | 1.53 | % | | | 1.53 | % |
Portfolio turnover rate | | | 1,503 | % | | | 1,104 | % | | | 534 | % | | | 1,832 | % | | | 1,449 | % |
a | Net investment income (loss) per share was computed using average shares outstanding throughout the period. |
b | Total return does not reflect the impact of any applicable sales charges. |
c | Reverse share split — Per share amounts for the years presented through March 31, 2020 have been restated to reflect a 1:5 reverse share split effective August 17, 2020 — See Note 11. |
d | The amount shown for a share outstanding throughout the year does not agree with the aggregate net loss on investments for the year because of the sales and repurchases of fund shares in relation to fluctuating market value of the investments of the Fund. |
60 | THE RYDEX FUNDS ANNUAL REPORT | SEE NOTES TO FINANCIAL STATEMENTS. |
PERFORMANCE REPORT AND FUND PROFILE (Unaudited) | March 31, 2021 |
EUROPE 1.25x STRATEGY FUND
OBJECTIVE: Seeks to provide investment results that correlate, before fees and expenses, to the performance of a specific benchmark. The Fund’s current benchmark is 125% of the fair value of the STOXX Europe 50® Index (the “underlying index”).
For the one year period ended March 31, 2021, Europe 1.25x Strategy Fund maintained a daily correlation of over 98% to its benchmark of 125% of the daily price movement of the underlying index. Europe 1.25x Strategy Fund H-Class returned 42.96% while the underlying index returned 33.63% over the same period.
The sectors contributing most to the return of the underlying index for the period were Consumer Discretionary, Industrials, and Information Technology. The only sector to detract was Real Estate.
The holdings contributing the most to the return of the underlying index for the period were ASML Holding N.V. - Class G, LVMH Moet Hennessy Louis Vuitton SE, and Siemens AG. The holdings detracting the most from return were Wirecard AG, BP plc, and HSBC Holdings plc.
Derivatives in the Fund were used to help provide exposure to the composition of the benchmark in the highest efficient manner and to provide leverage, not for hedging purposes. The results of derivatives use during the period were within our expectations and were a factor in the Fund’s positive performance.
Due to the compounding of daily returns, leveraged and inverse funds’ returns over periods other than one day will likely differ in amount and possibly direction from the benchmark return for the same period. Investors should monitor their leveraged and inverse funds’ holdings to ensure that they are consistent with their strategies, as frequently as daily.
The effects of compounding may cause the longer-term correlation of the Fund to its benchmark to diminish. The apparent discrepancy between the leveraged and unleveraged indices is the result of compounding, which is described briefly on page 6 of this report.
The Fund may invest in certain of the underlying series of Guggenheim Funds Trust and Guggenheim Strategy Funds Trust, including Guggenheim Ultra Short Duration, Guggenheim Strategy Fund II and Guggenheim Strategy Fund III (collectively, the “Short Term Investment Vehicles”), each of which are open-end management investment companies managed by Guggenheim Investments. The Short Term Investment Vehicles, which launched on March 11, 2014, are offered as short term investment options only to mutual funds, trusts, and other accounts managed by Guggenheim Investments and/or its affiliates, and are not available to the public, with the exception of Guggenheim Ultra Short Duration Fund, which is available to the public. Guggenheim Strategy Fund II and Guggenheim Strategy Fund III do not charge an investment management fee. Guggenheim Ultra Short Duration Fund charges an investment management fee but the Fund’s adviser has agreed to waive fees to the extent necessary to offset the proportionate share of any management fee paid by the Fund with respect to its investment in Guggenheim Ultra Short Duration Fund. For the one year period ended March 31, 2021, investment in the Short Term Investment Vehicles benefited Fund performance.
Performance displayed represents past performance, which is no guarantee of future results.
Holdings Diversification (Market Exposure as % of Net Assets)
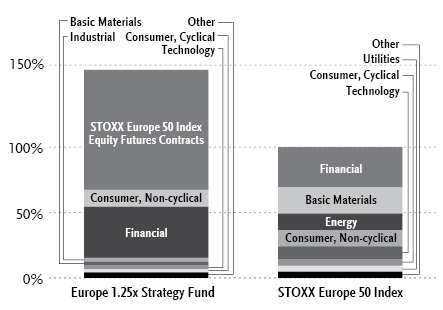
“Holdings Diversification (Market Exposure as % of Net Assets)” excludes any temporary cash investments, investments in Guggenheim Strategy Funds Trust mutual funds, or investments in Guggenheim Ultra Short Duration Fund. Investments in those Funds do not provide “market exposure” to meet the Fund’s investment objective, but will significantly increase the portfolio’s exposure to certain other asset categories (and their associated risks), which may cause the Fund to deviate from its principal investment strategy, including: (i) high yield, high risk debt securities rated below the top four long-term rating categories by a nationally recognized statistical rating organization (also known as “junk bonds”); (ii) securities issued by the U.S. government or its agencies and instrumentalities; (iii) CLOs and similar investments; and (iv) other short-term fixed income securities.
| | THE RYDEX FUNDS ANNUAL REPORT | 61 |
PERFORMANCE REPORT AND FUND PROFILE (Unaudited)(concluded) | March 31, 2021 |
Inception Dates: |
A-Class | March 31, 2004 |
C-Class | May 10, 2001 |
H-Class | May 8, 2000 |
Country Diversification
Country | % of
Long-Term
Investments |
United Kingdom | 28.8% |
France | 21.4% |
Switzerland | 19.6% |
Germany | 14.6% |
Netherlands | 6.8% |
Italy | 2.6% |
Denmark | 2.4% |
Other | 3.8% |
Total Long-Term Investments | 100.0% |
Ten Largest Holdings (% of Total Net Assets) |
Guggenheim Strategy Fund II | 16.5% |
Guggenheim Ultra Short Duration Fund — Institutional Class | 16.4% |
Nestle S.A. ADR | 2.2% |
ASML Holding N.V. — Class G | 1.8% |
Roche Holding AG ADR | 1.5% |
Novartis AG ADR | 1.4% |
LVMH Moet Hennessy Louis Vuitton SE ADR | 1.2% |
Unilever plc ADR | 1.0% |
Linde plc | 1.0% |
SAP SE ADR | 0.9% |
Top Ten Total | 43.9% |
| | |
“Ten Largest Holdings” excludes any temporary cash or derivative investments. |
Cumulative Fund Performance*
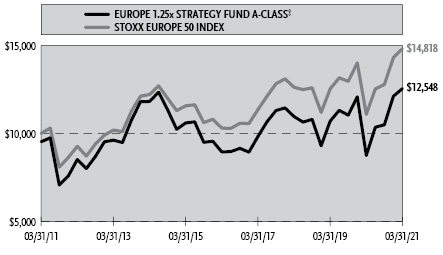

Average Annual Returns*
Periods Ended March 31, 2021
| 1 Year | 5 Year | 10 Year |
A-Class Shares | 43.39% | 7.00% | 2.79% |
A-Class Shares with sales charge‡ | 36.57% | 5.97% | 2.30% |
C-Class Shares | 41.93% | 6.18% | 1.92% |
C-Class Shares with CDSC§ | 40.93% | 6.18% | 1.92% |
H-Class Shares | 42.96% | 6.99% | 2.69% |
STOXX Europe 50 Index | 33.63% | 7.54% | 4.01% |
* | The performance data above represents past performance that is not predictive of future results. The investment return and principal value of an investment in the Fund will fluctuate so that an investor’s shares, when redeemed, may be worth more or less than their original cost. Returns are historical and include changes in principal and reinvested dividends and capital gains and do not reflect the effect of taxes. The STOXX Europe 50 Index is an unmanaged index and, unlike the Fund, has no management fees or operating expenses to reduce its reported return. The graphs are based on A-Class and H-Class shares only; performance for C-Class shares will vary due to differences in fee structure. |
‡ | Fund returns are calculated using the maximum sales charge of 4.75%. |
§ | Fund returns include a CDSC of 1% if redeemed within 12 months of purchase. |
62 | THE RYDEX FUNDS ANNUAL REPORT | |
SCHEDULE OF INVESTMENTS | March 31, 2021 |
EUROPE 1.25x STRATEGY FUND | |
| | Shares | | | Value | |
COMMON STOCKS† - 32.3% |
| | | | | | | | | |
Consumer, Non-cyclical - 13.0% |
Nestle S.A. ADR | | | 327 | | | $ | 36,464 | |
Roche Holding AG ADR | | | 639 | | | | 25,918 | |
Novartis AG ADR | | | 281 | | | | 24,020 | |
Unilever plc ADR | | | 298 | | | | 16,637 | |
AstraZeneca plc ADR1 | | | 299 | | | | 14,866 | |
Novo Nordisk A/S ADR | | | 192 | | | | 12,945 | |
Sanofi ADR | | | 259 | | | | 12,810 | |
Diageo plc ADR | | | 66 | | | | 10,838 | |
L’Oreal S.A. ADR | | | 139 | | | | 10,653 | |
GlaxoSmithKline plc ADR | | | 283 | | | | 10,100 | |
British American Tobacco plc ADR | | | 243 | | | | 9,414 | |
Reckitt Benckiser Group plc ADR | | | 411 | | | | 7,476 | |
Adyen N.V. ADR* | | | 159 | | | | 7,112 | |
Bayer AG ADR | | | 447 | | | | 7,098 | |
Anheuser-Busch InBev S.A. ADR | | | 96 | | | | 6,034 | |
RELX plc ADR | | | 224 | | | | 5,636 | |
Total Consumer, Non-cyclical | | | | | | | 218,021 | |
| | | | | | | | | |
Financial - 3.9% |
HSBC Holdings plc ADR | | | 471 | | | | 13,725 | |
Allianz SE ADR | | | 469 | | | | 11,997 | |
BNP Paribas S.A. ADR*,1 | | | 262 | | | | 8,017 | |
Zurich Insurance Group AG ADR | | | 171 | | | | 7,341 | |
AXA S.A. ADR | | | 235 | | | | 6,359 | |
Prudential plc ADR1 | | | 148 | | | | 6,318 | |
UBS Group AG | | | 403 | | | | 6,259 | |
Intesa Sanpaolo SpA ADR* | | | 345 | | | | 5,628 | |
Total Financial | | | | | | | 65,644 | |
| | | | | | | | | |
Industrial - 3.0% |
Siemens AG ADR1 | | | 170 | | | | 13,990 | |
Schneider Electric SE ADR | | | 322 | | | | 9,795 | |
Airbus SE ADR* | | | 263 | | | | 7,466 | |
Vinci S.A. ADR | | | 269 | | | | 6,935 | |
ABB Ltd. ADR | | | 203 | | | | 6,186 | |
Safran S.A. ADR* | | | 173 | | | | 5,889 | |
Total Industrial | | | | | | | 50,261 | |
| | | | | | | | | |
Basic Materials - 3.0% |
Linde plc | | | 59 | | | | 16,529 | |
Rio Tinto plc ADR | | | 120 | | | | 9,318 | |
Air Liquide S.A. ADR | | | 269 | | | | 8,788 | |
BASF SE ADR | | | 417 | | | | 8,636 | |
BHP Group plc ADR | | | 120 | | | | 6,943 | |
Total Basic Materials | | | | | | | 50,214 | |
| | | | | | | | | |
Technology - 2.7% |
ASML Holding N.V. — Class G | | | 48 | | | | 29,633 | |
SAP SE ADR1 | | | 124 | | | | 15,226 | |
Total Technology | | | | | | | 44,859 | |
| | | | | | | | | |
Consumer, Cyclical - 2.4% |
LVMH Moet Hennessy Louis Vuitton SE ADR | | | 150 | | | | 20,076 | |
Daimler AG ADR | | | 383 | | | | 8,514 | |
Adidas AG ADR*,1 | | | 42 | | | | 6,594 | |
Kering S.A. ADR | | | 83 | | | | 5,730 | |
Total Consumer, Cyclical | | | | | | | 40,914 | |
| | | | | | | | | |
Energy - 1.9% |
Total SE ADR | | | 298 | | | | 13,869 | |
BP plc ADR | | | 384 | | | | 9,350 | |
Royal Dutch Shell plc — Class A ADR | | | 233 | | | | 9,136 | |
Total Energy | | | | | | | 32,355 | |
| | | | | | | | | |
Utilities - 1.3% |
Enel SpA ADR | | | 884 | | | | 8,752 | |
Iberdrola S.A. ADR1 | | | 167 | | | | 8,635 | |
National Grid plc ADR | | | 80 | | | | 4,739 | |
Total Utilities | | | | | | | 22,126 | |
| | | | | | | | | |
Communications - 1.1% |
Deutsche Telekom AG ADR | | | 368 | | | | 7,448 | |
Prosus N.V. ADR | | | 253 | | | | 5,624 | |
Vodafone Group plc ADR | | | 301 | | | | 5,548 | |
Total Communications | | | | | | | 18,620 | |
| | | | | | | | | |
Total Common Stocks | | | | |
(Cost $482,806) | | | | | | | 543,014 | |
| | | | | | | | | |
MUTUAL FUNDS† - 32.9% |
Guggenheim Strategy Fund II2 | | | 11,082 | | | | 276,836 | |
Guggenheim Ultra Short Duration Fund — Institutional Class2 | | | 27,782 | | | | 276,705 | |
Total Mutual Funds | | | | |
(Cost $552,516) | | | | | | | 553,541 | |
| | | | | | | | | |
| | | Face
Amount | | | | | |
U.S. TREASURY BILLS†† - 12.3% |
U.S. Treasury Bills |
0.01% due 04/22/213,4 | | $ | 207,000 | | | | 206,999 | |
Total U.S. Treasury Bills | | | | |
(Cost $206,998) | | | | | | | 206,999 | |
| | | | | | | | | |
REPURCHASE AGREEMENTS††,5 - 31.4% |
J.P. Morgan Securities LLC
issued 03/31/21 at 0.01%
due 04/01/21 | | | 282,219 | | | | 282,219 | |
Barclays Capital, Inc.
issued 03/31/21 at 0.01%
due 04/01/21 | | | 128,311 | | | | 128,311 | |
BofA Securities, Inc.
issued 03/31/21 at 0.01%
due 04/01/21 | | | 117,103 | | | | 117,103 | |
Total Repurchase Agreements | | | | |
(Cost $527,633) | | | | | | | 527,633 | |
| | | | | | | | | |
SEE NOTES TO FINANCIAL STATEMENTS. | THE RYDEX FUNDS ANNUAL REPORT | 63 |
SCHEDULE OF INVESTMENTS (continued) | March 31, 2021 |
EUROPE 1.25x STRATEGY FUND | |
| | Shares | | | Value | |
SECURITIES LENDING COLLATERAL†,6 - 1.8% |
Money Market Fund | | | | | | | | |
First American Government Obligations Fund — Class Z, 0.03%7 | | | 30,559 | | | $ | 30,559 | |
Total Securities Lending Collateral | | | | |
(Cost $30,559) | | | | | | | 30,559 | |
| | | | | | | | | |
Total Investments - 110.7% | | | | |
(Cost $1,800,512) | | $ | 1,861,746 | |
Other Assets & Liabilities, net - (10.7)% | | | (180,701 | ) |
Total Net Assets - 100.0% | | $ | 1,681,045 | |
Futures Contracts |
Description | | Number of
Contracts | | | Expiration
Date | | | Notional
Amount | | | Value and
Unrealized
Appreciation
(Depreciation)** | |
Equity Futures Contracts Purchased† |
STOXX Europe 50 Index Futures Contracts | | | 40 | | | | Jun 2021 | | | $ | 1,541,979 | | | $ | 25,568 | |
Currency Futures Contracts Purchased† |
Euro FX Futures Contracts | | | 11 | | | | Jun 2021 | | | | 1,614,663 | | | | (15,786 | ) |
* | Non-income producing security. |
** | Includes cumulative appreciation (depreciation). Variation margin is reported within the Statement of Assets and Liabilities. |
† | Value determined based on Level 1 inputs — See Note 4. |
†† | Value determined based on Level 2 inputs — See Note 4. |
1 | All or a portion of this security is on loan at March 31, 2021 — See Note 7. |
2 | Affiliated issuer. |
3 | All or a portion of this security is pledged as futures collateral at March 31, 2021. |
4 | Rate indicated is the effective yield at the time of purchase. |
5 | Repurchase Agreements — See Note 6. |
6 | Securities lending collateral — See Note 7. |
7 | Rate indicated is the 7-day yield as of March 31, 2021. |
| | ADR — American Depositary Receipt |
| | plc — Public Limited Company |
| | |
| | See Sector Classification in Other Information section. |
64 | THE RYDEX FUNDS ANNUAL REPORT | SEE NOTES TO FINANCIAL STATEMENTS. |
SCHEDULE OF INVESTMENTS (concluded) | March 31, 2021 |
EUROPE 1.25x STRATEGY FUND | |
The following table summarizes the inputs used to value the Fund’s investments at March 31, 2021 (See Note 4 in the Notes to Financial Statements):
Investments in Securities (Assets) | | Level 1
Quoted
Prices | | | Level 2
Significant
Observable
Inputs | | | Level 3
Significant
Unobservable
Inputs | | | Total | |
Common Stocks | | $ | 543,014 | | | $ | — | | | $ | — | | | $ | 543,014 | |
Mutual Funds | | | 553,541 | | | | — | | | | — | | | | 553,541 | |
U.S. Treasury Bills | | | — | | | | 206,999 | | | | — | | | | 206,999 | |
Repurchase Agreements | | | — | | | | 527,633 | | | | — | | | | 527,633 | |
Securities Lending Collateral | | | 30,559 | | | | — | | | | — | | | | 30,559 | |
Equity Futures Contracts** | | | 25,568 | | | | — | | | | — | | | | 25,568 | |
Total Assets | | $ | 1,152,682 | | | $ | 734,632 | | | $ | — | | | $ | 1,887,314 | |
Investments in Securities (Liabilities) | | Level 1
Quoted
Prices | | | Level 2
Significant
Observable
Inputs | | | Level 3
Significant
Unobservable
Inputs | | | Total | |
Currency Futures Contracts** | | $ | 15,786 | | | $ | — | | | $ | — | | | $ | 15,786 | |
** | This derivative is reported as unrealized appreciation/depreciation at period end. |
Affiliated Transactions
Investments representing 5% or more of the outstanding voting shares of a company, or control of or by, or common control under Guggenheim Investments (“GI”), result in that company being considered an affiliated issuer, as defined in the 1940 Act.
The Fund may invest in certain of the underlying series of Guggenheim Strategy Funds Trust, including Guggenheim Strategy Fund II and Guggenheim Strategy Fund III, (collectively, the “Short Term Investment Vehicles”), each of which are open-end management investment companies managed by GI. The Short Term Investment Vehicles, which launched on March 11, 2014, are offered as short term investment options only to mutual funds, trusts, and other accounts managed by GI and/or its affiliates, and are not available to the public. The Short Term Investment Vehicles pay no investment management fees. The Short Term Investment Vehicles’ annual report on Form N-CSR dated September 30, 2020, is available publicly or upon request. This information is available from the EDGAR database on the SEC’s website at https://www.sec.gov/Archives/edgar/data/1601445/000182126820000133/gug81042-ncsr.htm.
Transactions during the year ended March 31, 2021, in which the company is an affiliated issuer, were as follows:
Security Name | | Value
03/31/20 | | | Additions | | | Reductions | | | Realized
Gain (Loss) | | | Change in
Unrealized
Appreciation
(Depreciation) | | | Value
03/31/21 | | | Shares
03/31/21 | | | Investment
Income | |
Mutual Funds | | | | | | | | | | | | | | | | | | | | | | | | | | | | | | | | |
Guggenheim Strategy Fund II | | $ | 269,269 | | | $ | 120,000 | | | $ | (120,000 | ) | | $ | (1,670 | ) | | $ | 9,237 | | | $ | 276,836 | | | | 11,082 | | | $ | 3,214 | |
Guggenheim Ultra Short Duration Fund — Institutional Class | | | 252,254 | | | | 50,000 | | | | (30,000 | ) | | | (304 | ) | | | 4,755 | | | | 276,705 | | | | 27,782 | | | | 2,741 | |
| | | $ | 521,523 | | | $ | 170,000 | | | $ | (150,000 | ) | | $ | (1,974 | ) | | $ | 13,992 | | | $ | 553,541 | | | | | | | $ | 5,955 | |
SEE NOTES TO FINANCIAL STATEMENTS. | THE RYDEX FUNDS ANNUAL REPORT | 65 |
EUROPE 1.25x STRATEGY FUND | |
STATEMENT OF ASSETS AND LIABILITIES |
March 31, 2021 |
Assets: |
Investments in unaffiliated issuers, at value - including $29,827 of securities loaned (cost $720,363) | | $ | 780,572 | |
Investments in affiliated issuers, at value (cost $552,516) | | | 553,541 | |
Repurchase agreements, at value (cost $527,633) | | | 527,633 | |
Receivables: |
Fund shares sold | | | 58,305 | |
Foreign tax reclaims | | | 16,725 | |
Dividends | | | 1,537 | |
Securities lending income | | | 33 | |
Total assets | | | 1,938,346 | |
| | | | | |
Liabilities: |
Overdraft due to custodian bank | | | 6 | |
Payable for: |
Fund shares redeemed | | | 215,610 | |
Return of securities lending collateral | | | 30,559 | |
Variation margin on futures contracts | | | 4,745 | |
Management fees | | | 1,348 | |
Transfer agent and administrative fees | | | 421 | |
Distribution and service fees | | | 406 | |
Portfolio accounting fees | | | 156 | |
Trustees’ fees* | | | 29 | |
Miscellaneous | | | 4,021 | |
Total liabilities | | | 257,301 | |
Commitments and contingent liabilities (Note 12) | | | — | |
Net assets | | $ | 1,681,045 | |
| | | | | |
Net assets consist of: |
Paid in capital | | $ | 1,701,821 | |
Total distributable earnings (loss) | | | (20,776 | ) |
Net assets | | $ | 1,681,045 | |
| | | | | |
A-Class: |
Net assets | | $ | 129,642 | |
Capital shares outstanding | | | 1,371 | |
Net asset value per share | | $ | 94.56 | |
Maximum offering price per share (Net asset value divided by 95.25%) | | $ | 99.28 | |
| | | | | |
C-Class: |
Net assets | | $ | 141,593 | |
Capital shares outstanding | | | 1,818 | |
Net asset value per share | | $ | 77.88 | |
| | | | | |
H-Class: |
Net assets | | $ | 1,409,810 | |
Capital shares outstanding | | | 15,069 | |
Net asset value per share | | $ | 93.56 | |
STATEMENT OF OPERATIONS |
Year Ended March 31, 2021 |
Investment Income: |
Dividends from securities of unaffiliated issuers (net of foreign withholding tax of $1,393) | | $ | 9,149 | |
Dividends from securities of affiliated issuers | | | 5,955 | |
Interest | | | 706 | |
Income from securities lending, net | | | 231 | |
Total investment income | | | 16,041 | |
| | | | | |
Expenses: |
Management fees | | | 17,058 | |
Distribution and service fees: |
A-Class | | | 367 | |
C-Class | | | 683 | |
H-Class | | | 4,200 | |
Transfer agent and administrative fees | | | 5,331 | |
Portfolio accounting fees | | | 1,896 | |
Registration fees | | | 1,728 | |
Professional fees | | | 1,003 | |
Custodian fees | | | 468 | |
Trustees’ fees* | | | 428 | |
Miscellaneous | | | 923 | |
Total expenses | | | 34,085 | |
Less: | | | | |
Expenses waived by Adviser | | | (595 | ) |
Net expenses | | | 33,490 | |
Net investment loss | | | (17,449 | ) |
| | | | | |
Net Realized and Unrealized Gain (Loss): |
Net realized gain (loss) on: |
Investments in unaffiliated issuers | | | (54,116 | ) |
Investments in affiliated issuers | | | (1,974 | ) |
Futures contracts | | | 574,857 | |
Foreign currency transactions | | | 12,656 | |
Net realized gain | | | 531,423 | |
Net change in unrealized appreciation (depreciation) on: |
Investments in unaffiliated issuers | | | 44,284 | |
Investments in affiliated issuers | | | 13,992 | |
Futures contracts | | | (135,207 | ) |
Foreign currency translations | | | (295 | ) |
Net change in unrealized appreciation (depreciation) | | | (77,226 | ) |
Net realized and unrealized gain | | | 454,197 | |
Net increase in net assets resulting from operations | | $ | 436,748 | |
* | Relates to Trustees not deemed “interested persons” within the meaning of Section 2(a)(19) of the 1940 Act. |
66 | THE RYDEX FUNDS ANNUAL REPORT | SEE NOTES TO FINANCIAL STATEMENTS. |
EUROPE 1.25x STRATEGY FUND | |
STATEMENTS OF CHANGES IN NET ASSETS |
| | Year Ended
March 31,
2021 | | | Year Ended
March 31,
2020 | |
Increase (Decrease) in Net Assets from Operations: | | | | | | | | |
Net investment income (loss) | | $ | (17,449 | ) | | $ | 61,455 | |
Net realized gain on investments | | | 531,423 | | | | 140,578 | |
Net change in unrealized appreciation (depreciation) on investments | | | (77,226 | ) | | | (79,364 | ) |
Net increase in net assets resulting from operations | | | 436,748 | | | | 122,669 | |
| | | | | | | | | |
Distributions to shareholders: | | | | | | | | |
A-Class | | | (3,005 | ) | | | (1,228 | ) |
C-Class | | | (864 | ) | | | (1,486 | ) |
H-Class | | | (64,304 | ) | | | (58,704 | ) |
Total distributions to shareholders | | | (68,173 | ) | | | (61,418 | ) |
| | | | | | | | | |
Capital share transactions: | | | | | | | | |
Proceeds from sale of shares | | | | | | | | |
A-Class | | | 12,145,953 | | | | 260,090 | |
C-Class | | | 758,238 | | | | 1,532,352 | |
H-Class | | | 24,728,511 | | | | 341,054,759 | |
Distributions reinvested | | | | | | | | |
A-Class | | | 2,277 | | | | 999 | |
C-Class | | | 864 | | | | 1,157 | |
H-Class | | | 52,203 | | | | 57,686 | |
Cost of shares redeemed | | | | | | | | |
A-Class | | | (12,156,789 | ) | | | (241,632 | ) |
C-Class | | | (963,363 | ) | | | (1,307,652 | ) |
H-Class | | | (25,112,437 | ) | | | (377,010,299 | ) |
Net decrease from capital share transactions | | | (544,543 | ) | | | (35,652,540 | ) |
Net decrease in net assets | | | (175,968 | ) | | | (35,591,289 | ) |
| | | | | | | | | |
Net assets: | | | | | | | | |
Beginning of year | | | 1,857,013 | | | | 37,448,302 | |
End of year | | $ | 1,681,045 | | | $ | 1,857,013 | |
| | | | | | | | | |
Capital share activity: | | | | | | | | |
Shares sold | | | | | | | | |
A-Class | | | 132,762 | | | | 3,600 | |
C-Class | | | 10,252 | | | | 21,584 | |
H-Class | | | 294,697 | | | | 3,874,912 | |
Shares issued from reinvestment of distributions | | | | | | | | |
A-Class | | | 25 | | | | 11 | |
C-Class | | | 12 | | | | 15 | |
H-Class | | | 589 | | | | 633 | |
Shares redeemed | | | | | | | | |
A-Class | | | (134,552 | ) | | | (2,632 | ) |
C-Class | | | (13,530 | ) | | | (16,852 | ) |
H-Class | | | (299,748 | ) | | | (4,296,290 | ) |
Net decrease in shares | | | (9,493 | ) | | | (415,019 | ) |
SEE NOTES TO FINANCIAL STATEMENTS. | THE RYDEX FUNDS ANNUAL REPORT | 67 |
EUROPE 1.25x STRATEGY FUND | |
This table is presented to show selected data for a share outstanding throughout each period and to assist shareholders in evaluating a Fund’s performance for the periods presented.
A-Class | | Year Ended
March 31,
2021 | | | Year Ended
March 31,
2020 | | | Year Ended
March 31,
2019 | | | Year Ended
March 29,
2018 | | | Year Ended
March 31,
2017e | |
Per Share Data |
Net asset value, beginning of period | | $ | 69.30 | | | $ | 85.18 | | | $ | 94.56 | | | $ | 84.99 | | | $ | 78.10 | |
Income (loss) from investment operations: |
Net investment income (loss)a | | | (.93 | ) | | | .63 | | | | 1.70 | | | | .82 | | | | 1.08 | |
Net gain (loss) on investments (realized and unrealized) | | | 30.74 | | | | (16.07 | )f | | | (4.78 | ) | | | 8.99 | | | | 6.51 | |
Total from investment operations | | | 29.81 | | | | (15.44 | ) | | | (3.08 | ) | | | 9.81 | | | | 7.59 | |
Less distributions from: |
Net investment income | | | (4.55 | ) | | | (.44 | ) | | | (6.30 | ) | | | (.24 | ) | | | (.70 | ) |
Total distributions | | | (4.55 | ) | | | (.44 | ) | | | (6.30 | ) | | | (.24 | ) | | | (.70 | ) |
Net asset value, end of period | | $ | 94.56 | | | $ | 69.30 | | | $ | 85.18 | | | $ | 94.56 | | | $ | 84.99 | |
|
Total Returnb | | | 43.39 | % | | | (18.25 | %) | | | (2.32 | %) | | | 11.53 | % | | | 9.83 | % |
Ratios/Supplemental Data |
Net assets, end of period (in thousands) | | $ | 130 | | | $ | 217 | | | $ | 184 | | | $ | 401 | | | $ | 417 | |
Ratios to average net assets: |
Net investment income (loss) | | | (1.10 | %) | | | 0.72 | % | | | 1.89 | % | | | 0.88 | % | | | 1.35 | % |
Total expensesc | | | 1.75 | % | | | 1.77 | % | | | 1.76 | % | | | 1.71 | % | | | 1.72 | % |
Net expensesd | | | 1.73 | % | | | 1.73 | % | | | 1.76 | % | | | 1.71 | % | | | 1.72 | % |
Portfolio turnover rate | | | 534 | % | | | 1,787 | % | | | 1,411 | % | | | 422 | % | | | 1,616 | % |
C-Class | | Year Ended
March 31,
2021 | | | Year Ended
March 31,
2020 | | | Year Ended
March 31,
2019 | | | Year Ended
March 29,
2018 | | | Year Ended
March 31,
2017e | |
Per Share Data |
Net asset value, beginning of period | | $ | 58.24 | | | $ | 72.13 | | | $ | 81.77 | | | $ | 74.07 | | | $ | 68.62 | |
Income (loss) from investment operations: |
Net investment income (loss)a | | | (.96 | ) | | | (.18 | ) | | | .96 | | | | (.09 | ) | | | .35 | |
Net gain (loss) on investments (realized and unrealized) | | | 25.15 | | | | (13.27 | )f | | | (4.30 | ) | | | 8.03 | | | | 5.80 | |
Total from investment operations | | | 24.19 | | | | (13.45 | ) | | | (3.34 | ) | | | 7.94 | | | | 6.15 | |
Less distributions from: |
Net investment income | | | (4.55 | ) | | | (.44 | ) | | | (6.30 | ) | | | (.24 | ) | | | (.70 | ) |
Total distributions | | | (4.55 | ) | | | (.44 | ) | | | (6.30 | ) | | | (.24 | ) | | | (.70 | ) |
Net asset value, end of period | | $ | 77.88 | | | $ | 58.24 | | | $ | 72.13 | | | $ | 81.77 | | | $ | 74.07 | |
|
Total Returnb | | | 41.93 | % | | | (18.79 | %) | | | (3.04 | %) | | | 10.70 | % | | | 9.09 | % |
Ratios/Supplemental Data |
Net assets, end of period (in thousands) | | $ | 142 | | | $ | 296 | | | $ | 24 | | | $ | 187 | | | $ | 840 | |
Ratios to average net assets: |
Net investment income (loss) | | | (1.50 | %) | | | (0.25 | %) | | | 1.22 | % | | | (0.11 | %) | | | 0.50 | % |
Total expensesc | | | 2.58 | % | | | 2.49 | % | | | 2.50 | % | | | 2.46 | % | | | 2.49 | % |
Net expensesd | | | 2.55 | % | | | 2.45 | % | | | 2.50 | % | | | 2.46 | % | | | 2.49 | % |
Portfolio turnover rate | | | 534 | % | | | 1,787 | % | | | 1,411 | % | | | 422 | % | | | 1,616 | % |
68 | THE RYDEX FUNDS ANNUAL REPORT | SEE NOTES TO FINANCIAL STATEMENTS. |
EUROPE 1.25x STRATEGY FUND | |
FINANCIAL HIGHLIGHTS (concluded) |
This table is presented to show selected data for a share outstanding throughout each period and to assist shareholders in evaluating a Fund’s performance for the periods presented.
H-Class | | Year Ended
March 31,
2021 | | | Year Ended
March 31,
2020 | | | Year Ended
March 31,
2019 | | | Year Ended
March 29,
2018 | | | Year Ended
March 31,
2017e | |
Per Share Data |
Net asset value, beginning of period | | $ | 68.79 | | | $ | 84.58 | | | $ | 93.89 | | | $ | 84.38 | | | $ | 77.38 | |
Income (loss) from investment operations: |
Net investment income (loss)a | | | (.74 | ) | | | .58 | | | | 1.26 | | | | 1.02 | | | | .46 | |
Net gain (loss) on investments (realized and unrealized) | | | 30.06 | | | | (15.93 | )f | | | (4.27 | ) | | | 8.73 | | | | 7.24 | |
Total from investment operations | | | 29.32 | | | | (15.35 | ) | | | (3.01 | ) | | | 9.75 | | | | 7.70 | |
Less distributions from: |
Net investment income | | | (4.55 | ) | | | (.44 | ) | | | (6.30 | ) | | | (.24 | ) | | | (.70 | ) |
Total distributions | | | (4.55 | ) | | | (.44 | ) | | | (6.30 | ) | | | (.24 | ) | | | (.70 | ) |
Net asset value, end of period | | $ | 93.56 | | | $ | 68.79 | | | $ | 84.58 | | | $ | 93.89 | | | $ | 84.38 | |
|
Total Return | | | 42.96 | % | | | (18.28 | %) | | | (2.28 | %) | | | 11.55 | % | | | 10.06 | % |
Ratios/Supplemental Data |
Net assets, end of period (in thousands) | | $ | 1,410 | | | $ | 1,344 | | | $ | 37,240 | | | $ | 3,967 | | | $ | 6,439 | |
Ratios to average net assets: |
Net investment income (loss) | | | (0.88 | %) | | | 0.66 | % | | | 1.42 | % | | | 1.09 | % | | | 0.59 | % |
Total expensesc | | | 1.77 | % | | | 1.80 | % | | | 1.76 | % | | | 1.71 | % | | | 1.73 | % |
Net expensesd | | | 1.74 | % | | | 1.76 | % | | | 1.76 | % | | | 1.71 | % | | | 1.73 | % |
Portfolio turnover rate | | | 534 | % | | | 1,787 | % | | | 1,411 | % | | | 422 | % | | | 1,616 | % |
a | Net investment income (loss) per share was computed using average shares outstanding throughout the period. |
b | Total return does not reflect the impact of any applicable sales charges. |
c | Does not include expenses of the underlying funds in which the Fund invests. |
d | Net expense information reflects the expense ratios after expense waivers and reimbursements, as applicable. |
e | Reverse share split — Per share amounts for the year ended March 31, 2017 have been restated to reflect a 1:6 reverse share split effective October 28, 2016. |
f | The amount shown for a share outstanding throughout the year does not agree with the aggregate net gain on investments for the year because of the sales and repurchases of fund shares in relation to fluctuating market value of the investments of the Fund. |
SEE NOTES TO FINANCIAL STATEMENTS. | THE RYDEX FUNDS ANNUAL REPORT | 69 |
PERFORMANCE REPORT AND FUND PROFILE (Unaudited) | March 31, 2021 |
JAPAN 2x STRATEGY FUND
OBJECTIVE: Seeks to provide investment results that correlate, before fees and expenses, to the performance of a specific benchmark. The Fund’s current benchmark is 200% of the fair value of the Nikkei-225 Stock Average Index (the “underlying index”).
For the one year period ended March 31, 2021, Japan 2x Strategy Fund maintained a daily correlation of over 99% to its benchmark of 200% of the daily price movement of the fair value of the underlying index. Japan 2x Strategy Fund H-Class returned 112.94%, while the underlying index returned 50.30% over the same time period.
All sectors contributed to the return of the underlying index for the period, led by Consumer Discretionary, Industrials, and Information Technology.
The holdings contributing the most to the return of the underlying index for the period were Fast Retailing Co. Ltd., SoftBank Group Corp., and Tokyo Electron Ltd. Those detracting most from return were Kao Corp., Japan Exchange Group, Inc., and West Japan Railway Co.
Derivatives in the Fund were used to help provide exposure to the composition of the benchmark in the highest efficient manner and to provide leverage, not for hedging purposes. The results of derivatives use during the period were within our expectations and were a factor in the Fund’s positive performance.
Due to the compounding of daily returns, leveraged and inverse funds’ returns over periods other than one day will likely differ in amount and possibly direction from the benchmark return for the same period. Investors should monitor their leveraged and inverse funds’ holdings to ensure that they are consistent with their strategies, as frequently as daily.
The effects of compounding may cause the longer-term correlation of the Fund to its benchmark to diminish. The apparent discrepancy between the leveraged and unleveraged indices is the result of compounding, which is described briefly on page 6 of this report.
The Fund may invest in certain of the underlying series of Guggenheim Funds Trust and Guggenheim Strategy Funds Trust, including Guggenheim Ultra Short Duration, Guggenheim Strategy Fund II and Guggenheim Strategy Fund III (collectively, the “Short Term Investment Vehicles”), each of which are open-end management investment companies managed by Guggenheim Investments. The Short Term Investment Vehicles, which launched on March 11, 2014, are offered as short term investment options only to mutual funds, trusts, and other accounts managed by Guggenheim Investments and/or its affiliates, and are not available to the public, with the exception of Guggenheim Ultra Short Duration Fund, which is available to the public. Guggenheim Strategy Fund II and Guggenheim Strategy Fund III do not charge an investment management fee. Guggenheim Ultra Short Duration Fund charges an investment management fee but the Fund’s adviser has agreed to waive fees to the extent necessary to offset the proportionate share of any management fee paid by the Fund with respect to its investment in Guggenheim Ultra Short Duration Fund. For the one year period ended March 31, 2021, investment in the Short Term Investment Vehicles benefited Fund performance.
Performance displayed represents past performance, which is no guarantee of future results.
Holdings Diversification (Market Exposure as % of Net Assets)
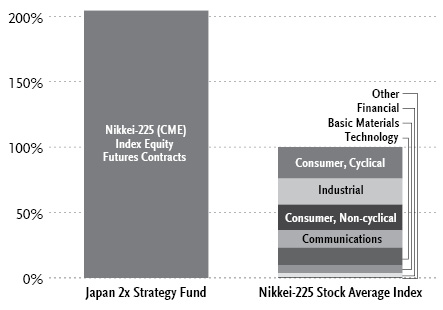
“Holdings Diversification (Market Exposure as % of Net Assets)” excludes any temporary cash investments, investments in Guggenheim Strategy Funds Trust mutual funds, or investments in Guggenheim Ultra Short Duration Fund. Investments in those Funds do not provide “market exposure” to meet the Fund’s investment objective, but will significantly increase the portfolio’s exposure to certain other asset categories (and their associated risks), which may cause the Fund to deviate from its principal investment strategy, including: (i) high yield, high risk debt securities rated below the top four long-term rating categories by a nationally recognized statistical rating organization (also known as “junk bonds”); (ii) securities issued by the U.S. government or its agencies and instrumentalities; (iii) CLOs and similar investments; and (iv) other short-term fixed income securities.
70 | THE RYDEX FUNDS ANNUAL REPORT | |
PERFORMANCE REPORT AND FUND PROFILE (Unaudited)(concluded) | March 31, 2021 |
Inception Dates: |
A-Class | February 22, 2008 |
C-Class | February 22, 2008 |
H-Class | February 22, 2008 |
The Fund invests principally in derivative investments such as swap agreements and futures contracts.
Largest Holdings (% of Total Net Assets) |
Guggenheim Ultra Short Duration Fund — Institutional Class | 7.7% |
Guggenheim Strategy Fund II | 7.6% |
Top Ten Total | 15.3% |
| | |
“Largest Holdings” excludes any temporary cash or derivative investments. |
Cumulative Fund Performance*
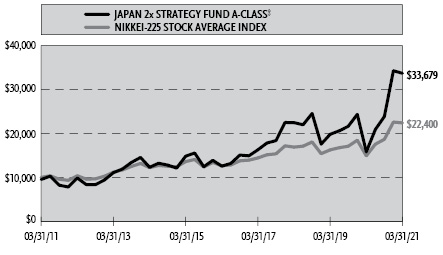

Average Annual Returns*
Periods Ended March 31, 2021
| 1 Year | 5 Year | 10 Year |
A-Class Shares | 112.92% | 21.83% | 13.46% |
A-Class Shares with sales charge‡ | 102.80% | 20.65% | 12.91% |
C-Class Shares | 111.34% | 20.92% | 12.69% |
C-Class Shares with CDSC§ | 110.34% | 20.92% | 12.69% |
H-Class Shares | 112.94% | 21.90% | 13.52% |
Nikkei-225 Stock Average Index | 50.30% | 12.11% | 8.40% |
* | The performance data above represents past performance that is not predictive of future results. The investment return and principal value of an investment in the Fund will fluctuate so that an investor’s shares, when redeemed, may be worth more or less than their original cost. Returns are historical and include changes in principal and reinvested dividends and capital gains and do not reflect the effect of taxes. The Nikkei-225 Stock Average Index is an unmanaged index and, unlike the Fund, has no management fees or operating expenses to reduce its reported return. The graphs are based on A-Class and H-Class shares only; performance for C-Class shares will vary due to differences in fee structure. |
‡ | Fund returns are calculated using the maximum sales charge of 4.75%. |
§ | Fund returns include a CDSC of 1% if redeemed within 12 months of purchase. |
| | THE RYDEX FUNDS ANNUAL REPORT | 71 |
SCHEDULE OF INVESTMENTS | March 31, 2021 |
JAPAN 2x STRATEGY FUND | |
| | Shares | | | Value | |
MUTUAL FUNDS† - 15.3% |
Guggenheim Ultra Short Duration Fund — Institutional Class1 | | | 14,448 | | | $ | 143,902 | |
Guggenheim Strategy Fund II1 | | | 5,636 | | | | 140,782 | |
Total Mutual Funds | | | | |
(Cost $283,661) | | | | | | | 284,684 | |
| | | | | | | | | |
| | | Face
Amount | | | | | |
U.S. TREASURY BILLS†† - 15.5% |
U.S. Treasury Bills |
0.01% due 04/22/212,3 | | $ | 290,000 | | | | 289,998 | |
Total U.S. Treasury Bills | | | | |
(Cost $289,997) | | | | | | | 289,998 | |
| | | | | | | | | |
FEDERAL AGENCY NOTES†† - 10.7% |
Federal Farm Credit Bank |
0.45% (U.S. Prime Rate - 2.80%, Rate Floor: 0.00%) due 03/14/224 | | | 100,000 | | | | 100,316 | |
0.31% (3 Month U.S. Treasury Bill Rate + 0.29%, Rate Floor: 0.00%) due 04/11/224 | | | 100,000 | | | | 100,230 | |
Total Federal Agency Notes | | | | |
(Cost $200,000) | | | | | | | 200,546 | |
| |
REPURCHASE AGREEMENTS††,5 - 61.6% |
J.P. Morgan Securities LLC
issued 03/31/21 at 0.01%
due 04/01/21 | | | 615,642 | | | | 615,642 | |
Barclays Capital, Inc.
issued 03/31/21 at 0.01%
due 04/01/21 | | | 279,901 | | | | 279,901 | |
BofA Securities, Inc.
issued 03/31/21 at 0.01%
due 04/01/21 | | | 255,453 | | | | 255,453 | |
Total Repurchase Agreements | | | | |
(Cost $1,150,996) | | | | | | | 1,150,996 | |
| | | | | | | | | |
Total Investments - 103.1% | | | | |
(Cost $1,924,654) | | $ | 1,926,224 | |
Other Assets & Liabilities, net - (3.1)% | | | (58,537 | ) |
Total Net Assets - 100.0% | | $ | 1,867,687 | |
Futures Contracts |
Description | | Number of
Contracts | | | Expiration
Date | | | Notional
Amount | | | Value and
Unrealized
Appreciation
(Depreciation)** | |
Equity Futures Contracts Purchased† |
Nikkei 225 (CME) Index Futures Contracts | | | 26 | | | | Jun 2021 | | | $ | 3,818,100 | | | $ | 84,264 | |
Currency Futures Contracts Purchased† |
Japanese Yen Futures Contracts | | | 34 | | | | Jun 2021 | | | | 3,840,725 | | | | (64,489 | ) |
** | Includes cumulative appreciation (depreciation). Variation margin is reported within the Statement of Assets and Liabilities. |
† | Value determined based on Level 1 inputs — See Note 4. |
†† | Value determined based on Level 2 inputs — See Note 4. |
1 | Affiliated issuer. |
2 | All or a portion of this security is pledged as futures collateral at March 31, 2021. |
3 | Rate indicated is the effective yield at the time of purchase. |
4 | Variable rate security. Rate indicated is the rate effective at March 31, 2021. In some instances, the effective rate is limited by a minimum rate floor or a maximum rate cap established by the issuer. The settlement status of a position may also impact the effective rate indicated. In some cases, a position may be unsettled at period end and may not have a stated effective rate. In instances where multiple underlying reference rates and spread amounts are shown, the effective rate is based on a weighted average. |
5 | Repurchase Agreements — See Note 6. |
| | CME — Chicago Mercantile Exchange |
| | |
| | See Sector Classification in Other Information section. |
72 | THE RYDEX FUNDS ANNUAL REPORT | SEE NOTES TO FINANCIAL STATEMENTS. |
SCHEDULE OF INVESTMENTS (concluded) | March 31, 2021 |
JAPAN 2x STRATEGY FUND | |
The following table summarizes the inputs used to value the Fund’s investments at March 31, 2021 (See Note 4 in the Notes to Financial Statements):
Investments in Securities (Assets) | | Level 1
Quoted
Prices | | | Level 2
Significant
Observable
Inputs | | | Level 3
Significant
Unobservable
Inputs | | | Total | |
Mutual Funds | | $ | 284,684 | | | $ | — | | | $ | — | | | $ | 284,684 | |
U.S. Treasury Bills | | | — | | | | 289,998 | | | | — | | | | 289,998 | |
Federal Agency Notes | | | — | | | | 200,546 | | | | — | | | | 200,546 | |
Repurchase Agreements | | | — | | | | 1,150,996 | | | | — | | | | 1,150,996 | |
Equity Futures Contracts** | | | 84,264 | | | | — | | | | — | | | | 84,264 | |
Total Assets | | $ | 368,948 | | | $ | 1,641,540 | | | $ | — | | | $ | 2,010,488 | |
Investments in Securities (Liabilities) | | Level 1
Quoted
Prices | | | Level 2
Significant
Observable
Inputs | | | Level 3
Significant
Unobservable
Inputs | | | Total | |
Currency Futures Contracts** | | $ | 64,489 | | | $ | — | | | $ | — | | | $ | 64,489 | |
** | This derivative is reported as unrealized appreciation/depreciation at period end. |
Affiliated Transactions
Investments representing 5% or more of the outstanding voting shares of a company, or control of or by, or common control under Guggenheim Investments (“GI”), result in that company being considered an affiliated issuer, as defined in the 1940 Act.
The Fund may invest in certain of the underlying series of Guggenheim Strategy Funds Trust, including Guggenheim Strategy Fund II and Guggenheim Strategy Fund III, (collectively, the “Short Term Investment Vehicles”), each of which are open-end management investment companies managed by GI. The Short Term Investment Vehicles, which launched on March 11, 2014, are offered as short term investment options only to mutual funds, trusts, and other accounts managed by GI and/or its affiliates, and are not available to the public. The Short Term Investment Vehicles pay no investment management fees. The Short Term Investment Vehicles’ annual report on Form N-CSR dated September 30, 2020, is available publicly or upon request. This information is available from the EDGAR database on the SEC’s website at https://www.sec.gov/Archives/edgar/data/1601445/000182126820000133/gug81042-ncsr.htm.
Transactions during the year ended March 31, 2021, in which the company is an affiliated issuer, were as follows:
Security Name | | Value
03/31/20 | | | Additions | | | Reductions | | | Realized
Gain (Loss) | | | Change in
Unrealized
Appreciation
(Depreciation) | | | Value
03/31/21 | | | Shares
03/31/21 | | | Investment
Income | |
Mutual Funds | | | | | | | | | | | | | | | | | | | | | | | | | | | | | | | | |
Guggenheim Strategy Fund II | | $ | 156,143 | | | $ | 40,000 | | | $ | (60,000 | ) | | $ | (1,252 | ) | | $ | 5,891 | | | $ | 140,782 | | | | 5,636 | | | $ | 1,945 | |
Guggenheim Ultra Short Duration Fund — Institutional Class | | | 160,954 | | | | 21 | | | | (20,000 | ) | | | (271 | ) | | | 3,198 | | | | 143,902 | | | | 14,448 | | | | 1,687 | |
| | | $ | 317,097 | | | $ | 40,021 | | | $ | (80,000 | ) | | $ | (1,523 | ) | | $ | 9,089 | | | $ | 284,684 | | | | | | | $ | 3,632 | |
SEE NOTES TO FINANCIAL STATEMENTS. | THE RYDEX FUNDS ANNUAL REPORT | 73 |
STATEMENT OF ASSETS AND LIABILITIES |
March 31, 2021 |
Assets: |
Investments in unaffiliated issuers, at value (cost $489,997) | | $ | 490,544 | |
Investments in affiliated issuers, at value (cost $283,661) | | | 284,684 | |
Repurchase agreements, at value (cost $1,150,996) | | | 1,150,996 | |
Receivables: |
Fund shares sold | | | 1,036 | |
Dividends | | | 289 | |
Interest | | | 98 | |
Total assets | | | 1,927,647 | |
| | | | | |
Liabilities: |
Payable for: |
Fund shares redeemed | | | 36,886 | |
Variation margin on futures contracts | | | 17,938 | |
Management fees | | | 1,386 | |
Distribution and service fees | | | 509 | |
Transfer agent and administrative fees | | | 508 | |
Portfolio accounting fees | | | 189 | |
Trustees’ fees* | | | 36 | |
Miscellaneous | | | 2,508 | |
Total liabilities | | | 59,960 | |
Commitments and contingent liabilities (Note 12) | | | — | |
Net assets | | $ | 1,867,687 | |
| | | | | |
Net assets consist of: |
Paid in capital | | $ | 3,549,507 | |
Total distributable earnings (loss) | | | (1,681,820 | ) |
Net assets | | $ | 1,867,687 | |
| | | | | |
A-Class: |
Net assets | | $ | 254,568 | |
Capital shares outstanding | | | 1,266 | |
Net asset value per share | | $ | 201.08 | |
Maximum offering price per share (Net asset value divided by 95.25%) | | $ | 211.11 | |
| | | | | |
C-Class: |
Net assets | | $ | 53,300 | |
Capital shares outstanding | | | 292 | |
Net asset value per share | | $ | 182.53 | |
| | | | | |
H-Class: |
Net assets | | $ | 1,559,819 | |
Capital shares outstanding | | | 7,697 | |
Net asset value per share | | $ | 202.65 | |
STATEMENT OF OPERATIONS |
Year Ended March 31, 2021 |
Investment Income: |
Dividends from securities of affiliated issuers | | $ | 3,632 | |
Interest | | | 1,623 | |
Total investment income | | | 5,255 | |
| | | | | |
Expenses: |
Management fees | | | 13,557 | |
Distribution and service fees: |
A-Class | | | 529 | |
C-Class | | | 385 | |
H-Class | | | 3,894 | |
Transfer agent and administrative fees | | | 5,021 | |
Portfolio accounting fees | | | 1,808 | |
Professional fees | | | 605 | |
Trustees’ fees* | | | 291 | |
Custodian fees | | | 253 | |
Miscellaneous | | | 2,459 | |
Total expenses | | | 28,802 | |
Less: |
Expenses waived by Adviser | | | (365 | ) |
Net expenses | | | 28,437 | |
Net investment loss | | | (23,182 | ) |
| | | | | |
Net Realized and Unrealized Gain (Loss): |
Net realized gain (loss) on: |
Investments in affiliated issuers | | | (1,523 | ) |
Swap agreements | | | 93 | |
Futures contracts | | | 1,144,166 | |
Net realized gain | | | 1,142,736 | |
Net change in unrealized appreciation (depreciation) on: |
Investments in unaffiliated issuers | | | 442 | |
Investments in affiliated issuers | | | 9,089 | |
Futures contracts | | | 42,466 | |
Net change in unrealized appreciation (depreciation) | | | 51,997 | |
Net realized and unrealized gain | | | 1,194,733 | |
Net increase in net assets resulting from operations | | $ | 1,171,551 | |
* | Relates to Trustees not deemed “interested persons” within the meaning of Section 2(a)(19) of the 1940 Act. |
74 | THE RYDEX FUNDS ANNUAL REPORT | SEE NOTES TO FINANCIAL STATEMENTS. |
STATEMENTS OF CHANGES IN NET ASSETS |
| | Year Ended
March 31,
2021 | | | Year Ended
March 31,
2020 | |
Increase (Decrease) in Net Assets from Operations: | | | | | | | | |
Net investment income (loss) | | $ | (23,182 | ) | | $ | 14,233 | |
Net realized gain (loss) on investments | | | 1,142,736 | | | | (377,386 | ) |
Net change in unrealized appreciation (depreciation) on investments | | | 51,997 | | | | (6,787 | ) |
Net increase (decrease) in net assets resulting from operations | | | 1,171,551 | | | | (369,940 | ) |
| | | | | | | | | |
Distributions to shareholders: | | | | | | | | |
A-Class | | | (1,352 | ) | | | (2,129 | ) |
C-Class | | | (252 | ) | | | (330 | ) |
H-Class | | | (12,629 | ) | | | (17,851 | ) |
Total distributions to shareholders | | | (14,233 | ) | | | (20,310 | ) |
| | | | | | | | | |
Capital share transactions: | | | | | | | | |
Proceeds from sale of shares | | | | | | | | |
A-Class | | | 129,406 | | | | 444,621 | |
C-Class | | | 25,877 | | | | 353,184 | |
H-Class | | | 9,996,652 | | | | 26,008,199 | |
Distributions reinvested | | | | | | | | |
A-Class | | | 1,352 | | | | 1,354 | |
C-Class | | | 245 | | | | 321 | |
H-Class | | | 11,506 | | | | 14,464 | |
Cost of shares redeemed | | | | | | | | |
A-Class | | | (163,139 | ) | | | (458,558 | ) |
C-Class | | | (16,392 | ) | | | (353,755 | ) |
H-Class | | | (10,253,391 | ) | | | (26,780,558 | ) |
Net decrease from capital share transactions | | | (267,884 | ) | | | (770,728 | ) |
Net increase (decrease) in net assets | | | 889,434 | | | | (1,160,978 | ) |
| | | | | | | | | |
Net assets: | | | | | | | | |
Beginning of year | | | 978,253 | | | | 2,139,231 | |
End of year | | $ | 1,867,687 | | | $ | 978,253 | |
| | | | | | | | | |
Capital share activity: | | | | | | | | |
Shares sold | | | | | | | | |
A-Class | | | 746 | | | | 3,455 | |
C-Class | | | 138 | | | | 2,897 | |
H-Class | | | 60,690 | | | | 205,913 | |
Shares issued from reinvestment of distributions | | | | | | | | |
A-Class | | | 7 | | | | 9 | |
C-Class | | | 1 | | | | 2 | |
H-Class | | | 60 | | | | 98 | |
Shares redeemed | | | | | | | | |
A-Class | | | (967 | ) | | | (3,747 | ) |
C-Class | | | (87 | ) | | | (2,928 | ) |
H-Class | | | (61,589 | ) | | | (213,175 | ) |
Net decrease in shares | | | (1,001 | ) | | | (7,476 | ) |
SEE NOTES TO FINANCIAL STATEMENTS. | THE RYDEX FUNDS ANNUAL REPORT | 75 |
This table is presented to show selected data for a share outstanding throughout each period and to assist shareholders in evaluating a Fund’s performance for the periods presented.
A-Class | | Year Ended
March 31,
2021 | | | Year Ended
March 31,
2020 | | | Year Ended
March 31,
2019 | | | Year Ended
March 29,
2018 | | | Year Ended
March 31,
2017e | |
Per Share Data |
Net asset value, beginning of period | | $ | 94.96 | | | $ | 119.96 | | | $ | 136.57 | | | $ | 102.24 | | | $ | 78.81 | |
Income (loss) from investment operations: |
Net investment income (loss)a | | | (1.95 | ) | | | .91 | | | | 1.22 | | | | (.03 | ) | | | (.74 | ) |
Net gain (loss) on investments (realized and unrealized) | | | 109.13 | | | | (24.67 | ) | | | (17.32 | ) | | | 38.80 | f | | | 24.17 | |
Total from investment operations | | | 107.18 | | | | (23.76 | ) | | | (16.10 | ) | | | 38.77 | | | | 23.43 | |
Less distributions from: |
Net investment income | | | (1.06 | ) | | | (1.24 | ) | | | (.51 | ) | | | — | | | | — | |
Net realized gains | | | — | | | | — | | | | — | | | | (4.44 | ) | | | — | |
Total distributions | | | (1.06 | ) | | | (1.24 | ) | | | (.51 | ) | | | (4.44 | ) | | | — | |
Net asset value, end of period | | $ | 201.08 | | | $ | 94.96 | | | $ | 119.96 | | | $ | 136.57 | | | $ | 102.24 | |
|
Total Returnb | | | 112.92 | % | | | (20.15 | %) | | | (11.79 | %) | | | 37.94 | % | | | 29.73 | % |
Ratios/Supplemental Data |
Net assets, end of period (in thousands) | | $ | 255 | | | $ | 141 | | | $ | 211 | | | $ | 404 | | | $ | 389 | |
Ratios to average net assets: |
Net investment income (loss) | | | (1.26 | %) | | | 0.70 | % | | | 0.93 | % | | | (0.02 | %) | | | (0.80 | %) |
Total expensesc | | | 1.58 | % | | | 1.63 | % | | | 1.58 | % | | | 1.51 | % | | | 1.52 | % |
Net expensesd | | | 1.56 | % | | | 1.57 | % | | | 1.56 | % | | | 1.51 | % | | | 1.52 | % |
Portfolio turnover rate | | | 15 | % | | | — | | | | — | | | | 17 | % | | | 1,225 | % |
C-Class | | Year Ended
March 31,
2021 | | | Year Ended
March 31,
2020 | | | Year Ended
March 31,
2019 | | | Year Ended
March 29,
2018 | | | Year Ended
March 31,
2017e | |
Per Share Data |
Net asset value, beginning of period | | $ | 87.00 | | | $ | 110.80 | | | $ | 127.14 | | | $ | 96.17 | | | $ | 74.63 | |
Income (loss) from investment operations: |
Net investment income (loss)a | | | (2.98 | ) | | | (.06 | ) | | | .19 | | | | (.80 | ) | | | (1.33 | ) |
Net gain (loss) on investments (realized and unrealized) | | | 99.57 | | | | (22.50 | ) | | | (16.02 | ) | | | 36.21 | f | | | 22.87 | |
Total from investment operations | | | 96.59 | | | | (22.56 | ) | | | (15.83 | ) | | | 35.41 | | | | 21.54 | |
Less distributions from: |
Net investment income | | | (1.06 | ) | | | (1.24 | ) | | | (.51 | ) | | | — | | | | — | |
Net realized gains | | | — | | | | — | | | | — | | | | (4.44 | ) | | | — | |
Total distributions | | | (1.06 | ) | | | (1.24 | ) | | | (.51 | ) | | | (4.44 | ) | | | — | |
Net asset value, end of period | | $ | 182.53 | | | $ | 87.00 | | | $ | 110.80 | | | $ | 127.14 | | | $ | 96.17 | |
|
Total Returnb | | | 111.34 | % | | | (20.75 | %) | | | (12.43 | %) | | | 36.90 | % | | | 28.74 | % |
Ratios/Supplemental Data |
Net assets, end of period (in thousands) | | $ | 53 | | | $ | 21 | | | $ | 30 | | | $ | 69 | | | $ | 52 | |
Ratios to average net assets: |
Net investment income (loss) | | | (2.02 | %) | | | (0.05 | %) | | | 0.16 | % | | | (0.68 | %) | | | (1.53 | %) |
Total expensesc | | | 2.32 | % | | | 2.38 | % | | | 2.33 | % | | | 2.26 | % | | | 2.27 | % |
Net expensesd | | | 2.30 | % | | | 2.32 | % | | | 2.31 | % | | | 2.26 | % | | | 2.27 | % |
Portfolio turnover rate | | | 15 | % | | | — | | | | — | | | | 17 | % | | | 1,225 | % |
76 | THE RYDEX FUNDS ANNUAL REPORT | SEE NOTES TO FINANCIAL STATEMENTS. |
FINANCIAL HIGHLIGHTS (concluded) |
This table is presented to show selected data for a share outstanding throughout each period and to assist shareholders in evaluating a Fund’s performance for the periods presented.
H-Class | | Year Ended
March 31,
2021 | | | Year Ended
March 31,
2020 | | | Year Ended
March 31,
2019 | | | Year Ended
March 29,
2018 | | | Year Ended
March 31,
2017e | |
Per Share Data |
Net asset value, beginning of period | | $ | 95.70 | | | $ | 120.89 | | | $ | 137.58 | | | $ | 102.97 | | | $ | 79.15 | |
Income (loss) from investment operations: |
Net investment income (loss)a | | | (2.07 | ) | | | .90 | | | | 1.09 | | | | (.12 | ) | | | (.86 | ) |
Net gain (loss) on investments (realized and unrealized) | | | 110.08 | | | | (24.85 | ) | | | (17.27 | ) | | | 39.17 | f | | | 24.68 | |
Total from investment operations | | | 108.01 | | | | (23.95 | ) | | | (16.18 | ) | | | 39.05 | | | | 23.82 | |
Less distributions from: |
Net investment income | | | (1.06 | ) | | | (1.24 | ) | | | (.51 | ) | | | — | | | | — | |
Net realized gains | | | — | | | | — | | | | — | | | | (4.44 | ) | | | — | |
Total distributions | | | (1.06 | ) | | | (1.24 | ) | | | (.51 | ) | | | (4.44 | ) | | | — | |
Net asset value, end of period | | $ | 202.65 | | | $ | 95.70 | | | $ | 120.89 | | | $ | 137.58 | | | $ | 102.97 | |
|
Total Return | | | 112.94 | % | | | (20.17 | %) | | | (11.76 | %) | | | 37.95 | % | | | 30.08 | % |
Ratios/Supplemental Data |
Net assets, end of period (in thousands) | | $ | 1,560 | | | $ | 817 | | | $ | 1,898 | | | $ | 4,946 | | | $ | 3,145 | |
Ratios to average net assets: |
Net investment income (loss) | | | (1.27 | %) | | | 0.69 | % | | | 0.83 | % | | | (0.10 | %) | | | (0.95 | %) |
Total expensesc | | | 1.58 | % | | | 1.63 | % | | | 1.58 | % | | | 1.50 | % | | | 1.52 | % |
Net expensesd | | | 1.56 | % | | | 1.58 | % | | | 1.57 | % | | | 1.50 | % | | | 1.52 | % |
Portfolio turnover rate | | | 15 | % | | | — | | | | — | | | | 17 | % | | | 1,225 | % |
a | Net investment income (loss) per share was computed using average shares outstanding throughout the period. |
b | Total return does not reflect the impact of any applicable sales charges. |
c | Does not include expenses of the underlying funds in which the Fund invests. |
d | Net expense information reflects the expense ratios after expense waivers and reimbursements, as applicable. |
e | Reverse share split — Per share amounts for the year ended March 31, 2017 have been restated to reflect a 1:4 share split effective November 4, 2016. |
f | The amount shown for a share outstanding throughout the year does not agree with the aggregate net loss on investments for the year because of the sales and repurchases of fund shares in relation to fluctuating market value of the investments of the Fund. |
SEE NOTES TO FINANCIAL STATEMENTS. | THE RYDEX FUNDS ANNUAL REPORT | 77 |
PERFORMANCE REPORT AND FUND PROFILE (Unaudited) | March 31, 2021 |
STRENGTHENING DOLLAR 2x STRATEGY FUND
OBJECTIVE: Seeks to provide investment results that match, before fees and expenses, the performance of a specific benchmark on a daily basis. The Fund’s current benchmark is 200% of the performance of the U.S. Dollar Index® (the “underlying index”). The Fund does not seek to achieve its investment objective over a period of time greater than one day.
For the one year period ended March 31, 2021, Strengthening Dollar 2x Strategy Fund maintained a daily correlation of over 99% to its benchmark of 200% of the daily price movement of the underlying index. Strengthening Dollar 2x Strategy Fund H-Class returned -11.86%, compared with a return of -5.88% for its benchmark, the underlying index.
Contributing the most to performance of the underlying index for the year were the Japanese Yen, Swiss Franc and Swedish Krona. The Euro, British Pound, and Canadian Dollar detracted the most from performance.
Derivatives in the Fund were used to help provide exposure to the composition of the benchmark in the highest efficient manner and to provide leverage, not for hedging purposes. The results of derivatives use during the period were within our expectations and were a factor in the Fund’s positive performance.
Due to the compounding of daily returns, leveraged and inverse funds’ returns over periods other than one day will likely differ in amount and possibly direction from the benchmark return for the same period. Investors should monitor their leveraged and inverse funds’ holdings to ensure that they are consistent with their strategies, as frequently as daily.
The effects of compounding may cause the longer-term correlation of the Fund to its benchmark to diminish. The apparent discrepancy between the leveraged and unleveraged indices is the result of compounding, which is described briefly on page 6 of this report.
The Fund may invest in certain of the underlying series of Guggenheim Funds Trust and Guggenheim Strategy Funds Trust, including Guggenheim Ultra Short Duration, Guggenheim Strategy Fund II and Guggenheim Strategy Fund III (collectively, the “Short Term Investment Vehicles”), each of which are open-end management investment companies managed by Guggenheim Investments. The Short Term Investment Vehicles, which launched on March 11, 2014, are offered as short term investment options only to mutual funds, trusts, and other accounts managed by Guggenheim Investments and/or its affiliates, and are not available to the public, with the exception of Guggenheim Ultra Short Duration Fund, which is available to the public. Guggenheim Strategy Fund II and Guggenheim Strategy Fund III do not charge an investment management fee. Guggenheim Ultra Short Duration Fund charges an investment management fee but the Fund’s adviser has agreed to waive fees to the extent necessary to offset the proportionate share of any management fee paid by the Fund with respect to its investment in Guggenheim Ultra Short Duration Fund. For the one year period ended March 31, 2021, investment in the Short Term Investment Vehicles benefited Fund performance.
Performance displayed represents past performance, which is no guarantee of future results.
Holdings Diversification (Market Exposure as % of Net Assets)
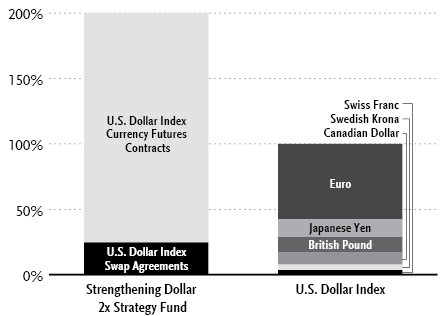
“Holdings Diversification (Market Exposure as % of Net Assets)” excludes any temporary cash investments, investments in Guggenheim Strategy Funds Trust mutual funds, or investments in Guggenheim Ultra Short Duration Fund. Investments in those Funds do not provide “market exposure” to meet the Fund’s investment objective, but will significantly increase the portfolio’s exposure to certain other asset categories (and their associated risks), which may cause the Fund to deviate from its principal investment strategy, including: (i) high yield, high risk debt securities rated below the top four long-term rating categories by a nationally recognized statistical rating organization (also known as “junk bonds”); (ii) securities issued by the U.S. government or its agencies and instrumentalities; (iii) CLOs and similar investments; and (iv) other short-term fixed income securities.
78 | THE RYDEX FUNDS ANNUAL REPORT | |
PERFORMANCE REPORT AND FUND PROFILE (Unaudited)(concluded) | March 31, 2021 |
Inception Dates: |
A-Class | May 25, 2005 |
C-Class | May 25, 2005 |
H-Class | May 25, 2005 |
The Fund invests principally in derivative investments such as swap agreements and futures contracts.
Largest Holdings (% of Total Net Assets) |
Guggenheim Strategy Fund II | 17.4% |
Guggenheim Ultra Short Duration Fund — Institutional Class | 14.7% |
Total | 32.1% |
| | |
“Largest Holdings” excludes any temporary cash or derivative investments. |
Average Annual Returns*
Periods Ended March 31, 2021
| 1 Year | 5 Year | 10 Year |
A-Class Shares | (11.88%) | 0.62% | 2.40% |
A-Class Shares with sales charge‡ | (16.07%) | (0.36%) | 1.90% |
C-Class Shares | (12.56%) | (0.13%) | 1.63% |
C-Class Shares with CDSC§ | (13.43%) | (0.13%) | 1.63% |
H-Class Shares | (11.86%) | 0.63% | 2.41% |
U.S. Dollar Index | (5.88%) | (0.29%) | 2.08% |
Cumulative Fund Performance*
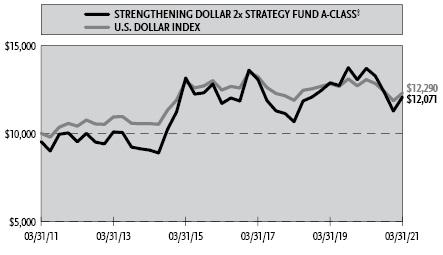

* | The performance data above represents past performance that is not predictive of future results. The investment return and principal value of an investment in the Fund will fluctuate so that an investor’s shares, when redeemed, may be worth more or less than their original cost. Returns are historical and include changes in principal and reinvested dividends and capital gains and do not reflect the effect of taxes. The U.S. Dollar Index is an unmanaged index and, unlike the Fund, has no management fees or operating expenses to reduce its reported return. The graphs are based on A-Class and H-Class shares only; performance for C-Class shares will vary due to differences in fee structure. |
‡ | Fund returns are calculated using the maximum sales charge of 4.75%. |
§ | Fund returns include a CDSC of 1% if redeemed within 12 months of purchase. |
| | THE RYDEX FUNDS ANNUAL REPORT | 79 |
SCHEDULE OF INVESTMENTS | March 31, 2021 |
STRENGTHENING DOLLAR 2x STRATEGY FUND | |
| | Shares | | | Value | |
MUTUAL FUNDS† - 32.1% |
Guggenheim Strategy Fund II1 | | | 27,327 | | | $ | 682,634 | |
Guggenheim Ultra Short Duration Fund — Institutional Class1 | | | 58,216 | | | | 579,831 | |
Total Mutual Funds | | | | |
(Cost $1,255,062) | | | | | | | 1,262,465 | |
| | | | | | | | | |
| | | Face
Amount | | | | | |
FEDERAL AGENCY NOTES†† - 30.0% |
Federal Farm Credit Bank |
0.45% (U.S. Prime Rate - 2.80%, Rate Floor: 0.00%) due 03/14/222 | | $ | 500,000 | | | | 501,583 | |
0.44% (U.S. Prime Rate - 2.81%, Rate Floor: 0.00%) due 05/20/222 | | | 180,000 | | | | 180,724 | |
Fannie Mae |
0.23% (U.S. Secured Overnight Financing Rate + 0.22%, Rate Floor: 0.00%) due 03/16/222 | | | 500,000 | | | | 500,976 | |
Total Federal Agency Notes | | | | |
(Cost $1,180,000) | | | | | | | 1,183,283 | |
| | | | | | | | | |
U.S. TREASURY BILLS†† - 3.0% |
U.S. Treasury Bills |
0.01% due 04/22/213,4 | | | 117,000 | | | | 116,999 | |
Total U.S. Treasury Bills | | | | |
(Cost $116,999) | | | | | | | 116,999 | |
| | | | | | | | | |
REPURCHASE AGREEMENTS††,5 - 19.3% |
J.P. Morgan Securities LLC
issued 03/31/21 at 0.01%
due 04/01/216 | | | 406,014 | | | | 406,014 | |
Barclays Capital, Inc.
issued 03/31/21 at 0.01%
due 04/01/216 | | | 184,594 | | | | 184,594 | |
BofA Securities, Inc.
issued 03/31/21 at 0.01%
due 04/01/216 | | | 168,470 | | | | 168,470 | |
Total Repurchase Agreements | | | | |
(Cost $759,078) | | | | | | | 759,078 | |
| | | | | | | | | |
Total Investments - 84.4% | | | | |
(Cost $3,311,139) | | $ | 3,321,825 | |
Other Assets & Liabilities, net - 15.6% | | | 613,408 | |
Total Net Assets - 100.0% | | $ | 3,935,233 | |
Futures Contracts |
Description | | Number of
Contracts | | | Expiration
Date | | | Notional
Amount | | | Value and
Unrealized
Appreciation** | |
Currency Futures Contracts Purchased† |
U.S. Dollar Index Futures Contracts | | | 74 | | | | Jun 2021 | | | $ | 6,900,130 | | | $ | 91,505 | |
Total Return Swap Agreements |
Counterparty | Index | Financing
Rate Pay
(Receive) | Payment
Frequency | | Maturity
Date | | | Units | | | Notional
Amount | | | Value and
Unrealized
Appreciation | |
OTC Currency Index Swap Agreements†† |
Goldman Sachs International | U.S. Dollar Index | N/A | At Maturity | | | 06/17/21 | | | | 10,489 | | | $ | 977,453 | | | $ | 4,670 | |
** | Includes cumulative appreciation (depreciation). Variation margin is reported within the Statement of Assets and Liabilities. |
† | Value determined based on Level 1 inputs — See Note 4. |
†† | Value determined based on Level 2 inputs — See Note 4. |
1 | Affiliated issuer. |
2 | Variable rate security. Rate indicated is the rate effective at March 31, 2021. In some instances, the effective rate is limited by a minimum rate floor or a maximum rate cap established by the issuer. The settlement status of a position may also impact the effective rate indicated. In some cases, a position may be unsettled at period end and may not have a stated effective rate. In instances where multiple underlying reference rates and spread amounts are shown, the effective rate is based on a weighted average. |
3 | All or a portion of this security is pledged as futures collateral at March 31, 2021. |
4 | Rate indicated is the effective yield at the time of purchase. |
5 | Repurchase Agreements — See Note 6. |
6 | All or a portion of this security is pledged as currency index swap collateral at March 31, 2021. |
| | |
| | See Sector Classification in Other Information section. |
80 | THE RYDEX FUNDS ANNUAL REPORT | SEE NOTES TO FINANCIAL STATEMENTS. |
SCHEDULE OF INVESTMENTS (concluded) | March 31, 2021 |
STRENGTHENING DOLLAR 2x STRATEGY FUND | |
The following table summarizes the inputs used to value the Fund’s investments at March 31, 2021 (See Note 4 in the Notes to Financial Statements):
Investments in Securities (Assets) | | Level 1
Quoted
Prices | | | Level 2
Significant
Observable
Inputs | | | Level 3
Significant
Unobservable
Inputs | | | Total | |
Mutual Funds | | $ | 1,262,465 | | | $ | — | | | $ | — | | | $ | 1,262,465 | |
Federal Agency Notes | | | — | | | | 1,183,283 | | | | — | | | | 1,183,283 | |
U.S. Treasury Bills | | | — | | | | 116,999 | | | | — | | | | 116,999 | |
Repurchase Agreements | | | — | | | | 759,078 | | | | — | | | | 759,078 | |
Currency Futures Contracts** | | | 91,505 | | | | — | | | | — | | | | 91,505 | |
Currency Index Swap Agreements** | | | — | | | | 4,670 | | | | — | | | | 4,670 | |
Total Assets | | $ | 1,353,970 | | | $ | 2,064,030 | | | $ | — | | | $ | 3,418,000 | |
** | This derivative is reported as unrealized appreciation/depreciation at period end. |
Affiliated Transactions
Investments representing 5% or more of the outstanding voting shares of a company, or control of or by, or common control under Guggenheim Investments (“GI”), result in that company being considered an affiliated issuer, as defined in the 1940 Act.
The Fund may invest in certain of the underlying series of Guggenheim Strategy Funds Trust, including Guggenheim Strategy Fund II and Guggenheim Strategy Fund III, (collectively, the “Short Term Investment Vehicles”), each of which are open-end management investment companies managed by GI. The Short Term Investment Vehicles, which launched on March 11, 2014, are offered as short term investment options only to mutual funds, trusts, and other accounts managed by GI and/or its affiliates, and are not available to the public. The Short Term Investment Vehicles pay no investment management fees. The Short Term Investment Vehicles’ annual report on Form N-CSR dated September 30, 2020, is available publicly or upon request. This information is available from the EDGAR database on the SEC’s website at https://www.sec.gov/Archives/edgar/data/1601445/000182126820000133/gug81042-ncsr.htm.
Transactions during the year ended March 31, 2021, in which the company is an affiliated issuer, were as follows:
Security Name | | Value
03/31/20 | | | Additions | | | Reductions | | | Realized
Gain (Loss) | | | Change in
Unrealized
Appreciation
(Depreciation) | | | Value
03/31/21 | | | Shares
03/31/21 | | | Investment
Income | |
Mutual Funds | | | | | | | | | | | | | | | | | | | | | | | | | | | | | | | | |
Guggenheim Strategy Fund II | | $ | 1,251,036 | | | $ | — | | | $ | (610,000 | ) | | $ | (2,689 | ) | | $ | 44,287 | | | $ | 682,634 | | | | 27,327 | | | $ | 14,738 | |
Guggenheim Ultra Short Duration Fund — Institutional Class | | | 1,267,630 | | | | — | | | | (710,000 | ) | | | (6,569 | ) | | | 28,770 | | | | 579,831 | | | | 58,216 | | | | 10,054 | |
| | | $ | 2,518,666 | | | $ | — | | | $ | (1,320,000 | ) | | $ | (9,258 | ) | | $ | 73,057 | | | $ | 1,262,465 | | | | | | | $ | 24,792 | |
SEE NOTES TO FINANCIAL STATEMENTS. | THE RYDEX FUNDS ANNUAL REPORT | 81 |
STRENGTHENING DOLLAR 2x STRATEGY FUND | |
STATEMENT OF ASSETS AND LIABILITIES |
March 31, 2021 |
Assets: |
Investments in unaffiliated issuers, at value (cost $1,296,999) | | $ | 1,300,282 | |
Investments in affiliated issuers, at value (cost $1,255,062) | | | 1,262,465 | |
Repurchase agreements, at value (cost $759,078) | | | 759,078 | |
Segregated cash with broker | | | 7,086 | |
Unrealized appreciation on OTC swap agreements | | | 4,670 | |
Receivables: |
Fund shares sold | | | 652,833 | |
Dividends | | | 1,296 | |
Interest | | | 252 | |
Total assets | | | 3,987,962 | |
| | | | | |
Liabilities: |
Payable for: |
Fund shares redeemed | | | 33,172 | |
Licensing fees | | | 6,054 | |
Variation margin on futures contracts | | | 4,962 | |
Management fees | | | 2,340 | |
Swap settlement | | | 1,073 | |
Transfer agent and administrative fees | | | 736 | |
Distribution and service fees | | | 707 | |
Portfolio accounting fees | | | 274 | |
Trustees’ fees* | | | 48 | |
Miscellaneous | | | 3,363 | |
Total liabilities | | | 52,729 | |
Commitments and contingent liabilities (Note 12) | | | — | |
Net assets | | $ | 3,935,233 | |
| | | | | |
Net assets consist of: |
Paid in capital | | $ | 23,161,122 | |
Total distributable earnings (loss) | | | (19,225,889 | ) |
Net assets | | $ | 3,935,233 | |
| | | | | |
A-Class: |
Net assets | | $ | 1,463,694 | |
Capital shares outstanding | | | 30,199 | |
Net asset value per share | | $ | 48.47 | |
Maximum offering price per share (Net asset value divided by 95.25%) | | $ | 50.89 | |
| | | | | |
C-Class: |
Net assets | | $ | 34,822 | |
Capital shares outstanding | | | 817 | |
Net asset value per share | | $ | 42.62 | |
| | | | | |
H-Class: |
Net assets | | $ | 2,436,717 | |
Capital shares outstanding | | | 50,464 | |
Net asset value per share | | $ | 48.29 | |
STATEMENT OF OPERATIONS |
Year Ended March 31, 2021 |
Investment Income: |
Dividends from securities of affiliated issuers | | $ | 24,792 | |
Interest | | | 5,628 | |
Total investment income | | | 30,420 | |
| | | | | |
Expenses: |
Management fees | | | 48,603 | |
Distribution and service fees: |
A-Class | | | 4,325 | |
C-Class | | | 499 | |
H-Class | | | 9,052 | |
Transfer agent and administrative fees | | | 15,662 | |
Licensing fees | | | 8,047 | |
Portfolio accounting fees | | | 5,401 | |
Professional fees | | | 4,740 | |
Trustees’ fees* | | | 2,128 | |
Custodian fees | | | 887 | |
Miscellaneous | | | 5,133 | |
Total expenses | | | 104,477 | |
Less: |
Expenses waived by Adviser | | | (2,110 | ) |
Net expenses | | | 102,367 | |
Net investment loss | | | (71,947 | ) |
| | | | | |
Net Realized and Unrealized Gain (Loss): |
Net realized gain (loss) on: |
Investments in unaffiliated issuers | | | 3 | |
Investments in affiliated issuers | | | (9,258 | ) |
Swap agreements | | | (14,257 | ) |
Futures contracts | | | (503,763 | ) |
Net realized loss | | | (527,275 | ) |
Net change in unrealized appreciation (depreciation) on: |
Investments in unaffiliated issuers | | | 2,691 | |
Investments in affiliated issuers | | | 73,057 | |
Swap agreements | | | (50,495 | ) |
Futures contracts | | | (122,095 | ) |
Net change in unrealized appreciation (depreciation) | | | (96,842 | ) |
Net realized and unrealized loss | | | (624,117 | ) |
Net decrease in net assets resulting from operations | | $ | (696,064 | ) |
* | Relates to Trustees not deemed “interested persons” within the meaning of Section 2(a)(19) of the 1940 Act. |
82 | THE RYDEX FUNDS ANNUAL REPORT | SEE NOTES TO FINANCIAL STATEMENTS. |
STRENGTHENING DOLLAR 2x STRATEGY FUND | |
STATEMENTS OF CHANGES IN NET ASSETS |
| | Year Ended
March 31,
2021 | | | Year Ended
March 31,
2020 | |
Increase (Decrease) in Net Assets from Operations: | | | | | | | | |
Net investment income (loss) | | $ | (71,947 | ) | | $ | 17,189 | |
Net realized loss on investments | | | (527,275 | ) | | | (64,902 | ) |
Net change in unrealized appreciation (depreciation) on investments | | | (96,842 | ) | | | 86,847 | |
Net increase (decrease) in net assets resulting from operations | | | (696,064 | ) | | | 39,134 | |
| | | | | | | | | |
Distributions to shareholders: | | | | | | | | |
A-Class | | | (6,655 | ) | | | (9,611 | ) |
C-Class | | | (292 | ) | | | (807 | ) |
H-Class | | | (10,242 | ) | | | (35,177 | ) |
Total distributions to shareholders | | | (17,189 | ) | | | (45,595 | ) |
| | | | | | | | | |
Capital share transactions: | | | | | | | | |
Proceeds from sale of shares | | | | | | | | |
A-Class | | | 1,906,912 | | | | 3,235,923 | |
C-Class | | | 493,961 | | | | 215,609 | |
H-Class | | | 48,911,545 | | | | 77,816,276 | |
Distributions reinvested | | | | | | | | |
A-Class | | | 4,700 | | | | 9,238 | |
C-Class | | | 292 | | | | 804 | |
H-Class | | | 10,066 | | | | 34,387 | |
Cost of shares redeemed | | | | | | | | |
A-Class | | | (2,675,694 | ) | | | (2,491,383 | ) |
C-Class | | | (548,182 | ) | | | (919,579 | ) |
H-Class | | | (56,636,089 | ) | | | (72,303,681 | ) |
Net increase (decrease) from capital share transactions | | | (8,532,489 | ) | | | 5,597,594 | |
Net increase (decrease) in net assets | | | (9,245,742 | ) | | | 5,591,133 | |
| | | | | | | | | |
Net assets: | | | | | | | | |
Beginning of year | | | 13,180,975 | | | | 7,589,842 | |
End of year | | $ | 3,935,233 | | | $ | 13,180,975 | |
| | | | | | | | | |
Capital share activity: | | | | | | | | |
Shares sold | | | | | | | | |
A-Class | | | 36,511 | | | | 57,467 | |
C-Class | | | 11,281 | | | | 4,363 | |
H-Class | | | 976,940 | | | | 1,436,108 | |
Shares issued from reinvestment of distributions | | | | | | | | |
A-Class | | | 102 | | | | 173 | |
C-Class | | | 7 | | | | 17 | |
H-Class | | | 219 | | | | 648 | |
Shares redeemed | | | | | | | | |
A-Class | | | (52,229 | ) | | | (45,804 | ) |
C-Class | | | (12,434 | ) | | | (19,278 | ) |
H-Class | | | (1,118,071 | ) | | | (1,341,390 | ) |
Net increase (decrease) in shares | | | (157,674 | ) | | | 92,304 | |
SEE NOTES TO FINANCIAL STATEMENTS. | THE RYDEX FUNDS ANNUAL REPORT | 83 |
STRENGTHENING DOLLAR 2x STRATEGY FUND | |
This table is presented to show selected data for a share outstanding throughout each period and to assist shareholders in evaluating a Fund’s performance for the periods presented.
A-Class | | Year Ended
March 31,
2021 | | | Year Ended
March 31,
2020 | | | Year Ended
March 31,
2019 | | | Year Ended
March 29,
2018 | | | Year Ended
March 31,
2017 | |
Per Share Data |
Net asset value, beginning of period | | $ | 55.34 | | | $ | 52.46 | | | $ | 43.45 | | | $ | 53.23 | | | $ | 47.68 | |
Income (loss) from investment operations: |
Net investment income (loss)a | | | (.64 | ) | | | .16 | | | | .19 | | | | (.16 | ) | | | (.55 | ) |
Net gain (loss) on investments (realized and unrealized) | | | (5.95 | ) | | | 3.17 | | | | 8.82 | | | | (9.62 | ) | | | 6.10 | |
Total from investment operations | | | (6.59 | ) | | | 3.33 | | | | 9.01 | | | | (9.78 | ) | | | 5.55 | |
Less distributions from: |
Net investment income | | | (.28 | ) | | | (.45 | ) | | | — | | | | — | | | | — | |
Total distributions | | | (.28 | ) | | | (.45 | ) | | | — | | | | — | | | | — | |
Net asset value, end of period | | $ | 48.47 | | | $ | 55.34 | | | $ | 52.46 | | | $ | 43.45 | | | $ | 53.23 | |
|
Total Returnb | | | (11.88 | %) | | | 6.38 | % | | | 20.74 | % | | | (18.37 | %) | | | 11.64 | % |
Ratios/Supplemental Data |
Net assets, end of period (in thousands) | | $ | 1,464 | | | $ | 2,535 | | | $ | 1,782 | | | $ | 1,517 | | | $ | 2,245 | |
Ratios to average net assets: |
Net investment income (loss) | | | (1.26 | %) | | | 0.29 | % | | | 0.40 | % | | | (0.34 | %) | | | (1.07 | %) |
Total expensesc | | | 1.91 | % | | | 2.00 | % | | | 1.83 | % | | | 1.72 | % | | | 1.73 | % |
Net expensesd | | | 1.87 | % | | | 1.96 | % | | | 1.82 | % | | | 1.72 | % | | | 1.73 | % |
Portfolio turnover rate | | | — | | | | — | | | | 9 | % | | | — | | | | 142 | % |
C-Class | | Year Ended
March 31,
2021 | | | Year Ended
March 31,
2020 | | | Year Ended
March 31,
2019 | | | Year Ended
March 29,
2018 | | | Year Ended
March 31,
2017 | |
Per Share Data |
Net asset value, beginning of period | | $ | 49.08 | | | $ | 46.91 | | | $ | 39.14 | | | $ | 48.32 | | | $ | 43.60 | |
Income (loss) from investment operations: |
Net investment income (loss)a | | | (.90 | ) | | | (.16 | ) | | | (.15 | ) | | | (.48 | ) | | | (.82 | ) |
Net gain (loss) on investments (realized and unrealized) | | | (5.28 | ) | | | 2.78 | | | | 7.92 | | | | (8.70 | ) | | | 5.54 | |
Total from investment operations | | | (6.18 | ) | | | 2.62 | | | | 7.77 | | | | (9.18 | ) | | | 4.72 | |
Less distributions from: |
Net investment income | | | (.28 | ) | | | (.45 | ) | | | — | | | | — | | | | — | |
Total distributions | | | (.28 | ) | | | (.45 | ) | | | — | | | | — | | | | — | |
Net asset value, end of period | | $ | 42.62 | | | $ | 49.08 | | | $ | 46.91 | | | $ | 39.14 | | | $ | 48.32 | |
|
Total Returnb | | | (12.56 | %) | | | 5.62 | % | | | 19.85 | % | | | (18.98 | %) | | | 10.80 | % |
Ratios/Supplemental Data |
Net assets, end of period (in thousands) | | $ | 35 | | | $ | 96 | | | $ | 791 | | | $ | 795 | | | $ | 1,309 | |
Ratios to average net assets: |
Net investment income (loss) | | | (2.00 | %) | | | (0.33 | %) | | | (0.33 | %) | | | (1.14 | %) | | | (1.80 | %) |
Total expensesc | | | 2.67 | % | | | 2.77 | % | | | 2.59 | % | | | 2.47 | % | | | 2.48 | % |
Net expensesd | | | 2.63 | % | | | 2.72 | % | | | 2.58 | % | | | 2.47 | % | | | 2.48 | % |
Portfolio turnover rate | | | — | | | | — | | | | 9 | % | | | — | | | | 142 | % |
84 | THE RYDEX FUNDS ANNUAL REPORT | SEE NOTES TO FINANCIAL STATEMENTS. |
STRENGTHENING DOLLAR 2x STRATEGY FUND | |
FINANCIAL HIGHLIGHTS (concluded) |
This table is presented to show selected data for a share outstanding throughout each period and to assist shareholders in evaluating a Fund’s performance for the periods presented.
H-Class | | Year Ended
March 31,
2021 | | | Year Ended
March 31,
2020 | | | Year Ended
March 31,
2019 | | | Year Ended
March 29,
2018 | | | Year Ended
March 31,
2017 | |
Per Share Data |
Net asset value, beginning of period | | $ | 55.12 | | | $ | 52.25 | | | $ | 43.27 | | | $ | 53.03 | | | $ | 47.49 | |
Income (loss) from investment operations: |
Net investment income (loss)a | | | (.70 | ) | | | .12 | | | | .18 | | | | (.17 | ) | | | (.56 | ) |
Net gain (loss) on investments (realized and unrealized) | | | (5.85 | ) | | | 3.20 | | | | 8.80 | | | | (9.59 | ) | | | 6.10 | |
Total from investment operations | | | (6.55 | ) | | | 3.32 | | | | 8.98 | | | | (9.76 | ) | | | 5.54 | |
Less distributions from: |
Net investment income | | | (.28 | ) | | | (.45 | ) | | | — | | | | — | | | | — | |
Total distributions | | | (.28 | ) | | | (.45 | ) | | | — | | | | — | | | | — | |
Net asset value, end of period | | $ | 48.29 | | | $ | 55.12 | | | $ | 52.25 | | | $ | 43.27 | | | $ | 53.03 | |
|
Total Return | | | (11.86 | %) | | | 6.39 | % | | | 20.75 | % | | | (18.39 | %) | | | 11.64 | % |
Ratios/Supplemental Data |
Net assets, end of period (in thousands) | | $ | 2,437 | | | $ | 10,549 | | | $ | 5,017 | | | $ | 6,301 | | | $ | 7,506 | |
Ratios to average net assets: |
Net investment income (loss) | | | (1.36 | %) | | | 0.22 | % | | | 0.36 | % | | | (0.36 | %) | | | (1.11 | %) |
Total expensesc | | | 1.94 | % | | | 2.00 | % | | | 1.83 | % | | | 1.72 | % | | | 1.73 | % |
Net expensesd | | | 1.90 | % | | | 1.96 | % | | | 1.82 | % | | | 1.72 | % | | | 1.73 | % |
Portfolio turnover rate | | | — | | | | — | | | | 9 | % | | | — | | | | 142 | % |
a | Net investment income (loss) per share was computed using average shares outstanding throughout the period. |
b | Total return does not reflect the impact of any applicable sales charges. |
c | Does not include expenses of the underlying funds in which the Fund invests. |
d | Net expense information reflects the expense ratios after expense waivers and reimbursements, as applicable. |
SEE NOTES TO FINANCIAL STATEMENTS. | THE RYDEX FUNDS ANNUAL REPORT | 85 |
PERFORMANCE REPORT AND FUND PROFILE (Unaudited) | March 31, 2021 |
WEAKENING DOLLAR 2x STRATEGY FUND
OBJECTIVE: Seeks to provide investment results that match, before fees and expenses, the performance of a specific benchmark on a daily basis. The Fund’s current benchmark is 200% of the inverse (opposite) of the performance of the U.S. Dollar Index® (the “underlying index”). The Fund does not seek to achieve its investment objective over a period of time greater than one day.
For the one year period ended March 31, 2021, Weakening Dollar 2x Strategy Fund maintained a daily correlation of over 99% to its benchmark of -200% of the daily price movement of the underlying index. Weakening Dollar 2x Strategy Fund H-Class returned 10.29%, compared with a return of -5.88% for its benchmark, the underlying index.
Contributing the most to performance of the underlying index for the year were the Japanese Yen, Swiss Franc and Swedish Krona. The Euro, British Pound, and Canadian Dollar detracted the most from performance.
Derivatives in the Fund were used to help provide exposure to the composition of the benchmark in the highest efficient manner and to provide leverage, not for hedging purposes. The results of derivatives use during the period were within our expectations and were a factor in the Fund’s negative performance.
Due to the compounding of daily returns, leveraged and inverse funds’ returns over periods other than one day will likely differ in amount and possibly direction from the benchmark return for the same period. Investors should monitor their leveraged and inverse funds’ holdings to ensure that they are consistent with their strategies, as frequently as daily.
The effects of compounding may cause the longer-term correlation of the Fund to its benchmark to diminish. The apparent discrepancy between the leveraged and unleveraged indices is the result of compounding, which is described briefly on page 6 of this report.
The Fund may invest in certain of the underlying series of Guggenheim Funds Trust and Guggenheim Strategy Funds Trust, including Guggenheim Ultra Short Duration, Guggenheim Strategy Fund II and Guggenheim Strategy Fund III (collectively, the “Short Term Investment Vehicles”), each of which are open-end management investment companies managed by Guggenheim Investments. The Short Term Investment Vehicles, which launched on March 11, 2014, are offered as short term investment options only to mutual funds, trusts, and other accounts managed by Guggenheim Investments and/or its affiliates, and are not available to the public, with the exception of Guggenheim Ultra Short Duration Fund, which is available to the public. Guggenheim Strategy Fund II and Guggenheim Strategy Fund III do not charge an investment management fee. Guggenheim Ultra Short Duration Fund charges an investment management fee but the Fund’s adviser has agreed to waive fees to the extent necessary to offset the proportionate share of any management fee paid by the Fund with respect to its investment in Guggenheim Ultra Short Duration Fund. For the one year period ended March 31, 2021, investment in the Short Term Investment Vehicles benefited Fund performance.
Performance displayed represents past performance, which is no guarantee of future result.
Holdings Diversification (Market Exposure as % of Net Assets)
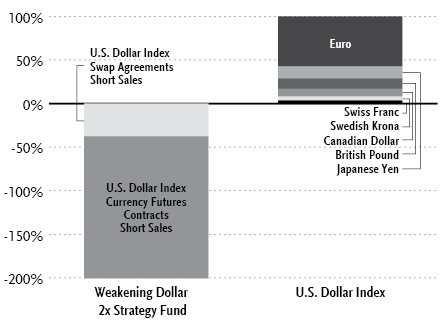
“Holdings Diversification (Market Exposure as % of Net Assets)” excludes any temporary cash investments, investments in Guggenheim Strategy Funds Trust mutual funds, or investments in Guggenheim Ultra Short Duration Fund. Investments in those Funds do not provide “market exposure” to meet the Fund’s investment objective, but will significantly increase the portfolio’s exposure to certain other asset categories (and their associated risks), which may cause the Fund to deviate from its principal investment strategy, including: (i) high yield, high risk debt securities rated below the top four long-term rating categories by a nationally recognized statistical rating organization (also known as “junk bonds”); (ii) securities issued by the U.S. government or its agencies and instrumentalities; (iii) CLOs and similar investments; and (iv) other short-term fixed income securities.
86 | THE RYDEX FUNDS ANNUAL REPORT | |
PERFORMANCE REPORT AND FUND PROFILE (Unaudited)(concluded) | March 31, 2021 |
Inception Dates: |
A-Class | May 25, 2005 |
C-Class | May 25, 2005 |
H-Class | May 25, 2005 |
The Fund invests principally in derivative investments such as swap agreements and futures contracts.
Largest Holdings (% of Total Net Assets) |
Guggenheim Strategy Fund II | 26.5% |
Guggenheim Ultra Short Duration Fund — Institutional Class | 25.8% |
Total | 52.3% |
| | |
“Largest Holdings” excludes any temporary cash or derivative investments. |
Cumulative Fund Performance*
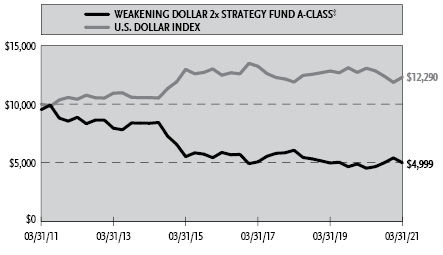
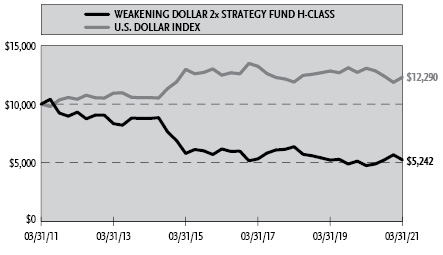
Average Annual Returns*
Periods Ended March 31, 2021
| 1 Year | 5 Year | 10 Year |
A-Class Shares | 10.32% | (3.19%) | (6.25%) |
A-Class Shares with sales charge‡ | 5.09% | (4.13%) | (6.70%) |
C-Class Shares | 9.50% | (3.93%) | (6.95%) |
C-Class Shares with CDSC§ | 8.50% | (3.93%) | (6.95%) |
H-Class Shares | 10.29% | (3.21%) | (6.25%) |
U.S. Dollar Index | (5.88%) | (0.29%) | 2.08% |
* | The performance data above represents past performance that is not predictive of future results. The investment return and principal value of an investment in the Fund will fluctuate so that an investor’s shares, when redeemed, may be worth more or less than their original cost. Returns are historical and include changes in principal and reinvested dividends and capital gains and do not reflect the effect of taxes. The U.S. Dollar Index is an unmanaged index and, unlike the Fund, has no management fees or operating expenses to reduce its reported return. The graphs are based on A-Class and H-Class shares only; performance for C-Class shares will vary due to differences in fee structure. |
‡ | Fund returns are calculated using the maximum sales charge of 4.75%. |
§ | Fund returns include a CDSC of 1% if redeemed within 12 months of purchase. |
| | THE RYDEX FUNDS ANNUAL REPORT | 87 |
SCHEDULE OF INVESTMENTS | March 31, 2021 |
WEAKENING DOLLAR 2x STRATEGY FUND | |
| | Shares | | | Value | |
MUTUAL FUNDS† - 52.3% |
Guggenheim Strategy Fund II1 | | | 15,742 | | | $ | 393,238 | |
Guggenheim Ultra Short Duration Fund — Institutional Class1 | | | 38,580 | | | | 384,261 | |
Total Mutual Funds | | | | |
(Cost $772,094) | | | | | | | 777,499 | |
| | | | | | | | | |
| | | Face
Amount | | | | | |
FEDERAL AGENCY NOTES†† - 20.9% |
Federal Farm Credit Bank |
0.45% (U.S. Prime Rate - 2.80%, Rate Floor: 0.00%) due 03/14/222 | | $ | 250,000 | | | | 250,792 | |
0.44% (U.S. Prime Rate - 2.81%, Rate Floor: 0.00%) due 05/20/222 | | | 60,000 | | | | 60,241 | |
Total Federal Agency Notes | | | | |
(Cost $310,000) | | | | | | | 311,033 | |
| | | | | | | | | |
U.S. TREASURY BILLS†† - 3.6% |
U.S. Treasury Bills |
0.01% due 04/22/213,4 | | | 54,000 | | | | 54,000 | |
Total U.S. Treasury Bills | | | | |
(Cost $54,000) | | | | | | | 54,000 | |
| | | | | | | | | |
REPURCHASE AGREEMENTS††,5 - 27.4% |
J.P. Morgan Securities LLC
issued 03/31/21 at 0.01%
due 04/01/216 | | | 217,512 | | | | 217,512 | |
Barclays Capital, Inc.
issued 03/31/21 at 0.01%
due 04/01/216 | | | 98,891 | | | | 98,891 | |
BofA Securities, Inc.
issued 03/31/21 at 0.01%
due 04/01/216 | | | 90,254 | | | | 90,254 | |
Total Repurchase Agreements | | | | |
(Cost $406,657) | | | | | | | 406,657 | |
| | | | | | | | | |
Total Investments - 104.2% | | | | |
(Cost $1,542,751) | | $ | 1,549,189 | |
Other Assets & Liabilities, net - (4.2)% | | | (62,408 | ) |
Total Net Assets - 100.0% | | $ | 1,486,781 | |
Futures Contracts |
Description | | Number of
Contracts | | | Expiration
Date | | | Notional
Amount | | | Value and
Unrealized
Depreciation** | |
Currency Futures Contracts Sold Short† |
U.S. Dollar Index Futures Contracts | | | 26 | | | | Jun 2021 | | | $ | 2,424,370 | | | $ | (32,638 | ) |
Total Return Swap Agreements |
Counterparty | Index | Financing
Rate Pay
(Receive) | Payment
Frequency | | Maturity
Date | | | Units | | | Notional
Amount | | | Value and
Unrealized
Depreciation | |
OTC Currency Index Swap Agreements Sold Short†† |
Goldman Sachs International | U.S. Dollar Index | N/A | At Maturity | | | 06/17/21 | | | | 5,978 | | | $ | 557,034 | | | $ | (8,243 | ) |
** | Includes cumulative appreciation (depreciation). Variation margin is reported within the Statement of Assets and Liabilities. |
† | Value determined based on Level 1 inputs — See Note 4. |
†† | Value determined based on Level 2 inputs — See Note 4. |
1 | Affiliated issuer. |
2 | Variable rate security. Rate indicated is the rate effective at March 31, 2021. In some instances, the effective rate is limited by a minimum rate floor or a maximum rate cap established by the issuer. The settlement status of a position may also impact the effective rate indicated. In some cases, a position may be unsettled at period end and may not have a stated effective rate. In instances where multiple underlying reference rates and spread amounts are shown, the effective rate is based on a weighted average. |
3 | All or a portion of this security is pledged as futures collateral at March 31, 2021. |
4 | Rate indicated is the effective yield at the time of purchase. |
5 | Repurchase Agreements — See Note 6. |
6 | All or a portion of this security is pledged as currency index swap collateral at March 31, 2021. |
| | |
| | See Sector Classification in Other Information section. |
88 | THE RYDEX FUNDS ANNUAL REPORT | SEE NOTES TO FINANCIAL STATEMENTS. |
SCHEDULE OF INVESTMENTS (concluded) | March 31, 2021 |
WEAKENING DOLLAR 2x STRATEGY FUND | |
The following table summarizes the inputs used to value the Fund’s investments at March 31, 2021 (See Note 4 in the Notes to Financial Statements):
Investments in Securities (Assets) | | Level 1
Quoted
Prices | | | Level 2
Significant
Observable
Inputs | | | Level 3
Significant
Unobservable
Inputs | | | Total | |
Mutual Funds | | $ | 777,499 | | | $ | — | | | $ | — | | | $ | 777,499 | |
Federal Agency Notes | | | — | | | | 311,033 | | | | — | | | | 311,033 | |
U.S. Treasury Bills | | | — | | | | 54,000 | | | | — | | | | 54,000 | |
Repurchase Agreements | | | — | | | | 406,657 | | | | — | | | | 406,657 | |
Total Assets | | $ | 777,499 | | | $ | 771,690 | | | $ | — | | | $ | 1,549,189 | |
Investments in Securities (Liabilities) | | Level 1
Quoted
Prices | | | Level 2
Significant
Observable
Inputs | | | Level 3
Significant
Unobservable
Inputs | | | Total | |
Currency Futures Contracts** | | $ | 32,638 | | | $ | — | | | $ | — | | | $ | 32,638 | |
Currency Index Swap Agreements** | | | — | | | | 8,243 | | | | — | | | | 8,243 | |
Total Liabilities | | $ | 32,638 | | | $ | 8,243 | | | $ | — | | | $ | 40,881 | |
** | This derivative is reported as unrealized appreciation/depreciation at period end. |
Affiliated Transactions
Investments representing 5% or more of the outstanding voting shares of a company, or control of or by, or common control under Guggenheim Investments (“GI”), result in that company being considered an affiliated issuer, as defined in the 1940 Act.
The Fund may invest in certain of the underlying series of Guggenheim Strategy Funds Trust, including Guggenheim Strategy Fund II and Guggenheim Strategy Fund III, (collectively, the “Short Term Investment Vehicles”), each of which are open-end management investment companies managed by GI. The Short Term Investment Vehicles, which launched on March 11, 2014, are offered as short term investment options only to mutual funds, trusts, and other accounts managed by GI and/or its affiliates, and are not available to the public. The Short Term Investment Vehicles pay no investment management fees. The Short Term Investment Vehicles’ annual report on Form N-CSR dated September 30, 2020, is available publicly or upon request. This information is available from the EDGAR database on the SEC’s website at https://www.sec.gov/Archives/edgar/data/1601445/000182126820000133/gug81042-ncsr.htm.
Transactions during the year ended March 31, 2021, in which the company is an affiliated issuer, were as follows:
Security Name | | Value
03/31/20 | | | Additions | | | Reductions | | | Realized
Gain (Loss) | | | Change in
Unrealized
Appreciation
(Depreciation) | | | Value
03/31/21 | | | Shares
03/31/21 | | | Investment
Income | |
Mutual Funds | | | | | | | | | | | | | | | | | | | | | | | | | | | | | | | | |
Guggenheim Strategy Fund II | | $ | 165,222 | | | $ | 370,000 | | | $ | (150,000 | ) | | $ | (423 | ) | | $ | 8,439 | | | $ | 393,238 | | | | 15,742 | | | $ | 5,662 | |
Guggenheim Ultra Short Duration Fund — Institutional Class | | | 170,685 | | | | 370,000 | | | | (160,000 | ) | | | (507 | ) | | | 4,083 | | | | 384,261 | | | | 38,580 | | | | 3,646 | |
| | | $ | 335,907 | | | $ | 740,000 | | | $ | (310,000 | ) | | $ | (930 | ) | | $ | 12,522 | | | $ | 777,499 | | | | | | | $ | 9,308 | |
SEE NOTES TO FINANCIAL STATEMENTS. | THE RYDEX FUNDS ANNUAL REPORT | 89 |
WEAKENING DOLLAR 2x STRATEGY FUND | |
STATEMENT OF ASSETS AND LIABILITIES |
March 31, 2021 |
Assets: |
Investments in unaffiliated issuers, at value (cost $364,000) | | $ | 365,033 | |
Investments in affiliated issuers, at value (cost $772,094) | | | 777,499 | |
Repurchase agreements, at value (cost $406,657) | | | 406,657 | |
Receivables: |
Fund shares sold | | | 4,084 | |
Variation margin on futures contracts | | | 1,976 | |
Dividends | | | 792 | |
Interest | | | 85 | |
Total assets | | | 1,556,126 | |
| | | | | |
Liabilities: |
Unrealized depreciation on OTC swap agreements | | | 8,243 | |
Payable for: |
Fund shares redeemed | | | 47,749 | |
Swap settlement | | | 6,511 | |
Management fees | | | 1,185 | |
Distribution and service fees | | | 382 | |
Transfer agent and administrative fees | | | 379 | |
Portfolio accounting fees | | | 141 | |
Trustees’ fees* | | | 26 | |
Miscellaneous | | | 4,729 | |
Total liabilities | | | 69,345 | |
Commitments and contingent liabilities (Note 12) | | | — | |
Net assets | | $ | 1,486,781 | |
| | | | | |
Net assets consist of: |
Paid in capital | | $ | 11,338,250 | |
Total distributable earnings (loss) | | | (9,851,469 | ) |
Net assets | | $ | 1,486,781 | |
| | | | | |
A-Class: |
Net assets | | $ | 387,087 | |
Capital shares outstanding | | | 6,076 | |
Net asset value per share | | $ | 63.71 | |
Maximum offering price per share (Net asset value divided by 95.25%) | | $ | 66.89 | |
| | | | | |
C-Class: |
Net assets | | $ | 37,105 | |
Capital shares outstanding | | | 665 | |
Net asset value per share | | $ | 55.80 | |
| | | | | |
H-Class: |
Net assets | | $ | 1,062,589 | |
Capital shares outstanding | | | 16,709 | |
Net asset value per share | | $ | 63.59 | |
STATEMENT OF OPERATIONS |
Year Ended March 31, 2021 |
Investment Income: |
Dividends from securities of affiliated issuers | | $ | 9,308 | |
Interest | | | 3,616 | |
Total investment income | | | 12,924 | |
| | | | | |
Expenses: |
Management fees | | | 28,268 | |
Distribution and service fees: |
A-Class | | | 1,019 | |
C-Class | | | 292 | |
H-Class | | | 6,760 | |
Transfer agent and administrative fees | | | 8,859 | |
Licensing fees | | | 4,298 | |
Registration fees | | | 3,143 | |
Portfolio accounting fees | | | 3,142 | |
Professional fees | | | 1,701 | |
Trustees’ fees* | | | 772 | |
Custodian fees | | | 462 | |
Miscellaneous | | | 673 | |
Total expenses | | | 59,389 | |
Less: |
Expenses waived by Adviser | | | (813 | ) |
Net expenses | | | 58,576 | |
Net investment loss | | | (45,652 | ) |
| | | | | |
Net Realized and Unrealized Gain (Loss): |
Net realized gain (loss) on: |
Investments in unaffiliated issuers | | | 1,070 | |
Investments in affiliated issuers | | | (930 | ) |
Swap agreements | | | 57,037 | |
Futures contracts | | | 363,687 | |
Net realized gain | | | 420,864 | |
Net change in unrealized appreciation (depreciation) on: |
Investments in unaffiliated issuers | | | 859 | |
Investments in affiliated issuers | | | 12,522 | |
Swap agreements | | | (11,416 | ) |
Futures contracts | | | (49 | ) |
Net change in unrealized appreciation (depreciation) | | | 1,916 | |
Net realized and unrealized gain | | | 422,780 | |
Net increase in net assets resulting from operations | | $ | 377,128 | |
* | Relates to Trustees not deemed “interested persons” within the meaning of Section 2(a)(19) of the 1940 Act. |
90 | THE RYDEX FUNDS ANNUAL REPORT | SEE NOTES TO FINANCIAL STATEMENTS. |
WEAKENING DOLLAR 2x STRATEGY FUND | |
STATEMENTS OF CHANGES IN NET ASSETS |
| | Year Ended
March 31,
2021 | | | Year Ended
March 31,
2020 | |
Increase (Decrease) in Net Assets from Operations: | | | | | | | | |
Net investment income (loss) | | $ | (45,652 | ) | | $ | 3,912 | |
Net realized gain (loss) on investments | | | 420,864 | | | | (248,640 | ) |
Net change in unrealized appreciation (depreciation) on investments | | | 1,916 | | | | (4,453 | ) |
Net increase (decrease) in net assets resulting from operations | | | 377,128 | | | | (249,181 | ) |
| | | | | | | | | |
Distributions to shareholders: | | | | | | | | |
A-Class | | | (726 | ) | | | (981 | ) |
C-Class | | | (70 | ) | | | (86 | ) |
H-Class | | | (3,116 | ) | | | (11,434 | ) |
Total distributions to shareholders | | | (3,912 | ) | | | (12,501 | ) |
| | | | | | | | | |
Capital share transactions: | | | | | | | | |
Proceeds from sale of shares | | | | | | | | |
A-Class | | | 686,728 | | | | 3,412,501 | |
C-Class | | | 81,908 | | | | 5,000 | |
H-Class | | | 50,241,475 | | | | 34,836,156 | |
Distributions reinvested | | | | | | | | |
A-Class | | | 690 | | | | 918 | |
C-Class | | | 70 | | | | 86 | |
H-Class | | | 2,901 | | | | 11,032 | |
Cost of shares redeemed | | | | | | | | |
A-Class | | | (563,534 | ) | | | (3,440,177 | ) |
C-Class | | | (64,608 | ) | | | (17,656 | ) |
H-Class | | | (50,838,141 | ) | | | (34,990,291 | ) |
Net decrease from capital share transactions | | | (452,511 | ) | | | (182,431 | ) |
Net decrease in net assets | | | (79,295 | ) | | | (444,113 | ) |
| | | | | | | | | |
Net assets: | | | | | | | | |
Beginning of year | | | 1,566,076 | | | | 2,010,189 | |
End of year | | $ | 1,486,781 | | | $ | 1,566,076 | |
| | | | | | | | | |
Capital share activity: | | | | | | | | |
Shares sold | | | | | | | | |
A-Class | | | 10,681 | | | | 54,128 | |
C-Class | | | 1,385 | | | | 99 | |
H-Class | | | 802,800 | | | | 565,225 | |
Shares issued from reinvestment of distributions | | | | | | | | |
A-Class | | | 10 | | | | 15 | |
C-Class | | | 1 | | | | 2 | |
H-Class | | | 43 | | | | 179 | |
Shares redeemed | | | | | | | | |
A-Class | | | (8,718 | ) | | | (54,689 | ) |
C-Class | | | (1,129 | ) | | | (320 | ) |
H-Class | | | (808,775 | ) | | | (569,120 | ) |
Net decrease in shares | | | (3,702 | ) | | | (4,481 | ) |
SEE NOTES TO FINANCIAL STATEMENTS. | THE RYDEX FUNDS ANNUAL REPORT | 91 |
WEAKENING DOLLAR 2x STRATEGY FUND | |
This table is presented to show selected data for a share outstanding throughout each period and to assist shareholders in evaluating a Fund’s performance for the periods presented.
A-Class | | Year Ended
March 31,
2021 | | | Year Ended
March 31,
2020 | | | Year Ended
March 31,
2019 | | | Year Ended
March 29,
2018 | | | Year Ended
March 31,
2017e | |
Per Share Data |
Net asset value, beginning of period | | $ | 57.85 | | | $ | 63.74 | | | $ | 77.67 | | | $ | 64.99 | | | $ | 75.31 | |
Income (loss) from investment operations: |
Net investment income (loss)a | | | (.84 | ) | | | .16 | | | | .23 | | | | (.35 | ) | | | (.80 | ) |
Net gain (loss) on investments (realized and unrealized) | | | 6.82 | | | | (5.84 | ) | | | (14.16 | ) | | | 13.03 | | | | (9.52 | ) |
Total from investment operations | | | 5.98 | | | | (5.68 | ) | | | (13.93 | ) | | | 12.68 | | | | (10.32 | ) |
Less distributions from: |
Net investment income | | | (.12 | ) | | | (.21 | ) | | | — | | | | — | | | | — | |
Total distributions | | | (.12 | ) | | | (.21 | ) | | | — | | | | — | | | | — | |
Net asset value, end of period | | $ | 63.71 | | | $ | 57.85 | | | $ | 63.74 | | | $ | 77.67 | | | $ | 64.99 | |
|
Total Returnb | | | 10.32 | % | | | (8.94 | %) | | | (17.93 | %) | | | 19.51 | % | | | (13.69 | %) |
Ratios/Supplemental Data |
Net assets, end of period (in thousands) | | $ | 387 | | | $ | 237 | | | $ | 296 | | | $ | 3,306 | | | $ | 324 | |
Ratios to average net assets: |
Net investment income (loss) | | | (1.30 | %) | | | 0.26 | % | | | 0.32 | % | | | (0.48 | %) | | | (1.13 | %) |
Total expensesc | | | 1.90 | % | | | 2.01 | % | | | 1.80 | % | | | 1.72 | % | | | 1.72 | % |
Net expensesd | | | 1.86 | % | | | 2.00 | % | | | 1.80 | % | | | 1.72 | % | | | 1.72 | % |
Portfolio turnover rate | | | 48 | % | | | — | | | | — | | | | 28 | % | | | 77 | % |
C-Class | | Year Ended
March 31,
2021 | | | Year Ended
March 31,
2020 | | | Year Ended
March 31,
2019 | | | Year Ended
March 29,
2018 | | | Year Ended
March 31,
2017e | |
Per Share Data |
Net asset value, beginning of period | | $ | 51.07 | | | $ | 56.74 | | | $ | 69.66 | | | $ | 58.72 | | | $ | 68.57 | |
Income (loss) from investment operations: |
Net investment income (loss)a | | | (1.17 | ) | | | (.29 | ) | | | (.27 | ) | | | (.80 | ) | | | (1.19 | ) |
Net gain (loss) on investments (realized and unrealized) | | | 6.02 | | | | (5.17 | ) | | | (12.65 | ) | | | 11.74 | | | | (8.66 | ) |
Total from investment operations | | | 4.85 | | | | (5.46 | ) | | | (12.92 | ) | | | 10.94 | | | | (9.85 | ) |
Less distributions from: |
Net investment income | | | (.12 | ) | | | (.21 | ) | | | — | | | | — | | | | — | |
Total distributions | | | (.12 | ) | | | (.21 | ) | | | — | | | | — | | | | — | |
Net asset value, end of period | | $ | 55.80 | | | $ | 51.07 | | | $ | 56.74 | | | $ | 69.66 | | | $ | 58.72 | |
|
Total Returnb | | | 9.50 | % | | | (9.65 | %) | | | (18.55 | %) | | | 18.65 | % | | | (14.39 | %) |
Ratios/Supplemental Data |
Net assets, end of period (in thousands) | | $ | 37 | | | $ | 21 | | | $ | 36 | | | $ | 388 | | | $ | 695 | |
Ratios to average net assets: |
Net investment income (loss) | | | (2.04 | %) | | | (0.53 | %) | | | (0.42 | %) | | | (1.23 | %) | | | (1.88 | %) |
Total expensesc | | | 2.66 | % | | | 2.75 | % | | | 2.53 | % | | | 2.47 | % | | | 2.47 | % |
Net expensesd | | | 2.62 | % | | | 2.73 | % | | | 2.53 | % | | | 2.47 | % | | | 2.47 | % |
Portfolio turnover rate | | | 48 | % | | | — | | | | — | | | | 28 | % | | | 77 | % |
92 | THE RYDEX FUNDS ANNUAL REPORT | SEE NOTES TO FINANCIAL STATEMENTS. |
WEAKENING DOLLAR 2x STRATEGY FUND | |
FINANCIAL HIGHLIGHTS (concluded) |
This table is presented to show selected data for a share outstanding throughout each period and to assist shareholders in evaluating a Fund’s performance for the periods presented.
H-Class | | Year Ended
March 31,
2021 | | | Year Ended
March 31,
2020 | | | Year Ended
March 31,
2019 | | | Year Ended
March 29,
2018 | | | Year Ended
March 31,
2017e | |
Per Share Data |
Net asset value, beginning of period | | $ | 57.76 | | | $ | 63.67 | | | $ | 77.60 | | | $ | 64.92 | | | $ | 75.23 | |
Income (loss) from investment operations: |
Net investment income (loss)a | | | (.93 | ) | | | .07 | | | | .28 | | | | (.36 | ) | | | (.85 | ) |
Net gain (loss) on investments (realized and unrealized) | | | 6.88 | | | | (5.77 | ) | | | (14.21 | ) | | | 13.04 | | | | (9.46 | ) |
Total from investment operations | | | 5.95 | | | | (5.70 | ) | | | (13.93 | ) | | | 12.68 | | | | (10.31 | ) |
Less distributions from: |
Net investment income | | | (.12 | ) | | | (.21 | ) | | | — | | | | — | | | | — | |
Total distributions | | | (.12 | ) | | | (.21 | ) | | | — | | | | — | | | | — | |
Net asset value, end of period | | $ | 63.59 | | | $ | 57.76 | | | $ | 63.67 | | | $ | 77.60 | | | $ | 64.92 | |
|
Total Return | | | 10.29 | % | | | (8.98 | %) | | | (17.95 | %) | | | 19.55 | % | | | (13.73 | %) |
Ratios/Supplemental Data |
Net assets, end of period (in thousands) | | $ | 1,063 | | | $ | 1,308 | | | $ | 1,678 | | | $ | 3,267 | | | $ | 5,068 | |
Ratios to average net assets: |
Net investment income (loss) | | | (1.47 | %) | | | 0.12 | % | | | 0.41 | % | | | (0.49 | %) | | | (1.19 | %) |
Total expensesc | | | 1.88 | % | | | 1.99 | % | | | 1.83 | % | | | 1.72 | % | | | 1.71 | % |
Net expensesd | | | 1.86 | % | | | 1.97 | % | | | 1.83 | % | | | 1.72 | % | | | 1.71 | % |
Portfolio turnover rate | | | 48 | % | | | — | | | | — | | | | 28 | % | | | 77 | % |
a | Net investment income (loss) per share was computed using average shares outstanding throughout the period. |
b | Total return does not reflect the impact of any applicable sales charges. |
c | Does not include expenses of the underlying funds in which the Fund invests. |
d | Net expense information reflects the expense ratios after expense waivers and reimbursements, as applicable. |
e | Reverse share split — Per share amounts for the year ended March 31, 2017 have been restated to reflect a 1:6 reverse share split effective October 28, 2016. |
SEE NOTES TO FINANCIAL STATEMENTS. | THE RYDEX FUNDS ANNUAL REPORT | 93 |
NOTES TO FINANCIAL STATEMENTS |
Note 1 – Organization and Significant Accounting Policies
Organization
The Rydex Series Funds (the “Trust”), a Delaware statutory trust, is registered with the SEC under the Investment Company Act of 1940 (”1940 Act”), as an open-ended investment company of the series type. Each series, in effect, is representing a separate fund (each, a “Fund”). The Trust may issue an unlimited number of authorized shares. The Trust accounts for the assets of each Fund separately.
The Trust offers a combination of seven separate classes of shares: Investor Class shares, A-Class shares, C-Class shares, H-Class shares, P-Class shares, Institutional Class shares and Money Market Class shares. Sales of shares of each Class are made without a front-end sales charge at the net asset value per share (“NAV”), with the exception of A-Class shares. A-Class shares are sold at the NAV, plus the applicable front-end sales charge. The sales charge varies depending on the amount purchased, but will not exceed 4.75%. A-Class share purchases of $1 million or more are exempt from the front-end sales charge but have a 1% contingent deferred sales charge (“CDSC”) if shares are redeemed within 12 months of purchase. C-Class shares have a 1% CDSC if shares are redeemed within 12 months of purchase. C-Class shares of each Fund automatically convert to A-Class shares of the same Fund on or about the 10th day of the month following the 10-year anniversary of the purchase of the C-Class shares. This conversion will be executed without any sales charge, fee or other charge. After the conversion is completed, the shares will be subject to all features and expenses of A-Class shares. Institutional Class shares are offered primarily for direct investment by institutions such as pension and profit sharing plans, endowments, foundations and corporations. Institutional Class shares require a minimum initial investment of $2 million and a minimum account balance of $1 million. At March 31, 2021, the Trust consisted of fifty-two funds.
This report covers the following funds (collectively, the “Funds”):
Fund Name | Investment
Company Type |
S&P 500® Pure Growth Fund | Non-diversified |
S&P 500® Pure Value Fund | Non-diversified |
S&P MidCap 400® Pure Growth Fund | Non-diversified |
S&P MidCap 400® Pure Value Fund | Non-diversified |
S&P SmallCap 600® Pure Growth Fund | Non-diversified |
S&P SmallCap 600® Pure Value Fund | Non-diversified |
Europe 1.25x Strategy Fund | Non-diversified |
Japan 2x Strategy Fund | Non-diversified |
Strengthening Dollar 2x Strategy Fund | Non-diversified |
Weakening Dollar 2x Strategy Fund | Non-diversified |
At March 31, 2021, only A-Class, C-Class and H-Class shares have been issued by the Funds.
The Funds are designed and operated to accommodate frequent trading by shareholders and, unlike most mutual funds, offer unlimited exchange privileges with no minimum holding periods or transactions fees, which may cause the Funds to experience high portfolio turnover.
Security Investors, LLC, which operates under the name Guggenheim Investments (“GI”), provides advisory services. Guggenheim Funds Distributors, LLC (“GFD”) acts as principal underwriter for the Trust. GI and GFD are affiliated entities.
Significant Accounting Policies
The Funds operate as investment companies and, accordingly, follow the investment company accounting and reporting guidance of the Financial Accounting Standards Board (“FASB”) Accounting Standards Codification Topic 946 Financial Services – Investment Companies.
The following significant accounting policies are in conformity with U.S. generally accepted accounting principles (“U.S. GAAP”) and are consistently followed by the Trust. This requires management to make estimates and assumptions that affect the reported amount of assets and liabilities, contingent assets and liabilities at the date of the financial statements, and the reported amounts of revenues and expenses during the reporting period. Actual results could differ from these estimates. All time references are based on Eastern Time.
The NAV of each Class of a fund is calculated by dividing the market value of a fund’s securities and other assets, less all liabilities, attributable to the Class by the number of outstanding shares of the Class.
(a) Valuation of Investments
The Board of Trustees of the Funds (the “Board”) has adopted policies and procedures for the valuation of the Funds’ investments (the “Valuation Procedures”). Pursuant to the Valuation Procedures, the Board has delegated to a valuation committee, consisting of representatives from Guggenheim’s investment management, fund administration, legal and compliance departments (the “Valuation Committee”), the day-to-day responsibility for implementing the Valuation Procedures, including, under most circumstances, the responsibility for determining the fair value of the Funds’ securities and/or other assets.
Valuations of the Funds’ securities and other assets are supplied primarily by pricing services appointed pursuant to the processes set forth in the Valuation Procedures. The Valuation Committee convenes monthly, or more frequently as needed, to review the valuation of all assets which have been fair valued for reasonableness. The Funds’ officers, through the Valuation
94 | THE RYDEX FUNDS ANNUAL REPORT | |
NOTES TO FINANCIAL STATEMENTS (continued) |
Committee and consistent with the monitoring and review responsibilities set forth in the Valuation Procedures, regularly review procedures used and valuations provided by the pricing services.
If the pricing service cannot or does not provide a valuation for a particular investment or such valuation is deemed unreliable, such investment is fair valued by the Valuation Committee.
Equity securities listed or traded on a recognized U.S. securities exchange or the National Association of Securities Dealers Automated Quotations (“NASDAQ”) National Market System shall generally be valued on the basis of the last sale price on the primary U.S. exchange or market on which the security is listed or traded; provided, however, that securities listed on NASDAQ will be valued at the NASDAQ Official Closing Price, which may not necessarily represent the last sale price. If there is no sale on the valuation date, exchange-traded U.S. equity securities will be valued on the basis of the last bid price.
Open-end investment companies are valued at their NAV as of the close of business, on the valuation date. Exchange-traded funds and closed-end investment companies are valued at the last quoted sale price.
U.S. Government securities are valued by independent pricing services, the last traded fill price, or at the reported bid price at the close of business.
Debt securities with a maturity of greater than 60 days at acquisition are valued at prices that reflect broker-dealer supplied valuations or are obtained from independent pricing services, which may consider the trade activity, treasury spreads, yields or price of bonds of comparable quality, coupon, maturity, and type, as well as prices quoted by dealers who make markets in such securities. Short-term debt securities with a maturity of 60 days or less at acquisition are valued at amortized cost, provided such amount approximates market value.
Repurchase agreements are generally valued at amortized cost, provided such amounts approximate market value.
The value of futures contracts is accounted for using the unrealized appreciation or depreciation on the contracts that is determined by marking the contracts to their current realized settlement prices. Financial futures contracts are valued at the 4:00 p.m. price on the valuation date. In the event that the exchange for a specific futures contract closes earlier than 4:00 p.m., the futures contract is valued at the official settlement price of the exchange. However, the underlying securities from which the futures contract value is derived are monitored until 4:00 p.m. to determine if fair valuation would provide a more accurate valuation.
The value of currency index swap agreements entered into by a Fund is accounted for using the unrealized appreciation or depreciation on the agreements that is determined by marking the agreements to the broker quote.
Investments for which market quotations are not readily available are fair-valued as determined in good faith by GI, subject to review and approval by the Valuation Committee, pursuant to methods established or ratified by the Board. Valuations in accordance with these methods are intended to reflect each security’s (or asset’s or liability’s) “fair value”. Each such determination is based on a consideration of all relevant factors, which are likely to vary from one pricing context to another. Examples of such factors may include, but are not limited to market prices; sale prices; broker quotes; and models which derive prices based on inputs such as prices of securities with comparable maturities and characteristics, or based on inputs such as anticipated cash flows or collateral, spread over U.S. Treasury securities, and other information analysis. In connection with futures contracts and other derivative investments, such factors may include obtaining information as to how (a) these contracts and other derivative investments trade in the futures or other derivative markets, respectively, and (b) the securities underlying these contracts and other derivative investments trade in the cash market.
(b) U.S. Government and Agency Obligations
Certain U.S. Government and Agency Obligations are traded on a discount basis; the interest rates shown on the Schedules of Investments reflect the effective rates paid at the time of purchase by the Funds. Other securities bear interest at the rates shown, payable at fixed dates through maturity.
(c) Futures Contracts
Upon entering into a futures contract, a Fund deposits and maintains as collateral such initial margin as required by the exchange on which the transaction is affected. Pursuant to the contract, the Fund agrees to receive from or pay to the broker an amount of cash equal to the daily fluctuation in value of the contract. Such receipts or payments are known as variation margin and are recorded by the Fund as unrealized appreciation or depreciation. When the contract is closed, the Fund records a realized gain or loss equal to the difference between the value of the contract at the time it was opened and the value at the time it was closed.
(d) Swap Agreements
Swap agreements are marked-to-market daily and the change, if any, is recorded as unrealized appreciation or depreciation. Payments received or made as a result of an agreement or termination of an agreement are recognized as realized gains or losses.
| | THE RYDEX FUNDS ANNUAL REPORT | 95 |
NOTES TO FINANCIAL STATEMENTS (continued) |
(e) Currency Translations
The accounting records of the Funds are maintained in U.S. dollars. All assets and liabilities initially expressed in foreign currencies are converted into U.S. dollars at prevailing exchange rates. Purchases and sales of investment securities, dividend and interest income, and certain expenses are translated at the rates of exchange prevailing on the respective dates of such transactions. Changes in the relationship of these foreign currencies to the U.S. dollar can significantly affect the value of the investments and earnings of the Funds. Foreign investments may also subject the Funds to foreign government exchange restrictions, expropriation, taxation, or other political, social or economic developments, all of which could affect the market and/or credit risk of the investments.
The Funds do not isolate that portion of the results of operations resulting from changes in the foreign exchange rates on investments from the fluctuations arising from changes in the market prices of securities held. Such fluctuations are included with the net realized gain or loss and unrealized appreciation or depreciation on investments.
Reported net realized foreign exchange gains and losses arise from sales of foreign currencies and currency gains or losses realized between the trade and settlement dates on investment transactions. Net unrealized appreciation and depreciation arise from changes in the fair values of assets and liabilities other than investments in securities at the fiscal period end, resulting from changes in exchange rates.
(f) Foreign Taxes
The Funds may be subject to foreign taxes (a portion of which may be reclaimable) on income, stock dividends, capital gains on investments or certain foreign currency transactions. All foreign taxes are recorded in accordance with the applicable foreign tax regulations and rates that exist in the foreign jurisdictions in which the Funds invest. These foreign taxes, if any, are paid by the Funds and reflected in their Statements of Operations as follows: foreign taxes withheld at source are presented as a reduction of income and foreign taxes on capital gains from sales of investments are included with the net realized gain (loss) on investments. Foreign taxes payable or deferred as of March 31, 2021, if any, are disclosed in the Funds’ Statements of Assets and Liabilities.
(g) Security Transactions
Security transactions are recorded on the trade date for financial reporting purposes. Realized gains and losses from securities transactions are recorded using the identified cost basis. Proceeds from lawsuits related to investment holdings are recorded as a reduction to cost if the securities are still held and as realized gains if no longer held in the respective Fund. Dividend income is recorded on the ex-dividend date, net of applicable taxes withheld by foreign countries, if any. Taxable non-cash dividends are recorded as dividend income. Interest income, including amortization of premiums and accretion of discounts, is accrued on a daily basis. Dividend income from Real Estate Investment Trusts (“REITs”) is recorded based on the income included in the distributions received from the REIT investments using published REIT classifications, including some management estimates when actual amounts are not available. Distributions received in excess of this estimated amount are recorded as a reduction of the cost of investments or reclassified to realized gains. The actual amounts of income, return of capital, and realized gains are only determined by each REIT after its fiscal year-end, and may differ from the estimated amounts.
(h) Distributions
Distributions of net investment income and net realized gains, if any, are declared and paid at least annually. Dividends are reinvested in additional shares, unless shareholders request payment in cash. Distributions are recorded on the ex-dividend date and are determined in accordance with U.S. federal income tax regulations which may differ from U.S. GAAP.
(i) Class Allocations
Interest and dividend income, most expenses, all realized gains and losses, and all unrealized appreciation and depreciation are allocated to the classes based upon the value of the outstanding shares in each Class. Certain costs, such as distribution and service fees are charged directly to specific classes. In addition, certain expenses have been allocated to the individual Funds in the Trust based on the respective net assets of each Fund included in the Trust.
(j) Cash
The Funds may leave cash overnight in their cash account with the custodian. Periodically, a Fund may have cash due to the custodian bank as an overdraft balance. A fee is incurred on this overdraft, calculated by multiplying the overdraft by a rate based on the federal funds rate, which was 0.06% at March 31, 2021.
(k) Indemnifications
Under the Funds’ organizational documents, the Trustees and Officers are indemnified against certain liabilities arising out of the performance of their duties to the Trust. In addition, throughout the normal course of business, the Funds enter into contracts that contain a variety of representations and warranties which provide general indemnifications. The Funds’ maximum exposure under these arrangements is unknown, as this would involve future claims that may be made against the Funds and/or their affiliates that have not yet occurred. However, based on experience, the Funds expect the risk of loss to be remote.
96 | THE RYDEX FUNDS ANNUAL REPORT | |
NOTES TO FINANCIAL STATEMENTS (continued) |
Note 2 – Derivatives
As part of their investment strategy, the Funds may utilize a variety of derivative instruments. These investments involve, to varying degrees, elements of market risk and risks in excess of amounts recognized on the Statements of Assets and Liabilities. Valuation and accounting treatment of these instruments can be found under Significant Accounting Policies in Note 1 of these Notes to Financial Statements.
Derivatives are instruments whose values depend on, or are derived from, in whole or in part, the value of one or more other assets, such as securities, currencies, commodities or indices. Derivative instruments may be used to increase investment flexibility (including to maintain cash reserves while maintaining exposure to certain other assets), for risk management (hedging) purposes, to facilitate trading, to reduce transaction costs and to pursue higher investment returns. Derivative instruments may also be used to mitigate certain investment risks, such as foreign currency exchange rate risk, interest rate risk and credit risk. U.S. GAAP requires disclosures to enable investors to better understand how and why a Fund uses derivative instruments, how these derivative instruments are accounted for and their effects on the Fund’s financial position and results of operations.
The Funds may utilize derivatives for the following purposes:
Index Exposure: the use of an instrument to obtain exposure to a listed or other type of index.
Leverage: gaining total exposure to equities or other assets on the long and short sides at greater than 100% of invested capital.
Liquidity: the ability to buy or sell exposure with little price/market impact.
For any Fund whose investment strategy consistently involves applying leverage, the value of the Fund’s shares will tend to increase or decrease more than the value of any increase or decrease in the underlying index or other asset. In addition, because an investment in derivative instruments generally requires a small investment relative to the amount of investment exposure assumed, an opportunity for increased net income is created; but, at the same time, leverage risk will increase. The Fund’s use of leverage, through borrowings or instruments such as derivatives, may cause the Fund to be more volatile and riskier than if they had not been leveraged.
Futures Contracts
A futures contract is an agreement to purchase (long) or sell (short) an agreed amount of securities or other instruments at a set price for delivery at a future date. There are significant risks associated with a Fund’s use of futures contracts, including (i) there may be an imperfect or no correlation between the changes in market value of the underlying asset and the prices of futures contracts; (ii) there may not be a liquid secondary market for a futures contract; (iii) trading restrictions or limitations may be imposed by an exchange; and (iv) government regulations may restrict trading in futures contracts. When investing in futures, there is minimal counterparty credit risk to a Fund because futures are exchange-traded and the exchange’s clearinghouse, as counterparty to all exchange-traded futures, guarantees against default. Cash deposits are shown as segregated cash with broker on the Statements of Assets and Liabilities; securities held as collateral are noted on the Schedules of Investments.
The following table represents the Funds’ use and volume of futures on a monthly basis:
| | | | Average Notional Amount | |
Fund | Use | | Long | | | Short | |
Europe 1.25x Strategy Fund | Index exposure, Leverage, Liquidity | | $ | 4,068,082 | | | $ | — | |
Japan 2x Strategy Fund | Index exposure, Leverage, Liquidity | | | 7,354,808 | | | | — | |
Strengthening Dollar 2x Strategy Fund | Index exposure, Leverage, Liquidity | | | 7,943,199 | | | | — | |
Weakening Dollar 2x Strategy Fund | Index exposure, Leverage, Liquidity | | | — | | | | 5,735,267 | |
Swap Agreements
A swap is an agreement that obligates two parties to exchange a series of cash flows at specified intervals based upon or calculated by reference to changes in specified prices or rates for a specified amount of an underlying asset. When utilizing over-the-counter (“OTC”) swaps, a fund bears the risk of loss of the amount expected to be received under a swap agreement in the event of the default or bankruptcy of a swap agreement counterparty or if the underlying asset declines in value. Certain standardized swaps are subject to mandatory central clearing and
| | THE RYDEX FUNDS ANNUAL REPORT | 97 |
NOTES TO FINANCIAL STATEMENTS (continued) |
are executed on a multi-lateral or other trade facility platform, such as a registered exchange. There is limited counterparty credit risk with respect to centrally-cleared swaps as the transaction is facilitated through a central clearinghouse, much like exchange-traded futures contracts. For a fund utilizing centrally-cleared swaps, the exchange bears the risk of loss resulting from a counterparty not being able to pay. There is no guarantee that a fund or an underlying fund could eliminate its exposure under an outstanding swap agreement by entering into an offsetting swap agreement with the same or another party.
Currency swaps enable the Funds to gain exposure to currencies in a market without actually possessing a given currency, or to hedge a position. Currency swaps involve the exchange of the principal and interest in one currency for the principal and interest in another currency. As in other types of OTC swaps, the Funds may be at risk due to the counterparty’s inability to perform.
The following table represents the Funds’ use and volume of currency swaps on a monthly basis:
| | | | Average Notional Amount | |
Fund | Use | | Long | | | Short | |
Strengthening Dollar 2x Strategy Fund | Index exposure, Leverage, Liquidity | | $ | 1,432,896 | | | $ | — | |
Weakening Dollar 2x Strategy Fund | Index exposure, Leverage, Liquidity | | | — | | | | 890,329 | |
Derivative Investment Holdings Categorized by Risk Exposure
The following is a summary of the location of derivative investments on the Funds’ Statements of Assets and Liabilities as of March 31, 2021:
Derivative Investment Type | Asset Derivatives | Liability Derivatives |
Equity/Currency contracts | Variation margin on futures contracts | Variation margin on futures contracts |
Currency contracts | Unrealized appreciation on OTC swap agreements | Unrealized depreciation on OTC swap agreements |
The following tables set forth the fair value of the Funds’ derivative investments categorized by primary risk exposure at March 31, 2021:
Asset Derivative Investments Value |
Fund | | Futures
Equity
Risk* | | | Futures
Foreign
Currency
Exchange
Risk* | | | Swaps
Currency
Risk | | | Total Value at
March 31,
2021 | |
Europe 1.25x Strategy Fund | | $ | 25,568 | | | $ | — | | | $ | — | | | $ | 25,568 | |
Japan 2x Strategy Fund | | | 84,264 | | | | — | | | | — | | | | 84,264 | |
Strengthening Dollar 2x Strategy Fund | | | — | | | | 91,505 | | | | 4,670 | | | | 96,175 | |
Liability Derivative Investments Value |
Fund | | Futures
Equity
Risk* | | | Futures
Foreign
Currency
Exchange
Risk* | | | Swaps
Currency
Risk | | | Total Value at
March 31,
2021 | |
Europe 1.25x Strategy Fund | | $ | — | | | $ | 15,786 | | | $ | — | | | $ | 15,786 | |
Japan 2x Strategy Fund | | | — | | | | 64,489 | | | | — | | | | 64,489 | |
Weakening Dollar 2x Strategy Fund | | | — | | | | 32,638 | | | | 8,243 | | | | 40,881 | |
* | Includes cumulative appreciation (depreciation) of exchange-traded, OTC and centrally-cleared derivatives contracts as reported on the Schedules of Investments. For exchange-traded and centrally-cleared derivatives, variation margin is reported within the Statements of Assets and Liabilities. |
98 | THE RYDEX FUNDS ANNUAL REPORT | |
NOTES TO FINANCIAL STATEMENTS (continued) |
The following is a summary of the location of derivative investments on the Funds’ Statements of Operations for the year ended March 31, 2021:
Derivative Investment Type | Location of Gain (Loss) on Derivatives |
Equity/Currency contracts | Net realized gain (loss) on futures contracts |
| Net change in unrealized appreciation (depreciation) on futures contracts |
Currency contracts | Net realized gain (loss) on swap agreements |
| Net change in unrealized appreciation (depreciation) on swap agreements |
The following is a summary of the Funds’ realized gain (loss) and change in unrealized appreciation (depreciation) on derivative investments recognized on the Statements of Operations categorized by primary risk exposure for the year ended March 31, 2021:
Realized Gain (Loss) on Derivative Investments Recognized on the Statements of Operations |
Fund | | Futures
Equity
Risk | | | Swaps
Equity
Risk | | | Futures
Foreign
Currency
Exchange
Risk | | | Swaps
Currency
Risk | | | Total | |
Europe 1.25x Strategy Fund | | $ | 448,877 | | | $ | — | | | $ | 125,980 | | | $ | — | | | $ | 574,857 | |
Japan 2x Strategy Fund | | | 1,276,597 | | | | 93 | | | | (132,431 | ) | | | — | | | | 1,144,259 | |
Strengthening Dollar 2x Strategy Fund | | | — | | | | — | | | | (503,763 | ) | | | (14,257 | ) | | | (518,020 | ) |
Weakening Dollar 2x Strategy Fund | | | — | | | | — | | | | 363,687 | | | | 57,037 | | | | 420,724 | |
Change in Unrealized Appreciation (Depreciation) on Derivative Investments Recognized on the Statements of Operations |
Fund | | Futures
Equity
Risk | | | Swaps
Equity
Risk | | | Futures
Foreign
Currency
Exchange
Risk | | | Swaps
Currency
Risk | | | Total | |
Europe 1.25x Strategy Fund | | $ | (135,425 | ) | | $ | — | | | $ | 218 | | | $ | — | | | $ | (135,207 | ) |
Japan 2x Strategy Fund | | | 136,690 | | | | — | | | | (94,224 | ) | | | — | | | | 42,466 | |
Strengthening Dollar 2x Strategy Fund | | | — | | | | — | | | | (122,095 | ) | | | (50,495 | ) | | | (172,590 | ) |
Weakening Dollar 2x Strategy Fund | | | — | | | | — | | | | (49 | ) | | | (11,416 | ) | | | (11,465 | ) |
In conjunction with the use of derivative instruments, the Funds are required to maintain collateral in various forms. Depending on the financial instrument utilized and the broker involved, the Funds use margin deposits at the broker, cash and/or securities segregated at the custodian bank, discount notes or repurchase agreements allocated to the Funds as collateral.
The Trust has established counterparty credit guidelines and enters into transactions only with financial institutions of investment grade or better. The Trust monitors the counterparty credit risk.
Note 3 – Offsetting
In the normal course of business, the Funds enter into transactions subject to enforceable master netting arrangements or other similar arrangements. Generally, the right to offset in those agreements allows the Funds to counteract the exposure to a specific counterparty with collateral received from or delivered to that counterparty based on the terms of the arrangements. These arrangements provide for the right to liquidate upon the occurrence of an event of default, credit event upon merger or additional termination event.
In order to better define their contractual rights and to secure rights that will help the Funds mitigate their counterparty risk, the Funds may enter into an International Swaps and Derivatives Association, Inc. Master Agreement (“ISDA Master Agreement”) or similar agreement with their derivative contract counterparties. An ISDA Master Agreement is a bilateral agreement between a fund and a counterparty that governs
| | THE RYDEX FUNDS ANNUAL REPORT | 99 |
NOTES TO FINANCIAL STATEMENTS (continued) |
OTC derivatives, including foreign exchange contracts, and typically contains, among other things, collateral posting terms and netting provisions in the event of a default and/or termination event. The provisions of the ISDA Master Agreement typically permit a single net payment in the event of a default (close-out netting) or similar event, including the bankruptcy or insolvency of the counterparty.
For derivatives traded under an ISDA Master Agreement, the collateral requirements are typically calculated by netting the mark-to-market amount for each transaction under such agreement and comparing that amount to the value of any collateral currently pledged by the Funds and the counterparty. For financial reporting purposes, cash collateral that has been pledged to cover obligations of the Funds and cash collateral received from the counterparty, if any, are reported separately on the Statements of Assets and Liabilities as segregated cash with broker/receivable for variation margin, or payable for swap settlement/variation margin. Cash and/or securities pledged or received as collateral by the Funds in connection with an OTC derivative subject to an ISDA Master Agreement generally may not be invested, sold or rehypothecated by the counterparty or the Funds, as applicable, absent an event of default under such agreement, in which case such collateral generally may be applied towards obligations due to and payable by such counterparty or the Funds, as applicable. Generally, the amount of collateral due from or to a counterparty must exceed a minimum transfer amount threshold (e.g., $300,000) before a transfer is required to be made. To the extent amounts due to the Funds from their counterparties are not fully collateralized, contractually or otherwise, the Funds bear the risk of loss from counterparty nonperformance. The Funds attempt to mitigate counterparty risk by only entering into agreements with counterparties that they believe to be of good standing and by monitoring the financial stability of those counterparties.
For financial reporting purposes, the Funds do not offset derivative assets and derivative liabilities that are subject to netting arrangements in the Statements of Assets and Liabilities.
The following tables present derivative financial instruments and secured financing transactions that are subject to enforceable netting arrangements:
| | | | | | | | | | | | | | | | Gross Amounts Not Offset
in the Statements of
Assets and Liabilities | | | | | |
Fund | Instrument | | Gross
Amounts of
Recognized
Assets1 | | | Gross
Amounts
Offset in the
Statements
of Assets and
Liabilities | | | Net Amount
of Assets
Presented on
the Statements
of Assets and
Liabilities | | | Financial
Instruments | | | Cash
Collateral
Received | | | Net
Amount | |
Strengthening Dollar 2x Strategy Fund | Swap currency contracts | | $ | 4,670 | | | $ | — | | | $ | 4,670 | | | $ | — | | | $ | — | | | $ | 4,670 | |
| | | | | | | | | | | | | | | | Gross Amounts Not Offset
in the Statements of
Assets and Liabilities | | | | | |
Fund | Instrument | | Gross
Amounts of
Recognized
Liabilities1 | | | Gross
Amounts
Offset in the
Statements
of Assets and
Liabilities | | | Net Amount
of Liabilities
Presented on
the Statements
of Assets and
Liabilities | | | Financial
Instruments | | | Cash
Collateral
Pledged | | | Net
Amount | |
Weakening Dollar 2x Strategy Fund | Swap currency contracts | | $ | 8,243 | | | $ | — | | | $ | 8,243 | | | $ | (8,243 | ) | | $ | — | | | $ | — | |
1 | Exchange-traded or centrally-cleared derivatives are excluded from these reported amounts. |
100 | THE RYDEX FUNDS ANNUAL REPORT | |
NOTES TO FINANCIAL STATEMENTS (continued) |
The Funds have the right to offset deposits against any related derivative liabilities outstanding with each counterparty with the exception of exchange-traded or centrally-cleared derivatives. The following table presents deposits held by others in connection with derivative investments as of March 31, 2021.
Fund | Counterparty | Asset Type | | Cash Pledged | | | Cash Received | |
Strengthening Dollar 2x Strategy Fund | Goldman Sachs International | Futures contracts | | $ | 7,086 | | | $ | — | |
Note 4 – Fair Value Measurement
In accordance with U.S. GAAP, fair value is defined as the price that the Funds would receive to sell an investment or pay to transfer a liability in an orderly transaction with an independent buyer in the principal market, or in the absence of a principal market, the most advantageous market for the investment or liability. U.S. GAAP establishes a three-tier fair value hierarchy based on the types of inputs used to value assets and liabilities and requires corresponding disclosure. The hierarchy and the corresponding inputs are summarized below:
Level 1 — | quoted prices in active markets for identical assets or liabilities. |
Level 2 — | significant other observable inputs (for example quoted prices for securities that are similar based on characteristics such as interest rates, prepayment speeds, credit risk, etc.). |
Level 3 — | significant unobservable inputs based on the best information available under the circumstances, to the extent observable inputs are not available, which may include assumptions. |
The types of inputs available depend on a variety of factors, such as the type of security and the characteristics of the markets in which it trades, if any. Fair valuation determinations that rely on fewer or no observable inputs require greater judgment. Accordingly, fair value determinations for Level 3 securities require the greatest amount of judgment.
The inputs or methodologies used for valuing securities are not necessarily an indication of the risk associated with investing in those securities. The suitability of the techniques and sources employed to determine fair valuation are regularly monitored and subject to change.
Note 5 – Investment Advisory Agreement and Other Agreements
Under the terms of an investment advisory contract, the Funds pay GI investment advisory fees calculated at the annualized rates below, based on the average daily net assets of the Funds:
Fund | | Management Fees
(as a % of Net Assets) | |
S&P 500® Pure Growth Fund | | | 0.75 | % |
S&P 500® Pure Value Fund | | | 0.75 | % |
S&P MidCap 400® Pure Growth Fund | | | 0.75 | % |
S&P MidCap 400® Pure Value Fund | | | 0.75 | % |
S&P SmallCap 600® Pure Growth Fund | | | 0.75 | % |
S&P SmallCap 600® Pure Value Fund | | | 0.75 | % |
Europe 1.25x Strategy Fund | | | 0.90 | % |
Japan 2x Strategy Fund | | | 0.75 | % |
Strengthening Dollar 2x Strategy Fund | | | 0.90 | % |
Weakening Dollar 2x Strategy Fund | | | 0.90 | % |
| | THE RYDEX FUNDS ANNUAL REPORT | 101 |
NOTES TO FINANCIAL STATEMENTS (continued) |
When the aggregate assets of each series of the Trust (excluding the Long Short Equity Fund, Managed Futures Strategy Fund and Multi-Hedge Strategies Fund) and each series of Rydex Dynamic Funds equal or exceed $10 billion, the advisory fee rate paid by each individual Fund (excluding the Long Short Equity Fund, Managed Futures Strategy Fund and Multi-Hedge Strategies Fund) will be reduced in accordance with the asset level and breakpoint schedule set forth below.
Fund Assets Under Management | Fund Asset-Based
Breakpoint Reductions |
$500 million – $1 billion | 0.025% |
> $1 billion – $2 billion | 0.050% |
> $2 billion | 0.075% |
GI pays operating expenses on behalf of the Trust, such as audit and accounting related services, legal services, custody, printing and mailing, among others, on a pass-through basis. Such expenses are allocated to various Funds within the complex based on relative net assets.
The Board has adopted a Distribution Plan applicable to A-Class shares and H-Class shares for which GFD and other firms that provide distribution and/or shareholder services (“Service Providers”) may receive compensation. If a Service Provider provides distribution services, the Funds will pay distribution fees to GFD at an annual rate not to exceed 0.25% of average daily net assets, pursuant to Rule 12b-1 of the 1940 Act. GFD, in turn, will pay the Service Provider out of its fees. GFD may, at its discretion, retain a portion of such payments to compensate itself for distribution services.
The Board has adopted a separate Distribution and Shareholder Services Plan applicable to C-Class shares that allows the Funds to pay annual distribution and service fees of 1.00% of the Funds’ C-Class shares average daily net assets. The annual 0.25% service fee compensates a shareholder’s financial adviser for providing ongoing services to the shareholder. The annual distribution fee of 0.75% reimburses GFD for paying the shareholder’s financial adviser an ongoing sales commission. GFD advances the first year’s service and distribution fees to the financial adviser. GFD retains the service and distribution fees on accounts with no authorized dealer of record.
For the year ended March 31, 2021, GFD retained sales charges of $128,465 relating to sales of A-Class shares of the Trust.
If a Fund invests in a fund that is advised by the same adviser or an affiliated adviser, the investing Fund’s adviser has agreed to waive fees at the investing fund level to the extent necessary to offset the proportionate share of any management fee paid by each Fund with respect to its investment in such affiliated fund. Fee waivers will be calculated at the investing Fund level without regard to any expense cap in effect for the investing Fund. Fees waived under this arrangement are not subject to reimbursement to GI. For the year ended March 31, 2021, the following Funds waived fees related to investments in affiliated funds:
Fund | | Amount Waived | |
Europe 1.25x Strategy Fund | | $ | 595 | |
Japan 2x Strategy Fund | | | 365 | |
Strengthening Dollar 2x Strategy Fund | | | 2,110 | |
Weakening Dollar 2x Strategy Fund | | | 813 | |
Certain trustees and officers of the Trust are also officers of GI and/or GFD. The Trust does not compensate its officers or trustees who are officers, directors and/or employees of GI or GFD.
MUFG Investor Services (US), LLC (“MUIS”) acts as the Funds’ administrator, transfer agent and accounting agent. As administrator, transfer agent and accounting agent, MUIS maintains the books and records of the Funds’ securities and cash. U.S. Bank, N.A. (“U.S. Bank”) acts as the Funds’ custodian. As custodian, U.S. Bank is responsible for the custody of the Funds’ assets. For providing the aforementioned services, MUIS and U.S. Bank are entitled to receive a monthly fee equal to an annual percentage of each Fund’s average daily net assets and out of pocket expenses.
102 | THE RYDEX FUNDS ANNUAL REPORT | |
NOTES TO FINANCIAL STATEMENTS (continued) |
Note 6 – Repurchase Agreements
The Funds transfer uninvested cash balances into a single joint account, the daily aggregate balance of which is invested in one or more repurchase agreements collateralized by obligations of the U.S. Treasury and U.S. government agencies. The joint account includes other Funds in the Guggenheim complex not covered in this report. The collateral is in the possession of the Funds’ custodian and is evaluated to ensure that its market value exceeds, at a minimum, 102% of the original face amount of the repurchase agreements. Each Fund holds a pro rata share of the collateral based on the dollar amount of the repurchase agreement entered into by each Fund.
At March 31, 2021, the repurchase agreements in the joint account were as follows:
Counterparty and
Terms of Agreement | | Face Value | | | Repurchase Price | | | Collateral | | Par Value | | | Fair Value | |
J.P. Morgan Securities LLC | | | | | | | | | | U.S. Treasury Bond | | | | | | | | |
0.01% | | | | | | | | | | 2.38% | | | | | | | | |
Due 04/01/21 | | $ | 124,999,036 | | | $ | 124,999,053 | | | 11/15/49 | | $ | 126,141,600 | | | $ | 127,499,092 | |
| | | | | | | | | | | | | | | | | | | |
Barclays Capital, Inc. | | | | | | | | | | U.S. Treasury Inflation Indexed Bond | | | | | | | | |
0.01% | | | | | | | | | | 0.13% | | | | | | | | |
Due 04/01/21 | | | 56,830,637 | | | | 56,830,653 | | | 02/15/51 | | | 57,053,077 | | | | 57,967,257 | |
| | | | | | | | | | | | | | | | | | | |
BofA Securities, Inc. | | | | | | | | | | U.S. Treasury Note | | | | | | | | |
0.01% | | | | | | | | | | 0.38% | | | | | | | | |
Due 04/01/21 | | | 51,866,820 | | | | 51,866,827 | | | 04/30/25 | | | 53,449,300 | | | | 52,904,236 | |
In the event of counterparty default, the Funds have the right to collect the collateral to offset losses incurred. There is potential loss to the Funds in the event the Funds are delayed or prevented from exercising their rights to dispose of the collateral securities, including the risk of a possible decline in the value of the underlying securities during the period while the Funds seek to assert their rights. GI, acting under the supervision of the Board, reviews the value of the collateral and the creditworthiness of those banks and dealers with which the Funds enter into repurchase agreements to evaluate potential risks.
Note 7 – Portfolio Securities Loaned
The Funds may lend their securities to approved brokers to earn additional income. Security lending income shown on the Statements of Operations is shown net of rebates paid to the borrowers and earnings on cash collateral investments shared with the lending agent. Within this arrangement, the Funds act as the lender, U.S. Bank acts as the lending agent, and other approved registered broker dealers act as the borrowers. The Funds receive cash collateral, valued at 102% of the value of the securities on loan. Under the terms of the Funds’ securities lending agreement with U.S. Bank, cash collateral and proceeds are invested in the First American Government Obligations Fund — Class Z. The Funds bear the risk of loss on cash collateral investments. Collateral is maintained over the life of the loan in an amount not less than the value of loaned securities, as determined at the close of fund business each day; any additional collateral required due to changes in security values is delivered to the Funds the next business day. Although the collateral mitigates the risk, the Funds could experience a delay in recovering their securities and a possible loss of income or value if the borrower fails to return the securities. The Funds have the right under the securities lending agreement to recover the securities from the borrower on demand. Securities lending transactions are accounted for as secured borrowings. The remaining contractual maturity of the securities lending agreement is overnight and continuous.
| | THE RYDEX FUNDS ANNUAL REPORT | 103 |
NOTES TO FINANCIAL STATEMENTS (continued) |
At March 31, 2021, the Funds participated in securities lending transactions, which are subject to enforceable netting arrangements, as follows:
| | | Gross Amounts Not Offset in the
Statements of Assets and Liabilities | | | | Securities Lending Collateral | |
Fund | | Value of
Securities
Loaned | | | Collateral
Received(a) | | | Net
Amount | | | | Cash
Collateral
Invested | | | Cash
Collateral
Uninvested | | | Total
Collateral | |
S&P 500® Pure Value Fund | | $ | 116,994 | | | $ | (116,994 | ) | | $ | — | | | | $ | 119,794 | | | $ | — | | | $ | 119,794 | |
S&P MidCap 400® Pure Value Fund | | | 710,822 | | | | (710,822 | ) | | | — | | | | | 744,237 | | | | — | | | | 744,237 | |
S&P SmallCap 600® Pure Growth Fund | | | 1,078,312 | | | | (1,068,144 | ) | | | 10,168 | | | | | 1,068,144 | * | | | — | | | | 1,068,144 | |
S&P SmallCap 600® Pure Value Fund | | | 330,025 | | | | (330,025 | ) | | | — | | | | | 332,723 | | | | — | | | | 332,723 | |
Europe 1.25x Strategy Fund | | | 29,827 | | | | (29,827 | ) | | | — | | | | | 30,559 | | | | — | | | | 30,559 | |
(a) | Actual collateral received by the Fund is generally greater than the amount shown due to overcollateralization. |
* | Subsequent to March 31, 2021, additional collateral was received. |
In the event of counterparty default, the Funds have the right to collect the collateral to offset losses incurred. There is potential loss to the Funds in the event the Funds are delayed or prevented from exercising their rights to dispose of the collateral securities, including the risk of a possible decline in the value of the underlying securities during the period while the Funds seek to assert their rights. GI, acting under the supervision of the Board, reviews the value of the collateral and the creditworthiness of those banks and dealers to evaluate potential risks.
Note 8 – Federal Income Tax Information
The Funds intend to comply with the provisions of Subchapter M of the Internal Revenue Code applicable to regulated investment companies and will distribute substantially all taxable net investment income and capital gains sufficient to relieve the Funds from all, or substantially all, federal income, excise and state income taxes. Therefore, no provision for federal or state income tax or federal excise tax is required.
Tax positions taken or expected to be taken in the course of preparing the Funds’ tax returns are evaluated to determine whether the tax positions are “more-likely-than-not” of being sustained by the applicable tax authority. Tax positions not deemed to meet the more-likely-than-not threshold would be recorded as a tax benefit or expense in the current year. Management has analyzed the Funds’ tax positions taken, or to be taken, on U.S. federal income tax returns for all open tax years, and has concluded that no provision for income tax is required in the Funds’ financial statements. The Funds’ U.S. federal income tax returns are subject to examination by the Internal Revenue Service (“IRS”) for a period of three years after they are filed.
The tax character of distributions paid during the year ended March 31, 2021 was as follows:
Fund | | Ordinary
Income | | | Long-Term
Capital Gain | | | Total
Distributions | |
S&P 500® Pure Growth Fund | | $ | 1,666,873 | | | $ | — | | | $ | 1,666,873 | |
S&P 500® Pure Value Fund | | | 301,858 | | | | — | | | | 301,858 | |
S&P MidCap 400® Pure Growth Fund | | | 183,257 | | | | 607,733 | | | | 790,990 | |
S&P MidCap 400® Pure Value Fund | | | 28,766 | | | | — | | | | 28,766 | |
Europe 1.25x Strategy Fund | | | 68,173 | | | | — | | | | 68,173 | |
Japan 2x Strategy Fund | | | 14,233 | | | | — | | | | 14,233 | |
Strengthening Dollar 2x Strategy Fund | | | 17,189 | | | | — | | | | 17,189 | |
Weakening Dollar 2x Strategy Fund | | | 3,912 | | | | — | | | | 3,912 | |
104 | THE RYDEX FUNDS ANNUAL REPORT | |
NOTES TO FINANCIAL STATEMENTS (continued) |
The tax character of distributions paid during the year ended March 31, 2020 was as follows:
Fund | | Ordinary
Income | | | Long-Term
Capital Gain | | | Total
Distributions | |
S&P 500® Pure Growth Fund | | $ | — | | | $ | 4,523,222 | | | $ | 4,523,222 | |
S&P 500® Pure Value Fund | | | 415,316 | | | | — | | | | 415,316 | |
Europe 1.25x Strategy Fund | | | 61,418 | | | | — | | | | 61,418 | |
Japan 2x Strategy Fund | | | 20,310 | | | | — | | | | 20,310 | |
Strengthening Dollar 2x Strategy Fund | | | 45,595 | | | | — | | | | 45,595 | |
Weakening Dollar 2x Strategy Fund | | | 12,501 | | | | — | | | | 12,501 | |
Note: For U.S. federal income tax purposes, short-term capital gain distributions are treated as ordinary income distributions.
The tax components of distributable earnings/(loss) as of March 31, 2021 were as follows:
Fund | | Undistributed
Ordinary
Income | | | Undistributed
Long-Term
Capital Gain | | | Net Unrealized
Appreciation
(Depreciation) | | | Accumulated
Capital and
Other Losses | | | Total | |
S&P 500® Pure Growth Fund | | $ | 570,074 | | | $ | 1,958,508 | | | $ | 9,255,291 | | | $ | — | | | $ | 11,783,873 | |
S&P 500® Pure Value Fund | | | 71,502 | | | | — | | | | 2,989,779 | | | | (6,104,531 | ) | | | (3,043,250 | ) |
S&P MidCap 400® Pure Growth Fund | | | 6,277,168 | | | | — | | | | 14,234,791 | | | | — | | | | 20,511,959 | |
S&P MidCap 400® Pure Value Fund | | | 1,372,146 | | | | — | | | | 19,351,753 | | | | — | | | | 20,723,899 | |
S&P SmallCap 600® Pure Growth Fund | | | 2,458,980 | | | | — | | | | 6,408,680 | | | | — | | | | 8,867,660 | |
S&P SmallCap 600® Pure Value Fund | | | — | | | | — | | | | (489,344 | ) | | | (9,547,191 | ) | | | (10,036,535 | ) |
Europe 1.25x Strategy Fund | | | — | | | | — | | | | 46,657 | | | | (67,433 | ) | | | (20,776 | ) |
Japan 2x Strategy Fund | | | — | | | | — | | | | 1,569 | | | | (1,683,389 | ) | | | (1,681,820 | ) |
Strengthening Dollar 2x Strategy Fund | | | — | | | | — | | | | 10,548 | | | | (19,236,437 | ) | | | (19,225,889 | ) |
Weakening Dollar 2x Strategy Fund | | | — | | | | — | | | | 6,349 | | | | (9,857,818 | ) | | | (9,851,469 | ) |
For U.S. federal income tax purposes, capital loss carryforwards represent realized losses of the Funds that may be carried forward and applied against future capital gains. The Funds are permitted to carry forward capital losses for an unlimited period and such capital loss carryforwards retain their character as either short-term or long-term capital losses. As of March 31, 2021, capital loss carryforwards for the Funds were as follows:
| | | Unlimited | | | | | |
Fund | | Short-Term | | | Long-Term | | | Total
Capital Loss
Carryforward | |
S&P 500® Pure Value Fund | | $ | (757,600 | ) | | $ | (5,346,931 | ) | | $ | (6,104,531 | ) |
S&P SmallCap 600® Pure Value Fund | | | (8,058,414 | ) | | | (1,470,714 | ) | | | (9,529,128 | ) |
Europe 1.25x Strategy Fund | | | (65,182 | ) | | | — | | | | (65,182 | ) |
Japan 2x Strategy Fund | | | (346,715 | ) | | | (1,327,927 | ) | | | (1,674,642 | ) |
Strengthening Dollar 2x Strategy Fund | | | (7,741,599 | ) | | | (11,484,516 | ) | | | (19,226,115 | ) |
Weakening Dollar 2x Strategy Fund | | | (3,952,653 | ) | | | (5,898,629 | ) | | | (9,851,282 | ) |
For the year ended March 31, 2021, the following capital loss carryforward amounts were utilized:
Fund | | Utilized | |
S&P MidCap 400® Pure Growth Fund | | $ | 1,990,791 | |
S&P SmallCap 600® Pure Growth Fund | | | 1,312,703 | |
Europe 1.25x Strategy Fund | | | 373,339 | |
Japan 2x Strategy Fund | | | 1,185,201 | |
Weakening Dollar 2x Strategy Fund | | | 409,370 | |
| | THE RYDEX FUNDS ANNUAL REPORT | 105 |
NOTES TO FINANCIAL STATEMENTS (continued) |
Net investment income and net realized gains (losses) may differ for financial statement and tax purposes because of temporary or permanent book/tax differences. These differences are primarily due to foreign currency gains and losses, losses deferred due to wash sales, distributions in connection with redemption of fund shares, and the “mark-to-market” of certain derivatives. Additional differences may result from the tax treatment of net operating losses and the deferral of qualified late-year losses. To the extent these differences are permanent and would require a reclassification between Paid in Capital and Total Distributable Earnings (Loss), such reclassifications are made in the period that the differences arise. These reclassifications have no effect on net assets or NAV per share.
The following adjustments were made on the Statements of Assets and Liabilities as of March 31, 2021 for permanent book/tax differences:
Fund | | Paid In
Capital | | | Total
Distributable
Earnings/(Loss) | |
S&P 500® Pure Growth Fund | | $ | 2,328,498 | | | $ | (2,328,498 | ) |
S&P MidCap 400® Pure Growth Fund | | | 3,628,199 | | | | (3,628,199 | ) |
S&P MidCap 400® Pure Value Fund | | | 457,299 | | | | (457,299 | ) |
S&P SmallCap 600® Pure Growth Fund | | | 2,010,048 | | | | (2,010,048 | ) |
S&P SmallCap 600® Pure Value Fund | | | (37,132 | ) | | | 37,132 | |
Europe 1.25x Strategy Fund | | | (2,542 | ) | | | 2,542 | |
Japan 2x Strategy Fund | | | (14,435 | ) | | | 14,435 | |
Strengthening Dollar 2x Strategy Fund | | | (61,625 | ) | | | 61,625 | |
Weakening Dollar 2x Strategy Fund | | | (39,116 | ) | | | 39,116 | |
At March 31, 2021, the cost of investments for U.S. federal income tax purposes, the aggregate gross unrealized appreciation for all investments for which there was an excess of value over tax cost and the aggregate gross unrealized depreciation for all investments for which there was an excess of tax cost over value, were as follows:
Fund | | Tax
Cost | | | Tax
Unrealized
Appreciation | | | Tax
Unrealized
Depreciation | | | Net Tax
Unrealized
Appreciation/
(Depreciation) | |
S&P 500® Pure Growth Fund | | $ | 29,827,105 | | | $ | 9,914,501 | | | $ | (659,210 | ) | | $ | 9,255,291 | |
S&P 500® Pure Value Fund | | | 54,599,899 | | | | 3,330,516 | | | | (340,737 | ) | | | 2,989,779 | |
S&P MidCap 400® Pure Growth Fund | | | 52,149,609 | | | | 15,933,989 | | | | (1,699,198 | ) | | | 14,234,791 | |
S&P MidCap 400® Pure Value Fund | | | 138,971,490 | | | | 19,595,339 | | | | (243,586 | ) | | | 19,351,753 | |
S&P SmallCap 600® Pure Growth Fund | | | 25,597,061 | | | | 6,800,519 | | | | (391,839 | ) | | | 6,408,680 | |
S&P SmallCap 600® Pure Value Fund | | | 40,734,414 | | | | — | | | | (489,344 | ) | | | (489,344 | ) |
Europe 1.25x Strategy Fund | | | 1,815,093 | | | | 66,376 | | | | (19,723 | ) | | | 46,653 | |
Japan 2x Strategy Fund | | | 1,924,655 | | | | 74,631 | | | | (73,062 | ) | | | 1,569 | |
Strengthening Dollar 2x Strategy Fund | | | 3,311,277 | | | | 10,548 | | | | — | | | | 10,548 | |
Weakening Dollar 2x Strategy Fund | | | 1,542,840 | | | | 6,349 | | | | — | | | | 6,349 | |
Pursuant to U.S. federal income tax regulations applicable to regulated investment companies, the Funds have elected to treat net capital losses and certain ordinary losses realized between November 1 and March 31 of each year as occurring on the first day of the following tax year. The Funds have also elected to treat certain ordinary losses realized between January 1 and March 31 of each year as occurring on the first day of the following tax year. For the year ended March 31, 2021, the following losses reflected in the accompanying financial statements were deferred for U.S. federal income tax purposes until April 1, 2021:
Fund | | Ordinary | | | Capital | |
S&P SmallCap 600® Pure Value Fund | | $ | (18,063 | ) | | $ | — | |
Europe 1.25x Strategy Fund | | | (2,251 | ) | | | — | |
Japan 2x Strategy Fund | | | (8,747 | ) | | | — | |
Strengthening Dollar 2x Strategy Fund | | | (10,322 | ) | | | — | |
Weakening Dollar 2x Strategy Fund | | | (6,536 | ) | | | — | |
106 | THE RYDEX FUNDS ANNUAL REPORT | |
NOTES TO FINANCIAL STATEMENTS (continued) |
Note 9 – Securities Transactions
For the year ended March 31, 2021, the cost of purchases and proceeds from sales of investment securities, excluding government securities, short-term investments and derivatives, were as follows:
Fund | | Purchases | | | Sales | |
S&P 500® Pure Growth Fund | | $ | 109,661,571 | | | $ | 131,061,118 | |
S&P 500® Pure Value Fund | | | 262,623,144 | | | | 220,156,139 | |
S&P MidCap 400® Pure Growth Fund | | | 256,793,373 | | | | 264,314,908 | |
S&P MidCap 400® Pure Value Fund | | | 303,694,413 | | | | 174,886,278 | |
S&P SmallCap 600® Pure Growth Fund | | | 204,186,241 | | | | 191,854,915 | |
S&P SmallCap 600® Pure Value Fund | | | 206,907,804 | | | | 168,749,256 | |
Europe 1.25x Strategy Fund | | | 4,556,001 | | | | 4,430,553 | |
Japan 2x Strategy Fund | | | 40,021 | | | | 80,000 | |
Strengthening Dollar 2x Strategy Fund | | | — | | | | 1,320,000 | |
Weakening Dollar 2x Strategy Fund | | | 740,000 | | | | 310,000 | |
The Funds are permitted to purchase or sell securities from or to certain affiliated funds under specified conditions outlined in procedures adopted by the Board. The procedures have been designed to ensure that any purchase or sale of securities by a Fund from or to another fund or portfolio that is or could be considered an affiliate by virtue of having a common investment adviser (or affiliated investment advisers), common trustees and/or common officers complies with Rule 17a-7 of the 1940 Act. Further, as defined under these procedures, each transaction is effected at the current market price to save costs, where permissible. For the year ended March 31, 2021, the Funds engaged in purchases and sales of securities, pursuant to Rule 17a-7 of the 1940 Act, as follows:
Fund | | Purchases | | | Sales | | | Realized Gain (Loss) | |
S&P 500® Pure Growth Fund | | $ | 16,592,526 | | | $ | 33,285,612 | | | $ | 578,644 | |
S&P 500® Pure Value Fund | | | 13,167,609 | | | | 25,159,417 | | | | (245,794 | ) |
S&P MidCap 400® Pure Growth Fund | | | 7,620,533 | | | | 7,575,467 | | | | 811,365 | |
S&P MidCap 400® Pure Value Fund | | | 11,764,722 | | | | 6,572,116 | | | | 299,190 | |
S&P SmallCap 600® Pure Growth Fund | | | 4,568,071 | | | | 4,457,549 | | | | 281,984 | |
S&P SmallCap 600® Pure Value Fund | | | 7,343,904 | | | | 6,955,521 | | | | 618,162 | |
Europe 1.25x Strategy Fund | | | 891,689 | | | | 966,260 | | | | 18,638 | |
Note 10 – Line of Credit
The Trust, along with other affiliated trusts, secured an uncommitted $75,000,000 line of credit from U.S. Bank, N.A., which expired June 8, 2020. On June 8, 2020, the line of credit agreement was renewed at an increased amount of $150,000,000 and expires on June 7, 2021. On February 10, 2021, the line of credit was increased from $150,000,000 to $200,000,000. This line of credit is reserved for emergency or temporary purposes. Borrowings, if any, under this arrangement bear interest equal to the Prime Rate, minus 2%, which shall be paid monthly, averaging 1.25% for the year ended March 31, 2021. The Funds did not have any borrowings outstanding under this agreement at March 31, 2021.
The average daily balances borrowed for the year ended March 31, 2021, were as follows:
Fund | | Average Daily Balance | |
S&P 500® Pure Value Fund | | $ | 16,956 | |
S&P MidCap 400® Pure Growth Fund | | | 9,271 | |
S&P MidCap 400® Pure Value Fund | | | 16,077 | |
S&P SmallCap 600® Pure Growth Fund | | | 11,488 | |
S&P SmallCap 600® Pure Value Fund | | | 2,518 | |
Strengthening Dollar 2x Strategy Fund | | | 162 | |
| | THE RYDEX FUNDS ANNUAL REPORT | 107 |
NOTES TO FINANCIAL STATEMENTS (continued) |
Note 11 – Reverse Share Splits
Effective on August 17, 2020, a reverse share split occurred for the following Fund:
Fund | Split Type |
S&P SmallCap 600® Pure Value Fund | One-for-Five Reverse Share Split |
Note 12 – Legal Proceedings
Tribune Company
Rydex Series Funds has been named as a defendant and a putative member of the proposed defendant class of shareholders in the case entitled Kirschner v. FitzSimons, No. 12-2652 (S.D.N.Y.) (formerly Official Committee of Unsecured Creditors of Tribune Co. v. FitzSimons, Adv. Pro. No. 10-54010 (Bankr. D. Del.)) (the “FitzSimons action”), as a result of ownership by certain series of the Rydex Series Funds of shares in the Tribune Company (“Tribune”) in 2007, when Tribune effected a leveraged buyout transaction (“LBO”) by which Tribune converted to a privately-held company. In his complaint, the plaintiff has alleged that, in connection with the LBO, Tribune insiders and shareholders were overpaid for their Tribune stock using financing that the insiders knew would, and ultimately did, leave Tribune insolvent. The plaintiff has asserted claims against certain insiders, major shareholders, professional advisers, and others involved in the LBO. The plaintiff is also attempting to obtain from former Tribune shareholders, including the Rydex Series Funds, the proceeds they received in connection with the LBO.
In June 2011, a group of Tribune creditors filed multiple actions against former Tribune shareholders involving state law constructive fraudulent conveyance claims arising out of the 2007 LBO (the “SLCFC actions”). Rydex Series Funds has been named as a defendant in one or more of these suits. In those actions, the creditors seek to recover from Tribune’s former shareholders the proceeds received in connection with the 2007 LBO.
The FitzSimons action and the SLCFC actions have been consolidated with the majority of the other Tribune LBO-related lawsuits in a multidistrict litigation proceeding captioned In re Tribune Company Fraudulent Conveyance Litig., No. 11-md-2296 (S.D.N.Y.) (the “MDL Proceeding”).
On September 23, 2013, the District Court granted the defendants’ omnibus motion to dismiss the SLCFC actions, on the basis that the creditors lacked standing. On September 30, 2013, the creditors filed a notice of appeal of the September 23 order. On October 28, 2013, the defendants filed a joint notice of cross-appeal of that same order.
On March 29, 2016, the U.S. Court of Appeals for the Second Circuit issued its opinion on the appeal of the SLCFC actions. The appeals court affirmed the district court’s dismissal of those lawsuits, but on different grounds than the district court. The appeals court held that while the plaintiffs have standing under the U.S. Bankruptcy Code, their claims were preempted by Section 546(e) of the Bankruptcy Code—the statutory safe harbor for settlement payments.
On April 12, 2016, the Plaintiffs in the SLCFC actions filed a petition seeking rehearing en banc before the appeals court. On July 22, 2016, the appeals court denied the petition. On September 9, 2016, the plaintiffs filed a petition for writ of certiorari in the U.S. Supreme Court challenging the Second Circuit’s decision that the safe harbor of Section 546(e) applied to their claims. The shareholder defendants, including the Funds, filed a joint brief in opposition to the petition for certiorari on October 24, 2016. On April 3, 2018, Justice Kennedy and Justice Thomas issued a “Statement” related to the petition for certiorari suggesting that the Second Circuit and/or District Court may want to take steps to reexamine the application of the Section 546(e) safe harbor to the previously dismissed state law constructive fraudulent transfer claims based on the Supreme Court’s decision in Merit Management Group LP v. FTI Consulting, Inc. On April 10, 2018, Plaintiffs filed in the Second Circuit a motion for that court to recall its mandate, vacate its prior decision, and remand to the district court for further proceedings consistent with Merit Management. On April 20, 2018, the shareholder defendants filed an opposition to Plaintiffs’ motion to recall the mandate. On May 15, 2018, the Second Circuit issued an order recalling the mandate “in anticipation of further panel review.” On December 19, 2019, the Second Circuit issued an amended opinion that again affirmed the district court’s ruling on the basis that plaintiffs’ claims were preempted by Section 546(e) of the Bankruptcy Code. Plaintiffs filed a motion for rehearing and rehearing en banc on January 2, 2020. The Second Circuit denied the petition on February 6, 2020. On July 6, 2020, plaintiffs filed a new petition for a writ of certiorari in the U.S. Supreme Court. In that petition, plaintiffs stated that “[t]o make it more likely that there will be a quorum for this petition,” they have “abandon[ed] the case and let the judgment below stand” with respect to certain defendants. That list did not include the Rydex Series Funds. Defendants filed an opposition to the certiorari
108 | THE RYDEX FUNDS ANNUAL REPORT | |
NOTES TO FINANCIAL STATEMENTS (concluded) |
petition on August 26, 2020, and plaintiffs filed a reply in support of the petition for certiorari on September 8, 2020. On March 12, 2021, the Solicitor General filed an amicus brief recommending that certiorari be denied. Plaintiffs filed a supplemental brief in response to the Solicitor General’s amicus brief on March 31, 2021, and Defendants filed a supplemental brief on April 1, 2021.
On May 23, 2014, the defendants filed motions to dismiss the FitzSimons action, including a global motion to dismiss Count I, which is the claim brought against former Tribune shareholders for intentional fraudulent conveyance under U.S. federal law. On January 6, 2017, the United States District Court for the Southern District of New York granted the shareholder defendants’ motion to dismiss the intentional fraudulent conveyance claim in the FitzSimons action. In dismissing the intentional fraudulent conveyance claim, the Court denied the plaintiff’s request to amend the complaint. The plaintiff requested that the Court direct entry of a final judgment in order to make the order immediately appealable. On February 23, 2017, the Court issued an order stating that it intended to permit an interlocutory appeal of the dismissal order, but would wait to do so until it has resolved outstanding motions to dismiss filed by other defendants.
On July 18, 2017, the plaintiff submitted a letter to the District Court seeking leave to amend its complaint to add a constructive fraudulent transfer claim. The shareholder defendants opposed that request. On August 24, 2017, the Court denied the plaintiff’s request without prejudice to renewal of the request in the event of an intervening change in the law. On March 8, 2018, the plaintiff renewed his request for leave to file a motion to amend the complaint to assert a constructive fraudulent transfer claim based on the Supreme Court’s ruling in Merit Management Group LP v. FTI Consulting, Inc. The shareholder defendants opposed that request. On June 18, 2018 the District Court ordered that the request would be stayed pending further action by the Second Circuit in the SLCFC actions.
On December 18, 2018, plaintiff filed a letter with the District Court requesting that the stay be dissolved in order to permit briefing on the motion to amend the complaint and indicating plaintiff’s intention to file another motion to amend the complaint to reinstate claims for intentional fraudulent transfer. The shareholder defendants opposed that request. On January 14, 2019, the court held a case management conference, during which the court stated that it would not lift the stay prior to further action from the Second Circuit in the SLCFC actions. The court further stated that it would allow the plaintiff to file a motion to amend to try to reinstate its intentional fraudulent transfer claim. On January 23, 2019, the court ordered the parties still facing pending claims to participate in a mediation, to commence on January 28, 2019. The mediation did not result in a settlement of the claims against the shareholder defendants.
On April 4, 2019, plaintiff filed a motion to amend the Fifth Amended Complaint to assert a federal constructive fraudulent transfer claim against certain shareholder defendants. On April 10, 2019, the shareholder defendants filed a brief in opposition to plaintiff’s motion to amend. On April 12, 2019, the plaintiff filed a reply brief. On April 23, 2019, the court denied the plaintiff’s motion to amend. On June 13, 2019, the court entered judgment pursuant to Rule 54(b). On July 12, 2019, the Plaintiff filed a notice of appeal with respect to the dismissal of his claims and the District Court’s denial of his motion for leave to amend. Plaintiff filed an appellate brief on January 7, 2020. The shareholder defendants’ brief was filed on April 27, 2020. Plaintiff filed a reply brief on May 18, 2020. The Court held oral argument on August 24, 2020.
None of these lawsuits alleges any wrongdoing on the part of Rydex Series Funds. The following series of Rydex Series Funds held shares of Tribune and tendered these shares as part of Tribune’s LBO: Nova Fund, S&P 500® Pure Value Fund, Multi-Cap Core Equity Fund, S&P 500® Fund, Multi-Hedge Strategies Fund and Hedged Equity Fund (the “Funds”). The value of the proceeds received by the foregoing Funds was $28,220, $109,242, $9,860, $3,400, $1,181,160, and $10,880, respectively. At this stage of the proceedings, Rydex Series Funds is not able to make a reliable predication as to the outcome of these lawsuits or the effect, if any, on a Fund’s net asset value.
Note 13 – COVID-19
The global ongoing crisis caused by the outbreak of COVID-19 and the current recovery underway is causing disruption to consumer demand and economic output and supply chains. There are still travel restrictions and quarantines, and adverse impacts on local and global economies. Investors should be aware that in light of the current uncertainty, volatility and distress in economies, financial markets, and labor and public health conditions around the world, the Funds’ investments and a shareholder’s investment in a Fund are subject to sudden and substantial losses, increased volatility and other adverse events. Firms through which investors invest with the Funds, the Funds, their service providers, the markets in which they invest and market intermediaries are also impacted by quarantines and similar measures intended to respond to and contain the ongoing pandemic, which can obstruct their functioning and subject them to heightened operational and other risks.
Note 14 – Subsequent Events
The Funds evaluated subsequent events through the date the financial statements were available for issue and determined there were no material events that would require adjustment to or disclosure in the Funds’ financial statements.
| | THE RYDEX FUNDS ANNUAL REPORT | 109 |
REPORT OF INDEPENDENT REGISTERED PUBLIC ACCOUNTING FIRM |
To the Shareholders of S&P 500® Pure Growth Fund, S&P 500® Pure Value Fund, S&P MidCap 400® Pure Growth Fund, S&P MidCap 400® Pure Value Fund, S&P SmallCap 600® Pure Growth Fund, S&P SmallCap 600® Pure Value Fund, Europe 1.25x Strategy Fund, Japan 2x Strategy Fund, Strengthening Dollar 2x Strategy Fund, and Weakening Dollar 2x Strategy Fund and the Board of Trustees of Rydex Series Funds
Opinion on the Financial Statements
We have audited the accompanying statements of assets and liabilities of S&P 500® Pure Growth Fund, S&P 500® Pure Value Fund, S&P MidCap 400® Pure Growth Fund, S&P MidCap 400® Pure Value Fund, S&P SmallCap 600® Pure Growth Fund, S&P SmallCap 600® Pure Value Fund, Europe 1.25x Strategy Fund, Japan 2x Strategy Fund, Strengthening Dollar 2x Strategy Fund, and Weakening Dollar 2x Strategy Fund (collectively referred to as the “Funds”), (ten of the funds constituting Rydex Series Funds (the “Trust”)), including the schedules of investments, as of March 31, 2021, and the related statements of operations for the year then ended, the statements of changes in net assets for each of the two years in the period then ended, the financial highlights for each of the five years in the period then ended and the related notes (collectively referred to as the “financial statements”). In our opinion, the financial statements present fairly, in all material respects, the financial position of each of the Funds (ten of the funds constituting Rydex Series Funds) at March 31, 2021, the results of their operations for the year then ended, the changes in their net assets for each of the two years in the period then ended and their financial highlights for each of the five years in the period then ended, in conformity with U.S. generally accepted accounting principles.
Basis for Opinion
These financial statements are the responsibility of the Trust’s management. Our responsibility is to express an opinion on each of the Funds’ financial statements based on our audits. We are a public accounting firm registered with the Public Company Accounting Oversight Board (United States) (“PCAOB”) and are required to be independent with respect to the Trust in accordance with the U.S. federal securities laws and the applicable rules and regulations of the Securities and Exchange Commission and the PCAOB.
We conducted our audits in accordance with the standards of the PCAOB. Those standards require that we plan and perform the audit to obtain reasonable assurance about whether the financial statements are free of material misstatement, whether due to error or fraud. The Trust is not required to have, nor were we engaged to perform, an audit of the Trust’s internal control over financial reporting. As part of our audits, we are required to obtain an understanding of internal control over financial reporting but not for the purpose of expressing an opinion on the effectiveness of the Trust’s internal control over financial reporting. Accordingly, we express no such opinion.
Our audits included performing procedures to assess the risks of material misstatement of the financial statements, whether due to error or fraud, and performing procedures that respond to those risks. Such procedures included examining, on a test basis, evidence regarding the amounts and disclosures in the financial statements. Our procedures included confirmation of securities owned as of March 31, 2021, by correspondence with the custodian, transfer agent, and brokers or by other appropriate auditing procedures where replies from brokers were not received. Our audits also included evaluating the accounting principles used and significant estimates made by management, as well as evaluating the overall presentation of the financial statements. We believe that our audits provide a reasonable basis for our opinion.

We have served as the auditor of one or more Guggenheim investment companies since 1979.
Tysons, Virginia
May 26, 2021
110 | THE RYDEX FUNDS ANNUAL REPORT | |
OTHER INFORMATION (Unaudited) |
Federal Income Tax Information
This information is being provided as required by the Internal Revenue Code. Amounts shown may differ from those elsewhere in the report because of differences in tax and financial reporting practice.
In January 2022, shareholders will be advised on IRS Form 1099 DIV or substitute 1099 DIV as to the federal tax status of the distributions received by shareholders in the calendar year 2021.
The Funds’ investment income (dividend income plus short-term capital gains, if any) qualifies as follows:
Of the taxable ordinary income distributions paid during the fiscal year ending March 31, 2021, the following funds had the corresponding percentages qualify for the reduced tax rate pursuant to the Jobs and Growth Tax Relief and Reconciliation Act of 2003 or for the dividends received deduction for corporations. See the qualified dividend income and dividend received deduction columns, respectively, in the table below.
Additionally, of the taxable ordinary income distributions paid during the fiscal year ended March 31, 2021, the following funds had the corresponding percentages qualify as interest related dividends and qualified short-term capital gains as permitted by IRC Section 871(k)(1) and IRC Section 871(k)(2), respectively. See qualified interest income and qualified short-term capital gain columns, respectively, in the table below.
Fund | | Qualified
Dividend
Income | | | Dividend
Received
Deduction | | | Qualified
Interest
Income | | | Qualified
Short-Term
Capital Gain | |
S&P 500® Pure Growth Fund | | | 0.00 | % | | | 0.00 | % | | | 0.00 | % | | | 100.00 | % |
S&P 500® Pure Value Fund | | | 93.14 | % | | | 91.65 | % | | | 0.00 | % | | | 0.00 | % |
S&P MidCap 400® Pure Growth Fund | | | 4.09 | % | | | 4.02 | % | | | 0.00 | % | | | 100.00 | % |
S&P MidCap 400® Pure Value Fund | | | 28.79 | % | | | 27.04 | % | | | 0.00 | % | | | 0.00 | % |
Europe 1.25x Strategy Fund | | | 100.00 | % | | | 28.77 | % | | | 6.93 | % | | | 0.00 | % |
With respect to the taxable year ended March 31, 2021, the Funds hereby designate as capital gain dividends the amounts listed below, or, if subsequently determined to be different, the net capital gain of such year:
Fund | | From long-term
capital gain: | | | From long-term
capital gain, using
proceeds from
shareholder
redemptions: | |
S&P 500® Pure Growth Fund | | $ | — | | | $ | 2,328,498 | |
S&P MidCap 400® Pure Growth Fund | | | 607,733 | | | | 3,567,405 | |
S&P SmallCap 600® Pure Growth Fund | | | — | | | | 331,885 | |
Delivery of Shareholder Reports
Paper copies of the Funds’ annual and semi-annual shareholder reports are not sent by mail, unless you specifically request paper copies of the reports from a fund or from your financial intermediary. Instead, the reports are made available on a website, and you are notified by mail each time a report is posted and provided with a website link to access the report.
You may elect to receive all future shareholder reports in paper free of charge. If you hold shares of a fund directly, you can inform the Fund that you wish to receive paper copies of reports by calling 800.820.0888. If you hold shares of a fund through a financial intermediary, please contact the financial intermediary to make this election. Your election to receive reports in paper may apply to all Guggenheim Funds in which you are invested and may apply to all Guggenheim funds held with your financial intermediary.
| | THE RYDEX FUNDS ANNUAL REPORT | 111 |
OTHER INFORMATION (Unaudited)(concluded) |
Proxy Voting Information
A description of the policies and procedures that the Trust uses to determine how to vote proxies relating to securities held in the Funds’ portfolios is available, without charge and upon request, by calling 800.820.0888. This information is also available from the EDGAR database on the SEC’s website at https://www.sec.gov.
Information regarding how the Funds’ voted proxies relating to portfolio securities during the most recent 12-month period ended June 30 is available without charge, upon request, by calling 800.820.0888. This information is also available from the EDGAR database on the SEC’s website at https://www.sec.gov.
Sector Classification
Information in the Schedule of Investments is categorized by sectors using sector-level Classifications defined by the Bloomberg Industry Classification System, a widely recognized industry classification system provider. Each Fund’s registration statement has investment policies relating to concentration in specific sectors/industries. For purposes of these investment policies, the Funds usually classify sectors/industries based on industry-level Classifications used by widely recognized industry classification system providers such as Bloomberg Industry Classification System, Global Industry Classification Standards and Barclays Global Classification Scheme.
Quarterly Portfolio Schedules Information
The Trust files its complete schedule of portfolio holdings with the SEC for the first and third quarters of each fiscal year as an exhibit to its reports on Form N-PORT, and for reporting periods ended prior to March 31, 2019, filed such information on Form N-Q. The Funds’ Forms N-PORT and N-Q are available on the SEC’s website at https://www.sec.gov. Copies of the portfolio holdings are also available to shareholders, without charge and upon request, by calling 800.820.0888.
112 | THE RYDEX FUNDS ANNUAL REPORT | |
INFORMATION ON BOARD OF TRUSTEES AND OFFICERS (Unaudited) |
A Board of Trustees oversees the Trust, as well as other trusts of GI, in which its members have no stated term of service, and continue to serve after election until resignation. The Statement of Additional Information includes further information about Fund Trustees and Officers, and can be obtained without charge by visiting guggenheiminvestments.com or by calling 800.820.0888.
Name, Address*
and Year of Birth | Position(s)
Held with
Trust | Term of Office
and Length of
Time Served** | Principal Occupation(s)
During Past Five Years | Number of
Portfolios
in Fund
Complex
Overseen | Other
Directorships Held
by Trustees*** |
INDEPENDENT TRUSTEES | | | |
Randall C. Barnes (1951) | Trustee and Chair of the Valuation Oversight Committee | Since 2019 (Trustee) Since 2020 (Chair of the Valuation Oversight Committee) | Current: Private Investor (2001-present). Former: Senior Vice President and Treasurer, PepsiCo, Inc. (1993-1997); President, Pizza Hut International (1991-1993); Senior Vice President, Strategic Planning and New Business Development, PepsiCo, Inc. (1987-1990). | 157 | Current: Purpose Investments Funds (2013-present). Former: Managed Duration Investment Grade Municipal Fund (2006-2016). |
Angela Brock-Kyle (1959) | Trustee | Since 2016 | Current: Founder and Chief Executive Officer, B.O.A.R.D.S. (2013-present). Former: Senior Leader, TIAA (1987-2012). | 156 | Current: Bowhead Insurance GP, LLC (2020-present); Hunt Companies, Inc. (2019-present). Former: Infinity Property & Casualty Corp. (2014-2018). |
Thomas F. Lydon, Jr. (1960) | Trustee and Chair of the Contracts Review Committee | Since 2005 (Trustee) Since 2020 (Chair of the Contracts Review Committee) | Current: President, Global Trends Investments (1996-present); Co-Chief Executive Officer, ETF Flows, LLC (2019-present); Chief Executive Officer, Lydon Media (2016-present). | 156 | Current: US Global Investors (GROW) (1995-present). Former: Harvest Volatility Edge Trust (3) (2017-2019). |
Ronald A. Nyberg (1953) | Trustee and Chair of the Nominating and Governance Committee | Since 2019 | Current: Of Counsel, Momkus LLP (2016-present). Former: Partner, Nyberg & Cassioppi, LLC (2000-2016); Executive Vice President, General Counsel, and Corporate Secretary, Van Kampen Investments (1982-1999). | 157 | Current: PPM Funds (2) (2018-present); Edward-Elmhurst Healthcare System (2012-present). Former: Western Asset Inflation-Linked Opportunities & Income Fund (2004-2020); Western Asset Inflation-Linked Income Fund (2003-2020); Managed Duration Investment Grade Municipal Fund (2003-2016). |
| | THE RYDEX FUNDS ANNUAL REPORT | 113 |
INFORMATION ON BOARD OF TRUSTEES AND OFFICERS (Unaudited)(continued) |
Name, Address*
and Year of Birth | Position(s)
Held with
Trust | Term of Office
and Length of
Time Served** | Principal Occupation(s)
During Past Five Years | Number of
Portfolios
in Fund
Complex
Overseen | Other
Directorships Held
by Trustees*** |
INDEPENDENT TRUSTEES - concluded | | | |
Sandra G. Sponem (1958) | Trustee and Chair of the Audit Committee | Since 2016 (Trustee) Since 2019 (Chair of the Audit Committee) | Current: Retired. Former: Senior Vice President and Chief Financial Officer, M.A. Mortenson-Companies, Inc. (2007-2017). | 156 | Current: SPDR Series Trust (81) (2018-present); SPDR Index Shares Funds (30) (2018-present); SSGA Active Trust (14) (2018-present). Former: SSGA Master Trust (1) (2018-2020). |
Ronald E. Toupin, Jr. (1958) | Trustee, Chair of the Board and Chair of the Executive Committee | Since 2019 | Current: Portfolio Consultant (2010-present); Member, Governing Council, Independent Directors Council (2013-present); Governor, Board of Governors, Investment Company Institute (2018-present). Former: Member, Executive Committee, Independent Directors Council (2016-2018); Vice President, Manager and Portfolio Manager, Nuveen Asset Management (1998-1999); Vice President, Nuveen Investment Advisory Corp. (1992-1999); Vice President and Manager, Nuveen Unit Investment Trusts (1991-1999); and Assistant Vice President and Portfolio Manager, Nuveen Unit Investment Trusts (1988-1999), each of John Nuveen & Co., Inc. (1982-1999). | 156 | Former: Western Asset Inflation-Linked Opportunities & Income Fund (2004-2020); Western Asset Inflation-Linked Income Fund (2003-2020); Managed Duration Investment Grade Municipal Fund (2003-2016). |
114 | THE RYDEX FUNDS ANNUAL REPORT | |
INFORMATION ON BOARD OF TRUSTEES AND OFFICERS (Unaudited)(continued) |
Name, Address*
and Year of Birth | Position(s)
Held with
Trust | Term of Office
and Length of
Time Served** | Principal Occupation(s)
During Past Five Years | Number of
Portfolios
in Fund
Complex
Overseen | Other
Directorships Held
by Trustees*** |
INTERESTED TRUSTEE | | | | |
Amy J. Lee**** (1961) | Trustee, Vice President and Chief Legal Officer | Since 2019 | Current: Interested Trustee, certain other funds in the Fund Complex (2018-present); Chief Legal Officer, certain other funds in the Fund Complex (2014-present); Vice President, certain other funds in the Fund Complex (2007-present); Senior Managing Director, Guggenheim Investments (2012-present). Former: President and Chief Executive Officer, certain other funds in the Fund Complex (2017-2019); Vice President, Associate General Counsel and Assistant Secretary, Security Benefit Life Insurance Company and Security Benefit Corporation (2004-2012). | 156 | None. |
* | The business address of each Trustee is c/o Guggenheim Investments, 227 West Monroe Street, Chicago, Illinois 60606. |
** | Each Trustee serves an indefinite term, until his or her successor is elected and qualified. |
*** | Each Trustee also serves on the Boards of Trustees of Guggenheim Funds Trust, Guggenheim Variable Funds Trust, Guggenheim Strategy Funds Trust, Fiduciary/Claymore Energy Infrastructure Fund, Guggenheim Taxable Municipal Bond & Investment Grade Debt Trust, Guggenheim Strategic Opportunities Fund, Guggenheim Enhanced Equity Income Fund, Guggenheim Energy & Income Fund, Guggenheim Credit Allocation Fund, Rydex Series Funds, Rydex Dynamic Funds, Rydex Variable Trust and Transparent Value Trust. Messrs. Barnes and Nyberg also serve on the Board of Trustees of Advent Convertible & Income Fund. |
**** | This Trustee is deemed to be an “interested person” of the Funds under the 1940 Act by reason of her position with the Funds’ Investment Manager and/or the parent of the Investment Manager. |
| | THE RYDEX FUNDS ANNUAL REPORT | 115 |
INFORMATION ON BOARD OF TRUSTEES AND OFFICERS (Unaudited)(continued) |
Name, Address*
and Year of Birth | Position(s)
Held with
Trust | Term of Office
and Length of
Time Served** | Principal Occupation(s)
During Past Five Years |
OFFICERS | | | |
Brian E. Binder (1972) | President and Chief Executive Officer | Since 2019 | Current: President and Chief Executive Officer, certain other funds in the Fund Complex (2018-present); President, Chief Executive Officer and Chairman of the Board of Managers, Guggenheim Funds Investment Advisors, LLC (2018-present); President and Chief Executive Officer, Security Investors, LLC (2018-present); Board Member of Guggenheim Partners Fund Management (Europe) Limited (2018-present); Senior Managing Director and Chief Administrative Officer, Guggenheim Investments (2018-present). Former: Managing Director and President, Deutsche Funds, and Head of US Product, Trading and Fund Administration, Deutsche Asset Management (2013-2018); Managing Director, Head of Business Management and Consulting, Invesco Ltd. (2010-2012). |
James M. Howley (1972) | Assistant Treasurer | Since 2016 | Current: Managing Director, Guggenheim Investments (2004-present); Assistant Treasurer, certain other funds in the Fund Complex (2006-present). Former: Manager, Mutual Fund Administration of Van Kampen Investments, Inc. (1996-2004). |
Mark E. Mathiasen (1978) | Secretary | Since 2017 | Current: Secretary, certain other funds in the Fund Complex (2007-present); Managing Director, Guggenheim Investments (2007-present). |
Glenn McWhinnie (1969) | Assistant Treasurer | Since 2016 | Current: Vice President, Guggenheim Investments (2009-present); Assistant Treasurer, certain other funds in the Fund Complex (2016-present). |
Michael P. Megaris (1984) | Assistant Secretary | Since 2018 | Current: Assistant Secretary, certain other funds in the Fund Complex (2014-present); Director, Guggenheim Investments (2012-present). |
Elisabeth Miller (1968) | Chief Compliance Officer | Since 2012 | Current: Chief Compliance Officer, certain other funds in the Fund Complex (2012-present); Senior Managing Director, Guggenheim Investments (2012-present). Vice President, Guggenheim Funds Distributors, LLC (2014-present). Former: Chief Compliance Officer, Security Investors, LLC and Guggenheim Funds Investment Advisors, LLC (2012-2018); Chief Compliance Officer, Guggenheim Distributors, LLC (2009-2014); Senior Manager, Security Investors, LLC (2004-2014); Senior Manager, Guggenheim Distributors, LLC (2004-2014). |
Margaux Misantone (1978) | AML Officer | Since 2017 | Current: Chief Compliance Officer, Security Investors, LLC and Guggenheim Funds Investment Advisors, LLC (2018-present); AML Officer, Security Investors, LLC and certain other funds in the Fund Complex (2017-present); Managing Director, Guggenheim Investments (2015-present). Former: Assistant Chief Compliance Officer, Security Investors, LLC and Guggenheim Funds Investments Advisors, LLC (2015-2018). |
116 | THE RYDEX FUNDS ANNUAL REPORT | |
INFORMATION ON BOARD OF TRUSTEES AND OFFICERS (Unaudited)(concluded) |
Name, Address*
and Year of Birth | Position(s)
Held with
Trust | Term of Office
and Length of
Time Served** | Principal Occupation(s)
During Past Five Years |
OFFICERS - concluded | | |
Kimberly J. Scott (1974) | Assistant Treasurer | Since 2016 | Current: Director, Guggenheim Investments (2012-present); Assistant Treasurer, certain other funds in the Fund Complex (2012-present). Former: Financial Reporting Manager, Invesco, Ltd. (2010-2011); Vice President/Assistant Treasurer, Mutual Fund Administration for Van Kampen Investments, Inc./Morgan Stanley Investment Management (2009-2010); Manager of Mutual Fund Administration, Van Kampen Investments, Inc./Morgan Stanley Investment Management (2005-2009). |
Bryan Stone (1979) | Vice President | Since 2019 | Current: Vice President, certain other funds in the Fund Complex (2014-present); Managing Director, Guggenheim Investments (2013-present). Former: Senior Vice President, Neuberger Berman Group LLC (2009-2013); Vice President, Morgan Stanley (2002-2009). |
John L. Sullivan (1955) | Chief Financial Officer, Chief Accounting Officer and Treasurer | Since 2016 | Current: Chief Financial Officer, Chief Accounting Officer and Treasurer, certain other funds in the Fund Complex (2010-present); Senior Managing Director, Guggenheim Investments (2010-present). Former: Managing Director and Chief Compliance Officer, each of the funds in the Van Kampen Investments fund complex (2004-2010); Managing Director and Head of Fund Accounting and Administration, Morgan Stanley Investment Management (2002-2004); Chief Financial Officer and Treasurer, Van Kampen Funds (1996-2004). |
Jon Szafran (1989) | Assistant Treasurer | Since 2017 | Current: Vice President, Guggenheim Investments (2017-present); Assistant Treasurer, certain other funds in the Fund Complex (2017-present). Former: Assistant Treasurer of Henderson Global Funds and Manager of US Fund Administration, Henderson Global Investors (North America) Inc. (“HGINA”), (2017); Senior Analyst of US Fund Administration, HGINA (2014–2017); Senior Associate of Fund Administration, Cortland Capital Market Services, LLC (2013-2014); Experienced Associate, PricewaterhouseCoopers LLP (2012-2013). |
* | The business address of each officer is c/o Guggenheim Investments, 227 West Monroe Street, Chicago, Illinois 60606. |
** | Each officer serves an indefinite term, until his or her successor is duly elected and qualified. |
| | THE RYDEX FUNDS ANNUAL REPORT | 117 |
GUGGENHEIM INVESTMENTS PRIVACY NOTICE (Unaudited) |
Who We Are
This Privacy Notice describes the data protection practices of Guggenheim Investments. Guggenheim Investments as used herein refers to the affiliated investment management businesses of Guggenheim Partners, LLC: Guggenheim Funds Investment Advisors, LLC, Guggenheim Partners Investment Management, LLC, Guggenheim Funds Distributors, LLC, Security Investors, LLC, Guggenheim Investment Advisors (Europe) Limited, Guggenheim Real Estate, LLC, GS Gamma Advisors, LLC, Guggenheim Partners India Management, LLC, Guggenheim Partners Europe Limited, as well as the funds in the Guggenheim Funds complex (the “Funds”) (“Guggenheim Investments,” “we,” “us,” or “our”).
Guggenheim Partners Investment Management Holdings, LLC, located at 330 Madison Avenue, New York, New York 10017 is the data controller for your information. The affiliates who are also controllers of certain of your information are: Guggenheim Investment Advisors (Europe) Limited, Guggenheim Partners Europe Limited, Guggenheim Partners, LLC, Guggenheim Funds Investment Advisors, LLC, Guggenheim Partners Investment Management, LLC, Guggenheim Funds Distributors, LLC and Security Investors, LLC, as well as the Funds.
Our Commitment to You
Guggenheim Investments considers your privacy our utmost concern. When you become our client or investor, you entrust us with not only your hard-earned money but also with your personal and financial information. Because we have access to your private information, we hold ourselves to the highest standards in its safekeeping and use. We strictly limit how we share your information with others, whether you are a current or former Guggenheim Investments client or investor.
The Information We Collect About You
We collect certain nonpublic personal information about you from information you provide on applications, other forms, our website, and/or from third parties including investment advisors. This information includes Social Security or other tax identification number, assets, income, tax information, retirement and estate plan information, transaction history, account balance, payment history, bank account information, marital status, family relationships, information that we collect on our website through the use of “cookies,” and other personal information that you or others provide to us. We may also collect such information through your inquiries by mail, e-mail or telephone. We may also collect customer due diligence information, as required by applicable law and regulation, through third party service providers.
How We Handle Your Personal Information
The legal basis for using your information as set out in this Privacy Notice is as follows: (a) use of your personal data is necessary to perform our obligations under any contract with you (such as a contract for us to provide financial services to you); or (b) where use of your personal data is not necessary for performance of a contract, use of your personal data is necessary for our legitimate interests or the legitimate interests of others (for example, to enforce the legal terms governing our services, operate and market our website and other services we offer, ensure safe environments for our personnel and others, make and receive payments, prevent fraud and to know the customer to whom we are providing the services). Some processing is done to comply with applicable law.
In addition to the specific uses described above, we also use your information in the following manner:
| | ● | We use your information in connection with servicing your accounts. |
| | ● | We use information to respond to your requests or questions. For example, we might use your information to respond to your customer feedback. |
| | ● | We use information to improve our products and services. We may use your information to make our website and products better. We may use your information to customize your experience with us. |
| | ● | We use information for security purposes. We may use your information to protect our company and our customers. |
| | ● | We use information to communicate with you. For example, we will communicate with you about your account or our relationship. We may contact you about your feedback. We might also contact you about this Privacy Notice. We may also enroll you in our email newsletter. |
118 | THE RYDEX FUNDS ANNUAL REPORT | |
GUGGENHEIM INVESTMENTS PRIVACY NOTICE (Unaudited)(continued) |
| | ● | We use information as otherwise permitted by law, as we may notify you. |
| | ● | Aggregate/Anonymous Data. We may aggregate and/or anonymize any information collected through the website so that such information can no longer be linked to you or your device (“Aggregate/Anonymous Information”). We may use Aggregate/Anonymous Information for any purpose, including without limitation for research and marketing purposes, and may also share such data with any third parties, including advertisers, promotional partners, and sponsors. |
We do not sell information about current or former clients or their accounts to third parties. Nor do we share this information, except when necessary to complete transactions at your request, to make you aware of investment products and services that we or our affiliates offer, or as permitted or required by law.
We provide information about you to companies and individuals not affiliated with Guggenheim Investments to complete certain transactions or account changes, or to perform services for us related to your account. For example, if you ask to transfer assets from another financial institution to Guggenheim Investments, we must provide certain information about you to that company to complete the transaction. We provide the third party with only the information necessary to carry out its responsibilities and only for that purpose. And we require these third parties to treat your private information with the same high degree of confidentiality that we do. To alert you to other Guggenheim Investments products and services, we share your information within our family of affiliated companies. You may limit our sharing with affiliated companies as set out below. We may also share information with any successor to all or part of our business, or in connection with steps leading up to a merger or acquisition. For example, if part of our business was sold we may give customer information as part of that transaction. We may also share information about you with your consent.
We will release information about you if you direct us to do so, if we are compelled by law to do so, or in other circumstances as permitted by law (for example, to protect your account from fraud).
If you close your account(s) or become an inactive client or investor, we will continue to adhere to the privacy policies and practices described in this notice.
Opt-Out Provisions and Your Data Choices
The law allows you to “opt out” of certain kinds of information sharing with third parties. We do not share personal information about you with any third parties that triggers this opt-out right. This means YOU ARE ALREADY OPTED OUT.
When you are no longer our client or investor, we continue to share your information as described in this notice, and you may contact us at any time to limit our sharing by sending an email to CorporateDataPrivacy@GuggenheimPartners.com.
European Union Data Subjects and certain others: In addition to the choices set forth above, residents of the European Union and certain other jurisdictions have certain rights to (1) request access to or rectification or deletion of information we collect about them, (2) request a restriction on the processing of their information, (3) object to the processing of their information, or (4) request the portability of certain information. To exercise these or other rights, please contact us using the contact information below. We will consider all requests and provide our response within the time period stated by applicable law. Please note, however, that certain information may be exempt from such requests in some circumstances, which may include if we need to keep processing your information for our legitimate interests or to comply with a legal obligation. We may request you provide us with information necessary to confirm your identity before responding to your request. Residents of France and certain other jurisdictions may also provide us with instructions regarding the manner in which we may continue to store, erase and share your information after your death, and where applicable, the person you have designated to exercise these rights after your death.
How We Protect Privacy Online
We take steps to protect your privacy when you use our web site – www.guggenheiminvestments.com – by using secure forms of online communication, including encryption technology, Secure Socket Layer (SSL) protocol, firewalls and user names and passwords. These safeguards vary based on the sensitivity of the information that we collect and store. However, we cannot and do not guarantee that these measures will prevent every unauthorized attempt to access, use, or disclose your information since despite our efforts, no Internet and/or other electronic transmissions can be completely secure. Our web site uses “http cookies”—tiny pieces of information that we ask your browser to
| | THE RYDEX FUNDS ANNUAL REPORT | 119 |
GUGGENHEIM INVESTMENTS PRIVACY NOTICE (Unaudited)(concluded) |
store. We use cookies for session management and security features on the Guggenheim Investments web site. We do not use them to pull data from your hard drive, to learn your e-mail address, or to view data in cookies created by other web sites. We will not share the information in our cookies or give others access to it. See the legal information area on our web site for more details about web site security and privacy features.
How We Safeguard Your Personal Information and Data Retention
We restrict access to nonpublic personal information about you to our employees and in some cases to third parties (for example, the service providers described above) as permitted by law. We maintain strict physical, electronic and procedural safeguards that comply with federal standards to guard your nonpublic personal information.
We keep your information for no longer than necessary for the purposes for which it is processed. The length of time for which we retain information depends on the purposes for which we collected and use it and/or as required to comply with applicable laws. Information may persist in copies made for backup and business continuity purposes for additional time.
International Visitors
If you are not a resident of the United States, please be aware that your information may be transferred to, stored and processed in the United States where our servers are located and our databases are operated. The data protection and other laws of the United States and other countries might not be as comprehensive as those in your country.
In such cases, we ensure that a legal basis for such a transfer exists and that adequate protection is provided as required by applicable law, for example, by using standard contractual clauses or by transferring your data to a jurisdiction that has obtained an adequacy finding. Individuals whose data may be transferred on the basis of standard contractual clauses may contact us as described below.
We’ll Keep You Informed
If you have any questions or concerns about how we treat your personal data, we encourage you to consult with us first. You may also contact the relevant supervisory authority.
We reserve the right to modify this policy at any time and will inform you promptly of material changes. You may access our privacy policy from our web site at www.guggenheiminvestments.com. Should you have any questions regarding our privacy policy, contact us by email at CorporateDataPrivacy@GuggenheimPartners.com.
120 | THE RYDEX FUNDS ANNUAL REPORT | |
This page intentionally left blank.
This page intentionally left blank.
This page intentionally left blank.
This page intentionally left blank.
This page intentionally left blank.
3.31.2021
Rydex Funds Annual Report
Domestic Equity Fund |
NASDAQ-100® Fund | | |
GuggenheimInvestments.com | ROTC-ANN-2-0321x0322 |

| | |
DEAR SHAREHOLDER | 2 |
ECONOMIC AND MARKET OVERVIEW | 4 |
ABOUT SHAREHOLDERS’ FUND EXPENSES | 7 |
NASDAQ-100® FUND | 10 |
NOTES TO FINANCIAL STATEMENTS | 28 |
REPORT OF INDEPENDENT REGISTERED PUBLIC ACCOUNTING FIRM | 47 |
OTHER INFORMATION | 49 |
INFORMATION ON BOARD OF TRUSTEES AND OFFICERS | 51 |
GUGGENHEIM INVESTMENTS PRIVACY NOTICE | 58 |
| | THE RYDEX FUNDS ANNUAL REPORT | 1 |
Dear Shareholder:
Security Investors, LLC (the “Investment Adviser”) is pleased to present the annual shareholder report for NASDAQ-100® Fund (the “Fund”). This report covers performance for the 12-month period ended March 31, 2021.
The Investment Adviser is part of Guggenheim Investments, which represents the investment management businesses of Guggenheim Partners, LLC (“Guggenheim”), a global, diversified financial services firm.
Guggenheim Funds Distributors, LLC is the distributor of the Funds. Guggenheim Funds Distributors, LLC is affiliated with Guggenheim and the Investment Adviser.
We encourage you to read the Economic and Market Overview section of the report, which follows this letter, and then the Performance Report and Fund Profile for the Fund.
We are committed to providing innovative investment solutions and appreciate the trust you place in us.
Sincerely,
Security Investors, LLC
April 30, 2021
Read a prospectus and summary prospectus (if available) carefully before investing. It contains the investment objectives, risks, charges, expenses, and other information, which should be considered carefully before investing. Obtain a prospectus and summary prospectus (if available) at guggenheiminvestments.com or call 800.820.0888.
This material is not intended as a recommendation or as investment advice of any kind, including in connection with rollovers, transfers, and distributions. Such material is not provided in a fiduciary capacity, may not be relied upon for or in connection with the making of investment decisions, and does not constitute a solicitation of an offer to buy or sell securities. All content has been provided for informational or educational purposes only and is not intended to be and should not be construed as legal or tax advice and/or a legal opinion. Always consult a financial, tax and/ or legal professional regarding your specific situation.
COVID-19. The global ongoing crisis caused by the outbreak of COVID-19 and the current recovery underway is causing disruption to consumer demand and economic output and supply chains. There are still travel restrictions and quarantines, and adverse impacts on local and global economies. Investors should be aware that in light of the current uncertainty, volatility and distress in economies, financial markets, and labor and public health conditions around the world, the Fund’s investments and a shareholder’s investment in the Fund are subject to investment risk, including the possible loss of the entire principal amount invested. Firms through which investors invest with the Fund, the Fund, its service providers, the markets in which it invests and market intermediaries are also impacted by quarantines and similar measures intended to respond to and contain the ongoing pandemic, which can obstruct their functioning and subject them to heightened operational and other risks.
2 | THE RYDEX FUNDS ANNUAL REPORT | |
The Nasdaq-100® Fund may not be suitable for all investors. ● Investing in the NASDAQ-100® Fund involves certain risks, which may include increased volatility due to the use of futures and the possibility that companies in which the Fund invests may not be commercially successful or may become obsolete more quickly. ● There are no assurances that any Rydex Fund will achieve its objective and/or strategy. This Fund is subject to active trading and tracking error risks, which may increase volatility, impact the Fund’s ability to achieve its investment objective and may decrease the Fund’s performance. ● This Fund is considered non-diversified and can invest a greater portion of its assets in securities of individual issuers than a diversified fund. As a result, changes in the market value of a single security could cause greater fluctuations in the value of Fund shares than would occur in a more diversified fund. ● For more on these and other risks, please read the prospectus.
| | THE RYDEX FUNDS ANNUAL REPORT | 3 |
ECONOMIC AND MARKET OVERVIEW (Unaudited) | March 31, 2021 |
For the 12-month period ended March 31, 2021, the Standard & Poor’s 500® (“S&P 500®”) Index returned 56.35% as the equity market roared back to life after a sharp selloff following the outbreak of COVID-19. This increase was in spite of ongoing personal and economic hardships imposed by COVID-19, highlighting the crucial role of policy support in the form of monetary and fiscal stimulus, which has succeeded in averting a lengthy recession in the U.S. These policy initiatives, particularly on the monetary side, increased market liquidity and lowered borrowing rates, reassuring equity investors that the Federal Reserve (the “Fed”) would do everything in its power to maintain market stability.
Our 2021 U.S. economic growth forecast increased during the first quarter of 2021 from an annualized 5.5% to over 7%, factoring in more fiscal stimulus than previously anticipated. This forecast captures the effect of stimulus representing roughly 11% of 2020–2021 gross domestic product (“GDP”), versus the previous calculation of about 8%. We see strength in the consumer sector and in housing activity. In addition, U.S. vaccinations for COVID-19 continue to accelerate, nearing 3 million doses per day by the end of the first quarter. More than 213 million doses have been administered in the U.S. so far, and about 35% of the U.S. population has been fully vaccinated. The U.S. is seeing the best-case scenario unfold in its vaccine rollout, but other countries have not been as fortunate.
Europe’s vaccine rollout hit a major speedbump during the first quarter when questions surrounding the safety of the AstraZeneca vaccine led several major European countries to temporarily suspend distribution. Safety concerns, coupled with supply constraints, meant that less than 10% of the populations of Germany, France, and Italy had been vaccinated by the end of the first quarter, well under the pace needed to reach 70% inoculated by summer. Any delay in ending the pandemic on a global scale has implications for other countries too, including the U.S., where travel and hospitality workers represent a large share of the unemployed.
Despite vaccination delays in Europe and its implications abroad, we saw meaningful improvement in the domestic labor market during the first quarter as states moved forward with business re-openings. Seasonally adjusted initial jobless claims fell by 97,000 to 684,000 in the week ending March 20, 2021, the lowest level since the pandemic began, before seeing an uptick the following week to 719,000. We saw more positive news across the board in the March payroll report with 916,000 jobs added, and with 156,000 more from revisions. Standing in the way of additional labor market gains are local government restrictions on certain sectors, although easing of these restrictions is expected by summer.
Economic developments drove a sharp increase in U.S. Treasury yields. The market pulled forward expectations of the next Fed rate hike from December 2023 to December 2022, while repricing the long-run terminal Fed funds rate estimate to 2.25% from just 0.55% last August. We do not expect the Fed to raise interest rates as early as the market is anticipating, even though we expect strong GDP growth in coming years.
4 | THE RYDEX FUNDS ANNUAL REPORT | |
ECONOMIC AND MARKET OVERVIEW (Unaudited)(continued) | March 31, 2021 |
Year-over-year inflation measures will rise over the next several months due to base effects, which may be compounded by supply chain disruptions in the goods sector and potential capacity constraints for certain services. However, these factors could prove to be short-lived, with base effects set to dampen inflation starting in the summer months. Moreover, the Fed is focused on generating sustainably higher inflation. Even if core inflation rises above the Fed’s 2% target in 2021, the Fed’s focus is on a long-term average of 2%. With years of shortfalls to make up, and the Fed now targeting labor market disparities as part of an expanded definition of full employment, we expect policymakers to remain resolutely patient. Any tapering of asset purchases will likely be deferred until later in 2022, with the first rate hike likely to come sometime after that.
Easy financial conditions and low rates will likely support credit over the next few years. With market optimism pulling forward rate hike expectations and causing bond yields to rise, we view this as an opportunity to add incremental yield to portfolios.
For the 12-month period ended March 31, 2021, the S&P 500® Index* returned, as noted, 56.35%. The MSCI Europe-Australasia-Far East (“EAFE”) Index* returned 44.57%. The return of the MSCI Emerging Markets Index* was 58.39%.
In the bond market, the Bloomberg Barclays U.S. Aggregate Bond Index* posted a 0.71% return for the 12-month period, while the Bloomberg Barclays U.S. Corporate High Yield Index* returned 23.72%. The return of the ICE Bank of America (“BofA”) Merrill Lynch 3-Month U.S. Treasury Bill Index* was 0.12% for the 12-month period.
The opinions and forecasts expressed may not actually come to pass. This information is subject to change at any time, based on market and other conditions, and should not be construed as a recommendation of any specific security or strategy.
*Index Definitions:
The following indices are referenced throughout this report. Indices are unmanaged and not available for direct investment. Index performance does not reflect transaction costs, fees, or expenses.
Bloomberg Barclays U.S. Aggregate Bond Index is a broad-based flagship benchmark that measures the investment grade, U.S. dollar-denominated, fixed-rate taxable bond market, including U.S. Treasuries, government-related and corporate securities, mortgage-backed securities or “MBS” (agency fixed-rate and hybrid adjustable-rate mortgage, or “ARM”, pass-throughs), asset-backed securities (“ABS”), and commercial mortgage-backed securities (“CMBS”) (agency and non-agency).
Bloomberg Barclays U.S. Corporate High Yield Index measures the U.S. dollar-denominated, high yield, fixed-rate corporate bond market. Securities are classified as high yield if the middle rating of Moody’s, Fitch, and S&P is Ba1/BB +/BB + or below.
ICE BofA Merrill Lynch 3-Month U.S. Treasury Bill Index is an unmanaged market index of U.S. Treasury securities maturing in 90 days that assumes reinvestment of all income.
MSCI EAFE Index is a free float-adjusted market capitalization index that is designed to measure the equity market performance of developed markets, excluding the U.S. & Canada.
| | THE RYDEX FUNDS ANNUAL REPORT | 5 |
ECONOMIC AND MARKET OVERVIEW (Unaudited)(concluded) | March 31, 2021 |
MSCI Emerging Markets Index is a free float-adjusted market capitalization weighted index that is designed to measure equity market performance in the global emerging markets.
NASDAQ-100® Index includes 100 of the largest domestic and international non-financial securities listed on The Nasdaq Stock Market based on market capitalization. The Index reflects companies across major industry groups including computer hardware and software, telecommunications, retail/wholesale trade and biotechnology. It does not contain securities of financial companies including investment companies.
S&P 500® is a broad-based index, the performance of which is based on the performance of 500 widely held common stocks chosen for market size, liquidity, and industry group representation.
6 | THE RYDEX FUNDS ANNUAL REPORT | |
ABOUT SHAREHOLDERS’ FUND EXPENSES (Unaudited) |
All mutual funds have operating expenses, and it is important for our shareholders to understand the impact of costs on their investments. Shareholders of a fund incur two types of costs: (i) transaction costs, including sales charges (loads) on purchase payments, reinvested dividends, other distributions, and exchange fees, and (ii) ongoing costs, including management fees, administrative services, and shareholder reports, among others. These ongoing costs, or operating expenses, are deducted from a fund’s gross income and reduce the investment return of the fund.
A fund’s expenses are expressed as a percentage of its average net assets, which is known as the expense ratio. The following examples are intended to help investors understand the ongoing costs (in dollars) of investing in a fund and to compare these costs with the ongoing costs of investing in other mutual funds.
The examples are based on an investment of $1,000 made at the beginning of the period and held for the entire six-month period beginning September 30, 2020 and ending March 31, 2021.
The following tables illustrate the Fund’s costs in two ways:
Table 1. Based on actual Fund return: This section helps investors estimate the actual expenses paid over the period. The “Ending Account Value” shown is derived from the Fund’s actual return, and the fifth column shows the dollar amount that would have been paid by an investor who started with $1,000 in the Fund. Investors may use the information here, together with the amount invested, to estimate the expenses paid over the period. Simply divide the Fund’s account value by $1,000 (for example, an $8,600 account value divided by $1,000 = 8.6), then multiply the result by the number provided under the heading “Expenses Paid During Period.”
Table 2. Based on hypothetical 5% return: This section is intended to help investors compare a fund’s cost with those of other mutual funds. The table provides information about hypothetical account values and hypothetical expenses based on the Fund’s actual expense ratio and an assumed rate of return of 5% per year before expenses, which is not the Fund’s actual return. The hypothetical account values and expenses may not be used to estimate the actual ending account balance or expenses paid during the period. The example is useful in making comparisons because the U.S. Securities and Exchange Commission (the “SEC”) requires all mutual funds to calculate expenses based on the 5% return. Investors can assess a Fund’s costs by comparing this hypothetical example with the hypothetical examples that appear in shareholder reports of other funds.
The calculations illustrated above assume no shares were bought or sold during the period. Actual costs may have been higher or lower, depending on the amount of investment and the timing of any purchases or redemptions.
| | THE RYDEX FUNDS ANNUAL REPORT | 7 |
ABOUT SHAREHOLDERS’ FUND EXPENSES (Unaudited)(continued) |
Please note that the expenses shown in the table are meant to highlight your ongoing costs only and do not reflect any transactional costs, such as sales charges (loads) on purchase payments, and contingent deferred sales charges (“CDSC”) on redemptions, if any. Therefore, the second table is useful in comparing ongoing costs only, and will not help you determine the relative total costs of owning different funds. In addition, if these transactional costs were included, your costs would have been higher.
More information about the Fund’s expenses, including annual expense ratios for periods up to five years (subject to the Fund’s inception date), can be found in the Financial Highlights section of this report. For additional information on operating expenses and other shareholder costs, please refer to the Fund’s prospectus.
8 | THE RYDEX FUNDS ANNUAL REPORT | |
ABOUT SHAREHOLDERS’ FUND EXPENSES (Unaudited)(concluded) |
| Expense
Ratio1 | Fund
Return | Beginning
Account Value
September 30,
2020 | Ending
Account Value
March 31,
2021 | Expenses
Paid During
Period2 |
Table 1. Based on actual Fund return3 |
Investor Class | 1.29% | 14.32% | $ 1,000.00 | $ 1,143.20 | $ 6.89 |
A-Class | 1.54% | 14.20% | 1,000.00 | 1,142.00 | 8.22 |
C-Class | 2.29% | 13.76% | 1,000.00 | 1,137.60 | 12.20 |
H-Class | 1.55% | 14.18% | 1,000.00 | 1,141.80 | 8.28 |
|
Table 2. Based on hypothetical 5% return (before expenses) |
Investor Class | 1.29% | 5.00% | $ 1,000.00 | $ 1,018.50 | $ 6.49 |
A-Class | 1.54% | 5.00% | 1,000.00 | 1,017.25 | 7.75 |
C-Class | 2.29% | 5.00% | 1,000.00 | 1,013.51 | 11.50 |
H-Class | 1.55% | 5.00% | 1,000.00 | 1,017.20 | 7.80 |
1 | Annualized and excludes expenses of the underlying funds in which the Fund invests, if any. |
2 | Expenses are equal to the Fund’s annualized expense ratio, net of any applicable fee waivers, multiplied by the average account value over the period, multiplied by 182/365 (to reflect the one-half year period). |
3 | Actual cumulative return at net asset value for the period September 30, 2020 to March 31, 2021. |
| | THE RYDEX FUNDS ANNUAL REPORT | 9 |
PERFORMANCE REPORT AND FUND PROFILE (Unaudited) | March 31, 2021 |
NASDAQ-100® FUND
OBJECTIVE: Seeks to provide investment results that correspond, before fees and expenses, to a benchmark for over-the-counter securities on a daily basis. The Fund’s current benchmark is the NASDAQ-100® Index (the “underlying index”).
For the one-year period ended March 31, 2021, NASDAQ-100 Fund maintained a daily correlation of over 99% to its benchmark of 100% of the daily price movement of the NASDAQ-100® Index. The Fund Investor Class returned 66.78%, while the NASDAQ-100 Index returned 68.88% over the same time period.
All sectors contributed to the return of the underlying index for the period, led by Information Technology, Consumer Discretionary, and Communication Services.
The holdings contributing the most to the return of the underlying index were Apple, Inc., Amazon.com, Inc., and Microsoft Corp. The holdings detracting the most were Biogen, Inc., Gilead Sciences, Inc., and Peloton Interactive, Inc. - Class A.
Derivatives in the Fund were used to help provide exposure to the composition of the benchmark in the highest efficient manner and to provide leverage and not for hedging purposes. Derivatives performed as expected.
The Fund may invest in certain of the underlying series of Guggenheim Funds Trust and Guggenheim Strategy Funds Trust, including Guggenheim Ultra Short Duration, Guggenheim Strategy Fund II and Guggenheim Strategy Fund III (collectively, the “Short Term Investment Vehicles”), each of which are open-end management investment companies managed by Guggenheim Investments. The Short Term Investment Vehicles, which launched on March 11, 2014, are offered as short term investment options only to mutual funds, trusts, and other accounts managed by Guggenheim Investments and/or its affiliates, and are not available to the public, with the exception of Guggenheim Ultra Short Duration Fund, which is available to the public. Guggenheim Strategy Fund II and Guggenheim Strategy Fund III do not charge an investment management fee. Guggenheim Ultra Short Duration Fund charges an investment management fee but that fee is waived by the respective investee fund. For the one-year period ended March 31, 2021, investment in the Short Term Investment Vehicles benefited Fund performance.
Performance displayed represents past performance, which is no guarantee of future results.
10 | THE RYDEX FUNDS ANNUAL REPORT | |
PERFORMANCE REPORT AND FUND PROFILE (Unaudited)(continued) | March 31, 2021 |
Holdings Diversification (Market Exposure as % of Net Assets)

“Holdings Diversification (Market Exposure as % of Net Assets)” excludes any temporary cash investments, investments in Guggenheim Strategy Funds Trust mutual funds, or investments in Guggenheim Ultra Short Duration Fund. Investments in those Funds do not provide “market exposure” to meet the Fund’s investment objective, but will significantly increase the portfolio’s exposure to certain other asset categories (and their associated risks), which may cause the Fund to deviate from its principal investment strategy, including: (i) high yield, high risk debt securities rated below the top four long-term rating categories by a nationally recognized statistical rating organization (also known as “junk bonds”); (ii) securities issued by the U.S. government or its agencies and instrumentalities; (iii) CLOs and similar investments; and (iv) other short-term fixed income securities.
Inception Dates: |
Investor Class | February 14, 1994 |
A-Class | March 31, 2004 |
C-Class | March 26, 2001 |
H-Class | September 18, 2014 |
Ten Largest Holdings (% of Total Net Assets) |
Apple, Inc. | 10.3% |
Microsoft Corp. | 9.0% |
Amazon.com, Inc. | 7.8% |
Tesla, Inc. | 4.0% |
Facebook, Inc. — Class A | 3.6% |
Alphabet, Inc. — Class C | 3.4% |
Alphabet, Inc. — Class A | 3.1% |
NVIDIA Corp. | 2.5% |
PayPal Holdings, Inc. | 2.2% |
Intel Corp. | 2.0% |
Top Ten Total | 47.9% |
| | |
“Ten Largest Holdings” excludes any temporary cash or derivative investments. |
| | THE RYDEX FUNDS ANNUAL REPORT | 11 |
PERFORMANCE REPORT AND FUND PROFILE (Unaudited)(continued) | March 31, 2021 |
Cumulative Fund Performance*
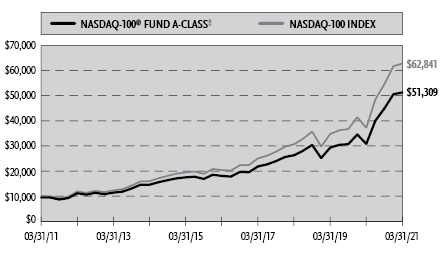
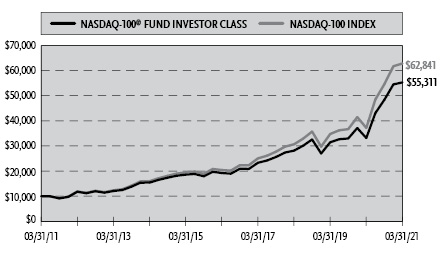
12 | THE RYDEX FUNDS ANNUAL REPORT | |
PERFORMANCE REPORT AND FUND PROFILE (Unaudited)(concluded) | March 31, 2021 |
Average Annual Returns*
Periods Ended March 31, 2021
| 1 Year | 5 Year | 10 Year |
Investor Class Shares | 66.78% | 23.53% | 18.65% |
A-Class Shares | 66.37% | 23.19% | 18.34% |
A-Class Shares with sales charge‡ | 58.47% | 22.00% | 17.77% |
C-Class Shares | 65.17% | 22.30% | 17.47% |
C-Class Shares with CDSC§ | 64.17% | 22.30% | 17.47% |
NASDAQ-100 Index | 68.88% | 25.22% | 20.18% |
| 1 Year | 5 Year | Since
Inception
(09/18/14) |
H-Class Shares | 66.36% | 23.22% | 18.85% |
NASDAQ-100 Index | 68.88% | 25.22% | 20.75% |
* | The performance data above represents past performance that is not predictive of future results. The investment return and principal value of an investment in the Fund will fluctuate so that an investor’s shares, when redeemed, may be worth more or less than their original cost. Returns are historical and include changes in principal and reinvested dividends and capital gains and do not reflect the effect of taxes. The NASDAQ-100 Index is an unmanaged index and, unlike the Fund, has no management fees or operating expenses to reduce its reported return. The graphs are based on the Investor Class shares and A-Class shares only; performance for C-Class shares and H-Class shares will vary due to differences in fee structures. |
‡ | Fund returns are calculated using the maximum sales charge of 4.75%. |
§ | Fund returns include a CDSC of 1% if redeemed within 12 months of purchase. |
| | THE RYDEX FUNDS ANNUAL REPORT | 13 |
SCHEDULE OF INVESTMENTS | March 31, 2021 |
NASDAQ-100® Fund | |
| | Shares | | | Value | |
COMMON STOCKS† - 94.1% |
| | | | | | | | | |
Technology - 41.6% |
Apple, Inc. | | | 1,349,888 | | | $ | 164,888,819 | |
Microsoft Corp. | | | 606,451 | | | | 142,982,952 | |
NVIDIA Corp. | | | 75,862 | | | | 40,504,998 | |
Intel Corp. | | | 497,139 | | | | 31,816,896 | |
Adobe, Inc.* | | | 58,573 | | | | 27,843,847 | |
Broadcom, Inc. | | | 49,949 | | | | 23,159,353 | |
Texas Instruments, Inc. | | | 112,599 | | | | 21,280,085 | |
QUALCOMM, Inc. | | | 138,998 | | | | 18,429,745 | |
Applied Materials, Inc. | | | 112,283 | | | | 15,001,009 | |
Intuit, Inc. | | | 33,506 | | | | 12,834,808 | |
Micron Technology, Inc.* | | | 136,878 | | | | 12,074,008 | |
Advanced Micro Devices, Inc.* | | | 148,215 | | | | 11,634,877 | |
Lam Research Corp. | | | 17,486 | | | | 10,408,367 | |
Fiserv, Inc.* | | | 81,913 | | | | 9,750,924 | |
Activision Blizzard, Inc. | | | 94,797 | | | | 8,816,121 | |
Zoom Video Communications, Inc. — Class A* | | | 24,944 | | | | 8,014,258 | |
Autodesk, Inc.* | | | 26,905 | | | | 7,456,721 | |
Analog Devices, Inc. | | | 45,137 | | | | 6,999,846 | |
NXP Semiconductor N.V. | | | 33,894 | | | | 6,824,218 | |
KLA Corp. | | | 18,852 | | | | 6,228,701 | |
ASML Holding N.V. — Class G | | | 9,512 | | | | 5,872,328 | |
Workday, Inc. — Class A* | | | 22,024 | | | | 5,471,422 | |
Microchip Technology, Inc. | | | 32,946 | | | | 5,113,878 | |
Cognizant Technology Solutions Corp. — Class A | | | 64,925 | | | | 5,071,941 | |
Electronic Arts, Inc. | | | 35,193 | | | | 4,764,076 | |
Cadence Design Systems, Inc.* | | | 34,135 | | | | 4,676,154 | |
DocuSign, Inc.* | | | 22,827 | | | | 4,621,326 | |
Synopsys, Inc.* | | | 18,644 | | | | 4,619,610 | |
Paychex, Inc. | | | 44,126 | | | | 4,325,231 | |
Marvell Technology Group Ltd. | | | 82,200 | | | | 4,026,156 | |
NetEase, Inc. ADR | | | 36,660 | | | | 3,785,512 | |
Xilinx, Inc. | | | 30,012 | | | | 3,718,487 | |
Skyworks Solutions, Inc. | | | 20,177 | | | | 3,702,076 | |
ANSYS, Inc.* | | | 10,615 | | | | 3,604,429 | |
Atlassian Corporation plc — Class A* | | | 16,277 | | | | 3,430,541 | |
Maxim Integrated Products, Inc. | | | 32,797 | | | | 2,996,662 | |
Cerner Corp. | | | 37,477 | | | | 2,693,847 | |
Splunk, Inc.* | | | 19,788 | | | | 2,680,878 | |
Check Point Software Technologies Ltd.* | | | 17,155 | | | | 1,920,845 | |
Total Technology | | | | | | | 664,045,952 | |
| | | | | | | | | |
Communications - 29.7% |
Amazon.com, Inc.* | | | 40,490 | | | | 125,279,299 | |
Facebook, Inc. — Class A* | | | 193,416 | | | | 56,966,815 | |
Alphabet, Inc. — Class C* | | | 26,338 | | | | 54,483,577 | |
Alphabet, Inc. — Class A* | | | 24,182 | | | | 49,875,859 | |
Comcast Corp. — Class A | | | 559,323 | | | | 30,264,968 | |
Netflix, Inc.* | | | 54,192 | | | | 28,269,799 | |
Cisco Systems, Inc. | | | 516,567 | | | | 26,711,679 | |
T-Mobile US, Inc.* | | | 152,066 | | | | 19,052,349 | |
Charter Communications, Inc. — Class A* | | | 23,705 | | | | 14,626,459 | |
Booking Holdings, Inc.* | | | 5,012 | | | | 11,677,158 | |
MercadoLibre, Inc.* | | | 6,103 | | | | 8,984,470 | |
JD.com, Inc. ADR* | | | 101,640 | | | | 8,571,301 | |
Baidu, Inc. ADR* | | | 33,204 | | | | 7,223,530 | |
Pinduoduo, Inc. ADR* | | | 42,271 | | | | 5,659,241 | |
14 | THE RYDEX FUNDS ANNUAL REPORT | SEE NOTES TO FINANCIAL STATEMENTS. |
SCHEDULE OF INVESTMENTS (continued) | March 31, 2021 |
NASDAQ-100® Fund | |
| | Shares | | | Value | |
eBay, Inc. | | | 83,258 | | | $ | 5,098,720 | |
Match Group, Inc.* | | | 32,911 | | | | 4,521,313 | |
Okta, Inc.* | | | 14,832 | | | | 3,269,418 | |
Sirius XM Holdings, Inc.1 | | | 506,558 | | | | 3,084,938 | |
CDW Corp. | | | 17,252 | | | | 2,859,519 | |
VeriSign, Inc.* | | | 13,838 | | | | 2,750,441 | |
Trip.com Group Ltd. ADR* | | | 64,463 | | | | 2,554,669 | |
Fox Corp. — Class A | | | 40,911 | | | | 1,477,296 | |
Fox Corp. — Class B | | | 31,347 | | | | 1,094,951 | |
Total Communications | | | | | | | 474,357,769 | |
| | | | | | | | | |
Consumer, Non-cyclical - 12.4% |
PayPal Holdings, Inc.* | | | 143,302 | | | | 34,799,458 | |
PepsiCo, Inc. | | | 168,805 | | | | 23,877,467 | |
Amgen, Inc. | | | 70,670 | | | | 17,583,403 | |
Intuitive Surgical, Inc.* | | | 14,404 | | | | 10,643,692 | |
Mondelez International, Inc. — Class A | | | 172,783 | | | | 10,112,989 | |
Gilead Sciences, Inc. | | | 153,754 | | | | 9,937,121 | |
Automatic Data Processing, Inc. | | | 52,362 | | | | 9,868,666 | |
Illumina, Inc.* | | | 17,852 | | | | 6,856,239 | |
Vertex Pharmaceuticals, Inc.* | | | 31,808 | | | | 6,835,221 | |
Moderna, Inc.* | | | 48,915 | | | | 6,405,419 | |
Regeneron Pharmaceuticals, Inc.* | | | 12,882 | | | | 6,094,989 | |
Kraft Heinz Co. | | | 149,665 | | | | 5,986,600 | |
Keurig Dr Pepper, Inc. | | | 172,190 | | | | 5,918,170 | |
Monster Beverage Corp.* | | | 64,595 | | | | 5,883,959 | |
Align Technology, Inc.* | | | 9,682 | | | | 5,243,094 | |
Biogen, Inc.* | | | 18,640 | | | | 5,214,540 | |
IDEXX Laboratories, Inc.* | | | 10,453 | | | | 5,114,757 | |
Cintas Corp. | | | 12,851 | | | | 4,386,175 | |
DexCom, Inc.* | | | 11,768 | | | | 4,229,301 | |
Alexion Pharmaceuticals, Inc.* | | | 26,900 | | | | 4,113,279 | |
Verisk Analytics, Inc. — Class A | | | 19,919 | | | | 3,519,488 | |
Seagen, Inc.* | | | 22,167 | | | | 3,078,110 | |
Incyte Corp.* | | | 26,899 | | | | 2,186,082 | |
Total Consumer, Non-cyclical | | | 197,888,219 | |
| | | | | | | | | |
Consumer, Cyclical - 8.9% |
Tesla, Inc.* | | | 95,512 | | | | 63,795,330 | |
Costco Wholesale Corp. | | | 54,199 | | | | 19,104,063 | |
Starbucks Corp. | | | 144,052 | | | | 15,740,562 | |
Marriott International, Inc. — Class A* | | | 39,695 | | | | 5,879,226 | |
Walgreens Boots Alliance, Inc. | | | 105,722 | | | | 5,804,138 | |
Ross Stores, Inc. | | | 43,616 | | | | 5,229,995 | |
Lululemon Athletica, Inc.* | | | 15,310 | | | | 4,695,730 | |
O’Reilly Automotive, Inc.* | | | 8,590 | | | | 4,357,277 | |
PACCAR, Inc. | | | 42,451 | | | | 3,944,547 | |
Peloton Interactive, Inc. — Class A* | | | 32,258 | | | | 3,627,090 | |
Fastenal Co. | | | 70,275 | | | | 3,533,427 | |
Dollar Tree, Inc.* | | | 28,778 | | | | 3,293,930 | |
Copart, Inc.* | | | 28,916 | | | | 3,140,567 | |
Total Consumer, Cyclical | | | 142,145,882 | |
| | | | | | | | | |
Utilities - 0.9% |
Exelon Corp. | | | 119,462 | | | | 5,225,268 | |
American Electric Power Company, Inc. | | | 60,763 | | | | 5,146,626 | |
Xcel Energy, Inc. | | | 65,785 | | | | 4,375,361 | |
Total Utilities | | | | | | | 14,747,255 | |
| | | | | | | | | |
Industrial - 0.6% |
CSX Corp. | | | 93,298 | | | | 8,995,793 | |
| | | | | | | | | |
Total Common Stocks | | | | |
(Cost $444,746,673) | | | | | | $ | 1,502,180,870 | |
SEE NOTES TO FINANCIAL STATEMENTS. | THE RYDEX FUNDS ANNUAL REPORT | 15 |
SCHEDULE OF INVESTMENTS (continued) | March 31, 2021 |
NASDAQ-100® Fund | |
| | Shares | | | Value | |
MUTUAL FUNDS† - 3.1% |
Guggenheim Ultra Short Duration Fund — Institutional Class2 | | | 2,563,180 | | | $ | 25,529,268 | |
Guggenheim Strategy Fund II2 | | | 575,584 | | | | 14,378,100 | |
Guggenheim Strategy Fund III2 | | | 370,504 | | | | 9,314,465 | |
Total Mutual Funds | | | | |
(Cost $49,178,710) | | | | | | | 49,221,833 | |
| | | | | | | | | |
| | | Face
Amount | | | | | |
U.S. TREASURY BILLS†† - 1.8% |
U.S. Treasury Bills |
0.01% due 04/06/213 | | $ | 15,000,000 | | | | 14,999,979 | |
0.04% due 04/01/213,4 | | | 8,000,000 | | | | 8,000,000 | |
0.01% due 04/22/213,5 | | | 3,828,000 | | | | 3,827,972 | |
0.09% due 04/01/213,4 | | | 1,500,000 | | | | 1,500,000 | |
U.S. Cash Management Bill |
0.03% due 08/03/213 | | | 1,000,000 | | | | 999,901 | |
Total U.S. Treasury Bills | | | | |
(Cost $29,327,857) | | | | | | | 29,327,852 | |
| | | | | | | | | |
FEDERAL AGENCY NOTES†† - 0.5% |
Federal Farm Credit Bank |
0.40% (U.S. Prime Rate - 2.85%, Rate Floor: 0.00%) due 08/30/226 | | | 3,000,000 | | | | 3,011,387 | |
0.27% due 06/09/22 | | | 2,000,000 | | | | 1,999,041 | |
0.45% (U.S. Prime Rate - 2.80%, Rate Floor: 0.00%) due 11/23/216 | | | 1,400,000 | | | | 1,403,422 | |
Fannie Mae |
0.23% (U.S. Secured Overnight Financing Rate + 0.22%, Rate Floor: 0.00%) due 03/16/226 | | | 2,000,000 | | | | 2,003,901 | |
Total Federal Agency Notes | | | | |
(Cost $8,399,264) | | | | | | | 8,417,751 | |
| | | | | | | | | |
REPURCHASE AGREEMENTS††,7 - 0.7% |
J.P. Morgan Securities LLC
issued 03/31/21 at 0.01%
due 04/01/214 | | | 5,900,683 | | | | 5,900,683 | |
Barclays Capital, Inc.
issued 03/31/21 at 0.01%
due 04/01/214 | | | 2,682,738 | | | | 2,682,738 | |
BofA Securities, Inc.
issued 03/31/21 at 0.01%
due 04/01/214 | | | 2,448,416 | | | | 2,448,416 | |
Total Repurchase Agreements | | | | |
(Cost $11,031,837) | | | | | | | 11,031,837 | |
| | | | | | | | | |
| | | Shares | | | | | |
SECURITIES LENDING COLLATERAL†,8 - 0.2% |
Money Market Fund | | | | | | | | |
First American Government Obligations Fund — Class Z, 0.03%9 | | | 2,374,488 | | | | 2,374,488 | |
Total Securities Lending Collateral | | | | |
(Cost $2,374,488) | | | | | | | 2,374,488 | |
| | | | | | | | | |
Total Investments - 100.4% | | | | |
(Cost $545,058,829) | | $ | 1,602,554,631 | |
Other Assets & Liabilities, net - (0.4)% | | | (6,178,681 | ) |
Total Net Assets - 100.0% | | $ | 1,596,375,950 | |
16 | THE RYDEX FUNDS ANNUAL REPORT | SEE NOTES TO FINANCIAL STATEMENTS. |
SCHEDULE OF INVESTMENTS (continued) | March 31, 2021 |
NASDAQ-100® Fund | |
Futures Contracts |
Description | | Number of
Contracts | | | Expiration
Date | | | Notional
Amount | | | Value and
Unrealized
Appreciation** | |
Equity Futures Contracts Purchased† |
NASDAQ-100 Index Mini Futures Contracts | | | 241 | | | | Jun 2021 | | | $ | 63,068,495 | | | $ | 769,277 | |
Total Return Swap Agreements |
Counterparty | Index | Financing
Rate Pay | Payment
Frequency | | Maturity
Date | | | Units | | | Notional
Amount | | | Value and
Unrealized
Appreciation
(Depreciation) | |
OTC Equity Index Swap Agreements†† |
Goldman Sachs International | NASDAQ-100 Index | 0.64% (1 Week USD LIBOR + 0.55%) | At Maturity | | | 04/08/21 | | | | 1,791 | | | $ | 23,448,538 | | | $ | 520,858 | |
BNP Paribas | NASDAQ-100 Index | 0.76% (1 Month USD LIBOR + 0.65%) | At Maturity | | | 04/08/21 | | | | 295 | | | | 3,866,563 | | | | (179,649 | ) |
Barclays Bank plc | NASDAQ-100 Index | 0.59% (1 Week USD LIBOR + 0.50%) | At Maturity | | | 04/07/21 | | | | 339 | | | | 4,439,641 | | | | (231,389 | ) |
| | | | | | | | | | | | | | $ | 31,754,742 | | | $ | 109,820 | |
SEE NOTES TO FINANCIAL STATEMENTS. | THE RYDEX FUNDS ANNUAL REPORT | 17 |
SCHEDULE OF INVESTMENTS (continued) | March 31, 2021 |
NASDAQ-100® Fund | |
* | Non-income producing security. |
** | Includes cumulative appreciation (depreciation). Variation margin is reported within the Statement of Assets and Liabilities. |
† | Value determined based on Level 1 inputs — See Note 4. |
†† | Value determined based on Level 2 inputs — See Note 4. |
1 | All or a portion of this security is on loan at March 31, 2021 — See Note 7. |
2 | Affiliated issuer. |
3 | Rate indicated is the effective yield at the time of purchase. |
4 | All or a portion of this security is pledged as equity index swap collateral at March 31, 2021. |
5 | All or a portion of this security is pledged as futures collateral at March 31, 2021. |
6 | Variable rate security. Rate indicated is the rate effective at March 31, 2021. In some instances, the effective rate is limited by a minimum rate floor or a maximum rate cap established by the issuer. The settlement status of a position may also impact the effective rate indicated. In some cases, a position may be unsettled at period end and may not have a stated effective rate. In instances where multiple underlying reference rates and spread amounts are shown, the effective rate is based on a weighted average. |
7 | Repurchase Agreements — See Note 6. |
8 | Securities lending collateral — See Note 7. |
9 | Rate indicated is the 7-day yield as of March 31, 2021. |
| | ADR — American Depositary Receipt |
| | LIBOR — London Interbank Offered Rate |
| | plc — Public Limited Company |
| | |
| | See Sector Classification in Other Information section. |
The following table summarizes the inputs used to value the Fund’s investments at March 31, 2021 (See Note 4 in the Notes to Financial Statements):
Investments in Securities (Assets) | | Level 1
Quoted
Prices | | | Level 2
Significant
Observable
Inputs | | | Level 3
Significant
Unobservable
Inputs | | | Total | |
Common Stocks | | $ | 1,502,180,870 | | | $ | — | | | $ | — | | | $ | 1,502,180,870 | |
Mutual Funds | | | 49,221,833 | | | | — | | | | — | | | | 49,221,833 | |
U.S. Treasury Bills | | | — | | | | 29,327,852 | | | | — | | | | 29,327,852 | |
Federal Agency Notes | | | — | | | | 8,417,751 | | | | — | | | | 8,417,751 | |
Repurchase Agreements | | | — | | | | 11,031,837 | | | | — | | | | 11,031,837 | |
Securities Lending Collateral | | | 2,374,488 | | | | — | | | | — | | | | 2,374,488 | |
Equity Futures Contracts** | | | 769,277 | | | | — | | | | — | | | | 769,277 | |
Equity Index Swap Agreements** | | | — | | | | 520,858 | | | | — | | | | 520,858 | |
Total Assets | | $ | 1,554,546,468 | | | $ | 49,298,298 | | | $ | — | | | $ | 1,603,844,766 | |
Investments in Securities (Liabilities) | | Level 1
Quoted
Prices | | | Level 2
Significant
Observable
Inputs | | | Level 3
Significant
Unobservable
Inputs | | | Total | |
Equity Index Swap Agreements** | | $ | — | | | $ | 411,038 | | | $ | — | | | $ | 411,038 | |
** | This derivative is reported as unrealized appreciation/depreciation at period end. |
18 | THE RYDEX FUNDS ANNUAL REPORT | SEE NOTES TO FINANCIAL STATEMENTS. |
SCHEDULE OF INVESTMENTS (concluded) | March 31, 2021 |
NASDAQ-100® Fund | |
Affiliated Transactions
Investments representing 5% or more of the outstanding voting shares of a company, or control of or by, or common control under Guggenheim Investments (“GI”), result in that company being considered an affiliated issuer, as defined in the 1940 Act.
The Fund may invest in certain of the underlying series of Guggenheim Strategy Funds Trust, including Guggenheim Strategy Fund II and Guggenheim Strategy Fund III, (collectively, the “Short Term Investment Vehicles”), each of which are open-end management investment companies managed by GI. The Short Term Investment Vehicles, which launched on March 11, 2014, are offered as short term investment options only to mutual funds, trusts, and other accounts managed by GI and/or its affiliates, and are not available to the public. The Short Term Investment Vehicles pay no investment management fees. The Short Term Investment Vehicles’ annual report on Form N-CSR dated September 30, 2020, is available publicly or upon request. This information is available from the EDGAR database on the SEC’s website at https://www.sec.gov/Archives/edgar/data/1601445/000182126820000133/gug81042-ncsr.htm.
Transactions during the year ended March 31, 2021, in which the company is an affiliated issuer, were as follows:
Security Name | | Value
03/31/20 | | | Additions | | | Reductions | | | Realized
Gain (Loss) | | | Change in
Unrealized
Appreciation
(Depreciation) | |
Mutual Funds | | | | | | | | | | | | | | | | | | | | |
Guggenheim Strategy Fund II | | $ | 13,842,806 | | | $ | — | | | $ | — | | | $ | — | | | $ | 535,294 | |
Guggenheim Strategy Fund III | | | 8,569,619 | | | | 350,000 | | | | — | | | | — | | | | 394,846 | |
Guggenheim Ultra Short Duration Fund — Institutional Class | | | 15,735,775 | | | | 9,500,000 | | | | — | | | | — | | | | 293,493 | |
| | | $ | 38,148,200 | | | $ | 9,850,000 | | | $ | — | | | $ | — | | | $ | 1,223,633 | |
Security Name | | Value
03/31/21 | | | Shares
03/31/21 | | | Investment
Income | |
Mutual Funds | | | | | | | | | | | | |
Guggenheim Strategy Fund II | | $ | 14,378,100 | | | | 575,584 | | | $ | 244,136 | |
Guggenheim Strategy Fund III | | | 9,314,465 | | | | 370,504 | | | | 161,143 | |
Guggenheim Ultra Short Duration Fund — Institutional Class | | | 25,529,268 | | | | 2,563,180 | | | | 209,716 | |
| | | $ | 49,221,833 | | | | | | | $ | 614,995 | |
SEE NOTES TO FINANCIAL STATEMENTS. | THE RYDEX FUNDS ANNUAL REPORT | 19 |
STATEMENT OF ASSETS AND LIABILITIES |
NASDAQ-100® Fund |
March 31, 2021
Assets: |
Investments in unaffiliated issuers, at value - including $2,313,701 of securities loaned (cost $484,848,282) | | $ | 1,542,300,961 | |
Investments in affiliated issuers, at value (cost $49,178,710) | | | 49,221,833 | |
Repurchase agreements, at value (cost $11,031,837) | | | 11,031,837 | |
Segregated cash with broker | | | 47,178 | |
Unrealized appreciation on OTC swap agreements | | | 520,858 | |
Receivables: |
Variation margin on futures contracts | | | 995,330 | |
Fund shares sold | | | 746,109 | |
Dividends | | | 260,126 | |
Interest | | | 3,601 | |
Securities lending income | | | 476 | |
Total assets | | | 1,605,128,309 | |
| | | | | |
Liabilities: |
Unrealized depreciation on OTC swap agreements | | | 411,038 | |
Payable for: |
Return of securities lending collateral | | | 2,374,488 | |
Securities purchased | | | 999,901 | |
Management fees | | | 966,191 | |
Swap settlement | | | 875,213 | |
Fund shares redeemed | | | 770,811 | |
Professional fees | | | 376,840 | |
Transfer agent and administrative fees | | | 348,490 | |
Printing | | | 308,022 | |
Distribution and service fees | | | 117,809 | |
Portfolio accounting fees | | | 67,529 | |
Trustees’ fees* | | | 23,427 | |
Miscellaneous | | | 1,112,600 | |
Total liabilities | | | 8,752,359 | |
Commitments and contingent liabilities (Note 11) | | | — | |
Net assets | | $ | 1,596,375,950 | |
Net assets consist of: |
Paid in capital | | $ | 497,387,178 | |
Total distributable earnings (loss) | | | 1,098,988,772 | |
Net assets | | $ | 1,596,375,950 | |
| | | | | |
Investor Class: |
Net assets | | $ | 1,386,720,784 | |
Capital shares outstanding | | | 21,861,253 | |
Net asset value per share | | $ | 63.43 | |
| | | | | |
A-Class: |
Net assets | | $ | 69,807,822 | |
Capital shares outstanding | | | 1,211,334 | |
Net asset value per share | | $ | 57.63 | |
Maximum offering price per share (Net asset value divided by 95.25%) | | $ | 60.50 | |
| | | | | |
C-Class: |
Net assets | | $ | 115,315,041 | |
Capital shares outstanding | | | 2,364,990 | |
Net asset value per share | | $ | 48.76 | |
| | | | | |
H-Class: |
Net assets | | $ | 24,532,303 | |
Capital shares outstanding | | | 425,801 | |
Net asset value per share | | $ | 57.61 | |
* | Relates to Trustees not deemed “interested persons” within the meaning of Section 2(a)(19) of the 1940 Act. |
20 | THE RYDEX FUNDS ANNUAL REPORT | SEE NOTES TO FINANCIAL STATEMENTS. |
STATEMENT OF OPERATIONS |
NASDAQ-100® Fund |
Year Ended March 31, 2021
Investment Income: |
Dividends from securities of unaffiliated issuers (net of foreign withholding tax of $15,664) | | $ | 11,650,168 | |
Dividends from securities of affiliated issuers | | | 614,995 | |
Interest | | | 75,218 | |
Income from securities lending, net | | | 6,839 | |
Total investment income | | | 12,347,220 | |
| | | | | |
Expenses: |
Management fees | | | 11,164,640 | |
Distribution and service fees: |
A-Class | | | 149,789 | |
C-Class | | | 1,122,171 | |
H-Class | | | 92,473 | |
Transfer agent and administrative fees | | | 4,168,282 | |
Registration fees | | | 1,422,512 | |
Portfolio accounting fees | | | 784,128 | |
Professional fees | | | 757,800 | |
Trustees’ fees* | | | 301,593 | |
Custodian fees | | | 214,911 | |
Interest expense | | | 2,113 | |
Line of credit fees | | | 23 | |
Miscellaneous | | | 1,044,238 | |
Total expenses | | | 21,224,673 | |
Less: |
Expenses waived by Adviser | | | (46,286 | ) |
Net expenses | | | 21,178,387 | |
Net investment loss | | | (8,831,167 | ) |
| | | | | |
Net Realized and Unrealized Gain (Loss): |
Net realized gain (loss) on: |
Investments | | $ | 124,858,452 | |
Swap agreements | | | 13,197,218 | |
Futures contracts | | | 34,572,061 | |
Net realized gain | | | 172,627,731 | |
Net change in unrealized appreciation (depreciation) on: |
Investments in unaffiliated issuers | | | 537,021,374 | |
Investments in affiliated issuers | | | 1,223,633 | |
Swap agreements | | | 675,752 | |
Futures contracts | | | (3,151,089 | ) |
Net change in unrealized appreciation (depreciation) | | | 535,769,670 | |
Net realized and unrealized gain | | | 708,397,401 | |
Net increase in net assets resulting from operations | | $ | 699,566,234 | |
* | Relates to Trustees not deemed “interested persons” within the meaning of Section 2(a)(19) of the 1940 Act. |
SEE NOTES TO FINANCIAL STATEMENTS. | THE RYDEX FUNDS ANNUAL REPORT | 21 |
STATEMENTS OF CHANGES IN NET ASSETS |
NASDAQ-100® Fund |
| | Year Ended
March 31,
2021 | | | Year Ended
March 31,
2020 | |
Increase (Decrease) in Net Assets from Operations: | | | | | | | | |
Net investment loss | | $ | (8,831,167 | ) | | $ | (3,453,284 | ) |
Net realized gain on investments | | | 172,627,731 | | | | 108,686,367 | |
Net change in unrealized appreciation (depreciation) on investments | | | 535,769,670 | | | | (37,088,730 | ) |
Net increase in net assets resulting from operations | | | 699,566,234 | | | | 68,144,353 | |
| | | | | | | | | |
Distributions to shareholders: | | | | | | | | |
Investor Class | | | (57,127,526 | ) | | | (20,287,863 | ) |
A-Class | | | (2,931,676 | ) | | | (1,043,499 | ) |
C-Class | | | (6,450,194 | ) | | | (2,257,087 | ) |
H-Class | | | (2,043,797 | ) | | | (648,117 | ) |
Total distributions to shareholders | | | (68,553,193 | ) | | | (24,236,566 | ) |
| | | | | | | | | |
Capital share transactions: | | | | | | | | |
Proceeds from sale of shares | | | | | | | | |
Investor Class | | | 1,533,725,604 | | | | 1,328,414,692 | |
A-Class | | | 26,461,104 | | | | 30,863,059 | |
C-Class | | | 22,888,440 | | | | 18,499,187 | |
H-Class | | | 96,094,160 | | | | 140,487,069 | |
Distributions reinvested | | | | | | | | |
Investor Class | | | 55,008,153 | | | | 19,606,905 | |
A-Class | | | 2,792,916 | | | | 977,143 | |
C-Class | | | 6,162,238 | | | | 2,159,664 | |
H-Class | | | 2,043,207 | | | | 645,234 | |
Cost of shares redeemed | | | | | | | | |
Investor Class | | | (1,635,030,147 | ) | | | (1,477,875,968 | ) |
A-Class | | | (25,477,996 | ) | | | (52,878,356 | ) |
C-Class | | | (39,910,076 | ) | | | (26,781,762 | ) |
H-Class | | | (113,048,391 | ) | | | (164,617,240 | ) |
Net decrease from capital share transactions | | | (68,290,788 | ) | | | (180,500,373 | ) |
Net increase (decrease) in net assets | | | 562,722,253 | | | | (136,592,586 | ) |
| | | | | | | | | |
Net assets: | | | | | | | | |
Beginning of year | | | 1,033,653,697 | | | | 1,170,246,283 | |
End of year | | $ | 1,596,375,950 | | | $ | 1,033,653,697 | |
| | | | | | | | | |
22 | THE RYDEX FUNDS ANNUAL REPORT | SEE NOTES TO FINANCIAL STATEMENTS. |
STATEMENTS OF CHANGES IN NET ASSETS (concluded) |
NASDAQ-100® Fund |
| | Year Ended
March 31,
2021 | | | Year Ended
March 31,
2020 | |
Capital share activity: | | | | | | | | |
Shares sold | | | | | | | | |
Investor Class | | | 28,111,919 | | | | 32,616,628 | |
A-Class | | | 526,023 | | | | 865,992 | |
C-Class | | | 548,678 | | | | 567,526 | |
H-Class | | | 2,033,470 | | | | 3,768,582 | |
Shares issued from reinvestment of distributions | | | | | | | | |
Investor Class | | | 913,757 | | | | 458,320 | |
A-Class | | | 51,031 | | | | 24,959 | |
C-Class | | | 132,778 | | | | 64,046 | |
H-Class | | | 37,339 | | | | 16,485 | |
Shares redeemed | | | | | | | | |
Investor Class | | | (29,550,246 | ) | | | (36,205,571 | ) |
A-Class | | | (497,139 | ) | | | (1,433,295 | ) |
C-Class | | | (902,170 | ) | | | (829,227 | ) |
H-Class | | | (2,300,380 | ) | | | (4,442,249 | ) |
Net decrease in shares | | | (894,940 | ) | | | (4,527,804 | ) |
SEE NOTES TO FINANCIAL STATEMENTS. | THE RYDEX FUNDS ANNUAL REPORT | 23 |
FINANCIAL HIGHLIGHTS |
NASDAQ-100® Fund |
This table is presented to show selected data for a share outstanding throughout each period and to assist shareholders in evaluating a Fund’s performance for the periods presented.
Investor Class | | Year
Ended
March 31,
2021 | | | Year
Ended
March 31,
2020 | | | Year
Ended
March 31,
2019 | | | Year
Ended
March 29,
2018 | | | Year
Ended
March 31,
2017 | |
Per Share Data |
Net asset value, beginning of period | | $ | 39.68 | | | $ | 38.39 | | | $ | 34.94 | | | $ | 30.68 | | | $ | 25.75 | |
Income (loss) from investment operations: |
Net investment income (loss)a | | | (.28 | ) | | | (.08 | ) | | | (.05 | ) | | | (.05 | ) | | | (.06 | ) |
Net gain (loss) on investments (realized and unrealized) | | | 26.64 | | | | 2.21 | | | | 4.11 | | | | 6.35 | | | | 5.47 | |
Total from investment operations | | | 26.36 | | | | 2.13 | | | | 4.06 | | | | 6.30 | | | | 5.41 | |
Less distributions from: |
Net realized gains | | | (2.61 | ) | | | (.84 | ) | | | (.61 | ) | | | (2.04 | ) | | | (.48 | ) |
Total distributions | | | (2.61 | ) | | | (.84 | ) | | | (.61 | ) | | | (2.04 | ) | | | (.48 | ) |
Net asset value, end of period | | $ | 63.43 | | | $ | 39.68 | | | $ | 38.39 | | | $ | 34.94 | | | $ | 30.68 | |
|
Total Return | | | 66.78 | % | | | 5.40 | % | | | 11.79 | % | | | 20.76 | % | | | 21.21 | % |
Ratios/Supplemental Data |
Net assets, end of period (in thousands) | | $ | 1,386,721 | | | $ | 888,189 | | | $ | 979,675 | | | $ | 926,146 | | | $ | 760,485 | |
Ratios to average net assets: |
Net investment income (loss) | | | (0.50 | %) | | | (0.19 | %) | | | (0.14 | %) | | | (0.14 | %) | | | (0.21 | %) |
Total expensesb | | | 1.33 | % | | | 1.37 | % | | | 1.36 | % | | | 1.28 | % | | | 1.29 | % |
Net expensesc | | | 1.33 | % | | | 1.37 | % | | | 1.36 | % | | | 1.28 | % | | | 1.29 | % |
Portfolio turnover rate | | | 57 | % | | | 54 | % | | | 32 | % | | | 48 | % | | | 72 | % |
24 | THE RYDEX FUNDS ANNUAL REPORT | SEE NOTES TO FINANCIAL STATEMENTS. |
FINANCIAL HIGHLIGHTS (continued) |
NASDAQ-100® Fund |
This table is presented to show selected data for a share outstanding throughout each period and to assist shareholders in evaluating a Fund’s performance for the periods presented.
A-Class | | Year
Ended
March 31,
2021 | | | Year
Ended
March 31,
2020 | | | Year
Ended
March 31,
2019 | | | Year
Ended
March 29,
2018 | | | Year
Ended
March 31,
2017 | |
Per Share Data |
Net asset value, beginning of period | | $ | 36.29 | | | $ | 35.26 | | | $ | 32.22 | | | $ | 28.49 | | | $ | 24.04 | |
Income (loss) from investment operations: |
Net investment income (loss)a | | | (.39 | ) | | | (.17 | ) | | | (.13 | ) | | | (.12 | ) | | | (.13 | ) |
Net gain (loss) on investments (realized and unrealized) | | | 24.34 | | | | 2.04 | | | | 3.78 | | | | 5.89 | | | | 5.06 | |
Total from investment operations | | | 23.95 | | | | 1.87 | | | | 3.65 | | | | 5.77 | | | | 4.93 | |
Less distributions from: |
Net realized gains | | | (2.61 | ) | | | (.84 | ) | | | (.61 | ) | | | (2.04 | ) | | | (.48 | ) |
Total distributions | | | (2.61 | ) | | | (.84 | ) | | | (.61 | ) | | | (2.04 | ) | | | (.48 | ) |
Net asset value, end of period | | $ | 57.63 | | | $ | 36.29 | | | $ | 35.26 | | | $ | 32.22 | | | $ | 28.49 | |
|
Total Returnd | | | 66.37 | % | | | 5.14 | % | | | 11.51 | % | | | 20.44 | % | | | 20.76 | % |
Ratios/Supplemental Data |
Net assets, end of period (in thousands) | | $ | 69,808 | | | $ | 41,054 | | | $ | 59,021 | | | $ | 52,257 | | | $ | 63,311 | |
Ratios to average net assets: |
Net investment income (loss) | | | (0.75 | %) | | | (0.44 | %) | | | (0.38 | %) | | | (0.39 | %) | | | (0.51 | %) |
Total expensesb | | | 1.58 | % | | | 1.62 | % | | | 1.61 | % | | | 1.53 | % | | | 1.53 | % |
Net expensesc | | | 1.58 | % | | | 1.62 | % | | | 1.61 | % | | | 1.53 | % | | | 1.53 | % |
Portfolio turnover rate | | | 57 | % | | | 54 | % | | | 32 | % | | | 48 | % | | | 72 | % |
SEE NOTES TO FINANCIAL STATEMENTS. | THE RYDEX FUNDS ANNUAL REPORT | 25 |
FINANCIAL HIGHLIGHTS (continued) |
NASDAQ-100® Fund |
This table is presented to show selected data for a share outstanding throughout each period and to assist shareholders in evaluating a Fund’s performance for the periods presented.
C-Class | | Year
Ended
March 31,
2021 | | | Year
Ended
March 31,
2020 | | | Year
Ended
March 31,
2019 | | | Year
Ended
March 29,
2018 | | | Year
Ended
March 31,
2017 | |
Per Share Data |
Net asset value, beginning of period | | $ | 31.18 | | | $ | 30.64 | | | $ | 28.29 | | | $ | 25.41 | | | $ | 21.62 | |
Income (loss) from investment operations: |
Net investment income (loss)a | | | (.66 | ) | | | (.39 | ) | | | (.34 | ) | | | (.32 | ) | | | (.28 | ) |
Net gain (loss) on investments (realized and unrealized) | | | 20.85 | | | | 1.77 | | | | 3.30 | | | | 5.24 | | | | 4.55 | |
Total from investment operations | | | 20.19 | | | | 1.38 | | | | 2.96 | | | | 4.92 | | | | 4.27 | |
Less distributions from: |
Net realized gains | | | (2.61 | ) | | | (.84 | ) | | | (.61 | ) | | | (2.04 | ) | | | (.48 | ) |
Total distributions | | | (2.61 | ) | | | (.84 | ) | | | (.61 | ) | | | (2.04 | ) | | | (.48 | ) |
Net asset value, end of period | | $ | 48.76 | | | $ | 31.18 | | | $ | 30.64 | | | $ | 28.29 | | | $ | 25.41 | |
|
Total Returnd | | | 65.17 | % | | | 4.31 | % | | | 10.70 | % | | | 19.57 | % | | | 19.98 | % |
Ratios/Supplemental Data |
Net assets, end of period (in thousands) | | $ | 115,315 | | | $ | 80,633 | | | $ | 85,274 | | | $ | 85,149 | | | $ | 58,647 | |
Ratios to average net assets: |
Net investment income (loss) | | | (1.50 | %) | | | (1.19 | %) | | | (1.14 | %) | | | (1.15 | %) | | | (1.21 | %) |
Total expensesb | | | 2.33 | % | | | 2.37 | % | | | 2.36 | % | | | 2.28 | % | | | 2.28 | % |
Net expensesc | | | 2.33 | % | | | 2.37 | % | | | 2.36 | % | | | 2.28 | % | | | 2.28 | % |
Portfolio turnover rate | | | 57 | % | | | 54 | % | | | 32 | % | | | 48 | % | | | 72 | % |
26 | THE RYDEX FUNDS ANNUAL REPORT | SEE NOTES TO FINANCIAL STATEMENTS. |
FINANCIAL HIGHLIGHTS (concluded) |
NASDAQ-100® Fund |
This table is presented to show selected data for a share outstanding throughout each period and to assist shareholders in evaluating a Fund’s performance for the periods presented.
H-Class | | Year
Ended
March 31,
2021 | | | Year
Ended
March 31,
2020 | | | Year
Ended
March 31,
2019 | | | Year
Ended
March 29,
2018 | | | Year
Ended
March 31,
2017 | |
Per Share Data |
Net asset value, beginning of period | | $ | 36.28 | | | $ | 35.26 | | | $ | 32.22 | | | $ | 28.49 | | | $ | 24.00 | |
Income (loss) from investment operations: |
Net investment income (loss)a | | | (.38 | ) | | | (.16 | ) | | | (.13 | ) | | | (.12 | ) | | | (.14 | ) |
Net gain (loss) on investments (realized and unrealized) | | | 24.32 | | | | 2.02 | | | | 3.78 | | | | 5.89 | | | | 5.11 | |
Total from investment operations | | | 23.94 | | | | 1.86 | | | | 3.65 | | | | 5.77 | | | | 4.97 | |
Less distributions from: |
Net realized gains | | | (2.61 | ) | | | (.84 | ) | | | (.61 | ) | | | (2.04 | ) | | | (.48 | ) |
Total distributions | | | (2.61 | ) | | | (.84 | ) | | | (.61 | ) | | | (2.04 | ) | | | (.48 | ) |
Net asset value, end of period | | $ | 57.61 | | | $ | 36.28 | | | $ | 35.26 | | | $ | 32.22 | | | $ | 28.49 | |
|
Total Return | | | 66.36 | % | | | 5.11 | % | | | 11.51 | % | | | 20.49 | % | | | 20.92 | % |
Ratios/Supplemental Data |
Net assets, end of period (in thousands) | | $ | 24,532 | | | $ | 23,777 | | | $ | 46,276 | | | $ | 64,483 | | | $ | 53,441 | |
Ratios to average net assets: |
Net investment income (loss) | | | (0.75 | %) | | | (0.43 | %) | | | (0.37 | %) | | | (0.37 | %) | | | (0.57 | %) |
Total expensesb | | | 1.59 | % | | | 1.62 | % | | | 1.61 | % | | | 1.53 | % | | | 1.54 | % |
Net expensesc | | | 1.59 | % | | | 1.62 | % | | | 1.61 | % | | | 1.53 | % | | | 1.54 | % |
Portfolio turnover rate | | | 57 | % | | | 54 | % | | | 32 | % | | | 48 | % | | | 72 | % |
a | Net investment income (loss) per share was computed using average shares outstanding throughout the period. |
b | Does not include expenses of the underlying funds in which the Fund invests. |
c | Net expense information reflects the expense ratios after expense waivers and reimbursements, as applicable. |
d | Total return does not reflect the impact of any applicable sales charges. |
SEE NOTES TO FINANCIAL STATEMENTS. | THE RYDEX FUNDS ANNUAL REPORT | 27 |
NOTES TO FINANCIAL STATEMENTS |
Note 1 – Organization and Significant Accounting Policies
Organization
The Rydex Series Funds (the “Trust”), a Delaware statutory trust, is registered with the SEC under the Investment Company Act of 1940 (”1940 Act”), as an open-ended investment company of the series type. Each series, in effect, is representing a separate fund. The Trust may issue an unlimited number of authorized shares. The Trust accounts for the assets of each fund separately.
The Trust offers a combination of seven separate classes of shares: Investor Class shares, A-Class shares, C-Class shares, H-Class shares, P-Class shares, Institutional Class shares and Money Market Class shares. Sales of shares of each Class are made without a front-end sales charge at the net asset value per share (“NAV”), with the exception of A-Class shares. A-Class shares are sold at the NAV, plus the applicable front-end sales charge. The sales charge varies depending on the amount purchased, but will not exceed 4.75%. A-Class share purchases of $1 million or more are exempt from the front-end sales charge but have a 1% contingent deferred sales charge (“CDSC”) if shares are redeemed within 12 months of purchase. C-Class shares have a 1% CDSC if shares are redeemed within 12 months of purchase. C-Class shares automatically convert to A-Class shares on or about the 10th day of the month following the 10-year anniversary of the purchase of the C-Class shares. This conversion will be executed without any sales charge, fee or other charge. After the conversion is completed, the shares will be subject to all features and expenses of A-Class shares. Institutional Class shares are offered primarily for direct investment by institutions such as pension and profit sharing plans, endowments, foundations and corporations. Institutional Class shares require a minimum initial investment of $2 million and a minimum account balance of $1 million. At March 31, 2021, the Trust consisted of fifty-two funds (the “Funds”).
This report covers the NASDAQ-100® Fund (the “Fund”), a non-diversified investment company.
At March 31, 2021, A-Class, C-Class, Investor Class and H-Class shares have been issued by the Fund.
The Fund is designed and operated to accommodate frequent trading by shareholders and, unlike most mutual funds, offers unlimited exchange privileges with no minimum holding periods or transactions fees, which may cause the Fund to experience high portfolio turnover.
Security Investors, LLC, which operates under the name Guggenheim Investments (“GI”), provides advisory services. Guggenheim Funds Distributors, LLC (“GFD”) acts as principal underwriter for the Trust. GI and GFD are affiliated entities.
Significant Accounting Policies
The Fund operates as an investment company and, accordingly, follows the investment company accounting and reporting guidance of the Financial Accounting Standards Board (“FASB”) Accounting Standards Codification Topic 946 Financial Services – Investment Companies.
28 | THE RYDEX FUNDS ANNUAL REPORT | |
NOTES TO FINANCIAL STATEMENTS (continued) |
The following significant accounting policies are in conformity with U.S. generally accepted accounting principles (“U.S. GAAP”) and are consistently followed by the Trust. This requires management to make estimates and assumptions that affect the reported amount of assets and liabilities, contingent assets and liabilities at the date of the financial statements, and the reported amounts of revenues and expenses during the reporting period. Actual results could differ from these estimates. All time references are based on Eastern Time.
The NAV of each Class of the Fund is calculated by dividing the market value of the Fund’s securities and other assets, less all liabilities, attributable to the Class by the number of outstanding shares of the Class.
(a) Valuation of Investments
The Board of Trustees of the Fund (the “Board”) has adopted policies and procedures for the valuation of the Fund’s investments (the “Valuation Procedures”). Pursuant to the Valuation Procedures, the Board has delegated to a valuation committee, consisting of representatives from Guggenheim’s investment management, fund administration, legal and compliance departments (the “Valuation Committee”), the day-to-day responsibility for implementing the Valuation Procedures, including, under most circumstances, the responsibility for determining the fair value of the Fund’s securities and/or other assets.
Valuations of the Fund’s securities and other assets are supplied primarily by pricing services appointed pursuant to the processes set forth in the Valuation Procedures. The Valuation Committee convenes monthly, or more frequently as needed, to review the valuation of all assets which have been fair valued for reasonableness. The Fund’s officers, through the Valuation Committee and consistent with the monitoring and review responsibilities set forth in the Valuation Procedures, regularly review procedures used and valuations provided by the pricing services.
If the pricing service cannot or does not provide a valuation for a particular investment or such valuation is deemed unreliable, such investment is fair valued by the Valuation Committee.
Equity securities listed or traded on a recognized U.S. securities exchange or the National Association of Securities Dealers Automated Quotations (“NASDAQ”) National Market System shall generally be valued on the basis of the last sale price on the primary U.S. exchange or market on which the security is listed or traded; provided, however, that securities listed on NASDAQ will be valued at the NASDAQ Official Closing Price, which may not necessarily represent the last sale price. If there is no sale on the valuation date, exchange-traded U.S. equity securities will be valued on the basis of the last bid price.
Open-end investment companies are valued at their NAV as of the close of business, on the valuation date.
U.S. Government securities are valued by independent pricing services, the last traded fill price, or at the reported bid price at the close of business.
| | THE RYDEX FUNDS ANNUAL REPORT | 29 |
NOTES TO FINANCIAL STATEMENTS (continued) |
Repurchase agreements are generally valued at amortized cost, provided such amounts approximate market value.
Debt securities with a maturity of greater than 60 days at acquisition are valued at prices that reflect broker-dealer supplied valuations or are obtained from independent pricing services, which may consider the trade activity, treasury spreads, yields or price of bonds of comparable quality, coupon, maturity, and type, as well as prices quoted by dealers who make markets in such securities. Short-term debt securities with a maturity of 60 days or less at acquisition are valued at amortized cost, provided such amount approximates market value.
The value of futures contracts is accounted for using the unrealized appreciation or depreciation on the contracts that is determined by marking the contracts to their current realized settlement prices. Financial futures contracts are valued at the 4:00 p.m. price on the valuation date. In the event that the exchange for a specific futures contract closes earlier than 4:00 p.m., the futures contract is valued at the official settlement price of the exchange. However, the underlying securities from which the futures contract value is derived are monitored until 4:00 p.m. to determine if fair valuation would provide a more accurate valuation.
The values of over-the-counter (“OTC”) swap agreements entered into by the Fund are accounted for using the unrealized appreciation or depreciation on the agreements that are determined by marking the agreements to the last quoted value of the index or other underlying position that the swaps pertain to at the close of the NYSE.
Investments for which market quotations are not readily available are fair-valued as determined in good faith by GI, subject to review and approval by the Valuation Committee, pursuant to methods established or ratified by the Board. Valuations in accordance with these methods are intended to reflect each security’s (or asset’s or liability’s) “fair value”. Each such determination is based on a consideration of all relevant factors, which are likely to vary from one pricing context to another. Examples of such factors may include, but are not limited to market prices; sale prices; broker quotes; and models which derive prices based on inputs such as prices of securities with comparable maturities and characteristics, or based on inputs such as anticipated cash flows or collateral, spread over U.S. Treasury securities, and other information analysis. In connection with futures contracts and other derivative investments, such factors may include obtaining information as to how (a) these contracts and other derivative investments trade in the futures or other derivative markets, respectively, and (b) the securities underlying these contracts and other derivative investments trade in the cash market.
(b) U.S. Government and Agency Obligations
Certain U.S. Government and Agency Obligations are traded on a discount basis; the interest rates shown on the Schedule of Investments reflect the effective rates paid at the time of purchase by the Fund. Other securities bear interest at the rates shown, payable at fixed dates through maturity.
30 | THE RYDEX FUNDS ANNUAL REPORT | |
NOTES TO FINANCIAL STATEMENTS (continued) |
(c) Futures Contracts
Upon entering into a futures contract, the Fund deposits and maintains as collateral such initial margin as required by the exchange on which the transaction is affected. Pursuant to the contract, the Fund agrees to receive from or pay to the broker an amount of cash equal to the daily fluctuation in value of the contract. Such receipts or payments are known as variation margin and are recorded by the Fund as unrealized appreciation or depreciation. When the contract is closed, the Fund records a realized gain or loss equal to the difference between the value of the contract at the time it was opened and the value at the time it was closed.
(d) Swap Agreements
Swap agreements are marked-to-market daily and the change, if any, is recorded as unrealized appreciation or depreciation. Payments received or made as a result of an agreement or termination of an agreement are recognized as realized gains or losses.
(e) Foreign Taxes
The Fund may be subject to foreign taxes (a portion of which may be reclaimable) on income, stock dividends, capital gains on investments or certain foreign currency transactions. All foreign taxes are recorded in accordance with the applicable foreign tax regulations and rates that exist in the foreign jurisdictions in which the Fund invests. These foreign taxes, if any, are paid by the Fund and reflected in its Statement of Operations as follows: foreign taxes withheld at source are presented as a reduction of income and foreign taxes on capital gains from sales of investments are included with the net realized gain (loss) on investments. Foreign taxes payable or deferred as of March 31, 2021, if any, are disclosed in the Fund’s Statement of Assets and Liabilities.
(f) Security Transactions
Security transactions are recorded on the trade date for financial reporting purposes. Realized gains and losses from securities transactions are recorded using the identified cost basis. Proceeds from lawsuits related to investment holdings are recorded as a reduction to cost if the securities are still held and as realized gains if no longer held in the Fund. Dividend income is recorded on the ex-dividend date, net of applicable taxes withheld by foreign countries, if any. Taxable non-cash dividends are recorded as dividend income. Interest income, including amortization of premiums and accretion of discounts, is accrued on a daily basis. Dividend income from Real Estate Investment Trusts (“REITs”) is recorded based on the income included in the distributions received from the REIT investments using published REIT classifications, including some management estimates when actual amounts are not available. Distributions received in excess of this estimated amount are recorded as a reduction of the cost of investments or reclassified to realized gains. The actual amounts of income, return of capital, and realized gains are only determined by each REIT after its fiscal year-end, and may differ from the estimated amounts.
| | THE RYDEX FUNDS ANNUAL REPORT | 31 |
NOTES TO FINANCIAL STATEMENTS (continued) |
(g) Distributions
Distributions of net investment income and net realized gains, if any, are declared and paid at least annually. Dividends are reinvested in additional shares, unless shareholders request payment in cash. Distributions are recorded on the ex-dividend date and are determined in accordance with U.S. federal income tax regulations which may differ from U.S. GAAP.
(h) Class Allocations
Interest and dividend income, most expenses, all realized gains and losses, and all unrealized appreciation and depreciation are allocated to the classes based upon the value of the outstanding shares in each Class. Certain costs, such as distribution and service fees are charged directly to specific classes. In addition, certain expenses have been allocated to the individual Funds in the Trust based on the respective net assets of each Fund included in the Trust.
(i) Cash
The Fund may leave cash overnight in its cash account with the custodian. Periodically, the Fund may have cash due to the custodian bank as an overdraft balance. A fee is incurred on this overdraft, calculated by multiplying the overdraft by a rate based on the federal funds rate, which was 0.06% at March 31, 2021.
(j) Indemnifications
Under the Fund’s organizational documents, its Trustees and Officers are indemnified against certain liabilities arising out of the performance of their duties to the Trust. In addition, throughout the normal course of business, the Fund enters into contracts that contain a variety of representations and warranties which provide general indemnifications. The Fund’s maximum exposure under these arrangements is unknown, as this would involve future claims that may be made against the Fund and/or its affiliates that have not yet occurred. However, based on experience, the Fund expects the risk of loss to be remote.
Note 2 – Derivatives
As part of its investment strategy, the Fund utilizes a variety of derivative instruments. These investments involve, to varying degrees, elements of market risk and risks in excess of amounts recognized on the Statement of Assets and Liabilities. Valuation and accounting treatment of these instruments can be found under Significant Accounting Policies in Note 1 of these Notes to Financial Statements.
Derivatives are instruments whose values depend on, or are derived from, in whole or in part, the value of one or more other assets, such as securities, currencies, commodities or indices. Derivative instruments may be used to increase investment flexibility (including to maintain cash reserves while maintaining exposure to certain other assets), for risk management (hedging) purposes, to facilitate trading, to reduce transaction costs and to pursue higher investment returns. Derivative instruments may also be used to mitigate certain investment risks, such
32 | THE RYDEX FUNDS ANNUAL REPORT | |
NOTES TO FINANCIAL STATEMENTS (continued) |
as foreign currency exchange rate risk, interest rate risk and credit risk. U.S. GAAP requires disclosures to enable investors to better understand how and why a Fund uses derivative instruments, how these derivative instruments are accounted for and their effects on the Fund’s financial position and results of operations.
The Fund utilized derivatives for the following purposes:
Index Exposure: the use of an instrument to obtain exposure to a listed or other type of index.
Liquidity: the ability to buy or sell exposure with little price/market impact.
Futures Contracts
A futures contract is an agreement to purchase (long) or sell (short) an agreed amount of securities or other instruments at a set price for delivery at a future date. There are significant risks associated with a Fund’s use of futures contracts, including (i) there may be an imperfect or no correlation between the changes in market value of the underlying asset and the prices of futures contracts; (ii) there may not be a liquid secondary market for a futures contract; (iii) trading restrictions or limitations may be imposed by an exchange; and (iv) government regulations may restrict trading in futures contracts. When investing in futures, there is minimal counterparty credit risk to a Fund because futures are exchange-traded and the exchange’s clearinghouse, as counterparty to all exchange-traded futures, guarantees against default. Cash deposits are shown as segregated cash with broker on the Statement of Assets and Liabilities; securities held as collateral are noted on the Schedule of Investments.
The following table represents the Fund’s use and volume of futures on a monthly basis:
| | | Average Notional Amount | |
Use | | Long | |
Index exposure, Liquidity | | $ | 61,596,006 | |
Swap Agreements
A swap is an agreement that obligates two parties to exchange a series of cash flows at specified intervals based upon or calculated by reference to changes in specified prices or rates for a specified amount of an underlying asset. When utilizing OTC swaps, the Fund bears the risk of loss of the amount expected to be received under a swap agreement in the event of the default or bankruptcy of a swap agreement counterparty or if the underlying asset declines in value. Certain standardized swaps are subject to mandatory central clearing and are executed on a multi-lateral or other trade facility platform, such as a registered exchange. There is limited counterparty credit risk with respect to centrally-cleared swaps as the transaction is facilitated through a central clearinghouse, much like exchange-traded futures contracts. For a fund utilizing centrally-cleared swaps, the exchange bears the risk of loss resulting from a counterparty not being able to pay.
| | THE RYDEX FUNDS ANNUAL REPORT | 33 |
NOTES TO FINANCIAL STATEMENTS (continued) |
There is no guarantee that a fund or an underlying fund could eliminate its exposure under an outstanding swap agreement by entering into an offsetting swap agreement with the same or another party.
Total return swaps involve commitments where single or multiple cash flows are exchanged based on the price of an underlying reference asset (such as an index) for a fixed or variable interest rate. Total return swaps will usually be computed based on the current value of the reference asset as of the close of regular trading on the NYSE or other exchange, with the swap value being adjusted to include dividends accrued, financing charges and/or interest associated with the swap agreement. When utilizing total return, the Fund bears the risk of loss of the amount expected to be received under a swap agreement in the event of the default or bankruptcy of a swap agreement counterparty or if the underlying reference asset declines in value.
The following table represents the Fund’s use and volume of total return swaps on a monthly basis:
| | | Average Notional Amount | |
Use | | Long | |
Index exposure, Liquidity | | $ | 21,921,046 | |
Derivative Investment Holdings Categorized by Risk Exposure
The following is a summary of the location of derivative investments on the Fund’s Statement of Assets and Liabilities as of March 31, 2021:
Derivative Investment Type | Asset Derivatives | Liability Derivatives |
Equity contracts | Variation margin on futures contracts | — |
| Unrealized appreciation on OTC swap agreements | Unrealized depreciation on OTC swap agreements |
The following table sets forth the fair value of the Fund’s derivative investments categorized by primary risk exposure at March 31, 2021:
Asset Derivative Investments Value |
| | Futures
Equity
Risk* | | | Swaps
Equity
Risk | | | Total Value at
March 31,
2021 | |
| | | $ | 769,277 | | | $ | 520,858 | | | $ | 1,290,135 | |
34 | THE RYDEX FUNDS ANNUAL REPORT | |
NOTES TO FINANCIAL STATEMENTS (continued) |
Liability Derivative Investments Value |
| | Futures
Equity
Risk* | | | Swaps
Equity
Risk | | | Total Value at
March 31,
2021 | |
| | | $ | — | | | $ | 411,038 | | | $ | 411,038 | |
* | Includes cumulative appreciation (depreciation) of futures contracts as reported on the Schedule of Investments. For exchange-traded derivatives, variation margin is reported within the Statement of Assets and Liabilities. |
The following is a summary of the location of derivative investments on the Fund’s Statement of Operations for the year ended March 31, 2021:
Derivative Investment Type | Location of Gain (Loss) on Derivatives |
Equity contracts | Net realized gain (loss) on futures contracts |
| Net change in unrealized appreciation (depreciation) on futures contracts |
| Net realized gain (loss) on swap agreements |
| Net change in unrealized appreciation (depreciation) on swap agreements |
The following is a summary of the Fund’s realized gain (loss) and change in unrealized appreciation (depreciation) on derivative investments recognized on the Statement of Operations categorized by primary risk exposure for the year ended March 31, 2021:
Realized Gain (Loss) on Derivative Investments Recognized on the Statement of Operations |
| | Futures
Equity
Risk | | | Swaps
Equity
Risk | | | Total | |
| | | $ | 34,572,061 | | | $ | 13,197,218 | | | $ | 47,769,279 | |
Change in Unrealized Appreciation (Depreciation) on Derivative Investments Recognized on the Statement of Operations |
| | Futures
Equity
Risk | | | Swaps
Equity
Risk | | | Total | |
| | | $ | (3,151,089 | ) | | $ | 675,752 | | | $ | (2,475,337 | ) |
In conjunction with the use of derivative instruments, the Fund is required to maintain collateral in various forms. Depending on the financial instrument utilized and the broker involved, the Fund uses margin deposits at the broker, cash and/or securities segregated at the custodian bank, discount notes or repurchase agreements allocated to the Fund as collateral.
| | THE RYDEX FUNDS ANNUAL REPORT | 35 |
NOTES TO FINANCIAL STATEMENTS (continued) |
The Trust has established counterparty credit guidelines and enters into transactions only with financial institutions of investment grade or better. The Trust monitors the counterparty credit risk.
Note 3 – Offsetting
In the normal course of business, the Fund enters into transactions subject to enforceable master netting arrangements or other similar arrangements. Generally, the right to offset in those agreements allows the Fund to counteract the exposure to a specific counterparty with collateral received from or delivered to that counterparty based on the terms of the arrangements. These arrangements provide for the right to liquidate upon the occurrence of an event of default, credit event upon merger or additional termination event.
In order to better define its contractual rights and to secure rights that will help the Fund mitigate its counterparty risk, the Fund may enter into an International Swaps and Derivatives Association, Inc. Master Agreement (“ISDA Master Agreement”) or similar agreement with its derivative contract counterparties. An ISDA Master Agreement is a bilateral agreement between a fund and a counterparty that governs OTC derivatives, including foreign exchange contracts, and typically contains, among other things, collateral posting terms and netting provisions in the event of a default and/or termination event. The provisions of the ISDA Master Agreement typically permit a single net payment in the event of a default (close-out netting) or similar event, including the bankruptcy or insolvency of the counterparty.
For derivatives traded under an ISDA Master Agreement, the collateral requirements are typically calculated by netting the mark-to-market amount for each transaction under such agreement and comparing that amount to the value of any collateral currently pledged by the Fund and the counterparty. For financial reporting purposes, cash collateral that has been pledged to cover obligations of the Fund and cash collateral received from the counterparty, if any, are reported separately on the Statement of Assets and Liabilities as segregated cash with broker/receivable for variation margin, or payable for swap settlement/variation margin. Cash and/or securities pledged or received as collateral by the Fund in connection with an OTC derivative subject to an ISDA Master Agreement generally may not be invested, sold or rehypothecated by the counterparty or the Fund, as applicable, absent an event of default under such agreement, in which case such collateral generally may be applied towards obligations due to and payable by such counterparty or the Fund, as applicable. Generally, the amount of collateral due from or to a counterparty must exceed a minimum transfer amount threshold (e.g., $300,000) before a transfer is required to be made. To the extent amounts due to the Fund from its counterparties are not fully collateralized, contractually or otherwise, the Fund bears the risk of loss from counterparty nonperformance. The Fund attempts to mitigate counterparty risk by only entering into agreements with counterparties that it believes to be of good standing and by monitoring the financial stability of those counterparties.
For financial reporting purposes, the Fund does not offset derivative assets and derivative liabilities that are subject to netting arrangements in the Statement of Assets and Liabilities.
36 | THE RYDEX FUNDS ANNUAL REPORT | |
NOTES TO FINANCIAL STATEMENTS (continued) |
The following tables present derivative financial instruments and secured financing transactions that are subject to enforceable netting arrangements:
| | | | | | | | | | | | | | | Gross Amounts Not Offset
in the Statement of
Assets and Liabilities | | | | | |
Instrument | | Gross
Amounts of
Recognized
Assets1 | | | Gross
Amounts
Offset in the
Statement of
Assets and
Liabilities | | | Net
Amount
of Assets
Presented on
the Statement
of Assets and
Liabilities | | | Financial
Instruments | | | Cash
Collateral
Received | | | Net Amount | |
Swap equity contracts | | $ | 520,858 | | | $ | — | | | $ | 520,858 | | | $ | — | | | $ | — | | | $ | 520,858 | |
| | | | | | | | | | | | | | | Gross Amounts Not Offset
in the Statement of
Assets and Liabilities | | | | | |
Instrument | | Gross
Amounts of
Recognized
Liabilities1 | | | Gross
Amounts
Offset in the
Statement of
Assets and
Liabilities | | | Net Amount
of Liabilities
Presented on
the Statement
of Assets and
Liabilities | | | Financial
Instruments | | | Cash
Collateral
Pledged | | | Net Amount | |
Swap equity contracts | | $ | 411,038 | | | $ | — | | | $ | 411,038 | | | $ | (411,038 | ) | | $ | — | | | $ | — | |
1 | Exchange-traded or centrally-cleared derivatives are excluded from these reported amounts. |
The Fund has the right to offset deposits against any related derivative liabilities outstanding with each counterparty with the exception of exchange-traded or centrally-cleared derivatives. The following table presents deposits held by others in connection with derivative investments as of March 31, 2021.
Counterparty | Asset Type | | Cash Pledged | | | Cash Received | |
Goldman Sachs International | Futures contracts | | $ | 47,178 | | | $ | — | |
Note 4 – Fair Value Measurement
In accordance with U.S. GAAP, fair value is defined as the price that the Fund would receive to sell an investment or pay to transfer a liability in an orderly transaction with an independent buyer in the principal market, or in the absence of a principal market, the most advantageous market for
| | THE RYDEX FUNDS ANNUAL REPORT | 37 |
NOTES TO FINANCIAL STATEMENTS (continued) |
the investment or liability. U.S. GAAP establishes a three-tier fair value hierarchy based on the types of inputs used to value assets and liabilities and requires corresponding disclosure. The hierarchy and the corresponding inputs are summarized below:
Level 1 — | quoted prices in active markets for identical assets or liabilities. |
Level 2 — | significant other observable inputs (for example quoted prices for securities that are similar based on characteristics such as interest rates, prepayment speeds, credit risk, etc.). |
Level 3 — | significant unobservable inputs based on the best information available under the circumstances, to the extent observable inputs are not available, which may include assumptions. |
The types of inputs available depend on a variety of factors, such as the type of security and the characteristics of the markets in which it trades, if any. Fair valuation determinations that rely on fewer or no observable inputs require greater judgment. Accordingly, fair value determinations for Level 3 securities require the greatest amount of judgment.
The inputs or methodologies used for valuing securities are not necessarily an indication of the risk associated with investing in those securities. The suitability of the techniques and sources employed to determine fair valuation are regularly monitored and subject to change.
Note 5 – Investment Advisory Agreement and Other Agreements
Under the terms of an investment advisory contract, the Fund pays GI investment advisory fees calculated at an annualized rate of 0.75% of the average daily net assets of the Fund.
When the aggregate assets of each series of the Trust (excluding the Long Short Equity Fund, Managed Futures Strategy Fund and Multi-Hedge Strategies Fund) and each series of Rydex Dynamic Funds equal or exceed $10 billion, the advisory fee rate paid by the Fund (excluding the Long Short Equity Fund, Managed Futures Strategy Fund and Multi-Hedge Strategies Fund) will be reduced in accordance with the asset level and breakpoint schedule set forth below.
Fund Assets Under Management | | Fund Asset-Based
Breakpoint Reductions | |
$500 million - $1 billion | | | 0.025 | % |
> $1 billion - $2 billion | | | 0.050 | % |
> $2 billion | | | 0.075 | % |
GI pays operating expenses on behalf of the Trust, such as audit and accounting related services, legal services, custody, printing and mailing, among others, on a pass-through basis. Such expenses are allocated to various Funds within the complex based on relative net assets.
38 | THE RYDEX FUNDS ANNUAL REPORT | |
NOTES TO FINANCIAL STATEMENTS (continued) |
The Board has adopted a Distribution Plan applicable to A-Class and P-Class shares and H-Class shares for which GFD and other firms that provide distribution and/or shareholder services (“Service Providers”) may receive compensation. If a Service Provider provides distribution services, the Fund will pay distribution fees to GFD at an annual rate not to exceed 0.25% of average daily net assets, pursuant to Rule 12b-1 of the 1940 Act. GFD, in turn, will pay the Service Provider out of its fees. GFD may, at its discretion, retain a portion of such payments to compensate itself for distribution services.
The Board has adopted a separate Distribution and Shareholder Services Plan applicable to C-Class shares that allows the Fund to pay annual distribution and service fees of 1.00% of the Fund’s C-Class shares average daily net assets. The annual 0.25% service fee compensates a shareholder’s financial adviser for providing ongoing services to the shareholder. The annual distribution fee of 0.75% reimburses GFD for paying the shareholder’s financial adviser an ongoing sales commission. GFD advances the first year’s service and distribution fees to the financial adviser. GFD retains the service and distribution fees on accounts with no authorized dealer of record.
For the year ended March 31, 2021, GFD retained sales charges of $128,465 relating to sales of A-Class shares of the Trust.
If the Fund invests in a fund that is advised by the same adviser or an affiliated adviser, the investing Fund’s adviser has agreed to waive fees at the investing fund level to the extent necessary to offset the proportionate share of any management fee paid by the Fund with respect to its investment in such affiliated fund. Fee waivers will be calculated at the investing Fund level without regard to any expense cap, if any, in effect for the investing Fund. Fees waived under this arrangement are not subject to reimbursement to GI. For the year ended March 31, 2021, the Fund waived $46,286 related to investments in affiliated funds.
Certain trustees and officers of the Trust are also officers of GI and/or GFD. The Trust does not compensate its officers or trustees who are officers, directors and/or employees of GI or GFD.
MUFG Investor Services (US), LLC (“MUIS”) acts as the Fund’s administrator, transfer agent and accounting agent. As administrator, transfer agent and accounting agent, MUIS maintains the books and records of the Fund’s securities and cash. U.S. Bank, N.A. (“U.S. Bank”) acts as the Fund’s custodian. As custodian, U.S. Bank is responsible for the custody of the Fund’s assets. For providing the aforementioned services, MUIS and U.S. Bank are entitled to receive a monthly fee equal to an annual percentage of the Fund’s average daily net assets and out of pocket expenses.
Note 6 – Repurchase Agreements
The Fund transfers uninvested cash balances into a single joint account, the daily aggregate balance of which is invested in one or more repurchase agreements collateralized by obligations of the U.S. Treasury and U.S. government agencies. The joint account includes other Funds in the Guggenheim complex not covered in this report. The collateral is in the possession of the
| | THE RYDEX FUNDS ANNUAL REPORT | 39 |
NOTES TO FINANCIAL STATEMENTS (continued) |
Funds’ custodian and is evaluated to ensure that its market value exceeds, at a minimum, 102% of the original face amount of the repurchase agreements. Each Fund holds a pro rata share of the collateral based on the dollar amount of the repurchase agreement entered into by each Fund.
At March 31, 2021, the repurchase agreements in the joint account were as follows:
Counterparty and
Terms of Agreement | | Face
Value | | | Repurchase
Price | | | | | | Collateral | | | | Par
Value | | | Fair
Value | |
J.P. Morgan Securities LLC | | | | | | | | | | | | | U.S. Treasury Bond | | | | | | | | |
0.01% | | | | | | | | | | | | | 2.38% | | | | | | | | |
Due 04/01/21 | | $ | 124,999,036 | | | $ | 124,999,053 | | | | | | 11/15/49 | | $ | 126,141,600 | | | $ | 127,499,092 | |
| | | | | | | | | | | | | | | | | | | | | | | | | |
Barclays Capital, Inc. | | | | | | | | | | | | | U.S. Treasury Inflation Indexed Bond | | | | | | | | |
0.01% | | | | | | | | | | | | | 0.13% | | | | | | | | |
Due 04/01/21 | | | 56,830,637 | | | | 56,830,653 | | | | | | 02/15/51 | | | 57,053,077 | | | | 57,967,257 | |
| | | | | | | | | | | | | | | | | | | | | | | | | |
BofA Securities, Inc. | | | | | | | | | | | | | U.S. Treasury Note | | | | | | | | |
0.01% | | | | | | | | | | | | | 0.38% | | | | | | | | |
Due 04/01/21 | | | 51,866,820 | | | | 51,866,827 | | | | | | 04/30/25 | | | 53,449,300 | | | | 52,904,236 | |
In the event of counterparty default, the Funds have the right to collect the collateral to offset losses incurred. There is potential loss to the Funds in the event the Funds are delayed or prevented from exercising their rights to dispose of the collateral securities, including the risk of a possible decline in the value of the underlying securities during the period while the Funds seek to assert their rights. GI, acting under the supervision of the Board, reviews the value of the collateral and the creditworthiness of those banks and dealers with which the Funds enter into repurchase agreements to evaluate potential risks.
Note 7 – Portfolio Securities Loaned
The Fund may lend its securities to approved brokers to earn additional income. Security lending income shown on the Statement of Operations is shown net of rebates paid to the borrowers and earnings on cash collateral investments shared with the lending agent. Within this arrangement, the Funds act as the lender, U.S. Bank acts as the lending agent, and other approved registered broker dealers act as the borrowers. The Fund receives cash collateral, valued at 102% of the value of the securities on loan. Under the terms of the Fund’s securities lending agreement with U.S. Bank, cash collateral and proceeds are invested in the First American Government Obligations Fund — Class Z. The Fund bears the risk of loss on cash collateral investments. Collateral is maintained over the life of the loan in an amount not less than the value of loaned securities, as determined at the close of fund business each day; any additional collateral required due to changes in security values is delivered to the Fund the next business day. Although the collateral mitigates the risk, the Fund could experience a delay in recovering their securities and a possible loss of income or value if the borrower fails to return the securities. The Fund has
40 | THE RYDEX FUNDS ANNUAL REPORT | |
NOTES TO FINANCIAL STATEMENTS (continued) |
the right under the securities lending agreement to recover the securities from the borrower on demand. Securities lending transactions are accounted for as secured borrowings. The remaining contractual maturity of the securities lending agreement is overnight and continuous.
At March 31, 2021, the Fund participated in securities lending transactions, which are subject to enforceable netting arrangements, as follows:
| | | Gross Amounts Not Offset in the
Statement of Assets and Liabilities | | | | Securities Lending Collateral | |
| | Value of
Securities
Loaned | | | Collateral
Received(a) | | | Net
Amount | | | | Cash
Collateral
Invested | | | Cash
Collateral
Uninvested | | | Total
Collateral | |
| | | $ | 2,313,701 | | | $ | (2,313,701 | ) | | $ | — | | | | $ | 2,374,488 | | | $ | — | | | $ | 2,374,488 | |
(a) | Actual collateral received by the Fund is generally greater than the amount shown due to overcollateralization. |
In the event of counterparty default, the Fund has the right to collect the collateral to offset losses incurred. There is potential loss to the Fund in the event the Fund is delayed or prevented from exercising its right to dispose of the collateral securities, including the risk of a possible decline in the value of the underlying securities during the period while the Fund seeks to assert its rights. GI, acting under the supervision of the Board, reviews the value of the collateral and the creditworthiness of those banks and dealers to evaluate potential risks.
Note 8 – Federal Income Tax Information
The Fund intends to comply with the provisions of Subchapter M of the Internal Revenue Code applicable to regulated investment companies and will distribute substantially all taxable net investment income and capital gains sufficient to relieve the Fund from all, or substantially all, federal income, excise and state income taxes. Therefore, no provision for federal or state income tax or federal excise tax is required.
Tax positions taken or expected to be taken in the course of preparing the Fund’s tax returns are evaluated to determine whether the tax positions are “more-likely-than-not” of being sustained by the applicable tax authority. Tax positions not deemed to meet the more-likely-than-not threshold would be recorded as a tax benefit or expense in the current year. Management has analyzed the Fund’s tax positions taken, or to be taken, on U.S. federal income tax returns for all open tax years, and has concluded that no provision for income tax is required in the Fund’s financial statements. The Fund’s U.S. federal income tax returns are subject to examination by the Internal Revenue Service (“IRS”) for a period of three years after they are filed.
The tax character of distributions paid during the year ended March 31, 2021 was as follows:
| | Ordinary
Income | | | Long-Term
Capital Gain | | | Total
Distributions | |
| | | $ | 14,003,461 | | | $ | 54,549,732 | | | $ | 68,553,193 | |
| | THE RYDEX FUNDS ANNUAL REPORT | 41 |
NOTES TO FINANCIAL STATEMENTS (continued) |
The tax character of distributions paid during the year ended March 31, 2020 was as follows:
| | Ordinary
Income | | | Long-Term
Capital Gain | | | Total
Distributions | |
| | | $ | 157,143 | | | $ | 24,079,423 | | | $ | 24,236,566 | |
Note: For U.S. federal income tax purposes, short-term capital gain distributions are treated as ordinary income distributions.
The tax components of distributable earnings/(loss) as of March 31, 2021 were as follows:
| | Undistributed
Ordinary
Income | | | Undistributed
Long-Term
Capital Gain | | | Net Unrealized
Appreciation
(Depreciation) | | | Accumulated
Capital and
Other Losses | | | Total | |
| | | $ | 71,808,723 | | | $ | 17,530,058 | | | $ | 1,009,649,991 | | | $ | — | | | $ | 1,098,988,772 | |
Net investment income and net realized gains (losses) may differ for financial statement and tax purposes because of temporary or permanent book/tax differences. These differences are primarily due to losses deferred due to wash sales, distributions in connection with redemption of fund shares, and the “mark-to-market” of certain derivatives. Additional differences may result from the tax treatment of net operating losses and the tax treatment of bond premium/discount amortization. To the extent these differences are permanent and would require a reclassification between Paid in Capital and Total Distributable Earnings (Loss), such reclassifications are made in the period that the differences arise. These reclassifications have no effect on net assets or NAV per share.
The following adjustments were made on the Statement of Assets and Liabilities as of March 31, 2021 for permanent book/tax differences:
| | Paid In
Capital | | | Total
Distributable
Earnings/(Loss) | |
| | | $ | 69,783,443 | | | $ | (69,783,443 | ) |
At March 31, 2021, the cost of investments for U.S. federal income tax purposes, the aggregate gross unrealized appreciation for all investments for which there was an excess of value over tax cost and the aggregate gross unrealized depreciation for all investments for which there was an excess of tax cost over value, were as follows:
| | Tax
Cost | | | Tax
Unrealized
Appreciation | | | Tax
Unrealized
Depreciation | | | Net Tax
Unrealized
Appreciation/
(Depreciation) | |
| | | $ | 593,014,460 | | | $ | 1,013,231,793 | | | $ | (3,581,802 | ) | | $ | 1,009,649,991 | |
42 | THE RYDEX FUNDS ANNUAL REPORT | |
NOTES TO FINANCIAL STATEMENTS (continued) |
Note 9 – Securities Transactions
For the year ended March 31, 2021, the cost of purchases and proceeds from sales of investment securities, excluding government securities, short-term investments and derivatives, were as follows:
| | Purchases | | | Sales | |
| | | $ | 808,543,346 | | | $ | 885,691,592 | |
The Fund is permitted to purchase or sell securities from or to certain affiliated funds under specified conditions outlined in procedures adopted by the Board. The procedures have been designed to ensure that any purchase or sale of securities by the Fund from or to another fund or portfolio that is or could be considered an affiliate by virtue of having a common investment adviser (or affiliated investment advisers), common trustees and/or common officers complies with Rule 17a-7 of the 1940 Act. Further, as defined under these procedures, each transaction is effected at the current market price to save costs, where permissible. For the year ended March 31, 2021, the Fund engaged in purchases and sales of securities, pursuant to Rule 17a-7 of the 1940 Act, as follows:
| | Purchases | | | Sales | | | Realized Gain | |
| | | $ | 244,800,906 | | | $ | 412,286,478 | | | $ | 41,793,691 | |
Note 10 – Line of Credit
The Trust, along with other affiliated trusts, secured an uncommitted $75,000,000 line of credit from U.S. Bank, N.A., which expired June 8, 2020. On June 8, 2020, the line of credit agreement was renewed at an increased amount of $150,000,000 and expires on June 7, 2021. On February 10, 2021, the line of credit was increased from $150,000,000 to $200,000,000. This line of credit is reserved for emergency or temporary purposes. Borrowings, if any, under this arrangement bear interest equal to the Prime Rate, minus 2%, which shall be paid monthly, averaging 1.25% for the year ended March 31, 2021. The Fund did not have any borrowings outstanding under this agreement at March 31, 2021.
The average daily balance borrowed for the year ended March 31, 2021 was $1,792.
Note 11 – Legal Proceedings
Tribune Company
Rydex Series Funds has been named as a defendant and a putative member of the proposed defendant class of shareholders in the case entitled Kirschner v. FitzSimons, No. 12-2652 (S.D.N.Y.) (formerly Official Committee of Unsecured Creditors of Tribune Co. v. FitzSimons, Adv. Pro. No. 10-54010 (Bankr. D. Del.)) (the “FitzSimons action”), as a result of ownership by certain series of the Rydex Series Funds of shares in the Tribune Company (“Tribune”) in 2007, when Tribune effected a leveraged buyout transaction (“LBO”) by which
| | THE RYDEX FUNDS ANNUAL REPORT | 43 |
NOTES TO FINANCIAL STATEMENTS (continued) |
Tribune converted to a privately-held company. In his complaint, the plaintiff has alleged that, in connection with the LBO, Tribune insiders and shareholders were overpaid for their Tribune stock using financing that the insiders knew would, and ultimately did, leave Tribune insolvent. The plaintiff has asserted claims against certain insiders, major shareholders, professional advisers, and others involved in the LBO. The plaintiff is also attempting to obtain from former Tribune shareholders, including the Rydex Series Funds, the proceeds they received in connection with the LBO.
In June 2011, a group of Tribune creditors filed multiple actions against former Tribune shareholders involving state law constructive fraudulent conveyance claims arising out of the 2007 LBO (the “SLCFC actions”). Rydex Series Funds has been named as a defendant in one or more of these suits. In those actions, the creditors seek to recover from Tribune’s former shareholders the proceeds received in connection with the 2007 LBO.
The FitzSimons action and the SLCFC actions have been consolidated with the majority of the other Tribune LBO-related lawsuits in a multidistrict litigation proceeding captioned In re Tribune Company Fraudulent Conveyance Litig., No. 11-md-2296 (S.D.N.Y.) (the “MDL Proceeding”).
On September 23, 2013, the District Court granted the defendants’ omnibus motion to dismiss the SLCFC actions, on the basis that the creditors lacked standing. On September 30, 2013, the creditors filed a notice of appeal of the September 23 order. On October 28, 2013, the defendants filed a joint notice of cross-appeal of that same order.
On March 29, 2016, the U.S. Court of Appeals for the Second Circuit issued its opinion on the appeal of the SLCFC actions. The appeals court affirmed the district court’s dismissal of those lawsuits, but on different grounds than the district court. The appeals court held that while the plaintiffs have standing under the U.S. Bankruptcy Code, their claims were preempted by Section 546(e) of the Bankruptcy Code—the statutory safe harbor for settlement payments.
On April 12, 2016, the Plaintiffs in the SLCFC actions filed a petition seeking rehearing en banc before the appeals court. On July 22, 2016, the appeals court denied the petition. On September 9, 2016, the plaintiffs filed a petition for writ of certiorari in the U.S. Supreme Court challenging the Second Circuit’s decision that the safe harbor of Section 546(e) applied to their claims. The shareholder defendants, including the Funds, filed a joint brief in opposition to the petition for certiorari on October 24, 2016. On April 3, 2018, Justice Kennedy and Justice Thomas issued a “Statement” related to the petition for certiorari suggesting that the Second Circuit and/or District Court may want to take steps to reexamine the application of the Section 546(e) safe harbor to the previously dismissed state law constructive fraudulent transfer claims based on the Supreme Court’s decision in Merit Management Group LP v. FTI Consulting, Inc. On April 10, 2018, Plaintiffs filed in the Second Circuit a motion for that court to recall its mandate, vacate its prior decision, and remand to the district court for further proceedings consistent with Merit Management. On April 20, 2018, the shareholder defendants filed an opposition to Plaintiffs’ motion to recall the mandate. On May 15, 2018, the Second Circuit issued an order
44 | THE RYDEX FUNDS ANNUAL REPORT | |
NOTES TO FINANCIAL STATEMENTS (continued) |
recalling the mandate “in anticipation of further panel review.” On December 19, 2019, the Second Circuit issued an amended opinion that again affirmed the district court’s ruling on the basis that plaintiffs’ claims were preempted by Section 546(e) of the Bankruptcy Code. Plaintiffs filed a motion for rehearing and rehearing en banc on January 2, 2020. The Second Circuit denied the petition on February 6, 2020. On July 6, 2020, plaintiffs filed a new petition for a writ of certiorari in the U.S. Supreme Court. In that petition, plaintiffs stated that “[t]o make it more likely that there will be a quorum for this petition,” they have “abandon[ed] the case and let the judgment below stand” with respect to certain defendants. That list did not include the Rydex Series Funds. Defendants filed an opposition to the certiorari petition on August 26, 2020, and plaintiffs filed a reply in support of the petition for certiorari on September 8, 2020. On March 12, 2021, the Solicitor General filed an amicus brief recommending that certiorari be denied. Plaintiffs filed a supplemental brief in response to the Solicitor General’s amicus brief on March 31, 2021, and Defendants filed a supplemental brief on April 1, 2021.
On May 23, 2014, the defendants filed motions to dismiss the FitzSimons action, including a global motion to dismiss Count I, which is the claim brought against former Tribune shareholders for intentional fraudulent conveyance under U.S. federal law. On January 6, 2017, the United States District Court for the Southern District of New York granted the shareholder defendants’ motion to dismiss the intentional fraudulent conveyance claim in the FitzSimons action. In dismissing the intentional fraudulent conveyance claim, the Court denied the plaintiff’s request to amend the complaint. The plaintiff requested that the Court direct entry of a final judgment in order to make the order immediately appealable. On February 23, 2017, the Court issued an order stating that it intended to permit an interlocutory appeal of the dismissal order, but would wait to do so until it has resolved outstanding motions to dismiss filed by other defendants.
On July 18, 2017, the plaintiff submitted a letter to the District Court seeking leave to amend its complaint to add a constructive fraudulent transfer claim. The shareholder defendants opposed that request. On August 24, 2017, the Court denied the plaintiff’s request without prejudice to renewal of the request in the event of an intervening change in the law. On March 8, 2018, the plaintiff renewed his request for leave to file a motion to amend the complaint to assert a constructive fraudulent transfer claim based on the Supreme Court’s ruling in Merit Management Group LP v. FTI Consulting, Inc. The shareholder defendants opposed that request. On June 18, 2018 the District Court ordered that the request would be stayed pending further action by the Second Circuit in the SLCFC actions.
On December 18, 2018, plaintiff filed a letter with the District Court requesting that the stay be dissolved in order to permit briefing on the motion to amend the complaint and indicating plaintiff’s intention to file another motion to amend the complaint to reinstate claims for intentional fraudulent transfer. The shareholder defendants opposed that request. On January 14, 2019, the court held a case management conference, during which the court stated that it would not lift the stay prior to further action from the Second Circuit in the SLCFC actions. The court further stated that it would allow the plaintiff to file a motion to amend to try to reinstate its
| | THE RYDEX FUNDS ANNUAL REPORT | 45 |
NOTES TO FINANCIAL STATEMENTS (concluded) |
intentional fraudulent transfer claim. On January 23, 2019, the court ordered the parties still facing pending claims to participate in a mediation, to commence on January 28, 2019. The mediation did not result in a settlement of the claims against the shareholder defendants.
On April 4, 2019, plaintiff filed a motion to amend the Fifth Amended Complaint to assert a federal constructive fraudulent transfer claim against certain shareholder defendants. On April 10, 2019, the shareholder defendants filed a brief in opposition to plaintiff’s motion to amend. On April 12, 2019, the plaintiff filed a reply brief. On April 23, 2019, the court denied the plaintiff’s motion to amend. On June 13, 2019, the court entered judgment pursuant to Rule 54(b). On July 12, 2019, the Plaintiff filed a notice of appeal with respect to the dismissal of his claims and the District Court’s denial of his motion for leave to amend. Plaintiff filed an appellate brief on January 7, 2020. The shareholder defendants’ brief was filed on April 27, 2020. Plaintiff filed a reply brief on May 18, 2020. The Court held oral argument on August 24, 2020.
None of these lawsuits alleges any wrongdoing on the part of Rydex Series Funds. The following series of Rydex Series Funds held shares of Tribune and tendered these shares as part of Tribune’s LBO: Nova Fund, S&P 500® Pure Value Fund, Multi-Cap Core Equity Fund, S&P 500® Fund, Multi-Hedge Strategies Fund and Hedged Equity Fund (the “Funds”). The value of the proceeds received by the foregoing Funds was $28,220, $109,242, $9,860, $3,400, $1,181,160, and $10,880, respectively. At this stage of the proceedings, Rydex Series Funds is not able to make a reliable predication as to the outcome of these lawsuits or the effect, if any, on a Fund’s net asset value.
Note 12 – COVID-19
The global ongoing crisis caused by the outbreak of COVID-19 and the current recovery underway is causing disruption to consumer demand and economic output and supply chains. There are still travel restrictions and quarantines, and adverse impacts on local and global economies. Investors should be aware that in light of the current uncertainty, volatility and distress in economies, financial markets, and labor and public health conditions around the world, the Fund’s investments and a shareholder’s investment in the Fund are subject to sudden and substantial losses, increased volatility and other adverse events. Firms through which investors invest with the Fund, the Fund, its service providers, the markets in which it invests and market intermediaries are also impacted by quarantines and similar measures intended to respond to and contain the ongoing pandemic, which can obstruct their functioning and subject them to heightened operational and other risks.
Note 13 – Subsequent Events
The Fund evaluated subsequent events through the date the financial statements were available for issue and determined there were no material events that would require adjustment to or disclosure in the Fund’s financial statements.
46 | THE RYDEX FUNDS ANNUAL REPORT | |
REPORT OF INDEPENDENT REGISTERED PUBLIC ACCOUNTING FIRM |
To the Shareholders of NASDAQ-100® Fund and the Board of Trustees of Rydex Series Funds
Opinion on the Financial Statements
We have audited the accompanying statement of assets and liabilities of NASDAQ-100® Fund (the “Fund”) (one of the funds constituting Rydex Series Funds (the “Trust”)), including the schedule of investments, as of March 31, 2021, and the related statement of operations for the year then ended, the statements of changes in net assets for each of the two years in the period then ended, the financial highlights for each of the five years in the period then ended and the related notes (collectively referred to as the “financial statements”). In our opinion, the financial statements present fairly, in all material respects, the financial position of the Fund (one of the funds constituting Rydex Series Funds) at March 31, 2021, the results of its operations for the year then ended, the changes in its net assets for each of the two years in the period then ended and its financial highlights for each of the five years in the period then ended, in conformity with U.S. generally accepted accounting principles.
Basis for Opinion
These financial statements are the responsibility of the Trust’s management. Our responsibility is to express an opinion on the Fund’s financial statements based on our audits. We are a public accounting firm registered with the Public Company Accounting Oversight Board (United States) (“PCAOB”) and are required to be independent with respect to the Trust in accordance with the U.S. federal securities laws and the applicable rules and regulations of the Securities and Exchange Commission and the PCAOB.
We conducted our audits in accordance with the standards of the PCAOB. Those standards require that we plan and perform the audit to obtain reasonable assurance about whether the financial statements are free of material misstatement, whether due to error or fraud. The Trust is not required to have, nor were we engaged to perform, an audit of the Trust’s internal control over financial reporting. As part of our audits, we are required to obtain an understanding of internal control over financial reporting but not for the purpose of expressing an opinion on the effectiveness of the Trust’s internal control over financial reporting. Accordingly, we express no such opinion.
Our audits included performing procedures to assess the risks of material misstatement of the financial statements, whether due to error or fraud, and performing procedures that respond to those risks. Such procedures included examining, on a test basis, evidence regarding the amounts and disclosures in the financial statements. Our procedures included confirmation of securities
| | THE RYDEX FUNDS ANNUAL REPORT | 47 |
REPORT OF INDEPENDENT REGISTERED PUBLIC ACCOUNTING FIRM (concluded) |
owned as of March 31, 2021, by correspondence with the custodian, transfer agent, and brokers or by other appropriate auditing procedures where replies from brokers were not received. Our audits also included evaluating the accounting principles used and significant estimates made by management, as well as evaluating the overall presentation of the financial statements. We believe that our audits provide a reasonable basis for our opinion.

We have served as the auditor of one or more Guggenheim investment companies since 1979.
Tysons, Virginia
May 26, 2021
48 | THE RYDEX FUNDS ANNUAL REPORT | |
OTHER INFORMATION (Unaudited) |
Federal Income Tax Information
This information is being provided as required by the Internal Revenue Code. Amounts shown may differ from those elsewhere in the report because of differences in tax and financial reporting practice.
In January 2022, shareholders will be advised on IRS Form 1099 DIV or substitute 1099 DIV as to the federal tax status of the distributions received by shareholders in the calendar year 2021.
The Fund’s investment income (dividend income plus short-term capital gains, if any) qualifies as follows:
Of the taxable ordinary income distributions paid during the fiscal year ending March 31, 2021, the Fund had the corresponding percentages qualify for the reduced tax rate pursuant to the Jobs and Growth Tax Relief and Reconciliation Act of 2003 or for the dividends received deduction for corporations. See the qualified dividend income and dividend received deduction columns, respectively, in the table below.
Additionally, of the taxable ordinary income distributions paid during the fiscal year ended March 31, 2021, the Fund had the corresponding percentages qualify as qualified short-term capital gains as permitted by IRC Section 871(k)(2). See qualified short-term capital gain column in the table below.
| | Qualified
Dividend
Income | | | Dividend
Received
Deduction | | | Qualified
Short-Term
Capital Gain | |
| | | | 100.00 | % | | | 100.00 | % | | | 100.00 | % |
With respect to the taxable year ended March 31, 2021, the Fund hereby designates as capital gain dividends the amount listed below, or, if subsequently determined to be different, the net capital gain of such year:
| | From long-term
capital gain: | | | From long-term capital
gain, using proceeds
from shareholder
redemptions: | |
| | $ | 54,549,732 | | | $ | 69,783,443 | |
Delivery of Shareholder Reports
Paper copies of the Fund’s annual and semi-annual shareholder reports are not sent by mail, unless you specifically request paper copies of the reports from a fund or from your financial intermediary. Instead, the reports are made available on a website, and you are notified by mail each time a report is posted and provided with a website link to access the report.
| | THE RYDEX FUNDS ANNUAL REPORT | 49 |
OTHER INFORMATION (Unaudited)(concluded) |
You may elect to receive all future shareholder reports in paper free of charge. If you hold shares of a fund directly, you can inform the Fund that you wish to receive paper copies of reports by calling 800.820.0888. If you hold shares of a fund through a financial intermediary, please contact the financial intermediary to make this election. Your election to receive reports in paper may apply to all Guggenheim Funds in which you are invested and may apply to all Guggenheim funds held with your financial intermediary.
Proxy Voting Information
A description of the policies and procedures that the Trust uses to determine how to vote proxies relating to securities held in the Fund’s portfolio is available, without charge and upon request, by calling 800.820.0888. This information is also available from the EDGAR database on the SEC’s website at https://www.sec.gov.
Information regarding how the Fund’s voted proxies relating to portfolio securities during the most recent 12-month period ended June 30 is available without charge, upon request, by calling 800.820.0888. This information is also available from the EDGAR database on the SEC’s website at https://www.sec.gov.
Sector Classification
Information in the Schedule of Investments is categorized by sectors using sector-level Classifications defined by the Bloomberg Industry Classification System, a widely recognized industry classification system provider. The Fund’s registration statement has investment policies relating to concentration in specific sectors/industries. For purposes of these investment policies, the Fund usually classifies sectors/industries based on industry-level Classifications used by widely recognized industry classification system providers such as Bloomberg Industry Classification System, Global Industry Classification Standards and Barclays Global Classification Scheme.
Quarterly Portfolio Schedules Information
The Trust files its complete schedule of portfolio holdings with the SEC for the first and third quarters of each fiscal year as an exhibit to its reports on Form N-PORT, and for reporting periods ended prior to March 31, 2019, filed such information on Form N-Q. The Fund’s Forms N-PORT and N-Q are available on the SEC’s website at https://www.sec.gov. Copies of the portfolio holdings are also available to shareholders, without charge and upon request, by calling 800.820.0888.
50 | THE RYDEX FUNDS ANNUAL REPORT | |
INFORMATION ON BOARD OF TRUSTEES AND OFFICERS (Unaudited) |
A Board of Trustees oversees the Trust, as well as other trusts of GI, in which its members have no stated term of service, and continue to serve after election until resignation. The Statement of Additional Information includes further information about Fund Trustees and Officers, and can be obtained without charge by visiting guggenheiminvestments.com or by calling 800.820.0888.
Name, Address*
and Year of Birth | Position(s)
Held with
Trust | Term of Office
and Length of
Time Served** | Principal Occupation(s)
During Past Five Years | Number of
Portfolios
in Fund
Complex
Overseen | Other
Directorships Held
by Trustees*** |
INDEPENDENT TRUSTEES | | | |
Randall C. Barnes (1951) | Trustee and Chair of the Valuation Oversight Committee | Since 2019 (Trustee) Since 2020 (Chair of the Valuation Oversight Committee) | Current: Private Investor (2001-present). Former: Senior Vice President and Treasurer, PepsiCo, Inc. (1993-1997); President, Pizza Hut International (1991-1993); Senior Vice President, Strategic Planning and New Business Development, PepsiCo, Inc. (1987-1990). | 157 | Current: Purpose Investments Funds (2013-present). Former: Managed Duration Investment Grade Municipal Fund (2006-2016). |
Angela Brock-Kyle (1959) | Trustee | Since 2016 | Current: Founder and Chief Executive Officer, B.O.A.R.D.S. (2013-present). Former: Senior Leader, TIAA (1987-2012). | 156 | Current: Bowhead Insurance GP, LLC (2020-present); Hunt Companies, Inc. (2019-present). Former: Infinity Property & Casualty Corp. (2014-2018). |
Thomas F. Lydon, Jr. (1960) | Trustee and Chair of the Contracts Review Committee | Since 2005 (Trustee) Since 2020 (Chair of the Contracts Review Committee) | Current: President, Global Trends Investments (1996-present); Co-Chief Executive Officer, ETF Flows, LLC (2019-present); Chief Executive Officer, Lydon Media (2016-present). | 156 | Current: US Global Investors (GROW) (1995-present). Former: Harvest Volatility Edge Trust (3) (2017-2019). |
| | THE RYDEX FUNDS ANNUAL REPORT | 51 |
INFORMATION ON BOARD OF TRUSTEES AND OFFICERS (Unaudited)(continued) |
Name, Address*
and Year of Birth | Position(s)
Held with
Trust | Term of Office
and Length of
Time Served** | Principal Occupation(s)
During Past Five Years | Number of
Portfolios
in Fund
Complex
Overseen | Other
Directorships Held
by Trustees*** |
INDEPENDENT TRUSTEES - continued | | | |
Ronald A. Nyberg (1953) | Trustee and Chair of the Nominating and Governance Committee | Since 2019 | Current: Of Counsel, Momkus LLP (2016-present). Former: Partner, Nyberg & Cassioppi, LLC (2000-2016); Executive Vice President, General Counsel, and Corporate Secretary, Van Kampen Investments (1982-1999). | 157 | Current: PPM Funds (2) (2018-present); Edward-Elmhurst Healthcare System (2012-present). Former: Western Asset Inflation-Linked Opportunities & Income Fund (2004-2020); Western Asset Inflation-Linked Income Fund (2003-2020); Managed Duration Investment Grade Municipal Fund (2003-2016). |
Sandra G. Sponem (1958) | Trustee and Chair of the Audit Committee | Since 2016 (Trustee) Since 2019 (Chair of the Audit Committee) | Current: Retired. Former: Senior Vice President and Chief Financial Officer, M.A. Mortenson-Companies, Inc. (2007-2017). | 156 | Current: SPDR Series Trust (81) (2018-present); SPDR Index Shares Funds (30) (2018-present); SSGA Active Trust (14) (2018-present). Former: SSGA Master Trust (1) (2018-2020). |
52 | THE RYDEX FUNDS ANNUAL REPORT | |
INFORMATION ON BOARD OF TRUSTEES AND OFFICERS (Unaudited)(continued) |
Name, Address*
and Year of Birth | Position(s)
Held with
Trust | Term of Office
and Length of
Time Served** | Principal Occupation(s)
During Past Five Years | Number of
Portfolios
in Fund
Complex
Overseen | Other
Directorships Held
by Trustees*** |
INDEPENDENT TRUSTEES - concluded | | | |
Ronald E. Toupin, Jr. (1958) | Trustee, Chair of the Board and Chair of the Executive Committee | Since 2019 | Current: Portfolio Consultant (2010-present); Member, Governing Council, Independent Directors Council (2013-present); Governor, Board of Governors, Investment Company Institute (2018-present). Former: Member, Executive Committee, Independent Directors Council (2016-2018); Vice President, Manager and Portfolio Manager, Nuveen Asset Management (1998-1999); Vice President, Nuveen Investment Advisory Corp. (1992-1999); Vice President and Manager, Nuveen Unit Investment Trusts (1991-1999); and Assistant Vice President and Portfolio Manager, Nuveen Unit Investment Trusts (1988-1999), each of John Nuveen & Co., Inc. (1982-1999). | 156 | Former: Western Asset Inflation-Linked Opportunities & Income Fund (2004-2020); Western Asset Inflation-Linked Income Fund (2003-2020); Managed Duration Investment Grade Municipal Fund (2003-2016). |
| | THE RYDEX FUNDS ANNUAL REPORT | 53 |
INFORMATION ON BOARD OF TRUSTEES AND OFFICERS (Unaudited)(continued) |
Name, Address*
and Year of Birth | Position(s)
Held with
Trust | Term of Office
and Length of
Time Served** | Principal Occupation(s)
During Past Five Years | Number of
Portfolios
in Fund
Complex
Overseen | Other
Directorships Held
by Trustees*** |
INTERESTED TRUSTEE | | | |
Amy J. Lee**** (1961) | Trustee, Vice President and Chief Legal Officer | Since 2019 | Current: Interested Trustee, certain other funds in the Fund Complex (2018-present); Chief Legal Officer, certain other funds in the Fund Complex (2014-present); Vice President, certain other funds in the Fund Complex (2007-present); Senior Managing Director, Guggenheim Investments (2012-present). Former: President and Chief Executive Officer, certain other funds in the Fund Complex (2017-2019); Vice President, Associate General Counsel and Assistant Secretary, Security Benefit Life Insurance Company and Security Benefit Corporation (2004-2012). | 156 | None. |
* | The business address of each Trustee is c/o Guggenheim Investments, 227 West Monroe Street, Chicago, Illinois 60606. |
** | Each Trustee serves an indefinite term, until his or her successor is elected and qualified. |
*** | Each Trustee also serves on the Boards of Trustees of Guggenheim Funds Trust, Guggenheim Variable Funds Trust, Guggenheim Strategy Funds Trust, Fiduciary/Claymore Energy Infrastructure Fund, Guggenheim Taxable Municipal Bond & Investment Grade Debt Trust, Guggenheim Strategic Opportunities Fund, Guggenheim Enhanced Equity Income Fund, Guggenheim Energy & Income Fund, Guggenheim Credit Allocation Fund, Rydex Series Funds, Rydex Dynamic Funds, Rydex Variable Trust and Transparent Value Trust. Messrs. Barnes and Nyberg also serve on the Board of Trustees of Advent Convertible & Income Fund. |
**** | This Trustee is deemed to be an “interested person” of the Fund under the 1940 Act by reason of her position with the Fund’s Investment Manager and/or the parent of the Investment Manager. |
54 | THE RYDEX FUNDS ANNUAL REPORT | |
INFORMATION ON BOARD OF TRUSTEES AND OFFICERS (Unaudited)(continued) |
Name, Address*
and Year of Birth | Position(s)
Held with
Trust | Term of Office
and Length of
Time Served** | Principal Occupation(s)
During Past Five Years |
OFFICERS | | | |
Brian E. Binder (1972) | President and Chief Executive Officer | Since 2019 | Current: President and Chief Executive Officer, certain other funds in the Fund Complex (2018-present); President, Chief Executive Officer and Chairman of the Board of Managers, Guggenheim Funds Investment Advisors, LLC (2018-present); President and Chief Executive Officer, Security Investors, LLC (2018-present); Board Member of Guggenheim Partners Fund Management (Europe) Limited (2018-present); Senior Managing Director and Chief Administrative Officer, Guggenheim Investments (2018-present). Former: Managing Director and President, Deutsche Funds, and Head of US Product, Trading and Fund Administration, Deutsche Asset Management (2013-2018); Managing Director, Head of Business Management and Consulting, Invesco Ltd. (2010-2012). |
James M. Howley (1972) | Assistant Treasurer | Since 2016 | Current: Managing Director, Guggenheim Investments (2004-present); Assistant Treasurer, certain other funds in the Fund Complex (2006-present). Former: Manager, Mutual Fund Administration of Van Kampen Investments, Inc. (1996-2004). |
Mark E. Mathiasen (1978) | Secretary | Since 2017 | Current: Secretary, certain other funds in the Fund Complex (2007-present); Managing Director, Guggenheim Investments (2007-present). |
Glenn McWhinnie (1969) | Assistant Treasurer | Since 2016 | Current: Vice President, Guggenheim Investments (2009-present); Assistant Treasurer, certain other funds in the Fund Complex (2016-present). |
Michael P. Megaris (1984) | Assistant Secretary | Since 2018 | Current: Assistant Secretary, certain other funds in the Fund Complex (2014-present); Director, Guggenheim Investments (2012-present). |
Elisabeth Miller (1968) | Chief Compliance Officer | Since 2012 | Current: Chief Compliance Officer, certain other funds in the Fund Complex (2012-present); Senior Managing Director, Guggenheim Investments (2012-present). Vice President, Guggenheim Funds Distributors, LLC (2014-present). Former: Chief Compliance Officer, Security Investors, LLC and Guggenheim Funds Investment Advisors, LLC (2012-2018); Chief Compliance Officer, Guggenheim Distributors, LLC (2009-2014); Senior Manager, Security Investors, LLC (2004-2014); Senior Manager, Guggenheim Distributors, LLC (2004-2014). |
| | THE RYDEX FUNDS ANNUAL REPORT | 55 |
INFORMATION ON BOARD OF TRUSTEES AND OFFICERS (Unaudited)(continued) |
Name, Address*
and Year of Birth | Position(s)
Held with
Trust | Term of Office
and Length of
Time Served** | Principal Occupation(s)
During Past Five Years |
OFFICERS - continued | | |
Margaux Misantone (1978) | AML Officer | Since 2017 | Current: Chief Compliance Officer, Security Investors, LLC and Guggenheim Funds Investment Advisors, LLC (2018-present); AML Officer, Security Investors, LLC and certain other funds in the Fund Complex (2017-present); Managing Director, Guggenheim Investments (2015-present). Former: Assistant Chief Compliance Officer, Security Investors, LLC and Guggenheim Funds Investments Advisors, LLC (2015-2018). |
Kimberly J. Scott (1974) | Assistant Treasurer | Since 2016 | Current: Director, Guggenheim Investments (2012-present); Assistant Treasurer, certain other funds in the Fund Complex (2012-present). Former: Financial Reporting Manager, Invesco, Ltd. (2010-2011); Vice President/Assistant Treasurer, Mutual Fund Administration for Van Kampen Investments, Inc./Morgan Stanley Investment Management (2009-2010); Manager of Mutual Fund Administration, Van Kampen Investments, Inc./Morgan Stanley Investment Management (2005-2009). |
Bryan Stone (1979) | Vice President | Since 2019 | Current: Vice President, certain other funds in the Fund Complex (2014-present); Managing Director, Guggenheim Investments (2013-present). Former: Senior Vice President, Neuberger Berman Group LLC (2009-2013); Vice President, Morgan Stanley (2002-2009). |
John L. Sullivan (1955) | Chief Financial Officer, Chief Accounting Officer and Treasurer | Since 2016 | Current: Chief Financial Officer, Chief Accounting Officer and Treasurer, certain other funds in the Fund Complex (2010-present); Senior Managing Director, Guggenheim Investments (2010-present). Former: Managing Director and Chief Compliance Officer, each of the funds in the Van Kampen Investments fund complex (2004-2010); Managing Director and Head of Fund Accounting and Administration, Morgan Stanley Investment Management (2002-2004); Chief Financial Officer and Treasurer, Van Kampen Funds (1996-2004). |
56 | THE RYDEX FUNDS ANNUAL REPORT | |
INFORMATION ON BOARD OF TRUSTEES AND OFFICERS (Unaudited)(concluded) |
Name, Address*
and Year of Birth | Position(s)
Held with
Trust | Term of Office
and Length of
Time Served** | Principal Occupation(s)
During Past Five Years |
OFFICERS - concluded | | |
Jon Szafran (1989) | Assistant Treasurer | Since 2017 | Current: Vice President, Guggenheim Investments (2017-present); Assistant Treasurer, certain other funds in the Fund Complex (2017-present). Former: Assistant Treasurer of Henderson Global Funds and Manager of US Fund Administration, Henderson Global Investors (North America) Inc. (“HGINA”), (2017); Senior Analyst of US Fund Administration, HGINA (2014–2017); Senior Associate of Fund Administration, Cortland Capital Market Services, LLC (2013-2014); Experienced Associate, PricewaterhouseCoopers LLP (2012-2013). |
* | The business address of each officer is c/o Guggenheim Investments, 227 West Monroe Street, Chicago, Illinois 60606. |
** | Each officer serves an indefinite term, until his or her successor is duly elected and qualified. |
| | THE RYDEX FUNDS ANNUAL REPORT | 57 |
GUGGENHEIM INVESTMENTS PRIVACY NOTICE (Unaudited) |
Who We Are
This Privacy Notice describes the data protection practices of Guggenheim Investments. Guggenheim Investments as used herein refers to the affiliated investment management businesses of Guggenheim Partners, LLC: Guggenheim Funds Investment Advisors, LLC, Guggenheim Partners Investment Management, LLC, Guggenheim Funds Distributors, LLC, Security Investors, LLC, Guggenheim Investment Advisors (Europe) Limited, Guggenheim Real Estate, LLC, GS Gamma Advisors, LLC, Guggenheim Partners India Management, LLC, Guggenheim Partners Europe Limited, as well as the funds in the Guggenheim Funds complex (the “Funds”) (“Guggenheim Investments,” “we,” “us,” or “our”).
Guggenheim Partners Investment Management Holdings, LLC, located at 330 Madison Avenue, New York, New York 10017 is the data controller for your information. The affiliates who are also controllers of certain of your information are: Guggenheim Investment Advisors (Europe) Limited, Guggenheim Partners Europe Limited, Guggenheim Partners, LLC, Guggenheim Funds Investment Advisors, LLC, Guggenheim Partners Investment Management, LLC, Guggenheim Funds Distributors, LLC and Security Investors, LLC, as well as the Funds.
Our Commitment to You
Guggenheim Investments considers your privacy our utmost concern. When you become our client or investor, you entrust us with not only your hard-earned money but also with your personal and financial information. Because we have access to your private information, we hold ourselves to the highest standards in its safekeeping and use. We strictly limit how we share your information with others, whether you are a current or former Guggenheim Investments client or investor.
The Information We Collect About You
We collect certain nonpublic personal information about you from information you provide on applications, other forms, our website, and/or from third parties including investment advisors. This information includes Social Security or other tax identification number, assets, income, tax information, retirement and estate plan information, transaction history, account balance, payment history, bank account information, marital status, family relationships, information that we collect on our website through the use of “cookies,” and other personal information that you or others provide to us. We may also collect such information through your inquiries by mail, e-mail or telephone. We may also collect customer due diligence information, as required by applicable law and regulation, through third party service providers.
How We Handle Your Personal Information
The legal basis for using your information as set out in this Privacy Notice is as follows: (a) use of your personal data is necessary to perform our obligations under any contract with you (such as a contract for us to provide financial services to you); or (b) where use of your personal data is not necessary for performance of a contract, use of your personal data is necessary for our
58 | THE RYDEX FUNDS ANNUAL REPORT | |
GUGGENHEIM INVESTMENTS PRIVACY NOTICE (Unaudited)(continued) |
legitimate interests or the legitimate interests of others (for example, to enforce the legal terms governing our services, operate and market our website and other services we offer, ensure safe environments for our personnel and others, make and receive payments, prevent fraud and to know the customer to whom we are providing the services). Some processing is done to comply with applicable law. In addition to the specific uses described above, we also use your information in the following manner:
| | ● | We use your information in connection with servicing your accounts. |
| | ● | We use information to respond to your requests or questions. For example, we might use your information to respond to your customer feedback. |
| | ● | We use information to improve our products and services. We may use your information to make our website and products better. We may use your information to customize your experience with us. |
| | ● | We use information for security purposes. We may use your information to protect our company and our customers. |
| | ● | We use information to communicate with you. For example, we will communicate with you about your account or our relationship. We may contact you about your feedback. We might also contact you about this Privacy Notice. We may also enroll you in our email newsletter. |
| | ● | We use information as otherwise permitted by law, as we may notify you. |
| | ● | Aggregate/Anonymous Data. We may aggregate and/or anonymize any information collected through the website so that such information can no longer be linked to you or your device (“Aggregate/Anonymous Information”). We may use Aggregate/Anonymous Information for any purpose, including without limitation for research and marketing purposes, and may also share such data with any third parties, including advertisers, promotional partners, and sponsors. |
We do not sell information about current or former clients or their accounts to third parties. Nor do we share this information, except when necessary to complete transactions at your request, to make you aware of investment products and services that we or our affiliates offer, or as permitted or required by law.
We provide information about you to companies and individuals not affiliated with Guggenheim Investments to complete certain transactions or account changes, or to perform services for us related to your account. For example, if you ask to transfer assets from another financial institution to Guggenheim Investments, we must provide certain information about you to that company to complete the transaction. We provide the third party with only the information necessary to carry out its responsibilities and only for that purpose. And we require these third parties to treat your private information with the same high degree of confidentiality that we do.
| | THE RYDEX FUNDS ANNUAL REPORT | 59 |
GUGGENHEIM INVESTMENTS PRIVACY NOTICE (Unaudited)(continued) |
To alert you to other Guggenheim Investments products and services, we share your information within our family of affiliated companies. You may limit our sharing with affiliated companies as set out below. We may also share information with any successor to all or part of our business, or in connection with steps leading up to a merger or acquisition. For example, if part of our business was sold we may give customer information as part of that transaction. We may also share information about you with your consent.
We will release information about you if you direct us to do so, if we are compelled by law to do so, or in other circumstances as permitted by law (for example, to protect your account from fraud).
If you close your account(s) or become an inactive client or investor, we will continue to adhere to the privacy policies and practices described in this notice.
Opt-Out Provisions and Your Data Choices
The law allows you to “opt out” of certain kinds of information sharing with third parties. We do not share personal information about you with any third parties that triggers this opt-out right. This means YOU ARE ALREADY OPTED OUT.
When you are no longer our client or investor, we continue to share your information as described in this notice, and you may contact us at any time to limit our sharing by sending an email to CorporateDataPrivacy@GuggenheimPartners.com.
European Union Data Subjects and certain others: In addition to the choices set forth above, residents of the European Union and certain other jurisdictions have certain rights to (1) request access to or rectification or deletion of information we collect about them, (2) request a restriction on the processing of their information, (3) object to the processing of their information, or (4) request the portability of certain information. To exercise these or other rights, please contact us using the contact information below. We will consider all requests and provide our response within the time period stated by applicable law. Please note, however, that certain information may be exempt from such requests in some circumstances, which may include if we need to keep processing your information for our legitimate interests or to comply with a legal obligation. We may request you provide us with information necessary to confirm your identity before responding to your request.
Residents of France and certain other jurisdictions may also provide us with instructions regarding the manner in which we may continue to store, erase and share your information after your death, and where applicable, the person you have designated to exercise these rights after your death.
How We Protect Privacy Online
We take steps to protect your privacy when you use our web site – www.guggenheiminvestments.com – by using secure forms of online communication, including encryption technology, Secure Socket Layer (SSL) protocol, firewalls and user names and passwords. These safeguards vary based on the
60 | THE RYDEX FUNDS ANNUAL REPORT | |
GUGGENHEIM INVESTMENTS PRIVACY NOTICE (Unaudited)(concluded) |
sensitivity of the information that we collect and store. However, we cannot and do not guarantee that these measures will prevent every unauthorized attempt to access, use, or disclose your information since despite our efforts, no Internet and/or other electronic transmissions can be completely secure. Our web site uses “http cookies”—tiny pieces of information that we ask your browser to store. We use cookies for session management and security features on the Guggenheim Investments web site. We do not use them to pull data from your hard drive, to learn your e-mail address, or to view data in cookies created by other web sites. We will not share the information in our cookies or give others access to it. See the legal information area on our web site for more details about web site security and privacy features.
How We Safeguard Your Personal Information and Data Retention
We restrict access to nonpublic personal information about you to our employees and in some cases to third parties (for example, the service providers described above) as permitted by law. We maintain strict physical, electronic and procedural safeguards that comply with federal standards to guard your nonpublic personal information.
We keep your information for no longer than necessary for the purposes for which it is processed. The length of time for which we retain information depends on the purposes for which we collected and use it and/or as required to comply with applicable laws. Information may persist in copies made for backup and business continuity purposes for additional time.
International Visitors
If you are not a resident of the United States, please be aware that your information may be transferred to, stored and processed in the United States where our servers are located and our databases are operated. The data protection and other laws of the United States and other countries might not be as comprehensive as those in your country.
In such cases, we ensure that a legal basis for such a transfer exists and that adequate protection is provided as required by applicable law, for example, by using standard contractual clauses or by transferring your data to a jurisdiction that has obtained an adequacy finding. Individuals whose data may be transferred on the basis of standard contractual clauses may contact us as described below.
We’ll Keep You Informed
If you have any questions or concerns about how we treat your personal data, we encourage you to consult with us first. You may also contact the relevant supervisory authority.
We reserve the right to modify this policy at any time and will inform you promptly of material changes.
You may access our privacy policy from our web site at www.guggenheiminvestments.com. Should you have any questions regarding our privacy policy, contact us by email at CorporateDataPrivacy@GuggenheimPartners.com.
| | THE RYDEX FUNDS ANNUAL REPORT | 61 |
This page intentionally left blank.
This page intentionally left blank.
This page intentionally left blank.
This page intentionally left blank.
3.31.2021
Rydex Funds Annual Report
Guggenheim Alternatives Funds |
Guggenheim Long Short Equity Fund | | |
Rydex International Equity Funds |
Rydex Emerging Markets 2x Strategy Fund | | |
Rydex Inverse Emerging Markets 2x Strategy Fund | | |
Rydex Fixed Income Fund |
Rydex Emerging Markets Bond Strategy Fund | | |
GuggenheimInvestments.com | RSTF-ANN-0321x0322 |

| | |
DEAR SHAREHOLDER | 2 |
ECONOMIC AND MARKET OVERVIEW | 4 |
A BRIEF NOTE ON THE COMPOUNDING OF RETURNS | 6 |
ABOUT SHAREHOLDERS’ FUND EXPENSES | 7 |
LONG SHORT EQUITY FUND | 10 |
EMERGING MARKETS 2x STRATEGY FUND | 32 |
INVERSE EMERGING MARKETS 2x STRATEGY FUND | 41 |
EMERGING MARKETS BOND STRATEGY FUND | 48 |
NOTES TO FINANCIAL STATEMENTS | 56 |
REPORT OF INDEPENDENT REGISTERED PUBLIC ACCOUNTING FIRM | 72 |
OTHER INFORMATION | 73 |
INFORMATION ON BOARD OF TRUSTEES AND OFFICERS | 74 |
GUGGENHEIM INVESTMENTS PRIVACY NOTICE | 79 |
| | THE RYDEX FUNDS ANNUAL REPORT | 1 |
Dear Shareholder:
Security Investors, LLC (the “Investment Adviser”) is pleased to present the annual shareholder report for a selection of our alternative strategy funds (the “Fund” or “Funds”) for the one-year period ended March 31, 2021.
The Investment Adviser is a part of Guggenheim Investments, which represents the investment management businesses of Guggenheim Partners, LLC (“Guggenheim”), a global, diversified financial services firm.
Guggenheim Funds Distributors, LLC is the distributor of the Funds. Guggenheim Funds Distributors, LLC is affiliated with Guggenheim and the Investment Adviser.
We encourage you to read the Economic and Market Overview section of the report, which follows this letter, and then the Performance Report and Fund Profile for each Fund.
We are committed to providing innovative investment solutions and appreciate the trust you place in us.
Sincerely,
Security Investors, LLC
April 30, 2021
Read a prospectus and summary prospectus (if available) carefully before investing. It contains the investment objectives, risks, charges, expenses and other information, which should be considered carefully before investing. Obtain a prospectus and summary prospectus (if available) at guggenheiminvestments.com or call 800.820.0888.
This material is not intended as a recommendation or as investment advice of any kind, including in connection with rollovers, transfers, and distributions. Such material is not provided in a fiduciary capacity, may not be relied upon for or in connection with the making of investment decisions, and does not constitute a solicitation of an offer to buy or sell securities. All content has been provided for informational or educational purposes only and is not intended to be and should not be construed as legal or tax advice and/or a legal opinion. Always consult a financial, tax and/or legal professional regarding your specific situation.
COVID-19. The global ongoing crisis caused by the outbreak of COVID-19 and the current recovery underway is causing disruption to consumer demand and economic output and supply chains. There are still travel restrictions and quarantines, and adverse impacts on local and global economies. Investors should be aware that in light of the current uncertainty, volatility and distress in economies, financial markets, and labor and public health conditions around the world, the Funds’ investments and a shareholder’s investment in a Fund are subject to investment risk, including the possible loss of the entire principal amount invested. Firms through which investors invest with the Funds, the Funds, their service providers, the markets in which they invest and market intermediaries are also impacted by quarantines and similar measures intended to respond to and contain the ongoing pandemic, which can obstruct their functioning and subject them to heightened operational and other risks.
The Long Short Equity Fund may not be suitable for all investors. ● The Fund is subject to the risk that the Advisor’s use of a momentum-driven investment strategy may cause the Fund to underperform other types of mutual funds that use different investment strategies during periods when momentum investing is out of favor. ● It is possible that the stocks the Fund holds long will decline in value at the same time that the stocks or indices being shorted increase in value, thereby increasing potential losses to the Fund. ● The Fund’s loss on a short sale is potentially unlimited because there is no upper limit on the price a borrowed security could attain. ● The more the Fund invests in leveraged instruments, the more the leverage will magnify any gains or losses on those investments. ● The use of derivatives, such as futures, options and swap agreements, may expose the Fund to additional risks that it would not be subject to if it invested directly in the securities underlying those derivatives. ● The Fund may invest in American Depositary Receipts (“ADRs”) therefore subjecting the value of the Fund’s portfolio to fluctuations in foreign exchange rates. ● This Fund is considered non-diversified and can invest a greater portion of its assets in securities of individual issuers than a diversified fund. As a result, changes in the market value of a single security could cause greater fluctuations in the value of Fund shares than would occur in a more diversified fund. See the prospectus for more information on these and additional risks.
2 | THE RYDEX FUNDS ANNUAL REPORT | |
Inverse and leveraged funds are not suitable for all investors. ● These funds should be utilized only by investors who (a) understand the risks associated with the use of leverage, (b) understand the consequences of seeking daily leveraged investment results, (c) understand the risk of shorting, and (d) intend to actively monitor and manage their investments. ● The more a fund invests in leveraged instruments, the more the leverage will magnify any gains or losses on those investments. ● Inverse funds involve certain risks, which include increased volatility due to the funds’ possible use of short sales of securities and derivatives, such as options and futures. ● The Funds’ use of derivatives, such as futures, options and swap agreements, may expose the funds’ shareholders to additional risks that they would not be subject to if they invested directly in the securities underlying those derivatives. ● Short-selling involves increased risks and costs. You risk paying more for a security than you received from its sale. ● Leveraged and inverse funds seek to provide investment results that match the performance of a specific benchmark, before fees and expenses, on a daily basis. Because the Funds seek to track the performance of their benchmark on a daily basis, mathematical compounding, especially with respect to those funds that use leverage as part of their investment strategy, may prevent a fund from correlating with the monthly, quarterly, annual or other period performance of its benchmark. Due to the compounding of daily returns, leveraged and inverse funds’ returns over periods other than one day will likely differ in amount and possibly direction from the benchmark return for the same period. For those funds that consistently apply leverage, the value of the fund’s shares will tend to increase or decrease more than the value of any increase or decrease in its benchmark index. The Funds rebalance their portfolios on a daily basis, increasing exposure in response to that day’s gains or reducing exposure in response to that day’s losses. Daily rebalancing will impair a fund’s performance if the benchmark experiences volatility. Investors should monitor their leveraged and inverse funds’ holdings consistent with their strategies, as frequently as daily. ● For more information on these and other risks, please read the prospectus. ● The leveraged and Inverse Emerging Markets Funds’ investments in developed and emerging foreign markets may increase the Funds’ volatility due to the impact of diplomatic, political or economic developments in the country in question. ● Additionally, the Funds’ direct and indirect exposure to foreign currencies subjects the Funds to the risk that those currencies will decline in value relative to the U.S. dollar, or, in the case of short positions, that the U.S. dollar will decline in value relative to the currencies. ● A fund’s investment in the securities of non-U.S. companies in the form of American Depositary Receipts (ADRs) poses special risks associated with international investing, including fluctuating exchange rates, government regulations and differences in liquidity, which may affect the volatility and performance of a fund.
The Emerging Markets Bond Strategy Fund may not be suitable for all investors. Investments in securities, in general, are subject to market risks that may cause their prices to fluctuate over time. An investment in the Fund may lose money. ● The Fund’s investments in bonds and financial instruments that in combination have economic characteristics similar to emerging markets bonds carries additional risks when compared to investing in U.S. securities, due to the impact of diplomatic, political or economic developments in the country in question. ● The Fund’s investments in derivatives, including credit default swaps, may pose risks in addition to those associated with investing directly in securities or other investments, including illiquidity of the derivatives, imperfect correlations with underlying investments or the Fund’s other portfolio holdings, lack of availability and counterparty risk. To the extent the Fund invests in derivatives to seek to hedge risk or limit leveraged exposure created by other investments, there is no guarantee that such hedging strategies will be effective at managing risk or limiting exposure to leveraged investments. ● The Fund’s exposure to high yield securities may subject the Fund to greater volatility. ● The Fund’s market value will change in response to interest rate changes and market conditions among other factors. In general, bond prices rise when interest rates fall and vice versa. ● The Fund’s investments in bank obligations may expose it to adverse developments in or related to the banking industry. ● The Funds use of leverage will exaggerate the effect on net asset value of any increase or decrease in the market value of the Fund’s portfolio. ● The Fund’s indirect and direct exposure to foreign currencies subjects the Fund to the risk that those currencies will decline in value relative to the U.S. dollar, or, in the case of short positions, that the U.S. dollar will decline in value relative to the currency being hedged. ● The Fund’s investments in other investment vehicles subject the Fund to those risks and expenses affecting the investment vehicle. ● See the prospectus for more information on these and other risks.
| | THE RYDEX FUNDS ANNUAL REPORT | 3 |
ECONOMIC AND MARKET OVERVIEW (Unaudited) | March 31, 2021 |
For the 12-month period ended March 31, 2021, the Standard & Poor’s 500® (“S&P 500®”) Index returned 56.35% as the equity market roared back to life after a sharp selloff following the outbreak of COVID-19. This increase was in spite of ongoing personal and economic hardships imposed by COVID-19, highlighting the crucial role of policy support in the form of monetary and fiscal stimulus, which has succeeded in averting a lengthy recession in the U.S. These policy initiatives, particularly on the monetary side, increased market liquidity and lowered borrowing rates, reassuring equity investors that the Federal Reserve (the “Fed”) would do everything in its power to maintain market stability.
Our 2021 U.S. economic growth forecast increased during the first quarter of 2021 from an annualized 5.5% to over 7%, factoring in more fiscal stimulus than previously anticipated. This forecast captures the effect of stimulus representing roughly 11% of 2020–2021 gross domestic product (“GDP”), versus the previous calculation of about 8%. We see strength in the consumer sector and in housing activity. In addition, U.S. vaccinations for COVID-19 continue to accelerate, nearing 3 million doses per day by the end of the first quarter. More than 213 million doses have been administered in the U.S. so far, and about 35% of the U.S. population has been fully vaccinated. The U.S. is seeing the best-case scenario unfold in its vaccine rollout, but other countries have not been as fortunate.
Europe’s vaccine rollout hit a major speedbump during the first quarter when questions surrounding the safety of the AstraZeneca vaccine led several major European countries to temporarily suspend distribution. Safety concerns, coupled with supply constraints, meant that less than 10% of the populations of Germany, France, and Italy had been vaccinated by the end of the first quarter, well under the pace needed to reach 70% inoculated by summer. Any delay in ending the pandemic on a global scale has implications for other countries too, including the U.S., where travel and hospitality workers represent a large share of the unemployed.
Despite vaccination delays in Europe and its implications abroad, we saw meaningful improvement in the domestic labor market during the first quarter as states moved forward with business re-openings. Seasonally adjusted initial jobless claims fell by 97,000 to 684,000 in the week ending March 20, 2021, the lowest level since the pandemic began, before seeing an uptick the following week to 719,000. We saw more positive news across the board in the March payroll report with 916,000 jobs added, and with 156,000 more from revisions. Standing in the way of additional labor market gains are local government restrictions on certain sectors, although easing of these restrictions is expected by summer.
Economic developments drove a sharp increase in U.S. Treasury yields. The market pulled forward expectations of the next Fed rate hike from December 2023 to December 2022, while repricing the long-run terminal Fed funds rate estimate to 2.25% from just 0.55% last August. We do not expect the Fed to raise interest rates as early as the market is anticipating, even though we expect strong GDP growth in coming years.
Year-over-year inflation measures will rise over the next several months due to base effects, which may be compounded by supply chain disruptions in the goods sector and potential capacity constraints for certain services. However, these factors could prove to be short-lived, with base effects set to dampen inflation starting in the summer months. Moreover, the Fed is focused on generating sustainably higher inflation. Even if core inflation rises above the Fed’s 2% target in 2021, the Fed’s focus is on a long-term average of 2%. With years of shortfalls to make up, and the Fed now targeting labor market disparities as part of an expanded definition of full employment, we expect policymakers to remain resolutely patient. Any tapering of asset purchases will likely be deferred until later in 2022, with the first rate hike likely to come sometime after that.
Easy financial conditions and low rates will likely support credit over the next few years. With market optimism pulling forward rate hike expectations and causing bond yields to rise, we view this as an opportunity to add incremental yield to portfolios.
For the 12-month period ended March 31, 2021, the S&P 500® Index* returned, as noted, 56.35%. The MSCI Europe-Australasia-Far East (“EAFE”) Index* returned 44.57%. The return of the MSCI Emerging Markets Index* was 58.39%.
In the bond market, the Bloomberg Barclays U.S. Aggregate Bond Index* posted a 0.71% return for the 12-month period, while the Bloomberg Barclays U.S. Corporate High Yield Index* returned 23.72%. The return of the ICE Bank of America (“BofA”) Merrill Lynch 3-Month U.S. Treasury Bill Index* was 0.12% for the 12-month period.
The opinions and forecasts expressed may not actually come to pass. This information is subject to change at any time, based on market and other conditions, and should not be construed as a recommendation of any specific security or strategy.
4 | THE RYDEX FUNDS ANNUAL REPORT | |
ECONOMIC AND MARKET OVERVIEW (Unaudited)(concluded) | March 31, 2021 |
*Index Definitions:
The following indices are referenced throughout this report. Indices are unmanaged and not available for direct investment. Index performance does not reflect transaction costs, fees, or expenses.
BNY Mellon Emerging Markets 50 ADR Index is capitalization-weighted and designed to track the performance of approximately 50 emerging market-based depositary receipts.
Bloomberg Barclays U.S. Aggregate Bond Index is a broad-based flagship benchmark that measures the investment grade, U.S. dollar-denominated, fixed-rate taxable bond market, including U.S. Treasuries, government-related and corporate securities, mortgage-backed securities or “MBS” (agency fixed-rate and hybrid adjustable-rate mortgage, or “ARM”, pass-throughs), asset-backed securities (“ABS”), and commercial mortgage-backed securities (“CMBS”) (agency and non-agency).
Bloomberg Barclays U.S. Corporate High Yield Index measures the U.S. dollar-denominated, high yield, fixed-rate corporate bond market. Securities are classified as high yield if the middle rating of Moody’s, Fitch, and S&P is Ba1/BB +/BB + or below.
HFRX Equity Hedge Index is designed to be representative of the overall composition of the equity hedge segment of the hedge fund universe. In an equity hedge strategy both long and short positions primarily in equities are maintained. Equities which are believed to be undervalued are bought and equities which are believed to be overvalued are sold.
ICE BofA Merrill Lynch 3-Month U.S. Treasury Bill Index is an unmanaged market Index of U.S. Treasury securities maturing in 90 days that assumes reinvestment of all income.
ICE BofA Merrill Lynch U.S. Dollar Emerging Markets Sovereign Plus Index tracks the performance of U.S. dollar-denominated emerging market and crossover sovereign debt publicly issued in the eurobond or U.S. domestic market. Qualifying countries must have a BBB1 or lower foreign currency long-term sovereign debt rating (based on an average of Moody’s, S&P and Fitch). Countries that are not rated, or that are rated “D” or “SD” by one or several rating agencies qualify for inclusion in the index but individual non-performing securities are removed. Qualifying securities must have at least one year remaining term to final maturity, at least 18 months to maturity at point of issuance, a fixed or floating coupon and a minimum amount outstanding of $250 million. Local currency debt is excluded from the Index. Index constituents are capitalization-weighted based on their current amount outstanding times the market price plus accrued interest.
MSCI EAFE Index is a free float-adjusted market capitalization index that is designed to measure the equity market performance of developed markets, excluding the U.S. & Canada.
MSCI Emerging Markets Index is a free float-adjusted market capitalization weighted index that is designed to measure equity market performance in the global emerging markets.
Morningstar Long/Short Equity Category Average represents long-short portfolios which hold sizable stakes in both long and short positions in equities and related derivatives. Some funds that fall into this category will shift their exposure to long and short positions depending on their macro outlook or the opportunities they uncover through bottom-up research. Some funds may simply hedge long stock positions through exchange traded funds or derivatives. At least 75% of the assets are in equity securities or derivatives.
Russell 2000® Index measures the performance of the small-cap segment of the U.S. equity universe.
Russell 3000® Index measures the performance of the largest 3,000 U.S. companies, representing approximately 98% of the investable U.S. equity market
S&P 500® is a broad-based index, the performance of which is based on the performance of 500 widely held common stocks chosen for market size, liquidity, and industry group representation.
| | THE RYDEX FUNDS ANNUAL REPORT | 5 |
A BRIEF NOTE ON THE COMPOUNDING OF RETURNS (Unaudited) | |
The Rydex Emerging Markets 2x Strategy Fund and Rydex Inverse Emerging Markets 2x Strategy Fund are benchmarked daily to leveraged and/or inverse leveraged versions of published indices. To properly evaluate the performance of these funds, it is essential to understand the effect of mathematical compounding on their respective returns.
Because of the nonlinear effects of leverage applied over time, it is possible for a fund to perform in-line with its benchmark for several individual periods in a row, yet seem to trail the benchmark over the entire period on a cumulative basis. It is also possible that a fund that performs in-line with its benchmark on a daily basis may seem to outperform its benchmark over longer periods.
An Example of Compounding
For example, consider a hypothetical fund that is designed to produce returns that correspond to 150% of an index. On the first day of a period, the index rises from a level of 100 to a level of 106, producing a 6.0% gain and an expectation that the fund will rise by 9.0%. On the same day, the fund’s net asset value per share (“NAV”) increases from $10.00 to $10.90 for a gain of 9.0% — in line with its benchmark.
On day two, assume the index falls from 106 to 99 for a loss of about 6.6%. The fund, as expected, falls 9.9% to a price of $9.82. On each day, the fund performed exactly in line with its benchmark, but for the two-day period, the fund was down 1.8%, while the index was down only 1.0%. Without taking into account the daily compounding of returns, one would expect the fund to lose 1.5% and would see the fund as trailing by 0.3% when in fact it had performed perfectly. This example is summarized in the table below.
| Index
Level | Index
Performance | Fund
Expectation | Fund
NAV | Fund
Performance | Assessment |
Start | 100 | | | $ 10.00 | | |
Day 1 | 106 | 6.0% | 9.0% | $ 10.90 | 9.0% | In line |
Day 2 | 99 | -6.6% | -9.9% | $ 9.82 | -9.9% | In line |
Cumulative | | -1.0% | -1.5% | | -1.8% | -0.3% |
As illustrated by this simple example, the effect of leverage can make it difficult to form expectations or judgments about fund performance given only the returns of the unleveraged index.
Because certain funds seek to track the performance of their benchmark on a daily basis, mathematical compounding, especially with respect to those funds that use leverage as part of their investment strategy, may prevent a fund from correlating with the monthly, quarterly, annual or other period performance of its benchmark. Due to the compounding of daily returns, leveraged and inverse funds’ returns over periods other than one day will likely differ in amount and possibly direction from the benchmark return for the same period. Investors should monitor their leveraged and inverse funds’ holdings to ensure that they are consistent with their strategies, as frequently as daily. For those funds that consistently apply leverage, the value of the fund’s shares will tend to increase or decrease more than the value of any increase or decrease in its benchmark index. For more on correlation, leverage and other risks, please read the prospectus.
In general, any change in direction in an index will produce compounding that seems to work against an investor. Were the index to move in the same direction (either up or down) for two or more periods in a row, the compounding of those returns would work in an investor’s favor, causing the fund to seemingly beat its benchmark.
As a general rule of thumb, more leverage in a fund will magnify the compounding effect, while less leverage will generally produce results that are more in line with expectations. In addition, periods of high volatility in an underlying index will also cause the effects of compounding to be more pronounced, while lower volatility will produce a more muted effect.
6 | THE RYDEX FUNDS ANNUAL REPORT | |
ABOUT SHAREHOLDERS’ FUND EXPENSES (Unaudited) | |
All mutual funds have operating expenses, and it is important for our shareholders to understand the impact of costs on their investments. Shareholders of a fund incur two types of costs: (i) transaction costs, including sales charges (loads) on purchase payments, reinvested dividends, other distributions, and exchange fees, and (ii) ongoing costs, including management fees, administrative services, and shareholder reports, among others. These ongoing costs, or operating expenses, are deducted from a fund’s gross income and reduce the investment return of the fund.
A fund’s expenses are expressed as a percentage of its average net assets, which is known as the expense ratio. The following examples are intended to help investors understand the ongoing costs (in dollars) of investing in a fund and to compare these costs with the ongoing costs of investing in other mutual funds.
The examples are based on an investment of $1,000 made at the beginning of the period and held for the entire six-month period beginning September 30, 2020 and ending March 31, 2021.
The following tables illustrate the Funds’ costs in two ways:
Table 1. Based on actual Fund return: This section helps investors estimate the actual expenses paid over the period. The “Ending Account Value” shown is derived from the Fund’s actual return, and the fifth column shows the dollar amount that would have been paid by an investor who started with $1,000 in the Fund. Investors may use the information here, together with the amount invested, to estimate the expenses paid over the period. Simply divide the Fund’s account value by $1,000 (for example, an $8,600 account value divided by $1,000 = 8.6), then multiply the result by the number provided under the heading “Expenses Paid During Period.”
Table 2. Based on hypothetical 5% return: This section is intended to help investors compare a fund’s cost with those of other mutual funds. The table provides information about hypothetical account values and hypothetical expenses based on the Fund’s actual expense ratio and an assumed rate of return of 5% per year before expenses, which is not the Fund’s actual return. The hypothetical account values and expenses may not be used to estimate the actual ending account balance or expenses paid during the period. The example is useful in making comparisons because the U.S. Securities and Exchange Commission (the “SEC”) requires all mutual funds to calculate expenses based on the 5% return. Investors can assess a fund’s costs by comparing this hypothetical example with the hypothetical examples that appear in shareholder reports of other funds.
The calculations illustrated above assume no shares were bought or sold during the period. Actual costs may have been higher or lower, depending on the amount of investment and the timing of any purchases or redemptions.
Please note that the expenses shown in the table are meant to highlight your ongoing costs only and do not reflect any transactional costs, such as sales charges (loads) on purchase payments, and contingent deferred sales charges (“CDSC”) on redemptions, if any. Therefore, the second table is useful in comparing ongoing costs only, and will not help you determine the relative total costs of owning different funds. In addition, if these transactional costs were included, your costs would have been higher.
More information about the Funds’ expenses, including annual expense ratios for periods up to five years (subject to the Fund’s inception date), can be found in the Financial Highlights section of this report. For additional information on operating expenses and other shareholder costs, please refer to the appropriate Fund prospectus.
| | THE RYDEX FUNDS ANNUAL REPORT | 7 |
ABOUT SHAREHOLDERS’ FUND EXPENSES (Unaudited)(continued) | |
| Expense
Ratio1 | Fund
Return | Beginning
Account Value
September 30, 2020 | Ending
Account Value
March 31, 2021 | Expenses
Paid During
Period2 |
Table 1. Based on actual Fund return3 | | | | | |
Long Short Equity Fund | | | | | |
A-Class | 1.71% | 18.88% | $ 1,000.00 | $ 1,188.80 | $ 9.33 |
C-Class | 2.46% | 18.39% | 1,000.00 | 1,183.90 | 13.39 |
P-Class | 1.71% | 18.82% | 1,000.00 | 1,188.20 | 9.33 |
Institutional Class | 1.46% | 19.03% | 1,000.00 | 1,190.30 | 7.97 |
Emerging Markets 2x Strategy Fund | | | | | |
A-Class | 1.81% | 39.60% | 1,000.00 | 1,396.00 | 10.81 |
C-Class | 2.55% | 39.07% | 1,000.00 | 1,390.70 | 15.20 |
H-Class | 1.79% | 39.58% | 1,000.00 | 1,395.80 | 10.69 |
Inverse Emerging Markets 2x Strategy Fund | | | | | |
A-Class | 1.95% | (39.38%) | 1,000.00 | 606.20 | 7.81 |
C-Class | 2.63% | (39.54%) | 1,000.00 | 604.60 | 10.52 |
H-Class | 1.79% | (38.47%) | 1,000.00 | 615.30 | 7.21 |
Emerging Markets Bond Strategy Fund | | | | | |
A-Class | 1.61% | (0.31%) | 1,000.00 | 996.90 | 8.02 |
C-Class | 2.36% | (0.68%) | 1,000.00 | 993.20 | 11.73 |
H-Class | 1.61% | (0.31%) | 1,000.00 | 996.90 | 8.02 |
8 | THE RYDEX FUNDS ANNUAL REPORT | |
ABOUT SHAREHOLDERS’ FUND EXPENSES (Unaudited)(concluded) | |
| Expense
Ratio1 | Fund
Return | Beginning
Account Value
September 30, 2020 | Ending
Account Value
March 31, 2021 | Expenses
Paid During
Period2 |
Table 2. Based on hypothetical 5% return (before expenses) | | | | |
Long Short Equity Fund | | | | | |
A-Class | 1.71% | 5.00% | $ 1,000.00 | $ 1,016.40 | $ 8.60 |
C-Class | 2.46% | 5.00% | 1,000.00 | 1,012.67 | 12.34 |
P-Class | 1.71% | 5.00% | 1,000.00 | 1,016.40 | 8.60 |
Institutional Class | 1.46% | 5.00% | 1,000.00 | 1,017.65 | 7.34 |
Emerging Markets 2x Strategy Fund | | | | | |
A-Class | 1.81% | 5.00% | 1,000.00 | 1,015.91 | 9.10 |
C-Class | 2.55% | 5.00% | 1,000.00 | 1,012.22 | 12.79 |
H-Class | 1.79% | 5.00% | 1,000.00 | 1,016.01 | 9.00 |
Inverse Emerging Markets 2x Strategy Fund | | | | | |
A-Class | 1.95% | 5.00% | 1,000.00 | 1,015.21 | 9.80 |
C-Class | 2.63% | 5.00% | 1,000.00 | 1,011.82 | 13.19 |
H-Class | 1.79% | 5.00% | 1,000.00 | 1,016.01 | 9.00 |
Emerging Markets Bond Strategy Fund | | | | | |
A-Class | 1.61% | 5.00% | 1,000.00 | 1,016.90 | 8.10 |
C-Class | 2.36% | 5.00% | 1,000.00 | 1,013.16 | 11.85 |
H-Class | 1.61% | 5.00% | 1,000.00 | 1,016.90 | 8.10 |
1 | Annualized and excludes expenses of the underlying funds in which the Funds invest, if any. |
2 | Expenses are equal to the Fund’s annualized expense ratio, net of any applicable fee waivers, multiplied by the average account value over the period, multiplied by 182/365 (to reflect the one-half year period). |
3 | Actual cumulative return at net asset value for the period September 30, 2020 to March 31, 2021. |
| | THE RYDEX FUNDS ANNUAL REPORT | 9 |
PERFORMANCE REPORT AND FUND PROFILE (Unaudited) | March 31, 2021 |
LONG SHORT EQUITY FUND
OBJECTIVE: Seeks long-term capital appreciation.
For the one-year period ended March 31, 2021, the Long Short Equity Fund P-Class returned 35.09%. The two benchmarks used by the Fund in the period, the Morningstar Long/Short Equity Category Average and the S&P 500 Index, returned 24.72% and 56.35%, respectively, for the same one-year period.
Investment Approach
The Fund is managed as an opportunistic long/short strategy, looking to invest in areas of the market where stock prices look priced at a discount vis-à-vis their company fundamentals and risks, while shorting areas of the market that look overpriced or are not compensating for risks appropriately. The strategy philosophy is founded in part on the academic view that markets are primarily efficient—investors require higher compensation for characteristics that increase the riskiness of future cash flows (such as being very small, or having lots of economic sensitivity in the business). Academics have noted that companies exhibiting certain risk factors have on average outperformed safer firms as the ‘risk premium’ leads to better performance. However, unlike most academic research in this field, the Fund’s strategy does not assume historic risk premia are constant. Investors’ perceptions of what is risky can change dramatically over time. Investors can harbor new fears about avoiding the companies that were vulnerable in the most recent economic crisis, or alternatively become over-excited about some new hot technology and completely forget about the risks involved.
The Fund’s strategy is to quantitatively compute what forward-looking compensation level is embedded in a large universe of stocks—and ascertain what broad risk factors are being overvalued or undervalued. The Fund’s portfolio is adaptive to changing market dynamics and aims to buy a highly diversified set of names with undervalued risk factors, and short a highly diversified set of stocks with overvalued characteristics.
The Fund will ordinarily hold simultaneous long and short positions in equity securities or securities markets that provide exposure up to a level equal to 200% of the Fund’s net assets for the long and up to 150% of the Fund’s net assets for the short positions. The Fund intends to maintain a hedged overall net exposure (the difference between the notional value of long positions and the notional value of short positions), typically varying between 0% and 80% net long, in order to maintain lower-than-market volatility and beta, and to seek to provide consistent return above an approximately 30% market weighted internal benchmark. The overall net exposure will change as market opportunities change and may, based on the Fund’s view of current market conditions, be outside this range.
Derivatives in the Fund are used to take short positions as well as long exposure above 100% of NAV (that is, to take leverage). The performance discussion below referencing short position performance would be entirely due to custom basket swap derivatives, and performance of long positions would be partially due to custom basket swap derivatives.
Performance Review
The year started at the depths of market uncertainty regarding the rapidly spreading COVID-19 pandemic and global shutdowns, and ended with a broad-based economic resurgence and strong stimulatory government backdrop. In between those extremes, the Fund navigated a host of rapidly evolving government, corporate, and economic cycles. This year, more than most, required both constant risk diligence, quick position rebalancing, as well as portfolio manager oversight of the quantitative approach in order to appropriately capture the benefits of never-before-seen governmental actions.
The COVID-19 pandemic halted global economies in quick fashion during March of 2020 and, as a result, market returns temporarily cratered in the worst showing since the 2008 Global Financial Crisis. Industries most impacted by global stay-at-home orders were hit the hardest, including airlines, hotels, cruise lines, and brick-and-mortar apparel retailers. Within the energy sector, on top of a big drop in oil demand due to shutdowns, a price war broke out between Russia and Saudi Arabia when they could not agree on the extent of OPEC supply cuts. This led to a collapse in oil prices and even a short stint of negative pricing in the oil futures market. Banks also suffered as investors foresaw big write-offs on loan books as a result of the impact of COVID-19 on company and individual borrowers.
Congress took unusually quick action, passing the CARES act, which provided direct payment to certain U.S. citizens, funding for extended unemployment, and small business relief to prevent layoffs. The Fed was also busy announcing an emergency rate cut with a zero lower bound, and massive quantitative easing and emergency lending facilities. These quick actions helped stabilize the markets and provided a backstop to
10 | THE RYDEX FUNDS ANNUAL REPORT | |
PERFORMANCE REPORT AND FUND PROFILE (Unaudited)(continued) | March 31, 2021 |
liquidity and credit flow, massively shrinking the “risk premium” across several fixed income asset classes. That low risk premium spilled into the stock market as investors were ready to invest at ever-higher valuations driven by low rates, low credit spreads, the promise of further stimulus, and positive news on COVID-19 vaccines.
The Presidential and Congressional election results led to a manic bullish environment to end the year. A strong emphasis on COVID-19 control and heavy stimulus on the Democratic platform fed the rally in many of the remaining beaten-down industries most impacted by the pandemic.
As 2021 began, interest rates rallied off their generational lows as the market anticipated a re-inflationary environment driven by demand shocks. While this was a bullish economic signal, and stocks broadly continued their advance in the first quarter, the biggest beneficiaries were cyclicals and higher cash flow names. For the first time in years, high growth but less profitable names began to underperform as the discount rates on far distant cash flows began to rise.
The broad market (S&P 500 Index) surged 56.35% off the March 31, 2020 starting point for the fiscal year. Riskier corners of the market achieved even more astounding rebounds. The Russell 2000 small cap benchmark for example notched a 94.8% return for the fiscal year.
At period end, the Fund held about 143% of assets in long securities, and 69% short, for a net-dollar exposure of 74%. The net exposure averaged 73% during the year (ranging between a low of 60% at the start of the fiscal year and a high of 78% in the months right before the election). The realized net beta (sensitivity of daily Fund returns to the S&P 500 index) averaged around 0.60 during the year. The beta is lower than the net dollar exposure because the shorts exhibit higher beta versus the market than the more-defensive long positions.
Fund long positions (on a standalone unlevered basis) averaged a return of 58.9% for the year, while short positions returned 62.6% on a standalone basis. Although standalone returns for long positions was lower than the short positions, the Fund ended with a positive return for the year as the total weight invested in long positions was at the high range of historic net exposure for much of the strong recovery portion of the year.
Compared to our internal benchmark of 30% S&P 500 Index and 70% cash—the Fund positions outperformed by a strong +22.1% excess return. Relative to that blended benchmark, the Fund’s net long bias added most of the excess return. Sector positioning had a positive impact of about +3.1%, with key contributors being a net long in Consumer Discretionary while those names had strong recoveries, as well as a net short in Energy which was one of the few higher-beta sectors that underperformed (at least for most of the fiscal year). The Fund’s fundamental style tilts detracted by about -2%. The Fund’s tilts towards value and high free cash flowing companies began to outperform at the tail end of the year; however, net long positions in higher-profitable companies and larger size firms caused more drag as the risk-on trade firmly set in. Stock selection–after controlling for the style and sector tilts described above–was about flat for the full year.
The portfolio managers kept a close eye on the ‘COVID-19 risk’ inherent in certain narrow industries that most directly suffered or benefited from the pandemic. This was a strong but transient factor that explained so many stock moves this year. It was more difficult for traditional quant techniques to identify due to the uniqueness of the risk factor and lack of historic precedent. Our goal this past year was to understand the risks of both shutdowns and re-openings, and make sure the portfolio was not inadvertently exposed to this unpredictable risk. This approach had a positive impact on the Fund profits and losses and risk control as we were able to quickly rebalance out of winning positions (both long and short) that overreacted to pandemic news and were likely to have massive volatility on the recovery.
Positioning
The Fund maintains its style bias towards less expensive valuation names, while maintaining a quality bias, including higher free cash flow names and stronger profitability bias. However, due to the quite-expensive valuations afforded high growth names, we remain net short growth.
From an industry perspective, the Fund remains net long several defensive sectors with relatively well-priced stocks, including Healthcare, Staples, and Utilities. After being short the Financials sector for a few years, the Fund has closed that out and now remains close to neutral in that sector. The largest net short exposures currently are Materials and Real Estate.
Looking forward, we are starting to see some positive indicators for our valuation disciplined approach. The Democratic presidential and Congressional victories will likely lead to some stock market positives (bigger stimulus, more traditional international dealings) as well as some corporate negatives (higher corporate taxes, more regulations on certain industries). The interest rate markets have started pricing this in with higher yields and a steeper yield curve. These developments have spurred a long-awaited recovery in ‘Value Stocks’. These are generally the
| | THE RYDEX FUNDS ANNUAL REPORT | 11 |
PERFORMANCE REPORT AND FUND PROFILE (Unaudited)(continued) | March 31, 2021 |
companies that deliver strong earnings increases during robust economic environments. Meanwhile, strong secular growth companies within each industry have had solid fundamentals in recent years, but their prices have already incorporated much of the longer-term growth. As long-term rates rise, the discounting of far-off profitability will impact the valuation of those long duration profit streams. The Fund’s style positioning would likely benefit from a steady return to economic growth, higher interest rates, and some of the extreme valuation disparities starting to converge.
Performance displayed represents past performance, which is no guarantee of future results.
Holdings Diversification (Market Exposure as % of Net Assets)

“Holdings Diversification (Market Exposure as % of Net Assets)” excludes any temporary cash investments.
Inception Dates: |
Institutional Class | November 30, 2011 |
A-Class | March 31, 2004 |
C-Class | March 22, 2002 |
P-Class | March 22, 2002 |
Ten Largest Holdings (% of Total Net Assets) |
Apple, Inc. | 1.2% |
Verizon Communications, Inc. | 1.1% |
International Business Machines Corp. | 1.1% |
Microsoft Corp. | 1.1% |
Johnson & Johnson | 1.1% |
McKesson Corp. | 1.1% |
Cisco Systems, Inc. | 1.1% |
SS&C Technologies Holdings, Inc. | 1.0% |
Molson Coors Beverage Co. — Class B | 1.0% |
MetLife, Inc. | 1.0% |
Top Ten Total | 10.8% |
| | |
“Ten Largest Holdings” excludes any temporary cash or derivative investments. |
12 | THE RYDEX FUNDS ANNUAL REPORT | |
PERFORMANCE REPORT AND FUND PROFILE (Unaudited)(concluded) | March 31, 2021 |
Cumulative Fund Performance*
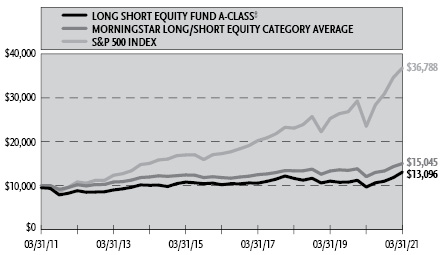
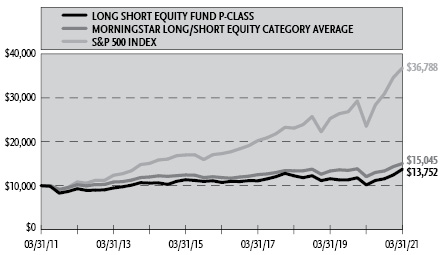
Average Annual Returns*
Periods Ended March 31, 2021
| 1 Year | 5 Year | 10 Year |
A-Class Shares | 35.04% | 5.09% | 3.23% |
A-Class Shares with sales charge‡ | 28.67% | 4.07% | 2.73% |
C-Class Shares | 34.06% | 4.31% | 2.47% |
C-Class Shares with CDSC§ | 33.06% | 4.31% | 2.47% |
P-Class Shares | 35.09% | 5.09% | 3.24% |
Morningstar Long/Short Equity Category Average** | 24.72% | 4.90% | 4.17% |
S&P 500 Index** | 56.35% | 16.29% | 13.91% |
| 1 Year | 5 Year | Since
Inception
(11/30/11) |
Institutional Class Shares | 35.47% | 5.38% | 5.36% |
Morningstar Long/Short Equity Category Average** | 24.72% | 4.90% | 4.96% |
S&P 500 Index** | 56.35% | 16.29% | 15.55% |
* | The performance data above represents past performance that is not predictive of future results. The investment return and principal value of an investment in the Fund will fluctuate so that an investor’s shares, when redeemed, may be worth more or less than their original cost. Returns are historical and include changes in principal and reinvested dividends and capital gains and do not reflect the effect of taxes. The Morningstar Long/Short Equity Category Average and S&P 500 Index are unmanaged indices and, unlike the Fund, have no management fees or operating expenses to reduce their reported returns. The Morningstar Long/Short Equity Category Average is the equal-weighted, simple average daily return for all funds in the Morningstar Long/Short Equity Category. The graphs are based on A-Class shares and P-Class shares only; performance for C-Class shares and Institutional Class shares will vary due to differences in fee structure. |
** | Effective May 31, 2017, the Fund changed its principal investment strategy. As a result of the investment strategy change, the Fund’s new benchmarks are the Morningstar Long/Short Equity Category Average and S&P 500 Index. Prior to May 31, 2017, the Fund’s benchmark was the HFRX Equity Hedge Index and Russell 3000 Index. |
‡ | Fund returns are calculated using the maximum sales charge of 4.75%. |
§ | Fund returns include a CDSC of 1% if redeemed within 12 months of purchase. |
| | THE RYDEX FUNDS ANNUAL REPORT | 13 |
SCHEDULE OF INVESTMENTS | March 31, 2021 |
LONG SHORT EQUITY FUND | |
| | Shares | | | Value | |
COMMON STOCKS† - 100.1% |
| | | | | | | | | |
Consumer, Non-cyclical - 31.0% |
Johnson & Johnson1 | | | 1,120 | | | $ | 184,072 | |
McKesson Corp.1 | | | 926 | | | | 180,607 | |
Molson Coors Beverage Co. — Class B*,1 | | | 3,385 | | | | 173,143 | |
Amgen, Inc.1 | | | 687 | | | | 170,932 | |
Merck & Company, Inc.1 | | | 2,190 | | | | 168,827 | |
Procter & Gamble Co.1 | | | 1,212 | | | | 164,141 | |
Bristol-Myers Squibb Co. | | | 2,591 | | | | 163,570 | |
Philip Morris International, Inc.1 | | | 1,761 | | | | 156,271 | |
General Mills, Inc.1 | | | 2,521 | | | | 154,588 | |
Altria Group, Inc.1 | | | 3,008 | | | | 153,889 | |
J M Smucker Co.1 | | | 1,184 | | | | 149,812 | |
Colgate-Palmolive Co. | | | 1,842 | | | | 145,205 | |
Humana, Inc. | | | 324 | | | | 135,837 | |
Conagra Brands, Inc. | | | 3,372 | | | | 126,787 | |
Cardinal Health, Inc. | | | 2,062 | | | | 125,266 | |
Kimberly-Clark Corp.1 | | | 880 | | | | 122,364 | |
Campbell Soup Co.1 | | | 2,428 | | | | 122,056 | |
Kraft Heinz Co. | | | 3,049 | | | | 121,960 | |
Kellogg Co. | | | 1,863 | | | | 117,928 | |
United Rentals, Inc.* | | | 348 | | | | 114,600 | |
Pfizer, Inc.1 | | | 2,995 | | | | 108,509 | |
Gilead Sciences, Inc.1 | | | 1,628 | | | | 105,218 | |
United Therapeutics Corp.* | | | 542 | | | | 90,660 | |
Tyson Foods, Inc. — Class A | | | 1,090 | | | | 80,987 | |
Coca-Cola Co. | | | 1,530 | | | | 80,646 | |
Quanta Services, Inc. | | | 902 | | | | 79,358 | |
Ingredion, Inc.1 | | | 795 | | | | 71,486 | |
Regeneron Pharmaceuticals, Inc.* | | | 150 | | | | 70,971 | |
Kroger Co. | | | 1,959 | | | | 70,504 | |
DaVita, Inc.* | | | 654 | | | | 70,481 | |
Cigna Corp. | | | 289 | | | | 69,863 | |
John B Sanfilippo & Son, Inc. | | | 761 | | | | 68,772 | |
Sprouts Farmers Market, Inc.* | | | 2,461 | | | | 65,512 | |
H&R Block, Inc. | | | 2,977 | | | | 64,898 | |
Quest Diagnostics, Inc. | | | 501 | | | | 64,298 | |
Post Holdings, Inc.* | | | 576 | | | | 60,895 | |
Abbott Laboratories | | | 467 | | | | 55,965 | |
Incyte Corp.* | | | 686 | | | | 55,751 | |
Vector Group Ltd. | | | 3,989 | | | | 55,647 | |
CVS Health Corp.1 | | | 734 | | | | 55,219 | |
Laboratory Corporation of America Holdings* | | | 211 | | | | 53,811 | |
Hologic, Inc.* | | | 699 | | | | 51,992 | |
Becton Dickinson and Co. | | | 207 | | | | 50,332 | |
Medtronic plc | | | 389 | | | | 45,952 | |
Hershey Co. | | | 284 | | | | 44,917 | |
Hill-Rom Holdings, Inc. | | | 394 | | | | 43,529 | |
Ionis Pharmaceuticals, Inc.* | | | 957 | | | | 43,027 | |
UnitedHealth Group, Inc. | | | 109 | | | | 40,556 | |
Innoviva, Inc.* | | | 3,389 | | | | 40,499 | |
Constellation Brands, Inc. — Class A | | | 166 | | | | 37,848 | |
FleetCor Technologies, Inc.* | | | 137 | | | | 36,802 | |
Anthem, Inc. | | | 101 | | | | 36,254 | |
Prestige Consumer Healthcare, Inc.* | | | 820 | | | | 36,146 | |
PepsiCo, Inc.1 | | | 250 | | | | 35,363 | |
PayPal Holdings, Inc.* | | | 139 | | | | 33,755 | |
Perrigo Company plc | | | 830 | | | | 33,590 | |
AbbVie, Inc. | | | 310 | | | | 33,548 | |
Thermo Fisher Scientific, Inc.1 | | | 73 | | | | 33,316 | |
Encompass Health Corp. | | | 403 | | | | 33,006 | |
USANA Health Sciences, Inc.* | | | 334 | | | | 32,598 | |
Boston Scientific Corp.* | | | 838 | | | | 32,389 | |
Mondelez International, Inc. — Class A | | | 399 | | | | 23,353 | |
Danaher Corp. | | | 103 | | | | 23,183 | |
Eli Lilly & Co.1 | | | 107 | | | | 19,990 | |
Total Consumer, Non-cyclical | | | | | | | 5,293,251 | |
| | | | | | | | | |
Industrial - 15.9% |
General Dynamics Corp. | | | 927 | | | | 168,306 | |
Parker-Hannifin Corp. | | | 398 | | | | 125,541 | |
3M Co. | | | 635 | | | | 122,352 | |
Lockheed Martin Corp. | | | 324 | | | | 119,718 | |
Vishay Intertechnology, Inc. | | | 4,511 | | | | 108,625 | |
Acuity Brands, Inc. | | | 627 | | | | 103,455 | |
Union Pacific Corp.1 | | | 415 | | | | 91,470 | |
Trane Technologies plc | | | 538 | | | | 89,071 | |
Oshkosh Corp. | | | 714 | | | | 84,723 | |
Caterpillar, Inc.1 | | | 360 | | | | 83,473 | |
Arrow Electronics, Inc.* | | | 742 | | | | 82,229 | |
Owens Corning | | | 863 | | | | 79,474 | |
CSX Corp. | | | 817 | | | | 78,775 | |
Masco Corp. | | | 1,311 | | | | 78,529 | |
Fortive Corp. | | | 1,049 | | | | 74,101 | |
Agilent Technologies, Inc. | | | 572 | | | | 72,724 | |
Northrop Grumman Corp. | | | 216 | | | | 69,906 | |
Snap-on, Inc.1 | | | 294 | | | | 67,838 | |
Hubbell, Inc. | | | 362 | | | | 67,654 | |
AGCO Corp. | | | 465 | | | | 66,797 | |
Norfolk Southern Corp. | | | 245 | | | | 65,787 | |
Timken Co. | | | 768 | | | | 62,339 | |
Eaton Corporation plc | | | 442 | | | | 61,120 | |
Westinghouse Air Brake Technologies Corp. | | | 683 | | | | 54,067 | |
Energizer Holdings, Inc. | | | 1,111 | | | | 52,728 | |
TE Connectivity Ltd. | | | 396 | | | | 51,128 | |
Lennox International, Inc. | | | 150 | | | | 46,738 | |
Sanmina Corp.* | | | 1,123 | | | | 46,470 | |
Waters Corp.* | | | 163 | | | | 46,320 | |
Lincoln Electric Holdings, Inc.1 | | | 368 | | | | 45,242 | |
Mettler-Toledo International, Inc.* | | | 38 | | | | 43,916 | |
Hillenbrand, Inc. | | | 892 | | | | 42,557 | |
AECOM* | | | 657 | | | | 42,120 | |
Donaldson Company, Inc. | | | 680 | | | | 39,549 | |
O-I Glass, Inc.* | | | 2,637 | | | | 38,869 | |
Deere & Co. | | | 93 | | | | 34,795 | |
Berry Global Group, Inc.* | | | 552 | | | | 33,893 | |
Westrock Co. | | | 635 | | | | 33,052 | |
Honeywell International, Inc. | | | 106 | | | | 23,009 | |
United Parcel Service, Inc. — Class B | | | 135 | | | | 22,949 | |
Total Industrial | | | | | | | 2,721,409 | |
| | | | | | | | | |
14 | THE RYDEX FUNDS ANNUAL REPORT | SEE NOTES TO FINANCIAL STATEMENTS. |
SCHEDULE OF INVESTMENTS (continued) | March 31, 2021 |
LONG SHORT EQUITY FUND | |
| | Shares | | | Value | |
Technology - 13.8% |
Apple, Inc.1 | | | 1,610 | | | $ | 196,661 | |
International Business Machines Corp.1 | | | 1,413 | | | | 188,296 | |
Microsoft Corp.1 | | | 798 | | | | 188,144 | |
SS&C Technologies Holdings, Inc.1 | | | 2,494 | | | | 174,256 | |
Seagate Technology plc | | | 1,547 | | | | 118,732 | |
Cerner Corp.1 | | | 1,537 | | | | 110,480 | |
Intel Corp.1 | | | 1,458 | | | | 93,312 | |
Dell Technologies, Inc. — Class C* | | | 1,022 | | | | 90,089 | |
HP, Inc. | | | 2,506 | | | | 79,566 | |
CDK Global, Inc. | | | 1,456 | | | | 78,711 | |
Kulicke & Soffa Industries, Inc. | | | 1,406 | | | | 69,049 | |
Texas Instruments, Inc. | | | 333 | | | | 62,934 | |
Dropbox, Inc. — Class A* | | | 2,265 | | | | 60,385 | |
Oracle Corp.1 | | | 860 | | | | 60,346 | |
NetApp, Inc. | | | 818 | | | | 59,444 | |
Cognizant Technology Solutions Corp. — Class A | | | 726 | | | | 56,715 | |
Qorvo, Inc.* | | | 304 | | | | 55,541 | |
Accenture plc — Class A | | | 198 | | | | 54,698 | |
KLA Corp. | | | 154 | | | | 50,881 | |
Fiserv, Inc.* | | | 423 | | | | 50,354 | |
Bandwidth, Inc. — Class A* | | | 395 | | | | 50,062 | |
Cirrus Logic, Inc.* | | | 582 | | | | 49,348 | |
VMware, Inc. — Class A*,2 | | | 326 | | | | 49,047 | |
Paychex, Inc. | | | 426 | | | | 41,757 | |
Microchip Technology, Inc. | | | 254 | | | | 39,426 | |
NVIDIA Corp. | | | 72 | | | | 38,443 | |
CSG Systems International, Inc. | | | 829 | | | | 37,214 | |
Skyworks Solutions, Inc. | | | 197 | | | | 36,145 | |
Broadcom, Inc. | | | 76 | | | | 35,238 | |
Western Digital Corp. | | | 526 | | | | 35,111 | |
Adobe, Inc.* | | | 50 | | | | 23,768 | |
QUALCOMM, Inc. | | | 175 | | | | 23,203 | |
Total Technology | | | | | | | 2,357,356 | |
| | | | | | | | | |
Utilities - 11.5% |
Evergy, Inc. | | | 2,607 | | | | 155,195 | |
PPL Corp.1 | | | 5,357 | | | | 154,496 | |
Public Service Enterprise Group, Inc.1 | | | 2,558 | | | | 154,017 | |
Southern Co.1 | | | 2,354 | | | | 146,325 | |
Duke Energy Corp. | | | 1,417 | | | | 136,783 | |
UGI Corp. | | | 3,103 | | | | 127,254 | |
Exelon Corp.1 | | | 2,814 | | | | 123,084 | |
IDACORP, Inc. | | | 1,178 | | | | 117,765 | |
Consolidated Edison, Inc. | | | 1,540 | | | | 115,192 | |
NiSource, Inc. | | | 4,524 | | | | 109,074 | |
ONE Gas, Inc. | | | 1,384 | | | | 106,443 | |
OGE Energy Corp. | | | 3,061 | | | | 99,054 | |
Pinnacle West Capital Corp. | | | 1,049 | | | | 85,336 | |
Southwest Gas Holdings, Inc. | | | 1,200 | | | | 82,452 | |
DTE Energy Co. | | | 551 | | | | 73,360 | |
CenterPoint Energy, Inc. | | | 3,123 | | | | 70,736 | |
Sempra Energy | | | 329 | | | | 43,619 | |
AES Corp. | | | 1,214 | | | | 32,547 | |
NextEra Energy, Inc. | | | 300 | | | | 22,683 | |
Dominion Energy, Inc. | | | 105 | | | | 7,976 | |
Total Utilities | | | | | | | 1,963,391 | |
| | | | | | | | | |
Communications - 11.1% |
Verizon Communications, Inc.1 | | | 3,347 | | | | 194,628 | |
Cisco Systems, Inc.1 | | | 3,469 | | | | 179,382 | |
Amazon.com, Inc.*,1 | | | 46 | | | | 142,328 | |
Viavi Solutions, Inc.*,1 | | | 8,322 | | | | 130,655 | |
Alphabet, Inc. — Class C*,1 | | | 63 | | | | 130,324 | |
Facebook, Inc. — Class A*,1 | | | 424 | | | | 124,881 | |
Juniper Networks, Inc. | | | 3,998 | | | | 101,269 | |
T-Mobile US, Inc.* | | | 714 | | | | 89,457 | |
AT&T, Inc.1 | | | 2,938 | | | | 88,933 | |
VeriSign, Inc.* | | | 435 | | | | 86,460 | |
Charter Communications, Inc. — Class A* | | | 138 | | | | 85,149 | |
Ciena Corp.* | | | 1,409 | | | | 77,101 | |
Cogent Communications Holdings, Inc. | | | 930 | | | | 63,947 | |
Sirius XM Holdings, Inc.2 | | | 10,404 | | | | 63,360 | |
Omnicom Group, Inc.1 | | | 854 | | | | 63,324 | |
Motorola Solutions, Inc. | | | 325 | | | | 61,116 | |
InterDigital, Inc. | | | 797 | | | | 50,570 | |
Vonage Holdings Corp.* | | | 3,990 | | | | 47,162 | |
Walt Disney Co.* | | | 225 | | | | 41,517 | |
Comcast Corp. — Class A1 | | | 647 | | | | 35,009 | |
Netflix, Inc.* | | | 43 | | | | 22,431 | |
Discovery, Inc. — Class A* | | | 303 | | | | 13,169 | |
Total Communications | | | | | | | 1,892,172 | |
| | | | | | | | | |
Consumer, Cyclical - 9.0% |
Gentex Corp.1 | | | 3,176 | | | | 113,288 | |
AutoZone, Inc.* | | | 80 | | | | 112,344 | |
Genuine Parts Co. | | | 948 | | | | 109,579 | |
Allison Transmission Holdings, Inc.1 | | | 2,541 | | | | 103,749 | |
Gentherm, Inc.* | | | 1,360 | | | | 100,790 | |
Best Buy Company, Inc.1 | | | 836 | | | | 95,981 | |
Lowe’s Companies, Inc. | | | 486 | | | | 92,428 | |
AutoNation, Inc.* | | | 965 | | | | 89,957 | |
Cummins, Inc.1 | | | 304 | | | | 78,769 | |
Lear Corp.1 | | | 425 | | | | 77,031 | |
MSC Industrial Direct Company, Inc. — Class A | | | 783 | | | | 70,619 | |
PACCAR, Inc. | | | 731 | | | | 67,924 | |
O’Reilly Automotive, Inc.* | | | 123 | | | | 62,392 | |
Lennar Corp. — Class A | | | 604 | | | | 61,143 | |
PulteGroup, Inc. | | | 1,062 | | | | 55,691 | |
Brunswick Corp. | | | 526 | | | | 50,165 | |
Home Depot, Inc.1 | | | 125 | | | | 38,156 | |
Dolby Laboratories, Inc. — Class A | | | 372 | | | | 36,724 | |
McDonald’s Corp. | | | 160 | | | | 35,862 | |
Walmart, Inc. | | | 259 | | | | 35,180 | |
Costco Wholesale Corp. | | | 70 | | | | 24,674 | |
Tesla, Inc.* | | | 34 | | | | 22,710 | |
Total Consumer, Cyclical | | | | | | | 1,535,156 | |
| | | | | | | | | |
SEE NOTES TO FINANCIAL STATEMENTS. | THE RYDEX FUNDS ANNUAL REPORT | 15 |
SCHEDULE OF INVESTMENTS (continued) | March 31, 2021 |
LONG SHORT EQUITY FUND | |
| | Shares | | | Value | |
Financial - 7.6% |
MetLife, Inc. | | | 2,826 | | | $ | 171,792 | |
Berkshire Hathaway, Inc. — Class B*,1 | | | 521 | | | | 133,100 | |
Allstate Corp.1 | | | 993 | | | | 114,096 | |
Highwoods Properties, Inc. REIT | | | 2,652 | | | | 113,877 | |
Travelers Companies, Inc. | | | 596 | | | | 89,638 | |
Prudential Financial, Inc. | | | 937 | | | | 85,361 | |
Aflac, Inc. | | | 1,381 | | | | 70,680 | |
Brandywine Realty Trust REIT | | | 5,451 | | | | 70,372 | |
Hartford Financial Services Group, Inc. | | | 850 | | | | 56,771 | |
JPMorgan Chase & Co. | | | 363 | | | | 55,260 | |
Synchrony Financial | | | 1,306 | | | | 53,102 | |
Western Union Co. | | | 1,726 | | | | 42,563 | |
Mastercard, Inc. — Class A | | | 102 | | | | 36,317 | |
Bank of America Corp. | | | 905 | | | | 35,014 | |
Wells Fargo & Co. | | | 865 | | | | 33,796 | |
Sabra Health Care REIT, Inc. | | | 1,881 | | | | 32,654 | |
Visa, Inc. — Class A | | | 150 | | | | 31,759 | |
BlackRock, Inc. — Class A | | | 31 | | | | 23,373 | |
Citigroup, Inc. | | | 308 | | | | 22,407 | |
American Express Co. | | | 152 | | | | 21,499 | |
Total Financial | | | | | | | 1,293,431 | |
| | | | | | | | | |
Basic Materials - 0.2% |
International Paper Co. | | | 600 | | | | 32,442 | |
| | | | | | | | | |
Total Common Stocks | | | | |
(Cost $14,136,506) | | | | | | | 17,088,608 | |
| | | | | | | | | |
MONEY MARKET FUND† - 2.4% |
Invesco Short-Term Investments Trust Treasury Obligations Portfolio Institutional Class, 0.01%3 | | | 417,373 | | | | 417,373 | |
Total Money Market Fund | | | | |
(Cost $417,373) | | | | | | | 417,373 | |
| | | | | | | | | |
SECURITIES LENDING COLLATERAL†,4 - 0.5% |
Money Market Fund | | | | | | | | |
First American Government Obligations Fund — Class Z, 0.03%3 | | | 86,162 | | | | 86,162 | |
Total Securities Lending Collateral | | | | |
(Cost $86,162) | | | | | | | 86,162 | |
| | | | | | | | | |
Total Investments - 103.0% | | | | |
(Cost $14,640,041) | | $ | 17,592,143 | |
Other Assets & Liabilities, net - (3.0)% | | | (508,423 | ) |
Total Net Assets - 100.0% | | $ | 17,083,720 | |
Custom Basket Swap Agreements |
Counterparty | Reference Obligation | Financing
Rate Pay
(Receive) | Payment
Frequency | | Maturity
Date | | | Notional
Amount | | | Value and
Unrealized
Appreciation
(Depreciation) | |
OTC Custom Basket Swap Agreements†† |
Morgan Stanley Capital Services LLC | MS Equity Custom Basket | 0.47% (Federal Funds Rate + 0.40%) | At Maturity | 03/27/24 | | $ | 4,076,680 | | | $ | 594,342 | |
Goldman Sachs International | GS Equity Custom Basket | 0.52% (Federal Funds Rate + 0.45%) | At Maturity | 05/06/24 | | | 4,074,100 | | | | 592,177 | |
| | | | | | | | | | $ | 8,150,780 | | | $ | 1,186,519 | |
OTC Custom Basket Swap Agreements Sold Short†† |
Goldman Sachs International | GS Equity Custom Basket | (0.13%) (Federal Funds Rate - 0.20%) | At Maturity | 05/06/24 | | $ | 5,845,698 | | | $ | (701,874 | ) |
Morgan Stanley Capital Services LLC | MS Equity Custom Basket | (0.23%) (Federal Funds Rate - 0.30%) | At Maturity | 03/27/24 | | | 5,805,752 | | | | (716,647 | ) |
| | | | | | | | | | $ | 11,651,450 | | | $ | (1,418,521 | ) |
16 | THE RYDEX FUNDS ANNUAL REPORT | SEE NOTES TO FINANCIAL STATEMENTS. |
SCHEDULE OF INVESTMENTS (continued) | March 31, 2021 |
LONG SHORT EQUITY FUND | |
| | Shares | | | Percentage
Notional
Amount | | | Value and
Unrealized
Appreciation
(Depreciation) | |
MS EQUITY LONG CUSTOM BASKET | | | | | | | | |
Utilities | | | | | | | | | | | | |
UGI Corp. | | | 738 | | | | 0.75 | % | | $ | 3,938 | |
Southern Co. | | | 560 | | | | 0.85 | % | | | 2,997 | |
Public Service Enterprise Group, Inc. | | | 608 | | | | 0.90 | % | | | 2,792 | |
CenterPoint Energy, Inc. | | | 743 | | | | 0.41 | % | | | 2,186 | |
IDACORP, Inc. | | | 280 | | | | 0.69 | % | | | 2,167 | |
Exelon Corp. | | | 669 | | | | 0.72 | % | | | 1,968 | |
Evergy, Inc. | | | 620 | | | | 0.91 | % | | | 1,730 | |
DTE Energy Co. | | | 131 | | | | 0.43 | % | | | 1,135 | |
Pinnacle West Capital Corp. | | | 249 | | | | 0.50 | % | | | 888 | |
NiSource, Inc. | | | 1,076 | | | | 0.64 | % | | | 742 | |
Sempra Energy | | | 78 | | | | 0.25 | % | | | 731 | |
OGE Energy Corp. | | | 728 | | | | 0.58 | % | | | 713 | |
Duke Energy Corp. | | | 337 | | | | 0.80 | % | | | 649 | |
Consolidated Edison, Inc. | | | 366 | | | | 0.67 | % | | | 517 | |
ONE Gas, Inc. | | | 329 | | | | 0.62 | % | | | 175 | |
NextEra Energy, Inc. | | | 71 | | | | 0.13 | % | | | 74 | |
Dominion Energy, Inc. | | | 25 | | | | 0.05 | % | | | 74 | |
AES Corp. | | | 288 | | | | 0.19 | % | | | (253 | ) |
Southwest Gas Holdings, Inc. | | | 285 | | | | 0.48 | % | | | (354 | ) |
PPL Corp. | | | 1,275 | | | | 0.90 | % | | | (359 | ) |
Total Utilities | | | | | | | | | | | 22,510 | |
| | | | | | | | | | | | | |
Industrial | | | | | | | | | | | | |
Caterpillar, Inc. | | | 85 | | | | 0.50 | % | | | 9,146 | |
AGCO Corp. | | | 110 | | | | 0.39 | % | | | 8,479 | |
Acuity Brands, Inc. | | | 149 | | | | 0.60 | % | | | 8,122 | |
Snap-on, Inc. | | | 70 | | | | 0.40 | % | | | 7,961 | |
Vishay Intertechnology, Inc. | | | 1,073 | | | | 0.63 | % | | | 7,528 | |
Oshkosh Corp. | | | 170 | | | | 0.49 | % | | | 7,147 | |
Owens Corning | | | 205 | | | | 0.46 | % | | | 6,960 | |
TE Connectivity Ltd. | | | 94 | | | | 0.30 | % | | | 5,834 | |
General Dynamics Corp. | | | 220 | | | | 0.98 | % | | | 5,410 | |
Timken Co. | | | 182 | | | | 0.36 | % | | | 4,831 | |
Arrow Electronics, Inc. | | | 176 | | | | 0.48 | % | | | 4,660 | |
Hubbell, Inc. | | | 86 | | | | 0.39 | % | | | 4,516 | |
3M Co. | | | 151 | | | | 0.71 | % | | | 3,924 | |
Eaton Corporation plc | | | 105 | | | | 0.36 | % | | | 3,517 | |
Lincoln Electric Holdings, Inc. | | | 87 | | | | 0.26 | % | | | 3,504 | |
Waters Corp. | | | 38 | | | | 0.26 | % | | | 3,307 | |
Trane Technologies plc | | | 128 | | | | 0.52 | % | | | 2,707 | |
Union Pacific Corp. | | | 98 | | | | 0.53 | % | | | 1,882 | |
Parker-Hannifin Corp. | | | 94 | | | | 0.73 | % | | | 1,583 | |
Energizer Holdings, Inc. | | | 264 | | | | 0.31 | % | | | 1,447 | |
Masco Corp. | | | 312 | | | | 0.46 | % | | | 1,286 | |
Lennox International, Inc. | | | 35 | | | | 0.27 | % | | | 1,242 | |
Northrop Grumman Corp. | | | 51 | | | | 0.40 | % | | | 1,196 | |
O-I Glass, Inc. | | | 627 | | | | 0.23 | % | | | 1,184 | |
Berry Global Group, Inc. | | | 131 | | | | 0.20 | % | | | 927 | |
Agilent Technologies, Inc. | | | 136 | | | | 0.42 | % | | | 883 | |
Mettler-Toledo International, Inc. | | | 9 | | | | 0.26 | % | | | 879 | |
Westinghouse Air Brake Technologies Corp. | | | 162 | | | | 0.31 | % | | | 841 | |
AECOM | | | 156 | | | | 0.25 | % | | | 701 | |
Westrock Co. | | | 151 | | | | 0.19 | % | | | 655 | |
CSX Corp. | | | 194 | | | | 0.46 | % | | | 600 | |
Sanmina Corp. | | | 267 | | | | 0.27 | % | | | 477 | |
Deere & Co. | | | 22 | | | | 0.20 | % | | | 438 | |
United Parcel Service, Inc. — Class B | | | 32 | | | | 0.13 | % | | | 381 | |
Norfolk Southern Corp. | | | 58 | | | | 0.38 | % | | | 354 | |
Honeywell International, Inc. | | | 25 | | | | 0.13 | % | | | 241 | |
Lockheed Martin Corp. | | | 77 | | | | 0.70 | % | | | 126 | |
Fortive Corp. | | | 249 | | | | 0.43 | % | | | 119 | |
Donaldson Company, Inc. | | | 161 | | | | 0.23 | % | | | (198 | ) |
Hillenbrand, Inc. | | | 212 | | | | 0.25 | % | | | (514 | ) |
Total Industrial | | | | | | | | | | | 114,283 | |
| | | | | | | | | | | | | |
Consumer, Non-cyclical | | | | | | | | | | | | |
United Rentals, Inc. | | | 83 | | | | 0.68 | % | | | 14,649 | |
McKesson Corp. | | | 220 | | | | 1.05 | % | | | 12,241 | |
Quanta Services, Inc. | | | 214 | | | | 0.46 | % | | | 7,645 | |
Molson Coors Beverage Co. — Class B | | | 805 | | | | 1.01 | % | | | 7,553 | |
Amgen, Inc. | | | 163 | | | | 0.99 | % | | | 6,985 | |
Cardinal Health, Inc. | | | 451 | | | | 0.67 | % | | | 6,703 | |
Johnson & Johnson | | | 266 | | | | 1.07 | % | | | 6,557 | |
Altria Group, Inc. | | | 715 | | | | 0.90 | % | | | 6,457 | |
United Therapeutics Corp. | | | 129 | | | | 0.53 | % | | | 5,888 | |
Kraft Heinz Co. | | | 725 | | | | 0.71 | % | | | 5,703 | |
Procter & Gamble Co. | | | 288 | | | | 0.96 | % | | | 5,268 | |
J M Smucker Co. | | | 282 | | | | 0.88 | % | | | 4,512 | |
Cigna Corp. | | | 68 | | | | 0.40 | % | | | 3,402 | |
H&R Block, Inc. | | | 708 | | | | 0.38 | % | | | 3,300 | |
Philip Morris International, Inc. | | | 419 | | | | 0.91 | % | | | 3,281 | |
DaVita, Inc. | | | 155 | | | | 0.41 | % | | | 3,150 | |
CVS Health Corp. | | | 174 | | | | 0.32 | % | | | 2,992 | |
Sprouts Farmers Market, Inc. | | | 585 | | | | 0.38 | % | | | 2,824 | |
Laboratory Corporation of America Holdings | | | 50 | | | | 0.31 | % | | | 2,788 | |
Tyson Foods, Inc. — Class A | | | 259 | | | | 0.47 | % | | | 2,626 | |
Anthem, Inc. | | | 24 | | | | 0.21 | % | | | 2,603 | |
Abbott Laboratories | | | 111 | | | | 0.33 | % | | | 2,356 | |
Medtronic plc | | | 92 | | | | 0.27 | % | | | 2,315 | |
UnitedHealth Group, Inc. | | | 26 | | | | 0.24 | % | | | 2,165 | |
Colgate-Palmolive Co. | | | 438 | | | | 0.85 | % | | | 2,068 | |
Conagra Brands, Inc. | | | 802 | | | | 0.74 | % | | | 2,038 | |
Eli Lilly & Co. | | | 25 | | | | 0.11 | % | | | 2,006 | |
SEE NOTES TO FINANCIAL STATEMENTS. | THE RYDEX FUNDS ANNUAL REPORT | 17 |
SCHEDULE OF INVESTMENTS (continued) | March 31, 2021 |
LONG SHORT EQUITY FUND | |
| | Shares | | | Percentage
Notional
Amount | | | Value and
Unrealized
Appreciation
(Depreciation) | |
Vector Group Ltd. | | | 878 | | | | 0.30 | % | | $ | 1,965 | |
USANA Health Sciences, Inc. | | | 79 | | | | 0.19 | % | | | 1,807 | |
Kroger Co. | | | 466 | | | | 0.41 | % | | | 1,756 | |
Kellogg Co. | | | 443 | | | | 0.69 | % | | | 1,678 | |
Post Holdings, Inc. | | | 137 | | | | 0.36 | % | | | 1,588 | |
Campbell Soup Co. | | | 824 | | | | 1.02 | % | | | 1,574 | |
Thermo Fisher Scientific, Inc. | | | 17 | | | | 0.19 | % | | | 1,530 | |
Hill-Rom Holdings, Inc. | | | 93 | | | | 0.25 | % | | | 1,445 | |
Prestige Consumer Healthcare, Inc. | | | 195 | | | | 0.21 | % | | | 1,439 | |
Constellation Brands, Inc. — Class A | | | 39 | | | | 0.22 | % | | | 1,307 | |
General Mills, Inc. | | | 600 | | | | 0.90 | % | | | 1,264 | |
PayPal Holdings, Inc. | | | 33 | | | | 0.20 | % | | | 1,263 | |
Pfizer, Inc. | | | 713 | | | | 0.63 | % | | | 964 | |
Quest Diagnostics, Inc. | | | 119 | | | | 0.37 | % | | | 911 | |
Humana, Inc. | | | 77 | | | | 0.79 | % | | | 894 | |
PepsiCo, Inc. | | | 59 | | | | 0.20 | % | | | 802 | |
Bristol-Myers Squibb Co. | | | 616 | | | | 0.95 | % | | | 670 | |
Mondelez International, Inc. — Class A | | | 95 | | | | 0.14 | % | | | 606 | |
Coca-Cola Co. | | | 364 | | | | 0.47 | % | | | 579 | |
Hologic, Inc. | | | 166 | | | | 0.30 | % | | | 539 | |
Hershey Co. | | | 67 | | | | 0.26 | % | | | 451 | |
Danaher Corp. | | | 24 | | | | 0.13 | % | | | 366 | |
AbbVie, Inc. | | | 73 | | | | 0.19 | % | | | 298 | |
Ingredion, Inc. | | | 189 | | | | 0.42 | % | | | 283 | |
Becton Dickinson and Co. | | | 49 | | | | 0.29 | % | | | 202 | |
John B Sanfilippo & Son, Inc. | | | 181 | | | | 0.40 | % | | | 166 | |
Kimberly-Clark Corp. | | | 209 | | | | 0.71 | % | | | 118 | |
Encompass Health Corp. | | | 96 | | | | 0.19 | % | | | 1 | |
Perrigo Company plc | | | 197 | | | | 0.20 | % | | | (184 | ) |
Boston Scientific Corp. | | | 199 | | | | 0.19 | % | | | (258 | ) |
Incyte Corp. | | | 163 | | | | 0.32 | % | | | (290 | ) |
FleetCor Technologies, Inc. | | | 32 | | | | 0.21 | % | | | (551 | ) |
Innoviva, Inc. | | | 806 | | | | 0.24 | % | | | (589 | ) |
Merck & Company, Inc. | | | 521 | | | | 0.99 | % | | | (1,006 | ) |
Regeneron Pharmaceuticals, Inc. | | | 35 | | | | 0.41 | % | | | (1,093 | ) |
Ionis Pharmaceuticals, Inc. | | | 227 | | | | 0.25 | % | | | (1,955 | ) |
Gilead Sciences, Inc. | | | 387 | | | | 0.61 | % | | | (2,191 | ) |
Total Consumer, Non-cyclical | | | | | | | | | | | 148,424 | |
| | | | | | | | | | | | | |
Financial | | | | | | | | | | | | |
MetLife, Inc. | | | 672 | | | | 1.00 | % | | | 12,222 | |
Hartford Financial Services Group, Inc. | | | 202 | | | | 0.33 | % | | | 5,715 | |
Berkshire Hathaway, Inc. — Class B | | | 124 | | | | 0.78 | % | | | 5,600 | |
JPMorgan Chase & Co. | | | 86 | | | | 0.32 | % | | | 4,237 | |
Aflac, Inc. | | | 328 | | | | 0.41 | % | | | 4,099 | |
Allstate Corp. | | | 236 | | | | 0.67 | % | | | 3,849 | |
Synchrony Financial | | | 311 | | | | 0.31 | % | | | 3,667 | |
Travelers Companies, Inc. | | | 141 | | | | 0.52 | % | | | 3,578 | |
Bank of America Corp. | | | 215 | | | | 0.20 | % | | | 3,223 | |
Western Union Co. | | | 410 | | | | 0.25 | % | | | 2,023 | |
Highwoods Properties, Inc. | | | 631 | | | | 0.66 | % | | | 1,355 | |
Visa, Inc. — Class A | | | 35 | | | | 0.18 | % | | | 1,156 | |
Wells Fargo & Co. | | | 205 | | | | 0.20 | % | | | 1,132 | |
Mastercard, Inc. — Class A | | | 24 | | | | 0.21 | % | | | 696 | |
BlackRock, Inc. — Class A | | | 7 | | | | 0.13 | % | | | 218 | |
Citigroup, Inc. | | | 73 | | | | 0.13 | % | | | 61 | |
American Express Co. | | | 36 | | | | 0.12 | % | | | (154 | ) |
Sabra Health Care REIT, Inc. | | | 447 | | | | 0.19 | % | | | (214 | ) |
Prudential Financial, Inc. | | | 223 | | | | 0.50 | % | | | (257 | ) |
Brandywine Realty Trust | | | 1,297 | | | | 0.41 | % | | | (659 | ) |
Total Financial | | | | | | | | | | | 51,547 | |
| | | | | | | | | | | | | |
Technology | | | | | | | | | | | | |
Apple, Inc. | | | 383 | | | | 1.16 | % | | | 24,206 | |
Microsoft Corp. | | | 189 | | | | 1.09 | % | | | 18,361 | |
Seagate Technology plc | | | 368 | | | | 0.69 | % | | | 9,386 | |
HP, Inc. | | | 596 | | | | 0.46 | % | | | 8,816 | |
Kulicke & Soffa Industries, Inc. | | | 334 | | | | 0.40 | % | | | 6,574 | |
Texas Instruments, Inc. | | | 79 | | | | 0.37 | % | | | 6,063 | |
NetApp, Inc. | | | 194 | | | | 0.35 | % | | | 5,956 | |
CDK Global, Inc. | | | 346 | | | | 0.46 | % | | | 5,507 | |
KLA Corp. | | | 36 | | | | 0.29 | % | | | 5,032 | |
SS&C Technologies Holdings, Inc. | | | 593 | | | | 1.02 | % | | | 4,163 | |
Intel Corp. | | | 347 | | | | 0.54 | % | | | 3,866 | |
Dell Technologies, Inc. — Class C | | | 243 | | | | 0.53 | % | | | 3,705 | |
Oracle Corp. | | | 204 | | | | 0.35 | % | | | 3,541 | |
International Business Machines Corp. | | | 336 | | | | 1.10 | % | | | 2,727 | |
Microchip Technology, Inc. | | | 60 | | | | 0.23 | % | | | 2,697 | |
Cirrus Logic, Inc. | | | 138 | | | | 0.29 | % | | | 2,228 | |
Skyworks Solutions, Inc. | | | 46 | | | | 0.21 | % | | | 2,039 | |
QUALCOMM, Inc. | | | 41 | | | | 0.13 | % | | | 1,557 | |
Accenture plc — Class A | | | 47 | | | | 0.32 | % | | | 1,449 | |
Adobe, Inc. | | | 12 | | | | 0.14 | % | | | 1,430 | |
Broadcom, Inc. | | | 18 | | | | 0.20 | % | | | 1,221 | |
Dropbox, Inc. — Class A | | | 539 | | | | 0.35 | % | | | 1,073 | |
Qorvo, Inc. | | | 72 | | | | 0.32 | % | | | 866 | |
Cerner Corp. | | | 366 | | | | 0.65 | % | | | 668 | |
Fiserv, Inc. | | | 100 | | | | 0.29 | % | | | 561 | |
Cognizant Technology Solutions Corp. — Class A | | | 173 | | | | 0.33 | % | | | 550 | |
VMware, Inc. — Class A | | | 77 | | | | 0.28 | % | | | 440 | |
Paychex, Inc. | | | 101 | | | | 0.24 | % | | | 432 | |
NVIDIA Corp. | | | 17 | | | | 0.22 | % | | | 124 | |
18 | THE RYDEX FUNDS ANNUAL REPORT | SEE NOTES TO FINANCIAL STATEMENTS. |
SCHEDULE OF INVESTMENTS (continued) | March 31, 2021 |
LONG SHORT EQUITY FUND | |
| | Shares | | | Percentage
Notional
Amount | | | Value and
Unrealized
Appreciation
(Depreciation) | |
Western Digital Corp. | | | 125 | | | | 0.20 | % | | $ | (390 | ) |
CSG Systems International, Inc. | | | 197 | | | | 0.22 | % | | | (480 | ) |
Bandwidth, Inc. — Class A | | | 94 | | | | 0.29 | % | | | (3,904 | ) |
Total Technology | | | | | | | | | | | 120,464 | |
| | | | | | | | | | | | | |
Communications | | | | | | | | | | | | |
Alphabet, Inc. — Class C | | | 15 | | | | 0.76 | % | | | 13,742 | |
Amazon.com, Inc. | | | 10 | | | | 0.76 | % | | | 11,130 | |
Facebook, Inc. — Class A | | | 100 | | | | 0.72 | % | | | 8,454 | |
Cisco Systems, Inc. | | | 825 | | | | 1.05 | % | | | 7,853 | |
Viavi Solutions, Inc. | | | 1,980 | | | | 0.76 | % | | | 5,717 | |
Discovery, Inc. — Class A | | | 410 | | | | 0.44 | % | | | 4,597 | |
Juniper Networks, Inc. | | | 951 | | | | 0.59 | % | | | 2,742 | |
Ciena Corp. | | | 335 | | | | 0.45 | % | | | 2,592 | |
Motorola Solutions, Inc. | | | 77 | | | | 0.36 | % | | | 2,243 | |
Comcast Corp. — Class A | | | 154 | | | | 0.20 | % | | | 1,968 | |
T-Mobile US, Inc. | | | 170 | | | | 0.52 | % | | | 1,771 | |
Walt Disney Co. | | | 53 | | | | 0.24 | % | | | 1,766 | |
Cogent Communications Holdings, Inc. | | | 221 | | | | 0.37 | % | | | 1,753 | |
Omnicom Group, Inc. | | | 203 | | | | 0.37 | % | | | 1,700 | |
Netflix, Inc. | | | 10 | | | | 0.13 | % | | | 856 | |
VeriSign, Inc. | | | 103 | | | | 0.50 | % | | | 668 | |
Charter Communications, Inc. — Class A | | | 32 | | | | 0.48 | % | | | (34 | ) |
InterDigital, Inc. | | | 189 | | | | 0.29 | % | | | (243 | ) |
Sirius XM Holdings, Inc. | | | 2,476 | | | | 0.37 | % | | | (274 | ) |
Vonage Holdings Corp. | | | 949 | | | | 0.28 | % | | | (851 | ) |
Verizon Communications, Inc. | | | 796 | | | | 1.14 | % | | | (964 | ) |
AT&T, Inc. | | | 699 | | | | 0.52 | % | | | (1,582 | ) |
Total Communications | | | | | | | | | | | 65,604 | |
| | | | | | | | | | | | | |
Consumer, Cyclical | | | | | | | | | | | | |
Gentherm, Inc. | | | 323 | | | | 0.60 | % | | | 12,461 | |
Lear Corp. | | | 101 | | | | 0.45 | % | | | 7,531 | |
Cummins, Inc. | | | 72 | | | | 0.46 | % | | | 6,394 | |
AutoNation, Inc. | | | 229 | | | | 0.52 | % | | | 5,340 | |
Gentex Corp. | | | 756 | | | | 0.66 | % | | | 4,844 | |
Brunswick Corp. | | | 125 | | | | 0.29 | % | | | 4,611 | |
AutoZone, Inc. | | | 19 | | | | 0.65 | % | | | 4,434 | |
Genuine Parts Co. | | | 225 | | | | 0.64 | % | | | 3,881 | |
Lowe’s Companies, Inc. | | | 115 | | | | 0.54 | % | | | 3,731 | |
Lennar Corp. — Class A | | | 143 | | | | 0.36 | % | | | 3,230 | |
Home Depot, Inc. | | | 29 | | | | 0.22 | % | | | 2,826 | |
MSC Industrial Direct Company, Inc. — Class A | | | 186 | | | | 0.41 | % | | | 2,819 | |
Dolby Laboratories, Inc. — Class A | | | 88 | | | | 0.21 | % | | | 2,276 | |
PACCAR, Inc. | | | 174 | | | | 0.40 | % | | | 2,196 | |
PulteGroup, Inc. | | | 252 | | | | 0.32 | % | | | 2,011 | |
Best Buy Company, Inc. | | | 199 | | | | 0.56 | % | | | 1,244 | |
O’Reilly Automotive, Inc. | | | 29 | | | | 0.36 | % | | | 1,168 | |
McDonald’s Corp. | | | 38 | | | | 0.21 | % | | | 1,046 | |
Walmart, Inc. | | | 61 | | | | 0.20 | % | | | 671 | |
Costco Wholesale Corp. | | | 16 | | | | 0.14 | % | | | 119 | |
Allison Transmission Holdings, Inc. | | | 604 | | | | 0.60 | % | | | (177 | ) |
Tesla, Inc. | | | 8 | | | | 0.13 | % | | | (1,491 | ) |
Total Consumer, Cyclical | | | | | | | | | | | 71,165 | |
| | | | | | | | | | | | | |
Basic Materials | | | | | | | | | | | | |
International Paper Co. | | | 142 | | | | 0.19 | % | | | 345 | |
Total MS Equity Long Custom Basket | | | | | | | 594,342 | |
| | | | | | | | | |
MS EQUITY SHORT CUSTOM BASKET | | | | | | | | |
Basic Materials | | | | | | | | | | | | |
Southern Copper Corp. | | | 578 | | | | (0.68 | )% | | | 1,667 | |
LyondellBasell Industries N.V. — Class A | | | 308 | | | | (0.55 | )% | | | 1,220 | |
Westlake Chemical Corp. | | | 280 | | | | (0.43 | )% | | | (150 | ) |
Royal Gold, Inc. | | | 235 | | | | (0.44 | )% | | | (308 | ) |
PPG Industries, Inc. | | | 443 | | | | (1.15 | )% | | | (1,177 | ) |
Steel Dynamics, Inc. | | | 821 | | | | (0.72 | )% | | | (2,493 | ) |
Huntsman Corp. | | | 1,583 | | | | (0.79 | )% | | | (4,326 | ) |
Axalta Coating Systems Ltd. | | | 1,346 | | | | (0.69 | )% | | | (5,014 | ) |
RPM International, Inc. | | | 359 | | | | (0.57 | )% | | | (6,931 | ) |
Nucor Corp. | | | 547 | | | | (0.76 | )% | | | (7,654 | ) |
United States Steel Corp. | | | 1,537 | | | | (0.69 | )% | | | (7,925 | ) |
Air Products and Chemicals, Inc. | | | 394 | | | | (1.91 | )% | | | (8,544 | ) |
Balchem Corp. | | | 489 | | | | (1.06 | )% | | | (15,694 | ) |
Quaker Chemical Corp. | | | 227 | | | | (0.95 | )% | | | (15,922 | ) |
Celanese Corp. — Class A | | | 425 | | | | (1.10 | )% | | | (18,622 | ) |
Linde plc | | | 372 | | | | (1.79 | )% | | | (20,071 | ) |
Albemarle Corp. | | | 292 | | | | (0.73 | )% | | | (20,677 | ) |
Freeport-McMoRan, Inc. | | | 1,152 | | | | (0.65 | )% | | | (21,065 | ) |
Total Basic Materials | | | | | | | | | | | (153,686 | ) |
| | | | | | | | | | | | | |
Financial | | | | | | | | | | | | |
Realty Income Corp. | | | 1,892 | | | | (2.07 | )% | | | 6,687 | |
Agree Realty Corp. | | | 1,548 | | | | (1.79 | )% | | | 2,356 | |
Goldman Sachs Group, Inc. | | | 300 | | | | (1.69 | )% | | | 2,300 | |
UDR, Inc. | | | 570 | | | | (0.43 | )% | | | 2,283 | |
JBG SMITH Properties | | | 1,471 | | | | (0.81 | )% | | | 2,216 | |
Federal Realty Investment Trust | | | 322 | | | | (0.56 | )% | | | 1,741 | |
CyrusOne, Inc. | | | 466 | | | | (0.54 | )% | | | 1,464 | |
Global Net Lease, Inc. | | | 1,791 | | | | (0.56 | )% | | | 1,398 | |
QTS Realty Trust, Inc. — Class A | | | 484 | | | | (0.52 | )% | | | 1,264 | |
Kilroy Realty Corp. | | | 622 | | | | (0.70 | )% | | | 789 | |
SEE NOTES TO FINANCIAL STATEMENTS. | THE RYDEX FUNDS ANNUAL REPORT | 19 |
SCHEDULE OF INVESTMENTS (continued) | March 31, 2021 |
LONG SHORT EQUITY FUND | |
| | Shares | | | Percentage
Notional
Amount | | | Value and
Unrealized
Appreciation
(Depreciation) | |
Nasdaq, Inc. | | | 279 | | | | (0.71 | )% | | $ | (83 | ) |
CubeSmart | | | 887 | | | | (0.58 | )% | | | (586 | ) |
Host Hotels & Resorts, Inc. | | | 2,325 | | | | (0.67 | )% | | | (587 | ) |
Life Storage, Inc. | | | 428 | | | | (0.63 | )% | | | (652 | ) |
KKR & Company, Inc. — Class A | | | 694 | | | | (0.58 | )% | | | (1,016 | ) |
Digital Realty Trust, Inc. | | | 254 | | | | (0.62 | )% | | | (1,363 | ) |
Intercontinental Exchange, Inc. | | | 446 | | | | (0.86 | )% | | | (1,399 | ) |
CME Group, Inc. — Class A | | | 246 | | | | (0.87 | )% | | | (1,459 | ) |
Equity LifeStyle Properties, Inc. | | | 712 | | | | (0.78 | )% | | | (1,785 | ) |
Americold Realty Trust | | | 1,263 | | | | (0.84 | )% | | | (2,119 | ) |
Duke Realty Corp. | | | 938 | | | | (0.68 | )% | | | (3,287 | ) |
Medical Properties Trust, Inc. | | | 2,669 | | | | (0.98 | )% | | | (3,805 | ) |
Healthpeak Properties, Inc. | | | 1,650 | | | | (0.90 | )% | | | (4,214 | ) |
Prologis, Inc. | | | 572 | | | | (1.04 | )% | | | (4,512 | ) |
S&T Bancorp, Inc. | | | 811 | | | | (0.47 | )% | | | (4,790 | ) |
Equinix, Inc. | | | 77 | | | | (0.90 | )% | | | (5,194 | ) |
Camden Property Trust | | | 603 | | | | (1.14 | )% | | | (5,546 | ) |
Rayonier, Inc. | | | 1,179 | | | | (0.65 | )% | | | (5,999 | ) |
TFS Financial Corp. | | | 1,553 | | | | (0.54 | )% | | | (6,350 | ) |
First Midwest Bancorp, Inc. | | | 1,096 | | | | (0.41 | )% | | | (7,160 | ) |
Alleghany Corp. | | | 130 | | | | (1.40 | )% | | | (7,367 | ) |
Southside Bancshares, Inc. | | | 876 | | | | (0.58 | )% | | | (7,424 | ) |
First Industrial Realty Trust, Inc. | | | 2,255 | | | | (1.78 | )% | | | (8,875 | ) |
Ares Management Corp. — Class A | | | 929 | | | | (0.90 | )% | | | (8,913 | ) |
Howard Hughes Corp. | | | 450 | | | | (0.74 | )% | | | (8,915 | ) |
EastGroup Properties, Inc. | | | 346 | | | | (0.85 | )% | | | (9,137 | ) |
American Tower Corp. — Class A | | | 285 | | | | (1.17 | )% | | | (10,165 | ) |
Loews Corp. | | | 805 | | | | (0.71 | )% | | | (10,238 | ) |
Terreno Realty Corp. | | | 670 | | | | (0.67 | )% | | | (10,425 | ) |
Brookline Bancorp, Inc. | | | 2,944 | | | | (0.76 | )% | | | (13,130 | ) |
Sun Communities, Inc. | | | 505 | | | | (1.31 | )% | | | (14,013 | ) |
First Financial Bankshares, Inc. | | | 1,196 | | | | (0.96 | )% | | | (16,579 | ) |
Rexford Industrial Realty, Inc. | | | 1,521 | | | | (1.32 | )% | | | (21,718 | ) |
First Republic Bank | | | 464 | | | | (1.33 | )% | | | (28,451 | ) |
Total Financial | | | | | | | | | | | (214,758 | ) |
| | | | | | | | | | | | | |
Consumer, Cyclical | | | | | | | | | | | | |
Lululemon Athletica, Inc. | | | 188 | | | | (0.99 | )% | | | 8,534 | |
IAA, Inc. | | | 483 | | | | (0.46 | )% | | | 3,912 | |
Wingstop, Inc. | | | 140 | | | | (0.31 | )% | | | (975 | ) |
Copart, Inc. | | | 541 | | | | (1.01 | )% | | | (3,549 | ) |
Avient Corp. | | | 1,719 | | | | (1.40 | )% | | | (3,616 | ) |
TJX Companies, Inc. | | | 431 | | | | (0.49 | )% | | | (3,773 | ) |
NIKE, Inc. — Class B | | | 410 | | | | (0.94 | )% | | | (7,183 | ) |
Delta Air Lines, Inc. | | | 711 | | | | (0.59 | )% | | | (7,306 | ) |
Live Nation Entertainment, Inc. | | | 279 | | | | (0.41 | )% | | | (9,104 | ) |
Alaska Air Group, Inc. | | | 631 | | | | (0.75 | )% | | | (10,711 | ) |
Hilton Worldwide Holdings, Inc. | | | 474 | | | | (0.99 | )% | | | (11,191 | ) |
Burlington Stores, Inc. | | | 182 | | | | (0.94 | )% | | | (14,454 | ) |
Starbucks Corp. | | | 590 | | | | (1.11 | )% | | | (18,391 | ) |
Southwest Airlines Co. | | | 1,052 | | | | (1.11 | )% | | | (18,525 | ) |
Scotts Miracle-Gro Co. — Class A | | | 217 | | | | (0.92 | )% | | | (26,112 | ) |
Total Consumer, Cyclical | | | | | | | | | | | (122,444 | ) |
| | | | | | | | | | | | | |
Industrial | | | | | | | | | | | | |
Worthington Industries, Inc. | | | 487 | | | | (0.56 | )% | | | 1,731 | |
Exponent, Inc. | | | 253 | | | | (0.42 | )% | | | (142 | ) |
Raytheon Technologies Corp. | | | 434 | | | | (0.58 | )% | | | (855 | ) |
TransDigm Group, Inc. | | | 55 | | | | (0.56 | )% | | | (1,986 | ) |
US Ecology, Inc. | | | 643 | | | | (0.46 | )% | | | (2,645 | ) |
HEICO Corp. | | | 197 | | | | (0.43 | )% | | | (3,207 | ) |
Boeing Co. | | | 72 | | | | (0.32 | )% | | | (3,386 | ) |
Ball Corp. | | | 989 | | | | (1.44 | )% | | | (7,901 | ) |
Martin Marietta Materials, Inc. | | | 143 | | | | (0.83 | )% | | | (9,428 | ) |
Crown Holdings, Inc. | | | 404 | | | | (0.68 | )% | | | (9,617 | ) |
AptarGroup, Inc. | | | 709 | | | | (1.73 | )% | | | (10,313 | ) |
Ingersoll Rand, Inc. | | | 1,341 | | | | (1.14 | )% | | | (12,241 | ) |
Vulcan Materials Co. | | | 262 | | | | (0.76 | )% | | | (12,388 | ) |
Tetra Tech, Inc. | | | 310 | | | | (0.72 | )% | | | (13,006 | ) |
Casella Waste Systems, Inc. — Class A | | | 858 | | | | (0.94 | )% | | | (13,982 | ) |
Total Industrial | | | | | | | | | | | (99,366 | ) |
| | | | | | | | | | | | | |
Consumer, Non-cyclical | | | | | | | | | | | | |
Nevro Corp. | | | 374 | | | | (0.90 | )% | | | 10,377 | |
Verisk Analytics, Inc. — Class A | | | 283 | | | | (0.86 | )% | | | 3,418 | |
CoStar Group, Inc. | | | 57 | | | | (0.81 | )% | | | 950 | |
Moody’s Corp. | | | 100 | | | | (0.51 | )% | | | (2,460 | ) |
Equifax, Inc. | | | 251 | | | | (0.78 | )% | | | (4,058 | ) |
Avalara, Inc. | | | 117 | | | | (0.27 | )% | | | (4,663 | ) |
WD-40 Co. | | | 80 | | | | (0.42 | )% | | | (5,473 | ) |
Avery Dennison Corp. | | | 222 | | | | (0.70 | )% | | | (16,637 | ) |
Total Consumer, Non-cyclical | | | | | | | | | | | (18,546 | ) |
| | | | | | | | | | | | | |
Energy | | | | | | | | | | | | |
Valero Energy Corp. | | | 556 | | | | (0.69 | )% | | | 3,597 | |
Chevron Corp. | | | 606 | | | | (1.09 | )% | | | 3,006 | |
Exxon Mobil Corp. | | | 606 | | | | (0.58 | )% | | | 2,858 | |
Cheniere Energy, Inc. | | | 565 | | | | (0.70 | )% | | | (121 | ) |
NOV, Inc. | | | 1,547 | | | | (0.37 | )% | | | (3,544 | ) |
20 | THE RYDEX FUNDS ANNUAL REPORT | SEE NOTES TO FINANCIAL STATEMENTS. |
SCHEDULE OF INVESTMENTS (continued) | March 31, 2021 |
LONG SHORT EQUITY FUND | |
| | Shares | | | Percentage
Notional
Amount | | | Value and
Unrealized
Appreciation
(Depreciation) | |
Pioneer Natural Resources Co. | | | 152 | | | | (0.42 | )% | | $ | (4,009 | ) |
Hess Corp. | | | 292 | | | | (0.36 | )% | | | (5,253 | ) |
Phillips 66 | | | 878 | | | | (1.23 | )% | | | (5,491 | ) |
Schlumberger N.V. | | | 2,189 | | | | (1.03 | )% | | | (6,179 | ) |
ChampionX Corp. | | | 3,561 | | | | (1.33 | )% | | | (21,571 | ) |
Ovintiv, Inc. | | | 3,216 | | | | (1.32 | )% | | | (31,675 | ) |
Total Energy | | | | | | | | | | | (68,382 | ) |
| | | | | | | | | | | | | |
Communications | | | | | | | | | | | | |
Q2 Holdings, Inc. | | | 274 | | | | (0.47 | )% | | | (5,503 | ) |
Liberty Broadband Corp. — Class C | | | 600 | | | | (1.55 | )% | | | (6,560 | ) |
Zendesk, Inc. | | | 259 | | | | (0.59 | )% | | | (7,472 | ) |
Total Communications | | | | | | | | | | | (19,535 | ) |
| | | | | | | | | | | | | |
Technology | | | | | | | | | | | | |
Pegasystems, Inc. | | | 331 | | | | (0.65 | )% | | | 2,239 | |
Clarivate plc | | | 1,322 | | | | (0.60 | )% | | | 828 | |
Coupa Software, Inc. | | | 59 | | | | (0.26 | )% | | | (385 | ) |
Rapid7, Inc. | | | 411 | | | | (0.53 | )% | | | (685 | ) |
Tyler Technologies, Inc. | | | 41 | | | | (0.30 | )% | | | (1,461 | ) |
Smartsheet, Inc. — Class A | | | 260 | | | | (0.29 | )% | | | (4,539 | ) |
Varonis Systems, Inc. | | | 480 | | | | (0.42 | )% | | | (6,027 | ) |
HubSpot, Inc. | | | 37 | | | | (0.28 | )% | | | (7,100 | ) |
Total Technology | | | | | | | | | | | (17,130 | ) |
| | | | | | | | | | | | | |
Utilities | | | | | | | | | | | | |
ALLETE, Inc. | | | 380 | | | | (0.44 | )% | | | (576 | ) |
California Water Service Group | | | 622 | | | | (0.60 | )% | | | (2,224 | ) |
Total Utilities | | | | | | | | | | | (2,800 | ) |
Total MS Equity Short Custom Basket | | | | | | | (716,647 | ) |
| | | | | | | | | |
GS EQUITY LONG CUSTOM BASKET | | | | | | | | |
Industrial | | | | | | | | | | | | |
Caterpillar, Inc. | | | 85 | | | | 0.48 | % | | | 9,117 | |
AGCO Corp. | | | 110 | | | | 0.39 | % | | | 8,469 | |
Acuity Brands, Inc. | | | 149 | | | | 0.60 | % | | | 8,144 | |
Snap-on, Inc. | | | 70 | | | | 0.40 | % | | | 7,928 | |
Vishay Intertechnology, Inc. | | | 1,073 | | | | 0.63 | % | | | 7,503 | |
Owens Corning | | | 205 | | | | 0.46 | % | | | 6,980 | |
Oshkosh Corp. | | | 170 | | | | 0.50 | % | | | 6,684 | |
TE Connectivity Ltd. | | | 94 | | | | 0.30 | % | | | 5,830 | |
General Dynamics Corp. | | | 220 | | | | 0.98 | % | | | 5,474 | |
Timken Co. | | | 182 | | | | 0.36 | % | | | 4,864 | |
Arrow Electronics, Inc. | | | 176 | | | | 0.48 | % | | | 4,628 | |
Hubbell, Inc. | | | 86 | | | | 0.39 | % | | | 4,513 | |
3M Co. | | | 151 | | | | 0.71 | % | | | 3,948 | |
Eaton Corporation plc | | | 105 | | | | 0.36 | % | | | 3,513 | |
Lincoln Electric Holdings, Inc. | | | 87 | | | | 0.26 | % | | | 3,473 | |
Waters Corp. | | | 38 | | | | 0.27 | % | | | 3,298 | |
Trane Technologies plc | | | 128 | | | | 0.52 | % | | | 2,755 | |
Union Pacific Corp. | | | 98 | | | | 0.53 | % | | | 1,892 | |
Parker-Hannifin Corp. | | | 94 | | | | 0.73 | % | | | 1,577 | |
Energizer Holdings, Inc. | | | 264 | | | | 0.31 | % | | | 1,449 | |
Masco Corp. | | | 312 | | | | 0.46 | % | | | 1,279 | |
Lennox International, Inc. | | | 35 | | | | 0.27 | % | | | 1,248 | |
Northrop Grumman Corp. | | | 51 | | | | 0.41 | % | | | 1,206 | |
O-I Glass, Inc. | | | 627 | | | | 0.23 | % | | | 1,172 | |
Berry Global Group, Inc. | | | 131 | | | | 0.20 | % | | | 929 | |
Agilent Technologies, Inc. | | | 136 | | | | 0.42 | % | | | 893 | |
Mettler-Toledo International, Inc. | | | 9 | | | | 0.26 | % | | | 878 | |
Westinghouse Air Brake Technologies Corp. | | | 162 | | | | 0.31 | % | | | 841 | |
AECOM | | | 156 | | | | 0.25 | % | | | 696 | |
Westrock Co. | | | 151 | | | | 0.19 | % | | | 660 | |
CSX Corp. | | | 194 | | | | 0.46 | % | | | 586 | |
Sanmina Corp. | | | 267 | | | | 0.27 | % | | | 473 | |
Deere & Co. | | | 22 | | | | 0.20 | % | | | 400 | |
United Parcel Service, Inc. — Class B | | | 32 | | | | 0.13 | % | | | 383 | |
Norfolk Southern Corp. | | | 58 | | | | 0.38 | % | | | 362 | |
Honeywell International, Inc. | | | 25 | | | | 0.13 | % | | | 226 | |
Fortive Corp. | | | 249 | | | | 0.43 | % | | | 111 | |
Lockheed Martin Corp. | | | 77 | | | | 0.70 | % | | | 106 | |
Donaldson Company, Inc. | | | 161 | | | | 0.23 | % | | | (204 | ) |
Hillenbrand, Inc. | | | 212 | | | | 0.25 | % | | | (514 | ) |
Total Industrial | | | | | | | | | | | 113,770 | |
| | | | | | | | | | | | | |
Financial | | | | | | | | | | | | |
MetLife, Inc. | | | 672 | | | | 1.00 | % | | | 12,252 | |
Hartford Financial Services Group, Inc. | | | 202 | | | | 0.33 | % | | | 5,726 | |
Berkshire Hathaway, Inc. — Class B | | | 124 | | | | 0.78 | % | | | 5,561 | |
JPMorgan Chase & Co. | | | 86 | | | | 0.32 | % | | | 4,248 | |
Aflac, Inc. | | | 328 | | | | 0.41 | % | | | 4,082 | |
Allstate Corp. | | | 236 | | | | 0.67 | % | | | 3,878 | |
Synchrony Financial | | | 311 | | | | 0.31 | % | | | 3,663 | |
Travelers Companies, Inc. | | | 141 | | | | 0.52 | % | | | 3,582 | |
Bank of America Corp. | | | 215 | | | | 0.20 | % | | | 3,253 | |
Western Union Co. | | | 410 | | | | 0.25 | % | | | 2,020 | |
Highwoods Properties, Inc. | | | 631 | | | | 0.67 | % | | | 1,328 | |
Visa, Inc. — Class A | | | 35 | | | | 0.18 | % | | | 1,182 | |
Wells Fargo & Co. | | | 205 | | | | 0.20 | % | | | 1,143 | |
Mastercard, Inc. — Class A | | | 24 | | | | 0.21 | % | | | 697 | |
BlackRock, Inc. — Class A | | | 7 | | | | 0.13 | % | | | 204 | |
Citigroup, Inc. | | | 73 | | | | 0.13 | % | | | 54 | |
American Express Co. | | | 36 | | | | 0.12 | % | | | (167 | ) |
Sabra Health Care REIT, Inc. | | | 447 | | | | 0.19 | % | | | (210 | ) |
SEE NOTES TO FINANCIAL STATEMENTS. | THE RYDEX FUNDS ANNUAL REPORT | 21 |
SCHEDULE OF INVESTMENTS (continued) | March 31, 2021 |
LONG SHORT EQUITY FUND | |
| | Shares | | | Percentage
Notional
Amount | | | Value and
Unrealized
Appreciation
(Depreciation) | |
Prudential Financial, Inc. | | | 223 | | | | 0.50 | % | | $ | (253 | ) |
Brandywine Realty Trust | | | 1,297 | | | | 0.41 | % | | | (652 | ) |
Total Financial | | | | | | | | | | | 51,591 | |
| | | | | | | | | | | | | |
Consumer, Non-cyclical | | | | | | | | | | | | |
United Rentals, Inc. | | | 83 | | | | 0.67 | % | | | 14,648 | |
McKesson Corp. | | | 220 | | | | 1.05 | % | | | 9,813 | |
Amgen, Inc. | | | 163 | | | | 1.00 | % | | | 7,905 | |
Quanta Services, Inc. | | | 214 | | | | 0.46 | % | | | 7,619 | |
Molson Coors Beverage Co. — Class B | | | 805 | | | | 1.01 | % | | | 7,546 | |
Cardinal Health, Inc. | | | 451 | | | | 0.67 | % | | | 7,047 | |
Johnson & Johnson | | | 266 | | | | 1.07 | % | | | 6,443 | |
Altria Group, Inc. | | | 715 | | | | 0.90 | % | | | 6,431 | |
United Therapeutics Corp. | | | 129 | | | | 0.53 | % | | | 5,914 | |
Kraft Heinz Co. | | | 725 | | | | 0.71 | % | | | 5,681 | |
Procter & Gamble Co. | | | 288 | | | | 0.96 | % | | | 4,719 | |
J M Smucker Co. | | | 282 | | | | 0.88 | % | | | 4,498 | |
Philip Morris International, Inc. | | | 419 | | | | 0.91 | % | | | 4,209 | |
Cigna Corp. | | | 68 | | | | 0.40 | % | | | 3,442 | |
H&R Block, Inc. | | | 708 | | | | 0.38 | % | | | 3,290 | |
DaVita, Inc. | | | 155 | | | | 0.41 | % | | | 3,170 | |
CVS Health Corp. | | | 174 | | | | 0.32 | % | | | 2,886 | |
Sprouts Farmers Market, Inc. | | | 585 | | | | 0.38 | % | | | 2,795 | |
Laboratory Corporation of America Holdings | | | 50 | | | | 0.31 | % | | | 2,789 | |
Anthem, Inc. | | | 24 | | | | 0.21 | % | | | 2,610 | |
Tyson Foods, Inc. — Class A | | | 259 | | | | 0.47 | % | | | 2,603 | |
Abbott Laboratories | | | 111 | | | | 0.33 | % | | | 2,256 | |
UnitedHealth Group, Inc. | | | 26 | | | | 0.24 | % | | | 2,148 | |
Colgate-Palmolive Co. | | | 438 | | | | 0.85 | % | | | 2,072 | |
Conagra Brands, Inc. | | | 802 | | | | 0.74 | % | | | 2,047 | |
Eli Lilly & Co. | | | 25 | | | | 0.11 | % | | | 1,993 | |
Vector Group Ltd. | | | 878 | | | | 0.30 | % | | | 1,961 | |
USANA Health Sciences, Inc. | | | 79 | | | | 0.19 | % | | | 1,801 | |
Kroger Co. | | | 466 | | | | 0.41 | % | | | 1,759 | |
Medtronic plc | | | 92 | | | | 0.27 | % | | | 1,707 | |
Kellogg Co. | | | 443 | | | | 0.69 | % | | | 1,619 | |
Ingredion, Inc. | | | 189 | | | | 0.42 | % | | | 1,613 | |
Campbell Soup Co. | | | 824 | | | | 1.02 | % | | | 1,570 | |
Post Holdings, Inc. | | | 137 | | | | 0.36 | % | | | 1,558 | |
Hill-Rom Holdings, Inc. | | | 93 | | | | 0.25 | % | | | 1,456 | |
Prestige Consumer Healthcare, Inc. | | | 195 | | | | 0.21 | % | | | 1,436 | |
Thermo Fisher Scientific, Inc. | | | 17 | | | | 0.19 | % | | | 1,400 | |
Constellation Brands, Inc. — Class A | | | 39 | | | | 0.22 | % | | | 1,313 | |
PayPal Holdings, Inc. | | | 33 | | | | 0.20 | % | | | 1,263 | |
General Mills, Inc. | | | 600 | | | | 0.90 | % | | | 1,249 | |
Humana, Inc. | | | 77 | | | | 0.79 | % | | | 930 | |
Quest Diagnostics, Inc. | | | 119 | | | | 0.37 | % | | | 905 | |
Bristol-Myers Squibb Co. | | | 616 | | | | 0.95 | % | | | 684 | |
Coca-Cola Co. | | | 364 | | | | 0.47 | % | | | 563 | |
Hologic, Inc. | | | 166 | | | | 0.30 | % | | | 551 | |
Mondelez International, Inc. — Class A | | | 95 | | | | 0.14 | % | | | 521 | |
PepsiCo, Inc. | | | 59 | | | | 0.20 | % | | | 474 | |
Hershey Co. | | | 67 | | | | 0.26 | % | | | 461 | |
Danaher Corp. | | | 24 | | | | 0.13 | % | | | 374 | |
AbbVie, Inc. | | | 73 | | | | 0.19 | % | | | 306 | |
Becton Dickinson and Co. | | | 49 | | | | 0.29 | % | | | 202 | |
John B Sanfilippo & Son, Inc. | | | 181 | | | | 0.40 | % | | | 200 | |
Kimberly-Clark Corp. | | | 209 | | | | 0.71 | % | | | 97 | |
Encompass Health Corp. | | | 96 | | | | 0.19 | % | | | 7 | |
Perrigo Company plc | | | 197 | | | | 0.20 | % | | | (215 | ) |
Boston Scientific Corp. | | | 199 | | | | 0.19 | % | | | (255 | ) |
Pfizer, Inc. | | | 713 | | | | 0.63 | % | | | (288 | ) |
Incyte Corp. | | | 163 | | | | 0.33 | % | | | (303 | ) |
FleetCor Technologies, Inc. | | | 32 | | | | 0.21 | % | | | (536 | ) |
Innoviva, Inc. | | | 806 | | | | 0.24 | % | | | (695 | ) |
Regeneron Pharmaceuticals, Inc. | | | 35 | | | | 0.41 | % | | | (1,016 | ) |
Merck & Company, Inc. | | | 521 | | | | 0.99 | % | | | (1,040 | ) |
Ionis Pharmaceuticals, Inc. | | | 227 | | | | 0.25 | % | | | (1,942 | ) |
Gilead Sciences, Inc. | | | 387 | | | | 0.61 | % | | | (2,178 | ) |
Total Consumer, Non-cyclical | | | | | | | | | | | 146,086 | |
| | | | | | | | | | | | | |
Basic Materials | | | | | | | | | | | | |
International Paper Co. | | | 142 | | | | 0.19 | % | | | 352 | |
| | | | | | | | | | | | | |
Consumer, Cyclical | | | | | | | | | | | | |
Gentherm, Inc. | | | 323 | | | | 0.60 | % | | | 12,477 | |
Lear Corp. | | | 101 | | | | 0.45 | % | | | 7,540 | |
Cummins, Inc. | | | 72 | | | | 0.46 | % | | | 6,382 | |
AutoNation, Inc. | | | 229 | | | | 0.52 | % | | | 5,310 | |
Gentex Corp. | | | 756 | | | | 0.66 | % | | | 4,854 | |
Brunswick Corp. | | | 125 | | | | 0.29 | % | | | 4,621 | |
AutoZone, Inc. | | | 19 | | | | 0.65 | % | | | 4,465 | |
Genuine Parts Co. | | | 225 | | | | 0.64 | % | | | 3,912 | |
Lowe’s Companies, Inc. | | | 115 | | | | 0.54 | % | | | 3,744 | |
Lennar Corp. — Class A | | | 143 | | | | 0.36 | % | | | 3,218 | |
MSC Industrial Direct Company, Inc. — Class A | | | 186 | | | | 0.41 | % | | | 2,810 | |
Home Depot, Inc. | | | 29 | | | | 0.22 | % | | | 2,628 | |
Dolby Laboratories, Inc. — Class A | | | 88 | | | | 0.21 | % | | | 2,278 | |
PACCAR, Inc. | | | 174 | | | | 0.40 | % | | | 2,185 | |
PulteGroup, Inc. | | | 252 | | | | 0.32 | % | | | 2,020 | |
Best Buy Company, Inc. | | | 199 | | | | 0.56 | % | | | 1,220 | |
O’Reilly Automotive, Inc. | | | 29 | | | | 0.36 | % | | | 1,207 | |
McDonald’s Corp. | | | 38 | | | | 0.21 | % | | | 1,064 | |
Walmart, Inc. | | | 42 | | | | 0.14 | % | | | 549 | |
22 | THE RYDEX FUNDS ANNUAL REPORT | SEE NOTES TO FINANCIAL STATEMENTS. |
SCHEDULE OF INVESTMENTS (continued) | March 31, 2021 |
LONG SHORT EQUITY FUND | |
| | Shares | | | Percentage
Notional
Amount | | | Value and
Unrealized
Appreciation
(Depreciation) | |
Allison Transmission Holdings, Inc. | | | 604 | | | | 0.61 | % | | $ | 131 | |
Costco Wholesale Corp. | | | 16 | | | | 0.14 | % | | | 102 | |
Tesla, Inc. | | | 8 | | | | 0.13 | % | | | (1,402 | ) |
Total Consumer, Cyclical | | | | | | | | | | | 71,315 | |
| | | | | | | | | | | | | |
Technology | | | | | | | | | | | | |
Apple, Inc. | | | 383 | | | | 1.15 | % | | | 23,677 | |
Microsoft Corp. | | | 189 | | | | 1.09 | % | | | 16,013 | |
Seagate Technology plc | | | 368 | | | | 0.69 | % | | | 9,388 | |
HP, Inc. | | | 596 | | | | 0.46 | % | | | 8,832 | |
Kulicke & Soffa Industries, Inc. | | | 334 | | | | 0.40 | % | | | 6,610 | |
Texas Instruments, Inc. | | | 79 | | | | 0.37 | % | | | 6,074 | |
NetApp, Inc. | | | 194 | | | | 0.35 | % | | | 5,963 | |
CDK Global, Inc. | | | 346 | | | | 0.46 | % | | | 5,510 | |
KLA Corp. | | | 36 | | | | 0.29 | % | | | 5,025 | |
Intel Corp. | | | 347 | | | | 0.55 | % | | | 4,867 | |
SS&C Technologies Holdings, Inc. | | | 593 | | | | 1.02 | % | | | 4,164 | |
Dell Technologies, Inc. — Class C | | | 243 | | | | 0.53 | % | | | 3,707 | |
Oracle Corp. | | | 204 | | | | 0.35 | % | | | 3,319 | |
Microchip Technology, Inc. | | | 60 | | | | 0.23 | % | | | 2,699 | |
International Business Machines Corp. | | | 336 | | | | 1.10 | % | | | 2,675 | |
Cirrus Logic, Inc. | | | 138 | | | | 0.29 | % | | | 2,247 | |
Skyworks Solutions, Inc. | | | 46 | | | | 0.21 | % | | | 2,045 | |
QUALCOMM, Inc. | | | 41 | | | | 0.13 | % | | | 1,538 | |
Adobe, Inc. | | | 12 | | | | 0.14 | % | | | 1,425 | |
Accenture plc — Class A | | | 47 | | | | 0.32 | % | | | 1,395 | |
Broadcom, Inc. | | | 18 | | | | 0.20 | % | | | 1,192 | |
Dropbox, Inc. — Class A | | | 539 | | | | 0.35 | % | | | 1,055 | |
Qorvo, Inc. | | | 72 | | | | 0.32 | % | | | 864 | |
Cerner Corp. | | | 366 | | | | 0.65 | % | | | 673 | |
Fiserv, Inc. | | | 100 | | | | 0.29 | % | | | 559 | |
Cognizant Technology Solutions Corp. — Class A | | | 173 | | | | 0.33 | % | | | 549 | |
VMware, Inc. — Class A | | | 77 | | | | 0.28 | % | | | 436 | |
Paychex, Inc. | | | 101 | | | | 0.24 | % | | | 432 | |
NVIDIA Corp. | | | 17 | | | | 0.22 | % | | | 113 | |
Western Digital Corp. | | | 125 | | | | 0.20 | % | | | (407 | ) |
CSG Systems International, Inc. | | | 197 | | | | 0.22 | % | | | (482 | ) |
Bandwidth, Inc. — Class A | | | 94 | | | | 0.29 | % | | | (3,892 | ) |
Total Technology | | | | | | | | | | | 118,265 | |
| | | | | | | | | | | | | |
Communications | | | | | | | | | | | | |
Alphabet, Inc. — Class C | | | 15 | | | | 0.77 | % | | | 14,848 | |
Amazon.com, Inc. | | | 10 | | | | 0.76 | % | | | 11,064 | |
Facebook, Inc. — Class A | | | 100 | | | | 0.72 | % | | | 8,447 | |
Cisco Systems, Inc. | | | 825 | | | | 1.05 | % | | | 7,854 | |
Viavi Solutions, Inc. | | | 1,980 | | | | 0.76 | % | | | 5,557 | |
Discovery, Inc. — Class A | | | 410 | | | | 0.44 | % | | | 4,593 | |
Juniper Networks, Inc. | | | 951 | | | | 0.59 | % | | | 2,776 | |
Ciena Corp. | | | 335 | | | | 0.45 | % | | | 2,608 | |
Motorola Solutions, Inc. | | | 77 | | | | 0.36 | % | | | 2,252 | |
Comcast Corp. — Class A | | | 154 | | | | 0.20 | % | | | 1,966 | |
Walt Disney Co. | | | 53 | | | | 0.24 | % | | | 1,776 | |
T-Mobile US, Inc. | | | 170 | | | | 0.52 | % | | | 1,773 | |
Cogent Communications Holdings, Inc. | | | 221 | | | | 0.37 | % | | | 1,754 | |
Omnicom Group, Inc. | | | 203 | | | | 0.37 | % | | | 1,281 | |
Verizon Communications, Inc. | | | 796 | | | | 1.14 | % | | | 1,104 | |
Netflix, Inc. | | | 10 | | | | 0.13 | % | | | 856 | |
VeriSign, Inc. | | | 103 | | | | 0.50 | % | | | 671 | |
Charter Communications, Inc. — Class A | | | 32 | | | | 0.48 | % | | | (28 | ) |
InterDigital, Inc. | | | 189 | | | | 0.29 | % | | | (260 | ) |
Sirius XM Holdings, Inc. | | | 2,476 | | | | 0.37 | % | | | (289 | ) |
Vonage Holdings Corp. | | | 949 | | | | 0.28 | % | | | (832 | ) |
AT&T, Inc. | | | 699 | | | | 0.52 | % | | | (1,989 | ) |
Total Communications | | | | | | | | | | | 67,782 | |
| | | | | | | | | | | | | |
Utilities | | | | | | | | | | | | |
UGI Corp. | | | 738 | | | | 0.76 | % | | | 3,936 | |
Southern Co. | | | 560 | | | | 0.85 | % | | | 2,842 | |
Public Service Enterprise Group, Inc. | | | 608 | | | | 0.90 | % | | | 2,786 | |
CenterPoint Energy, Inc. | | | 743 | | | | 0.41 | % | | | 2,188 | |
IDACORP, Inc. | | | 280 | | | | 0.69 | % | | | 2,152 | |
Exelon Corp. | | | 669 | | | | 0.72 | % | | | 1,959 | |
Evergy, Inc. | | | 620 | | | | 0.91 | % | | | 1,732 | |
DTE Energy Co. | | | 131 | | | | 0.43 | % | | | 1,122 | |
Pinnacle West Capital Corp. | | | 249 | | | | 0.50 | % | | | 877 | |
NiSource, Inc. | | | 1,076 | | | | 0.64 | % | | | 730 | |
Sempra Energy | | | 78 | | | | 0.25 | % | | | 724 | |
OGE Energy Corp. | | | 728 | | | | 0.58 | % | | | 713 | |
Duke Energy Corp. | | | 337 | | | | 0.80 | % | | | 642 | |
Consolidated Edison, Inc. | | | 366 | | | | 0.67 | % | | | 505 | |
PPL Corp. | | | 1,275 | | | | 0.90 | % | | | 381 | |
ONE Gas, Inc. | | | 329 | | | | 0.62 | % | | | 203 | |
Dominion Energy, Inc. | | | 25 | | | | 0.05 | % | | | 75 | |
NextEra Energy, Inc. | | | 71 | | | | 0.13 | % | | | 71 | |
AES Corp. | | | 288 | | | | 0.19 | % | | | (259 | ) |
Southwest Gas Holdings, Inc. | | | 285 | | | | 0.48 | % | | | (363 | ) |
Total Utilities | | | | | | | | | | | 23,016 | |
Total GS Equity Long Custom Basket | | | | | | | 592,177 | |
| | | | | | | | | |
GS EQUITY SHORT CUSTOM BASKET | | | | | | | | |
Basic Materials | | | | | | | | | | | | |
Southern Copper Corp. | | | 578 | | | | (0.67 | )% | | | 1,790 | |
SEE NOTES TO FINANCIAL STATEMENTS. | THE RYDEX FUNDS ANNUAL REPORT | 23 |
SCHEDULE OF INVESTMENTS (continued) | March 31, 2021 |
LONG SHORT EQUITY FUND | |
| | Shares | | | Percentage
Notional
Amount | | | Value and
Unrealized
Appreciation
(Depreciation) | |
LyondellBasell Industries N.V. — Class A | | | 308 | | | | (0.55 | )% | | $ | 1,217 | |
Westlake Chemical Corp. | | | 280 | | | | (0.43 | )% | | | (102 | ) |
Royal Gold, Inc. | | | 235 | | | | (0.43 | )% | | | (257 | ) |
PPG Industries, Inc. | | | 443 | | | | (1.14 | )% | | | (1,151 | ) |
Steel Dynamics, Inc. | | | 821 | | | | (0.71 | )% | | | (2,602 | ) |
Huntsman Corp. | | | 1,583 | | | | (0.78 | )% | | | (4,289 | ) |
Axalta Coating Systems Ltd. | | | 1,346 | | | | (0.68 | )% | | | (4,986 | ) |
RPM International, Inc. | | | 359 | | | | (0.56 | )% | | | (6,982 | ) |
Nucor Corp. | | | 547 | | | | (0.75 | )% | | | (7,708 | ) |
United States Steel Corp. | | | 1,537 | | | | (0.69 | )% | | | (7,921 | ) |
Air Products and Chemicals, Inc. | | | 394 | | | | (1.90 | )% | | | (8,509 | ) |
Balchem Corp. | | | 489 | | | | (1.05 | )% | | | (13,940 | ) |
Quaker Chemical Corp. | | | 227 | | | | (0.95 | )% | | | (16,032 | ) |
Celanese Corp. — Class A | | | 425 | | | | (1.09 | )% | | | (18,644 | ) |
Linde plc | | | 372 | | | | (1.78 | )% | | | (20,051 | ) |
Albemarle Corp. | | | 292 | | | | (0.73 | )% | | | (20,724 | ) |
Freeport-McMoRan, Inc. | | | 1,152 | | | | (0.65 | )% | | | (21,058 | ) |
Total Basic Materials | | | | | | | | | | | (151,949 | ) |
| | | | | | | | | | | | | |
Financial | | | | | | | | | | | | |
Morgan Stanley | | | 1,778 | | | | (2.36 | )% | | | 7,512 | |
Realty Income Corp. | | | 1,892 | | | | (2.06 | )% | | | 7,280 | |
UDR, Inc. | | | 570 | | | | (0.43 | )% | | | 2,269 | |
JBG SMITH Properties | | | 1,471 | | | | (0.80 | )% | | | 2,210 | |
Federal Realty Investment Trust | | | 322 | | | | (0.56 | )% | | | 1,917 | |
Global Net Lease, Inc. | | | 1,791 | | | | (0.55 | )% | | | 1,391 | |
CyrusOne, Inc. | | | 466 | | | | (0.54 | )% | | | 1,376 | |
Kilroy Realty Corp. | | | 622 | | | | (0.70 | )% | | | 782 | |
Nasdaq, Inc. | | | 279 | | | | (0.70 | )% | | | (72 | ) |
CubeSmart | | | 887 | | | | (0.57 | )% | | | (465 | ) |
Host Hotels & Resorts, Inc. | | | 2,325 | | | | (0.67 | )% | | | (471 | ) |
Life Storage, Inc. | | | 428 | | | | (0.63 | )% | | | (621 | ) |
KKR & Company, Inc. — Class A | | | 694 | | | | (0.58 | )% | | | (984 | ) |
Digital Realty Trust, Inc. | | | 254 | | | | (0.61 | )% | | | (1,340 | ) |
Intercontinental Exchange, Inc. | | | 446 | | | | (0.85 | )% | | | (1,398 | ) |
Agree Realty Corp. | | | 1,548 | | | | (1.78 | )% | | | (1,414 | ) |
CME Group, Inc. — Class A | | | 246 | | | | (0.86 | )% | | | (1,525 | ) |
Equity LifeStyle Properties, Inc. | | | 712 | | | | (0.78 | )% | | | (1,756 | ) |
Duke Realty Corp. | | | 938 | | | | (0.67 | )% | | | (3,345 | ) |
Equinix, Inc. | | | 77 | | | | (0.90 | )% | | | (3,647 | ) |
QTS Realty Trust, Inc. — Class A | | | 484 | | | | (0.51 | )% | | | (3,756 | ) |
Medical Properties Trust, Inc. | | | 2,669 | | | | (0.97 | )% | | | (3,803 | ) |
Healthpeak Properties, Inc. | | | 1,650 | | | | (0.90 | )% | | | (4,235 | ) |
Prologis, Inc. | | | 572 | | | | (1.04 | )% | | | (4,416 | ) |
S&T Bancorp, Inc. | | | 811 | | | | (0.46 | )% | | | (4,791 | ) |
Camden Property Trust | | | 603 | | | | (1.13 | )% | | | (5,535 | ) |
Americold Realty Trust | | | 1,263 | | | | (0.83 | )% | | | (5,813 | ) |
Rayonier, Inc. | | | 1,179 | | | | (0.65 | )% | | | (5,957 | ) |
TFS Financial Corp. | | | 1,553 | | | | (0.54 | )% | | | (6,370 | ) |
Terreno Realty Corp. | | | 670 | | | | (0.66 | )% | | | (7,049 | ) |
First Midwest Bancorp, Inc. | | | 1,096 | | | | (0.41 | )% | | | (7,100 | ) |
Alleghany Corp. | | | 130 | | | | (1.39 | )% | | | (7,143 | ) |
Southside Bancshares, Inc. | | | 876 | | | | (0.58 | )% | | | (7,513 | ) |
EastGroup Properties, Inc. | | | 346 | | | | (0.85 | )% | | | (8,533 | ) |
Howard Hughes Corp. | | | 450 | | | | (0.73 | )% | | | (8,789 | ) |
Ares Management Corp. — Class A | | | 929 | | | | (0.89 | )% | | | (8,846 | ) |
First Industrial Realty Trust, Inc. | | | 2,255 | | | | (1.77 | )% | | | (8,886 | ) |
Sun Communities, Inc. | | | 505 | | | | (1.30 | )% | | | (9,741 | ) |
American Tower Corp. — Class A | | | 285 | | | | (1.17 | )% | | | (10,163 | ) |
Loews Corp. | | | 805 | | | | (0.71 | )% | | | (10,222 | ) |
Brookline Bancorp, Inc. | | | 2,944 | | | | (0.76 | )% | | | (13,148 | ) |
Rexford Industrial Realty, Inc. | | | 1,521 | | | | (1.31 | )% | | | (16,188 | ) |
First Financial Bankshares, Inc. | | | 1,196 | | | | (0.96 | )% | | | (16,573 | ) |
First Republic Bank | | | 464 | | | | (1.32 | )% | | | (28,328 | ) |
Total Financial | | | | | | | | | | | (205,199 | ) |
| | | | | | | | | | | | | |
Technology | | | | | | | | | | | | |
Pegasystems, Inc. | | | 331 | | | | (0.65 | )% | | | 2,259 | |
Clarivate plc | | | 1,322 | | | | (0.60 | )% | | | 815 | |
Coupa Software, Inc. | | | 59 | | | | (0.26 | )% | | | (488 | ) |
Rapid7, Inc. | | | 411 | | | | (0.52 | )% | | | (505 | ) |
Tyler Technologies, Inc. | | | 41 | | | | (0.30 | )% | | | (1,468 | ) |
Smartsheet, Inc. — Class A | | | 260 | | | | (0.28 | )% | | | (4,542 | ) |
Varonis Systems, Inc. | | | 480 | | | | (0.42 | )% | | | (5,962 | ) |
HubSpot, Inc. | | | 37 | | | | (0.29 | )% | | | (6,876 | ) |
Total Technology | | | | | | | | | | | (16,767 | ) |
| | | | | | | | | | | | | |
Industrial | | | | | | | | | | | | |
Worthington Industries, Inc. | | | 487 | | | | (0.56 | )% | | | 1,723 | |
Exponent, Inc. | | | 253 | | | | (0.42 | )% | | | (83 | ) |
Raytheon Technologies Corp. | | | 434 | | | | (0.57 | )% | | | (824 | ) |
TransDigm Group, Inc. | | | 55 | | | | (0.55 | )% | | | (2,009 | ) |
US Ecology, Inc. | | | 643 | | | | (0.46 | )% | | | (2,657 | ) |
HEICO Corp. | | | 197 | | | | (0.42 | )% | | | (3,173 | ) |
Boeing Co. | | | 72 | | | | (0.31 | )% | | | (3,398 | ) |
Ball Corp. | | | 989 | | | | (1.43 | )% | | | (7,743 | ) |
Martin Marietta Materials, Inc. | | | 143 | | | | (0.82 | )% | | | (9,445 | ) |
Crown Holdings, Inc. | | | 404 | | | | (0.67 | )% | | | (9,646 | ) |
24 | THE RYDEX FUNDS ANNUAL REPORT | SEE NOTES TO FINANCIAL STATEMENTS. |
SCHEDULE OF INVESTMENTS (continued) | March 31, 2021 |
LONG SHORT EQUITY FUND | |
| | Shares | | | Percentage
Notional
Amount | | | Value and
Unrealized
Appreciation
(Depreciation) | |
AptarGroup, Inc. | | | 709 | | | | (1.72 | )% | | $ | (10,280 | ) |
Ingersoll Rand, Inc. | | | 1,341 | | | | (1.13 | )% | | | (12,243 | ) |
Vulcan Materials Co. | | | 262 | | | | (0.76 | )% | | | (12,424 | ) |
Tetra Tech, Inc. | | | 310 | | | | (0.72 | )% | | | (13,007 | ) |
Casella Waste Systems, Inc. — Class A | | | 858 | | | | (0.93 | )% | | | (14,026 | ) |
Total Industrial | | | | | | | | | | | (99,235 | ) |
| | | | | | | | | | | | | |
Consumer, Cyclical | | | | | | | | | | | | |
Lululemon Athletica, Inc. | | | 188 | | | | (0.99 | )% | | | 8,493 | |
IAA, Inc. | | | 483 | | | | (0.46 | )% | | | 3,947 | |
Wingstop, Inc. | | | 140 | | | | (0.30 | )% | | | (976 | ) |
Avient Corp. | | | 1,719 | | | | (1.39 | )% | | | (3,370 | ) |
Copart, Inc. | | | 541 | | | | (1.01 | )% | | | (3,559 | ) |
TJX Companies, Inc. | | | 431 | | | | (0.49 | )% | | | (3,750 | ) |
NIKE, Inc. — Class B | | | 410 | | | | (0.93 | )% | | | (7,196 | ) |
Delta Air Lines, Inc. | | | 711 | | | | (0.59 | )% | | | (7,301 | ) |
Live Nation Entertainment, Inc. | | | 279 | | | | (0.40 | )% | | | (9,078 | ) |
Alaska Air Group, Inc. | | | 631 | | | | (0.75 | )% | | | (10,847 | ) |
Hilton Worldwide Holdings, Inc. | | | 474 | | | | (0.98 | )% | | | (11,144 | ) |
Burlington Stores, Inc. | | | 182 | | | | (0.93 | )% | | | (14,672 | ) |
Starbucks Corp. | | | 590 | | | | (1.10 | )% | | | (18,417 | ) |
Southwest Airlines Co. | | | 1,052 | | | | (1.10 | )% | | | (18,510 | ) |
Scotts Miracle-Gro Co. — Class A | | | 217 | | | | (0.91 | )% | | | (26,084 | ) |
Total Consumer, Cyclical | | | | | | | | | | | (122,464 | ) |
| | | | | | | | | | | | | |
Communications | | | | | | | | | | | | |
Q2 Holdings, Inc. | | | 274 | | | | (0.47 | )% | | | (4,783 | ) |
Liberty Broadband Corp. — Class C | | | 600 | | | | (1.54 | )% | | | (6,531 | ) |
Zendesk, Inc. | | | 259 | | | | (0.60 | )% | | | (7,419 | ) |
Total Communications | | | | | | | | | | | (18,733 | ) |
| | | | | | | | | | | | | |
Energy | | | | | | | | | | | | |
Valero Energy Corp. | | | 556 | | | | (0.68 | )% | | | 3,608 | |
Chevron Corp. | | | 606 | | | | (1.09 | )% | | | 3,052 | |
Exxon Mobil Corp. | | | 606 | | | | (0.58 | )% | | | 2,888 | |
Cheniere Energy, Inc. | | | 565 | | | | (0.70 | )% | | | (56 | ) |
NOV, Inc. | | | 1,547 | | | | (0.36 | )% | | | (3,556 | ) |
Pioneer Natural Resources Co. | | | 152 | | | | (0.41 | )% | | | (4,036 | ) |
Hess Corp. | | | 292 | | | | (0.35 | )% | | | (5,262 | ) |
Phillips 66 | | | 878 | | | | (1.22 | )% | | | (5,491 | ) |
Schlumberger N.V. | | | 2,189 | | | | (1.02 | )% | | | (5,930 | ) |
ChampionX Corp. | | | 3,561 | | | | (1.32 | )% | | | (21,160 | ) |
Ovintiv, Inc. | | | 3,216 | | | | (1.31 | )% | | | (31,298 | ) |
Total Energy | | | | | | | | | | | (67,241 | ) |
| | | | | | | | | | | | | |
Consumer, Non-cyclical | | | | | | | | | | | | |
Nevro Corp. | | | 374 | | | | (0.89 | )% | | | 10,700 | |
Verisk Analytics, Inc. — Class A | | | 283 | | | | (0.86 | )% | | | 3,427 | |
CoStar Group, Inc. | | | 57 | | | | (0.80 | )% | | | 895 | |
Moody’s Corp. | | | 100 | | | | (0.51 | )% | | | (2,478 | ) |
Avalara, Inc. | | | 117 | | | | (0.27 | )% | | | (3,793 | ) |
Equifax, Inc. | | | 251 | | | | (0.78 | )% | | | (4,099 | ) |
WD-40 Co. | | | 80 | | | | (0.41 | )% | | | (5,494 | ) |
Avery Dennison Corp. | | | 222 | | | | (0.70 | )% | | | (16,690 | ) |
Total Consumer, Non-cyclical | | | | | | | | | | | (17,532 | ) |
| | | | | | | | | | | | | |
Utilities | | | | | | | | | | | | |
ALLETE, Inc. | | | 380 | | | | (0.43 | )% | | | (583 | ) |
California Water Service Group | | | 622 | | | | (0.60 | )% | | | (2,171 | ) |
Total Utilities | | | | | | | | | | | (2,754 | ) |
Total GS Equity Short Custom Basket | | | | | | | (701,874 | ) |
SEE NOTES TO FINANCIAL STATEMENTS. | THE RYDEX FUNDS ANNUAL REPORT | 25 |
SCHEDULE OF INVESTMENTS (concluded) | March 31, 2021 |
LONG SHORT EQUITY FUND | |
* | Non-income producing security. |
† | Value determined based on Level 1 inputs — See Note 4. |
†† | Value determined based on Level 2 inputs — See Note 4. |
1 | All or a portion of this security is pledged as equity custom basket swap collateral at March 31, 2021. |
2 | All or a portion of this security is on loan at March 31, 2021 — See Note 7. |
3 | Rate indicated is the 7-day yield as of March 31, 2021. |
4 | Securities lending collateral — See Note 7. |
| | GS — Goldman Sachs International |
| | MS — Morgan Stanley Capital Services LLC |
| | plc — Public Limited Company |
| | REIT — Real Estate Investment Trust |
| | |
| | See Sector Classification in Other Information section. |
The following table summarizes the inputs used to value the Fund’s investments at March 31, 2021 (See Note 4 in the Notes to Financial Statements):
Investments in Securities (Assets) | | Level 1
Quoted
Prices | | | Level 2
Significant
Observable
Inputs | | | Level 3
Significant
Unobservable
Inputs | | | Total | |
Common Stocks | | $ | 17,088,608 | | | $ | — | | | $ | — | | | $ | 17,088,608 | |
Money Market Fund | | | 417,373 | | | | — | | | | — | | | | 417,373 | |
Securities Lending Collateral | | | 86,162 | | | | — | | | | — | | | | 86,162 | |
Equity Custom Basket Swap Agreements** | | | — | | | | 1,186,519 | | | | — | | | | 1,186,519 | |
Total Assets | | $ | 17,592,143 | | | $ | 1,186,519 | | | $ | — | | | $ | 18,778,662 | |
Investments in Securities (Liabilities) | | Level 1
Quoted
Prices | | | Level 2
Significant
Observable
Inputs | | | Level 3
Significant
Unobservable
Inputs | | | Total | |
Equity Custom Basket Swap Agreements** | | $ | — | | | $ | 1,418,521 | | | $ | — | | | $ | 1,418,521 | |
** | This derivative is reported as unrealized appreciation/depreciation at period end. |
26 | THE RYDEX FUNDS ANNUAL REPORT | SEE NOTES TO FINANCIAL STATEMENTS. |
STATEMENT OF ASSETS AND LIABILITIES |
March 31, 2021 |
Assets: |
Investments, at value - including $84,230 of securities loaned (cost $14,640,041) | | $ | 17,592,143 | |
Cash | | | 1,902 | |
Unrealized appreciation on OTC swap agreements | | | 1,186,519 | |
Receivables: |
Dividends | | | 23,198 | |
Securities lending income | | | 13 | |
Fund shares sold | | | 6 | |
Total assets | | | 18,803,781 | |
| | | | | |
Liabilities: |
Unrealized depreciation on OTC swap agreements | | | 1,418,521 | |
Payable for: |
Swap settlement | | | 169,826 | |
Return of securities lending collateral | | | 86,162 | |
Management fees | | | 12,585 | |
Fund shares redeemed | | | 6,050 | |
Transfer agent and administrative fees | | | 3,762 | |
Distribution and service fees | | | 3,286 | |
Portfolio accounting fees | | | 1,398 | |
Trustees’ fees* | | | 253 | |
Miscellaneous | | | 18,218 | |
Total liabilities | | | 1,720,061 | |
Commitments and contingent liabilities (Note 11) | | | — | |
Net assets | | $ | 17,083,720 | |
| | | | | |
Net assets consist of: |
Paid in capital | | $ | 18,369,959 | |
Total distributable earnings (loss) | | | (1,286,239 | ) |
Net assets | | $ | 17,083,720 | |
| | | | | |
A-Class: |
Net assets | | $ | 8,044,442 | |
Capital shares outstanding | | | 423,807 | |
Net asset value per share | | $ | 18.98 | |
Maximum offering price per share (Net asset value divided by 95.25%) | | $ | 19.93 | |
| | | | | |
C-Class: |
Net assets | | $ | 377,717 | |
Capital shares outstanding | | | 22,740 | |
Net asset value per share | | $ | 16.61 | |
| | | | | |
P-Class: |
Net assets | | $ | 6,414,564 | |
Capital shares outstanding | | | 336,875 | |
Net asset value per share | | $ | 19.04 | |
| | | | | |
Institutional Class: |
Net assets | | $ | 2,246,997 | |
Capital shares outstanding | | | 115,259 | |
Net asset value per share | | $ | 19.50 | |
STATEMENT OF OPERATIONS |
Year Ended March 31, 2021 |
Investment Income: |
Dividends | | $ | 371,993 | |
Interest | | | 69 | |
Income from securities lending, net | | | 60 | |
Total investment income | | | 372,122 | |
| | | | | |
Expenses: |
Management fees | | | 141,847 | |
Distribution and service fees: |
A-Class | | | 18,606 | |
C-Class | | | 4,451 | |
P-Class | | | 14,594 | |
Transfer agent and administrative fees | | | 44,403 | |
Portfolio accounting fees | | | 15,763 | |
Registration fees | | | 13,488 | |
Professional fees | | | 7,800 | |
Trustees’ fees* | | | 3,740 | |
Custodian fees | | | 2,513 | |
Miscellaneous | | | 7,034 | |
Total expenses | | | 274,239 | |
Net investment income | | | 97,883 | |
| | | | | |
Net Realized and Unrealized Gain (Loss): |
Net realized gain (loss) on: |
Investments | | | 1,583,744 | |
Swap agreements | | | (2,382,497 | ) |
Net realized loss | | | (798,753 | ) |
Net change in unrealized appreciation (depreciation) on: |
Investments | | | 5,319,586 | |
Swap agreements | | | 130,978 | |
Net change in unrealized appreciation (depreciation) | | | 5,450,564 | |
Net realized and unrealized gain | | | 4,651,811 | |
Net increase in net assets resulting from operations | | $ | 4,749,694 | |
* | Relates to Trustees not deemed “interested persons” within the meaning of Section 2(a)(19) of the 1940 Act. |
SEE NOTES TO FINANCIAL STATEMENTS. | THE RYDEX FUNDS ANNUAL REPORT | 27 |
STATEMENTS OF CHANGES IN NET ASSETS |
| | Year Ended
March 31,
2021 | | | Year Ended
March 31,
2020 | |
Increase (Decrease) in Net Assets from Operations: | | | | | | | | |
Net investment income | | $ | 97,883 | | | $ | 113,222 | |
Net realized gain (loss) on investments | | | (798,753 | ) | | | 1,100,712 | |
Net change in unrealized appreciation (depreciation) on investments | | | 5,450,564 | | | | (3,461,630 | ) |
Net increase (decrease) in net assets resulting from operations | | | 4,749,694 | | | | (2,247,696 | ) |
| | | | | | | | | |
Distributions to shareholders: | | | | | | | | |
A-Class | | | (34,330 | ) | | | (68,033 | ) |
P-Class | | | (28,015 | ) | | | (66,392 | ) |
Institutional Class | | | (12,375 | ) | | | (19,220 | ) |
Total distributions to shareholders | | | (74,720 | ) | | | (153,645 | ) |
| | | | | | | | | |
Capital share transactions: | | | | | | | | |
Proceeds from sale of shares | | | | | | | | |
A-Class | | | 196,419 | | | | 577,147 | |
C-Class | | | 8,000 | | | | 7,950 | |
P-Class | | | 288,465 | | | | 323,678 | |
Institutional Class | | | 204,066 | | | | 835,323 | |
Distributions reinvested | | | | | | | | |
A-Class | | | 33,556 | | | | 67,459 | |
P-Class | | | 25,294 | | | | 61,922 | |
Institutional Class | | | 12,308 | | | | 19,220 | |
Cost of shares redeemed | | | | | | | | |
A-Class | | | (1,413,489 | ) | | | (2,659,455 | ) |
C-Class | | | (328,519 | ) | | | (754,681 | ) |
P-Class | | | (1,001,225 | ) | | | (3,414,692 | ) |
Institutional Class | | | (367,376 | ) | | | (798,573 | ) |
Net decrease from capital share transactions | | | (2,342,501 | ) | | | (5,734,702 | ) |
Net increase (decrease) in net assets | | | 2,332,473 | | | | (8,136,043 | ) |
| | | | | | | | | |
Net assets: | | | | | | | | |
Beginning of year | | | 14,751,247 | | | | 22,887,290 | |
End of year | | $ | 17,083,720 | | | $ | 14,751,247 | |
| | | | | | | | | |
Capital share activity: | | | | | | | | |
Shares sold | | | | | | | | |
A-Class | | | 11,844 | | | | 36,834 | |
C-Class | | | 564 | | | | 575 | |
P-Class | | | 16,987 | | | | 20,296 | |
Institutional Class | | | 12,752 | | | | 51,644 | |
Shares issued from reinvestment of distributions | | | | | | | | |
A-Class | | | 1,950 | | | | 4,146 | |
P-Class | | | 1,465 | | | | 3,794 | |
Institutional Class | | | 697 | | | | 1,152 | |
Shares redeemed | | | | | | | | |
A-Class | | | (87,189 | ) | | | (169,933 | ) |
C-Class | | | (23,557 | ) | | | (55,084 | ) |
P-Class | | | (60,649 | ) | | | (217,505 | ) |
Institutional Class | | | (22,057 | ) | | | (50,497 | ) |
Net decrease in shares | | | (147,193 | ) | | | (374,578 | ) |
28 | THE RYDEX FUNDS ANNUAL REPORT | SEE NOTES TO FINANCIAL STATEMENTS. |
This table is presented to show selected data for a share outstanding throughout each period and to assist shareholders in evaluating a Fund’s performance for the periods presented.
A-Class | | Year Ended
March 31,
2021 | | | Year Ended
March 31,
2020 | | | Year Ended
March 31,
2019 | | | Year Ended
March 29,
2018 | | | Year Ended
March 31,
2017 | |
Per Share Data |
Net asset value, beginning of period | | $ | 14.12 | | | $ | 16.20 | | | $ | 17.41 | | | $ | 15.80 | | | $ | 15.26 | |
Income (loss) from investment operations: |
Net investment income (loss)a | | | .10 | | | | .09 | | | | .10 | | | | — | b | | | (.09 | ) |
Net gain (loss) on investments (realized and unrealized) | | | 4.84 | | | | (2.04 | ) | | | (1.02 | ) | | | 1.61 | | | | .63 | |
Total from investment operations | | | 4.94 | | | | (1.95 | ) | | | (.92 | ) | | | 1.61 | | | | .54 | |
Less distributions from: |
Net investment income | | | (.08 | ) | | | (.13 | ) | | | — | | | | — | | | | — | |
Net realized gains | | | — | | | | — | | | | (.29 | ) | | | — | | | | — | |
Total distributions | | | (.08 | ) | | | (.13 | ) | | | (.29 | ) | | | — | | | | — | |
Net asset value, end of period | | $ | 18.98 | | | $ | 14.12 | | | $ | 16.20 | | | $ | 17.41 | | | $ | 15.80 | |
|
Total Returnc | | | 35.04 | % | | | (12.15 | %) | | | (5.31 | %) | | | 10.19 | % | | | 3.54 | % |
Ratios/Supplemental Data |
Net assets, end of period (in thousands) | | $ | 8,044 | | | $ | 7,021 | | | $ | 10,143 | | | $ | 4,012 | | | $ | 4,615 | |
Ratios to average net assets: |
Net investment income (loss) | | | 0.61 | % | | | 0.58 | % | | | 0.58 | % | | | 0.01 | % | | | (0.59 | %) |
Total expensesd,e | | | 1.75 | % | | | 1.78 | % | | | 1.78 | % | | | 1.77 | % | | | 2.25 | % |
Portfolio turnover rate | | | 162 | % | | | 119 | % | | | 170 | % | | | 328 | % | | | 223 | % |
C-Class | | Year Ended
March 31,
2021 | | | Year Ended
March 31,
2020 | | | Year Ended
March 31,
2019 | | | Year Ended
March 29,
2018 | | | Year Ended
March 31,
2017 | |
Per Share Data |
Net asset value, beginning of period | | $ | 12.39 | | | $ | 14.21 | | | $ | 15.43 | | | $ | 14.11 | | | $ | 13.72 | |
Income (loss) from investment operations: |
Net investment income (loss)a | | | (.02 | ) | | | (.02 | ) | | | (.07 | ) | | | (.11 | ) | | | (.18 | ) |
Net gain (loss) on investments (realized and unrealized) | | | 4.24 | | | | (1.80 | ) | | | (.86 | ) | | | 1.43 | | | | .57 | |
Total from investment operations | | | 4.22 | | | | (1.82 | ) | | | (.93 | ) | | | 1.32 | | | | .39 | |
Less distributions from: |
Net realized gains | | | — | | | | — | | | | (.29 | ) | | | — | | | | — | |
Total distributions | | | — | | | | — | | | | (.29 | ) | | | — | | | | — | |
Net asset value, end of period | | $ | 16.61 | | | $ | 12.39 | | | $ | 14.21 | | | $ | 15.43 | | | $ | 14.11 | |
|
Total Returnc | | | 34.06 | % | | | (12.81 | %) | | | (6.00 | %) | | | 9.36 | % | | | 2.77 | % |
Ratios/Supplemental Data |
Net assets, end of period (in thousands) | | $ | 378 | | | $ | 567 | | | $ | 1,424 | | | $ | 11,394 | | | $ | 13,235 | |
Ratios to average net assets: |
Net investment income (loss) | | | (0.16 | %) | | | (0.18 | %) | | | (0.43 | %) | | | (0.74 | %) | | | (1.30 | %) |
Total expensesd,e | | | 2.51 | % | | | 2.53 | % | | | 2.50 | % | | | 2.52 | % | | | 2.98 | % |
Portfolio turnover rate | | | 162 | % | | | 119 | % | | | 170 | % | | | 328 | % | | | 223 | % |
SEE NOTES TO FINANCIAL STATEMENTS. | THE RYDEX FUNDS ANNUAL REPORT | 29 |
FINANCIAL HIGHLIGHTS (continued) |
This table is presented to show selected data for a share outstanding throughout each period and to assist shareholders in evaluating a Fund’s performance for the periods presented.
P-Class | | Year Ended
March 31,
2021 | | | Year Ended
March 31,
2020 | | | Year Ended
March 31,
2019 | | | Year Ended
March 29,
2018 | | | Year Ended
March 31,
2017 | |
Per Share Data |
Net asset value, beginning of period | | $ | 14.17 | | | $ | 16.25 | | | $ | 17.47 | | | $ | 15.86 | | | $ | 15.31 | |
Income (loss) from investment operations: |
Net investment income (loss)a | | | .10 | | | | .09 | | | | .08 | | | | — | b | | | (.09 | ) |
Net gain (loss) on investments (realized and unrealized) | | | 4.85 | | | | (2.04 | ) | | | (1.01 | ) | | | 1.61 | | | | .64 | |
Total from investment operations | | | 4.95 | | | | (1.95 | ) | | | (.93 | ) | | | 1.61 | | | | .55 | |
Less distributions from: |
Net investment income | | | (.08 | ) | | | (.13 | ) | | | — | | | | — | | | | — | |
Net realized gains | | | — | | | | — | | | | (.29 | ) | | | — | | | | — | |
Total distributions | | | (.08 | ) | | | (.13 | ) | | | (.29 | ) | | | — | | | | — | |
Net asset value, end of period | | $ | 19.04 | | | $ | 14.17 | | | $ | 16.25 | | | $ | 17.47 | | | $ | 15.86 | |
|
Total Return | | | 35.09 | % | | | (12.17 | %) | | | (5.35 | %) | | | 10.15 | % | | | 3.53 | % |
Ratios/Supplemental Data |
Net assets, end of period (in thousands) | | $ | 6,415 | | | $ | 5,370 | | | $ | 9,303 | | | $ | 12,614 | | | $ | 13,779 | |
Ratios to average net assets: |
Net investment income (loss) | | | 0.61 | % | | | 0.57 | % | | | 0.47 | % | | | 0.01 | % | | | (0.58 | %) |
Total expensesd,e | | | 1.75 | % | | | 1.78 | % | | | 1.77 | % | | | 1.76 | % | | | 2.24 | % |
Portfolio turnover rate | | | 162 | % | | | 119 | % | | | 170 | % | | | 328 | % | | | 223 | % |
30 | THE RYDEX FUNDS ANNUAL REPORT | SEE NOTES TO FINANCIAL STATEMENTS. |
FINANCIAL HIGHLIGHTS (concluded) |
This table is presented to show selected data for a share outstanding throughout each period and to assist shareholders in evaluating a Fund’s performance for the periods presented.
Institutional Class | | Year Ended
March 31,
2021 | | | Year Ended
March 31,
2020 | | | Year Ended
March 31,
2019 | | | Year Ended
March 29,
2018 | | | Year Ended
March 31,
2017 | |
Per Share Data |
Net asset value, beginning of period | | $ | 14.49 | | | $ | 16.60 | | | $ | 17.79 | | | $ | 16.11 | | | $ | 15.50 | |
Income (loss) from investment operations: |
Net investment income (loss)a | | | .15 | | | | .14 | | | | .12 | | | | .05 | | | | (.03 | ) |
Net gain (loss) on investments (realized and unrealized) | | | 4.97 | | | | (2.10 | ) | | | (1.02 | ) | | | 1.63 | | | | .64 | |
Total from investment operations | | | 5.12 | | | | (1.96 | ) | | | (.90 | ) | | | 1.68 | | | | .61 | |
Less distributions from: |
Net investment income | | | (.11 | ) | | | (.15 | ) | | | — | | | | — | | | | — | |
Net realized gains | | | — | | | | — | | | | (.29 | ) | | | — | | | | — | |
Total distributions | | | (.11 | ) | | | (.15 | ) | | | (.29 | ) | | | — | | | | — | |
Net asset value, end of period | | $ | 19.50 | | | $ | 14.49 | | | $ | 16.60 | | | $ | 17.79 | | | $ | 16.11 | |
|
Total Return | | | 35.47 | % | | | (11.96 | %) | | | (5.08 | %) | | | 10.43 | % | | | 3.94 | % |
Ratios/Supplemental Data |
Net assets, end of period (in thousands) | | $ | 2,247 | | | $ | 1,794 | | | $ | 2,018 | | | $ | 2,722 | | | $ | 1,990 | |
Ratios to average net assets: |
Net investment income (loss) | | | 0.86 | % | | | 0.85 | % | | | 0.72 | % | | | 0.31 | % | | | (0.20 | %) |
Total expensesd,e | | | 1.50 | % | | | 1.53 | % | | | 1.51 | % | | | 1.50 | % | | | 1.96 | % |
Portfolio turnover rate | | | 162 | % | | | 119 | % | | | 170 | % | | | 328 | % | | | 223 | % |
a | Net investment income (loss) per share was computed using average shares outstanding throughout the period. |
b | Net investment income is less than $0.01 per share. |
c | Total return does not reflect the impact of any applicable sales charges. |
d | Does not include expenses of the underlying funds in which the Fund invests. |
e | Excluding interest and dividend expense related to short sales, the operating expense ratios for the years or periods presented was as follows: |
| | | 03/31/21 | 03/31/20 | 03/31/19 | 03/29/18 | 03/31/17 |
| | A-Class | 1.75% | 1.78% | 1.78% | 1.68% | 1.67% |
| | C-Class | 2.51% | 2.53% | 2.50% | 2.44% | 2.42% |
| | P-Class | 1.75% | 1.78% | 1.77% | 1.69% | 1.67% |
| | Institutional Class | 1.50% | 1.53% | 1.51% | 1.43% | 1.43% |
SEE NOTES TO FINANCIAL STATEMENTS. | THE RYDEX FUNDS ANNUAL REPORT | 31 |
PERFORMANCE REPORT AND FUND PROFILE (Unaudited) | March 31, 2021 |
EMERGING MARKETS 2x STRATEGY FUND
OBJECTIVE: Seeks to provide investment results that correlate, before fees and expenses, to the performance of a specific benchmark on a daily basis. The Fund’s current benchmark is 200% of the performance of the BNY Mellon Emerging Markets 50 ADR Index (the “underlying index”). The Fund does not seek to achieve its investment objective over a period of time greater than one day.
For the one-year period ended March 31, 2021, Emerging Markets 2x Strategy Fund H-Class returned 162.59%, while the BNY Mellon Emerging Markets 50 ADR Index returned 70.41% over the same period.
For the period, the Fund maintained a daily correlation of over 99% to its benchmark of 200% of the daily price movement of the BNY Mellon Emerging Markets 50 ADR Index.
The sectors that contributed the most to the performance of the underlying index over the past year were semiconductors & semiconductor equipment, banks, and metals & mining. The sectors that detracted the most were internet & direct marketing retail, diversified consumer services, and automobiles.
The stocks that contributed the most to the return of the underlying index over the past year were Taiwan Semiconductor Manufacturing Co. ADR, HDFC Bank Ltd. ADR, and Infosys Ltd. ADR. The stocks that detracted the most were Pinduoduo, Inc. ADR Class A, NIO, Inc. ADR Class A, and TAL Education Group ADR Class A.
Derivatives in the Fund were used to help provide exposure to the composition of the benchmark in the most efficient manner possible and to provide leverage, not for hedging purposes. The results of derivatives use during the period were within our expectations and were factors in the Fund’s positive performance.
Due to the compounding of daily returns, leveraged and inverse funds’ returns over periods other than one day will likely differ in amount and possibly direction from the benchmark return for the same period. Investors should monitor their leveraged and inverse funds’ holdings to ensure that they are consistent with their strategies, as frequently as daily.
The effects of compounding may cause the longer-term correlation of the Fund to its benchmark to diminish. The apparent discrepancy between the leveraged and unleveraged indices is the result of compounding, which is described briefly on page 6 of this report.
Performance displayed represents past performance, which is no guarantee of future results.
Holdings Diversification (Market Exposure as % of Net Assets)
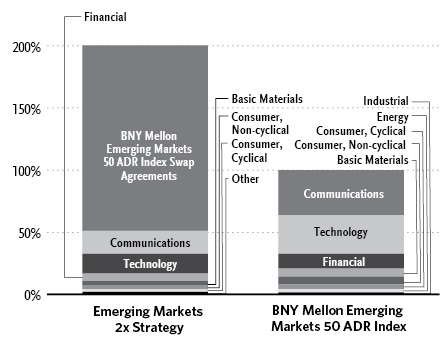
“Holdings Diversification (Market Exposure as % of Net Assets)” excludes any temporary cash investments.
Inception Dates: |
A-Class | October 29, 2010 |
C-Class | October 29, 2010 |
H-Class | October 29, 2010 |
32 | THE RYDEX FUNDS ANNUAL REPORT | |
PERFORMANCE REPORT AND FUND PROFILE (Unaudited)(concluded) | March 31, 2021 |
Country Diversification
Country | | % of Long-Term
Investments | |
China | | | 25.9 | % |
Taiwan, Province of China | | | 23.9 | % |
Cayman Islands | | | 20.7 | % |
India | | | 12.5 | % |
Brazil | | | 9.5 | % |
Republic of Korea | | | 2.9 | % |
Mexico | | | 2.3 | % |
Other | | | 2.3 | % |
Total Long-Term Investments | | | 100.0 | % |
Ten Largest Holdings (% of Total Net Assets) |
Taiwan Semiconductor Manufacturing Company Ltd. ADR | 10.9% |
Alibaba Group Holding Ltd. ADR | 10.1% |
HDFC Bank Ltd. ADR | 2.6% |
JD.com, Inc. ADR | 2.2% |
Infosys Ltd. ADR | 2.0% |
Vale S.A. ADR | 1.7% |
Baidu, Inc. ADR | 1.7% |
NIO, Inc. ADR | 1.4% |
Pinduoduo, Inc. ADR | 1.3% |
NetEase, Inc. ADR | 1.2% |
Top Ten Total | 35.1% |
| | |
“Ten Largest Holdings” excludes any temporary cash or derivative investments. |
Cumulative Fund Performance*
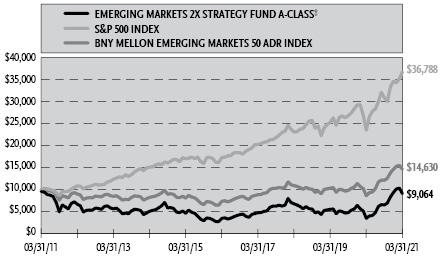
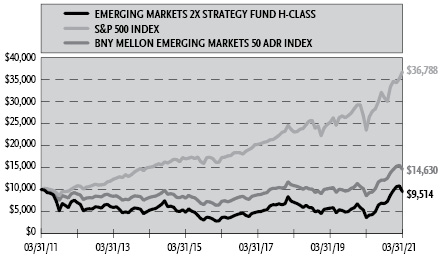
Average Annual Returns*
Periods Ended March 31, 2021
| 1 Year | 5 Year | 10 Year |
A-Class Shares | 162.66% | 21.18% | (0.50%) |
A-Class Shares with sales charge‡ | 150.17% | 20.00% | (0.98%) |
C-Class Shares | 160.68% | 20.27% | (1.10%) |
C-Class Shares with CDSC§ | 159.68% | 20.27% | (1.10%) |
H-Class Shares | 162.59% | 21.14% | (0.50%) |
BNY Mellon Emerging Markets 50 ADR Index | 70.41% | 14.77% | 3.88% |
S&P 500 Index | 56.35% | 16.29% | 13.91% |
* | The performance data above represents past performance that is not predictive of future results. The investment return and principal value of an investment in the Fund will fluctuate so that an investor’s shares, when redeemed, may be worth more or less than their original cost. Returns are historical and include changes in principal and reinvested dividends and capital gains and do not reflect the effect of taxes. The BNY Mellon Emerging Markets 50 ADR Index and S&P 500 Index are unmanaged indices and, unlike the Fund, have no management fees or operating expenses to reduce their reported returns. The graphs are based on A-Class shares and H-Class shares only; performance for C-Class shares will vary due to differences in fee structure. |
‡ | Fund returns are calculated using the maximum sales charge of 4.75%. |
§ | Fund returns include a CDSC of 1% if redeemed within 12 months of purchase. |
| | THE RYDEX FUNDS ANNUAL REPORT | 33 |
SCHEDULE OF INVESTMENTS | March 31, 2021 |
EMERGING MARKETS 2x STRATEGY FUND | |
| | Shares | | | Value | |
COMMON STOCKS† - 50.0% |
| | | | | | | | | |
Communications - 18.6% |
Alibaba Group Holding Ltd. ADR* | | | 3,526 | | | $ | 799,450 | |
JD.com, Inc. ADR* | | | 2,046 | | | | 172,539 | |
Baidu, Inc. ADR* | | | 622 | | | | 135,316 | |
Pinduoduo, Inc. ADR* | | | 797 | | | | 106,702 | |
Trip.com Group Ltd. ADR* | | | 1,041 | | | | 41,255 | |
America Movil SAB de CV — Class L ADR | | | 2,703 | | | | 36,707 | |
Chunghwa Telecom Company Ltd. ADR | | | 867 | | | | 33,934 | |
Vipshop Holdings Ltd. ADR* | | | 881 | | | | 26,307 | |
Telkom Indonesia Persero Tbk PT ADR | | | 1,084 | | | | 25,626 | |
SK Telecom Company Ltd. ADR | | | 812 | | | | 22,111 | |
GDS Holdings Ltd. ADR* | | | 260 | | | | 21,083 | |
KE Holdings, Inc. ADR* | | | 363 | | | | 20,684 | |
Tencent Music Entertainment Group ADR* | | | 948 | | | | 19,425 | |
iQIYI, Inc. ADR* | | | 739 | | | | 12,282 | |
Total Communications | | | | | | | 1,473,421 | |
| | | | | | | | | |
Technology - 15.9% |
Taiwan Semiconductor Manufacturing Company Ltd. ADR | | | 7,255 | | | | 858,121 | |
Infosys Ltd. ADR | | | 8,351 | | | | 156,331 | |
NetEase, Inc. ADR | | | 914 | | | | 94,380 | |
United Microelectronics Corp. ADR1 | | | 5,267 | | | | 47,982 | |
Bilibili, Inc. ADR* | | | 354 | | | | 37,899 | |
ASE Technology Holding Company Ltd. ADR | | | 3,868 | | | | 29,784 | |
Wipro Ltd. ADR | | | 3,247 | | | | 20,586 | |
GSX Techedu, Inc. ADR* | | | 257 | | | | 8,707 | |
Total Technology | | | | | | | 1,253,790 | |
| | | | | | | | | |
Financial - 5.4% |
HDFC Bank Ltd. ADR* | | | 2,604 | | | | 202,305 | |
ICICI Bank Ltd. ADR* | | | 5,830 | | | | 93,455 | |
Banco Bradesco S.A. ADR | | | 10,110 | | | | 47,517 | |
KB Financial Group, Inc. ADR | | | 891 | | | | 44,042 | |
China Life Insurance Company Ltd. ADR1 | | | 3,393 | | | | 35,321 | |
Total Financial | | | | | | | 422,640 | |
| | | | | | | | | |
Basic Materials - 3.5% |
Vale S.A. ADR | | | 7,830 | | | | 136,086 | |
POSCO ADR | | | 731 | | | | 52,778 | |
Sibanye Stillwater Ltd. ADR | | | 1,566 | | | | 27,969 | |
AngloGold Ashanti Ltd. ADR | | | 950 | | | | 20,871 | |
Suzano S.A. ADR* | | | 1,614 | | | | 19,723 | |
Gold Fields Ltd. ADR | | | 2,014 | | | | 19,113 | |
Total Basic Materials | | | | | | | 276,540 | |
| | | | | | | | | |
Consumer, Non-cyclical - 3.1% |
TAL Education Group ADR* | | | 911 | | | | 49,057 | |
New Oriental Education & Technology Group, Inc. ADR* | | | 3,414 | | | | 47,796 | |
Fomento Economico Mexicano SAB de CV ADR | | | 424 | | | | 31,940 | |
BeiGene Ltd. ADR* | | | 90 | | | | 31,327 | |
Ambev S.A. ADR | | | 10,043 | | | | 27,518 | |
Zai Lab Ltd. ADR* | | | 159 | | | | 21,216 | |
Dr Reddy’s Laboratories Ltd. ADR | | | 277 | | | | 17,005 | |
Natura & Company Holding S.A. ADR*,1 | | | 956 | | | | 16,242 | |
Total Consumer, Non-cyclical | | | | | | | 242,101 | |
| | | | | | | | | |
Consumer, Cyclical - 1.9% |
NIO, Inc. ADR* | | | 2,946 | | | | 114,835 | |
Huazhu Group Ltd. ADR* | | | 330 | | | | 18,117 | |
Tata Motors Ltd. ADR* | | | 863 | | | | 17,942 | |
Total Consumer, Cyclical | | | | | | | 150,894 | |
| | | | | | | | | |
Energy - 0.8% |
Petroleo Brasileiro S.A. ADR | | | 4,241 | | | | 35,963 | |
China Petroleum & Chemical Corp. ADR | | | 582 | | | | 30,689 | |
Total Energy | | | | | | | 66,652 | |
| | | | | | | | | |
Industrial - 0.8% |
ZTO Express Cayman, Inc. ADR | | | 1,436 | | | | 41,859 | |
Cemex SAB de CV ADR* | | | 3,451 | | | | 24,054 | |
Total Industrial | | | | | | | 65,913 | |
| | | | | | | | | |
Total Common Stocks | | | | |
(Cost $3,293,310) | | | | | | | 3,951,951 | |
| | | | | | | | | |
PREFERRED STOCKS† - 1.2% |
Financial - 0.7% |
Itau Unibanco Holding S.A. ADR | | | 11,047 | | | | 54,793 | |
| | | | | | | | | |
Energy - 0.5% |
Petroleo Brasileiro S.A. ADR | | | 5,236 | | | | 44,716 | |
Total Preferred Stocks | | | | |
(Cost $98,454) | | | | | | | 99,509 | |
| | | | | | | | | |
| | | Face
Amount | | | | | |
REPURCHASE AGREEMENTS††,2 - 71.0% |
J.P. Morgan Securities LLC
issued 03/31/21 at 0.01%
due 04/01/213 | | $ | 3,000,378 | | | | 3,000,378 | |
Barclays Capital, Inc.
issued 03/31/21 at 0.01%
due 04/01/213 | | | 1,364,118 | | | | 1,364,118 | |
BofA Securities, Inc.
issued 03/31/21 at 0.01%
due 04/01/213 | | | 1,244,970 | | | | 1,244,970 | |
Total Repurchase Agreements | | | | |
(Cost $5,609,466) | | | | | | | 5,609,466 | |
34 | THE RYDEX FUNDS ANNUAL REPORT | SEE NOTES TO FINANCIAL STATEMENTS. |
SCHEDULE OF INVESTMENTS (continued) | March 31, 2021 |
EMERGING MARKETS 2x STRATEGY FUND | |
| | Shares | | | Value | |
SECURITIES LENDING COLLATERAL†,4 - 0.4% |
Money Market Fund | | | | | | | | |
First American Government Obligations Fund — Class Z, 0.03%5 | | | 32,816 | | | $ | 32,816 | |
Total Securities Lending Collateral | | | | |
(Cost $32,816) | | | | | | | 32,816 | |
| | | | | | | | | |
Total Investments - 122.6% | | | | |
(Cost $9,034,046) | | $ | 9,693,742 | |
Other Assets & Liabilities, net - (22.6)% | | | (1,789,627 | ) |
Total Net Assets - 100.0% | | $ | 7,904,115 | |
Total Return Swap Agreements |
Counterparty | Index | Financing
Rate Pay | Payment
Frequency | | Maturity
Date | | | Units | | | Notional
Amount | | | Value and
Unrealized
Depreciation | |
OTC Equity Index Swap Agreements†† |
Goldman Sachs International | BNY Mellon Emerging Markets 50 ADR Index | 0.64% (1 Week USD LIBOR + 0.55%) | At Maturity | 04/08/21 | | | 1,564 | | | $ | 5,621,029 | | | $ | (1,153 | ) |
BNP Paribas | BNY Mellon Emerging Markets 50 ADR Index | 0.71% (1 Month USD LIBOR + 0.60%) | At Maturity | 04/08/21 | | | 1,718 | | | | 6,174,239 | | | | (897,774 | ) |
| | | | | | | | | | | | | | $ | 11,795,268 | | | $ | (898,927 | ) |
* | Non-income producing security. |
† | Value determined based on Level 1 inputs — See Note 4. |
†† | Value determined based on Level 2 inputs — See Note 4. |
1 | All or a portion of this security is on loan at March 31, 2021 — See Note 7. |
2 | Repurchase Agreements — See Note 6. |
3 | All or a portion of this security is pledged as equity index swap collateral at March 31, 2021. |
4 | Securities lending collateral — See Note 7. |
5 | Rate indicated is the 7-day yield as of March 31, 2021. |
| | ADR — American Depositary Receipt |
| | LIBOR — London Interbank Offered Rate |
| | |
| | See Sector Classification in Other Information section. |
SEE NOTES TO FINANCIAL STATEMENTS. | THE RYDEX FUNDS ANNUAL REPORT | 35 |
SCHEDULE OF INVESTMENTS (concluded) | March 31, 2021 |
EMERGING MARKETS 2x STRATEGY FUND | |
The following table summarizes the inputs used to value the Fund’s investments at March 31, 2021 (See Note 4 in the Notes to Financial Statements):
Investments in Securities (Assets) | | Level 1
Quoted
Prices | | | Level 2
Significant
Observable
Inputs | | | Level 3
Significant
Unobservable
Inputs | | | Total | |
Common Stocks | | $ | 3,951,951 | | | $ | — | | | $ | — | | | $ | 3,951,951 | |
Preferred Stocks | | | 99,509 | | | | — | | | | — | | | | 99,509 | |
Repurchase Agreements | | | — | | | | 5,609,466 | | | | — | | | | 5,609,466 | |
Securities Lending Collateral | | | 32,816 | | | | — | | | | — | | | | 32,816 | |
Total Assets | | $ | 4,084,276 | | | $ | 5,609,466 | | | $ | — | | | $ | 9,693,742 | |
Investments in Securities (Liabilities) | | Level 1
Quoted
Prices | | | Level 2
Significant
Observable
Inputs | | | Level 3
Significant
Unobservable
Inputs | | | Total | |
Equity Index Swap Agreements** | | $ | — | | | $ | 898,927 | | | $ | — | | | $ | 898,927 | |
** | This derivative is reported as unrealized appreciation/depreciation at period end. |
36 | THE RYDEX FUNDS ANNUAL REPORT | SEE NOTES TO FINANCIAL STATEMENTS. |
EMERGING MARKETS 2x STRATEGY FUND | |
STATEMENT OF ASSETS AND LIABILITIES |
March 31, 2021 |
Assets: |
Investments, at value - including $31,851 of securities loaned (cost $3,424,580) | | $ | 4,084,276 | |
Repurchase agreements, at value (cost $5,609,466) | | | 5,609,466 | |
Cash | | | 5 | |
Receivables: |
Fund shares sold | | | 543,125 | |
Dividends | | | 3,247 | |
Foreign tax reclaims | | | 477 | |
Securities lending income | | | 24 | |
Total assets | | | 10,240,620 | |
| | | | | |
Liabilities: |
Unrealized depreciation on OTC swap agreements | | | 898,927 | |
Payable for: |
Swap settlement | | | 1,115,713 | |
Fund shares redeemed | | | 264,230 | |
Return of securities lending collateral | | | 32,816 | |
Management fees | | | 5,851 | |
Distribution and service fees | | | 1,933 | |
Transfer agent and administrative fees | | | 1,749 | |
Portfolio accounting fees | | | 975 | |
Trustees’ fees* | | | 121 | |
Miscellaneous | | | 14,190 | |
Total liabilities | | | 2,336,505 | |
Commitments and contingent liabilities (Note 11) | | | — | |
Net assets | | $ | 7,904,115 | |
| | | | | |
Net assets consist of: |
Paid in capital | | $ | 18,660,567 | |
Total distributable earnings (loss) | | | (10,756,452 | ) |
Net assets | | $ | 7,904,115 | |
| | | | | |
A-Class: |
Net assets | | $ | 647,050 | |
Capital shares outstanding | | | 5,562 | |
Net asset value per share | | $ | 116.33 | |
Maximum offering price per share (Net asset value divided by 95.25%) | | $ | 122.13 | |
| | | | | |
C-Class: |
Net assets | | $ | 449,481 | |
Capital shares outstanding | | | 4,126 | |
Net asset value per share | | $ | 108.94 | |
| | | | | |
H-Class: |
Net assets | | $ | 6,807,584 | |
Capital shares outstanding | | | 58,533 | |
Net asset value per share | | $ | 116.30 | |
STATEMENT OF OPERATIONS |
Year Ended March 31, 2021 |
Investment Income: |
Dividends (net of foreign withholding tax of $3,146) | | $ | 32,372 | |
Interest | | | 2,083 | |
Income from securities lending, net | | | 109 | |
Total investment income | | | 34,564 | |
| | | | | |
Expenses: |
Management fees | | | 56,021 | |
Distribution and service fees: |
A-Class | | | 2,081 | |
C-Class | | | 3,908 | |
H-Class | | | 12,508 | |
Transfer agent and administrative fees | | | 17,216 | |
Portfolio accounting fees | | | 9,338 | |
Professional fees | | | 1,636 | |
Custodian fees | | | 1,038 | |
Trustees’ fees* | | | 856 | |
Interest expense | | | 33 | |
Miscellaneous | | | 11,157 | |
Total expenses | | | 115,792 | |
Net investment loss | | | (81,228 | ) |
| | | | | |
Net Realized and Unrealized Gain (Loss): |
Net realized gain (loss) on: |
Investments | | | (3,173 | ) |
Swap agreements | | | 4,283,457 | |
Futures contracts | | | 60,369 | |
Net realized gain | | | 4,340,653 | |
Net change in unrealized appreciation (depreciation) on: |
Investments | | | 630,547 | |
Swap agreements | | | (796,482 | ) |
Futures contracts | | | (107 | ) |
Net change in unrealized appreciation (depreciation) | | | (166,042 | ) |
Net realized and unrealized gain | | | 4,174,611 | |
Net increase in net assets resulting from operations | | $ | 4,093,383 | |
* | Relates to Trustees not deemed “interested persons” within the meaning of Section 2(a)(19) of the 1940 Act. |
SEE NOTES TO FINANCIAL STATEMENTS. | THE RYDEX FUNDS ANNUAL REPORT | 37 |
EMERGING MARKETS 2x STRATEGY FUND | |
STATEMENTS OF CHANGES IN NET ASSETS |
| | Year Ended
March 31,
2021 | | | Year Ended
March 31,
2020 | |
Increase (Decrease) in Net Assets from Operations: | | | | | | | | |
Net investment loss | | $ | (81,228 | ) | | $ | (2,403 | ) |
Net realized gain (loss) on investments | | | 4,340,653 | | | | (3,827,042 | ) |
Net change in unrealized appreciation (depreciation) on investments | | | (166,042 | ) | | | (1,110,916 | ) |
Net increase (decrease) in net assets resulting from operations | | | 4,093,383 | | | | (4,940,361 | ) |
| | | | | | | | | |
Distributions to shareholders: | | | | | | | | |
A-Class | | | — | | | | (7,524 | ) |
C-Class | | | — | | | | (1,845 | ) |
H-Class | | | — | | | | (35,229 | ) |
Total distributions to shareholders | | | — | | | | (44,598 | ) |
| | | | | | | | | |
Capital share transactions: | | | | | | | | |
Proceeds from sale of shares | | | | | | | | |
A-Class | | | 8,376,517 | | | | 903,892 | |
C-Class | | | 412,755 | | | | 1,815,669 | |
H-Class | | | 119,205,321 | | | | 214,239,492 | |
Distributions reinvested | | | | | | | | |
A-Class | | | — | | | | 7,503 | |
C-Class | | | — | | | | 1,805 | |
H-Class | | | — | | | | 34,340 | |
Cost of shares redeemed | | | | | | | | |
A-Class | | | (9,178,674 | ) | | | (2,144,611 | ) |
C-Class | | | (426,896 | ) | | | (1,980,620 | ) |
H-Class | | | (116,830,877 | ) | | | (214,946,228 | ) |
Net increase (decrease) from capital share transactions | | | 1,558,146 | | | | (2,068,758 | ) |
Net increase (decrease) in net assets | | | 5,651,529 | | | | (7,053,717 | ) |
| | | | | | | | | |
Net assets: | | | | | | | | |
Beginning of year | | | 2,252,586 | | | | 9,306,303 | |
End of year | | $ | 7,904,115 | | | $ | 2,252,586 | |
| | | | | | | | | |
Capital share activity: | | | | | | | | |
Shares sold | | | | | | | | |
A-Class | | | 77,226 | | | | 14,019 | |
C-Class | | | 4,706 | | | | 27,838 | |
H-Class | | | 1,339,008 | | | | 3,178,461 | |
Shares issued from reinvestment of distributions | | | | | | | | |
A-Class | | | — | | | | 93 | |
C-Class | | | — | | | | 24 | |
H-Class | | | — | | | | 426 | |
Shares redeemed | | | | | | | | |
A-Class | | | (85,834 | ) | | | (31,579 | ) |
C-Class | | | (4,440 | ) | | | (30,269 | ) |
H-Class | | | (1,313,520 | ) | | | (3,239,286 | ) |
Net increase (decrease) in shares | | | 17,146 | | | | (80,273 | ) |
38 | THE RYDEX FUNDS ANNUAL REPORT | SEE NOTES TO FINANCIAL STATEMENTS. |
EMERGING MARKETS 2x STRATEGY FUND | |
This table is presented to show selected data for a share outstanding throughout each period and to assist shareholders in evaluating a Fund’s performance for the periods presented.
A-Class | | Year Ended
March 31,
2021 | | | Year Ended
March 31,
2020 | | | Year Ended
March 31,
2019 | | | Year Ended
March 29,
2018 | | | Year Ended
March 31,
2017 | |
Per Share Data |
Net asset value, beginning of period | | $ | 44.29 | | | $ | 71.02 | | | $ | 87.20 | | | $ | 60.99 | | | $ | 44.79 | |
Income (loss) from investment operations: |
Net investment income (loss)a | | | (.94 | ) | | | .17 | | | | .40 | | | | (.24 | ) | | | (.48 | ) |
Net gain (loss) on investments (realized and unrealized) | | | 72.98 | | | | (26.42 | ) | | | (16.58 | ) | | | 26.45 | | | | 16.68 | |
Total from investment operations | | | 72.04 | | | | (26.25 | ) | | | (16.18 | ) | | | 26.21 | | | | 16.20 | |
Less distributions from: |
Net investment income | | | — | | | | (.48 | ) | | | — | | | | — | | | | — | |
Total distributions | | | — | | | | (.48 | ) | | | — | | | | — | | | | — | |
Net asset value, end of period | | $ | 116.33 | | | $ | 44.29 | | | $ | 71.02 | | | $ | 87.20 | | | $ | 60.99 | |
|
Total Returnb | | | 162.66 | % | | | (37.27 | %) | | | (18.56 | %) | | | 42.97 | % | | | 36.17 | % |
Ratios/Supplemental Data |
Net assets, end of period (in thousands) | | $ | 647 | | | $ | 628 | | | $ | 2,247 | | | $ | 3,187 | | | $ | 628 | |
Ratios to average net assets: |
Net investment income (loss) | | | (1.10 | %) | | | 0.25 | % | | | 0.54 | % | | | (0.30 | %) | | | (0.96 | %) |
Total expenses | | | 1.83 | % | | | 1.86 | % | | | 1.84 | % | | | 1.76 | % | | | 1.76 | % |
Portfolio turnover rate | | | 632 | % | | | 974 | % | | | 1,978 | % | | | 1,006 | % | | | 2,568 | % |
C-Class | | Year Ended
March 31,
2021 | | | Year Ended
March 31,
2020 | | | Year Ended
March 31,
2019 | | | Year Ended
March 29,
2018 | | | Year Ended
March 31,
2017 | |
Per Share Data |
Net asset value, beginning of period | | $ | 41.79 | | | $ | 67.53 | | | $ | 83.55 | | | $ | 58.90 | | | $ | 43.56 | |
Income (loss) from investment operations: |
Net investment income (loss)a | | | (1.69 | ) | | | (.28 | ) | | | (.22 | ) | | | (.61 | ) | | | (.79 | ) |
Net gain (loss) on investments (realized and unrealized) | | | 68.84 | | | | (24.98 | ) | | | (15.80 | ) | | | 25.26 | | | | 16.13 | |
Total from investment operations | | | 67.15 | | | | (25.26 | ) | | | (16.02 | ) | | | 24.65 | | | | 15.34 | |
Less distributions from: |
Net investment income | | | — | | | | (.48 | ) | | | — | | | | — | | | | — | |
Total distributions | | | — | | | | (.48 | ) | | | — | | | | — | | | | — | |
Net asset value, end of period | | $ | 108.94 | | | $ | 41.79 | | | $ | 67.53 | | | $ | 83.55 | | | $ | 58.90 | |
|
Total Returnb | | | 160.68 | % | | | (37.73 | %) | | | (19.17 | %) | | | 41.87 | % | | | 35.19 | % |
Ratios/Supplemental Data |
Net assets, end of period (in thousands) | | $ | 449 | | | $ | 161 | | | $ | 423 | | | $ | 522 | | | $ | 361 | |
Ratios to average net assets: |
Net investment income (loss) | | | (1.95 | %) | | | (0.44 | %) | | | (0.33 | %) | | | (0.82 | %) | | | (1.55 | %) |
Total expenses | | | 2.57 | % | | | 2.60 | % | | | 2.59 | % | | | 2.56 | % | | | 2.50 | % |
Portfolio turnover rate | | | 632 | % | | | 974 | % | | | 1,978 | % | | | 1,006 | % | | | 2,568 | % |
SEE NOTES TO FINANCIAL STATEMENTS. | THE RYDEX FUNDS ANNUAL REPORT | 39 |
EMERGING MARKETS 2x STRATEGY FUND | |
FINANCIAL HIGHLIGHTS (concluded) |
This table is presented to show selected data for a share outstanding throughout each period and to assist shareholders in evaluating a Fund’s performance for the periods presented.
H-Class | | Year Ended
March 31,
2021 | | | Year Ended
March 31,
2020 | | | Year Ended
March 31,
2019 | | | Year Ended
March 29,
2018 | | | Year Ended
March 31,
2017 | |
Per Share Data |
Net asset value, beginning of period | | $ | 44.29 | | | $ | 71.02 | | | $ | 87.21 | | | $ | 61.01 | | | $ | 44.84 | |
Income (loss) from investment operations: |
Net investment income (loss)a | | | (1.28 | ) | | | (.05 | ) | | | .50 | | | | (.25 | ) | | | (.42 | ) |
Net gain (loss) on investments (realized and unrealized) | | | 73.29 | | | | (26.20 | ) | | | (16.69 | ) | | | 26.45 | | | | 16.59 | |
Total from investment operations | | | 72.01 | | | | (26.25 | ) | | | (16.19 | ) | | | 26.20 | | | | 16.17 | |
Less distributions from: |
Net investment income | | | — | | | | (.48 | ) | | | — | | | | — | | | | — | |
Total distributions | | | — | | | | (.48 | ) | | | — | | | | — | | | | — | |
Net asset value, end of period | | $ | 116.30 | | | $ | 44.29 | | | $ | 71.02 | | | $ | 87.21 | | | $ | 61.01 | |
|
Total Return | | | 162.59 | % | | | (37.27 | %) | | | (18.56 | %) | | | 42.95 | % | | | 36.04 | % |
Ratios/Supplemental Data |
Net assets, end of period (in thousands) | | $ | 6,808 | | | $ | 1,464 | | | $ | 6,636 | | | $ | 27,270 | | | $ | 6,698 | |
Ratios to average net assets: |
Net investment income (loss) | | | (1.29 | %) | | | (0.07 | %) | | | 0.71 | % | | | (0.32 | %) | | | (0.82 | %) |
Total expenses | | | 1.81 | % | | | 1.87 | % | | | 1.85 | % | | | 1.77 | % | | | 1.76 | % |
Portfolio turnover rate | | | 632 | % | | | 974 | % | | | 1,978 | % | | | 1,006 | % | | | 2,568 | % |
a | Net investment income (loss) per share was computed using average shares outstanding throughout the period. |
b | Total return does not reflect the impact of any applicable sales charges. |
40 | THE RYDEX FUNDS ANNUAL REPORT | SEE NOTES TO FINANCIAL STATEMENTS. |
PERFORMANCE REPORT AND FUND PROFILE (Unaudited) | March 31, 2021 |
INVERSE EMERGING MARKETS 2x STRATEGY FUND
OBJECTIVE: Seeks to provide investment results that correlate, before fees and expenses, to the performance of a specific benchmark on a daily basis. The Fund’s current benchmark is 200% of the inverse (opposite) of the performance of the BNY Mellon Emerging Markets 50 ADR Index (the “underlying index”). The Fund does not seek to achieve its investment objective over a period of time greater than one day.
For the one-year period ended March 31, 2021, Inverse Emerging Markets 2x Strategy Fund H-Class returned -72.97%, while the BNY Mellon Emerging Markets 50 ADR Index returned 70.41% over the same period.
For the period, the Fund maintained a daily correlation of over 99% to its benchmark of -200% of the daily price movement of the BNY Mellon Emerging Markets 50 ADR Index.
The sectors that contributed the most to the performance of the underlying index over the past year were semiconductors & semiconductor equipment, banks, and metals & mining. The sectors that detracted the most were Internet & direct marketing retail, diversified consumer services, and automobiles.
The stocks that contributed the most to the return of the underlying index over the past year were Taiwan Semiconductor Manufacturing Co. ADR, HDFC Bank Ltd. ADR, and Infosys Ltd. ADR. The stocks that detracted the most were Pinduoduo, Inc. ADR Class A, NIO, Inc. ADR Class A, and TAL Education Group ADR Class A.
Derivatives in the Fund were used to help provide exposure to the composition of the benchmark in the most efficient manner possible and to provide leverage, not for hedging purposes. The results of derivatives use during the period were within our expectations and were a factor in the Fund’s negative performance.
Due to the compounding of daily returns, leveraged and inverse funds’ returns over periods other than one day will likely differ in amount and possibly direction from the benchmark return for the same period. Investors should monitor their leveraged and inverse funds’ holdings to ensure that they are consistent with their strategies, as frequently as daily.
The effects of compounding may cause the longer-term correlation of the Fund to its benchmark to diminish. The apparent discrepancy between the leveraged and unleveraged indices is the result of compounding, which is described briefly on page 6 of this report.
Performance displayed represents past performance, which is no guarantee of future results.
Holdings Diversification (Market Exposure as % of Net Assets)
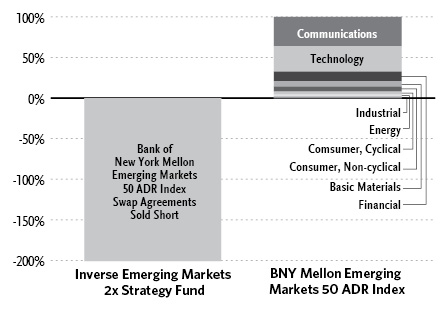
“Holdings Diversification (Market Exposure as % of Net Assets)” excludes any temporary cash investments.
Inception Dates: |
A-Class | October 29, 2010 |
C-Class | October 29, 2010 |
H-Class | October 29, 2010 |
The Fund invests principally in derivative investments such as swap agreements and futures contracts.
| | THE RYDEX FUNDS ANNUAL REPORT | 41 |
PERFORMANCE REPORT AND FUND PROFILE (Unaudited)(concluded) | March 31, 2021 |
Cumulative Fund Performance*

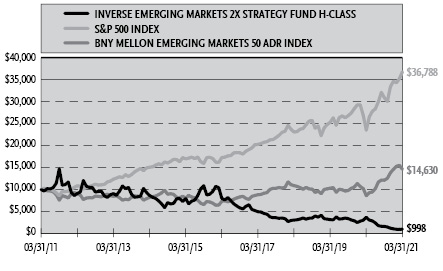
Average Annual Returns*
Periods Ended March 31, 2021
| 1 Year | 5 Year | 10 Year |
A-Class Shares | (73.37%) | (34.19%) | (20.64%) |
A-Class Shares with sales charge‡ | (74.57%) | (34.83%) | (21.03%) |
C-Class Shares | (73.52%) | (34.49%) | (20.74%) |
C-Class Shares with CDSC§ | (73.78%) | (34.49%) | (20.74%) |
H-Class Shares | (72.97%) | (34.01%) | (20.58%) |
S&P 500 Index | 56.35% | 16.29% | 13.91% |
BNY Mellon Emerging Markets 50 ADR Index | 70.41% | 14.77% | 3.88% |
* | The performance data above represents past performance that is not predictive of future results. The investment return and principal value of an investment in the Fund will fluctuate so that an investor’s shares, when redeemed, may be worth more or less than their original cost. Returns are historical and include changes in principal and reinvested dividends and capital gains and do not reflect the effect of taxes. The BNY Mellon Emerging Markets 50 ADR Index and the S&P 500 Index are unmanaged indices and, unlike the Fund, have no management fees or operating expenses to reduce their reported returns. The graphs are based on A-Class shares and H-Class shares only: performance for C-Class shares will vary due to differences in fee structure. |
‡ | Fund returns are calculated using the maximum sales charge of 4.75%. |
§ | Fund returns include a CDSC of 1% if redeemed within 12 months of purchase. |
42 | THE RYDEX FUNDS ANNUAL REPORT | |
SCHEDULE OF INVESTMENTS | March 31, 2021 |
INVERSE EMERGING MARKETS 2x STRATEGY FUND | |
| | Face
Amount | | | Value | |
REPURCHASE AGREEMENTS††,1 - 95.2% |
J.P. Morgan Securities LLC
issued 03/31/21 at 0.01%
due 04/01/212 | | $ | 207,660 | | | $ | 207,660 | |
Barclays Capital, Inc.
issued 03/31/21 at 0.01%
due 04/01/212 | | | 94,412 | | | | 94,412 | |
BofA Securities, Inc.
issued 03/31/21 at 0.01%
due 04/01/212 | | | 86,166 | | | | 86,166 | |
Total Repurchase Agreements | | | | |
(Cost $388,238) | | | | | | | 388,238 | |
| | | | | | | | | |
Total Investments - 95.2% | | | | |
(Cost $388,238) | | $ | 388,238 | |
Other Assets & Liabilities, net - 4.8% | | | 19,412 | |
Total Net Assets - 100.0% | | $ | 407,650 | |
Total Return Swap Agreements |
Counterparty | Index | Financing
Rate Receive | Payment
Frequency | | Maturity
Date | | | Units | | | Notional
Amount | | | Value and
Unrealized
Appreciation | |
OTC Equity Index Swap Agreements Sold Short†† |
BNP Paribas | BNY Mellon Emerging Markets 50 ADR Index | 0.19% (1 Month USD LIBOR - 0.30%) | At Maturity | 04/08/21 | | | 141 | | | $ | 505,042 | | | $ | 27,915 | |
Goldman Sachs International | BNY Mellon Emerging Markets 50 ADR Index | 0.36% (1 Week USD LIBOR - 0.45%) | At Maturity | 04/09/21 | | | 87 | | | | 314,502 | | | | 10,460 | |
| | | | | | | | | | | | | | $ | 819,544 | | | $ | 38,375 | |
†† | Value determined based on Level 2 inputs — See Note 4. |
1 | Repurchase Agreements — See Note 6. |
2 | All or a portion of this security is pledged as equity index swap collateral at March 31, 2021. |
| | ADR — American Depositary Receipt |
| | LIBOR — London Interbank Offered Rate |
| | |
| | See Sector Classification in Other Information section. |
The following table summarizes the inputs used to value the Fund’s investments at March 31, 2021 (See Note 4 in the Notes to Financial Statements):
Investments in Securities (Assets) | | Level 1
Quoted
Prices | | | Level 2
Significant
Observable
Inputs | | | Level 3
Significant
Unobservable
Inputs | | | Total | |
Repurchase Agreements | | $ | — | | | $ | 388,238 | | | $ | — | | | $ | 388,238 | |
Equity Index Swap Agreements** | | | — | | | | 38,375 | | | | — | | | | 38,375 | |
Total Assets | | $ | — | | | $ | 426,613 | | | $ | — | | | $ | 426,613 | |
** | This derivative is reported as unrealized appreciation/depreciation at period end. |
SEE NOTES TO FINANCIAL STATEMENTS. | THE RYDEX FUNDS ANNUAL REPORT | 43 |
INVERSE EMERGING MARKETS 2x STRATEGY FUND | |
STATEMENT OF ASSETS AND LIABILITIES |
March 31, 2021 |
Assets: |
Repurchase agreements, at value (cost $388,238) | | $ | 388,238 | |
Unrealized appreciation on OTC swap agreements | | | 38,375 | |
Receivables: |
Fund shares sold | | | 211,615 | |
Swap settlement | | | 62,148 | |
Total assets | | | 700,376 | |
| | | | | |
Liabilities: |
Payable for: |
Fund shares redeemed | | | 290,892 | |
Management fees | | | 369 | |
Transfer agent and administrative fees | | | 111 | |
Distribution and service fees | | | 107 | |
Portfolio accounting fees | | | 62 | |
Variation margin on futures contracts | | | 24 | |
Trustees’ fees* | | | 7 | |
Miscellaneous | | | 1,154 | |
Total liabilities | | | 292,726 | |
Commitments and contingent liabilities (Note 11) | | | — | |
Net assets | | $ | 407,650 | |
| | | | | |
Net assets consist of: |
Paid in capital | | $ | 20,315,013 | |
Total distributable earnings (loss) | | | (19,907,363 | ) |
Net assets | | $ | 407,650 | |
| | | | | |
A-Class: |
Net assets | | $ | 1,758 | |
Capital shares outstanding | | | 141 | |
Net asset value per share | | $ | 12.44 | |
Maximum offering price per share (Net asset value divided by 95.25%) | | $ | 13.06 | |
| | | | | |
C-Class: |
Net assets | | $ | 5,501 | |
Capital shares outstanding | | | 444 | |
Net asset value per share | | $ | 12.40 | |
| | | | | |
H-Class: |
Net assets | | $ | 400,391 | |
Capital shares outstanding | | | 31,933 | |
Net asset value per share | | $ | 12.54 | |
STATEMENT OF OPERATIONS |
Year Ended March 31, 2021 |
Investment Income: |
Interest | | $ | 383 | |
Total investment income | | | 383 | |
| | | | | |
Expenses: |
Management fees | | | 8,092 | |
Distribution and service fees: |
A-Class | | | 96 | |
C-Class | | | 301 | |
H-Class | | | 2,081 | |
Transfer agent and administrative fees | | | 2,580 | |
Portfolio accounting fees | | | 1,350 | |
Registration fees | | | 1,247 | |
Professional fees | | | 706 | |
Trustees’ fees* | | | 277 | |
Custodian fees | | | 137 | |
Miscellaneous | | | 338 | |
Total expenses | | | 17,205 | |
Net investment loss | | | (16,822 | ) |
| | | | | |
Net Realized and Unrealized Gain (Loss): |
Net realized gain (loss) on: |
Swap agreements | | | (1,578,473 | ) |
Futures contracts | | | (13,003 | ) |
Net realized loss | | | (1,591,476 | ) |
Net change in unrealized appreciation (depreciation) on: |
Swap agreements | | | 36,619 | |
Net change in unrealized appreciation (depreciation) | | | 36,619 | |
Net realized and unrealized loss | | | (1,554,857 | ) |
Net decrease in net assets resulting from operations | | $ | (1,571,679 | ) |
* | Relates to Trustees not deemed “interested persons” within the meaning of Section 2(a)(19) of the 1940 Act. |
44 | THE RYDEX FUNDS ANNUAL REPORT | SEE NOTES TO FINANCIAL STATEMENTS. |
INVERSE EMERGING MARKETS 2x STRATEGY FUND | |
STATEMENTS OF CHANGES IN NET ASSETS |
| | Year Ended
March 31,
2021 | | | Year Ended
March 31,
2020 | |
Increase (Decrease) in Net Assets from Operations: | | | | | | | | |
Net investment income (loss) | | $ | (16,822 | ) | | $ | 1,035 | |
Net realized gain (loss) on investments | | | (1,591,476 | ) | | | 174,492 | |
Net change in unrealized appreciation (depreciation) on investments | | | 36,619 | | | | 42,848 | |
Net increase (decrease) in net assets resulting from operations | | | (1,571,679 | ) | | | 218,375 | |
| | | | | | | | | |
Distributions to shareholders: | | | | | | | | |
A-Class | | | — | | | | (74 | ) |
C-Class | | | — | | | | (291 | ) |
H-Class | | | — | | | | (4,157 | ) |
Total distributions to shareholders | | | — | | | | (4,522 | ) |
| | | | | | | | | |
Capital share transactions: | | | | | | | | |
Proceeds from sale of shares | | | | | | | | |
A-Class | | | 55,618 | | | | 948,187 | |
C-Class | | | 256,178 | | | | 1,863,277 | |
H-Class | | | 66,477,775 | | | | 52,112,944 | |
Distributions reinvested | | | | | | | | |
A-Class | | | — | | | | 55 | |
C-Class | | | — | | | | 27 | |
H-Class | | | — | | | | 3,705 | |
Cost of shares redeemed | | | | | | | | |
A-Class | | | (136,743 | ) | | | (813,060 | ) |
C-Class | | | (292,788 | ) | | | (1,767,237 | ) |
H-Class | | | (65,279,241 | ) | | | (53,439,146 | ) |
Net increase (decrease) from capital share transactions | | | 1,080,799 | | | | (1,091,248 | ) |
Net decrease in net assets | | | (490,880 | ) | | | (877,395 | ) |
| | | | | | | | | |
Net assets: | | | | | | | | |
Beginning of year | | | 898,530 | | | | 1,775,925 | |
End of year | | $ | 407,650 | | | $ | 898,530 | |
| | | | | | | | | |
Capital share activity: | | | | | | | | |
Shares sold | | | | | | | | |
A-Class | | | 3,229 | | | | 22,942 | |
C-Class | | | 11,803 | | | | 51,267 | |
H-Class | | | 3,478,109 | | | | 1,307,127 | |
Shares issued from reinvestment of distributions | | | | | | | | |
A-Class | | | — | | | | 2 | |
C-Class | | | — | | | | 1 | |
H-Class | | | — | | | | 115 | |
Shares redeemed | | | | | | | | |
A-Class | | | (6,225 | ) | | | (20,207 | ) |
C-Class | | | (13,555 | ) | | | (49,157 | ) |
H-Class | | | (3,460,171 | ) | | | (1,336,862 | ) |
Net increase (decrease) in shares | | | 13,190 | | | | (24,772 | ) |
SEE NOTES TO FINANCIAL STATEMENTS. | THE RYDEX FUNDS ANNUAL REPORT | 45 |
INVERSE EMERGING MARKETS 2x STRATEGY FUND | |
This table is presented to show selected data for a share outstanding throughout each period and to assist shareholders in evaluating a Fund’s performance for the periods presented.
A-Class | | Year Ended
March 31,
2021 | | | Year Ended
March 31,
2020 | | | Year Ended
March 31,
2019 | | | Year Ended
March 29,
2018 | | | Year Ended
March 31,
2017c | |
Per Share Data |
Net asset value, beginning of period | | $ | 46.71 | | | $ | 40.57 | | | $ | 39.08 | | | $ | 63.42 | | | $ | 101.83 | |
Income (loss) from investment operations: |
Net investment income (loss)a | | | (.54 | ) | | | (.16 | ) | | | .23 | | | | (.28 | ) | | | (1.42 | ) |
Net gain (loss) on investments (realized and unrealized) | | | (33.73 | ) | | | 6.64 | | | | 1.26 | d | | | (24.06 | ) | | | (36.99 | ) |
Total from investment operations | | | (34.27 | ) | | | 6.48 | | | | 1.49 | | | | (24.34 | ) | | | (38.41 | ) |
Less distributions from: |
Net investment income | | | — | | | | (.34 | ) | | | — | | | | — | | | | — | |
Total distributions | | | — | | | | (.34 | ) | | | — | | | | — | | | | — | |
Net asset value, end of period | | $ | 12.44 | | | $ | 46.71 | | | $ | 40.57 | | | $ | 39.08 | | | $ | 63.42 | |
|
Total Returnb | | | (73.37 | %) | | | 16.30 | % | | | 3.81 | % | | | (38.35 | %) | | | (37.72 | %) |
Ratios/Supplemental Data |
Net assets, end of period (in thousands) | | $ | 2 | | | $ | 147 | | | $ | 16 | | | $ | 43 | | | $ | 42 | |
Ratios to average net assets: |
Net investment income (loss) | | | (1.81 | %) | | | (0.37 | %) | | | 0.51 | % | | | (0.64 | %) | | | (1.50 | %) |
Total expenses | | | 1.86 | % | | | 1.89 | % | | | 1.88 | % | | | 1.76 | % | | | 1.75 | % |
Portfolio turnover rate | | | — | | | | — | | | | — | | | | — | | | | — | |
C-Class | | Year Ended
March 31,
2021 | | | Year Ended
March 31,
2020 | | | Year Ended
March 31,
2019 | | | Year Ended
March 29,
2018 | | | Year Ended
March 31,
2017c | |
Per Share Data |
Net asset value, beginning of period | | $ | 46.82 | | | $ | 40.45 | | | $ | 39.34 | | | $ | 64.21 | | | $ | 103.83 | |
Income (loss) from investment operations: |
Net investment income (loss)a | | | (.69 | ) | | | (.31 | ) | | | (.29 | ) | | | (.74 | ) | | | (1.88 | ) |
Net gain (loss) on investments (realized and unrealized) | | | (33.73 | ) | | | 7.02 | | | | 1.40 | d | | | (24.13 | ) | | | (37.74 | ) |
Total from investment operations | | | (34.42 | ) | | | 6.71 | | | | 1.11 | | | | (24.87 | ) | | | (39.62 | ) |
Less distributions from: |
Net investment income | | | — | | | | (.34 | ) | | | — | | | | — | | | | — | |
Total distributions | | | — | | | | (.34 | ) | | | — | | | | — | | | | — | |
Net asset value, end of period | | $ | 12.40 | | | $ | 46.82 | | | $ | 40.45 | | | $ | 39.34 | | | $ | 64.21 | |
|
Total Returnb | | | (73.52 | %) | | | 16.96 | % | | | (2.82 | %) | | | (38.77 | %) | | | (38.17 | %) |
Ratios/Supplemental Data |
Net assets, end of period (in thousands) | | $ | 6 | | | $ | 103 | | | $ | 3 | | | $ | 19 | | | $ | 56 | |
Ratios to average net assets: |
Net investment income (loss) | | | (2.62 | %) | | | (1.09 | %) | | | (0.63 | %) | | | (1.46 | %) | | | (2.20 | %) |
Total expenses | | | 2.66 | % | | | 2.79 | % | | | 2.53 | % | | | 2.49 | % | | | 2.48 | % |
Portfolio turnover rate | | | — | | | | — | | | | — | | | | — | | | | — | |
46 | THE RYDEX FUNDS ANNUAL REPORT | SEE NOTES TO FINANCIAL STATEMENTS. |
INVERSE EMERGING MARKETS 2x STRATEGY FUND | |
FINANCIAL HIGHLIGHTS (concluded) |
This table is presented to show selected data for a share outstanding throughout each period and to assist shareholders in evaluating a Fund’s performance for the periods presented.
H-Class | | Year Ended
March 31,
2021 | | | Year Ended
March 31,
2020 | | | Year Ended
March 31,
2019 | | | Year Ended
March 29,
2018 | | | Year Ended
March 31,
2017c | |
Per Share Data |
Net asset value, beginning of period | | $ | 46.39 | | | $ | 40.27 | | | $ | 38.77 | | | $ | 63.00 | | | $ | 101.28 | |
Income (loss) from investment operations: |
Net investment income (loss)a | | | (.42 | ) | | | .07 | | | | .19 | | | | (.30 | ) | | | (1.23 | ) |
Net gain (loss) on investments (realized and unrealized) | | | (33.43 | ) | | | 6.39 | | | | 1.31 | d | | | (23.93 | ) | | | (37.05 | ) |
Total from investment operations | | | (33.85 | ) | | | 6.46 | | | | 1.50 | | | | (24.23 | ) | | | (38.28 | ) |
Less distributions from: |
Net investment income | | | — | | | | (.34 | ) | | | — | | | | — | | | | — | |
Total distributions | | | — | | | | (.34 | ) | | | — | | | | — | | | | — | |
Net asset value, end of period | | $ | 12.54 | | | $ | 46.39 | | | $ | 40.27 | | | $ | 38.77 | | | $ | 63.00 | |
|
Total Return | | | (72.97 | %) | | | 16.40 | % | | | 3.87 | % | | | (38.46 | %) | | | (37.80 | %) |
Ratios/Supplemental Data |
Net assets, end of period (in thousands) | | $ | 400 | | | $ | 649 | | | $ | 1,756 | | | $ | 743 | | | $ | 890 | |
Ratios to average net assets: |
Net investment income (loss) | | | (1.85 | %) | | | 0.19 | % | | | 0.42 | % | | | (0.68 | %) | | | (1.46 | %) |
Total expenses | | | 1.89 | % | | | 1.87 | % | | | 1.87 | % | | | 1.77 | % | | | 1.76 | % |
Portfolio turnover rate | | | — | | | | — | | | | — | | | | — | | | | — | |
a | Net investment income (loss) per share was computed using average shares outstanding throughout the period. |
b | Total return does not reflect the impact of any applicable sales charges. |
c | Reverse share split — Per share amounts for the years presented through March 31, 2017 have been restated to reflect a 1:6 reverse share split effective October 31, 2016. |
d | The amount shown for a share outstanding throughout the period does not agree with the aggregate net loss on investments for the year because of the sales and repurchases of fund shares in relation to fluctuating market value of the investments of the Fund. |
SEE NOTES TO FINANCIAL STATEMENTS. | THE RYDEX FUNDS ANNUAL REPORT | 47 |
PERFORMANCE REPORT AND FUND PROFILE (Unaudited) | March 31, 2021 |
EMERGING MARKETS BOND STRATEGY FUND
OBJECTIVE: Seeks to provide investment results that correlate, before fees and expenses, to the performance of the emerging markets bond market as defined by the Adviser.
The Emerging Markets Bond Fund H-Class returned 10.93% for the one-year period ended March 31, 2021. By comparison, the ICE Bank of America Merrill Lynch U.S. Dollar Emerging Markets Sovereign Plus Index returned 15.24% over the same period.
During 2020, emerging market countries experienced decreasing credit spreads, leading to positive performance for the Fund. After the first quarter of 2020, the combination of easing COVID-19 restrictions and positive COVID-19 vaccine and treatment news lead to an increase in consumer demand, which helped to alleviate some uncertainties of global consumption and global production resulting in decreased credit spreads. In addition, oil prices rebounded after the April price collapse leading to the decrease of credit spreads for some emerging market countries such as Kingdom of Saudi Arabia, Qatar and United Arab Emirates (Abu Dhabi). For the first quarter of 2021, emerging market credit spreads have increased with the resurgence of COVID-19 and reinitiated government-imposed restrictions.
Most emerging market countries experienced a decrease in credit default swap spreads, with Indonesia, South Africa, and Ukraine experiencing some of the largest decreases in credit default credit spreads. During this period, Argentina experienced a credit event and was subsequently added back to the credit default swap. Since being added back to the credit default swap Argentina has experienced an increase of its credit default swap spread.
Derivatives in the Fund were used to help provide efficient exposure to the emerging markets bond market and to provide leverage, not for hedging purposes. The results of derivatives use during the period were within our expectations and were a factor in the Fund’s positive performance.
Performance displayed represents past performance, which is no guarantee of future results.
Holdings Diversification (Market Exposure as % of Net Assets)
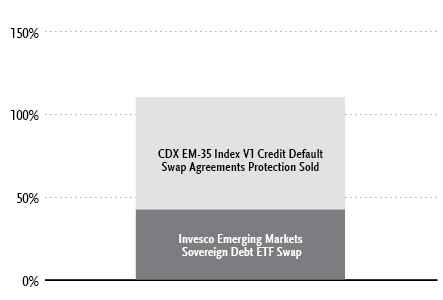
“Holdings Diversification (Market Exposure as % of Net Assets)” excludes any temporary cash investments.
Inception Dates: |
A-Class | October 8, 2013 |
C-Class | October 8, 2013 |
H-Class | October 8, 2013 |
The Fund invests principally in derivative investments such as swap agreements and futures contracts.
48 | THE RYDEX FUNDS ANNUAL REPORT | |
PERFORMANCE REPORT AND FUND PROFILE (Unaudited)(concluded) | March 31, 2021 |
Cumulative Fund Performance*
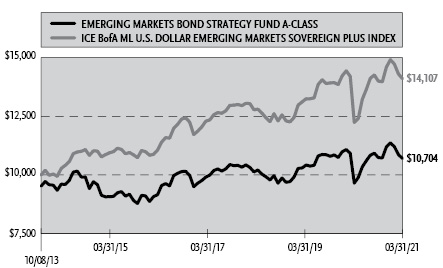
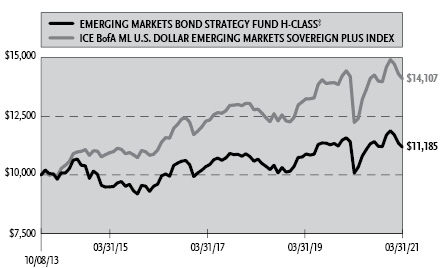
Average Annual Returns*
Periods Ended March 31, 2021
| 1 Year | 5 Year | Since
Inception
(10/08/13) |
A-Class Shares | 10.92% | 2.31% | 1.58% |
A-Class Shares with sales charge‡ | 5.65% | 1.32% | 0.91% |
C-Class Shares | 10.10% | 1.59% | 0.75% |
C-Class Shares with CDSC§ | 9.10% | 1.59% | 0.75% |
H-Class Shares | 10.93% | 2.35% | 1.51% |
ICE BofA Merrill Lynch U.S. Dollar Emerging Markets Sovereign Plus Index | 15.24% | 4.35% | 4.71% |
* | The performance data above represents past performance that is not predictive of future results. The investment return and principal value of an investment in the Fund will fluctuate so that an investor’s shares, when redeemed, may be worth more or less than their original cost. Returns are historical and include changes in principal and reinvested dividends and capital gains and do not reflect the effect of taxes. The ICE BofA Merrill Lynch U.S. Dollar Emerging Markets Sovereign Plus Index is an unmanaged index and, unlike the Fund, has no management fees or operating expenses to reduce its reported return. The graphs are based on A-Class shares and H-Class shares only; performance for C-Class shares will vary due to differences in fee structure. |
‡ | Fund returns are calculated using the maximum sales charge of 4.75%. |
§ | Fund returns include a CDSC of 1% if redeemed within 12 months of purchase. |
| | THE RYDEX FUNDS ANNUAL REPORT | 49 |
SCHEDULE OF INVESTMENTS | March 31, 2021 |
EMERGING MARKETS BOND STRATEGY FUND | |
| | Face
Amount | | | Value | |
U.S. TREASURY BILLS†† - 0.5% |
U.S. Treasury Bills |
0.01% due 04/22/211,2 | | $ | 2,000 | | | $ | 2,000 | |
Total U.S. Treasury Bills | | | | |
(Cost $2,000) | | | | | | | 2,000 | |
| | | | | | | | | |
REPURCHASE AGREEMENTS††,3 - 88.4% |
J.P. Morgan Securities LLC
issued 03/31/21 at 0.01%
due 04/01/214 | | | 209,410 | | | | 209,410 | |
Barclays Capital, Inc.
issued 03/31/21 at 0.01%
due 04/01/214 | | | 95,208 | | | | 95,208 | |
BofA Securities, Inc.
issued 03/31/21 at 0.01%
due 04/01/214 | | | 86,892 | | | | 86,892 | |
Total Repurchase Agreements | | | | |
(Cost $391,510) | | | | | | | 391,510 | |
| | | | | | | | | |
Total Investments - 88.9% | | | | |
(Cost $393,510) | | $ | 393,510 | |
Other Assets & Liabilities, net - 11.1% | | | 49,085 | |
Total Net Assets - 100.0% | | $ | 442,595 | |
Futures Contracts |
Description | | Number of
Contracts | | | Expiration Date | | | Notional
Amount | | | Value and
Unrealized
Depreciation** | |
Interest Rate Futures Contracts Purchased† |
U.S. Treasury 5 Year Note Futures Contracts | | | 2 | | | | Jun 2021 | | | $ | 246,922 | | | $ | (2,022 | ) |
Centrally Cleared Credit Default Swap Agreements Protection Sold†† |
| |
Counterparty | Exchange | Index | | Protection
Premium
Rate | | Payment
Frequency | | Maturity
Date | | | Notional
Amount | | | Value | | | Upfront
Premiums
Received | | | Unrealized
Depreciation** | |
Barclays Bank plc | ICE | CDX.EM.35.V1 | | | 1.00 | % | Quarterly | 06/20/26 | | $ | 300,000 | | | $ | (12,563 | ) | | $ | (10,810 | ) | | $ | (1,753 | ) |
Total Return Swap Agreements |
Counterparty | Index | Financing
Rate Pay | Payment
Frequency | | Maturity
Date | | | Units | | | Notional
Amount | | | Value and
Unrealized
Appreciation | |
OTC Credit Index Swap Agreements†† |
Goldman Sachs International | Invesco Emerging Markets Sovereign Debt ETF | 0.63% (1 Week USD LIBOR + 0.55%) | At Maturity | 04/29/21 | | | 6,959 | | | $ | 186,292 | | | $ | 418 | |
50 | THE RYDEX FUNDS ANNUAL REPORT | SEE NOTES TO FINANCIAL STATEMENTS. |
SCHEDULE OF INVESTMENTS (concluded) | March 31, 2021 |
EMERGING MARKETS BOND STRATEGY FUND | |
** | Includes cumulative appreciation (depreciation). Variation margin is reported within the Statement of Assets and Liabilities. |
† | Value determined based on Level 1 inputs — See Note 4. |
†† | Value determined based on Level 2 inputs — See Note 4. |
1 | All or a portion of this security is pledged as futures collateral at March 31, 2021. |
2 | Rate indicated is the effective yield at the time of purchase. |
3 | Repurchase Agreements — See Note 6. |
4 | All or a portion of this security is pledged as credit index swap collateral at March 31, 2021. |
| | CDX.EM.35.V1 — Credit Default Swap Emerging Markets Series 35 Index Version 1 |
| | ICE — Intercontinental Exchange |
| | LIBOR — London Interbank Offered Rate |
| | plc — Public Limited Company |
| | |
| | See Sector Classification in Other Information section. |
The following table summarizes the inputs used to value the Fund’s investments at March 31, 2021 (See Note 4 in the Notes to Financial Statements):
Investments in Securities (Assets) | | Level 1
Quoted
Prices | | | Level 2
Significant
Observable
Inputs | | | Level 3
Significant
Unobservable
Inputs | | | Total | |
U.S. Treasury Bills | | $ | — | | | $ | 2,000 | | | $ | — | | | $ | 2,000 | |
Repurchase Agreements | | | — | | | | 391,510 | | | | — | | | | 391,510 | |
Credit Index Swap Agreements** | | | — | | | | 418 | | | | — | | | | 418 | |
Total Assets | | $ | — | | | $ | 393,928 | | | $ | — | | | $ | 393,928 | |
Investments in Securities (Liabilities) | | Level 1
Quoted
Prices | | | Level 2
Significant
Observable
Inputs | | | Level 3
Significant
Unobservable
Inputs | | | Total | |
Interest Rate Futures Contracts** | | $ | 2,022 | | | $ | — | | | $ | — | | | $ | 2,022 | |
Credit Default Swap Agreements** | | | — | | | | 1,753 | | | | — | | | | 1,753 | |
Total Liabilities | | $ | 2,022 | | | $ | 1,753 | | | $ | — | | | $ | 3,775 | |
** | This derivative is reported as unrealized appreciation/depreciation at period end. |
SEE NOTES TO FINANCIAL STATEMENTS. | THE RYDEX FUNDS ANNUAL REPORT | 51 |
EMERGING MARKETS BOND STRATEGY FUND | |
STATEMENT OF ASSETS AND LIABILITIES |
March 31, 2021 |
Assets: |
Investments, at value (cost $2,000) | | $ | 2,000 | |
Repurchase agreements, at value (cost $391,510) | | | 391,510 | |
Segregated cash with broker | | | 56,328 | |
Unrealized appreciation on OTC swap agreements | | | 418 | |
Receivables: |
Fund shares sold | | | 5,734 | |
Variation margin on credit default swap agreements | | | 786 | |
Protection fees on credit default swap agreements | | | 83 | |
Total assets | | | 456,859 | |
| | | | | |
Liabilities: |
Unamortized upfront premiums received on credit default swap agreements | | | 10,810 | |
Payable for: |
Fund shares redeemed | | | 2,080 | |
Management fees | | | 307 | |
Variation margin on futures contracts | | | 203 | |
Distribution and service fees | | | 137 | |
Transfer agent and administrative fees | | | 110 | |
Portfolio accounting fees | | | 62 | |
Trustees’ fees* | | | 8 | |
Swap settlement | | | 3 | |
Miscellaneous | | | 544 | |
Total liabilities | | | 14,264 | |
Commitments and contingent liabilities (Note 11) | | | — | |
Net assets | | $ | 442,595 | |
| | | | | |
Net assets consist of: |
Paid in capital | | $ | 626,408 | |
Total distributable earnings (loss) | | | (183,813 | ) |
Net assets | | $ | 442,595 | |
| | | | | |
A-Class: |
Net assets | | $ | 47,958 | |
Capital shares outstanding | | | 684 | |
Net asset value per share | | $ | 70.11 | |
Maximum offering price per share (Net asset value divided by 95.25%) | | $ | 73.61 | |
| | | | | |
C-Class: |
Net assets | | $ | 51,862 | |
Capital shares outstanding | | | 797 | |
Net asset value per share | | $ | 65.07 | |
| | | | | |
H-Class: |
Net assets | | $ | 342,775 | |
Capital shares outstanding | | | 4,922 | |
Net asset value per share | | $ | 69.64 | |
STATEMENT OF OPERATIONS |
Year Ended March 31, 2021 |
Investment Income: |
Interest | | $ | 402 | |
Total investment income | | | 402 | |
| | | | | |
Expenses: |
Management fees | | | 7,308 | |
Distribution and service fees: |
A-Class | | | 488 | |
C-Class | | | 665 | |
H-Class | | | 1,785 | |
Transfer agent and administrative fees | | | 2,837 | |
Registration fees | | | 1,570 | |
Portfolio accounting fees | | | 1,463 | |
Trustees’ fees* | | | 420 | |
Custodian fees | | | 161 | |
Miscellaneous | | | 60 | |
Total expenses | | | 16,757 | |
Net investment loss | | | (16,355 | ) |
| | | | | |
Net Realized and Unrealized Gain (Loss): |
Net realized gain (loss) on: |
Swap agreements | | | 179,320 | |
Futures contracts | | | 4,808 | |
Net realized gain | | | 184,128 | |
Net change in unrealized appreciation (depreciation) on: |
Investments | | | (5 | ) |
Swap agreements | | | 17,069 | |
Futures contracts | | | (9,280 | ) |
Net change in unrealized appreciation (depreciation) | | | 7,784 | |
Net realized and unrealized gain | | | 191,912 | |
Net increase in net assets resulting from operations | | $ | 175,557 | |
* | Relates to Trustees not deemed “interested persons” within the meaning of Section 2(a)(19) of the 1940 Act. |
52 | THE RYDEX FUNDS ANNUAL REPORT | SEE NOTES TO FINANCIAL STATEMENTS. |
EMERGING MARKETS BOND STRATEGY FUND | |
STATEMENTS OF CHANGES IN NET ASSETS |
| | Year Ended
March 31,
2021 | | | Year Ended
March 31,
2020 | |
Increase (Decrease) in Net Assets from Operations: | | | | | | | | |
Net investment income (loss) | | $ | (16,355 | ) | | $ | 12,923 | |
Net realized gain (loss) on investments | | | 184,128 | | | | (34,134 | ) |
Net change in unrealized appreciation (depreciation) on investments | | | 7,784 | | | | (47,946 | ) |
Net increase (decrease) in net assets resulting from operations | | | 175,557 | | | | (69,157 | ) |
| | | | | | | | | |
Distributions to shareholders: | | | | | | | | |
A-Class | | | (403 | ) | | | (2,501 | ) |
C-Class | | | (847 | ) | | | (5,902 | ) |
H-Class | | | (6,005 | ) | | | (332,227 | ) |
Total distributions to shareholders | | | (7,255 | ) | | | (340,630 | ) |
| | | | | | | | | |
Capital share transactions: | | | | | | | | |
Proceeds from sale of shares | | | | | | | | |
A-Class | | | 344,712 | | | | 1,927,596 | |
C-Class | | | — | | | | 145,366 | |
H-Class | | | 5,679,241 | | | | 5,754,621 | |
Distributions reinvested | | | | | | | | |
A-Class | | | 403 | | | | 2,501 | |
C-Class | | | 847 | | | | 5,902 | |
H-Class | | | 6,005 | | | | 332,224 | |
Cost of shares redeemed | | | | | | | | |
A-Class | | | (1,470,337 | ) | | | (1,529,027 | ) |
C-Class | | | (17,197 | ) | | | (143,144 | ) |
H-Class | | | (5,743,063 | ) | | | (14,659,065 | ) |
Net decrease from capital share transactions | | | (1,199,389 | ) | | | (8,163,026 | ) |
Net decrease in net assets | | | (1,031,087 | ) | | | (8,572,813 | ) |
| | | | | | | | | |
Net assets: | | | | | | | | |
Beginning of year | | | 1,473,682 | | | | 10,046,495 | |
End of year | | $ | 442,595 | | | $ | 1,473,682 | |
| | | | | | | | | |
Capital share activity: | | | | | | | | |
Shares sold | | | | | | | | |
A-Class | | | 4,998 | | | | 27,204 | |
C-Class | | | — | | | | 2,040 | |
H-Class | | | 80,788 | | | | 76,190 | |
Shares issued from reinvestment of distributions | | | | | | | | |
A-Class | | | 5 | | | | 35 | |
C-Class | | | 12 | | | | 87 | |
H-Class | | | 82 | | | | 4,616 | |
Shares redeemed | | | | | | | | |
A-Class | | | (21,600 | ) | | | (20,116 | ) |
C-Class | | | (255 | ) | | | (1,923 | ) |
H-Class | | | (80,778 | ) | | | (199,774 | ) |
Net decrease in shares | | | (16,748 | ) | | | (111,641 | ) |
SEE NOTES TO FINANCIAL STATEMENTS. | THE RYDEX FUNDS ANNUAL REPORT | 53 |
EMERGING MARKETS BOND STRATEGY FUND | |
This table is presented to show selected data for a share outstanding throughout each period and to assist shareholders in evaluating a Fund’s performance for the periods presented.
A-Class | | Year Ended
March 31,
2021 | | | Year Ended
March 31,
2020 | | | Year Ended
March 31,
2019 | | | Year Ended
March 29,
2018 | | | Year Ended
March 31,
2017c | |
Per Share Data |
Net asset value, beginning of period | | $ | 63.93 | | | $ | 74.95 | | | $ | 73.42 | | | $ | 71.93 | | | $ | 72.75 | |
Income (loss) from investment operations: |
Net investment income (loss)a | | | (1.14 | ) | | | .03 | | | | .10 | | | | (.55 | ) | | | (.91 | ) |
Net gain (loss) on investments (realized and unrealized) | | | 8.16 | | | | (4.86 | ) | | | 1.43 | | | | 2.13 | | | | 3.87 | |
Total from investment operations | | | 7.02 | | | | (4.83 | ) | | | 1.53 | | | | 1.58 | | | | 2.96 | |
Less distributions from: |
Net investment income | | | (.84 | ) | | | (2.36 | ) | | | — | | | | (.09 | ) | | | (3.70 | ) |
Net realized gains | | | — | | | | (3.83 | ) | | | — | | | | — | | | | (.08 | ) |
Total distributions | | | (.84 | ) | | | (6.19 | ) | | | — | | | | (.09 | ) | | | (3.78 | ) |
Net asset value, end of period | | $ | 70.11 | | | $ | 63.93 | | | $ | 74.95 | | | $ | 73.42 | | | $ | 71.93 | |
|
Total Returnb | | | 10.92 | % | | | (7.41 | %) | | | 2.08 | % | | | 2.18 | % | | | 4.62 | % |
Ratios/Supplemental Data |
Net assets, end of period (in thousands) | | $ | 48 | | | $ | 1,105 | | | $ | 761 | | | $ | 116 | | | $ | 113 | |
Ratios to average net assets: |
Net investment income (loss) | | | (1.72 | %) | | | 0.03 | % | | | 0.14 | % | | | (0.74 | %) | | | (1.19 | %) |
Total expenses | | | 1.74 | % | | | 1.68 | % | | | 1.66 | % | | | 1.58 | % | | | 1.58 | % |
Portfolio turnover rate | | | — | | | | — | | | | — | | | | — | | | | 733 | % |
C-Class | | Year Ended
March 31,
2021 | | | Year Ended
March 31,
2020 | | | Year Ended
March 31,
2019 | | | Year Ended
March 29,
2018 | | | Year Ended
March 31,
2017c | |
Per Share Data |
Net asset value, beginning of period | | $ | 59.82 | | | $ | 71.05 | | | $ | 70.12 | | | $ | 69.22 | | | $ | 70.54 | |
Income (loss) from investment operations: |
Net investment income (loss)a | | | (1.56 | ) | | | (.46 | ) | | | (.54 | ) | | | (1.06 | ) | | | (1.10 | ) |
Net gain (loss) on investments (realized and unrealized) | | | 7.65 | | | | (4.58 | ) | | | 1.47 | | | | 2.05 | | | | 3.56 | |
Total from investment operations | | | 6.09 | | | | (5.04 | ) | | | .93 | | | | .99 | | | | 2.46 | |
Less distributions from: |
Net investment income | | | (.84 | ) | | | (2.36 | ) | | | — | | | | (.09 | ) | | | (3.70 | ) |
Net realized gains | | | — | | | | (3.83 | ) | | | — | | | | — | | | | (.08 | ) |
Total distributions | | | (.84 | ) | | | (6.19 | ) | | | — | | | | (.09 | ) | | | (3.78 | ) |
Net asset value, end of period | | $ | 65.07 | | | $ | 59.82 | | | $ | 71.05 | | | $ | 70.12 | | | $ | 69.22 | |
|
Total Returnb | | | 10.10 | % | | | (8.13 | %) | | | 1.33 | % | | | 1.41 | % | | | 4.09 | % |
Ratios/Supplemental Data |
Net assets, end of period (in thousands) | | $ | 52 | | | $ | 62 | | | $ | 59 | | | $ | 82 | | | $ | 90 | |
Ratios to average net assets: |
Net investment income (loss) | | | (2.36 | %) | | | (0.61 | %) | | | (0.79 | %) | | | (1.49 | %) | | | (1.54 | %) |
Total expenses | | | 2.40 | % | | | 2.42 | % | | | 2.37 | % | | | 2.34 | % | | | 2.33 | % |
Portfolio turnover rate | | | — | | | | — | | | | — | | | | — | | | | 733 | % |
54 | THE RYDEX FUNDS ANNUAL REPORT | SEE NOTES TO FINANCIAL STATEMENTS. |
EMERGING MARKETS BOND STRATEGY FUND | |
FINANCIAL HIGHLIGHTS (concluded) |
This table is presented to show selected data for a share outstanding throughout each period and to assist shareholders in evaluating a Fund’s performance for the periods presented.
H-Class | | Year Ended
March 31,
2021 | | | Year Ended
March 31,
2020 | | | Year Ended
March 31,
2019 | | | Year Ended
March 29,
2018 | | | Year Ended
March 31,
2017c | |
Per Share Data |
Net asset value, beginning of period | | $ | 63.50 | | | $ | 74.52 | | | $ | 72.98 | | | $ | 71.51 | | | $ | 72.19 | |
Income (loss) from investment operations: |
Net investment income (loss)a | | | (1.14 | ) | | | .15 | | | | .23 | | | | (.55 | ) | | | (.28 | ) |
Net gain (loss) on investments (realized and unrealized) | | | 8.12 | | | | (4.98 | ) | | | 1.31 | | | | 2.11 | | | | 3.38 | |
Total from investment operations | | | 6.98 | | | | (4.83 | ) | | | 1.54 | | | | 1.56 | | | | 3.10 | |
Less distributions from: |
Net investment income | | | (.84 | ) | | | (2.36 | ) | | | — | | | | (.09 | ) | | | (3.70 | ) |
Net realized gains | | | — | | | | (3.83 | ) | | | — | | | | — | | | | (.08 | ) |
Total distributions | | | (.84 | ) | | | (6.19 | ) | | | — | | | | (.09 | ) | | | (3.78 | ) |
Net asset value, end of period | | $ | 69.64 | | | $ | 63.50 | | | $ | 74.52 | | | $ | 72.98 | | | $ | 71.51 | |
|
Total Return | | | 10.93 | % | | | (7.45 | %) | | | 2.11 | % | | | 2.19 | % | | | 4.85 | % |
Ratios/Supplemental Data |
Net assets, end of period (in thousands) | | $ | 343 | | | $ | 307 | | | $ | 9,226 | | | $ | 615 | | | $ | 472 | |
Ratios to average net assets: |
Net investment income (loss) | | | (1.61 | %) | | | 0.20 | % | | | 0.32 | % | | | (0.75 | %) | | | (0.38 | %) |
Total expenses | | | 1.65 | % | | | 1.67 | % | | | 1.70 | % | | | 1.58 | % | | | 1.54 | % |
Portfolio turnover rate | | | — | | | | — | | | | — | | | | — | | | | 733 | % |
a | Net investment income (loss) per share was computed using average shares outstanding throughout the period. |
b | Total return does not reflect the impact of any applicable sales charges. |
c | Reverse share split — Per share amounts for the periods presented through March 31, 2017 have been restated to reflect a 1:4 reverse share split effective November 7, 2016. |
SEE NOTES TO FINANCIAL STATEMENTS. | THE RYDEX FUNDS ANNUAL REPORT | 55 |
NOTES TO FINANCIAL STATEMENTS |
Note 1 – Organization and Significant Accounting Policies
Organization
The Rydex Series Funds (the “Trust”), a Delaware statutory trust, is registered with the SEC under the Investment Company Act of 1940 (“1940 Act”), as an open-ended investment company of the series type. Each series, in effect, is representing a separate fund (each, a “Fund”). The Trust may issue an unlimited number of authorized shares. The Trust accounts for the assets of each Fund separately.
The Trust offers a combination of seven separate classes of shares: Investor Class shares, A-Class shares, C-Class shares, H-Class shares, P-Class shares, Institutional Class shares and Money Market Class shares. Sales of shares of each Class are made without a front-end sales charge at the net asset value per share (“NAV”), with the exception of A-Class shares. A-Class shares are sold at the NAV, plus the applicable front-end sales charge. The sales charge varies depending on the amount purchased, but will not exceed 4.75%. A-Class share purchases of $1 million or more are exempt from the front-end sales charge but have a 1% contingent deferred sales charge (“CDSC”) if shares are redeemed within 12 months of purchase. C-Class shares have a 1% CDSC if shares are redeemed within 12 months of purchase. C-Class shares of each Fund automatically convert to A-Class shares of the same Fund on or about the 10th day of the month following the 10-year anniversary of the purchase of the C-Class shares. This conversion will be executed without any sales charge, fee or other charge. After the conversion is completed, the shares will be subject to all features and expenses of A-Class shares. Institutional Class shares are offered primarily for direct investment by institutions such as pension and profit sharing plans, endowments, foundations and corporations. Institutional Class shares require a minimum initial investment of $2 million and a minimum account balance of $1 million. At March 31, 2021, the Trust consisted of fifty-two funds.
This report covers the following funds (collectively, the “Funds”):
Fund Name | Investment
Company Type |
Long Short Equity Fund | Non-diversified |
Emerging Markets 2x Strategy Fund | Non-diversified |
Inverse Emerging Markets 2x Strategy Fund | Non-diversified |
Emerging Markets Bond Strategy Fund | Diversified |
At March 31, 2021, A-Class, C-Class, H-Class, P-Class and Institutional Class shares have been issued by the Funds.
The Emerging Markets 2x Strategy Fund, Inverse Emerging Markets 2x Strategy Fund, and Emerging Markets Bond Strategy Fund are designed and operated to accommodate frequent trading by shareholders and, unlike most mutual funds, offer unlimited exchange privileges with no minimum holding periods or transactions fees, which may cause the Funds to experience high portfolio turnover.
Security Investors, LLC, which operates under the name Guggenheim Investments (“GI”), provides advisory services. Guggenheim Funds Distributors, LLC (“GFD”) acts as principal underwriter for the Trust. GI and GFD are affiliated entities.
Significant Accounting Policies
The Funds operate as investment companies and, accordingly, follow the investment company accounting and reporting guidance of the Financial Accounting Standards Board (“FASB”) Accounting Standards Codification Topic 946 Financial Services – Investment Companies.
The following significant accounting policies are in conformity with U.S. generally accepted accounting principles (“U.S. GAAP”) and are consistently followed by the Trust. This requires management to make estimates and assumptions that affect the reported amount of assets and liabilities, contingent assets and liabilities at the date of the financial statements, and the reported amounts of revenues and expenses during the reporting period. Actual results could differ from these estimates. All time references are based on Eastern Time.
The NAV of each Class of a fund is calculated by dividing the market value of a fund’s securities and other assets, less all liabilities, attributable to the Class by the number of outstanding shares of the Class.
The Trust calculates a NAV twice each business day; at 10:45 a.m. and at the close of the New York Stock Exchange (“NYSE”), usually 4:00 p.m. for the Emerging Markets 2x Strategy Fund, Inverse Emerging Markets 2x Strategy Fund and Emerging Markets Bond Strategy Fund. All other Funds in this report will price at the afternoon NAV. The NAV is calculated using the current market value of each Fund’s total assets as of the respective time of calculation. These financial statements are based on the March 31, 2021, afternoon NAV.
(a) Valuation of Investments
The Board of Trustees of the Funds (the “Board”) has adopted policies and procedures for the valuation of the Funds’ investments (the “Valuation Procedures”). Pursuant to the Valuation Procedures, the Board has delegated to a valuation committee, consisting of representatives from Guggenheim’s investment management, fund administration, legal and compliance departments (the “Valuation Committee”), the day-to-day responsibility for implementing the Valuation Procedures,
56 | THE RYDEX FUNDS ANNUAL REPORT | |
NOTES TO FINANCIAL STATEMENTS (continued) |
including, under most circumstances, the responsibility for determining the fair value of the Funds’ securities and/or other assets.
Valuations of the Funds’ securities and other assets are supplied primarily by pricing services appointed pursuant to the processes set forth in the Valuation Procedures. The Valuation Committee convenes monthly, or more frequently as needed, to review the valuation of all assets which have been fair valued for reasonableness. The Funds’ officers, through the Valuation Committee and consistent with the monitoring and review responsibilities set forth in the Valuation Procedures, regularly review procedures used and valuations provided by the pricing services.
If the pricing service cannot or does not provide a valuation for a particular investment or such valuation is deemed unreliable, such investment is fair valued by the Valuation Committee.
Equity securities listed or traded on a recognized U.S. securities exchange or the National Association of Securities Dealers Automated Quotations (“NASDAQ”) National Market System shall generally be valued on the basis of the last sale price on the primary U.S. exchange or market on which the security is listed or traded; provided, however, that securities listed on NASDAQ will be valued at the NASDAQ Official Closing Price, which may not necessarily represent the last sale price. If there is no sale on the valuation date, exchange-traded U.S. equity securities will be valued on the basis of the last bid price.
Open-end investment companies are valued at their NAV as of the close of business, on the valuation date. Exchange-traded funds and closed-end investment companies are valued at the last quoted sale price.
U.S. Government securities are valued by independent pricing services, the last traded fill price, or at the reported bid price at the close of business.
Repurchase agreements are generally valued at amortized cost, provided such amounts approximate market value.
The value of futures contracts is accounted for using the unrealized appreciation or depreciation on the contracts that is determined by marking the contracts to their current realized settlement prices. Financial futures contracts are valued at the 4:00 p.m. price on the valuation date. In the event that the exchange for a specific futures contract closes earlier than 4:00 p.m., the futures contract is valued at the official settlement price of the exchange. However, the underlying securities from which the futures contract value is derived are monitored until 4:00 p.m. to determine if fair valuation would provide a more accurate valuation.
The values of swap agreements entered into by a fund are accounted for using the unrealized appreciation or depreciation on the agreements that are determined by marking the agreements to the last quoted value of the index or other underlying position that the swaps pertain to at the close of the NYSE.
Investments for which market quotations are not readily available are fair-valued as determined in good faith by GI, subject to review and approval by the Valuation Committee, pursuant to methods established or ratified by the Board. Valuations in accordance with these methods are intended to reflect each security’s (or asset’s or liability’s) “fair value”. Each such determination is based on a consideration of all relevant factors, which are likely to vary from one pricing context to another. Examples of such factors may include, but are not limited to market prices; sale prices; broker quotes; and models which derive prices based on inputs such as prices of securities with comparable maturities and characteristics, or based on inputs such as anticipated cash flows or collateral, spread over U.S. Treasury securities, and other information analysis. In connection with futures contracts and other derivative investments, such factors may include obtaining information as to how (a) these contracts and other derivative investments trade in the futures or other derivative markets, respectively, and (b) the securities underlying these contracts and other derivative investments trade in the cash market.
(b) U.S. Government and Agency Obligations
Certain U.S. Government and Agency Obligations are traded on a discount basis; the interest rates shown on the Schedules of Investments reflect the effective rates paid at the time of purchase by the Funds. Other securities bear interest at the rates shown, payable at fixed dates through maturity.
(c) Futures Contracts
Upon entering into a futures contract, a Fund deposits and maintains as collateral such initial margin as required by the exchange on which the transaction is affected. Pursuant to the contract, the Fund agrees to receive from or pay to the broker an amount of cash equal to the daily fluctuation in value of the contract. Such receipts or payments are known as variation margin and are recorded by the Fund as unrealized appreciation or depreciation. When the contract is closed, the Fund records a realized gain or loss equal to the difference between the value of the contract at the time it was opened and the value at the time it was closed.
| | THE RYDEX FUNDS ANNUAL REPORT | 57 |
NOTES TO FINANCIAL STATEMENTS (continued) |
(d) Swap Agreements
Swap agreements are marked-to-market daily and the change, if any, is recorded as unrealized appreciation or depreciation. Payments received or made as a result of an agreement or termination of an agreement are recognized as realized gains or losses.
Upon entering into certain centrally-cleared swap transactions, a Fund is required to deposit with its clearing broker an amount of cash or securities as an initial margin. Subsequent variation margin receipts or payments are received or made by the Fund depending on fluctuations in the fair value of the reference entity and are recorded by the Fund as unrealized appreciation or depreciation. When the contract is closed, the Fund records a realized gain or loss equal to the difference between the value of the contract at the time it was opened and the value at the time it was closed.
Upfront payments received or made by a Fund on credit default swap agreements and interest rate swap agreements are amortized over the expected life of the agreement. Periodic payments received or paid by a Fund are recorded as realized gains or losses. Payments received or made as a result of a credit event or termination of the contract are recognized, net of a proportional amount of the upfront payment, as realized gains or losses.
(e) Currency Translations
The accounting records of the Funds are maintained in U.S. dollars. All assets and liabilities initially expressed in foreign currencies are converted into U.S. dollars at prevailing exchange rates. Purchases and sales of investment securities, dividend and interest income, and certain expenses are translated at the rates of exchange prevailing on the respective dates of such transactions. Changes in the relationship of these foreign currencies to the U.S. dollar can significantly affect the value of the investments and earnings of the Funds. Foreign investments may also subject the Funds to foreign government exchange restrictions, expropriation, taxation, or other political, social or economic developments, all of which could affect the market and/or credit risk of the investments.
The Funds do not isolate that portion of the results of operations resulting from changes in the foreign exchange rates on investments from the fluctuations arising from changes in the market prices of securities held. Such fluctuations are included with the net realized gain or loss and unrealized appreciation or depreciation on investments.
Reported net realized foreign exchange gains and losses arise from sales of foreign currencies and currency gains or losses realized between the trade and settlement dates on investment transactions. Net unrealized appreciation and depreciation arise from changes in the fair values of assets and liabilities other than investments in securities at the fiscal period end, resulting from changes in exchange rates.
(f) Foreign Taxes
The Funds may be subject to foreign taxes (a portion of which may be reclaimable) on income, stock dividends, capital gains on investments or certain foreign currency transactions. All foreign taxes are recorded in accordance with the applicable foreign tax regulations and rates that exist in the foreign jurisdictions in which the Funds invest. These foreign taxes, if any, are paid by the Funds and reflected in their Statements of Operations as follows: foreign taxes withheld at source are presented as a reduction of income and foreign taxes on capital gains from sales of investments are included with the net realized gain (loss) on investments. Foreign taxes payable or deferred as of March 31, 2021, if any, are disclosed in the Funds’ Statements of Assets and Liabilities.
(g) Security Transactions
Security transactions are recorded on the trade date for financial reporting purposes. Realized gains and losses from securities transactions are recorded using the identified cost basis. Proceeds from lawsuits related to investment holdings are recorded as a reduction to cost if the securities are still held and as realized gains if no longer held in the respective Fund. Dividend income is recorded on the ex-dividend date, net of applicable taxes withheld by foreign countries, if any. Taxable non-cash dividends are recorded as dividend income. Interest income, including amortization of premiums and accretion of discounts, is accrued on a daily basis. Dividend income from Real Estate Investment Trusts (“REITs”) is recorded based on the income included in the distributions received from the REIT investments using published REIT classifications, including some management estimates when actual amounts are not available. Distributions received in excess of this estimated amount are recorded as a reduction of the cost of investments or reclassified to realized gains. The actual amounts of income, return of capital, and realized gains are only determined by each REIT after its fiscal year-end, and may differ from the estimated amounts.
(h) Distributions
Distributions of net investment income and net realized gains, if any, are declared and paid at least annually. Dividends are reinvested in additional shares, unless shareholders request payment in cash. Distributions are recorded on the ex-dividend date and are determined in accordance with U.S. federal income tax regulations which may differ from U.S. GAAP.
58 | THE RYDEX FUNDS ANNUAL REPORT | |
NOTES TO FINANCIAL STATEMENTS (continued) |
(i) Class Allocations
Interest and dividend income, most expenses, all realized gains and losses, and all unrealized appreciation and depreciation are allocated to the classes based upon the value of the outstanding shares in each Class. Certain costs, such as distribution and service fees are charged directly to specific classes. In addition, certain expenses have been allocated to the individual Funds in the Trust based on the respective net assets of each Fund included in the Trust.
(j) Cash
The Funds may leave cash overnight in their cash account with the custodian. Periodically, a Fund may have cash due to the custodian bank as an overdraft balance. A fee is incurred on this overdraft, calculated by multiplying the overdraft by a rate based on the federal funds rate, which was 0.06% at March 31, 2021.
(k) Indemnifications
Under the Funds’ organizational documents, the Trustees and Officers are indemnified against certain liabilities arising out of the performance of their duties to the Trust. In addition, throughout the normal course of business, the Funds enter into contracts that contain a variety of representations and warranties which provide general indemnifications. The Funds’ maximum exposure under these arrangements is unknown, as this would involve future claims that may be made against the Funds and/or their affiliates that have not yet occurred. However, based on experience, the Funds expect the risk of loss to be remote.
Note 2 – Derivatives
As part of their investment strategy, the Funds may utilize a variety of derivative instruments. These investments involve, to varying degrees, elements of market risk and risks in excess of amounts recognized on the Statements of Assets and Liabilities. Valuation and accounting treatment of these instruments can be found under Significant Accounting Policies in Note 1 of these Notes to Financial Statements.
Derivatives are instruments whose values depend on, or are derived from, in whole or in part, the value of one or more other assets, such as securities, currencies, commodities or indices. Derivative instruments may be used to increase investment flexibility (including to maintain cash reserves while maintaining exposure to certain other assets), for risk management (hedging) purposes, to facilitate trading, to reduce transaction costs and to pursue higher investment returns. Derivative instruments may also be used to mitigate certain investment risks, such as foreign currency exchange rate risk, interest rate risk and credit risk. U.S. GAAP requires disclosures to enable investors to better understand how and why a Fund uses derivative instruments, how these derivative instruments are accounted for and their effects on the Fund’s financial position and results of operations.
The Funds may utilize derivatives for the following purposes:
Duration: the use of an instrument to manage the interest rate risk of a portfolio.
Index Exposure: the use of an instrument to obtain exposure to a listed or other type of index.
Leverage: gaining total exposure to equities or other assets on the long and short sides at greater than 100% of invested capital.
Liquidity: the ability to buy or sell exposure with little price/market impact.
For any Fund whose investment strategy consistently involves applying leverage, the value of the Fund’s shares will tend to increase or decrease more than the value of any increase or decrease in the underlying index or other asset. In addition, because an investment in derivative instruments generally requires a small investment relative to the amount of investment exposure assumed, an opportunity for increased net income is created; but, at the same time, leverage risk will increase. The Fund’s use of leverage, through borrowings or instruments such as derivatives, may cause the Fund to be more volatile and riskier than if they had not been leveraged.
Futures Contracts
A futures contract is an agreement to purchase (long) or sell (short) an agreed amount of securities or other instruments at a set price for delivery at a future date. There are significant risks associated with a Fund’s use of futures contracts, including (i) there may be an imperfect or no correlation between the changes in market value of the underlying asset and the prices of futures contracts; (ii) there may not be a liquid secondary market for a futures contract; (iii) trading restrictions or limitations may be imposed by an exchange; and (iv) government regulations may restrict trading in futures contracts. When investing in futures, there is minimal counterparty credit risk to a Fund because futures are exchange-traded and the exchange’s clearinghouse, as counterparty to all exchange-traded futures, guarantees against default. Cash deposits are shown as segregated cash with broker on the Statements of Assets and Liabilities; securities held as collateral are noted on the Schedules of Investments.
| | THE RYDEX FUNDS ANNUAL REPORT | 59 |
NOTES TO FINANCIAL STATEMENTS (continued) |
The following table represents the Funds’ use and volume of futures on a monthly basis:
| | | | Average Notional Amount | |
Fund | Use | | Long | | | Short | |
Emerging Markets 2x Strategy Fund | Index exposure, Leverage, Liquidity | | $ | 35,814 | | | $ | 11,325 | |
Inverse Emerging Markets 2x Strategy Fund | Index exposure, Leverage, Liquidity | | | — | | | | 11,325 | |
Emerging Markets Bond Strategy Fund | Duration, Index exposure, Leverage, Liquidity | | | 444,437 | | | | — | |
Swap Agreements
A swap is an agreement that obligates two parties to exchange a series of cash flows at specified intervals based upon or calculated by reference to changes in specified prices or rates for a specified amount of an underlying asset. When utilizing over-the-counter (“OTC”) swaps, a fund bears the risk of loss of the amount expected to be received under a swap agreement in the event of the default or bankruptcy of a swap agreement counterparty or if the underlying asset declines in value. Certain standardized swaps are subject to mandatory central clearing and are executed on a multi-lateral or other trade facility platform, such as a registered exchange. There is limited counterparty credit risk with respect to centrally-cleared swaps as the transaction is facilitated through a central clearinghouse, much like exchange-traded futures contracts. For a fund utilizing centrally-cleared swaps, the exchange bears the risk of loss resulting from a counterparty not being able to pay. There is no guarantee that a fund or an underlying fund could eliminate its exposure under an outstanding swap agreement by entering into an offsetting swap agreement with the same or another party.
Total return and custom basket swaps involve commitments where single or multiple cash flows are exchanged based on the price of an underlying reference asset (such as an index or custom basket of securities) for a fixed or variable interest rate. Total return and custom basket swaps will usually be computed based on the current value of the reference asset as of the close of regular trading on the NYSE or other exchange, with the swap value being adjusted to include dividends accrued, financing charges and/or interest associated with the swap agreement. When utilizing total return or custom basket swaps, a fund bears the risk of loss of the amount expected to be received under a swap agreement in the event of the default or bankruptcy of a swap agreement counterparty or if the underlying reference asset declines in value.
The following table represents the Funds’ use and volume of total return and custom basket swaps on a monthly basis:
| | | | Average Notional Amount | |
Fund | Use | | Long | | | Short | |
Long Short Equity Fund | Index exposure, Liquidity | | $ | 6,933,272 | | | $ | 11,059,943 | |
Emerging Markets 2x Strategy Fund | Index exposure, Leverage, Liquidity | | | 9,972,565 | | | | — | |
Inverse Emerging Markets 2x Strategy Fund | Index exposure, Leverage, Liquidity | | | — | | | | 1,568,142 | |
Emerging Markets Bond Strategy Fund | Duration, Index exposure, Leverage, Liquidity | | | 419,826 | | | | — | |
Credit default swaps are instruments which allow for the full or partial transfer of third party credit risk, with respect to a particular entity or entities, from one counterparty to the other. A fund enters into credit default swaps as a “seller” or “buyer” of protection primarily to gain or reduce exposure to the investment grade and/or high yield bond market. A seller of credit default swaps is selling credit protection or assuming credit risk with respect to the underlying entity or entities. The buyer in a credit default swap is obligated to pay the seller a periodic stream of payments over the term of the contract provided that no event of default on an underlying reference obligation has occurred. If a credit event occurs, as defined under the terms of the swap agreement, the seller will either (i) pay to the buyer of protection an amount equal to the notional amount of the swap and take delivery of the referenced obligation or underlying securities comprising the referenced index or (ii) pay a net settlement amount in the form of cash or securities equal to the notional amount of the swap less the recovery value of the referenced obligation or underlying securities comprising the referenced index. The notional amount reflects the maximum potential amount the seller of credit protection could be required to pay to the buyer if a credit event occurs. The seller of protection receives periodic premium payments from the buyer and may also receive or pay an upfront premium adjustment to the stated periodic payments. In the event a credit default occurs on a credit default swap referencing an index, a factor adjustment will take place and the buyer of protection will receive a payment reflecting the par less the default recovery rate of the defaulted index component based on its weighting in the index. If no default occurs, the counterparty will pay the stream of payments and have no further obligations to the fund selling the credit protection. For a fund utilizing centrally cleared credit default swaps, the exchange bears the risk of loss resulting from a counterparty not being able to pay. For OTC credit default swaps, a fund bears the risk of loss of the amount expected to be received under a swap agreement in the event of the default or bankruptcy of a swap agreement counterparty, or in the case of a credit default swap in which a fund is selling credit protection, the default of a third party issuer.
60 | THE RYDEX FUNDS ANNUAL REPORT | |
NOTES TO FINANCIAL STATEMENTS (continued) |
The quoted market prices and resulting market values for credit default swap agreements on securities and credit indices serve as an indicator of the current status of the payment/performance risk and represent the likelihood of an expected liability (or profit) for the credit derivative had the notional amount of the swap agreement been closed/sold as of the period end. Increasing market values, in absolute terms when compared to the notional amount of the swap, represent a deterioration of the referenced entity’s credit soundness and a greater likelihood or risk of default or other credit event occurring as defined under the terms of the agreement.
The following table represents the Funds’ use and volume of credit default swaps on a monthly basis:
| | | | Average Notional Amount | |
Fund | Use | | Protection Sold | | | Protection Purchased | |
Emerging Markets Bond Strategy Fund | Duration, Index exposure, Leverage, Liquidity | | $ | 726,458 | | | $ | — | |
Derivative Investment Holdings Categorized by Risk Exposure
The following is a summary of the location of derivative investments on the Funds’ Statements of Assets and Liabilities as of March 31, 2021:
Derivative Investment Type | Asset Derivatives | Liability Derivatives |
Equity/Interest Rate contracts | Unrealized appreciation on OTC swap agreements | Unrealized depreciation on OTC swap agreements |
| | Variation margin on futures contracts |
Credit contracts | Unrealized appreciation on OTC swap agreements | Unamortized upfront premiums received on credit default swap agreements |
| Variation margin on credit default swap agreements | Variation margin on futures contracts |
The following tables set forth the fair value of the Funds’ derivative investments categorized by primary risk exposure at March 31, 2021:
Asset Derivative Investments Value |
Fund | | Swaps
Equity
Risk | | | Futures
Interest Rate
Risk* | | | Swaps
Credit
Risk* | | | Total Value at
March 31,
2021 | |
Long Short Equity Fund | | $ | 1,186,519 | | | $ | — | | | $ | — | | | $ | 1,186,519 | |
Inverse Emerging Markets 2x Strategy Fund | | | 38,375 | | | | — | | | | — | | | | 38,375 | |
Emerging Markets Bond Strategy Fund | | | — | | | | — | | | | 418 | | | | 418 | |
Liability Derivative Investments Value |
Fund | | Swaps
Equity
Risk | | | Futures
Interest Rate
Risk* | | | Swaps
Credit
Risk* | | | Total Value at
March 31,
2021 | |
Long Short Equity Fund | | $ | 1,418,521 | | | $ | — | | | $ | — | | | $ | 1,418,521 | |
Emerging Markets 2x Strategy Fund | | | 898,927 | | | | — | | | | — | | | | 898,927 | |
Emerging Markets Bond Strategy Fund | | | — | | | | 2,022 | | | | 1,753 | | | | 3,775 | |
* | Includes cumulative appreciation (depreciation) of exchange-traded, OTC and centrally-cleared derivatives as reported on the Schedules of Investments. For exchange-traded and centrally-cleared derivatives, variation margin is reported within the Statements of Assets and Liabilities. |
The following is a summary of the location of derivative investments on the Funds’ Statements of Operations for the year ended March 31, 2021:
Derivative Investment Type | Location of Gain (Loss) on Derivatives |
Equity/Interest Rate contracts | Net realized gain (loss) on futures contracts |
| Net change in unrealized appreciation (depreciation) on futures contracts |
Equity/Credit contracts | Net realized gain (loss) on swap agreements |
| Net change in unrealized appreciation (depreciation) on swap agreements |
| | THE RYDEX FUNDS ANNUAL REPORT | 61 |
NOTES TO FINANCIAL STATEMENTS (continued) |
The following is a summary of the Funds’ realized gain (loss) and change in unrealized appreciation (depreciation) on derivative investments recognized on the Statements of Operations categorized by primary risk exposure for the year ended March 31, 2021:
Realized Gain (Loss) on Derivative Investments Recognized on the Statements of Operations |
Fund | | Futures
Equity
Risk | | | Swaps
Equity
Risk | | | Futures
Interest Rate
Risk | | | Swaps
Credit
Risk | | | Total | |
Long Short Equity Fund | | $ | — | | | $ | (2,382,497 | ) | | $ | — | | | $ | — | | | $ | (2,382,497 | ) |
Emerging Markets 2x Strategy Fund | | | 60,369 | | | | 4,283,457 | | | | — | | | | — | | | | 4,343,826 | |
Inverse Emerging Markets 2x Strategy Fund | | | (13,003 | ) | | | (1,578,473 | ) | | | — | | | | — | | | | (1,591,476 | ) |
Emerging Markets Bond Strategy Fund | | | — | | | | — | | | | 4,808 | | | | 179,320 | | | | 184,128 | |
Change in Unrealized Appreciation (Depreciation) on Derivative Investments Recognized on the Statements of Operations |
Fund | | Futures
Equity
Risk | | | Swaps
Equity
Risk | | | Futures
Interest Rate
Risk | | | Swaps
Credit
Risk | | | Total | |
Long Short Equity Fund | | $ | — | | | $ | 130,978 | | | $ | — | | | $ | — | | | $ | 130,978 | |
Emerging Markets 2x Strategy Fund | | | (107 | ) | | | (796,482 | ) | | | — | | | | — | | | | (796,589 | ) |
Inverse Emerging Markets 2x Strategy Fund | | | — | | | | 36,619 | | | | — | | | | — | | | | 36,619 | |
Emerging Markets Bond Strategy Fund | | | — | | | | — | | | | (9,280 | ) | | | 17,069 | | | | 7,789 | |
In conjunction with the use of derivative instruments, the Funds are required to maintain collateral in various forms. Depending on the financial instrument utilized and the broker involved, the Funds use margin deposits at the broker, cash and/or securities segregated at the custodian bank, discount notes or repurchase agreements allocated to the Funds as collateral.
The Trust has established counterparty credit guidelines and enters into transactions only with financial institutions of investment grade or better. The Trust monitors the counterparty credit risk.
Foreign Investments
There are several risks associated with exposure to foreign currencies, foreign issuers and emerging markets.A fund’s indirect and direct exposure to foreign currencies subjects the Fund to the risk that those currencies will decline in value relative to the U.S. dollar, or in the case of short positions, that the U.S. dollar will decline in value relative to the currency being hedged. Currency rates in foreign countries may fluctuate significantly over short periods of time for a number of reasons, including changes in interest rates and the imposition of currency controls or other political developments in the U.S. or abroad. In addition, the Funds may incur transaction costs in connection with conversions between various currencies. The Funds may, but is not obligated to, engage in currency hedging transactions, which generally involve buying currency forward, options or futures contracts. However, not all currency risks may be effectively hedged, and in some cases the costs of hedging techniques may outweigh expected benefits. In such instances, the value of securities denominated in foreign currencies can change significantly when foreign currencies strengthen or weaken relative to the U.S. dollar.
The Funds may invest in securities of foreign companies directly, or in financial instruments, such as ADRs and exchange-traded funds, which are indirectly linked to the performance of foreign issuers. Foreign markets can be more volatile than the U.S. market due to increased risks of adverse issuer, political, regulatory, market, or economic developments and can perform differently from the U.S. market. Investing in securities of foreign companies directly, or in financial instruments that are indirectly linked to the performance of foreign issuers, may involve risks not typically associated with investing in U.S. issuers. The value of securities denominated in foreign currencies, and of dividends from such securities, can change significantly when foreign currencies strengthen or weaken relative to the U.S. dollar. Foreign securities markets generally have less trading volume and less liquidity than U.S. markets, and prices in some foreign markets may fluctuate more than those of securities traded on U.S. markets. Many foreign countries lack accounting and disclosure standards comparable to those that apply to U.S. companies, and it may be more difficult to obtain reliable information regarding a foreign issuer’s financial condition and operations. Transaction costs and costs associated with custody services are generally higher for foreign securities than they are for U.S. securities. Some foreign governments levy withholding taxes against dividend and interest income. Although in some countries portions of these taxes are recoverable, the non-recovered portion will reduce the income received by the Funds.
62 | THE RYDEX FUNDS ANNUAL REPORT | |
NOTES TO FINANCIAL STATEMENTS (continued) |
Emerging markets, which consist of countries that have an emerging stock market as defined by Standard & Poor’s®, countries or markets with low- to middle-income economies as classified by the World Bank, and other countries or markets with similar characteristics as determined by GI, can be more volatile than the U.S. market due to increased risks of adverse issuer, political, regulatory, market, or economic developments and can perform differently from the U.S. market. Emerging markets can be subject to greater social, economic, regulatory, and political uncertainties and can be extremely volatile. As a result, the securities of emerging market issuers may present market, credit, currency, liquidity, legal, political and other risks different from, or greater than, the risks of investing in securities of developed foreign countries. In addition, the risks associated with investing in a narrowly defined geographic area are generally more pronounced with respect to investments in emerging market countries. The Fund may also be subject to this risk with respect to its investments in derivatives or other securities or financial instruments whose returns are related to the returns of emerging market securities.
Note 3 – Offsetting
In the normal course of business, the Funds enter into transactions subject to enforceable master netting arrangements or other similar arrangements. Generally, the right to offset in those agreements allows the Funds to counteract the exposure to a specific counterparty with collateral received from or delivered to that counterparty based on the terms of the arrangements. These arrangements provide for the right to liquidate upon the occurrence of an event of default, credit event upon merger or additional termination event.
In order to better define their contractual rights and to secure rights that will help the Funds mitigate their counterparty risk, the Funds may enter into an International Swaps and Derivatives Association, Inc. Master Agreement (“ISDA Master Agreement”) or similar agreement with their derivative contract counterparties. An ISDA Master Agreement is a bilateral agreement between a fund and a counterparty that governs OTC derivatives, including foreign exchange contracts, and typically contains, among other things, collateral posting terms and netting provisions in the event of a default and/or termination event. The provisions of the ISDA Master Agreement typically permit a single net payment in the event of a default (close-out netting) or similar event, including the bankruptcy or insolvency of the counterparty.
For derivatives traded under an ISDA Master Agreement, the collateral requirements are typically calculated by netting the mark-to-market amount for each transaction under such agreement and comparing that amount to the value of any collateral currently pledged by the Funds and the counterparty. For financial reporting purposes, cash collateral that has been pledged to cover obligations of the Funds and cash collateral received from the counterparty, if any, are reported separately on the Statements of Assets and Liabilities as segregated cash with broker/receivable for variation margin, or payable for swap settlement/variation margin. Cash and/or securities pledged or received as collateral by the Funds in connection with an OTC derivative subject to an ISDA Master Agreement generally may not be invested, sold or rehypothecated by the counterparty or the Funds, as applicable, absent an event of default under such agreement, in which case such collateral generally may be applied towards obligations due to and payable by such counterparty or the Funds, as applicable. Generally, the amount of collateral due from or to a counterparty must exceed a minimum transfer amount threshold (e.g., $300,000) before a transfer is required to be made. To the extent amounts due to the Funds from their counterparties are not fully collateralized, contractually or otherwise, the Funds bear the risk of loss from counterparty nonperformance. The Funds attempt to mitigate counterparty risk by only entering into agreements with counterparties that they believe to be of good standing and by monitoring the financial stability of those counterparties.
For financial reporting purposes, the Funds do not offset derivative assets and derivative liabilities that are subject to netting arrangements in the Statements of Assets and Liabilities.
| | THE RYDEX FUNDS ANNUAL REPORT | 63 |
NOTES TO FINANCIAL STATEMENTS (continued) |
The following tables present derivative financial instruments and secured financing transactions that are subject to enforceable netting arrangements:
| | | | | | | | | | | | | | | | Gross Amounts Not Offset
in the Statements of
Assets and Liabilities | | | | | |
Fund | Instrument | | Gross
Amounts of
Recognized
Assets1 | | | Gross
Amounts
Offset in the
Statements
of Assets and
Liabilities | | | Net Amount
of Assets
Presented on
the Statements
of Assets and
Liabilities | | | Financial
Instruments | | | Cash
Collateral
Received | | | Net
Amount | |
Long Short Equity Fund | Custom basket swap agreements | | $ | 1,186,519 | | | $ | — | | | $ | 1,186,519 | | | $ | (1,186,519 | ) | | $ | — | | | $ | — | |
Inverse Emerging Markets 2x Strategy Fund | Swap equity contracts | | | 38,375 | | | | — | | | | 38,375 | | | | — | | | | — | | | | 38,375 | |
Emerging Markets Bond Strategy Fund | Credit index swap agreements | | | 418 | | | | — | | | | 418 | | | | — | | | | — | | | | 418 | |
| | | | | | | | | | | | | | | | Gross Amounts Not Offset
in the Statements of
Assets and Liabilities | | | | | |
Fund | Instrument | | Gross
Amounts of
Recognized
Liabilities1 | | | Gross
Amounts
Offset in the
Statements
of Assets and
Liabilities | | | Net Amount
of Liabilities
Presented on
the Statements
of Assets and
Liabilities | | | Financial
Instruments | | | Cash
Collateral
Pledged | | | Net
Amount | |
Long Short Equity Fund | Custom basket swap agreements | | $ | 1,418,521 | | | $ | — | | | $ | 1,418,521 | | | $ | (1,418,521 | ) | | $ | — | | | $ | — | |
Emerging Markets 2x Strategy Fund | Swap equity contracts | | | 898,927 | | | | — | | | | 898,927 | | | | (898,927 | ) | | | — | | | | — | |
1 | Exchange-traded or centrally-cleared derivatives are excluded from these reported amounts. |
The Funds have the right to offset deposits against any related derivative liabilities outstanding with each counterparty with the exception of exchange-traded or centrally-cleared derivatives. The following table presents deposits held by others in connection with derivative investments as of March 31, 2021.
Fund | Counterparty | Asset Type | | Cash Pledged | | | Cash Received | |
Emerging Markets Bond Strategy Fund | Barclays Bank plc | Credit default swap agreements | | $ | 56,328 | | | $ | — | |
Note 4 – Fair Value Measurement
In accordance with U.S. GAAP, fair value is defined as the price that the Funds would receive to sell an investment or pay to transfer a liability in an orderly transaction with an independent buyer in the principal market, or in the absence of a principal market, the most advantageous market for the investment or liability. U.S. GAAP establishes a three-tier fair value hierarchy based on the types of inputs used to value assets and liabilities and requires corresponding disclosure. The hierarchy and the corresponding inputs are summarized below:
Level 1 — | quoted prices in active markets for identical assets or liabilities. |
Level 2 — | significant other observable inputs (for example quoted prices for securities that are similar based on characteristics such as interest rates, prepayment speeds, credit risk, etc.). |
64 | THE RYDEX FUNDS ANNUAL REPORT | |
NOTES TO FINANCIAL STATEMENTS (continued) |
Level 3 — | significant unobservable inputs based on the best information available under the circumstances, to the extent observable inputs are not available, which may include assumptions. |
The types of inputs available depend on a variety of factors, such as the type of security and the characteristics of the markets in which it trades, if any. Fair valuation determinations that rely on fewer or no observable inputs require greater judgment. Accordingly, fair value determinations for Level 3 securities require the greatest amount of judgment.
The inputs or methodologies used for valuing securities are not necessarily an indication of the risk associated with investing in those securities. The suitability of the techniques and sources employed to determine fair valuation are regularly monitored and subject to change.
Note 5 – Investment Advisory Agreement and Other Agreements
Under the terms of an investment advisory contract, the Funds pay GI investment advisory fees calculated at the annualized rates below, based on the average daily net assets of the Funds:
Fund | | Management Fees
(as a % of Net Assets) | |
Long Short Equity Fund | | | 0.90 | % |
Emerging Markets 2x Strategy Fund | | | 0.90 | % |
Inverse Emerging Markets 2x Strategy Fund | | | 0.90 | % |
Emerging Markets Bond Strategy Fund | | | 0.75 | % |
When the aggregate assets of each series of the Trust (excluding the Long Short Equity Fund, Managed Futures Strategy Fund and Multi-Hedge Strategies Fund) and each series of Rydex Dynamic Funds equal or exceed $10 billion, the advisory fee rate paid by each individual Fund (excluding the Long Short Equity Fund, Managed Futures Strategy Fund and Multi-Hedge Strategies Fund) will be reduced in accordance with the asset level and breakpoint schedule set forth below.
Fund Assets Under Management | | Fund Asset-Based
Breakpoint Reductions | |
$500 million - $1 billion | | | 0.025 | % |
> $1 billion - $2 billion | | | 0.050 | % |
> $2 billion | | | 0.075 | % |
GI pays operating expenses on behalf of the Trust, such as audit and accounting related services, legal services, custody, printing and mailing, among others, on a pass-through basis. Such expenses are allocated to various Funds within the complex based on relative net assets.
The Board has adopted a Distribution Plan applicable to A-Class shares, H-Class shares and P-Class shares for which GFD and other firms that provide distribution and/or shareholder services (“Service Providers”) may receive compensation. If a Service Provider provides distribution services, the Funds will pay distribution fees to GFD at an annual rate not to exceed 0.25% of average daily net assets, pursuant to Rule 12b-1 of the 1940 Act. GFD, in turn, will pay the Service Provider out of its fees. GFD may, at its discretion, retain a portion of such payments to compensate itself for distribution services.
The Board has adopted a separate Distribution and Shareholder Services Plan applicable to C-Class shares that allows the Funds to pay annual distribution and service fees of 1.00% of the Funds’ C-Class shares average daily net assets. The annual 0.25% service fee compensates a shareholder’s financial adviser for providing ongoing services to the shareholder. The annual distribution fee of 0.75% reimburses GFD for paying the shareholder’s financial adviser an ongoing sales commission. GFD advances the first year’s service and distribution fees to the financial adviser. GFD retains the service and distribution fees on accounts with no authorized dealer of record.
For the year ended March 31, 2021, GFD retained sales charges of $128,465 relating to sales of A-Class shares of the Trust.
Certain trustees and officers of the Trust are also officers of GI and/or GFD. The Trust does not compensate its officers or trustees who are officers, directors and/or employees of GI or GFD.
| | THE RYDEX FUNDS ANNUAL REPORT | 65 |
NOTES TO FINANCIAL STATEMENTS (continued) |
MUFG Investor Services (US), LLC (“MUIS”) acts as the Funds’ administrator, transfer agent and accounting agent. As administrator, transfer agent and accounting agent, MUIS maintains the books and records of the Funds’ securities and cash. U.S. Bank, N.A. (“U.S. Bank”) acts as the Funds’ custodian. As custodian, U.S. Bank is responsible for the custody of the Funds’ assets. For providing the aforementioned services, MUIS and U.S. Bank are entitled to receive a monthly fee equal to an annual percentage of each Fund’s average daily net assets and out of pocket expenses.
Note 6 – Repurchase Agreements
The Funds transfer uninvested cash balances into a single joint account, the daily aggregate balance of which is invested in one or more repurchase agreements collateralized by obligations of the U.S. Treasury and U.S. government agencies. The joint account includes other Funds in the Guggenheim complex not covered in this report. The collateral is in the possession of the Funds’ custodian and is evaluated to ensure that its market value exceeds, at a minimum, 102% of the original face amount of the repurchase agreements. Each Fund holds a pro rata share of the collateral based on the dollar amount of the repurchase agreement entered into by each Fund.
At March 31, 2021, the repurchase agreements in the joint account were as follows:
Counterparty and
Terms of Agreement | | Face Value | | | Repurchase Price | | | Collateral | | Par Value | | | Fair Value | |
J.P. Morgan Securities LLC | | | | | | | | | | U.S. Treasury Bond | | | | | | | | |
0.01% | | | | | | | | | | 2.38% | | | | | | | | |
Due 04/01/21 | | $ | 124,999,036 | | | $ | 124,999,053 | | | 11/15/49 | | $ | 126,141,600 | | | $ | 127,499,092 | |
| | | | | | | | | | | | | | | | | | | |
Barclays Capital, Inc. | | | | | | | | | | U.S. Treasury Inflation Indexed Bond | | | | | | | | |
0.01% | | | | | | | | | | 0.13% | | | | | | | | |
Due 04/01/21 | | | 56,830,637 | | | | 56,830,653 | | | 02/15/51 | | | 57,053,077 | | | | 57,967,257 | |
| | | | | | | | | | | | | | | | | | | |
BofA Securities, Inc. | | | | | | | | | | U.S. Treasury Note | | | | | | | | |
0.01% | | | | | | | | | | 0.38% | | | | | | | | |
Due 04/01/21 | | | 51,866,820 | | | | 51,866,827 | | | 04/30/25 | | | 53,449,300 | | | | 52,904,236 | |
In the event of counterparty default, the Funds have the right to collect the collateral to offset losses incurred. There is potential loss to the Funds in the event the Funds are delayed or prevented from exercising their rights to dispose of the collateral securities, including the risk of a possible decline in the value of the underlying securities during the period while the Funds seek to assert their rights. GI, acting under the supervision of the Board, reviews the value of the collateral and the creditworthiness of those banks and dealers with which the Funds enter into repurchase agreements to evaluate potential risks.
Note 7 – Portfolio Securities Loaned
The Funds may lend their securities to approved brokers to earn additional income. Security lending income shown on the Statements of Operations is shown net of rebates paid to the borrowers and earnings on cash collateral investments shared with the lending agent. Within this arrangement, the Funds act as the lender, U.S. Bank acts as the lending agent, and other approved registered broker dealers act as the borrowers. The Funds receive cash collateral, valued at 102% of the value of the securities on loan. Under the terms of the Funds’ securities lending agreement with U.S. Bank, cash collateral and proceeds are invested in the First American Government Obligations Fund — Class Z. The Funds bear the risk of loss on cash collateral investments. Collateral is maintained over the life of the loan in an amount not less than the value of loaned securities, as determined at the close of fund business each day; any additional collateral required due to changes in security values is delivered to the Funds the next business day. Although the collateral mitigates the risk, the Funds could experience a delay in recovering their securities and a possible loss of income or value if the borrower fails to return the securities. The Funds have the right under the securities lending agreement to recover the securities from the borrower on demand. Securities lending transactions are accounted for as secured borrowings. The remaining contractual maturity of the securities lending agreement is overnight and continuous.
66 | THE RYDEX FUNDS ANNUAL REPORT | |
NOTES TO FINANCIAL STATEMENTS (continued) |
At March 31, 2021, the Funds participated in securities lending transactions, which are subject to enforceable netting arrangements, as follows:
| | | Gross Amounts Not Offset in the
Statements of Assets and Liabilities | | | | Securities Lending Collateral | |
Fund | | Value of
Securities
Loaned | | | Collateral
Received(a) | | | Net
Amount | | | | Cash
Collateral
Invested | | | Cash
Collateral
Uninvested | | | Total
Collateral | |
Long Short Equity Fund | | $ | 84,230 | | | $ | (84,230 | ) | | $ | — | | | | $ | 86,162 | | | $ | — | | | $ | 86,162 | |
Emerging Markets 2x Strategy Fund | | | 31,851 | | | | (31,851 | ) | | | — | | | | | 32,816 | | | | — | | | | 32,816 | |
(a) | Actual collateral received by the Fund is generally greater than the amount shown due to overcollateralization. |
In the event of counterparty default, the Funds have the right to collect the collateral to offset losses incurred. There is potential loss to the Funds in the event the Funds are delayed or prevented from exercising their rights to dispose of the collateral securities, including the risk of a possible decline in the value of the underlying securities during the period while the Funds seek to assert their rights. GI, acting under the supervision of the Board, reviews the value of the collateral and the creditworthiness of those banks and dealers to evaluate potential risks.
Note 8 – Federal Income Tax Information
The Funds intend to comply with the provisions of Subchapter M of the Internal Revenue Code applicable to regulated investment companies and will distribute substantially all taxable net investment income and capital gains sufficient to relieve the Funds from all, or substantially all, federal income, excise and state income taxes. Therefore, no provision for federal or state income tax or federal excise tax is required.
Tax positions taken or expected to be taken in the course of preparing the Funds’ tax returns are evaluated to determine whether the tax positions are “more-likely-than-not” of being sustained by the applicable tax authority. Tax positions not deemed to meet the more-likely-than-not threshold would be recorded as a tax benefit or expense in the current year. Management has analyzed the Funds’ tax positions taken, or to be taken, on U.S. federal income tax returns for all open tax years, and has concluded that no provision for income tax is required in the Funds’ financial statements. The Funds’ U.S. federal income tax returns are subject to examination by the Internal Revenue Service (“IRS”) for a period of three years after they are filed.
The tax character of distributions paid during the year ended March 31, 2021 was as follows:
Fund | | Ordinary
Income | | | Long-Term
Capital Gain | | | Total
Distributions | |
Long Short Equity Fund | | $ | 74,720 | | | $ | — | | | $ | 74,720 | |
Emerging Markets Bond Strategy Fund | | | 7,255 | | | | — | | | | 7,255 | |
The tax character of distributions paid during the year ended March 31, 2020 was as follows:
Fund | | Ordinary
Income | | | Long-Term
Capital Gain | | | Total
Distributions | |
Long Short Equity Fund | | $ | 153,645 | | | $ | — | | | $ | 153,645 | |
Emerging Markets 2x Strategy Fund | | | 44,598 | | | | — | | | | 44,598 | |
Inverse Emerging Markets 2x Strategy Fund | | | 4,522 | | | | — | | | | 4,522 | |
Emerging Markets Bond Strategy Fund | | | 340,630 | | | | — | | | | 340,630 | |
Note: For U.S. federal income tax purposes, short-term capital gain distributions are treated as ordinary income distributions.
| | THE RYDEX FUNDS ANNUAL REPORT | 67 |
NOTES TO FINANCIAL STATEMENTS (continued) |
The tax components of distributable earnings/(loss) as of March 31, 2021 were as follows:
Fund | | Undistributed
Ordinary
Income | | | Undistributed
Long-Term
Capital Gain | | | Net Unrealized
Appreciation
(Depreciation) | | | Accumulated
Capital and
Other Losses | | | Total | |
Long Short Equity Fund | | $ | 20,579 | | | $ | — | | | $ | 2,500,664 | | | $ | (3,807,482 | ) | | $ | (1,286,239 | ) |
Emerging Markets 2x Strategy Fund | | | — | | | | — | | | | (409,848 | ) | | | (10,346,604 | ) | | | (10,756,452 | ) |
Inverse Emerging Markets 2x Strategy Fund | | | — | | | | — | | | | 38,375 | | | | (19,945,738 | ) | | | (19,907,363 | ) |
Emerging Markets Bond Strategy Fund | | | — | | | | — | | | | (1,335 | ) | | | (182,478 | ) | | | (183,813 | ) |
For U.S. federal income tax purposes, capital loss carryforwards represent realized losses of the Funds that may be carried forward and applied against future capital gains. The Funds are permitted to carry forward capital losses for an unlimited period and such capital loss carryforwards retain their character as either short-term or long-term capital losses. As of March 31, 2021, capital loss carryforwards for the Funds were as follows:
| | | | | | Total | |
| | | Unlimited | | | Capital Loss | |
| Fund | | Short-Term | | | Long-Term | | | Carryforwards | |
| Long Short Equity Fund | | $ | (3,552,276 | ) | | $ | (255,206 | ) | | $ | (3,807,482 | ) |
| Emerging Markets 2x Strategy Fund | | | (9,210,813 | ) | | | (1,135,791 | ) | | | (10,346,604 | ) |
| Inverse Emerging Markets 2x Strategy Fund | | | (19,066,247 | ) | | | (877,256 | ) | | | (19,943,503 | ) |
| Emerging Markets Bond Strategy Fund | | | (172,790 | ) | | | — | | | | (172,790 | ) |
For the year ended March 31, 2021, the following capital loss carryforward amounts were utilized:
Fund | | Utilized | |
Long Short Equity Fund | | $ | 680,450 | |
Emerging Markets 2x Strategy Fund | | | 4,474,207 | |
Net investment income and net realized gains (losses) may differ for financial statement and tax purposes because of temporary or permanent book/tax differences. These differences are primarily due to investments in real estate investment trusts, investments in swaps, losses deferred due to wash sales, taxable overdistributions, and the “mark-to-market” of certain derivatives. Additional differences may result from the tax treatment of net operating losses and the deferral of qualified late-year losses. To the extent these differences are permanent and would require a reclassification between Paid in Capital and Total Distributable Earnings (Loss), such reclassifications are made in the period that the differences arise. These reclassifications have no effect on net assets or NAV per share.
The following adjustments were made on the Statements of Assets and Liabilities as of March 31, 2021 for permanent book/tax differences:
Fund | | Paid In
Capital | | | Total
Distributable
Earnings/(Loss) | |
Long Short Equity Fund | | $ | (150 | ) | | $ | 150 | |
Emerging Markets 2x Strategy Fund | | | (83,631 | ) | | | 83,631 | |
Inverse Emerging Markets 2x Strategy Fund | | | (15,902 | ) | | | 15,902 | |
Emerging Markets Bond Strategy Fund | | | (24,955 | ) | | | 24,955 | |
68 | THE RYDEX FUNDS ANNUAL REPORT | |
NOTES TO FINANCIAL STATEMENTS (continued) |
At March 31, 2021, the cost of investments for U.S. federal income tax purposes, the aggregate gross unrealized appreciation for all investments for which there was an excess of value over tax cost and the aggregate gross unrealized depreciation for all investments for which there was an excess of tax cost over value, were as follows:
| Fund | | Tax
Cost | | | Tax
Unrealized
Appreciation | | | Tax
Unrealized
Depreciation | | | Net Tax
Unrealized
Appreciation/
(Depreciation) | |
| Long Short Equity Fund | | $ | 14,689,651 | | | $ | 4,078,773 | | | $ | (1,578,109 | ) | | $ | 2,500,664 | |
| Emerging Markets 2x Strategy Fund | | | 9,204,663 | | | | 495,574 | | | | (905,422 | ) | | | (409,848 | ) |
| Inverse Emerging Markets 2x Strategy Fund | | | 388,238 | | | | 38,375 | | | | — | | | | 38,375 | |
| Emerging Markets Bond Strategy Fund | | | 393,510 | | | | 618 | | | | (1,953 | ) | | | (1,335 | ) |
Pursuant to U.S. federal income tax regulations applicable to regulated investment companies, the Funds have elected to treat net capital losses and certain ordinary losses realized between November 1 and March 31 of each year as occurring on the first day of the following tax year. The Funds have also elected to treat certain ordinary losses realized between January 1 and March 31 of each year as occurring on the first day of the following tax year. For the year ended March 31, 2021, the following losses reflected in the accompanying financial statements were deferred for U.S. federal income tax purposes until April 1, 2021:
Fund | | Ordinary | | | Capital | |
Inverse Emerging Markets 2x Strategy Fund | | $ | (2,235 | ) | | $ | — | |
Emerging Markets Bond Strategy Fund | | | (9,688 | ) | | | — | |
Note 9 – Securities Transactions
For the year ended March 31, 2021, the cost of purchases and proceeds from sales of investment securities, excluding government securities, short-term investments and derivatives, were as follows:
Fund | | Purchases | | | Sales | |
Long Short Equity Fund | | $ | 25,310,820 | | | $ | 26,963,333 | |
Emerging Markets 2x Strategy Fund | | | 12,692,398 | | | | 9,818,361 | |
The Funds are permitted to purchase or sell securities from or to certain affiliated funds under specified conditions outlined in procedures adopted by the Board. The procedures have been designed to ensure that any purchase or sale of securities by a Fund from or to another fund or portfolio that is or could be considered an affiliate by virtue of having a common investment adviser (or affiliated investment advisers), common trustees and/or common officers complies with Rule 17a-7 of the 1940 Act. Further, as defined under these procedures, each transaction is effected at the current market price to save costs, where permissible. For the year ended March 31, 2021, the Funds engaged in purchases and sales of securities, pursuant to Rule 17a-7 of the 1940 Act, as follows:
Fund | | Purchases | | | Sales | | | Realized
Gain (Loss) | |
Emerging Markets 2x Strategy Fund | | $ | 73,097 | | | $ | — | | | $ | — | |
Note 10 – Line of Credit
The Trust, along with other affiliated trusts, secured an uncommitted $75,000,000 line of credit from U.S. Bank, N.A., which expired June 8, 2020. On June 8, 2020, the line of credit agreement was renewed at an increased amount of $150,000,000 and expires on June 7, 2021. On February 10, 2021, the line of credit was increased from $150,000,000 to $200,000,000. This line of credit is reserved for emergency or temporary purposes. Borrowings, if any, under this arrangement bear interest equal to the Prime Rate, minus 2%, which shall be paid monthly, averaging 1.25% for the year ended March 31, 2021. The Funds did not have any borrowings outstanding under this agreement at March 31, 2021.
| | THE RYDEX FUNDS ANNUAL REPORT | 69 |
NOTES TO FINANCIAL STATEMENTS (continued) |
Note 11 – Legal Proceedings
Tribune Company
Rydex Series Funds has been named as a defendant and a putative member of the proposed defendant class of shareholders in the case entitled Kirschner v. FitzSimons, No. 12-2652 (S.D.N.Y.) (formerly Official Committee of Unsecured Creditors of Tribune Co. v. FitzSimons, Adv. Pro. No. 10-54010 (Bankr. D. Del.)) (the “FitzSimons action”), as a result of ownership by certain series of the Rydex Series Funds of shares in the Tribune Company (“Tribune”) in 2007, when Tribune effected a leveraged buyout transaction (“LBO”) by which Tribune converted to a privately-held company. In his complaint, the plaintiff has alleged that, in connection with the LBO, Tribune insiders and shareholders were overpaid for their Tribune stock using financing that the insiders knew would, and ultimately did, leave Tribune insolvent. The plaintiff has asserted claims against certain insiders, major shareholders, professional advisers, and others involved in the LBO. The plaintiff is also attempting to obtain from former Tribune shareholders, including the Rydex Series Funds, the proceeds they received in connection with the LBO.
In June 2011, a group of Tribune creditors filed multiple actions against former Tribune shareholders involving state law constructive fraudulent conveyance claims arising out of the 2007 LBO (the “SLCFC actions”). Rydex Series Funds has been named as a defendant in one or more of these suits. In those actions, the creditors seek to recover from Tribune’s former shareholders the proceeds received in connection with the 2007 LBO.
The FitzSimons action and the SLCFC actions have been consolidated with the majority of the other Tribune LBO-related lawsuits in a multidistrict litigation proceeding captioned In re Tribune Company Fraudulent Conveyance Litig., No. 11-md-2296 (S.D.N.Y.) (the “MDL Proceeding”).
On September 23, 2013, the District Court granted the defendants’ omnibus motion to dismiss the SLCFC actions, on the basis that the creditors lacked standing. On September 30, 2013, the creditors filed a notice of appeal of the September 23 order. On October 28, 2013, the defendants filed a joint notice of cross-appeal of that same order.
On March 29, 2016, the U.S. Court of Appeals for the Second Circuit issued its opinion on the appeal of the SLCFC actions. The appeals court affirmed the district court’s dismissal of those lawsuits, but on different grounds than the district court. The appeals court held that while the plaintiffs have standing under the U.S. Bankruptcy Code, their claims were preempted by Section 546(e) of the Bankruptcy Code—the statutory safe harbor for settlement payments.
On April 12, 2016, the Plaintiffs in the SLCFC actions filed a petition seeking rehearing en banc before the appeals court. On July 22, 2016, the appeals court denied the petition. On September 9, 2016, the plaintiffs filed a petition for writ of certiorari in the U.S. Supreme Court challenging the Second Circuit’s decision that the safe harbor of Section 546(e) applied to their claims. The shareholder defendants, including the Funds, filed a joint brief in opposition to the petition for certiorari on October 24, 2016. On April 3, 2018, Justice Kennedy and Justice Thomas issued a “Statement” related to the petition for certiorari suggesting that the Second Circuit and/or District Court may want to take steps to reexamine the application of the Section 546(e) safe harbor to the previously dismissed state law constructive fraudulent transfer claims based on the Supreme Court’s decision in Merit Management Group LP v. FTI Consulting, Inc. On April 10, 2018, Plaintiffs filed in the Second Circuit a motion for that court to recall its mandate, vacate its prior decision, and remand to the district court for further proceedings consistent with Merit Management. On April 20, 2018, the shareholder defendants filed an opposition to Plaintiffs’ motion to recall the mandate. On May 15, 2018, the Second Circuit issued an order recalling the mandate “in anticipation of further panel review.” On December 19, 2019, the Second Circuit issued an amended opinion that again affirmed the district court’s ruling on the basis that plaintiffs’ claims were preempted by Section 546(e) of the Bankruptcy Code. Plaintiffs filed a motion for rehearing and rehearing en banc on January 2, 2020. The Second Circuit denied the petition on February 6, 2020. On July 6, 2020, plaintiffs filed a new petition for a writ of certiorari in the U.S. Supreme Court. In that petition, plaintiffs stated that “[t]o make it more likely that there will be a quorum for this petition,” they have “abandon[ed] the case and let the judgment below stand” with respect to certain defendants. That list did not include the Rydex Series Funds. Defendants filed an opposition to the certiorari petition on August 26, 2020, and plaintiffs filed a reply in support of the petition for certiorari on September 8, 2020. On March 12, 2021, the Solicitor General filed an amicus brief recommending that certiorari be denied. Plaintiffs filed a supplemental brief in response to the Solicitor General’s amicus brief on March 31, 2021, and Defendants filed a supplemental brief on April 1, 2021.
On May 23, 2014, the defendants filed motions to dismiss the FitzSimons action, including a global motion to dismiss Count I, which is the claim brought against former Tribune shareholders for intentional fraudulent conveyance under U.S. federal law. On January 6, 2017, the United States District Court for the Southern District of New York granted the shareholder defendants’ motion to dismiss the intentional fraudulent
70 | THE RYDEX FUNDS ANNUAL REPORT | |
NOTES TO FINANCIAL STATEMENTS (concluded) |
conveyance claim in the FitzSimons action. In dismissing the intentional fraudulent conveyance claim, the Court denied the plaintiff’s request to amend the complaint. The plaintiff requested that the Court direct entry of a final judgment in order to make the order immediately appealable. On February 23, 2017, the Court issued an order stating that it intended to permit an interlocutory appeal of the dismissal order, but would wait to do so until it has resolved outstanding motions to dismiss filed by other defendants.
On July 18, 2017, the plaintiff submitted a letter to the District Court seeking leave to amend its complaint to add a constructive fraudulent transfer claim. The shareholder defendants opposed that request. On August 24, 2017, the Court denied the plaintiff’s request without prejudice to renewal of the request in the event of an intervening change in the law. On March 8, 2018, the plaintiff renewed his request for leave to file a motion to amend the complaint to assert a constructive fraudulent transfer claim based on the Supreme Court’s ruling in Merit Management Group LP v. FTI Consulting, Inc. The shareholder defendants opposed that request. On June 18, 2018 the District Court ordered that the request would be stayed pending further action by the Second Circuit in the SLCFC actions.
On December 18, 2018, plaintiff filed a letter with the District Court requesting that the stay be dissolved in order to permit briefing on the motion to amend the complaint and indicating plaintiff’s intention to file another motion to amend the complaint to reinstate claims for intentional fraudulent transfer. The shareholder defendants opposed that request. On January 14, 2019, the court held a case management conference, during which the court stated that it would not lift the stay prior to further action from the Second Circuit in the SLCFC actions. The court further stated that it would allow the plaintiff to file a motion to amend to try to reinstate its intentional fraudulent transfer claim. On January 23, 2019, the court ordered the parties still facing pending claims to participate in a mediation, to commence on January 28, 2019. The mediation did not result in a settlement of the claims against the shareholder defendants.
On April 4, 2019, plaintiff filed a motion to amend the Fifth Amended Complaint to assert a federal constructive fraudulent transfer claim against certain shareholder defendants. On April 10, 2019, the shareholder defendants filed a brief in opposition to plaintiff’s motion to amend. On April 12, 2019, the plaintiff filed a reply brief. On April 23, 2019, the court denied the plaintiff’s motion to amend. On June 13, 2019, the court entered judgment pursuant to Rule 54(b). On July 12, 2019, the Plaintiff filed a notice of appeal with respect to the dismissal of his claims and the District Court’s denial of his motion for leave to amend. Plaintiff filed an appellate brief on January 7, 2020. The shareholder defendants’ brief was filed on April 27, 2020. Plaintiff filed a reply brief on May 18, 2020. The Court held oral argument on August 24, 2020.
None of these lawsuits alleges any wrongdoing on the part of Rydex Series Funds. The following series of Rydex Series Funds held shares of Tribune and tendered these shares as part of Tribune’s LBO: Nova Fund, S&P 500® Pure Value Fund, Multi-Cap Core Equity Fund, S&P 500® Fund, Multi-Hedge Strategies Fund and Hedged Equity Fund (the “Funds”). The value of the proceeds received by the foregoing Funds was $28,220, $109,242, $9,860, $3,400, $1,181,160, and $10,880, respectively. At this stage of the proceedings, Rydex Series Funds is not able to make a reliable predication as to the outcome of these lawsuits or the effect, if any, on a Fund’s net asset value.
Note 12 – COVID-19
The global ongoing crisis caused by the outbreak of COVID-19 and the current recovery underway is causing disruption to consumer demand and economic output and supply chains. There are still travel restrictions and quarantines, and adverse impacts on local and global economies. Investors should be aware that in light of the current uncertainty, volatility and distress in economies, financial markets, and labor and public health conditions around the world, the Funds’ investments and a shareholder’s investment in a Fund are subject to sudden and substantial losses, increased volatility and other adverse events. Firms through which investors invest with the Funds, the Funds, their service providers, the markets in which they invest and market intermediaries are also impacted by quarantines and similar measures intended to respond to and contain the ongoing pandemic, which can obstruct their functioning and subject them to heightened operational and other risks.
Note 13 – Subsequent Events
The Funds evaluated subsequent events through the date the financial statements were available for issue and determined there were no material events that would require adjustment to or disclosure in the Funds’ financial statements.
| | THE RYDEX FUNDS ANNUAL REPORT | 71 |
REPORT OF INDEPENDENT REGISTERED PUBLIC ACCOUNTING FIRM |
To the Shareholders of Guggenheim Long Short Equity Fund, Rydex Emerging Markets 2x Strategy Fund, Rydex Inverse Emerging Markets 2x Strategy Fund and Rydex Emerging Markets Bond Strategy Fund and the Board of Trustees of Rydex Series Funds
Opinion on the Financial Statements
We have audited the accompanying statements of assets and liabilities of Guggenheim Long Short Equity Fund, Rydex Emerging Markets 2x Strategy Fund, Rydex Inverse Emerging Markets 2x Strategy Fund and Rydex Emerging Markets Bond Strategy Fund (collectively referred to as the “Funds”), (four of the funds constituting Rydex Series Funds (the “Trust”)), including the schedules of investments, as of March 31, 2021, and the related statements of operations for the year then ended, the statements of changes in net assets for each of the two years in the period then ended, the financial highlights for each of the five years in the period then ended and the related notes (collectively referred to as the “financial statements”). In our opinion, the financial statements present fairly, in all material respects, the financial position of each of the Funds (four of the funds constituting Rydex Series Funds) at March 31, 2021, the results of their operations for the year then ended, the changes in their net assets for each of the two years in the period then ended and their financial highlights for each of the five years in the period then ended, in conformity with U.S. generally accepted accounting principles.
Basis for Opinion
These financial statements are the responsibility of the Trust’s management. Our responsibility is to express an opinion on each of the Funds’ financial statements based on our audits. We are a public accounting firm registered with the Public Company Accounting Oversight Board (United States) (“PCAOB”) and are required to be independent with respect to the Trust in accordance with the U.S. federal securities laws and the applicable rules and regulations of the Securities and Exchange Commission and the PCAOB.
We conducted our audits in accordance with the standards of the PCAOB. Those standards require that we plan and perform the audit to obtain reasonable assurance about whether the financial statements are free of material misstatement, whether due to error or fraud. The Trust is not required to have, nor were we engaged to perform, an audit of the Trust’s internal control over financial reporting. As part of our audits, we are required to obtain an understanding of internal control over financial reporting but not for the purpose of expressing an opinion on the effectiveness of the Trust’s internal control over financial reporting. Accordingly, we express no such opinion.
Our audits included performing procedures to assess the risks of material misstatement of the financial statements, whether due to error or fraud, and performing procedures that respond to those risks. Such procedures included examining, on a test basis, evidence regarding the amounts and disclosures in the financial statements. Our procedures included confirmation of securities owned as of March 31, 2021, by correspondence with the custodian and brokers or by other appropriate auditing procedures where replies from brokers were not received. Our audits also included evaluating the accounting principles used and significant estimates made by management, as well as evaluating the overall presentation of the financial statements. We believe that our audits provide a reasonable basis for our opinion.

We have served as the auditor of one or more Guggenheim investment companies since 1979.
Tysons, Virginia
May 26, 2021
72 | THE RYDEX FUNDS ANNUAL REPORT | |
OTHER INFORMATION (Unaudited) |
Federal Income Tax Information
This information is being provided as required by the Internal Revenue Code. Amounts shown may differ from those elsewhere in the report because of differences in tax and financial reporting practice.
In January 2022, shareholders will be advised on IRS Form 1099 DIV or substitute 1099 DIV as to the federal tax status of the distributions received by shareholders in the calendar year 2021.
The Funds’ investment income (dividend income plus short-term capital gains, if any) qualifies as follows:
Of the taxable ordinary income distributions paid during the fiscal year ending March 31, 2021, the following fund had the corresponding percentages qualify for the reduced tax rate pursuant to the Jobs and Growth Tax Relief and Reconciliation Act of 2003 or for the dividends received deduction for corporations. See the qualified dividend income and dividend received deduction columns, respectively, in the table below.
Fund | | Qualified
Dividend
Income | | | Dividend
Received
Deduction | |
Long Short Equity Fund | | | 100.00 | % | | | 100.00 | % |
Delivery of Shareholder Reports
Paper copies of the Funds’ annual and semi-annual shareholder reports are not sent by mail, unless you specifically request paper copies of the reports from a fund or from your financial intermediary. Instead, the reports are made available on a website, and you are notified by mail each time a report is posted and provided with a website link to access the report.
You may elect to receive all future shareholder reports in paper free of charge. If you hold shares of a fund directly, you can inform the Fund that you wish to receive paper copies of reports by calling 800.820.0888. If you hold shares of a fund through a financial intermediary, please contact the financial intermediary to make this election. Your election to receive reports in paper may apply to all Guggenheim Funds in which you are invested and may apply to all Guggenheim funds held with your financial intermediary.
Proxy Voting Information
A description of the policies and procedures that the Trust uses to determine how to vote proxies relating to securities held in the Funds’ portfolios is available, without charge and upon request, by calling 800.820.0888. This information is also available from the EDGAR database on the SEC’s website at https://www.sec.gov.
Information regarding how the Funds’ voted proxies relating to portfolio securities during the most recent 12-month period ended June 30 is available without charge, upon request, by calling 800.820.0888. This information is also available from the EDGAR database on the SEC’s website at https://www.sec.gov.
Sector Classification
Information in the Schedule of Investments is categorized by sectors using sector-level Classifications defined by the Bloomberg Industry Classification System, a widely recognized industry classification system provider. Each Fund’s registration statement has investment policies relating to concentration in specific sectors/industries. For purposes of these investment policies, the Funds usually classify sectors/industries based on industry-level Classifications used by widely recognized industry classification system providers such as Bloomberg Industry Classification System, Global Industry Classification Standards and Barclays Global Classification Scheme.
Quarterly Portfolio Schedules Information
The Trust files its complete schedule of portfolio holdings with the SEC for the first and third quarters of each fiscal year as an exhibit to its reports on Form N-PORT, and for reporting periods ended prior to March 31, 2019, filed such information on Form N-Q. The Funds’ Forms N-PORT and N-Q are available on the SEC’s website at https://www.sec.gov. Copies of the portfolio holdings are also available to shareholders, without charge and upon request, by calling 800.820.0888.
| | THE RYDEX FUNDS ANNUAL REPORT | 73 |
INFORMATION ON BOARD OF TRUSTEES AND OFFICERS (Unaudited) |
A Board of Trustees oversees the Trust, as well as other trusts of GI, in which its members have no stated term of service, and continue to serve after election until resignation. The Statement of Additional Information includes further information about Fund Trustees and Officers, and can be obtained without charge by visiting guggenheiminvestments.com or by calling 800.820.0888.
Name, Address*
and Year of Birth | Position(s)
Held with
Trust | Term of Office
and Length of
Time Served** | Principal Occupation(s)
During Past Five Years | Number of
Portfolios
in Fund
Complex
Overseen | Other
Directorships Held
by Trustees*** |
INDEPENDENT TRUSTEES | | | |
Randall C. Barnes (1951) | Trustee and Chair of the Valuation Oversight Committee | Since 2019 (Trustee) Since 2020 (Chair of the Valuation Oversight Committee) | Current: Private Investor (2001-present). Former: Senior Vice President and Treasurer, PepsiCo, Inc. (1993-1997); President, Pizza Hut International (1991-1993); Senior Vice President, Strategic Planning and New Business Development, PepsiCo, Inc. (1987-1990). | 157 | Current: Purpose Investments Funds (2013-present). Former: Managed Duration Investment Grade Municipal Fund (2006-2016). |
Angela Brock-Kyle (1959) | Trustee | Since 2016 | Current: Founder and Chief Executive Officer, B.O.A.R.D.S. (2013-present). Former: Senior Leader, TIAA (1987-2012). | 156 | Current: Bowhead Insurance GP, LLC (2020-present); Hunt Companies, Inc. (2019-present). Former: Infinity Property & Casualty Corp. (2014-2018). |
Thomas F. Lydon, Jr. (1960) | Trustee and Chair of the Contracts Review Committee | Since 2005 (Trustee) Since 2020 (Chair of the Contracts Review Committee) | Current: President, Global Trends Investments (1996-present); Co-Chief Executive Officer, ETF Flows, LLC (2019-present); Chief Executive Officer, Lydon Media (2016-present). | 156 | Current: US Global Investors (GROW) (1995-present). Former: Harvest Volatility Edge Trust (3) (2017-2019). |
Ronald A. Nyberg (1953) | Trustee and Chair of the Nominating and Governance Committee | Since 2019 | Current: Of Counsel, Momkus LLP (2016-present). Former: Partner, Nyberg & Cassioppi, LLC (2000-2016); Executive Vice President, General Counsel, and Corporate Secretary, Van Kampen Investments (1982-1999). | 157 | Current: PPM Funds (2) (2018-present); Edward-Elmhurst Healthcare System (2012-present). Former: Western Asset Inflation-Linked Opportunities & Income Fund (2004-2020); Western Asset Inflation-Linked Income Fund (2003-2020); Managed Duration Investment Grade Municipal Fund (2003-2016). |
74 | THE RYDEX FUNDS ANNUAL REPORT | |
INFORMATION ON BOARD OF TRUSTEES AND OFFICERS (Unaudited)(continued) |
Name, Address*
and Year of Birth | Position(s)
Held with
Trust | Term of Office
and Length of
Time Served** | Principal Occupation(s)
During Past Five Years | Number of
Portfolios
in Fund
Complex
Overseen | Other
Directorships Held
by Trustees*** |
INDEPENDENT TRUSTEES - concluded | | | |
Sandra G. Sponem (1958) | Trustee and Chair of the Audit Committee | Since 2016 (Trustee) Since 2019 (Chair of the Audit Committee) | Current: Retired. Former: Senior Vice President and Chief Financial Officer, M.A. Mortenson-Companies, Inc. (2007-2017). | 156 | Current: SPDR Series Trust (81) (2018-present); SPDR Index Shares Funds (30) (2018-present); SSGA Active Trust (14) (2018-present). Former: SSGA Master Trust (1) (2018-2020). |
Ronald E. Toupin, Jr. (1958) | Trustee, Chair of the Board and Chair of the Executive Committee | Since 2019 | Current: Portfolio Consultant (2010-present); Member, Governing Council, Independent Directors Council (2013-present); Governor, Board of Governors, Investment Company Institute (2018-present). Former: Member, Executive Committee, Independent Directors Council (2016-2018); Vice President, Manager and Portfolio Manager, Nuveen Asset Management (1998-1999); Vice President, Nuveen Investment Advisory Corp. (1992-1999); Vice President and Manager, Nuveen Unit Investment Trusts (1991-1999); and Assistant Vice President and Portfolio Manager, Nuveen Unit Investment Trusts (1988-1999), each of John Nuveen & Co., Inc. (1982-1999). | 156 | Former: Western Asset Inflation-Linked Opportunities & Income Fund (2004-2020); Western Asset Inflation-Linked Income Fund (2003-2020); Managed Duration Investment Grade Municipal Fund (2003-2016). |
| | THE RYDEX FUNDS ANNUAL REPORT | 75 |
INFORMATION ON BOARD OF TRUSTEES AND OFFICERS (Unaudited)(continued) |
Name, Address*
and Year of Birth | Position(s)
Held with
Trust | Term of Office
and Length of
Time Served** | Principal Occupation(s)
During Past Five Years | Number of
Portfolios
in Fund
Complex
Overseen | Other
Directorships Held
by Trustees*** |
INTERESTED TRUSTEE | | | | |
Amy J. Lee**** (1961) | Trustee, Vice President and Chief Legal Officer | Since 2019 | Current: Interested Trustee, certain other funds in the Fund Complex (2018-present); Chief Legal Officer, certain other funds in the Fund Complex (2014-present); Vice President, certain other funds in the Fund Complex (2007-present); Senior Managing Director, Guggenheim Investments (2012-present). Former: President and Chief Executive Officer, certain other funds in the Fund Complex (2017-2019); Vice President, Associate General Counsel and Assistant Secretary, Security Benefit Life Insurance Company and Security Benefit Corporation (2004-2012). | 156 | None. |
* | The business address of each Trustee is c/o Guggenheim Investments, 227 West Monroe Street, Chicago, Illinois 60606. |
** | Each Trustee serves an indefinite term, until his or her successor is elected and qualified. |
*** | Each Trustee also serves on the Boards of Trustees of Guggenheim Funds Trust, Guggenheim Variable Funds Trust, Guggenheim Strategy Funds Trust, Fiduciary/Claymore Energy Infrastructure Fund, Guggenheim Taxable Municipal Bond & Investment Grade Debt Trust, Guggenheim Strategic Opportunities Fund, Guggenheim Enhanced Equity Income Fund, Guggenheim Energy & Income Fund, Guggenheim Credit Allocation Fund, Rydex Series Funds, Rydex Dynamic Funds, Rydex Variable Trust and Transparent Value Trust. Messrs. Barnes and Nyberg also serve on the Board of Trustees of Advent Convertible & Income Fund. |
**** | This Trustee is deemed to be an “interested person” of the Funds under the 1940 Act by reason of her position with the Funds’ Investment Manager and/or the parent of the Investment Manager. |
76 | THE RYDEX FUNDS ANNUAL REPORT | |
INFORMATION ON BOARD OF TRUSTEES AND OFFICERS (Unaudited)(continued) |
Name, Address*
and Year of Birth | Position(s)
Held with
Trust | Term of Office
and Length of
Time Served** | Principal Occupation(s)
During Past Five Years |
OFFICERS | | | |
Brian E. Binder (1972) | President and Chief Executive Officer | Since 2019 | Current: President and Chief Executive Officer, certain other funds in the Fund Complex (2018-present); President, Chief Executive Officer and Chairman of the Board of Managers, Guggenheim Funds Investment Advisors, LLC (2018-present); President and Chief Executive Officer, Security Investors, LLC (2018-present); Board Member of Guggenheim Partners Fund Management (Europe) Limited (2018-present); Senior Managing Director and Chief Administrative Officer, Guggenheim Investments (2018-present). Former: Managing Director and President, Deutsche Funds, and Head of US Product, Trading and Fund Administration, Deutsche Asset Management (2013-2018); Managing Director, Head of Business Management and Consulting, Invesco Ltd. (2010-2012). |
James M. Howley (1972) | Assistant Treasurer | Since 2016 | Current: Managing Director, Guggenheim Investments (2004-present); Assistant Treasurer, certain other funds in the Fund Complex (2006-present). Former: Manager, Mutual Fund Administration of Van Kampen Investments, Inc. (1996-2004). |
Mark E. Mathiasen (1978) | Secretary | Since 2017 | Current: Secretary, certain other funds in the Fund Complex (2007-present); Managing Director, Guggenheim Investments (2007-present). |
Glenn McWhinnie (1969) | Assistant Treasurer | Since 2016 | Current: Vice President, Guggenheim Investments (2009-present); Assistant Treasurer, certain other funds in the Fund Complex (2016-present). |
Michael P. Megaris (1984) | Assistant Secretary | Since 2018 | Current: Assistant Secretary, certain other funds in the Fund Complex (2014-present); Director, Guggenheim Investments (2012-present). |
Elisabeth Miller (1968) | Chief Compliance Officer | Since 2012 | Current: Chief Compliance Officer, certain other funds in the Fund Complex (2012-present); Senior Managing Director, Guggenheim Investments (2012-present). Vice President, Guggenheim Funds Distributors, LLC (2014-present). Former: Chief Compliance Officer, Security Investors, LLC and Guggenheim Funds Investment Advisors, LLC (2012-2018); Chief Compliance Officer, Guggenheim Distributors, LLC (2009-2014); Senior Manager, Security Investors, LLC (2004-2014); Senior Manager, Guggenheim Distributors, LLC (2004-2014). |
Margaux Misantone (1978) | AML Officer | Since 2017 | Current: Chief Compliance Officer, Security Investors, LLC and Guggenheim Funds Investment Advisors, LLC (2018-present); AML Officer, Security Investors, LLC and certain other funds in the Fund Complex (2017-present); Managing Director, Guggenheim Investments (2015-present). Former: Assistant Chief Compliance Officer, Security Investors, LLC and Guggenheim Funds Investments Advisors, LLC (2015-2018). |
| | THE RYDEX FUNDS ANNUAL REPORT | 77 |
INFORMATION ON BOARD OF TRUSTEES AND OFFICERS (Unaudited)(concluded) |
Name, Address*
and Year of Birth | Position(s)
Held with
Trust | Term of Office
and Length of
Time Served** | Principal Occupation(s)
During Past Five Years |
OFFICERS - concluded | |
Kimberly J. Scott (1974) | Assistant Treasurer | Since 2016 | Current: Director, Guggenheim Investments (2012-present); Assistant Treasurer, certain other funds in the Fund Complex (2012-present). Former: Financial Reporting Manager, Invesco, Ltd. (2010-2011); Vice President/Assistant Treasurer, Mutual Fund Administration for Van Kampen Investments, Inc./Morgan Stanley Investment Management (2009-2010); Manager of Mutual Fund Administration, Van Kampen Investments, Inc./Morgan Stanley Investment Management (2005-2009). |
Bryan Stone (1979) | Vice President | Since 2019 | Current: Vice President, certain other funds in the Fund Complex (2014-present); Managing Director, Guggenheim Investments (2013-present). Former: Senior Vice President, Neuberger Berman Group LLC (2009-2013); Vice President, Morgan Stanley (2002-2009). |
John L. Sullivan (1955) | Chief Financial Officer, Chief Accounting Officer and Treasurer | Since 2016 | Current: Chief Financial Officer, Chief Accounting Officer and Treasurer, certain other funds in the Fund Complex (2010-present); Senior Managing Director, Guggenheim Investments (2010-present). Former: Managing Director and Chief Compliance Officer, each of the funds in the Van Kampen Investments fund complex (2004-2010); Managing Director and Head of Fund Accounting and Administration, Morgan Stanley Investment Management (2002-2004); Chief Financial Officer and Treasurer, Van Kampen Funds (1996-2004). |
Jon Szafran (1989) | Assistant Treasurer | Since 2017 | Current: Vice President, Guggenheim Investments (2017-present); Assistant Treasurer, certain other funds in the Fund Complex (2017-present). Former: Assistant Treasurer of Henderson Global Funds and Manager of US Fund Administration, Henderson Global Investors (North America) Inc. (“HGINA”), (2017); Senior Analyst of US Fund Administration, HGINA (2014–2017); Senior Associate of Fund Administration, Cortland Capital Market Services, LLC (2013-2014); Experienced Associate, PricewaterhouseCoopers LLP (2012-2013). |
* | The business address of each officer is c/o Guggenheim Investments, 227 West Monroe Street, Chicago, Illinois 60606. |
** | Each officer serves an indefinite term, until his or her successor is duly elected and qualified. |
78 | THE RYDEX FUNDS ANNUAL REPORT | |
GUGGENHEIM INVESTMENTS PRIVACY NOTICE (Unaudited) |
Who We Are
This Privacy Notice describes the data protection practices of Guggenheim Investments. Guggenheim Investments as used herein refers to the affiliated investment management businesses of Guggenheim Partners, LLC: Guggenheim Funds Investment Advisors, LLC, Guggenheim Partners Investment Management, LLC, Guggenheim Funds Distributors, LLC, Security Investors, LLC, Guggenheim Investment Advisors (Europe) Limited, Guggenheim Real Estate, LLC, GS Gamma Advisors, LLC, Guggenheim Partners India Management, LLC, Guggenheim Partners Europe Limited, as well as the funds in the Guggenheim Funds complex (the “Funds”) (“Guggenheim Investments,” “we,” “us,” or “our”).
Guggenheim Partners Investment Management Holdings, LLC, located at 330 Madison Avenue, New York, New York 10017 is the data controller for your information. The affiliates who are also controllers of certain of your information are: Guggenheim Investment Advisors (Europe) Limited, Guggenheim Partners Europe Limited, Guggenheim Partners, LLC, Guggenheim Funds Investment Advisors, LLC, Guggenheim Partners Investment Management, LLC, Guggenheim Funds Distributors, LLC and Security Investors, LLC, as well as the Funds.
Our Commitment to You
Guggenheim Investments considers your privacy our utmost concern. When you become our client or investor, you entrust us with not only your hard-earned money but also with your personal and financial information. Because we have access to your private information, we hold ourselves to the highest standards in its safekeeping and use. We strictly limit how we share your information with others, whether you are a current or former Guggenheim Investments client or investor.
The Information We Collect About You
We collect certain nonpublic personal information about you from information you provide on applications, other forms, our website, and/or from third parties including investment advisors. This information includes Social Security or other tax identification number, assets, income, tax information, retirement and estate plan information, transaction history, account balance, payment history, bank account information, marital status, family relationships, information that we collect on our website through the use of “cookies,” and other personal information that you or others provide to us. We may also collect such information through your inquiries by mail, e-mail or telephone. We may also collect customer due diligence information, as required by applicable law and regulation, through third party service providers.
How We Handle Your Personal Information
The legal basis for using your information as set out in this Privacy Notice is as follows: (a) use of your personal data is necessary to perform our obligations under any contract with you (such as a contract for us to provide financial services to you); or (b) where use of your personal data is not necessary for performance of a contract, use of your personal data is necessary for our legitimate interests or the legitimate interests of others (for example, to enforce the legal terms governing our services, operate and market our website and other services we offer, ensure safe environments for our personnel and others, make and receive payments, prevent fraud and to know the customer to whom we are providing the services). Some processing is done to comply with applicable law.
In addition to the specific uses described above, we also use your information in the following manner:
| | ● | We use your information in connection with servicing your accounts. |
| | ● | We use information to respond to your requests or questions. For example, we might use your information to respond to your customer feedback. |
| | ● | We use information to improve our products and services. We may use your information to make our website and products better. We may use your information to customize your experience with us. |
| | ● | We use information for security purposes. We may use your information to protect our company and our customers. |
| | ● | We use information to communicate with you. For example, we will communicate with you about your account or our relationship. We may contact you about your feedback. We might also contact you about this Privacy Notice. We may also enroll you in our email newsletter. |
| | THE RYDEX FUNDS ANNUAL REPORT | 79 |
GUGGENHEIM INVESTMENTS PRIVACY NOTICE (Unaudited)(continued) |
| | ● | We use information as otherwise permitted by law, as we may notify you. |
| | ● | Aggregate/Anonymous Data. We may aggregate and/or anonymize any information collected through the website so that such information can no longer be linked to you or your device (“Aggregate/Anonymous Information”). We may use Aggregate/Anonymous Information for any purpose, including without limitation for research and marketing purposes, and may also share such data with any third parties, including advertisers, promotional partners, and sponsors. |
We do not sell information about current or former clients or their accounts to third parties. Nor do we share this information, except when necessary to complete transactions at your request, to make you aware of investment products and services that we or our affiliates offer, or as permitted or required by law.
We provide information about you to companies and individuals not affiliated with Guggenheim Investments to complete certain transactions or account changes, or to perform services for us related to your account. For example, if you ask to transfer assets from another financial institution to Guggenheim Investments, we must provide certain information about you to that company to complete the transaction. We provide the third party with only the information necessary to carry out its responsibilities and only for that purpose. And we require these third parties to treat your private information with the same high degree of confidentiality that we do. To alert you to other Guggenheim Investments products and services, we share your information within our family of affiliated companies. You may limit our sharing with affiliated companies as set out below. We may also share information with any successor to all or part of our business, or in connection with steps leading up to a merger or acquisition. For example, if part of our business was sold we may give customer information as part of that transaction. We may also share information about you with your consent.
We will release information about you if you direct us to do so, if we are compelled by law to do so, or in other circumstances as permitted by law (for example, to protect your account from fraud).
If you close your account(s) or become an inactive client or investor, we will continue to adhere to the privacy policies and practices described in this notice.
Opt-Out Provisions and Your Data Choices
The law allows you to “opt out” of certain kinds of information sharing with third parties. We do not share personal information about you with any third parties that triggers this opt-out right. This means YOU ARE ALREADY OPTED OUT.
When you are no longer our client or investor, we continue to share your information as described in this notice, and you may contact us at any time to limit our sharing by sending an email to CorporateDataPrivacy@GuggenheimPartners.com.
European Union Data Subjects and certain others: In addition to the choices set forth above, residents of the European Union and certain other jurisdictions have certain rights to (1) request access to or rectification or deletion of information we collect about them, (2) request a restriction on the processing of their information, (3) object to the processing of their information, or (4) request the portability of certain information. To exercise these or other rights, please contact us using the contact information below. We will consider all requests and provide our response within the time period stated by applicable law. Please note, however, that certain information may be exempt from such requests in some circumstances, which may include if we need to keep processing your information for our legitimate interests or to comply with a legal obligation. We may request you provide us with information necessary to confirm your identity before responding to your request.
Residents of France and certain other jurisdictions may also provide us with instructions regarding the manner in which we may continue to store, erase and share your information after your death, and where applicable, the person you have designated to exercise these rights after your death.
How We Protect Privacy Online
We take steps to protect your privacy when you use our web site – www.guggenheiminvestments.com – by using secure forms of online communication, including encryption technology, Secure Socket Layer (SSL) protocol, firewalls and user names and passwords. These safeguards vary based on the sensitivity of the information that we collect and store. However, we cannot and do not guarantee that these measures will prevent every unauthorized attempt to access, use, or disclose your information since despite our efforts, no Internet and/or other
80 | THE RYDEX FUNDS ANNUAL REPORT | |
GUGGENHEIM INVESTMENTS PRIVACY NOTICE (Unaudited)(concluded) |
electronic transmissions can be completely secure. Our web site uses “http cookies”—tiny pieces of information that we ask your browser to store. We use cookies for session management and security features on the Guggenheim Investments web site. We do not use them to pull data from your hard drive, to learn your e-mail address, or to view data in cookies created by other web sites. We will not share the information in our cookies or give others access to it. See the legal information area on our web site for more details about web site security and privacy features.
How We Safeguard Your Personal Information and Data Retention
We restrict access to nonpublic personal information about you to our employees and in some cases to third parties (for example, the service providers described above) as permitted by law. We maintain strict physical, electronic and procedural safeguards that comply with federal standards to guard your nonpublic personal information.
We keep your information for no longer than necessary for the purposes for which it is processed. The length of time for which we retain information depends on the purposes for which we collected and use it and/or as required to comply with applicable laws. Information may persist in copies made for backup and business continuity purposes for additional time.
International Visitors
If you are not a resident of the United States, please be aware that your information may be transferred to, stored and processed in the United States where our servers are located and our databases are operated. The data protection and other laws of the United States and other countries might not be as comprehensive as those in your country.
In such cases, we ensure that a legal basis for such a transfer exists and that adequate protection is provided as required by applicable law, for example, by using standard contractual clauses or by transferring your data to a jurisdiction that has obtained an adequacy finding. Individuals whose data may be transferred on the basis of standard contractual clauses may contact us as described below.
We’ll Keep You Informed
If you have any questions or concerns about how we treat your personal data, we encourage you to consult with us first. You may also contact the relevant supervisory authority.
We reserve the right to modify this policy at any time and will inform you promptly of material changes. You may access our privacy policy from our web site at www.guggenheiminvestments.com. Should you have any questions regarding our privacy policy, contact us by email at CorporateDataPrivacy@GuggenheimPartners.com.
| | THE RYDEX FUNDS ANNUAL REPORT | 81 |
This page intentionally left blank.
This page intentionally left blank.
This page intentionally left blank.
This page intentionally left blank.
Item 2. Code of Ethics.
The registrant’s Board of Trustees has adopted a code of ethics that applies to the registrant’s principal executive officer and principal financial officer. No substantive amendments were approved or waivers were granted to the Code during the period covered by this report. The Code is filed as an exhibit to this Form N-CSR.
Item 3. Audit Committee Financial Expert.
The registrant's Board of Trustees has determined that it has at least one audit committee financial expert serving on its audit committee (the “Audit Committee”), Sandra G. Sponem. Ms. Sponem is “independent,” meaning that she is not an “interested person” of the Registrant (as that term is defined in Section 2(a)(19) of the Investment Company Act of 1940, as amended) and she does not accept any consulting, advisory, or other compensatory fee from the Registrant (except in her capacity as a Board or committee member).
Under applicable securities laws, a person who is determined to be an audit committee financial expert will not be deemed an "expert" for any purpose, including without limitation for the purposes of Section 11 of the Securities Act of 1933, as a result of being designated or identified as an audit committee financial expert. The designation or identification of a person as an audit committee financial expert does not impose on such person any duties, obligations, or liabilities that are greater than the duties, obligations, and liabilities imposed on such person as a member of the Audit Committee and Board of Trustees in the absence of such designation or identification. The designation or identification of a person as an audit committee financial expert does not affect the duties, obligations or liability of any other member of the Audit Committee or Board of Trustees.
Item 4. Principal Accountant Fees and Services.
(a) Audit Fees. The aggregate Audit Fees billed by the registrant’s principal accountant for professional services rendered for the audit of the annual financial statements or services that are normally provided by the accountant in connection with statutory and regulatory filings or engagements for the fiscal years ended March 31, 2021 and March 31, 2020 were $893,061 and $852,722, respectively.
(b) Audit Related Fees. The aggregate Audit-Related Fees billed by the registrant’s principal accountant for assurance and related services that are reasonably related to the performance of the audit of the registrant’s financial statements and are not reported under paragraph (a) of this Item for the fiscal years ended March 31, 2021 and March 31, 2020 were $0 and $0, respectively.
(c) Tax Fees: The aggregate Tax Fees billed by the registrant’s principal accountant for professional services rendered for tax compliance, tax advice, and tax planning, including preparation of tax returns and distribution assistance, for the fiscal years ended March 31, 2021 and March 31, 2020 were $440,430 and $456,085, respectively. These services consisted of (i) preparation of U.S. federal, state and excise tax returns; (ii) U.S. federal and state tax planning, advice and assistance regarding statutory, regulatory or administrative developments, (iii) tax advice regarding tax qualification matters and/or treatment of various financial instruments held or proposed to be acquired and (iv) review of U.S. federal excise distribution calculations.
(d) All Other Fees. The aggregate All Other Fees billed by the registrant’s principal accountant for products and services provided by the principal accountant, other than the services reported in paragraphs (a) through (c) of this Item, for the fiscal years ended March 31, 2021 and March 31, 2020 were $0 and $0, respectively.
(e) Audit Committee Pre-Approval Policies and Procedures.
(1) Audit Committee pre-approval policies and procedures:
To fulfill its responsibilities and duties the Audit Committee (the “Committee”) shall:
| 1. | Pre-Approval Policy (Trusts). Pre-approve any engagement of the independent auditors to provide any services, other than “prohibited non-audit services,” to the Trust, including the fees and other compensation to be paid to the independent auditors (unless an exception is available under Rule 2-01 of Regulation S-X). |
| (a) | The categories of services to be reviewed and considered for pre-approval include those services set forth under Section II.A.1. of the Background and Definitions for Audit Committee Charter (collectively, “Identified Services”). |
| (b) | The Committee has pre-approved Identified Services for which the estimated fees are less than $25,000. |
| (c) | For Identified Services with estimated fees of $25,000 or more, but less than $50,000, the Chair or any member of the Committee designated by the Chair is hereby authorized to pre-approve such Identified Services on behalf of the Committee. |
| (d) | For Identified Services with estimated fees of $50,000 or more, such Identified Services require pre-approval by the Committee. |
| (e) | All requests for Identified Services to be provided by the independent auditor that were pre-approved by the Committee shall be submitted to the Principal/Chief Accounting Officer (“CAO”) of the Trust by the independent auditor using the pre-approval request form. The Trust’s CAO will determine whether such services are included within the list of services that have received the general pre-approval of the Committee. |
| (f) | The independent auditors or the CAO of the Trust (or an officer of the Trust who reports to the CAO) shall report to the Committee at each of its regular scheduled meetings all audit, audit-related and permissible non-audit services initiated since the last such report (unless the services were contained in the initial audit plan, as previously presented to, and approved by, the Committee). The report shall include a general description of the services and projected fees, and the means by which such services were approved by the Committee (including the particular category of Identified Services under which pre-approval was obtained). |
| 2. | Pre-Approval Policy (Adviser or Any Control Affiliate). Pre-approve any engagement of the independent auditors, including the fees and other compensation to be paid to the independent auditors, to provide any non-audit services to the Adviser (or any “control affiliate” of the Adviser providing ongoing services to the Trust), if the engagement relates directly to the operations or financial reporting of the Trust (unless an exception is available under Rule 2-01 of Regulation S-X). |
| (a) | The Chair or any member of the Committee designated by the Chair may grant the pre-approval for non-audit services to the Adviser (or any “control affiliate” of the Adviser providing ongoing services to the Trust) relating directly to the operations or financial reporting of the Trust for which the estimated fees are less than $25,000. All such delegated pre-approvals shall be presented to the Committee no later than the next Committee meeting. |
| (b) | For non-audit services to the Adviser (or any “control affiliate” of the Adviser providing ongoing services to the Trust) relating directly to the operations or financial reporting of the Trust for which the estimated fees are $25,000 or more, such services require pre-approval by the Committee. |
| a. | Pre-Approval Requirements |
| i. | Categories of Services to be Reviewed and Considered for Pre-Approval |
| a. | Annual financial statement audits |
| b. | Seed audits (related to new product filings, as required) |
| c. | SEC and regulatory filings and consents |
| a. | Accounting consultations |
| b. | Fund merger/reorganization support services |
| c. | Other accounting related matters |
| d. | Agreed upon procedures reports |
| f. | Other internal control reports |
| a. | Recurring tax services: |
| i. | Preparation of Federal and state income tax returns, including extensions |
| ii. | Preparation of calculations of taxable income, including fiscal year tax designations |
| iii. | Preparation of annual Federal excise tax returns (if applicable) |
| iv. | Preparation of calendar year excise distribution calculations |
| v. | Calculation of tax equalization on an as-needed basis |
| vi. | Preparation of monthly/quarterly estimates of tax undistributed position for closed-end funds |
| vii. | Preparation of the estimated excise distribution calculations on an as-needed basis |
| viii. | Preparation of calendar year shareholder reporting designations on Form 1099 |
| ix. | Preparation of quarterly Federal, state and local and franchise tax estimated tax payments on an as-needed basis |
| x. | Preparation of state apportionment calculations to properly allocate Fund taxable income among the states for state tax filing purposes |
| xi. | Assistance with management’s identification of passive foreign investment companies (PFICs) for tax purposes |
| b. | Permissible non-recurring tax services upon request: |
| i. | Assistance with determining ownership changes which impact a Fund’s utilization of loss carryforwards |
| ii. | Assistance with corporate actions and tax treatment of complex securities and structured products |
| iii. | Assistance with IRS ruling requests and calculation of deficiency dividends |
| iv. | Conduct training sessions for the Adviser’s internal tax resources |
| v. | Assistance with Federal, state, local and international tax planning and advice regarding the tax consequences of proposed or actual transactions |
| vi. | Tax services related to amendments to Federal, state and local returns and sales and use tax compliance |
| vii. | RIC qualification reviews |
| viii. | Tax distribution analysis and planning |
| ix. | Tax authority examination services |
| x. | Tax appeals support services |
| xi. | Tax accounting methods studies |
| xii. | Fund merger, reorganization and liquidation support services |
| xiii. | Tax compliance, planning and advice services and related projects |
| xiv. | Assistance with out of state residency status |
| xv. | Provision of tax compliance services in India for Funds with direct investments in India |
(f) Not applicable.
(g) Non-Audit Fees. The aggregate non-audit fees billed by the registrant’s accountant for the most recent fiscal year and the preceding fiscal year for services rendered to the registrant, the investment advisor, and any entity controlling, controlled by, or under common control with the advisor that provides ongoing services to the registrant were $440,430 and $456,085, respectively. These aggregate fees were less than the aggregate fees billed for the same periods by the registrant’s principal accountant for audit services rendered to the registrant, the investment advisor, and any entity controlling, controlled by, or under common control with the advisor that provides ongoing services to the registrant.
(h) Auditor Independence. The registrant’s Audit Committee was provided with information relating to the provision of non-audit services by Ernst & Young, LLP to the registrant’s investment adviser (not including any sub adviser whose role is primarily portfolio management and is subcontracted with or overseen by another investment adviser), and any entity controlling, controlled by, or under common control with the investment adviser that provides ongoing services to the registrant that were not pre-approved by the Audit Committee so that a determination could be made whether the provision of such services is compatible with maintaining Ernst & Young, LLP’s independence.
Item 5. Audit Committee of Listed Registrants.
Not applicable.
Item 6. Investments.
The Schedule of Investments is included as part of the report to shareholders filed under Item 1 of this form.
Item 7. Disclosure of Proxy Voting Policies and Procedures for Closed-End Management Investment Companies.
Not applicable.
Item 8. Portfolio Managers of Closed-End Management Investment Companies.
Not applicable.
Item 9. Purchases of Equity Securities by Closed-End Management Investment Company and Affiliated Purchasers.
Not applicable.
Item 10. Submission of Matters to a Vote of Security Holders.
The registrant does not currently have in place procedures by which shareholders may recommend nominees to the registrant’s board.
Item 11. Controls and Procedures.
(a) The registrant’s President (principal executive officer) and Treasurer (principal financial officer) have evaluated the registrant’s disclosure controls and procedures (as defined in Rule 30a-3(c) under the Investment Company Act) as of a date within 90 days of this filing and have concluded that based on such evaluation as required by Rule 30a-3(b) under the Investment Company Act, that the registrant’s disclosure controls and procedures were effective as of that date in ensuring that information required to be disclosed by the registrant in this Form N-CSR was recorded, processed, summarized, and reported within the time periods specified in the Securities and Exchange Commission’s rules and forms.
(b) The registrant’s principal executive officer and principal financial officer are aware of no change in the registrant’s internal control over financial reporting that occurred during the period covered by this report that has materially affected, or is reasonably likely to materially affect, the registrant’s internal control over financial reporting.
Item 12. Disclosure of Securities Lending Activities for Closed-End Management Investment Companies.
Not applicable.
Item 13. Exhibits.
(a)(1) The registrant’s code of ethics pursuant to Item 2 of Form N-CSR is attached.
(a)(2) Separate certifications by the President (principal executive officer) and Treasurer (principal financial officer) of the registrant as required by Rule 30a-2(a) under the Act (17 CFR 270.30a-2(a)) are attached.
(a)(3) Not applicable.
(a)(4) Not applicable.
(b) A certification by the registrant’s President (principal executive officer) and Treasurer (principal financial officer) as required by Rule 30a-2(b) under the Act (17 CFR 270.30a-2(b)) is attached.
SIGNATURES
Pursuant to the requirements of the Securities Exchange Act of 1934 and the Investment Company Act of 1940, the registrant has duly caused this report to be signed on its behalf by the undersigned, thereunto duly authorized.
| (Registrant) | Rydex Series Funds | |
| | | |
| By (Signature and Title)* | /s/ Brian E. Binder | |
| | Brian E. Binder, President and Chief Executive Officer | |
| | | |
| Date | June 7, 2021 | |
Pursuant to the requirements of the Securities Exchange Act of 1934 and the Investment Company Act of 1940, this report has been signed below by the following persons on behalf of the registrant and in the capacities and on the dates indicated.
| By (Signature and Title)* | /s/ Brian E. Binder | |
| | Brian E. Binder, President and Chief Executive Officer | |
| | | |
| Date | June 7, 2021 | |
| | | |
| By (Signature and Title)* | /s/ John L. Sullivan | |
| | John L. Sullivan, Chief Financial Officer, Chief Accounting Officer and Treasurer | |
| | | |
| Date | June 7, 2021 | |
| * | Print the name and title of each signing officer under his or her signature. |


