UNITED STATES
SECURITIES AND EXCHANGE COMMISSION
WASHINGTON, D.C. 20549
FORM N-CSR
CERTIFIED SHAREHOLDER REPORT OF REGISTERED
MANAGEMENT INVESTMENT COMPANIES
Investment Company Act file number: 811-07618
ALLIANCEBERNSTEIN MUNICIPAL INCOME FUND II
|
| (Exact name of registrant as specified in charter) |
| | |
| 1345 Avenue of the Americas, New York, | | New York 10105 |
| (Address of principal executive offices) | | (Zip code) |
Joseph J. Mantineo
AllianceBernstein L.P.
1345 Avenue of the Americas
New York, New York 10105
|
| (Name and address of agent for service) |
Registrant’s telephone number, including area code: (800) 221-5672
Date of fiscal year end: September 30, 2008
Date of reporting period: September 30, 2008
ITEM 1. REPORTS TO STOCKHOLDERS.
ANNUAL REPORT
AllianceBernstein
Municipal Income Fund II
Arizona Portfolio
Florida Portfolio
Massachusetts Portfolio
Michigan Portfolio
Minnesota Portfolio
New Jersey Portfolio
Ohio Portfolio
Pennsylvania Portfolio
Virginia Portfolio

Annual Report
Investment Products Offered
| | • | | Are Not Bank Guaranteed |
The investment return and principal value of an investment in the Fund will fluctuate as the prices of the individual securities in which it invests fluctuate, so that your shares, when redeemed, may be worth more or less than their original cost. You should consider the investment objectives, risks, charges and expenses of the Fund carefully before investing. For a free copy of the Fund’s prospectus, which contains this and other information, visit our web site at www.alliancebernstein.com or call your financial advisor or AllianceBernstein® at (800) 227-4618. Please read the prospectus carefully before you invest.
You may obtain performance information current to the most recent month-end by visiting www.alliancebernstein.com.
This shareholder report must be preceded or accompanied by the Fund’s prospectus for individuals who are not current shareholders of the Fund.
You may obtain a description of the Fund’s proxy voting policies and procedures, and information regarding how the Fund voted proxies relating to portfolio securities during the most recent 12-month period ended June 30, without charge. Simply visit AllianceBernstein’s web site at www.alliancebernstein.com, or go to the Securities and Exchange Commission’s (the “Commission”) web site at www.sec.gov, or call AllianceBernstein at (800) 227-4618.
The Fund files its complete schedule of portfolio holdings with the Commission for the first and third quarters of each fiscal year on Form N-Q. The Fund’s Forms N-Q are available on the Commission’s web site at www.sec.gov. The Fund’s Forms N-Q may also be reviewed and copied at the Commission’s Public Reference Room in Washington, DC; information on the operation of the Public Reference Room may be obtained by calling (800) SEC-0330. AllianceBernstein publishes full portfolio holdings for the Fund monthly at www.alliancebernstein.com.
AllianceBernstein Investments, Inc. is an affiliate of AllianceBernstein L.P., the manager of the AllianceBernstein funds, and is a member of FINRA.
AllianceBernstein® and the AB Logo are registered trademarks and service marks used by permission of the owner, AllianceBernstein L.P.
November 18, 2008
Annual Report
This report provides management’s discussion of fund performance for the portfolios of AllianceBernstein Municipal Income Fund II (the “Portfolios”) for the annual reporting period ended September 30, 2008.
Investment Objectives and Policies
The nine Portfolios of this open-end fund, by investing principally in high-yielding, predominantly investment-grade municipal securities, seek to provide their shareholders with the highest level of current income exempt from Federal taxation and state taxation of the respective state that is available without assuming what the Adviser considers to be undue risk. Each of the Portfolios pursues its objective by investing at least 80% of its net assets in municipal securities issued by the named state or municipal securities with interest that is otherwise exempt from the named state’s income tax. The Pennsylvania Portfolio and the Virginia Portfolio are non-diversified, meaning they can invest more of their assets in a fewer number of issuers.
Investment Results
The tables on pages 6-14 show performance for each Portfolio compared with the benchmark, the Lehman Brothers (LB) Municipal Index, for the six- and 12-month periods ended September 30, 2008. For the 12-month period ended September 30, 2008, all of the Portfolios’ Class A shares without sales charges underperformed the benchmark, the LB Municipal Index, which represents the U.S. municipal
market and returned -1.87%, except for the Massachusetts Portfolio and the Minnesota Portfolio, which outperformed. (All of the Portfolios and the benchmark posted negative returns.) For the six-month period ended September 30, 2008, all of the Portfolios’ Class A shares without sales charges underperformed the benchmark, which returned -2.60%, except for the Massachusetts Portfolio, the Minnesota Portfolio and the New Jersey Portfolio, which outperformed.
Though the Portfolios’ Municipal Bond Investment Team (the “Team”) primarily bought higher credit quality bonds, the Portfolios’ weights in lower-credit quality bonds, across various sectors, compared with the benchmark’s detracted from relative performance as credit spreads widened. The Team focused new purchases on high credit quality bonds and generally avoided the longest maturity bonds. This was beneficial to the Portfolios’ performance during the six- and 12-month periods because higher-credit quality bonds outperformed lower-credit quality bonds and shorter-maturity bonds outperformed longer-maturity bonds. Overall, the Portfolios benefited from relatively less interest-rate exposure compared with the benchmark. A more detailed description of the contribution to each Portfolio’s relative performance due to security and sector selection versus the benchmark for the annual reporting period ended September 30, 2008 follows.
| | |
| ALLIANCEBERNSTEIN MUNICIPAL INCOME FUND II • | | 1 |
Arizona Portfolio – The Arizona Portfolio’s underperformance compared with the benchmark was partially the result of security selection in the special tax, leasing and housing sectors. The Portfolio’s relative underweight in the general obligation sector also detracted from the Portfolio’s performance. The Portfolio’s relative underweight in the industrial revenue bond sector was beneficial to performance.
Florida Portfolio – The Florida Portfolio’s underperformance compared with the benchmark was partially the result of security selection in the general obligation, special tax and hospital sectors. The Portfolio’s relative underweight in the industrial revenue bond sector was beneficial to performance.
Massachusetts Portfolio – The Massachusetts Portfolio’s relative outperformance compared with the benchmark was largely the result of its low level of interest-rate exposure and partially the result of the Portfolio’s relative underweight in the industrial revenue bond sector and security selection within the housing sector. The Portfolio’s relative underweight in the general obligation sector, in addition to security selection in the transportation, special tax and education sectors, detracted from performance.
Michigan Portfolio – The Michigan Portfolio’s underperformance compared with the benchmark was partially the result of security selection in the pre-refunded, housing, hospital and education sectors. The Portfolio’s relative overweight in the housing sector
and underweight in the general obligation sector also detracted from performance.
Minnesota Portfolio – The Minnesota Portfolio’s relative outperformance compared with the benchmark was partially the result of the Portfolio’s relative underweight in the industrial revenue bond sector. Security selection in the housing, education, power and hospital sectors detracted from performance.
New Jersey Portfolio – The New Jersey Portfolio’s underperformance compared with the benchmark was partially the result of security selection in the education, transportation and special tax sectors. The Portfolio’s relative underweight in the general obligation sector also detracted from performance. Security selection in the industrial revenue bond sector was beneficial to performance.
Ohio Portfolio – The Ohio Portfolio’s underperformance compared with the benchmark was partially the result of security selection in the housing, special tax and education sectors. The Portfolio’s relative underweight in the general obligation sector also detracted from performance.
Pennsylvania Portfolio – The Pennsylvania Portfolio’s underperformance compared with the benchmark was partially the result of security selection in the water, transportation, education and hospital sectors. The Portfolio’s relative underweight in the general obligation sector also detracted from performance.
| | |
| 2 | | • ALLIANCEBERNSTEIN MUNICIPAL INCOME FUND II |
Virginia Portfolio – The Virginia Portfolio’s underperformance compared with the benchmark was partially the result of security selection in the housing, transportation, water and leasing sectors. The Portfolio’s relative underweight in the general obligation sector and overweight in the housing sector also detracted from performance.
Market Review and Investment Strategy
The crisis in the financial markets continued to intensify toward the end of the annual reporting period ended September 30, 2008, and created severe dislocations in the municipal market. As investors grew increasingly more risk averse, demand for lower-rated and longer-maturity bonds diminished. As a result, municipal credit spreads—the extra yield investors demand to move down in credit quality—widened sharply, and the slope of the municipal yield curve steepened dramatically over both the six- and 12-month periods. The Team’s strategies over the last year of primarily buying high credit quality bonds and avoiding the longest maturity bonds benefited performance because credit spreads widened sharply and the slope of the yield curve steepened dramatically.
Concerns about deteriorating municipal credit quality and a weakening economy contributed to investors’ sense of unease, but it was the news that the Reserve Primary Fund, a large “prime” money market fund, had “broken the buck” that ignited a wave of fear in all the financial markets. In
the ensuing panic, investors apparently feared that similar funds would have similar problems and redeemed significant amounts of their investments in such funds. Yields of municipal cash-equivalent securities spiked from around 2.5% to around 9% as buyers flocked to the safety of Treasury bills. As a result, three-month T-bill yields dropped to a rate of virtually zero. In light of this turmoil, municipal bond portfolios generally had low to negative returns in this environment.
As the Portfolios’ fiscal year drew to a close, regulators and policymakers across the globe were working feverishly to address the financial crisis. At the same time, economic growth was beginning to slow dramatically. Historically, tax revenues have been very economically sensitive. And, there were signs that tax revenue growth was slowing quickly across the country. Fortunately, most state and local officials had successfully built up reserves to address the looming budget shortfalls. On average, state budget reserves were at 7.5% of general fund spending to start the fiscal year (July 1 for most states). States also cut spending on average this fiscal year. The average projected increase in states’ budgeted expenses was only 1%—the second lowest in 25 years. So far, municipal issuers are prudently readying themselves for difficult times ahead, which should help them weather a significant downturn.
The Portfolios may purchase municipal securities that are insured under policies issued by certain insurance companies. When issued, insured
| | |
| ALLIANCEBERNSTEIN MUNICIPAL INCOME FUND II • | | 3 |
municipal securities typically receive a higher credit rating which means that the issuer of the securities pays a lower interest rate. In purchasing insured securities, the Team gives consideration to both the insurer and to the credit quality of the underlying issuer. The purpose of insurance is to reduce the credit risk of a particular municipal security by supplementing the creditworthiness of the underlying issuer and providing additional security for payment of the principal and interest. Certain of the insurance companies that insure municipal securities insure other types of securities, including some involving subprime mortgages. The credit quality of many subprime mortgage securities has declined and some bond insurers’ risk of having to make payments to holders of subprime mortgage securities has increased. Because of this risk, the credit ratings of some insurance companies have been downgraded and may be further downgraded; it is possible that certain insurance companies may become insolvent. If an insurance company’s rating is downgraded or the company becomes insolvent, the prices of municipal securities insured by the insurance company may decline.
As of September 30, 2008, the Portfolios’ percentages of total investments in insured bonds and in insured bonds that have been pre-refunded are as follows:
| | | | | | |
| Portfolio | | Insured
Bonds | | | Pre-Refunded
Insured
Bonds | |
Arizona | | 47 | % | | 9 | % |
Florida | | 49 | % | | 0 | % |
Massachusetts | | 47 | % | | 8 | % |
Michigan | | 41 | % | | 15 | % |
Minnesota | | 44 | % | | 8 | % |
New Jersey | | 53 | % | | 9 | % |
Ohio | | 50 | % | | 19 | % |
Pennsylvania | | 66 | % | | 22 | % |
Virginia | | 32 | % | | 0 | % |
The Team believes that downgrades in insurance company ratings or insurance company insolvencies present limited risk to the Portfolios. The Portfolios are well diversified by bond insurer, minimizing the exposure to any single insurer. In addition, the Team believes that the generally investment-grade underlying credit quality of the insured municipal securities reduces the risk of a significant reduction in the value of the insured municipal security.
| | |
| 4 | | • ALLIANCEBERNSTEIN MUNICIPAL INCOME FUND II |
HISTORICAL PERFORMANCE
An Important Note About the Value of Historical Performance
The performance shown on the following pages represents past performance and does not guarantee future results. Current performance may be lower or higher than the performance information shown. You may obtain performance information current to the most recent month-end by visiting www.alliancebernstein.com.
The investment return and principal value of an investment in the Portfolios will fluctuate, so that your shares, when redeemed, may be worth more or less than their original cost. You should consider the investment objectives, risks, charges and expenses of the Portfolios carefully before investing. For a free copy of the Portfolios’ prospectus, which contains this and other information, visit our website at www.alliancebernstein.com or call your financial advisor or AllianceBernstein Investments at 800.227.4618. You should read the prospectus carefully before you invest.
All fees and expenses related to the operation of the Portfolios have been deducted. NAV returns do not reflect sales charges; if sales charges were reflected, the Portfolios’ quoted performance would be lower. SEC returns reflect the applicable sales charges for each share class: a 4.25% maximum front-end sales charge for Class A shares; the applicable contingent deferred sales charge for Class B shares (3% year 1, 2% year 2, 1% year 3, 0% year 4); a 1% 1 year contingent deferred sales charge for Class C shares. Returns for the different share classes will vary due to different expenses associated with each class. Performance assumes reinvestment of distributions and does not account for taxes.
Benchmark Disclosure
The unmanaged Lehman Brothers (LB) Municipal Index does not reflect fees and expenses associated with the active management of a mutual fund portfolio. The Index is a total return performance benchmark for the long-term investment grade, tax-exempt bond market. An investor cannot invest directly in an index, and its results are not indicative of the performance for any specific investment, including the Portfolios.
A Word About Risk
Price fluctuations in the Portfolios’ securities may be caused by changes in the general level of interest rates or changes in bond credit quality ratings. Changes in interest rates have a greater effect on bonds with longer maturities than on those with shorter maturities. Please note, as interest rates rise, existing bond prices fall and can cause the value of an investment in the Portfolios to decline. Municipal income securities may realize gains; therefore, shareholders will incur a tax liability from time to time. Income may be subject to state and local taxes and/or the alternative minimum tax. A municipal security could be downgraded or its issuer could default in payment of principal or interest. If applicable, for bonds that are issued at higher interest rates, the issuer may exercise its right to recall some or all of the outstanding bonds to investors prior to their maturity. Individual state municipal portfolios are non-diversified and subject to geographic risk including greater risk of adverse economic conditions and regulatory changes based on their narrow investment objectives. Additionally, the Pennsylvania and Virginia Portfolios can invest in a relatively small number of issuers, and are more susceptible to risks associated with a single economic, political or regulatory occurrence than a more diversified portfolio might be. While the Portfolios invest principally in bonds and other fixed-income securities, in order to achieve their investment objectives, the Portfolios may at times use certain types of investment derivatives, such as options, futures, forwards and swaps. These instruments involve risks different from, and in certain cases, greater than, the risks presented by more traditional investments. These risks are fully discussed in the Portfolios’ prospectus.
(Historical Performance continued on next page)
| | |
| ALLIANCEBERNSTEIN MUNICIPAL INCOME FUND II • | | 5 |
Historical Performance
ARIZONA PORTFOLIO
HISTORICAL PERFORMANCE
(continued from previous page)
| | | | | | |
| | | | | | |
THE PORTFOLIO VS. ITS BENCHMARK PERIODS ENDED SEPTEMBER 30, 2008 | | Returns | | |
| | 6 Months | | 12 Months | | |
Arizona Portfolio | | | | | | |
Class A | | -2.62% | | -2.08% | | |
| |
Class B | | -2.97% | | -2.76% | | |
| |
Class C | | -2.97% | | -2.76% | | |
| |
LB Municipal Index | | -2.60% | | -1.87% | | |
| |
| | | | | | |
GROWTH OF A $10,000 INVESTMENT IN THE PORTFOLIO
9/30/98 TO 9/30/08
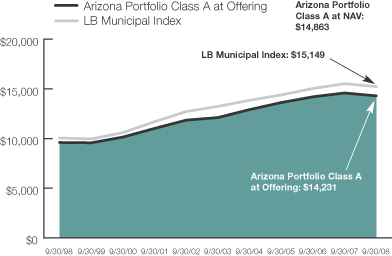
This chart illustrates the total value of an assumed $10,000 investment in AllianceBernstein Municipal Income Fund II Arizona Portfolio Class A shares (from 9/30/98 to 9/30/08) as compared to the performance of the Portfolio’s benchmark. The chart assumes the reinvestment of dividends and capital gains distributions.
See Historical Performance and Benchmark disclosures on the previous page.
(Historical Performance continued on next page)
| | |
| 6 | | • ALLIANCEBERNSTEIN MUNICIPAL INCOME FUND II |
Historical Performance
FLORIDA PORTFOLIO
HISTORICAL PERFORMANCE
(continued from previous page)
| | | | | | |
| | | | | | |
THE PORTFOLIO VS. ITS BENCHMARK PERIODS ENDED SEPTEMBER 30, 2008 | | Returns | | |
| | 6 Months | | 12 Months | | |
Florida Portfolio | | | | | | |
Class A | | -3.90% | | -4.16% | | |
| |
Class B | | -4.23% | | -4.82% | | |
| |
Class C | | -4.23% | | -4.82% | | |
| |
LB Municipal Index | | -2.60% | | -1.87% | | |
| |
| | | | | | |
GROWTH OF A $10,000 INVESTMENT IN THE PORTFOLIO
9/30/98 TO 9/30/08

This chart illustrates the total value of an assumed $10,000 investment in AllianceBernstein Municipal Income Fund II Florida Portfolio Class A shares (from 9/30/98 to 9/30/08) as compared to the performance of the Portfolio’s benchmark. The chart assumes the reinvestment of dividends and capital gains distributions.
See Historical Performance and Benchmark disclosures on page 5.
(Historical Performance continued on next page)
| | |
| ALLIANCEBERNSTEIN MUNICIPAL INCOME FUND II • | | 7 |
Historical Performance
MASSACHUSETTS PORTFOLIO
HISTORICAL PERFORMANCE
(continued from previous page)
| | | | | | |
| | | | | | |
THE PORTFOLIO VS. ITS BENCHMARK PERIODS ENDED SEPTEMBER 30, 2008 | | Returns | | |
| | 6 Months | | 12 Months | | |
Massachusetts Portfolio | | | | | | |
Class A | | -1.82% | | -0.22% | | |
| |
Class B | | -2.16% | | -0.91% | | |
| |
Class C | | -2.16% | | -0.91% | | |
| |
LB Municipal Index | | -2.60% | | -1.87% | | |
| |
| | | | | | |
GROWTH OF A $10,000 INVESTMENT IN THE PORTFOLIO
9/30/98 TO 9/30/08
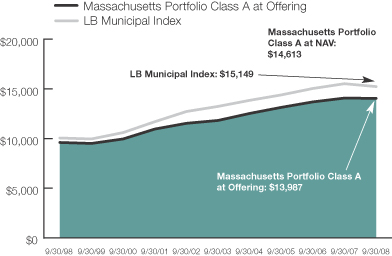
This chart illustrates the total value of an assumed $10,000 investment in AllianceBernstein Municipal Income Fund II Massachusetts Portfolio Class A shares (from 9/30/98 to 9/30/08) as compared to the performance of the Portfolio’s benchmark. The chart assumes the reinvestment of dividends and capital gains distributions.
See Historical Performance and Benchmark disclosures on page 5.
(Historical Performance continued on next page)
| | |
| 8 | | • ALLIANCEBERNSTEIN MUNICIPAL INCOME FUND II |
Historical Performance
MICHIGAN PORTFOLIO
HISTORICAL PERFORMANCE
(continued from previous page)
| | | | | | |
| | | | | | |
THE PORTFOLIO VS. ITS BENCHMARK PERIODS ENDED SEPTEMBER 30, 2008 | | Returns | | |
| | 6 Months | | 12 Months | | |
Michigan Portfolio | | | | | | |
Class A | | -2.97% | | -1.97% | | |
| |
Class B | | -3.32% | | -2.65% | | |
| |
Class C | | -3.32% | | -2.74% | | |
| |
LB Municipal Index | | -2.60% | | -1.87% | | |
| |
| | | | | | |
GROWTH OF A $10,000 INVESTMENT IN THE PORTFOLIO
9/30/98 TO 9/30/08
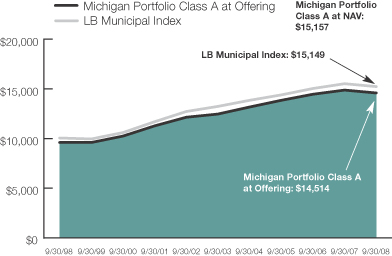
This chart illustrates the total value of an assumed $10,000 investment in AllianceBernstein Municipal Income Fund II Michigan Portfolio Class A shares (from 9/30/98 to 9/30/08) as compared to the performance of the Portfolio’s benchmark. The chart assumes the reinvestment of dividends and capital gains distributions.
See Historical Performance and Benchmark disclosures on page 5.
(Historical Performance continued on next page)
| | |
| ALLIANCEBERNSTEIN MUNICIPAL INCOME FUND II • | | 9 |
Historical Performance
MINNESOTA PORTFOLIO
HISTORICAL PERFORMANCE
(continued from previous page)
| | | | | | |
| | | | | | |
THE PORTFOLIO VS. ITS BENCHMARK PERIODS ENDED SEPTEMBER 30, 2008 | | Returns | | |
| | 6 Months | | 12 Months | | |
Minnesota Portfolio | | | | | | |
Class A | | -2.49% | | -1.53% | | |
| |
Class B | | -2.83% | | -2.21% | | |
| |
Class C | | -2.83% | | -2.21% | | |
| |
LB Municipal Index | | -2.60% | | -1.87% | | |
| |
| | | | | | |
GROWTH OF A $10,000 INVESTMENT IN THE PORTFOLIO
9/30/98 TO 9/30/08
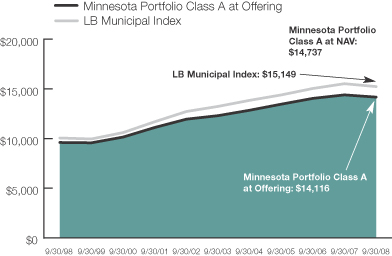
This chart illustrates the total value of an assumed $10,000 investment in AllianceBernstein Municipal Income Fund II Minnesota Portfolio Class A shares (from 9/30/98 to 9/30/08) as compared to the performance of the Portfolio’s benchmark. The chart assumes the reinvestment of dividends and capital gains distributions.
See Historical Performance and Benchmark disclosures on page 5.
(Historical Performance continued on next page)
| | |
| 10 | | • ALLIANCEBERNSTEIN MUNICIPAL INCOME FUND II |
Historical Performance
NEW JERSEY PORTFOLIO
HISTORICAL PERFORMANCE
(continued from previous page)
| | | | | | |
| | | | | | |
THE PORTFOLIO VS. ITS BENCHMARK PERIODS ENDED SEPTEMBER 30, 2008 | | Returns | | |
| | 6 Months | | 12 Months | | |
New Jersey Portfolio | | | | | | |
Class A | | -2.20% | | -2.46% | | |
| |
Class B | | -2.54% | | -3.14% | | |
| |
Class C | | -2.54% | | -3.14% | | |
| |
LB Municipal Index | | -2.60% | | -1.87% | | |
| |
| | | | | | |
GROWTH OF A $10,000 INVESTMENT IN THE PORTFOLIO
9/30/98 TO 9/30/08
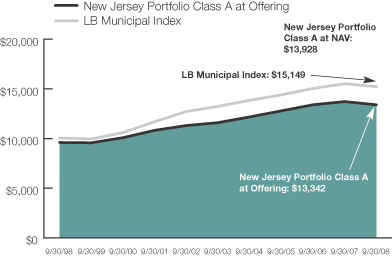
This chart illustrates the total value of an assumed $10,000 investment in AllianceBernstein Municipal Income Fund II New Jersey Portfolio Class A shares (from 9/30/98 to 9/30/08) as compared to the performance of the Portfolio’s benchmark. The chart assumes the reinvestment of dividends and capital gains distributions.
See Historical Performance and Benchmark disclosures on page 5.
(Historical Performance continued on next page)
| | |
| ALLIANCEBERNSTEIN MUNICIPAL INCOME FUND II • | | 11 |
Historical Performance
OHIO PORTFOLIO
HISTORICAL PERFORMANCE
(continued from previous page)
| | | | | | |
| | | | | | |
THE PORTFOLIO VS. ITS BENCHMARK PERIODS ENDED SEPTEMBER 30, 2008 | | Returns | | |
| | 6 Months | | 12 Months | | |
Ohio Portfolio | | | | | | |
Class A | | -2.61% | | -2.33% | | |
| |
Class B | | -2.96% | | -3.02% | | |
| |
Class C | | -3.06% | | -3.11% | | |
| |
LB Municipal Index | | -2.60% | | -1.87% | | |
| |
| | | | | | |
GROWTH OF A $10,000 INVESTMENT IN THE PORTFOLIO
9/30/98 TO 9/30/08
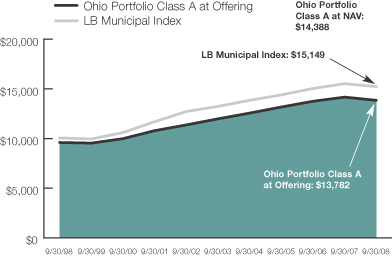
This chart illustrates the total value of an assumed $10,000 investment in AllianceBernstein Municipal Income Fund II Ohio Portfolio Class A shares (from 9/30/98 to 9/30/08) as compared to the performance of the Portfolio’s benchmark. The chart assumes the reinvestment of dividends and capital gains distributions.
See Historical Performance and Benchmark disclosures on page 5.
(Historical Performance continued on next page)
| | |
| 12 | | • ALLIANCEBERNSTEIN MUNICIPAL INCOME FUND II |
Historical Performance
PENNSYLVANIA PORTFOLIO
HISTORICAL PERFORMANCE
(continued from previous page)
| | | | | | |
| | | | | | |
THE PORTFOLIO VS. ITS BENCHMARK PERIODS ENDED SEPTEMBER 30, 2008 | | Returns | | |
| | 6 Months | | 12 Months | | |
Pennsylvania Portfolio | | | | | | |
Class A | | -3.04% | | -2.80% | | |
| |
Class B | | -3.38% | | -3.48% | | |
| |
Class C | | -3.38% | | -3.48% | | |
| |
LB Municipal Index | | -2.60% | | -1.87% | | |
| |
| | | | | | |
GROWTH OF A $10,000 INVESTMENT IN THE PORTFOLIO
9/30/98 TO 9/30/08
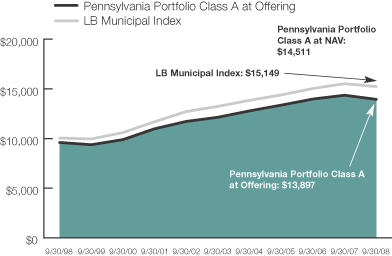
This chart illustrates the total value of an assumed $10,000 investment in AllianceBernstein Municipal Income Fund II Pennsylvania Portfolio Class A shares (from 9/30/98 to 9/30/08) as compared to the performance of the Portfolio’s benchmark. The chart assumes the reinvestment of dividends and capital gains distributions.
See Historical Performance and Benchmark disclosures on page 5.
(Historical Performance continued on next page)
| | |
| ALLIANCEBERNSTEIN MUNICIPAL INCOME FUND II • | | 13 |
Historical Performance
VIRGINIA PORTFOLIO
HISTORICAL PERFORMANCE
(continued from previous page)
| | | | | | |
| | | | | | |
THE PORTFOLIO VS. ITS BENCHMARK PERIODS ENDED SEPTEMBER 30, 2008 | | Returns | | |
| | 6 Months | | 12 Months | | |
Virginia Portfolio | | | | | | |
Class A | | -2.98% | | -2.33% | | |
| |
Class B | | -3.33% | | -3.02% | | |
| |
Class C | | -3.33% | | -3.11% | | |
| |
LB Municipal Index | | -2.60% | | -1.87% | | |
| |
| | | | | | |
GROWTH OF A $10,000 INVESTMENT IN THE PORTFOLIO
9/30/98 TO 9/30/08
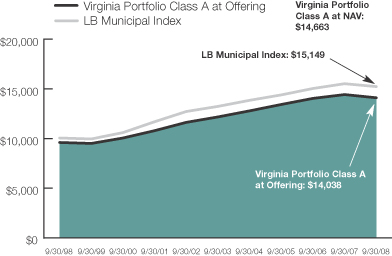
This chart illustrates the total value of an assumed $10,000 investment in AllianceBernstein Municipal Income Fund II Virginia Portfolio Class A shares (from 9/30/98 to 9/30/08) as compared to the performance of the Portfolio’s benchmark. The chart assumes the reinvestment of dividends and capital gains distributions.
See Historical Performance and Benchmark disclosures on page 5.
(Historical Performance continued on next page)
| | |
| 14 | | • ALLIANCEBERNSTEIN MUNICIPAL INCOME FUND II |
Historical Performance
ARIZONA PORTFOLIO
HISTORICAL PERFORMANCE
(continued from previous page)
| | | | | | | | |
| AVERAGE ANNUAL RETURNS AS OF SEPTEMBER 30, 2008 |
| | | NAV
Returns | | SEC
Returns | | SEC
Yields* | | Taxable Equivalent Yields** |
| | | | | | | | |
| Class A Shares | | | | | | 3.86% | | 6.22% |
1 Year | | -2.08% | | -6.28% | | | | |
5 Years | | 3.35% | | 2.45% | | | | |
10 Years | | 4.04% | | 3.59% | | | | |
| | | | | | | | |
| Class B Shares | | | | | | 3.31% | | 5.33% |
1 Year | | -2.76% | | -5.59% | | | | |
5 Years | | 2.64% | | 2.64% | | | | |
10 Years(a) | | 3.61% | | 3.61% | | | | |
| | | | | | | | |
| Class C Shares | | | | | | 3.32% | | 5.35% |
1 Year | | -2.76% | | -3.70% | | | | |
5 Years | | 2.64% | | 2.64% | | | | |
10 Years | | 3.32% | | 3.32% | | | | |
| | | | | | | | |
SEC AVERAGE ANNUAL RETURNS (WITH ANY APPLICABLE SALES CHARGES) AS OF THE MOST RECENT CALENDAR QUARTER-END (SEPTEMBER 30, 2008) |
| | | | | | | | | SEC Returns |
| | | | | | | | |
| Class A Shares | | | | | | | | |
1 Year | | | | | | | | -6.28% |
5 Years | | | | | | | | 2.45% |
10 Years | | | | | | | | 3.59% |
| | | | | | | | |
| Class B Shares | | | | | | | | |
1 Year | | | | | | | | -5.59% |
5 Years | | | | | | | | 2.64% |
10 Years(a) | | | | | | | | 3.61% |
| | | | | | | | |
| Class C Shares | | | | | | | | |
1 Year | | | | | | | | -3.70% |
5 Years | | | | | | | | 2.64% |
10 Years | | | | | | | | 3.32% |
The Portfolio’s current prospectus fee table shows the Portfolio’s total annual operating expense ratios as 0.96%, 1.67% and 1.66% for Class A, Class B and Class C, respectively, gross of any fee waivers or expense reimbursements. Contractual fee waivers and/or expense reimbursements limit the Portfolio’s annual operating expense ratios to 0.78%, 1.48% and 1.48% for Class A, Class B and Class C, respectively. These waivers/reimbursements extend through the Portfolio’s current fiscal year and may be extended by the Adviser for additional one-year terms. Absent reimbursements or waivers, performance would have been lower. The Financial Highlights section of this report sets forth expense ratio data for the current reporting period; the expense ratios shown above may differ from the expense ratios in the Financial Highlights section since they are based on different time periods.
| (a) | Assumes conversion of Class B shares into Class A shares after six years. |
| * | SEC Yields are calculated based on SEC guidelines for the 30-day period ended September 30, 2008. |
| ** | Taxable equivalent yields are based on SEC yields and a 35% marginal Federal income tax rate and maximum state taxes where applicable. |
See Historical Performance disclosures on page 5.
(Historical Performance continued on next page)
| | |
| ALLIANCEBERNSTEIN MUNICIPAL INCOME FUND II • | | 15 |
Historical Performance
FLORIDA PORTFOLIO
HISTORICAL PERFORMANCE
(continued from previous page)
| | | | | | | | |
| AVERAGE ANNUAL RETURNS AS OF SEPTEMBER 30, 2008 |
| | | NAV
Returns | | SEC
Returns | | SEC
Yields* | | Taxable Equivalent Yields** |
| | | | | | | | |
| Class A Shares | | | | | | 4.60% | | 7.08% |
1 Year | | -4.16% | | -8.23% | | | | |
5 Years | | 2.82% | | 1.93% | | | | |
10 Years | | 3.79% | | 3.34% | | | | |
| | | | | | | | |
| Class B Shares | | | | | | 4.06% | | 6.25% |
1 Year | | -4.82% | | -7.57% | | | | |
5 Years | | 2.11% | | 2.11% | | | | |
10 Years(a) | | 3.36% | | 3.36% | | | | |
| | | | | | | | |
| Class C Shares | | | | | | 4.07% | | 6.26% |
1 Year | | -4.82% | | -5.74% | | | | |
5 Years | | 2.11% | | 2.11% | | | | |
10 Years | | 3.07% | | 3.07% | | | | |
| | | | | | | | |
SEC AVERAGE ANNUAL RETURNS (WITH ANY APPLICABLE SALES CHARGES) AS OF THE MOST RECENT CALENDAR QUARTER-END (SEPTEMBER 30, 2008) |
| | | | | | | | | SEC Returns |
| | | | | | | | |
| Class A Shares | | | | | | | | |
1 Year | | | | | | | | -8.23% |
5 Years | | | | | | | | 1.93% |
10 Years | | | | | | | | 3.34% |
| | | | | | | | |
| Class B Shares | | | | | | | | |
1 Year | | | | | | | | -7.57% |
5 Years | | | | | | | | 2.11% |
10 Years(a) | | | | | | | | 3.36% |
| | | | | | | | |
| Class C Shares | | | | | | | | |
1 Year | | | | | | | | -5.74% |
5 Years | | | | | | | | 2.11% |
10 Years | | | | | | | | 3.07% |
The Portfolio’s current prospectus fee table shows the Portfolio’s total annual operating expense ratios as 0.96%, 1.68% and 1.67% for Class A, Class B and Class C, respectively, gross of any fee waivers or expense reimbursements. Contractual fee waivers and/or expense reimbursements limit the Portfolio’s annual operating expense ratios to 0.78%, 1.48% and 1.48% for Class A, Class B and Class C, respectively. These waivers/reimbursements extend through the Portfolio’s current fiscal year and may be extended by the Adviser for additional one-year terms. Absent reimbursements or waivers, performance would have been lower. The Financial Highlights section of this report sets forth expense ratio data for the current reporting period; the expense ratios shown above may differ from the expense ratios in the Financial Highlights section since they are based on different time periods.
| (a) | Assumes conversion of Class B shares into Class A shares after six years. |
| * | SEC Yields are calculated based on SEC guidelines for the 30-day period ended September 30, 2008. |
| ** | Taxable equivalent yields are based on SEC yields and a 35% marginal Federal income tax rate and maximum state taxes where applicable. |
See Historical Performance disclosures on page 5.
(Historical Performance continued on next page)
| | |
| 16 | | • ALLIANCEBERNSTEIN MUNICIPAL INCOME FUND II |
Historical Performance
MASSACHUSETTS PORTFOLIO
HISTORICAL PERFORMANCE
(continued from previous page)
| | | | | | | | |
| AVERAGE ANNUAL RETURNS AS OF SEPTEMBER 30, 2008 |
| | | NAV
Returns | | SEC
Returns | | SEC
Yields* | | Taxable Equivalent Yields** |
| | | | | | | | |
| Class A Shares | | | | | | 3.66% | | 5.95% |
1 Year | | -0.22% | | -4.46% | | | | |
5 Years | | 3.52% | | 2.62% | | | | |
10 Years | | 3.87% | | 3.41% | | | | |
| | | | | | | | |
| Class B Shares | | | | | | 3.11% | | 5.05% |
1 Year | | -0.91% | | -3.79% | | | | |
5 Years | | 2.80% | | 2.80% | | | | |
10 Years(a) | | 3.45% | | 3.45% | | | | |
| | | | | | | | |
| Class C Shares | | | | | | 3.11% | | 5.05% |
1 Year | | -0.91% | | -1.87% | | | | |
5 Years | | 2.80% | | 2.80% | | | | |
10 Years | | 3.16% | | 3.16% | | | | |
| | | | | | | | |
SEC AVERAGE ANNUAL RETURNS (WITH ANY APPLICABLE SALES CHARGES) AS OF THE MOST RECENT CALENDAR QUARTER-END (SEPTEMBER 30, 2008) |
| | | | | | | | | SEC Returns |
| | | | | | | | |
| Class A Shares | | | | | | | | |
1 Year | | | | | | | | -4.46% |
5 Years | | | | | | | | 2.62% |
10 Years | | | | | | | | 3.41% |
| | | | | | | | |
| Class B Shares | | | | | | | | |
1 Year | | | | | | | | -3.79% |
5 Years | | | | | | | | 2.80% |
10 Years(a) | | | | | | | | 3.45% |
| | | | | | | | |
| Class C Shares | | | | | | | | |
1 Year | | | | | | | | -1.87% |
5 Years | | | | | | | | 2.80% |
10 Years | | | | | | | | 3.16% |
The Portfolio’s current prospectus fee table shows the Portfolio’s total annual operating expense ratios as 1.06%, 1.77% and 1.76% for Class A, Class B and Class C, respectively, gross of any fee waivers or expense reimbursements. Contractual fee waivers and/or expense reimbursements limit the Portfolio’s annual operating expense ratios to 0.82%, 1.52% and 1.52% for Class A, Class B and Class C, respectively. These waivers/reimbursements extend through the Portfolio’s current fiscal year and may be extended by the Adviser for additional one-year terms. Absent reimbursements or waivers, performance would have been lower. The Financial Highlights section of this report sets forth expense ratio data for the current reporting period; the expense ratios shown above may differ from the expense ratios in the Financial Highlights section since they are based on different time periods.
| (a) | Assumes conversion of Class B shares into Class A shares after six years. |
| * | SEC Yields are calculated based on SEC guidelines for the 30-day period ended September 30, 2008. |
| ** | Taxable equivalent yields are based on SEC yields and a 35% marginal Federal income tax rate and maximum state taxes where applicable. |
See Historical Performance disclosures on page 5.
(Historical Performance continued on next page)
| | |
| ALLIANCEBERNSTEIN MUNICIPAL INCOME FUND II • | | 17 |
Historical Performance
MICHIGAN PORTFOLIO
HISTORICAL PERFORMANCE
(continued from previous page)
| | | | | | | | |
| AVERAGE ANNUAL RETURNS AS OF SEPTEMBER 30, 2008 |
| | | NAV
Returns | | SEC
Returns | | SEC
Yields* | | Taxable Equivalent Yields** |
| | | | | | | | |
| Class A Shares | | | | | | 3.40% | | 5.47% |
1 Year | | -1.97% | | -6.16% | | | | |
5 Years | | 3.15% | | 2.27% | | | | |
10 Years | | 4.25% | | 3.80% | | | | |
| | | | | | | | |
| Class B Shares | | | | | | 2.84% | | 4.57% |
1 Year | | -2.65% | | -5.47% | | | | |
5 Years | | 2.45% | | 2.45% | | | | |
10 Years(a) | | 3.81% | | 3.81% | | | | |
| | | | | | | | |
| Class C Shares | | | | | | 2.84% | | 4.57% |
1 Year | | -2.74% | | -3.68% | | | | |
5 Years | | 2.44% | | 2.44% | | | | |
10 Years | | 3.53% | | 3.53% | | | | |
| | | | | | | | |
SEC AVERAGE ANNUAL RETURNS (WITH ANY APPLICABLE SALES CHARGES) AS OF THE MOST RECENT CALENDAR QUARTER-END (SEPTEMBER 30, 2008) |
| | | | | | | | | SEC Returns |
| | | | | | | | |
| Class A Shares | | | | | | | | |
1 Year | | | | | | | | -6.16% |
5 Years | | | | | | | | 2.27% |
10 Years | | | | | | | | 3.80% |
| | | | | | | | |
| Class B Shares | | | | | | | | |
1 Year | | | | | | | | -5.47% |
5 Years | | | | | | | | 2.45% |
10 Years(a) | | | | | | | | 3.81% |
| | | | | | | | |
| Class C Shares | | | | | | | | |
1 Year | | | | | | | | -3.68% |
5 Years | | | | | | | | 2.44% |
10 Years | | | | | | | | 3.53% |
The Portfolio’s current prospectus fee table shows the Portfolio’s total annual operating expense ratios as 1.10%, 1.81% and 1.81% for Class A, Class B and Class C, respectively, gross of any fee waivers or expense reimbursements. Contractual fee waivers and/or expense reimbursements limit the Portfolio’s annual operating expense ratios to 1.01%, 1.71% and 1.71% for Class A, Class B and Class C, respectively. These waivers/reimbursements extend through the Portfolio’s current fiscal year and may be extended by the Adviser for additional one-year terms. Absent reimbursements or waivers, performance would have been lower. The Financial Highlights section of this report sets forth expense ratio data for the current reporting period; the expense ratios shown above may differ from the expense ratios in the Financial Highlights section since they are based on different time periods.
| (a) | Assumes conversion of Class B shares into Class A shares after six years. |
| * | SEC Yields are calculated based on SEC guidelines for the 30-day period ended September 30, 2008. |
| ** | Taxable equivalent yields are based on SEC yields and a 35% marginal Federal income tax rate and maximum state taxes where applicable. |
See Historical Performance disclosures on page 5.
(Historical Performance continued on next page)
| | |
| 18 | | • ALLIANCEBERNSTEIN MUNICIPAL INCOME FUND II |
Historical Performance
MINNESOTA PORTFOLIO
HISTORICAL PERFORMANCE
(continued from previous page)
| | | | | | | | |
| AVERAGE ANNUAL RETURNS AS OF SEPTEMBER 30, 2008 |
| | | NAV
Returns | | SEC
Returns | | SEC
Yields* | | Taxable Equivalent Yields** |
| | | | | | | | |
| Class A Shares | | | | | | 3.65% | | 6.09% |
1 Year | | -1.53% | | -5.75% | | | | |
5 Years | | 2.87% | | 1.98% | | | | |
10 Years | | 3.95% | | 3.51% | | | | |
| | | | | | | | |
| Class B Shares | | | | | | 3.09% | | 5.16% |
1 Year | | -2.21% | | -5.05% | | | | |
5 Years | | 2.15% | | 2.15% | | | | |
10 Years(a) | | 3.52% | | 3.52% | | | | |
| | | | | | | | |
| Class C Shares | | | | | | 3.09% | | 5.16% |
1 Year | | -2.21% | | -3.16% | | | | |
5 Years | | 2.15% | | 2.15% | | | | |
10 Years | | 3.24% | | 3.24% | | | | |
| | | | | | | | |
SEC AVERAGE ANNUAL RETURNS (WITH ANY APPLICABLE SALES CHARGES) AS OF THE MOST RECENT CALENDAR QUARTER-END (SEPTEMBER 30, 2008) |
| | | | | | | | | SEC Returns |
| | | | | | | | |
| Class A Shares | | | | | | | | |
1 Year | | | | | | | | -5.75% |
5 Years | | | | | | | | 1.98% |
10 Years | | | | | | | | 3.51% |
| | | | | | | | |
| Class B Shares | | | | | | | | |
1 Year | | | | | | | | -5.05% |
5 Years | | | | | | | | 2.15% |
10 Years(a) | | | | | | | | 3.52% |
| | | | | | | | |
| Class C Shares | | | | | | | | |
1 Year | | | | | | | | -3.16% |
5 Years | | | | | | | | 2.15% |
10 Years | | | | | | | | 3.24% |
The Portfolio’s current prospectus fee table shows the Portfolio’s total annual operating expense ratios as 1.16%, 1.87% and 1.86% for Class A, Class B and Class C, respectively, gross of any fee waivers or expense reimbursements. Contractual fee waivers and/or expense reimbursements limit the Portfolio’s annual operating expense ratios to 0.90%, 1.60% and 1.60% for Class A, Class B and Class C, respectively. These waivers/reimbursements extend through the Portfolio’s current fiscal year and may be extended by the Adviser for additional one-year terms. Absent reimbursements or waivers, performance would have been lower. The Financial Highlights section of this report sets forth expense ratio data for the current reporting period; the expense ratios shown above may differ from the expense ratios in the Financial Highlights section since they are based on different time periods.
| (a) | Assumes conversion of Class B shares into Class A shares after six years. |
| * | SEC Yields are calculated based on SEC guidelines for the 30-day period ended September 30, 2008. |
| ** | Taxable equivalent yields are based on SEC yields and a 35% marginal Federal income tax rate and maximum state taxes where applicable. |
See Historical Performance disclosures on page 5.
(Historical Performance continued on next page)
| | |
| ALLIANCEBERNSTEIN MUNICIPAL INCOME FUND II • | | 19 |
Historical Performance
NEW JERSEY PORTFOLIO
HISTORICAL PERFORMANCE
(continued from previous page)
| | | | | | | | |
| AVERAGE ANNUAL RETURNS AS OF SEPTEMBER 30, 2008 |
| | | NAV
Returns | | SEC
Returns | | SEC
Yields* | | Taxable Equivalent Yields** |
| | | | | | | | |
| Class A Shares | | | | | | 4.10% | | 6.93% |
1 Year | | -2.46% | | -6.58% | | | | |
5 Years | | 2.94% | | 2.06% | | | | |
10 Years | | 3.37% | | 2.93% | | | | |
| | | | | | | | |
| Class B Shares | | | | | | 3.56% | | 6.02% |
1 Year | | -3.14% | | -5.95% | | | | |
5 Years | | 2.22% | | 2.22% | | | | |
10 Years(a) | | 2.93% | | 2.93% | | | | |
| | | | | | | | |
| Class C Shares | | | | | | 3.56% | | 6.02% |
1 Year | | -3.14% | | -4.08% | | | | |
5 Years | | 2.20% | | 2.20% | | | | |
10 Years | | 2.64% | | 2.64% | | | | |
| | | | | | | | |
SEC AVERAGE ANNUAL RETURNS (WITH ANY APPLICABLE SALES CHARGES) AS OF THE MOST RECENT CALENDAR QUARTER-END (SEPTEMBER 30, 2008) |
| | | | | | | | | SEC Returns |
| | | | | | | | |
| Class A Shares | | | | | | | | |
1 Year | | | | | | | | -6.58% |
5 Years | | | | | | | | 2.06% |
10 Years | | | | | | | | 2.93% |
| | | | | | | | |
| Class B Shares | | | | | | | | |
1 Year | | | | | | | | -5.95% |
5 Years | | | | | | | | 2.22% |
10 Years(a) | | | | | | | | 2.93% |
| | | | | | | | |
| Class C Shares | | | | | | | | |
1 Year | | | | | | | | -4.08% |
5 Years | | | | | | | | 2.20% |
10 Years | | | | | | | | 2.64% |
The Portfolio’s current prospectus fee table shows the Portfolio’s total annual operating expense ratios, including interest expense, as 1.10%, 1.81% and 1.80% for Class A, Class B and Class C, respectively, gross of any fee waivers or expense reimbursements. Contractual fee waivers and/or expense reimbursements limit the Portfolio’s annual operating expense ratios, excluding interest expense, to 0.87%, 1.57% and 1.57% for Class A, Class B and Class C, respectively. These waivers/reimbursements extend through the Portfolio’s current fiscal year and may be extended by the Adviser for additional one-year terms. Absent reimbursements or waivers, performance would have been lower. The Financial Highlights section of this report sets forth expense ratio data for the current reporting period; the expense ratios shown above may differ from the expense ratios in the Financial Highlights section since they are based on different time periods.
| (a) | Assumes conversion of Class B shares into Class A shares after six years. |
| * | SEC Yields are calculated based on SEC guidelines for the 30-day period ended September 30, 2008. |
| ** | Taxable equivalent yields are based on SEC yields and a 35% marginal Federal income tax rate and maximum state taxes where applicable. |
See Historical Performance disclosures on page 5.
(Historical Performance continued on next page)
| | |
| 20 | | • ALLIANCEBERNSTEIN MUNICIPAL INCOME FUND II |
Historical Performance
OHIO PORTFOLIO
HISTORICAL PERFORMANCE
(continued from previous page)
| | | | | | | | |
| AVERAGE ANNUAL RETURNS AS OF SEPTEMBER 30, 2008 |
| | | NAV
Returns | | SEC
Returns | | SEC
Yields* | | Taxable Equivalent Yields** |
| | | | | | | | |
| Class A Shares | | | | | | 3.57% | | 5.86% |
1 Year | | -2.33% | | -6.51% | | | | |
5 Years | | 2.92% | | 2.03% | | | | |
10 Years | | 3.71% | | 3.26% | | | | |
| | | | | | | | |
| Class B Shares | | | | | | 3.00% | | 4.92% |
1 Year | | -3.02% | | -5.83% | | | | |
5 Years | | 2.21% | | 2.21% | | | | |
10 Years(a) | | 3.27% | | 3.27% | | | | |
| | | | | | | | |
| Class C Shares | | | | | | 3.00% | | 4.92% |
1 Year | | -3.11% | | -4.05% | | | | |
5 Years | | 2.19% | | 2.19% | | | | |
10 Years | | 2.98% | | 2.98% | | | | |
| | | | | | | | |
SEC AVERAGE ANNUAL RETURNS (WITH ANY APPLICABLE SALES CHARGES) AS OF THE MOST RECENT CALENDAR QUARTER-END (SEPTEMBER 30, 2008) |
| | | | | | | | | SEC Returns |
| | | | | | | | |
| Class A Shares | | | | | | | | |
1 Year | | | | | | | | -6.51% |
5 Years | | | | | | | | 2.03% |
10 Years | | | | | | | | 3.26% |
| | | | | | | | |
| Class B Shares | | | | | | | | |
1 Year | | | | | | | | -5.83% |
5 Years | | | | | | | | 2.21% |
10 Years(a) | | | | | | | | 3.27% |
| | | | | | | | |
| Class C Shares | | | | | | | | |
1 Year | | | | | | | | -4.05% |
5 Years | | | | | | | | 2.19% |
10 Years | | | | | | | | 2.98% |
The Portfolio’s current prospectus fee table shows the Portfolio’s total annual operating expense ratios as 1.01%, 1.72% and 1.71% for Class A, Class B and Class C, respectively, gross of any fee waivers or expense reimbursements. Contractual fee waivers and/or expense reimbursements limit the Portfolio’s annual operating expense ratios to 0.85%, 1.55% and 1.55% for Class A, Class B and Class C, respectively. These waivers/reimbursements extend through the Portfolio’s current fiscal year and may be extended by the Adviser for additional one-year terms. Absent reimbursements or waivers, performance would have been lower. The Financial Highlights section of this report sets forth expense ratio data for the current reporting period; the expense ratios shown above may differ from the expense ratios in the Financial Highlights section since they are based on different time periods.
| (a) | Assumes conversion of Class B shares into Class A shares after six years. |
| * | SEC Yields are calculated based on SEC guidelines for the 30-day period ended September 30, 2008. |
| ** | Taxable equivalent yields are based on SEC yields and a 35% marginal Federal income tax rate and maximum state taxes where applicable. |
See Historical Performance disclosures on page 5.
(Historical Performance continued on next page)
| | |
| ALLIANCEBERNSTEIN MUNICIPAL INCOME FUND II • | | 21 |
Historical Performance
PENNSYLVANIA PORTFOLIO
HISTORICAL PERFORMANCE
(continued from previous page)
| | | | | | | | |
| AVERAGE ANNUAL RETURNS AS OF SEPTEMBER 30, 2008 |
| | | NAV
Returns | | SEC
Returns | | SEC
Yields* | | Taxable Equivalent Yields** |
| | | | | | | | |
| Class A Shares | | | | | | 3.75% | | 5.95% |
1 Year | | -2.80% | | -6.90% | | | | |
5 Years | | 2.79% | | 1.91% | | | | |
10 Years | | 3.79% | | 3.35% | | | | |
| | | | | | | | |
| Class B Shares | | | | | | 3.18% | | 5.05% |
1 Year | | -3.48% | | -6.28% | | | | |
5 Years | | 2.07% | | 2.07% | | | | |
10 Years(a) | | 3.36% | | 3.36% | | | | |
| | | | | | | | |
| Class C Shares | | | | | | 3.19% | | 5.06% |
1 Year | | -3.48% | | -4.41% | | | | |
5 Years | | 2.08% | | 2.08% | | | | |
10 Years | | 3.07% | | 3.07% | | | | |
| | | | | | | | |
SEC AVERAGE ANNUAL RETURNS (WITH ANY APPLICABLE SALES CHARGES) AS OF THE MOST RECENT CALENDAR QUARTER-END (SEPTEMBER 30, 2008) |
| | | | | | | | | SEC Returns |
| | | | | | | | |
| Class A Shares | | | | | | | | |
1 Year | | | | | | | | -6.90% |
5 Years | | | | | | | | 1.91% |
10 Years | | | | | | | | 3.35% |
| | | | | | | | |
| Class B Shares | | | | | | | | |
1 Year | | | | | | | | -6.28% |
5 Years | | | | | | | | 2.07% |
10 Years(a) | | | | | | | | 3.36% |
| | | | | | | | |
| Class C Shares | | | | | | | | |
1 Year | | | | | | | | -4.41% |
5 Years | | | | | | | | 2.08% |
10 Years | | | | | | | | 3.07% |
The Portfolio’s current prospectus fee table shows the Portfolio’s total annual operating expense ratios as 1.03%, 1.74% and 1.74% for Class A, Class B and Class C, respectively, gross of any fee waivers or expense reimbursements. Contractual fee waivers and/or expense reimbursements limit the Portfolio’s annual operating expense ratios to 0.95%, 1.65% and 1.65% for Class A, Class B and Class C, respectively. These waivers/reimbursements extend through the Portfolio’s current fiscal year and may be extended by the Adviser for additional one-year terms. Absent reimbursements or waivers, performance would have been lower. The Financial Highlights section of this report sets forth expense ratio data for the current reporting period; the expense ratios shown above may differ from the expense ratios in the Financial Highlights section since they are based on different time periods.
| (a) | Assumes conversion of Class B shares into Class A shares after six years. |
| * | SEC Yields are calculated based on SEC guidelines for the 30-day period ended September 30, 2008. |
| ** | Taxable equivalent yields are based on SEC yields and a 35% marginal Federal income tax rate and maximum state taxes where applicable. |
See Historical Performance disclosures on page 5.
(Historical Performance continued on next page)
| | |
| 22 | | • ALLIANCEBERNSTEIN MUNICIPAL INCOME FUND II |
Historical Performance
VIRGINIA PORTFOLIO
HISTORICAL PERFORMANCE
(continued from previous page)
| | | | | | | | |
| AVERAGE ANNUAL RETURNS AS OF SEPTEMBER 30, 2008 |
| | | NAV
Returns | | SEC
Returns | | SEC
Yields* | | Taxable Equivalent Yields** |
| | | | | | | | |
| Class A Shares | | | | | | 4.10% | | 6.69% |
1 Year | | -2.33% | | -6.44% | | | | |
5 Years | | 2.99% | | 2.09% | | | | |
10 Years | | 3.90% | | 3.45% | | | | |
| | | | | | | | |
| Class B Shares | | | | | | 3.56% | | 5.81% |
1 Year | | -3.02% | | -5.83% | | | | |
5 Years | | 2.27% | | 2.27% | | | | |
10 Years(a) | | 3.48% | | 3.48% | | | | |
| | | | | | | | |
| Class C Shares | | | | | | 3.57% | | 5.83% |
1 Year | | -3.11% | | -4.04% | | | | |
5 Years | | 2.27% | | 2.27% | | | | |
10 Years | | 3.18% | | 3.18% | | | | |
| | | | | | | | |
SEC AVERAGE ANNUAL RETURNS (WITH ANY APPLICABLE SALES CHARGES) AS OF THE MOST RECENT CALENDAR QUARTER-END (SEPTEMBER 30, 2008) |
| | | | | | | | | SEC Returns |
| | | | | | | | |
| Class A Shares | | | | | | | | |
1 Year | | | �� | | | | | -6.44% |
5 Years | | | | | | | | 2.09% |
10 Years | | | | | | | | 3.45% |
| | | | | | | | |
| Class B Shares | | | | | | | | |
1 Year | | | | | | | | -5.83% |
5 Years | | | | | | | | 2.27% |
10 Years(a) | | | | | | | | 3.48% |
| | | | | | | | |
| Class C Shares | | | | | | | | |
1 Year | | | | | | | | -4.04% |
5 Years | | | | | | | | 2.27% |
10 Years | | | | | | | | 3.18% |
The Portfolio’s current prospectus fee table shows the Portfolio’s total annual operating expense ratios as 0.99%, 1.69% and 1.69% for Class A, Class B and Class C, respectively, gross of any fee waivers or expense reimbursements. Contractual fee waivers and/or expense reimbursements limit the Portfolio’s annual operating expense ratios to 0.72%, 1.42% and 1.42% for Class A, Class B and Class C, respectively. These waivers/reimbursements extend through the Portfolio’s current fiscal year and may be extended by the Adviser for additional one-year terms. Absent reimbursements or waivers, performance would have been lower. The Financial Highlights section of this report sets forth expense ratio data for the current reporting period; the expense ratios shown above may differ from the expense ratios in the Financial Highlights section since they are based on different time periods.
| (a) | Assumes conversion of Class B shares into Class A shares after six years. |
| * | SEC Yields are calculated based on SEC guidelines for the 30-day period ended September 30, 2008. |
| ** | Taxable equivalent yields are based on SEC yields and a 35% marginal Federal income tax rate and maximum state taxes where applicable. |
See Historical Performance disclosures on page 5.
| | |
| ALLIANCEBERNSTEIN MUNICIPAL INCOME FUND II • | | 23 |
Historical Performance
FUND EXPENSES
As a shareholder of the Fund, you incur two types of costs: (1) transaction costs, including sales charges (loads) on purchase payments, contingent deferred sales charges on redemptions and (2) ongoing costs, including management fees; distribution (12b-1) fees; and other Fund expenses. This example is intended to help you understand your ongoing costs (in dollars) of investing in the Fund and to compare these costs with the ongoing costs of investing in other mutual funds.
The Example is based on an investment of $1,000 invested at the beginning of the period and held for the entire period as indicated below.
Actual Expenses
The first line of the table below provides information about actual account values and actual expenses. You may use the information in this line, together with the amount you invested, to estimate the expenses that you paid over the period. Simply divide your account value by $1,000 (for example, an $8,600 account value divided by $1,000 = 8.6), then multiply the result by the number in the first line under the heading entitled “Expenses Paid During Period” to estimate the expenses you paid on your account during this period.
Hypothetical Example for Comparison Purposes
The second line of the table below provides information about hypothetical account values and hypothetical expenses based on the Fund’s actual expense ratio and an assumed annual rate of return of 5% before expenses, which is not the Fund’s actual return. The hypothetical account values and expenses may not be used to estimate the actual ending account balance or expenses you paid for the period. You may use this information to compare the ongoing costs of investing in the Fund and other funds by comparing this 5% hypothetical example with the 5% hypothetical examples that appear in the shareholder reports of other funds.
Please note that the expenses shown in the table are meant to highlight your ongoing costs only and do not reflect any transactional costs, such as sales charges (loads), or contingent deferred sales charges on redemptions. Therefore, the second line of the table is useful in comparing ongoing costs only, and will not help you determine the relative total costs of owning different funds. In addition, if these transactional costs were included, your costs would have been higher.
Arizona Portfolio
| | | | | | | | | | | | |
| | | Beginning
Account Value
April 1, 2008 | | Ending
Account Value
September 30, 2008 | | Expenses
Paid During
Period* | | Annualized
Expense
Ratio* | |
| Class A | | | | | | | | | | | | |
Actual | | $ | 1,000 | | $ | 973.77 | | $ | 3.85 | | 0.78 | % |
Hypothetical** | | $ | 1,000 | | $ | 1,021.10 | | $ | 3.94 | | 0.78 | % |
| Class B | | | | | | | | | | | | |
Actual | | $ | 1,000 | | $ | 970.33 | | $ | 7.29 | | 1.48 | % |
Hypothetical** | | $ | 1,000 | | $ | 1,017.60 | | $ | 7.47 | | 1.48 | % |
| Class C | | | | | | | | | | | | |
Actual | | $ | 1,000 | | $ | 970.32 | | $ | 7.29 | | 1.48 | % |
Hypothetical** | | $ | 1,000 | | $ | 1,017.60 | | $ | 7.47 | | 1.48 | % |
| | |
| 24 | | • ALLIANCEBERNSTEIN MUNICIPAL INCOME FUND II |
Fund Expenses
FUND EXPENSES
(continued from previous page)
Florida Portfolio
| | | | | | | | | | | | |
| | | Beginning
Account Value
April 1, 2008 | | Ending
Account Value
September 30, 2008 | | Expenses
Paid During
Period* | | Annualized
Expense
Ratio* | |
| Class A | | | | | | | | | | | | |
Actual | | $ | 1,000 | | $ | 960.97 | | $ | 3.82 | | 0.78 | % |
Hypothetical** | | $ | 1,000 | | $ | 1,021.10 | | $ | 3.94 | | 0.78 | % |
| Class B | | | | | | | | | | | | |
Actual | | $ | 1,000 | | $ | 957.67 | | $ | 7.19 | | 1.47 | % |
Hypothetical** | | $ | 1,000 | | $ | 1,017.65 | | $ | 7.41 | | 1.47 | % |
| Class C | | | | | | | | | | | | |
Actual | | $ | 1,000 | | $ | 957.68 | | $ | 7.24 | | 1.48 | % |
Hypothetical** | | $ | 1,000 | | $ | 1,017.60 | | $ | 7.47 | | 1.48 | % |
Massachusetts Portfolio
| | | | | | | | | | | | |
| | | Beginning
Account Value
April 1, 2008 | | Ending
Account Value
September 30, 2008 | | Expenses
Paid During
Period* | | Annualized
Expense
Ratio* | |
| Class A | | | | | | | | | | | | |
Actual | | $ | 1,000 | | $ | 981.81 | | $ | 4.06 | | 0.82 | % |
Hypothetical** | | $ | 1,000 | | $ | 1,020.90 | | $ | 4.14 | | 0.82 | % |
| Class B | | | | | | | | | | | | |
Actual | | $ | 1,000 | | $ | 978.38 | | $ | 7.52 | | 1.52 | % |
Hypothetical** | | $ | 1,000 | | $ | 1,017.40 | | $ | 7.67 | | 1.52 | % |
| Class C | | | | | | | | | | | | |
Actual | | $ | 1,000 | | $ | 978.38 | | $ | 7.52 | | 1.52 | % |
Hypothetical** | | $ | 1,000 | | $ | 1,017.40 | | $ | 7.67 | | 1.52 | % |
Michigan Portfolio
| | | | | | | | | | | | |
| | | Beginning
Account Value
April 1, 2008 | | Ending
Account Value
September 30, 2008 | | Expenses
Paid During
Period* | | Annualized
Expense
Ratio* | |
| Class A | | | | | | | | | | | | |
Actual | | $ | 1,000 | | $ | 970.28 | | $ | 4.97 | | 1.01 | % |
Hypothetical** | | $ | 1,000 | | $ | 1,019.95 | | $ | 5.10 | | 1.01 | % |
| Class B | | | | | | | | | | | | |
Actual | | $ | 1,000 | | $ | 966.84 | | $ | 8.41 | | 1.71 | % |
Hypothetical** | | $ | 1,000 | | $ | 1,016.45 | | $ | 8.62 | | 1.71 | % |
| Class C | | | | | | | | | | | | |
Actual | | $ | 1,000 | | $ | 966.84 | | $ | 8.41 | | 1.71 | % |
Hypothetical** | | $ | 1,000 | | $ | 1,016.45 | | $ | 8.62 | | 1.71 | % |
| | |
| ALLIANCEBERNSTEIN MUNICIPAL INCOME FUND II • | | 25 |
Fund Expenses
FUND EXPENSES
(continued from previous page)
Minnesota Portfolio
| | | | | | | | | | | | |
| | | Beginning
Account Value
April 1, 2008 | | Ending
Account Value
September 30, 2008 | | Expenses
Paid During
Period* | | Annualized
Expense
Ratio* | |
| Class A | | | | | | | | | | | | |
Actual | | $ | 1,000 | | $ | 975.07 | | $ | 4.44 | | 0.90 | % |
Hypothetical** | | $ | 1,000 | | $ | 1,020.50 | | $ | 4.55 | | 0.90 | % |
| Class B | | | | | | | | | | | | |
Actual | | $ | 1,000 | | $ | 971.68 | | $ | 7.89 | | 1.60 | % |
Hypothetical** | | $ | 1,000 | | $ | 1,017.00 | | $ | 8.07 | | 1.60 | % |
| Class C | | | | | | | | | | | | |
Actual | | $ | 1,000 | | $ | 971.68 | | $ | 7.89 | | 1.60 | % |
Hypothetical** | | $ | 1,000 | | $ | 1,017.00 | | $ | 8.07 | | 1.60 | % |
New Jersey Portfolio
| | | | | | | | | | | | |
| | | Beginning
Account Value
April 1, 2008 | | Ending
Account Value
September 30, 2008 | | Expenses
Paid During
Period* | | Annualized
Expense
Ratio* | |
| Class A | | | | | | | | | | | | |
Actual | | $ | 1,000 | | $ | 978.01 | | $ | 4.30 | | 0.87 | % |
Hypothetical** | | $ | 1,000 | | $ | 1,020.65 | | $ | 4.39 | | 0.87 | % |
| Class B | | | | | | | | | | | | |
Actual | | $ | 1,000 | | $ | 974.60 | | $ | 7.75 | | 1.57 | % |
Hypothetical** | | $ | 1,000 | | $ | 1,017.15 | | $ | 7.92 | | 1.57 | % |
| Class C | | | | | | | | | | | | |
Actual | | $ | 1,000 | | $ | 974.60 | | $ | 7.75 | | 1.57 | % |
Hypothetical** | | $ | 1,000 | | $ | 1,017.15 | | $ | 7.92 | | 1.57 | % |
Ohio Portfolio
| | | | | | | | | | | | |
| | | Beginning
Account Value
April 1, 2008 | | Ending
Account Value
September 30, 2008 | | Expenses
Paid During
Period* | | Annualized
Expense
Ratio* | |
| Class A | | | | | | | | | | | | |
Actual | | $ | 1,000 | | $ | 973.85 | | $ | 4.19 | | 0.85 | % |
Hypothetical** | | $ | 1,000 | | $ | 1,020.75 | | $ | 4.29 | | 0.85 | % |
| Class B | | | | | | | | | | | | |
Actual | | $ | 1,000 | | $ | 970.40 | | $ | 7.64 | | 1.55 | % |
Hypothetical** | | $ | 1,000 | | $ | 1,017.25 | | $ | 7.82 | | 1.55 | % |
| Class C | | | | | | | | | | | | |
Actual | | $ | 1,000 | | $ | 969.45 | | $ | 7.63 | | 1.55 | % |
Hypothetical** | | $ | 1,000 | | $ | 1,017.25 | | $ | 7.82 | | 1.55 | % |
| | |
| 26 | | • ALLIANCEBERNSTEIN MUNICIPAL INCOME FUND II |
Fund Expenses
FUND EXPENSES
(continued from previous page)
Pennsylvania Portfolio
| | | | | | | | | | | | |
| | | Beginning
Account Value
April 1, 2008 | | Ending
Account Value
September 30, 2008 | | Expenses
Paid During
Period* | | Annualized
Expense
Ratio* | |
| Class A | | | | | | | | | | | | |
Actual | | $ | 1,000 | | $ | 969.62 | | $ | 4.68 | | 0.95 | % |
Hypothetical** | | $ | 1,000 | | $ | 1,020.25 | | $ | 4.80 | | 0.95 | % |
| Class B | | | | | | | | | | | | |
Actual | | $ | 1,000 | | $ | 966.22 | | $ | 8.11 | | 1.65 | % |
Hypothetical** | | $ | 1,000 | | $ | 1,016.75 | | $ | 8.32 | | 1.65 | % |
| Class C | | | | | | | | | | | | |
Actual | | $ | 1,000 | | $ | 966.22 | | $ | 8.11 | | 1.65 | % |
Hypothetical** | | $ | 1,000 | | $ | 1,016.75 | | $ | 8.32 | | 1.65 | % |
Virginia Portfolio
| | | | | | | | | | | | |
| | | Beginning
Account Value
April 1, 2008 | | Ending
Account Value
September 30, 2008 | | Expenses
Paid During
Period* | | Annualized
Expense
Ratio* | |
| Class A | | | | | | | | | | | | |
Actual | | $ | 1,000 | | $ | 970.21 | | $ | 3.55 | | 0.72 | % |
Hypothetical** | | $ | 1,000 | | $ | 1,021.40 | | $ | 3.64 | | 0.72 | % |
| Class B | | | | | | | | | | | | |
Actual | | $ | 1,000 | | $ | 966.75 | | $ | 6.98 | | 1.42 | % |
Hypothetical** | | $ | 1,000 | | $ | 1,017.90 | | $ | 7.16 | | 1.42 | % |
| Class C | | | | | | | | | | | | |
Actual | | $ | 1,000 | | $ | 966.72 | | $ | 6.98 | | 1.42 | % |
Hypothetical** | | $ | 1,000 | | $ | 1,017.90 | | $ | 7.16 | | 1.42 | % |
| * | Expenses are equal to each Class’ annualized expense ratio, multiplied by the average account value over the period, multiplied by 183/366 (to reflect the one-half year period). |
| ** | Assumes 5% return before expenses. |
| | |
| ALLIANCEBERNSTEIN MUNICIPAL INCOME FUND II • | | 27 |
Fund Expenses
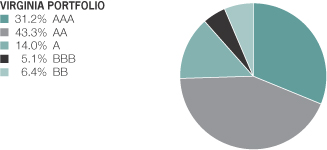
BOND RATING SUMMARY*
September 30, 2008
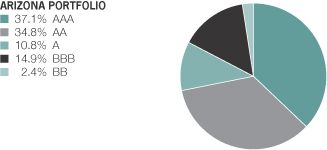
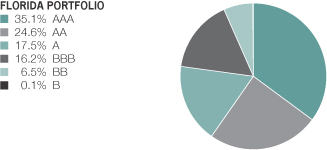

| * | All data are as of September 30, 2008. Each Portfolio’s quality rating distribution is expressed as a percentage of the Portfolio’s total investments rated in particular ratings categories by Standard & Poor’s Rating Services, Moody’s Investors Service, Inc. and Fitch Ratings, Ltd. The distributions may vary over time. If ratings are not available, the Fund’s Adviser will assign ratings that are considered to be of equivalent quality to such ratings. Pre-refunded bonds, which are escrowed by U.S. Government Securities, have been rated AAA by the Adviser. |
| | |
| 28 | | • ALLIANCEBERNSTEIN MUNICIPAL INCOME FUND II |
Bond Rating Summary
BOND RATING SUMMARY*
September 30, 2008
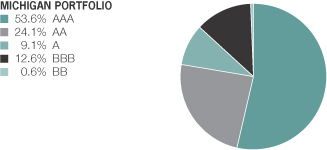

| * | All data are as of September 30, 2008. Each Portfolio’s quality rating distribution is expressed as a percentage of the Portfolio’s total investments rated in particular ratings categories by Standard & Poor’s Rating Services, Moody’s Investors Service, Inc. and Fitch Ratings, Ltd. The distributions may vary over time. If ratings are not available, the Fund’s Adviser will assign ratings that are considered to be of equivalent quality to such ratings. Pre-refunded bonds, which are escrowed by U.S. Government Securities, have been rated AAA by the Adviser. |
| | |
| ALLIANCEBERNSTEIN MUNICIPAL INCOME FUND II • | | 29 |
Bond Rating Summary
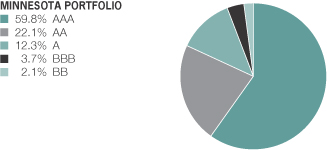
BOND RATING SUMMARY*
September 30, 2008


| * | All data are as of September 30, 2008. Each Portfolio’s quality rating distribution is expressed as a percentage of the Portfolio’s total investments rated in particular ratings categories by Standard & Poor’s Rating Services, Moody’s Investors Service, Inc. and Fitch Ratings, Ltd. The distributions may vary over time. If ratings are not available, the Fund’s Adviser will assign ratings that are considered to be of equivalent quality to such ratings. Pre-refunded bonds, which are escrowed by U.S. Government Securities, have been rated AAA by the Adviser. |
| | |
| 30 | | • ALLIANCEBERNSTEIN MUNICIPAL INCOME FUND II |
Bond Rating Summary
ARIZONA PORTFOLIO
PORTFOLIO OF INVESTMENTS
September 30, 2008
| | | | | | |
| | | Principal
Amount
(000) | | U.S. $ Value |
| |
| | | | | | |
MUNICIPAL OBLIGATIONS – 98.1% | | | | | | |
Long-Term Municipal Bonds – 94.2% | | | | | | |
Arizona – 76.5% | | | | | | |
Arizona Cap Fac Fin Corp Student Hsg Rev
(Arizona St Univ Proj)
Series 00
6.25%, 9/01/32 | | $ | 2,000 | | $ | 1,868,540 |
Arizona COP
FSA Series A
5.00%, 9/01/24 | | | 6,000 | | | 5,623,560 |
Arizona Game & Fish Dept
5.00%, 7/01/26 | | | 1,000 | | | 883,340 |
Arizona HFA SFMR
(Tucson & Pima Proj) AMT
GNMA/FNMA Series 02A
5.50%, 1/01/35(a) | | | 360 | | | 359,968 |
Arizona Hlth Fac Auth
(Blood System Inc.)
Series 04
5.00%, 4/01/19 | | | 750 | | | 732,652 |
Arizona Hlth Fac Auth
(Phoenix Children’s Hosp)
8.96%, 2/01/42(b) | | | 1,150 | | | 1,039,979 |
Arizona Hlth Fac Auth
(Phoenix Children’s Hosp)
(Prerefunded)
Series 02A
6.00%, 2/15/32 | | | 5,700 | | | 6,205,020 |
Arizona Sch Fac Brd
(Prerefunded)
Series 01
5.00%, 7/01/19 | | | 6,730 | | | 7,103,582 |
Arizona St Transp Brd Hwy Rev
5.00%, 7/01/20 | | | 5,000 | | | 5,099,350 |
Series 04B
5.00%, 7/01/24 | | | 4,300 | | | 4,194,435 |
Arizona St Univ COP
(Research Infra Proj)
AMBAC Series 05A
5.00%, 9/01/23 | | | 2,000 | | | 1,906,920 |
Arizona Student Loan Auth
(Student Loan Rev) AMT
Series 99B-1
5.90%, 5/01/24 | | | 1,500 | | | 1,423,395 |
Arizona Tourism & Sports Auth
(Multipurpose Stadium Fac)
MBIA Series 03A
5.00%, 7/01/25 | | | 2,400 | | | 2,248,512 |
| | |
| ALLIANCEBERNSTEIN MUNICIPAL INCOME FUND II • | | 31 |
Arizona Portfolio—Portfolio of Investments
| | | | | | |
| | | Principal
Amount
(000) | | U.S. $ Value |
| |
| | | | | | |
Arizona Wtr Infra Fin Auth
(Wtr Quality)
Series 06A
5.00%, 10/01/24 | | $ | 4,000 | | $ | 3,943,720 |
Estrella Mtn Ranch CFD
(Desert Village)
7.375%, 7/01/27 | | | 1,474 | | | 1,442,324 |
Series 01A
7.875%, 7/01/25 | | | 2,983 | | | 3,009,728 |
Gilbert Wtr Res Muni Ppty Corp.
Series 04
4.90%, 4/01/19 | | | 2,500 | | | 2,311,000 |
Glendale IDA
(John C Lincoln Hlth)
Series 05B
5.25%, 12/01/22 | | | 1,000 | | | 912,100 |
Glendale IDA
(Midwestern Univ)
(Prerefunded)
Series 01A
5.875%, 5/15/31 | | | 3,770 | | | 4,097,462 |
Goodyear CFD
(Palm Valley)
Series 96C
7.25%, 7/01/16 | | | 2,108 | | | 2,095,015 |
Goodyear IDA Wtr & Swr Rev
(Litchfield Pk Svc Proj) AMT
Series 99
5.95%, 10/01/23 | | | 3,160 | | | 2,983,514 |
Greater Arizona Dev Auth Infra Rev
MBIA Series 05A
5.00%, 8/01/21 | | | 1,600 | | | 1,608,160 |
MBIA Series 05B
5.00%, 8/01/25 | | | 4,320 | | | 4,153,291 |
Hassayampa CFD #2
Series 96
7.75%, 7/01/21 | | | 2,265 | | | 2,167,696 |
Hassayampa CFD #2
(Forest Ridge Estates)
Series 00
7.50%, 7/01/24 | | | 645 | | | 654,959 |
Maricopa Cnty SFMR
(Mtg Rev) AMT
GNMA/FNMA/FHLMC Series 00-1C
6.25%, 12/01/30 | | | 5 | | | 5,020 |
GNMA/FNMA/FHLMC Series 01
5.63%, 3/01/33 | | | 485 | | | 483,637 |
| | |
| 32 | | • ALLIANCEBERNSTEIN MUNICIPAL INCOME FUND II |
Arizona Portfolio—Portfolio of Investments
| | | | | | |
| | | Principal
Amount
(000) | | U.S. $ Value |
| |
| | | | | | |
Mesa Cnty IDA
(Discovery Hlth Sys)
(Prerefunded)
MBIA Series 99A
5.75%, 1/01/25 | | $ | 15,000 | | $ | 15,734,700 |
Nogales Muni Dev Auth
AMBAC Series 05
5.00%, 6/01/27 | | | 1,000 | | | 859,490 |
Northern Arizona Univ COP
(Northern Arizona Univ Research Proj)
AMBAC Series 04
5.125%, 9/01/21-9/01/24 | | | 7,140 | | | 7,176,920 |
Phoenix Civic Impr Corp.
(Senior Lien Arpt Rev)
5.00%, 7/01/26 | | | 4,080 | | | 3,751,111 |
Phoenix Civic Impr Corp. Excise Tax Rev
(Civic Plaza Exp Proj)
FGIC Series 05A
5.00%, 7/01/23 | | | 5,500 | | | 5,403,915 |
Phoenix IDA
(Capitol Mall LLC Proj)
AMBAC Series 05
5.00%, 9/15/25 | | | 5,935 | | | 5,769,651 |
Pima Cnty IDA
(Horizon Comnty Learning Ctr)
Series 05
5.125%, 6/01/20 | | | 1,500 | | | 1,373,235 |
Pima Cnty IDA MFHR
(La Hacienda)
(Prerefunded)
GNMA Series 99
7.00%, 12/20/31 | | | 1,290 | | | 1,461,738 |
Pima Cnty IDA SFMR
(Mtg Rev) AMT
GNMA/FNMA Series 99B-1
6.10%, 5/01/31 | | | 65 | | | 65,327 |
Pinal Cnty COP
AMBAC Series 01
5.125%, 6/01/21 | | | 1,000 | | | 987,560 |
Series 04
5.00%, 12/01/24 | | | 3,780 | | | 3,240,670 |
Pinal Cnty IDA Correctional Fac Contract
(Florence West Prison Proj)
ACA Series 06A
5.25%, 10/01/22 | | | 1,400 | | | 1,255,002 |
Queen Creek Impr Dist No 1
5.00%, 1/01/26 | | | 600 | | | 518,616 |
| | |
| ALLIANCEBERNSTEIN MUNICIPAL INCOME FUND II • | | 33 |
Arizona Portfolio—Portfolio of Investments
| | | | | | |
| | | Principal
Amount
(000) | | U.S. $ Value |
| |
| | | | | | |
Salt Verde Fin Corp.
(Prepaid Gas)
5.25%, 12/01/22-12/01/23 | | $ | 1,165 | | $ | 953,823 |
Scottsdale IDA
(Scottsdale Healthcare)
5.00%, 9/01/23 | | | 500 | | | 446,445 |
Show Low Assmt Dist #6
(Torreon)
ACA Series 00
6.00%, 1/01/18 | | | 955 | | | 933,742 |
Show Low IDA
(Navapache Regl Med Ctr)
RADIAN Series 05
5.00%, 12/01/25 | | | 1,415 | | | 1,180,053 |
Stoneridge CFD
Series 01
6.75%, 7/15/26 | | | 1,650 | | | 1,634,622 |
Sundance CFD No 1
Series 02
7.75%, 7/01/22 | | | 1,826 | | | 1,829,177 |
Tax Exempt Muni Infra Trust
Series 04B, Class A
4.05%, 12/01/08(c) | | | 3,310 | | | 3,310,199 |
Tempe Excise Tax Rev
5.00%, 7/01/24 | | | 1,035 | | | 1,009,591 |
Tolleson IDA MFHR
(Copper Cove) AMT
GNMA Series 01A
5.50%, 11/20/41 | | | 5,825 | | | 5,090,118 |
Tucson & Pima IDA SFMR
(Mtg Bkd Sec Prog) AMT
GNMA/FNMA/FHLMC Series 01A-1
6.35%, 1/01/34(a)(d) | | | 535 | | | 535,824 |
Tucson Arpt Auth Rev AMT
AMBAC Series 01
5.35%, 6/01/31 | | | 6,475 | | | 5,580,090 |
Tucson COP
MBIA Series 04A
5.00%, 7/01/23-7/01/24 | | | 6,100 | | | 6,041,187 |
Tucson Hgr Ed
(Univ Arizona)
AMBAC Series 02A
5.00%, 7/15/32 | | | 1,000 | | | 925,690 |
Univ Med Ctr Corp. Hosp Rev
5.00%, 7/01/35 | | | 3,500 | | | 2,796,885 |
Univ of Arizona COP
AMBAC
5.00%, 6/01/12 | | | 3,040 | | | 3,207,048 |
5.25%, 6/01/14-6/01/15 | | | 5,000 | | | 5,311,520 |
| | |
| 34 | | • ALLIANCEBERNSTEIN MUNICIPAL INCOME FUND II |
Arizona Portfolio—Portfolio of Investments
| | | | | | |
| | | Principal
Amount
(000) | | U.S. $ Value |
| |
| | | | | | |
West Campus Hsg LLC Student Hsg Rev
(Arizona St Univ West Campus)
AMBAC Series 05
5.00%, 7/01/30 | | $ | 1,500 | | $ | 1,388,250 |
Yavapai Cnty Hosp Rev
(Regl Med Ctr)
RADIAN Series 03A
5.25%, 8/01/21 | | | 4,000 | | | 3,573,000 |
| | | | | | |
| | | | | | 161,902,078 |
| | | | | | |
California – 1.4% | | | | | | |
California Statewide Comnty Dev Auth
(Enloe Med Ctr)
6.25%, 8/15/28 | | | 2,155 | | | 2,178,511 |
Series A
5.375%, 8/15/20 | | | 740 | | | 733,873 |
| | | | | | |
| | | | | | 2,912,384 |
| | | | | | |
Florida – 1.1% | | | | | | |
Double Branch CDD
(Oakleaf Village)
Series 02A
6.70%, 5/01/34 | | | 970 | | | 955,935 |
Fiddlers Creek CDD
(Prerefunded)
Series 99B
5.80%, 5/01/21 | | | 405 | | | 361,961 |
Highlands Cnty Hlth Fac Auth
(Adventist Hlth Sys/Sunbelt Oblig Group)
MBIA Series 2007D
8.00%, 11/15/37(a)† | | | 1,075 | | | 1,075,000 |
| | | | | | |
| | | | | | 2,392,896 |
| | | | | | |
New Jersey – 1.0% | | | | | | |
New Jersey Ed Fac Auth
(Kean Univ)
FGIC Series 2007E-2
10.00%, 7/01/37(a)† | | | 2,145 | | | 2,145,000 |
| | | | | | |
| | |
Puerto Rico – 13.4% | | | | | | |
Puerto Rico
(Pub Impr)
5.25%, 7/01/23 | | | 575 | | | 519,392 |
(Prerefunded)
FGIC Series 02A
5.00%, 7/01/32 | | | 2,500 | | | 2,662,025 |
Series 01A
5.50%, 7/01/19 | | | 500 | | | 490,820 |
Series 03A
5.25%, 7/01/23 | | | 500 | | | 451,645 |
| | |
| ALLIANCEBERNSTEIN MUNICIPAL INCOME FUND II • | | 35 |
Arizona Portfolio—Portfolio of Investments
| | | | | | |
| | | Principal
Amount
(000) | | U.S. $ Value |
| |
| | | | | | |
Puerto Rico Conv Ctr Dist Auth
(Hotel Occupancy Rev)
AMBAC Series 06A
5.00%, 7/01/18 | | $ | 6,000 | | $ | 5,773,200 |
Puerto Rico Elec Pwr Auth
5.00%, 7/01/20-7/01/22 | | | 6,400 | | | 5,911,674 |
Puerto Rico Govt Dev Bank
(Sr Notes)
Series 06B
5.00%, 12/01/15 | | | 500 | | | 496,110 |
Puerto Rico HFA
(Prerefunded)
5.00%, 12/01/17 | | | 4,870 | | | 5,007,820 |
5.125%, 12/01/27 | | | 385 | | | 344,667 |
Puerto Rico Hwy & Transp Auth
FSA
(Prerefunded)
5.00%, 7/01/32 | | | 3,400 | | | 3,293,440 |
Puerto Rico IFA Hlth Fac
(Ascension Hlth)
Series 00A
6.125%, 11/15/30 | | | 1,500 | | | 1,535,880 |
Univ of Puerto Rico
5.00%, 6/01/18 | | | 1,855 | | | 1,766,721 |
| | | | | | |
| | | | | | 28,253,394 |
| | | | | | |
Texas – 0.8% | | | | | | |
Texas Trpk Auth
AMBAC Series 02A
5.50%, 8/15/39 | | | 1,750 | | | 1,660,435 |
| | | | | | |
Total Long-Term Municipal Bonds
(cost $207,840,748) | | | | | | 199,266,187 |
| | | | | | |
| | | | | | |
Short-Term Municipal Notes – 3.9% | | | | | | |
Alaska – 1.2% | | | | | | |
Valdez Marine Term Rev
(BP Pipelines, Inc. Proj)
Series 03B
4.25%, 7/01/37(e) | | | 2,500 | | | 2,500,000 |
| | | | | | |
| | |
Colorado – 0.3% | | | | | | |
Colorado Ed & Cultural Fac Auth
(Natl Jewish Fed Bd Prog)
4.25%, 9/01/33-7/01/36(e) | | | 600 | | | 600,000 |
| | | | | | |
| | |
Illinois – 1.2% | | | | | | |
Romoeoville Rev
(Lewis Univ)
4.25%, 10/01/36(e) | | | 2,500 | | | 2,500,000 |
| | | | | | |
| | |
| 36 | | • ALLIANCEBERNSTEIN MUNICIPAL INCOME FUND II |
Arizona Portfolio—Portfolio of Investments
| | | | | | |
| | | Principal
Amount
(000) | | U.S. $ Value |
| |
| | | | | | |
Missouri – 0.3% | | | | | | |
Missouri Hlth & Ed Fac Auth
4.25%, 10/01/35(e) | | $ | 500 | | $ | 500,000 |
| | | | | | |
| | |
New York – 0.2% | | | | | | |
New York City Muni Wtr Fin Auth
4.50%, 6/15/32(e) | | | 500 | | | 500,000 |
| | | | | | |
| | |
Pennsylvania – 0.7% | | | | | | |
Langhorne Manor Hgr Ed & Hlth Auth
(Wesley Enhanced Living) RADIAN
Series 2005A
4.35%, 10/01/32(e) | | | 1,500 | | | 1,500,000 |
| | | | | | |
| | |
Total Short-Term Municipal Notes
(cost $8,100,000) | | | | | | 8,100,000 |
| | | | | | |
| | |
Total Investments – 98.1%
(cost $215,940,748) | | | | | | 207,366,187 |
Other assets less liabilities – 1.9% | | | | | | 4,115,783 |
| | | | | | |
| | |
Net Assets – 100.0% | | | | | $ | 211,481,970 |
| | | | | | |
INTEREST RATE SWAP TRANSACTIONS (see Note D)
| | | | | | | | | | | | | | | |
| | | | | | | Rate Type | | | | |
Swap
Counterparty | | Notional
Amount
(000) | | Termination
Date | | Payments
made
by the
Portfolio | | | Payments
received
by the
Portfolio | | | Unrealized
Appreciation/
(Depreciation) | |
Merrill Lynch | | $ | 1,440 | | 2/12/12 | | BMA | * | | 3.5480 | % | | $ | 29,212 | |
Merrill Lynch | | | 1,000 | | 8/09/26 | | 4.0632 | % | | BMA | * | | | (33,627 | ) |
| (a) | Variable rate coupon, rate shown as of September 30, 2008. |
| (b) | Floating Rate Security. Stated interest rate was in effect at September 30, 2008. |
| (c) | Security is exempt from registration under Rule 144A of the Securities Act of 1933. This security is considered liquid and may be resold in transactions exempt from registration, normally to qualified institutional buyers. At September 30, 2008, the market value of this security amounted to $3,310,199 or 1.6% of net assets. |
| (d) | Position, or a portion thereof, has been segregated to collateralize interest rate swaps. |
| (e) | Variable Rate Demand Notes (VRDN) are instruments whose interest rates change on a specific date (such as coupon date or interest payment date) or whose interest rates vary with changes in a designated base rate (such as the prime interest rate). This instrument is payable on demand and is secured by letters of credit or other credit support agreements from major banks. |
| * | Variable interest rate based on the Securities Industry & Financial Markets Association, formerly the Bond Market Association (BMA). |
| | |
| ALLIANCEBERNSTEIN MUNICIPAL INCOME FUND II • | | 37 |
Arizona Portfolio—Portfolio of Investments
| † | An auction rate security whose interest rate resets at each auction date. Auctions are typically held every week or month. The rate shown is as of September 30, 2008 and the aggregate market value of these securities amounted to $3,220,000 or 1.5% of net assets. |
As of September 30, 2008, the Portfolio held 47% of net assets in insured bonds (of this amount 9% represents the Portfolio’s holding in pre-refunded insured bonds). 19% and 15% of the Portfolio’s insured bonds were insured by AMBAC and MBIA, respectively.
Glossary:
ACA – ACA Capital
AMBAC – American Bond Assurance Corporation
AMT – Alternative Minimum Tax (subject to)
CDD – Community Development District
CFD – Community Facilities District
COP – Certificate of Participation
FGIC – Financial Guaranty Insurance Company
FHLMC – Federal Home Loan Mortgage Corporation
FNMA – Federal National Mortgage Association
FSA – Financial Security Assurance Inc.
GNMA – Government National Mortgage Association
HFA – Housing Finance Authority
IDA – Industrial Development Authority/Agency
IFA – Industrial Finance Authority
MBIA – Municipal Bond Investors Assurance
MFHR – Multi-Family Housing Revenue
RADIAN – Radian Group, Inc.
SFMR – Single Family Mortgage Revenue
See notes to financial statements.
| | |
| 38 | | • ALLIANCEBERNSTEIN MUNICIPAL INCOME FUND II |
Arizona Portfolio—Portfolio of Investments
FLORIDA PORTFOLIO
PORTFOLIO OF INVESTMENTS
September 30, 2008
| | | | | | |
| | | Principal
Amount
(000) | | U.S. $ Value |
| |
| | | | | | |
| | | | | | |
MUNICIPAL OBLIGATIONS – 97.7% | | | | | | |
Long-Term Municipal Bonds – 97.7% | | | | | | |
Florida – 49.3% | | | | | | |
Beacon Tradeport CDD
Series 02B
7.25%, 5/01/33 | | $ | 855 | | $ | 825,520 |
Bonnet Creek Resort CDD
Series 02
7.25%, 5/01/18 | | | 2,000 | | | 1,984,900 |
Capital Trust Agy Arpt Fac
(Cargo Acq Grp) AMT
Series 02
6.25%, 1/01/19 | | | 490 | | | 466,813 |
Series 03
5.75%, 1/01/32 | | | 2,000 | | | 1,593,380 |
Concorde Estates CDD
Series 04B
5.00%, 5/01/11 | | | 700 | | | 673,806 |
Crossings at Fleming Island CDD
(Eagle Harbor)
Series 00C
7.10%, 5/01/30 | | | 2,240 | | | 2,198,650 |
Dade Cnty HFA MFHR
(Golden Lakes Apts) AMT
Series 97A
6.00%, 11/01/32 | | | 250 | | | 234,875 |
6.05%, 11/01/39 | | | 750 | | | 700,425 |
Florida HFA MFHR
(Turtle Creek Apts) AMT
AMBAC Series 96C
6.20%, 5/01/36 | | | 3,245 | | | 3,249,543 |
Florida HFC MFHR
(Mystic Pointe II) AMT
GNMA Series 00
6.30%, 12/01/41 | | | 1,165 | | | 1,137,972 |
Florida HFC MFHR
(Sabal Chase Apts) AMT
FSA Series 00
6.00%, 5/01/40 | | | 3,650 | | | 3,458,047 |
Florida HFC MFHR
(Spring Harbor Apts) AMT
Series 99C-1
5.90%, 8/01/39 | | | 2,540 | | | 2,344,217 |
Florida HFC MFHR
(Walker Ave Club) AMT
FSA Series 00L-1
6.00%, 12/01/38 | | | 3,435 | | | 3,288,703 |
| | |
| ALLIANCEBERNSTEIN MUNICIPAL INCOME FUND II • | | 39 |
Florida Portfolio—Portfolio of Investments
| | | | | | |
| | | Principal
Amount
(000) | | U.S. $ Value |
| |
| | | | | | |
Florida HFC MFHR
(Waverly Apts) AMT
FSA Series 00C-1
6.50%, 7/01/40 | | $ | 2,790 | | $ | 2,800,184 |
Gateway CDD
(Sun City Ctr)
Series 03B
5.50%, 5/01/10 | | | 225 | | | 220,680 |
Hamal CDD
(Prerefunded)
Series 01
6.65%, 5/01/21 | | | 1,100 | | | 1,208,174 |
Herons Glen Recreation Dist
(Prerefunded)
Series 99
5.90%, 5/01/19 | | | 2,385 | | | 2,449,800 |
Highlands Cnty Hlth Fac Auth
(Adventist/Sunbelt Hosp)
FSA Series 2005G
10.00%, 11/15/35(a)† | | | 1,700 | | | 1,700,000 |
(Prerefunded)
Series 01A
6.00%, 11/15/31 | | | 2,000 | | | 2,171,700 |
Indian Trace Dev Dist
(Wtr Mgmt Spl Benefit)
MBIA Series 05
5.00%, 5/01/22 | | | 680 | | | 654,221 |
Jacksonville
(Excise Taxes Rev)
AMBAC Series 02B
5.00%, 10/01/26 | | | 3,925 | | | 3,767,529 |
Lee Cnty Arpt
(Southwest Int’l Arpt) AMT
FSA Series 00A
6.00%, 10/01/32 | | | 13,500 | | | 12,889,935 |
Manatee Cnty HFA SFMR
(Mtg Rev) AMT
GNMA Series 99
6.25%, 11/01/28 | | | 270 | | | 270,243 |
Marshall Creek CDD
Series 02A
6.625%, 5/01/32 | | | 900 | | | 896,211 |
Miami Beach Hlth Fac Auth
(Mt Sinai Med Ctr)
Series 01A
6.80%, 11/15/31 | | | 1,600 | | | 1,361,984 |
| | |
| 40 | | • ALLIANCEBERNSTEIN MUNICIPAL INCOME FUND II |
Florida Portfolio—Portfolio of Investments
| | | | | | |
| | | Principal
Amount
(000) | | U.S. $ Value |
| |
| | | | | | |
Miami-Dade Cnty HFA SFMR
(Home Ownship Mtg) AMT
GNMA/FNMA Series 00A-1
6.00%, 10/01/32 | | $ | 710 | | $ | 713,408 |
Miromar Lakes CDD
Series 00A
7.25%, 5/01/12 | | | 2,550 | | | 2,500,505 |
North Broward Hosp Dist
(Prerefunded)
Series 01
6.00%, 1/15/31 | | | 1,700 | | | 1,828,316 |
Northern Palm Beach Cnty Impr Dist
(Mirasol Unit #43)
(Prerefunded)
6.125%, 8/01/31 | | | 1,000 | | | 1,093,830 |
Northern Palm Beach Cnty Impr Dist
(Unit Dev #43)
(Prerefunded)
6.10%, 8/01/21 | | | 585 | | | 627,389 |
Northern Palm Beach Cnty Impr Dist
(Unit Dev 27B)
Series 02
6.40%, 8/01/32 | | | 1,075 | | | 1,004,136 |
Orange Cnty HFA MFHR
(Loma Vista Proj) AMT
Series 99G
5.50%, 3/01/32 | | | 2,000 | | | 1,767,000 |
Orange Cnty Hosp
(Orlando Regl)
(Prerefunded)
Series 02
5.75%, 12/01/32 | | | 1,320 | | | 1,442,034 |
Preserve at Wilderness Lake CDD
Series 02A
7.10%, 5/01/33 | | | 1,425 | | | 1,420,283 |
South Miami Hlth Fac Hosp
(Baptist Hlth)
(Prerefunded)
5.25%, 11/15/33 | | | 2,000 | | | 2,147,640 |
Tallahassee Hosp
(Tallahassee Memorial)
Series 00
6.375%, 12/01/30 | | | 2,750 | | | 2,625,920 |
Tampa Hgr Ed
(Tampa Univ Proj)
RADIAN Series 02
5.625%, 4/01/32 | | | 3,175 | | | 2,850,737 |
| | |
| ALLIANCEBERNSTEIN MUNICIPAL INCOME FUND II • | | 41 |
Florida Portfolio—Portfolio of Investments
| | | | | | |
| | | Principal
Amount
(000) | | U.S. $ Value |
| |
| | | | | | |
Village Ctr CDD
MBIA
5.125%, 10/01/28 | | $ | 1,000 | | $ | 877,510 |
Volusia Cnty Ed Fac Auth
(Embry Riddle Aero Univ)
Series 99A
5.75%, 10/15/29 | | | 2,000 | | | 1,833,560 |
Waterlefe CDD
Series 01
6.95%, 5/01/31 | | | 665 | | | 673,525 |
West Palm Beach Comnty Redev Agy
(Northwood-Pleasant Comnty Redev)
5.00%, 3/01/25-3/01/29 | | | 3,640 | | | 3,115,518 |
| | | | | | |
| | | | | | 79,068,823 |
| | | | | | |
Arizona – 1.6% | | | | | | |
Arizona Hlth Fac Auth
(Phoenix Children’s Hosp)
8.96%, 2/01/42(b) | | | 1,250 | | | 1,130,412 |
Queen Creek Impr Dist No 1
5.00%, 1/01/26 | | | 600 | | | 518,616 |
Salt Verde Fin Corp.
(Prepaid Gas)
5.25%, 12/01/23 | | | 1,125 | | | 916,200 |
| | | | | | |
| | | | | | 2,565,228 |
| | | | | | |
California – 1.5% | | | | | | |
California Statewide Comnty Dev Auth
(Enloe Med Ctr)
5.50%, 8/15/23 | | | 80 | | | 76,931 |
6.25%, 8/15/28 | | | 1,715 | | | 1,733,711 |
Series A
5.375%, 8/15/20 | | | 510 | | | 505,777 |
| | | | | | |
| | | | | | 2,316,419 |
| | | | | | |
Colorado – 0.4% | | | | | | |
Colorado Hlth Fac Auth
(Evangelical Lutheran Proj)
5.25%, 6/01/19-6/01/23 | | | 700 | | | 655,558 |
| | | | | | |
| | |
District Of Columbia – 4.8% | | | | | | |
Dist of Columbia
FSA Series 2007C
5.00%, 6/01/23 | | | 3,205 | | | 3,067,441 |
Washington Conv Ctr Auth
AMBAC
5.00%, 10/01/23 | | | 5,000 | | | 4,695,600 |
| | | | | | |
| | | | | | 7,763,041 |
| | | | | | |
| | |
| 42 | | • ALLIANCEBERNSTEIN MUNICIPAL INCOME FUND II |
Florida Portfolio—Portfolio of Investments
| | | | | | |
| | | Principal
Amount
(000) | | U.S. $ Value |
| |
| | | | | | |
Illinois – 1.3% | | | | | | |
Chicago Incr Alloc
(Diversey/Narragansett Redev Proj)
7.46%, 2/15/26 | | $ | 830 | | $ | 839,412 |
Hampshire Spl Svc Area No 14
5.80%, 3/01/26 | | | 775 | | | 655,999 |
Manhattan
(No 04-1 Brookstone Springs Proj)
Series 05
5.875%, 3/01/28 | | | 700 | | | 603,764 |
| | | | | | |
| | | | | | 2,099,175 |
| | | | | | |
Indiana – 4.0% | | | | | | |
Franklin Township Sch Bldg Corp.
5.00%, 7/15/21-7/15/22 | | | 6,625 | | | 6,415,143 |
| | | | | | |
| | |
Iowa – 0.1% | | | | | | |
Coralville Urban Rev Tax Incr
Series 07C
5.00%, 6/01/18 | | | 100 | | | 98,043 |
| | | | | | |
| | |
Kansas – 0.2% | | | | | | |
Lenexa Hlth Care Fac
(Lakeview Village Inc.)
5.25%, 5/15/22 | | | 390 | | | 341,554 |
| | | | | | |
| | |
Louisiana – 3.0% | | | | | | |
Lafayette
(Communications Sys Rev)
XLCA
5.25%, 11/01/20 | | | 2,215 | | | 2,227,603 |
Louisiana Agriculture Fin Auth
5.25%, 9/15/17 | | | 1,130 | | | 1,076,438 |
New Orleans
RADIAN
5.00%, 12/01/18 | | | 1,550 | | | 1,449,700 |
| | | | | | |
| | | | | | 4,753,741 |
| | | | | | |
Michigan – 1.7% | | | | | | |
Detroit Wtr Sup Sys
FSA Series 2006A
5.00%, 7/01/24 | | | 2,975 | | | 2,731,110 |
| | | | | | |
| | |
Minnesota – 1.7% | | | | | | |
Maple Grove Hlth Care
5.00%, 5/01/22 | | | 1,350 | | | 1,244,403 |
St. Paul Hsg & Redev Auth
(Hltheast Proj)
Series 05 6.00%, 11/15/25 | | | 500 | | | 476,345 |
| | |
| ALLIANCEBERNSTEIN MUNICIPAL INCOME FUND II • | | 43 |
Florida Portfolio—Portfolio of Investments
| | | | | | |
| | | Principal
Amount
(000) | | U.S. $ Value |
| |
| | | | | | |
Western Minnesota Muni Pwr Agy
FSA
5.00%, 1/01/17 | | $ | 900 | | $ | 950,319 |
| | | | | | |
| | | | | | 2,671,067 |
| | | | | | |
Missouri – 2.0% | | | | | | |
Kansas City
(Downtown Arena Proj)
Series 08C
5.00%, 4/01/28 | | | 3,500 | | | 3,065,440 |
Riverside IDA
(Riverside Horizons Proj)
ACA Series 07A
5.00%, 5/01/27 | | | 160 | | | 137,405 |
| | | | | | |
| | | | | | 3,202,845 |
| | | | | | |
Nevada – 1.3% | | | | | | |
Clark Cnty
AMBAC
5.00%, 11/01/23 | | | 2,250 | | | 2,151,923 |
| | | | | | |
| | |
New Jersey – 0.0% | | | | | | |
New Jersey Ed Fac Auth
(Kean Univ)
FGIC Series 07
10.50%, 7/01/37(a)† | | | 40 | | | 40,000 |
| | | | | | |
| | |
New Mexico – 2.3% | | | | | | |
Clayton Jail Proj
CIFG
5.00%, 11/01/26 | | | 4,620 | | | 3,702,468 |
| | | | | | |
| | |
New York – 0.4% | | | | | | |
New York Liberty Dev Corp.
(National Sports Museum Proj)
6.125%, 2/15/19(c) | | | 500 | | | 173,985 |
New York St Dorm Auth
(Orange Regl Med Ctr)
Series 2008
6.50%, 12/01/21 | | | 460 | | | 458,339 |
| | | | | | |
| | | | | | 632,324 |
| | | | | | |
North Dakota – 0.4% | | | | | | |
Ward Cnty Hlth Care Fac
(Trinity Hlth)
5.125%, 7/01/20 | | | 685 | | | 631,666 |
| | | | | | |
| | |
| 44 | | • ALLIANCEBERNSTEIN MUNICIPAL INCOME FUND II |
Florida Portfolio—Portfolio of Investments
| | | | | | |
| | | Principal
Amount
(000) | | U.S. $ Value |
| |
| | | | | | |
Ohio – 1.8% | | | | | | |
Cleveland Cuyahoga Port Auth
(Univ Heights Ohio-Pub Parking Proj)
Series 01
7.35%, 12/01/31 | | $ | 3,000 | | $ | 2,940,780 |
| | | | | | |
| | |
Pennsylvania – 0.7% | | | | | | |
Allegheny Cnty Hosp Dev Auth
(West Pennsylvania Hlth Sys)
Series 07A
5.00%, 11/15/17 | | | 1,300 | | | 1,093,365 |
| | | | | | |
| | |
Puerto Rico – 2.0% | | | | | | |
Puerto Rico
(Pub Impr)
5.25%, 7/01/23 | | | 600 | | | 541,974 |
Series 01A
5.50%, 7/01/19 | | | 500 | | | 490,820 |
Series 04A
5.25%, 7/01/19 | | | 960 | | | 924,009 |
Puerto Rico HFA
5.125%, 12/01/27 | | | 695 | | | 622,192 |
Univ of Puerto Rico
Series 06Q
5.00%, 6/01/19 | | | 730 | | | 688,244 |
| | | | | | |
| | | | | | 3,267,239 |
| | | | | | |
South Carolina – 0.5% | | | | | | |
Scago Ed Fac Corp.
(Calhoun Sch Dist)
RADIAN
5.00%, 12/01/21 | | | 945 | | | 866,395 |
| | | | | | |
| | |
Tennessee – 0.4% | | | | | | |
Sullivan Cnty Hlth Ed
(Wellmont Hlth Sys)
Series 06C
5.00%, 9/01/22 | | | 725 | | | 642,792 |
| | | | | | |
| | |
Texas – 5.9% | | | | | | |
Bexar Cnty Hlth Fac Dev Corp.
5.00%, 7/01/27 | | | 150 | | | 123,966 |
Camino Real Regl Mobility Auth
5.00%, 2/15/22 | | | 1,270 | | | 1,175,423 |
Magnolia Tax ISD
5.00%, 8/15/20 | | | 6,165 | | | 6,212,964 |
North Texas Hlth Fac Dev Corp
(United Regl Hlth Care Sys)
FSA Series 07
5.00%, 9/01/24 | | | 250 | | | 223,842 |
| | |
| ALLIANCEBERNSTEIN MUNICIPAL INCOME FUND II • | | 45 |
Florida Portfolio—Portfolio of Investments
| | | | | | |
| | | Principal
Amount
(000) | | U.S. $ Value |
| |
| | | | | | |
Tyler Tex Hlth Fac Dev Corp.
5.25%, 7/01/26 | | $ | 2,000 | | $ | 1,748,320 |
| | | | | | |
| | | | | | 9,484,515 |
| | | | | | |
Utah – 0.2% | | | | | | |
Spanish Fork City Charter Sch Rev
5.55%, 11/15/21 | | | 370 | | | 330,543 |
| | | | | | |
| | |
Washington – 9.3% | | | | | | |
Energy Northwest Wind
AMBAC
5.00%, 7/01/21 | | | 3,625 | | | 3,481,921 |
King Cnty Sch Dist No 414
(Lake Washington)
MBIA SCH BD GTY
5.00%, 12/01/24 | | | 4,500 | | | 4,280,760 |
Spokane
AMBAC
5.00%, 12/01/22 | | | 2,390 | | | 2,243,159 |
Washington
AMBAC
5.00%, 1/01/24 | | | 5,000 | | | 4,854,250 |
| | | | | | |
| | | | | | 14,860,090 |
| | | | | | |
Wisconsin – 0.9% | | | | | | |
Wisconsin HEFA
(Wheaton Franciscan)
MBIA
5.25%, 8/15/20 | | | 1,600 | | | 1,422,992 |
| | | | | | |
| | |
Total Investments – 97.7%
(cost $167,914,805) | | | | | | 156,748,839 |
Other assets less liabilities – 2.3% | | | | | | 3,735,868 |
| | | | | | |
| | |
Net Assets – 100.0% | | | | | $ | 160,484,707 |
| | | | | | |
INTEREST RATE SWAP TRANSACTIONS (see Note D)
| | | | | | | | | | | | | | |
| | | | | | | Rate Type | | | |
Swap
Counterparty | | Notional
Amount
(000) | | Termination
Date | | Payments
made
by the
Portfolio | | | Payments
received
by the
Portfolio | | | Unrealized
Appreciation/
(Depreciation) |
Merrill Lynch | | $ | 1,540 | | 2/12/12 | | BMA | * | | 3.548 | % | | $ | 31,241 |
Merrill Lynch | | | 5,300 | | 10/21/16 | | BMA | * | | 4.1285 | % | | | 275,920 |
| (a) | Variable rate coupon, rate shown as of September 30, 2008. |
| (b) | Floating Rate Security. Stated interest rate was in effect at September 30, 2008. |
| | |
| 46 | | • ALLIANCEBERNSTEIN MUNICIPAL INCOME FUND II |
Florida Portfolio—Portfolio of Investments
| (c) | Illiquid security, valued at fair value. |
| * | Variable interest rate based on the Securities Industry & Financial Markets Association, formerly the Bond Market Association (BMA). |
| † | An auction rate security whose interest rate resets at each auction date. Auctions are typically held every week or month. The rate shown is as of September 30, 2008 and the aggregate market value of these securities amounted to $1,740,000 or 1.1% of net assets. |
As of September 30, 2008, the Portfolio held 49% of net assets in insured bonds (of this amount 0% represents the Portfolio’s holding in pre-refunded insured bonds). 19% and 19% of the Portfolio’s insured bonds were insured by AMBAC and FSA, respectively.
Glossary:
ACA – ACA Capital
AMBAC – American Bond Assurance Corporation
AMT – Alternative Minimum Tax (subject to)
CDD – Community Development District
CIFG – CIFG Assurance North America, Inc.
FGIC – Financial Guaranty Insurance Company
FNMA – Federal National Mortgage Association
FSA – Financial Security Assurance Inc.
GNMA – Government National Mortgage Association
HEFA – Health & Education Facility Authority
HFA – Housing Finance Authority
HFC – Housing Finance Corporation
IDA – Industrial Development Authority/Agency
ISD – Independent School District
MBIA – Municipal Bond Investors Assurance
MFHR – Multi-Family Housing Revenue
RADIAN – Radian Group, Inc.
SFMR – Single Family Mortgage Revenue
XLCA – XL Capital Assurance Inc.
See notes to financial statements.
| | |
| ALLIANCEBERNSTEIN MUNICIPAL INCOME FUND II • | | 47 |
Florida Portfolio—Portfolio of Investments
MASSACHUSETTS PORTFOLIO
PORTFOLIO OF INVESTMENTS
September 30, 2008
| | | | | | |
| | | Principal
Amount
(000) | | U.S. $ Value |
| |
| | | | | | |
MUNICIPAL OBLIGATIONS – 96.3% | | | | | | |
Long-Term Municipal Bonds – 90.0% | | | | | | |
Massachusetts – 68.3% | | | | | | |
Fall River
FSA
5.00%, 7/15/28 | | $ | 5,085 | | $ | 4,929,297 |
Massachusetts
FSA Series 05A
5.00%, 3/01/17 | | | 5,000 | | | 5,245,500 |
Massachusetts
(Prerefunded)
Series 02C
5.25%, 11/01/30 | | | 3,075 | | | 3,259,746 |
Massachusetts Bay Transp Auth
(Prerefunded)
Series 04A
5.25%, 7/01/21 | | | 2,000 | | | 2,176,260 |
Massachusetts Dev Fin Agy
5.00%, 10/01/26 | | | 1,610 | | | 1,563,503 |
Massachusetts Dev Fin Agy
(Boston Architectural Coll)
ACA
5.00%, 1/01/27 | | | 1,750 | | | 1,404,620 |
Massachusetts Dev Fin Agy
(Brandeis Univ)
5.00%, 10/01/27 | | | 1,690 | | | 1,631,712 |
Massachusetts Dev Fin Agy
(Massachusetts Biomedical)
Series 00C
6.25%, 8/01/20 | | | 3,000 | | | 3,107,310 |
Massachusetts Dev Fin Agy
(Massachusetts Coll of Pharmacy)
(Prerefunded)
Series 99B
6.75%, 7/01/30 | | | 3,350 | | | 3,559,107 |
Massachusetts Dev Fin Agy
(Pharmacy & Allied Hlth)
ASSURED GTY Series 05D
5.00%, 7/01/24 | | | 3,500 | | | 3,351,285 |
Massachusetts Dev Fin Agy
(Suffolk Univ)
(Prerefunded)
Series 99
5.85%, 7/01/29 | | | 1,375 | | | 1,420,636 |
Massachusetts Dev Fin Agy
(Worchester Redev)
(Prerefunded)
RADIAN Series 99
5.25%, 6/01/19 | | | 2,350 | | | 2,417,515 |
| | |
| 48 | | • ALLIANCEBERNSTEIN MUNICIPAL INCOME FUND II |
Massachusetts Portfolio—Portfolio of Investments
| | | | | | |
| | | Principal
Amount
(000) | | U.S. $ Value |
| |
| | | | | | |
Massachusetts Ed Fin Auth
(Ed Loan) AMT
MBIA Series 00G
6.00%, 12/01/16 | | $ | 820 | | $ | 791,849 |
Massachusetts HEFA
5.00%, 7/01/27 | | | 2,000 | | | 1,810,660 |
(Prerefunded)
5.75%, 7/01/32 | | | 3,835 | | | 4,153,420 |
(Prerefunded)
6.00%, 7/01/31 | | | 545 | | | 597,086 |
FGIC
(Prerefunded)
5.00%, 5/15/25 | | | 2,000 | | | 1,723,089 |
Massachusetts HEFA
(Berkshire Hlth Sys)
RADIAN Series 01E
5.70%, 10/01/25 | | | 4,000 | | | 3,664,200 |
Massachusetts HEFA
(Cape Cod Hlthcare)
RADIAN Series 01C
5.25%, 11/15/31 | | | 2,600 | | | 2,151,708 |
Massachusetts HEFA
(Caregroup Hlthcare Sys)
5.375%, 7/01/25 | | | 1,000 | | | 923,660 |
Massachusetts HEFA
(Covenant Hlth Sys)
6.00%, 7/01/31 | | | 1,955 | | | 1,955,645 |
Massachusetts HEFA
(Milford Regl Med Ctr)
5.00%, 7/15/22 | | | 1,220 | | | 1,073,161 |
Massachusetts HEFA
(Partners Healthcare Sys)
5.75%, 7/01/32 | | | 165 | | | 168,318 |
Massachusetts HEFA
(Univ of Massachusetts Proj)
(Prerefunded)
MBIA Series 02C
5.25%, 10/01/31 | | | 6,440 | | | 6,943,866 |
Massachusetts HEFA
(Winchester Hosp)
(Prerefunded)
Series 00E
6.75%, 7/01/30 | | | 4,335 | | | 4,634,245 |
Massachusetts HFA MFHR
(Rental Rev)
AMBAC Series 95E
6.00%, 7/01/41 | | | 4,125 | | | 3,851,554 |
| | |
| ALLIANCEBERNSTEIN MUNICIPAL INCOME FUND II • | | 49 |
Massachusetts Portfolio—Portfolio of Investments
| | | | | | |
| | | Principal
Amount
(000) | | U.S. $ Value |
| |
| | | | | | |
Massachusetts HFA MFHR
(Rental Rev) AMT
MBIA Series 00H
6.65%, 7/01/41 | | $ | 4,670 | | $ | 4,688,353 |
Massachusetts Indl Fin Agy MFHR
(Heights Crossing) AMT
FHA Series 95
6.15%, 2/01/35 | | | 6,000 | | | 5,998,740 |
Massachusetts Port Auth Spec Fac
(US Air Proj) AMT
MBIA Series 96A
5.875%, 9/01/23 | | | 2,000 | | | 1,868,980 |
Massachusetts St Coll Bldg
AMBAC
5.00%, 5/01/23 | | | 2,635 | | | 2,530,786 |
Massachusetts St Sch Bldg Auth
(Dedicated Sales Tax Rev)
MBIA Series 05A
5.00%, 8/15/19 | | | 7,000 | | | 7,191,940 |
Massachusetts St Spl Oblig
(Constr Lane)
FSA Series 05A
5.00%, 6/01/23 | | | 1,500 | | | 1,490,655 |
Massachusetts St Wtr Pollution Abatement
(Prerefunded)
5.00%, 8/01/20-8/01/24 | | | 8,000 | | | 8,443,341 |
Springfield
5.00%, 8/01/19 | | | 3,000 | | | 3,086,250 |
Univ of Massachusetts Bldg Auth
5.00%, 5/01/26-5/01/27 | | | 6,000 | | | 5,668,400 |
| | | | | | |
| | | | | | 109,476,397 |
| | | | | | |
Alabama – 0.9% | | | | | | |
Hlth Care Auth for Baptist Hlth
ASSURED GTY Series B
9.00%, 11/15/37(a)† | | | 1,500 | | | 1,500,000 |
| | | | | | |
| | |
Arizona – 1.5% | | | | | | |
Goodyear IDA
(Litchfield Pk Svc Proj) AMT
Series 01
6.75%, 10/01/31 | | | 1,160 | | | 1,130,954 |
Stoneridge CFD
Series 01
6.75%, 7/15/26 | | | 1,265 | | | 1,253,210 |
| | | | | | |
| | | | | | 2,384,164 |
| | | | | | |
California – 1.5% | | | | | | |
California
Series 03
5.25%, 11/01/25 | | | 1,000 | | | 976,820 |
| | |
| 50 | | • ALLIANCEBERNSTEIN MUNICIPAL INCOME FUND II |
Massachusetts Portfolio—Portfolio of Investments
| | | | | | |
| | | Principal
Amount
(000) | | U.S. $ Value |
| |
| | | | | | |
California Statewide Comnty Dev Auth
(Enloe Med Ctr)
5.50%, 8/15/23 | | $ | 360 | | $ | 346,190 |
6.25%, 8/15/28 | | | 1,055 | | | 1,066,510 |
| | | | | | |
| | | | | | 2,389,520 |
| | | | | | |
Colorado – 0.2% | | | | | | |
Murphy Creek Metro Dist No 3
Series 06
6.00%, 12/01/26 | | | 500 | | | 384,920 |
| | | | | | |
| | |
Florida – 1.6% | | | | | | |
Crossings at Fleming Island CDD
(Eagle Harbor)
Series 00C
7.10%, 5/01/30 | | | 1,750 | | | 1,717,695 |
Highlands Cnty Hlth Fac Auth
(Adventist Hlth Sys/Sunbelt Oblig Group)
MBIA Series 2007D
8.00%, 11/15/37(a)† | | | 800 | | | 800,000 |
| | | | | | |
| | | | | | 2,517,695 |
| | | | | | |
Georgia – 0.3% | | | | | | |
Atlanta
(Tax Alloc Bonds Eastside Proj)
Series 05B
5.60%, 1/01/30 | | | 500 | | | 409,810 |
| | | | | | |
| | |
Illinois – 0.5% | | | | | | |
Bolingbrook
(Bolingbrook-Sales Tax)
6.25%, 1/01/24 | | | 500 | | | 465,570 |
Plano Spl Svc Area No. 3
(Lakewood Springs Proj)
Series 05A
5.95%, 3/01/28 | | | 395 | | | 344,511 |
| | | | | | |
| | | | | | 810,081 |
| | | | | | |
Nevada – 0.6% | | | | | | |
Clark Cnty Impr Dist No. 142
Series 03
6.10%, 8/01/18 | | | 975 | | | 916,568 |
| | | | | | |
| | |
New Jersey – 2.0% | | | | | | |
New Jersey Ed Fac Auth
(Kean Univ)
FGIC Series 07
10.50%, 7/01/37(a)† | | | 1,700 | | | 1,700,000 |
| | |
| ALLIANCEBERNSTEIN MUNICIPAL INCOME FUND II • | | 51 |
Massachusetts Portfolio—Portfolio of Investments
| | | | | | |
| | | Principal
Amount
(000) | | U.S. $ Value |
| |
| | | | | | |
FGIC Series 2007E-2
10.00%, 7/01/37(a)† | | $ | 1,570 | | $ | 1,570,000 |
| | | | | | |
| | | | | | 3,270,000 |
| | | | | | |
Pennsylvania – 0.2% | | | | | | |
Allegheny Cnty Hosp Dev Auth
(West Pennsylvania Hlth Sys)
Series 07A
5.00%, 11/15/17 | | | 350 | | | 294,368 |
| | | | | | |
| | |
Puerto Rico – 12.4% | | | | | | |
Puerto Rico
Series 06A
5.25%, 7/01/22 | | | 500 | | | 456,305 |
Puerto Rico
(Pub Impr)
Series 01A
5.50%, 7/01/19 | | | 500 | | | 490,820 |
Puerto Rico Elec Pwr Auth
5.00%, 7/01/18 | | | 850 | | | 817,088 |
Series 08WW
5.375%, 7/01/23 | | | 2,065 | | | 1,927,368 |
XLCA Series 02-1
(Prerefunded)
5.25%, 7/01/22 | | | 3,200 | | | 3,458,016 |
Puerto Rico Govt Dev Bank
(Sr Notes)
Series 06B
5.00%, 12/01/15 | | | 500 | | | 496,110 |
Puerto Rico HFA
(Prerefunded)
5.00%, 12/01/20 | | | 1,740 | | | 1,745,815 |
5.125%, 12/01/27 | | | 465 | | | 416,287 |
Puerto Rico Hwy & Transp Auth
FGIC Series 03
5.25%, 7/01/14 | | | 4,225 | | | 4,270,545 |
FGIC Series 03G
5.25%, 7/01/14 | | | 4,410 | | | 4,485,499 |
Puerto Rico Muni Fin Agy
Series 05A
5.25%, 8/01/23 | | | 275 | | | 248,339 |
Univ of Puerto Rico
Series 06Q
5.00%, 6/01/19 | | | 1,025 | | | 966,370 |
| | | | | | |
| | | | | | 19,778,562 |
| | | | | | |
Total Long-Term Municipal Bonds
(cost $146,853,956) | | | | | | 144,132,085 |
| | | | | | |
| | |
| 52 | | • ALLIANCEBERNSTEIN MUNICIPAL INCOME FUND II |
Massachusetts Portfolio—Portfolio of Investments
| | | | | | |
| | | Principal
Amount
(000) | | U.S. $ Value |
| |
| | | | | | |
Short-Term Municipal Notes – 6.3% | | | | | | |
Massachusetts – 6.0% | | | | | | |
Massachusetts Dev Fin Agy
(Boston Univ)
4.25%, 10/01/42(b) | | $ | 2,500 | | $ | 2,500,000 |
Massachusetts Dev Fin Agy
(Coll of the Holy Cross)
4.40%, 9/01/37(b) | | | 2,000 | | | 2,000,000 |
Massachusetts HEFA
(Northeastern Univ)
Series 2008
4.40%, 10/01/35(b) | | | 2,650 | | | 2,650,000 |
Massachusetts HEFA
(Stone Hill College)
Series 2008K
4.40%, 7/01/37(b) | | | 1,900 | | | 1,900,000 |
Massachusetts HEFA
(Wellesley Coll)
Series 99G
4.00%, 7/01/39(b) | | | 500 | | | 500,000 |
| | | | | | |
| | | | | | 9,550,000 |
| | | | | | |
Colorado – 0.1% | | | | | | |
Colorado Ed & Cultural Fac Auth
(Natl Jewish Fed Bd Prog)
4.25%, 9/01/33(b) | | | 200 | | | 200,000 |
| | | | | | |
| | |
Ohio – 0.2% | | | | | | |
Allen Cnty Hosp
7.00%, 10/01/31(b) | | | 400 | | | 400,000 |
| | | | | | |
| | |
Total Short-Term Municipal Notes
(cost $10,150,000) | | | | | | 10,150,000 |
| | | | | | |
| | |
Total Municipal Obligations
(cost $157,003,956) | | | | | | 154,282,085 |
| | | | | | |
| | | | | | |
SHORT-TERM INVESTMENTS – 0.3% | | | | | | |
Time Deposit – 0.3% | | | | | | |
The Bank of New York Mellon
1.00%, 10/01/08
(cost $584,000) | | | 584 | | | 584,000 |
| | | | | | |
| | |
Total Investments – 96.6%
(cost $157,587,956) | | | | | | 154,866,085 |
Other assets less liabilities – 3.4% | | | | | | 5,396,201 |
| | | | | | |
| | |
Net Assets – 100.0% | | | | | $ | 160,262,286 |
| | | | | | |
| | |
| ALLIANCEBERNSTEIN MUNICIPAL INCOME FUND II • | | 53 |
Massachusetts Portfolio—Portfolio of Investments
INTEREST RATE SWAP TRANSACTIONS (see Note D)
| | | | | | | | | | | | | | |
| | | | | | | Rate Type | | | |
Swap
Counterparty | | Notional
Amount
(000) | | Termination
Date | | Payments
made
by the
Portfolio | | | Payments
received
by the
Portfolio | | | Unrealized
Appreciation/
(Depreciation) |
Merrill Lynch | | $ | 5,100 | | 10/01/16 | | BMA | * | | 4.1475 | % | | $ | 279,660 |
Citibank | | | 8,000 | | 12/01/17 | | BMA | * | | 3.7920 | % | | | 190,826 |
| (a) | Variable rate coupon, rate shown as of September 30, 2008. |
| (b) | Variable Rate Demand Notes (VRDN) are instruments whose interest rates change on a specific date (such as coupon date or interest payment date) or whose interest rates vary with changes in a designated base rate (such as the prime interest rate). This instrument is payable on demand and is secured by letters of credit or other credit support agreements from major banks. |
| * | Variable interest rate based on the Securities Industry & Financial Markets Association, formerly the Bond Market Association (BMA). |
| † | An auction rate security whose interest rate resets at each auction date. Auctions are typically held every week or month. The rate shown is as of September 30, 2008 and the aggregate market value of these securities amounted to $5,570,000 or 3.5% of net assets. |
As of September 30, 2008, the Portfolio held 47% of net assets in insured bonds (of this amount 8% represents the Portfolio’s holding in pre-refunded insured bonds).
Glossary:
ACA – ACA Capital
AMBAC – American Bond Assurance Corporation
AMT – Alternative Minimum Tax (subject to)
ASSURED GTY – Assured Guaranty
CDD – Community Development District
CFD – Community Facilities District
FGIC – Financial Guaranty Insurance Company
FHA – Federal Housing Administration
FSA – Financial Security Assurance Inc.
HEFA – Health & Education Facility Authority
HFA – Housing Finance Authority
IDA – Industrial Development Authority/Agency
MBIA – Municipal Bond Investors Assurance
MFHR – Multi-Family Housing Revenue
RADIAN – Radian Group, Inc.
XLCA – XL Capital Assurance Inc.
See notes to financial statements.
| | |
| 54 | | • ALLIANCEBERNSTEIN MUNICIPAL INCOME FUND II |
Massachusetts Portfolio—Portfolio of Investments
MICHIGAN PORTFOLIO
PORTFOLIO OF INVESTMENTS
September 30, 2008
| | | | | | |
| | | Principal
Amount
(000) | | U.S. $ Value |
| |
| | | | | | |
MUNICIPAL OBLIGATIONS – 97.2% | | | | | | |
Long-Term Municipal Bonds – 91.1% | | | | | | |
Michigan – 63.1% | | | | | | |
Allen Park Pub Sch Dist
(Prerefunded)
Q-SBLF Series 03
5.00%, 5/01/16-5/01/22 | | $ | 8,630 | | $ | 9,210,540 |
Cedar Springs Pub Sch Dist
(Prerefunded)
Q-SBLF Series 03
5.00%, 5/01/28 | | | 1,835 | | | 1,958,440 |
Detroit
AMBAC Series 04A-1
5.25%, 4/01/22 | | | 1,330 | | | 1,191,135 |
Detroit Sch Brd
(Sch Brd Loan Fund)
(Prerefunded)
FSA Series 01A
5.125%, 5/01/31 | | | 2,900 | | | 3,095,315 |
Detroit Wtr Sup Sys
FSA Series 2006A
5.00%, 7/01/24 | | | 1,885 | | | 1,730,468 |
Detroit Wtr Sup Sys
(Prerefunded)
FGIC Series 01B
5.50%, 7/01/33 | | | 3,550 | | | 3,806,878 |
Dexter Comnty Sch
5.00%, 5/01/25 | | | 4,500 | | | 4,081,050 |
Genesee Cnty
(Wtr Sup Sys)
AMBAC Series 04
5.00%, 11/01/26 | | | 3,000 | | | 2,813,220 |
Kalamazoo Hosp Fin Auth
(Borgess Med Ctr) ETM
FGIC Series 94A
6.725%, 6/01/11(a) | | | 1,660 | | | 1,664,416 |
Kent Hosp Fin Auth
(Metro Hosp Proj)
Series 05A
5.75%, 7/01/25 | | | 210 | | | 182,643 |
Lansing Wtr & Elec Sys
FSA Series 03A
5.00%, 7/01/25 | | | 2,200 | | | 2,172,808 |
Michigan
(Trunk Line Fund)
(Prerefunded)
FSA Series 01A
5.25%, 11/01/30 | | | 4,000 | | | 4,271,120 |
| | |
| ALLIANCEBERNSTEIN MUNICIPAL INCOME FUND II • | | 55 |
Michigan Portfolio—Portfolio of Investments
| | | | | | |
| | | Principal
Amount
(000) | | U.S. $ Value |
| |
| | | | | | |
Michigan HDA MFHR
(Arbor Pointe)
GNMA Series 99
5.40%, 6/20/40 | | $ | 1,810 | | $ | 1,657,308 |
Michigan HDA MFHR
(Danbury Manor) AMT
FNMA Series 02A
5.30%, 6/01/35(b) | | | 2,490 | | | 2,322,896 |
Michigan HDA MFHR
(Rental Rev) AMT
AMBAC Series 97A
6.10%, 10/01/33 | | | 1,795 | | | 1,754,074 |
GNMA Series 02A
5.50%, 10/20/43 | | | 1,950 | | | 1,703,851 |
Michigan Hgr Ed Fac
(Hope Coll)
Series 02A
5.90%, 4/01/32 | | | 3,465 | | | 3,387,523 |
Michigan Hgr Ed Student Loan Auth AMT
AMBAC Series 17G
5.20%, 9/01/20 | | | 3,500 | | | 3,085,215 |
Michigan Hosp Fin Auth
(Chelsea Comnty Hosp Oblig)
5.00%, 5/15/25 | | | 415 | | | 353,410 |
Michigan Hosp Fin Auth
(Crittenton Hosp)
Series 02A
5.625%, 3/01/27 | | | 1,250 | | | 1,217,112 |
Michigan Hosp Fin Auth
(Trinity Hlth)
Series 00A
6.00%, 12/01/27 | | | 1,485 | | | 1,509,592 |
Michigan Strategic Fund Hlth Fac
(Autumn Wood)
GNMA Series 02 A
5.20%, 12/20/22 | | | 3,000 | | | 2,911,770 |
Michigan Strategic Fund Hlth Fac
(Detroit Edison) AMT
XLCA Series 02C
5.45%, 12/15/32 | | | 3,000 | | | 2,376,990 |
Michigan Strategic Fund Hlth Fac
(Holland Home)
Series 98
5.75%, 11/15/28 | | | 1,000 | | | 1,013,210 |
North Muskegon Sch Dist
(Prerefunded)
Q-SBLF Series 03
5.25%, 5/01/28 | | | 1,500 | | | 1,616,685 |
| | |
| 56 | | • ALLIANCEBERNSTEIN MUNICIPAL INCOME FUND II |
Michigan Portfolio—Portfolio of Investments
| | | | | | |
| | | Principal
Amount
(000) | | U.S. $ Value |
| |
| | | | | | |
Olivet Sch Brd Fund
(Prerefunded)
Q-SBLF Series 02
5.125%, 5/01/28 | | $ | 1,065 | | $ | 1,140,658 |
Ovid Elsie Schools Brd Fund
(Prerefunded)
Q-SBLF Series 02
5.00%, 5/01/25 | | | 2,650 | | | 2,825,722 |
Plymouth Ed Ctr Charter Sch Pub Sch
Academy Rev
Series 05
5.125%, 11/01/18 | | | 1,050 | | | 971,481 |
Saginaw Hosp Fin Auth
(Covenant Med Ctr)
Series 00F
6.50%, 7/01/30 | | | 1,770 | | | 1,800,373 |
Southfield Library Bldg Auth
MBIA
5.00%, 5/01/25 | | | 3,340 | | | 3,163,748 |
| | | | | | |
| | | | | | 70,989,651 |
| | | | | | |
California – 1.9% | | | | | | |
California
Series 03
5.25%, 11/01/25 | | | 1,000 | | | 976,820 |
California Hlth Fac Fin Auth
(Sutter Hlth)
Series 00A
6.25%, 8/15/35 | | | 1,100 | | | 1,138,544 |
| | | | | | |
| | | | | | 2,115,364 |
| | | | | | |
District Of Columbia – 0.7% | | | | | | |
Dist of Columbia
(Georgetown Univ)
AMBAC Series B-1
7.00%, 4/01/41(b)† | | | 825 | | | 825,000 |
| | | | | | |
| | |
Florida – 3.8% | | | | | | |
Crossings at Fleming Island CDD
(Eagle Harbor)
Series 00C
7.10%, 5/01/30 | | | 1,835 | | | 1,801,126 |
Double Branch CDD
(Oakleaf Village)
Series 02A
6.70%, 5/01/34 | | | 955 | | | 941,153 |
Gateway CDD
(Sun City Ctr)
Series 03B
5.50%, 5/01/10 | | | 285 | | | 279,528 |
| | |
| ALLIANCEBERNSTEIN MUNICIPAL INCOME FUND II • | | 57 |
Michigan Portfolio—Portfolio of Investments
| | | | | | |
| | | Principal
Amount
(000) | | U.S. $ Value |
| |
| | | | | | |
Highlands Cnty Hlth Fac Auth
(Adventist Hlth Sys/Sunbelt Oblig Group)
MBIA Series 2007D
8.00%, 11/15/37(b)† | | $ | 575 | | $ | 575,000 |
Northern Palm Beach Cnty Impr Dist
(Unit Dev 27B)
Series 02
6.40%, 8/01/32 | | | 740 | | | 691,219 |
| | | | | | |
| | | | | | 4,288,026 |
| | | | | | |
Illinois – 1.0% | | | | | | |
Antioch Village Spl Svc Area
(Clublands Proj)
Series 03
6.625%, 3/01/33 | | | 500 | | | 402,390 |
Antioch Village Spl Svc Area
(Deercrest Proj)
Series 03
6.625%, 3/01/33 | | | 500 | | | 408,910 |
Plano Spl Svc Area No. 3
(Lakewood Springs Proj)
Series 05A
5.95%, 3/01/28 | | | 395 | | | 344,511 |
| | | | | | |
| | | | | | 1,155,811 |
| | | | | | |
New Jersey – 2.7% | | | | | | |
New Jersey Ed Fac Auth
(Kean Univ)
FGIC Series 07
10.50%, 7/01/37(b)† | | | 1,765 | | | 1,765,000 |
FGIC Series 2007E-2
10.00%, 7/01/37(b)† | | | 625 | | | 625,000 |
New Jersey St Ed Fac Auth
(Seton Hall Univ)
CIFG
8.00%, 7/01/19(b)† | | | 600 | | | 600,000 |
| | | | | | |
| | | | | | 2,990,000 |
| | | | | | |
Puerto Rico – 17.9% | | | | | | |
Puerto Rico
Series 06A
5.25%, 7/01/22 | | | 500 | | | 456,305 |
Puerto Rico
(Pub Impr)
Series 01A
5.50%, 7/01/19 | | | 500 | | | 490,820 |
Puerto Rico Elec Pwr Auth
5.00%, 7/01/18 | | | 1,000 | | | 961,280 |
Series 08WW
5.375%, 7/01/23 | | | 1,120 | | | 1,045,352 |
| | |
| 58 | | • ALLIANCEBERNSTEIN MUNICIPAL INCOME FUND II |
Michigan Portfolio—Portfolio of Investments
| | | | | | |
| | | Principal
Amount
(000) | | U.S. $ Value |
| |
| | | | | | |
(Prerefunded)
XLCA Series 02-1
5.25%, 7/01/22 | | $ | 2,500 | | $ | 2,701,575 |
Puerto Rico HFA
(Prerefunded)
5.00%, 12/01/17 | | | 3,160 | | | 3,248,682 |
5.125%, 12/01/27 | | | 145 | | | 129,810 |
Puerto Rico HFC SFMR
(Mtg Rev) AMT
GNMA Series 01B
5.50%, 12/01/23 | | | 1,975 | | | 1,948,890 |
GNMA Series 01C
5.30%, 12/01/28 | | | 1,760 | | | 1,680,184 |
Puerto Rico IFA Hlth Fac
(Ascension Hlth)
Series 00A
6.125%, 11/15/30 | | | 3,000 | | | 3,071,760 |
Puerto Rico Muni Fin Agy
Series 05A
5.25%, 8/01/23 | | | 275 | | | 248,339 |
Puerto Rico Pub Fin Corp.
(Comwlth Appropriation Bonds)
(Prerefunded)
MBIA Series 01A
5.00%, 8/01/31 | | | 2,875 | | | 3,023,264 |
Univ of Puerto Rico
Series 06Q
5.00%, 6/01/19 | | | 1,145 | | | 1,079,506 |
| | | | | | |
| | | | | | 20,085,767 |
| | | | | | |
Total Long-Term Municipal Bonds
(cost $104,771,065) | | | | | | 102,449,619 |
| | | | | | |
| | | | | | |
Short-Term Municipal Notes – 6.1% | | | | | | |
Michigan – 4.4% | | | | | | |
Michigan University Revs
(Med Svc Plan)
Series 98A-1
4.50%, 12/01/21(c) | | | 400 | | | 400,000 |
Southfield Econ Dev Corp.
(Lawrence Tech Univ Proj)
7.95%, 10/01/31-2/01/35(c) | | | 3,535 | | | 3,535,000 |
Univ of Michigan
6.50%, 4/01/32(c) | | | 400 | | | 400,000 |
7.75%, 4/01/35(c) | | | 600 | | | 600,000 |
| | | | | | |
| | | | | | 4,935,000 |
| | | | | | |
| | |
| ALLIANCEBERNSTEIN MUNICIPAL INCOME FUND II • | | 59 |
Michigan Portfolio—Portfolio of Investments
| | | | | | |
| | | Principal
Amount
(000) | | U.S. $ Value |
| |
| | | | | | |
Alaska – 0.5% | | | | | | |
Valdez Marine Term
(BP Pipelines, Inc. Proj)
Series 03C
4.25%, 7/01/37(c) | | $ | 500 | | $ | 500,000 |
| | | | | | |
| | |
Florida – 0.4% | | | | | | |
Polk Cnty IDA
(Winter Haven Hosp Proj)
RADIAN
5.50%, 9/01/36(c) | | | 500 | | | 500,000 |
| | | | | | |
| | |
Kentucky – 0.8% | | | | | | |
Shelby Cnty
4.25%, 9/01/34(c) | | | 900 | | | 900,000 |
| | | | | | |
| | |
Total Short-Term Municipal Notes
(cost $6,835,000) | | | | | | 6,835,000 |
| | | | | | |
| | |
Total Investments – 97.2%
(cost $111,606,065) | | | | | | 109,284,619 |
Other assets less liabilities – 2.8% | | | | | | 3,181,080 |
| | | | | | |
| | |
Net Assets – 100.0% | | | | | $ | 112,465,699 |
| | | | | | |
INTEREST RATE SWAP TRANSACTIONS (see Note D)
| | | | | | | | | | | | | | |
| | | | | | | Rate Type | | | |
Swap
Counterparty | | Notional
Amount
(000) | | Termination
Date | | Payments
made
by the
Portfolio | | | Payments
received
by the
Portfolio | | | Unrealized
Appreciation/
(Depreciation) |
Merrill Lynch | | $ | 6,200 | | 10/01/16 | | BMA | * | | 4.1475 | % | | $ | 339,980 |
| (a) | Inverse Floater Security – Security with variable or floating interest rate that moves in the opposite direction of short-term interest rates. |
| (b) | Variable rate coupon, rate shown as of September 30, 2008. |
| (c) | Variable Rate Demand Notes (VRDN) are instruments whose interest rates change on a specific date (such as coupon date or interest payment date) or whose interest rates vary with changes in a designated base rate (such as the prime interest rate). This instrument is payable on demand and is secured by letters of credit or other credit support agreements from major banks. |
| * | Variable interest rate based on the Securities Industry & Financial Markets Association, formerly the Bond Market Association (BMA). |
| † | An auction rate security whose interest rate resets at each auction date. Auctions are typically held every week or month. The rate shown is as of September 30, 2008 and the aggregate market value of these securities amounted to $4,390,000 or 3.9% of net assets. |
| | |
| 60 | | • ALLIANCEBERNSTEIN MUNICIPAL INCOME FUND II |
Michigan Portfolio—Portfolio of Investments
As of September 30, 2008, the Portfolio held 41% of net assets in insured bonds (of this amount 15% represents the Portfolio’s holding in pre-refunded insured bonds).
Glossary:
AMBAC – American Bond Assurance Corporation
AMT – Alternative Minimum Tax (subject to)
CDD – Community Development District
CIFG – CIFG Assurance North America, Inc.
ETM – Escrow to Maturity
FGIC – Financial Guaranty Insurance Company
FNMA – Federal National Mortgage Association
FSA – Financial Security Assurance Inc.
GNMA – Government National Mortgage Association
HDA – Housing Development Authority
HFA – Housing Finance Authority
HFC – Housing Finance Corporation
IDA – Industrial Development Authority/Agency
IFA – Industrial Finance Authority
MBIA – Municipal Bond Investors Assurance
MFHR – Multi-Family Housing Revenue
Q-SBLF – Qualified School Bond Loan Fund
RADIAN – Radian Group, Inc.
SFMR – Single Family Mortgage Revenue
XLCA – XL Capital Assurance Inc.
See notes to financial statements.
| | |
| ALLIANCEBERNSTEIN MUNICIPAL INCOME FUND II • | | 61 |
Michigan Portfolio—Portfolio of Investments
MINNESOTA PORTFOLIO
PORTFOLIO OF INVESTMENTS
September 30, 2008
| | | | | | |
| | | Principal
Amount
(000) | | U.S. $ Value |
| |
| | | | | | |
MUNICIPAL OBLIGATIONS – 98.9% | | | | | | |
Long-Term Municipal Bonds – 96.8% | | | | | | |
Minnesota – 96.8% | | | | | | |
Bemidji Hlth Fac
(North Cnty Hlth Svc)
RADIAN Series 02
5.00%, 9/01/31 | | $ | 1,500 | | $ | 1,307,940 |
Brooklyn Park MFHR
(Brooks Landing) AMT
FNMA Series 99A
5.50%, 7/01/19 | | | 1,355 | | | 1,334,594 |
Cass Lake Sch Dist
FGIC
5.00%, 2/01/26 | | | 1,760 | | | 1,719,995 |
Chaska Elec
(Generating Fac)
Series 05A
5.25%, 10/01/25 | | | 1,000 | | | 952,200 |
Farmington ISD No 192
FSA Series 05B
5.00%, 2/01/24 | | | 3,875 | | | 3,833,848 |
Golden Valley Hlth Fac
(Covenant Ret Comnty)
Series 99A
5.50%, 12/01/29 | | | 1,000 | | | 844,310 |
Hennepin Cnty
(Sales Tax)
5.00%, 12/15/23 | | | 3,475 | | | 3,405,917 |
Maple Grove Hlth Care
5.00%, 5/01/22 | | | 650 | | | 599,157 |
Metro Council
(St. Paul Metro Area)
5.00%, 3/01/22 | | | 5,000 | | | 5,012,050 |
Minneapolis & St. Paul Arpt
MBIA Series 03A
5.00%, 1/01/28 | | | 1,500 | | | 1,352,820 |
Minneapolis & St. Paul Arpt AMT
FGIC Series 00B
6.00%, 1/01/21 | | | 3,455 | | | 3,425,114 |
Minneapolis
(Pkg Assmt)
MBIA Series 02
5.25%, 12/01/26 | | | 2,000 | | | 2,018,440 |
Minneapolis Common Bond Fund
(Prerefunded)
Series 01G-3
5.45%, 12/01/31 | | | 1,500 | | | 1,606,230 |
| | |
| 62 | | • ALLIANCEBERNSTEIN MUNICIPAL INCOME FUND II |
Minnesota Portfolio—Portfolio of Investments
| | | | | | |
| | | Principal
Amount
(000) | | U.S. $ Value |
| |
| | | | | | |
Minneapolis Hlth Care Sys
(Allina Hlth Sys)
(Prerefunded)
Series 02A
5.75%, 11/15/32 | | $ | 1,500 | | $ | 1,643,340 |
Minneapolis Hlth Care Sys
(Fairview Hlth Svc)
AMBAC Series 05D
5.00%, 11/15/30 | | | 1,000 | | | 846,920 |
Minneapolis MFHR
(Bottineau Commons Proj) AMT
GNMA Series 02
5.45%, 4/20/43 | | | 2,000 | | | 1,733,760 |
Minneapolis MFHR
(Sumner Field) AMT
GNMA Series 02
5.60%, 11/20/43 | | | 2,505 | | | 2,228,548 |
Minnesota
5.00%, 6/01/21 | | | 3,000 | | | 3,041,130 |
Minnesota Agriculture & Econ Dev Hlth
Fac
(Benedictine Hlth Sys)
(Prerefunded)
MBIA Series 99
5.125%, 2/15/29 | | | 4,000 | | | 4,174,880 |
Minnesota Agriculture & Econ Dev Hlth
Fac
(Evangelical Lutheran Proj)
Series 02
6.00%, 2/01/22-2/01/27 | | | 2,880 | | | 2,894,332 |
Minnesota Agriculture & Econ Dev Hlth
Fac
(Prerefunded-Hlth Care Sys)
Series 00A
6.375%, 11/15/29 | | | 1,700 | | | 1,844,058 |
Minnesota Agriculture & Econ Dev Hlth
Fac
(Small Business Loan Proj) AMT
Series 00C
7.25%, 8/01/20 | | | 1,000 | | | 1,012,260 |
Series 00D
7.25%, 8/01/20 | | | 950 | | | 961,647 |
Minnesota Hgr Ed Fac Auth
(Coll Art & Design)
(Prerefunded)
Series 00-5D
6.75%, 5/01/26 | | | 1,000 | | | 1,065,000 |
| | |
| ALLIANCEBERNSTEIN MUNICIPAL INCOME FUND II • | | 63 |
Minnesota Portfolio—Portfolio of Investments
| | | | | | |
| | | Principal
Amount
(000) | | U.S. $ Value |
| |
| | | | | | |
Minnesota Hgr Ed Fac Auth
(Hamline Univ)
Series 99-5B
6.00%, 10/01/29 | | $ | 1,250 | | $ | 1,250,350 |
Minnesota Hgr Ed Fac Auth
(St Catherine Coll)
5.375%, 10/01/32 | | | 1,000 | | | 901,400 |
Minnesota Hgr Ed Fac Auth
(Univ St Thomas)
Series 04-5
5.00%, 10/01/24 | | | 1,000 | | | 924,560 |
5.25%, 10/01/34 | | | 1,000 | | | 941,950 |
Minnesota Hsg Fin Agy SFMR AMT
Series 96F
6.30%, 1/01/28 | | | 505 | | | 505,035 |
Series 96G
6.25%, 7/01/26 | | | 820 | | | 819,820 |
Series 98H
6.05%, 7/01/31 | | | 1,590 | | | 1,525,446 |
Minnesota Muni Pwr Agy Elec
5.25%, 10/01/21 | | | 3,000 | | | 2,969,370 |
Series 04A
5.25%, 10/01/24 | | | 500 | | | 480,645 |
Minnetonka MFHR
(Archer Heights Apts Proj) AMT
GNMA Series 99A
5.30%, 1/20/27 | | | 1,620 | | | 1,505,920 |
North St Paul Maplewood ISD No. 622
FSA
5.00%, 8/01/20 | | | 3,425 | | | 3,502,028 |
Prior Lake ISD No. 719
(Sch Bldg)
FSA Series 05B
5.00%, 2/01/23 | | | 3,350 | | | 3,329,464 |
Shakopee Hlth Care Fac
(St Francis Regl Med Ctr)
Series 04
5.10%, 9/01/25 | | | 600 | | | 524,016 |
Shoreview MFHR
(Lexington Shores Proj) AMT
GNMA Series 01A
5.55%, 8/20/42 | | | 1,445 | | | 1,270,617 |
St. Cloud Hosp
(Saint Cloud Hosp)
FSA Series 00A
5.875%, 5/01/30 | | | 3,750 | | | 3,729,375 |
| | |
| 64 | | • ALLIANCEBERNSTEIN MUNICIPAL INCOME FUND II |
Minnesota Portfolio—Portfolio of Investments
| | | | | | |
| | | Principal
Amount
(000) | | U.S. $ Value |
| |
| | | | | | |
St. Paul Hsg & Redev Auth
(Hltheast Proj)
Series 05
6.00%, 11/15/25 | | $ | 500 | | $ | 476,345 |
St. Paul Pkg Auth
(Block 19 Ramp)
FSA Series 02A
5.35%, 8/01/29 | | | 3,075 | | | 3,088,684 |
St. Paul Port Auth
(Lease Rev)
Series 02
5.25%, 12/01/27 | | | 1,725 | | | 1,710,475 |
St. Paul Port Auth
(Lease Rev)
(Cedar St. Office Bldg)
Series 03
5.00%, 12/01/23 | | | 1,000 | | | 976,060 |
St. Paul Recreational Fac
(Highland National Proj)
5.00%, 10/01/20 | | | 2,750 | | | 2,758,283 |
Waconia Hlth Care Fac
(Ridgeview Med Ctr)
(Prerefunded)
RADIAN Series 99A
6.125%, 1/01/29 | | | 3,415 | | | 3,562,596 |
Western Minnesota Muni Pwr Agy
FSA
5.00%, 1/01/17 | | | 700 | | | 739,137 |
MBIA Series 03A
5.00%, 1/01/26-1/01/30 | | | 3,100 | | | 2,821,512 |
White Bear Lake MFHR
(Renova Partners Proj) AMT
FNMA Series 01
5.60%, 10/01/30 | | | 1,000 | | | 914,300 |
Willmar Hosp
(Rice Mem Hosp Proj)
FSA Series 02
5.00%, 2/01/32 | | | 2,000 | | | 1,909,760 |
| | | | | | |
Total Long-Term Municipal Bonds
(cost $94,687,381) | | | | | | 91,995,638 |
| | | | | | |
| | |
| Short-Term Municipal Notes – 2.1% | | | | | | |
Minnesota – 2.1% | | | | | | |
Cohasset
(Minnesota Pwr & Light Proj)
Series 97B
7.25%, 6/01/13(a) | | | 500 | | | 500,000 |
| | |
| ALLIANCEBERNSTEIN MUNICIPAL INCOME FUND II • | | 65 |
Minnesota Portfolio—Portfolio of Investments
| | | | | | |
| | | Principal
Amount
(000) | | U.S. $ Value |
| |
| | | | | | |
Minnesota Hgr Ed Fac Auth
(Carleton Coll)
Series 05D
6.50%, 4/01/35(a) | | $ | 1,000 | | $ | 1,000,000 |
Univ of Minnesota
7.75%, 12/01/36(a) | | | 500 | | | 500,000 |
| | | | | | |
Total Short-Term Municipal Notes
(cost $2,000,000) | | | | | | 2,000,000 |
| | | | | | |
| | |
Total Investments – 98.9%
(cost $96,687,381) | | | | | | 93,995,638 |
Other assets less liabilities – 1.1% | | | | | | 1,065,409 |
| | | | | | |
| | |
Net Assets – 100.0% | | | | | $ | 95,061,047 |
| | | | | | |
INTEREST RATE SWAP TRANSACTIONS (see Note D)
| | | | | | | | | | | | | | |
| | | Rate Type | | | |
Swap
Counterparty | | Notional
Amount
(000) | | Termination
Date | | Payments
made
by the
Portfolio | | | Payments
received
by the
Portfolio | | | Unrealized
Appreciation/
(Depreciation) |
Merrill Lynch | | $ | 3,500 | | 8/01/16 | | BMA | * | | 4.0710 | % | | $ | 166,334 |
| (a) | Variable Rate Demand Notes (VRDN) are instruments whose interest rates change on a specific date (such as coupon date or interest payment date) or whose interest rates vary with changes in a designated base rate (such as the prime interest rate). This instrument is payable on demand and is secured by letters of credit or other credit support agreements from major banks. |
| * | Variable interest rate based on the Securities Industry & Financial Markets Association, formerly the Bond Market Association (BMA). |
As of September 30, 2008, the Portfolio held 44% of net assets in insured bonds (of this amount 8% represents the Portfolio’s holding in pre-refunded insured bonds). 21% of the Portfolio’s insured bonds were insured by FSA.
Glossary:
AMBAC – American Bond Assurance Corporation
AMT – Alternative Minimum Tax (subject to)
FGIC – Financial Guaranty Insurance Company
FNMA – Federal National Mortgage Association
FSA – Financial Security Assurance Inc.
GNMA – Government National Mortgage Association
ISD – Independent School District
MBIA – Municipal Bond Investors Assurance
MFHR – Multi-Family Housing Revenue
RADIAN – Radian Group, Inc.
SFMR – Single Family Mortgage Revenue
See notes to financial statements.
| | |
| 66 | | • ALLIANCEBERNSTEIN MUNICIPAL INCOME FUND II |
Minnesota Portfolio—Portfolio of Investments
NEW JERSEY PORTFOLIO
PORTFOLIO OF INVESTMENTS
September 30, 2008
| | | | | | |
| | | Principal
Amount
(000) | | U.S. $ Value |
| |
| | | | | | |
MUNICIPAL OBLIGATIONS –97.0% | | | | | | |
Long-Term Municipal Bonds – 93.2% | | | | | | |
New Jersey – 76.7% | | | | | | |
Bergen Cnty Impr Auth
(Bergen Cnty Util)
5.00%, 12/15/17 | | $ | 3,755 | | $ | 4,020,516 |
Bergen Cnty Impr Auth
(Wyckoff Twp Brd Ed Proj)
Series 05
5.00%, 4/01/25 | | | 1,555 | | | 1,546,354 |
Hoboken Parking Auth
(Prerefunded)
AMBAC Series 01A
5.30%, 5/01/27 | | | 3,700 | | | 3,994,409 |
Lafayette Yard Comnty Dev Corp
(Conv Ctr Hotel Proj)
(Prerefunded)
MBIA Series 00
5.80%, 4/01/35 | | | 2,100 | | | 2,220,624 |
Landis Swr Auth FGIC
Series 93
7.604%, 9/19/19(a) | | | 2,950 | | | 3,343,766 |
Middlesex Cnty Impr Auth
FNMA Series 01
5.25%, 7/01/21 | | | 750 | | | 710,400 |
Morris-Union Jointure Comnty COP
RADIAN Series 04
5.00%, 5/01/24 | | | 2,200 | | | 1,897,984 |
New Jersey Ed Fac Auth
(Hgr Ed Cap Impr)
(Prerefunded)
AMBAC Series 02A
5.125%, 9/01/22 | | | 2,500 | | | 2,675,525 |
New Jersey Ed Fac Auth
(Kean Univ) FGIC Series 07
10.50%, 7/01/37(b)† | | | 1,820 | | | 1,820,000 |
FGIC Series 2007E-2
10.00%, 7/01/37(b)† | | | 1,665 | | | 1,665,000 |
New Jersey Ed Fac Auth
(Ramapo Coll of New Jersey)
(Prerefunded)
AMBAC Series 01D
5.00%, 7/01/31 | | | 1,000 | | | 1,054,160 |
(Prerefunded)
FGIC Series 04E
5.00%, 7/01/28 | | | 1,000 | | | 1,067,200 |
| | |
| ALLIANCEBERNSTEIN MUNICIPAL INCOME FUND II • | | 67 |
New Jersey Portfolio—Portfolio of Investments
| | | | | | |
| | | Principal
Amount
(000) | | U.S. $ Value |
| |
| | | | | | |
New Jersey EDA
(American Wtr Co.) AMT
FGIC
6.875%, 11/01/34 | | $ | 5,000 | | $ | 5,007,400 |
New Jersey EDA
(Hackensack Wtr Co.) AMT
MBIA Series 94B
5.90%, 3/01/24 | | | 4,000 | | | 3,839,600 |
New Jersey EDA
(Kapkowski Rd)
Series 98B
6.50%, 4/01/28 | | | 4,500 | | | 4,427,280 |
New Jersey EDA
(Liberty St Park Proj)
Series A
5.00%, 3/01/24 | | | 1,500 | | | 1,473,075 |
New Jersey EDA
(Masonic Charity Fndtn Proj)
Series 01
5.50%, 6/01/31 | | | 1,000 | | | 950,270 |
Series 02
5.25%, 6/01/24 | | | 540 | | | 501,266 |
New Jersey EDA
(New Jersey St Contract)
FSA
5.00%, 9/01/22 | | | 3,540 | | | 3,532,814 |
Series 05
5.25%, 3/01/25 | | | 3,300 | | | 3,281,883 |
New Jersey EDA
(NUI Corp.) AMT
ACA Series 98A
5.25%, 11/01/33 | | | 2,200 | | | 1,748,098 |
New Jersey EDA
(Pub Svc Elec & Gas) AMT
MBIA Series 94A
6.40%, 5/01/32 | | | 5,000 | | | 4,927,900 |
New Jersey EDA
(New Jersey St Contract)
(Prerefunded)
Series 04-I
5.25%, 9/01/24 | | | 2,510 | | | 2,723,099 |
New Jersey Hgr Ed
(Student Loan) AMT
MBIA Series 00A
6.15%, 6/01/19 | | | 705 | | | 670,293 |
New Jersey Hlth Care Fac
(AHS Hosp Corp. Issue)
Series 08
5.125%, 7/01/22 | | | 1,000 | | | 949,390 |
| | |
| 68 | | • ALLIANCEBERNSTEIN MUNICIPAL INCOME FUND II |
New Jersey Portfolio—Portfolio of Investments
| | | | | | |
| | | Principal
Amount
(000) | | U.S. $ Value |
| |
| | | | | | |
New Jersey Hlth Care Fac
(Atlantic City Med)
5.75%, 7/01/25 | | $ | 975 | | $ | 980,431 |
New Jersey Hlth Care Fac
(Atlantic City Med)
(Prerefunded)
5.75%, 7/01/25 | | | 900 | | | 973,719 |
New Jersey Hlth Care Fac
(Bayshore Comnty Hosp)
RADIAN Series 02
5.125%, 7/01/32 | | | 9,250 | | | 7,703,030 |
New Jersey Hlth Care Fac
(Good Shepard)
RADIAN Series 01A
5.20%, 7/01/31 | | | 1,350 | | | 1,138,657 |
New Jersey Hlth Care Fac
(Kennedy Hlth Sys)
Series 01
5.625%, 7/01/31 | | | 2,700 | | | 2,600,883 |
New Jersey Hlth Care Fac
(Newton Mem Hosp)
FSA Series 01
5.00%, 7/01/26 | | | 1,500 | | | 1,423,155 |
New Jersey Hlth Care Fac
(Palisades Med Ctr)
ACA Series 99
5.25%, 7/01/28 | | | 1,000 | | | 804,130 |
New Jersey Hlth Care Fac
(Southern Ocean Cnty Hosp)
RADIAN Series 01
5.125%, 7/01/31 | | | 4,500 | | | 3,756,870 |
New Jersey Hlth Care Fac
(Wood Johnson)
Series 00
5.75%, 7/01/31 | | | 3,350 | | | 3,364,539 |
New Jersey Hlth Care Fac Fin Auth
(St Clare’s Hosp Inc.)
RADIAN Series 04A
5.25%, 7/01/23 | | | 2,085 | | | 2,095,467 |
New Jersey Hsg & Mtg Fin Agy MFHR
(Rental Hsg) AMT
FSA Series 00A1
6.35%, 11/01/31 | | | 2,000 | | | 2,000,380 |
New Jersey St Ed Fac Auth
(Princeton Univ)
5.00%, 7/01/23 | | | 3,480 | | | 3,496,602 |
| | |
| ALLIANCEBERNSTEIN MUNICIPAL INCOME FUND II • | | 69 |
New Jersey Portfolio—Portfolio of Investments
| | | | | | |
| | | Principal
Amount
(000) | | U.S. $ Value |
| |
| | | | | | |
New Jersey St Ed Fac Auth
(Richard Stockton Coll)
5.50%, 7/01/23 | | $ | 3,500 | | $ | 3,437,315 |
New Jersey St Transp Auth
FGIC Series 06A
5.00%, 6/15/18 | | | 3,400 | | | 3,449,674 |
New Jersey St Transp Auth
(Transp Sys)
(Prerefunded)
Series 03C
5.50%, 6/15/24 | | | 3,750 | | | 4,097,737 |
Newark Hsg Auth
(Newark Marine Terminal)
(Prerefunded)
MBIA Series 04
5.25%, 1/01/21-1/01/22 | | | 3,580 | | | 3,865,147 |
North Hudson Swr Auth
MBIA Series 01A
Zero Coupon, 8/01/24 | | | 12,340 | | | 4,863,441 |
Port Auth NY & NJ
(126th)
FGIC Series 02
5.25%, 5/15/37 | | | 2,500 | | | 2,149,025 |
Port Auth NY & NJ
(JFK Int’l Arpt Proj) AMT
MBIA Series 97-6
5.75%, 12/01/22 | | | 7,675 | | | 7,622,963 |
Salem Cnty PCR
(PSE&G Pwr) AMT
Series 01A
5.75%, 4/01/31 | | | 1,500 | | | 1,277,055 |
South Jersey Port Corp.
(Marine Terminal) AMT
5.20%, 1/01/23 | | | 1,000 | | | 882,940 |
Union Cnty Impr Auth
MBIA Series 03A
5.25%, 8/15/23 | | | 2,885 | | | 2,895,848 |
| | | | | | |
| | | | | | 124,927,314 |
| | | | | | |
Alabama – 1.0% | | | | | | |
Hlth Care Auth for Baptist Hlth
ASSURED GTY Series B
9.00%, 11/15/37(b)† | | | 1,575 | | | 1,575,000 |
| | | | | | |
| | |
California – 1.6% | | | | | | |
California
Series 03
5.25%, 11/01/25 | | | 1,000 | | | 976,820 |
| | |
| 70 | | • ALLIANCEBERNSTEIN MUNICIPAL INCOME FUND II |
New Jersey Portfolio—Portfolio of Investments
| | | | | | |
| | | Principal
Amount
(000) | | U.S. $ Value |
| |
| | | | | | |
California Statewide Comnty Dev Auth
(Enloe Med Ctr)
5.50%, 8/15/23 | | $ | 400 | | $ | 384,656 |
6.25%, 8/15/28 | | | 1,165 | | | 1,177,710 |
| | | | | | |
| | | | | | 2,539,186 |
| | | | | | |
District Of Columbia – 0.7% | | | | | | |
Dist of Columbia
(Georgetown Univ)
AMBAC Series B-1
7.00%, 4/01/41(b)† | | | 1,150 | | | 1,150,000 |
| | | | | | |
| | |
Florida – 3.5% | | | | | | |
Crossings at Fleming Island CDD
(Eagle Harbor)
Series 00C
7.10%, 5/01/30 | | | 2,500 | | | 2,453,850 |
Double Branch CDD
(Oakleaf Village)
Series 02A
6.70%, 5/01/34 | | | 950 | | | 936,225 |
Hammock Bay CDD
(Spl Assmt)
Series 04A
6.15%, 5/01/24 | | | 285 | | | 258,960 |
Highlands Cnty Hlth Fac Auth
(Adventist Hlth Sys/Sunbelt Oblig Group)
MBIA Series 2007D
8.00%, 11/15/37(b)† | | | 825 | | | 825,000 |
Northern Palm Beach Cnty Impr Dist
(Unit Dev 27B)
Series 02
6.40%, 8/01/32 | | | 1,240 | | | 1,158,259 |
| | | | | | |
| | | | | | 5,632,294 |
| | | | | | |
Guam – 0.3% | | | | | | |
Guam Govt
(Wtr & Waste Sys Rev)
Series 05
6.00%, 7/01/25 | | | 500 | | | 460,315 |
| | | | | | |
| | |
Illinois – 0.8% | | | | | | |
Antioch Village Spl Svc Area
(Clublands Proj)
Series 03
6.625%, 3/01/33 | | | 1,000 | | | 804,780 |
Plano Spl Svc Area No. 3
(Lakewood Springs Proj)
Series 05A
5.95%, 3/01/28 | | | 550 | | | 479,699 |
| | | | | | |
| | | | | | 1,284,479 |
| | | | | | |
| | |
| ALLIANCEBERNSTEIN MUNICIPAL INCOME FUND II • | | 71 |
New Jersey Portfolio—Portfolio of Investments
| | | | | | |
| | | Principal
Amount
(000) | | U.S. $ Value |
| |
| | | | | | |
Ohio – 0.3% | | | | | | |
Port Auth of Columbiana Cnty SWFR
(Apex Enviro LLC) AMT
Series 04A
7.125%, 8/01/25 | | $ | 500 | | $ | 471,935 |
| | | | | | |
| | |
Pennsylvania – 1.1% | | | | | | |
Allegheny Cnty Hosp Dev Auth
(West Pennsylvania Hlth Sys)
Series 07A
5.00%, 11/15/17 | | | 420 | | | 353,241 |
Delaware River Joint Toll Brdg
(PA/NJ Bridge)
Series 03
5.00%, 7/01/28 | | | 1,625 | | | 1,503,515 |
| | | | | | |
| | | | | | 1,856,756 |
| | | | | | |
Puerto Rico – 6.0% | | | | | | |
Puerto Rico
Series 06A
5.25%, 7/01/22 | | | 500 | | | 456,305 |
Puerto Rico
(Pub Impr)
Series 01A
5.50%, 7/01/19 | | | 500 | | | 490,820 |
Series 04A
5.25%, 7/01/19 | | | 710 | | | 683,382 |
Puerto Rico Elec Pwr Auth
5.00%, 7/01/18 | | | 900 | | | 865,152 |
Series 08WW
5.375%, 7/01/23 | | | 2,165 | | | 2,020,703 |
Puerto Rico HFA
5.00%, 12/01/17 | | | 3,665 | | | 3,774,366 |
5.125%, 12/01/27 | | | 305 | | | 273,048 |
Univ of Puerto Rico
Series 06Q
5.00%, 6/01/20 | | | 1,260 | | | 1,165,513 |
| | | | | | |
| | | | | | 9,729,289 |
| | | | | | |
Texas – 0.5% | | | | | | |
Camino Real Regl Mobility Auth
5.00%, 2/15/22 | | | 905 | | | 837,605 |
| | | | | | |
| | |
Virginia – 0.7% | | | | | | |
Broad Street CDD
(Parking Fac)
Series 03
7.50%, 6/01/33 | | | 1,200 | | | 1,210,428 |
| | | | | | |
| | |
Total Long-Term Municipal Bonds
(cost $156,839,218) | | | | | | 151,674,601 |
| | | | | | |
| | |
| 72 | | • ALLIANCEBERNSTEIN MUNICIPAL INCOME FUND II |
New Jersey Portfolio—Portfolio of Investments
| | | | | | |
| | | Principal
Amount
(000) | | U.S. $ Value |
| |
| | | | | | |
Short-Term Municipal Notes – 3.8% | | | | | | |
New Jersey – 3.6% | | | | | | |
Camden Cnty Impr Auth
(Harvest Village Proj)
5.20%, 7/01/29(c) | | $ | 500 | | $ | 500,000 |
New Jersey EDA
4.00%, 9/01/31(c) | | | 2,300 | | | 2,300,000 |
4.20%, 9/01/31(c) | | | 500 | | | 500,000 |
New Jersey Hlth Care Fac
(Southern Ocean Cnty Hosp)
7.46%, 7/01/36(c) | | | 1,000 | | | 1,000,000 |
New Jersey Hlth Care Fac
(Variable Rate COMP Program)
7.42%, 7/01/23(c) | | | 1,555 | | | 1,555,000 |
| | | | | | |
| | | | | | 5,855,000 |
| | | | | | |
Colorado – 0.2% | | | | | | |
Colorado Ed & Cultural Fac Auth
(Natl Jewish Fed Bd Prog)
4.25%, 9/01/33(c) | | | 300 | | | 300,000 |
| | | | | | |
| | |
Total Short-Term Municipal Notes
(cost $6,155,000) | | | | | | 6,155,000 |
| | | | | | |
| | |
Total Municipal Obligations
(cost $162,994,218) | | | | | | 157,829,601 |
| | | | | | |
| | | | | | |
SHORT-TERM INVESTMENTS – 0.5% | | | | | | |
Time Deposit – 0.5% | | | | | | |
The Bank of New York Mellon
1.00%, 10/01/08
(cost $868,000) | | | 868 | | | 868,000 |
| | | | | | |
| | |
Total Investments – 97.5%
(cost $163,862,218) | | | | | | 158,697,601 |
Other assets less liabilities – 2.5% | | | | | | 4,094,835 |
| | | | | | |
| | |
Net Assets – 100.0% | | | | | $ | 162,792,436 |
| | | | | | |
INTEREST RATE SWAP TRANSACTIONS (see Note D)
| | | | | | | | | | | | | | |
| | | | | | | Rate Type | | | |
Swap
Counterparty | | Notional
Amount
(000) | | Termination
Date | | Payments
made
by the
Portfolio | | | Payments
received
by the
Portfolio | | | Unrealized
Appreciation/
(Depreciation) |
Merrill Lynch | | $ | 3,000 | | 10/21/16 | | BMA | * | | 4.1285 | % | | $ | 156,181 |
| | |
| ALLIANCEBERNSTEIN MUNICIPAL INCOME FUND II • | | 73 |
New Jersey Portfolio—Portfolio of Investments
| (a) | Inverse Floater Security – Security with variable or floating interest rate that moves in the opposite direction of short-term interest rates. |
| (b) | Variable rate coupon, rate shown as of September 30, 2008. |
| (c) | Variable Rate Demand Notes (VRDN) are instruments whose interest rates change on a specific date (such as coupon date or interest payment date) or whose interest rates vary with changes in a designated base rate (such as the prime interest rate). This instrument is payable on demand and is secured by letters of credit or other credit support agreements from major banks. |
| * | Variable interest rate based on the Securities Industry & Financial Markets Association, formerly the Bond Market Association (BMA). |
| † | An auction rate security whose interest rate resets at each auction date. Auctions are typically held every week or month. The rate shown is as of September 30, 2008 and the aggregate market value of these securities amounted to $7,035,000 or 4.3% of net assets. |
As of September 30, 2008, the Portfolio held 53% of net assets in insured bonds (of this amount 9% represents the Portfolio’s holding in pre-refunded insured bonds). 19% of the Portfolio’s insured bonds were insured by MBIA.
Glossary:
ACA – ACA Capital
AMBAC – American Bond Assurance Corporation
AMT – Alternative Minimum Tax (subject to)
ASSURED GTY – Assured Guaranty
CDD – Community Development District
COP – Certificate of Participation
EDA – Economic Development Agency
FGIC – Financial Guaranty Insurance Company
FNMA – Federal National Mortgage Association
FSA – Financial Security Assurance Inc.
HFA – Housing Finance Authority
MBIA – Municipal Bond Investors Assurance
MFHR – Multi-Family Housing Revenue
PCR – Pollution Control Revenue Bond
RADIAN – Radian Group, Inc.
SWFR – Solid Waste Facility Revenue
See notes to financial statements.
| | |
| 74 | | • ALLIANCEBERNSTEIN MUNICIPAL INCOME FUND II |
New Jersey Portfolio—Portfolio of Investments
OHIO PORTFOLIO
PORTFOLIO OF INVESTMENTS
September 30, 2008
| | | | | | |
| | | Principal
Amount
(000) | | U.S. $ Value |
| |
| | | | | | |
MUNICIPAL OBLIGATIONS –97.2% | | | | | | |
Long-Term Municipal Bonds – 95.3% | | | | | | |
Ohio – 80.3% | | | | | | |
Akron
MBIA Series 02
5.00%, 12/01/23 | | $ | 1,000 | | $ | 943,320 |
Brookville Loc Sch Dist
FSA Series 03
5.00%, 12/01/26 | | | 2,000 | | | 2,155,120 |
Canton City Sch Dist
MBIA Series 04B
5.00%, 12/01/22-12/01/23 | | | 2,150 | | | 2,060,310 |
Central Ohio Solid Waste Auth
AMBAC Series 04B
5.00%, 12/01/21 | | | 2,035 | | | 2,036,994 |
Cincinnati Technical Comnty Coll
AMBAC Series 02
5.00%, 10/01/28 | | | 5,000 | | | 4,442,500 |
Cleveland
(Prerefunded)
AMBAC Series 04
5.25%, 12/01/24 | | | 1,200 | | | 1,312,644 |
(Prerefunded)
MBIA Series 02
5.25%, 12/01/27 | | | 4,380 | | | 4,735,919 |
Cleveland
(Police & Fire Pension Payment)
5.25%, 5/15/24 | | | 2,500 | | | 2,440,025 |
Cleveland Cuyahoga Port Auth
(Rita Proj)
RADIAN Series 04
5.00%, 11/15/19 | | | 1,850 | | | 1,805,230 |
Cleveland Cuyahoga Port Auth
(Univ Heights Ohio-Pub Parking Proj)
Series 01
7.35%, 12/01/31 | | | 2,000 | | | 1,960,520 |
Cleveland Pub Pwr Sys
FGIC Series 06A
5.00%, 11/15/18 | | | 2,165 | | | 2,170,607 |
Cleveland Wtrwks
MBIA
5.00%, 1/01/23 | | | 2,500 | | | 2,440,100 |
Columbus Sch Dist
(Prerefunded)
FGIC Series 03
5.00%, 12/01/24-12/01/25 | | | 4,730 | | | 5,063,985 |
| | |
| ALLIANCEBERNSTEIN MUNICIPAL INCOME FUND II • | | 75 |
Ohio Portfolio—Portfolio of Investments
| | | | | | |
| | | Principal
Amount
(000) | | U.S. $ Value |
| |
| | | | | | |
Cuyahoga Cnty Hosp Fac
(Univ Hosp Hlth)
Series 00
7.50%, 1/01/30 | | $ | 1,900 | | $ | 1,940,660 |
Cuyahoga Cnty MFHR
(Livingston Park Apts)
GNMA Series 02A
5.45%, 9/20/39 | | | 1,500 | | | 1,299,210 |
Cuyahoga Cnty MFHR
(Longwood Proj) AMT
GNMA Series 01
5.60%, 1/20/43 | | | 3,620 | | | 3,212,352 |
Dayton Arpt
(James M Cox Dayton Int’l)
RADIAN Series 03A
5.00%, 12/01/23 | | | 1,280 | | | 1,141,517 |
Dayton Sch Dist
(Administrative Fac Proj)
Series 03
6.00%, 12/01/19-12/01/21 | | | 3,040 | | | 3,194,756 |
Delaware Sch Dist
MBIA Series 04
5.00%, 12/01/19 | | | 1,340 | | | 1,356,911 |
Dublin Sch Dist
FSA Series 03
5.00%, 12/01/22 | | | 1,500 | | | 1,496,880 |
Erie Cnty Hosp
(Firelands Med Ctr)
Series 02A
5.625%, 8/15/32 | | | 1,500 | | | 1,337,055 |
Fairfield Cnty Hosp
(Fairfield Med Ctr Proj)
RADIAN Series 03
5.00%, 6/15/24 | | | 1,000 | | | 849,030 |
Franklin Cnty
(OCLC Online Computer Library Ctr)
Series 98A
5.20%, 10/01/20 | | | 2,800 | | | 2,830,156 |
Franklin Cnty MFHR
(Agler Green) AMT
GNMA Series 02A
5.65%, 5/20/32 | | | 770 | | | 690,574 |
5.80%, 5/20/44 | | | 1,150 | | | 1,011,195 |
Greater Cleveland Regl Transp Auth
MBIA Series 04
5.00%, 12/01/24 | | | 1,350 | | | 1,303,452 |
| | |
| 76 | | • ALLIANCEBERNSTEIN MUNICIPAL INCOME FUND II |
Ohio Portfolio—Portfolio of Investments
| | | | | | |
| | | Principal
Amount
(000) | | U.S. $ Value |
| |
| | | | | | |
Hamilton City Sch Dist
MBIA
5.00%, 12/01/24 | | $ | 1,000 | | $ | 945,700 |
Hamilton Cnty
(Prerefunded)
AMBAC Series B
5.25%, 12/01/32 | | | 10,525 | | | 11,109,348 |
Hamilton Cnty
(Unrefunded)
AMBAC Series B
5.25%, 12/01/32 | | | 2,660 | | | 2,578,391 |
Hamilton Cnty Conv Fac Auth
FGIC Series 04
5.00%, 12/01/23 | | | 1,330 | | | 1,234,865 |
Lucas Cnty Hlth Fac
(Altenheim Proj)
GNMA Series 99
5.50%, 7/20/40 | | | 3,200 | | | 3,008,192 |
Madeira City Sch Dist
(Prerefunded)
MBIA Series 04
5.00%, 12/01/22-12/01/23 | | | 2,665 | | | 2,870,925 |
Oak Hills Loc Sch Dist
FSA Series 05
5.00%, 12/01/25 | | | 1,000 | | | 972,980 |
Ohio
Series 04A
5.00%, 6/15/22 | | | 3,000 | | | 2,985,060 |
Ohio HFA SFMR
(Mtg Rev) AMT
GNMA Series 02
5.375%, 9/01/33 | | | 1,445 | | | 1,266,817 |
GNMA Series 02-A2
5.60%, 9/01/34 | | | 150 | | | 134,035 |
GNMA Series 02-A3
5.50%, 9/01/34 | | | 820 | | | 815,351 |
Ohio St Bldg Auth
(Adult Correctional Proj)
MBIA Series 04A
5.00%, 4/01/22 | | | 2,975 | | | 2,926,299 |
Ohio St Bldg Auth
(St Fac-Admin Bldg Fd Proj)
FSA Series 05A
5.00%, 4/01/24 | | | 1,500 | | | 1,463,670 |
Ohio St Hgr Ed Fac Comnty
(Denison Univ Proj)
Series 04
5.00%, 11/01/21-11/01/24 | | | 3,440 | | | 3,375,265 |
| | |
| ALLIANCEBERNSTEIN MUNICIPAL INCOME FUND II • | | 77 |
Ohio Portfolio—Portfolio of Investments
| | | | | | |
| | | Principal
Amount
(000) | | U.S. $ Value |
| |
| | | | | | |
Ohio St Univ
MBIA Series 04
5.00%, 12/01/22 | | $ | 1,950 | | $ | 1,872,078 |
Ohio SWDR
(Anheuser-Busch) AMT
Series 01
5.50%, 11/01/35 | | | 3,000 | | | 2,804,070 |
Ohio Wtr Dev Auth
(Anheuser-Busch) AMT
Series 99
6.00%, 8/01/38(a) | | | 2,250 | | | 2,297,790 |
Pinnacle Comnty Fin Auth
Series A
6.00%, 12/01/22 | | | 2,070 | | | 1,866,747 |
Port Auth of Columbiana Cnty SWFR
(Apex Enviro LLC) AMT
Series 04A
7.125%, 8/01/25 | | | 500 | | | 471,935 |
Princeton Sch Dist
(Prerefunded)
MBIA Series 03
5.00%, 12/01/24 | | | 1,600 | | | 1,724,096 |
Riversouth Auth
(Area Redevelopment)
Series 04A
5.25%, 12/01/21-12/01/22 | | | 2,000 | | | 2,031,660 |
Series 05A
5.00%, 12/01/24 | | | 3,590 | | | 3,481,367 |
Steubenville Hosp
(Trinity Hlth)
(Prerefunded)
Series 00
6.50%, 10/01/30 | | | 2,500 | | | 2,688,825 |
Toledo Lucas Cnty Port Auth
(Cargill, Inc. Project)
Series 04B
4.50%, 12/01/15 | | | 2,500 | | | 2,401,550 |
Toledo Lucas Cnty Port Auth
(Crocker Park Proj)
Series 03
5.375%, 12/01/35 | | | 2,000 | | | 1,718,260 |
Toledo Lucas Cnty Port Auth
(CSX Transp)
Series 92
6.45%, 12/15/21 | | | 1,270 | | | 1,266,495 |
Toledo Sch Dist
FGIC Series 03B
5.00%, 12/01/23 | | | 2,940 | | | 2,683,838 |
| | |
| 78 | | • ALLIANCEBERNSTEIN MUNICIPAL INCOME FUND II |
Ohio Portfolio—Portfolio of Investments
| | | | | | |
| | | Principal
Amount
(000) | | U.S. $ Value |
| |
| | | | | | |
Univ of Cincinnati COP
(Univ Cincinnati Ctr Proj)
MBIA
5.00%, 6/01/24 | | $ | 4,470 | | $ | 4,134,929 |
Youngstown City Sch Dist
FSA
5.00%, 12/01/25 | | | 2,155 | | | 2,096,772 |
| | | | | | |
| | | | | | 124,458,332 |
| | | | | | |
California – 0.6% | | | | | | |
California
5.25%, 4/01/29 | | | 5 | | | 4,812 |
Series 04
5.20%, 4/01/26 | | | 1,000 | | | 973,130 |
| | | | | | |
| | | | | | 977,942 |
| | | | | | |
Florida – 2.2% | | | | | | |
Collier Cnty IDA
(Southern St Util) AMT
Series 96
6.50%, 10/01/25 | | | 200 | | | 200,046 |
Crossings at Fleming Island CDD
(Eagle Harbor)
Series 00C
7.10%, 5/01/30 | | | 2,000 | | | 1,963,080 |
Double Branch CDD
(Oakleaf Village)
Series 02A
6.70%, 5/01/34 | | | 920 | | | 906,660 |
Hammock Bay CDD
(Spl Assmt)
Series 04A
6.15%, 5/01/24 | | | 300 | | | 272,589 |
| | | | | | |
| | | | | | 3,342,375 |
| | | | | | |
Georgia – 0.3% | | | | | | |
Atlanta
(Tax Alloc Bonds Eastside Proj)
Series 05B
5.60%, 1/01/30 | | | 500 | | | 409,810 |
| | | | | | |
| | |
Illinois – 0.8% | | | | | | |
Antioch Village Spl Svc Area
(Deercrest Proj)
Series 03
6.625%, 3/01/33 | | | 977 | | | 799,010 |
| | |
| ALLIANCEBERNSTEIN MUNICIPAL INCOME FUND II • | | 79 |
Ohio Portfolio—Portfolio of Investments
| | | | | | |
| | | Principal
Amount
(000) | | U.S. $ Value |
| |
| | | | | | |
Plano Spl Svc Area No. 3
(Lakewood Springs Proj)
Series 05A
5.95%, 3/01/28 | | $ | 565 | | $ | 492,782 |
| | | | | | |
| | | | | | 1,291,792 |
| | | | | | |
Pennsylvania – 0.2% | | | | | | |
Allegheny Cnty Hosp Dev Auth
(West Pennsylvania Hlth Sys)
Series 07A
5.00%, 11/15/17 | | | 425 | | | 357,446 |
| | | | | | |
| | |
Puerto Rico – 10.9% | | | | | | |
Puerto Rico
Series 06A
5.25%, 7/01/22 | | | 500 | | | 456,305 |
Puerto Rico
(Pub Impr)
Series 01A
5.50%, 7/01/19 | | | 500 | | | 490,820 |
Puerto Rico Conv Ctr Dist Auth
(Hotel Occupancy Rev)
AMBAC Series 06A
5.00%, 7/01/18-7/01/19 | | | 6,370 | | | 6,059,464 |
Puerto Rico Elec Pwr Auth
5.00%, 7/01/20 | | | 2,530 | | | 2,364,310 |
5.375%, 7/01/24 | | | 1,030 | | | 958,065 |
Puerto Rico Govt Dev Bank
(Sr Notes)
Series 06B
5.00%, 12/01/15 | | | 500 | | | 496,110 |
Puerto Rico HFA
5.125%, 12/01/27 | | | 375 | | | 335,715 |
Puerto Rico Muni Fin Agy
Series 05A
5.25%, 8/01/23 | | | 375 | | | 338,644 |
Puerto Rico Tobacco Settlement
(Childrens Trust Fund)
(Prerefunded)
Series 00
6.00%, 7/01/26 | | | 4,000 | | | 4,206,440 |
Univ of Puerto Rico
5.00%, 6/01/22 | | | 1,350 | | | 1,209,154 |
| | | | | | |
| | | | | | 16,915,027 |
| | | | | | |
Total Long-Term Municipal Bonds
(cost $153,405,955) | | | | | | 147,752,724 |
| | | | | | |
| | | | | | |
| | |
| 80 | | • ALLIANCEBERNSTEIN MUNICIPAL INCOME FUND II |
Ohio Portfolio—Portfolio of Investments
| | | | | | |
| | | Principal
Amount
(000) | | U.S. $ Value |
| |
| | | | | | |
Short-Term Municipal Notes – 1.9% | | | | | | |
Ohio – 0.3% | | | | | | |
Allen County OH
4.25%, 10/01/31(b) | | $ | 500 | | $ | 500,000 |
| | | | | | |
| | |
Colorado – 0.1% | | | | | | |
Colorado Ed & Cultural Fac Auth
(Natl Jewish Fed Bd Prog)
4.25%, 9/01/33(b) | | | 100 | | | 100,000 |
| | | | | | |
| | |
Florida – 1.2% | | | | | | |
Alachua Cnty Hlth Fac Auth
5.50%, 12/01/32(b) | | | 500 | | | 500,000 |
Brevard Cnty Hlth Fac Auth
(Hlth First Inc.)
5.50%, 8/01/14(b) | | | 900 | | | 900,000 |
Broward Cnty Ed Fac Auth
5.50%, 4/01/24(b) | | | 500 | | | 500,000 |
| | | | | | |
| | | | | | 1,900,000 |
| | | | | | |
| | |
Rhode Island – 0.3% | | | | | | |
Rhode Island Hlth & Ed Bldg Corp.
(Catholic Sch Pool Program Issue)
7.25%, 4/01/35(b) | | | 500 | | | 500,000 |
| | | | | | |
| | |
Total Short-Term Municipal Notes
(cost $3,000,000) | | | | | | 3,000,000 |
| | | | | | |
| | |
Total Investments – 97.2%
(cost $156,405,955) | | | | | | 150,752,724 |
Other assets less liabilities – 2.8% | | | | | | 4,365,940 |
| | | | | | |
| | |
Net Assets – 100.0% | | | | | $ | 155,118,664 |
| | | | | | |
INTEREST RATE SWAP TRANSACTIONS (see Note D)
| | | | | | | | | | | | | | |
| | | | | | | Rate Type | | | |
Swap
Counterparty | | Notional
Amount
(000) | | Termination
Date | | Payments
made
by the
Portfolio | | | Payments
received
by the
Portfolio | | | Unrealized
Appreciation/
(Depreciation) |
Merrill Lynch | | $ | 3,600 | | 8/01/16 | | BMA | * | | 4.0710 | % | | $ | 171,087 |
| (a) | Variable rate coupon, rate shown as of September 30, 2008. |
| (b) | Variable Rate Demand Notes (VRDN) are instruments whose interest rates change on a specific date (such as coupon date or interest payment date) or whose interest rates vary with changes in a designated base rate (such as the prime interest rate). This instrument is payable on demand and is secured by letters of credit or other credit support agreements from major banks. |
| | |
| ALLIANCEBERNSTEIN MUNICIPAL INCOME FUND II • | | 81 |
Ohio Portfolio—Portfolio of Investments
| * | Variable interest rate based on the Securities Industry & Financial Markets Association, formerly the Bond Market Association (BMA). |
As of September 30, 2008, the Portfolio held 50% of net assets in insured bonds (of this amount 19% represents the Portfolio’s holding in pre-refunded insured bonds). 18% and 18% of the Portfolio’s insured bonds were insured by AMBAC and MBIA, respectively.
Glossary:
AMBAC – American Bond Assurance Corporation
AMT – Alternative Minimum Tax (subject to)
CDD – Community Development District
COP – Certificate of Participation
FGIC – Financial Guaranty Insurance Company
FSA – Financial Security Assurance Inc.
GNMA – Government National Mortgage Association
HFA – Housing Finance Authority
IDA – Industrial Development Authority/Agency
MBIA – Municipal Bond Investors Assurance
MFHR – Multi-Family Housing Revenue
RADIAN – Radian Group, Inc.
SFMR – Single Family Mortgage Revenue
SWDR – Solid Waste Disposal Revenue
SWFR – Solid Waste Facility Revenue
See notes to financial statements.
| | |
| 82 | | • ALLIANCEBERNSTEIN MUNICIPAL INCOME FUND II |
Ohio Portfolio—Portfolio of Investments
PENNSYLVANIA PORTFOLIO
PORTFOLIO OF INVESTMENTS
September 30, 2008
| | | | | | |
| | | Principal
Amount
(000) | | U.S. $ Value |
| |
| | | | | | |
MUNICIPAL OBLIGATIONS –97.3% | | | | | | |
Long-Term Municipal Bonds – 95.3% | | | | | | |
Pennsylvania – 76.2% | | | | | | |
Allegheny Cnty Hgr Ed
(Thiel Coll)
ACA Series 99A
5.375%, 11/15/19-11/15/29 | | $ | 2,500 | | $ | 2,243,745 |
Allegheny Cnty Hosp Dev Auth
(South Hills Hlth)
(Prerefunded)
Series 00B
6.75%, 5/01/25 | | | 1,555 | | | 1,656,075 |
Allegheny Cnty Hosp Dev Auth
(West Pennsylvania Hlth Sys)
5.00%, 11/15/28 | | | 200 | | | 140,770 |
Series 07A
5.00%, 11/15/17 | | | 800 | | | 672,840 |
Allegheny Cnty IDA
(Residential Reserves Inc Proj)
5.00%, 9/01/21 | | | 500 | | | 444,335 |
(Prerefunded)
Series 01
6.60%, 9/01/31 | | | 1,540 | | | 1,694,293 |
Allegheny Cnty IDA
(USX Corp.)
Series 98
5.50%, 12/01/29 | | | 2,680 | | | 2,264,519 |
Allegheny Cnty Redev Auth
(Pittsburgh Mills Proj)
5.60%, 7/01/23 | | | 1,500 | | | 1,374,345 |
Allegheny Cnty Sanitation Auth
(Swr Rev)
MBIA Series 05A
5.00%, 12/01/24 | | | 7,490 | | | 6,825,862 |
Butler Cnty
(Prerefunded)
FGIC Series 03
5.25%, 7/15/26 | | | 1,625 | | | 1,756,592 |
Chester Upland Sch Dist
4.30%, 5/15/14 | | | 1,705 | | | 1,713,934 |
Coatesville Sch Dist
5.00%, 8/01/23 | | | 6,500 | | | 6,300,970 |
Crawford Cnty Hlth Fac
(Westbury Methodist)
Series 99
6.25%, 8/15/29 | | | 1,600 | | | 1,369,616 |
| | |
| ALLIANCEBERNSTEIN MUNICIPAL INCOME FUND II • | | 83 |
Pennsylvania Portfolio—Portfolio of Investments
| | | | | | |
| | | Principal
Amount
(000) | | U.S. $ Value |
| |
| | | | | | |
Delaware Cnty Hgr Ed
(Eastern Coll)
Series 99
5.625%, 10/01/28 | | $ | 2,500 | | $ | 2,226,425 |
Ephrata Area Sch Dist
(Prerefunded)
FGIC Series 05
5.00%, 3/01/22 | | | 1,000 | | | 1,070,620 |
Harrisburg Arpt Auth
(Susquehanna Arpt Proj) AMT
Series 99
5.50%, 1/01/24 | | | 3,490 | | | 2,842,675 |
Lancaster Swr Auth Rev
MBIA Series 04
5.00%, 4/01/22 | | | 1,330 | | | 1,305,688 |
Lehigh Northampton Arpt Auth
MBIA Series 00
6.00%, 5/15/30 | | | 4,400 | | | 4,185,236 |
Lycoming Cnty Hgr Ed
(Coll of Technology)
AMBAC Series 02
5.25%, 5/01/32 | | | 2,250 | | | 2,184,750 |
McKean Cnty Hosp Auth
(Bradford Hosp Proj)
ACA
5.00%, 10/01/17 | | | 1,205 | | | 1,064,533 |
Meadville
XLCA
5.00%, 10/01/25 | | | 3,080 | | | 2,779,608 |
Montgomery Cnty Hgr Ed
(Beaver Coll)
(Prerefunded)
RADIAN Series 99
5.70%, 4/01/27 | | | 6,000 | | | 6,098,220 |
Montgomery Cnty Hosp
(Abington Mem Hosp)
Series 02A
5.125%, 6/01/32 | | | 3,000 | | | 2,534,340 |
Montgomery Cnty IDA
(Whitemarsh Continuing Care Ret
Comnty)
6.00%, 2/01/21 | | | 415 | | | 378,177 |
New Wilmington Muni Auth
(Westminster Coll Proj)
RADIAN
5.00%, 5/01/27 | | | 1,040 | | | 874,993 |
| | |
| 84 | | • ALLIANCEBERNSTEIN MUNICIPAL INCOME FUND II |
Pennsylvania Portfolio—Portfolio of Investments
| | | | | | |
| | | Principal
Amount
(000) | | U.S. $ Value |
| |
| | | | | | |
Pennsylvania EDA
(30th St Station ) AMT
ACA Series 02
5.875%, 6/01/33 | | $ | 2,085 | | $ | 1,804,547 |
Pennsylvania EDA
(Amtrak) AMT
Series 01A
6.375%, 11/01/41 | | | 3,000 | | | 2,707,980 |
Pennsylvania Hgr Ed Fac Auth
(Dickinson Coll)
RADIAN Series 03AA-1
5.00%, 11/01/26 | | | 1,000 | | | 864,410 |
Pennsylvania Hgr Ed Fac Auth
(Univ Hlth Sys)
AMBAC Series 05A
5.00%, 8/15/20 | | | 2,000 | | | 2,019,560 |
Pennsylvania Hgr Ed Fac Auth
(UPMC Hlth Sys)
Series 01A
6.00%, 1/15/31 | | | 2,405 | | | 2,473,855 |
Pennsylvania IDA
(St Revolving Fd)
Series 08A
5.50%, 7/01/23 | | | 1,060 | | | 1,010,636 |
Philadelphia IDA
(Prerefunded)
FSA Series 01B
5.25%, 10/01/30 | | | 8,000 | | | 8,589,760 |
Philadelphia IDA
(Leadership Learning Partners)
Series 05A
5.25%, 7/01/24 | | | 350 | | | 291,200 |
Philadelphia Sch Dist
(Prerefunded)
FSA Series 03
5.25%, 6/01/26 | | | 5,000 | | | 5,361,950 |
Pittsburgh
FSA Series 06C
5.25%, 9/01/17 | | | 5,000 | | | 5,203,200 |
Pittsburgh Pub Pkg Auth
FGIC Series 05A
5.00%, 12/01/19 | | | 2,435 | | | 2,375,878 |
Pittsburgh Urban Redev Auth SFMR
(Mtg Rev) AMT
FHA Series 97A
6.25%, 10/01/28 | | | 790 | | | 790,071 |
| | |
| ALLIANCEBERNSTEIN MUNICIPAL INCOME FUND II • | | 85 |
Pennsylvania Portfolio—Portfolio of Investments
| | | | | | |
| | | Principal
Amount
(000) | | U.S. $ Value |
| |
| | | | | | |
Potter Cnty Hosp
(Charles Cole Mem)
RADIAN
Series 96 6.05%, 8/01/24 | | $ | 4,340 | | $ | 4,347,508 |
South Ctr Gen Auth
(Hanover Hosp Inc.)
RADIAN
5.00%, 12/01/25 | | | 1,570 | | | 1,410,692 |
South Ctr Gen Auth
(Wellspan Hlth)
MBIA Series 01
5.25%, 5/15/31 | | | 795 | | | 805,391 |
South Ctr Gen Auth
(Wellspan Hlth)
(Prerefunded)
MBIA Series 01
5.25%, 5/15/31 | | | 3,905 | | | 4,182,997 |
St Pub Sch Bldg Auth
(Colonial Northampton Inter Unit 20)
FGIC Series 05
5.00%, 5/15/26 | | | 2,025 | | | 1,872,072 |
Wilkes-Barre Fin Auth
(Wilkes Univ Proj)
5.00%, 3/01/22 | | | 510 | | | 453,747 |
| | | | | | |
| | | | | | 102,568,615 |
| | | | | | |
Florida – 4.4% | | | | | | |
Collier Cnty IDA
(Southern St Util) AMT
Series 96
6.50%, 10/01/25 | | | 400 | | | 400,092 |
Crossings at Fleming Island CDD
(Eagle Harbor)
Series 00C
7.10%, 5/01/30 | | | 2,000 | | | 1,963,080 |
Double Branch CDD
(Oakleaf Village)
Series 02A
6.70%, 5/01/34 | | | 1,015 | | | 1,000,282 |
Hammock Bay CDD
(Spl Assmt)
Series 04A
6.15%, 5/01/24 | | | 300 | | | 272,589 |
Highlands Cnty Hlth Fac Auth
(Adventist/Sunbelt Hosp)
FSA Series 2005G
10.00%, 11/15/35(a)† | | | 1,400 | | | 1,400,000 |
| | |
| 86 | | • ALLIANCEBERNSTEIN MUNICIPAL INCOME FUND II |
Pennsylvania Portfolio—Portfolio of Investments
| | | | | | |
| | | Principal
Amount
(000) | | U.S. $ Value |
| |
| | | | | | |
Northern Palm Beach Cnty Impr Dist
(Unit Dev 27B)
Series 02
6.40%, 8/01/32 | | $ | 900 | | $ | 840,672 |
| | | | | | |
| | | | | | 5,876,715 |
| | | | | | |
Guam – 0.7% | | | | | | |
Guam Govt
(Wtr & Waste Sys Rev)
Series 05
6.00%, 7/01/25 | | | 500 | | | 460,315 |
Guam Int’l Arpt Auth
MBIA Series 03B
5.25%, 10/01/23 | | | 500 | | | 487,345 |
| | | | | | |
| | | | | | 947,660 |
| | | | | | |
Illinois – 1.5% | | | | | | |
Antioch Village Spl Svc Area
(Deercrest Proj)
Series 03
6.625%, 3/01/33 | | | 1,000 | | | 817,820 |
Plano Spl Svc Area No. 3
(Lakewood Springs Proj)
Series 05A
5.95%, 3/01/28 | | | 465 | | | 405,564 |
Yorkville CFD
(Raintree Village)
Series 03
6.875%, 3/01/33 | | | 800 | | | 764,944 |
| | | | | | |
| | | | | | 1,988,328 |
| | | | | | |
Puerto Rico – 10.0% | | | | | | |
Puerto Rico
(Pub Impr)
5.25%, 7/01/23 | | | 500 | | | 451,645 |
Series 01A
5.50%, 7/01/19 | | | 500 | | | 490,820 |
Puerto Rico Elec Pwr Auth
5.00%, 7/01/22 | | | 800 | | | 724,448 |
5.375%, 7/01/24 | | | 1,530 | | | 1,423,145 |
Puerto Rico HFA
5.125%, 12/01/27 | | | 180 | | | 161,143 |
Puerto Rico Hwy & Transp Auth
FGIC Series 03
5.25%, 7/01/14 | | | 3,195 | | | 3,229,442 |
FGIC Series 03G
5.25%, 7/01/14 | | | 3,335 | | | 3,392,095 |
(Prerefunded)
FSA
5.00%, 7/01/27 | | | 2,260 | | | 2,406,471 |
| | |
| ALLIANCEBERNSTEIN MUNICIPAL INCOME FUND II • | | 87 |
Pennsylvania Portfolio—Portfolio of Investments
| | | | | | |
| | | Principal
Amount
(000) | | U.S. $ Value |
| |
| | | | | | |
Puerto Rico Muni Fin Agy
Series 05A
5.25%, 8/01/23 | | $ | 300 | | $ | 270,915 |
Puerto Rico Pub Bldg Auth
Series N
5.50%, 7/01/22 | | | 345 | | | 322,478 |
Univ of Puerto Rico
5.00%, 6/01/22 | | | 655 | | | 586,664 |
| | | | | | |
| | | | | | 13,459,266 |
| | | | | | |
Texas – 0.6% | | | | | | |
Camino Real Regl Mobility Auth
5.00%, 2/15/22 | | | 845 | | | 782,073 |
| | | | | | |
| | |
Virgin Islands – 1.9% | | | | | | |
Virgin Islands Pub Fin Auth
(Virgin Islands Gross Receipts Taxes
Loan Note)
FSA Series 03
5.00%, 10/01/13-10/01/14 | | | 675 | | | 708,740 |
5.25%, 10/01/15-10/01/17 | | | 1,840 | | | 1,919,775 |
| | | | | | |
| | | | | | 2,628,515 |
| | | | | | |
Total Long-Term Municipal Bonds
(cost $132,597,088) | | | | | | 128,251,172 |
| | | | | | |
| | | | | | |
Short-Term Municipal Notes – 2.0% | | | | | | |
Pennsylvania – 0.4% | | | | | | |
Lehigh Cnty
(Lehigh Valley Hlth Network)
4.50%, 7/01/29(b) | | | 500 | | | 500,000 |
| | | | | | |
Alaska – 0.1% | | | | | | |
Valdez Marine Term Rev
(BP Pipelines, Inc. Proj)
Series 03B
4.25%, 7/01/37(b) | | | 200 | | | 200,000 |
| | | | | | |
| | |
Florida – 1.5% | | | | | | |
Jacksonville Econ Dev Commission
(Methodist Refunding Proj)
5.50%, 10/01/15(b) | | | 2,000 | | | 2,000,000 |
| | | | | | |
| | |
Total Short-Term Municipal Notes
(cost $2,700,000) | | | | | | 2,700,000 |
| | | | | | |
| | |
Total Investments – 97.3%
(cost $135,297,088) | | | | | | 130,951,172 |
Other assets less liabilities – 2.7% | | | | | | 3,583,946 |
| | | | | | |
| | |
Net Assets – 100.0% | | | | | $ | 134,535,118 |
| | | | | | |
| | |
| 88 | | • ALLIANCEBERNSTEIN MUNICIPAL INCOME FUND II |
Pennsylvania Portfolio—Portfolio of Investments
| (a) | Variable rate coupon, rate shown as of September 30, 2008. |
| (b) | Variable Rate Demand Notes (VRDN) are instruments whose interest rates change on a specific date (such as coupon date or interest payment date) or whose interest rates vary with changes in a designated base rate (such as the prime interest rate). This instrument is payable on demand and is secured by letters of credit or other credit support agreements from major banks. |
| † | An auction rate security whose interest rate resets at each auction date. Auctions are typically held every week or month. The rate shown is as of September 30, 2008 and the aggregate market value of these securities amounted to $1,400,000 or 1.0% of net assets. |
As of September 30, 2008, the Portfolio held 66% of net assets in insured bonds (of this amount 22% represents the Portfolio’s holding in pre-refunded insured bonds). 24% of the Portfolio’s insured bonds were insured by FSA.
Glossary:
ACA – ACA Capital
AMBAC – American Bond Assurance Corporation
AMT – Alternative Minimum Tax (subject to)
CDD – Community Development District
CFD – Community Facilities District
EDA – Economic Development Agency
FGIC – Financial Guaranty Insurance Company
FHA – Federal Housing Administration
FSA – Financial Security Assurance Inc.
HFA – Housing Finance Authority
IDA – Industrial Development Authority/Agency
MBIA – Municipal Bond Investors Assurance
RADIAN – Radian Group, Inc.
SFMR – Single Family Mortgage Revenue
XLCA – XL Capital Assurance Inc.
See notes to financial statements.
| | |
| ALLIANCEBERNSTEIN MUNICIPAL INCOME FUND II • | | 89 |
Pennsylvania Portfolio—Portfolio of Investments
VIRGINIA PORTFOLIO
PORTFOLIO OF INVESTMENTS
September 30, 2008
| | | | | | |
| | | Principal
Amount
(000) | | U.S. $ Value |
| |
| | | | | | |
MUNICIPAL OBLIGATIONS – 97.0% | | | | | | |
Long-Term Municipal Bonds – 92.4% | | | | | | |
Virginia – 78.8% | | | | | | |
Albemarle Cnty Ed Fac
(The Convent Sch)
Series 01A
7.75%, 7/15/32 | | $ | 4,260 | | $ | 4,350,397 |
Arlington Cnty IDA
(Ogden Martin) AMT
FSA Series 98B
5.25%, 1/01/09 | | | 2,295 | | | 2,304,868 |
Arlington Cnty MFHR
(Arlington View Terrace) AMT
FNMA Series 01
5.15%, 11/01/31 | | | 1,550 | | | 1,477,538 |
Arlington IDA
(Arlington Hlth Sys)
(Prerefunded)
Series 01
5.25%, 7/01/31 | | | 5,900 | | | 6,312,646 |
Bell Creek CDD
Series 03A
6.75%, 3/01/22 | | | 200 | | | 198,848 |
Broad Street CDD
(Parking Fac)
Series 03
7.50%, 6/01/33 | | | 1,500 | | | 1,513,035 |
Celebrate North CDD
(Spl Assmt Rev)
Series 03B
6.60%, 3/01/25 | | | 1,250 | | | 1,191,038 |
Chesterfield Cnty
(Elec & Pwr Co)
Series 02
5.875%, 6/01/17 | | | 3,800 | | | 3,924,488 |
Dinwiddie Cnty IDA
(Lease Rev)
MBIA Series 04B
5.00%, 2/15/24 | | | 3,200 | | | 3,062,432 |
Dulles Town CDA
(Dulles Town Ctr Proj)
Series 98
6.25%, 3/01/26 | | | 1,990 | | | 1,839,098 |
Fairfax Cnty EDA
(Goodwin House Inc.)
5.00%, 10/01/22 | | | 1,000 | | | 907,960 |
| | |
| 90 | | • ALLIANCEBERNSTEIN MUNICIPAL INCOME FUND II |
Virginia Portfolio—Portfolio of Investments
| | | | | | |
| | | Principal
Amount
(000) | | U.S. $ Value |
| |
| | | | | | |
Fairfax Wtr Auth
Series 02
5.00%, 4/01/32 | | $ | 3,380 | | $ | 3,262,241 |
Greater Richmond Hotel Tax
(Conv Ctr Proj)
(Prerefunded)
Series 00
6.25%, 6/15/32 | | | 6,000 | | | 6,411,720 |
Hampton
MBIA
5.00%, 1/15/20 | | | 6,105 | | | 6,176,917 |
Hampton Conv Ctr
AMBAC Series 02
5.00%, 1/15/35 | | | 5,150 | | | 4,654,467 |
Hampton Roads Sanitation Dist
5.00%, 4/01/25 | | | 5,050 | | | 4,879,361 |
Harrisonburg IDA
(Rockingham Mem Hosp)
AMBAC
5.00%, 8/15/22-8/15/25 | | | 7,850 | | | 6,975,231 |
Harrisonburg MFHR
(Greens of Salem Run) AMT
FSA Series 97
6.30%, 4/01/29 | | | 1,110 | | | 1,110,200 |
James City Cnty Econ Dev Auth
(Lease Rev Bonds)
FSA
5.00%, 6/15/22 | | | 4,385 | | | 4,329,047 |
James City Cnty SWR
(Anheuser Busch Proj) AMT
Series 97
6.00%, 4/01/32 | | | 4,200 | | | 3,785,082 |
Montgomery Cnty IDA
5.00%, 2/01/24 | | | 2,000 | | | 1,842,620 |
Newport Comnty Dev Auth
(Spl Assmt)
5.50%, 9/01/26 | | | 1,000 | | | 744,930 |
Newport News Hlth Care Fac
(Mennowood)
GNMA Series 96A
6.25%, 8/01/36 | | | 2,580 | | | 2,589,417 |
Newport News MFHR
(Walker Village Proj) AMT
GNMA Series 02A
5.55%, 9/20/34 | | | 1,880 | | | 1,676,170 |
5.65%, 3/20/44 | | | 1,660 | | | 1,488,671 |
Norfolk
5.00%, 4/01/21 | | | 7,800 | | | 7,837,518 |
| | |
| ALLIANCEBERNSTEIN MUNICIPAL INCOME FUND II • | | 91 |
Virginia Portfolio—Portfolio of Investments
| | | | | | |
| | | Principal
Amount
(000) | | U.S. $ Value |
| |
| | | | | | |
Norfolk Arpt Auth
(Air Cargo) AMT
FGIC Series 01B
5.30%, 7/01/25 | | $ | 10,000 | | $ | 8,904,500 |
Series 02
6.25%, 1/01/30 | | | 985 | | | 850,380 |
Northwestern Regl Jail Auth
MBIA
5.00%, 7/01/25 | | | 1,500 | | | 1,403,520 |
Portsmouth
(Unrefunded Ref & Pub Util)
FGIC Series B
5.00%, 6/01/26 | | | 95 | | | 91,119 |
Prince William MFHR
(Woodwind Gables) AMT
AMBAC Series 01A
5.30%, 12/01/34 | | | 2,760 | | | 2,352,845 |
Reynolds Crossing CDD
5.10%, 3/01/21 | | | 2,150 | | | 1,827,457 |
Richmond
FSA Series 05A
5.00%, 7/15/22 | | | 2,500 | | | 2,480,150 |
Suffolk
MBIA
5.00%, 2/01/20 | | | 3,000 | | | 3,042,660 |
Upper Occoquan Sewage Auth
FSA
5.00%, 7/01/25 | | | 2,500 | | | 2,441,625 |
Virginia Beach
(Wtr & Swr Rev)
5.00%, 10/01/30 | | | 2,000 | | | 1,900,200 |
Virginia Beach MFHR
(Beth Sholom Terrace)
GNMA Series 02
5.40%, 4/01/44 | | | 2,900 | | | 2,543,387 |
Virginia Biotechnology Auth
(Consolidated Laboratories Proj)
Series 01
5.00%, 9/01/21 | | | 4,170 | | | 4,213,660 |
Virginia Coll Bldg Auth
(Prerefunded)
5.00%, 9/01/16-4/01/23 | | | 1,220 | | | 1,172,973 |
Virginia Coll Bldg Auth
(Pub Hgr Ed Fin Program)
5.00%, 9/01/16 | | | 5,615 | | | 5,947,464 |
Series 05A
5.00%, 9/01/17 | | | 5,890 | | | 6,173,486 |
| | |
| 92 | | • ALLIANCEBERNSTEIN MUNICIPAL INCOME FUND II |
Virginia Portfolio—Portfolio of Investments
| | | | | | |
| | | Principal
Amount
(000) | | U.S. $ Value |
| |
| | | | | | |
Virginia HDA MFHR
(Rental Hsg) AMT
Series 02B
5.50%, 4/01/27 | | $ | 5,000 | | $ | 4,683,350 |
Series 99
5.95%, 2/01/23 | | | 5,525 | | | 5,528,978 |
Virginia HDA SFMR
(Mtg Rev) AMT
Series 01D
5.40%, 6/01/24 | | | 3,155 | | | 3,009,586 |
Virginia Port Auth
(Newport News) AMT
Series 02
5.125%, 7/01/24 | | | 4,000 | | | 3,658,720 |
Virginia Port Auth Rev
(Newport News) AMT
Series 02
5.00%, 7/01/27 | | | 1,000 | | | 885,730 |
Virginia Small Business Fin Auth
5.125%, 9/01/22 | | | 710 | | | 629,195 |
Watkins Centre CDD
5.40%, 3/01/20 | | | 600 | | | 525,792 |
| | | | | | |
| | | | | | 149,112,717 |
| | | | | | |
California – 1.4% | | | | | | |
California Statewide Comnty Dev Auth
(Enloe Med Ctr)
5.50%, 8/15/23 | | | 660 | | | 634,682 |
6.25%, 8/15/28 | | | 1,910 | | | 1,930,838 |
| | | | | | |
| | | | | | 2,565,520 |
| | | | | | |
Florida – 0.5% | | | | | | |
Highlands Cnty Hlth Fac Auth
(Adventist Hlth Sys/Sunbelt Oblig
Group)
MBIA Series 2007D
8.00%, 11/15/37(a)† | | | 975 | | | 975,000 |
| | | | | | |
| | |
Georgia – 0.2% | | | | | | |
Atlanta
(Tax Alloc Bonds Eastside Proj)
Series 05B
5.60%, 1/01/30 | | | 500 | | | 409,810 |
| | | | | | |
| | |
Illinois – 0.7% | | | | | | |
Plano Spl Svc Area No. 3
(Lakewood Springs Proj)
Series 05A
5.95%, 3/01/28 | | | 465 | | | 405,564 |
| | |
| ALLIANCEBERNSTEIN MUNICIPAL INCOME FUND II • | | 93 |
Virginia Portfolio—Portfolio of Investments
| | | | | | |
| | | Principal
Amount
(000) | | U.S. $ Value |
| |
| | | | | | |
Yorkville CFD
(Raintree Village)
Series 03
6.875%, 3/01/33 | | $ | 1,000 | | $ | 956,180 |
| | | | | | |
| | | | | | 1,361,744 |
| | | | | | |
New Jersey – 1.5% | | | | | | |
New Jersey Ed Fac Auth
(Kean Univ)
FGIC Series 07
10.50%, 7/01/37(a)† | | | 2,040 | | | 2,040,000 |
FGIC Series 2007E-2
10.00%, 7/01/37(a)† | | | 900 | | | 900,000 |
| | | | | | |
| | | | | | 2,940,000 |
| | | | | | |
Puerto Rico – 9.3% | | | | | | |
Puerto Rico
(Pub Impr)
Series 01A
5.50%, 7/01/19 | | | 500 | | | 490,820 |
Puerto Rico Elec Pwr Auth
5.00%, 7/01/20 | | | 800 | | | 747,608 |
MBIA
5.50%, 7/01/17 | | | 5,000 | | | 5,182,100 |
Puerto Rico Govt Dev Bank
(Sr Notes)
Series 06B
5.00%, 12/01/15 | | | 500 | | | 496,110 |
Puerto Rico HFA
5.00%, 12/01/20 | | | 4,870 | | | 4,931,962 |
5.125%, 12/01/27 | | | 290 | | | 259,619 |
Puerto Rico Hwy & Transp Auth
FGIC Series 03
5.25%, 7/01/14 | | | 1,760 | | | 1,778,973 |
FGIC Series 03G
5.25%, 7/01/14 | | | 1,840 | | | 1,871,501 |
Puerto Rico Muni Fin Agy
Series 05A
5.25%, 8/01/23 | | | 340 | | | 307,037 |
Univ of Puerto Rico
5.00%, 6/01/22 | | | 1,740 | | | 1,558,466 |
| | | | | | |
| | | | | | 17,624,196 |
| | | | | | |
Total Long-Term Municipal Bonds
(cost $184,191,489) | | | | | | 174,988,987 |
| | | | | | |
| | | | | | |
| | |
| 94 | | • ALLIANCEBERNSTEIN MUNICIPAL INCOME FUND II |
Virginia Portfolio—Portfolio of Investments
| | | | | | |
| | | Principal
Amount
(000) | | U.S. $ Value |
| |
| | | | | | |
Short-Term Municipal Notes – 4.6% | | | | | | |
Virginia – 0.8% | | | | | | |
Montgomery Cnty IDA
(Virgina Tech Fndtn)
5.25%, 6/01/35(b) | | $ | 500 | | $ | 500,000 |
Richmond IDA
(Church Sch in the Diocese of Virginia)
5.25%, 12/01/31-5/01/35(b) | | | 1,000 | | | 1,000,000 |
| | | | | | |
| | | | | | 1,500,000 |
| | | | | | |
Alaska – 0.7% | | | | | | |
Valdez Marine Term Rev
(BP Pipelines, Inc. Proj)
Series 03B
4.25%, 7/01/37(b) | | | 1,300 | | | 1,300,000 |
| | | | | | |
| | |
Colorado – 0.4% | | | | | | |
Colorado Ed & Cultural Fac Auth
(Natl Jewish Fed Bd Prog)
4.25%, 2/01/25-9/01/33(b) | | | 800 | | | 800,000 |
| | | | | | |
| | |
Florida – 1.6% | | | | | | |
Palm Beach Cnty
(St Andrews Sch)
7.25%, 10/01/28(b) | | | 2,000 | | | 2,000,000 |
Univ of North Florida Fndtn, Inc.
(Parking Sys Rev Bonds)
6.25%, 5/01/28(b) | | | 1,000 | | | 1,000,000 |
| | | | | | |
| | | | | | 3,000,000 |
| | | | | | |
Iowa – 0.8% | | | | | | |
Iowa Hgr Ed Loan Auth
5.60%, 11/01/36(b) | | | 1,500 | | | 1,500,000 |
| | | | | | |
| | |
Rhode Island – 0.3% | | | | | | |
Rhode Island Hlth & Ed Bldg Corp.
(Catholic Sch Pool Program Issue)
7.25%, 4/01/35(b) | | | 500 | | | 500,000 |
| | | | | | |
| | |
Total Short-Term Municipal Notes
(cost $8,600,000) | | | | | | 8,600,000 |
| | | | | | |
| | |
Total Investments – 97.0%
(cost $192,791,489) | | | | | | 183,588,987 |
Other assets less liabilities – 3.0% | | | | | | 5,725,703 |
| | | | | | |
| | |
Net Assets – 100.0% | | | | | $ | 189,314,690 |
| | | | | | |
| | |
| ALLIANCEBERNSTEIN MUNICIPAL INCOME FUND II • | | 95 |
Virginia Portfolio—Portfolio of Investments
INTEREST RATE SWAP TRANSACTIONS (see Note D)
| | | | | | | | | | | | | | |
| | | | | | | Rate Type | | | |
Swap
Counterparty | | Notional
Amount
(000) | | Termination
Date | | Payments
made
by the
Portfolio | | | Payments
received
by the
Portfolio | | | Unrealized
Appreciation/
(Depreciation) |
Citibank | | $ | 7,000 | | 12/01/17 | | BMA | * | | 3.7920 | % | | $ | 166,972 |
| (a) | Variable rate coupon, rate shown as of September 30, 2008. |
| (b) | Variable Rate Demand Notes (VRDN) are instruments whose interest rates change on a specific date (such as coupon date or interest payment date) or whose interest rates vary with changes in a designated base rate (such as the prime interest rate). This instrument is payable on demand and is secured by letters of credit or other credit support agreements from major banks. |
| * | Variable interest rate based on the Securities Industry & Financial Markets Association, formerly the Bond Market Association (BMA). |
| † | An auction rate security whose interest rate resets at each auction date. Auctions are typically held every week or month. The rate shown is as of September 30, 2008 and the aggregate market value of these securities amounted to $3,915,000 or 2.1% of net assets. |
As of September 30, 2008, the Portfolio held 32% of net assets in insured bonds (of this amount 0% represents the Portfolio’s holding in pre-refunded insured bonds).
Glossary:
AMBAC – American Bond Assurance Corporation
AMT – Alternative Minimum Tax (subject to)
CDA – Community Development Administration
CDD – Community Development District
CFD – Community Facilities District
EDA – Economic Development Agency
FGIC – Financial Guaranty Insurance Company
FNMA – Federal National Mortgage Association
FSA – Financial Security Assurance Inc.
GNMA – Government National Mortgage Association
HDA – Housing Development Authority
HFA – Housing Finance Authority
IDA – Industrial Development Authority/Agency
MBIA – Municipal Bond Investors Assurance
MFHR – Multi-Family Housing Revenue
SFMR – Single Family Mortgage Revenue
SWR – Solid Waste Revenue
See notes to financial statements.
| | |
| 96 | | • ALLIANCEBERNSTEIN MUNICIPAL INCOME FUND II |
Virginia Portfolio—Portfolio of Investments
STATEMENT OF ASSETS & LIABILITIES
September 30, 2008
| | | | | | | | |
| | | Arizona | | | Florida | |
| Assets | | | | | | | | |
Investments in securities, at value
(cost: $215,940,748 and $167,914,805, respectively) | | $ | 207,366,187 | | | $ | 156,748,839 | |
Cash | | | 202,245 | | | | – 0 | – |
Unrealized appreciation of interest rate swap contracts | | | 29,212 | | | | 307,161 | |
Interest receivable | | | 2,826,372 | | | | 3,044,851 | |
Receivable for investment securities sold | | | 2,220,000 | | | | 1,755,000 | |
Receivable for shares of beneficial interest sold | | | 1,452,211 | | | | 302,556 | |
| | | | | | | | |
Total assets | | | 214,096,227 | | | | 162,158,407 | |
| | | | | | | | |
| Liabilities | | | | | | | | |
Due to custodian | | | – 0 | – | | | 200,355 | |
Unrealized depreciation of interest rate swap contracts | | | 33,627 | | | | – 0 | – |
Payable for shares of beneficial interest redeemed | | | 2,107,515 | | | | 1,089,548 | |
Dividends payable | | | 227,997 | | | | 181,339 | |
Distribution fee payable | | | 81,148 | | | | 66,821 | |
Advisory fee payable | | | 63,754 | | | | 42,167 | |
Administrative fee payable | | | 22,747 | | | | 22,332 | |
Transfer Agent fee payable | | | 3,213 | | | | 2,301 | |
Accrued expenses and other liabilities | | | 74,256 | | | | 68,837 | |
| | | | | | | | |
Total liabilities | | | 2,614,257 | | | | 1,673,700 | |
| | | | | | | | |
Net Assets | | $ | 211,481,970 | | | $ | 160,484,707 | |
| | | | | | | | |
| Composition of Net Assets | | | | | | | | |
Shares of beneficial interest, at par | | $ | 205,859 | | | $ | 172,506 | |
Additional paid-in capital | | | 220,542,321 | | | | 174,903,334 | |
Distributions in excess of net investment income | | | (201,924 | ) | | | (196,816 | ) |
Accumulated net realized loss on investment transactions | | | (485,310 | ) | | | (3,535,512 | ) |
Net unrealized depreciation of investments | | | (8,578,976 | ) | | | (10,858,805 | ) |
| | | | | | | | |
| | $ | 211,481,970 | | | $ | 160,484,707 | |
| | | | | | | | |
Net Asset Value Per Share—unlimited shares authorized, $.01 par value
| | | | | | | | | |
| Arizona Portfolio | | Net Assets | | Shares
Outstanding | | Net Asset
Value | |
| Class A | | $ | 166,997,412 | | 16,250,748 | | $ | 10.28 | * |
| | |
| Class B | | $ | 14,484,420 | | 1,411,332 | | $ | 10.26 | |
| | |
| Class C | | $ | 30,000,138 | | 2,923,813 | | $ | 10.26 | |
| | |
| | | |
| Florida Portfolio | | | | | | | |
| Class A | | $ | 118,867,420 | | 12,778,931 | | $ | 9.30 | * |
| | |
| Class B | | $ | 12,628,159 | | 1,357,029 | | $ | 9.31 | |
| | |
| Class C | | $ | 28,989,128 | | 3,114,665 | | $ | 9.31 | |
| | |
| * | The maximum offering price per share for Class A shares of Arizona Portfolio and Florida Portfolio were $10.74 and $9.71, respectively, which reflects a sales charge of 4.25%. |
See notes to financial statements.
| | |
| ALLIANCEBERNSTEIN MUNICIPAL INCOME FUND II • | | 97 |
Statement of Assets & Liabilities
| | | | | | | | |
| | | Massachusetts | | | Michigan | |
| Assets | | | | | | | | |
Investments in securities, at value
(cost: $157,587,956 and $111,606,065, respectively) | | $ | 154,866,085 | | | $ | 109,284,619 | |
Cash | | | 265 | | | | 435,617 | |
Unrealized appreciation of interest rate swap contracts | | | 470,486 | | | | 339,980 | |
Receivable for shares of beneficial interest sold | | | 2,316,046 | | | | 425,603 | |
Interest receivable | | | 2,026,828 | | | | 1,737,489 | |
Receivable for investment securities sold | | | 1,630,000 | | | | 1,170,000 | |
| | | | | | | | |
Total assets | | | 161,309,710 | | | | 113,393,308 | |
| | | | | | | | |
| Liabilities | | | | | | | | |
Payable for shares of beneficial interest redeemed | | | 673,979 | | | | 634,791 | |
Dividends payable | | | 157,217 | | | | 109,600 | |
Distribution fee payable | | | 69,857 | | | | 55,299 | |
Advisory fee payable | | | 44,040 | | | | 36,298 | |
Administrative fee payable | | | 21,021 | | | | 22,340 | |
Transfer Agent fee payable | | | 5,827 | | | | 3,211 | |
Accrued expenses and other liabilities | | | 75,483 | | | | 66,070 | |
| | | | | | | | |
Total liabilities | | | 1,047,424 | | | | 927,609 | |
| | | | | | | | |
Net Assets | | $ | 160,262,286 | | | $ | 112,465,699 | |
| | | | | | | | |
| Composition of Net Assets | | | | | | | | |
Shares of beneficial interest, at par | | $ | 154,775 | | | $ | 111,338 | |
Additional paid-in capital | | | 166,369,536 | | | | 115,028,927 | |
Distributions in excess of net investment income | | | (158,060 | ) | | | (135,674 | ) |
Accumulated net realized loss on investment transactions | | | (3,852,580 | ) | | | (557,426 | ) |
Net unrealized depreciation of investments | | | (2,251,385 | ) | | | (1,981,466 | ) |
| | | | | | | | |
| | $ | 160,262,286 | | | $ | 112,465,699 | |
| | | | | | | | |
Net Asset Value Per Share—unlimited shares authorized, $.01 par value
| | | | | | | | | |
| Massachusetts Portfolio | | Net Assets | | Shares
Outstanding | | Net Asset
Value | |
| Class A | | $ | 109,951,536 | | 10,612,560 | | $ | 10.36 | * |
| | |
| Class B | | $ | 13,477,069 | | 1,303,309 | | $ | 10.34 | |
| | |
| Class C | | $ | 36,833,681 | | 3,561,591 | | $ | 10.34 | |
| | |
| | | |
| Michigan Portfolio | | | | | | | |
| Class A | | $ | 67,798,200 | | 6,707,704 | | $ | 10.11 | * |
| | |
| Class B | | $ | 10,377,615 | | 1,028,366 | | $ | 10.09 | |
| | |
| Class C | | $ | 34,289,884 | | 3,397,764 | | $ | 10.09 | |
| | |
| * | The maximum offering price per share for Class A shares of Massachusetts Portfolio and Michigan Portfolio were $10.82 and $10.56, respectively, which reflects a sales charge of 4.25%. |
See notes to financial statements.
| | |
| 98 | | • ALLIANCEBERNSTEIN MUNICIPAL INCOME FUND II |
Statement of Assets & Liabilities
| | | | | | | | |
| | | Minnesota | | | New Jersey | |
| Assets | | | | | | | | |
Investments in securities, at value
(cost: $96,687,381 and $163,862,218, respectively) | | $ | 93,995,638 | | | $ | 158,697,601 | |
Cash | | | – 0 | – | | | 242 | |
Unrealized appreciation of interest rate swap contracts | | | 166,334 | | | | 156,181 | |
Interest receivable | | | 1,421,104 | | | | 2,277,783 | |
Receivable for shares of beneficial interest sold | | | 91,157 | | | | 1,178,131 | |
Receivable for investment securities sold | | | – 0 | – | | | 1,720,000 | |
| | | | | | | | |
Total assets | | | 95,674,233 | | | | 164,029,938 | |
| | | | | | | | |
| Liabilities | | | | | | | | |
Due to custodian | | | 13,953 | | | | – 0 | – |
Payable for shares of beneficial interest redeemed | | | 359,030 | | | | 830,773 | |
Dividends payable | | | 95,690 | | | | 181,135 | |
Distribution fee payable | | | 34,563 | | | | 69,425 | |
Advisory fee payable | | | 22,366 | | | | 53,981 | |
Administrative fee payable | | | 22,090 | | | | 22,309 | |
Transfer Agent fee payable | | | 2,145 | | | | 4,394 | |
Accrued expenses and other liabilities | | | 63,349 | | | | 75,485 | |
| | | | | | | | |
Total liabilities | | | 613,186 | | | | 1,237,502 | |
| | | | | | | | |
Net Assets | | $ | 95,061,047 | | | $ | 162,792,436 | |
| | | | | | | | |
| Composition of Net Assets | | | | | | | | |
Shares of beneficial interest, at par | | $ | 99,933 | | | $ | 178,288 | |
Additional paid-in capital | | | 98,422,178 | | | | 179,646,460 | |
Distributions in excess of net investment
income | | | (103,060 | ) | | | (174,148 | ) |
Accumulated net realized loss on investment transactions | | | (832,595 | ) | | | (11,849,728 | ) |
Net unrealized depreciation of investments | | | (2,525,409 | ) | | | (5,008,436 | ) |
| | | | | | | | |
| | $ | 95,061,047 | | | $ | 162,792,436 | |
| | | | | | | | |
Net Asset Value Per Share—unlimited shares authorized, $.01 par value
| | | | | | | | | |
| Minnesota Portfolio | | Net Assets | | Shares
Outstanding | | Net Asset
Value | |
| Class A | | $ | 78,063,473 | | 8,207,479 | | $ | 9.51 | * |
| | |
| Class B | | $ | 2,805,088 | | 294,968 | | $ | 9.51 | |
| | |
| Class C | | $ | 14,192,486 | | 1,490,888 | | $ | 9.52 | |
| | |
| | | |
| New Jersey Portfolio | | | | | | | |
| Class A | | $ | 116,561,908 | | 12,767,392 | | $ | 9.13 | * |
| | |
| Class B | | $ | 13,898,214 | | 1,521,894 | | $ | 9.13 | |
| | |
| Class C | | $ | 32,332,314 | | 3,539,541 | | $ | 9.13 | |
| | |
| * | The maximum offering price per share for Class A shares of Minnesota Portfolio and New Jersey Portfolio were $9.93 and $9.54, respectively, which reflects a sales charge of 4.25%. |
See notes to financial statements.
| | |
| ALLIANCEBERNSTEIN MUNICIPAL INCOME FUND II • | | 99 |
Statement of Assets & Liabilities
| | | | | | | | |
| | | Ohio | | | Pennsylvania | |
| Assets | | | | | | | | |
Investments in securities, at value
(cost: $156,405,955 and $135,297,088, respectively) | | $ | 150,752,724 | | | $ | 130,951,172 | |
Cash | | | 12,680 | | | | 160,851 | |
Unrealized appreciation of interest rate swap contracts | | | 171,087 | | | | – 0 | – |
Interest receivable | | | 2,646,753 | | | | 2,304,137 | |
Receivable for investment securities sold | | | 1,792,750 | | | | 1,400,000 | |
Receivable for shares of beneficial interest sold | | | 658,280 | | | | 772,039 | |
| | | | | | | | |
Total assets | | | 156,034,274 | | | | 135,588,199 | |
| | | | | | | | |
| Liabilities | | | | | | | | |
Payable for shares of beneficial interest redeemed | | | 549,496 | | | | 716,066 | |
Dividends payable | | | 151,024 | | | | 139,609 | |
Distribution fee payable | | | 71,854 | | | | 59,082 | |
Advisory fee payable | | | 43,545 | | | | 44,236 | |
Administrative fee payable | | | 22,262 | | | | 22,330 | |
Transfer Agent fee payable | | | 3,693 | | | | 3,608 | |
Accrued expenses and other liabilities | | | 73,736 | | | | 68,150 | |
| | | | | | | | |
Total liabilities | | | 915,610 | | | | 1,053,081 | |
| | | | | | | | |
Net Assets | | $ | 155,118,664 | | | $ | 134,535,118 | |
| | | | | | | | |
| Composition of Net Assets | | | | | | | | |
Shares of beneficial interest, at par | | $ | 164,417 | | | $ | 137,935 | |
Additional paid-in capital | | | 165,875,726 | | | | 139,594,273 | |
Distributions in excess of net investment income | | | (142,517 | ) | | | (129,554 | ) |
Accumulated net realized loss on investment transactions | | | (5,296,818 | ) | | | (721,620 | ) |
Net unrealized depreciation of investments | | | (5,482,144 | ) | | | (4,345,916 | ) |
| | | | | | | | |
| | $ | 155,118,664 | | | $ | 134,535,118 | |
| | | | | | | | |
Net Asset Value Per Share—unlimited shares authorized, $.01 par value
| | | | | | | | | |
| Ohio Portfolio | | Net Assets | | Shares
Outstanding | | Net Asset
Value | |
| Class A | | $ | 101,481,154 | | 10,754,182 | | $ | 9.44 | * |
| | |
| Class B | | $ | 16,191,556 | | 1,717,361 | | $ | 9.43 | |
| | |
| Class C | | $ | 37,445,954 | | 3,970,138 | | $ | 9.43 | |
| | |
| | | |
| Pennsylvania Portfolio | | | | | | | |
| Class A | | $ | 93,095,788 | | 9,545,194 | | $ | 9.75 | * |
| | |
| Class B | | $ | 11,245,473 | | 1,152,851 | | $ | 9.75 | |
| | |
| Class C | | $ | 30,193,857 | | 3,095,480 | | $ | 9.75 | |
| | |
| * | The maximum offering price per share for Class A shares of Ohio Portfolio and Pennsylvania Portfolio were $9.86 and $10.18, respectively, which reflects a sales charge of 4.25%. |
See notes to financial statements.
| | |
| 100 | | • ALLIANCEBERNSTEIN MUNICIPAL INCOME FUND II |
Statement of Assets & Liabilities
| | | | |
| | | Virginia | |
| Assets | | | | |
Investments in securities, at value (cost $192,791,489) | | $ | 183,588,987 | |
Cash | | | 523,737 | |
Unrealized appreciation of interest rate swap contracts | | | 166,972 | |
Interest receivable | | | 2,435,191 | |
Receivable for shares of beneficial interest sold | | | 1,997,044 | |
Receivable for investment securities sold | | | 1,950,000 | |
| | | | |
Total assets | | | 190,661,931 | |
| | | | |
| Liabilities | | | | |
Payable for shares of beneficial interest redeemed | | | 950,423 | |
Dividends payable | | | 198,857 | |
Distribution fee payable | | | 77,021 | |
Advisory fee payable | | | 28,693 | |
Administrative fee payable | | | 22,340 | |
Transfer Agent fee payable | | | 3,016 | |
Accrued expenses and other liabilities | | | 66,891 | |
| | | | |
Total liabilities | | | 1,347,241 | |
| | | | |
Net Assets | | $ | 189,314,690 | |
| | | | |
| Composition of Net Assets | | | | |
Shares of beneficial interest, at par | | $ | 189,293 | |
Additional paid-in capital | | | 199,700,321 | |
Undistributed net investment income | | | 134,958 | |
Accumulated net realized loss on investment transactions | | | (1,674,352 | ) |
Net unrealized depreciation of investments | | | (9,035,530 | ) |
| | | | |
| | $ | 189,314,690 | |
| | | | |
Net Asset Value Per Share—unlimited shares authorized, $.01 par value
| | | | | | | | | |
| Virginia Portfolio | | Net Assets | | Shares
Outstanding | | Net Asset
Value | |
| Class A | | $ | 141,216,082 | | 14,111,795 | | $ | 10.01 | * |
| | |
| Class B | | $ | 11,582,149 | | 1,159,269 | | $ | 9.99 | |
| | |
| Class C | | $ | 36,516,459 | | 3,658,262 | | $ | 9.98 | |
| | |
| * | The maximum offering price per share for Class A shares of Virginia Portfolio was $10.45 which reflects a sales charge of 4.25%. |
See notes to financial statements.
| | |
| ALLIANCEBERNSTEIN MUNICIPAL INCOME FUND II • | | 101 |
Statement of Assets & Liabilities
STATEMENT OF OPERATIONS
Year Ended September 30, 2008
| | | | | | | | |
| | | Arizona | | | Florida | |
| Investment Income | | | | | | | | |
Interest | | $ | 10,211,098 | | | $ | 9,426,787 | |
| | | | | | | | |
| Expenses | | | | | | | | |
Advisory fee (see Note B) | | | 956,424 | | | | 813,645 | |
Distribution fee—Class A | | | 474,767 | | | | 390,893 | |
Distribution fee—Class B | | | 263,943 | | | | 185,927 | |
Distribution fee—Class C | | | 278,885 | | | | 319,196 | |
Transfer agency—Class A | | | 44,342 | | | | 42,237 | |
Transfer agency—Class B | | | 13,275 | | | | 11,066 | |
Transfer agency—Class C | | | 8,529 | | | | 11,090 | |
Custodian | | | 106,447 | | | | 108,758 | |
Administrative | | | 90,500 | | | | 92,500 | |
Audit | | | 46,377 | | | | 47,614 | |
Legal | | | 30,841 | | | | 26,484 | |
Registration | | | 26,205 | | | | 14,187 | |
Printing | | | 13,931 | | | | 18,871 | |
Trustees’ fees | | | 5,109 | | | | 5,534 | |
Miscellaneous | | | 8,996 | | | | 12,425 | |
| | | | | | | | |
Total expenses | | | 2,368,571 | | | | 2,100,427 | |
Less: expenses waived and reimbursed by the Adviser (see Note B) | | | (328,509 | ) | | | (334,827 | ) |
Less: expense offset arrangement
(see Note B) | | | (2,280 | ) | | | (1,696 | ) |
| | | | | | | | |
Net expenses | | | 2,037,782 | | | | 1,763,904 | |
| | | | | | | | |
Net investment income | | | 8,173,316 | | | | 7,662,883 | |
| | | | | | | | |
| Realized and Unrealized Gain (Loss) on Investment Transactions | | | | | | | | |
Net realized gain (loss) on: | | | | | | | | |
Investment transactions | | | (9,175 | ) | | | 460,402 | |
Futures contracts | | | (56,521 | ) | | | (50,306 | ) |
Swap contracts | | | 151,675 | | | | 231,700 | |
Net change in unrealized appreciation/depreciation of: | | | | | | | | |
Investments | | | (13,326,723 | ) | | | (15,629,898 | ) |
Swap contracts | | | (94,150 | ) | | | 14,441 | |
| | | | | | | | |
Net loss on investment transactions | | | (13,334,894 | ) | | | (14,973,661 | ) |
| | | | | | | | |
Contributions from Adviser (see Note B) | | | – 0 | – | | | 21,273 | |
| | | | | | | | |
Net Decrease in Net Assets from Operations | | $ | (5,161,578 | ) | | $ | (7,289,505 | ) |
| | | | | | | | |
See notes to financial statements.
| | |
| 102 | | • ALLIANCEBERNSTEIN MUNICIPAL INCOME FUND II |
Statement of Operations
| | | | | | | | |
| | | Massachusetts | | | Michigan | |
| Investment Income | | | | | | | | |
Interest | | $ | 6,904,796 | | | $ | 5,679,724 | |
| | | | | | | | |
| Expenses | | | | | | | | |
Advisory fee (see Note B) | | | 657,528 | | | | 534,659 | |
Distribution fee—Class A | | | 275,765 | | | | 200,443 | |
Distribution fee—Class B | | | 188,325 | | | | 154,884 | |
Distribution fee—Class C | | | 353,633 | | | | 365,101 | |
Transfer agency—Class A | | | 38,802 | | | | 34,041 | |
Transfer agency—Class B | | | 9,989 | | | | 11,689 | |
Transfer agency—Class C | | | 15,838 | | | | 20,585 | |
Custodian | | | 102,367 | | | | 102,131 | |
Administrative | | | 92,500 | | | | 92,500 | |
Audit | | | 42,376 | | | | 41,432 | |
Legal | | | 29,050 | | | | 26,178 | |
Registration | | | 27,411 | | | | 17,479 | |
Printing | | | 10,730 | | | | 10,560 | |
Trustees’ fees | | | 6,263 | | | | 5,581 | |
Miscellaneous | | | 8,593 | | | | 8,057 | |
| | | | | | | | |
Total expenses | | | 1,859,170 | | | | 1,625,320 | |
Less: expenses waived and reimbursed by the Adviser (see Note B) | | | (279,719 | ) | | | (59,300 | ) |
Less: expense offset arrangement
(see Note B) | | | (1,918 | ) | | | (2,018 | ) |
| | | | | | | | |
Net expenses | | | 1,577,533 | | | | 1,564,002 | |
| | | | | | | | |
Net investment income | | | 5,327,263 | | | | 4,115,722 | |
| | | | | | | | |
| Realized and Unrealized Gain (Loss) on Investment Transactions | | | | | | | | |
Net realized gain (loss) on: | | | | | | | | |
Investment transactions | | | 4,891 | | | | (591,861 | ) |
Futures contracts | | | (34,768 | ) | | | (31,661 | ) |
Swap contracts | | | 258,271 | | | | 172,465 | |
Net change in unrealized appreciation/depreciation of: | | | | | | | | |
Investments | | | (6,899,279 | ) | | | (6,343,716 | ) |
Swap contracts | | | 163,217 | | | | 49,305 | |
| | | | | | | | |
Net loss on investment transactions | | | (6,507,668 | ) | | | (6,745,468 | ) |
| | | | | | | | |
Contributions from Adviser (see Note B) | | | 287 | | | | – 0 | – |
| | | | | | | | |
Net Decrease in Net Assets from Operations | | $ | (1,180,118 | ) | | $ | (2,629,746 | ) |
| | | | | | | | |
See notes to financial statements.
| | |
| ALLIANCEBERNSTEIN MUNICIPAL INCOME FUND II • | | 103 |
Statement of Operations
| | | | | | | | |
| | | Minnesota | | | New Jersey | |
| Investment Income | | | | | | | | |
Interest | | $ | 4,703,919 | | | $ | 8,169,998 | |
| | | | | | | | |
| Expenses | | | | | | | | |
Advisory fee (see Note B) | | | 438,818 | | | | 733,013 | |
Distribution fee—Class A | | | 235,806 | | | | 329,422 | |
Distribution fee—Class B | | | 48,013 | | | | 201,985 | |
Distribution fee—Class C | | | 141,121 | | | | 328,861 | |
Transfer agency—Class A | | | 35,908 | | | | 55,125 | |
Transfer agency—Class B | | | 3,150 | | | | 14,680 | |
Transfer agency—Class C | | | 7,186 | | | | 17,880 | |
Custodian | | | 103,734 | | | | 104,333 | |
Administrative | | | 92,500 | | | | 92,500 | |
Audit | | | 40,481 | | | | 44,402 | |
Legal | | | 30,372 | | | | 26,281 | |
Registration | | | 13,255 | | | | 17,561 | |
Trustees’ fees | | | 5,010 | | | | 5,511 | |
Printing | | | 3,986 | | | | 14,236 | |
Miscellaneous | | | 6,098 | | | | 11,756 | |
| | | | | | | | |
Total expenses | | | 1,205,438 | | | | 1,997,546 | |
Less: expenses waived and reimbursed by the Adviser (see Note B) | | | (194,069 | ) | | | (206,318 | ) |
Less: expense offset arrangement
(see Note B) | | | (1,338 | ) | | | (2,477 | ) |
| | | | | | | | |
Net expenses | | | 1,010,031 | | | | 1,788,751 | |
| | | | | | | | |
Net investment income | | | 3,693,888 | | | | 6,381,247 | |
| | | | | | | | |
| Realized and Unrealized Gain (Loss) on Investment Transactions | | | | | | | | |
Net realized gain (loss) on: | | | | | | | | |
Investment transactions | | | (640 | ) | | | 297,231 | |
Futures contracts | | | (24,860 | ) | | | (40,983 | ) |
Swap contracts | | | 114,443 | | | | 155,930 | |
Net change in unrealized appreciation/depreciation of: | | | | | | | | |
Investments | | | (5,428,909 | ) | | | (11,270,833 | ) |
Swap contracts | | | 14,560 | | | | (19,338 | ) |
| | | | | | | | |
Net loss on investment transactions | | | (5,325,406 | ) | | | (10,877,993 | ) |
| | | | | | | | |
Net Decrease in Net Assets from Operations | | $ | (1,631,518 | ) | | $ | (4,496,746 | ) |
| | | | | | | | |
See notes to financial statements.
| | |
| 104 | | • ALLIANCEBERNSTEIN MUNICIPAL INCOME FUND II |
Statement of Operations
| | | | | | | | |
| | | Ohio | | | Pennsylvania | |
| Investment Income | | | | | | | | |
Interest | | $ | 7,833,588 | | | $ | 7,081,162 | |
| | | | | | | | |
| Expenses | | | | | | | | |
Advisory fee (see Note B) | | | 732,178 | | | | 644,818 | |
Distribution fee—Class A | | | 299,716 | | | | 287,203 | |
Distribution fee—Class B | | | 231,444 | | | | 163,137 | |
Distribution fee—Class C | | | 396,564 | | | | 312,447 | |
Transfer agency—Class A | | | 49,644 | | | | 55,769 | |
Transfer agency—Class B | | | 14,754 | | | | 13,039 | |
Transfer agency—Class C | | | 21,431 | | | | 19,534 | |
Custodian | | | 106,359 | | | | 106,584 | |
Administrative | | | 92,500 | | | | 92,500 | |
Audit | | | 44,491 | | | | 42,707 | |
Legal | | | 30,442 | | | | 27,332 | |
Printing | | | 25,029 | | | | 19,101 | |
Registration | | | 12,982 | | | | 12,421 | |
Trustees’ fees | | | 4,998 | | | | 5,840 | |
Miscellaneous | | | 11,023 | | | | 13,259 | |
| | | | | | | | |
Total expenses | | | 2,073,555 | | | | 1,815,691 | |
Less: expenses waived and reimbursed by the Adviser (see Note B) | | | (248,529 | ) | | | (119,248 | ) |
Less: expense offset arrangement (see Note B) | | | (2,417 | ) | | | (2,252 | ) |
| | | | | | | | |
Net expenses | | | 1,822,609 | | | | 1,694,191 | |
| | | | | | | | |
Net investment income | | | 6,010,979 | | | | 5,386,971 | |
| | | | | | | | |
| Realized and Unrealized Gain (Loss) on Investment Transactions | | | | | | | | |
Net realized gain (loss) on: | | | | | | | | |
Investment transactions | | | 570,005 | | | | 27,689 | |
Futures contracts | | | (40,983 | ) | | | (37,876 | ) |
Swap contracts | | | 171,138 | | | | 108,380 | |
Net change in unrealized appreciation/depreciation of: | | | | | | | | |
Investments | | | (10,842,830 | ) | | | (9,506,148 | ) |
Swap contracts | | | (17,446 | ) | | | (63,374 | ) |
| | | | | | | | |
Net loss on investment transactions | | | (10,160,116 | ) | | | (9,471,329 | ) |
| | | | | | | | |
Net Decrease in Net Assets from Operations | | $ | (4,149,137 | ) | | $ | (4,084,358 | ) |
| | | | | | | | |
See notes to financial statements.
| | |
| ALLIANCEBERNSTEIN MUNICIPAL INCOME FUND II • | | 105 |
Statement of Operations
| | | | |
| | | Virginia | |
| Investment Income | | | | |
Interest | | $ | 8,959,390 | |
| | | | |
| Expenses | | | | |
Advisory fee (see Note B) | | | 841,105 | |
Distribution fee—Class A | | | 394,743 | |
Distribution fee—Class B | | | 179,220 | |
Distribution fee—Class C | | | 374,090 | |
Transfer agency—Class A | | | 50,752 | |
Transfer agency—Class B | | | 10,066 | |
Transfer agency—Class C | | | 15,934 | |
Custodian | | | 105,581 | |
Administrative | | | 92,500 | |
Audit | | | 43,983 | |
Legal | | | 29,977 | |
Printing | | | 18,885 | |
Registration | | | 13,923 | |
Trustees’ fees | | | 4,965 | |
Miscellaneous | | | 10,375 | |
| | | | |
Total expenses | | | 2,186,099 | |
Less: expenses waived and reimbursed by the Adviser
(see Note B) | | | (450,885 | ) |
Less: expense offset arrangement (see Note B) | | | (2,129 | ) |
| | | | |
Net expenses | | | 1,733,085 | |
| | | | |
Net investment income | | | 7,226,305 | |
| | | | |
| Realized and Unrealized Gain (Loss) on Investment Transactions | | | | |
Net realized gain (loss) on: | | | | |
Investment transactions | | | 28,845 | |
Futures contracts | | | (47,198 | ) |
Swap contracts | | | 213,579 | |
Net change in unrealized appreciation/depreciation of: | | | | |
Investments | | | (12,729,927 | ) |
Swap contracts | | | 42,171 | |
| | | | |
Net loss on investment transactions | | | (12,492,530 | ) |
| | | | |
Net Decrease in Net Assets from Operations | | $ | (5,266,225 | ) |
| | | | |
See notes to financial statements.
| | |
| 106 | | • ALLIANCEBERNSTEIN MUNICIPAL INCOME FUND II |
Statement of Operations
STATEMENT OF CHANGES IN NET ASSETS
| | | | | | | | |
| | | Arizona | |
| | | Year Ended
September 30,
2008 | | | Year Ended
September 30,
2007 | |
| Increase (Decrease) in Net Assets from Operations | | | | | | | | |
Net investment income | | $ | 8,173,316 | | | $ | 7,983,394 | |
Net realized gain on investment transactions | | | 85,979 | | | | 252,670 | |
Net change in unrealized appreciation/depreciation of investments | | | (13,420,873 | ) | | | (2,923,882 | ) |
| | | | | | | | |
Net increase (decrease) in net assets from operations | | | (5,161,578 | ) | | | 5,312,182 | |
| Dividends to Shareholders from | | | | | | | | |
Net investment income | | | | | | | | |
Class A | | | (6,374,797 | ) | | | (5,586,668 | ) |
Class B | | | (877,735 | ) | | | (1,503,920 | ) |
Class C | | | (929,319 | ) | | | (858,229 | ) |
| Transactions in Shares of Beneficial Interest | | | | | | | | |
Net increase (decrease) | | | 20,333,217 | | | | (9,266,642 | ) |
| | | | | | | | |
Total increase (decrease) | | | 6,989,788 | | | | (11,903,277 | ) |
| Net Assets | | | | | | | | |
Beginning of period | | | 204,492,182 | | | | 216,395,459 | |
| | | | | | | | |
End of period (including distributions in excess of net investment income of $(201,924) and $(167,695), respectively) | | $ | 211,481,970 | | | $ | 204,492,182 | |
| | | | | | | | |
See notes to financial statements.
| | |
| ALLIANCEBERNSTEIN MUNICIPAL INCOME FUND II • | | 107 |
Statement of Changes in Net Assets
| | | | | | | | |
| | | Florida | |
| | | Year Ended
September 30,
2008 | | | Year Ended
September 30,
2007 | |
| Increase (Decrease) in Net Assets from Operations | | | | | | | | |
Net investment income | | $ | 7,662,883 | | | $ | 8,448,091 | |
Net realized gain on investment transactions | | | 641,796 | | | | 1,815,917 | |
Net change in unrealized appreciation/depreciation of investments | | | (15,615,457 | ) | | | (5,072,460 | ) |
Contributions from Adviser (see Note B) | | | 21,273 | | | | – 0 | – |
| | | | | | | | |
Net increase (decrease) in net assets from operations | | | (7,289,505 | ) | | | 5,191,548 | |
| Dividends to Shareholders from | | | | | | | | |
Net investment income | | | | | | | | |
Class A | | | (5,856,840 | ) | | | (5,927,254 | ) |
Class B | | | (701,532 | ) | | | (1,162,922 | ) |
Class C | | | (1,210,000 | ) | | | (1,347,966 | ) |
| Transactions in Shares of Beneficial Interest | | | | | | | | |
Net decrease | | | (16,632,194 | ) | | | (19,972,567 | ) |
| | | | | | | | |
Total decrease | | | (31,690,071 | ) | | | (23,219,161 | ) |
| Net Assets | | | | | | | | |
Beginning of period | | | 192,174,778 | | | | 215,393,939 | |
| | | | | | | | |
End of period (including distributions in excess of net investment income of $(196,816) and $(216,819), respectively) | | $ | 160,484,707 | | | $ | 192,174,778 | |
| | | | | | | | |
See notes to financial statements.
| | |
| 108 | | • ALLIANCEBERNSTEIN MUNICIPAL INCOME FUND II |
Statement of Changes in Net Assets
| | | | | | | | |
| | | Massachusetts | |
| | | Year Ended
September 30,
2008 | | | Year Ended
September 30,
2007 | |
| Increase (Decrease) in Net Assets from Operations | | | | | | | | |
Net investment income | | $ | 5,327,263 | | | $ | 5,199,361 | |
Net realized gain on investment transactions | | | 228,394 | | | | 706,630 | |
Net change in unrealized appreciation/depreciation of investments | | | (6,736,062 | ) | | | (2,379,147 | ) |
Contributions from Adviser (see Note B) | | | 287 | | | | – 0 | – |
| | | | | | | | |
Net increase (decrease) in net assets from operations | | | (1,180,118 | ) | | | 3,526,844 | |
| Dividends to Shareholders from | | | | | | | | |
Net investment income | | | | | | | | |
Class A | | | (3,695,120 | ) | | | (2,817,460 | ) |
Class B | | | (630,334 | ) | | | (1,161,698 | ) |
Class C | | | (1,180,855 | ) | | | (1,224,095 | ) |
| Transactions in Shares of Beneficial Interest | | | | | | | | |
Net increase (decrease) | | | 32,919,269 | | | | (6,636,425 | ) |
| | | | | | | | |
Total increase (decrease) | | | 26,232,842 | | | | (8,312,834 | ) |
| Net Assets | | | | | | | | |
Beginning of period | | | 134,029,444 | | | | 142,342,278 | |
| | | | | | | | |
End of period (including distributions in excess of net investment income of $(158,060) and $(138,505), respectively) | | $ | 160,262,286 | | | $ | 134,029,444 | |
| | | | | | | | |
See notes to financial statements.
| | |
| ALLIANCEBERNSTEIN MUNICIPAL INCOME FUND II • | | 109 |
Statement of Changes in Net Assets
| | | | | | | | |
| | | Michigan | |
| | | Year Ended
September 30,
2008 | | | Year Ended
September 30,
2007 | |
| Increase (Decrease) in Net Assets from Operations | | | | | | | | |
Net investment income | | $ | 4,115,722 | | | $ | 4,518,570 | |
Net realized gain (loss) on investment transactions | | | (451,057 | ) | | | 257,392 | |
Net change in unrealized appreciation/depreciation of investments | | | (6,294,411 | ) | | | (1,714,414 | ) |
| | | | | | | | |
Net increase (decrease) in net assets from operations | | | (2,629,746 | ) | | | 3,061,548 | |
| Dividends and Distributions to Shareholders from | | | | | | | | |
Net investment income | | | | | | | | |
Class A | | | (2,574,535 | ) | | | (2,417,113 | ) |
Class B | | | (489,229 | ) | | | (857,768 | ) |
Class C | | | (1,154,917 | ) | | | (1,252,927 | ) |
Net realized gain on investments | | | | | | | | |
Class A | | | (131,968 | ) | | | (259,975 | ) |
Class B | | | (37,691 | ) | | | (121,587 | ) |
Class C | | | (75,845 | ) | | | (165,841 | ) |
| Transactions in Shares of Beneficial Interest | | | | | | | | |
Net decrease | | | (2,707,760 | ) | | | (12,725,856 | ) |
| | | | | | | | |
Total decrease | | | (9,801,691 | ) | | | (14,739,519 | ) |
| Net Assets | | | | | | | | |
Beginning of period | | | 122,267,390 | | | | 137,006,909 | |
| | | | | | | | |
End of period (including distributions in excess of net investment income of $(135,674) and $(119,904), respectively) | | $ | 112,465,699 | | | $ | 122,267,390 | |
| | | | | | | | |
See notes to financial statements.
| | |
| 110 | | • ALLIANCEBERNSTEIN MUNICIPAL INCOME FUND II |
Statement of Changes in Net Assets
| | | | | | | | |
| | | Minnesota | |
| | | Year Ended
September 30,
2008 | | | Year Ended
September 30,
2007 | |
| Increase (Decrease) in Net Assets from Operations | | | | | | | | |
Net investment income | | $ | 3,693,888 | | | $ | 3,638,421 | |
Net realized gain on investment transactions | | | 88,943 | | | | 109,122 | |
Net change in unrealized appreciation/depreciation of investments | | | (5,414,349 | ) | | | (1,546,923 | ) |
| | | | | | | | |
Net increase (decrease) in net assets from operations | | | (1,631,518 | ) | | | 2,200,620 | |
| Dividends to Shareholders from | | | | | | | | |
Net investment income | | | | | | | | |
Class A | | | (3,130,860 | ) | | | (2,861,003 | ) |
Class B | | | (156,743 | ) | | | (289,271 | ) |
Class C | | | (462,600 | ) | | | (488,482 | ) |
| Transactions in Shares of Beneficial Interest | | | | | | | | |
Net increase (decrease) | | | 6,653,588 | | | | (2,156,615 | ) |
| | | | | | | | |
Total increase (decrease) | | | 1,271,867 | | | | (3,594,751 | ) |
| Net Assets | | | | | | | | |
Beginning of period | | | 93,789,180 | | | | 97,383,931 | |
| | | | | | | | |
End of period (including distributions in excess of net investment income of $(103,060) and $(98,041), respectively) | | $ | 95,061,047 | | | $ | 93,789,180 | |
| | | | | | | | |
See notes to financial statements.
| | |
| ALLIANCEBERNSTEIN MUNICIPAL INCOME FUND II • | | 111 |
Statement of Changes in Net Assets
| | | | | | | | |
| | | New Jersey | |
| | | Year Ended
September 30,
2008 | | | Year Ended
September 30,
2007 | |
| Increase (Decrease) in Net Assets from Operations | | | | | | | | |
Net investment income | | $ | 6,381,247 | | | $ | 6,157,969 | |
Net realized gain on investment transactions | | | 412,178 | | | | 786,793 | |
Net change in unrealized appreciation/depreciation of investments | | | (11,290,171 | ) | | | (3,499,208 | ) |
| | | | | | | | |
Net increase (decrease) in net assets from operations | | | (4,496,746 | ) | | | 3,445,554 | |
| Dividends to Shareholders from | | | | | | | | |
Net investment income | | | | | | | | |
Class A | | | (4,590,422 | ) | | | (3,710,850 | ) |
Class B | | | (700,370 | ) | | | (1,267,491 | ) |
Class C | | | (1,143,165 | ) | | | (1,167,676 | ) |
| Transactions in Shares of Beneficial Interest | | | | | | | | |
Net increase | | | 12,279,186 | | | | 4,248,623 | |
| | | | | | | | |
Total increase | | | 1,348,483 | | | | 1,548,160 | |
| Net Assets | | | | | | | | |
Beginning of period | | | 161,443,953 | | | | 159,895,793 | |
| | | | | | | | |
End of period (including distributions in excess of net investment income of $(174,148) and $(162,334), respectively) | | $ | 162,792,436 | | | $ | 161,443,953 | |
| | | | | | | | |
See notes to financial statements.
| | |
| 112 | | • ALLIANCEBERNSTEIN MUNICIPAL INCOME FUND II |
Statement of Changes in Net Assets
| | | | | | | | |
| | | Ohio | |
| | | Year Ended
September 30,
2008 | | | Year Ended
September 30,
2007 | |
| Increase (Decrease) in Net Assets from Operations | | | | | | | | |
Net investment income | | $ | 6,010,979 | | | $ | 6,168,587 | |
Net realized gain on investment transactions | | | 700,160 | | | | 405,349 | |
Net change in unrealized appreciation/depreciation of investments | | | (10,860,276 | ) | | | (2,089,927 | ) |
| | | | | | | | |
Net increase (decrease) in net assets from operations | | | (4,149,137 | ) | | | 4,484,009 | |
| Dividends to Shareholders from | | | | | | | | |
Net investment income | | | | | | | | |
Class A | | | (3,999,609 | ) | | | (3,576,771 | ) |
Class B | | | (762,572 | ) | | | (1,200,354 | ) |
Class C | | | (1,309,943 | ) | | | (1,382,134 | ) |
| Transactions in Shares of Beneficial Interest | | | | | | | | |
Net increase (decrease) | | | 2,015,616 | | | | (8,727,511 | ) |
| | | | | | | | |
Total decrease | | | (8,205,645 | ) | | | (10,402,761 | ) |
| Net Assets | | | | | | | | |
Beginning of period | | | 163,324,309 | | | | 173,727,070 | |
| | | | | | | | |
End of period (including distributions in excess of net investment income of $(142,517) and $(133,534) respectively) | | $ | 155,118,664 | | | $ | 163,324,309 | |
| | | | | | | | |
See notes to financial statements.
| | |
| ALLIANCEBERNSTEIN MUNICIPAL INCOME FUND II • | | 113 |
Statement of Changes in Net Assets
| | | | | | | | |
| | | Pennsylvania | |
| | | Year Ended
September 30,
2008 | | | Year Ended
September 30,
2007 | |
| Increase (Decrease) in Net Assets from Operations | | | | | | | | |
Net investment income | | $ | 5,386,971 | | | $ | 5,348,311 | |
Net realized gain on investment transactions | | | 98,193 | | | | 159,957 | |
Net change in unrealized appreciation/depreciation of investments | | | (9,569,522 | ) | | | (2,145,660 | ) |
| | | | | | | | |
Net increase (decrease) in net assets from operations | | | (4,084,358 | ) | | | 3,362,608 | |
| Dividends to Shareholders from | | | | | | | | |
Net investment income | | | | | | | | |
Class A | | | (3,828,243 | ) | | | (3,357,673 | ) |
Class B | | | (534,773 | ) | | | (912,588 | ) |
Class C | | | (1,029,588 | ) | | | (1,055,053 | ) |
| Transactions in Shares of Beneficial Interest | | | | | | | | |
Net decrease | | | (1,238,392 | ) | | | (1,717,829 | ) |
| | | | | | | | |
Total decrease | | | (10,715,354 | ) | | | (3,680,535 | ) |
| Net Assets | | | | | | | | |
Beginning of period | | | 145,250,472 | | | | 148,931,007 | |
| | | | | | | | |
End of period (including distributions in excess of net investment income of $(129,554) and $(126,775), respectively) | | $ | 134,535,118 | | | $ | 145,250,472 | |
| | | | | | | | |
See notes to financial statements.
| | |
| 114 | | • ALLIANCEBERNSTEIN MUNICIPAL INCOME FUND II |
Statement of Changes in Net Assets
| | | | | | | | |
| | | Virginia | |
| | | Year Ended
September 30,
2008 | | | Year Ended
September 30,
2007 | |
| Increase (Decrease) in Net Assets from Operations | | | | | | | | |
Net investment income | | $ | 7,226,305 | | | $ | 7,055,270 | |
Net realized gain on investment transactions | | | 195,226 | | | | 1,088,302 | |
Net change in unrealized appreciation/depreciation of investments | | | (12,687,756 | ) | | | (3,747,643 | ) |
| | | | | | | | |
Net increase (decrease) in net assets from operations | | | (5,266,225 | ) | | | 4,395,929 | |
| Dividends to Shareholders from | | | | | | | | |
Net investment income | | | | | | | | |
Class A | | | (5,418,958 | ) | | | (4,710,573 | ) |
Class B | | | (613,385 | ) | | | (1,086,563 | ) |
Class C | | | (1,283,008 | ) | | | (1,233,258 | ) |
| Transactions in Shares of Beneficial Interest | | | | | | | | |
Net increase | | | 23,036,289 | | | | 601,903 | |
| | | | | | | | |
Total increase (decrease) | | | 10,454,713 | | | | (2,032,562 | ) |
| Net Assets | | | | | | | | |
Beginning of period | | | 178,859,977 | | | | 180,892,539 | |
| | | | | | | | |
End of period (including undistributed net investment income of $134,958 and $138,511, respectively) | | $ | 189,314,690 | | | $ | 178,859,977 | |
| | | | | | | | |
See notes to financial statements.
| | |
| ALLIANCEBERNSTEIN MUNICIPAL INCOME FUND II • | | 115 |
Statement of Changes in Net Assets
NOTES TO FINANCIAL STATEMENTS
September 30, 2008
NOTE A
Significant Accounting Policies
AllianceBernstein Municipal Income Fund II (the “Fund”), which is a Massachusetts Business Trust, is registered under the Investment Company Act of 1940, as an open-end management investment company. The Arizona Portfolio, Florida Portfolio, Massachusetts Portfolio, Michigan Portfolio, Minnesota Portfolio, New Jersey Portfolio and Ohio Portfolio are each diversified Portfolios. Each of the other Portfolios is non-diversified. The Fund operates as a series company currently comprised of nine portfolios: Arizona Portfolio, Florida Portfolio, Massachusetts Portfolio, Michigan Portfolio, Minnesota Portfolio, New Jersey Portfolio, Ohio Portfolio, Pennsylvania Portfolio and Virginia Portfolio (the “Portfolios”). Each series is considered to be a separate entity for financial reporting and tax purposes. Each portfolio offers Class A, Class B and Class C shares. Class A shares are sold with a front-end sales charge of up to 4.25% for purchases not exceeding $1,000,000. With respect to purchases of $1,000,000 or more, Class A shares redeemed within one year of purchase may be subject to a contingent deferred sales charge of 1%. Class B shares are currently sold with a contingent deferred sales charge which declines from 3% to zero depending on the period of time the shares are held. Class B shares will automatically convert to Class A shares six years after the end of the calendar month of purchase. Class C shares are subject to a contingent deferred sales charge of 1% on redemptions made within the first year after purchase. All three classes of shares have identical voting, dividend, liquidation and other rights and the same terms and conditions, except that the classes bear different distribution and transfer agency expenses. Each class has exclusive voting rights with respect to its distribution plan. The financial statements have been prepared in conformity with U.S. generally accepted accounting principles, which require management to make certain estimates and assumptions that affect the reported amounts of assets and liabilities in the financial statements and amounts of income and expenses during the reporting period. Actual results could differ from those estimates. The following is a summary of the significant accounting policies followed by the Fund.
1. Security Valuation
Portfolio securities are valued at their current market value determined on the basis of market quotations or, if market quotations are not readily available or are deemed unreliable, at “fair value” as determined in accordance with procedures established by and under the general supervision of the Fund’s Board of Trustees.
In general, the market value of securities which are readily available and deemed reliable are determined as follows. Securities listed on a national securities exchange (other than securities listed on The NASDAQ Stock Market, Inc. (“NASDAQ”)) or on a foreign securities exchange are valued at the last sale price at the close of the exchange or foreign securities exchange. If there has
| | |
| 116 | | • ALLIANCEBERNSTEIN MUNICIPAL INCOME FUND II |
Notes to Financial Statements
been no sale on such day, the securities are valued at the mean of the closing bid and asked prices on such day. Securities listed on more than one exchange are valued by reference to the principal exchange on which the securities are traded; securities listed only on NASDAQ are valued in accordance with the NASDAQ Official Closing Price; listed put or call options are valued at the last sale price. If there has been no sale on that day, such securities will be valued at the closing bid prices on that day; open futures contracts and options thereon are valued using the closing settlement price or, in the absence of such a price; the most recent quoted bid price. If there are no quotations available for the day of valuation, the last available closing settlement price is used; securities traded in the over-the-counter market (“OTC”) are valued at the mean of the current bid and asked prices as reported by the National Quotation Bureau or other comparable sources; U.S. government securities and other debt instruments having 60 days or less remaining until maturity are valued at amortized cost if their original maturity was 60 days or less; or by amortizing their fair value as of the 61st day prior to maturity if their original term to maturity exceeded 60 days; fixed-income securities, including mortgage backed and asset backed securities, may be valued on the basis of prices provided by a pricing service or at a price obtained from one or more of the major broker/dealers. In cases where broker/dealer quotes are obtained, AllianceBernstein L.P. (the “Adviser”) may establish procedures whereby changes in market yields or spreads are used to adjust, on a daily basis, a recently obtained quoted price on a security; and OTC and other derivatives are valued on the basis of a quoted bid price or spread from a major broker/dealer in such security.
Investments in money market funds are valued at their net asset value each day.
Securities for which market quotations are not readily available (including restricted securities) or are deemed unreliable are valued at fair value. Factors considered in making this determination may include, but are not limited to, information obtained by contacting the issuer, analysts, analysis of the issuer’s financial statements or other available documents. In addition, the Fund may use fair value pricing for securities primarily traded in non-U.S. markets because, most foreign markets close well before the Fund values its securities at 4:00 p.m., Eastern Time. The earlier close of these foreign markets gives rise to the possibility that significant events, including broad market moves, may have occurred in the interim and may materially affect the value of those securities.
2. Taxes
It is each Portfolio’s policy to meet the requirements of the Internal Revenue Code applicable to regulated investment companies and to distribute all of its investment company taxable income and net realized gains, if any, to shareholders. Therefore, no provisions for federal income or excise taxes are required.
In accordance with the Financial Accounting Standards Board (“FASB”) Interpretation No. 48, Accounting for Uncertainties in Income Taxes (“FIN 48”),
| | |
| ALLIANCEBERNSTEIN MUNICIPAL INCOME FUND II • | | 117 |
Notes to Financial Statements
management has analyzed each Portfolio’s tax positions taken on federal and state income tax returns for all open tax years (the current and prior three tax years) and has concluded that no provision for income tax is required in the Portfolios’ financial statements.
3. Investment Income and Investment Transactions
Interest income is accrued daily. Investment transactions are accounted for on the date securities are purchased or sold. Investment gains and losses are determined on the identified cost basis. Each Portfolio may buy and sell securities from other affiliated funds in accordance with the requirements of Rule 17a-7 of the Investment Company Act of 1940. Each Portfolio has adopted procedures to ensure that all such transactions are done in accordance with the requirements of Rule 17a-7. The Portfolios amortize premium and accrete original issue discount and market discount as adjustments to interest income.
The Portfolios follow an investment policy of investing primarily in municipal obligations of one state. Economic changes affecting the state and certain of its public bodies and municipalities may affect the ability of issuers within the state to pay interest on, or repay principal of, municipal obligations held by the Portfolios.
4. Class Allocations
All income earned and expenses incurred by the Portfolios are borne on a pro-rata basis by each settled class of shares, based on the proportionate interest in the Portfolios represented by the net assets of such class, except for class specific expenses which are allocated to the respective class. Expenses of the Fund are charged to each Portfolio in proportion to net assets. Realized and unrealized gains and losses are allocated among the various share classes based on their respective net assets.
5. Dividends and Distributions
Dividends and distributions to shareholders are recorded on the ex-dividend date. Income and capital gains distributions are determined in accordance with federal tax regulations and may differ from those determined in accordance with U.S. generally accepted accounting principles. To the extent these differences are permanent, such amounts are reclassified within the capital accounts based on their federal tax basis treatment; temporary differences do not require such reclassification.
NOTE B
Advisory Fee and Other Transactions With Affiliates
Under the terms of the investment advisory agreement, the Fund pays the Adviser an advisory fee at an annual rate of .45% of the first $2.5 billion, .40% of the next $2.5 billion and .35% in excess of $5 billion, of the average daily net assets of each Portfolio. Such fees are accrued daily and paid monthly.
| | |
| 118 | | • ALLIANCEBERNSTEIN MUNICIPAL INCOME FUND II |
Notes to Financial Statements
The Adviser has voluntarily agreed to waive its fees and bear certain expenses to the extent necessary to limit the total portfolio operating expenses on an annual basis as follows:
| | | | | | | | | |
| Portfolios | | Class A | | | Class B | | | Class C | |
Arizona | | 0.78 | % | | 1.48 | % | | 1.48 | % |
Florida | | 0.78 | % | | 1.48 | % | | 1.48 | % |
Massachusetts | | 0.82 | % | | 1.52 | % | | 1.52 | % |
Michigan | | 1.01 | % | | 1.71 | % | | 1.71 | % |
Minnesota | | 0.90 | % | | 1.60 | % | | 1.60 | % |
New Jersey | | 0.87 | % | | 1.57 | % | | 1.57 | % |
Ohio | | 0.85 | % | | 1.55 | % | | 1.55 | % |
Pennsylvania | | 0.95 | % | | 1.65 | % | | 1.65 | % |
Virginia | | 0.72 | % | | 1.42 | % | | 1.42 | % |
For the year ended September 30, 2008, the Adviser has voluntarily agreed to waive a portion of its advisory fees. The aggregate amounts of such fee waivers were as follows: Arizona Portfolio, $328,509; Florida Portfolio, $334,827; Massachusetts Portfolio, $279,719; Michigan Portfolio, $59,300; Minnesota Portfolio, $194,069; New Jersey Portfolio, $206,318; Ohio Portfolio, $248,529; Pennsylvania Portfolio, $119,248, and Virginia Portfolio, $450,885.
During the year ended September 30, 2008, the Adviser made payments of $21,273 and $287 to the Florida Portfolio and Massachusetts Portfolio, respectively, for losses incurred due to trade entry errors.
Pursuant to the investment advisory agreement, the Arizona, Florida, Massachusetts, Michigan, Minnesota, New Jersey, Ohio, Pennsylvania, and Virginia Portfolios paid $90,500, $92,500, $92,500, $92,500, $92,500, $92,500, $92,500, $92,500, and $92,500, respectively, to the Adviser representing the cost of certain legal and accounting services provided to these Portfolios by the Adviser for the year ended September 30, 2008. Additionally, the Adviser voluntarily agreed to waive a portion of such fees for the Michigan, Minnesota and Virginia Portfolios in the amount of $24,500 each.
Each Portfolio compensates AllianceBernstein Investor Services, Inc. (“ABIS”), a wholly-owned subsidiary of the Adviser, under a Transfer Agency Agreement, for providing personnel and facilities to perform transfer agency services for each Portfolio. ABIS may make payments to intermediaries that provide omnibus account services, sub-accounting services and/or networking services. For the year ended September 30, 2008, such compensation retained by ABIS amounted to: Arizona Portfolio, $33,393; Florida Portfolio, $26,326; Massachusetts Portfolio, $31,002; Michigan Portfolio, $38,083; Minnesota Portfolio, $25,554; New Jersey Portfolio, $47,125; Ohio Portfolio, $40,224; Pennsylvania Portfolio, $42,348; and Virginia Portfolio, $35,628.
For the year ended September 30, 2008, each Portfolio’s expenses were reduced under an expense offset arrangement with ABIS, as follows: Arizona Portfolio, by $2,280; Florida Portfolio, by $1,696; Massachusetts Portfolio, by $1,918;
| | |
| ALLIANCEBERNSTEIN MUNICIPAL INCOME FUND II • | | 119 |
Notes to Financial Statements
Michigan Portfolio, by $2,018; Minnesota Portfolio, by $1,338; New Jersey Portfolio, by $2,477; Ohio Portfolio, by $2,417; Pennsylvania Portfolio, by $2,252; and Virginia Portfolio, by $2,129.
AllianceBernstein Investments, Inc. (the “Distributor”), a wholly-owned subsidiary of the Adviser, serves as the distributor of the Fund’s shares. The Distributor has advised the Fund that it has retained front-end sales charges from sales of Class A shares and received contingent deferred sales charges imposed upon redemptions by shareholders of Class A, Class B and Class C shares for each Portfolio for the year ended September 30, 2008 as follows:
| | | | | | | | | | | | | |
| | | Front End Sales
Charges | | Contingent Deferred Sales
Charges |
| Portfolio | | Class A | | Class A | | | Class B | | Class C |
Arizona | | $ | 31,380 | | $ | – 0 | – | | $ | 8,413 | | $ | 10,705 |
Florida | | | 12,741 | | | – 0 | – | | | 3,415 | | | 2,109 |
Massachusetts | | | 23,369 | | | 13,974 | | | | 2,979 | | | 2,709 |
Michigan | | | 9,132 | | | – 0 | – | | | 5,195 | | | 2,997 |
Minnesota | | | 9,021 | | | – 0 | – | | | 212 | | | 994 |
New Jersey | | | 11,500 | | | – 0 | – | | | 10,090 | | | 1,481 |
Ohio | | | 13,824 | | | – 0 | – | | | 5,689 | | | 3,643 |
Pennsylvania | | | 12,441 | | | – 0 | – | | | 3,961 | | | 3,582 |
Virginia | | | 27,568 | | | 3,000 | | | | 7,012 | | | 8,857 |
NOTE C
Distribution Services Agreement
Each Portfolio has adopted a Distribution Services Agreement (the “Agreement”) pursuant to Rule 12b-1 under the Investment Company Act of 1940. Under the Agreement, each Portfolio pays distribution and servicing fees to the Distributor at an annual rate of up to .30% of each Portfolio’s average daily net assets attributable to Class A shares and 1% of each Portfolio’s average daily net assets attributable to both Class B and Class C shares. Such fees are accrued daily and paid monthly. The Agreement provides that the Distributor will use such payments in their entirety for distribution assistance and promotional activities. The Distributor has incurred expenses in excess of the distribution costs reimbursed by each Portfolio as follows:
| | | | | | |
| Portfolio | | Class B | | Class C |
Arizona | | $ | 3,553,393 | | $ | 1,617,357 |
Florida | | | 3,910,567 | | | 2,976,702 |
Massachusetts | | | 3,492,430 | | | 3,180,999 |
Michigan | | | 3,257,372 | | | 3,936,820 |
Minnesota | | | 2,673,051 | | | 2,450,145 |
New Jersey | | | 5,392,401 | | | 3,179,769 |
Ohio | | | 4,446,897 | | | 3,436,185 |
Pennsylvania | | | 3,664,243 | | | 3,112,483 |
Virginia | | | 3,678,824 | | | 2,524,957 |
While such costs may be recovered from each Portfolio in future periods so long as the Agreement is in effect, the rate of the distribution and servicing fees
| | |
| 120 | | • ALLIANCEBERNSTEIN MUNICIPAL INCOME FUND II |
Notes to Financial Statements
payable under the Agreement may not be increased without a shareholder vote. In accordance with the Agreement, there is no provision for recovery of unreimbursed distribution costs incurred by the Distributor beyond the current fiscal year for Class A shares. The Agreement also provides that the Adviser may use its own resources to finance the distribution of each Portfolio’s shares.
NOTE D
Investment Transactions
Purchases and sales of investment securities (excluding short-term investments and U.S. government securities) for the year ended September 30, 2008 were as follows:
| | | | | | |
| Portfolio | | Purchases | | Sales |
Arizona | | $ | 66,043,119 | | $ | 50,356,240 |
Florida | | | 50,449,658 | | | 51,589,951 |
Massachusetts | | | 69,671,426 | | | 41,770,450 |
Michigan | | | 13,946,246 | | | 23,833,579 |
Minnesota | | | 18,051,604 | | | 6,295,000 |
New Jersey | | | 58,521,698 | | | 47,398,000 |
Ohio | | | 11,380,052 | | | 14,035,750 |
Pennsylvania | | | 12,045,170 | | | 12,246,917 |
Virginia | | | 72,442,031 | | | 45,186,180 |
There were no purchases or sales of U.S. government and government agency obligations during the period.
At September 30, 2008, the cost of investments for federal income tax purposes, gross unrealized appreciation, gross unrealized depreciation and net unrealized appreciation/depreciation of investments for each Portfolio were as follows (excluding swap contracts):
| | | | | | | | | | | | | | |
| Portfolio | | Tax Cost | | Gross
Unrealized
Appreciation | | Gross
Unrealized
Depreciation | | | Net
Unrealized
Depreciation | |
Arizona | | $ | 215,954,923 | | $ | 2,967,890 | | $ | (11,556,626 | ) | | $ | (8,588,736 | ) |
Florida | | | 167,970,412 | | | 1,075,140 | | | (12,296,713 | ) | | | (11,221,573 | ) |
Massachusetts | | | 157,662,208 | | | 2,954,699 | | | (5,750,822 | ) | | | (2,796,123 | ) |
Michigan | | | 111,632,232 | | | 2,190,471 | | | (4,538,084 | ) | | | (2,347,613 | ) |
Minnesota | | | 96,713,859 | | | 1,269,273 | | | (3,987,494 | ) | | | (2,718,221 | ) |
New Jersey | | | 163,963,922 | | | 2,200,166 | | | (7,466,487 | ) | | | (5,266,321 | ) |
Ohio | | | 156,405,955 | | | 2,624,009 | | | (8,277,240 | ) | | | (5,653,231 | ) |
Pennsylvania | | | 135,298,176 | | | 2,331,300 | | | (6,678,304 | ) | | | (4,347,004 | ) |
Virginia | | | 193,036,033 | | | 1,487,347 | | | (10,934,393 | ) | | | (9,447,046 | ) |
1. Swap Agreements
The Portfolios may enter into swaps to hedge its exposure to interest rates and credit risk or for investment purposes. A swap is an agreement that obligates two parties to exchange a series of cash flows at specified intervals based upon or calculated by reference to changes in specified prices or rates for a specified
| | |
| ALLIANCEBERNSTEIN MUNICIPAL INCOME FUND II • | | 121 |
Notes to Financial Statements
amount of an underlying asset. The payment flows are usually netted against each other, with the difference being paid by one party to the other.
Risks may arise as a result of the failure of the counterparty to the swap contract to comply with the terms of the swap contract. The loss incurred by the failure of a counterparty is generally limited to the net interest payment to be received by the Portfolios, and/or the termination value at the end of the contract. Therefore, the Portfolios consider the creditworthiness of each counterparty to a swap contract in evaluating potential credit risk. Additionally, risks may arise from unanticipated movements in interest rates or in the value of the underlying securities.
The Portfolios accrue for the interim payments on swap contracts on a daily basis, with the net amount recorded within unrealized appreciation/depreciation of swap contracts on the statement of assets and liabilities. Once the interim payments are settled in cash, the net amount is recorded as realized gain/loss on swaps, in addition to realized gain/loss recorded upon the termination of swap contracts on the statements of operations. Fluctuations in the value of swap contracts are recorded as a component of net change in unrealized appreciation/ depreciation of investments.
The Portfolios may enter into credit default swaps. The Portfolios may purchase credit protection on the referenced obligation of the credit default swap (“Buy Contract”) or provide credit protection on the referenced obligation of the credit default swap (“Sale Contract”). A sale/(buy) in a credit default swap provides upon the occurrence of a credit event, as defined in the swap agreement, for the Portfolio to buy/(sell) from/(to) the counterparty at the notional amount (the “Notional Amount”) and receive/(deliver) the principal amount of the referenced obligation. If a credit event occurs, the maximum payout amount for a Sale Contract is limited to the Notional Amount of the swap contract (“Maximum Payout Amount”). During the term of the swap agreement, the Portfolio receives/(pays) fixed payments from/(to) the respective counterparty, calculated at the agreed upon interest rate applied to the Notional Amount. These interim payments are recorded within unrealized appreciation/depreciation of swap contracts on the statement of assets and liabilities.
Credit default swaps may involve greater risks than if a Portfolio had invested in the referenced obligation directly. Credit default swaps are subject to general market risk, liquidity risk, counterparty risk and credit risk. If the Portfolio is a buyer and no credit event occurs, it will lose its investment. In addition, if the Portfolio is a seller and a credit event occurs, the value of the referenced obligation received by the Portfolio coupled with the periodic payments previously received, may be less than the Maximum Payout Amount it pays to the buyer, resulting in a loss to the Portfolio.
| | |
| 122 | | • ALLIANCEBERNSTEIN MUNICIPAL INCOME FUND II |
Notes to Financial Statements
2. Financial Futures Contracts
The Portfolios may buy or sell financial futures contracts for the purpose of hedging its portfolio against adverse affects of anticipated movements in the market. The Portfolios bear the market risk that arises from changes in the value of these financial instruments and the imperfect correlation between movements in the price of the futures contracts and movements in the price of securities hedged or used to cover.
At the time the Portfolios enter into a futures contract, the Portfolios deposit and maintain as collateral an initial margin with the broker, as required by the exchange on which the transaction is affected. Pursuant to the contract, the Portfolios agree to receive from or pay to the broker an amount of cash equal to the daily fluctuation in the value of the contract. Such receipts or payments are known as variation margin and are recorded by the Portfolios as unrealized gains or losses. Risks may arise from the potential inability of a counterparty to meet the terms of a contract. When the contract is closed, the Portfolios record a realized gain or loss equal to the difference between the value of the contract at the time it was opened and the time it was closed.
NOTE E
Shares of Beneficial Interest
Transactions in shares of beneficial interest for each Portfolio were as follows:
| | | | | | | | | | | | | | | | | | |
| | | | | | | | | | | | | | | | | | |
| | | Shares | | | | | Amount | | | |
| | | Year Ended
September 30,
2008 | | | Year Ended
September 30,
2007 | | | | | Year Ended
September 30,
2008 | | | Year Ended
September 30,
2007 | | | |
| | | | | |
| Arizona Portfolio | | | | | | | | | | | | | | | | | | |
| Class A | | | | | | | | | | | | | | | | | | |
Shares sold | | 4,204,678 | | | 2,766,270 | | | | | $ | 45,614,871 | | | $ | 30,384,819 | | | |
| | | | |
Shares issued in reinvestment of dividends | | 333,863 | | | 280,820 | | | | | | 3,615,525 | | | | 3,089,209 | | | |
| | | | |
Shares converted from Class B | | 1,620,765 | | | 782,156 | | | | | | 17,461,169 | | | | 8,579,497 | | | |
| | | | |
Shares redeemed | | (2,892,144 | ) | | (3,391,027 | ) | | | | | (31,283,592 | ) | | | (37,333,814 | ) | | |
| | | | |
Net increase | | 3,267,162 | | | 438,219 | | | | | $ | 35,407,973 | | | $ | 4,719,711 | | | |
| | | | |
| | | | | | | | | | | | | | | | | | |
| Class B | | | | | | | | | | | | | | | | | | |
Shares sold | | 55,333 | | | 127,421 | | | | | $ | 599,049 | | | $ | 1,399,763 | | | |
| | | | |
Shares issued in reinvestment of dividends | | 52,976 | | | 86,848 | | | | | | 574,301 | | | | 954,741 | | | |
| | | | |
Shares converted to Class A | | (1,623,652 | ) | | (783,487 | ) | | | | | (17,461,169 | ) | | | (8,579,497 | ) | | |
| | | | |
Shares redeemed | | (385,306 | ) | | (829,571 | ) | | | | | (4,165,558 | ) | | | (9,127,821 | ) | | |
| | | | |
Net decrease | | (1,900,649 | ) | | (1,398,789 | ) | | | | $ | (20,453,377 | ) | | $ | (15,352,814 | ) | | |
| | | | |
| | |
| ALLIANCEBERNSTEIN MUNICIPAL INCOME FUND II • | | 123 |
Notes to Financial Statements
| | | | | | | | | | | | | | | | | | |
| | | | | | | | | | | | | | | | | | |
| | | Shares | | | | | Amount | | | |
| | | Year Ended
September 30,
2008 | | | Year Ended
September 30,
2007 | | | | | Year Ended
September 30,
2008 | | | Year Ended
September 30,
2007 | | | |
| | | | | |
| Arizona Portfolio | | | | | | | | | | | | | | | | | | |
| Class C | | | | | | | | | | | | | | | | | | |
Shares sold | | 978,400 | | | 444,707 | | | | | $ | 10,576,533 | | | $ | 4,885,740 | | | |
| | | | |
Shares issued in reinvestment of dividends | | 46,225 | | | 39,335 | | | | | | 499,700 | | | | 432,055 | | | |
| | | | |
Shares redeemed | | (527,110 | ) | | (359,929 | ) | | | | | (5,697,612 | ) | | | (3,951,334 | ) | | |
| | | | |
Net increase | | 497,515 | | | 124,113 | | | | | $ | 5,378,621 | | | $ | 1,366,461 | | | |
| | | | |
| | | | | | | | | | | | | | | | | | |
| | | | | | | | | | | | | | | | | | |
| | | Shares | | | | | Amount | | | |
| | | Year Ended
September 30,
2008 | | | Year Ended
September 30,
2007 | | | | | Year Ended
September 30,
2008 | | | Year Ended
September 30,
2007 | | | |
| | | | | |
| Florida Portfolio | | | | | | | | | | | | | | | | | | |
| Class A | | | | | | | | | | | | | | | | | | |
Shares sold | | 1,244,054 | | | 2,154,467 | | | | | $ | 12,437,941 | | | $ | 22,078,165 | | | |
| | | | |
Shares issued in reinvestment of dividends | | 266,157 | | | 226,727 | | | | | | 2,656,332 | | | | 2,316,613 | | | |
| | | | |
Shares converted from Class B | | 728,660 | | | 627,086 | | | | | | 7,241,515 | | | | 6,400,734 | | | |
| | | | |
Shares redeemed | | (2,755,431 | ) | | (3,116,944 | ) | | | | | (27,444,836 | ) | | | (31,972,822 | ) | | |
| | | | |
Net decrease | | (516,560 | ) | | (108,664 | ) | | | | $ | (5,109,048 | ) | | $ | (1,177,310 | ) | | |
| | | | |
| | | | | | | | | | | | | | | | | | |
| Class B | | | | | | | | | | | | | | | | | | |
Shares sold | | 94,122 | | | 93,518 | | | | | $ | 941,273 | | | $ | 958,350 | | | |
| | | | |
Shares issued in reinvestment of dividends | | 32,169 | | | 43,978 | | | | | | 321,712 | | | | 450,211 | | | |
| | | | |
Shares converted to Class A | | (728,577 | ) | | (626,774 | ) | | | | | (7,241,515 | ) | | | (6,400,734 | ) | | |
| | | | |
Shares redeemed | | (368,950 | ) | | (868,274 | ) | | | | | (3,684,766 | ) | | | (8,893,397 | ) | | |
| | | | |
Net decrease | | (971,236 | ) | | (1,357,552 | ) | | | | $ | (9,663,296 | ) | | $ | (13,885,570 | ) | | |
| | | | |
| | | | | | | | | | | | | | | | | | |
| Class C | | | | | | | | | | | | | | | | | | |
Shares sold | | 249,585 | | | 261,437 | | | | | $ | 2,507,136 | | | $ | 2,682,018 | | | |
| | | | |
Shares issued in reinvestment of dividends | | 62,372 | | | 62,298 | | | | | | 622,918 | | | | 637,392 | | | |
| | | | |
Shares redeemed | | (498,797 | ) | | (803,729 | ) | | | | | (4,989,904 | ) | | | (8,229,097 | ) | | |
| | | | |
Net decrease | | (186,840 | ) | | (479,994 | ) | | | | $ | (1,859,850 | ) | | $ | (4,909,687 | ) | | |
| | | | |
| | |
| 124 | | • ALLIANCEBERNSTEIN MUNICIPAL INCOME FUND II |
Notes to Financial Statements
| | | | | | | | | | | | | | | | | | |
| | | | | | | | | | | | | | | | | | |
| | | Shares | | | | | Amount | | | |
| | | Year Ended
September 30,
2008 | | | Year Ended
September 30,
2007 | | | | | Year Ended
September 30,
2008 | | | Year Ended
September 30,
2007 | | | |
| | | | | |
| Massachusetts Portfolio | | | | | | | | | | | | | | | | | | |
| Class A | | | | | | | | | | | | | | | | | | |
Shares sold | | 4,128,095 | | | 1,720,779 | | | | | $ | 44,372,359 | | | $ | 18,695,450 | | | |
| | | | |
Shares issued in reinvestment of dividends | | 230,116 | | | 178,128 | | | | | | 2,480,227 | | | | 1,932,440 | | | |
| | | | |
Shares converted from Class B | | 895,820 | | | 705,338 | | | | | | 9,635,577 | | | | 7,632,486 | | | |
| | | | |
Shares redeemed | | (1,519,783 | ) | | (1,496,587 | ) | | | | | (16,374,152 | ) | | | (16,244,603 | ) | | |
| | | | |
Net increase | | 3,734,248 | | | 1,107,658 | | | | | $ | 40,114,011 | | | $ | 12,015,773 | | | |
| | | | |
| | | | | | | | | | | | | | | | | | |
| Class B | | | | | | | | | | | | | | | | | | |
Shares sold | | 100,242 | | | 60,339 | | | | | $ | 1,080,329 | | | $ | 655,401 | | | |
| | | | |
Shares issued in reinvestment of dividends | | 41,106 | | | 73,458 | | | | | | 442,912 | | | | 796,396 | | | |
| | | | |
Shares converted to Class A | | (897,654 | ) | | (706,644 | ) | | | | | (9,635,577 | ) | | | (7,632,486 | ) | | |
| | | | |
Shares redeemed | | (277,414 | ) | | (865,840 | ) | | | | | (2,996,388 | ) | | | (9,395,094 | ) | | |
| | | | |
Net decrease | | (1,033,720 | ) | | (1,438,687 | ) | | | | $ | (11,108,724 | ) | | $ | (15,575,783 | ) | | |
| | | | |
| | | | | | | | | | | | | | | | | | |
| Class C | | | | | | | | | | | | | | | | | | |
Shares sold | | 821,182 | | | 276,302 | | | | | $ | 8,823,279 | | | $ | 2,999,884 | | | |
| | | | |
Shares issued in reinvestment of dividends | | 77,110 | | | 75,619 | | | | | | 829,782 | | | | 819,486 | | | |
| | | | |
Shares redeemed | | (532,530 | ) | | (636,361 | ) | | | | | (5,739,079 | ) | | | (6,895,785 | ) | | |
| | | | |
Net increase (decrease) | | 365,762 | | | (284,440 | ) | | | | $ | 3,913,982 | | | $ | (3,076,415 | ) | | |
| | | | |
| | | | | | | | | | | | | | | | | | |
| | | | | | | | | | | | | | | | | | |
| | | Shares | | | | | Amount | | | |
| | | Year Ended
September 30,
2008 | | | Year Ended
September 30,
2007 | | | | | Year Ended
September 30,
2008 | | | Year Ended
September 30,
2007 | | | |
| | | | | |
| Michigan Portfolio | | | | | | | | | | | | | | | | | | |
| Class A | | | | | | | | | | | | | | | | | | |
Shares sold | | 1,080,726 | | | 887,203 | | | | | $ | 11,532,381 | | | $ | 9,585,224 | | | |
| | | | |
Shares issued in reinvestment of dividends and distributions | | 176,907 | | | 162,907 | | | | | | 1,882,966 | | | | 1,750,933 | | | |
| | | | |
Shares converted from Class B | | 682,589 | | | 466,181 | | | | | | 7,241,606 | | | | 5,013,420 | | | |
| | | | |
Shares redeemed | | (1,188,357 | ) | | (1,510,021 | ) | | | | | (12,656,416 | ) | | | (16,331,669 | ) | | |
| | | | |
| Net increase | | 751,865 | | | 6,270 | | | | | $ | 8,000,537 | | | $ | 17,908 | | | |
| | | | |
| | |
| ALLIANCEBERNSTEIN MUNICIPAL INCOME FUND II • | | 125 |
Notes to Financial Statements
| | | | | | | | | | | | | | | | | | |
| | | | | | | | | | | | | | | | | | |
| | | Shares | | | | | Amount | | | |
| | | Year Ended
September 30,
2008 | | | Year Ended
September 30,
2007 | | | | | Year Ended
September 30,
2008 | | | Year Ended
September 30,
2007 | | | |
| | | | | |
| Michigan Portfolio | | | | | | | | | | | | | | | | | | |
| Class B | | | | | | | | | | | | | | | | | | |
Shares sold | | 90,711 | | | 91,982 | | | | | $ | 964,433 | | | $ | 994,862 | | | |
| | | | |
Shares issued in reinvestment of dividends and distributions | | 37,834 | | | 67,000 | | | | | | 402,970 | | | | 724,001 | | | |
| | | | |
Shares converted to Class A | | (683,936 | ) | | (467,049 | ) | | | | | (7,241,606 | ) | | | (5,013,420 | ) | | |
| | | | |
Shares redeemed | | (330,066 | ) | | (607,176 | ) | | | | | (3,528,128 | ) | | | (6,543,883 | ) | | |
| | | | |
| Net decrease | | (885,457 | ) | | (915,243 | ) | | | | $ | (9,402,331 | ) | | $ | (9,838,440 | ) | | |
| | | | |
| | | | | | | | | | | | | | | | | | |
| Class C | | | | | | | | | | | | | | | | | | |
Shares sold | | 398,785 | | | 363,422 | | | | | $ | 4,231,371 | | | $ | 3,922,697 | | | |
| | | | |
Shares issued in reinvestment of dividends and distributions | | 89,727 | | | 99,515 | | | | | | 954,324 | | | | 1,074,912 | | | |
| | | | |
Shares redeemed | | (610,380 | ) | | (731,779 | ) | | | | | (6,491,661 | ) | | | (7,902,933 | ) | | |
| | | | |
| Net decrease | | (121,868 | ) | | (268,842 | ) | | | | $ | (1,305,966 | ) | | $ | (2,905,324 | ) | | |
| | | | |
| | | | | | | | | | | | | | | | | | |
| | | | | | | | | | | | | | | | | | |
| | | Shares | | | | | Amount | | | |
| | | Year Ended
September 30,
2008 | | | Year Ended
September 30,
2007 | | | | | Year Ended
September 30,
2008 | | | Year Ended
September 30,
2007 | | | |
| | | | | |
| Minnesota Portfolio | | | | | | | | | | | | | | | | | | |
| Class A | | | | | | | | | | | | | | | | | | |
Shares sold | | 1,668,885 | | | 1,193,213 | | | | | $ | 16,714,379 | | | $ | 12,051,009 | | | |
| | | | |
Shares issued in reinvestment of dividends | | 152,740 | | | 129,201 | | | | | | 1,527,289 | | | | 1,306,955 | | | |
| | | | |
Shares converted from Class B | | 323,769 | | | 223,159 | | | | | | 3,228,208 | | | | 2,255,830 | | | |
| | | | |
Shares redeemed | | (1,243,316 | ) | | (1,215,922 | ) | | | | | (12,400,056 | ) | | | (12,305,707 | ) | | |
| | | | |
| Net increase | | 902,078 | | | 329,651 | | | | | $ | 9,069,820 | | | $ | 3,308,087 | | | |
| | | | |
| | | | | | | | | | | | | | | | | | |
| Class B | | | | | | | | | | | | | | | | | | |
Shares sold | | 13,396 | | | 17,933 | | | | | $ | 134,532 | | | $ | 181,240 | | | |
| | | | |
Shares issued in reinvestment
of dividends | | 10,124 | | | 17,320 | | | | | | 101,447 | | | | 175,322 | | | |
| | | | |
Shares converted to Class A | | (323,855 | ) | | (223,174 | ) | | | | | (3,228,208 | ) | | | (2,255,830 | ) | | |
| | | | |
Shares redeemed | | (58,856 | ) | | (194,869 | ) | | | | | (589,025 | ) | | | (1,972,334 | ) | | |
| | | | |
Net decrease | | (359,191 | ) | | (382,790 | ) | | | | $ | (3,581,254 | ) | | $ | (3,871,602 | ) | | |
| | | | |
| | |
| 126 | | • ALLIANCEBERNSTEIN MUNICIPAL INCOME FUND II |
Notes to Financial Statements
| | | | | | | | | | | | | | | | | | |
| | | | | | | | | | | | | | | | | | |
| | | Shares | | | | | Amount | | | |
| | | Year Ended
September 30,
2008 | | | Year Ended
September 30,
2007 | | | | | Year Ended
September 30,
2008 | | | Year Ended
September 30,
2007 | | | |
| | | | | |
Minnesota
Portfolio | | | | | | | | | | | | | | | | | | |
| Class C | | | | | | | | | | | | | | | | | | |
Shares sold | | 233,481 | | | 162,887 | | | | | $ | 2,333,859 | | | $ | 1,647,191 | | | |
| | | | |
Shares issued in reinvestment of dividends | | 34,930 | | | 34,732 | | | | | | 349,651 | | | | 351,815 | | | |
| | | | |
Shares redeemed | | (151,604 | ) | | (354,709 | ) | | | | | (1,518,488 | ) | | | (3,592,106 | ) | | |
| | | | |
Net increase (decrease) | | 116,807 | | | (157,090 | ) | | | | $ | 1,165,022 | | | $ | (1,593,100 | ) | | |
| | | | |
| | | | | | | | | | | | | | | | | | |
| | | | | | | | | | | | | | | | | | |
| | | Shares | | | | | Amount | | | |
| | | Year Ended
September 30,
2008 | | | Year Ended
September 30,
2007 | | | | | Year Ended
September 30,
2008 | | | Year Ended
September 30,
2007 | | | |
| | | | | |
New Jersey
Portfolio | | | | | | | | | | | | | | | | | | |
| Class A | | | | | | | | | | | | | | | | | | |
Shares sold | | 3,311,142 | | | 2,528,204 | | | | | $ | 31,734,493 | | | $ | 24,841,959 | | | |
| | | | |
Shares issued in reinvestment of dividends | | 246,294 | | | 174,632 | | | | | | 2,372,772 | | | | 1,717,554 | | | |
| | | | |
Shares converted from Class B | | 1,120,704 | | | 1,114,062 | | | | | | 10,789,107 | | | | 10,956,461 | | | |
| | | | |
Shares redeemed | | (2,277,655 | ) | | (1,820,739 | ) | | | | | (21,834,614 | ) | | | (17,929,193 | ) | | |
| | | | |
Net increase | | 2,400,485 | | | 1,996,159 | | | | | $ | 23,061,758 | | | $ | 19,586,781 | | | |
| | | | |
| | | | | | | | | | | | | | | | | | |
| Class B | | | | | | | | | | | | | | | | | | |
Shares sold | | 178,462 | | | 230,788 | | | | | $ | 1,717,216 | | | $ | 2,282,546 | | | |
| | | | |
Shares issued in reinvestment of dividends | | 52,203 | | | 83,423 | | | | | | 503,984 | | | | 822,563 | | | |
| | | | |
Shares converted to Class A | | (1,120,628 | ) | | (1,113,786 | ) | | | | | (10,789,107 | ) | | | (10,956,461 | ) | | |
| | | | |
Shares redeemed | | (382,929 | ) | | (712,564 | ) | | | | | (3,699,683 | ) | | | (7,036,793 | ) | | |
| | | | |
Net decrease | | (1,272,892 | ) | | (1,512,139 | ) | | | | $ | (12,267,590 | ) | | $ | (14,888,145 | ) | | |
| | | | |
| | | |
| Class C | | | | | | | | | | | | | | | | | | |
Shares sold | | 550,100 | | | 414,891 | | | | | $ | 5,287,856 | | | $ | 4,088,672 | | | |
| | | | |
Shares issued in reinvestment of dividends | | 83,299 | | | 75,244 | | | | | | 802,885 | | | | 741,324 | | | |
| | | | |
Shares redeemed | | (477,565 | ) | | (533,730 | ) | | | | | (4,605,723 | ) | | | (5,280,009 | ) | | |
| | | | |
Net increase (decrease) | | 155,834 | | | (43,595 | ) | | | | $ | 1,485,018 | | | $ | (450,013 | ) | | |
| | | | |
| | |
| ALLIANCEBERNSTEIN MUNICIPAL INCOME FUND II • | | 127 |
Notes to Financial Statements
| | | | | | | | | | | | | | | | | | |
| | | | | | | | | | | | | | | | | | |
| | | Shares | | | | | Amount | | | |
| | | Year Ended
September 30,
2008 | | | Year Ended
September 30,
2007 | | | | | Year Ended
September 30,
2008 | | | Year Ended
September 30,
2007 | | | |
| | | | | |
| Ohio Portfolio | | | | | | | | | | | | | | | | | | |
| Class A | | | | | | | | | | | | | | | | | | |
Shares sold | | 2,035,533 | | | 1,399,191 | | | | | $ | 20,324,202 | | | $ | 14,137,483 | | | |
| | | | |
Shares issued in reinvestment of dividends | | 259,663 | | | 214,063 | | | | | | 2,590,239 | | | | 2,163,056 | | | |
| | | | |
Shares converted from Class B | | 891,776 | | | 620,790 | | | | | | 8,868,001 | | | | 6,257,275 | | | |
| | | | |
Shares redeemed | | (1,756,660 | ) | | (1,561,050 | ) | | | | | (17,555,833 | ) | | | (15,764,681 | ) | | |
| | | | |
Net increase | | 1,430,312 | | | 672,994 | | | | | $ | 14,226,609 | | | $ | 6,793,133 | | | |
| | | | |
| | | | | | | | | | | | | | | | | | |
Class B | | | | | | | | | | | | | | | | | | |
Shares sold | | 150,118 | | | 150,177 | | | | | $ | 1,489,858 | | | $ | 1,521,552 | | | |
| | | | |
Shares issued in reinvestment of dividends | | 57,242 | | | 84,421 | | | | | | 571,517 | | | | 853,153 | | | |
| | | | |
Shares converted to Class A | | (892,674 | ) | | (621,313 | ) | | | | | (8,868,001 | ) | | | (6,257,274 | ) | | |
| | | | |
Shares redeemed | | (525,944 | ) | | (801,933 | ) | | | | | (5,248,383 | ) | | | (8,119,896 | ) | | |
| | | | |
Net decrease | | (1,211,258 | ) | | (1,188,648 | ) | | | | $ | (12,055,009 | ) | | $ | (12,002,465 | ) | | |
| | | | |
| | | | | | | | | | | | | | | | | | |
Class C | | | | | | | | | | | | | | | | | | |
Shares sold | | 434,992 | | | 347,876 | | | | | $ | 4,333,684 | | | $ | 3,517,661 | | | |
| | | | |
Shares issued in reinvestment of dividends | | 94,190 | | | 91,537 | | | | | | 939,482 | | | | 925,052 | | | |
| | | | |
Shares redeemed | | (545,596 | ) | | (787,261 | ) | | | | | (5,429,150 | ) | | | (7,960,892 | ) | | |
| | | | |
Net decrease | | (16,414 | ) | | (347,848 | ) | | | | $ | (155,984 | ) | | $ | (3,518,179 | ) | | |
| | | | |
| | | | | | | | | | | | | | | | | | |
| | | | | | | | | | | | | | | | | | |
| | | Shares | | | | | Amount | | | |
| | | Year Ended
September 30,
2008 | | | Year Ended
September 30,
2007 | | | | | Year Ended
September 30,
2008 | | | Year Ended
September 30,
2007 | | | |
| | | | | |
| Pennsylvania Portfolio | | | | | | | | | | | | | | | | | | |
| Class A | | | | | | | | | | | | | | | | | | |
Shares sold | | 1,417,866 | | | 1,156,884 | | | | | $ | 14,631,504 | | | $ | 12,172,306 | | | |
| | | | |
Shares issued in reinvestment of dividends | | 232,299 | | | 178,266 | | | | | | 2,397,456 | | | | 1,872,837 | | | |
| | | | |
Shares converted from Class B | | 711,726 | | | 787,273 | | | | | | 7,323,360 | | | | 8,251,502 | | | |
| | | | |
Shares redeemed | | (1,687,782 | ) | | (921,004 | ) | | | | | (17,429,553 | ) | | | (9,680,328 | ) | | |
| | | | |
Net increase | | 674,109 | | | 1,201,419 | | | | | $ | 6,922,767 | | | $ | 12,616,317 | | | |
| | | | |
| | |
| 128 | | • ALLIANCEBERNSTEIN MUNICIPAL INCOME FUND II |
Notes to Financial Statements
| | | | | | | | | | | | | | | | | | |
| | | | | | | | | | | | | | | | | | |
| | | Shares | | | | | Amount | | | |
| | | Year Ended
September 30,
2008 | | | Year Ended
September 30,
2007 | | | | | Year Ended
September 30,
2008 | | | Year Ended
September 30,
2007 | | | |
| | | | | |
| Pennsylvania Portfolio | | | | | | | | | | | | | | | | | | |
Class B | | | | | | | | | | | | | | | | | | |
Shares sold | | 134,392 | | | 119,545 | | | | | $ | 1,388,555 | | | $ | 1,256,533 | | | |
| | | | |
Shares issued in reinvestment of dividends | | 34,044 | | | 48,295 | | | | | | 352,157 | | | | 507,960 | | | |
| | | | |
Shares converted from Class B | | (711,826 | ) | | (787,067 | ) | | | | | (7,323,360 | ) | | | (8,251,502 | ) | | |
| | | | |
Shares redeemed | | (346,598 | ) | | (498,704 | ) | | | | | (3,595,931 | ) | | | (5,247,064 | ) | | |
| | | | |
Net decrease | | (889,988 | ) | | (1,117,931 | ) | | | | $ | (9,178,579 | ) | | $ | (11,734,073 | ) | | |
| | | | |
| | | | | | | | | | | | | | | | | | |
| Class C | | | | | | | | | | | | | | | | | | |
Shares sold | | 436,148 | | | 193,933 | | | | | $ | 4,505,635 | | | $ | 2,041,982 | | | |
| | | | |
Shares issued in reinvestment of dividends | | 68,442 | | | 64,650 | | | | | | 706,780 | | | | 679,552 | | | |
| | | | |
Shares redeemed | | (406,109 | ) | | (506,022 | ) | | | | | (4,194,995 | ) | | | (5,321,607 | ) | | |
| | | | |
Net increase (decrease) | | 98,481 | | | (247,439 | ) | | | | $ | 1,017,420 | | | $ | (2,600,073 | ) | | |
| | | | |
| | | | | | | | | | | | | | | | | | |
| | | | | | | | | | | | | | | | | | |
| | | Shares | | | | | Amount | | | |
| | | Year Ended
September 30,
2008 | | | Year Ended
September 30,
2007 | | | | | Year Ended
September 30,
2008 | | | Year Ended
September 30,
2007 | | | |
| | | | | |
| Virginia Portfolio | | | | | | | | | | | | | | | | | | |
| Class A | | | | | | | | | | | | | | | | | | |
Shares sold | | 3,424,960 | | | 1,707,960 | | | | | $ | 36,167,452 | | | $ | 18,376,267 | | | |
| | | | |
Shares issued in reinvestment of dividends | | 300,262 | | | 223,873 | | | | | | 3,178,233 | | | | 2,404,271 | | | |
| | | | |
Shares converted from Class B | | 956,875 | | | 885,555 | | | | | | 10,060,975 | | | | 9,502,541 | | | |
| | | | |
Shares redeemed | | (1,789,684 | ) | | (1,683,978 | ) | | | | | (18,890,631 | ) | | | (18,111,444 | ) | | |
| | | | |
Net increase | | 2,892,413 | | | 1,133,410 | | | | | $ | 30,516,029 | | | $ | 12,171,635 | | | |
| | | | |
| | | | | | | | | | | | | | | | | | |
| Class B | | | | | | | | | | | | | | | | | | |
Shares sold | | 108,002 | | | 112,869 | | | | | $ | 1,139,032 | | | $ | 1,206,823 | | | |
| | | | |
Shares issued in reinvestment of dividends | | 40,148 | | | 63,323 | | | | | | 425,388 | | | | 679,913 | | | |
| | | | |
Shares converted to Class A | | (958,536 | ) | | (887,073 | ) | | | | | (10,060,975 | ) | | | (9,502,541 | ) | | |
| | | | |
Shares redeemed | | (232,512 | ) | | (506,226 | ) | | | | | (2,467,859 | ) | | | (5,440,306 | ) | | |
| | | | |
Net decrease | | (1,042,898 | ) | | (1,217,107 | ) | | | | $ | (10,964,414 | ) | | $ | (13,056,111 | ) | | |
| | | | |
| | |
| ALLIANCEBERNSTEIN MUNICIPAL INCOME FUND II • | | 129 |
Notes to Financial Statements
| | | | | | | | | | | | | | | | | | |
| | | | | | | | | | | | | | | | | | |
| | | Shares | | | | | Amount | | | |
| | | Year Ended
September 30,
2008 | | | Year Ended
September 30,
2007 | | | | | Year Ended
September 30,
2008 | | | Year Ended
September 30,
2007 | | | |
| | | | | |
| Virginia Portfolio | | | | | | | | | | | | | | | | | | |
| Class C | | | | | | | | | | | | | | | | | | |
Shares sold | | 840,397 | | | 467,527 | | | | | $ | 8,883,532 | | | $ | 5,013,282 | | | |
| | | | |
Shares issued in reinvestment of dividends | | 87,183 | | | 71,574 | | | | | | 920,968 | | | | 766,840 | | | |
| | | | |
Shares redeemed | | (602,275 | ) | | (400,643 | ) | | | | | (6,319,826 | ) | | | (4,293,743 | ) | | |
| | | | |
Net increase | | 325,305 | | | 138,458 | | | | | $ | 3,484,674 | | | $ | 1,486,379 | | | |
| | | | |
NOTE F
Joint Credit Facility
A number of open-end mutual funds managed by the Adviser, including the Fund, participate in a $250 million revolving credit facility (the “Facility”) intended to provide short-term financing if necessary, subject to certain restrictions, in connection with abnormal redemption activity. Commitment fees related to the Facility are paid by the participating funds and are included in miscellaneous expenses in the statement of operations. The Fund did not utilize the Facility during the year ended September 30, 2008.
NOTE G
Distributions to Shareholders
The tax character of distributions paid during the fiscal years ended September 30, 2008 and September 30, 2007 were as follows:
| | | | | | |
| Arizona Portfolio | | 2008 | | 2007 |
Distributions paid from: | | | | | | |
Tax-exempt income | | $ | 8,156,800 | | $ | 7,948,817 |
Ordinary income | | | 25,051 | | | — |
| | | | | | |
Total distributions paid | | $ | 8,181,851 | | $ | 7,948,817 |
| | | | | | |
As of September 30, 2008, the components of accumulated earnings/(deficit) on a tax basis were as follows:
| | | | |
Undistributed Tax-Exempt Income | | $ | 25,538 | |
Accumulated capital and other losses | | | (471,133 | )(a) |
Unrealized appreciation/(depreciation) | | | (8,592,616 | )(b) |
| | | | |
Total accumulated earnings/(deficit) | | $ | (9,038,211 | )(c) |
| | | | |
(a) | On September 30, 2008, the Portfolio had a net capital loss carryforward for federal income tax purposes of $471,133 of which $383,250 expires in the year 2010 and $87,883 expires in the year 2011. To the extent future capital gains are offset by capital loss carryforwards, such gains will not be distributed. During the fiscal year ended September 30, 2008, the Portfolio utilized capital loss carryforwards of $81,545. The Portfolio had a capital loss carryforward expire in the amount of $167,868 in the current fiscal year. |
| | |
| 130 | | • ALLIANCEBERNSTEIN MUNICIPAL INCOME FUND II |
Notes to Financial Statements
(b) | The differences between book-basis and tax-basis unrealized appreciation/(depreciation) are attributable primarily to the tax deferral of losses on wash sales and the difference between the book and tax treatment of swap income. |
(c) | The difference between book-basis and tax-basis components of accumulated earnings/ (deficit) is attributable to dividends payable. |
During the current fiscal year, permanent differences primarily due to the tax treatment of Swaps, capital loss carryforward expiration, and a prior period adjustment resulted in a net increase in distributions in excess of net investment income, a net decrease in accumulated net realized loss on investment transactions, and a net decrease in additional paid in capital. This reclassification had no effect on net assets.
| | | | | | |
| Florida Portfolio | | 2008 | | 2007 |
Distributions paid from: | | | | | | |
Tax-exempt income | | $ | 7,641,385 | | $ | 8,438,142 |
Ordinary income | | | 126,987 | | | — |
| | | | | | |
Total distributions paid | | $ | 7,768,372 | | $ | 8,438,142 |
| | | | | | |
As of September 30, 2008, the components of accumulated earnings/(deficit) on a tax basis were as follows:
| | | | |
Accumulated capital and other losses | | $ | (3,479,905 | )(a) |
Unrealized appreciation/(depreciation) | | | (10,929,889 | )(b) |
| | | | |
Total accumulated earnings/(deficit) | | $ | (14,409,794 | )(c) |
| | | | |
(a) | On September 30, 2008, the Portfolio had a net capital loss carryforward for federal income tax purposes of $3,479,905 of which $3,475,986 expires in the year 2009 and $3,919 expires in the year 2010. To the extent future capital gains are offset by capital loss carryforwards, such gains will not be distributed. During the fiscal year ended September 30, 2008, the Portfolio utilized capital loss carryforwards of $568,074. The Portfolio had a capital loss carryforward expire in the amount of $1,948,045 in the current fiscal year. |
(b) | The differences between book-basis and tax-basis unrealized appreciation/(depreciation) are attributable primarily to the tax deferral of losses on wash sales and the difference between the book and tax treatment of swap income. |
(c) | The difference between book-basis and tax-basis components of accumulated earnings/ (deficit) is attributable to dividends payable. |
During the current fiscal year, permanent differences primarily due to the tax treatment of Swaps, capital loss carryforward expiration, excess taxable distributions, contributions from adviser, and a prior period adjustment resulted in a net decrease in distributions in excess of net investment income, a net decrease in accumulated net realized loss on investment transactions, and a net decrease in additional paid in capital. This reclassification had no effect on net assets.
| | | | | | |
| Massachusetts Portfolio | | 2008 | | 2007 |
Distributions paid from: | | | | | | |
Tax-exempt income | | $ | 5,361,875 | | $ | 5,197,763 |
Ordinary income | | | 144,434 | | | 5,490 |
| | | | | | |
Total distributions paid | | $ | 5,506,309 | | $ | 5,203,253 |
| | | | | | |
| | |
| ALLIANCEBERNSTEIN MUNICIPAL INCOME FUND II • | | 131 |
Notes to Financial Statements
As of September 30, 2008, the components of accumulated earnings/(deficit) on a tax basis were as follows:
| | | | |
Undistributed Tax-Exempt Income | | $ | 20,850 | |
Accumulated capital and other losses | | | (3,778,328 | )(a) |
Unrealized appreciation/(depreciation) | | | (2,347,329 | )(b) |
| | | | |
Total accumulated earnings/(deficit) | | $ | (6,104,807 | )(c) |
| | | | |
(a) | On September 30, 2008, the Portfolio had a net capital loss carryforward for federal income tax purposes of $3,778,328 of which $1,585,051 expires in the year 2009 and $2,193,277 expires in the year 2011. To the extent future capital gains are offset by capital loss carryforwards, such gains will not be distributed. During the fiscal year ended September 30, 2008, the Portfolio utilized capital loss carryforwards of $69,190. The Portfolio had a capital loss carryforward expire in the amount of $4,946,731 in the current fiscal year. |
(b) | The differences between book-basis and tax-basis unrealized appreciation/(depreciation) are attributable primarily to the tax deferral of losses on wash sales and the difference between the book and tax treatment of swap income. |
(c) | The difference between book-basis and tax-basis components of accumulated earnings/ (deficit) is attributable to dividends payable. |
During the current fiscal year, permanent differences primarily due to the tax treatment of Swaps and a capital loss carryforward expiration resulted in a net decrease in distributions in excess of net investment income, a net decrease in accumulated net realized loss on investment transactions, and a net decrease to additional paid in capital. This reclassification had no effect on net assets.
| | | | | | |
| Michigan Portfolio | | 2008 | | 2007 |
Distributions paid from: | | | | | | |
Tax-exempt income | | $ | 4,125,020 | | $ | 4,495,268 |
Ordinary income | | | 218,750 | | | 21,710 |
Long term capital gains | | | 120,415 | | | 558,233 |
| | | | | | |
Total distributions paid | | $ | 4,464,185 | | $ | 5,075,211 |
| | | | | | |
As of September 30, 2008, the components of accumulated earnings/(deficit) on a tax basis were as follows:
| | | | |
Accumulated capital and other losses | | $ | (531,259 | )(a) |
Unrealized appreciation/(depreciation) | | | (2,033,707 | )(b) |
| | | | |
Total accumulated earnings/(deficit) | | $ | (2,564,966 | )(c) |
| | | | |
(a) | On September 30, 2008, the Portfolio had a net capital loss carryforward for federal income tax purposes of $1,899 of which expires in the year 2016. To the extent future capital gains are offset of capital loss carryforwards, such gains will not be distributed. Net capital loss incurred after October 31, and within the taxable year are believed to arise on the first business day of Portfolio’s next taxable year. For the year ended September 30, 2008, the Portfolio defers to November 1, 2008 post-October capital losses of $529,360. |
(b) | The differences between book-basis and tax-basis unrealized appreciation/(depreciation) are attributable primarily to the tax deferral of losses on wash sales and the difference between the book and tax treatment of swap income. |
(c) | The difference between book-basis and tax-basis components of accumulated earnings/ (deficit) is attributable to dividends payable. |
| | |
| 132 | | • ALLIANCEBERNSTEIN MUNICIPAL INCOME FUND II |
Notes to Financial Statements
During the current fiscal year, permanent differences primarily due to the tax treatment of Swaps, dividend reclassification, and excess taxable distributions resulted in a net decrease in distributions in excess of net investment income, a net increase in accumulated net realized loss on investment transactions, and a net decrease to additional paid in capital. This reclassification had no effect on net assets.
| | | | | | |
| Minnesota Portfolio | | 2008 | | 2007 |
Distributions paid from: | | | | | | |
Tax-exempt income | | $ | 3,689,423 | | $ | 3,624,953 |
Ordinary income | | | 60,780 | | | 13,803 |
| | | | | | |
Total distributions paid | | $ | 3,750,203 | | $ | 3,638,756 |
| | | | | | |
As of September 30, 2008, the components of accumulated earnings/(deficit) on a tax basis were as follows:
| | | | |
Accumulated capital and other losses | | $ | (806,117 | )(a) |
Unrealized appreciation/(depreciation) | | | (2,559,257 | )(b) |
| | | | |
Total accumulated earnings/(deficit) | | $ | (3,365,374 | )(c) |
| | | | |
(a) | On September 30, 2008, the Portfolio had a net capital loss carryforward for federal income tax purposes of $806,117 of which $160,146 expires in the year 2009, $46,432 expires in the year 2010, $179,795 expires in the year 2011, $142,635 expires in the year 2012 and $277,109 expires in the year 2013. To the extent future capital gains are offset by capital loss carryforwards, such gains will not be distributed. During the fiscal year ended September 30, 2008, the Portfolio utilized capital loss carryforwards of $39,992. The Portfolio had a capital loss carryforwards expire in the amount of $731,683 in the current fiscal year. |
(b) | The difference between book-basis and tax-basis unrealized appreciation/(depreciation) is attributable primarily to the tax deferral of losses on wash sales, and the difference between the book and tax treatment of swap income. |
(c) | The difference between book-basis and tax-basis components of accumulated earnings/ (deficit) is attributable to dividends payable. |
During the current fiscal year, permanent differences primarily due to the tax treatment of Swaps, capital loss carryforward expiration, and excess taxable distributions resulted in a net decrease in distributions in excess of net investment income, a net decrease in accumulated net realized loss on investment transactions, and a net decrease to additional paid in capital. This reclassification had no effect on net assets.
| | | | | | |
| New Jersey Portfolio | | 2008 | | 2007 |
Distributions paid from: | | | | | | |
Tax-exempt income | | $ | 6,383,489 | | $ | 6,146,017 |
Ordinary income | | | 50,468 | | | — |
| | | | | | |
Total distributions paid | | $ | 6,433,957 | | $ | 6,146,017 |
| | | | | | |
| | |
| ALLIANCEBERNSTEIN MUNICIPAL INCOME FUND II • | | 133 |
Notes to Financial Statements
As of September 30, 2008, the components of accumulated earnings/(deficit) on a tax basis were as follows:
| | | | |
Undistributed Tax-Exempt Income | | $ | 15,059 | |
Accumulated capital and other losses | | | (11,748,025 | )(a) |
Unrealized appreciation/(depreciation) | | | (5,118,211 | )(b) |
| | | | |
Total accumulated earnings/(deficit) | | $ | (16,851,177 | )(c) |
| | | | |
(a) | On September 30, 2008, the Portfolio had a net capital loss carryforward for federal income tax purposes of $11,748,025 of which $1,077,263 expires in the year 2009, $4,688,584 expires in the year 2010, $5,617,272 expires in the year 2011 and $364,906 expires in the year 2012. To the extent future capital gains are offset by capital loss carryforwards, such gains will not be distributed. During the fiscal year ended September 30, 2008, the Portfolio utilized capital loss carryforwards of $368,291. The Portfolio had a capital carryforward expire in the amount of $615,745 in the current fiscal year. |
(b) | The differences between book-basis and tax-basis unrealized appreciation/(depreciation) are attributable primarily to the tax deferral of losses on wash sales and the difference between book and tax treatment of swap income. |
(c) | The difference between book-basis and tax-basis components of accumulated earnings/ (deficit) is attributable to dividends payable. |
During the current fiscal year, permanent differences primarily due to the tax treatment of Swaps, capital loss carryforward expiration and a prior period adjustment resulted in a net decrease in distributions in excess of net investment income, a net decrease in accumulated net realized loss on investment transactions, and a net decrease in additional paid in capital. This reclassification had no effect on net assets.
| | | | | | |
| Ohio Portfolio | | 2008 | | 2007 |
Distributions paid from: | | | | | | |
Tax-exempt income | | $ | 6,007,728 | | $ | 6,150,596 |
Ordinary income | | | 64,396 | | | 8,663 |
| | | | | | |
Total distributions paid | | $ | 6,072,124 | | $ | 6,159,259 |
| | | | | | |
As of September 30, 2008, the components of accumulated earnings/(deficit) on a tax basis were as follows:
| | | | |
Undistributed Tax Exempt Income | | $ | 16,088 | |
Accumulated capital and other losses | | | (5,296,818 | )(a) |
Unrealized appreciation/(depreciation) | | | (5,489,725 | )(b) |
| | | | |
Total accumulated earnings/(deficit) | | $ | (10,770,455 | )(c) |
| | | | |
(a) | On September 30, 2008, the Portfolio had a net capital loss carryforward for federal income tax purposes of $5,296,818 of which $1,639,021 expires in the year 2009, $3,620,192 expires in the year 2011 and $37,605 expires in the year 2012. To the extent future capital gains are offset by capital loss carryforwards, such gains will not be distributed. During the fiscal year ended September 30, 2008, the Portfolio utilized capital loss carry-forwards of $647,998. The Portfolio had a capital loss carryforward expire in the amount of $234,228 in the current fiscal year. |
| | |
| 134 | | • ALLIANCEBERNSTEIN MUNICIPAL INCOME FUND II |
Notes to Financial Statements
(b) | The difference between book-basis and tax-basis unrealized appreciation/(depreciation) are attributable primarily to the difference between book and tax treatment of swap income. |
(c) | The difference between book-basis and tax-basis components of accumulated earnings/ (deficit) is attributable to dividends payable. |
During the current fiscal year, permanent differences primarily due to the tax treatment of Swaps and a capital loss carryforward expiration resulted in a net decrease in distributions in excess of net investment income, a net decrease in accumulated net realized loss on investment transactions, and a net decrease to additional paid in capital. This reclassification had no effect on net assets.
| | | | | | |
| Pennsylvania Portfolio | | 2008 | | 2007 |
Distributions paid from: | | | | | | |
Tax-exempt income | | $ | 5,353,271 | | $ | 5,317,153 |
Ordinary income | | | 39,333 | | | 8,161 |
| | | | | | |
Total distributions paid | | $ | 5,392,604 | | $ | 5,325,314 |
| | | | | | |
As of September 30, 2008, the components of accumulated earnings/(deficit) on a tax basis were as follows:
| | | | |
Undistributed Tax Exempt Income | | $ | 10,055 | |
Accumulated capital and other losses | | | (720,532 | )(a) |
Unrealized appreciation/(depreciation) | | | (4,347,004 | )(b) |
| | | | |
Total accumulated earnings/(deficit) | | $ | (5,057,481 | )(c) |
| | | | |
(a) | On September 30, 2008, the Portfolio had a net capital loss carryforward for federal income tax purposes of $720,532 of which $274,791 expires in the year 2010, $445,741 expires in the year 2011. To the extent future capital gains are offset by capital loss carry-forwards, such gains will not be distributed. During the fiscal year ended September 30, 2008 the Portfolio utilized capital loss carryforwards of $95,339. The Portfolio had a capital loss carryforward expire in the amount of $1,196,910 in the current fiscal year. |
(b) | The differences between book-basis and tax-basis unrealized appreciation/(depreciation) are attributable primarily to the tax deferral of losses on wash sales and the difference between book and tax treatment of swap income. |
(c) | The difference between book-basis and tax-basis components of accumulated earnings/ (deficit) is attributable to dividends payable. |
During the current fiscal year, permanent differences primarily due to the tax treatment of Swaps and a capital loss carryforward expiration resulted in a net decrease in distributions in excess of net investment income, a net decrease in accumulated net realized loss on investment transactions, and a net decrease to additional paid in capital. This reclassification had no effect on net assets.
| | | | | | |
| Virginia Portfolio | | 2008 | | 2007 |
Distributions paid from: | | | | | | |
Tax-exempt income | | $ | 7,210,855 | | $ | 7,022,505 |
Ordinary income | | | 104,496 | | | 7,889 |
| | | | | | |
Total distributions paid | | $ | 7,315,351 | | $ | 7,030,394 |
| | | | | | |
| | |
| ALLIANCEBERNSTEIN MUNICIPAL INCOME FUND II • | | 135 |
Notes to Financial Statements
As of September 30, 2008, the components of accumulated earnings/(deficit) on a tax basis were as follows:
| | | | |
Undistributed Tax-Exempt Income | | $ | 334,027 | |
Accumulated capital and other losses | | | (1,429,808 | )(a) |
Unrealized appreciation/(depreciation) | | | (9,280,287 | )(b) |
| | | | |
Total accumulated earnings/(deficit) | | $ | (10,376,068 | )(c) |
| | | | |
(a) | On September 30, 2008, the Portfolio had a net capital loss carryforward for federal income tax purposes of $1,429,808 of which, $604,484 expires in the year 2009, $793,446 expires in the year 2010 and $31,878 expires in the year 2014. To the extent future capital gains are offset by capital loss carryforwards, such gains will not be distributed. During the fiscal year ended September 30, 2008, the portfolio utilized capital loss carry-forwards of $109,733. |
(b) | The differences between book-basis and tax-basis unrealized appreciation/(depreciation) are attributable primarily to the tax deferral of losses on wash sales and the difference between book and tax treatment of swap income. |
(c) | The difference between book-basis and tax-basis components of accumulated earnings/ (deficit) is attributable to dividends payable. |
During the current fiscal year, permanent differences primarily due to the tax treatment of Swaps resulted in a net increase in undistributed net investment income, and a corresponding net increase in accumulated net realized loss on investment transactions. This reclassification had no effect on net assets.
NOTE H
Risks Involved in Investing in the Fund
Credit Risk—The Portfolios of the AllianceBernstein Municipal Income Fund II are State Portfolios that may invest a large portion of their assets in a particular state’s municipal securities and their various political subdivisions, and the performance of each of these Portfolios may be closely tied to economic conditions within the applicable state and the financial condition of that state and its agencies and municipalities.
Indemnification Risk—In the ordinary course of business, the Fund enters into contracts that contain a variety of indemnifications. The Fund’s maximum exposure under these arrangements is unknown. However, the Fund has not had prior claims or losses pursuant to these indemnification provisions and expects the risk of loss thereunder to be remote.
NOTE I
Legal Proceedings
On October 2, 2003, a purported class action complaint entitled Hindo, et al. v. AllianceBernstein Growth & Income Fund, et al. (“Hindo Complaint”) was filed against the Adviser, Alliance Capital Management Holding L.P. (“Alliance Holding”), Alliance Capital Management Corporation, AXA Financial, Inc., the AllianceBernstein Funds, certain officers of the Adviser (“AllianceBernstein defendants”), and certain other unaffiliated defendants, as
| | |
| 136 | | • ALLIANCEBERNSTEIN MUNICIPAL INCOME FUND II |
Notes to Financial Statements
well as unnamed Doe defendants. The Hindo Complaint was filed in the United States District Court for the Southern District of New York by alleged shareholders of two of the AllianceBernstein Funds. The Hindo Complaint alleges that certain of the AllianceBernstein defendants failed to disclose that they improperly allowed certain hedge funds and other unidentified parties to engage in “late trading” and “market timing” of AllianceBernstein Fund securities, violating Sections 11 and 15 of the Securities Act, Sections 10(b) and 20(a) of the Exchange Act and Sections 206 and 215 of the Advisers Act. Plaintiffs seek an unspecified amount of compensatory damages and rescission of their contracts with the Adviser, including recovery of all fees paid to the Adviser pursuant to such contracts.
Following October 2, 2003, 43 additional lawsuits making factual allegations generally similar to those in the Hindo Complaint were filed in various federal and state courts against the Adviser and certain other defendants. On September 29, 2004, plaintiffs filed consolidated amended complaints with respect to four claim types: mutual fund shareholder claims; mutual fund derivative claims; derivative claims brought on behalf of Alliance Holding; and claims brought under ERISA by participants in the Profit Sharing Plan for Employees of the Adviser. All four complaints include substantially identical factual allegations, which appear to be based in large part on the Order of the SEC dated December 18, 2003 as amended and restated January 15, 2004 (“SEC Order”) and the New York State Attorney General Assurance of Discontinuance dated September 1, 2004 (“NYAG Order”).
On April 21, 2006, the Adviser and attorneys for the plaintiffs in the mutual fund shareholder claims, mutual fund derivative claims, and ERISA claims entered into a confidential memorandum of understanding containing their agreement to settle these claims. The agreement will be documented by a stipulation of settlement and will be submitted for court approval at a later date. The settlement amount ($30 million), which the Adviser previously accrued and disclosed, has been disbursed. The derivative claims brought on behalf of Alliance Holding, in which plaintiffs seek an unspecified amount of damages, remain pending.
It is possible that these matters and/or other developments resulting from these matters could result in increased redemptions of the AllianceBernstein Mutual Funds’ shares or other adverse consequences to the AllianceBernstein Mutual Funds. This may require the AllianceBernstein Mutual Funds to sell investments held by those funds to provide for sufficient liquidity and could also have an adverse effect on the investment performance of the AllianceBernstein Mutual Funds. However, the Adviser believes that these matters are not likely to have a material adverse effect on its ability to perform advisory services relating to the AllianceBernstein Mutual Funds.
| | |
| ALLIANCEBERNSTEIN MUNICIPAL INCOME FUND II • | | 137 |
Notes to Financial Statements
NOTE J
Recent Accounting Pronouncements
On September 20, 2006, the FASB released Statement of Financial Accounting Standards No. 157 “Fair Value Measurements” (“FAS 157”). FAS 157 establishes an authoritative definition of fair value, sets out a framework for measuring fair value, and requires additional disclosures about fair-value measurements. The application of FAS 157 is required for fiscal years beginning after November 15, 2007 and interim periods within those fiscal years. As of September 30, 2008, management believes the adoption of FAS 157 will not impact the amounts reported in the financial statements. However, additional disclosures will be required.
On March 19, 2008, the FASB released Statement of Financial Accounting Standards No. 161, “Disclosures about Derivative Instruments and Hedging Activities” (“FAS 161”). FAS 161 requires qualitative disclosures about objectives and strategies for using derivatives, quantitative disclosures about fair value amounts of and gains and losses on derivative instruments, and disclosures about credit-risk-related contingent features in derivative agreements. The application of FAS 161 is required for fiscal years beginning after November 15, 2008 and interim periods within those fiscal years. At this time, management is evaluating the implications of FAS 161 and believes the adoption of FAS 161 will have no material impact on the Portfolios’ financial statements.
| | |
| 138 | | • ALLIANCEBERNSTEIN MUNICIPAL INCOME FUND II |
Notes to Financial Statements
FINANCIAL HIGHLIGHTS
Selected Data For A Share Of Capital Stock Outstanding Throughout Each Period
| | | | | | | | | | | | | | | |
| | | Arizona Portfolio | |
| | | Class A | |
| | | Year Ended September 30, | |
| | | 2008 | | | 2007 | | | 2006 | | | 2005 | | | 2004(a) | |
| | | |
| | | | | | | | | | | | | | | |
Net asset value, beginning of period | | $ 10.93 | | | $ 11.07 | | | $ 11.06 | | | $ 10.95 | | | $ 10.76 | |
| | | |
Income From Investment Operations | | | | | | | | | | | | | | | |
Net investment income(b)(c) | | .44 | | | .44 | | | .45 | | | .47 | | | .51 | |
Net realized and unrealized gain (loss) on investment transactions | | (.65 | ) | | (.14 | ) | | .01 | | | .11 | | | .19 | |
| | | |
Net increase (decrease) in net asset value from operations | | (.21 | ) | | .30 | | | .46 | | | .58 | | | .70 | |
| | | |
Less: Dividends | | | | | | | | | | | | | | | |
Dividends from net investment income | | (.44 | ) | | (.44 | ) | | (.45 | ) | | (.47 | ) | | (.51 | ) |
| | | |
Net asset value, end of period | | $ 10.28 | | | $ 10.93 | | | $ 11.07 | | | $ 11.06 | | | $ 10.95 | |
| | | |
Total Return | | | | | | | | | | | | | | | |
Total investment return based on net asset value(d) | | (2.08 | )% | | 2.78 | % | | 4.28 | % | | 5.36 | % | | 6.64 | % |
Ratios/Supplemental Data | | | | | | | | | | | | | | | |
Net assets, end of period (000’s omitted) | | $166,997 | | | $141,882 | | | $138,880 | | | $111,704 | | | $88,701 | |
Ratio to average net
assets of: | | | | | | | | | | | | | | | |
Expenses, net of waivers/reimbursements | | .78 | % | | .78 | % | | .78 | %(e) | | .78 | % | | .78 | % |
Expenses, before waivers/reimbursements | | .93 | % | | .96 | % | | .95 | %(e) | | .97 | % | | 1.13 | % |
Net investment income, net of waivers/reimbursements | | 4.02 | % | | 4.03 | % | | 4.11 | %(e) | | 4.22 | % | | 4.69 | % |
Portfolio turnover rate | | 25 | % | | 8 | % | | 20 | % | | 25 | % | | 28 | % |
See footnote summary on page 166.
| | |
| ALLIANCEBERNSTEIN MUNICIPAL INCOME FUND II • | | 139 |
Financial Highlights
Selected Data For A Share Of Capital Stock Outstanding Throughout Each Period
| | | | | | | | | | | | | | | |
| | | Arizona Portfolio | |
| | | Class B | |
| | | Year Ended September 30, | |
| | | 2008 | | | 2007 | | | 2006 | | | 2005 | | | 2004(a) | |
| | | |
| | | | | | | | | | | | | | | |
Net asset value, beginning of period | | $ 10.91 | | | $ 11.05 | | | $ 11.04 | | | $ 10.94 | | | $ 10.74 | |
| | | |
Income From Investment Operations | | | | | | | | | | | | | | | |
Net investment income(b)(c) | | .36 | | | .37 | | | .38 | | | .39 | | | .43 | |
Net realized and unrealized gain (loss) on investment transactions | | (.65 | ) | | (.15 | ) | | – 0 | – | | .10 | | | .20 | |
| | | |
Net increase (decrease) in net asset value from operations | | (.29 | ) | | .22 | | | .38 | | | .49 | | | .63 | |
| | | |
Less: Dividends | | | | | | | | | | | | | | | |
Dividends from net investment income | | (.36 | ) | | (.36 | ) | | (.37 | ) | | (.39 | ) | | (.43 | ) |
| | | |
Net asset value, end of period | | $ 10.26 | | | $ 10.91 | | | $ 11.05 | | | $ 11.04 | | | $ 10.94 | |
| | | |
Total Return | | | | | | | | | | | | | | | |
Total investment return based on net asset value(d) | | (2.76 | )% | | 2.07 | % | | 3.56 | % | | 4.56 | % | | 5.98 | % |
Ratios/Supplemental Data | | | | | | | | | | | | | | | |
Net assets, end of period (000’s omitted) | | $14,485 | | | $36,136 | | | $52,070 | | | $63,255 | | | $76,951 | |
Ratio to average net assets of: | | | | | | | | | | | | | | | |
Expenses, net of waivers/reimbursements | | 1.48 | % | | 1.48 | % | | 1.48 | %(e) | | 1.48 | % | | 1.48 | % |
Expenses, before waivers/reimbursements | | 1.66 | % | | 1.67 | % | | 1.66 | %(e) | | 1.68 | % | | 1.84 | % |
Net investment income, net of waivers/reimbursements | | 3.32 | % | | 3.33 | % | | 3.42 | %(e) | | 3.54 | % | | 4.00 | % |
Portfolio turnover rate | | 25 | % | | 8 | % | | 20 | % | | 25 | % | | 28 | % |
See footnote summary on page 166.
| | |
| 140 | | • ALLIANCEBERNSTEIN MUNICIPAL INCOME FUND II |
Financial Highlights
Selected Data For A Share Of Capital Stock Outstanding Throughout Each Period
| | | | | | | | | | | | | | | |
| | | Arizona Portfolio | |
| | | Class C | |
| | | Year Ended September 30, | |
| | | 2008 | | | 2007 | | | 2006 | | | 2005 | | | 2004(a) | |
| | | |
| | | | | | | | | | | | | | | |
Net asset value, beginning of period | | $ 10.91 | | | $ 11.05 | | | $ 11.04 | | | $ 10.94 | | | $ 10.74 | |
| | | |
Income From Investment Operations | | | | | | | | | | | | | | | |
Net investment income(b)(c) | | .36 | | | .37 | | | .37 | | | .39 | | | .43 | |
Net realized and unrealized gain (loss) on investment transactions | | (.65 | ) | | (.14 | ) | | .01 | | | .10 | | | .20 | |
| | | |
Net increase (decrease) in net asset value from operations | | (.29 | ) | | .23 | | | .38 | | | .49 | | | .63 | |
| | | |
Less: Dividends | | | | | | | | | | | | | | | |
Dividends from net investment income | | (.36 | ) | | (.37 | ) | | (.37 | ) | | (.39 | ) | | (.43 | ) |
| | | |
Net asset value, end of period | | $ 10.26 | | | $ 10.91 | | | $ 11.05 | | | $ 11.04 | | | $ 10.94 | |
| | | |
Total Return | | | | | | | | | | | | | | | |
Total investment return based on net asset value(d) | | (2.76 | )% | | 2.07 | % | | 3.56 | % | | 4.56 | % | | 5.98 | % |
Ratios/Supplemental Data | | | | | | | | | | | | | | | |
Net assets, end of period
(000’s omitted) | | $30,000 | | | $26,474 | | | $25,445 | | | $24,926 | | | $20,305 | |
Ratio to average net
assets of: | | | | | | | | | | | | | | | |
Expenses, net of waivers/reimbursements | | 1.48 | % | | 1.48 | % | | 1.48 | %(e) | | 1.48 | % | | 1.48 | % |
Expenses, before waivers/reimbursements | | 1.64 | % | | 1.66 | % | | 1.65 | %(e) | | 1.67 | % | | 1.84 | % |
Net investment income, net of waivers/reimbursements | | 3.33 | % | | 3.34 | % | | 3.42 | %(e) | | 3.53 | % | | 4.00 | % |
Portfolio turnover rate | | 25 | % | | 8 | % | | 20 | % | | 25 | % | | 28 | % |
See footnote summary on page 166.
| | |
| ALLIANCEBERNSTEIN MUNICIPAL INCOME FUND II • | | 141 |
Financial Highlights
Selected Data For A Share Of Capital Stock Outstanding Throughout Each Period
| | | | | | | | | | | | | | | |
| | | Florida Portfolio | |
| | | Class A | |
| | | Year Ended September 30, | |
| | | 2008 | | | 2007 | | | 2006 | | | 2005 | | | 2004(a) | |
| | | |
| | | | | | | | | | | | | | | |
Net asset value, beginning of period | | $ 10.15 | | | $ 10.32 | | | $ 10.28 | | | $ 10.25 | | | $ 10.17 | |
| | | |
Income From Investment Operations | | | | | | | | | | | | | | | |
Net investment income(b)(c) | | .44 | | | .45 | | | .46 | | | .47 | | | .49 | |
Net realized and unrealized gain (loss) on investment transactions | | (.84 | ) | | (.17 | ) | | .04 | | | .03 | | | .08 | |
Contributions from Adviser (see Note B) | | .00 | (f) | | – 0 | – | | – 0 | – | | – 0 | – | | – 0 | – |
| | | |
Net increase (decrease) in net asset value from operations | | (.40 | ) | | .28 | | | .50 | | | .50 | | | .57 | |
| | | |
Less: Dividends | | | | | | | | | | | | | | | |
Dividends from net investment income | | (.45 | ) | | (.45 | ) | | (.46 | ) | | (.47 | ) | | (.49 | ) |
| | | |
Net asset value, end of period | | $ 9.30 | | | $ 10.15 | | | $ 10.32 | | | $ 10.28 | | | $ 10.25 | |
| | | |
Total Return | | | | | | | | | | | | | | | |
Total investment return based on net asset value(d) | | (4.16 | )% | | 2.80 | % | | 5.00 | % | | 5.01 | % | | 5.78 | % |
Ratios/Supplemental Data | | | | | | | | | | | | | | | |
Net assets, end of period (000’s omitted) | | $118,868 | | | $134,989 | | | $138,307 | | | $127,541 | | | $101,529 | |
Ratio to average net assets of: | | | | | | | | | | | | | | | |
Expenses, net of waivers/reimbursements excluding interest expense | | .78 | % | | .78 | % | | .78 | %(e) | | .78 | % | | .78 | % |
Expenses, before waivers/reimbursements | | .96 | % | | .96 | % | | .98 | %(e) | | 1.08 | % | | 1.12 | % |
Expenses, before waivers/reimbursements excluding interest expense | | .96 | % | | .96 | % | | .94 | %(e) | | .98 | % | | 1.11 | % |
Net investment income, net of waivers/reimbursements | | 4.44 | % | | 4.43 | % | | 4.51 | %(e) | | 4.60 | % | | 4.83 | % |
Portfolio turnover rate | | 29 | % | | 23 | % | | 27 | % | | 23 | % | | 22 | % |
See footnote summary on page 166.
| | |
| 142 | | • ALLIANCEBERNSTEIN MUNICIPAL INCOME FUND II |
Financial Highlights
Selected Data For A Share Of Capital Stock Outstanding Throughout Each Period
| | | | | | | | | | | | | | | |
| | | Florida Portfolio | |
| | | Class B | |
| | | Year Ended September 30, | |
| | | 2008 | | | 2007 | | | 2006 | | | 2005 | | | 2004(a) | |
| | | |
| | | | | | | | | | | | | | | |
Net asset value, beginning of period | | $ 10.16 | | | $ 10.32 | | | $ 10.29 | | | $ 10.26 | | | $ 10.18 | |
| | | |
Income From Investment Operations | | | | | | | | | | | | | | | |
Net investment income(b)(c) | | .37 | | | .38 | | | .39 | | | .40 | | | .42 | |
Net realized and unrealized gain (loss) on investment transactions | | (.84 | ) | | (.16 | ) | | .03 | | | .03 | | | .08 | |
Contributions from Adviser (see Note B) | | .00 | (f) | | – 0 | – | | – 0 | – | | – 0 | – | | – 0 | – |
| | | |
Net increase (decrease) in net asset value from operations | | (.47 | ) | | .22 | | | .42 | | | .43 | | | .50 | |
| | | |
Less: Dividends | | | | | | | | | | | | | | | |
Dividends from net investment income | | (.38 | ) | | (.38 | ) | | (.39 | ) | | (.40 | ) | | (.42 | ) |
| | | |
Net asset value, end of period | | $ 9.31 | | | $ 10.16 | | | $ 10.32 | | | $ 10.29 | | | $ 10.26 | |
| | | |
Total Return | | | | | | | | | | | | | | | |
Total investment return based on net asset
value(d) | | (4.82 | )% | | 2.18 | % | | 4.17 | % | | 4.29 | % | | 4.96 | % |
Ratios/Supplemental
Data | | | | | | | | | | | | | | | |
Net assets, end of period (000’s omitted) | | $12,628 | | | $23,646 | | | $38,045 | | | $53,996 | | | $79,266 | |
Ratio to average net
assets of: | | | | | | | | | | | | | | | |
Expenses, net of waivers/reimbursements excluding interest expense | | 1.48 | % | | 1.48 | % | | 1.48 | %(e) | | 1.48 | % | | 1.48 | % |
Expenses, before waivers/reimbursements | | 1.69 | % | | 1.68 | % | | 1.69 | %(e) | | 1.78 | % | | 1.83 | % |
Expenses, before waivers/reimbursements excluding interest expense | | 1.69 | % | | 1.68 | % | | 1.65 | %(e) | | 1.68 | % | | 1.82 | % |
Net investment income, net of waivers/reimbursements | | 3.72 | % | | 3.73 | % | | 3.80 | %(e) | | 3.91 | % | | 4.12 | % |
Portfolio turnover rate | | 29 | % | | 23 | % | | 27 | % | | 23 | % | | 22 | % |
See footnote summary on page 166.
| | |
| ALLIANCEBERNSTEIN MUNICIPAL INCOME FUND II • | | 143 |
Financial Highlights
Selected Data For A Share Of Capital Stock Outstanding Throughout Each Period
| | | | | | | | | | | | | | | |
| | | Florida Portfolio | |
| | | Class C | |
| | | Year Ended September 30, | |
| | | 2008 | | | 2007 | | | 2006 | | | 2005 | | | 2004(a) | |
| | | |
| | | | | | | | | | | | | | | |
Net asset value, beginning of period | | $ 10.16 | | | $ 10.32 | | | $ 10.29 | | | $ 10.25 | | | $ 10.18 | |
| | | |
Income From Investment Operations | | | | | | | | | | | | | | | |
Net investment income(b)(c) | | .37 | | | .38 | | | .39 | | | .40 | | | .42 | |
Net realized and unrealized gain (loss) on investment transactions | | (.84 | ) | | (.16 | ) | | .03 | | | .04 | | | .07 | |
Contributions from Adviser (see Note B) | | .00 | (f) | | – 0 | – | | – 0 | – | | – 0 | – | | – 0 | – |
| | | |
Net increase (decrease) in net asset value from operations | | (.47 | ) | | .22 | | | .42 | | | .44 | | | .49 | |
| | | |
Less: Dividends | | | | | | | | | | | | | | | |
Dividends from net investment income | | (.38 | ) | | (.38 | ) | | (.39 | ) | | (.40 | ) | | (.42 | ) |
| | | |
Net asset value, end of period | | $ 9.31 | | | $ 10.16 | | | $ 10.32 | | | $ 10.29 | | | $ 10.25 | |
| | | |
Total Return | | | | | | | | | | | | | | | |
Total investment return based on net asset value(d) | | (4.82 | )% | | 2.18 | % | | 4.17 | % | | 4.38 | % | | 4.96 | % |
Ratios/Supplemental Data | | | | | | | | | | | | | | | |
Net assets, end of period (000’s omitted) | | $28,989 | | | $33,540 | | | $39,042 | | | $39,950 | | | $39,170 | |
Ratio to average net
assets of: | | | | | | | | | | | | | | | |
Expenses, net of waivers/reimbursements excluding interest expense | | 1.48 | % | | 1.48 | % | | 1.48 | %(e) | | 1.48 | % | | 1.48 | % |
Expenses, before waivers/reimbursements | | 1.67 | % | | 1.67 | % | | 1.68 | %(e) | | 1.78 | % | | 1.83 | % |
Expenses, before waivers/reimbursements excluding interest expense | | 1.67 | % | | 1.67 | % | | 1.64 | %(e) | | 1.68 | % | | 1.82 | % |
Net investment income, net of waivers/reimbursements | | 3.73 | % | | 3.73 | % | | 3.80 | %(e) | | 3.90 | % | | 4.13 | % |
Portfolio turnover rate | | 29 | % | | 23 | % | | 27 | % | | 23 | % | | 22 | % |
See footnote summary on page 166.
| | |
| 144 | | • ALLIANCEBERNSTEIN MUNICIPAL INCOME FUND II |
Financial Highlights
Selected Data For A Share Of Capital Stock Outstanding Throughout Each Period
| | | | | | | | | | | | | | | |
| | | Massachusetts Portfolio | |
| | | Class A | |
| | | Year Ended September 30, | |
| | | 2008 | | | 2007 | | | 2006 | | | 2005 | | | 2004(a) | |
| | | |
| | | | | | | | | | | | | | | |
Net asset value, beginning of period | | $ 10.81 | | | $ 10.94 | | | $ 10.96 | | | $ 10.92 | | | $ 10.79 | |
| | | |
Income From Investment Operations | | | | | | | | | | | | | | | |
Net investment income(b)(c) | | .42 | | | .44 | | | .45 | | | .47 | | | .51 | |
Net realized and unrealized gain (loss) on investment transactions | | (.43 | ) | | (.13 | ) | | (.02 | ) | | .05 | | | .13 | |
Contributions from Adviser (see Note B) | | .00 | (f) | | .00 | | | .00 | | | .00 | | | .00 | |
| | | |
Net increase (decrease) in net asset value from operations | | (.01 | ) | | .31 | | | .43 | | | .52 | | | .64 | |
| | | |
Less: Dividends | | | | | | | | | | | | | | | |
Dividends from net investment income | | (.44 | ) | | (.44 | ) | | (.45 | ) | | (.48 | ) | | (.51 | ) |
| | | |
Net asset value, end of period | | $ 10.36 | | | $ 10.81 | | | $ 10.94 | | | $ 10.96 | | | $ 10.92 | |
| | | |
Total Return | | | | | | | | | | | | | | | |
Total investment return based on net asset value(d) | | (.22 | )% | | 2.92 | % | | 4.06 | % | | 4.80 | % | | 6.13 | % |
Ratios/Supplemental Data | | | | | | | | | | | | | | | |
Net assets, end of period (000’s omitted) | | $109,951 | | | $74,341 | | | $63,120 | | | $53,035 | | | $39,749 | |
Ratio to average net
assets of: | | | | | | | | | | | | | | | |
Expenses, net of waivers/reimbursements excluding interest expense | | .82 | % | | .82 | % | | .82 | %(e) | | .82 | % | | .82 | % |
Expenses, before waivers/reimbursements | | 1.01 | % | | 1.06 | % | | 1.09 | %(e) | | 1.17 | % | | 1.25 | % |
Expenses, before waivers/
reimbursements excluding interest expense | | 1.01 | % | | 1.06 | % | | 1.03 | %(e) | | 1.03 | % | | 1.20 | % |
Net investment income, net of waivers/reimbursements | | 3.90 | % | | 4.08 | % | | 4.18 | %(e) | | 4.29 | % | | 4.73 | % |
Portfolio turnover rate | | 32 | % | | 11 | % | | 25 | % | | 25 | % | | 26 | % |
See footnote summary on page 166.
| | |
| ALLIANCEBERNSTEIN MUNICIPAL INCOME FUND II • | | 145 |
Financial Highlights
Selected Data For A Share Of Capital Stock Outstanding Throughout Each Period
| | | | | | | | | | | | | | | |
| | | Massachusetts Portfolio | |
| | | Class B | |
| | | Year Ended September 30, | |
| | | 2008 | | | 2007 | | | 2006 | | | 2005 | | | 2004(a) | |
| | | |
| | | | | | | | | | | | | | | |
Net asset value, beginning of period | | $ 10.79 | | | $ 10.92 | | | $ 10.94 | | | $ 10.91 | | | $ 10.77 | |
| | | |
Income From Investment Operations | | | | | | | | | | | | | | | |
Net investment income(b)(c) | | .34 | | | .37 | | | .38 | | | .40 | | | .44 | |
Net realized and unrealized gain (loss) on investment transactions | | (.43 | ) | | (.13 | ) | | (.02 | ) | | .03 | | | .14 | |
Contributions from Adviser (see Note B) | | .00 | (f) | | .00 | | | .00 | | | .00 | | | .00 | |
| | | |
Net increase (decrease) in net asset value from operations | | (.09 | ) | | .24 | | | .36 | | | .43 | | | .58 | |
| | | |
Less: Dividends | | | | | | | | | | | | | | | |
Dividends from net investment income | | (.36 | ) | | (.37 | ) | | (.38 | ) | | (.40 | ) | | (.44 | ) |
| | | |
Net asset value, end of period | | $ 10.34 | | | $ 10.79 | | | $ 10.92 | | | $ 10.94 | | | $ 10.91 | |
| | | |
Total Return | | | | | | | | | | | | | | | |
Total investment return based on net asset value(d) | | (.91 | )% | | 2.21 | % | | 3.35 | % | | 4.00 | % | | 5.38 | % |
Ratios/Supplemental Data | | | | | | | | | | | | | | | |
Net assets, end of period (000’s omitted) | | $13,477 | | | $25,209 | | | $41,221 | | | $50,203 | | | $63,430 | |
Ratio to average net
assets of: | | | | | | | | | | | | | | | |
Expenses, net of waivers/reimbursements excluding interest expense | | 1.52 | % | | 1.52 | % | | 1.52 | %(e) | | 1.52 | % | | 1.52 | % |
Expenses, before waivers/reimbursements | | 1.73 | % | | 1.77 | % | | 1.81 | %(e) | | 1.88 | % | | 1.96 | % |
Expenses, before waivers/reimbursements excluding interest expense | | 1.73 | % | | 1.77 | % | | 1.75 | %(e) | | 1.74 | % | | 1.91 | % |
Net investment income, net of waivers/reimbursements | | 3.23 | % | | 3.38 | % | | 3.49 | %(e) | | 3.61 | % | | 4.04 | % |
Portfolio turnover rate | | 32 | % | | 11 | % | | 25 | % | | 25 | % | | 26 | % |
See footnote summary on page 166.
| | |
| 146 | | • ALLIANCEBERNSTEIN MUNICIPAL INCOME FUND II |
Financial Highlights
Selected Data For A Share Of Capital Stock Outstanding Throughout Each Period
| | | | | | | | | | | | | | | |
| | | Massachusetts Portfolio | |
| | | Class C | |
| | | Year Ended September 30, | |
| | | 2008 | | | 2007 | | | 2006 | | | 2005 | | | 2004(a) | |
| | | |
| | | | | | | | | | | | | | | |
Net asset value, beginning of period | | $ 10.79 | | | $ 10.92 | | | $ 10.94 | | | $ 10.91 | | | $ 10.77 | |
| | | |
Income From Investment Operations | | | | | | | | | | | | | | | |
Net investment income(b)(c) | | .34 | | | .37 | | | .38 | | | .40 | | | .44 | |
Net realized and unrealized gain (loss) on investment transactions | | (.43 | ) | | (.13 | ) | | (.02 | ) | | .03 | | | .14 | |
Contributions from Adviser (see Note B) | | .00 | (f) | | .00 | | | .00 | | | .00 | | | .00 | |
| | | |
Net increase (decrease) in net asset value from operations | | (.09 | ) | | .24 | | | .36 | | | .43 | | | .58 | |
| | | |
Less: Dividends | | | | | | | | | | | | | | | |
Dividends from net investment income | | (.36 | ) | | (.37 | ) | | (.38 | ) | | (.40 | ) | | (.44 | ) |
| | | |
Net asset value, end of period | | $ 10.34 | | | $ 10.79 | | | $ 10.92 | | | $ 10.94 | | | $ 10.91 | |
| | | |
Total Return | | | | | | | | | | | | | | | |
Total investment return based on net asset value(d) | | (.91 | )% | | 2.22 | % | | 3.35 | % | | 3.99 | % | | 5.38 | % |
Ratios/Supplemental Data | | | | | | | | | | | | | | | |
Net assets, end of period (000’s omitted) | | $36,834 | | | $34,479 | | | $38,001 | | | $34,789 | | | $35,598 | |
Ratio to average net
assets of: | | | | | | | | | | | | | | | |
Expenses, net of waivers/reimbursements excluding interest expense | | 1.52 | % | | 1.52 | % | | 1.52 | %(e) | | 1.52 | % | | 1.52 | % |
Expenses, before waivers/reimbursements | | 1.72 | % | | 1.76 | % | | 1.80 | %(e) | | 1.88 | % | | 1.95 | % |
Expenses, before waivers/reimbursements excluding interest expense | | 1.72 | % | | 1.76 | % | | 1.74 | %(e) | | 1.74 | % | | 1.90 | % |
Net investment income, net of waivers/reimbursements | | 3.22 | % | | 3.39 | % | | 3.49 | %(e) | | 3.61 | % | | 4.04 | % |
Portfolio turnover rate | | 32 | % | | 11 | % | | 25 | % | | 25 | % | | 26 | % |
See footnote summary on page 166.
| | |
| ALLIANCEBERNSTEIN MUNICIPAL INCOME FUND II • | | 147 |
Financial Highlights
Selected Data For A Share Of Capital Stock Outstanding Throughout Each Period
| | | | | | | | | | | | | | | |
| | | Michigan Portfolio | |
| | | Class A | |
| | | Year Ended September 30, | |
| | | 2008 | | | 2007 | | | 2006 | | | 2005 | | | 2004(a) | |
| | | |
| | | | | | | | | | | | | | | |
Net asset value, beginning of period | | $ 10.74 | | | $ 10.91 | | | $ 10.88 | | | $ 10.79 | | | $ 10.69 | |
| | | |
Income From Investment Operations | | | | | | | | | | | | | | | |
Net investment income(b)(c) | | .40 | | | .42 | | | .43 | | | .46 | | | .48 | |
Net realized and unrealized gain (loss) on investment transactions | | (.60 | ) | | (.12 | ) | | .03 | | | .09 | | | .11 | |
| | | |
Net increase (decrease) in net asset value from operations | | (.20 | ) | | .30 | | | .46 | | | .55 | | | .59 | |
| | | |
Less: Dividends and Distributions | | | | | | | | | | | | | | | |
Dividends from net investment income | | (.41 | ) | | (.42 | ) | | (.42 | ) | | (.46 | ) | | (.49 | ) |
Distributions from net realized gain on investments | | (.02 | ) | | (.05 | ) | | (.01 | ) | | – 0 | – | | – 0 | – |
| | | |
Total dividends and distributions | | (.43 | ) | | (.47 | ) | | (.43 | ) | | (.46 | ) | | (.49 | ) |
| | | |
Net asset value, end of period | | $ 10.11 | | | $ 10.74 | | | $ 10.91 | | | $ 10.88 | | | $ 10.79 | |
| | | |
Total Return | | | | | | | | | | | | | | | |
Total investment return based on net asset value(d) | | (1.97 | )% | | 2.75 | % | | 4.38 | % | | 5.16 | % | | 5.65 | % |
Ratios/Supplemental Data | | | | | | | | | | | | | | | |
Net assets, end of period (000’s omitted) | | $67,798 | | | $63,989 | | | $64,920 | | | $54,635 | | | $45,362 | |
Ratio to average net assets of: | | | | | | | | | | | | | | | |
Expenses, net of waivers/reimbursements | | 1.01 | % | | 1.01 | % | | .98 | %(e) | | .99 | % | | 1.01 | % |
Expenses, before waivers/reimbursements | | 1.06 | % | | 1.10 | % | | 1.04 | %(e) | | 1.05 | % | | 1.20 | % |
Net investment income, net of waivers/reimbursements | | 3.77 | % | | 3.87 | % | | 3.92 | %(e) | | 4.19 | % | | 4.51 | % |
Portfolio turnover rate | | 13 | % | | 2 | % | | 17 | % | | 18 | % | | 18 | % |
See footnote summary on page 166.
| | |
| 148 | | • ALLIANCEBERNSTEIN MUNICIPAL INCOME FUND II |
Financial Highlights
Selected Data For A Share Of Capital Stock Outstanding Throughout Each Period
| | | | | | | | | | | | | | | |
| | | Michigan Portfolio | |
| | | Class B | |
| | | Year Ended September 30, | |
| | | 2008 | | | 2007 | | | 2006 | | | 2005 | | | 2004(a) | |
| | | |
| | | | | | | | | | | | | | | |
Net asset value, beginning of period | | $ 10.72 | | | $ 10.89 | | | $ 10.86 | | | $ 10.77 | | | $ 10.67 | |
| | | |
Income From Investment Operations | | | | | | | | | | | | | | | |
Net investment income(b)(c) | | .32 | | | .34 | | | .35 | | | .38 | | | .41 | |
Net realized and unrealized gain (loss) on investment transactions | | (.59 | ) | | (.12 | ) | | .04 | | | .10 | | | .10 | |
| | | |
Net increase (decrease) in net asset value from operations | | (.27 | ) | | .22 | | | .39 | | | .48 | | | .51 | |
| | | |
Less: Dividends and Distributions | | | | | | | | | | | | | | | |
Dividends from net investment income | | (.34 | ) | | (.34 | ) | | (.35 | ) | | (.39 | ) | | (.41 | ) |
Distributions from net realized gain on investments | | (.02 | ) | | (.05 | ) | | (.01 | ) | | – 0 | – | | – 0 | – |
| | | |
Total dividends and distributions | | (.36 | ) | | (.39 | ) | | (.36 | ) | | (.39 | ) | | (.41 | ) |
| | | |
Net asset value, end of period | | $ 10.09 | | | $ 10.72 | | | $ 10.89 | | | $ 10.86 | | | $ 10.77 | |
| | | |
Total Return | | | | | | | | | | | | | | | |
Total investment return based on net asset value(d) | | (2.65 | )% | | 2.04 | % | | 3.66 | % | | 4.47 | % | | 4.91 | % |
Ratios/Supplemental Data | | | | | | | | | | | | | | | |
Net assets, end of period (000’s omitted) | | $10,378 | | | $20,524 | | | $30,813 | | | $41,516 | | | $47,605 | |
Ratio to average net assets of: | | | | | | | | | | | | | | | |
Expenses, net of waivers/reimbursements | | 1.71 | % | | 1.71 | % | | 1.69 | %(e) | | 1.70 | % | | 1.71 | % |
Expenses, before waivers/reimbursements | | 1.78 | % | | 1.81 | % | | 1.75 | %(e) | | 1.76 | % | | 1.91 | % |
Net investment income, net of waivers/reimbursements | | 3.08 | % | | 3.17 | % | | 3.23 | %(e) | | 3.50 | % | | 3.81 | % |
Portfolio turnover rate | | 13 | % | | 2 | % | | 17 | % | | 18 | % | | 18 | % |
See footnote summary on page 166.
| | |
| ALLIANCEBERNSTEIN MUNICIPAL INCOME FUND II • | | 149 |
Financial Highlights
Selected Data For A Share Of Capital Stock Outstanding Throughout Each Period
| | | | | | | | | | | | | | | |
| | | Michigan Portfolio | |
| | | Class C | |
| | | Year Ended September 30, | |
| | | 2008 | | | 2007 | | | 2006 | | | 2005 | | | 2004(a) | |
| | | |
| | | | | | | | | | | | | | | |
Net asset value, beginning of period | | $ 10.73 | | | $ 10.89 | | | $ 10.87 | | | $ 10.77 | | | $ 10.67 | |
| | | |
Income From Investment Operations | | | | | | | | | | | | | | | |
Net investment income(b)(c) | | .33 | | | .34 | | | .35 | | | .38 | | | .41 | |
Net realized and unrealized gain (loss) on investment transactions | | (.61 | ) | | (.11 | ) | | .03 | | | .10 | | | .10 | |
| | | |
Net increase (decrease) in net asset value from operations | | (.28 | ) | | .23 | | | .38 | | | .48 | | | .51 | |
| | | |
Less: Dividends and Distributions | | | | | | | | | | | | | | | |
Dividends from net investment income | | (.34 | ) | | (.34 | ) | | (.35 | ) | | (.38 | ) | | (.41 | ) |
Distributions from net realized gain on investments | | (.02 | ) | | (.05 | ) | | (.01 | ) | | – 0 | – | | – 0 | – |
| | | |
Total dividends and distributions | | (.36 | ) | | (.39 | ) | | (.36 | ) | | (.38 | ) | | (.41 | ) |
| | | |
Net asset value, end of period | | $ 10.09 | | | $ 10.73 | | | $ 10.89 | | | $ 10.87 | | | $ 10.77 | |
| | | |
Total Return | | | | | | | | | | | | | | | |
Total investment return based on net asset value(d) | | (2.74 | )% | | 2.13 | % | | 3.56 | % | | 4.54 | % | | 4.91 | % |
Ratios/Supplemental Data | | | | | | | | | | | | | | | |
Net assets, end of period (000’s omitted) | | $34,290 | | | $37,755 | | | $41,274 | | | $43,225 | | | $43,382 | |
Ratio to average net assets of: | | | | | | | | | | | | | | | |
Expenses, net of waivers/reimbursements | | 1.71 | % | | 1.71 | % | | 1.68 | %(e) | | 1.70 | % | | 1.71 | % |
Expenses, before waivers/reimbursements | | 1.76 | % | | 1.81 | % | | 1.74 | %(e) | | 1.75 | % | | 1.90 | % |
Net investment income, net of waivers/reimbursements | | 3.08 | % | | 3.17 | % | | 3.23 | %(e) | | 3.50 | % | | 3.82 | % |
Portfolio turnover rate | | 13 | % | | 2 | % | | 17 | % | | 18 | % | | 18 | % |
See footnote summary on page 166.
| | |
| 150 | | • ALLIANCEBERNSTEIN MUNICIPAL INCOME FUND II |
Financial Highlights
Selected Data For A Share Of Capital Stock Outstanding Throughout Each Period
| | | | | | | | | | | | | | | |
| | | Minnesota Portfolio | |
| | | Class A | |
| | | Year Ended September 30, | |
| | | 2008 | | | 2007 | | | 2006 | | | 2005 | | | 2004(a) | |
| | | |
| | | | | | | | | | | | | | | |
Net asset value, beginning of period | | $ 10.05 | | | $ 10.20 | | | $ 10.19 | | | $ 10.14 | | | $ 10.15 | |
| | | |
Income From Investment Operations | | | | | | | | | | | | | | | |
Net investment income(b)(c) | | .39 | | | .41 | | | .42 | | | .42 | | | .44 | |
Net realized and unrealized gain (loss) on investment transactions | | (.53 | ) | | (.15 | ) | | .01 | | | .05 | | | (.01 | ) |
| | | |
Net increase (decrease) in net asset value from operations | | (.14 | ) | | .26 | | | .43 | | | .47 | | | .43 | |
| | | |
Less: Dividends | | | | | | | | | | | | | | | |
Dividends from net investment income | | (.40 | ) | | (.41 | ) | | (.42 | ) | | (.42 | ) | | (.44 | ) |
| | | |
Net asset value, end of period | | $ 9.51 | | | $ 10.05 | | | $ 10.20 | | | $ 10.19 | | | $ 10.14 | |
| | | |
Total Return | | | | | | | | | | | | | | | |
Total investment return based on net asset value(d) | | (1.53 | )% | | 2.58 | % | | 4.29 | % | | 4.72 | % | | 4.41 | % |
Ratios/Supplemental Data | | | | | | | | | | | | | | | |
Net assets, end of period (000’s omitted) | | $78,064 | | | $73,400 | | | $71,172 | | | $69,174 | | | $64,847 | |
Ratio to average net assets of: | | | | | | | | | | | | | | | |
Expenses, net of waivers/reimbursements excluding interest expense | | .90 | % | | .90 | % | | .90 | %(e) | | .90 | % | | .90 | % |
Expenses, before waivers/reimbursements | | 1.10 | % | | 1.16 | % | | 1.17 | %(e) | | 1.26 | % | | 1.32 | % |
Expenses, before waivers/reimbursements excluding interest expense | | 1.10 | % | | 1.16 | % | | 1.10 | %(e) | | 1.13 | % | | 1.28 | % |
Net investment income, net of waivers/reimbursements | | 3.93 | % | | 4.03 | % | | 4.10 | %(e) | | 4.12 | % | | 4.36 | % |
Portfolio turnover rate | | 7 | % | | 1 | % | | 13 | % | | 14 | % | | 19 | % |
See footnote summary on page 166.
| | |
| ALLIANCEBERNSTEIN MUNICIPAL INCOME FUND II • | | 151 |
Financial Highlights
Selected Data For A Share Of Capital Stock Outstanding Throughout Each Period
| | | | | | | | | | | | | | | |
| | | Minnesota Portfolio | |
| | | Class B | |
| | | Year Ended September 30, | |
| | | 2008 | | | 2007 | | | 2006 | | | 2005 | | | 2004(a) | |
| | | |
| | | | | | | | | | | | | | | |
Net asset value, beginning of period | | $ 10.05 | | | $ 10.20 | | | $ 10.19 | | | $ 10.14 | | | $ 10.15 | |
| | | |
Income From Investment Operations | | | | | | | | | | | | | | | |
Net investment income(b)(c) | | .32 | | | .34 | | | .34 | | | .35 | | | .37 | |
Net realized and unrealized gain (loss) on investment transactions | | (.53 | ) | | (.15 | ) | | .01 | | | .05 | | | (.01 | ) |
| | | |
Net increase (decrease) in net asset value from operations | | (.21 | ) | | .19 | | | .35 | | | .40 | | | .36 | |
| | | |
Less: Dividends | | | | | | | | | | | | | | | |
Dividends from net investment income | | (.33 | ) | | (.34 | ) | | (.34 | ) | | (.35 | ) | | (.37 | ) |
| | | |
Net asset value, end of period | | $ 9.51 | | | $ 10.05 | | | $ 10.20 | | | $ 10.19 | | | $ 10.14 | |
| | | |
Total Return | | | | | | | | | | | | | | | |
Total investment return based on net asset value(d) | | (2.21 | )% | | 1.86 | % | | 3.56 | % | | 3.99 | % | | 3.68 | % |
Ratios/Supplemental Data | | | | | | | | | | | | | | | |
Net assets, end of period (000’s omitted) | | $2,805 | | | $6,571 | | | $10,577 | | | $14,424 | | | $16,976 | |
Ratio to average net assets of: | | | | | | | | | | | | | | | |
Expenses, net of waivers/reimbursements excluding interest expense | | 1.60 | % | | 1.60 | % | | 1.60 | %(e) | | 1.60 | % | | 1.60 | % |
Expenses, before waivers/reimbursements | | 1.81 | % | | 1.87 | % | | 1.88 | %(e) | | 1.97 | % | | 2.04 | % |
Expenses, before waivers/reimbursements excluding interest expense | | 1.81 | % | | 1.87 | % | | 1.81 | %(e) | | 1.84 | % | | 2.00 | % |
Net investment income, net of waivers/reimbursements | | 3.21 | % | | 3.33 | % | | 3.41 | %(e) | | 3.43 | % | | 3.65 | % |
Portfolio turnover rate | | 7 | % | | 1 | % | | 13 | % | | 14 | % | | 19 | % |
See footnote summary on page 166.
| | |
| 152 | | • ALLIANCEBERNSTEIN MUNICIPAL INCOME FUND II |
Financial Highlights
Selected Data For A Share Of Capital Stock Outstanding Throughout Each Period
| | | | | | | | | | | | | | | |
| | | Minnesota Portfolio | |
| | | Class C | |
| | | Year Ended September 30, | |
| | | 2008 | | | 2007 | | | 2006 | | | 2005 | | | 2004(a) | |
| | | |
| | | | | | | | | | | | | | | |
Net asset value, beginning of period | | $ 10.06 | | | $ 10.21 | | | $ 10.20 | | | $ 10.15 | | | $ 10.16 | |
| | | |
Income From Investment Operations | | | | | | | | | | | | | | | |
Net investment income(b)(c) | | .32 | | | .34 | | | .34 | | | .35 | | | .37 | |
Net realized and unrealized gain (loss) on investment transactions | | (.53 | ) | | (.15 | ) | | .01 | | | .05 | | | (.01 | ) |
| | | |
Net increase (decrease) in net asset value from operations | | (.21 | ) | | .19 | | | .35 | | | .40 | | | .36 | |
| | | |
Less: Dividends | | | | | | | | | | | | | | | |
Dividends from net investment income | | (.33 | ) | | (.34 | ) | | (.34 | ) | | (.35 | ) | | (.37 | ) |
| | | |
Net asset value, end of period | | $ 9.52 | | | $ 10.06 | | | $ 10.21 | | | $ 10.20 | | | $ 10.15 | |
| | | |
Total Return | | | | | | | | | | | | | | | |
Total investment return based on net asset value(d) | | (2.21 | )% | | 1.86 | % | | 3.55 | % | | 3.98 | % | | 3.68 | % |
Ratios/Supplemental Data | | | | | | | | | | | | | | | |
Net assets, end of period (000’s omitted) | | $14,192 | | | $13,818 | | | $15,635 | | | $17,153 | | | $16,402 | |
Ratio to average net assets of: | | | | | | | | | | | | | | | |
Expenses, net of waivers/reimbursements excluding interest expense | | 1.60 | % | | 1.60 | % | | 1.60 | %(e) | | 1.60 | % | | 1.60 | % |
Expenses, before waivers/reimbursements | | 1.80 | % | | 1.86 | % | | 1.87 | %(e) | | 1.96 | % | | 2.03 | % |
Expenses, before waivers/reimbursements excluding interest expense | | 1.80 | % | | 1.86 | % | | 1.80 | %(e) | | 1.83 | % | | 1.99 | % |
Net investment income, net of waivers/reimbursements | | 3.22 | % | | 3.33 | % | | 3.40 | %(e) | | 3.42 | % | | 3.65 | % |
Portfolio turnover rate | | 7 | % | | 1 | % | | 13 | % | | 14 | % | | 19 | % |
See footnote summary on page 166.
| | |
| ALLIANCEBERNSTEIN MUNICIPAL INCOME FUND II • | | 153 |
Financial Highlights
Selected Data For A Share Of Capital Stock Outstanding Throughout Each Period
| | | | | | | | | | | | | | | |
| | | New Jersey Portfolio | |
| | | Class A | |
| | | Year Ended September 30, | |
| | | 2008 | | | 2007 | | | 2006 | | | 2005 | | | 2004(a) | |
| | | | | | | | | | | | | | | |
| | | |
Net asset value, beginning of period | | $ 9.76 | | | $ 9.93 | | | $ 9.90 | | | $ 9.84 | | | $ 9.80 | |
| | | |
Income From Investment Operations | | | | | | | | | | | | | | | |
Net investment income(b)(c) | | .40 | | | .42 | | | .42 | | | .42 | | | .45 | |
Net realized and unrealized gain (loss) on investment transactions | | (.63 | ) | | (.17 | ) | | .03 | | | .07 | | | .04 | |
| | | |
Net increase (decrease) in net asset value from operations | | (.23 | ) | | .25 | | | .45 | | | .49 | | | .49 | |
| | | |
Less: Dividends | | | | | | | | | | | | | | | |
Dividends from net investment income | | (.40 | ) | | (.42 | ) | | (.42 | ) | | (.43 | ) | | (.45 | ) |
| | | |
Net asset value, end of period | | $ 9.13 | | | $ 9.76 | | | $ 9.93 | | | $ 9.90 | | | $ 9.84 | |
| | | |
Total Return | | | | | | | | | | | | | | | |
Total investment return based on net asset value(d) | | (2.46 | )% | | 2.52 | % | | 4.65 | % | | 5.03 | % | | 5.05 | % |
Ratios/Supplemental
Data | | | | | | | | | | | | | | | |
Net assets, end of period
(000’s omitted) | | $116,562 | | | $101,138 | | | $83,088 | | | $77,570 | | | $76,164 | |
Ratio to average net assets of: | | | | | | | | | | | | | | | |
Expenses, net of waivers/reimbursements excluding interest expense | | .87 | % | | .87 | % | | .87 | %(e) | | .87 | % | | .87 | % |
Expenses, before waivers/reimbursements | | .99 | % | | 1.10 | % | | 1.15 | %(e) | | 1.16 | % | | 1.23 | % |
Expenses, before waivers/reimbursements excluding interest expense | | .99 | % | | 1.03 | % | | 1.01 | %(e) | | 1.02 | % | | 1.17 | % |
Net investment income, net of waivers/reimbursements | | 4.15 | % | | 4.23 | % | | 4.25 | %(e) | | 4.26 | % | | 4.60 | % |
Portfolio turnover rate | | 32 | % | | 6 | % | | 6 | % | | 38 | % | | 15 | % |
See footnote summary on page 166.
| | |
| 154 | | • ALLIANCEBERNSTEIN MUNICIPAL INCOME FUND II |
Financial Highlights
Selected Data For A Share Of Capital Stock Outstanding Throughout Each Period
| | | | | | | | | | | | | | | |
| | | New Jersey Portfolio | |
| | | Class B | |
| | | Year Ended September 30, | |
| | | | | | | | | | | | | | | |
| | | 2008 | | | 2007 | | | 2006 | | | 2005 | | | 2004(a) | |
| | | |
Net asset value, beginning of period | | $ 9.76 | | | $ 9.93 | | | $ 9.90 | | | $ 9.84 | | | $ 9.80 | |
| | | |
Income From Investment Operations | | | | | | | | | | | | | | | |
Net investment income(b)(c) | | .33 | | | .35 | | | .35 | | | .35 | | | .38 | |
Net realized and unrealized gain (loss) on investment transactions | | (.62 | ) | | (.17 | ) | | .03 | | | .07 | | | .04 | |
| | | |
Net increase (decrease) in net asset value from operations | | (.29 | ) | | .18 | | | .38 | | | .42 | | | .42 | |
| | | |
Less: Dividends | | | | | | | | | | | | | | | |
Dividends from net investment income | | (.34 | ) | | (.35 | ) | | (.35 | ) | | (.36 | ) | | (.38 | ) |
| | | |
Net asset value, end of period | | $ 9.13 | | | $ 9.76 | | | $ 9.93 | | | $ 9.90 | | | $ 9.84 | |
| | | |
Total Return | | | | | | | | | | | | | | | |
Total investment return based on net asset value(d) | | (3.14 | )% | | 1.80 | % | | 3.91 | % | | 4.30 | % | | 4.41 | % |
Ratios/Supplemental Data | | | | | | | | | | | | | | | |
Net assets, end of period (000’s omitted) | | $13,898 | | | $27,275 | | | $42,766 | | | $58,706 | | | $83,835 | |
Ratio to average net assets of: | | | | | | | | | | | | | | | |
Expenses, net of waivers/reimbursements excluding interest expense | | 1.57 | % | | 1.57 | % | | 1.57 | %(e) | | 1.57 | % | | 1.57 | % |
Expenses, before waivers/reimbursements | | 1.72 | % | | 1.81 | % | | 1.86 | %(e) | | 1.87 | % | | 1.94 | % |
Expenses, before waivers/reimbursements excluding interest expense | | 1.72 | % | | 1.74 | % | | 1.72 | %(e) | | 1.73 | % | | 1.88 | % |
Net investment income, net of waivers/reimbursements | | 3.44 | % | | 3.52 | % | | 3.55 | %(e) | | 3.56 | % | | 3.89 | % |
Portfolio turnover rate | | 32 | % | | 6 | % | | 6 | % | | 38 | % | | 15 | % |
See footnote summary on page 166.
| | |
| ALLIANCEBERNSTEIN MUNICIPAL INCOME FUND II • | | 155 |
Financial Highlights
Selected Data For A Share Of Capital Stock Outstanding Throughout Each Period
| | | | | | | | | | | | | | | |
| | | New Jersey Portfolio | |
| | | Class C | |
| | | Year Ended September 30, | |
| | | 2008 | | | 2007 | | | 2006 | | | 2005 | | | 2004(a) | |
| | | |
| | | | | | | | | | | | | | | |
Net asset value, beginning of period | | $ 9.76 | | | $ 9.93 | | | $ 9.90 | | | $ 9.84 | | | $ 9.81 | |
| | | |
Income From Investment Operations | | | | | | | | | | | | | | | |
Net investment income(b)(c) | | .33 | | | .35 | | | .35 | | | .35 | | | .38 | |
Net realized and unrealized gain (loss) on investment transactions | | (.62 | ) | | (.17 | ) | | .03 | | | .07 | | | .03 | |
| | | |
Net increase (decrease) in net asset value from operations | | (.29 | ) | | .18 | | | .38 | | | .42 | | | .41 | |
| | | |
Less: Dividends | | | | | | | | | | | | | | | |
Dividends from net investment income | | (.34 | ) | | (.35 | ) | | (.35 | ) | | (.36 | ) | | (.38 | ) |
| | | |
Net asset value, end of period | | $ 9.13 | | | $ 9.76 | | | $ 9.93 | | | $ 9.90 | | | $ 9.84 | |
| | | |
Total Return | | | | | | | | | | | | | | | |
Total investment return based on net asset value(d) | | (3.14 | )% | | 1.80 | % | | 3.92 | % | | 4.31 | % | | 4.30 | % |
Ratios/Supplemental Data | | | | | | | | | | | | | | | |
Net assets, end of period (000’s omitted) | | $32,332 | | | $33,031 | | | $34,042 | | | $35,279 | | | $37,926 | |
Ratio to average net assets of: | | | | | | | | | | | | | | | |
Expenses, net of waivers/reimbursements excluding interest expense | | 1.57 | % | | 1.57 | % | | 1.57 | %(e) | | 1.57 | % | | 1.57 | % |
Expenses, before waivers/reimbursements | | 1.70 | % | | 1.80 | % | | 1.85 | %(e) | | 1.86 | % | | 1.93 | % |
Expenses, before waivers/reimbursements excluding interest expense | | 1.70 | % | | 1.74 | % | | 1.71 | %(e) | | 1.72 | % | | 1.87 | % |
Net investment income, net of waivers/reimbursements | | 3.44 | % | | 3.52 | % | | 3.55 | %(e) | | 3.56 | % | | 3.89 | % |
Portfolio turnover rate | | 32 | % | | 6 | % | | 6 | % | | 38 | % | | 15 | % |
See footnote summary on page 166.
| | |
| 156 | | • ALLIANCEBERNSTEIN MUNICIPAL INCOME FUND II |
Financial Highlights
Selected Data For A Share Of Capital Stock Outstanding Throughout Each Period
| | | | | | | | | | | | | | | |
| | | Ohio Portfolio | |
| | | Class A | |
| | | Year Ended September 30, | |
| | | 2008 | | | 2007 | | | 2006 | | | 2005 | | | 2004(a) | |
| | | |
| | | | | | | | | | | | | | | |
Net asset value, beginning of period | | $ 10.06 | | | $ 10.16 | | | $ 10.14 | | | $ 10.10 | | | $ 10.05 | |
| | | |
Income From Investment Operations | | | | | | | | | | | | | | | |
Net investment income(b)(c) | | .40 | | | .40 | | | .41 | | | .43 | | | .44 | |
Net realized and unrealized gain (loss) on investment transactions | | (.62 | ) | | (.10 | ) | | .02 | | | .03 | | | .05 | |
| | | |
Net increase (decrease) in net asset value from operations | | (.22 | ) | | .30 | | | .43 | | | .46 | | | .49 | |
| | | |
Less: Dividends | | | | | | | | | | | | | | | |
Dividends from net investment income | | (.40 | ) | | (.40 | ) | | (.41 | ) | | (.42 | ) | | (.44 | ) |
| | | |
Net asset value, end of period | | $ 9.44 | | | $ 10.06 | | | $ 10.16 | | | $ 10.14 | | | $ 10.10 | |
| | | |
Total Return | | | | | | | | | | | | | | | |
Total investment return based on net asset value(d) | | (2.33 | )% | | 3.05 | % | | 4.40 | % | | 4.67 | % | | 5.02 | % |
Ratios/Supplemental Data | | | | | | | | | | | | | | | |
Net assets, end of period (000’s omitted) | | $101,481 | | | $93,801 | | | $87,902 | | | $85,749 | | | $78,184 | |
Ratio to average net assets of: | | | | | | | | | | | | | | | |
Expenses, net of waivers/reimbursements | | .85 | % | | .85 | % | | .85 | %(e) | | .85 | % | | .85 | % |
Expenses, before waivers/reimbursements | | 1.00 | % | | 1.01 | % | | .98 | %(e) | | .99 | % | | 1.14 | % |
Net investment income, net of waivers/reimbursements | | 3.97 | % | | 4.00 | % | | 4.12 | %(e) | | 4.19 | % | | 4.38 | % |
Portfolio turnover rate | | 7 | % | | 4 | % | | 11 | % | | 23 | % | | 33 | % |
See footnote summary on page 166.
| | |
| ALLIANCEBERNSTEIN MUNICIPAL INCOME FUND II • | | 157 |
Financial Highlights
Selected Data For A Share Of Capital Stock Outstanding Throughout Each Period
| | | | | | | | | | | | | | | |
| | | Ohio Portfolio | |
| | | Class B | |
| | | Year Ended September 30, | |
| | | 2008 | | | 2007 | | | 2006 | | | 2005 | | | 2004(a) | |
| | | |
| | | | | | | | | | | | | | | |
Net asset value, beginning of period | | $ 10.05 | | | $ 10.15 | | | $ 10.13 | | | $ 10.09 | | | $ 10.04 | |
| | | |
Income From Investment Operations | | | | | | | | | | | | | | | |
Net investment income(b)(c) | | .32 | | | .33 | | | .34 | | | .36 | | | .37 | |
Net realized and unrealized gain (loss) on investment transactions | | (.61 | ) | | (.10 | ) | | .02 | | | .03 | | | .05 | |
| | | |
Net increase (decrease) in net asset value from operations | | (.29 | ) | | .23 | | | .36 | | | .39 | | | .42 | |
| | | |
Less: Dividends | | | | | | | | | | | | | | | |
Dividends from net investment income | | (.33 | ) | | (.33 | ) | | (.34 | ) | | (.35 | ) | | (.37 | ) |
| | | |
Net asset value, end of period | | $ 9.43 | | | $ 10.05 | | | $ 10.15 | | | $ 10.13 | | | $ 10.09 | |
| | | |
Total Return | | | | | | | | | | | | | | | |
Total investment return based on net asset value(d) | | (3.02 | )% | | 2.34 | % | | 3.67 | % | | 3.95 | % | | 4.30 | % |
Ratios/Supplemental Data | | | | | | | | | | | | | | | |
Net assets, end of period (000’s omitted) | | $16,192 | | | $29,436 | | | $41,802 | | | $55,111 | | | $70,121 | |
Ratio to average net assets of: | | | | | | | | | | | | | | | |
Expenses, net of waivers/reimbursements | | 1.55 | % | | 1.55 | % | | 1.55 | %(e) | | 1.55 | % | | 1.55 | % |
Expenses, before waivers/reimbursements | | 1.72 | % | | 1.72 | % | | 1.69 | %(e) | | 1.69 | % | | 1.85 | % |
Net investment income, net of waivers/reimbursements | | 3.26 | % | | 3.30 | % | | 3.42 | %(e) | | 3.50 | % | | 3.69 | % |
Portfolio turnover rate | | 7 | % | | 4 | % | | 11 | % | | 23 | % | | 33 | % |
See footnote summary on page 166.
| | |
| 158 | | • ALLIANCEBERNSTEIN MUNICIPAL INCOME FUND II |
Financial Highlights
Selected Data For A Share Of Capital Stock Outstanding Throughout Each Period
| | | | | | | | | | | | | | | |
| | | Ohio Portfolio | |
| | | Class C | |
| | | Year Ended September 30, | |
| | | 2008 | | | 2007 | | | 2006 | | | 2005 | | | 2004(a) | |
| | | |
| | | | | | | | | | | | | | | |
Net asset value, beginning of period | | $ 10.06 | | | $ 10.16 | | | $ 10.13 | | | $ 10.09 | | | $ 10.05 | |
| | | |
Income From Investment Operations | | | | | | | | | | | | | | | |
Net investment income(b)(c) | | .33 | | | .33 | | | .34 | | | .36 | | | .37 | |
Net realized and unrealized gain (loss) on investment transactions | | (.63 | ) | | (.10 | ) | | .03 | | | .03 | | | .04 | |
| | | |
Net increase (decrease) in net asset value from operations | | (.30 | ) | | .23 | | | .37 | | | .39 | | | .41 | |
| | | |
Less: Dividends | | | | | | | | | | | | | | | |
Dividends from net investment income | | (.33 | ) | | (.33 | ) | | (.34 | ) | | (.35 | ) | | (.37 | ) |
| | | |
Net asset value, end of period | | $ 9.43 | | | $ 10.06 | | | $ 10.16 | | | $ 10.13 | | | $ 10.09 | |
| | | |
Total Return | | | | | | | | | | | | | | | |
Total investment return based on net asset value(d) | | (3.11 | )% | | 2.33 | % | | 3.78 | % | | 3.94 | % | | 4.19 | % |
Ratios/Supplemental Data | | | | | | | | | | | | | | | |
Net assets, end of period (000’s omitted) | | $37,446 | | | $40,087 | | | $44,023 | | | $47,610 | | | $48,233 | |
Ratio to average net assets of: | | | | | | | | | | | | | | | |
Expenses, net of waivers/reimbursements | | 1.55 | % | | 1.55 | % | | 1.55 | %(e) | | 1.55 | % | | 1.55 | % |
Expenses, before waivers/reimbursements | | 1.71 | % | | 1.71 | % | | 1.68 | %(e) | | 1.69 | % | | 1.85 | % |
Net investment income, net of waivers/reimbursements | | 3.27 | % | | 3.31 | % | | 3.42 | %(e) | | 3.49 | % | | 3.69 | % |
Portfolio turnover rate | | 7 | % | | 4 | % | | 11 | % | | 23 | % | | 33 | % |
See footnote summary on page 166.
| | |
| ALLIANCEBERNSTEIN MUNICIPAL INCOME FUND II • | | 159 |
Financial Highlights
Selected Data For A Share Of Capital Stock Outstanding Throughout Each Period
| | | | | | | | | | | | | | | |
| | | Pennsylvania Portfolio | |
| | | Class A | |
| | | Year Ended September 30, | |
| | | 2008 | | | 2007 | | | 2006 | | | 2005 | | | 2004(a) | |
| | | |
| | | | | | | | | | | | | | | |
Net asset value, beginning of period | | $ 10.44 | | | $ 10.58 | | | $ 10.53 | | | $ 10.48 | | | $ 10.44 | |
| | | |
Income From Investment Operations | | | | | | | | | | | | | | | |
Net investment income(b)(c) | | .41 | | | .41 | | | .42 | | | .44 | | | .48 | |
Net realized and unrealized gain (loss) on investment transactions | | (.69 | ) | | (.14 | ) | | .05 | | | .05 | | | .04 | |
| | | |
Net increase (decrease) in net asset value from operations | | (.28 | ) | | .27 | | | .47 | | | .49 | | | .52 | |
| | | |
Less: Dividends | | | | | | | | | | | | | | | |
Dividends from net investment income | | (.41 | ) | | (.41 | ) | | (.42 | ) | | (.44 | ) | | (.48 | ) |
| | | |
Net asset value, end of period | | $ 9.75 | | | $ 10.44 | | | $ 10.58 | | | $ 10.53 | | | $ 10.48 | |
| | | |
Total Return | | | | | | | | | | | | | | | |
Total investment return based on net asset value(d) | | (2.80 | )% | | 2.60 | % | | 4.57 | % | | 4.75 | % | | 5.06 | % |
Ratios/Supplemental Data | | | | | | | | | | | | | | | |
Net assets, end of period (000’s omitted) | | $93,096 | | | $92,626 | | | $81,151 | | | $78,472 | | | $74,132 | |
Ratio to average net assets of: | | | | | | | | | | | | | | | |
Expenses, net of waivers/reimbursements excluding interest expense | | .95 | % | | .95 | % | | .95 | %(e) | | .95 | % | | .95 | % |
Expenses, before waivers/reimbursements | | 1.03 | % | | 1.03 | % | | 1.11 | %(e) | | 1.20 | % | | 1.24 | % |
Expenses, before waivers/reimbursements excluding interest expense | | 1.03 | % | | 1.03 | % | | 1.01 | %(e) | | 1.04 | % | | 1.18 | % |
Net investment income, net of waivers/reimbursements | | 3.99 | % | | 3.92 | % | | 4.00 | %(e) | | 4.19 | % | | 4.55 | % |
Portfolio turnover rate | | 9 | % | | 8 | % | | 23 | % | | 36 | % | | 19 | % |
See footnote summary on page 166.
| | |
| 160 | | • ALLIANCEBERNSTEIN MUNICIPAL INCOME FUND II |
Financial Highlights
Selected Data For A Share Of Capital Stock Outstanding Throughout Each Period
| | | | | | | | | | | | | | | |
| | | Pennsylvania Portfolio | |
| | | Class B | |
| | | Year Ended September 30, | |
| | | 2008 | | | 2007 | | | 2006 | | | 2005 | | | 2004(a) | |
| | | |
| | | | | | | | | | | | | | | |
Net asset value, beginning of period | | $ 10.44 | | | $ 10.58 | | | $ 10.53 | | | $ 10.48 | | | $ 10.44 | |
| | | |
Income From Investment Operations | | | | | | | | | | | | | | | |
Net investment income(b)(c) | | .34 | | | .34 | | | .35 | | | .37 | | | .40 | |
Net realized and unrealized gain (loss) on investment transactions | | (.69 | ) | | (.14 | ) | | .05 | | | .05 | | | .04 | |
| | | |
Net increase (decrease) in net asset value from operations | | (.35 | ) | | .20 | | | .40 | | | .42 | | | .44 | |
| | | |
Less: Dividends | | | | | | | | | | | | | | | |
Dividends from net investment income | | (.34 | ) | | (.34 | ) | | (.35 | ) | | (.37 | ) | | (.40 | ) |
| | | |
Net asset value, end of period | | $ 9.75 | | | $ 10.44 | | | $ 10.58 | | | $ 10.53 | | | $ 10.48 | |
| | | |
Total Return | | | | | | | | | | | | | | | |
Total investment return based on net asset value(d) | | (3.48 | )% | | 1.89 | % | | 3.84 | % | | 4.01 | % | | 4.32 | % |
Ratios/Supplemental Data | | | | | | | | | | | | | | | |
Net assets, end of period (000’s omitted) | | $11,245 | | | $21,329 | | | $33,448 | | | $41,760 | | | $55,552 | |
Ratio to average net assets of: | | | | | | | | | | | | | | | |
Expenses, net of waivers/reimbursements excluding interest expense | | 1.65 | % | | 1.65 | % | | 1.65 | %(e) | | 1.65 | % | | 1.65 | % |
Expenses, before waivers/reimbursements | | 1.75 | % | | 1.74 | % | | 1.82 | %(e) | | 1.90 | % | | 1.95 | % |
Expenses, before waivers/reimbursements excluding interest expense | | 1.75 | % | | 1.74 | % | | 1.72 | %(e) | | 1.74 | % | | 1.89 | % |
Net investment income, net of waivers/reimbursements | | 3.27 | % | | 3.21 | % | | 3.31 | %(e) | | 3.49 | % | | 3.85 | % |
Portfolio turnover rate | | 9 | % | | 8 | % | | 23 | % | | 36 | % | | 19 | % |
See footnote summary on page 166.
| | |
| ALLIANCEBERNSTEIN MUNICIPAL INCOME FUND II • | | 161 |
Financial Highlights
Selected Data For A Share Of Capital Stock Outstanding Throughout Each Period
| | | | | | | | | | | | | | | |
| | | Pennsylvania Portfolio | |
| | | Class C | |
| | | Year Ended September 30, | |
| | | 2008 | | | 2007 | | | 2006 | | | 2005 | | | 2004(a) | |
| | | |
| | | | | | | | | | | | | | | |
Net asset value, beginning of period | | $ 10.44 | | | $ 10.58 | | | $ 10.53 | | | $ 10.48 | | | $ 10.44 | |
| | | | | | |
Income From Investment Operations | | | | | | | | | | | | | | | |
Net investment income(b)(c) | | .34 | | | .34 | | | .35 | | | .37 | | | .40 | |
Net realized and unrealized gain (loss) on investment transactions | | (.69 | ) | | (.14 | ) | | .05 | | | .05 | | | .04 | |
| | | |
Net increase (decrease) in net asset value from operations | | (.35 | ) | | .20 | | | .40 | | | .42 | | | .44 | |
| | | |
Less: Dividends | | | | | | | | | | | | | | | |
Dividends from net investment income | | (.34 | ) | | (.34 | ) | | (.35 | ) | | (.37 | ) | | (.40 | ) |
| | | |
Net asset value, end of period | | $ 9.75 | | | $ 10.44 | | | $ 10.58 | | | $ 10.53 | | | $ 10.48 | |
| | | |
Total Return | | | | | | | | | | | | | | | |
Total investment return based on net asset value(d) | | (3.48 | )% | | 1.89 | % | | 3.84 | % | | 4.02 | % | | 4.32 | % |
Ratios/Supplemental Data | | | | | | | | | | | | | | | |
Net assets, end of period (000’s omitted) | | $30,194 | | | $31,295 | | | $34,332 | | | $34,705 | | | $36,168 | |
Ratio to average net assets of: | | | | | | | | | | | | | | | |
Expenses, net of waivers/reimbursements excluding interest expense | | 1.65 | % | | 1.65 | % | | 1.65 | %(e) | | 1.65 | % | | 1.65 | % |
Expenses, before waivers/reimbursements | | 1.74 | % | | 1.74 | % | | 1.82 | %(e) | | 1.90 | % | | 1.94 | % |
Expenses, before waivers/reimbursements excluding interest expense | | 1.74 | % | | 1.74 | % | | 1.72 | %(e) | | 1.74 | % | | 1.88 | % |
Net investment income, net of waivers/reimbursements | | 3.29 | % | | 3.22 | % | | 3.30 | %(e) | | 3.49 | % | | 3.85 | % |
Portfolio turnover rate | | 9 | % | | 8 | % | | 23 | % | | 36 | % | | 19 | % |
See footnote summary on page 166.
| | |
| 162 | | • ALLIANCEBERNSTEIN MUNICIPAL INCOME FUND II |
Financial Highlights
Selected Data For A Share Of Capital Stock Outstanding Throughout Each Period
| | | | | | | | | | | | | | | |
| | | Virginia Portfolio | |
| | | Class A | |
| | | Year Ended September 30, | |
| | | 2008 | | | 2007 | | | 2006 | | | 2005 | | | 2004(a) | |
| | | |
| | | | | | | | | | | | | | | |
Net asset value, beginning of period | | $ 10.68 | | | $ 10.84 | | | $ 10.82 | | | $ 10.77 | | | $ 10.75 | |
| | | |
Income From Investment Operations | | | | | | | | | | | | | | | |
Net investment income(b)(c) | | .43 | | | .45 | | | .47 | | | .49 | | | .52 | |
Net realized and unrealized gain (loss) on investment transactions | | (.66 | ) | | (.16 | ) | | .02 | | | .05 | | | .01 | |
| | | |
Net increase (decrease) in net asset value from operations | | (.23 | ) | | .29 | | | .49 | | | .54 | | | .53 | |
| | | |
Less: Dividends | | | | | | | | | | | | | | | |
Dividends from net investment income | | (.44 | ) | | (.45 | ) | | (.47 | ) | | (.49 | ) | | (.51 | ) |
| | | |
Net asset value, end of period | | $ 10.01 | | | $ 10.68 | | | $ 10.84 | | | $ 10.82 | | | $ 10.77 | |
| | | |
Total Return | | | | | | | | | | | | | | | |
Total investment return based on net asset value(d) | | (2.33 | )% | | 2.72 | % | | 4.61 | % | | 5.11 | % | | 5.04 | % |
Ratios/Supplemental Data | | | | | | | | | | | | | | | |
Net assets, end of period (000’s omitted) | | $141,216 | | | $119,858 | | | $109,343 | | | $88,605 | | | $64,089 | |
Ratio to average net assets of: | | | | | | | | | | | | | | | |
Expenses, net of waivers/reimbursements excluding interest expense | | .72 | % | | .72 | % | | .72 | %(e) | | .72 | % | | .72 | % |
Expenses, before waivers/reimbursements | | .96 | % | | .99 | % | | 1.01 | %(e) | | 1.09 | % | | 1.18 | % |
Expenses, before waivers/reimbursements excluding interest expense | | .96 | % | | .99 | % | | 1.00 | %(e) | | 1.00 | % | | 1.18 | % |
Net investment income, net of waivers/reimbursements | | 4.07 | % | | 4.19 | % | | 4.33 | %(e) | | 4.48 | % | | 4.82 | % |
Portfolio turnover rate | | 26 | % | | 15 | % | | 31 | % | | 23 | % | | 10 | % |
See footnote summary on page 166.
| | |
| ALLIANCEBERNSTEIN MUNICIPAL INCOME FUND II • | | 163 |
Financial Highlights
Selected Data For A Share Of Capital Stock Outstanding Throughout Each Period
| | | | | | | | | | | | | | | |
| | | Virginia Portfolio | |
| | | Class B | |
| | | Year Ended September 30, | |
| | | 2008 | | | 2007 | | | 2006 | | | 2005 | | | 2004(a) | |
| | | |
| | | | | | | | | | | | | | | |
Net asset value, beginning of period | | $ 10.66 | | | $ 10.82 | | | $ 10.80 | | | $ 10.75 | | | $ 10.73 | |
| | | |
Income From Investment Operations | | | | | | | | | | | | | | | |
Net investment income(b)(c) | | .35 | | | .38 | | | .39 | | | .41 | | | .44 | |
Net realized and unrealized gain (loss) on investment transactions | | (.66 | ) | | (.17 | ) | | .02 | | | .05 | | | .01 | |
| | | |
Net increase (decrease) in net asset value from operations | | (.31 | ) | | .21 | | | .41 | | | .46 | | | .45 | |
| | | |
Less: Dividends | | | | | | | | | | | | | | | |
Dividends from net investment income | | (.36 | ) | | (.37 | ) | | (.39 | ) | | (.41 | ) | | (.43 | ) |
| | | |
Net asset value, end of period | | $ 9.99 | | | $ 10.66 | | | $ 10.82 | | | $ 10.80 | | | $ 10.75 | |
| | | |
Total Return | | | | | | | | | | | | | | | |
Total investment return based on net asset value(d) | | (3.02 | )% | | 2.01 | % | | 3.89 | % | | 4.36 | % | | 4.32 | % |
Ratios/Supplemental Data | | | | | | | | | | | | | | | |
Net assets, end of period (000’s omitted) | | $11,582 | | | $23,486 | | | $37,006 | | | $46,489 | | | $65,978 | |
Ratio to average net assets of: | | | | | | | | | | | | | | | |
Expenses, net of waivers/reimbursements excluding interest expense | | 1.42 | % | | 1.42 | % | | 1.42 | %(e) | | 1.42 | % | | 1.42 | % |
Expenses, before waivers/reimbursements | | 1.67 | % | | 1.69 | % | | 1.72 | %(e) | | 1.80 | % | | 1.89 | % |
Expenses, before waivers/reimbursements excluding interest expense | | 1.67 | % | | 1.69 | % | | 1.71 | %(e) | | 1.71 | % | | 1.89 | % |
Net investment income, net of waivers/reimbursements | | 3.37 | % | | 3.49 | % | | 3.64 | %(e) | | 3.81 | % | | 4.13 | % |
Portfolio turnover rate | | 26 | % | | 15 | % | | 31 | % | | 23 | % | | 10 | % |
See footnote summary on page 166.
| | |
| 164 | | • ALLIANCEBERNSTEIN MUNICIPAL INCOME FUND II |
Financial Highlights
Selected Data For A Share Of Capital Stock Outstanding Throughout Each Period
| | | | | | | | | | | | | | | |
| | | Virginia Portfolio | |
| | | Class C | |
| | | Year Ended September 30, | |
| | | 2008 | | | 2007 | | | 2006 | | | 2005 | | | 2004(a) | |
| | | |
| | | | | | | | | | | | | | | |
Net asset value, beginning of period | | $ 10.66 | | | $ 10.81 | | | $ 10.79 | | | $ 10.74 | | | $ 10.73 | |
| | | |
Income From Investment Operations | | | | | | | | | | | | | | | |
Net investment income(b)(c) | | .36 | | | .38 | | | .39 | | | .41 | | | .44 | |
Net realized and unrealized gain (loss) on investment transactions | | (.68 | ) | | (.16 | ) | | .02 | | | .06 | | | – 0 | – |
| | | |
Net increase (decrease) in net asset value from operations | | (.32 | ) | | .22 | | | .41 | | | .47 | | | .44 | |
| | | |
Less: Dividends | | | | | | | | | | | | | | | |
Dividends from net investment income | | (.36 | ) | | (.37 | ) | | (.39 | ) | | (.42 | ) | | (.43 | ) |
| | | |
Net asset value, end of period | | $ 9.98 | | | $ 10.66 | | | $ 10.81 | | | $ 10.79 | | | $ 10.74 | |
| | | |
Total Return | | | | | | | | | | | | | | | |
Total investment return based on net asset value(d) | | (3.11 | )% | | 2.11 | % | | 3.90 | % | | 4.41 | % | | 4.23 | % |
Ratios/Supplemental Data | | | | | | | | | | | | | | | |
Net assets, end of period (000’s omitted) | | $36,517 | | | $35,516 | | | $34,544 | | | $29,412 | | | $28,654 | |
Ratio to average net assets of: | | | | | | | | | | | | | | | |
Expenses, net of waivers/reimbursements excluding interest expense | | 1.42 | % | | 1.42 | % | | 1.42 | %(e) | | 1.42 | % | | 1.42 | % |
Expenses, before waivers/reimbursements | | 1.66 | % | | 1.69 | % | | 1.71 | %(e) | | 1.79 | % | | 1.88 | % |
Expenses, before waivers/reimbursements excluding interest expense | | 1.66 | % | | 1.69 | % | | 1.70 | %(e) | | 1.70 | % | | 1.88 | % |
Net investment income, net of waivers/reimbursements | | 3.38 | % | | 3.50 | % | | 3.64 | %(e) | | 3.80 | % | | 4.13 | % |
Portfolio turnover rate | | 26 | % | | 15 | % | | 31 | % | | 23 | % | | 10 | % |
See footnote summary on page 166.
| | |
| ALLIANCEBERNSTEIN MUNICIPAL INCOME FUND II • | | 165 |
Financial Highlights
| (a) | As of October 1, 2003, the Portfolios have adopted the method of accounting for interim payments on swap contracts in accordance with Financial Accounting Standards Board Statement No. 133. These interim payments are reflected within net realized and unrealized gain (loss) on swap contracts, however prior to October 1, 2003, these interim payments were reflected within interest income/expense on the statement of operations. For the year ended September 30, 2004, the effect of this change to the net investment income and the net realized and unrealized gain (loss) on investment transactions was less than $0.01 per share. The effect on the ratio of net investment income to average net assets was as follows: |
| | | | | | | | | |
| | | Class A | | | Class B | | | Class C | |
Arizona | | 0.01 | % | | .00 | % | | .00 | % |
Florida | | (.02 | )% | | (.02 | )% | | (.02 | )% |
Massachusetts | | (.01 | )% | | .00 | % | | (.01 | )% |
Michigan | | 0.01 | % | | .01 | % | | .02 | % |
Minnesota | | 0.00 | % | | .00 | % | | .00 | % |
New Jersey | | 0.01 | % | | .01 | % | | .01 | % |
Ohio | | (.04 | )% | | (.03 | )% | | (.04 | )% |
Pennsylvania | | 0.00 | % | | .01 | % | | .00 | % |
Virginia | | (.02 | )% | | (.01 | )% | | (.02 | )% |
| (b) | Net of fees waived and expenses reimbursed by the Adviser. |
| (c) | Based on average shares outstanding. |
| (d) | Total investment return is calculated assuming an initial investment made at the net asset value at the beginning of the period, reinvestment of all dividends and distributions at net asset value during the period, and redemption on the last day of the period. Initial sales charge or contingent deferred sales charge is not reflected in the calculation of total investment return. Total return does not reflect the deduction of taxes that a shareholder would pay on Portfolio distributions or the redemption of Portfolio shares. Total investment return calculated for a period of less than one year is not annualized. |
| (e) | The ratio includes expenses attributable to costs of proxy solicitation. |
| (f) | Amount is less than .005. |
| | |
| 166 | | • ALLIANCEBERNSTEIN MUNICIPAL INCOME FUND II |
Financial Highlights
REPORT OF INDEPENDENT REGISTERED
PUBLIC ACCOUNTING FIRM
To the Shareholders and Board of Trustees
AllianceBernstein Municipal Income Fund II
We have audited the accompanying statements of assets and liabilities, including the portfolios of investments, of AllianceBernstein Municipal Income Fund II (the “Fund”) (comprising, respectively, the Arizona, Florida, Massachusetts, Michigan, Minnesota, New Jersey, Ohio, Pennsylvania and Virginia Portfolios) as of September 30, 2008, and the related statements of operations for the year then ended, the statements of changes in net assets for each of the two years in the period then ended, and the financial highlights for each of the five years in the period then ended. These financial statements and financial highlights are the responsibility of the Fund’s management. Our responsibility is to express an opinion on these financial statements and financial highlights based on our audits.
We conducted our audits in accordance with the standards of the Public Company Accounting Oversight Board (United States). Those standards require that we plan and perform the audit to obtain reasonable assurance about whether the financial statements and financial highlights are free of material misstatement. We were not engaged to perform an audit of the Fund’s internal control over financial reporting. Our audits included consideration of internal control over financial reporting as a basis for designing audit procedures that are appropriate in the circumstances, but not for the purpose of expressing an opinion on the effectiveness of the Fund’s internal control over financial reporting. Accordingly, we express no such opinion. An audit also includes examining, on a test basis, evidence supporting the amounts and disclosures in the financial statements and financial highlights, assessing the accounting principles used and significant estimates made by management, and evaluating the overall financial statement presentation. Our procedures included confirmation of securities owned as of September 30, 2008 by correspondence with the custodian and others or by other appropriate auditing procedures where replies from others were not received. We believe that our audits provide a reasonable basis for our opinion.
In our opinion, the financial statements and financial highlights referred to above present fairly, in all material respects, the financial position of each of the respective portfolios constituting the AllianceBernstein Municipal Income Fund II at September 30, 2008, the results of their operations for the year then ended, the changes in their net assets for each of the two years in the period then ended, and the financial highlights for each of the five years in the period then ended, in conformity with U.S. generally accepted accounting principles.

New York, New York
November 26, 2008
| | |
| ALLIANCEBERNSTEIN MUNICIPAL INCOME FUND II • | | 167 |
Report of Independent Registered Public Accounting Firm
TAX INFORMATION
(unaudited)
The Portfolios designated the following for the fiscal year ended September 30, 2008:
| | | |
| Portfolio | | Exempt-lnterest
Dividends |
Arizona | | $ | 8,156,800 |
Florida | | | 7,641,385 |
Massachusetts | | | 5,361,875 |
Michigan | | | 4,125,020 |
Minnesota | | | 3,689,423 |
New Jersey | | | 6,383,489 |
Ohio | | | 6,007,728 |
Pennsylvania | | | 5,353,271 |
Virginia | | | 7,210,855 |
Shareholders should not use the above information to prepare their tax returns. The Information necessary to complete your income tax returns will be included with your Form 1099-DIV which will be sent to you separately in January 2009.
| | |
| 168 | | • ALLIANCEBERNSTEIN MUNICIPAL INCOME FUND II |
Tax Information
BOARD OF TRUSTEES
William H. Foulk, Jr.,(1) Chairman
Marc O. Mayer
John H. Dobkin(1)
Michael J. Downey(1)
D. James Guzy(1)
Nancy P. Jacklin(1)
Garry L. Moody(1)
Marshall C. Turner, Jr.(1)
Earl D. Weiner(1)
OFFICERS
Robert M. Keith, President and Chief Executive Officer
Philip L. Kirstein, Senior Vice President and Independent Compliance Officer
(Guy) Robert B. Davidson III(2), Senior Vice President
Douglas J. Peebles, Senior Vice President
Jeffrey S. Phlegar, Senior Vice President
Michael G. Brooks(2), Vice President
Fred S. Cohen(2), Vice President
Terrance T. Hults(2), Vice President
Emilie D. Wrapp, Secretary
Joseph J. Mantineo, Treasurer and Chief Financial Officer
Thomas R. Manley, Controller
| | |
Custodian and Accounting Agent The Bank of New York
One Wall Street
New York, NY 10286 Principal Underwriter AllianceBernstein Investments, Inc.
1345 Avenue of the Americas
New York, NY 10105 Legal Counsel Seward & Kissel LLP
One Battery Park Plaza
New York, NY 10004 | | Independent Registered Public Accounting Firm Ernst & Young LLP
5 Times Square
New York, NY 10036 Transfer Agent AllianceBernstein Investor
Services, Inc.
P.O. Box 786003
San Antonio, TX 78278-6003
Toll-free (800) 227-5672 |
| (1) | Member of the Audit Committee, the Governance and Nominating Committee and the Independent Directors Committee. Mr. Foulk is the sole member of the Fair Value Pricing Committee. |
| (2) | The day-to-day management of, and investment decisions for, the Portfolios’ portfolios are made by the Municipal Bond Investment Team. Michael G. Brooks, Fred S. Cohen, (Guy) Robert B. Davidson III and Terrance T. Hults are the investment professionals with the most significant responsibility for the day-to-day management of the Portfolios’ portfolios. |
| | |
| ALLIANCEBERNSTEIN MUNICIPAL INCOME FUND II • | | 169 |
Board of Trustees
MANAGEMENT OF THE FUND
Board of Trustees Information
The business and affairs of the Fund are managed under the direction of the Board of Trustees. Certain information concerning the Fund’s Trustees is set forth below.
| | | | | | |
NAME,
ADDRESS* AND AGE
(FIRST YEAR ELECTED**) | | PRINCIPAL
OCCUPATION(S)
DURING PAST 5 YEARS | | PORTFOLIOS
IN FUND
COMPLEX
OVERSEEN BY
TRUSTEE | | OTHER
TRUSTEESHIPS
HELD BY
TRUSTEE |
| INTERESTED TRUSTEE | | | | |
Marc O. Mayer,***
1345 Avenue of the Americas,
New York, NY 10105
51
(2003) | | Executive Vice President of the Adviser since 2000 and Chief Investment Officer of Blend Solutions since June 2008. Previously, Executive Managing Director of AllianceBernstein Investments, Inc. (“ABI”) since 2003; prior thereto, he was head of AllianceBernstein Institutional Investments, a unit of the Adviser from 2001-2003. Prior to 2001, Chief Executive Officer of Sanford C. Bernstein & Co., LLC (institutional research and brokerage arm of Bernstein & Co. LLC) (“SCB & Co.”) and its predecessor. | | 95 | | SCB Partners, Inc. and SCB Inc. |
| | | | | | |
| DISINTERESTED TRUSTEES | | | | |
William H. Foulk, Jr., # +
Chairman of the Board
76
(1998) | | Investment Adviser and an Independent Consultant. Formerly, Senior Manager of Barrett Associates, Inc., a registered investment adviser, with which he had been associated since prior to 2003. He was formerly Deputy Comptroller and Chief Investment Officer of the State of New York and, prior thereto, Chief Investment Officer of the New York Bank for Savings. | | 97 | | None |
| | | | | | |
| | |
| 170 | | • ALLIANCEBERNSTEIN MUNICIPAL INCOME FUND II |
Management of the Fund
| | | | | | |
NAME,
ADDRESS* AND AGE
(FIRST YEAR ELECTED**) | | PRINCIPAL
OCCUPATION(S)
DURING PAST 5 YEARS | | PORTFOLIOS
IN FUND
COMPLEX
OVERSEEN BY
TRUSTEE | | OTHER
TRUSTEESHIPS
HELD BY
TRUSTEE |
DISINTERESTED TRUSTEES
(continued) | | | | |
John H. Dobkin, # 66 (1998) | | Consultant. Formerly, President of Save Venice, Inc. (preservation organization) from 2001-2002, Senior Advisor from June 1999-June 2000 and President of Historic Hudson Valley (historic preservation) from December 1989-May 1999. Previously, Director of the National Academy of Design and during 1988-1992, Director and Chairman of the Audit Committee of AllianceBernstein Corporation (“AB Corp.”) (formerly, Alliance Capital Management Corporation). | | 95 | | None |
| | | | | | |
Michael J. Downey, # 64 (2005) | | Private Investor since January 2004. Formerly, managing partner of Lexington Capital, LLC (investment advisory firm) from December 1997 until December 2003. Prior thereto, Chairman and CEO of Prudential Mutual Fund Management from 1987 to 1993. | | 95 | | Asia Pacific Fund, Inc.; The Merger Fund and Prospect Acquisition Corp. (financial services) |
| | | | | | |
D. James Guzy, #
72
(2005) | | Chairman of the Board of PLX Technology (semi-conductors) and of SRC Computers Inc., with which he has been associated since prior to 2003. | | 95 | | Intel Corporation (semi-conductors) and Cirrus Logic Corporation (semi-conductors) |
| | | | | | |
| | |
| ALLIANCEBERNSTEIN MUNICIPAL INCOME FUND II • | | 171 |
Management of the Fund
| | | | | | |
NAME,
ADDRESS* AND AGE
(FIRST YEAR ELECTED**) | | PRINCIPAL
OCCUPATION(S)
DURING PAST 5 YEARS | | PORTFOLIOS
IN FUND
COMPLEX
OVERSEEN BY
TRUSTEE | | OTHER
TRUSTEESHIPS
HELD BY
TRUSTEE |
DISINTERESTED TRUSTEES
(continued) | | | | |
Nancy P. Jacklin, #
60
(2006) | | Professorial Lecturer at the Johns Hopkins School of Advanced International Studies and Adjunct Professor at Georgetown University Law Center in the 2008-2009 academic year. Formerly, U.S. Executive Director of the International Monetary Fund (December 2002-May 2006); Partner, Clifford Chance (1992-2002); Sector Counsel, International Banking and Finance, and Associate General Counsel, Citicorp (1985-1992); Assistant General Counsel (International), Federal Reserve Board of Governors (1982-1985); and Attorney Advisor, U.S. Department of the Treasury (1973-1982). Member of the Bar of the District of Columbia and of New York; and member of the Council on Foreign Relations. | | 95 | | None |
| | | | | | |
Garry L. Moody, # 56 (2008) | | Formerly, Partner, Deloitte & Touche LLP, Vice-Chairman, and U.S. and Global Managing Partner, Investment Management Services Group 1995-2008. | | 94 | | None |
| | | | | | |
Marshall C. Turner, Jr., #
67
(2005) | | Interim CEO of MEMC Electronic Materials, Inc. since November 2008. He was Chairman and CEO of Dupont Photomasks, Inc. (components of semi-conductor manufacturing), 2003-2005, and President and CEO, 2005-2006, after the company was renamed Toppan Photomasks, Inc. | | 95 | | Xilinx, Inc. (programmable logic semi-
conductors) and MEMC Electronic Materials, Inc. (semi-conductor and solar cell substrates) |
| | |
| 172 | | • ALLIANCEBERNSTEIN MUNICIPAL INCOME FUND II |
Management of the Fund
| | | | | | |
NAME,
ADDRESS* AND AGE
(FIRST YEAR ELECTED**) | | PRINCIPAL
OCCUPATION(S)
DURING PAST 5 YEARS | | PORTFOLIOS
IN FUND
COMPLEX
OVERSEEN BY
TRUSTEE | | OTHER
TRUSTEESHIPS
HELD BY
TRUSTEE |
DISINTERESTED TRUSTEES
(continued) | | | | |
Earl D. Weiner, #
69
(2007) | | Of Counsel and Partner prior to January 2007, of the law firm Sullivan & Cromwell LLP; member of ABA Federal Regulation of Securities Committee Task Force on Fund Director’s Guidebook, member of Advisory Board of Sustainable Forestry Management Limited. | | 95 | | None |
| * | The address for each of the Fund’s disinterested Trustees is c/o AllianceBernstein L.P., Attention: Philp L. Kirstein, 1345 Avenue of the Americas, New York, NY 10105. |
| ** | There is no stated term of office for the Fund’s Trustees. |
| *** | Mr. Mayer is an “interested trustee”, as defined in the Investment Company Act of 1940 (the “1940 Act”), due to his position as an Executive Vice President of the Adviser. |
| # | Member of the Audit Committee, the Governance and Nominating Committee and Independent Directors Committee. |
| + | Member of the Fair Value Pricing Committee. |
| | |
| ALLIANCEBERNSTEIN MUNICIPAL INCOME FUND II • | | 173 |
Management of the Fund
Officer Information
Certain information concerning the Fund’s Officers is listed below.
| | | | |
NAME,
ADDRESS* AND AGE | | POSITION(S)
HELD WITH FUND | | PRINCIPAL OCCUPATION
DURING PAST 5 YEARS** |
Robert M. Keith
48 | | President and Chief Executive Officer | | Executive Vice President of the Adviser** since July 2008; Executive Managing Director of ABI** since 2006 and the head of ABI since July 2008. Prior to joining ABI in 2006, Executive Managing Director of Bernstein Global Wealth Management, and prior thereto, Senior Managing Director and Global Head of Client Service and Sales of AllianceBernstein’s institutional investment management business since 2004. Prior thereto, he was a Managing Director and Head of North American Client Service and Sales in AllianceBernstein’s institutional investment management business, with which he had been associated since prior to 2003. |
| | | | |
Philip L. Kirstein
63 | | Senior Vice President and Independent Compliance Officer | | Senior Vice President and Independent Compliance Officer of the AllianceBernstein Funds, with which he has been associated since October 2004. Prior thereto, he was Of Counsel to Kirkpatrick & Lockhart, LLP from October 2003 to October 2004 and General Counsel of Merrill Lynch Investment Managers, L.P. since prior to March 2003. |
| | | | |
(Guy) Robert B. Davidson III
47 | | Senior Vice President | | Senior Vice President of the Adviser,** with which he has been associated since prior to 2003. |
| | | | |
Douglas J. Peebles
43 | | Senior Vice President | | Executive Vice President of the Adviser,** with which he has been associated since prior to 2003. |
| | | | |
Jeffrey S. Phlegar
42 | | Senior Vice President | | Executive Vice President of the Adviser,** with which he has been associated since prior to 2003. |
| | | | |
Michael G. Brooks
60 | | Vice President | | Senior Vice President of the Adviser,** with which he has been associated since prior to 2003. |
| | | | |
Fred S. Cohen
50 | | Vice President | | Senior Vice President of the Adviser,** with which he has been associated since prior to 2003. |
| | | | |
Terrance T. Hults
42 | | Vice President | | Senior Vice President of the Adviser,** with which he has been associated since prior to 2003. |
| | | | |
| | |
| 174 | | • ALLIANCEBERNSTEIN MUNICIPAL INCOME FUND II |
Management of the Fund
| | | | |
NAME,
ADDRESS* AND AGE | | POSITION(S)
HELD WITH FUND | | PRINCIPAL OCCUPATION
DURING PAST 5 YEARS** |
Emilie D. Wrapp 52 | | Secretary | | Senior Vice President, Assistant General Counsel and Assistant Secretary of ABI,** with which she has been associated since prior to 2003. |
| | | | |
Joseph J. Mantineo 49 | | Treasurer and Chief Financial Officer | | Senior Vice President of ABIS,** with which he has been associated since prior to 2003. |
| | | | |
Thomas R. Manley 57 | | Controller | | Vice President of the Adviser,** with which he has been associated since prior to 2003. |
| * | The address for each of the Fund’s Officers is 1345 Avenue of the Americas, New York, NY 10105. |
| ** | The Adviser, ABI and ABIS are affiliates of the Fund. |
| | The Fund’s Statement of Additional Information (“SAI”) has additional information about the Fund’s Trustees and Officers and is available without charge upon request. Contact your financial representative or AllianceBernstein at 1-800-227-4618 for a free prospectus or SAI. |
| | |
| ALLIANCEBERNSTEIN MUNICIPAL INCOME FUND II • | | 175 |
Management of the Fund
THE FOLLOWING IS NOT PART OF THE SHAREHOLDER REPORT OR THE FINANCIAL STATEMENTS.
SUMMARY OF SENIOR OFFICER’S EVALUATION OF INVESTMENT ADVISORY AGREEMENT1
The following is a summary of the evaluation of the Investment Advisory Agreement between AllianceBernstein L.P. (the “Adviser”) and AllianceBernstein Municipal Income Fund II (the “Trust”) in respect of the following Portfolios: 2
Arizona Portfolio
Florida Portfolio
Massachusetts Portfolio
Michigan Portfolio
Minnesota Portfolio
New Jersey Portfolio
Ohio Portfolio
Pennsylvania Portfolio
Virginia Portfolio
The evaluation of the Investment Advisory Agreement was prepared by Philip L. Kirstein, the Senior Officer of the Trust, for the Trustees of the Trust, as required by an August 2004 agreement between the Adviser and the New York State Attorney General (“the NYAG”). The Senior Officer’s evaluation of the Investment Advisory Agreement is not meant to diminish the responsibility or authority of the Trustees of the Trust to perform its duties pursuant to Section 15 of the Investment Company Act of 1940 (the “40 Act”) and applicable state law. The purpose of the summary is to provide shareholders with a synopsis of the independent evaluation of the reasonableness of the advisory fees proposed to be paid by the Portfolios, which was provided to the Trustees in connection with their review of the proposed approval of the continuance of the Investment Advisory Agreement. The Senior Officer’s evaluation considered the following factors:
| | 1. | Advisory fees charged to institutional and other clients of the Adviser for like services; |
| | 2. | Advisory fees charged by other mutual fund companies for like services; |
| | 3. | Costs to the Adviser and its affiliates of supplying services pursuant to the advisory agreements, excluding any intra-corporate profit; |
| | 4. | Profit margins of the Adviser and its affiliates from supplying such services; |
| 1 | It should be noted that Senior Officer’s fee evaluation was completed on October 18, 2007. |
| 2 | Future references to the Portfolios do not include “AllianceBernstein.” References in the fee summary pertaining to performance and expense ratios refer to the Class A shares of the Portfolios. |
| | |
| 176 | | • ALLIANCEBERNSTEIN MUNICIPAL INCOME FUND II |
| | 5. | Possible economies of scale as the Portfolios grow larger; and |
| | 6. | Nature and quality of the Adviser’s services including the performance of the Portfolios. |
PORTFOLIO ADVISORY FEES, EXPENSE REIMBURSEMENTS, CAPS & RATIOS
The Adviser proposed that the Portfolios pay the advisory fee set forth in the table below for receiving the services to be provided pursuant to the Investment Advisory Agreement. The fee schedule below, implemented in January 2004 in consideration of the Adviser’s settlement with the NYAG in December 2003, is based on a master schedule that contemplates eight categories of funds with almost all funds in each category having the same advisory fee schedule.3
| | | | |
| Category | | Advisory Fee4 | | Trust |
| Low Risk Income | | 45 bp on 1st $2.5 billion 40 bp on next $2.5 billion 35 bp on the balance | | Municipal Income Fund II |
The Portfolios’ net assets on September 30, 2007 are set forth below:
| | | |
| Portfolio | | Net Assets ($MM) |
| Arizona Portfolio | | $ | 204.3 |
| Florida Portfolio | | $ | 192.3 |
| Massachusetts Portfolio | | $ | 134.3 |
| Michigan Portfolio | | $ | 122.3 |
| Minnesota Portfolio | | $ | 93.7 |
| New Jersey Portfolio | | $ | 161.7 |
| Ohio Portfolio | | $ | 163.4 |
| Pennsylvania Portfolio | | $ | 145.3 |
| Virginia Portfolio | | $ | 178.8 |
The Adviser is reimbursed as specified in the Investment Advisory Agreement for certain clerical, legal, accounting, administrative, and other services. Indicated below are the reimbursement amounts, which the Adviser received from the
| 3 | Most of the AllianceBernstein Mutual Funds, which the Adviser manages, were affected by the Adviser’s settlement with the NYAG. |
| 4 | The management fees for each Portfolio are based on the percentage of each Portfolio’s average daily net assets, not a combination of any of the Portfolios. |
| | |
| ALLIANCEBERNSTEIN MUNICIPAL INCOME FUND II • | | 177 |
Portfolios during their most recently completed fiscal year; expressed in dollars and as a percentage of average daily net assets:
| | | | | | |
| Portfolio | | Amount | | As a % of Average
Daily Net Assets | |
| Arizona Portfolio | | $ | 80,500 | | 0.039 | % |
| Florida Portfolio | | $ | 80,500 | | 0.017 | % |
| Massachusetts Portfolio | | $ | 80,500 | | 0.058 | % |
| Michigan Portfolio5 | | $ | 80,500 | | 0.057 | % |
| Minnesota Portfolio5 | | $ | 80,500 | | 0.082 | % |
| New Jersey Portfolio | | $ | 80,500 | | 0.049 | % |
| Ohio Portfolio | | $ | 80,500 | | 0.045 | % |
| Pennsylvania Portfolio | | $ | 80,500 | | 0.053 | % |
| Virginia Portfolio5 | | $ | 80,500 | | 0.047 | % |
The Adviser has agreed to waive that portion of its advisory fees and/or reimburse certain of the Portfolios for that portion of the Portfolios’ total operating expenses to the degree necessary to limit each Portfolio’s expense ratios to the amounts set forth below for each Portfolio’s current fiscal year. The waiver agreement is terminable by the Adviser at the end of the Portfolios’ fiscal year upon at least 60 days written notice. In addition, set forth below are the gross expense ratios of the Portfolios, annualized for the most recent semi-annual period:
| | | | | | | | | | |
| Portfolio | | Expense Cap
Pursuant to Expense
Limitation Undertaking | | | Gross
Expense
Ratio | | | Fiscal
Year End |
| Arizona Portfolio | | Class A
Class B Class C | | 0.78
1.48 1.48 | %
% % | | 0.94
1.65 1.64 | %
% % | | September 30 |
| | | | | | | | | | |
| Florida Portfolio | | Class A
Class B Class C | | 0.78
1.48 1.48 | %
% % | | 0.95
1.66 1.65 | %
% % | | September 30 |
| | | | | | | | | | |
| Massachusetts Portfolio | | Class A
Class B Class C | | 0.82
1.52 1.52 | %
% % | | 1.04
1.75 1.74 | %
% % | | September 30 |
| | | | | | | | | | |
| Michigan Portfolio | | Class A
Class B Class C | | 1.01
1.71 1.71 | %
% % | | 1.08
1.79 1.78 | %
% % | | September 30 |
| | | | | | | | | | |
| Minnesota Portfolio | | Class A
Class B Class C | | 0.90
1.60 1.60 | %
% % | | 1.15
1.87 1.86 | %
% % | | September 30 |
| 5 | The Adviser waived the amount in its entirety. |
| | |
| 178 | | • ALLIANCEBERNSTEIN MUNICIPAL INCOME FUND II |
| | | | | | | | | | |
| Portfolio | | Expense Cap
Pursuant to Expense
Limitation Undertaking | | | Gross
Expense
Ratio | | | Fiscal
Year End |
| New Jersey Portfolio | | Class A
Class B Class C | | 0.87
1.57 1.57 | %
% % | | 1.09
1.80 1.79 | %
% % | | September 30 |
| | | | | | | | | | |
| Ohio Portfolio | | Class A
Class B Class C | | 0.85
1.55 1.55 | %
% % | | 1.00
1.71 1.70 | %
% % | | September 30 |
| | | | | | | | | | |
| Pennsylvania Portfolio | | Class A
Class B Class C | | 0.95
1.65 1.65 | %
% % | | 1.02
1.73 1.72 | %
% % | | September 30 |
| | | | | | | | | | |
| Virginia Portfolio | | Class A
Class B Class C | | 0.72
1.42 1.42 | %
% % | | 0.97
1.68 1.67 | %
% % | | September 30 |
| I. | ADVISORY FEES CHARGED TO INSTITUTIONAL AND OTHER CLIENTS |
The advisory fees charged to investment companies which the Adviser manages and sponsors are normally higher than those charged to similar sized institutional accounts, including pension plans and sub-advised investment companies. The fee differential reflects, among other things, different services provided to such clients, and different liabilities assumed. Services provided by the Adviser to the Portfolios that are not provided to non-investment company clients include providing office space and personnel to serve as Fund Officers, who among other responsibilities make the certifications required under the Sarbanes–Oxley Act of 2002, and coordinating with and monitoring the Portfolios’ third party service providers such as Fund counsel, auditors, custodians, transfer agents and pricing services. The accounting, administrative, legal and compliance requirements for the Portfolios are more costly than those for institutional client assets due to the greater complexities and time required for investment companies, although as previously noted, a portion of these expenses are reimbursed by the Portfolios to the Adviser. Also, retail mutual funds managed by the Adviser are widely held. Servicing the Portfolios’ investors is more time consuming and labor intensive compared to institutional clients since the Adviser needs to communicate with a more extensive network of financial intermediaries and shareholders. In addition, managing the cash flow of an investment company may be more difficult than that of a stable pool of assets, such as an institutional client account with little cash movement in either direction, particularly, if a fund is in net redemption and the Adviser is frequently forced to sell securities to raise cash for redemptions. However, managing a fund with positive cash flow may be easier at times than managing a stable pool of assets. Finally, in recent years, investment advisers have been sued by institutional clients and have suffered reputational damage both by the attendant publicity and outcomes other than complete victories. Accordingly, the legal and reputational risks associated with institutional accounts are greater than previously thought, although still not equal to those related to the mutual fund industry.
| | |
| ALLIANCEBERNSTEIN MUNICIPAL INCOME FUND II • | | 179 |
Notwithstanding the Adviser’s view that managing an investment company is not comparable to managing other institutional accounts because the services provided are different, it is worth considering information regarding the advisory fees charged to institutional accounts with substantially similar investment styles as the Portfolios. However, with respect to the Portfolios, the Adviser represented that there is no institutional product in the Adviser’s Form ADV that has a substantially similar investment style as the Portfolios. It should be noted that the Adviser has represented that it does manage separately managed accounts that invest principally in municipal securities but those mandates have a substantially lower risk profile (credit and interest rate risk) than the Portfolios.
The Adviser represented that it does not sub-advise any registered investment companies of other fund families with a substantially similar investment style as any of the Portfolios.
| II. | MANAGEMENT FEES CHARGED BY OTHER MUTUAL FUNDS COMPANIES FOR LIKE SERVICES. |
Lipper, Inc. (“Lipper”), an analytical service that is not affiliated with the Adviser, compared the fees charged to the Portfolio with fees charged to other investment companies for similar services by other investment advisers. Lipper’s analysis included the Portfolios’ rankings with respect to the contractual management fee relative to the median of the Portfolios’ Lipper Expense Group (“EG”) at the approximate current asset level of the Portfolios.6
Lipper describes an EG as a representative sample of comparable funds. Lipper’s standard methodology for screening funds to be included in an EG entails the consideration of several fund criteria, including fund type, investment classification/objective, load type and similar 12b-1/non-12b-1 service fees, asset (size) comparability, and expense components and attributes.7 An EG will typically consist of seven to twenty funds. Certain of the Portfolios had original EGs that had an insufficient number of peers, in the view of the Senior Officer and the Adviser. Consequently, at the request of the Senior Officer and the Adviser, Lipper expanded those Portfolios’ EGs to include peers that had a similar but not the same Lipper investment classification/objective.
| 6 | The contractual management fee is calculated by Lipper using the Portfolio’s contractual management fee rate at a hypothetical asset level. The hypothetical asset level is based on the combined net assets of all classes of the Portfolio, rounded up to the next $25 million. Lipper’s total expense ratio information is based on the most recent annual report except as otherwise noted. A ranking of “1” means that the Portfolio has the lowest effective fee rate in the Lipper peer group. |
| 7 | Lipper does not consider average account size when constructing EGs. Funds with relatively small average account sizes tend to have higher transfer agent expense ratios than comparable sized funds that have relatively large average account sizes. Note that there are limitations on Lipper expense category data because different funds categorize expenses differently. |
| | |
| 180 | | • ALLIANCEBERNSTEIN MUNICIPAL INCOME FUND II |
| | | | | | |
| Portfolio | | Contractual
Management
Fee8 | | Lipper Expense
Group Median | | Rank |
| Arizona Portfolio9,10 | | 0.450 | | 0.543 | | 3/13 |
| Florida Portfolio9,10 | | 0.450 | | 0.550 | | 2/15 |
| Massachusetts Portfolio10 | | 0.450 | | 0.500 | | 2/11 |
| Michigan Portfolio9,10 | | 0.450 | | 0.550 | | 1/13 |
| Minnesota Portfolio9 | | 0.450 | | 0.550 | | 1/13 |
| New Jersey Portfolio10 | | 0.450 | | 0.510 | | 1/8 |
| Ohio Portfolio9,10 | | 0.450 | | 0.550 | | 1/14 |
| Pennsylvania Portfolio10 | | 0.450 | | 0.546 | | 1/9 |
| Virginia Portfolio9,10 | | 0.450 | | 0.547 | | 3/12 |
Because Lipper had expanded certain of the Portfolios’ EGs, under Lipper’s standard guidelines, those Portfolios’ Lipper Expense Universes (“EU”) were also expanded to include the universes of the peers that had a similar but not the same Lipper investment objective/classification as the subject Portfolio.11 A “normal” EU will include funds that have the same investment objective/classification as the subject Portfolio. 12 Set forth below is the comparison of the Portfolios’ total expense ratios and the medians of the Portfolios’ EGs and EUs. The Portfolios’ total expense ratios rankings are also shown:
| | | | | | | | | | |
| Portfolio | | Expense Ratio (%)13 | | Lipper Group
Median (%) | | Lipper Group Rank | | Lipper Universe Median (%) | | Lipper
Universe Rank |
| Arizona Portfolio14 | | 0.778 | | 0.791 | | 7/14 | | 0.770 | | 10/18 |
| Florida Portfolio14 | | 0.778 | | 0.881 | | 3/16 | | 0.876 | | 5/20 |
| Massachusetts Portfolio | | 0.817 | | 0.860 | | 5/12 | | 0.870 | | 7/17 |
| Michigan Portfolio14 | | 0.980 | | 0.914 | | 11/14 | | 0.890 | | 17/21 |
| Minnesota Portfolio14 | | 0.899 | | 0.890 | | 8/13 | | 0.860 | | 15/22 |
| New Jersey Portfolio | | 0.867 | | 0.857 | | 6/9 | | 0.851 | | 9/14 |
| Ohio Portfolio14 | | 0.847 | | 0.890 | | 4/15 | | 0.850 | | 9/21 |
| Pennsylvania Portfolio | | 0.948 | | 0.861 | | 9/10 | | 0.861 | | 14/18 |
| Virginia Portfolio14 | | 0.719 | | 0.845 | | 2/13 | | 0.851 | | 3/17 |
| 8 | The contractual management fees for the Portfolios do not reflect any expense reimbursements made by the Portfolios to the Adviser for certain clerical, legal, accounting, administrative, and other services. In addition, the contractual management fees do not reflect any management waivers for expense caps that effectively reduce the contractual management fee. |
| 9 | The Portfolio’s EG was expanded by Lipper at the request of the Senior Officer and the adviser. |
| 10 | Note that one of the Portfolio’s peers is excluded in the contractual management fee rankings because Lipper is unable to calculate the fund’s contractual management fee due to the fund’s breakpoint gross income component. |
| 11 | The expansion of the Portfolio’s EU was not requested by the Adviser or the Senior Officer. They requested only that the EGs be expanded. |
| 12 | Except for asset size comparability, Lipper uses the same criteria for selecting an EG peer when selecting an EU peer. Unlike the EG, the EU allows for the same adviser to be represented by more than just one fund. |
| 13 | Most recently completed fiscal year Class A share total expense ratio. |
| 14 | The Portfolios’ EU was expanded by Lipper under standard Lipper guidelines. |
| | |
| ALLIANCEBERNSTEIN MUNICIPAL INCOME FUND II • | | 181 |
Based on this analysis, except for Virginia Portfolio which has a more favorable ranking on a total expense ratio basis than on a management fee basis, the Portfolios have a more favorable ranking on a management fee basis than they do on a total expense ratio basis.
| III. | COSTS TO THE ADVISER AND ITS AFFILIATES OF SUPPLYING SERVICES PURSUANT TO THE ADVISORY FEE ARRANGEMENT, EXCLUDING ANY INTRA-CORPORATE PROFIT. |
The Adviser utilizes two profitability reporting systems, which operate independently but are aligned with each other, to estimate the Adviser’s profitability in connection with investment advisory services provided to the Portfolios. The Senior Officer has retained a consultant to provide independent advice regarding the alignment of the two profitability systems as well as the methodologies and allocations utilized by both profitability systems. See Section IV for additional discussion.
| IV. | PROFIT MARGINS OF THE ADVISER AND ITS AFFILIATES FOR SUPPLYING SUCH SERVICES. |
The Adviser’s profitability information for the Portfolios prepared by the Adviser for the Trustees of the Trust was reviewed by the Senior Officer and the consultant. Except for Michigan Portfolio and Virginia Portfolio, the Adviser’s profitability from providing investment advisory services to the Portfolios increased during the calendar year 2006, relative to 2005.
In addition to the Adviser’s direct profits from managing the Portfolios, certain of the Adviser’s affiliates have business relationships with the Portfolios and may earn a profit from providing other services to the Portfolios. The courts have referred to this type of business opportunity as “fall-out benefits” to the Adviser and indicated that they should be factored into the evaluation of the total relationship between the Portfolios and the Adviser. Neither case law nor common business practice precludes the Adviser’s affiliates from earning a reasonable profit on this type of relationship. These affiliates provide transfer agent and distribution services to the Portfolios and receive transfer agent fees, Rule 12b-1 payments, front-end sales loads and contingent deferred sales charges (“CDSC”).
AllianceBernstein Investments, Inc. (“ABI”), an affiliate of the Adviser, is the Portfolios’ principal underwriter. ABI and the Adviser have disclosed in the Portfolios’ prospectus that they may make revenue sharing payments from their own resources, in addition to revenues derived from sales loads and Rule 12b-1 fees, to firms that sell shares of the Portfolios. In 2006, ABI paid approximately 0.044% of the average monthly assets of the AllianceBernstein Mutual Funds or approximately $20.4 million for distribution services and educational support (revenue sharing payments). For 2007, it is anticipated, ABI will pay approximately 0.04% of the average monthly assets of the AllianceBernstein Mutual Funds or approximately $20 million.15
| 15 | ABI currently inserts the “Advance” in quarterly account statements and pays the incremental costs associated with the mailing. The incremental cost is less than what an “independent mailing” would cost. |
| | |
| 182 | | • ALLIANCEBERNSTEIN MUNICIPAL INCOME FUND II |
ABI retained the following amounts for Class A front-end load sales charges from sales of the Portfolios’ Class A shares during the Portfolios’ most recently completed fiscal year:
| | | |
| Portfolio | | Amount Received |
| Arizona Portfolio | | $ | 47,909 |
| Florida Portfolio | | $ | 20,683 |
| Massachusetts Portfolio | | $ | 12,980 |
| Michigan Portfolio | | $ | 13,670 |
| Minnesota Portfolio | | $ | 8,111 |
| New Jersey Portfolio | | $ | 10,044 |
| Ohio Portfolio | | $ | 12,123 |
| Pennsylvania Portfolio | | $ | 10,735 |
| Virginia Portfolio | | $ | 24,168 |
ABI received the following Rule 12b-1 fees and CDSC for the Portfolios during the Portfolios’ most recently completed fiscal year:
| | | | | | |
| Portfolio | | 12b-1 Fee Received | | CDSC Received |
| Arizona Portfolio | | $ | 1,204,307 | | $ | 31,161 |
| Florida Portfolio | | $ | 1,253,323 | | $ | 36,741 |
| Massachusetts Portfolio | | $ | 994,952 | | $ | 29,159 |
| Michigan Portfolio | | $ | 982,555 | | $ | 54,057 |
| Minnesota Portfolio | | $ | 495,020 | | $ | 10,388 |
| New Jersey Portfolio | | $ | 1,094,043 | | $ | 19,155 |
| Ohio Portfolio | | $ | 1,196,616 | | $ | 29,410 |
| Pennsylvania Portfolio | | $ | 955,604 | | $ | 9,665 |
| Virginia Portfolio | | $ | 1,026,494 | | $ | 22,764 |
Fees and reimbursements for out of pocket expenses charged by AllianceBernstein Investor Services, Inc. (“ABIS”), the affiliated transfer agent for the Portfolios, are charged on a per account basis, based on the level of service provided and the class of share held by the account. ABIS also receives a fee per shareholder sub-account for each account maintained by an intermediary on an omnibus basis. ABIS’ after-tax profitability decreased in 2006 in comparison to 2005. Set forth below are the net fees which ABIS retained from the Portfolios during the Portfolios’ most recently completed fiscal year:16
| | | | | | |
| Portfolio | | ABIS Fee | | Expense Offset |
| Arizona Portfolio | | $ | 37,864 | | $ | 1,787 |
| Florida Portfolio | | $ | 33,893 | | $ | 1,448 |
| Massachusetts Portfolio | | $ | 35,074 | | $ | 1,825 |
| Michigan Portfolio | | $ | 47,048 | | $ | 2,237 |
| 16 | The fees disclosed are net of any expense offsets with ABIS. An expense offset is created by the interest earned on the positive cash balance that occur within the transfer agent account as there is a one day lag with regards to money movement from the shareholder’s account to the transfer agent’s account and then from the transfer agent’s account to the Portfolio’s account. |
| | |
| ALLIANCEBERNSTEIN MUNICIPAL INCOME FUND II • | | 183 |
| | | | | | |
| Portfolio | | ABIS Fee | | Expense Offset |
| Minnesota Portfolio | | $ | 28,398 | | $ | 1,367 |
| New Jersey Portfolio | | $ | 54,295 | | $ | 2,554 |
| Ohio Portfolio | | $ | 48,076 | | $ | 2,328 |
| Pennsylvania Portfolio | | $ | 49,558 | | $ | 2,276 |
| Virginia Portfolio | | $ | 36,574 | | $ | 1,594 |
| V. | POSSIBLE ECONOMIES OF SCALE |
The Adviser has indicated that economies of scale are being shared with shareholders through fee structures,17 subsidies and enhancement to services. Based on some of the professional literature that has considered economies of scale in the mutual fund industry, it is thought that to the extent economies of scale exist, they may more often exist across a fund family as opposed to a specific fund. This is because the costs incurred by the Adviser, such as investment research or technology for trading or compliance systems, can be spread across a greater asset base as the fund family increases in size. It is also possible that as the level of services required to operate a successful investment company has increased over time, and advisory firms have made such investments in their business to provide services, there may be a sharing of economies of scale without a reduction in advisory fees.
An independent consultant, retained by the Senior Officer, provided the Board of Trustees an update of the Deli18 study on advisory fees and various fund characteristics. The preliminary results of the updated study, based on more recent data and using Lipper classifications, were found to be consistent with the results of the original study. The independent consultant observed patterns of lower advisory fees for funds with larger asset sizes and funds from larger family sizes compared to funds with smaller asset sizes and funds from smaller family sizes, which according to the independent consultant is indicative of a sharing of economies of scale and scope. However, in less liquid and active markets, such is not the case, as the empirical analysis showed potential for diseconomies of scale in those markets. The empirical analysis also showed diminishing economies of scale and scope as funds surpassed a certain high level of assets.
| VI. | NATURE AND QUALITY OF THE ADVISER’S SERVICES INCLUDING THE PERFORMANCE OF THE PORTFOLIOS. |
With assets under management of $813 billion as of September 30, 2007, the Adviser has the investment experience to manage and provide non-investment services (described in Section I) to the Portfolios.
| 17 | Fee structures include fee reductions, pricing at scale and breakpoints in advisory fee schedules. |
| 18 | The Deli study was originally published in 2002 based on 1997 data. |
| | |
| 184 | | • ALLIANCEBERNSTEIN MUNICIPAL INCOME FUND II |
The information below, prepared by Lipper, shows the 1, 3, 5 and 10 year performance returns and rankings of the Portfolios19 relative to their Lipper Performance Group (“PG”) and Lipper Performance Universe (“PU”)20 for the periods ended July 31, 2007.21
| | | | | | | | | | |
| | | Portfolio Return
(%) | | PG Median
(%) | | PU Median
(%) | | PG Rank | | PU Rank |
| Arizona Portfolio | | | | | | | | | | |
1 year | | 4.37 | | 3.81 | | 3.83 | | 1/5 | | 2/10 |
3 year | | 4.80 | | 3.87 | | 3.89 | | 1/5 | | 2/10 |
5 year | | 4.70 | | 3.87 | | 4.02 | | 1/5 | | 3/10 |
10 year | | 5.24 | | 4.39 | | 4.56 | | 1/5 | | 1/9 |
| | | | | | | | | | |
| Florida Portfolio | | | | | | | | | | |
1 year | | 4.11 | | 3.85 | | 3.85 | | 2/5 | | 2/9 |
3 year | | 4.83 | | 4.00 | | 4.40 | | 2/5 | | 2/9 |
5 year | | 4.89 | | 3.94 | | 4.33 | | 2/5 | | 2/9 |
10 year | | 5.16 | | 4.35 | | 4.78 | | 1/5 | | 1/9 |
| | | | | | | | | | |
| Massachusetts Portfolio | | | | | | | | | | |
1 year | | 4.06 | | 3.72 | | 3.72 | | 2/12 | | 3/18 |
3 year | | 4.43 | | 4.02 | | 4.00 | | 2/12 | | 2/17 |
5 year | | 4.28 | | 4.17 | | 4.10 | | 4/12 | | 5/17 |
10 year | | 4.82 | | 4.63 | | 4.60 | | 4/12 | | 5/16 |
| | | | | | | | | | |
| Michigan Portfolio | | | | | | | | | | |
1 year | | 3.98 | | 3.70 | | 3.79 | | 1/4 | | 3/12 |
3 year | | 4.68 | | 3.83 | | 3.78 | | 1/4 | | 1/11 |
5 year | | 4.49 | | 3.78 | | 3.89 | | 1/4 | | 1/11 |
10 year | | 5.31 | | 4.42 | | 4.42 | | 1/4 | | 1/11 |
| | | | | | | | | | |
| Minnesota Portfolio | | | | | | | | | | |
1 year | | 3.90 | | 3.76 | | 3.58 | | 3/7 | | 5/16 |
3 year | | 4.42 | | 4.08 | | 3.92 | | 3/7 | | 5/16 |
5 year | | 4.28 | | 4.20 | | 4.10 | | 3/7 | | 5/16 |
10 year | | 4.90 | | 4.65 | | 4.65 | | 2/7 | | 2/15 |
| | | | | | | | | | |
| 19 | The performance returns and rankings are for the Class A shares of the Portfolios. It should be noted that the performance returns of the Portfolios that were shown were provided by the Adviser. Lipper maintains its own database that includes the Portfolios’ performance returns. However, differences in the distribution price (ex-date versus payable date) and rounding differences may cause the Adviser’s own performance returns of the Portfolios to be one or two basis points different from Lipper. To maintain consistency, the performance returns of the Portfolios, as reported by the Adviser, are provided instead of Lipper. |
| 20 | The Portfolios PG/PU may not be necessarily identical to the Portfolios EG/EU as the criteria for including or excluding a fund in/from a PG/PU are somewhat different than that of an EU/EG. |
| 21 | Note that the current Lipper investment classification/objective dictates the PG and PU throughout the life of each Portfolio even if a Portfolio may have had a different investment classification/objective at different points in time. |
| | |
| ALLIANCEBERNSTEIN MUNICIPAL INCOME FUND II • | | 185 |
| | | | | | | | | | |
| | | Portfolio Return
(%) | | PG Median
(%) | | PU Median
(%) | | PG Rank | | PU Rank |
| New Jersey Portfolio | | | | | | | | | | |
1 year | | 4.19 | | 3.67 | | 3.80 | | 4/9 | | 6/14 |
3 year | | 4.75 | | 4.13 | | 4.22 | | 2/9 | | 4/14 |
5 year | | 3.98 | | 3.82 | | 3.96 | | 4/9 | | 7/14 |
10 year | | 4.42 | | 4.35 | | 4.45 | | 4/9 | | 8/14 |
| | | | | | | | | | |
| Ohio Portfolio | | | | | | | | | | |
1 year | | 4.60 | | 3.50 | | 3.66 | | 1/7 | | 2/15 |
3 year | | 4.60 | | 3.68 | | 3.61 | | 2/7 | | 2/14 |
5 year | | 4.46 | | 3.73 | | 3.77 | | 2/7 | | 2/14 |
10 year | | 4.82 | | 4.33 | | 4.33 | | 2/7 | | 3/13 |
| | | | | | | | | | |
| Pennsylvania Portfolio | | | | | | | | | | |
1 year | | 4.06 | | 3.76 | | 3.82 | | 3/10 | | 6/18 |
3 year | | 4.38 | | 4.19 | | 4.20 | | 3/10 | | 8/18 |
5 year | | 4.44 | | 4.16 | | 4.28 | | 2/10 | | 4/18 |
10 year | | 4.99 | | 4.60 | | 4.60 | | 1/10 | | 3/18 |
| | | | | | | | | | |
| Virginia Portfolio | | | | | | | | | | |
1 year | | 3.87 | | 3.69 | | 3.63 | | 2/6 | | 4/11 |
3 year | | 4.66 | | 4.13 | | 3.69 | | 2/6 | | 2/10 |
5 year | | 4.77 | | 4.35 | | 3.88 | | 1/6 | | 1/10 |
10 year | | 5.26 | | 4.61 | | 4.51 | | 1/6 | | 1/10 |
Set forth below are the 1, 3, 5, 10 year and since inception performance returns of the Portfolios (in bold)22 versus its benchmarks.23 Portfolio and benchmark
| 22 | The performance returns and risk measures shown in the table are for the Class A shares of the Portfolios. |
| 23 | The benchmark’s since inception performance return for each Portfolio is from the nearest month-end after inception date. In contrast to the benchmark, each Portfolio’s since inception performance return is from the Portfolio’s actual inception date. |
| | |
| 186 | | • ALLIANCEBERNSTEIN MUNICIPAL INCOME FUND II |
volatility and reward-to-variability ratio (“Sharpe Ratio”) information is also shown.24 Note that each Portfolio’s benchmark is the Lehman Brothers Municipal Bond Index.25
| | | | | | | | | | | | | | | | |
| | | Periods Ending July 31, 2007
Annualized Performance |
| | | 1 Year
(%) | | 3 Year
(%) | | 5 Year
(%) | | 10 Year
(%) | | Since
Inception
(%) | | Annualized | | Risk
Period
(Year) |
| | | | | | | Volatility
(%) | | Sharpe
(%) | |
| Arizona Portfolio | | 4.37 | | 4.80 | | 4.70 | | 5.24 | | 6.06 | | 3.29 | | 0.44 | | 10 |
| Lehman Brothers Municipal Bond Index | | 4.27 | | 4.38 | | 4.50 | | 5.23 | | 6.02 | | 3.65 | | 0.39 | | 10 |
| Inception Date: June 1, 1994 | | | | | | | | | | | | |
| | | | | | | | | | | | | | | | |
| Florida Portfolio | | 4.11 | | 4.83 | | 4.89 | | 5.16 | | 5.48 | | 3.29 | | 0.41 | | 10 |
| Lehman Brothers Municipal Bond Index | | 4.27 | | 4.38 | | 4.50 | | 5.23 | | 5.60 | | 3.65 | | 0.39 | | 10 |
| Inception Date: June 25, 1993 | | | | | | | | | | | | |
| | | | | | | | | | | | | | | | |
| Massachusetts Portfolio | | 4.06 | | 4.43 | | 4.28 | | 4.82 | | 6.18 | | 3.83 | | 0.28 | | 10 |
| Lehman Brothers Municipal Bond Index | | 4.27 | | 4.38 | | 4.50 | | 5.23 | | 5.99 | | 3.65 | | 0.39 | | 10 |
| Inception Date: March 29, 1994 | | | | | | | | | | | | |
| | | | | | | | | | | | | | | | |
| Michigan Portfolio | | 3.98 | | 4.68 | | 4.49 | | 5.31 | | 6.09 | | 3.73 | | 0.41 | | 10 |
| Lehman Brothers Municipal Bond Index | | 4.27 | | 4.38 | | 4.50 | | 5.23 | | 5.63 | | 3.65 | | 0.39 | | 10 |
| Inception Date: February 25, 1994 | | | | | | | | | | | | |
| | | | | | | | | | | | | | | | |
| Minnesota Portfolio | | 3.90 | | 4.42 | | 4.28 | | 4.90 | | 5.19 | | 3.59 | | 0.31 | | 10 |
| Lehman Brothers Municipal Bond Index | | 4.27 | | 4.38 | | 4.50 | | 5.23 | | 5.60 | | 3.65 | | 0.39 | | 10 |
| Inception Date: June 25, 1993 | | | | | | | | | | | | |
| | | | | | | | | | | | | | | | |
| New Jersey Portfolio | | 4.19 | | 4.75 | | 3.98 | | 4.42 | | 4.98 | | 4.08 | | 0.17 | | 10 |
| Lehman Brothers Municipal Bond Index | | 4.27 | | 4.38 | | 4.50 | | 5.23 | | 5.60 | | 3.65 | | 0.39 | | 10 |
| Inception Date: June 25, 1993 | | | | | | | | | | | | |
| 24 | Portfolio and benchmark volatility and Sharpe Ratio information was obtained through Lipper LANA, a database maintained by Lipper. Volatility is a statistical measure of the tendency of a market price or yield to vary over time. A Sharpe Ratio is a risk adjusted measure of return that divides a fund’s return in excess of the riskless return by the fund’s standard deviation. A fund with a greater volatility would be seen as more risky than a fund with equivalent performance but lower volatility; for that reason, a greater return would be demanded for the more risky fund. A fund with a higher Sharpe Ratio would be viewed as better performing than a fund with a lower Sharpe Ratio. |
| 25 | The Lehman Brother’s Municipal Index is a rules-based, market-value-weighted index engineered for the long-term tax-exempt bond market. To be included, bonds must be investment grade and be at least one year from maturity. The index has four main sectors: general obligation bonds, revenue bonds, insured bonds, and pre-funded bonds. The index represents a national municipal bond index as opposed to a specific state index. |
| | |
| ALLIANCEBERNSTEIN MUNICIPAL INCOME FUND II • | | 187 |
| | | | | | | | | | | | | | | | |
| | | Periods Ending July 31, 2007
Annualized Performance |
| | | 1 Year
(%) | | 3 Year
(%) | | 5 Year
(%) | | 10 Year
(%) | | Since
Inception
(%) | | Annualized | | Risk
Period
(Year) |
| | | | | | | Volatility
(%) | | Sharpe
(%) | |
| Ohio Portfolio | | 4.60 | | 4.60 | | 4.46 | | 4.82 | | 5.23 | | 3.47 | | 0.30 | | 10 |
| Lehman Brothers Municipal Bond Index | | 4.27 | | 4.38 | | 4.50 | | 5.23 | | 5.60 | | 3.65 | | 0.39 | | 10 |
| Inception Date: June 25, 1993 | | | | | | | | | | | | |
| | | | | | | | | | | | | | | | |
| Pennsylvania Portfolio | | 4.06 | | 4.38 | | 4.44 | | 4.99 | | 5.52 | | 3.61 | | 0.33 | | 10 |
| Lehman Brothers Municipal Bond Index | | 4.27 | | 4.38 | | 4.50 | | 5.23 | | 5.60 | | 3.65 | | 0.39 | | 10 |
| Inception Date: June 25, 1993 | | | | | | | | | | | | |
| | | | | | | | | | | | | | | | |
| Virginia Portfolio | | 3.87 | | 4.66 | | 4.77 | | 5.26 | | 6.21 | | 3.37 | | 0.43 | | 10 |
| Lehman Brothers Municipal Bond Index | | 4.27 | | 4.38 | | 4.50 | | 5.23 | | 5.97 | | 3.65 | | 0.39 | | 10 |
| Inception Date: April 29, 1994 | | | | | | | | | | | | |
CONCLUSION:
Based on the factors discussed above the Senior Officer’s conclusion is that the proposed fees for the Portfolios are reasonable and within the range of what would have been negotiated at arms-length in light of all the surrounding circumstances. This conclusion in respect of the Portfolios is based on an evaluation of all of these factors and no single factor was dispositive.
Dated: November 26, 2007
| | |
| 188 | | • ALLIANCEBERNSTEIN MUNICIPAL INCOME FUND II |
THIS PAGE IS NOT PART OF THE SHAREHOLDER REPORT OR THE FINANCIAL STATEMENTS
ALLIANCEBERNSTEIN FAMILY OF FUNDS
Wealth Strategies Funds
Balanced Wealth Strategy
Wealth Appreciation Strategy
Wealth Preservation Strategy
Tax-Managed Balanced Wealth Strategy
Tax-Managed Wealth Appreciation Strategy
Tax-Managed Wealth Preservation Strategy
Blended Style Funds
U.S. Large Cap Portfolio
International Portfolio
Tax-Managed International Portfolio
Growth Funds
Domestic
Growth Fund
Mid-Cap Growth Fund
Large Cap Growth Fund
Small/Mid Cap Growth Portfolio*
Global & International
Global Growth Fund*
Global Thematic Growth Fund*
Greater China ‘97 Fund
International Growth Fund
Value Funds
Domestic
Balanced Shares
Focused Growth & Income Fund
Growth & Income Fund
Small/Mid Cap Value Fund
Utility Income Fund
Value Fund
Global & International
Global Real Estate Investment Fund
Global Value Fund
International Value Fund
Taxable Bond Funds
Diversified Yield Fund
Global Bond Fund
High Income Fund*
Intermediate Bond Portfolio
Short Duration Portfolio
Municipal Bond Funds
| | |
National
National Portfolio II Arizona
California
California Portfolio II Florida
Massachusetts | | Michigan
Minnesota
New Jersey
New York
Ohio
Pennsylvania
Virginia |
Intermediate Municipal Bond Funds
Intermediate California
Intermediate Diversified
Intermediate New York
Closed-End Funds
AllianceBernstein Global High Income Fund
AllianceBernstein Income Fund
AllianceBernstein National Municipal Income Fund
ACM Managed Dollar Income Fund
Alliance California Municipal Income Fund
Alliance New York Municipal Income Fund
The Spain Fund
Retirement Strategies Funds
| | | | |
2000 Retirement Strategy | | 2020 Retirement Strategy | | 2040 Retirement Strategy |
2005 Retirement Strategy | | 2025 Retirement Strategy | | 2045 Retirement Strategy |
2010 Retirement Strategy | | 2030 Retirement Strategy | | 2050 Retirement Strategy |
2015 Retirement Strategy | | 2035 Retirement Strategy | | 2055 Retirement Strategy |
We also offer Exchange Reserves,** which serves as the money market fund exchange vehicle for the AllianceBernstein mutual funds.
You should consider the investment objectives, risks, charges and expenses of any AllianceBernstein fund/portfolio carefully before investing. For free copies of our prospectuses, which contain this and other information, visit us online at www.alliancebernstein.com or contact your financial advisor. Please read the prospectus carefully before investing.
| * | | Prior to January 28, 2008, High Income Fund was named Emerging Market Debt Fund. Prior to November 3, 2008, Small/Mid Cap Growth Portfolio was named Small Cap Growth Portfolio, Global Growth Fund was named Global Research Growth Fund, and Global Thematic Growth Fund was named Global Technology Fund. Prior to December 1, 2008, National Portfolio II was known as Insured National Portfolio, and California Portfolio II was named California Portfolio. |
| ** | An investment in the Fund is not a deposit in a bank and is not insured or guaranteed by the Federal Deposit Insurance Corporation or any other government agency. Although the Fund seeks to preserve the value of your investment at $1.00 per share, it is possible to lose money by investing in the Fund. |
| | |
| ALLIANCEBERNSTEIN MUNICIPAL INCOME FUND II • | | 189 |
AllianceBernstein Family of Funds
NOTES
| | |
| 190 | | • ALLIANCEBERNSTEIN MUNICIPAL INCOME FUND II |
NOTES
| | |
| ALLIANCEBERNSTEIN MUNICIPAL INCOME FUND II • | | 191 |
NOTES
| | |
| 192 | | • ALLIANCEBERNSTEIN MUNICIPAL INCOME FUND II |
ALLIANCEBERNSTEIN MUNICIPAL INCOME FUND II
1345 Avenue of the Americas
New York, NY 10105
800.221.5672
| | |
| |
| MIFII-0151-0908 | |  |
ITEM 2. CODE OF ETHICS.
(a) The registrant has adopted a code of ethics that applies to its principal executive officer, principal financial officer and principal accounting officer. A copy of the registrant’s code of ethics is filed herewith as Exhibit 12(a)(1).
(b) During the period covered by this report, no material amendments were made to the provisions of the code of ethics adopted in 2(a) above.
(c) During the period covered by this report, no implicit or explicit waivers to the provisions of the code of ethics adopted in 2(a) above were granted.
ITEM 3. AUDIT COMMITTEE FINANCIAL EXPERT.
The registrant’s Board of Directors has determined that independent directors Garry L. Moody and William H. Foulk, Jr. qualify as audit committee financial experts.
ITEM 4. PRINCIPAL ACCOUNTANT FEES AND SERVICES.
(a) - (c) The following table sets forth the aggregate fees billed by the independent registered public accounting firm Ernst & Young LLP, for the Fund’s last two fiscal years for professional services rendered for: (i) the audit of the Fund’s annual financial statements included in the Fund’s annual report to stockholders; (ii) assurance and related services that are reasonably related to the performance of the audit of the Fund’s financial statements and are not reported under (i), which include advice and education related to accounting and auditing issues and quarterly press release review (for those Funds which issue press releases), and preferred stock maintenance testing (for those Funds that issue preferred stock); and (iii) tax compliance, tax advice and tax return preparation.
| | | | | | | | | | | |
| | | | | Audit Fees | | Audit-Related
Fees | | Tax Fees |
Arizona Portfolio | | 2007 | | $ | 26,220 | | $ | 3,386 | | $ | 17,190 |
| | 2008 | | $ | 26,767 | | $ | 3,148 | | $ | 14,758 |
Florida Portfolio | | 2007 | | $ | 26,220 | | $ | 3,386 | | $ | 16,735 |
| | 2008 | | $ | 26,767 | | $ | 3,148 | | $ | 14,758 |
Massachusetts Portfolio | | 2007 | | $ | 26,220 | | $ | 3,386 | | $ | 13,553 |
| | 2008 | | $ | 26,767 | | $ | 3,148 | | $ | 14,758 |
Michigan Portfolio | | 2007 | | $ | 26,220 | | $ | 3,386 | | $ | 12,813 |
| | 2008 | | $ | 26,767 | | $ | 3,148 | | $ | 14,758 |
Minnesota Portfolio | | 2007 | | $ | 26,220 | | $ | 3,386 | | $ | 11,288 |
| | 2008 | | $ | 26,767 | | $ | 3,148 | | $ | 14,758 |
New Jersey Portfolio | | 2007 | | $ | 26,220 | | $ | 3,386 | | $ | 14,733 |
| | 2008 | | $ | 26,767 | | $ | 3,148 | | $ | 14,758 |
Ohio Portfolio | | 2007 | | $ | 26,220 | | $ | 3,386 | | $ | 15,122 |
| | 2008 | | $ | 26,767 | | $ | 3,148 | | $ | 14,758 |
Pennsylvania Portfolio | | 2007 | | $ | 26,220 | | $ | 3,386 | | $ | 14,098 |
| | 2008 | | $ | 26,767 | | $ | 3,148 | | $ | 14,758 |
Virginia Portfolio | | 2007 | | $ | 26,220 | | $ | 3,386 | | $ | 15,743 |
| | 2008 | | $ | 26,767 | | $ | 3,148 | | $ | 14,758 |
(d) Not applicable.
(e) (1) Beginning with audit and non-audit service contracts entered into on or after May 6, 2003, the Fund’s Audit Committee policies and procedures require the pre-approval of all audit and non-audit services provided to the Fund by the Fund’s independent registered public accounting firm. The Fund’s Audit Committee policies and procedures also require pre-approval of all audit and non-audit services provided to the Adviser and Service Affiliates to the extent that these services are directly related to the operations or financial reporting of the Fund.
(e) (2) All of the amounts for Audit Fees, Audit-Related Fees and Tax Fees in the table under Item 4 (a)–(c) are for services pre-approved by the Fund’s Audit Committee.
(f) Not applicable.
(g) The following table sets forth the aggregate non-audit services provided to the Fund, the Fund’s Adviser and entities that control, are controlled by or under common control with the Adviser that provide ongoing services to the Fund, which include preparing an annual internal control report pursuant to Statement on Auditing Standards No. 70 (“Service Affiliates”):
| | | | | | | | | |
| | | | | All Fees for
Non-Audit Services
Provided to the
Portfolio, the Adviser
and Service Affiliates | | Total Amount of
Foregoing Column Pre-
approved by the Audit
Committee
(Portion Comprised of
Audit Related Fees)
(Portion Comprised of
Tax Fees) | |
Arizona Portfolio | | 2007 | | $ | 1,213,831 | | $ | 140,096 | |
| | | | | | | $ | (122,906 | ) |
| | | | | | | $ | (17,190 | ) |
| | 2008 | | $ | 1,024,154 | | $ | 161,025 | |
| | | | | | | $ | (146,267 | ) |
| | | | | | | $ | (14,758 | ) |
Florida Portfolio | | 2007 | | $ | 1,213,138 | | $ | 139,403 | |
| | | | | | | $ | (122,668 | ) |
| | | | | | | $ | (16,735 | ) |
| | 2008 | | $ | 1,024,154 | | $ | 161,025 | |
| | | | | | | $ | (146,267 | ) |
| | | | | | | $ | (14,758 | ) |
Massachusetts Portfolio | | 2007 | | $ | 1,209,956 | | $ | 136,221 | |
| | | | | | | $ | (122,668 | ) |
| | | | | | | $ | (13,553 | ) |
| | 2008 | | $ | 1,024,154 | | $ | 161,025 | |
| | | | | | | $ | (146,267 | ) |
| | | | | | | $ | (14,758 | ) |
Michigan Portfolio | | 2007 | | $ | 1,209,216 | | $ | 135,481 | |
| | | | | | | $ | (122,668 | ) |
| | | | | | | $ | (12,813 | ) |
| | 2008 | | $ | 1,024,154 | | $ | 161,025 | |
| | | | | | | $ | (146,267 | ) |
| | | | | | | $ | (14,758 | ) |
Minnesota Portfolio | | 2007 | | $ | 1,207,691 | | $ | 133,956 | |
| | | | | | | $ | (122,668 | ) |
| | | | | | | $ | (11,288 | ) |
| | 2008 | | $ | 1,024,154 | | $ | 161,025 | |
| | | | | | | $ | (146,267 | ) |
| | | | | | | $ | (14,758 | ) |
New Jersey Portfolio | | 2007 | | $ | 1,211,374 | | $ | 137,639 | |
| | | | | | | $ | (122,906 | ) |
| | | | | | | $ | (14,733 | ) |
| | 2008 | | $ | 1,024,154 | | $ | 161,025 | |
| | | | | | | $ | (146,267 | ) |
| | | | | | | $ | (14,758 | ) |
Ohio Portfolio | | 2007 | | $ | 1,211,525 | | $ | 137,790 | |
| | | | | | | $ | (122,668 | ) |
| | | | | | | $ | (15,122 | ) |
| | 2008 | | $ | 1,024,154 | | $ | 161,025 | |
| | | | | | | $ | (146,267 | ) |
| | | | | | | $ | (14,758 | ) |
Pennsylvania Portfolio | | 2007 | | $ | 1,210,501 | | $ | 136,766 | |
| | | | | | | $ | (122,668 | ) |
| | | | | | | $ | (14,098 | ) |
| | 2008 | | $ | 1,024,154 | | $ | 161,025 | |
| | | | | | | $ | (146,267 | ) |
| | | | | | | $ | (14,758 | ) |
Virginia Portfolio | | 2007 | | $ | 1,212,146 | | $ | 138,411 | |
| | | | | | | $ | (122,668 | ) |
| | | | | | | $ | (15,743 | ) |
| | 2008 | | $ | 1,024,154 | | $ | 161,025 | |
| | | | | | | $ | (146,267 | ) |
| | | | | | | $ | (14,758 | ) |
(h) The Audit Committee of the Fund has considered whether the provision of any non-audit services not pre-approved by the Audit Committee provided by the Fund’s independent registered public accounting firm to the Adviser and Service Affiliates is compatible with maintaining the auditor’s independence.
ITEM 5. AUDIT COMMITTEE OF LISTED REGISTRANTS.
Not applicable to the registrant.
ITEM 6. SCHEDULE OF INVESTMENTS.
Please see Schedule of Investments contained in the Report to Shareholders included under Item 1 of this Form N-CSR.
ITEM 7. DISCLOSURE OF PROXY VOTING POLICIES AND PROCEDURES FOR CLOSED-END MANAGEMENT INVESTMENT COMPANIES.
Not applicable to the registrant.
ITEM 8. PORTFOLIO MANAGERS OF CLOSED-END MANAGEMENT INVESTMENT COMPANIES.
Not applicable to the registrant.
ITEM 9. PURCHASES OF EQUITY SECURITIES BY CLOSED-END MANAGEMENT INVESTMENT COMPANY AND AFFILIATED PURCHASERS.
Not applicable to the registrant.
ITEM 10. SUBMISSION OF MATTERS TO A VOTE OF SECURITY HOLDERS.
There have been no material changes to the procedures by which shareholders may recommend nominees to the Fund’s Board of Directors since the Fund last provided disclosure in response to this item.
ITEM 11. CONTROLS AND PROCEDURES.
(a) The registrant’s principal executive officer and principal financial officer have concluded that the registrant’s disclosure controls and procedures (as defined in Rule 30a-2(c) under the Investment Company Act of 1940, as amended) are effective at the reasonable assurance level based on their evaluation of these controls and procedures as of a date within 90 days of the filing date of this document.
(b) There were no changes in the registrant’s internal controls over financial reporting that occurred during the second fiscal quarter of the period that has materially affected, or is reasonably likely to materially affect, the registrant’s internal control over financial reporting.
ITEM 12. EXHIBITS.
The following exhibits are attached to this Form N-CSR:
| | |
EXHIBIT NO. | | DESCRIPTION OF EXHIBIT |
12 (a) (1) | | Code of Ethics that is subject to the disclosure of Item 2 hereof |
12 (b) (1) | | Certification of Principal Executive Officer Pursuant to Section 302 of the Sarbanes-Oxley Act of 2002 |
12 (b) (2) | | Certification of Principal Financial Officer Pursuant to Section 302 of the Sarbanes-Oxley Act of 2002 |
12 (c) | | Certification of Principal Executive Officer and Principal Financial Officer Pursuant to Section 906 of the Sarbanes-Oxley Act of 2002 |
SIGNATURES
Pursuant to the requirements of the Securities Exchange Act of 1934 and the Investment Company Act of 1940, the registrant has duly caused this report to be signed on its behalf by the undersigned, thereunto duly authorized.
(Registrant): AllianceBernstein Municipal Income Fund II
| | |
| |
| By: | | /s/ Robert M. Keith |
| | Robert M. Keith |
| | President |
| |
| Date: | | November 26, 2008 |
Pursuant to the requirements of the Securities Exchange Act of 1934 and the Investment Company Act of 1940, this report has been signed below by the following persons on behalf of the registrant and in the capacities and on the dates indicated.
| | |
| |
| By: | | /s/ Robert M. Keith |
| | Robert M. Keith |
| | President |
| |
| Date: | | November 26, 2008 |
| |
| By: | | /s/ Joseph J. Mantineo |
| | Joseph J. Mantineo |
| | Treasurer and Chief Financial Officer |
| |
| Date: | | November 26, 2008 |