UNITED STATES
SECURITIES AND EXCHANGE COMMISSION
WASHINGTON, D.C. 20549
FORM N-CSR
CERTIFIED SHAREHOLDER REPORT OF REGISTERED
MANAGEMENT INVESTMENT COMPANIES
Investment Company Act file number: 811-07618
ALLIANCEBERNSTEIN MUNICIPAL INCOME FUND II
(Exact name of registrant as specified in charter)
1345 Avenue of the Americas,
New York, New York 10105
(Address of principal executive offices) (Zip code)
Joseph J. Mantineo
AllianceBernstein L.P.
1345 Avenue of the Americas
New York, New York 10105
(Name and address of agent for service)
Registrant’s telephone number, including area code: (800) 221-5672
Date of fiscal year end: September 30, 2011
Date of reporting period: September 30, 2011
| ITEM 1. | REPORTS TO STOCKHOLDERS. |
ANNUAL REPORT
AllianceBernstein
Municipal Income Fund II
Arizona Portfolio
Massachusetts Portfolio
Michigan Portfolio
Minnesota Portfolio
New Jersey Portfolio
Ohio Portfolio
Pennsylvania Portfolio
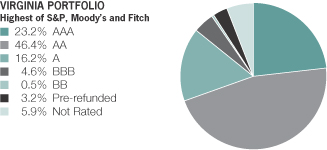
Virginia Portfolio
Annual Report

Investment Products Offered
| | • | | Are Not Bank Guaranteed |
Investors should consider the investment objectives, risks, charges and expenses of the Fund carefully before investing. For copies of our prospectus or summary prospectus, which contain this and other information, visit us online at www.alliancebernstein.com or contact your AllianceBernstein Investments representative. Please read the prospectus and/or summary prospectus carefully before investing.
This shareholder report must be preceded or accompanied by the Fund’s prospectus for individuals who are not current shareholders of the Fund.
You may obtain a description of the Fund’s proxy voting policies and procedures, and information regarding how the Fund voted proxies relating to portfolio securities during the most recent 12-month period ended June 30, without charge. Simply visit AllianceBernstein’s website at www.alliancebernstein.com, or go to the Securities and Exchange Commission’s (the “Commission”) website at www.sec.gov, or call AllianceBernstein at (800) 227-4618.
The Fund files its complete schedule of portfolio holdings with the Commission for the first and third quarters of each fiscal year on Form N-Q. The Fund’s Forms N-Q are available on the Commission’s website at www.sec.gov. The Fund’s Forms N-Q may also be reviewed and copied at the Commission’s Public Reference Room in Washington, DC; information on the operation of the Public Reference Room may be obtained by calling (800) SEC-0330. AllianceBernstein publishes full portfolio holdings for the Fund monthly at www.alliancebernstein.com.
AllianceBernstein Investments, Inc. (ABI) is the distributor of the AllianceBernstein family of mutual funds. ABI is a member of FINRA and is an affiliate of AllianceBernstein L.P., the manager of the funds.
AllianceBernstein® and the AB Logo are registered trademarks and service marks used by permission of the owner, AllianceBernstein L.P.
November 21, 2011
Annual Report
This report provides management’s discussion of fund performance for the portfolios of AllianceBernstein Municipal Income Fund II (the “Portfolios”) for the annual reporting period ended September 30, 2011.
Investment Objectives and Policies
The eight Portfolios of this Fund, by investing principally in high-yielding, predominantly investment-grade municipal securities, seek to provide their shareholders with the highest level of current income exempt from Federal taxation and state taxation of the respective state that is available without assuming what AllianceBernstein (the “Adviser”) considers to be undue risk. Each of the Portfolios pursues its objective by investing at least 80% of its net assets in municipal securities issued by the named state or municipal securities with interest that is otherwise exempt from the named state’s income tax.
Investment Results
The tables on pages 6-13 show performance for each Portfolio compared to its benchmark, the Barclays Capital Municipal Bond Index, which represents the municipal market, for the six- and 12-month periods ended September 30, 2011.
For the 12-month period ended September 30, 2011, Class A shares of the Arizona, Massachusetts, Michigan, Minnesota, New Jersey, Ohio and Pennsylvania Portfolios underperformed their benchmark, while Class A shares of the Virginia Portfolio
outperformed its benchmark, before sales charges. Overall security selection was negative across a number of sectors. Yield curve positioning (maturity distribution of the Portfolio), specifically slightly longer duration contributed positively for all of the Portfolios, except for the Michigan and Ohio Portfolios, during both the six- and 12-month periods. During the six-month period, yield curve positioning detracted from performance for the Michigan and Ohio Portfolios, as they had a duration that was slightly shorter than the benchmark.
For the six-month period ended September 30, 2011, Class A shares of all the Portfolios underperformed their benchmark, before sales charges. Security selection detracted from performance, while yield curve positioning was the primary positive contributor. The Municipal Bond Investment Team (the “Team”) continues to focus buying activity on revenue bonds. As the Team expects state and local governments to have to grapple with budget and pension fund shortfalls both in the present and in the years ahead.
A more detailed description of the contribution to each Portfolio’s relative performance due to security and sector selection versus the benchmark for the annual reporting period ended September 30, 2011 follows.
Arizona Portfolio – Class A shares of the Arizona Portfolio underperformed the benchmark for both the six- and 12-month periods, before sales charges. For the six-month period, security selection detracted in the leasing and
| | | | |
| ALLIANCEBERNSTEIN MUNICIPAL INCOME FUND II • | | | 1 | |
special tax sectors, while it contributed in the housing sector. For the 12-month period, security selection detracted in the leasing and health care sectors, while it contributed in the industrials sector.
Massachusetts Portfolio – Class A shares of the Massachusetts Portfolio underperformed the benchmark for both the six- and 12-month periods, before sales charges. For both periods, security selection in the education and health care sectors detracted. For the six-month period, security selection contributed in the housing sector. For the 12-month period, security selection contributed in the housing and special tax sectors.
Michigan Portfolio – Class A shares of the Michigan Portfolio underperformed the benchmark for both the six- and 12-month periods, before sales charges. For the six-month period, security selection in the education sector detracted. For the 12-month period, security selection detracted in the housing sector, while it contributed in the health care sector.
Minnesota Portfolio – Class A shares of the Minnesota Portfolio underperformed the benchmark for both the six- and 12-month periods, before sales charges. For both periods, security selection in the education and health care sectors detracted from performance. For the 12-month period, security selection contributed in the power and water sectors.
New Jersey Portfolio – Class A shares of the New Jersey Portfolio underperformed the benchmark for both the
six- and 12-month periods, before sales charges. For the six-month period, security selection in the health care, special tax and transportation sectors detracted from performance, while it contributed in the housing and industrial sectors. For the 12-month period, stock selection detracted in the health care and leasing sectors, while it contributed in the industrial and water sectors.
Ohio Portfolio – Class A shares of the Ohio Portfolio underperformed the benchmark for both the six- and 12-month periods, before sales charges. For both periods, security selection detracted in the education and special tax sectors. For the six-month period, security selection contributed in the housing sector, while for the 12-month period, it contributed in the industrial and water sectors.
Pennsylvania Portfolio – Class A shares of the Pennsylvania Portfolio underperformed the benchmark for both the six- and 12-month periods, before sales charges. For the six-month period, security selection detracted in the education and health care sectors, and contributed in the housing sector. For the 12-month period, security selection detracted in the health care and transportation sectors, and contributed in the special tax and industrials sectors.
Virginia Portfolio – Class A shares of the Virginia Portfolio underperformed the benchmark for the six-month period, and outperformed for the 12-month period, before sales charges. For the six-month period, security
| | |
| 2 | | • ALLIANCEBERNSTEIN MUNICIPAL INCOME FUND II |
selection in the transportation and education sectors detracted from performance, and contributed in the housing and industrials sectors. For the 12-month period, security selection helped in the industrial sector, while it detracted in the education sector.
All the Portfolios, with the exception of the Pennsylvania Portfolio, utilized interest rate swaps during the 12-month period ended September 30, 2011, for hedging purposes, and this had an immaterial effect on performance.
Market Review and Investment Strategy
Municipal bond markets drew strength from very tight supply and continued improved tax collections and rose over the six-month period ended September 30, 2011, as investor panic about defaults sweeping the nation appeared to have subsided. New municipal bond issuance fell sharply in the first nine months of 2011, to the lowest level in a decade. Mayors and governors were reluctant to commit to large capital expenditures while they were slashing their operating budgets. Nevertheless, the need to issue bonds to fund critical capital improvements grew, which points to increased issuance ahead.
The Team estimates that state tax revenues climbed to the point where they are 70% back to their peak reached in September 2008 after the largest drop seen. State and local tax collections are highly correlated with the rate of economic growth. Uncertainty surrounding the domestic
economic outlook due to the deteriorating economic outlook for Europe coupled with the fallout of their debt crisis worked together during the summer to cloud the outlook for tax collections going forward. Fortunately, for fiscal year 2012, most states were conservative in budgeting revenue increases.
While the change in the tax collections of state and local governments is highly uncertain at the moment, investors don’t envision a rash of defaults should tax collections be less than expected. Most state and local governments made progress this summer in addressing their budget shortfalls going forward. States and municipalities continued to face their most serious fiscal difficulties since the Great Depression, but, in general, substantial progress was made during the summer to balance their budgets, reducing the risk of widespread defaults.
The Portfolios may purchase municipal securities that are insured under policies issued by certain insurance companies. Historically, insured municipal securities typically received a higher credit rating, which meant that the issuer of the securities paid a lower interest rate. As a result of declines in the credit quality and associated downgrades of most fund insurers, insurance has less value than it did in the past. The market now values insured municipal securities primarily based on the credit quality of the issuer of the security with little value given to the insurance feature. In purchas-
| | | | |
| ALLIANCEBERNSTEIN MUNICIPAL INCOME FUND II • | | | 3 | |
ing such insured securities, the Adviser evaluates the risk and return of municipal securities through its own research. The ratings of most insurance companies have been downgraded and it is possible that an insurance company may become insolvent. If an insurance company’s rating is downgraded or the company becomes insolvent, the prices of municipal securities insured by the insurance company may decline.
As of September 30, 2011, the Portfolios’ percentages of total investments in insured bonds and in insured bonds that have been prerefunded are as follows:
| | | | | | | | |
| Portfolio | | Insured
Bonds* | | | Prerefunded/
ETM**
Bonds | |
Arizona | | | 45.79 | % | | | 1.76 | % |
Massachusetts | | | 16.78 | % | | | 0.03 | % |
Michigan | | | 32.44 | % | | | 4.78 | % |
Minnesota | | | 26.49 | % | | | 0.00 | % |
New Jersey | | | 37.04 | % | | | 6.66 | % |
Ohio | | | 49.27 | % | | | 12.04 | % |
Pennsylvania | | | 44.68 | % | | | 5.57 | % |
Virginia | | | 16.01 | % | | | 0.00 | % |
| * | | Breakdowns expressed as a percentage of total investments. |
The Team believes that downgrades in insurance company ratings or insurance company insolvencies present limited risk to the Portfolios. The generally investment-grade underlying credit quality of the insured municipal security may reduce the risk of a significant reduction in the value of the insured municipal security.
| | |
| 4 | | • ALLIANCEBERNSTEIN MUNICIPAL INCOME FUND II |
HISTORICAL PERFORMANCE
An Important Note About Historical Performance
The investment return and principal value of an investment in the Fund will fluctuate, so that shares, when redeemed, may be worth more or less than their original cost. Performance shown on the following pages represents past performance and does not guarantee future results. Current performance may be lower or higher than the performance information shown. You may obtain performance information current to the most recent month-end by visiting www.alliancebernstein.com.
All fees and expenses related to the operation of the Portfolios have been deducted. NAV returns do not reflect sales charges; if sales charges were reflected, the Portfolios’ quoted performance would be lower. SEC returns and the Portfolios’ returns shown reflect the applicable sales charges for each share class: a 3% maximum front-end sales charge for Class A shares; the applicable contingent deferred sales charge for Class B shares (3% year 1, 2% year 2, 1% year 3, 0% year 4); a 1% 1-year contingent deferred sales charge for Class C shares. Prior to October 1, 2009, the maximum front-end sales charge for Class A shares of the Portfolio was 4.25%. If the Class A annualized returns for the Portfolio and Portfolio returns shown reflected the deduction of the former maximum front-end sales charge, its returns would be lower. Returns for the different share classes will vary due to different expenses associated with each class. Performance assumes reinvestment of distributions and does not account for taxes.
Benchmark Disclosure
The unmanaged Barclays Capital Municipal Bond Index does not reflect fees and expenses associated with the active management of a mutual fund portfolio. The Index is a total return performance benchmark for the long-term investment grade, tax-exempt bond market. An investor cannot invest directly in an index, and its results are not indicative of the performance for any specific investment, including the Portfolios.
A Word About Risk
Market Risk: The market values of the portfolio’s holdings rise and fall from day to day, so investments may lose value.
Municipal Market Risk: Debt securities issued by state or local governments may be subject to special political, legal, economic and market factors that can have a significant effect on the portfolio’s yield or value.
Interest Rate Risk: As interest rates rise, bond prices fall and vice versa—long-term securities tend to rise and fall more than short-term securities.
Credit Risk: A bond’s credit rating reflects the issuer’s ability to make timely payments of interest or principal—the lower the rating, the higher the risk of default. If the issuer’s financial strength deteriorates, the issuer’s rating may be lowered and the bond’s value may decline.
Inflation Risk: Prices for goods and services tend to rise over time, which may erode the purchasing power of investments.
Derivatives Risk: Investing in derivative instruments such as options, futures, forwards or swaps can be riskier than traditional investments, and may be more volatile, especially in a down market.
Liquidity Risk: The difficulty of purchasing or selling a security at an advantageous time or price.
These risks are fully discussed in the Portfolios’ prospectus.
(Historical Performance continued on next page)
| | | | |
| ALLIANCEBERNSTEIN MUNICIPAL INCOME FUND II • | | | 5 | |
Historical Performance
ARIZONA PORTFOLIO
HISTORICAL PERFORMANCE
(continued from previous page)
| | | | | | | | | | |
| | | | | | | | | | |
THE PORTFOLIO VS. ITS BENCHMARK PERIODS ENDED SEPTEMBER 30, 2011 | | NAV Returns | | | |
| | 6 Months | | | 12 Months | | | |
Arizona Portfolio | | | | | | | | | | |
Class A | | | 6.68% | | | | 3.07% | | | |
|
Class B* | | | 6.32% | | | | 2.36% | | | |
|
Class C | | | 6.32% | | | | 2.35% | | | |
|
Barclays Capital Municipal Bond Index | | | 7.85% | | | | 3.88% | | | |
|
* Effective January 31, 2009, Class B shares are no longer available for purchase to new investors. Please see Note A for more information. |
| | | | | | | | | | |
GROWTH OF A $10,000 INVESTMENT IN THE PORTFOLIO
9/30/01 TO 9/30/11

This chart illustrates the total value of an assumed $10,000 investment in AllianceBernstein Municipal Income Fund II Arizona Portfolio Class A shares (from 9/30/01 to 9/30/11) as compared with the performance of the Portfolio’s benchmark. The chart showing the Class A at Offering reflects the deduction of the maximum 3% sales charge from the initial $10,000 investment in the Portfolio and assumes the reinvestment of dividends and capital gains distributions.
See Historical Performance and Benchmark disclosures on page 5.
(Historical Performance continued on next page)
| | |
| 6 | | • ALLIANCEBERNSTEIN MUNICIPAL INCOME FUND II |
Historical Performance
MASSACHUSETTS PORTFOLIO
HISTORICAL PERFORMANCE
(continued from previous page)
| | | | | | | | | | |
| | | | | | | | | | |
THE PORTFOLIO VS. ITS BENCHMARK PERIODS ENDED SEPTEMBER 30, 2011 | | NAV Returns | | | |
| | 6 Months | | | 12 Months | | | |
Massachusetts Portfolio | | | | | | | | | | |
Class A | | | 7.60% | | | | 3.38% | | | |
|
Class B* | | | 7.15% | | | | 2.68% | | | |
|
Class C | | | 7.24% | | | | 2.67% | | | |
|
Barclays Capital Municipal Bond Index | | | 7.85% | | | | 3.88% | | | |
|
* Effective January 31, 2009, Class B shares are no longer available for purchase to new investors. Please see Note A for more information. |
| | | | | | | | | | |
GROWTH OF A $10,000 INVESTMENT IN THE PORTFOLIO
9/30/01 TO 9/30/11
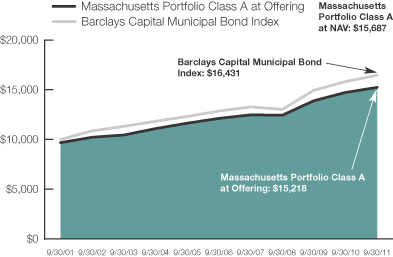
This chart illustrates the total value of an assumed $10,000 investment in AllianceBernstein Municipal Income Fund II Massachusetts Portfolio Class A shares (from 9/30/01 to 9/30/11) as compared with the performance of the Portfolio’s benchmark. The chart showing the Class A at Offering reflects the deduction of the maximum 3% sales charge from the initial $10,000 investment in the Portfolio and assumes the reinvestment of dividends and capital gains distributions.
See Historical Performance and Benchmark disclosures on page 5.
(Historical Performance continued on next page)
| | | | |
| ALLIANCEBERNSTEIN MUNICIPAL INCOME FUND II • | | | 7 | |
Historical Performance
MICHIGAN PORTFOLIO
HISTORICAL PERFORMANCE
(continued from previous page)
| | | | | | | | | | |
| | | | | | | | | | |
THE PORTFOLIO VS. ITS BENCHMARK PERIODS ENDED SEPTEMBER 30, 2011 | | NAV Returns | | | |
| | 6 Months | | | 12 Months | | | |
Michigan Portfolio | | | | | | | | | | |
Class A | | | 5.07% | | | | 2.92% | | | |
|
Class B* | | | 4.72% | | | | 2.27% | | | |
|
Class C | | | 4.71% | | | | 2.30% | | | |
|
Barclays Capital Municipal Bond Index | | | 7.85% | | | | 3.88% | | | |
|
* Effective January 31, 2009, Class B shares are no longer available for purchase to new investors. Please see Note A for more information. |
| | | | | | | | | | |
GROWTH OF A $10,000 INVESTMENT IN THE PORTFOLIO
9/30/01 TO 9/30/11
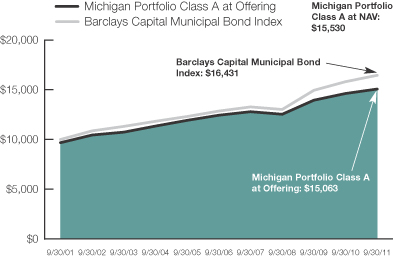
This chart illustrates the total value of an assumed $10,000 investment in AllianceBernstein Municipal Income Fund II Michigan Portfolio Class A shares (from 9/30/01 to 9/30/11) as compared with the performance of the Portfolio’s benchmark. The chart showing the Class A at Offering reflects the deduction of the maximum 3% sales charge from the initial $10,000 investment in the Portfolio and assumes the reinvestment of dividends and capital gains distributions.
See Historical Performance and Benchmark disclosures on page 5.
(Historical Performance continued on next page)
| | |
| 8 | | • ALLIANCEBERNSTEIN MUNICIPAL INCOME FUND II |
Historical Performance
MINNESOTA PORTFOLIO
HISTORICAL PERFORMANCE
(continued from previous page)
| | | | | | | | | | |
| | | | | | | | | | |
THE PORTFOLIO VS. ITS BENCHMARK PERIODS ENDED SEPTEMBER 30, 2011 | | NAV Returns | | | |
| | 6 Months | | | 12 Months | | | |
Minnesota Portfolio | | | | | | | | | | |
Class A | | | 6.59% | | | | 3.68% | | | |
|
Class B* | | | 6.22% | | | | 2.96% | | | |
|
Class C | | | 6.22% | | | | 2.95% | | | |
|
Barclays Capital Municipal Bond Index | | | 7.85% | | | | 3.88% | | | |
|
* Effective January 31, 2009, Class B shares are no longer available for purchase to new investors. Please see Note A for more information. |
| | | | | | | | | | |
GROWTH OF A $10,000 INVESTMENT IN THE PORTFOLIO
9/30/01 TO 9/30/11
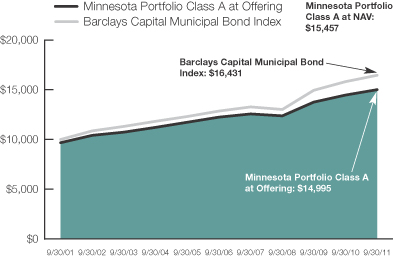
This chart illustrates the total value of an assumed $10,000 investment in AllianceBernstein Municipal Income Fund II Minnesota Portfolio Class A shares (from 9/30/01 to 9/30/11) as compared with the performance of the Portfolio’s benchmark. The chart showing the Class A at Offering reflects the deduction of the maximum 3% sales charge from the initial $10,000 investment in the Portfolio and assumes the reinvestment of dividends and capital gains distributions.
See Historical Performance and Benchmark disclosures on page 5.
(Historical Performance continued on next page)
| | | | |
| ALLIANCEBERNSTEIN MUNICIPAL INCOME FUND II • | | | 9 | |
Historical Performance
NEW JERSEY PORTFOLIO
HISTORICAL PERFORMANCE
(continued from previous page)
| | | | | | | | | | |
| | | | | | | | | | |
THE PORTFOLIO VS. ITS BENCHMARK PERIODS ENDED SEPTEMBER 30, 2011 | | NAV Returns | | | |
| | 6 Months | | | 12 Months | | | |
New Jersey Portfolio | | | | | | | | | | |
Class A | | | 7.03% | | | | 3.08% | | | |
|
Class B* | | | 6.66% | | | | 2.37% | | | |
|
Class C | | | 6.65% | | | | 2.47% | | | |
|
Barclays Capital Municipal Bond Index | | | 7.85% | | | | 3.88% | | | |
|
* Effective January 31, 2009, Class B shares are no longer available for purchase to new investors. Please see Note A for more information. |
| | | | | | | | | | |
GROWTH OF A $10,000 INVESTMENT IN THE PORTFOLIO
9/30/01 TO 9/30/11
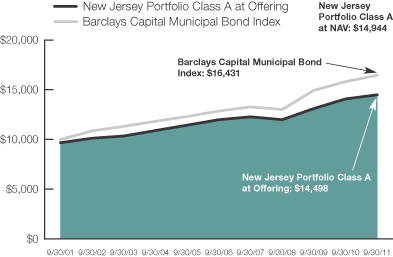
This chart illustrates the total value of an assumed $10,000 investment in AllianceBernstein Municipal Income Fund II New Jersey Portfolio Class A shares (from 9/30/01 to 9/30/11) as compared with the performance of the Portfolio’s benchmark. The chart showing the Class A at Offering reflects the deduction of the maximum 3% sales charge from the initial $10,000 investment in the Portfolio and assumes the reinvestment of dividends and capital gains distributions.
See Historical Performance and Benchmark disclosures on page 5.
(Historical Performance continued on next page)
| | |
| 10 | | • ALLIANCEBERNSTEIN MUNICIPAL INCOME FUND II |
Historical Performance
OHIO PORTFOLIO
HISTORICAL PERFORMANCE
(continued from previous page)
| | | | | | | | | | |
| | | | | | | | | | |
THE PORTFOLIO VS. ITS BENCHMARK PERIODS ENDED SEPTEMBER 30, 2011 | | NAV Returns | | | |
| | 6 Months | | | 12 Months | | | |
Ohio Portfolio | | | | | | | | | | |
Class A | | | 5.78% | | | | 3.71% | | | |
|
Class B* | | | 5.42% | | | | 3.00% | | | |
|
Class C | | | 5.42% | | | | 2.99% | | | |
|
Barclays Capital Municipal Bond Index | | | 7.85% | | | | 3.88% | | | |
|
* Effective January 31, 2009, Class B shares are no longer available for purchase to new investors. Please see Note A for more information. |
| | | | | | | | | | |
GROWTH OF A $10,000 INVESTMENT IN THE PORTFOLIO
9/30/01 TO 9/30/11
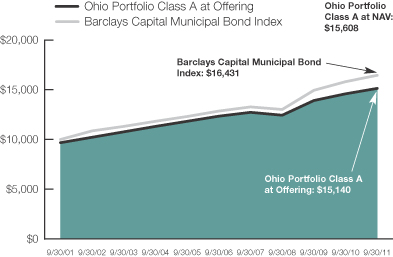
This chart illustrates the total value of an assumed $10,000 investment in AllianceBernstein Municipal Income Fund II Ohio Portfolio Class A shares (from 9/30/01 to 9/30/11) as compared with the performance of the Portfolio’s benchmark. The chart showing the Class A at Offering reflects the deduction of the maximum 3% sales charge from the initial $10,000 investment in the Portfolio and assumes the reinvestment of dividends and capital gains distributions.
See Historical Performance and Benchmark disclosures on page 5.
(Historical Performance continued on next page)
| | | | |
| ALLIANCEBERNSTEIN MUNICIPAL INCOME FUND II • | | | 11 | |
Historical Performance
PENNSYLVANIA PORTFOLIO
HISTORICAL PERFORMANCE
(continued from previous page)
| | | | | | | | | | |
| | | | | | | | | | |
THE PORTFOLIO VS. ITS BENCHMARK PERIODS ENDED SEPTEMBER 30, 2011 | | NAV Returns | | | |
| | 6 Months | | | 12 Months | | | |
Pennsylvania Portfolio | | | | | | | | | | |
Class A | | | 7.06% | | | | 3.75% | | | |
|
Class B* | | | 6.69% | | | | 3.03% | | | |
|
Class C | | | 6.79% | | | | 3.13% | | | |
|
Barclays Capital Municipal Bond Index | | | 7.85% | | | | 3.88% | | | |
|
* Effective January 31, 2009, Class B shares are no longer available for purchase to new investors. Please see Note A for more information. |
| | | | | | | | | | |
GROWTH OF A $10,000 INVESTMENT IN THE PORTFOLIO
9/30/01 TO 9/30/11

This chart illustrates the total value of an assumed $10,000 investment in AllianceBernstein Municipal Income Fund II Pennsylvania Portfolio Class A shares (from 9/30/01 to 9/30/11) as compared with the performance of the Portfolio’s benchmark. The chart showing the Class A at Offering reflects the deduction of the maximum 3% sales charge from the initial $10,000 investment in the Portfolio and assumes the reinvestment of dividends and capital gains distributions.
See Historical Performance and Benchmark disclosures on page 5.
(Historical Performance continued on next page)
| | |
| 12 | | • ALLIANCEBERNSTEIN MUNICIPAL INCOME FUND II |
Historical Performance
VIRGINIA PORTFOLIO
HISTORICAL PERFORMANCE
(continued from previous page)
| | | | | | | | | | |
| | | | | | | | | | |
THE PORTFOLIO VS. ITS BENCHMARK PERIODS ENDED SEPTEMBER 30, 2011 | | NAV Returns | | | |
| | 6 Months | | | 12 Months | | | |
Virginia Portfolio | | | | | | | | | | |
Class A | | | 7.46% | | | | 4.72% | | | |
|
Class B* | | | 7.10% | | | | 4.01% | | | |
|
Class C | | | 7.10% | | | | 4.01% | | | |
|
Barclays Capital Municipal Bond Index | | | 7.85% | | | | 3.88% | | | |
|
* Effective January 31, 2009, Class B shares are no longer available for purchase to new investors. Please see Note A for more information. |
| | | | | | | | | | |
GROWTH OF A $10,000 INVESTMENT IN THE PORTFOLIO
9/30/01 TO 9/30/11
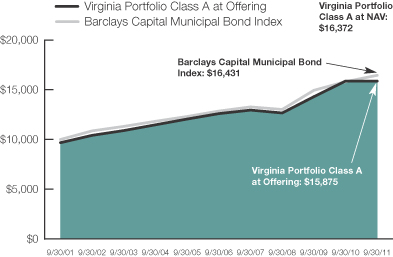
This chart illustrates the total value of an assumed $10,000 investment in AllianceBernstein Municipal Income Fund II Virginia Portfolio Class A shares (from 9/30/01 to 9/30/11) as compared with the performance of the Portfolio’s benchmark. The chart showing the Class A at Offering reflects the deduction of the maximum 3% sales charge from the initial $10,000 investment in the Portfolio and assumes the reinvestment of dividends and capital gains distributions.
See Historical Performance and Benchmark disclosures on page 5.
(Historical Performance continued on next page)
| | | | |
| ALLIANCEBERNSTEIN MUNICIPAL INCOME FUND II • | | | 13 | |
Historical Performance
ARIZONA PORTFOLIO
HISTORICAL PERFORMANCE
(continued from previous page)
| | | | | | | | | | | | | | | | |
| AVERAGE ANNUAL RETURNS AS OF SEPTEMBER 30, 2011 | |
| | | NAV Returns | | | SEC Returns | | | SEC Yields* | | | Taxable
Equivalent
Yields** | |
| | | | | | | | | | | | | | | | |
| Class A Shares | | | | | | | | | | | 3.09 | % | | | 4.98 | % |
1 Year | | | 3.07 | % | | | -0.06 | % | | | | | | | | |
5 Years | | | 4.16 | % | | | 3.53 | % | | | | | | | | |
10 Years | | | 4.67 | % | | | 4.35 | % | | | | | | | | |
| | | | | | | | | | | | | | | | |
| Class B Shares | | | | | | | | | | | 2.47 | % | | | 3.98 | % |
1 Year | | | 2.36 | % | | | -0.58 | % | | | | | | | | |
5 Years | | | 3.45 | % | | | 3.45 | % | | | | | | | | |
10 Years(a) | | | 4.25 | % | | | 4.25 | % | | | | | | | | |
| | | | | | | | | | | | | | | | |
| Class C Shares | | | | | | | | | | | 2.49 | % | | | 4.01 | % |
1 Year | | | 2.35 | % | | | 1.37 | % | | | | | | | | |
5 Years | | | 3.44 | % | | | 3.44 | % | | | | | | | | |
10 Years | | | 3.95 | % | | | 3.95 | % | | | | | | | | |
| | | | | | | | | | | | | | | | |
SEC AVERAGE ANNUAL RETURNS (WITH ANY APPLICABLE SALES CHARGES)
AS OF THE MOST RECENT CALENDAR QUARTER-END (SEPTEMBER 30, 2011) | |
| | | | | | | | | | | | SEC Returns | |
| | | | | | | | | | | | | | | | |
| Class A Shares | | | | | | | | | | | | | | | | |
1 Year | | | | | | | | | | | | | | | -0.06 | % |
5 Years | | | | | | | | | | | | | | | 3.53 | % |
10 Years(a) | | | | | | | | | | | | | | | 4.35 | % |
| | | | | | | | | | | | | | | | |
| Class B Shares | | | | | | | | | | | | | | | | |
1 Year | | | | | | | | | | | | | | | -0.58 | % |
5 Years | | | | | | | | | | | | | | | 3.45 | % |
10 Years(a) | | | | | | | | | | | | | | | 4.25 | % |
| | | | | | | | | | | | | | | | |
| Class C Shares | �� | | | | | | | | | | | | | | | |
1 Year | | | | | | | | | | | | | | | 1.37 | % |
5 Years | | | | | | | | | | | | | | | 3.44 | % |
10 Years | | | | | | | | | | | | | | | 3.95 | % |
The Portfolio’s current prospectus fee table shows the Portfolio’s total annual operating expense ratios as 0.94%, 1.65% and 1.64% for Class A, Class B and Class C, respectively, gross of any fee waivers or expense reimbursements. Contractual fee waivers and/or expense reimbursements limit the Portfolio’s annual operating expense ratios to 0.78%, 1.48% and 1.48% for Class A, Class B and Class C, respectively. These waivers/reimbursements extend through the Portfolio’s current fiscal year and may be extended by the Adviser for additional one-year terms. Absent reimbursements or waivers, performance would have been lower. The Financial Highlights section of this report sets forth expense ratio data for the current reporting period; the expense ratios shown above may differ from the expense ratios in the Financial Highlights section since they are based on different time periods.
| (a) | | Assumes conversion of Class B shares into Class A shares after six years. |
| * | | SEC Yields are calculated based on SEC guidelines for the 30-day period ended September 30, 2011. |
| ** | | Taxable equivalent yields are based on SEC yields and a 35% marginal Federal income tax rate and maximum state taxes where applicable. |
See Historical Performance disclosures on page 5.
(Historical Performance continued on next page)
| | |
| 14 | | • ALLIANCEBERNSTEIN MUNICIPAL INCOME FUND II |
Historical Performance
MASSACHUSETTS PORTFOLIO
HISTORICAL PERFORMANCE
(continued from previous page)
| | | | | | | | | | | | | | | | |
| AVERAGE ANNUAL RETURNS AS OF SEPTEMBER 30, 2011 | |
| | | NAV Returns | | | SEC Returns | | | SEC Yields* | | | Taxable
Equivalent
Yields** | |
| | | | | | | | | | | | | | | | |
| Class A Shares | | | | | | | | | | | 2.68 | % | | | 4.35 | % |
1 Year | | | 3.38 | % | | | 0.28 | % | | | | | | | | |
5 Years | | | 4.65 | % | | | 4.01 | % | | | | | | | | |
10 Years | | | 4.61 | % | | | 4.29 | % | | | | | | | | |
| | | | | | | | | | | | | | | | |
| Class B Shares | | | | | | | | | | | 2.06 | % | | | 3.35 | % |
1 Year | | | 2.68 | % | | | -0.31 | % | | | | | | | | |
5 Years | | | 3.92 | % | | | 3.92 | % | | | | | | | | |
10 Years(a) | | | 4.18 | % | | | 4.18 | % | | | | | | | | |
| | | | | | | | | | | | | | | | |
| Class C Shares | | | | | | | | | | | 2.07 | % | | | 3.36 | % |
1 Year | | | 2.67 | % | | | 1.67 | % | | | | | | | | |
5 Years | | | 3.93 | % | | | 3.93 | % | | | | | | | | |
10 Years | | | 3.89 | % | | | 3.89 | % | | | | | | | | |
| | | | | | | | | | | | | | | | |
SEC AVERAGE ANNUAL RETURNS (WITH ANY APPLICABLE SALES CHARGES)
AS OF THE MOST RECENT CALENDAR QUARTER-END (SEPTEMBER 30, 2011) | |
| | | | | | | | | | | | SEC Returns | |
| | | | | | | | | | | | | | | | |
| Class A Shares | | | | | | | | | | | | | | | | |
1 Year | | | | | | | | | | | | | | | 0.28 | % |
5 Years | | | | | | | | | | | | | | | 4.01 | % |
10 Years | | | | | | | | | | | | | | | 4.29 | % |
| | | | | | | | | | | | | | | | |
| Class B Shares | | | | | | | | | | | | | | | | |
1 Year | | | | | | | | | | | | | | | -0.31 | % |
5 Years | | | | | | | | | | | | | | | 3.92 | % |
10 Years(a) | | | | | | | | | | | | | | | 4.18 | % |
| | | | | | | | | | | | | | | | |
| Class C Shares | | | | | | | | | | | | | | | | |
1 Year | | | | | | | | | | | | | | | 1.67 | % |
5 Years | | | | | | | | | | | | | | | 3.93 | % |
10 Years | | | | | | | | | | | | | | | 3.89 | % |
The Portfolio’s current prospectus fee table shows the Portfolio’s total annual operating expense ratios as 0.93%, 1.64% and 1.63% for Class A, Class B and Class C, respectively, gross of any fee waivers or expense reimbursements. Contractual fee waivers and/or expense reimbursements limit the Portfolio’s annual operating expense ratios to 0.82%, 1.52% and 1.52% for Class A, Class B and Class C, respectively. These waivers/reimbursements extend through the Portfolio’s current fiscal year and may be extended by the Adviser for additional one-year terms. Absent reimbursements or waivers, performance would have been lower. The Financial Highlights section of this report sets forth expense ratio data for the current reporting period; the expense ratios shown above may differ from the expense ratios in the Financial Highlights section since they are based on different time periods.
| (a) | | Assumes conversion of Class B shares into Class A shares after six years. |
| * | | SEC Yields are calculated based on SEC guidelines for the 30-day period ended September 30, 2011. |
| ** | | Taxable equivalent yields are based on SEC yields and a 35% marginal Federal income tax rate and maximum state taxes where applicable. |
See Historical Performance disclosures on page 5.
(Historical Performance continued on next page)
| | | | |
| ALLIANCEBERNSTEIN MUNICIPAL INCOME FUND II • | | | 15 | |
Historical Performance
MICHIGAN PORTFOLIO
HISTORICAL PERFORMANCE
(continued from previous page)
| | | | | | | | | | | | | | | | |
| AVERAGE ANNUAL RETURNS AS OF SEPTEMBER 30, 2011 | |
| | | NAV Returns | | | SEC Returns | | | SEC Yields* | | | Taxable
Equivalent
Yields** | |
| | | | | | | | | | | | | | | | |
| Class A Shares | | | | | | | | | | | 2.49 | % | | | 4.00 | % |
1 Year | | | 2.92 | % | | | -0.20 | % | | | | | | | | |
5 Years | | | 3.87 | % | | | 3.24 | % | | | | | | | | |
10 Years | | | 4.50 | % | | | 4.18 | % | | | | | | | | |
| | | | | | | | | | | | | | | | |
| Class B Shares | | | | | | | | | | | 1.87 | % | | | 3.01 | % |
1 Year | | | 2.27 | % | | | -0.69 | % | | | | | | | | |
5 Years | | | 3.17 | % | | | 3.17 | % | | | | | | | | |
10 Years(a) | | | 4.06 | % | | | 4.06 | % | | | | | | | | |
| | | | | | | | | | | | | | | | |
| Class C Shares | | | | | | | | | | | 1.87 | % | | | 3.01 | % |
1 Year | | | 2.30 | % | | | 1.31 | % | | | | | | | | |
5 Years | | | 3.18 | % | | | 3.18 | % | | | | | | | | |
10 Years | | | 3.78 | % | | | 3.78 | % | | | | | | | | |
| | | | | | | | | | | | | | | | |
SEC AVERAGE ANNUAL RETURNS (WITH ANY APPLICABLE SALES CHARGES)
AS OF THE MOST RECENT CALENDAR QUARTER-END (SEPTEMBER 30, 2011) | |
| | | | | | | | | | | | SEC Returns | |
| | | | | | | | | | | | | | | | |
| Class A Shares | | | | | | | | | | | | | | | | |
1 Year | | | | | | | | | | | | | | | -0.20 | % |
5 Years | | | | | | | | | | | | | | | 3.24 | % |
10 Years | | | | | | | | | | | | | | | 4.18 | % |
| | | | | | | | | | | | | | | | |
| Class B Shares | | | | | | | | | | | | | | | | |
1 Year | | | | | | | | | | | | | | | -0.69 | % |
5 Years | | | | | | | | | | | | | | | 3.17 | % |
10 Years(a) | | | | | | | | | | | | | | | 4.06 | % |
| | | | | | | | | | | | | | | | |
| Class C Shares | | | | | | | | | | | | | | | | |
1 Year | | | | | | | | | | | | | | | 1.31 | % |
5 Years | | | | | | | | | | | | | | | 3.18 | % |
10 Years | | | | | | | | | | | | | | | 3.78 | % |
The Portfolio’s current prospectus fee table shows the Portfolio’s total annual operating expense ratios as 1.06%, 1.78% and 1.76% for Class A, Class B and Class C, respectively, gross of any fee waivers or expense reimbursements. Contractual fee waivers and/or expense reimbursements limit the Portfolio’s annual operating expense ratios to 1.01%, 1.71% and 1.71% for Class A, Class B and Class C, respectively. These waivers/reimbursements extend through the Portfolio’s current fiscal year and may be extended by the Adviser for additional one-year terms. Absent reimbursements or waivers, performance would have been lower. The Financial Highlights section of this report sets forth expense ratio data for the current reporting period; the expense ratios shown above may differ from the expense ratios in the Financial Highlights section since they are based on different time periods.
| (a) | | Assumes conversion of Class B shares into Class A shares after six years. |
| * | | SEC Yields are calculated based on SEC guidelines for the 30-day period ended September 30, 2011. |
| ** | | Taxable equivalent yields are based on SEC yields and a 35% marginal Federal income tax rate and maximum state taxes where applicable. |
See Historical Performance disclosures on page 5.
(Historical Performance continued on next page)
| | |
| 16 | | • ALLIANCEBERNSTEIN MUNICIPAL INCOME FUND II |
Historical Performance
MINNESOTA PORTFOLIO
HISTORICAL PERFORMANCE
(continued from previous page)
| | | | | | | | | | | | | | | | |
| AVERAGE ANNUAL RETURNS AS OF SEPTEMBER 30, 2011 | |
| | | NAV Returns | | | SEC Returns | | | SEC Yields* | | | Taxable
Equivalent
Yields** | |
| | | | | | | | | | | | | | | | |
| Class A Shares | | | | | | | | | | | | | | | | |
1 Year | | | 3.68 | % | | | 0.57 | % | | | 2.46 | % | | | 4.11 | % |
5 Years | | | 4.13 | % | | | 3.49 | % | | | | | | | | |
10 Years | | | 4.45 | % | | | 4.13 | % | | | | | | | | |
| | | | | | | | | | | | | | | | |
| Class B Shares | | | | | | | | | | | | | | | | |
1 Year | | | 2.96 | % | | | -0.04 | % | | | 1.54 | % | | | 2.57 | % |
5 Years | | | 3.41 | % | | | 3.41 | % | | | | | | | | |
10 Years(a) | | | 4.03 | % | | | 4.03 | % | | | | | | | | |
| | | | | | | | | | | | | | | | |
| Class C Shares | | | | | | | | | | | | | | | | |
1 Year | | | 2.95 | % | | | 1.95 | % | | | 1.83 | % | | | 3.06 | % |
5 Years | | | 3.40 | % | | | 3.40 | % | | | | | | | | |
10 Years | | | 3.72 | % | | | 3.72 | % | | | | | | | | |
| | | | | | | | | | | | | | | | |
SEC AVERAGE ANNUAL RETURNS (WITH ANY APPLICABLE SALES CHARGES)
AS OF THE MOST RECENT CALENDAR QUARTER-END (SEPTEMBER 30, 2011) | |
| | | | | | | | | | | | SEC Returns | |
| | | | | | | | | | | | | | | | |
| Class A Shares | | | | | | | | | | | | | | | | |
1 Year | | | | | | | | | | | | | | | 0.57 | % |
5 Years | | | | | | | | | | | | | | | 3.49 | % |
10 Years | | | | | | | | | | | | | | | 4.13 | % |
| | | | | | | | | | | | | | | | |
| Class B Shares | | | | | | | | | | | | | | | | |
1 Year | | | | | | | | | | | | | | | -0.04 | % |
5 Years | | | | | | | | | | | | | | | 3.41 | % |
10 Years(a) | | | | | | | | | | | | | | | 4.03 | % |
| | | | | | | | | | | | | | | | |
| Class C Shares | | | | | | | | | | | | | | | | |
1 Year | | | | | | | | | | | | | | | 1.95 | % |
5 Years | | | | | | | | | | | | | | | 3.40 | % |
10 Years | | | | | | | | | | | | | | | 3.72 | % |
The Portfolio’s current prospectus fee table shows the Portfolio’s total annual operating expense ratios as 1.02%, 1.76% and 1.72% for Class A, Class B and Class C, respectively, gross of any fee waivers or expense reimbursements. Contractual fee waivers and/or expense reimbursements limit the Portfolio’s annual operating expense ratios to 0.90%, 1.60% and 1.60% for Class A, Class B and Class C, respectively. These waivers/reimbursements extend through the Portfolio’s current fiscal year and may be extended by the Adviser for additional one-year terms. Absent reimbursements or waivers, performance would have been lower. The Financial Highlights section of this report sets forth expense ratio data for the current reporting period; the expense ratios shown above may differ from the expense ratios in the Financial Highlights section since they are based on different time periods.
| (a) | | Assumes conversion of Class B shares into Class A shares after six years. |
| * | | SEC Yields are calculated based on SEC guidelines for the 30-day period ended September 30, 2011. |
| ** | | Taxable equivalent yields are based on SEC yields and a 35% marginal Federal income tax rate and maximum state taxes where applicable. |
See Historical Performance disclosures on page 5.
(Historical Performance continued on next page)
| | | | |
| ALLIANCEBERNSTEIN MUNICIPAL INCOME FUND II • | | | 17 | |
Historical Performance
NEW JERSEY PORTFOLIO
HISTORICAL PERFORMANCE
(continued from previous page)
| | | | | | | | | | | | | | | | |
| AVERAGE ANNUAL RETURNS AS OF SEPTEMBER 30, 2011 | |
| | | NAV Returns | | | SEC Returns | | | SEC Yields* | | | Taxable
Equivalent
Yields** | |
| | | | | | | | | | | | | | | | |
| Class A Shares | | | | | | | | | | | 2.80 | % | | | 4.83 | % |
1 Year | | | 3.08 | % | | | 0.02 | % | | | | | | | | |
5 Years | | | 3.87 | % | | | 3.23 | % | | | | | | | | |
10 Years | | | 4.10 | % | | | 3.78 | % | | | | | | | | |
| | | | | | | | | | | | | | | | |
| Class B Shares | | | | | | | | | | | 2.17 | % | | | 3.74 | % |
1 Year | | | 2.37 | % | | | -0.60 | % | | | | | | | | |
5 Years | | | 3.15 | % | | | 3.15 | % | | | | | | | | |
10 Years(a) | | | 3.66 | % | | | 3.66 | % | | | | | | | | |
| | | | | | | | | | | | | | | | |
| Class C Shares | | | | | | | | | | | 2.18 | % | | | 3.76 | % |
1 Year | | | 2.47 | % | | | 1.48 | % | | | | | | | | |
5 Years | | | 3.17 | % | | | 3.17 | % | | | | | | | | |
10 Years | | | 3.38 | % | | | 3.38 | % | | | | | | | | |
| | | | | | | | | | | | | | | | |
SEC AVERAGE ANNUAL RETURNS (WITH ANY APPLICABLE SALES CHARGES)
AS OF THE MOST RECENT CALENDAR QUARTER-END (SEPTEMBER 30, 2011) | |
| | | | | | | | | | | | SEC Returns | |
| | | | | | | | | | | | | | | | |
| Class A Shares | | | | | | | | | | | | | | | | |
1 Year | | | | | | | | | | | | | | | 0.02 | % |
5 Years | | | | | | | | | | | | | | | 3.23 | % |
10 Years | | | | | | | | | | | | | | | 3.78 | % |
| | | | | | | | | | | | | | | | |
| Class B Shares | | | | | | | | | | | | | | | | |
1 Year | | | | | | | | | | | | | | | -0.60 | % |
5 Years | | | | | | | | | | | | | | | 3.15 | % |
10 Years(a) | | | | | | | | | | | | | | | 3.66 | % |
| | | | | | | | | | | | | | | | |
| Class C Shares | | | | | | | | | | | | | | | | |
1 Year | | | | | | | | | | | | | | | 1.48 | % |
5 Years | | | | | | | | | | | | | | | 3.17 | % |
10 Years | | | | | | | | | | | | | | | 3.38 | % |
The Portfolio’s current prospectus fee table shows the Portfolio’s total annual operating expense ratios as 0.97%, 1.68% and 1.67% for Class A, Class B and Class C, respectively, gross of any fee waivers or expense reimbursements. Contractual fee waivers and/or expense reimbursements limit the Portfolio’s annual operating expense ratios to 0.87%, 1.57% and 1.57% for Class A, Class B and Class C, respectively. These waivers/reimbursements extend through the Portfolio’s current fiscal year and may be extended by the Adviser for additional one-year terms. Absent reimbursements or waivers, performance would have been lower. The Financial Highlights section of this report sets forth expense ratio data for the current reporting period; the expense ratios shown above may differ from the expense ratios in the Financial Highlights section since they are based on different time periods.
| (a) | | Assumes conversion of Class B shares into Class A shares after six years. |
| * | | SEC Yields are calculated based on SEC guidelines for the 30-day period ended September 30, 2011. |
| ** | | Taxable equivalent yields are based on SEC yields and a 35% marginal Federal income tax rate and maximum state taxes where applicable. |
See Historical Performance disclosures on page 5.
(Historical Performance continued on next page)
| | |
| 18 | | • ALLIANCEBERNSTEIN MUNICIPAL INCOME FUND II |
Historical Performance
OHIO PORTFOLIO
HISTORICAL PERFORMANCE
(continued from previous page)
| | | | | | | | | | | | | | | | |
| AVERAGE ANNUAL RETURNS AS OF SEPTEMBER 30, 2011 | |
| | | NAV Returns | | | SEC Returns | | | SEC Yields* | | | Taxable
Equivalent
Yields** | |
| | | | | | | | | | | | | | | | |
| Class A Shares | | | | | | | | | | | 2.67 | % | | | 4.37 | % |
1 Year | | | 3.71 | % | | | 0.56 | % | | | | | | | | |
5 Years | | | 4.14 | % | | | 3.51 | % | | | | | | | | |
10 Years | | | 4.55 | % | | | 4.23 | % | | | | | | | | |
| | | | | | | | | | | | | | | | |
| Class B Shares | | | | | | | | | | | 2.04 | % | | | 3.34 | % |
1 Year | | | 3.00 | % | | | 0.00 | % | | | | | | | | |
5 Years | | | 3.42 | % | | | 3.42 | % | | | | | | | | |
10 Years(a) | | | 4.11 | % | | | 4.11 | % | | | | | | | | |
| | | | | | | | | | | | | | | | |
| Class C Shares | | | | | | | | | | | 2.05 | % | | | 3.35 | % |
1 Year | | | 2.99 | % | | | 1.99 | % | | | | | | | | |
5 Years | | | 3.39 | % | | | 3.39 | % | | | | | | | | |
10 Years | | | 3.81 | % | | | 3.81 | % | | | | | | | | |
| | | | | | | | | | | | | | | | |
SEC AVERAGE ANNUAL RETURNS (WITH ANY APPLICABLE SALES CHARGES)
AS OF THE MOST RECENT CALENDAR QUARTER-END (SEPTEMBER 30, 2011) | |
| | | | | | | | | | | | SEC Returns | |
| | | | | | | | | | | | | | | | |
| Class A Shares | | | | | | | | | | | | | | | | |
1 Year | | | | | | | | | | | | | | | 0.56 | % |
5 Years | | | | | | | | | | | | | | | 3.51 | % |
10 Years | | | | | | | | | | | | | | | 4.23 | % |
| | | | | | | | | | | | | | | | |
| Class B Shares | | | | | | | | | | | | | | | | |
1 Year | | | | | | | | | | | | | | | 0.00 | % |
5 Years | | | | | | | | | | | | | | | 3.42 | % |
10 Years(a) | | | | | | | | | | | | | | | 4.11 | % |
| | | | | | | | | | | | | | | | |
| Class C Shares | | | | | | | | | | | | | | | | |
1 Year | | | | | | | | | | | | | | | 1.99 | % |
5 Years | | | | | | | | | | | | | | | 3.39 | % |
10 Years | | | | | | | | | | | | | | | 3.81 | % |
The Portfolio’s current prospectus fee table shows the Portfolio’s total annual operating expense ratios as 0.99%, 1.71% and 1.69% for Class A, Class B and Class C, respectively, gross of any fee waivers or expense reimbursements. Contractual fee waivers and/or expense reimbursements limit the Portfolio’s annual operating expense ratios to 0.85%, 1.55% and 1.55% for Class A, Class B and Class C, respectively. These waivers/reimbursements extend through the Portfolio’s current fiscal year and may be extended by the Adviser for additional one-year terms. Absent reimbursements or waivers, performance would have been lower. The Financial Highlights section of this report sets forth expense ratio data for the current reporting period; the expense ratios shown above may differ from the expense ratios in the Financial Highlights section since they are based on different time periods.
| (a) | | Assumes conversion of Class B shares into Class A shares after six years. |
| * | | SEC Yields are calculated based on SEC guidelines for the 30-day period ended September 30, 2011. |
| ** | | Taxable equivalent yields are based on SEC yields and a 35% marginal Federal income tax rate and maximum state taxes where applicable. |
See Historical Performance disclosures on page 5.
(Historical Performance continued on next page)
| | | | |
| ALLIANCEBERNSTEIN MUNICIPAL INCOME FUND II • | | | 19 | |
Historical Performance
PENNSYLVANIA PORTFOLIO
HISTORICAL PERFORMANCE
(continued from previous page)
| | | | | | | | | | | | | | | | |
| AVERAGE ANNUAL RETURNS AS OF SEPTEMBER 30, 2011 | |
| | | NAV Returns | | | SEC Returns | | | SEC Yields* | | | Taxable
Equivalent
Yields** | |
| | | | | | | | | | | | | | | | |
| Class A Shares | | | | | | | | | | | 2.82 | % | | | 4.48 | % |
1 Year | | | 3.75 | % | | | 0.60 | % | | | | | | | | |
5 Years | | | 3.96 | % | | | 3.32 | % | | | | | | | | |
10 Years | | | 4.46 | % | | | 4.14 | % | | | | | | | | |
| | | | | | | | | | | | | | | | |
| Class B Shares | | | | | | | | | | | 2.18 | % | | | 3.46 | % |
1 Year | | | 3.03 | % | | | 0.06 | % | | | | | | | | |
5 Years | | | 3.23 | % | | | 3.23 | % | | | | | | | | |
10 Years(a) | | | 4.03 | % | | | 4.03 | % | | | | | | | | |
| | | | | | | | | | | | | | | | |
| Class C Shares | | | | | | | | | | | 2.20 | % | | | 3.49 | % |
1 Year | | | 3.13 | % | | | 2.14 | % | | | | | | | | |
5 Years | | | 3.25 | % | | | 3.25 | % | | | | | | | | |
10 Years | | | 3.75 | % | | | 3.75 | % | | | | | | | | |
| | | | | | | | | | | | | | | | |
SEC AVERAGE ANNUAL RETURNS (WITH ANY APPLICABLE SALES CHARGES)
AS OF THE MOST RECENT CALENDAR QUARTER-END (SEPTEMBER 30, 2011) | |
| | | | | | | | | | | | SEC Returns | |
| | | | | | | | | | | | | | | | |
| Class A Shares | | | | | | | | | | | | | | | | |
1 Year | | | | | | | | | | | | | | | 0.60 | % |
5 Years | | | | | | | | | | | | | | | 3.32 | % |
10 Years | | | | | | | | | | | | | | | 4.14 | % |
| | | | | | | | | | | | | | | | |
| Class B Shares | | | | | | | | | | | | | | | | |
1 Year | | | | | | | | | | | | | | | 0.06 | % |
5 Years | | | | | | | | | | | | | | | 3.23 | % |
10 Years(a) | | | | | | | | | | | | | | | 4.03 | % |
| | | | | | | | | | | | | | | | |
| Class C Shares | | | | | | | | | | | | | | | | |
1 Year | | | | | | | | | | | | | | | 2.14 | % |
5 Years | | | | | | | | | | | | | | | 3.25 | % |
10 Years | | | | | | | | | | | | | | | 3.75 | % |
The Portfolio’s current prospectus fee table shows the Portfolio’s total annual operating expense ratios as 1.01%, 1.73% and 1.71% for Class A, Class B and Class C, respectively, gross of any fee waivers or expense reimbursements. Contractual fee waivers and/or expense reimbursements limit the Portfolio’s annual operating expense ratios to 0.95%, 1.65% and 1.65% for Class A, Class B and Class C, respectively. These waivers/reimbursements extend through the Portfolio’s current fiscal year and may be extended by the Adviser for additional one-year terms. Absent reimbursements or waivers, performance would have been lower. The Financial Highlights section of this report sets forth expense ratio data for the current reporting period; the expense ratios shown above may differ from the expense ratios in the Financial Highlights section since they are based on different time periods.
| (a) | | Assumes conversion of Class B shares into Class A shares after six years. |
| * | | SEC Yields are calculated based on SEC guidelines for the 30-day period ended September 30, 2011. |
| ** | | Taxable equivalent yields are based on SEC yields and a 35% marginal Federal income tax rate and maximum state taxes where applicable. |
See Historical Performance disclosures on page 5.
(Historical Performance continued on next page)
| | |
| 20 | | • ALLIANCEBERNSTEIN MUNICIPAL INCOME FUND II |
Historical Performance
VIRGINIA PORTFOLIO
HISTORICAL PERFORMANCE
(continued from previous page)
| | | | | | | | | | | | | | | | |
| AVERAGE ANNUAL RETURNS AS OF SEPTEMBER 30, 2011 | |
| | | NAV Returns | | | SEC Returns | | | SEC Yields* | | | Taxable
Equivalent
Yields** | |
| | | | | | | | | | | | | | | | |
| Class A Shares | | | | | | | | | | | 2.60 | % | | | 4.24 | % |
1 Year | | | 4.72 | % | | | 1.60 | % | | | | | | | | |
5 Years | | | 4.71 | % | | | 4.07 | % | | | | | | | | |
10 Years | | | 5.05 | % | | | 4.73 | % | | | | | | | | |
| | | | | | | | | | | | | | | | |
| Class B Shares | | | | | | | | | | | 1.97 | % | | | 3.22 | % |
1 Year | | | 4.01 | % | | | 1.01 | % | | | | | | | | |
5 Years | | | 4.00 | % | | | 4.00 | % | | | | | | | | |
10 Years(a) | | | 4.61 | % | | | 4.61 | % | | | | | | | | |
| | | | | | | | | | | | | | | | |
| Class C Shares | | | | | | | | | | | 1.99 | % | | | 3.25 | % |
1 Year | | | 4.01 | % | | | 3.01 | % | | | | | | | | |
5 Years | | | 4.00 | % | | | 4.00 | % | | | | | | | | |
10 Years | | | 4.33 | % | | | 4.33 | % | | | | | | | | |
| | | | | | | | | | | | | | | | |
SEC AVERAGE ANNUAL RETURNS (WITH ANY APPLICABLE SALES CHARGES)
AS OF THE MOST RECENT CALENDAR QUARTER-END (SEPTEMBER 30, 2011) | |
| | | | | | | | | | | | SEC Returns | |
| | | | | | | | | | | | | | | | |
| Class A Shares | | | | | | | | | | | | | | | | |
1 Year | | | | | | | | | | | | | | | 1.60 | % |
5 Years | | | | | | | | | | | | | | | 4.07 | % |
10 Years | | | | | | | | | | | | | | | 4.73 | % |
| | | | | | | | | | | | | | | | |
| Class B Shares | | | | | | | | | | | | | | | | |
1 Year | | | | | | | | | | | | | | | 1.01 | % |
5 Years | | | | | | | | | | | | | | | 4.00 | % |
10 Years(a) | | | | | | | | | | | | | | | 4.61 | % |
| | | | | | | | | | | | | | | | |
| Class C Shares | | | | | | | | | | | | | | | | |
1 Year | | | | | | | | | | | | | | | 3.01 | % |
5 Years | | | | | | | | | | | | | | | 4.00 | % |
10 Years | | | | | | | | | | | | | | | 4.33 | % |
The Portfolio’s current prospectus fee table shows the Portfolio’s total annual operating expense ratios as 0.92%, 1.64% and 1.62% for Class A, Class B and Class C, respectively, gross of any fee waivers or expense reimbursements. Contractual fee waivers and/or expense reimbursements limit the Portfolio’s annual operating expense ratios to 0.72%, 1.42% and 1.42% for Class A, Class B and Class C, respectively. These waivers/reimbursements extend through the Portfolio’s current fiscal year and may be extended by the Adviser for additional one-year terms. Absent reimbursements or waivers, performance would have been lower. The Financial Highlights section of this report sets forth expense ratio data for the current reporting period; the expense ratios shown above may differ from the expense ratios in the Financial Highlights section since they are based on different time periods.
| (a) | | Assumes conversion of Class B shares into Class A shares after six years. |
| * | | SEC Yields are calculated based on SEC guidelines for the 30-day period ended September 30, 2011. |
| ** | | Taxable equivalent yields are based on SEC yields and a 35% marginal Federal income tax rate and maximum state taxes where applicable. |
See Historical Performance disclosures on page 5.
| | | | |
| ALLIANCEBERNSTEIN MUNICIPAL INCOME FUND II • | | | 21 | |
Historical Performance
FUND EXPENSES
(unaudited)
As a shareholder of the Fund, you incur two types of costs: (1) transaction costs, including sales charges (loads) on purchase payments, contingent deferred sales charges on redemptions and (2) ongoing costs, including management fees; distribution (12b-1) fees; and other Fund expenses. This example is intended to help you understand your ongoing costs (in dollars) of investing in the Fund and to compare these costs with the ongoing costs of investing in other mutual funds.
The Example is based on an investment of $1,000 invested at the beginning of the period and held for the entire period as indicated below.
Actual Expenses
The first line of the table below provides information about actual account values and actual expenses. You may use the information in this line, together with the amount you invested, to estimate the expenses that you paid over the period. Simply divide your account value by $1,000 (for example, an $8,600 account value divided by $1,000 = 8.6), then multiply the result by the number in the first line under the heading entitled “Expenses Paid During Period” to estimate the expenses you paid on your account during this period.
Hypothetical Example for Comparison Purposes
The second line of the table below provides information about hypothetical account values and hypothetical expenses based on the Fund’s actual expense ratio and an assumed annual rate of return of 5% before expenses, which is not the Fund’s actual return. The hypothetical account values and expenses may not be used to estimate the actual ending account balance or expenses you paid for the period. You may use this information to compare the ongoing costs of investing in the Fund and other funds by comparing this 5% hypothetical example with the 5% hypothetical examples that appear in the shareholder reports of other funds.
Please note that the expenses shown in the table are meant to highlight your ongoing costs only and do not reflect any transactional costs, such as sales charges (loads), or contingent deferred sales charges on redemptions. Therefore, the second line of the table is useful in comparing ongoing costs only, and will not help you determine the relative total costs of owning different funds. In addition, if these transactional costs were included, your costs would have been higher.
Arizona Portfolio
| | | | | | | | | | | | | | | | |
| | | Beginning
Account Value
April 1, 2011 | | | Ending
Account Value
September 30, 2011 | | | Expenses
Paid During
Period* | | | Annualized
Expense
Ratio* | |
| Class A | | | | | | | | | | | | | | | | |
Actual | | $ | 1,000 | | | $ | 1,066.80 | | | $ | 4.04 | | | | 0.78 | % |
Hypothetical** | | $ | 1,000 | | | $ | 1,021.16 | | | $ | 3.95 | | | | 0.78 | % |
| Class B | | | | | | | | | | | | | | | | |
Actual | | $ | 1,000 | | | $ | 1,063.20 | | | $ | 7.65 | | | | 1.48 | % |
Hypothetical** | | $ | 1,000 | | | $ | 1,017.65 | | | $ | 7.49 | | | | 1.48 | % |
| Class C | | | | | | | | | | | | | | | | |
Actual | | $ | 1,000 | | | $ | 1,063.20 | | | $ | 7.65 | | | | 1.48 | % |
Hypothetical** | | $ | 1,000 | | | $ | 1,017.65 | | | $ | 7.49 | | | | 1.48 | % |
| | |
| 22 | | • ALLIANCEBERNSTEIN MUNICIPAL INCOME FUND II |
Fund Expenses
FUND EXPENSES
(unaudited)
(continued from previous page)
Massachusetts Portfolio
| | | | | | | | | | | | | | | | |
| | | Beginning
Account Value
April 1, 2011 | | | Ending
Account Value
September 30, 2011 | | | Expenses
Paid During
Period* | | | Annualized
Expense
Ratio* | |
| Class A | | | | | | | | | | | | | | | | |
Actual | | $ | 1,000 | | | $ | 1,076.00 | | | $ | 4.27 | | | | 0.82 | % |
Hypothetical** | | $ | 1,000 | | | $ | 1,020.96 | | | $ | 4.15 | | | | 0.82 | % |
| Class B | | | | | | | | | | | | | | | | |
Actual | | $ | 1,000 | | | $ | 1,071.50 | | | $ | 7.89 | | | | 1.52 | % |
Hypothetical** | | $ | 1,000 | | | $ | 1,017.45 | | | $ | 7.69 | | | | 1.52 | % |
| Class C | | | | | | | | | | | | | | | | |
Actual | | $ | 1,000 | | | $ | 1,072.40 | | | $ | 7.90 | | | | 1.52 | % |
Hypothetical** | | $ | 1,000 | | | $ | 1,017.45 | | | $ | 7.69 | | | | 1.52 | % |
Michigan Portfolio
| | | | | | | | | | | | | | | | |
| | | Beginning
Account Value
April 1, 2011 | | | Ending
Account Value
September 30, 2011 | | | Expenses
Paid During
Period* | | | Annualized
Expense
Ratio* | |
| Class A | | | | | | | | | | | | | | | | |
Actual | | $ | 1,000 | | | $ | 1,050.70 | | | $ | 5.19 | | | | 1.01 | % |
Hypothetical** | | $ | 1,000 | | | $ | 1,020.00 | | | $ | 5.11 | | | | 1.01 | % |
| Class B | | | | | | | | | | | | | | | | |
Actual | | $ | 1,000 | | | $ | 1,047.20 | | | $ | 8.78 | | | | 1.71 | % |
Hypothetical** | | $ | 1,000 | | | $ | 1,016.50 | | | $ | 8.64 | | | | 1.71 | % |
| Class C | | | | | | | | | | | | | | | | |
Actual | | $ | 1,000 | | | $ | 1,047.10 | | | $ | 8.78 | | | | 1.71 | % |
Hypothetical** | | $ | 1,000 | | | $ | 1,016.50 | | | $ | 8.64 | | | | 1.71 | % |
Minnesota Portfolio
| | | | | | | | | | | | | | | | |
| | | Beginning
Account Value
April 1, 2011 | | | Ending
Account Value
September 30, 2011 | | | Expenses
Paid During
Period* | | | Annualized
Expense
Ratio* | |
| Class A | | | | | | | | | | | | | | | | |
Actual | | $ | 1,000 | | | $ | 1,065.90 | | | $ | 4.66 | | | | 0.90 | % |
Hypothetical** | | $ | 1,000 | | | $ | 1,020.56 | | | $ | 4.56 | | | | 0.90 | % |
| Class B | | | | | | | | | | | | | | | | |
Actual | | $ | 1,000 | | | $ | 1,062.20 | | | $ | 8.27 | | | | 1.60 | % |
Hypothetical** | | $ | 1,000 | | | $ | 1,017.05 | | | $ | 8.09 | | | | 1.60 | % |
| Class C | | | | | | | | | | | | | | | | |
Actual | | $ | 1,000 | | | $ | 1,062.20 | | | $ | 8.27 | | | | 1.60 | % |
Hypothetical** | | $ | 1,000 | | | $ | 1,017.05 | | | $ | 8.09 | | | | 1.60 | % |
| | | | |
| ALLIANCEBERNSTEIN MUNICIPAL INCOME FUND II • | | | 23 | |
Fund Expenses
FUND EXPENSES
(unaudited)
(continued from previous page)
New Jersey Portfolio
| | | | | | | | | | | | | | | | |
| | | Beginning
Account Value
April 1, 2011 | | | Ending
Account Value
September 30, 2011 | | | Expenses
Paid During
Period* | | | Annualized
Expense
Ratio* | |
| Class A | | | | | | | | | | | | | | | | |
Actual | | $ | 1,000 | | | $ | 1,070.30 | | | $ | 4.52 | | | | 0.87 | % |
Hypothetical** | | $ | 1,000 | | | $ | 1,020.71 | | | $ | 4.41 | | | | 0.87 | % |
| Class B | | | | | | | | | | | | | | | | |
Actual | | $ | 1,000 | | | $ | 1,066.60 | | | $ | 8.13 | | | | 1.57 | % |
Hypothetical** | | $ | 1,000 | | | $ | 1,017.20 | | | $ | 7.94 | | | | 1.57 | % |
| Class C | | | | | | | | | | | | | | | | |
Actual | | $ | 1,000 | | | $ | 1,066.50 | | | $ | 8.13 | | | | 1.57 | % |
Hypothetical** | | $ | 1,000 | | | $ | 1,017.20 | | | $ | 7.94 | | | | 1.57 | % |
Ohio Portfolio
| | | | | | | | | | | | | | | | |
| | | Beginning
Account Value
April 1, 2011 | | | Ending
Account Value
September 30, 2011 | | | Expenses
Paid During
Period* | | | Annualized
Expense
Ratio* | |
| Class A | | | | | | | | | | | | | | | | |
Actual | | $ | 1,000 | | | $ | 1,057.80 | | | $ | 4.38 | | | | 0.85 | % |
Hypothetical** | | $ | 1,000 | | | $ | 1,020.81 | | | $ | 4.31 | | | | 0.85 | % |
| Class B | | | | | | | | | | | | | | | | |
Actual | | $ | 1,000 | | | $ | 1,054.20 | | | $ | 7.98 | | | | 1.55 | % |
Hypothetical** | | $ | 1,000 | | | $ | 1,017.30 | | | $ | 7.84 | | | | 1.55 | % |
| Class C | | | | | | | | | | | | | | | | |
Actual | | $ | 1,000 | | | $ | 1,054.20 | | | $ | 7.98 | | | | 1.55 | % |
Hypothetical** | | $ | 1,000 | | | $ | 1,017.30 | | | $ | 7.84 | | | | 1.55 | % |
Pennsylvania Portfolio
| | | | | | | | | | | | | | | | |
| | | Beginning
Account Value
April 1, 2011 | | | Ending
Account Value
September 30, 2011 | | | Expenses
Paid During
Period* | | | Annualized
Expense
Ratio* | |
| Class A | | | | | | | | | | | | | | | | |
Actual | | $ | 1,000 | | | $ | 1,070.60 | | | $ | 4.93 | | | | 0.95 | % |
Hypothetical** | | $ | 1,000 | | | $ | 1,020.31 | | | $ | 4.81 | | | | 0.95 | % |
| Class B | | | | | | | | | | | | | | | | |
Actual | | $ | 1,000 | | | $ | 1,066.90 | | | $ | 8.55 | | | | 1.65 | % |
Hypothetical** | | $ | 1,000 | | | $ | 1,016.80 | | | $ | 8.34 | | | | 1.65 | % |
| Class C | | | | | | | | | | | | | | | | |
Actual | | $ | 1,000 | | | $ | 1,067.90 | | | $ | 8.55 | | | | 1.65 | % |
Hypothetical** | | $ | 1,000 | | | $ | 1,016.80 | | | $ | 8.34 | | | | 1.65 | % |
| | |
| 24 | | • ALLIANCEBERNSTEIN MUNICIPAL INCOME FUND II |
Fund Expenses
FUND EXPENSES
(unaudited)
(continued from previous page)
Virginia Portfolio
| | | | | | | | | | | | | | | | |
| | | Beginning
Account Value
April 1, 2011 | | | Ending
Account Value
September 30, 2011 | | | Expenses
Paid During
Period* | | | Annualized
Expense
Ratio* | |
| Class A | | | | | | | | | | | | | | | | |
Actual | | $ | 1,000 | | | $ | 1,074.60 | | | $ | 3.74 | | | | 0.72 | % |
Hypothetical** | | $ | 1,000 | | | $ | 1,021.46 | | | $ | 3.65 | | | | 0.72 | % |
| Class B | | | | | | | | | | | | | | | | |
Actual | | $ | 1,000 | | | $ | 1,071.00 | | | $ | 7.37 | | | | 1.42 | % |
Hypothetical** | | $ | 1,000 | | | $ | 1,017.95 | | | $ | 7.18 | | | | 1.42 | % |
| Class C | | | | | | | | | | | | | | | | |
Actual | | $ | 1,000 | | | $ | 1,071.00 | | | $ | 7.37 | | | | 1.42 | % |
Hypothetical** | | $ | 1,000 | | | $ | 1,017.95 | | | $ | 7.18 | | | | 1.42 | % |
| * | | Expenses are equal to each class’ annualized expense ratio, shown in the table above, multiplied by the average account value over the period, multiplied by 183/365 (to reflect the one-half year period). |
| ** | | Assumes 5% return before expenses. |
| | | | |
| ALLIANCEBERNSTEIN MUNICIPAL INCOME FUND II • | | | 25 | |
Fund Expenses
BOND RATING SUMMARY*
September 30, 2011 (unaudited)
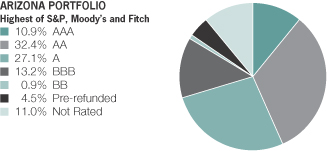
| * | | All data are as of September 30, 2011. The Portfolio’s quality rating breakdowns are expressed as a percentage of the Portfolio’s total investments in municipal securities and may vary over time. Each Portfolio also enters into derivative transactions, which may be used for hedging or investment purposes (see “Portfolio of Investments” section of the report for additional details). The quality ratings are determined by using the Standard & Poor’s Ratings Services (“S&P”), Moody’s Investors Services, Inc. (“Moody’s”) and Fitch Ratings, Ltd. (“Fitch”). Quality breakdown is the measure of the quality and safety of a bond or portfolio, based on the issuer’s financial condition. AAA is the highest (best) and D is the lowest (worst). The Pre-refunded category includes bonds which are secured by U.S. Government Securities and therefore are deemed AAA by the Adviser. The Not Rated category includes bonds that are not rated by a nationally recognized statistical rating organization. |
| | |
| 26 | | • ALLIANCEBERNSTEIN MUNICIPAL INCOME FUND II |
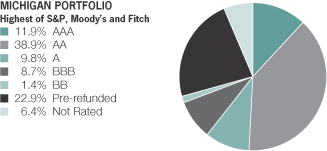
Bond Rating Summary
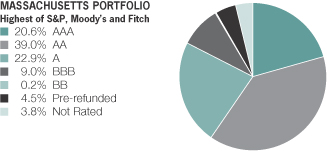
BOND RATING SUMMARY*
September 30, 2011 (unaudited)

| * | | All data are as of September 30, 2011. The Portfolio’s quality rating breakdowns are expressed as a percentage of the Portfolio’s total investments in municipal securities and may vary over time. Each Portfolio also enters into derivative transactions, which may be used for hedging or investment purposes (see “Portfolio of Investments” section of the report for additional details). The quality ratings are determined by using the Standard & Poor’s Ratings Services (“S&P”), Moody’s Investors Services, Inc. (“Moody’s”) and Fitch Ratings, Ltd. (“Fitch”). Quality breakdown is the measure of the quality and safety of a bond or portfolio, based on the issuer’s financial condition. AAA is the highest (best) and D is the lowest (worst). The Pre-refunded category includes bonds which are secured by U.S. Government Securities and therefore are deemed AAA by the Adviser. The Not Rated category includes bonds that are not rated by a nationally recognized statistical rating organization. |
| | | | |
| ALLIANCEBERNSTEIN MUNICIPAL INCOME FUND II • | | | 27 | |
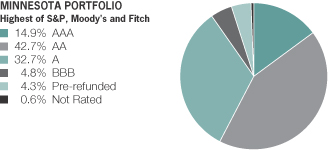
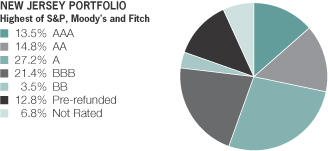
Bond Rating Summary
BOND RATING SUMMARY*
September 30, 2011 (unaudited)
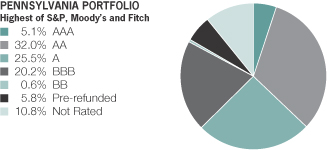
| * | | All data are as of September 30, 2011. The Portfolio’s quality rating breakdowns are expressed as a percentage of the Portfolio’s total investments in municipal securities and may vary over time. The Portfolio also enters into derivative transactions, which may be used for hedging or investment purposes (see “Portfolio of Investments” section of the report for additional details). The quality ratings are determined by using the Standard & Poor’s Ratings Services (“S&P”), Moody’s Investors Services, Inc. (“Moody’s”) and Fitch Ratings, Ltd. (“Fitch”). Quality breakdown is the measure of the quality and safety of a bond or portfolio, based on the issuer’s financial condition. AAA is the highest (best) and D is the lowest (worst). The Pre-refunded category includes bonds which are secured by U.S. Government Securities and therefore are deemed AAA by the Adviser. The Not Rated category includes bonds that are not rated by a nationally recognized statistical rating organization. |
| | |
| 28 | | • ALLIANCEBERNSTEIN MUNICIPAL INCOME FUND II |
Bond Rating Summary
ARIZONA PORTFOLIO
PORTFOLIO OF INVESTMENTS
September 30, 2011
| | | | | | | | |
| | | Principal
Amount
(000) | | | U.S. $ Value | |
| |
| | | | | | | | |
MUNICIPAL OBLIGATIONS – 100.2% | | | | | | | | |
Long-Term Municipal Bonds – 100.2% | | | | | | | | |
Arizona – 76.4% | | | | | | | | |
Arizona Cap Fac Fin Corp.
(Arizona St Univ)
Series 00
6.25%, 9/01/32 | | $ | 2,000 | | | $ | 1,972,340 | |
Arizona COP
AGM Series A
5.00%, 9/01/24 | | | 6,000 | | | | 6,356,760 | |
Arizona Dept of Admin Svc
(Arizona Lottery)
AGM Series 2010A
5.00%, 7/01/28 | | | 6,000 | | | | 6,430,320 | |
Arizona Game & Fish Dept
5.00%, 7/01/26 | | | 1,000 | | | | 1,041,840 | |
Arizona Hlth Fac Auth
(Blood Systems, Inc.)
Series 04
5.00%, 4/01/19 | | | 750 | | | | 767,243 | |
Arizona Hlth Fac Auth
(Catholic Healthcare West)
Series 2009 D
5.00%, 7/01/28 | | | 1,000 | | | | 1,006,300 | |
Arizona Hlth Fac Auth
(Phoenix Children’s Hospital)
1.16%, 2/01/42(a) | | | 1,150 | | | | 1,065,130 | |
Arizona St Univ
(Arizona State Univ COP Rsch Infra)
AMBAC Series 05A
5.00%, 9/01/23 | | | 2,000 | | | | 2,083,720 | |
Arizona St West Campus Hsg
AMBAC Series 05
5.00%, 7/01/30 | | | 2,200 | | | | 2,019,138 | |
Arizona Tourism & Sports Auth
(Arizona Tourism/Sports Spl Tax)
NPFGC Series 03A
5.00%, 7/01/25 | | | 2,400 | | | | 2,415,288 | |
Arizona Trnsp Brd Hwy
Series 04B
5.00%, 7/01/24 | | | 4,300 | | | | 4,631,272 | |
Arizona Wtr Infra Fin Auth
(Arizona SRF)
Series 06A
5.00%, 10/01/24 | | | 4,000 | | | | 4,409,040 | |
Dove Mountain Resort CFD AZ
Series 2001
6.75%, 12/01/16 | | | 405 | | | | 344,335 | |
| | | | |
| ALLIANCEBERNSTEIN MUNICIPAL INCOME FUND II • | | | 29 | |
Arizona Portfolio—Portfolio of Investments
| | | | | | | | |
| | | Principal
Amount
(000) | | | U.S. $ Value | |
| |
| | | | | | | | |
Downtown Phoenix Hotel Corp AZ
FGIC Series 2005A
5.00%, 7/01/29 | | $ | 1,400 | | | $ | 1,196,440 | |
Estrella Mtn CFD AZ Desert Vlg
7.38%, 7/01/27 | | | 1,107 | | | | 1,116,387 | |
Estrella Mtn CFD AZ Golf Vlg
Series 01A
7.88%, 7/01/25 | | | 2,315 | | | | 2,338,081 | |
Gilbert AZ Wtr Res Mun Corp.
(Gilbert AZ Wastewater Sys)
Series 04
4.90%, 4/01/19 | | | 2,315 | | | | 2,315,000 | |
Goodyear AZ IDA
(Litchfield Park Svc Co.)
Series 99
5.95%, 10/01/23 | | | 3,160 | | | | 2,867,510 | |
Greater AZ Dev Auth
NPFGC Series 05A
5.00%, 8/01/21 | | | 1,600 | | | | 1,677,488 | |
NPFGC Series 05B
5.00%, 8/01/25 | | | 4,320 | | | | 4,439,059 | |
Hassayampa CFD #2 AZ
(Hassayampa CFD #2 AZ Forst Rdg)
Series 00
7.50%, 7/01/24 | | | 475 | | | | 472,611 | |
Hassayampa CFD AZ
Series 96
7.75%, 7/01/21 | | | 1,775 | | | | 1,791,791 | |
Maricopa Cnty AZ IDA SFMR
Series 01
5.63%, 3/01/33 | | | 120 | | | | 120,139 | |
Maricopa Cnty AZ USD #89 GO
6.25%, 7/01/26 | | | 3,700 | | | | 4,227,139 | |
Mohave Cnty AZ IDA
(Mohave Correctional Fac Prog)
8.00%, 5/01/25 | | | 2,000 | | | | 2,239,140 | |
Nogales AZ Mun Dev Auth Lease
(Nogales AZ Lease Mun Dev Auth)
AMBAC Series 05
5.00%, 6/01/27 | | | 1,000 | | | | 1,022,710 | |
Northern Arizona Univ COP
(No Arizona Univ COP Rsch Fac)
AMBAC Series 04
5.13%, 9/01/21-9/01/24 | | | 7,140 | | | | 7,364,644 | |
Phoenix AZ Civic Impt Corp.
(Phoenix AZ Civic Impt Airport)
5.00%, 7/01/26 | | | 4,080 | | | | 4,388,530 | |
| | |
| 30 | | • ALLIANCEBERNSTEIN MUNICIPAL INCOME FUND II |
Arizona Portfolio—Portfolio of Investments
| | | | | | | | |
| | | Principal
Amount
(000) | | | U.S. $ Value | |
| |
| | | | | | | | |
Series 2010A
5.00%, 7/01/31 | | $ | 2,000 | | | $ | 2,090,580 | |
Phoenix AZ Civic Impt Corp.
(Phoenix AZ Transit Excise Tax)
NPFGC-RE Series 05A
5.00%, 7/01/23 | | | 5,500 | | | | 5,780,555 | |
Phoenix AZ IDA
(Phoenix AZ Lease – Capitol Mall)
AMBAC
5.00%, 9/15/25 | | | 5,935 | | | | 6,028,120 | |
Pima Cnty AZ IDA
(American Charter Sch Fdntn)
Series 2007A
5.50%, 7/01/26 | | | 1,000 | | | | 912,160 | |
Pima Cnty AZ IDA
(Horizon Learning Ctr)
Series 05
5.13%, 6/01/20 | | | 1,500 | | | | 1,416,135 | |
Pima Cnty AZ IDA MFHR
Series 99
7.00%, 12/20/31 (Pre-refunded/ETM) | | | 1,290 | | | | 1,347,405 | |
Pima Cnty AZ Swr
AGM
5.00%, 7/01/25 | | | 2,000 | | | | 2,189,400 | |
Pinal Cnty AZ COP
Series 04
5.00%, 12/01/24 | | | 2,000 | | | | 2,047,320 | |
Pinal Cnty AZ IDA
(Florence West Prison Proj)
ACA Series 06A
5.25%, 10/01/22 | | | 1,400 | | | | 1,328,250 | |
Queen Creek AZ ID #1
5.00%, 1/01/26 | | | 600 | | | | 589,170 | |
Salt River Proj Agric Impt & Pwr Dist AZ
Series A
5.00%, 1/01/29 | | | 3,400 | | | | 3,718,920 | |
Salt Verde Fin Corp. Gas
(Citigroup, Inc.)
5.25%, 12/01/22-12/01/23 | | | 1,165 | | | | 1,165,341 | |
Series 2007 | | | | | | | | |
5.00%, 12/01/37 | | | 1,000 | | | | 891,940 | |
Scottsdale AZ IDA
(Scottsdale Healthcare)
5.00%, 9/01/23 | | | 1,500 | | | | 1,550,325 | |
AGM | | | | | | | | |
5.00%, 9/01/35 | | | 1,500 | | | | 1,507,425 | |
| | | | |
| ALLIANCEBERNSTEIN MUNICIPAL INCOME FUND II • | | | 31 | |
Arizona Portfolio—Portfolio of Investments
| | | | | | | | |
| | | Principal
Amount
(000) | | | U.S. $ Value | |
| |
| | | | | | | | |
Show Low AZ ID #6
ACA Series 00
6.00%, 1/01/18 | | $ | 855 | | | $ | 854,889 | |
Stoneridge CFD AZ
Series 01
6.75%, 7/15/26 | | | 1,650 | | | | 1,502,012 | |
Sundance AZ CFD #1
Series 02
7.75%, 7/01/22 | | | 1,268 | | | | 1,267,861 | |
Tempe AZ Excise Tax
5.00%, 7/01/24 | | | 1,035 | | | | 1,115,637 | |
Tolleson AZ IDA MFHR
(Copper Cove Apts)
Series 01A
5.50%, 11/20/41 | | | 5,825 | | | | 5,909,987 | |
Tucson AZ Arpt Auth
AMBAC Series 01
5.35%, 6/01/31 | | | 6,475 | | | | 6,476,424 | |
Tucson AZ COP
NPFGC Series 04A
5.00%, 7/01/23-7/01/24 | | | 6,100 | | | | 6,318,581 | |
Tucson AZ IDA
(Univ of AZ/Marshall Foundation)
AMBAC Series 02A
5.00%, 7/15/32 | | | 1,000 | | | | 1,001,210 | |
| | | | | | | | |
| | | | | | | 129,129,042 | |
| | | | | | | | |
| | | | | | | | |
California – 2.5% | | | | | | | | |
California Econ Recovery
(California Econ Rec Spl Tax)
Series 2009A
5.25%, 7/01/21 | | | 800 | | | | 939,744 | |
California Statewide CDA
(Enloe Med Ctr)
6.25%, 8/15/28 | | | 2,155 | | | | 2,387,417 | |
Series 2008A | | | | | | | | |
5.38%, 8/15/20 | | | 740 | | | | 828,252 | |
| | | | | | | | |
| | | | | | | 4,155,413 | |
| | | | | | | | |
District of Columbia – 1.4% | | | | | | | | |
District of Columbia Tax Incr
5.25%, 12/01/26 | | | 2,040 | | | | 2,344,327 | |
| | | | | | | | |
| | |
Florida – 0.6% | | | | | | | | |
Double Branch CDD FL
Series 02A
6.70%, 5/01/34 | | | 925 | | | | 937,312 | |
| | | | | | | | |
| | |
| 32 | | • ALLIANCEBERNSTEIN MUNICIPAL INCOME FUND II |
Arizona Portfolio—Portfolio of Investments
| | | | | | | | |
| | | Principal
Amount
(000) | | | U.S. $ Value | |
| |
| | | | | | | | |
Ohio – 0.2% | | | | | | | | |
Lorain Cnty OH Port Auth
(United States Steel Corp.)
6.75%, 12/01/40 | | $ | 305 | | | $ | 317,850 | |
| | | | | | | | |
Puerto Rico – 17.3% | | | | | | | | |
Puerto Rico Comwlth Hwy Tran
5.00%, 7/01/32 | | | 2,015 | | | | 2,023,971 | |
Puerto Rico Conv Ctr Dist Auth
(Puerto Rico Hotel Occupancy Tax) | | | | | | | | |
AMBAC Series 06A | | | | | | | | |
5.00%, 7/01/18 | | | 6,000 | | | | 6,288,000 | |
Puerto Rico Elec Pwr Auth
5.00%, 7/01/20-7/01/22 | | | 6,400 | | | | 6,753,633 | |
Puerto Rico GO
5.25%, 7/01/23 | | | 575 | | | | 592,192 | |
Series 01A | | | | | | | | |
5.50%, 7/01/19 | | | 500 | | | | 544,945 | |
FGIC Series 02A | | | | | | | | |
5.00%, 7/01/32 (Pre-refunded/ETM) | | | 1,500 | | | | 1,552,680 | |
Series 03A | | | | | | | | |
5.25%, 7/01/23 | | | 500 | | | | 505,835 | |
Puerto Rico Govt Dev Bank | | | | | | | | |
Series 06B | | | | | | | | |
5.00%, 12/01/15 | | | 500 | | | | 540,200 | |
Puerto Rico HFA MFHR
5.00%, 12/01/17 (Pre-refunded/ETM) | | | 3,015 | | | | 3,303,445 | |
Puerto Rico HFA MFHR
(Puerto Rico HFA Cap Fund) | | | | | | | | |
5.00%, 12/01/17 | | | 1,855 | | | | 1,933,003 | |
5.13%, 12/01/27 | | | 385 | | | | 404,366 | |
Puerto Rico Hwy & Trnsp Auth
AGM
5.00%, 7/01/32 (Pre-refunded/ETM) | | | 1,385 | | | | 1,433,641 | |
Puerto Rico Ind Tour Edl Med
(Ascension Health)
Series 00A
6.13%, 11/15/30 | | | 1,500 | | | | 1,506,945 | |
Univ of Puerto Rico
5.00%, 6/01/18 | | | 1,855 | | | | 1,928,996 | |
| | | | | | | | |
| | | | | | | 29,311,852 | |
| | | | | | | | |
Texas – 1.8% | | | | | | | | |
Texas Private Acvty Bond Srfc Trnsp Corp.
(LBJ Managed Lanes Project)
7.00%, 6/30/40 | | | 840 | | | | 907,032 | |
Texas Private Acvty Bond Srfc Trnsp Corp.
(NTE Mobility Partners LLC Project)
6.875%, 12/31/39 | | | 420 | | | | 448,909 | |
| | | | |
| ALLIANCEBERNSTEIN MUNICIPAL INCOME FUND II • | | | 33 | |
Arizona Portfolio—Portfolio of Investments
| | | | | | | | |
| | | Principal
Amount
(000) | | | U.S. $ Value | |
| |
| | | | | | | | |
Texas Turnpike Auth
(Central Texas Turnpike)
AMBAC Series 02A
5.50%, 8/15/39 | | $ | 1,750 | | | $ | 1,753,080 | |
| | | | | | | | |
| | | | | | | 3,109,021 | |
| | | | | | | | |
| | | | | | | 169,304,817 | |
| | | | | | | | |
| | |
Total Investments – 100.2%
(cost $165,423,781) | | | | | | | 169,304,817 | |
Other assets less liabilities – (0.2)% | | | | | | | (405,423 | ) |
| | | | | | | | |
| | |
Net Assets – 100.0% | | | | | | $ | 168,899,394 | |
| | | | | | | | |
INTEREST RATE SWAP TRANSACTIONS (see Note D)
| | | | | | | | | | | | | | | | | | | | |
| | | | | | | | | Rate Type | | | | |
Swap
Counterparty | | Notional
Amount
(000) | | | Termination
Date | | | Payments
made
by the
Portfolio | | | Payments
received
by the
Portfolio | | | Unrealized
Appreciation/
(Depreciation) | |
Merrill Lynch | | $ | 1,440 | | | | 2/12/12 | | | | SIFMA | * | | | 3.548 | % | | $ | 23,972 | |
Merrill Lynch | | | 1,000 | | | | 8/9/26 | | | | 4.063 | % | | | SIFMA | * | | | (249,564) | |
| | | | | | | | | | | | | | | | | | | | |
| | | | | | | | | | | | | | | | | | $ | (225,592 | ) |
| | | | | | | | | | | | | | | | | | | | |
| * | | Variable interest rate based on the Securities Industry & Financial Markets Association (SIFMA) Municipal Swap Index. |
| (a) | | Floating Rate Security. Stated interest rate was in effect at September 30, 2011. |
As of September 30, 2011, the Portfolio held 45.9% of net assets in insured bonds (of this amount 3.9% represents the Portfolio’s holding in pre-refunded or escrowed to maturity bonds).
Glossary:
ACA – ACA Financial Guaranty Corporation
AGM – Assured Guaranty Municipal
AMBAC – Ambac Assurance Corporation
CDA – Community Development Authority
CDD – Community Development District
CFD – Community Facilities District
COP – Certificate of Participation
ETM – Escrowed to Maturity
FGIC – Financial Guaranty Insurance Company
GO – General Obligation
HFA – Housing Finance Authority
ID – Improvement District
IDA – Industrial Development Authority/Agency
MFHR – Multi-Family Housing Revenue
NPFGC – National Public Finance Guarantee Corporation
NPFGC-RE – National Public Finance Guarantee Corporation Reinsuring FGIC
SFMR – Single Family Mortgage Revenue
SRF – State Revolving Fund
USD – Unified School District
See notes to financial statements.
| | |
| 34 | | • ALLIANCEBERNSTEIN MUNICIPAL INCOME FUND II |
Arizona Portfolio—Portfolio of Investments
MASSACHUSETTS PORTFOLIO
PORTFOLIO OF INVESTMENTS
September 30, 2011
| | | | | | | | |
| | | Principal
Amount
(000) | | | U.S. $ Value | |
| |
| | | | | | | | |
MUNICIPAL OBLIGATIONS – 97.9% | | | | | | | | |
Long-Term Municipal Bonds – 97.9% | | | | | | | | |
Massachusetts – 77.0% | | | | | | | | |
Boston MA Wtr & Swr Comm
5.00%, 11/01/26 | | $ | 2,000 | | | $ | 2,272,020 | |
Series 2010A
5.00%, 11/01/29-11/01/30 | | | 5,000 | | | | 5,588,990 | |
Fall River MA GO
AGM
5.00%, 7/15/28 | | | 5,085 | | | | 5,560,702 | |
Massachusetts Bay Transp Auth
Series 04A
5.25%, 7/01/21 (Pre-refunded/ETM) | | | 2,000 | | | | 2,258,660 | |
Massachusetts Bay Transp Auth
(Massachusetts Bay Trnsp Auth Sales Tax)
5.00%, 7/01/28 | | | 1,025 | | | | 1,146,391 | |
Series B
5.00%, 7/01/29 | | | 645 | | | | 716,756 | |
Massachusetts Dev Fin Agy
(Bentley Univ)
5.00%, 7/01/28 | | | 4,500 | | | | 4,697,145 | |
Massachusetts Dev Fin Agy
(Boston College)
5.00%, 7/01/31 | | | 3,250 | | | | 3,517,410 | |
Massachusetts Dev Fin Agy
(Boston University)
5.00%, 10/01/29 | | | 3,300 | | | | 3,516,777 | |
Massachusetts Dev Fin Agy
(Brandeis Univ)
5.00%, 10/01/26-10/01/27 | | | 3,300 | | | | 3,527,292 | |
Series O-2
5.00%, 10/01/28 | | | 3,500 | | | | 3,734,850 | |
Massachusetts Dev Fin Agy
(Deerfield Academy)
5.00%, 10/01/30-10/01/40 | | | 7,615 | | | | 8,463,444 | |
Massachusetts Dev Fin Agy
(Massachusetts Clg of Pharmacy)
AGC Series 05D
5.00%, 7/01/24 | | | 3,500 | | | | 3,668,525 | |
Massachusetts Dev Fin Agy
(Phillips Academy)
5.00%, 9/01/21-9/01/22 | | | 6,000 | | | | 6,995,610 | |
Massachusetts Dev Fin Agy
(Sterling & Francine Clark Art Institute)
5.00%, 7/01/31 | | | 7,000 | | | | 7,618,590 | |
Massachusetts Dev Fin Agy
(Whitehead Institute)
5.00%, 6/01/26 | | | 1,710 | | | | 1,900,768 | |
| | | | |
| ALLIANCEBERNSTEIN MUNICIPAL INCOME FUND II • | | | 35 | |
Massachusetts Portfolio—Portfolio of Investments
| | | | | | | | |
| | | Principal
Amount
(000) | | | U.S. $ Value | |
| |
| | | | | | | | |
Series 2011A
5.00%, 6/01/27-6/01/28 | | $ | 3,225 | | | $ | 3,532,234 | |
Massachusetts DOT Met Hwy Sys
Series 2010B
5.00%, 1/01/26 | | | 6,900 | | | | 7,414,947 | |
Massachusetts GO
AMBAC
5.00%, 5/01/23 | | | 2,635 | | | | 2,867,934 | |
Series 02C
5.25%, 11/01/30 (Pre-refunded/ETM) | | | 3,075 | | | | 3,234,746 | |
AGM Series 05A
5.00%, 3/01/17 | | | 5,000 | | | | 5,651,800 | |
Series 2008A
5.00%, 9/01/28 | | | 2,800 | | | | 3,156,160 | |
Massachusetts Hlth & Ed Facs Auth
FGIC
5.00%, 5/15/25 (Pre-refunded/ETM) | | | 80 | | | | 82,298 | |
Massachusetts Hlth & Ed Facs Auth
(Berklee College of Music)
Series 2007A
5.00%, 10/01/32 | | | 5,000 | | | | 5,132,600 | |
Massachusetts Hlth & Ed Facs Auth
(Berkshire Health Sys)
RADIAN Series 01E
5.70%, 10/01/25 | | | 4,000 | | | | 4,007,400 | |
Massachusetts Hlth & Ed Facs Auth
(Cape Cod Healthcare)
RADIAN Series 01C
5.25%, 11/15/31 | | | 2,600 | | | | 2,424,344 | |
Massachusetts Hlth & Ed Facs Auth
(Caregroup, Inc.)
5.375%, 7/01/25 | | | 3,000 | | | | 3,170,550 | |
Massachusetts Hlth & Ed Facs Auth
(Covenant Health Sys)
6.00%, 7/01/31 | | | 1,955 | | | | 1,977,483 | |
Massachusetts Hlth & Ed Facs Auth
(Harvard Univ)
5.25%, 11/15/23 | | | 2,000 | | | | 2,364,800 | |
Series 2010A
5.00%, 12/15/30 | | | 5,000 | | | | 5,644,000 | |
Series A
5.00%, 12/15/27 | | | 2,150 | | | | 2,485,593 | |
Massachusetts Hlth & Ed Facs Auth
(Mass Eye & Ear Infirmary)
Series 2010C
5.375%, 7/01/35 | | | 1,005 | | | | 989,674 | |
| | |
| 36 | | • ALLIANCEBERNSTEIN MUNICIPAL INCOME FUND II |
Massachusetts Portfolio—Portfolio of Investments
| | | | | | | | |
| | | Principal
Amount
(000) | | | U.S. $ Value | |
| |
| | | | | | | | |
Massachusetts Hlth & Ed Facs Auth (Massachusetts Inst of Tech)
5.75%, 7/01/26 | | $ | 6,500 | | | $ | 7,722,520 | |
Massachusetts Hlth & Ed Facs Auth
(Milford Reg Med Ctr)
5.00%, 7/15/22 | | | 1,220 | | | | 1,211,887 | |
Massachusetts Hlth & Ed Facs Auth
(Northeastern Univ)
5.00%, 10/01/28 | | | 2,025 | | | | 2,175,053 | |
Series 2010A
5.00%, 10/01/29 | | | 5,000 | | | | 5,327,750 | |
Massachusetts Hlth & Ed Facs Auth
(Partners Healthcare Sys)
5.00%, 7/01/27 | | | 2,000 | | | | 2,097,340 | |
5.25%, 7/01/29 | | | 2,500 | | | | 2,664,950 | |
5.75%, 7/01/32 | | | 165 | | | | 166,794 | |
Massachusetts Hlth & Ed Facs Auth
(Sterling & Francine Clark Art Institute)
5.00%, 7/01/30 | | | 3,860 | | | | 4,243,645 | |
Massachusetts Hlth & Ed Facs Auth
(Suffolk Univ)
6.00%, 7/01/24 | | | 2,000 | | | | 2,210,580 | |
Massachusetts Hlth & Ed Facs Auth
(Williams College)
Series 2007
5.00%, 7/01/31 | | | 5,360 | | | | 5,705,613 | |
Massachusetts Hlth & Ed Facs Auth
(Winchester Medical Center)
5.25%, 7/01/38 | | | 2,500 | | | | 2,362,675 | |
Massachusetts Hlth & Ed Facs Auth
(Woods Hole Oceanographic)
5.25%, 6/01/26 | | | 1,905 | | | | 2,115,636 | |
5.375%, 6/01/27 | | | 3,060 | | | | 3,399,782 | |
Massachusetts Port Auth
Series 2010B
5.00%, 7/01/34 | | | 2,750 | | | | 2,936,312 | |
Massachusetts Port Auth
(US Airways)
NPFGC Series 96A
5.875%, 9/01/23 | | | 2,000 | | | | 1,838,280 | |
Massachusetts Sch Bldg Auth
(Massachusetts Sch Sales Tax)
NPFGC Series 05A
5.00%, 8/15/19 | | | 7,000 | | | | 7,865,200 | |
Massachusetts Spl Obl
(Massachusetts Gas Tax)
Series 2005A
4.429%, 6/01/20(a) | | | 2,000 | | | | 2,004,460 | |
| | | | |
| ALLIANCEBERNSTEIN MUNICIPAL INCOME FUND II • | | | 37 | |
Massachusetts Portfolio—Portfolio of Investments
| | | | | | | | |
| | | Principal
Amount
(000) | | | U.S. $ Value | |
| |
| | | | | | | | |
AGM Series 2005A
5.00%, 6/01/23 | | $ | 1,500 | | | $ | 1,625,805 | |
Massachusetts Wtr Poll Abatmnt
5.00%, 8/01/24 (Pre-refunded/ETM) | | | 4,875 | | | | 5,497,781 | |
Massachusetts Wtr Poll Abatmnt
(Massachusetts SRF)
5.00%, 8/01/20-8/01/25 | | | 6,125 | | | | 7,002,890 | |
Massachusetts Wtr Res Auth
Series 2011B
5.00%, 8/01/26-8/01/29 | | | 6,755 | | | | 7,687,221 | |
Metropolitan Boston Trnsp Pkg Corp. MA
5.00%, 7/01/27 | | | 6,000 | | | | 6,530,220 | |
Springfield MA GO
AGM
5.00%, 8/01/19 | | | 3,000 | | | | 3,385,830 | |
Univ of Massachusetts Bldg Auth
(Univ Of Massachusetts Lease)
5.00%, 5/01/26-5/01/27 | | | 6,000 | | | | 6,397,272 | |
| | | | | | | | |
| | | | | | | 213,495,989 | |
| | | | | | | | |
Arizona – 1.1% | | | | | | | | |
Dove Mountain Resort CFD AZ
Series 2001
6.75%, 12/01/16 | | | 345 | | | | 293,323 | |
Goodyear AZ IDA
(Litchfield Park Svc Co.)
Series 01
6.75%, 10/01/31 | | | 1,160 | | | | 1,065,008 | |
Salt Verde Fin Corp. Gas
(Citigroup, Inc.)
Series 2007
5.00%, 12/01/37 | | | 660 | | | | 588,680 | |
Stoneridge CFD AZ
Series 01
6.75%, 7/15/26 | | | 1,265 | | | | 1,151,542 | |
| | | | | | | | |
| | | | | | | 3,098,553 | |
| | | | | | | | |
California – 2.0% | | | | | | | | |
California Econ Recovery
(California Econ Rec Spl Tax)
Series 2009A
5.25%, 7/01/21 | | | 795 | | | | 933,871 | |
California Statewide CDA
(Enloe Med Ctr)
6.25%, 8/15/28 | | | 1,055 | | | | 1,168,782 | |
Series 2008A
5.50%, 8/15/23 | | | 360 | | | | 393,458 | |
Southern CA Pub Pwr Auth
5.00%, 7/01/23 | | | 2,800 | | | | 3,146,332 | |
| | | | | | | | |
| | | | | | | 5,642,443 | |
| | | | | | | | |
| | |
| 38 | | • ALLIANCEBERNSTEIN MUNICIPAL INCOME FUND II |
Massachusetts Portfolio—Portfolio of Investments
| | | | | | | | |
| | | Principal
Amount
(000) | | | U.S. $ Value | |
| |
| | | | | | | | |
District of Columbia – 3.5% | | | | | | | | |
District of Columbia
(Howard Univ)
Series 2011A
6.25%, 10/01/32 | | $ | 5,300 | | | $ | 5,598,814 | |
District of Columbia Tax Incr
5.25%, 12/01/26 | | | 3,575 | | | | 4,108,318 | |
| | | | | | | | |
| | | | | | | 9,707,132 | |
| | | | | | | | |
Florida – 0.6% | | | | | | | | |
Crossings at Fleming Is CDD FL
Series 00C
7.10%, 5/01/30 | | | 1,750 | | | | 1,749,930 | |
| | | | | | | | |
Georgia – 0.2% | | | | | | | | |
Atlanta GA Tax Allocation
(Eastside Proj)
Series 05B
5.60%, 1/01/30 | | | 500 | | | | 494,325 | |
| | | | | | | | |
Illinois – 0.4% | | | | | | | | |
Bolingbrook IL Sales Tax
6.25%, 1/01/24 | | | 500 | | | | 313,815 | |
Plano IL SSA #3
(Plano IL SSA #3 Lakewood Spr)
Series 05A
5.95%, 3/01/28 | | | 378 | | | | 370,614 | |
Railsplitter Tobacco Settlement Auth IL
6.00%, 6/01/28 | | | 325 | | | | 336,775 | |
| | | | | | | | |
| | | | | | | 1,021,204 | |
| | | | | | | | |
Nevada – 0.6% | | | | | | | | |
Clark Cnty NV SID #142
(Clark Cnty NV SID#142 Mtns Edg)
Series 03
6.10%, 8/01/18 | | | 920 | | | | 949,937 | |
Nevada GO
NPFGC-RE Series 2007B
5.00%, 12/01/25 | | | 620 | | | | 670,356 | |
| | | | | | | | |
| | | | | | | 1,620,293 | |
| | | | | | | | |
New York – 1.5% | | | | | | | | |
New York NY GO
Series 06
5.00%, 6/01/22 | | | 1,085 | | | | 1,210,556 | |
Series 2007
5.00%, 1/01/23 | | | 2,600 | | | | 2,846,272 | |
| | | | | | | | |
| | | | | | | 4,056,828 | |
| | | | | | | | |
| | | | |
| ALLIANCEBERNSTEIN MUNICIPAL INCOME FUND II • | | | 39 | |
Massachusetts Portfolio—Portfolio of Investments
| | | | | | | | |
| | | Principal
Amount
(000) | | | U.S. $ Value | |
| |
| | | | | | | | |
Ohio – 1.5% | | | | | | | | |
Cleveland OH, Inc. Tax
(Cleveland Police & Fire Pension)
5.25%, 5/15/24 | | $ | 3,450 | | | $ | 3,827,085 | |
Lorain Cnty OH Port Auth
(United States Steel Corp.)
6.75%, 12/01/40 | | | 395 | | | | 411,641 | |
| | | | | | | | |
| | | | | | | 4,238,726 | |
| | | | | | | | |
Puerto Rico – 8.1% | | | | | | | | |
Puerto Rico Comwlth Hwy Tran
5.25%, 7/01/14 | | | 4,225 | | | | 4,556,248 | |
Puerto Rico Elec Pwr Auth
5.00%, 7/01/18 | | | 850 | | | | 924,477 | |
Series 08WW
5.375%, 7/01/23 | | | 2,065 | | | | 2,207,237 | |
Series 2010 ZZ
5.25%, 7/01/24 | | | 3,000 | | | | 3,194,340 | |
Puerto Rico GO
Series 01A
5.50%, 7/01/19 | | | 500 | | | | 544,945 | |
Series 06A
5.25%, 7/01/22 | | | 500 | | | | 517,320 | |
Puerto Rico Govt Dev Bank
Series 06B
5.00%, 12/01/15 | | | 500 | | | | 540,200 | |
Puerto Rico HFA MFHR
5.00%, 12/01/20 (Pre-refunded/ETM) | | | 1,045 | | | | 1,144,975 | |
Puerto Rico HFA MFHR
(Puerto Rico HFA Cap Fund)
5.00%, 12/01/20 | | | 695 | | | | 715,850 | |
5.125%, 12/01/27 | | | 1,965 | | | | 2,063,839 | |
Puerto Rico Hwy & Trnsp Auth
(Puerto Rico Hwy & Trnsp Spl Tax)
FGIC Series 03G
5.25%, 7/01/14 | | | 4,410 | | | | 4,629,574 | |
Puerto Rico Mun Fin Agy
Series 05A
5.25%, 8/01/23 | | | 275 | | | | 280,794 | |
Univ of Puerto Rico
Series 06Q
5.00%, 6/01/19 | | | 1,025 | | | | 1,057,985 | |
| | | | | | | | |
| | | | | | | 22,377,784 | |
| | | | | | | | |
Texas – 0.6% | | | | | | | | |
Texas Private Acvty Bond Srfc Trnsp Corp.
(LBJ Managed Lanes Project)
7.00%, 6/30/40 | | | 1,090 | | | | 1,176,982 | |
| | |
| 40 | | • ALLIANCEBERNSTEIN MUNICIPAL INCOME FUND II |
Massachusetts Portfolio—Portfolio of Investments
| | | | | | | | |
| | | Principal
Amount
(000) | | | U.S. $ Value | |
| |
| | | | | | | | |
Texas Private Acvty Bond Srfc Trnsp Corp.
(NTE Mobility Partners LLC Project)
6.875%, 12/31/39 | | $ | 545 | | | $ | 582,512 | |
| | | | | | | | |
| | | | | | | 1,759,494 | |
| | | | | | | | |
Washington – 0.5% | | | | | | | | |
Washington St GO
AGM
5.00%, 7/01/28 | | | 1,245 | | | | 1,337,416 | |
| | | | | | | | |
Wisconsin – 0.3% | | | | | | | | |
Oneida Tribe of Indians WS Retail Sales
6.50%, 2/01/31(b) | | | 750 | | | | 808,013 | |
| | | | | | | | |
Total Municipal Obligations
(cost $258,223,706) | | | | | | | 271,408,130 | |
| | | | | | | | |
| | |
| | | Shares | | | | |
SHORT-TERM INVESTMENTS – 0.2% | | | | | | | | |
Investment Companies – 0.2% | | | | | | | | |
AllianceBernstein Fixed-Income Shares, Inc. - Government STIF Portfolio, 0.08%(c)
(cost $466,280) | | | 466,280 | | | | 466,280 | |
| | | | | | | | |
| | |
Total Investments – 98.1%
(cost $258,689,986) | | | | | | | 271,874,410 | |
Other assets less liabilities – 1.9% | | | | | | | 5,204,617 | |
| | | | | | | | |
| | |
Net Assets – 100.0% | | | | | | $ | 277,079,027 | |
| | | | | | | | |
INTEREST RATE SWAP TRANSACTIONS (see Note D)
| | | | | | | | | | | | | | | | | | | | |
| | | | | | | | | Rate Type | | | | |
Swap Counterparty | | Notional
Amount
(000) | | | Termination
Date | | | Payments
made by the
Portfolio | | | Payments
received
by the
Portfolio | | | Unrealized
Appreciation/
(Depreciation) | |
Citibank | | $ | 8,000 | | | | 12/1/17 | | | | SIFMA | * | | | 3.792 | % | | $ | 1,199,559 | |
Merrill Lynch | | | 5,100 | | | | 10/1/16 | | | | SIFMA | * | | | 4.147 | % | | | 812,964 | |
| | | | | | | | | | | | | | | | | | | | |
| | | | | | | | | | | | | | | | | | $ | 2,012,523 | |
| | | | | | | | | | | | | | | | | | | | |
| * | | Variable interest rate based on the Securities Industry & Financial Markets Association (SIFMA) Municipal Swap Index. |
| (a) | | Variable rate coupon, rate shown as of September 30, 2011. |
| (b) | | Security is exempt from registration under Rule 144A of the Securities Act of 1933. This security is considered liquid and may be resold in transactions exempt from registration, normally to qualified institutional buyers. At September 30, 2011, the market value of this security amounted to $808,013 or 0.3% of net assets. |
| (c) | | Investment in affiliated money market mutual fund. The rate shown represents the 7-day yield as of period end. |
| | | | |
| ALLIANCEBERNSTEIN MUNICIPAL INCOME FUND II • | | | 41 | |
Massachusetts Portfolio—Portfolio of Investments
As of September 30, 2011, the Portfolio held 16.5% of net assets in insured bonds (of this amount 0.2% represents the Portfolio’s holding in pre-refunded or escrowed to maturity bonds).
Glossary:
AGC – Assured Guaranty Corporation
AGM – Assured Guaranty Municipal
AMBAC – Ambac Assurance Corporation
CDA – Community Development Authority
CDD – Community Development District
CFD – Community Facilities District
DOT – Department of Transportation
ETM – Escrowed to Maturity
FGIC – Financial Guaranty Insurance Company
GO – General Obligation
HFA – Housing Finance Authority
IDA – Industrial Development Authority/Agency
MFHR – Multi-Family Housing Revenue
NPFGC – National Public Finance Guarantee Corporation
NPFGC-RE – National Public Finance Guarantee Corporation Reinsuring FGIC
RADIAN – Radian Asset Assurance Inc.
SID – Special Improvement District
SRF – State Revolving Fund
SSA – Special Services Area
See notes to financial statements.
| | |
| 42 | | • ALLIANCEBERNSTEIN MUNICIPAL INCOME FUND II |
Massachusetts Portfolio—Portfolio of Investments
MICHIGAN PORTFOLIO
PORTFOLIO OF INVESTMENTS
September 30, 2011
| | | | | | | | |
| | | Principal
Amount
(000) | | | U.S. $ Value | |
| |
| | | | | | | | |
MUNICIPAL OBLIGATIONS – 95.7% | | | | | | | | |
Long-Term Municipal Bonds – 95.7% | | | | | | | | |
Michigan – 63.0% | | | | | | | | |
Allen Park MI Pub SD GO
Series 03
5.00%, 5/01/16 (Pre-refunded/ETM) | | $ | 2,635 | | | $ | 2,829,094 | |
5.00%, 5/01/17 (Pre-refunded/ETM) | | | 2,300 | | | | 2,469,418 | |
5.00%, 5/01/18 (Pre-refunded/ETM) | | | 1,000 | | | | 1,073,660 | |
5.00%, 5/01/22 (Pre-refunded/ETM) | | | 2,695 | | | | 2,893,514 | |
Cedar Springs MI SD GO
Series 03
5.00%, 5/01/28 (Pre-refunded/ETM) | | | 1,835 | | | | 1,970,166 | |
Detroit MI GO
Series 2010
5.00%, 11/01/30 | | | 2,000 | | | | 2,067,720 | |
AMBAC Series 04A-1
5.25%, 4/01/22 | | | 1,330 | | | | 1,147,484 | |
Detroit MI SD GO
AGM Series 01A
5.125%, 5/01/31 (Pre-refunded/ETM) | | | 2,900 | | | | 2,981,809 | |
Detroit MI Wtr Supply Sys
AGM Series 2006A
5.00%, 7/01/24 | | | 1,885 | | | | 1,973,821 | |
Dexter Cmnty Sch MI GO
AGM
5.00%, 5/01/25 | | | 4,500 | | | | 4,827,555 | |
Lansing MI Brd Wtr & Lt
AGM Series 03A
5.00%, 7/01/25 | | | 2,200 | | | | 2,270,136 | |
Michigan Federal Hwy Grant
AGM
5.25%, 9/15/26 | | | 3,500 | | | | 3,788,960 | |
Michigan HDA MFHR
(Danbury Manor Apts)
Series 02A
5.30%, 6/01/35 | | | 2,490 | | | | 2,428,970 | |
Michigan HDA MFHR
(Michigan HDA)
Series 02A
5.50%, 10/20/43 | | | 1,950 | | | | 1,966,477 | |
AMBAC Series 97A
6.10%, 10/01/33 | | | 1,280 | | | | 1,280,474 | |
Michigan Hgr Ed Fac Auth
(Hope College)
Series 02A
5.90%, 4/01/32 | | | 1,465 | | | | 1,471,124 | |
| | | | |
| ALLIANCEBERNSTEIN MUNICIPAL INCOME FUND II • | | | 43 | |
Michigan Portfolio—Portfolio of Investments
| | | | | | | | |
| | | Principal
Amount
(000) | | | U.S. $ Value | |
| |
| | | | | | | | |
Michigan Hgr Ed Stud Loan Auth
(Michigan Hgr Ed Stud Loan Prog)
AMBAC Series 17G
5.20%, 9/01/20 | | $ | 3,500 | | | $ | 3,510,325 | |
Michigan Hosp Fin Auth
5.00%, 5/15/25 (Pre-refunded/ETM) | | | 415 | | | | 477,557 | |
Michigan Hosp Fin Auth
(Crittenton Hosp Medical Ctr)
Series 02A
5.625%, 3/01/27 | | | 1,250 | | | | 1,251,013 | |
Michigan Hosp Fin Auth
(Henry Ford Hlth Sys)
Series 2006A
5.25%, 11/15/32 | | | 1,600 | | | | 1,606,304 | |
Michigan Hosp Fin Auth
(Trinity Health Credit Group)
Series 2010A
5.00%, 12/01/27 | | | 1,000 | | | | 1,033,330 | |
Michigan Strategic Fund
(Detroit Edison Co.)
XLCA Series 02C
5.45%, 12/15/32 | | | 3,000 | | | | 3,002,820 | |
Michigan Strategic Fund
(Friendship Associates)
Series 02 A
5.20%, 12/20/22 | | | 3,000 | | | | 3,095,040 | |
Michigan Trunk Line Spl Tax
AGM Series 01A
5.25%, 11/01/30 (Pre-refunded/ETM) | | | 1,500 | | | | 1,505,535 | |
North Muskegon SD MI GO
Series 03
5.25%, 5/01/28 (Pre-refunded/ETM) | | | 1,500 | | | | 1,616,370 | |
Olivet Comnty Schs MI GO
Series 02
5.125%, 5/01/28 (Pre-refunded/ETM) | | | 1,065 | | | | 1,120,678 | |
Plymouth MI Ed Ctr Charter Sch
Series 05
5.125%, 11/01/18 | | | 1,050 | | | | 1,023,540 | |
Saginaw MI Hosp Fin Auth
(Covenant Medical Ctr)
5.00%, 7/01/30 | | | 500 | | | | 481,700 | |
Southfield MI Lib Bldg Auth
NPFGC
5.00%, 5/01/25 | | | 3,340 | | | | 3,519,391 | |
| | | | | | | | |
| | | | | | | 60,683,985 | |
| | | | | | | | |
| | |
| 44 | | • ALLIANCEBERNSTEIN MUNICIPAL INCOME FUND II |
Michigan Portfolio—Portfolio of Investments
| | | | | | | | |
| | | Principal
Amount
(000) | | | U.S. $ Value | |
| |
| | | | | | | | |
Arizona – 0.2% | | | | | | | | |
Dove Mountain Resort CFD AZ
Series 2001
6.75%, 12/01/16 | | $ | 215 | | | $ | 182,795 | |
| | | | | | | | |
| | |
California – 1.7% | | | | | | | | |
California Econ Recovery
(California Econ Rec Spl Tax)
Series 2009A
5.25%, 7/01/21 | | | 430 | | | | 505,112 | |
California Hlth Fac Fin Auth
(Sutter Health)
Series 00A
6.25%, 8/15/35 | | | 1,100 | | | | 1,101,936 | |
| | | | | | | | |
| | | | | | | 1,607,048 | |
| | | | | | | | |
District of Columbia – 2.7% | | | | | | | | |
District of Columbia Tax Incr
5.25%, 12/01/26 | | | 2,230 | | | | 2,562,672 | |
| | | | | | | | |
| | |
Florida – 3.6% | | | | | | | | |
Crossings at Fleming Is CDD FL
Series 00C
7.10%, 5/01/30 | | | 1,835 | | | | 1,834,926 | |
Double Branch CDD FL
Series 02A
6.70%, 5/01/34 | | | 915 | | | | 927,179 | |
Northern Palm Beach Cnty FL ID #27-B
Series 02
6.40%, 8/01/32 | | | 700 | | | | 697,529 | |
| | | | | | | | |
| | | | | | | 3,459,634 | |
| | | | | | | | |
Illinois – 0.9% | | | | | | | | |
Antioch Vilage IL SSA #1
(Antioch IL SSA #1 - Deercrest)
Series 03
6.625%, 3/01/33 | | | 491 | | | | 394,764 | |
Plano IL SSA #3
(Plano IL SSA #3 Lakewood Spr)
Series 05A
5.95%, 3/01/28 | | | 377 | | | | 369,634 | |
Railsplitter Tobacco Settlement Auth IL
6.00%, 6/01/28 | | | 140 | | | | 145,072 | |
| | | | | | | | |
| | | | | | | 909,470 | |
| | | | | | | | |
Nevada – 0.7% | | | | | | | | |
Nevada GO
NPFGC-RE Series 2007B
5.00%, 12/01/25 | | | 620 | | | | 670,356 | |
| | | | | | | | |
| | | | |
| ALLIANCEBERNSTEIN MUNICIPAL INCOME FUND II • | | | 45 | |
Michigan Portfolio—Portfolio of Investments
| | | | | | | | |
| | | Principal
Amount
(000) | | | U.S. $ Value | |
| |
| | | | | | | | |
New York – 2.7% | | | | | | | | |
New York NY GO
Series 06
5.00%, 6/01/22 | | $ | 680 | | | $ | 758,690 | |
Series 2007
5.00%, 1/01/23 | | | 1,700 | | | | 1,861,024 | |
| | | | | | | | |
| | | | | | | 2,619,714 | |
| | | | | | | | |
Ohio – 2.5% | | | | | | | | |
Cleveland OH, Inc. Tax
(Cleveland Police & Fire Pension)
5.25%, 5/15/24 | | | 2,050 | | | | 2,274,065 | |
Lorain Cnty OH Port Auth
(United States Steel Corp.)
6.75%, 12/01/40 | | | 170 | | | | 177,162 | |
| | | | | | | | |
| | | | | | | 2,451,227 | |
| | | | | | | | |
Puerto Rico – 16.9% | | | | | | | | |
Puerto Rico Elec Pwr Auth
5.00%, 7/01/18 | | | 1,000 | | | | 1,087,620 | |
Series 08WW
5.375%, 7/01/23 | | | 1,120 | | | | 1,197,146 | |
Puerto Rico GO
Series 06A
5.25%, 7/01/22 | | | 500 | | | | 517,320 | |
Puerto Rico HFA MFHR
5.00%, 12/01/17 (Pre-refunded/ETM) | | | 1,945 | | | | 2,131,078 | |
Puerto Rico HFA MFHR
(Puerto Rico HFA Cap Fund)
5.00%, 12/01/17 | | | 1,215 | | | | 1,266,091 | |
5.125%, 12/01/27 | | | 145 | | | | 152,293 | |
Puerto Rico HFC SFMR
(Puerto Rico HFC)
Series 01B
5.50%, 12/01/23 | | | 1,750 | | | | 1,751,190 | |
Series 01C
5.30%, 12/01/28 | | | 1,565 | | | | 1,565,188 | |
Puerto Rico Ind Tour Edl Med
(Ascension Health)
Series 00A
6.125%, 11/15/30 | | | 3,000 | | | | 3,013,890 | |
Puerto Rico Mun Fin Agy
Series 05A
5.25%, 8/01/23 | | | 275 | | | | 280,794 | |
Puerto Rico Sales Tax Fin Corp.
5.50%, 8/01/28 | | | 3,000 | | | | 3,270,060 | |
| | | | | | | | |
| | | | | | | 16,232,670 | |
| | | | | | | | |
| | |
| 46 | | • ALLIANCEBERNSTEIN MUNICIPAL INCOME FUND II |
Michigan Portfolio—Portfolio of Investments
| | | | | | | | |
| | | Principal
Amount
(000) | | | U.S. $ Value | |
| |
| | | | | | | | |
Texas – 0.8% | | | | | | | | |
Texas Private Acvty Bond Srfc Trnsp Corp.
(LBJ Managed Lanes Project)
7.00%, 6/30/40 | | $ | 470 | | | $ | 507,506 | |
Texas Private Acvty Bond Srfc Trnsp Corp.
(NTE Mobility Partners LLC Project)
6.875%, 12/31/39 | | | 235 | | | | 251,175 | |
| | | | | | | | |
| | | | | | | 758,681 | |
| | | | | | | | |
| | |
Total Municipal Obligations
(cost $89,072,970) | | | | | | | 92,138,252 | |
| | | | | | | | |
| | |
| | | Shares | | | | |
SHORT-TERM INVESTMENT – 1.9% | | | | | | | | |
Investment Companies – 1.9% | | | | | | | | |
AllianceBernstein Fixed-Income Shares, Inc. –
Government STIF Portfolio, 0.08%(a)
(cost $1,825,046) | | | 1,825,046 | | | | 1,825,046 | |
| | | | | | | | |
| | |
Total Investments – 97.6%
(cost $90,898,016) | | | | | | | 93,963,298 | |
Other assets less liabilities – 2.4% | | | | | | | 2,342,480 | |
| | | | | | | | |
| | |
Net Assets – 100.0% | | | | | | $ | 96,305,778 | |
| | | | | | | | |
INTEREST RATE SWAP TRANSACTIONS (see Note D)
| | | | | | | | | | | | | | | | | | | | |
| | | | | | | | | Rate Type | | | | |
Swap
Counterparty | | Notional
Amount
(000) | | | Termination
Date | | | Payments
made
by the
Portfolio | | | Payments
received
by the
Portfolio | | | Unrealized
Appreciation/
(Depreciation) | |
Merrill Lynch | | $ | 6,200 | | | | 10/1/16 | | | | SIFMA | * | | | 4.147 | % | | $ | 988,310 | |
| * | | Variable interest rate based on the Securities Industry & Financial Markets Association (SIFMA) Municipal Swap Index. |
| (a) | | Investment in affiliated money market mutual fund. The rate shown represents the 7-day yield as of period end. |
As of September 30, 2011, the Portfolio held 31.6% of net assets in insured bonds (of this amount 14.7% represents the Portfolio’s holding in pre-refunded or escrowed to maturity bonds).
Glossary:
| AGM | | – Assured Guaranty Municipal |
| AMBAC | | – Ambac Assurance Corporation |
| CDD | | – Community Development District |
| CFD | | – Community Facilities District |
| ETM | | – Escrowed to Maturity |
| HDA | | – Housing Development Authority |
| | | | |
| ALLIANCEBERNSTEIN MUNICIPAL INCOME FUND II • | | | 47 | |
Michigan Portfolio—Portfolio of Investments
| HFA | | – Housing Finance Authority |
| HFC | | – Housing Finance Corporation |
| ID | | – Improvement District |
| MFHR | | – Multi-Family Housing Revenue |
| NPFGC | | – National Public Finance Guarantee Corporation |
| NPFGC-RE | | – National Public Finance Guarantee Corporation Reinsuring FGIC |
| SFMR | | – Single Family Mortgage Revenue |
| SSA | | – Special Services Area |
| XLCA | | – XL Capital Assurance Inc. |
See notes to financial statements.
| | |
| 48 | | • ALLIANCEBERNSTEIN MUNICIPAL INCOME FUND II |
Michigan Portfolio—Portfolio of Investments
MINNESOTA PORTFOLIO
PORTFOLIO OF INVESTMENTS
September 30, 2011
| | | | | | | | |
| | | Principal
Amount
(000) | | | U.S. $ Value | |
| |
| | | | | | | | |
MUNICIPAL OBLIGATIONS – 101.0% | | | | | | | | |
Long-Term Municipal Bonds – 101.0% | | | | | | | | |
Minnesota – 101.0% | | | | | | | | |
Bemidji MN Hlth Care Fac
(North Country Hlth Svc)
RADIAN Series 02
5.00%, 9/01/31 | | $ | 1,500 | | | $ | 1,425,945 | |
Cass Lake MN ISD #115 GO
NPFGC-RE
5.00%, 2/01/26 | | | 1,760 | | | | 1,852,928 | |
Chaska MN Elec Sys
Series 05A
5.25%, 10/01/25 | | | 1,000 | | | | 1,057,750 | |
Cottage Grove MN Sr Hsg
(PHS Cottage Grove, Inc.)
Series 2006A
6.00%, 12/01/46 | | | 675 | | | | 614,723 | |
Farmington MN ISD #192 GO
(Farmington MN ISD) AGM
Series 05B
5.00%, 2/01/24 | | | 3,875 | | | | 4,148,575 | |
Hennepin Cnty MN Sales Tax
(Ballpark Proj)
5.00%, 12/15/23 | | | 3,475 | | | | 3,848,493 | |
Maple Grove MN Hlth Care Sys
(Maple Grove Hospital)
5.00%, 5/01/22 | | | 650 | | | | 668,421 | |
Metropolitan Council MN GO
5.00%, 3/01/22 | | | 5,000 | | | | 5,527,050 | |
Minneapolis MN
(National Marrow Donor Prog)
4.875%, 8/01/25 | | | 1,170 | | | | 1,145,173 | |
Minneapolis MN Common Bond Fd
Series 20102A
6.25%, 12/01/30 | | | 1,000 | | | | 1,113,390 | |
Minneapolis MN GO NPFGC
Series 02
5.25%, 12/01/26 | | | 2,000 | | | | 2,075,000 | |
Minneapolis MN Hlth Care Sys
(Fairview Health Svcs) AMBAC
Series 05D
5.00%, 11/15/30 | | | 1,000 | | | | 1,003,260 | |
Minneapolis MN MFHR
(Bottineau Commons Apts)
Series 02
5.45%, 4/20/43 | | | 2,000 | | | | 2,003,220 | |
| | | | |
| ALLIANCEBERNSTEIN MUNICIPAL INCOME FUND II • | | | 49 | |
Minnesota Portfolio—Portfolio of Investments
| | | | | | | | |
| | | Principal
Amount
(000) | | | U.S. $ Value | |
| |
| | | | | | | | |
Minneapolis MN MFHR
(Sumner Field Apts)
Series 02
5.60%, 11/20/43 | | $ | 2,505 | | | $ | 2,517,274 | |
Minneapolis-St Paul MN Hsg & Redev Auth
(Children’s Health Care)
5.25%, 8/15/35 | | | 1,000 | | | | 1,052,760 | |
Series 2010A
5.00%, 8/15/30 | | | 1,000 | | | | 1,024,610 | |
Series D
5.25%, 8/15/25 | | | 500 | | | | 550,925 | |
Minneapolis-St Paul MN Metro Arpt Commn
(Minneapolis-St Paul MN Intl Arpt)
5.00%, 1/01/30 | | | 1,250 | | | | 1,335,112 | |
Series 2009A
5.00%, 1/01/21 | | | 2,020 | | | | 2,290,882 | |
NPFGC Series 03A
5.00%, 1/01/28 | | | 1,500 | | | | 1,517,325 | |
Minnesota 911 Spl Fee AGC
Series 2009
5.00%, 6/01/21 | | | 1,970 | | | | 2,323,182 | |
Minnesota Agr & Econ Dev Brd
(Essentia Health)
AGC Series 2008 C-1
5.50%, 2/15/25 | | | 1,000 | | | | 1,121,510 | |
Minnesota Agr & Econ Dev Brd
(Evangelical Luth Good Sam Soc)
Series 02
6.00%, 2/01/22-2/01/27 | | | 2,880 | | | | 2,922,070 | |
Minnesota GO
5.00%, 8/01/19-6/01/21 | | | 4,000 | | | | 4,719,440 | |
Minnesota HFA SFMR
(Minnesota HFA)
Series 96F
6.30%, 1/01/28 | | | 215 | | | | 215,153 | |
Series 98H
6.05%, 7/01/31 | | | 1,000 | | | | 1,004,640 | |
Minnesota Hgr Ed Fac Auth
(Carleton College)
Series D
5.00%, 3/01/30 | | | 2,000 | | | | 2,194,160 | |
Minnesota Hgr Ed Fac Auth
(Gustavus Adolfus College)
5.00%, 10/01/31 | | | 2,770 | | | | 2,963,678 | |
Minnesota Hgr Ed Fac Auth
(St. Catherine College)
5.375%, 10/01/32 | | | 1,000 | | | | 1,001,470 | |
| | |
| 50 | | • ALLIANCEBERNSTEIN MUNICIPAL INCOME FUND II |
Minnesota Portfolio—Portfolio of Investments
| | | | | | | | |
| | | Principal
Amount
(000) | | | U.S. $ Value | |
| |
| | | | | | | | |
Minnesota Hgr Ed Fac Auth
(St. Olaf College)
2010 7-F
5.00%, 10/01/20 | | $ | 700 | | | $ | 813,904 | |
Minnesota Hgr Ed Fac Auth
(St. Scholastic College)
Series 2010H
5.125%, 12/01/30 | | | 1,000 | | | | 1,006,890 | |
Minnesota Hgr Ed Fac Auth
(Univ of St Thomas MN)
Series 04-5
5.00%, 10/01/24 | | | 1,000 | | | | 1,053,840 | |
5.25%, 10/01/34 | | | 1,000 | | | | 1,034,310 | |
Series 2009
5.00%, 10/01/29 | | | 1,000 | | | | 1,079,150 | |
Minnesota Mun Pwr Agy Elec
5.25%, 10/01/21 | | | 3,000 | | | | 3,302,970 | |
Series 04A
5.25%, 10/01/24 | | | 500 | | | | 534,740 | |
Minnesota Pub Fac Auth
Series 2007 A
5.00%, 3/01/20 (Pre-refunded/ETM) | | | 3,900 | | | | 4,693,767 | |
Minnetonka MN MFHR
(Archer Heights Apts)
Series 99A
5.30%, 1/20/27 | | | 1,620 | | | | 1,620,130 | |
No St Paul Maplewd MN ISD #622
AGM
5.00%, 8/01/20 | | | 3,425 | | | | 3,838,226 | |
Northern Mun Pwr Agy MN
(Northern Mun Pwr Agy MN Elec)
5.00%, 1/01/23-1/01/24 | | | 4,135 | | | | 4,695,332 | |
Prior Lake MN ISD #719 GO
AGM Series 05B
5.00%, 2/01/23 | | | 3,350 | | | | 3,588,721 | |
Rochester MN Hlth Care Fac
(Mayo Clinic)
Series D
5.00%, 11/15/38 | | | 1,000 | | | | 1,059,490 | |
Shakopee MN Hlthcare Fac
(St Francis Reg Medical Ctr)
Series 04
5.10%, 9/01/25 | | | 600 | | | | 603,990 | |
Shoreview MN MFHR
(Lexington Apts)
Series 01A
5.55%, 8/20/42 | | | 1,445 | | | | 1,446,994 | |
| | | | |
| ALLIANCEBERNSTEIN MUNICIPAL INCOME FUND II • | | | 51 | |
Minnesota Portfolio—Portfolio of Investments
| | | | | | | | |
| | | Principal
Amount
(000) | | | U.S. $ Value | |
| |
| | | | | | | | |
St. Cloud MN Hosp
(Centracare Hlth Sys)
Series 2010A
5.125%, 5/01/30 | | $ | 1,500 | | | $ | 1,547,700 | |
St. Louis Park MN Hlth Care Facs
(Park Nicollet Health Svcs)
Series 2009
5.50%, 7/01/29 | | | 1,150 | | | | 1,178,279 | |
St. Paul MN Hsg & Redev Auth
(Block 19 Ramp Parking Proj)
Series 2010A
5.00%, 8/01/30 | | | 1,870 | | | | 1,973,579 | |
St. Paul MN Hsg & Redev Auth
(Gillette Childrens Specialty Hosp)
5.00%, 2/01/21 | | | 500 | | | | 510,175 | |
St. Paul MN Port Auth
(Allina Health Sys)
Series 2009 A-2
5.25%, 11/15/28 | | | 1,200 | | | | 1,264,704 | |
St. Paul MN Port Auth
(Amherst H Wilder Fndtn)
5.00%, 12/01/29 | | | 3,945 | | | | 4,170,338 | |
St. Paul MN Port Auth Lease
(St. Paul MN Port Lease off Bldg)
Series 02
5.25%, 12/01/27 | | | 1,725 | | | | 1,766,900 | |
Series 03
5.00%, 12/01/23 | | | 1,000 | | | | 1,054,490 | |
St. Paul MN Rec Facs
(Highland National Proj)
5.00%, 10/01/20-10/01/25 | | | 2,750 | | | | 2,966,183 | |
Western MN Mun Pwr Agy
AGM
5.00%, 1/01/17 | | | 700 | | | | 814,919 | |
Western MN Mun Pwr Agy
NPFGC Series 03A
5.00%, 1/01/26-1/01/30 | | | 3,100 | | | | 3,151,052 | |
White Bear Lake MN MFHR
(Renova Partners Proj)
Series 01
5.60%, 10/01/30 | | | 1,000 | | | | 1,000,040 | |
Willmar MN GO
(Rice Memorial Hosp)
AGM Series 02
5.00%, 2/01/32 | | | 2,000 | | | | 2,027,460 | |
| | | | | | | | |
| | | | | | | 109,036,392 | |
| | | | | | | | |
| | |
| 52 | | • ALLIANCEBERNSTEIN MUNICIPAL INCOME FUND II |
Minnesota Portfolio—Portfolio of Investments
| | | | | | |
| | | | | U.S. $ Value | |
| |
| | | | | | |
Total Investments – 101.0%
(cost $104,499,566) | | | | $ | 109,036,392 | |
Other assets less liabilities – (1.0)% | | | | | (1,053,099 | ) |
| | | | | | |
| | |
Net Assets – 100.0% | | | | $ | 107,983,293 | |
| | | | | | |
INTEREST RATE SWAP TRANSACTIONS (see Note D)
| | | | | | | | | | | | | | | | | | | | |
| | | | | | | | | Rate Type | | | | |
Swap Counterparty | | Notional
Amount
(000) | | | Termination
Date | | | Payments
made by the
Portfolio | | | Payments
received
by the
Portfolio | | | Unrealized
Appreciation/
(Depreciation) | |
Merrill Lynch | | $ | 3,500 | | | | 8/1/16 | | | | SIFMA | * | | | 4.071 | % | | $ | 523,166 | |
| * | | Variable interest rate based on the Securities Industry & Financial Markets Association (SIFMA) Municipal Swap Index. |
As of September 30, 2011, the Portfolio held 26.8% of net assets in insured bonds (of this amount 0.0% represents the Portfolio’s holding in pre-refunded or escrowed to maturity bonds).
Glossary:
| AGC | | – Assured Guaranty Corporation |
| AGM | | – Assured Guaranty Municipal |
| AMBAC | | – Ambac Assurance Corporation |
| ETM | | – Escrowed to Maturity |
| HFA | | – Housing Finance Authority |
| ISD | | – Independent School District |
| MFHR | | – Multi-Family Housing Revenue |
| NPFGC | | – National Public Finance Guarantee Corporation |
| NPFGC-RE | | – National Public Finance Guarantee Corporation Reinsuring FGIC |
| RADIAN | | – Radian Asset Assurance Inc. |
| SFMR | | – Single Family Mortgage Revenue |
See notes to financial statements.
| | | | |
| ALLIANCEBERNSTEIN MUNICIPAL INCOME FUND II • | | | 53 | |
Minnesota Portfolio—Portfolio of Investments
NEW JERSEY PORTFOLIO
PORTFOLIO OF INVESTMENTS
September 30, 2011
| | | | | | | | |
| | | Principal
Amount
(000) | | | U.S. $ Value | |
| |
| | | | | | | | |
MUNICIPAL OBLIGATIONS – 97.1% | | | | | | | | |
Long-Term Municipal Bonds – 97.1% | | | | | | | | |
New Jersey – 66.3% | | | | | | | | |
Bergen Cnty NJ Impt Auth
(Bergen Cnty NJ GO)
5.00%, 12/15/17 | | $ | 2,755 | | | $ | 3,326,910 | |
Bergen Cnty NJ Impt Auth
(Wyckoff Twnj NJ Brd Ed GO)
Series 05
5.00%, 4/01/25 | | | 1,555 | | | | 1,665,281 | |
Higher Ed Student Assist NJ
NPFGC Series 00A
6.15%, 6/01/19 | | | 705 | | | | 705,874 | |
Landis NJ Swr Auth
NPFGC-RE Series 93
9.403%, 9/19/19(a) | | | 2,050 | | | | 2,443,149 | |
Middlesex Cnty NJ Impt Auth MFHR
(Skyline Tower Apts)
Series 01
5.25%, 7/01/21 | | | 750 | | | | 750,960 | |
Morris-Union NJ Jt Comm COP
RADIAN Series 04
5.00%, 5/01/24 | | | 1,290 | | | | 1,271,024 | |
New Jersey Ed Fac Auth
5.00%, 7/01/23 (Pre-refunded/ETM) | | | 280 | | | | 325,254 | |
AMBAC Series 02A
5.125%, 9/01/22 (Pre-refunded/ETM) | | | 2,500 | | | | 2,610,400 | |
FGIC Series 04E
5.00%, 7/01/28 (Pre-refunded/ETM) | | | 1,000 | | | | 1,119,630 | |
New Jersey Ed Fac Auth
(New Jersey Inst of Technology)
Series 2010H
5.00%, 7/01/31 | | | 700 | | | | 722,967 | |
New Jersey Ed Fac Auth
(Princeton Theological Seminary)
Series 2010A
5.00%, 7/01/28 | | | 5,000 | | | | 5,709,800 | |
New Jersey Ed Fac Auth
(Princeton Univ)
5.00%, 7/01/23 | | | 3,200 | | | | 3,519,808 | |
New Jersey Ed Fac Auth
(Richard Stockton College)
5.50%, 7/01/23 | | | 4,500 | | | | 5,001,615 | |
New Jersey EDA
Series 04-I
5.25%, 9/01/24 (Pre-refunded/ETM) | | | 2,510 | | | | 2,854,246 | |
| | |
| 54 | | • ALLIANCEBERNSTEIN MUNICIPAL INCOME FUND II |
New Jersey Portfolio—Portfolio of Investments
| | | | | | | | |
| | | Principal
Amount
(000) | | | U.S. $ Value | |
| |
| | | | | | | | |
New Jersey EDA
(Jersey Gardens Mall)
Series 98B
6.50%, 4/01/28 | | $ | 4,500 | | | $ | 4,753,350 | |
New Jersey EDA
(Masonic Charity Foundation NJ)
Series 01
5.50%, 6/01/31 | | | 1,000 | | | | 1,005,050 | |
Series 02
5.25%, 6/01/24 | | | 540 | | | | 545,141 | |
New Jersey EDA
(New Jersey Lease Liberty St Pk)
Series A
5.00%, 3/01/24 | | | 1,500 | | | | 1,551,780 | |
New Jersey EDA
(New Jersey Lease Sch Fac)
AGM
5.00%, 9/01/22 | | | 3,540 | | | | 3,844,582 | |
Series 05
5.25%, 3/01/25 | | | 3,300 | | | | 3,526,446 | |
New Jersey EDA
(NUI Corp.)
ACA Series 98A
5.25%, 11/01/33 | | | 2,200 | | | | 2,199,956 | |
New Jersey Hlth Care Fac Fin Auth
5.75%, 7/01/25 (Pre-refunded/ETM) | | | 900 | | | | 936,243 | |
RADIAN Series 04A
5.25%, 7/01/23 (Pre-refunded/ETM) | | | 2,085 | | | | 2,553,145 | |
New Jersey Hlth Care Fac Fin Auth
(AHS Hospital Corp.)
Series 08
5.125%, 7/01/22 | | | 1,000 | | | | 1,068,860 | |
New Jersey Hlth Care Fac Fin Auth
(Atlantic City Med Ctr)
5.75%, 7/01/25 | | | 975 | | | | 991,380 | |
New Jersey Hlth Care Fac Fin Auth
(Bayshore Community Hospital)
RADIAN Series 02
5.125%, 7/01/32 | | | 5,250 | | | | 4,151,805 | |
New Jersey Hlth Care Fac Fin Auth
(Hackensack Univ Med Ctr)
5.00%, 1/01/34 | | | 1,940 | | | | 1,899,066 | |
New Jersey Hlth Care Fac Fin Auth
(Holy Name Hospital)
5.00%, 7/01/25 | | | 2,100 | | | | 2,044,896 | |
| | | | |
| ALLIANCEBERNSTEIN MUNICIPAL INCOME FUND II • | | | 55 | |
New Jersey Portfolio—Portfolio of Investments
| | | | | | | | |
| | | Principal
Amount
(000) | | | U.S. $ Value | |
| |
| | | | | | | | |
New Jersey Hlth Care Fac Fin Auth
(House of Good Shepherd)
RADIAN Series 01A
5.20%, 7/01/31 | | $ | 1,350 | | | $ | 1,096,929 | |
New Jersey Hlth Care Fac Fin Auth
(Kennedy Health Sys)
Series 01
5.625%, 7/01/31 | | | 2,700 | | | | 2,700,216 | |
New Jersey Hlth Care Fac Fin Auth
(Newton Memorial Hospital)
AGM Series 01
5.00%, 7/01/26 | | | 1,500 | | | | 1,504,200 | |
New Jersey Hlth Care Fac Fin Auth
(Southern Ocean Cnty Hosp)
RADIAN Series 01
5.125%, 7/01/31 | | | 4,500 | | | | 4,145,310 | |
New Jersey Hsg & Mtg Agy MFHR
(New Jersey Hsg & Mtg Fin Agy)
AGM Series 00A1
6.35%, 11/01/31 | | | 2,000 | | | | 2,001,500 | |
New Jersey Trnsp Trust Fd Auth
Series 03C
5.50%, 6/15/24
(Pre-refunded/ETM) | | | 2,250 | | | | 2,446,380 | |
New Jersey Trnsp Trust Fd Auth
(New Jersey Trnsp Fed Hwy Grant)
NPFGC-RE Series 2006A
5.00%, 6/15/18 | | | 3,400 | | | | 3,788,552 | |
New Jersey Turnpike Auth
(New Jersey Turnpike)
Series 2009H
5.00%, 1/01/23 | | | 5,000 | | | | 5,492,450 | |
Newark NJ Hsg Auth PANYNJ Term
NPFGC Series 04
5.25%, 1/01/21 (Pre-refunded/ETM) | | | 2,380 | | | | 2,633,613 | |
5.25%, 1/01/22 (Pre-refunded/ETM) | | | 1,200 | | | | 1,327,872 | |
North Hudson Swr Auth NJ
NPFGC Series 01A
Zero Coupon, 8/01/24 | | | 12,340 | | | | 6,341,526 | |
Rutgers State Univ NJ GO
5.00%, 5/01/30 | | | 1,000 | | | | 1,089,280 | |
Salem Cnty NJ Poll Cntl Fin Auth
(Public Service Elec & Gas)
Series 01A 5.75%, 4/01/31 | | | 1,500 | | | | 1,512,750 | |
South Jersey Port Corp. NJ
5.20%, 1/01/23 | | | 1,000 | | | | 1,009,990 | |
| | |
| 56 | | • ALLIANCEBERNSTEIN MUNICIPAL INCOME FUND II |
New Jersey Portfolio—Portfolio of Investments
| | | | | | | | |
| | | Principal
Amount
(000) | | | U.S. $ Value | |
| |
| | | | | | | | |
Union Cnty NJ Impt Auth
(Union Cnty NJ GO)
NPFGC Series 03A
5.25%, 8/15/23 | | $ | 2,885 | | | $ | 2,978,762 | |
| | | | | | | | |
| | | | | | | 103,167,948 | |
| | | | | | | | |
Arizona – 0.2% | | | | | | | | |
Dove Mountain Resort CFD AZ
Series 2001
6.75%, 12/01/16 | | | 310 | | | | 263,565 | |
| | | | | | | | |
California – 1.1% | | | | | | | | |
California Statewide CDA
(Enloe Med Ctr)
6.25%, 8/15/28 | | | 1,165 | | | | 1,290,645 | |
Series 2008A
5.50%, 8/15/23 | | | 400 | | | | 437,176 | |
| | | | | | | | |
| | | | | | | 1,727,821 | |
| | | | | | | | |
District of Columbia – 2.3% | | | | | | | | |
District of Columbia Tax Incr
5.25%, 12/01/26 | | | 3,070 | | | | 3,527,983 | |
| | | | | | | | |
Florida – 3.1% | | | | | | | | |
Crossings at Fleming Is CDD FL
Series 00C
7.10%, 5/01/30 | | | 2,500 | | | | 2,499,900 | |
Double Branch CDD FL
Series 02A
6.70%, 5/01/34 | | | 905 | | | | 917,046 | |
Hammock Bay CDD FL
Series 04A
6.15%, 5/01/24 | | | 180 | | | | 174,035 | |
Northern Palm Beach Cnty FL ID #27-B
Series 02
6.40%, 8/01/32 | | | 1,165 | | | | 1,160,887 | |
| | | | | | | | |
| | | | | | | 4,751,868 | |
| | | | | | | | |
Guam – 0.3% | | | | | | | | |
Guam Wtrworks Auth
Series 05
6.00%, 7/01/25 | | | 500 | | | | 510,835 | |
| | | | | | | | |
Illinois – 0.3% | | | | | | | | |
Plano IL SSA #3
(Plano IL SSA #3 Lakewood Spr)
Series 05A
5.95%, 3/01/28 | | | 528 | | | | 517,683 | |
| | | | | | | | |
New York – 7.2% | | | | | | | | |
New York NY GO
Series 06
5.00%, 6/01/22 | | | 950 | | | | 1,059,934 | |
| | | | |
| ALLIANCEBERNSTEIN MUNICIPAL INCOME FUND II • | | | 57 | |
New Jersey Portfolio—Portfolio of Investments
| | | | | | | | |
| | | Principal
Amount
(000) | | | U.S. $ Value | |
| |
| | | | | | | | |
Port Authority of NY & NJ
NPFGC-RE Series 02
5.25%, 5/15/37 | | $ | 2,500 | | | $ | 2,544,350 | |
Port Authority of NY & NJ
(Delta Airlines, Inc.)
NPFGC Series 97-6
5.75%, 12/01/22 | | | 7,675 | | | | 7,678,300 | |
| | | | | | | | |
| | | | | | | 11,282,584 | |
| | | | | | | | |
Ohio – 2.4% | | | | | | | | |
Cleveland OH, Inc. Tax
(Cleveland Police & Fire Pension)
5.25%, 5/15/24 | | | 3,000 | | | | 3,327,900 | |
Columbiana Cnty Port Auth OH
(Apex Environmental LLC)
Series 04A
7.125%, 8/01/25 | | | 500 | | | | 434,400 | |
| | | | | | | | |
| | | | | | | 3,762,300 | |
| | | | | | | | |
Pennsylvania – 4.8% | | | | | | | | |
Delaware Riv Port Auth PA & NJ
Series 2010E
5.00%, 1/01/28-1/01/29 | | | 5,530 | | | | 5,863,314 | |
Delaware River JT Toll Brdg Commn PA
Series 03
5.00%, 7/01/28 | | | 1,625 | | | | 1,652,755 | |
| | | | | | | | |
| | | | | | | 7,516,069 | |
| | | | | | | | |
Puerto Rico – 6.8% | | | | | | | | |
Puerto Rico Elec Pwr Auth
5.00%, 7/01/18 | | | 900 | | | | 978,858 | |
Series 08WW
5.375%, 7/01/23 | | | 2,165 | | | | 2,314,125 | |
Puerto Rico GO
Series 01A
5.50%, 7/01/19 | | | 500 | | | | 544,945 | |
Series 04A
5.25%, 7/01/19 | | | 710 | | | | 734,069 | |
Series 06A
5.25%, 7/01/22 | | | 500 | | | | 517,320 | |
Puerto Rico HFA MFHR
5.00%, 12/01/17 (Pre-refunded/ETM) | | | 2,355 | | | | 2,580,303 | |
Puerto Rico HFA MFHR
(Puerto Rico HFA Cap Fund)
5.00%, 12/01/17 | | | 1,310 | | | | 1,365,085 | |
5.125%, 12/01/27 | | | 305 | | | | 320,342 | |
Univ of Puerto Rico
Series 06Q
5.00%, 6/01/20 | | | 1,260 | | | | 1,286,120 | |
| | | | | | | | |
| | | | | | | 10,641,167 | |
| | | | | | | | |
| | |
| 58 | | • ALLIANCEBERNSTEIN MUNICIPAL INCOME FUND II |
New Jersey Portfolio—Portfolio of Investments
| | | | | | | | |
| | | Principal
Amount
(000) | | | U.S. $ Value | |
| |
| | | | | | | | |
Texas – 2.3% | | | | | | | | |
Camino Real Regl Mob Auth TX
5.00%, 2/15/22 | | $ | 905 | | | $ | 905,163 | |
Dallas TX ISD GO
Series 2004
5.00%, 2/15/28 | | | 2,450 | | | | 2,602,267 | |
| | | | | | | | |
| | | | | | | 3,507,430 | |
| | | | | | | | |
| | |
Total Municipal Obligations
(cost $146,036,267) | | | | | | | 151,177,253 | |
| | | | | | | | |
| | |
| | | Shares | | | | |
SHORT-TERM INVESTMENTS – 1.6% | | | | | | | | |
Investment Companies – 1.6% | | | | | | | | |
AllianceBernstein Fixed-Income Shares, Inc. – Government STIF Portfolio, 0.08%(b)
(cost $2,549,512) | | | 2,549,512 | | | | 2,549,512 | |
| | | | | | | | |
| | |
Total Investments – 98.7%
(cost $148,585,779) | | | | | | | 153,726,765 | |
Other assets less liabilities – 1.3% | | | | | | | 1,947,612 | |
| | | | | | | | |
| | |
Net Assets – 100.0% | | | | | | $ | 155,674,377 | |
| | | | | | | | |
INTEREST RATE SWAP TRANSACTIONS (see Note D)
| | | | | | | | | | | | | | | | | | | | |
| | | | | | | | | Rate Type | | | | |
Swap
Counterparty | | Notional
Amount
(000) | | | Termination
Date | | | Payments
made
by the
Portfolio | | | Payments
received
by the
Portfolio | | | Unrealized
Appreciation/
(Depreciation) | |
Merrill Lynch | | $ | 3,000 | | | | 10/21/16 | | | | SIFMA | * | | | 4.129 | % | | $ | 472,065 | |
| * | | Variable interest rate based on the Securities Industry & Financial Markets Association (SIFMA) Municipal Swap Index. |
| (a) | | Variable rate coupon, rate shown as of September 30, 2011. |
| (b) | | Investment in affiliated money market mutual fund. The rate shown represents the 7-day yield as of period end. |
As of September 30, 2011, the Portfolio held 36.6% of net assets in insured bonds (of this amount 18.0% represents the Portfolio’s holding in pre-refunded or escrowed to maturity bonds).
ACA – ACA Financial Guaranty Corporation
AGM – Assured Guaranty Municipal
AMBAC – Ambac Assurance Corporation
CDA – Community Development Authority
CDD – Community Development District
| | | | |
| ALLIANCEBERNSTEIN MUNICIPAL INCOME FUND II • | | | 59 | |
New Jersey Portfolio—Portfolio of Investments
CFD – Community Facilities District
COP – Certificate of Participation
EDA – Economic Development Agency
ETM – Escrowed to Maturity
FGIC – Financial Guaranty Insurance Company
GO – General Obligation
HFA – Housing Finance Authority
ID – Improvement District
ISD – Independent School District
MFHR – Multi-Family Housing Revenue
NPFGC – National Public Finance Guarantee Corporation
NPFGC-RE – National Public Finance Guarantee Corporation Reinsuring FGIC
RADIAN – Radian Asset Assurance Inc.
SSA – Special Services Area
See notes to financial statements.
| | |
| 60 | | • ALLIANCEBERNSTEIN MUNICIPAL INCOME FUND II |
New Jersey Portfolio—Portfolio of Investments
OHIO PORTFOLIO
PORTFOLIO OF INVESTMENTS
September 30, 2011
| | | | | | | | |
| | | Principal
Amount
(000) | | | U.S. $ Value | |
| |
| | | | | | | | |
MUNICIPAL OBLIGATIONS – 99.5% | | | | | | | | |
Long-Term Municipal Bonds – 99.5% | | | | | | | | |
Ohio – 83.0% | | | | | | | | |
Allen Cnty OH Hosp
(Catholic Healthcare Partners)
Series 2010B
5.25%, 9/01/27 | | $ | 2,350 | | | $ | 2,436,128 | |
Brookville OH Local SD GO
AGM Series 03
5.00%, 12/01/26 (Pre-refunded/ETM) | | | 2,000 | | | | 2,198,160 | |
Canton OH SD GO
NPFGC Series 04B
5.00%, 12/01/22-12/01/23 | | | 2,150 | | | | 2,269,943 | |
Central OH Solid Wst Auth
AMBAC Series 04B
5.00%, 12/01/21 | | | 2,035 | | | | 2,177,511 | |
Cincinnati OH Tech College
AMBAC Series 02
5.00%, 10/01/28 | | | 5,000 | | | | 4,938,000 | |
Cleveland OH Arpt Sys
AMBAC Series 2006 A
5.00%, 1/01/23 | | | 4,000 | | | | 4,086,520 | |
Cleveland OH GO
NPFGC Series 02
5.25%, 12/01/27 (Pre-refunded/ETM) | | | 4,380 | | | | 4,630,405 | |
AMBAC Series 04
5.25%, 12/01/24 (Pre-refunded/ETM) | | | 1,200 | | | | 1,374,972 | |
Cleveland OH Pub Pwr Sys
NPFGC-RE Series 06A
5.00%, 11/15/18 | | | 2,165 | | | | 2,391,372 | |
Cleveland OH Wtrworks
NPFGC
5.00%, 1/01/23 | | | 2,500 | | | | 2,761,025 | |
Cleveland OH, Inc. Tax
(Cleveland Police & Fire Pension)
5.25%, 5/15/24 | | | 2,500 | | | | 2,773,250 | |
Columbiana Cnty Port Auth OH
(Apex Environmental LLC)
Series 04A
7.125%, 8/01/25 | | | 500 | | | | 434,400 | |
Columbus OH SD GO
FGIC Series 03
5.00%, 12/01/24 (Pre-refunded/ETM) | | | 2,500 | | | | 2,692,600 | |
5.00%, 12/01/25 (Pre-refunded/ETM) | | | 2,230 | | | | 2,401,799 | |
Cuyahoga Cnty OH Econ Dev
(Cuyahoga Cnty OH Lease)
Series 2010G
5.25%, 12/01/25 | | | 3,200 | | | | 3,637,984 | |
| | | | |
| ALLIANCEBERNSTEIN MUNICIPAL INCOME FUND II • | | | 61 | |
Ohio Portfolio—Portfolio of Investments
| | | | | | | | |
| | | Principal
Amount
(000) | | | U.S. $ Value | |
| |
| | | | | | | | |
Cuyahoga Cnty OH GO
RADIAN Series 04
5.00%, 11/15/19 | | $ | 1,850 | | | $ | 1,862,599 | |
Cuyahoga Cnty OH MFHR
(Longwood Apts)
Series 01
5.60%, 1/20/43 | | | 3,620 | | | | 3,647,838 | |
Cuyahoga Cnty OH Port Auth
(University Square Proj)
Series 01
7.35%, 12/01/31 | | | 2,000 | | | | 2,021,060 | |
Cuyahoga OH CCD
5.00%, 8/01/24 | | | 1,545 | | | | 1,721,624 | |
Dayton OH Arpt
(James M Cox Dayton Intl Arpt)
RADIAN Series 03A
5.00%, 12/01/23 | | | 1,280 | | | | 1,294,502 | |
Delaware OH SD GO
NPFGC Series 04
5.00%, 12/01/19 | | | 1,340 | | | | 1,465,317 | |
Dublin OH SD GO
AGM Series 03
5.00%, 12/01/22 | | | 1,500 | | | | 1,610,580 | |
Erie Cnty OH Hosp
(Firelands Regional Med Ctr)
Series 2002A
5.625%, 8/15/32 | | | 2,745 | | | | 2,743,106 | |
Franklin Cnty OH MFHR
(Agler Green Apts)
Series 02A
5.65%, 5/20/32 | | | 770 | | | | 782,690 | |
5.80%, 5/20/44 | | | 1,150 | | | | 1,172,862 | |
Greater Cleveland RTA OH
(Gtr Cleveland Trnsp Spl Tax)
NPFGC Series 04
5.00%, 12/01/24 | | | 1,350 | | | | 1,436,535 | |
Hamilton Cnty Conv Fac Auth OH
(Hamilton Cnty OH)
NPFGC-RE Series 04
5.00%, 12/01/23 | | | 1,330 | | | | 1,394,931 | |
Hamilton Cnty OH Sales Tax
AMBAC Series B
5.25%, 12/01/32 | | | 2,660 | | | | 2,661,543 | |
Hamilton OH SD GO
NPFGC
5.00%, 12/01/24 | | | 1,000 | | | | 1,046,110 | |
| | |
| 62 | | • ALLIANCEBERNSTEIN MUNICIPAL INCOME FUND II |
Ohio Portfolio—Portfolio of Investments
| | | | | | | | |
| | | Principal
Amount
(000) | | | U.S. $ Value | |
| |
| | | | | | | | |
Lorain Cnty OH Port Auth
(United States Steel Corp.)
6.75%, 12/01/40 | | $ | 270 | | | $ | 281,375 | |
Madeira OH City SD GO
NPFGC Series 04
5.00%, 12/01/22 (Pre-refunded/ETM) | | | 1,295 | | | | 1,473,710 | |
5.00%, 12/01/23 (Pre-refunded/ETM) | | | 1,370 | | | | 1,559,060 | |
Oak Hills OH Local SD GO
AGM Series 05
5.00%, 12/01/25 | | | 1,000 | | | | 1,040,990 | |
Ohio Bldg Auth
(Ohio Lease Adult Corr Fac)
NPFGC Series 04A
5.00%, 4/01/22 | | | 2,975 | | | | 3,171,201 | |
AGM Series 05A
5.00%, 4/01/24 | | | 1,500 | | | | 1,613,610 | |
Ohio GO
5.00%, 9/15/22 | | | 3,085 | | | | 3,750,157 | |
Series 04A
5.00%, 6/15/22 | | | 3,000 | | | | 3,252,960 | |
Ohio HFA SFMR
(Ohio HFA)
Series 02
5.375%, 9/01/33 | | | 955 | | | | 961,561 | |
Series 02-A3
5.50%, 9/01/34 | | | 245 | | | | 245,801 | |
Ohio Hgr Edl Fac Commn
(Oberlin College)
Series 2003
5.00%, 10/01/33 | | | 5,000 | | | | 5,112,900 | |
Ohio Higher Edl Fac Commn
(Denison Univ)
Series 04
5.00%, 11/01/21-11/01/24 | | | 3,440 | | | | 3,652,565 | |
Ohio St Higher Edl Fac Rev
(Univ Of Dayton OH)
5.375%, 12/01/30 | | | 750 | | | | 801,075 | |
Ohio Swr & Solid Wst Fac
(Anheuser-Busch Cos., Inc.)
Series 01
5.50%, 11/01/35 | | | 3,000 | | | | 3,000,780 | |
Ohio Univ
NPFGC Series 04
5.00%, 12/01/22 | | | 1,950 | | | | 2,056,431 | |
Ohio Wtr Dev Auth
(Anheuser-Busch Cos., Inc.)
Series 99
6.00%, 8/01/38 | | | 2,250 | | | | 2,251,260 | |
| | | | |
| ALLIANCEBERNSTEIN MUNICIPAL INCOME FUND II • | | | 63 | |
Ohio Portfolio—Portfolio of Investments
| | | | | | | | |
| | | Principal
Amount
(000) | | | U.S. $ Value | |
| |
| | | | | | | | |
Pinnacle Cmnty Infra Fin Auth
(Pinnacle Club of Grove City)
Series A
6.00%, 12/01/22 | | $ | 1,785 | | | $ | 1,544,703 | |
Princeton OH City SD GO
NPFGC Series 03
5.00%, 12/01/24 (Pre-refunded/ETM) | | | 1,600 | | | | 1,758,528 | |
Riversouth Auth OH
Series 04A
5.25%, 12/01/21-12/01/22 | | | 2,000 | | | | 2,138,270 | |
Series 05A
5.00%, 12/01/24 | | | 3,590 | | | | 3,823,601 | |
Toledo OH City SD GO
NPFGC-RE Series 03B
5.00%, 12/01/23 | | | 2,940 | | | | 3,078,062 | |
Toledo-Lucas Cnty OH Port Auth
(Cargill, Inc.)
Series 04B
4.50%, 12/01/15 | | | 2,500 | | | | 2,660,500 | |
Toledo-Lucas Cnty OH Port Auth
(Crocker Park Proj)
Series 03
5.375%, 12/01/35 | | | 2,000 | | | | 1,714,520 | |
Toledo-Lucas Cnty OH Port Auth
(CSX Corp., Inc.)
Series 92
6.45%, 12/15/21 | | | 1,270 | | | | 1,429,626 | |
Univ of Cincinnati COP
NPFGC
5.00%, 6/01/24 | | | 4,470 | | | | 4,660,556 | |
Youngstown OH GO
AGM
5.00%, 12/01/25 | | | 2,155 | | | | 2,276,434 | |
| | | | | | | | |
| | | | | | | 125,375,602 | |
| | | | | | | | |
Arizona – 0.2% | | | | | | | | |
Dove Mountain Resort CFD AZ
Series 2001
6.75%, 12/01/16 | | | 300 | | | | 255,063 | |
| | | | | | | | |
| | |
California – 0.5% | | | | | | | | |
California Econ Recovery
(California Econ Rec Spl Tax)
Series 2009A
5.25%, 7/01/21 | | | 600 | | | | 704,808 | |
California GO
5.25%, 4/01/29 | | | 5 | | | | 5,142 | |
| | | | | | | | |
| | | | | | | 709,950 | |
| | | | | | | | |
| | |
| 64 | | • ALLIANCEBERNSTEIN MUNICIPAL INCOME FUND II |
Ohio Portfolio—Portfolio of Investments
| | | | | | | | |
| | | Principal
Amount
(000) | | | U.S. $ Value | |
| |
| | | | | | | | |
District of Columbia – 2.1% | | | | | | | | |
District of Columbia
(Howard Univ)
Series 2011A
6.25%, 10/01/32 | | $ | 3,000 | | | $ | 3,169,140 | |
| | | | | | | | |
| | |
Florida – 2.2% | | | | | | | | |
Collier Cnty FL IDA
(Allete)
Series 96
6.50%, 10/01/25 | | | 200 | | | | 200,646 | |
Crossings at Fleming Is CDD FL
Series 00C
7.10%, 5/01/30 | | | 2,000 | | | | 1,999,920 | |
Double Branch CDD FL
Series 02A
6.70%, 5/01/34 | | | 885 | | | | 896,779 | |
Hammock Bay CDD FL
Series 04A
6.15%, 5/01/24 | | | 265 | | | | 256,218 | |
| | | | | | | | |
| | | | | | | 3,353,563 | |
| | | | | | | | |
Georgia – 0.3% | | | | | | | | |
Atlanta GA Tax Allocation
(Eastside Proj)
Series 05B
5.60%, 1/01/30 | | | 500 | | | | 494,325 | |
| | | | | | | | |
| | |
Illinois – 1.0% | | | | | | | | |
Antioch Vilage IL SSA #1
(Antioch IL SSA#1 - Deercrest)
Series 03
6.625%, 3/01/33 | | | 949 | | | | 762,996 | |
Plano IL SSA #3
(Plano IL SSA #3 Lakewood Spr)
Series 05A
5.95%, 3/01/28 | | | 542 | | | | 531,409 | |
Railsplitter Tobacco Settlement Auth IL
6.00%, 6/01/28 | | | 215 | | | | 222,790 | |
| | | | | | | | |
| | | | | | | 1,517,195 | |
| | | | | | | | |
Puerto Rico – 9.4% | | | | | | | | |
Puerto Rico Conv Ctr Dist Auth
(Puerto Rico Hotel Occupancy Tax)
AMBAC Series 06A
5.00%, 7/01/18-7/01/19 | | | 6,370 | | | | 6,631,860 | |
Puerto Rico Elec Pwr Auth
5.00%, 7/01/20 | | | 2,530 | | | | 2,679,725 | |
5.375%, 7/01/24 | | | 1,030 | | | | 1,091,017 | |
| | | | |
| ALLIANCEBERNSTEIN MUNICIPAL INCOME FUND II • | | | 65 | |
Ohio Portfolio—Portfolio of Investments
| | | | | | | | |
| | | Principal
Amount
(000) | | | U.S. $ Value | |
| |
| | | | | | | | |
Puerto Rico GO
Series 01A
5.50%, 7/01/19 | | $ | 500 | | | $ | 544,945 | |
Series 06A
5.25%, 7/01/22 | | | 500 | | | | 517,320 | |
Puerto Rico Govt Dev Bank
Series 06B
5.00%, 12/01/15 | | | 500 | | | | 540,200 | |
Puerto Rico HFA MFHR
(Puerto Rico HFA Cap Fund)
5.125%, 12/01/27 | | | 375 | | | | 393,863 | |
Puerto Rico Mun Fin Agy
Series 05A
5.25%, 8/01/23 | | | 375 | | | | 382,901 | |
Univ of Puerto Rico
5.00%, 6/01/22 | | | 1,350 | | | | 1,370,628 | |
| | | | | | | | |
| | | | | | | 14,152,459 | |
| | | | | | | | |
Texas – 0.8% | | | | | | | | |
Texas Private Acvty Bond Srfc Trnsp Corp.
(LBJ Managed Lanes Project)
7.00%, 6/30/40 | | | 740 | | | | 799,052 | |
Texas Private Acvty Bond Srfc Trnsp Corp.
(NTE Mobility Partners LLC Project)
6.875%, 12/31/39 | | | 370 | | | | 395,467 | |
| | | | | | | | |
| | | | | | | 1,194,519 | |
| | | | | | | | |
| | | | | | | 150,221,816 | |
| | | | | | | | |
| | |
Total Investments – 99.5%
(cost $145,485,184) | | | | | | | 150,221,816 | |
Other assets less liabilities – 0.5% | | | | | | | 735,797 | |
| | | | | | | | |
| | |
Net Assets – 100.0% | | | | | | $ | 150,957,613 | |
| | | | | | | | |
INTEREST RATE SWAP TRANSACTIONS (see Note D)
| | | | | | | | | | | | | | | | | | | | |
| | | | | | | | | Rate Type | | | | |
Swap Counterparty | | Notional
Amount
(000) | | | Termination
Date | | | Payments
made
by the
Portfolio | | | Payments
received
by the
Portfolio | | | Unrealized
Appreciation/
(Depreciation) | |
Merrill Lynch | | $ | 3,600 | | | | 8/1/16 | | | | SIFMA | * | | | 4.071 | % | | $ | 538,113 | |
| * | | Variable interest rate based on the Securities Industry & Financial Markets Association (SIFMA) Municipal Swap Index. |
As of September 30, 2011, the Portfolio held 49.0% of net assets in insured bonds (of this amount 24.4% represents the Portfolio’s holding in pre-refunded or escrowed to maturity bonds).
| | |
| 66 | | • ALLIANCEBERNSTEIN MUNICIPAL INCOME FUND II |
Ohio Portfolio—Portfolio of Investments
Glossary:
| AGM | | – Assured Guaranty Municipal |
| AMBAC | | – Ambac Assurance Corporation |
| CCD | | – Community College District |
| CDD | | – Community Development District |
| CFD | | – Community Facilities District |
| COP | | – Certificate of Participation |
| ETM | | – Escrowed to Maturity |
| FGIC | | – Financial Guaranty Insurance Company |
| HFA | | – Housing Finance Authority |
| IDA | | – Industrial Development Authority/Agency |
| MFHR | | – Multi-Family Housing Revenue |
| NPFGC | | – National Public Finance Guarantee Corporation |
| NPFGC-RE | | – National Public Finance Guarantee Corporation Reinsuring FGIC |
| RADIAN | | – Radian Asset Assurance Inc. |
| RTA | | – Regional Transportation Authority |
| SFMR | | – Single Family Mortgage Revenue |
| SSA | | – Special Services Area |
See notes to financial statements.
| | | | |
| ALLIANCEBERNSTEIN MUNICIPAL INCOME FUND II • | | | 67 | |
Ohio Portfolio—Portfolio of Investments
PENNSYLVANIA PORTFOLIO
PORTFOLIO OF INVESTMENTS
September 30, 2011
| | | | | | | | |
| | | Principal
Amount
(000) | | | U.S. $ Value | |
| |
| | | | | | | | |
MUNICIPAL OBLIGATIONS – 94.2% | | | | | | | | |
Long-Term Municipal Bonds – 94.2% | | | | | | | | |
Pennsylvania – 77.8% | | | | | | | | |
Adams Cnty PA IDA
(Gettysburg College)
5.00%, 8/15/25 | | $ | 1,090 | | | $ | 1,185,866 | |
Allegheny Cnty PA Hosp Dev Auth
(West Penn Allegheny Hlth Sys)
5.00%, 11/15/28 | | | 200 | | | | 170,014 | |
Allegheny Cnty PA IDA
(Residential Resources, Inc.)
5.00%, 9/01/21 | | | 500 | | | | 468,005 | |
Allegheny Cnty PA Redev Agy
(Pittsburgh Mills Spl Tax)
5.60%, 7/01/23 | | | 1,500 | | | | 1,378,605 | |
Allegheny Cnty PA Sani Auth
(Allegheny Cnty PA Swr)
NPFGC Series 05A
5.00%, 12/01/24 | | | 7,490 | | | | 7,968,386 | |
Butler Cnty PA
FGIC Series 03
5.25%, 7/15/26 (Pre-refunded/ETM) | | | 1,625 | | | | 1,766,586 | |
Coatesville PA SD GO
AGM
5.00%, 8/01/23 | | | 6,500 | | | | 7,091,500 | |
Cumberland Cnty PA Mun Auth
(Asbury Atlantic, Inc.)
6.125%, 1/01/45 | | | 300 | | | | 281,247 | |
Delaware Cnty Auth PA
(Elwyn Proj)
5.00%, 6/01/25 | | | 1,645 | | | | 1,536,627 | |
Delaware Cnty PA Hgr Ed Auth
(Eastern College)
Series 99
5.625%, 10/01/28 | | | 2,500 | | | | 2,500,200 | |
Delaware Riv Port Auth PA & NJ
Series 2010E
5.00%, 1/01/29 | | | 4,470 | | | | 4,713,436 | |
Lancaster Area Swr Auth PA
NPFGC Series 04
5.00%, 4/01/22 | | | 1,330 | | | | 1,399,865 | |
Lehigh Northampton PA Arpt
NPFGC Series 00
6.00%, 5/15/30 | | | 4,400 | | | | 4,399,956 | |
Lycoming Cnty PA Auth
(College of Technology)
AMBAC Series 02
5.25%, 5/01/32 | | | 2,250 | | | | 2,224,800 | |
| | |
| 68 | | • ALLIANCEBERNSTEIN MUNICIPAL INCOME FUND II |
Pennsylvania Portfolio—Portfolio of Investments
| | | | | | | | |
| | | Principal
Amount
(000) | | | U.S. $ Value | |
| |
| | | | | | | | |
Meadville PA GO
XLCA
5.00%, 10/01/25 | | $ | 3,080 | | | $ | 3,233,045 | |
Montgomery Cnty PA Hgr Ed Fac
(Abington Memorial Hosp)
Series 02A
5.125%, 6/01/32 | | | 3,000 | | | | 3,005,670 | |
Montgomery Cnty PA IDA
(New Regional Medical Ctr)
5.25%, 8/01/33 | | | 740 | | | | 779,449 | |
New Wilmington PA Mun Auth
(Westminster College)
RADIAN
5.00%, 5/01/27 | | | 1,040 | | | | 1,013,615 | |
Pennsylvania Econ Dev Fin Auth
(30th St Station Pkg Garage PA)
ACA Series 02
5.875%, 6/01/33 | | | 2,085 | | | | 2,011,858 | |
Pennsylvania Econ Dev Fin Auth
(Amtrak)
Series 01A
6.375%, 11/01/41 | | | 3,000 | | | | 3,029,250 | |
Pennsylvania Hgr Ed Fac Auth
(Dickinson College)
RADIAN Series 03AA-1
5.00%, 11/01/26 | | | 1,000 | | | | 1,021,270 | |
Pennsylvania Hgr Ed Fac Auth
(Thomas Jefferson Univ)
5.00%, 3/01/27 | | | 1,460 | | | | 1,582,815 | |
Series 2010
5.00%, 3/01/28 | | | 1,390 | | | | 1,496,571 | |
Pennsylvania Hgr Ed Fac Auth
(Univ of Pennsylvania Hlth Sys)
AMBAC Series 05A
5.00%, 8/15/20 | | | 2,000 | | | | 2,159,140 | |
Pennsylvania IDA
(Pennsylvania Srf)
Series 08A
5.50%, 7/01/23 | | | 1,060 | | | | 1,181,508 | |
Pennsylvania Intergov Coop Auth
5.00%, 6/15/23 | | | 4,000 | | | | 4,578,360 | |
Pennsylvania Turnpike Comm
Zero Coupon, 12/01/30 | | | 3,500 | | | | 2,860,270 | |
Philadelphia PA Gasworks
5.00%, 8/01/30 | | | 2,000 | | | | 2,019,760 | |
Philadelphia PA IDA
(Leadership Learning Partners)
Series 05A
5.25%, 7/01/24(a) | | | 350 | | | | 291,102 | |
| | | | |
| ALLIANCEBERNSTEIN MUNICIPAL INCOME FUND II • | | | 69 | |
Pennsylvania Portfolio—Portfolio of Investments
| | | | | | | | |
| | | Principal
Amount
(000) | | | U.S. $ Value | |
| |
| | | | | | | | |
Philadelphia PA IDA
(Univ of Pennsylvania)
Series 2007
0.73%, 4/26/14(b) | | $ | 2,000 | | | $ | 1,965,600 | |
Philadelphia PA Parking Auth
(Philadelphia Airport Parking)
Series 2009
5.00%, 9/01/26 | | | 2,725 | | | | 2,860,678 | |
Philadelphia PA SD GO
Series 2011E
5.25%, 9/01/23 | | | 4,000 | | | | 4,380,760 | |
Pittsburgh & Allegheny PA Sports & Exhibition Auth
(Pittsburgh-Allegheny Cnty PA Sales Tax)
AGM
5.00%, 2/01/31 | | | 1,075 | | | | 1,131,309 | |
Pittsburgh PA GO
AGM Series 06C
5.25%, 9/01/17 | | | 5,000 | | | | 5,591,750 | |
Pittsburgh PA Pub Pkg Auth
NPFGC-RE Series 05A
5.00%, 12/01/19 | | | 2,435 | | | | 2,585,654 | |
Pittsburgh PA Ur Redev Auth SFMR
Series 97A
6.25%, 10/01/28 | | | 745 | | | | 745,000 | |
South Central Gen Auth PA
(Hanover Hospital)
RADIAN
5.00%, 12/01/25 | | | 1,570 | | | | 1,474,261 | |
State Pub Sch Bldg Auth PA
AGM Series 03
5.25%, 6/01/26 (Pre-refunded/ETM) | | | 5,000 | | | | 5,405,800 | |
State Pub Sch Bldg Auth PA
(Colonial Intermediate Unit No. 20)
NPFGC-RE Series 05
5.00%, 5/15/26 | | | 2,025 | | | | 2,115,234 | |
Susquehanna PA Arpt Fac
(Aero Harrisburg LLC)
Series 99
5.50%, 1/01/24 | | | 3,235 | | | | 2,525,662 | |
Wilkes-Barre PA Fin Auth
(Univ of Scranton)
5.00%, 11/01/30 | | | 2,500 | | | | 2,647,575 | |
Wilkes-Barre PA Fin Auth
(Wilkes Univ Proj)
5.00%, 3/01/22 | | | 510 | | | | 527,534 | |
| | | | | | | | |
| | | | | | | 101,305,593 | |
| | | | | | | | |
| | |
| 70 | | • ALLIANCEBERNSTEIN MUNICIPAL INCOME FUND II |
Pennsylvania Portfolio—Portfolio of Investments
| | | | | | | | |
| | | Principal
Amount
(000) | | | U.S. $ Value | |
| |
| | | | | | | | |
Arizona – 0.2% | | | | | | | | |
Dove Mountain Resort CFD AZ
Series 2001
6.75%, 12/01/16 | | $ | 265 | | | $ | 225,306 | |
| | | | | | | | |
| | |
California – 0.5% | | | | | | | | |
California Econ Recovery
(California Econ Rec Spl Tax)
Series 2009A
5.25%, 7/01/21 | | | 520 | | | | 610,834 | |
| | | | | | | | |
| | |
District of Columbia – 2.3% | | | | | | | | |
District of Columbia Tax Incr
5.25%, 12/01/26 | | | 2,625 | | | | 3,016,597 | |
| | | | | | | | |
| | |
Florida – 3.4% | | | | | | | | |
Collier Cnty FL IDA
(Allete)
Series 96
6.50%, 10/01/25 | | | 400 | | | | 401,292 | |
Crossings at Fleming Is CDD FL
Series 00C
7.10%, 5/01/30 | | | 2,000 | | | | 1,999,920 | |
Double Branch CDD FL
Series 02A
6.70%, 5/01/34 | | | 955 | | | | 967,711 | |
Hammock Bay CDD FL
Series 04A
6.15%, 5/01/24 | | | 265 | | | | 256,218 | |
Northern Palm Beach Cnty FL ID #27-B
Series 02
6.40%, 8/01/32 | | | 845 | | | | 842,017 | |
| | | | | | | | |
| | | | | | | 4,467,158 | |
| | | | | | | | |
Guam – 0.8% | | | | | | | | |
Guam Intl Arpt Auth
NPFGC Series 03B
5.25%, 10/01/23 | | | 500 | | | | 505,915 | |
Guam Wtrworks Auth
Series 05
6.00%, 7/01/25 | | | 500 | | | | 510,835 | |
| | | | | | | | |
| | | | | | | 1,016,750 | |
| | | | | | | | |
Illinois – 0.9% | | | | | | | | |
Antioch Vilage IL SSA #1
(Antioch IL SSA #1 – Deercrest)
Series 03
6.625%, 3/01/33 | | | 983 | | | | 790,332 | |
| | | | |
| ALLIANCEBERNSTEIN MUNICIPAL INCOME FUND II • | | | 71 | |
Pennsylvania Portfolio—Portfolio of Investments
| | | | | | | | |
| | | Principal
Amount
(000) | | | U.S. $ Value | |
| |
| | | | | | | | |
Plano IL SSA #3
(Plano IL SSA #3 Lakewood Spr)
Series 05A
5.95%, 3/01/28 | | $ | 445 | | | $ | 436,305 | |
| | | | | | | | |
| | | | | | | 1,226,637 | |
| | | | | | | | |
Puerto Rico – 6.9% | | | | | | | | |
Puerto Rico Elec Pwr Auth
5.00%, 7/01/22 | | | 800 | | | | 838,936 | |
5.375%, 7/01/24 | | | 1,530 | | | | 1,620,637 | |
Puerto Rico GO
5.25%, 7/01/23 | | | 500 | | | | 514,950 | |
Puerto Rico HFA MFHR
(Puerto Rico HFA Cap Fund)
5.125%, 12/01/27 | | | 1,180 | | | | 1,239,354 | |
Puerto Rico Hwy & Trnsp Auth
(Puerto Rico Hwy & Trnsp Spl Tax)
FGIC Series 03G
5.25%, 7/01/14 | | | 3,335 | | | | 3,501,050 | |
Puerto Rico Mun Fin Agy
Series 05A
5.25%, 8/01/23 | | | 300 | | | | 306,321 | |
Puerto Rico Pub Bldgs Auth
(Puerto Rico GO)
Series N
5.50%, 7/01/22 | | | 345 | | | | 361,719 | |
Univ of Puerto Rico
5.00%, 6/01/22 | | | 655 | | | | 665,008 | |
| | | | | | | | |
| | | | | | | 9,047,975 | |
| | | | | | | | |
Texas – 0.6% | | | | | | | | |
Camino Real Regl Mob Auth TX
5.00%, 2/15/22 | | | 845 | | | | 845,152 | |
| | | | | | | | |
| | |
Washington – 0.8% | | | | | | | | |
Washington St GO
AGM
5.00%, 7/01/28 | | | 920 | | | | 988,292 | |
| | | | | | | | |
Total Municipal Obligations
(cost $119,163,399) | | | | | | | 122,750,294 | |
| | | | | | | | |
| | |
| 72 | | • ALLIANCEBERNSTEIN MUNICIPAL INCOME FUND II |
Pennsylvania Portfolio—Portfolio of Investments
| | | | | | | | |
| | | Shares | | | U.S. $ Value | |
| |
| | | | | | | | |
SHORT-TERM INVESTMENTS – 4.7% | | | | | | | | |
Investment Companies – 4.7% | | | | | | | | |
AllianceBernstein Fixed-Income Shares, Inc. – Government STIF Portfolio, 0.08%(c)
(cost $6,138,238) | | | 6,138,238 | | | $ | 6,138,238 | |
| | | | | | | | |
| | |
Total Investments – 98.9%
(cost $125,301,637) | | | | | | | 128,888,532 | |
Other assets less liabilities – 1.1% | | | | | | | 1,400,993 | |
| | | | | | | | |
| | |
Net Assets – 100.0% | | | | | | $ | 130,289,525 | |
| | | | | | | | |
| (b) | | Floating Rate Security. Stated interest rate was in effect at September 30, 2011. |
| (c) | | Investment in affiliated money market mutual fund. The rate shown represents the 7-day yield as of period end. |
As of September 30, 2011, the Portfolio held 44.2% of net assets in insured bonds (of this amount 12.5% represents the Portfolio’s holding in pre-refunded or escrowed to maturity bonds).
Glossary:
| ACA | | – ACA Financial Guaranty Corporation |
| AGM | | – Assured Guaranty Municipal |
| AMBAC | | – Ambac Assurance Corporation |
| CDD | | – Community Development District |
| CFD | | – Community Facilities District |
| ETM | | – Escrowed to Maturity |
| FGIC | | – Financial Guaranty Insurance Company |
| HFA | | – Housing Finance Authority |
| ID | | – Improvement District |
| IDA | | – Industrial Development Authority/Agency |
| MFHR | | – Multi-Family Housing Revenue |
| NPFGC | | – National Public Finance Guarantee Corporation |
| NPFGC-RE | | – National Public Finance Guarantee Corporation Reinsuring FGIC |
| RADIAN | | – Radian Asset Assurance Inc. |
| SFMR | | – Single Family Mortgage Revenue |
| SSA | | – Special Services Area |
| XLCA | | – XL Capital Assurance Inc. |
See notes to financial statements.
| | | | |
| ALLIANCEBERNSTEIN MUNICIPAL INCOME FUND II • | | | 73 | |
Pennsylvania Portfolio—Portfolio of Investments
VIRGINIA PORTFOLIO
PORTFOLIO OF INVESTMENTS
September 30, 2011
| | | | | | | | |
| | | Principal
Amount
(000) | | | U.S. $ Value | |
| |
| | | | | | | | |
MUNICIPAL OBLIGATIONS – 98.0% | | | | | | | | |
Long-Term Municipal Bonds – 98.0% | | | | | | | | |
Virginia – 72.8% | | | | | | | | |
Albemarle Cnty VA IDA Ed Fac
(The Covenant School)
Series 01A
7.75%, 7/15/32 | | $ | 4,260 | | | $ | 4,268,648 | |
Arlington Cnty VA IDA MFHR
(Arlington View Terrace Apts)
Series 01
5.15%, 11/01/31 | | | 1,550 | | | | 1,568,848 | |
Bell Creek CDA VA
Series 03A
6.75%, 3/01/22 | | | 134 | | | | 134,458 | |
Chesapeake VA GO
Series 2010D
5.00%, 12/01/25 | | | 2,275 | | | | 2,694,828 | |
Chesterfield Cnty VA IDA
(Virginia Elec & Pwr Co.)
Series 02
5.875%, 6/01/17 | | | 1,000 | | | | 1,023,370 | |
Chesterfield Cnty VA IDA PCR
(Virginia Elec & Pwr Co.)
Series 02
5.875%, 6/01/17 | | | 2,800 | | | | 2,865,436 | |
Dulles Town Ctr CDA VA
Series 98
6.25%, 3/01/26 | | | 1,860 | | | | 1,854,625 | |
Fairfax Cnty VA Econ Dev Dist
(Fairfax Cnty VA Trnsp Impt Dist)
5.00%, 4/01/28 | | | 8,635 | | | | 9,639,596 | |
Fairfax Cnty VA EDA
(Goodwin House)
5.00%, 10/01/22 | | | 1,000 | | | | 1,018,630 | |
Fairfax Cnty VA IDA
(Inova Health Sys)
5.00%, 5/15/25 | | | 1,000 | | | | 1,092,440 | |
Fairfax Cnty VA Wtr Auth
5.00%, 4/01/32 (Pre-refunded/ETM) | | | 1,355 | | | | 1,386,829 | |
5.00%, 4/01/32 | | | 2,025 | | | | 2,037,332 | |
Fairfax VA GO
Series 2010
5.00%, 7/15/25 | | | 480 | | | | 566,160 | |
Hampton VA Convention Ctr
5.00%, 1/15/35 (Pre-refunded/ETM) | | | 635 | | | | 673,030 | |
AMBAC | | | | | | | | |
5.00%, 1/15/35 | | | 4,515 | | | | 4,558,615 | |
| | |
| 74 | | • ALLIANCEBERNSTEIN MUNICIPAL INCOME FUND II |
Virginia Portfolio—Portfolio of Investments
| | | | | | | | |
| | | Principal
Amount
(000) | | | U.S. $ Value | |
| |
| | | | | | | | |
Hampton VA GO
Series 2010A
5.00%, 1/15/21 | | $ | 1,750 | | | $ | 2,084,285 | |
Hamptons Roads Santn Dist VA Wstwtr
5.00%, 4/01/25 | | | 6,650 | | | | 7,449,729 | |
Harrisonburg VA IDA
(Rockingham Mem Hosp)
AMBAC
5.00%, 8/15/22-8/15/25 | | | 7,850 | | | | 7,971,451 | |
Henrico Cnty VA GO
5.00%, 12/01/26 | | | 1,000 | | | | 1,135,480 | |
Series 2010
5.00%, 7/15/24 | | | 6,600 | | | | 7,779,024 | |
Henrico Cnty VA Wtr & Swr
5.00%, 5/01/25 | | | 1,165 | | | | 1,330,232 | |
Series 2009
5.00%, 5/01/27 | | | 1,200 | | | | 1,351,944 | |
Isle Wight Cnty VA GO
6.00%, 7/01/27 | | | 3,500 | | | | 4,111,275 | |
James City Cnty VA EDA
(James City Cnty VA Lease)
AGM
5.00%, 6/15/22 | | | 4,385 | | | | 4,889,363 | |
James City Cnty VA Swr
(Anheuser-Busch Cos., Inc.)
Series 97 6.00%, 4/01/32 | | | 4,200 | | | | 4,202,814 | |
Leesburg VA GO
Series 2011A
5.00%, 1/15/24 | | | 2,040 | | | | 2,417,196 | |
Lexington VA Indl Dev Auth
(Virginia Military Institute)
Series 2010B
5.00%, 12/01/30 | | | 3,885 | | | | 4,314,526 | |
Loudoun Cnty VA Santn Auth
5.00%, 1/01/29 | | | 3,820 | | | | 4,299,601 | |
Montgomery Cnty VA IDA
(Montgomery Cnty Va Lease)
5.00%, 2/01/24 | | | 2,000 | | | | 2,212,940 | |
Mosaic Dist VA CDA
Series 2011A
6.875%, 3/01/36 | | | 250 | | | | 258,613 | |
New Port CDA VA
5.50%, 9/01/26(a) | | | 957 | | | | 528,561 | |
Newport News VA IDA MFHR
(Walker Village Apts)
Series 02A
5.55%, 9/20/34 | | | 1,880 | | | | 1,890,208 | |
5.65%, 3/20/44 | | | 1,660 | | | | 1,670,093 | |
| | | | |
| ALLIANCEBERNSTEIN MUNICIPAL INCOME FUND II • | | | 75 | |
Virginia Portfolio—Portfolio of Investments
| | | | | | | | |
| | | Principal
Amount
(000) | | | U.S. $ Value | |
| |
| | | | | | | | |
Norfolk VA Arpt Auth
(Cargo Acquisition Group)
Series 02
6.25%, 1/01/30 | | $ | 970 | | | $ | 828,186 | |
Northwestern Reg Jail Auth VA
NPFGC
5.00%, 7/01/25 | | | 1,500 | | | | 1,572,765 | |
Prince William Cnty VA IDA
(George Mason Univ)
5.50%, 9/01/31 | | | 3,750 | | | | 4,040,662 | |
Prince William Cnty VA IDA
(Woodwind Gables Apt)
AMBAC
Series 01A
5.30%, 12/01/34 | | | 2,760 | | | | 2,302,751 | |
Reynolds Crossing CDA VA
5.10%, 3/01/21 | | | 2,135 | | | | 2,088,905 | |
Richmond VA GO
Series 2009A
5.00%, 7/15/27 | | | 1,400 | | | | 1,569,162 | |
AGM Series 05A | | | | | | | | |
5.00%, 7/15/22 | | | 2,500 | | | | 2,793,750 | |
Richmond VA Pub Util
5.00%, 1/15/28 | | | 1,000 | | | | 1,105,050 | |
Roanoke VA IDA
(Carilion Health Sys)
AGM
5.00%, 7/01/27 | | | 3,000 | | | | 3,182,850 | |
Suffolk VA GO
5.00%, 2/01/20 (Pre-refunded/ETM) | | | 1,710 | | | | 2,047,930 | |
5.00%, 8/01/22-2/01/26 | | | 7,140 | | | | 8,341,364 | |
NPFGC | | | | | | | | |
5.00%, 2/01/20 | | | 1,290 | | | | 1,472,522 | |
Univ of Virginia
5.00%, 9/01/29(b) | | | 2,910 | | | | 3,343,590 | |
Upper Occoquan Swr Auth VA
AGM
5.00%, 7/01/25 | | | 2,500 | | | | 2,731,025 | |
Virginia Beach VA Dev Auth MFHR
(Sholom Terrace Apts)
Series 02
5.40%, 4/01/44 | | | 2,900 | | | | 2,963,539 | |
Virginia Beach VA Wtr & Swr
5.00%, 10/01/30 | | | 2,000 | | | | 2,149,320 | |
Virginia College Bldg Auth
5.00%, 9/01/16 (Pre-refunded/ETM) | | | 220 | | | | 256,661 | |
Virginia College Bldg Auth (Liberty Univ)
5.25%, 3/01/29 | | | 5,000 | | | | 5,593,600 | |
| | |
| 76 | | • ALLIANCEBERNSTEIN MUNICIPAL INCOME FUND II |
Virginia Portfolio—Portfolio of Investments
| | | | | | | | |
| | | Principal
Amount
(000) | | | U.S. $ Value | |
| |
| | | | | | | | |
Virginia College Bldg Auth
(Roanoke College)
5.00%, 4/01/23 | | $ | 1,000 | | | $ | 1,063,020 | |
Virginia College Bldg Auth
(Virginia Lease Pub Hgr Ed)
5.00%, 9/01/16 | | | 5,615 | | | | 6,424,346 | |
Series 05A | | | | | | | | |
5.00%, 9/01/17 | | | 5,890 | | | | 6,681,086 | |
Virginia HDA SFMR
(Virginia HDA)
Series 01D
5.40%, 6/01/24 | | | 3,155 | | | | 3,156,073 | |
Series 02B | | | | | | | | |
5.50%, 4/01/27 | | | 5,000 | | | | 5,000,950 | |
Virginia Port Auth
Series 2010
5.00%, 7/01/30 | | | 2,250 | | | | 2,429,437 | |
Virginia Port Auth
(Virginia Lease Port Fund)
Series 02
5.00%, 7/01/27 | | | 1,000 | | | | 1,018,260 | |
5.125%, 7/01/24 | | | 4,000 | | | | 4,105,640 | |
Virginia Resources Auth
(Virginia SRF)
5.00%, 10/01/27 | | | 2,500 | | | | 2,899,025 | |
Series 2009 | | | | | | | | |
5.00%, 10/01/25 | | | 5,845 | | | | 6,874,129 | |
Virginia Small Business Fin Auth
(Wellmont Hlth Sys Proj)
5.125%, 9/01/22 | | | 710 | | | | 717,711 | |
Watkins Centre CDA VA
5.40%, 3/01/20 | | | 583 | | | | 582,580 | |
| | | | | | | | |
| | | | | | | 184,616,069 | |
| | | | | | | | |
Arizona – 0.4% | | | | | | | | |
Dove Mountain Resort CFD AZ
Series 2001
6.75%, 12/01/16 | | | 355 | | | | 301,824 | |
Salt Verde Fin Corp. Gas
(Citigroup, Inc.)
Series 2007
5.00%, 12/01/37 | | | 705 | | | | 628,818 | |
| | | | | | | | |
| | | | | | | 930,642 | |
| | | | | | | | |
California – 1.5% | | | | | | | | |
California Econ Recovery
(California Econ Rec Spl Tax)
Series 2009A
5.25%, 7/01/21 | | | 880 | | | | 1,033,718 | |
| | | | |
| ALLIANCEBERNSTEIN MUNICIPAL INCOME FUND II • | | | 77 | |
Virginia Portfolio—Portfolio of Investments
| | | | | | | | |
| | | Principal
Amount
(000) | | | U.S. $ Value | |
| |
| | | | | | | | |
California Statewide CDA
(Enloe Med Ctr)
6.25%, 8/15/28 | | $ | 1,910 | | | $ | 2,115,994 | |
Series 2008A | | | | | | | | |
5.50%, 8/15/23 | | | 660 | | | | 721,340 | |
| | | | | | | | |
| | | | | | | 3,871,052 | |
| | | | | | | | |
District of Columbia – 8.3% | | | | | | | | |
District of Columbia
(Howard Univ)
Series 2011A
6.25%, 10/01/32 | | | 4,700 | | | | 4,964,986 | |
District of Columbia Tax Incr
5.25%, 12/01/26 | | | 3,860 | | | | 4,435,835 | |
Metro Washington Arpt Auth VA
Series C
5.125%, 10/01/34 | | | 5,130 | | | | 5,417,998 | |
Metro Washington Arpt Auth VA
(Dulles Toll Road)
Series 2010B
6.50%, 10/01/44 | | | 4,300 | | | | 2,852,276 | |
Washington DC Metro Area Trnst Auth
5.25%, 7/01/27 | | | 3,000 | | | | 3,340,170 | |
| | | | | | | | |
| | | | | | | 21,011,265 | |
| | | | | | | | |
Georgia – 0.2% | | | | | | | | |
Atlanta GA Tax Allocation
(Eastside Proj)
Series 05B
5.60%, 1/01/30 | | | 500 | | | | 494,325 | |
| | | | | | | | |
Illinois – 0.3% | | | | | | | | |
Plano IL SSA #3
(Plano IL SSA #3 Lakewood Spr)
Series 05A
5.95%, 3/01/28 | | | 445 | | | | 436,304 | |
Railsplitter Tobacco Settlement Auth IL
6.00%, 6/01/28 | | | 325 | | | | 336,775 | |
| | | | | | | | |
| | | | | | | 773,079 | |
| | | | | | | | |
New York – 1.6% | | | | | | | | |
New York NY GO
Series 06
5.00%, 6/01/22 | | | 1,125 | | | | 1,255,185 | |
Series 2007 | | | | | | | | |
5.00%, 1/01/23 | | | 2,700 | | | | 2,955,744 | |
| | | | | | | | |
| | | | | | | 4,210,929 | |
| | | | | | | | |
Ohio – 0.2% | | | | | | | | |
Lorain Cnty OH Port Auth
(United States Steel Corp.)
6.75%, 12/01/40 | | | 405 | | | | 422,063 | |
| | | | | | | | |
| | |
| 78 | | • ALLIANCEBERNSTEIN MUNICIPAL INCOME FUND II |
Virginia Portfolio—Portfolio of Investments
| | | | | | | | |
| | | Principal
Amount
(000) | | | U.S. $ Value | |
| |
| | | | | | | | |
Puerto Rico – 8.8% | | | | | | | | |
Puerto Rico Comwlth Hwy Tran
5.25%, 7/01/14 | | $ | 1,760 | | | $ | 1,897,901 | |
Puerto Rico Elec Pwr Auth
5.00%, 7/01/20 | | | 800 | | | | 847,344 | |
NPFGC | | | | | | | | |
5.50%, 7/01/17 | | | 5,000 | | | | 5,645,800 | |
Puerto Rico GO
Series 01A
5.50%, 7/01/19 | | | 500 | | | | 544,945 | |
Puerto Rico Govt Dev Bank
Series 06B
5.00%, 12/01/15 | | | 500 | | | | 540,200 | |
Puerto Rico HFA MFHR
5.00%, 12/01/20 (Pre-refunded/ETM) | | | 3,290 | | | | 3,604,754 | |
Puerto Rico HFA MFHR
(Puerto Rico HFA Cap Fund)
5.00%, 12/01/20 | | | 1,580 | | | | 1,627,400 | |
5.125%, 12/01/27 | | | 290 | | | | 304,587 | |
Puerto Rico Hwy & Trnsp Auth
(Puerto Rico Hwy & Trnsp Spl Tax)
FGIC
Series 03G 5.25%, 7/01/14 | | | 1,840 | | | | 1,931,614 | |
Puerto Rico Mun Fin Agy
Series 05A
5.25%, 8/01/23 | | | 340 | | | | 347,164 | |
Puerto Rico Sales Tax Fin Corp.
5.50%, 8/01/28 | | | 3,000 | | | | 3,270,060 | |
Univ of Puerto Rico
5.00%, 6/01/22 | | | 1,740 | | | | 1,766,587 | |
| | | | | | | | |
| | | | | | | 22,328,356 | |
| | | | | | | | |
Texas – 3.3% | | | | | | | | |
Spring TX ISD GO
5.00%, 8/15/25 | | | 5,655 | | | | 6,519,593 | |
Texas Private Acvty Bond Srfc Trnsp Corp.
(LBJ Managed Lanes Project)
7.00%, 6/30/40 | | | 1,110 | | | | 1,198,578 | |
Texas Private Acvty Bond Srfc Trnsp Corp.
(NTE Mobility Partners LLC Project)
6.875%, 12/31/39 | | | 555 | | | | 593,201 | |
| | | | | | | | |
| | | | | | | 8,311,372 | |
| | | | | | | | |
Washington – 0.6% | | | | | | | | |
Washington St GO AGM
5.00%, 7/01/28 | | | 1,335 | | | | 1,434,097 | |
| | | | | | | | |
| | |
Total Municipal Obligations
(cost $238,038,974) | | | | | | | 248,403,249 | |
| | | | | | | | |
| | | | |
| ALLIANCEBERNSTEIN MUNICIPAL INCOME FUND II • | | | 79 | |
Virginia Portfolio—Portfolio of Investments
| | | | | | | | |
| | | Shares | | | U.S. $ Value | |
| |
| | | | | | | | |
SHORT-TERM INVESTMENTS – 1.8% | | | | | | | | |
Investment Companies – 1.8% | | | | | | | | |
AllianceBernstein Fixed-Income Shares,
Inc. – Government STIF Portfolio,
0.08%(c) (cost $4,475,071) | | | 4,475,071 | | | $ | 4,475,071 | |
| | | | | | | | |
| | |
Total Investments – 99.8%
(cost $242,514,045) | | | | | | | 252,878,320 | |
Other assets less liabilities – 0.2% | | | | | | | 623,833 | |
| | | | | | | | |
| | |
Net Assets – 100.0% | | | | | | $ | 253,502,153 | |
| | | | | | | | |
INTEREST RATE SWAP TRANSACTIONS (see Note D)
| | | | | | | | | | | | | | | | | | | | |
| | | | | | | | | Rate Type | | | | |
Swap
Counterparty | | Notional
Amount
(000) | | | Termination
Date | | | Payments
made
by the
Portfolio | | | Payments
received
by the
Portfolio | | | Unrealized
Appreciation/
(Depreciation) | |
Citibank | | $ | 7,000 | | | | 12/1/17 | | | | SIFMA | * | | | 3.792 | % | | $ | 1,049,614 | |
| * | | Variable interest rate based on the Securities Industry & Financial Markets Association (SIFMA) Municipal Swap Index. |
| (b) | | When-Issued or delayed delivery security. |
| (c) | | Investment in affiliated money market mutual fund. The rate shown represents the 7-day yield as of period end. |
As of September 30, 2011, the Portfolio held 16.0% of net assets in insured bonds (of this amount 0.0% represents the Portfolio’s holding in pre-refunded or escrowed to maturity bonds).
Glossary:
| AGM | | – Assured Guaranty Municipal |
| AMBAC | | – Ambac Assurance Corporation |
| CDA | | – Community Development Authority |
| CFD | | – Community Facilities District |
| EDA | | – Economic Development Agency |
| ETM | | – Escrowed to Maturity |
| FGIC | | – Financial Guaranty Insurance Company |
| HDA | | – Housing Development Authority |
| HFA | | – Housing Finance Authority |
| IDA | | – Industrial Development Authority/Agency |
| ISD | | – Independent School District |
| MFHR | | – Multi-Family Housing Revenue |
| NPFGC | | – National Public Finance Guarantee Corporation |
| PCR | | – Pollution Control Revenue Bond |
| SFMR | | – Single Family Mortgage Revenue |
| SRF | | – State Revolving Fund |
| SSA | | – Special Services Area |
See notes to financial statements.
| | |
| 80 | | • ALLIANCEBERNSTEIN MUNICIPAL INCOME FUND II |
Virginia Portfolio—Portfolio of Investments
STATEMENT OF ASSETS & LIABILITIES
September 30, 2011
| | | | | | | | |
| | | Arizona | | | Massachusetts | |
| Assets | | | | | | | | |
Investments in securities, at value | | | | | | | | |
Unaffiliated issuers (cost $165,423,781 and $258,223,706, respectively) | | $ | 169,304,817 | | | $ | 271,408,130 | |
Affiliated issuers (cost $0 and $466,280, respectively) | | | – 0 | – | | | 466,280 | |
Interest and dividends receivable | | | 2,226,383 | | | | 3,782,961 | |
Receivable for shares of beneficial interest sold | | | 569,604 | | | | 309,221 | |
Unrealized appreciation on interest rate swap contracts | | | 23,972 | | | | 2,012,523 | |
| | | | | | | | |
Total assets | | | 172,124,776 | | | | 277,979,115 | |
| | | | | | | | |
| Liabilities | | | | | | | | |
Due to custodian | | | 2,427,369 | | | | – 0 | – |
Unrealized depreciation on interest rate swap contracts | | | 249,564 | | | | – 0 | – |
Payable for shares of beneficial interest redeemed | | | 189,686 | | | | 361,442 | |
Dividends payable | | | 182,875 | | | | 263,037 | |
Distribution fee payable | | | 61,430 | | | | 104,445 | |
Advisory fee payable | | | 23,250 | | | | 81,627 | |
Administrative fee payable | | | 18,332 | | | | 15,750 | |
Transfer Agent fee payable | | | 1,885 | | | | 2,763 | |
Accrued expenses | | | 70,991 | | | | 71,024 | |
| | | | | | | | |
Total liabilities | | | 3,225,382 | | | | 900,088 | |
| | | | | | | | |
Net Assets | | $ | 168,899,394 | | | $ | 277,079,027 | |
| | | | | | | | |
| Composition of Net Assets | | | | | | | | |
Shares of beneficial interest, at par | | $ | 154,293 | | | $ | 245,793 | |
Additional paid-in capital | | | 166,083,520 | | | | 261,846,513 | |
Distributions in excess of net investment income | | | (183,725 | ) | | | (210,226 | ) |
Accumulated net realized loss on investment transactions | | | (810,138 | ) | | | – 0 | – |
Net unrealized appreciation on investments | | | 3,655,444 | | | | 15,196,947 | |
| | | | | | | | |
| | $ | 168,899,394 | | | $ | 277,079,027 | |
| | | | | | | | |
Net Asset Value Per Share—unlimited shares authorized, $.01 par value
| | | | | | | | | | | | |
| Arizona Portfolio | | Net Assets | | | Shares
Outstanding | | | Net Asset
Value | |
| Class A | | $ | 134,466,455 | | | | 12,279,968 | | | $ | 10.95 | * |
| |
| Class B | | $ | 2,329,693 | | | | 213,076 | | | $ | 10.93 | |
| |
| Class C | | $ | 32,103,246 | | | | 2,936,244 | | | $ | 10.93 | |
| |
| | |
| Massachusetts Portfolio | | | | | | | |
| Class A | | $ | 215,024,956 | | | | 19,066,819 | | | $ | 11.28 | * |
| |
| Class B | | $ | 3,085,913 | | | | 274,183 | | | $ | 11.25 | |
| |
| Class C | | $ | 58,968,158 | | | | 5,238,269 | | | $ | 11.26 | |
| |
| * | | The maximum offering price per share for Class A of Arizona Portfolio and Massachusetts Portfolio was $11.29 and $11.63, respectively, which reflects a sales charge of 3.00%. |
See notes to financial statements.
| | | | |
| ALLIANCEBERNSTEIN MUNICIPAL INCOME FUND II • | | | 81 | |
Statement of Assets & Liabilities
| | | | | | | | |
| | | Michigan | | | Minnesota | |
| Assets | | | | | | | | |
Investments in securities, at value | | | | | | | | |
Unaffiliated issuers (cost $89,072,970 and $104,499,566, respectively) | | $ | 92,138,252 | | | $ | 109,036,392 | |
Affiliated issuers (cost $1,825,046 and $0, respectively) | | | 1,825,046 | | | | – 0 | – |
Interest and dividends receivable | | | 1,538,960 | | | | 1,426,708 | |
Unrealized appreciation on interest rate swap contracts | | | 988,310 | | | | 523,166 | |
Receivable for shares of beneficial interest sold | | | 196,422 | | | | 61,447 | |
| | | | | | | | |
Total assets | | | 96,686,990 | | | | 111,047,713 | |
| | | | | | | | |
| Liabilities | | | | | | | | |
Due to custodian | | | – 0 | – | | | 2,689,844 | |
Payable for shares of beneficial interest redeemed | | | 125,304 | | | | 128,864 | |
Dividends payable | | | 96,879 | | | | 102,833 | |
Distribution fee payable | | | 41,322 | | | | 38,689 | |
Audit fee payable | | | 39,601 | | | | 39,602 | |
Advisory fee payable | | | 22,489 | | | | 20,620 | |
Administrative fee payable | | | 19,995 | | | | 16,498 | |
Transfer Agent fee payable | | | 2,455 | | | | 1,978 | |
Accrued expenses | | | 33,167 | | | | 25,492 | |
| | | | | | | | |
Total liabilities | | | 381,212 | | | | 3,064,420 | |
| | | | | | | | |
Net Assets | | $ | 96,305,778 | | | $ | 107,983,293 | |
| | | | | | | | |
| Composition of Net Assets | | | | | | | | |
Shares of beneficial interest, at par | | $ | 89,505 | | | $ | 104,340 | |
Additional paid-in capital | | | 92,273,879 | | | | 103,136,014 | |
Distributions in excess of net investment income | | | (157,594 | ) | | | (119,002 | ) |
Accumulated net realized gain (loss) on investment transactions | | | 46,396 | | | | (198,051 | ) |
Net unrealized appreciation on investments | | | 4,053,592 | | | | 5,059,992 | |
| | | | | | | | |
| | $ | 96,305,778 | | | $ | 107,983,293 | |
| | | | | | | | |
Net Asset Value Per Share—unlimited shares authorized, $.01 par value
| | | | | | | | | | | | |
| Michigan Portfolio | | Net Assets | | | Shares
Outstanding | | | Net Asset
Value | |
| Class A | | $ | 66,033,193 | | | | 6,134,167 | | | $ | 10.76 | * |
| |
| Class B | | $ | 1,459,620 | | | | 135,844 | | | $ | 10.74 | |
| |
| Class C | | $ | 28,812,965 | | | | 2,680,480 | | | $ | 10.75 | |
| |
| | |
| Minnesota Portfolio | | | | | | | |
| Class A | | $ | 86,704,966 | | | | 8,379,468 | | | $ | 10.35 | * |
| |
| Class B | | $ | 439,698 | | | | 42,498 | | | $ | 10.35 | |
| |
| Class C | | $ | 20,838,629 | | | | 2,012,064 | | | $ | 10.36 | |
| |
| * | | The maximum offering price per share for Class A of Michigan Portfolio and Minnesota Portfolio was $11.09 and $10.67, respectively, which reflects a sales charge of 3.00%. |
See notes to financial statements.
| | |
| 82 | | • ALLIANCEBERNSTEIN MUNICIPAL INCOME FUND II |
Statement of Assets & Liabilities
| | | | | | | | |
| | | New Jersey | | | Ohio | |
| Assets | | | | | | | | |
Investments in securities, at value | | | | | | | | |
Unaffiliated issuers (cost $146,036,267 and $145,485,184, respectively) | | $ | 151,177,253 | | | $ | 150,221,816 | |
Affiliated issuers (cost $2,549,512 and $0, respectively) | | | 2,549,512 | | | | – 0 | – |
Interest and dividends receivable | | | 2,014,281 | | | | 2,414,403 | |
Unrealized appreciation on interest rate swap contracts | | | 472,065 | | | | 538,113 | |
Receivable for shares of beneficial interest sold | | | 101,016 | | | | 188,286 | |
| | | | | | | | |
Total assets | | | 156,314,127 | | | | 153,362,618 | |
| | | | | | | | |
| Liabilities | | | | | | | | |
Due to custodian | | | – 0 | – | | | 1,850,855 | |
Payable for shares of beneficial interest redeemed | | | 289,485 | | | | 210,507 | |
Dividends payable | | | 160,684 | | | | 151,854 | |
Distribution fee payable | | | 60,420 | | | | 63,140 | |
Advisory fee payable | | | 46,004 | | | | 40,009 | |
Audit fee payable | | | 38,807 | | | | 38,990 | |
Administrative fee payable | | | 16,005 | | | | 15,844 | |
Transfer Agent fee payable | | | 2,500 | | | | 3,131 | |
Accrued expenses | | | 25,845 | | | | 30,675 | |
| | | | | | | | |
Total liabilities | | | 639,750 | | | | 2,405,005 | |
| | | | | | | | |
Net Assets | | $ | 155,674,377 | | | $ | 150,957,613 | |
| | | | | | | | |
| Composition of Net Assets | | | | | | | | |
Shares of beneficial interest, at par | | $ | 160,304 | | | $ | 147,923 | |
Additional paid-in capital | | | 151,335,340 | | | | 145,730,743 | |
Distributions in excess of net investment income | | | (183,981 | ) | | | (158,193 | ) |
Accumulated net realized loss on investment transactions | | | (1,250,337 | ) | | | (37,605 | ) |
Net unrealized appreciation on investments | | | 5,613,051 | | | | 5,274,745 | |
| | | | | | | | |
| | $ | 155,674,377 | | | $ | 150,957,613 | |
| | | | | | | | |
Net Asset Value Per Share—unlimited shares authorized, $.01 par value
| | | | | | | | | | | | |
| New Jersey Portfolio | | Net Assets | | | Shares
Outstanding | | | Net Asset
Value | |
| Class A | | $ | 118,468,400 | | | | 12,200,730 | | | $ | 9.71 | * |
| |
| Class B | | $ | 2,981,869 | | | | 307,027 | | | $ | 9.71 | |
| |
| Class C | | $ | 34,224,108 | | | | 3,522,638 | | | $ | 9.72 | |
| |
| | |
| Ohio Portfolio | | | | | | | |
| Class A | | $ | 106,355,988 | | | | 10,419,962 | | | $ | 10.21 | * |
| |
| Class B | | $ | 3,081,980 | | | | 302,285 | | | $ | 10.20 | |
| |
| Class C | | $ | 41,519,645 | | | | 4,070,005 | | | $ | 10.20 | |
| |
| * | | The maximum offering price per share for Class A of New Jersey Portfolio and Ohio Portfolio was $10.01 and $10.53, respectively, which reflects a sales charge of 3.00%. |
See notes to financial statements.
| | | | |
| ALLIANCEBERNSTEIN MUNICIPAL INCOME FUND II • | | | 83 | |
Statement of Assets & Liabilities
| | | | | | | | |
| | | Pennsylvania | | | Virginia | |
| Assets | | | | | | | | |
Investments in securities, at value | | | | | | | | |
Unaffiliated issuers (cost $119,163,399 and $238,038,974, respectively) | | $ | 122,750,294 | | | $ | 248,403,249 | |
Affiliated issuers (cost $6,138,238 and $4,475,071, respectively) | | | 6,138,238 | | | | 4,475,071 | |
Interest and dividends receivable | | | 1,699,852 | | | | 3,271,511 | |
Receivable for shares of beneficial interest sold | | | 57,590 | | | | 297,685 | |
Unrealized appreciation on interest rate swap contracts | | | – 0 | – | | | 1,049,614 | |
| | | | | | | | |
Total assets | | | 130,645,974 | | | | 257,497,130 | |
| | | | | | | | |
| Liabilities | | | | | | | | |
Dividends payable | | | 118,106 | | | | 241,888 | |
Payable for shares of beneficial interest redeemed | | | 55,435 | | | | 151,667 | |
Advisory fee payable | | | 55,083 | | | | 56,323 | |
Distribution fee payable | | | 48,740 | | | | 98,790 | |
Audit fee payable | | | 38,697 | | | | 37,252 | |
Administrative fee payable | | | 16,115 | | | | 15,761 | |
Transfer Agent fee payable | | | 2,947 | | | | 13,453 | |
Payable for investment securities purchased | | | – 0 | – | | | 3,350,720 | |
Accrued expenses | | | 21,326 | | | | 29,123 | |
| | | | | | | | |
Total liabilities | | | 356,449 | | | | 3,994,977 | |
| | | | | | | | |
Net Assets | | $ | 130,289,525 | | | $ | 253,502,153 | |
| | | | | | | | |
| Composition of Net Assets | | | | | | | | |
Shares of beneficial interest, at par | | $ | 124,861 | | | $ | 228,184 | |
Additional paid-in capital | | | 126,594,753 | | | | 240,979,271 | |
Distributions in excess of net investment income | | | (118,106 | ) | | | (20,929 | ) |
Accumulated net realized gain on investment transactions | | | 101,122 | | | | 901,738 | |
Net unrealized appreciation on investments | | | 3,586,895 | | | | 11,413,889 | |
| | | | | | | | |
| | $ | 130,289,525 | | | $ | 253,502,153 | |
| | | | | | | | |
Net Asset Value Per Share—unlimited shares authorized, $.01 par value
| | | | | | | | | | | | |
| Pennsylvania Portfolio | | Net Assets | | | Shares
Outstanding | | | Net Asset
Value | |
| Class A | | $ | 101,431,741 | | | | 9,720,736 | | | $ | 10.43 | * |
| |
| Class B | | $ | 3,163,964 | | | | 303,227 | | | $ | 10.43 | |
| |
| Class C | | $ | 25,693,820 | | | | 2,462,173 | | | $ | 10.44 | |
| |
| | |
| Virginia Portfolio | | | | | | | |
| Class A | | $ | 189,325,803 | | | | 17,030,962 | | | $ | 11.12 | * |
| |
| Class B | | $ | 3,132,648 | | | | 282,290 | | | $ | 11.10 | |
| |
| Class C | | $ | 61,043,702 | | | | 5,505,141 | | | $ | 11.09 | |
| |
| * | | The maximum offering price per share for Class A of Pennsylvania Portfolio and Virginia Portfolio was $10.75 and $11.46, respectively, which reflects a sales charge of 3.00%. |
See notes to financial statements.
| | |
| 84 | | • ALLIANCEBERNSTEIN MUNICIPAL INCOME FUND II |
Statement of Assets & Liabilities
STATEMENT OF OPERATIONS
Year Ended September 30, 2011
| | | | | | | | |
| | | Arizona | | | Massachusetts | |
| Investment Income | | | | | | | | |
Interest | | $ | 8,920,963 | | | $ | 11,562,412 | |
Dividends – Affiliated issuers | | | 224 | | | | 997 | |
| | | | | | | | |
Total income | | | 8,921,187 | | | | 11,563,409 | |
| | | | | | | | |
| Expenses | | | | | | | | |
Advisory fee (see Note B) | | | 803,098 | | | | 1,202,320 | |
Distribution fee – Class A | | | 424,812 | | | | 611,238 | |
Distribution fee – Class B | | | 33,642 | | | | 37,195 | |
Distribution fee – Class C | | | 334,979 | | | | 597,167 | |
Transfer agency – Class A | | | 51,319 | | | | 68,773 | |
Transfer agency – Class B | | | 1,869 | | | | 1,935 | |
Transfer agency – Class C | | | 13,554 | | | | 22,455 | |
Custodian | | | 112,152 | | | | 101,993 | |
Administrative | | | 67,247 | | | | 68,249 | |
Audit | | | 38,663 | | �� | | 38,394 | |
Legal | | | 31,690 | | | | 32,562 | |
Printing | | | 17,917 | | | | 26,976 | |
Registration fees | | | 11,898 | | | | 2,747 | |
Trustees’ fees | | | 6,583 | | | | 8,268 | |
Miscellaneous | | | 8,253 | | | | 11,153 | |
| | | | | | | | |
Total expenses | | | 1,957,676 | | | | 2,831,425 | |
Less: expenses waived and reimbursed by the Adviser (see Note B) | | | (307,606 | ) | | | (196,478 | ) |
| | | | | | | | |
Net expenses | | | 1,650,070 | | | | 2,634,947 | |
| | | | | | | | |
Net investment income | | | 7,271,117 | | | | 8,928,462 | |
| | | | | | | | |
| Realized and Unrealized Gain (Loss) on Investment Transactions | | | | | | | | |
Net realized gain (loss) on: | | | | | | | | |
Investment transactions | | | (800,663 | ) | | | 492,421 | |
Swap contracts | | | 9,429 | | | | 483,481 | |
Net change in unrealized appreciation/depreciation of: | | | | | | | | |
Investments | | | (2,544,133 | ) | | | (897,518 | ) |
Swap contracts | | | (107,203 | ) | | | 68,293 | |
| | | | | | | | |
Net gain (loss) on investment transactions | | | (3,442,570 | ) | | | 146,677 | |
| | | | | | | | |
Net Increase in Net Assets from Operations | | $ | 3,828,547 | | | $ | 9,075,139 | |
| | | | | | | | |
See notes to financial statements.
| | | | |
| ALLIANCEBERNSTEIN MUNICIPAL INCOME FUND II • | | | 85 | |
Statement of Operations
| | | | | | | | |
| | | Michigan | | | Minnesota | |
| Investment Income | | | | | | | | |
Interest | | $ | 4,839,327 | | | $ | 5,010,298 | |
Dividends – Affiliated issuers | | | 310 | | | | – 0 | – |
| | | | | | | | |
Total income | | | 4,839,637 | | | | 5,010,298 | |
| | | | | | | | |
| Expenses | | | | | | | | |
Advisory fee (see Note B) | | | 448,365 | | | | 514,127 | |
Distribution fee – Class A | | | 198,909 | | | | 279,631 | |
Distribution fee – Class B | | | 22,336 | | | | 5,078 | |
Distribution fee – Class C | | | 311,001 | | | | 205,321 | |
Transfer agency – Class A | | | 37,855 | | | | 40,175 | |
Transfer agency – Class B | | | 1,757 | | | | 1,123 | |
Transfer agency – Class C | | | 19,073 | | | | 9,833 | |
Custodian | | | 91,992 | | | | 98,516 | |
Administrative | | | 71,030 | | | | 64,221 | |
Audit | | | 40,065 | | | | 39,270 | |
Legal | | | 39,035 | | | | 31,289 | |
Printing | | | 20,205 | | | | 17,761 | |
Trustees’ fees | | | 5,646 | | | | 6,933 | |
Registration fees | | | 4,955 | | | | 339 | |
Miscellaneous | | | 4,400 | | | | 6,401 | |
| | | | | | | | |
Total expenses | | | 1,316,624 | | | | 1,320,018 | |
Less: expenses waived and reimbursed by the Adviser (see Note B) | | | (76,958 | ) | | | (144,485 | ) |
| | | | | | | | |
Net expenses | | | 1,239,666 | | | | 1,175,533 | |
| | | | | | | | |
Net investment income | | | 3,599,971 | | | | 3,834,765 | |
| | | | | | | | |
| Realized and Unrealized Gain (Loss) on Investment Transactions | | | | | | | | |
Net realized gain (loss) on: | | | | | | | | |
Investment transactions | | | 126,579 | | | | (31,537 | ) |
Swap contracts | | | 241,368 | | | | 134,134 | |
Net change in unrealized appreciation/depreciation of: | | | | | | | | |
Investments | | | (1,711,230 | ) | | | (955,138 | ) |
Swap contracts | | | (12,056 | ) | | | (8,264 | ) |
| | | | | | | | |
Net loss on investment transactions | | | (1,355,339 | ) | | | (860,805 | ) |
| | | | | | | | |
Net Increase in Net Assets from Operations | | $ | 2,244,632 | | | $ | 2,973,960 | |
| | | | | | | | |
See notes to financial statements.
| | |
| 86 | | • ALLIANCEBERNSTEIN MUNICIPAL INCOME FUND II |
Statement of Operations
| | | | | | | | |
| | | New Jersey | | | Ohio | |
| Investment Income | | | | | | | | |
Interest | | $ | 7,827,891 | | | $ | 7,106,593 | |
Dividends – Affiliated issuers | | | 955 | | | | 416 | |
| | | | | | | | |
Total income | | | 7,828,846 | | | | 7,107,009 | |
| | | | | | | | |
| Expenses | | | | | | | | |
Advisory fee (see Note B) | | | 710,652 | | | | 710,865 | |
Distribution fee – Class A | | | 356,330 | | | | 335,722 | |
Distribution fee – Class B | | | 36,661 | | | | 38,336 | |
Distribution fee – Class C | | | 354,800 | | | | 422,291 | |
Transfer agency – Class A | | | 49,991 | | | | 52,780 | |
Transfer agency – Class B | | | 2,174 | | | | 2,688 | |
Transfer agency – Class C | | | 16,241 | | | | 21,812 | |
Custodian | | | 95,888 | | | | 86,333 | |
Administrative | | | 66,639 | | | | 64,166 | |
Audit | | | 39,458 | | | | 36,894 | |
Legal | | | 30,611 | | | | 33,288 | |
Printing | | | 25,018 | | | | 22,561 | |
Trustees’ fees | | | 6,719 | | | | 6,530 | |
Registration fees | | | 1,525 | | | | – 0 | – |
Miscellaneous | | | 7,787 | | | | 7,520 | |
| | | | | | | | |
Total expenses | | | 1,800,494 | | | | 1,841,786 | |
Less: expenses waived and reimbursed by the Adviser (see Note B) | | | (152,544 | ) | | | (176,601 | ) |
| | | | | | | | |
Net expenses | | | 1,647,950 | | | | 1,665,185 | |
| | | | | | | | |
Net investment income | | | 6,180,896 | | | | 5,441,824 | |
| | | | | | | | |
| Realized and Unrealized Gain (Loss) on Investment Transactions | | | | | | | | |
Net realized gain (loss) on: | | | | | | | | |
Investment transactions | | | (52,657 | ) | | | 368,584 | |
Swap contracts | | | 116,506 | | | | 137,967 | |
Net change in unrealized appreciation/depreciation of: | | | | | | | | |
Investments | | | (2,384,248 | ) | | | (1,411,858 | ) |
Swap contracts | | | (3,780 | ) | | | (8,500 | ) |
| | | | | | | | |
Net loss on investment transactions | | | (2,324,179 | ) | | | (913,807 | ) |
| | | | | | | | |
Net Increase in Net Assets from Operations | | $ | 3,856,717 | | | $ | 4,528,017 | |
| | | | | | | | |
See notes to financial statements.
| | | | |
| ALLIANCEBERNSTEIN MUNICIPAL INCOME FUND II • | | | 87 | |
Statement of Operations
| | | | | | | | |
| | | Pennsylvania | | | Virginia | |
| Investment Income | | | | | | | | |
Interest | | $ | 6,284,211 | | | $ | 11,162,667 | |
Dividends – Affiliated issuers | | | 434 | | | | 1,236 | |
| | | | | | | | |
Total income | | | 6,284,645 | | | | 11,163,903 | |
| | | | | | | | |
| Expenses | | | | | | | | |
Advisory fee (see Note B) | | | 583,709 | | | | 1,102,338 | |
Distribution fee – Class A | | | 300,809 | | | | 553,111 | |
Distribution fee – Class B | | | 36,166 | | | | 37,016 | |
Distribution fee – Class C | | | 258,267 | | | | 568,919 | |
Transfer agency – Class A | | | 48,846 | | | | 79,713 | |
Transfer agency – Class B | | | 2,491 | | | | 2,284 | |
Transfer agency – Class C | | | 14,040 | | | | 27,035 | |
Custodian | | | 99,191 | | | | 113,851 | |
Administrative | | | 69,932 | | | | 57,371 | |
Audit | | | 38,132 | | | | 36,017 | |
Legal | | | 31,983 | | | | 32,514 | |
Printing | | | 14,607 | | | | 21,581 | |
Trustees’ fees | | | 6,650 | | | | 8,261 | |
Registration fees | | | 402 | | | | 1,729 | |
Miscellaneous | | | 6,560 | | | | 10,956 | |
| | | | | | | | |
Total expenses | | | 1,511,785 | | | | 2,652,696 | |
Less: expenses waived and reimbursed by the Adviser (see Note B) | | | (73,408 | ) | | | (464,802 | ) |
| | | | | | | | |
Net expenses | | | 1,438,377 | | | | 2,187,894 | |
| | | | | | | | |
Net investment income | | | 4,846,268 | | | | 8,976,009 | |
| | | | | | | | |
| Realized and Unrealized Gain (Loss) on Investment Transactions | | | | | | | | |
Net realized gain on: | | | | | | | | |
Investment transactions | | | 138,042 | | | | 1,310,897 | |
Swap contracts | | | – 0 | – | | | 249,319 | |
Net change in unrealized appreciation/depreciation of: | | | | | | | | |
Investments | | | (637,837 | ) | | | (745,509 | ) |
Swap contracts | | | – 0 | – | | | 68,435 | |
| | | | | | | | |
Net gain (loss) on investment transactions | | | (499,795 | ) | | | 883,142 | |
| | | | | | | | |
Net Increase in Net Assets from Operations | | $ | 4,346,473 | | | $ | 9,859,151 | |
| | | | | | | | |
See notes to financial statements.
| | |
| 88 | | • ALLIANCEBERNSTEIN MUNICIPAL INCOME FUND II |
Statement of Operations
STATEMENT OF CHANGES IN NET ASSETS
| | | | | | | | |
| | | Arizona | |
| | | Year Ended
September 30,
2011 | | | Year Ended
September 30,
2010 | |
| Increase (Decrease) in Net Assets from Operations | | | | | | | | |
Net investment income | | $ | 7,271,117 | | | $ | 7,973,641 | |
Net realized gain (loss) on investment transactions | | | (791,234 | ) | | | 1,647,939 | |
Net change in unrealized appreciation/depreciation of investments | | | (2,651,336 | ) | | | 751,868 | |
| | | | | | | | |
Net increase in net assets from operations | | | 3,828,547 | | | | 10,373,448 | |
| Dividends and Distributions to Shareholders from | | | | | | | | |
Net investment income | | | | | | | | |
Class A | | | (5,978,658 | ) | | | (6,568,155 | ) |
Class B | | | (118,923 | ) | | | (197,295 | ) |
Class C | | | (1,182,875 | ) | | | (1,217,537 | ) |
Net realized gain on investment transactions | | | | | | | | |
Class A | | | (1,155,566 | ) | | | – 0 | – |
Class B | | | (31,404 | ) | | | – 0 | – |
Class C | | | (279,810 | ) | | | – 0 | – |
| Transactions in Shares of Beneficial Interest | | | | | | | | |
Net decrease | | | (27,713,514 | ) | | | (15,939,948 | ) |
| | | | | | | | |
Total decrease | | | (32,632,203 | ) | | | (13,549,487 | ) |
| Net Assets | | | | | | | | |
Beginning of period | | | 201,531,597 | | | | 215,081,084 | |
| | | | | | | | |
End of period (including distributions in excess of net investment income of ($183,725) and ($203,403), respectively) | | $ | 168,899,394 | | | $ | 201,531,597 | |
| | | | | | | | |
See notes to financial statements.
| | | | |
| ALLIANCEBERNSTEIN MUNICIPAL INCOME FUND II • | | | 89 | |
Statement of Changes in Net Assets
| | | | | | | | |
| | | Massachusetts | |
| | | Year Ended
September 30,
2011 | | | Year Ended
September 30,
2010 | |
| Increase (Decrease) in Net Assets from Operations | | | | | | | | |
Net investment income | | $ | 8,928,462 | | | $ | 7,852,471 | |
Net realized gain on investment transactions | | | 975,902 | | | | 949,252 | |
Net change in unrealized appreciation/depreciation of investments | | | (829,225 | ) | | | 5,300,208 | |
| | | | | | | | |
Net increase in net assets from operations | | | 9,075,139 | | | | 14,101,931 | |
| Dividends to Shareholders from | | | | | | | | |
Net investment income | | | | | | | | |
Class A | | | (7,514,190 | ) | | | (6,473,211 | ) |
Class B | | | (111,204 | ) | | | (189,623 | ) |
Class C | | | (1,787,876 | ) | | | (1,670,937 | ) |
| Transactions in Shares of Beneficial Interest | | | | | | | | |
Net increase | | | 15,254,150 | | | | 44,917,091 | |
| | | | | | | | |
Total increase | | | 14,916,019 | | | | 50,685,251 | |
| Net Assets | | | | | | | | |
Beginning of period | | | 262,163,008 | | | | 211,477,757 | |
| | | | | | | | |
End of period (including distributions in excess of net investment income of ($210,226) and ($208,899), respectively) | | $ | 277,079,027 | | | $ | 262,163,008 | |
| | | | | | | | |
See notes to financial statements.
| | |
| 90 | | • ALLIANCEBERNSTEIN MUNICIPAL INCOME FUND II |
Statement of Changes in Net Assets
| | | | | | | | |
| | | Michigan | |
| | | Year Ended
September 30,
2011 | | | Year Ended
September 30,
2010 | |
| Increase (Decrease) in Net Assets from Operations | | | | | | | | |
Net investment income | | $ | 3,599,971 | | | $ | 3,822,924 | |
Net realized gain on investment transactions | | | 367,947 | | | | 869,145 | |
Net change in unrealized appreciation/depreciation of investments | | | (1,723,286 | ) | | | 290,042 | |
Contributions from Adviser (see Note B) | | | – 0 | – | | | 1,157 | |
| | | | | | | | |
Net increase in net assets from operations | | | 2,244,632 | | | | 4,983,268 | |
| Dividends to Shareholders from | | | | | | | | |
Net investment income | | | | | | | | |
Class A | | | (2,709,612 | ) | | | (2,822,665 | ) |
Class B | | | (76,047 | ) | | | (134,203 | ) |
Class C | | | (1,056,388 | ) | | | (1,107,126 | ) |
| Transactions in Shares of Beneficial Interest | | | | | | | | |
Net decrease | | | (14,553,984 | ) | | | (3,590,276 | ) |
| | | | | | | | |
Total decrease | | | (16,151,399 | ) | | | (2,671,002 | ) |
| Net Assets | | | | | | | | |
Beginning of period | | | 112,457,177 | | | | 115,128,179 | |
| | | | | | | | |
End of period (including distributions in excess of net investment income of ($157,594) and ($164,668), respectively) | | $ | 96,305,778 | | | $ | 112,457,177 | |
| | | | | | | | |
See notes to financial statements.
| | | | |
| ALLIANCEBERNSTEIN MUNICIPAL INCOME FUND II • | | | 91 | |
Statement of Changes in Net Assets
| | | | | | | | |
| | | Minnesota | |
| | | Year Ended
September 30,
2011 | | | Year Ended
September 30,
2010 | |
| Increase (Decrease) in Net Assets from Operations | | | | | | | | |
Net investment income | | $ | 3,834,765 | | | $ | 3,621,539 | |
Net realized gain on investment transactions | | | 102,597 | | | | 592,091 | |
Net change in unrealized appreciation/depreciation of investments | | | (963,402 | ) | | | 1,873,515 | |
| | | | | | | | |
Net increase in net assets from operations | | | 2,973,960 | | | | 6,087,145 | |
| Dividends to Shareholders from | | | | | | | | |
Net investment income | | | | | | | | |
Class A | | | (3,358,188 | ) | | | (3,243,863 | ) |
Class B | | | (14,674 | ) | | | (25,137 | ) |
Class C | | | (596,662 | ) | | | (486,245 | ) |
| Transactions in Shares of Beneficial Interest | | | | | | | | |
Net increase (decrease) | | | (21,143,071 | ) | | | 13,980,259 | |
| | | | | | | | |
Total increase (decrease) | | | (22,138,635 | ) | | | 16,312,159 | |
| Net Assets | | | | | | | | |
Beginning of period | | | 130,121,928 | | | | 113,809,769 | |
| | | | | | | | |
End of period (including distributions in excess of net investment income of ($119,002) and ($118,377), respectively) | | $ | 107,983,293 | | | $ | 130,121,928 | |
| | | | | | | | |
See notes to financial statements.
| | |
| 92 | | • ALLIANCEBERNSTEIN MUNICIPAL INCOME FUND II |
Statement of Changes in Net Assets
| | | | | | | | |
| | | New Jersey | |
| | | Year Ended
September 30,
2011 | | | Year Ended
September 30,
2010 | |
| Increase (Decrease) in Net Assets from Operations | | | | | | | | |
Net investment income | | $ | 6,180,896 | | | $ | 6,737,707 | |
Net realized gain on investment transactions | | | 63,849 | | | | 607,860 | |
Net change in unrealized appreciation/depreciation of investments | | | (2,388,028 | ) | | | 4,213,895 | |
| | | | | | | | |
Net increase in net assets from operations | | | 3,856,717 | | | | 11,559,462 | |
| Dividends to Shareholders from | | | | | | | | |
Net investment income | | | | | | | | |
Class A | | | (4,942,954 | ) | | | (5,370,090 | ) |
Class B | | | (127,010 | ) | | | (218,264 | ) |
Class C | | | (1,228,157 | ) | | | (1,265,622 | ) |
| Transactions in Shares of Beneficial Interest | | | | | | | | |
Net decrease | | | (14,605,208 | ) | | | (6,217,459 | ) |
| | | | | | | | |
Total decrease | | | (17,046,612 | ) | | | (1,511,973 | ) |
| Net Assets | | | | | | | | |
Beginning of period | | | 172,720,989 | | | | 174,232,962 | |
| | | | | | | | |
End of period (including distributions in excess of net investment income of ($183,981) and ($188,656), respectively) | | $ | 155,674,377 | | | $ | 172,720,989 | |
| | | | | | | | |
See notes to financial statements.
| | | | |
| ALLIANCEBERNSTEIN MUNICIPAL INCOME FUND II • | | | 93 | |
Statement of Changes in Net Assets
| | | | | | | | |
| | | Ohio | |
| | | Year Ended
September 30,
2011 | | | Year Ended
September 30,
2010 | |
| Increase (Decrease) in Net Assets from Operations | | | | | | | | |
Net investment income | | $ | 5,441,824 | | | $ | 5,743,939 | |
Net realized gain on investment transactions | | | 506,551 | | | | 141,859 | |
Net change in unrealized appreciation/depreciation of investments | | | (1,420,358 | ) | | | 1,634,755 | |
| | | | | | | | |
Net increase in net assets from operations | | | 4,528,017 | | | | 7,520,553 | |
| Dividends to Shareholders from | | | | | | | | |
Net investment income | | | | | | | | |
Class A | | | (4,178,197 | ) | | | (4,382,740 | ) |
Class B | | | (116,083 | ) | | | (198,677 | ) |
Class C | | | (1,286,153 | ) | | | (1,299,339 | ) |
| Transactions in Shares of Beneficial Interest | | | | | | | | |
Net increase (decrease) | | | (17,955,231 | ) | | | 6,922,334 | |
| | | | | | | | |
Total increase (decrease) | | | (19,007,647 | ) | | | 8,562,131 | |
| Net Assets | | | | | | | | |
Beginning of period | | | 169,965,260 | | | | 161,403,129 | |
| | | | | | | | |
End of period (including distributions in excess of net investment income of ($158,193) and ($157,551), respectively) | | $ | 150,957,613 | | | $ | 169,965,260 | |
| | | | | | | | |
See notes to financial statements.
| | |
| 94 | | • ALLIANCEBERNSTEIN MUNICIPAL INCOME FUND II |
Statement of Changes in Net Assets
| | | | | | | | |
| | | Pennsylvania | |
| | | Year Ended
September 30,
2011 | | | Year Ended
September 30,
2010 | |
| Increase (Decrease) in Net Assets from Operations | | | | | | | | |
Net investment income | | $ | 4,846,268 | | | $ | 5,046,803 | |
Net realized gain on investment transactions | | | 138,042 | | | | 1,736,393 | |
Net change in unrealized appreciation/depreciation of investments | | | (637,837 | ) | | | 1,721,119 | |
| | | | | | | | |
Net increase in net assets from operations | | | 4,346,473 | | | | 8,504,315 | |
| Dividends and Distributions to Shareholders from | | | | | | | | |
Net investment income | | | | | | | | |
Class A | | | (3,905,732 | ) | | | (3,975,845 | ) |
Class B | | | (115,528 | ) | | | (181,793 | ) |
Class C | | | (825,008 | ) | | | (889,165 | ) |
Net realized gain on investment transactions | | | | | | | | |
Class A | | | (924,127 | ) | | | – 0 | – |
Class B | | | (37,512 | ) | | | – 0 | – |
Class C | | | (244,880 | ) | | | – 0 | – |
| Transactions in Shares of Beneficial Interest | | | | | | | | |
Net decrease | | | (6,245,321 | ) | | | (3,957,873 | ) |
| | | | | | | | |
Total decrease | | | (7,951,635 | ) | | | (500,361 | ) |
| Net Assets | | | | | | | | |
Beginning of period | | | 138,241,160 | | | | 138,741,521 | |
| | | | | | | | |
End of period (including distributions in excess of net investment income of ($118,106) and ($129,554), respectively) | | $ | 130,289,525 | | | $ | 138,241,160 | |
| | | | | | | | |
See notes to financial statements.
| | | | |
| ALLIANCEBERNSTEIN MUNICIPAL INCOME FUND II • | | | 95 | |
Statement of Changes in Net Assets
| | | | | | | | |
| | | Virginia | |
| | | Year Ended
September 30,
2011 | | | Year Ended
September 30,
2010 | |
| Increase (Decrease) in Net Assets from Operations | | | | | | | | |
Net investment income | | $ | 8,976,009 | | | $ | 8,594,035 | |
Net realized gain on investment transactions | | | 1,560,216 | | | | 1,325,638 | |
Net change in unrealized appreciation/depreciation of investments | | | (677,074 | ) | | | 4,650,756 | |
| | | | | | | | |
Net increase in net assets from operations | | | 9,859,151 | | | | 14,570,429 | |
| Dividends and Distributions to Shareholders from | | | | | | | | |
Net investment income | | | | | | | | |
Class A | | | (7,259,112 | ) | | | (7,033,665 | ) |
Class B | | | (120,307 | ) | | | (174,112 | ) |
Class C | | | (1,846,560 | ) | | | (1,633,548 | ) |
Net realized gain on investment transactions | | | | | | | | |
Class A | | | (413,890 | ) | | | – 0 | – |
Class B | | | (9,397 | ) | | | – 0 | – |
Class C | | | (129,670 | ) | | | – 0 | – |
| Transactions in Shares of Beneficial Interest | | | | | | | | |
Net increase (decrease) | | | (15,691,486 | ) | | | 29,257,496 | |
| | | | | | | | |
Total increase (decrease) | | | (15,611,271 | ) | | | 34,986,600 | |
| Net Assets | | | | | | | | |
Beginning of period | | | 269,113,424 | | | | 234,126,824 | |
| | | | | | | | |
End of period (including distributions in excess of net investment income of ($20,929) and undistributed net investment income of $114,894, respectively) | | $ | 253,502,153 | | | $ | 269,113,424 | |
| | | | | | | | |
See notes to financial statements.
| | |
| 96 | | • ALLIANCEBERNSTEIN MUNICIPAL INCOME FUND II |
Statement of Changes in Net Assets
NOTES TO FINANCIAL STATEMENTS
September 30, 2011
NOTE A
Significant Accounting Policies
AllianceBernstein Municipal Income Fund II (the “Fund”) which is a Massachusetts Business Trust, is registered under the Investment Company Act of 1940, as a diversified, open-end management investment company. The Fund operates as a series company currently comprised of eight portfolios: Arizona Portfolio, Massachusetts Portfolio, Michigan Portfolio, Minnesota Portfolio, New Jersey Portfolio, Ohio Portfolio, Pennsylvania Portfolio and Virginia Portfolio (the “Portfolios”). Each series is considered to be a separate entity for financial reporting and tax purposes. Each Portfolio offers Class A, Class B and Class C shares. Class A shares are sold with a front-end sales charge of up to 3% for purchases up to $500,000; purchases of $500,000 or more are not subject to a sales charge. With respect to purchases of $500,000 or more, Class A shares redeemed within one year of purchase may be subject to a contingent deferred sales charge of 1%. Class B shares are currently sold with a contingent deferred sales charge which declines from 3% to zero depending on the period of time the shares are held. Effective January 31, 2009, sales of Class B shares of the Portfolio to new investors were suspended. Class B shares will only be issued (i) upon the exchange of Class B shares from another AllianceBernstein Mutual Fund, (ii) for purposes of dividend reinvestment, (iii) through the Portfolios’ Automatic Investment Program (the “Program”) for accounts that established the Program prior to January 31, 2009, and (iv) for purchases of additional shares by Class B shareholders as of January 31, 2009. The ability to establish a new Program for accounts containing Class B shares was suspended as of January 31, 2009. Class B shares will automatically convert to Class A shares six years after the end of the calendar month of purchase. Class C shares are subject to a contingent deferred sales charge of 1% on redemptions made within the first year after purchase. All three classes of shares have identical voting, dividend, liquidation and other rights, except that the classes bear different distribution and transfer agency expenses. Each class has exclusive voting rights with respect to its distribution plan. The financial statements have been prepared in conformity with U.S. generally accepted accounting principles (“U.S. GAAP”) which require management to make certain estimates and assumptions that affect the reported amounts of assets and liabilities in the financial statements and amounts of income and expenses during the reporting period. Actual results could differ from those estimates. The following is a summary of significant accounting policies followed by the Portfolios.
1. Security Valuation
Portfolio securities are valued at their current market value determined on the basis of market quotations or, if market quotations are not readily available or are deemed unreliable, at “fair value” as determined in accordance with procedures established by and under the general supervision of the Fund’s Board of Trustees.
| | | | |
| ALLIANCEBERNSTEIN MUNICIPAL INCOME FUND II • | | | 97 | |
Notes to Financial Statements
In general, the market value of securities which are readily available and deemed reliable are determined as follows: Securities listed on a national securities exchange (other than securities listed on the NASDAQ Stock Market, Inc. (“NASDAQ”)) or on a foreign securities exchange are valued at the last sale price at the close of the exchange or foreign securities exchange. If there has been no sale on such day, the securities are valued at the mean of the closing bid and ask prices on such day. Securities listed on more than one exchange are valued by reference to the principal exchange on which the securities are traded; securities listed only on NASDAQ are valued in accordance with the NASDAQ Official Closing Price; listed or over the counter market (“OTC”) put or call options are valued at the mid level between the current bid and ask prices. If either a current bid or current ask price is unavailable, AllianceBernstein L.P. (the “Adviser”) will have discretion to determine the best valuation (e.g. last trade price); open futures contracts are valued using the closing settlement price or, in the absence of such a price, the most recent quoted bid price. If there are no quotations available for the day of valuation, the last available closing settlement price is used; U.S. government securities and other debt instruments having 60 days or less remaining until maturity are valued at amortized cost if their original maturity was 60 days or less; or by amortizing their fair value as of the 61st day prior to maturity if their original term to maturity exceeded 60 days; fixed-income securities, including mortgage backed and asset backed securities, may be valued on the basis of prices provided by a pricing service or at a price obtained from one or more of the major broker/dealers. In cases where broker/dealer quotes are obtained, the Adviser may establish procedures whereby changes in market yields or spreads are used to adjust, on a daily basis, a recently obtained quoted price on a security; and OTC and other derivatives are valued using the Adviser’s pricing models which utilize pricing-related information from external sources. Investments in money market funds are valued at their net asset value each day.
Securities for which market quotations are not readily available (including restricted securities) or are deemed unreliable are valued at fair value. Factors considered in making this determination may include, but are not limited to, information obtained by contacting the issuer, analysts, analysis of the issuer’s financial statements or other available documents. In addition, the Portfolios may use fair value pricing for securities primarily traded in non-U.S. markets because most foreign markets close well before the Portfolios value their securities at 4:00 p.m., Eastern Time. The earlier close of these foreign markets gives rise to the possibility that significant events, including broad market moves, may have occurred in the interim and may materially affect the value of those securities.
2. Fair Value Measurements
In accordance with U.S. GAAP regarding fair value measurements, fair value is defined as the price that the Portfolios would receive to sell an asset or pay to transfer a liability in an orderly transaction between market participants at the
| | |
| 98 | | • ALLIANCEBERNSTEIN MUNICIPAL INCOME FUND II |
Notes to Financial Statements
measurement date. The U.S. GAAP disclosure requirements establish a framework for measuring fair value, and a three-level hierarchy for fair value measurements based upon the transparency of inputs to the valuation of an asset or liability. Inputs may be observable or unobservable and refer broadly to the assumptions that market participants would use in pricing the asset or liability. Observable inputs reflect the assumptions market participants would use in pricing the asset or liability based on market data obtained from sources independent of the Portfolios. Unobservable inputs reflect the Portfolios’ own assumptions about the assumptions that market participants would use in pricing the asset or liability based on the best information available in the circumstances. Each investment is assigned a level based upon the observability of the inputs which are significant to the overall valuation. The three-tier hierarchy of inputs is summarized below.
| | • | | Level 1—quoted prices in active markets for identical investments |
| | • | | Level 2—other significant observable inputs (including quoted prices for similar investments, interest rates, prepayment speeds, credit risk, etc.) |
| | • | | Level 3—significant unobservable inputs (including the Portfolios’ own assumptions in determining the fair value of investments) |
The following tables summarize the valuation of the Portfolios’ investments by the above fair value hierarchy levels as of September 30, 2011:
| | | | | | | | | | | | | | | | |
| Arizona Portfolio | | | | | | | | | | |
Investments in
Securities: | | Level 1 | | | Level 2 | | | Level 3 | | | Total | |
Assets: | | | | | | | | | | | | | | | | |
Long-Term Municipal Bonds | | $ | – 0 | – | | $ | 169,304,817 | | | $ | – 0 | – | | $ | 169,304,817 | |
| | | | | | | | | | | | | | | | |
Total Investments in Securities | | | – 0 | – | | | 169,304,817 | | | | – 0 | – | | | 169,304,817 | |
Other Financial Instruments*: | | | | | | | | | | | | | | | | |
Assets: | | | | | | | | | | | | | | | | |
Interest Rate Swap Contracts | | | – 0 | – | | | – 0 | – | | | 23,972 | | | | 23,972 | |
Liabilities: | | | | | | | | | | | | | | | | |
Interest Rate Swap Contracts | | | – 0 | – | | | – 0 | – | | | (249,564 | ) | | | (249,564 | ) |
| | | | | | | | | | | | | | | | |
Total | | $ | – 0 | – | | $ | 169,304,817 | | | $ | (225,592 | ) | | $ | 169,079,225 | |
| | | | | | | | | | | | | | | | |
| | | | |
| ALLIANCEBERNSTEIN MUNICIPAL INCOME FUND II • | | | 99 | |
Notes to Financial Statements
| | | | | | | | | | | | | | | | |
| Massachusetts Portfolio | | | | | | | | | | |
Investments in
Securities: | | Level 1 | | | Level 2 | | | Level 3 | | | Total | |
Assets: | | | | | | | | | | | | | | | | |
Long-Term Municipal Bonds | | $ | – 0 | – | | $ | 271,408,130 | | | $ | – 0 | – | | $ | 271,408,130 | |
Short-Term Investments | | | 466,280 | | | | – 0 | – | | | – 0 | – | | | 466,280 | |
| | | | | | | | | | | | | | | | |
Total Investments in Securities | | | 466,280 | | | | 271,408,130 | | | | – 0 | – | | | 271,874,410 | |
Other Financial Instruments*: | | | | | | | | | | | | | | | | |
Assets: | | | | | | | | | | | | | | | | |
Interest Rate Swap Contracts | | | – 0 | – | | | – 0 | – | | | 2,012,523 | | | | 2,012,523 | |
Liabilities | | | – 0 | – | | | – 0 | – | | | – 0 | – | | | – 0 | – |
| | | | | | | | | | | | | | | | |
Total | | $ | 466,280 | | | $ | 271,408,130 | | | $ | 2,012,523 | | | $ | 273,886,933 | |
| | | | | | | | | | | | | | | | |
| | | |
| Michigan Portfolio | | | | | | | | | | |
Investments in
Securities: | | Level 1 | | | Level 2 | | | Level 3 | | | Total | |
Assets: | | | | | | | | | | | | | | | | |
Long-Term Municipal Bonds | | $ | – 0 | – | | $ | 92,138,252 | | | $ | – 0 | – | | $ | 92,138,252 | |
Short-Term Investment | | | 1,825,046 | | | | – 0 | – | | | – 0 | – | | | 1,825,046 | |
| | | | | | | | | | | | | | | | |
Total Investments in Securities | | | 1,825,046 | | | | 92,138,252 | | | | – 0 | – | | | 93,963,298 | |
Other Financial Instruments*: | | | | | | | | | | | | | | | | |
Assets: | | | | | | | | | | | | | | | | |
Interest Rate Swap Contracts | | | – 0 | – | | | – 0 | – | | | 988,310 | | | | 988,310 | |
Liabilities | | | – 0 | – | | | – 0 | – | | | – 0 | – | | | – 0 | – |
| | | | | | | | | | | | | | | | |
Total | | $ | 1,825,046 | | | $ | 92,138,252 | | | $ | 988,310 | | | $ | 94,951,608 | |
| | | | | | | | | | | | | | | | |
| | |
| 100 | | • ALLIANCEBERNSTEIN MUNICIPAL INCOME FUND II |
Notes to Financial Statements
| | | | | | | | | | | | | | | | |
| Minnesota Portfolio | | | | | | | | | | |
Investments in
Securities: | | Level 1 | | | Level 2 | | | Level 3 | | | Total | |
Assets: | | | | | | | | | | | | | | | | |
Long-Term Municipal Bonds | | $ | – 0 | – | | $ | 109,036,392 | | | $ | – 0 | – | | $ | 109,036,392 | |
| | | | | | | | | | | | | | | | |
Total Investments in Securities | | | – 0 | – | | | 109,036,392 | | | | – 0 | – | | | 109,036,392 | |
Other Financial Instruments*: | | | | | | | | | | | | | | | | |
Assets: | | | | | | | | | | | | | | | | |
Interest Rate Swap Contracts | | | – 0 | – | | | – 0 | – | | | 523,166 | | | | 523,166 | |
Liabilities | | | – 0 | – | | | – 0 | – | | | – 0 | – | | | – 0 | – |
| | | | | | | | | | | | | | | | |
Total | | $ | –0 | – | | $ | 109,036,392 | | | $ | 523,166 | | | $ | 109,559,558 | |
| | | | | | | | | | | | | | | | |
| | | |
| New Jersey Portfolio | | | | | | | | | | |
Investments in
Securities: | | Level 1 | | | Level 2 | | | Level 3 | | | Total | |
Assets: | | | | | | | | | | | | | | | | |
Long-Term Municipal Bonds | | $ | – 0 | – | | $ | 151,177,253 | | | $ | – 0 | – | | $ | 151,177,253 | |
Short-Term Investments | | | 2,549,512 | | | | – 0 | – | | | – 0 | – | | | 2,549,512 | |
| | | | | | | | | | | | | | | | |
Total Investments in Securities | | | 2,549,512 | | | | 151,177,253 | | | | – 0 | – | | | 153,726,765 | |
Other Financial Instruments* : | | | | | | | | | | | | | | | | |
Assets: | | | | | | | | | | | | | | | | |
Interest Rate Swap Contracts | | | – 0 | – | | | – 0 | – | | | 472,065 | | | | 472,065 | |
Liabilities | | | – 0 | – | | | – 0 | – | | | – 0 | – | | | – 0 | – |
| | | | | | | | | | | | | | | | |
Total | | $ | 2,549,512 | | | $ | 151,177,253 | | | $ | 472,065 | | | $ | 154,198,830 | |
| | | | | | | | | | | | | | | | |
| | | |
| Ohio Portfolio | | | | | | | | | | |
Investments in
Securities: | | Level 1 | | | Level 2 | | | Level 3 | | | Total | |
Assets: | | | | | | | | | | | | | | | | |
Long-Term Municipal Bonds | | $ | – 0 | – | | $ | 150,221,816 | | | $ | – 0 | – | | $ | 150,221,816 | |
| | | | | | | | | | | | | | | | |
Total Investments in Securities | | | – 0 | – | | | 150,221,816 | | | | – 0 | – | | | 150,221,816 | |
Other Financial Instruments* : | | | | | | | | | | | | | | | | |
Assets: | | | | | | | | | | | | | | | | |
Interest Rate Swap Contracts | | | – 0 | – | | | – 0 | – | | | 538,113 | | | | 538,113 | |
Liabilities | | | – 0 | – | | | – 0 | – | | | – 0 | – | | | – 0 | – |
| | | | | | | | | | | | | | | | |
Total | | $ | – 0 | – | | $ | 150,221,816 | | | $ | 538,113 | | | $ | 150,759,929 | |
| | | | | | | | | | | | | | | | |
| | | | |
| ALLIANCEBERNSTEIN MUNICIPAL INCOME FUND II • | | | 101 | |
Notes to Financial Statements
| | | | | | | | | | | | | | | | |
| Pennsylvania Portfolio | | | | | | | | | | |
Investments in
Securities: | | Level 1 | | | Level 2 | | | Level 3 | | | Total | |
Assets: | | | | | | | | | | | | | | | | |
Long-Term Municipal Bonds | | $ | – 0 | – | | $ | 122,750,294 | | | $ | – 0 | – | | $ | 122,750,294 | |
Short-Term Investments | | | 6,138,238 | | | | – 0 | – | | | – 0 | – | | | 6,138,238 | |
| | | | | | | | | | | | | | | | |
Total Investments in Securities | | | 6,138,238 | | | | 122,750,294 | | | | – 0 | – | | | 128,888,532 | |
Other Financial Instruments* | | | – 0 | – | | | – 0 | – | | | – 0 | – | | | – 0 | – |
| | | | | | | | | | | | | | | | |
Total | | $ | 6,138,238 | | | $ | 122,750,294 | | | $ | – 0 | – | | $ | 128,888,532 | |
| | | | | | | | | | | | | | | | |
| | | |
| Virginia Portfolio | | | | | | | | | | |
Investments in
Securities: | | Level 1 | | | Level 2 | | | Level 3 | | | Total | |
Assets: | | | | | | | | | | | | | | | | |
Long-Term Municipal Bonds | | $ | – 0 | – | | $ | 248,403,249 | | | $ | – 0 | – | | $ | 248,403,249 | |
Short-Term Investments | | | 4,475,071 | | | | – 0 | – | | | – 0 | – | | | 4,475,071 | |
| | | | | | | | | | | | | | | | |
Total Investments in Securities | | | 4,475,071 | | | | 248,403,249 | | | | – 0 | – | | | 252,878,320 | |
Other Financial Instruments*: | | | | | | | | | | | | | | | | |
Assets: | | | | | | | | | | | | | | | | |
Interest Rate Swap Contracts | | | – 0 | – | | | – 0 | – | | | 1,049,614 | | | | 1,049,614 | |
Liabilities | | | – 0 | – | | | – 0 | – | | | – 0 | – | | | – 0 | – |
| | | | | | | | | | | | | | | | |
Total | | $ | 4,475,071 | | | $ | 248,403,249 | | | $ | 1,049,614 | | | $ | 253,927,934 | |
| | | | | | | | | | | | | | | | |
| * | | Other financial instruments are derivative instruments, such as futures, forwards and swap contracts, which are valued at the unrealized appreciation/depreciation on the instrument. |
| | |
| 102 | | • ALLIANCEBERNSTEIN MUNICIPAL INCOME FUND II |
Notes to Financial Statements
Following is a reconciliation of investments in which significant unobservable inputs (Level 3) were used in determining fair value. The transfers between levels of the fair value hierarchy assumes the financial instrument was transferred at the beginning of the reporting period.
| | | | | | | | |
Arizona Portfolio | | Interest Rate
Swap Contracts | | | Total | |
Balance as of 9/30/10 | | $ | – 0 | – | | $ | – 0 | – |
Accrued discounts/(premiums) | | | – 0 | – | | | – 0 | – |
Realized gain (loss) | | | 9,429 | | | | 9,429 | |
Change in unrealized appreciation/depreciation | | | (107,203 | ) | | | (107,203 | ) |
Purchases | | | – 0 | – | | | – 0 | – |
Sales | | | – 0 | – | | | – 0 | – |
Settlements | | | (9,429 | ) | | | (9,429 | ) |
Transfers in to Level 3 | | | (118,389 | ) | | | (118,389 | ) |
Transfers out of Level 3 | | | – 0 | – | | | – 0 | – |
| | | | | | | | |
Balance as of 9/30/11 | | $ | (225,592 | ) | | $ | (225,592 | ) |
| | | | | | | | |
Net change in unrealized appreciation/depreciation from Investments held as of 9/30/11* | | $ | (107,203 | ) | | $ | (107,203 | ) |
| | | | | | | | |
| | |
Massachusetts Portfolio | | Interest Rate
Swap Contracts | | | Total | |
Balance as of 9/30/10 | | $ | – 0 | – | | $ | – 0 | – |
Accrued discounts/(premiums) | | | – 0 | – | | | – 0 | – |
Realized gain (loss) | | | 483,481 | | | | 483,481 | |
Change in unrealized appreciation/depreciation | | | 68,293 | | | | 68,293 | |
Purchases | | | – 0 | – | | | – 0 | – |
Sales | | | – 0 | – | | | – 0 | – |
Settlements | | | (483,481 | ) | | | (483,481 | ) |
Transfers in to Level 3 | | | 1,944,230 | | | | 1,944,230 | |
Transfers out of Level 3 | | | – 0 | – | | | – 0 | – |
| | | | | | | | |
Balance as of 9/30/11 | | $ | 2,012,523 | | | $ | 2,012,523 | |
| | | | | | | | |
Net change in unrealized appreciation/depreciation from Investments held as of 9/30/11* | | $ | 68,293 | | | $ | 68,293 | |
| | | | | | | | |
| | | | |
| ALLIANCEBERNSTEIN MUNICIPAL INCOME FUND II • | | | 103 | |
Notes to Financial Statements
| | | | | | | | |
Michigan Portfolio | | Interest Rate
Swap Contracts | | | Total | |
Balance as of 9/30/10 | | $ | – 0 | – | | $ | – 0 | – |
Accrued discounts/(premiums) | | | – 0 | – | | | – 0 | – |
Realized gain (loss) | | | 241,368 | | | | 241,368 | |
Change in unrealized appreciation/depreciation | | | (12,056 | ) | | | (12,056 | ) |
Purchases | | | – 0 | – | | | – 0 | – |
Sales | | | – 0 | – | | | – 0 | – |
Settlements | | | (241,368 | ) | | | (241,368 | ) |
Transfers in to Level 3 | | | 1,000,366 | | | | 1,000,366 | |
Transfers out of Level 3 | | | – 0 | – | | | – 0 | – |
| | | | | | | | |
Balance as of 9/30/11 | | $ | 988,310 | | | $ | 988,310 | |
| | | | | | | | |
Net change in unrealized appreciation/depreciation from Investments held as of 9/30/11* | | $ | (12,056 | ) | | $ | (12,056 | ) |
| | | | | | | | |
| | |
Minnesota Portfolio | | Interest Rate
Swap Contracts | | | Total | |
Balance as of 9/30/10 | | $ | – 0 | – | | $ | – 0 | – |
Accrued discounts/(premiums) | | | – 0 | – | | | – 0 | – |
Realized gain (loss) | | | 134,134 | | | | 134,134 | |
Change in unrealized appreciation/depreciation | | | (8,264 | ) | | | (8,264 | ) |
Purchases | | | – 0 | – | | | – 0 | – |
Sales | | | – 0 | – | | | – 0 | – |
Settlements | | | (134,134 | ) | | | (134,134 | ) |
Transfers in to Level 3 | | | 531,430 | | | | 531,430 | |
Transfers out of Level 3 | | | – 0 | – | | | – 0 | – |
| | | | | | | | |
Balance as of 9/30/11 | | $ | 523,166 | | | $ | 523,166 | |
| | | | | | | | |
Net change in unrealized appreciation/depreciation from Investments held as of 9/30/11* | | $ | (8,264 | ) | | $ | (8,264 | ) |
| | | | | | | | |
| | |
New Jersey Portfolio | | Interest Rate
Swap Contracts | | | Total | |
Balance as of 9/30/10 | | $ | – 0 | – | | $ | – 0 | – |
Accrued discounts/(premiums) | | | – 0 | – | | | – 0 | – |
Realized gain (loss) | | | 116,506 | | | | 116,506 | |
Change in unrealized appreciation/depreciation | | | (3,780 | ) | |
| (3,780
| )
|
Purchases | | | – 0 | – | | | – 0 | – |
Sales | | | – 0 | – | | | – 0 | – |
Settlements | | | (116,506 | ) | | | (116,506 | ) |
Transfers in to Level 3 | | | 475,845 | | | | 475,845 | |
Transfers out of Level 3 | | | – 0 | – | | | – 0 | – |
| | | | | | | | |
Balance as of 9/30/11 | | $ | 472,065 | | | $ | 472,065 | |
| | | | | | | | |
Net change in unrealized appreciation/depreciation from Investments held as of 9/30/11* | | $ | (3,780 | ) | | $ | (3,780 | ) |
| | | | | | | | |
| | |
| 104 | | • ALLIANCEBERNSTEIN MUNICIPAL INCOME FUND II |
Notes to Financial Statements
| | | | | | | | |
Ohio Portfolio | | Interest Rate
Swap Contracts | | | Total | |
Balance as of 9/30/10 | | $ | – 0 | – | | $ | – 0 | – |
Accrued discounts/(premiums) | | | – 0 | – | | | – 0 | – |
Realized gain (loss) | | | 137,967 | | | | 137,967 | |
Change in unrealized appreciation/depreciation | | | (8,500 | ) | | | (8,500 | ) |
Purchases | | | – 0 | – | | | – 0 | – |
Sales | | | – 0 | – | | | – 0 | – |
Settlements | | | (137,967 | ) | | | (137,967 | ) |
Transfers in to Level 3 | | | 546,613 | | | | 546,613 | |
Transfers out of Level 3 | | | – 0 | – | | | – 0 | – |
| | | | | | | | |
Balance as of 9/30/11 | | $ | 538,113 | | | $ | 538,113 | |
| | | | | | | | |
Net change in unrealized appreciation/depreciation from Investments held as of 9/30/11* | | $ | (8,500 | ) | | $ | (8,500 | ) |
| | | | | | | | |
| | |
Virginia Portfolio | | Interest Rate
Swap Contracts | | | Total | |
Balance as of 9/30/10 | | $ | – 0 | – | | $ | – 0 | – |
Accrued discounts/(premiums) | | | – 0 | – | | | – 0 | – |
Realized gain (loss) | | | 249,319 | | | | 249,319 | |
Change in unrealized appreciation/depreciation | | | 68,435 | | | | 68,435 | |
Purchases | | | – 0 | – | | | – 0 | – |
Sales | | | – 0 | – | | | – 0 | – |
Settlements | | | (249,319 | ) | | | (249,319 | ) |
Transfers in to Level 3 | | | 981,179 | | | | 981,179 | |
Transfers out of Level 3 | | | – 0 | – | | | – 0 | – |
| | | | | | | | |
Balance as of 9/30/11 | | $ | 1,049,614 | | | $ | 1,049,614 | |
| | | | | | | | |
Net change in unrealized appreciation/depreciation from Investments held as of 9/30/11* | | $ | 68,435 | | | $ | 68,435 | |
| | | | | | | | |
| * | | The unrealized appreciation/depreciation is included in net change in unrealized appreciation/depreciation of investments in the accompanying statement of operations. |
3. Taxes
It is each Portfolio’s policy to meet the requirements of the Internal Revenue Code applicable to regulated investment companies and to distribute all of its investment company taxable income and net realized gains, if any, to shareholders. Therefore, no provisions for federal income or excise taxes are required.
In accordance with U.S. GAAP requirements regarding accounting for uncertainties in income taxes, management has analyzed the Portfolios’ tax positions taken or expected to be taken on federal and state income tax returns for all open tax years (the current and the prior three tax years) and has concluded that no provision for income tax is required in the Portfolios’ financial statements.
| | | | |
| ALLIANCEBERNSTEIN MUNICIPAL INCOME FUND II • | | | 105 | |
Notes to Financial Statements
4. Investment Income and Investment Transactions
Interest income is accrued daily. Investment transactions are accounted for on the date the securities are purchased or sold. Each Portfolio may buy and sell securities from other affiliated funds in accordance with the requirements of Rule 17a-7 of the Investment Company Act of 1940. Each Portfolio has adopted procedures to ensure that all such transactions are done in accordance with the requirements of Rule 17a-7. Investment gains and losses are determined on the identified cost basis. The Portfolios amortize premiums and accrete original issue discount and market discount as adjustments to interest income.
5. Class Allocations
All income earned and expenses incurred by the Portfolios are borne on a pro-rata basis by each settled class of shares, based on the proportionate interest in each Portfolio represented by the net assets of such class, except for class specific expenses which are allocated to the respective class. Expenses of the Fund are charged to each Portfolio in proportion to net assets. Realized and unrealized gains and losses are allocated among the various share classes based on respective net assets.
6. Dividends and Distributions
Dividends and distributions to shareholders, if any, are recorded on the ex-dividend date. Income dividends and capital gains distributions are determined in accordance with federal tax regulations and may differ from those determined in accordance with U.S. GAAP. To the extent these differences are permanent, such amounts are reclassified within the capital accounts based on their federal tax basis treatment; temporary differences do not require such reclassification.
NOTE B
Advisory Fee and Other Transactions with Affiliates
Under the terms of the investment advisory agreement, each Portfolio pays the Adviser an advisory fee at an annual rate of .45% of the first $2.5 billion, .40% of the next $2.5 billion and .35% in excess of $5 billion, of each Portfolio’s average daily net assets. Such fee is accrued daily and paid monthly.
During the year ended September 30, 2010, the Adviser reimbursed the Michigan Portfolio $1,157 for trading losses incurred due to a trade entry error.
| | |
| 106 | | • ALLIANCEBERNSTEIN MUNICIPAL INCOME FUND II |
Notes to Financial Statements
The Adviser has agreed to waive its fees and bear certain expenses to the extent necessary to limit the total portfolio operating expenses as a percentage of daily average net assets on an annual basis (the “Expense Caps”) as follows:
| | | | | | | | | | | | |
| Portfolio | | Class A | | | Class B | | | Class C | |
Arizona | | | .78 | % | | | 1.48 | % | | | 1.48 | % |
Massachusetts | | | .82 | % | | | 1.52 | % | | | 1.52 | % |
Michigan | | | 1.01 | % | | | 1.71 | % | | | 1.71 | % |
Minnesota | | | .90 | % | | | 1.60 | % | | | 1.60 | % |
New Jersey | | | .87 | % | | | 1.57 | % | | | 1.57 | % |
Ohio | | | .85 | % | | | 1.55 | % | | | 1.55 | % |
Pennsylvania | | | .95 | % | | | 1.65 | % | | | 1.65 | % |
Virginia | | | .72 | % | | | 1.42 | % | | | 1.42 | % |
The Expense Caps will extend through January 31, 2012 and then may be extended by the Adviser for additional one year terms. For the year ended September 30, 2011, such reimbursement waivers amounted to $307,606, $196,478, $76,958, $144,485, $152,544, $176,601, $73,408 and $464,802 for Arizona, Massachusetts, Michigan, Minnesota, New Jersey, Ohio, Pennsylvania and Virginia Portfolios, respectively.
Pursuant to the investment advisory agreement, each Portfolio may reimburse the Adviser for certain legal and accounting services provided to each Portfolio by the Adviser. For the year ended September 30, 2011, such fees amounted to $67,247, $68,249, $71,030, $64,221, $66,639, $64,166, $69,932 and $57,371 for Arizona, Massachusetts, Michigan, Minnesota, New Jersey, Ohio, Pennsylvania and Virginia Portfolios, respectively.
The Portfolios compensate AllianceBernstein Investor Services, Inc. (“ABIS”), a wholly-owned subsidiary of the Adviser, under a Transfer Agency Agreement for providing personnel and facilities to perform transfer agency services for the Portfolios. ABIS may make payments to intermediaries that provide omnibus account services, sub-accounting services and/or networking services. For the year ended September 30, 2011, such compensation retained by ABIS amounted to: $22,866, $34,881, $29,258, $24,124, $30,917, $31,638, $32,338 and $35,802 for Arizona, Massachusetts, Michigan, Minnesota, New Jersey, Ohio, Pennsylvania and Virginia Portfolios, respectively.
| | | | |
| ALLIANCEBERNSTEIN MUNICIPAL INCOME FUND II • | | | 107 | |
Notes to Financial Statements
AllianceBernstein Investments, Inc. (the “Distributor”), a wholly-owned subsidiary of the Adviser, serves as the distributor of the Portfolio’s shares. The Distributor has advised the Portfolios that it has retained front-end sales charges from the sale of Class A shares and received contingent deferred sales charges imposed upon redemptions by shareholders of Class A, Class B and Class C shares for each Portfolio for the year ended September 30, 2011 as follows:
| | | | | | | | | | | | | | | | |
| | | Front-End Sales
Charges | | | Contingent Deferred Sales
Charges | |
| Portfolio | | Class A | | | Class A | | | Class B | | | Class C | |
Arizona | | $ | – 0 | – | | $ | 4,490 | | | $ | 1,153 | | | $ | 5,057 | |
Massachusetts | | | 60 | | | | 19,001 | | | | 334 | | | | 18,427 | |
Michigan | | | 110 | | | | 601 | | | | 4,798 | | | | 2,146 | |
Minnesota | | | 145 | | | | 158 | | | | 190 | | | | 6,606 | |
New Jersey | | | – 0 | – | | | 1,000 | | | | 1,728 | | | | 4,855 | |
Ohio | | | 89 | | | | 7,819 | | | | 2,234 | | | | 3,805 | |
Pennsylvania | | | 143 | | | | 2,163 | | | | 742 | | | | 1,405 | |
Virginia | | | 782 | | | | 21,682 | | | | 1,148 | | | | 5,589 | |
The Portfolios may invest in the AllianceBernstein Fixed-Income Shares, Inc. — Government STIF Portfolio (“Government STIF Portfolio”), an open-end management investment company managed by the Adviser. The Government STIF Portfolio is offered as a cash management option to mutual funds and other institutional accounts of the Adviser, and is not available for direct purchase by members of the public. The Government STIF Portfolio pays no investment management fees but does bear its own expenses. A summary of the Portfolios’ transactions in shares of the Government STIF Portfolio for the year ended September 30, 2011 is as follows:
| | | | | | | | | | | | | | | | | | | | |
| Portfolio | | Market Value September 30,
2010 (000) | | | Purchases at Cost (000) | | | Sales Proceeds (000) | | | Market Value September 30,
2011 (000) | | | Dividend Income (000) | |
Arizona | | $ | – 0 | – | | $ | 7,476 | | | $ | 7,476 | | | $ | – 0 | – | | $ | – 0 | –* |
Massachusetts | | | – 0 | – | | | 22,335 | | | | 21,869 | | | | 466 | | | | 1 | |
Michigan | | | – 0 | – | | | 4,212 | | | | 2,387 | | | | 1,825 | | | | – 0 | –* |
New Jersey | | | – 0 | – | | | 11,274 | | | | 8,724 | | | | 2,550 | | | | 1 | |
Ohio | | | – 0 | – | | | 8,263 | | | | 8,263 | | | | – 0 | – | | | – 0 | –* |
Pennsylvania | | | – 0 | – | | | 8,592 | | | | 2,454 | | | | 6,138 | | | | – 0 | –* |
Virginia | | | – 0 | – | | | 31,153 | | | | 26,678 | | | | 4,475 | | | | 1 | |
| * | | Amount is less than $500. |
The Minnesota Portfolio did not have any transactions in shares of the Government STIF Portfolio during the year ended September 30, 2011.
NOTE C
Distribution Services Agreement
The Fund has adopted a Distribution Services Agreement (the “Agreement”) pursuant to Rule 12b-1 under the Investment Company Act of 1940. Under the
| | |
| 108 | | • ALLIANCEBERNSTEIN MUNICIPAL INCOME FUND II |
Notes to Financial Statements
Agreement, the Portfolios pay distribution and servicing fees to the Distributor at an annual rate of up to .30% of the Portfolios’ average daily net assets attributable to Class A shares and 1% of the Portfolios’ average daily net assets attributable to both Class B and Class C shares. The fees are accrued daily and paid monthly. The Agreement provides that the Distributor will use such payments in their entirety for distribution assistance and promotional activities. Since the commencement of the Portfolios’ operations, the distributor has incurred expenses in excess of the distribution costs reimbursed by each Portfolio as follows:
| | | | | | | | |
| Portfolio | | Class B | | | Class C | |
Arizona | | $ | 3,412,244 | | | $ | 1,942,226 | |
Massachusetts | | | 3,365,911 | | | | 3,509,525 | |
Michigan | | | 3,166,377 | | | | 4,290,086 | |
Minnesota | | | 2,643,519 | | | | 2,663,498 | |
New Jersey | | | 5,268,960 | | | | 3,502,158 | |
Ohio | | | 4,297,939 | | | | 3,757,570 | |
Pennsylvania | | | 3,546,436 | | | | 3,332,319 | |
Virginia | | | 3,571,008 | | | | 2,902,345 | |
While such costs may be recovered from the Portfolios in future periods so long as the Agreement is in effect, the rate of the distribution and servicing fees payable under the Agreement may not be increased without a shareholder vote. In accordance with the Agreement, there is no provision for recovery of unreimbursed distribution costs incurred by the Distributor beyond the current fiscal year for Class A shares. The Agreement also provides that the Adviser may use its own resources to finance the distribution of the Portfolios’ shares.
NOTE D
Investment Transactions
Purchases and sales of investment securities (excluding short-term investments and U.S. government securities) for the year ended September 30, 2011, were as follows:
| | | | | | | | |
| Portfolio | | Purchases | | | Sales | |
Arizona | | $ | 3,558,468 | | | $ | 28,507,659 | |
Massachusetts | | | 69,333,742 | | | | 38,177,403 | |
Michigan | | | 2,581,801 | | | | 16,243,100 | |
Minnesota | | | 11,809,937 | | | | 17,099,813 | |
New Jersey | | | 733,775 | | | | 17,312,456 | |
Ohio | | | 12,575,626 | | | | 23,422,123 | |
Pennsylvania | | | 8,246,305 | | | | 20,760,081 | |
Virginia | | | 58,374,886 | | | | 70,754,601 | |
There were no purchases or sales of U.S. government and government agency obligations for the year ended September 30, 2011.
| | | | |
| ALLIANCEBERNSTEIN MUNICIPAL INCOME FUND II • | | | 109 | |
Notes to Financial Statements
The cost of investments for federal income tax purposes, gross unrealized appreciation and unrealized depreciation (excluding swap transactions) are as follows:
| | | | | | | | | | | | | | | | |
| | | Cost | | | Gross Unrealized | | | Net
Unrealized
Appreciation | |
Portfolio | | | Appreciation | | | (Depreciation) | | |
Arizona | | $ | 165,423,781 | | | $ | 4,936,458 | | | $ | (1,055,422 | ) | | $ | 3,881,036 | |
Massachusetts | | | 258,689,986 | | | | 14,065,363 | | | | (880,939 | ) | | | 13,184,424 | |
Michigan | | | 90,898,016 | | | | 3,524,691 | | | | (459,409 | ) | | | 3,065,282 | |
Minnesota | | | 104,526,044 | | | | 4,651,981 | | | | (141,633 | ) | | | 4,510,348 | |
New Jersey | | | 148,591,863 | | | | 7,023,196 | | | | (1,888,294 | ) | | | 5,134,902 | |
Ohio | | | 145,485,184 | | | | 5,711,123 | | | | (974,491 | ) | | | 4,736,632 | |
Pennsylvania | | | 125,301,637 | | | | 4,569,637 | | | | (982,742 | ) | | | 3,586,895 | |
Virginia | | | 242,620,000 | | | | 11,706,421 | | | | (1,448,101 | ) | | | 10,258,320 | |
1. Derivative Financial Instruments
Each Portfolio may use derivatives to earn income and enhance returns, to hedge or adjust the risk profile of its portfolio, to replace more traditional direct investments, or to obtain exposure to otherwise inaccessible markets.
The principal type of derivatives utilized by the Portfolios, as well as the methods in which they may be used are:
Each Portfolio may enter into swaps to hedge their exposure to interest rates, credit risk, or currencies and for other purposes discussed below. A swap is an agreement that obligates two parties to exchange a series of cash flows at specified intervals based upon or calculated by reference to changes in specified prices or rates for a specified amount of an underlying asset. The payment flows are usually netted against each other, with the difference being paid by one party to the other. In addition, collateral may be pledged or received by the Portfolio in accordance with the terms of the respective swap agreements to provide value and recourse to the Portfolio or its counterparties in the event of default, bankruptcy or insolvency by one of the parties to the swap agreement.
Risks may arise as a result of the failure of the counterparty to the swap contract to comply with the terms of the swap contract. The loss incurred by the failure of a counterparty is generally limited to the net interim payment to be received by the Portfolio, and/or the termination value at the end of the contract. Therefore, the Portfolio considers the creditworthiness of each counterparty to a swap contract in evaluating potential counterparty risk. This risk is mitigated by having a netting arrangement between the Portfolio and the counterparty and by the posting of collateral by the counterparty to the Portfolio to cover the Portfolio’s exposure to the counterparty. Additionally, risks may arise from unanticipated movements in interest rates or in the value of the underlying securities. The Portfolio accrues for the interim payments on swap contracts on a daily basis, with the net amount recorded within unrealized
| | |
| 110 | | • ALLIANCEBERNSTEIN MUNICIPAL INCOME FUND II |
Notes to Financial Statements
appreciation/depreciation of swap contracts on the statement of assets and liabilities, where applicable. Once the interim payments are settled in cash, the net amount is recorded as realized gain/(loss) on swaps on the statement of operations, in addition to any realized gain/(loss) recorded upon the termination of swap contracts. Fluctuations in the value of swap contracts are recorded as a component of net change in unrealized appreciation/depreciation of swap contracts on the statement of operations.
Interest Rate Swaps:
Each Portfolio is subject to interest rate risk exposure in the normal course of pursuing its investment objectives. Because the Portfolio holds fixed rate bonds, the value of these bonds may decrease if interest rates rise. To help hedge against this risk and to maintain its ability to generate income at prevailing market rates, the Portfolio may enter into interest rate swap contracts. Interest rate swaps are agreements between two parties to exchange cash flows based on a notional amount. The Portfolio may elect to pay a fixed rate and receive a floating rate, or, receive a fixed rate and pay a floating rate on a notional amount.
In addition, each Portfolio may enter into interest rate swap transactions to preserve a return or spread on a particular investment or portion of its portfolio, or protecting against an increase in the price of securities the Portfolio anticipates purchasing at a later date. Interest rate swaps involve the exchange by a Portfolio with another party of their respective commitments to pay or receive interest (e.g., an exchange of floating rate payments for fixed rate payments) computed based on a contractually-based principal (or “notional”) amount. Interest rate swaps are entered into on a net basis (i.e., the two payment streams are netted out, with the Portfolio receiving or paying, as the case may be, only the net amount of the two payments).
During the year ended September 30, 2011, the Arizona, Massachusetts, Michigan, Minnesota, New Jersey, Ohio and Virginia Portfolios held interest rate swaps for hedging purposes.
Documentation governing the Portfolios’ swap transactions may contain provisions for early termination of a swap in the event the net assets of the Portfolio decline below specific levels set forth in the documentation (“net asset contingent features”). If these levels are triggered, the Portfolios’ counterparty has the right to terminate the swap and require the Portfolio to pay or receive a settlement amount in connection with the terminated swap transaction. As of September 30, 2011, the Arizona Portfolio had interest rate swap contracts in liability positions with net asset contingent features. The fair value of such contracts amounted to $249,564 at September 30, 2011.
| | | | |
| ALLIANCEBERNSTEIN MUNICIPAL INCOME FUND II • | | | 111 | |
Notes to Financial Statements
At September 30, 2011, the Portfolios had entered into the following derivatives:
| | | | | | | | | | | | |
Arizona Portfolio | | Asset Derivatives | | | Liability Derivatives | |
| Derivative Type | | Statement of
Assets and
Liabilities
Location | | Fair Value | | | Statement of
Assets and
Liabilities
Location | | Fair Value | |
Interest rate contracts | | Unrealized appreciation on interest rate swap contracts | | $ | 23,972 | | | Unrealized depreciation on interest rate swap contracts | | $ | 249,564 | |
| | | | | | | | | | | | |
Total | | | | $ | 23,972 | | | | | $ | 249,564 | |
| | | | | | | | | | | | |
The effect of derivative instruments on the statement of operations for the year ended September 30, 2011:
| | | | | | | | | | |
| Derivative Type | | Location of
Gain or (Loss)
on Derivatives | | Realized Gain
or (Loss) on
Derivatives | | | Change in
Unrealized
Appreciation or
(Depreciation) | |
Interest rate contracts | | Net realized gain (loss) on swap contracts; Net change in unrealized appreciation/depreciation of swap contracts | | $ | 9,429 | | | $ | (107,203 | ) |
| | | | | | | | | | |
Total | | | | $ | 9,429 | | | $ | (107,203 | ) |
| | | | | | | | | | |
For the year ended September 30, 2011, the average monthly notional amount of interest rate swaps was $2,440,000.
| | | | | | | | | | |
Massachusetts
Portfolio | | Asset Derivatives | | | Liability Derivatives |
| Derivative Type | | Statement of
Assets and
Liabilities
Location | | Fair Value | | | Statement of
Assets and
Liabilities
Location | | Fair Value |
Interest rate contracts | | Unrealized appreciation on interest rate swap contracts | | $ | 2,012,523 | | | | | |
| | | | | | | | | | |
Total | | | | $ | 2,012,523 | | | | | |
| | | | | | | | | | |
| | |
| 112 | | • ALLIANCEBERNSTEIN MUNICIPAL INCOME FUND II |
Notes to Financial Statements
The effect of derivative instruments on the statement of operations for the year ended September 30, 2011:
| | | | | | | | | | |
| Derivative Type | | Location of
Gain or (Loss)
on Derivatives | | Realized Gain
or (Loss) on
Derivatives | | | Change in
Unrealized
Appreciation or
(Depreciation) | |
Interest rate contracts | | Net realized gain (loss) on swap contracts; Net change in unrealized appreciation/depreciation of swap contracts | | $ | 483,481 | | | $ | 68,293 | |
| | | | | | | | | | |
Total | | | | $ | 483,481 | | | $ | 68,293 | |
| | | | | | | | | | |
For the year ended September 30, 2011, the average monthly notional amount of interest rate swaps was $13,100,000.
| | | | | | | | | | |
Michigan Portfolio | | Asset Derivatives | | | Liability Derivatives |
| Derivative Type | | Statement of
Assets and
Liabilities
Location | | Fair Value | | | Statement of
Assets and
Liabilities
Location | | Fair Value |
Interest rate contracts | | Unrealized appreciation on interest rate swap contracts | | $ | 988,310 | | | | | |
| | | | | | | | | | |
Total | | | | $ | 988,310 | | | | | |
| | | | | | | | | | |
The effect of derivative instruments on the statement of operations for the year ended September 30, 2011:
| | | | | | | | | | |
| Derivative Type | | Location of
Gain or (Loss)
on Derivatives | | Realized Gain
or (Loss) on
Derivatives | | | Change in
Unrealized
Appreciation or
(Depreciation) | |
Interest rate contracts | | Net realized gain (loss) on swap contracts; Net change in unrealized appreciation/depreciation of swap contracts | | $ | 241,368 | | | $ | (12,056 | ) |
| | | | | | | | | | |
Total | | | | $ | 241,368 | | | $ | (12,056 | ) |
| | | | | | | | | | |
| | | | |
| ALLIANCEBERNSTEIN MUNICIPAL INCOME FUND II • | | | 113 | |
Notes to Financial Statements
For the year ended September 30, 2011, the average monthly notional amount of interest rate swaps was $6,200,000.
| | | | | | | | | | |
Minnesota Portfolio | | Asset Derivatives | | | Liability Derivatives |
| Derivative Type | | Statement of
Assets and
Liabilities
Location | | Fair Value | | | Statement of
Assets and
Liabilities
Location | | Fair Value |
Interest rate contracts | | Unrealized appreciation on interest rate swap contracts | | $ | 523,166 | | | | | |
| | | | | | | | | | |
Total | | | | $ | 523,166 | | | | | |
| | | | | | | | | | |
The effect of derivative instruments on the statement of operations for the year ended September 30, 2011:
| | | | | | | | | | |
| Derivative Type | | Location of
Gain or (Loss)
on Derivatives | | Realized Gain
or (Loss) on
Derivatives | | | Change in
Unrealized
Appreciation or
(Depreciation) | |
Interest rate contracts | | Net realized gain (loss) on swap contracts; Net change in unrealized appreciation/depreciation of swap contracts | | $ | 134,134 | | | $ | (8,264 | ) |
| | | | | | | | | | |
Total | | | | $ | 134,134 | | | $ | (8,264 | ) |
| | | | | | | | | | |
For the year ended September 30, 2011, the average monthly notional amount of interest rate swaps was $3,500,000.
| | | | | | | | | | |
New Jersey
Portfolio | | Asset Derivatives | | | Liability Derivatives |
| Derivative Type | | Statement of
Assets and
Liabilities
Location | | Fair Value | | | Statement of
Assets and
Liabilities
Location | | Fair Value |
Interest rate contracts | | Unrealized appreciation on interest rate swap contracts | | $ | 472,065 | | | | | |
| | | | | | | | | | |
Total | | | | $ | 472,065 | | | | | |
| | | | | | | | | | |
| | |
| 114 | | • ALLIANCEBERNSTEIN MUNICIPAL INCOME FUND II |
Notes to Financial Statements
The effect of derivative instruments on the statement of operations for the year ended September 30, 2011:
| | | | | | | | | | |
| Derivative Type | | Location of
Gain or (Loss)
on Derivatives | | Realized Gain
or (Loss) on
Derivatives | | | Change in
Unrealized
Appreciation or
(Depreciation) | |
Interest rate contracts | | Net realized gain (loss) on swap contracts; Net change in unrealized appreciation/depreciation of swap contracts | | $ | 116,506 | | | $ | (3,780 | ) |
| | | | | | | | | | |
Total | | | | $ | 116,506 | | | $ | (3,780 | ) |
| | | | | | | | | | |
For the year ended September 30, 2011, the average monthly notional amount of interest rate swaps was $3,000,000.
| | | | | | | | | | |
Ohio Portfolio | | Asset Derivatives | | | Liability Derivatives |
| Derivative Type | | Statement of
Assets and
Liabilities
Location | | Fair Value | | | Statement of
Assets and
Liabilities
Location | | Fair Value |
Interest rate contracts | | Unrealized appreciation on interest rate swap contracts | | $ | 538,113 | | | | | |
| | | | | | | | | | |
Total | | | | $ | 538,113 | | | | | |
| | | | | | | | | | |
The effect of derivative instruments on the statement of operations for the year ended September 30, 2011:
| | | | | | | | | | |
| Derivative Type | | Location of
Gain or (Loss)
on Derivatives | | Realized Gain
or (Loss) on
Derivatives | | | Change in
Unrealized
Appreciation or
(Depreciation) | |
Interest rate contracts | | Net realized gain (loss) on swap contracts; Net change in unrealized appreciation/depreciation of swap contracts | | $ | 137,967 | | | $ | (8,500 | ) |
| | | | | | | | | | |
Total | | | | $ | 137,967 | | | $ | (8,500 | ) |
| | | | | | | | | | |
| | | | |
| ALLIANCEBERNSTEIN MUNICIPAL INCOME FUND II • | | | 115 | |
Notes to Financial Statements
For the year ended September 30, 2011, the average monthly notional amount of interest rate swaps was $3,600,000.
| | | | | | | | | | |
Virginia Portfolio | | Asset Derivatives | | | Liability Derivatives |
| Derivative Type | | Statement of
Assets and
Liabilities
Location | | Fair Value | | | Statement of
Assets and
Liabilities
Location | | Fair Value |
Interest rate contracts | | Unrealized appreciation on interest rate swap contracts | | $ | 1,049,614 | | | | | |
| | | | | | | | | | |
Total | | | | $ | 1,049,614 | | | | | |
| | | | | | | | | | |
The effect of derivative instruments on the statement of operations for the year ended September 30, 2011:
| | | | | | | | | | |
| Derivative Type | | Location of
Gain or (Loss)
on Derivatives | | Realized Gain
or (Loss) on
Derivatives | | | Change in
Unrealized
Appreciation or
(Depreciation) | |
Interest rate contracts | | Net realized gain (loss) on swap contracts; Net change in unrealized appreciation/depreciation of swap contracts | | $ | 249,319 | | | $ | 68,435 | |
| | | | | | | | | | |
Total | | | | $ | 249,319 | | | $ | 68,435 | |
| | | | | | | | | | |
For the year ended September 30, 2011, the average monthly notional amount of interest rate swaps was $7,000,000.
NOTE E
Shares of Beneficial Interest
Transactions in shares of beneficial interest for each Portfolio were as follows:
| | | | | | | | | | | | | | | | | | | | |
| | | | | | | | | | | | | | | | | | | | |
| | | Arizona Portfolio | | | |
| | | Shares | | | | | Amount | | | |
| | | Year Ended
September 30,
2011 | | | Year Ended
September 30,
2010 | | | | | Year Ended
September 30,
2011 | | | Year Ended
September 30,
2010 | | | |
| | | | | | |
| Class A | | | | | | | | | | | | | | | | | | | | |
Shares sold | | | 1,158,480 | | | | 1,386,384 | | | | | $ | 12,414,735 | | | $ | 15,179,020 | | | |
| | | |
Shares issued in reinvestment of dividends and distributions | | | 384,732 | | | | 336,557 | | | | | | 4,105,511 | | | | 3,678,934 | | | |
| | | |
Shares converted from Class B | | | 126,191 | | | | 194,264 | | | | | | 1,355,578 | | | | 2,122,249 | | | |
| | | |
Shares redeemed | | | (3,659,181 | ) | | | (3,313,057 | ) | | | | | (38,936,689 | ) | | | (36,149,801 | ) | | |
| | | |
Net decrease | | | (1,989,778 | ) | | | (1,395,852 | ) | | | | $ | (21,060,865 | ) | | $ | (15,169,598 | ) | | |
| | | |
| | | | | | | | | | | | | | | | | | | | |
| | |
| 116 | | • ALLIANCEBERNSTEIN MUNICIPAL INCOME FUND II |
Notes to Financial Statements
| | | | | | | | | | | | | | | | | | | | |
| | | | | | | | | | | | | | | | | | | | |
| | | Arizona Portfolio | | | |
| | | Shares | | | | | Amount | | | |
| | | Year Ended
September 30,
2011 | | | Year Ended
September 30,
2010 | | | | | Year Ended
September 30,
2011 | | | Year Ended
September 30,
2010 | | | |
| | | | | | |
| Class B | | | | | | | | | | | | | | | | | | | | |
Shares sold | | | 418 | | | | 3,570 | | | | | $ | 4,828 | | | $ | 39,034 | | | |
| | | |
Shares issued in reinvestment of dividends and distributions | | | 10,171 | | | | 12,888 | | | | | | 108,194 | | | | 140,536 | | | |
| | | |
Shares converted to Class A | | | (126,372 | ) | | | (194,581 | ) | | | | | (1,355,578 | ) | | | (2,122,249 | ) | | |
| | | |
Shares redeemed | | | (77,756 | ) | | | (88,371 | ) | | | | | (818,216 | ) | | | (965,063 | ) | | |
| | | |
Net decrease | | | (193,539 | ) | | | (266,494 | ) | | | | $ | (2,060,772 | ) | | $ | (2,907,742 | ) | | |
| | | |
| | | | | | | | | | | | | | | | | | | | |
| Class C | | | | | | | | | | | | | | | | | | | | |
Shares sold | | | 287,887 | | | | 553,537 | | | | | $ | 3,088,762 | | | $ | 6,036,899 | | | |
| | | |
Shares issued in reinvestment of dividends and distributions | | | 84,961 | | | | 65,384 | | | | | | 904,405 | | | | 713,718 | | | |
| | | |
Shares redeemed | | | (810,308 | ) | | | (422,705 | ) | | | | | (8,585,044 | ) | | | (4,613,225 | ) | | |
| | | |
Net increase (decrease) | | | (437,460 | ) | | | 196,216 | | | | | $ | (4,591,877 | ) | | $ | 2,137,392 | | | |
| | | |
| | | | | | | | | | | | | | | | | | | | |
| | | | | | | | | | | | | | | | | | | | |
| | | Massachusetts Portfolio | | | |
| | | Shares | | | | | Amount | | | |
| | | Year Ended
September 30,
2011 | | | Year Ended
September 30,
2010 | | | | | Year Ended
September 30,
2011 | | | Year Ended
September 30,
2010 | | | |
| | | | | | |
| Class A | | | | | | | | | | | | | | | | | | | | |
Shares sold | | | 8,308,336 | | | | 4,732,763 | | | | | $ | 89,548,401 | | | $ | 52,210,069 | | | |
| | | |
Shares issued in reinvestment of dividends | | | 302,462 | | | | 307,046 | | | | | | 3,303,296 | | | | 3,387,569 | | | |
| | | |
Shares converted from Class B | | | 101,181 | | | | 196,597 | | | | | | 1,103,706 | | | | 2,169,093 | | | |
| | | |
Shares redeemed | | | (6,649,727 | ) | | | (2,527,182 | ) | | | | | (71,634,166 | ) | | | (27,883,330 | ) | | |
| | | |
Net increase | | | 2,062,252 | | | | 2,709,224 | | | | | $ | 22,321,237 | | | $ | 29,883,401 | | | |
| | | |
| | | | | | | | | | | | | | | | | | | | |
| Class B | | | | | | | | | | | | | | | | | | | | |
Shares sold | | | 2,695 | | | | 29,429 | | | | | $ | 30,172 | | | $ | 323,027 | | | |
| | | |
Shares issued in reinvestment of dividends | | | 6,425 | | | | 8,920 | | | | | | 69,938 | | | | 98,325 | | | |
| | | |
Shares converted to Class A | | | (101,376 | ) | | | (197,050 | ) | | | | | (1,103,706 | ) | | | (2,169,093 | ) | | |
| | | |
Shares redeemed | | | (51,967 | ) | | | (110,397 | ) | | | | | (556,547 | ) | | | (1,218,841 | ) | | |
| | | |
Net decrease | | | (144,223 | ) | | | (269,098 | ) | | | | $ | (1,560,143 | ) | | $ | (2,966,582 | ) | | |
| | | |
| | | | | | | | | | | | | | | | | | | | |
| | | | |
| ALLIANCEBERNSTEIN MUNICIPAL INCOME FUND II • | | | 117 | |
Notes to Financial Statements
| | | | | | | | | | | | | | | | | | | | |
| | | | | | | | | | | | | | | | | | | | |
| | | Massachusetts Portfolio | | | |
| | | Shares | | | | | Amount | | | |
| | | Year Ended
September 30,
2011 | | | Year Ended
September 30,
2010 | | | | | Year Ended
September 30,
2011 | | | Year Ended
September 30,
2010 | | | |
| | | | | | |
| Class C | | | | | | | | | | | | | | | | | | | | |
Shares sold | | | 873,484 | | | | 2,167,029 | | | | | $ | 9,537,803 | | | $ | 23,848,459 | | | |
| | | |
Shares issued in reinvestment of dividends | | | 121,459 | | | | 108,387 | | | | | | 1,323,729 | | | | 1,194,412 | | | |
| | | |
Shares redeemed | | | (1,512,048 | ) | | | (635,506 | ) | | | | | (16,368,476 | ) | | | (7,042,599 | ) | | |
| | | |
Net increase (decrease) | | | (517,105 | ) | | | 1,639,910 | | | | | $ | (5,506,944 | ) | | $ | 18,000,272 | | | |
| | | |
| | | | | | | | | | | | | | | | | | | | |
| | | | | | | | | | | | | | | | | | | | |
| | | Michigan Portfolio | | | |
| | | Shares | | | | | Amount | | | |
| | | Year Ended
September 30,
2011 | | | Year Ended
September 30,
2010 | | | | | Year Ended
September 30,
2011 | | | Year Ended
September 30,
2010 | | | |
| | | | | | |
| Class A | | | | | | | | | | | | | | | | | | | | |
Shares sold | | | 890,286 | | | | 944,052 | | | | | $ | 9,445,590 | | | $ | 10,134,042 | | | |
| | | |
Shares issued in reinvestment of dividends | | | 169,080 | | | | 180,595 | | | | | | 1,793,928 | | | | 1,937,491 | | | |
| | | |
Shares converted from Class B | | | 87,033 | | | | 138,150 | | | | | | 921,552 | | | | 1,479,075 | | | |
| | | |
Shares redeemed | | | (1,758,547 | ) | | | (1,353,398 | ) | | | | | (18,531,430 | ) | | | (14,521,834 | ) | | |
| | | |
Net decrease | | | (612,148 | ) | | | (90,601 | ) | | | | $ | (6,370,360 | ) | | $ | (971,226 | ) | | |
| | | |
| | | | | | | | | | | | | | | | | | | | |
| Class B | | | | | | | | | | | | | | | | | | | | |
Shares sold | | | 11,786 | | | | 12,560 | | | | | $ | 126,664 | | | $ | 135,155 | | | |
| | | |
Shares issued in reinvestment of dividends | | | 6,176 | | | | 9,940 | | | | | | 65,375 | | | | 106,370 | | | |
| | | |
Shares converted to Class A | | | (87,184 | ) | | | (138,396 | ) | | | | | (921,552 | ) | | | (1,479,075 | ) | | |
| | | |
Shares redeemed | | | (92,679 | ) | | | (89,717 | ) | | | | | (984,143 | ) | | | (962,177 | ) | | |
| | | |
Net decrease | | | (161,901 | ) | | | (205,613 | ) | | | | $ | (1,713,656 | ) | | $ | (2,199,727 | ) | | |
| | | |
| | | | | | | | | | | | | | | | | | | | |
| Class C | | | | | | | | | | | | | | | | | | | | |
Shares sold | | | 213,551 | | | | 531,668 | | | | | $ | 2,268,271 | | | $ | 5,695,213 | | | |
| | | |
Shares issued in reinvestment of dividends | | | 73,645 | | | | 73,992 | | | | | | 780,167 | | | | 792,800 | | | |
| | | |
Shares redeemed | | | (897,889 | ) | | | (645,737 | ) | | | | | (9,518,406 | ) | | | (6,907,336 | ) | | |
| | | |
Net decrease | | | (610,693 | ) | | | (40,077 | ) | | | | $ | (6,469,968 | ) | | $ | (419,323 | ) | | |
| | | |
| | |
| 118 | | • ALLIANCEBERNSTEIN MUNICIPAL INCOME FUND II |
Notes to Financial Statements
| | | | | | | | | | | | | | | | | | | | |
| | | | | | | | | | | | | | | | | | | | |
| | | Minnesota Portfolio | | | |
| | | Shares | | | | | Amount | | | |
| | | Year Ended
September 30,
2011 | | | Year Ended
September 30,
2010 | | | | | Year Ended
September 30,
2011 | | | Year Ended
September 30,
2010 | | | |
| | | | | | |
| Class A | | | | | | | | | | | | | | | | | | | | |
Shares sold | | | 1,618,138 | | | | 2,295,077 | | | | | $ | 16,281,059 | | | $ | 23,218,071 | | | |
| | | |
Shares issued in reinvestment of dividends | | | 188,716 | | | | 190,492 | | | | | | 1,898,874 | | | | 1,930,757 | | | |
| | | |
Shares converted from Class B | | | 13,863 | | | | 37,663 | | | | | | 139,961 | | | | 382,495 | | | |
| | | |
Shares redeemed | | | (3,801,092 | ) | | | (1,400,169 | ) | | | | | (37,932,172 | ) | | | (14,196,749 | ) | | |
| | | |
Net increase (decrease) | | | (1,980,375 | ) | | | 1,123,063 | | | | | $ | (19,612,278 | ) | | $ | 11,334,574 | | | |
| | | |
| | | | | | | | | | | | | | | | | | | | |
| Class B | | | | | | | | | | | | | | | | | | | | |
Shares sold | | | 1,114 | | | | 1,956 | | | | | $ | 11,318 | | | $ | 19,750 | | | |
| | | |
Shares issued in reinvestment of dividends | | | 971 | | | | 1,684 | | | | | | 9,769 | | | | 17,028 | | | |
| | | |
Shares converted to Class A | | | (13,863 | ) | | | (37,667 | ) | | | | | (139,961 | ) | | | (382,495 | ) | | |
| | | |
Shares redeemed | | | (11,106 | ) | | | (15,185 | ) | | | | | (112,822 | ) | | | (154,845 | ) | | |
| | | |
Net decrease | | | (22,884 | ) | | | (49,212 | ) | | | | $ | (231,696 | ) | | $ | (500,562 | ) | | |
| | | |
| | | | | | | | | | | | | | | | | | | | |
| Class C | | | | | | | | | | | | | | | | | | | | |
Shares sold | | | 420,125 | | | | 608,333 | | | | | $ | 4,242,625 | | | $ | 6,196,160 | | | |
| | | |
Shares issued in reinvestment of dividends | | | 42,002 | | | | 34,423 | | | | | | 423,208 | | | | 349,107 | | | |
| | | |
Shares redeemed | | | (597,343 | ) | | | (335,897 | ) | | | | | (5,964,930 | ) | | | (3,399,020 | ) | | |
| | | |
Net increase (decrease) | | | (135,216 | ) | | | 306,859 | | | | | $ | (1,299,097 | ) | | $ | 3,146,247 | | | |
| | | |
| | | | | | | | | | | | | | | | | | | | |
| | | | | | | | | | | | | | | | | | | | |
| | | New Jersey Portfolio | | | |
| | | Shares | | | | | Amount | | | |
| | | Year Ended
September 30,
2011 | | | Year Ended
September 30,
2010 | | | | | Year Ended
September 30,
2011 | | | Year Ended
September 30,
2010 | | | |
| | | | | | |
| Class A | | | | | | | | | | | | | | | | | | | | |
Shares sold | | | 3,446,517 | | | | 1,443,475 | | | | | $ | 32,409,455 | | | $ | 13,767,441 | | | |
| | | |
Shares issued in reinvestment of dividends | | | 217,442 | | | | 255,850 | | | | | | 2,062,490 | | | | 2,450,632 | | | |
| | | |
Shares converted from Class B | | | 121,602 | | | | 271,674 | | | | | | 1,155,478 | | | | 2,594,437 | | | |
| | | |
Shares redeemed | | | (4,732,290 | ) | | | (2,489,943 | ) | | | | | (44,496,945 | ) | | | (23,776,630 | ) | | |
| | | |
Net decrease | | | (946,729 | ) | | | (518,944 | ) | | | | $ | (8,869,522 | ) | | $ | (4,964,120 | ) | | |
| | | |
| | | | | | | | | | | | | | | | | | | | |
| | | | |
| ALLIANCEBERNSTEIN MUNICIPAL INCOME FUND II • | | | 119 | |
Notes to Financial Statements
| | | | | | | | | | | | | | | | | | | | |
| | | | | | | | | | | | | | | | | | | | |
| | | New Jersey Portfolio | | | |
| | | Shares | | | | | Amount | | | |
| | | Year Ended
September 30,
2011 | | | Year Ended
September 30,
2010 | | | | | Year Ended
September 30,
2011 | | | Year Ended
September 30,
2010 | | | |
| | | | | | |
| Class B | | | | | | | | | | | | | | | | | | | | |
Shares sold | | | 17,781 | | | | 15,916 | | | | | $ | 165,930 | | | $ | 152,156 | | | |
| | | |
Shares issued in reinvestment of dividends | | | 9,226 | | | | 16,193 | | | | | | 87,448 | | | | 154,829 | | | |
| | | |
Shares converted to Class A | | | (121,590 | ) | | | (271,624 | ) | | | | | (1,155,478 | ) | | | (2,594,437 | ) | | |
| | | |
Shares redeemed | | | (95,148 | ) | | | (119,528 | ) | | | | | (894,707 | ) | | | (1,141,057 | ) | | |
| | | |
Net decrease | | | (189,731 | ) | | | (359,043 | ) | | | | $ | (1,796,807 | ) | | $ | (3,428,509 | ) | | |
| | | |
| | | | | | | | | | | | | | | | | | | | |
| Class C | | | | | | | | | | | | | | | | | | | | |
Shares sold | | | 319,820 | | | | 574,812 | | | | | $ | 3,054,990 | | | $ | 5,508,908 | | | |
| | | |
Shares issued in reinvestment of dividends | | | 91,883 | | | | 92,948 | | | | | | 871,051 | | | | 890,941 | | | |
| | | |
Shares redeemed | | | (835,459 | ) | | | (441,247 | ) | | | | | (7,864,920 | ) | | | (4,224,679 | ) | | |
| | | |
Net increase (decrease) | | | (423,756 | ) | | | 226,513 | | | | | $ | (3,938,879 | ) | | $ | 2,175,170 | | | |
| | | |
| | | | | | | | | | | | | | | | | | | | |
| | | | | | | | | | | | | | | | | | | | |
| | | Ohio Portfolio | | | |
| | | Shares | | | | | Amount | | | |
| | | Year Ended
September 30,
2011 | | | Year Ended
September 30,
2010 | | | | | Year Ended
September 30,
2011 | | | Year Ended
September 30,
2010 | | | |
| | | | | | |
| Class A | | | | | | | | | | | | | | | | | | | | |
Shares sold | | | 2,725,965 | | | | 1,767,927 | | | | | $ | 27,294,711 | | | $ | 17,766,498 | | | |
| | | |
Shares issued in reinvestment of dividends | | | 271,008 | | | | 278,911 | | | | | | 2,713,237 | | | | 2,802,723 | | | |
| | | |
Shares converted from Class B | | | 110,335 | | | | 256,168 | | | | | | 1,106,167 | | | | 2,568,886 | | | |
| | | |
Shares redeemed | | | (4,500,647 | ) | | | (1,565,445 | ) | | | | | (44,572,327 | ) | | | (15,731,710 | ) | | |
| | | |
Net increase (decrease) | | | (1,393,339 | ) | | | 737,561 | | | | | $ | (13,458,212 | ) | | $ | 7,406,397 | | | |
| | | |
| | | | | | | | | | | | | | | | | | | | |
| Class B | | | | | | | | | | | | | | | | | | | | |
Shares sold | | | 3,846 | | | | 16,435 | | | | | $ | 38,806 | | | $ | 164,786 | | | |
| | | |
Shares issued in reinvestment of dividends | | | 9,074 | | | | 16,274 | | | | | | 92,220 | | | | 163,118 | | | |
| | | |
Shares converted to Class A | | | (110,471 | ) | | | (256,438 | ) | | | | | (1,106,167 | ) | | | (2,568,886 | ) | | |
| | | |
Shares redeemed | | | (89,142 | ) | | | (107,716 | ) | | | | | (884,047 | ) | | | (1,076,525 | ) | | |
| | | |
Net decrease | | | (186,693 | ) | | | (331,445 | ) | | | | $ | (1,859,188 | ) | | $ | (3,317,507 | ) | | |
| | | |
| | | | | | | | | | | | | | | | | | | | |
| | |
| 120 | | • ALLIANCEBERNSTEIN MUNICIPAL INCOME FUND II |
Notes to Financial Statements
| | | | | | | | | | | | | | | | | | | | |
| | | | | | | | | | | | | | | | | | | | |
| | | Ohio Portfolio | | | |
| | | Shares | | | | | Amount | | | |
| | | Year Ended
September 30,
2011 | | | Year Ended
September 30,
2010 | | | | | Year Ended
September 30,
2011 | | | Year Ended
September 30,
2010 | | | |
| | | | | | |
| Class C | | | | | | | | | | | | | | | | | | | | |
Shares sold | | | 415,581 | | | | 601,639 | | | | | $ | 4,153,464 | | | $ | 6,051,365 | | | |
| | | |
Shares issued in reinvestment of dividends | | | 87,461 | | | | 91,196 | | | | | | 875,370 | | | | 915,850 | | | |
| | | |
Shares redeemed | | | (768,105 | ) | | | (411,498 | ) | | | | | (7,666,665 | ) | | | (4,133,771 | ) | | |
| | | |
Net increase (decrease) | | | (265,063 | ) | | | 281,337 | | | | | $ | (2,637,831 | ) | | $ | 2,833,444 | | | |
| | | |
| | | | | | | | | | | | | | | | | | | | |
| | | | | | | | | | | | | | | | | | | | |
| | | Pennsylvania Portfolio | | | |
| | | Shares | | | | | Amount | | | |
| | | Year Ended
September 30,
2011 | | | Year Ended
September 30,
2010 | | | | | Year Ended
September 30,
2011 | | | Year Ended
September 30,
2010 | | | |
| | | | | | |
| Class A | | | | | | | | | | | | | | | | | | | | |
Shares sold | | | 1,488,345 | | | | 932,071 | | | | | $ | 15,015,035 | | | $ | 9,571,046 | | | |
| | | |
Shares issued in reinvestment of dividends and distributions | | | 278,023 | | | | 228,570 | | | | | | 2,812,607 | | | | 2,352,730 | | | |
| | | |
Shares converted from Class B | | | 106,214 | | | | 188,514 | | | | | | 1,077,725 | | | | 1,935,268 | | | |
| | | |
Shares redeemed | | | (2,100,612 | ) | | | (1,419,314 | ) | | | | | (21,182,794 | ) | | | (14,595,766 | ) | | |
| | | |
Net decrease | | | (228,030 | ) | | | (70,159 | ) | | | | $ | (2,277,427 | ) | | $ | (736,722 | ) | | |
| | | |
| | | | | | | | | | | | | | | | | | | | |
| Class B | | | | | | | | | | | | | | | | | | | | |
Shares sold | | | 4,765 | | | | 20,934 | | | | | $ | 49,050 | | | $ | 214,841 | | | |
| | | |
Shares issued in reinvestment of dividends and distributions | | | 10,243 | | | | 11,560 | | | | | | 103,534 | | | | 118,886 | | | |
| | | |
Shares converted to Class A | | | (106,214 | ) | | | (188,514 | ) | | | | | (1,077,725 | ) | | | (1,935,268 | ) | | |
| | | |
Shares redeemed | | | (45,713 | ) | | | (97,729 | ) | | | | | (465,395 | ) | | | (1,001,391 | ) | | |
| | | |
Net decrease | | | (136,919 | ) | | | (253,749 | ) | | | | $ | (1,390,536 | ) | | $ | (2,602,932 | ) | | |
| | | |
| | | | | | | | | | | | | | | | | | | | |
| Class C | | | | | | | | | | | | | | | | | | | | |
Shares sold | | | 150,174 | | | | 230,578 | | | | | $ | 1,533,173 | | | $ | 2,379,445 | | | |
| | | |
Shares issued in reinvestment of dividends and distributions | | | 77,191 | | | | 59,707 | | | | | | 780,289 | | | | 614,585 | | | |
| | | |
Shares redeemed | | | (483,348 | ) | | | (351,587 | ) | | | | | (4,890,820 | ) | | | (3,612,249 | ) | | |
| | | |
Net decrease | | | (255,983 | ) | | | (61,302 | ) | | | | $ | (2,577,358 | ) | | $ | (618,219 | ) | | |
| | | |
| | | | |
| ALLIANCEBERNSTEIN MUNICIPAL INCOME FUND II • | | | 121 | |
Notes to Financial Statements
| | | | | | | | | | | | | | | | | | | | |
| | | | | | | | | | | | | | | | | | | | |
| | | Virginia Portfolio | | | |
| | | Shares | | | | | Amount | | | |
| | | Year Ended
September 30,
2011 | | | Year Ended
September 30,
2010 | | | | | Year Ended
September 30,
2011 | | | Year Ended
September 30,
2010 | | | |
| | | | | | |
| Class A | | | | | | | | | | | | | | | | | | | | |
Shares sold | | | 2,584,329 | | | | 3,844,511 | | | | | $ | 27,857,809 | | | $ | 41,509,568 | | | |
| | | |
Shares issued in reinvestment of dividends and distributions | | | 432,883 | | | | 381,966 | | | | | | 4,653,349 | | | | 4,125,389 | | | |
| | | |
Shares converted from Class B | | | 84,190 | | | | 155,217 | | | | | | 907,102 | | | | 1,679,390 | | | |
| | | |
Shares redeemed | | | (4,547,817 | ) | | | (2,365,279 | ) | | | | | (48,598,379 | ) | | | (25,560,367 | ) | | |
| | | |
Net increase (decrease) | | | (1,446,415 | ) | | | 2,016,415 | | | | | $ | (15,180,119 | ) | | $ | 21,753,980 | | | |
| | | |
| | | | | | | | | | | | | | | | | | | | |
| Class B | | | | | | | | | | | | | | | | | | | | |
Shares sold | | | 6,543 | | | | 11,214 | | | | | $ | 68,911 | | | $ | 120,553 | | | |
| | | |
Shares issued in reinvestment of dividends and distributions | | | 8,285 | | | | 10,821 | | | | | | 88,752 | | | | 116,493 | | | |
| | | |
Shares converted to Class A | | | (84,338 | ) | | | (155,504 | ) | | | | | (907,102 | ) | | | (1,679,390 | ) | | |
| | | |
Shares redeemed | | | (78,248 | ) | | | (44,446 | ) | | | | | (830,609 | ) | | | (477,327 | ) | | |
| | | |
Net decrease | | | (147,758 | ) | | | (177,915 | ) | | | | $ | (1,580,048 | ) | | $ | (1,919,671 | ) | | |
| | | |
| | | | | | | | | | | | | | | | | | | | |
| Class C | | | | | | | | | | | | | | | | | | | | |
Shares sold | | | 848,553 | | | | 1,218,547 | | | | | $ | 9,190,276 | | | $ | 13,124,982 | | | |
| | | |
Shares issued in reinvestment of dividends and distributions | | | 137,221 | | | | 106,939 | | | | | | 1,470,979 | | | | 1,152,477 | | | |
| | | |
Shares redeemed | | | (901,111 | ) | | | (450,025 | ) | | | | | (9,592,574 | ) | | | (4,854,272 | ) | | |
| | | |
Net increase | | | 84,663 | | | | 875,461 | | | | | $ | 1,068,681 | | | $ | 9,423,187 | | | |
| | | |
NOTE F
Risks Involved in Investing in the Portfolios
Municipal Market Risk and Concentration of Credit Risk—This is the risk that special factors may adversely affect the value of municipal securities and have a significant effect on the yield or value of the Portfolios’ investments in municipal securities. These factors include economic conditions, political or legislative changes, uncertainties related to the tax status of municipal securities, or the rights of investors in these securities. The Portfolios of the AllianceBernstein Municipal Income Fund II are State Portfolios that may invest a large portion of their assets in a particular state’s municipal securities and their various political subdivisions. To the extent that these Portfolios invest more of their assets in a particular state’s municipal securities, these Portfolios may be vulnerable to
| | |
| 122 | | • ALLIANCEBERNSTEIN MUNICIPAL INCOME FUND II |
Notes to Financial Statements
events adversely affecting that state, including economic, political and regulatory occurrences, court decisions, terrorism and catastrophic natural disasters, such as hurricanes or earthquakes. These Portfolios’ investments in certain municipal securities with principal and interest payments that are made from the revenues of a specific project or facility, and not general tax revenues, may have increased risks. Factors affecting the project or facility, such as local business or economic conditions, could have a significant effect on the project’s ability to make payments of principal and interest on these securities.
Derivatives Risk—The Portfolios may enter into derivative transactions such as forwards, options, futures and swaps. Derivatives may be illiquid, difficult to price, and leveraged so that small changes may produce disproportionate losses for the Portfolios, and subject to counterparty risk to a greater degree than more traditional investments. Derivatives may result in significant losses, including losses that are far greater than the value of the derivatives reflected in the statement of assets and liabilities.
Indemnification Risk—In the ordinary course of business, the Portfolios enter into contracts that contain a variety of indemnifications. The Portfolios’ maximum exposure under these arrangements is unknown. However, the Portfolios have not had prior claims or losses pursuant to these indemnification provisions and expect the risk of loss thereunder to be remote. Therefore, the Portfolios have not accrued any liability in connection with these indemnification provisions.
NOTE G
Joint Credit Facility
A number of open-end mutual funds managed by the Adviser, including the Portfolios, participate in a $140 million revolving credit facility (the “Facility”) intended to provide short-term financing, if necessary, subject to certain restrictions in connection with abnormal redemption activity. Commitment fees related to the Facility are paid by the participating funds and are included in miscellaneous expenses in the statement of operations. The Portfolios did not utilize the Facility during the year ended September 30, 2011.
NOTE H
Distributions to Shareholders
The tax character of distributions paid during the fiscal years ended September 30, 2011 and September 30, 2010 were as follows:
| | | | | | | | |
| Arizona Portfolio | | 2011 | | | 2010 | |
Distributions paid from: | | | | | | | | |
Ordinary income | | $ | 115,128 | | | $ | 54,515 | |
Net long-term capital gains | | | 1,432,139 | | | | – 0 | – |
| | | | | | | | |
Total taxable distributions paid | | | 1,547,267 | | | | 54,515 | |
Tax exempt distributions | | | 7,199,969 | | | | 7,928,472 | |
| | | | | | | | |
Total distributions paid | | $ | 8,747,236 | | | $ | 7,982,987 | |
| | | | | | | | |
| | | | |
| ALLIANCEBERNSTEIN MUNICIPAL INCOME FUND II • | | | 123 | |
Notes to Financial Statements
As of September 30, 2011, the components of accumulated earnings/(deficit) on a tax basis were as follows:
| | | | |
Accumulated capital and other losses | | $ | (810,136 | )(a) |
Unrealized appreciation/(depreciation) | | | 3,654,594 | (b) |
| | | | |
Total accumulated earnings/(deficit) | | $ | 2,844,458 | (c) |
| | | | |
| (a) | | At September 30, 2011, the Portfolio elected to defer $810,136 of capital losses that are deemed to arise on October 1, 2011. |
| (b) | | The difference between book-basis and tax-basis unrealized appreciation/(depreciation) is attributable primarily to the difference between the book and tax treatment of swap income. |
| (c) | | The difference between book-basis and tax-basis components of accumulated earnings/(deficit) is attributable to dividends payable. |
During the current fiscal year, permanent differences primarily due to the tax treatment of swaps and redesignations of distributions resulted in a net decrease in distributions in excess of net investment income, a net decrease in accumulated net realized loss on investment transactions, and a net decrease in additional paid-in capital. These reclassifications had no effect on net assets.
| | | | | | | | |
| Massachusetts Portfolio | | 2011 | | | 2010 | |
Distributions paid from: | | | | | | | | |
Ordinary income | | $ | 406,498 | | | $ | 399,273 | |
Tax-exempt income | | | 9,006,772 | | | | 7,934,498 | |
| | | | | | | | |
Total distributions paid | | $ | 9,413,270 | | | $ | 8,333,771 | |
| | | | | | | | |
As of September 30, 2011, the components of accumulated earnings/(deficit) on a tax basis were as follows:
| | | | |
Undistributed tax-exempt net investment income | | $ | 126,674 | |
Accumulated capital and other losses | | | – 0 | –(a) |
Unrealized appreciation/(depreciation) | | | 15,123,084 | (b) |
| | | | |
Total accumulated earnings/(deficit) | | $ | 15,249,758 | (c) |
| | | | |
| (a) | | During the fiscal year ended September 30, 2011, the Portfolio utilized capital loss carryforwards of $492,421. Additionally, the Portfolio had capital loss carryforwards of $1,306,001 expire in the current fiscal year. |
| (b) | | The difference between book-basis and tax-basis unrealized appreciation/(depreciation) is attributable primarily to the difference between the book and tax treatment of swap income. |
| (c) | | The difference between book-basis and tax-basis components of accumulated earnings/(deficit) is attributable to dividends payable. |
During the current fiscal year, permanent differences primarily due to the tax treatment of swaps and the expiration of capital loss carryforwards resulted in a net decrease in distributions in excess of net investment income, a net decrease in accumulated net realized loss on investment transactions, and a net decrease in additional paid-in capital. These reclassifications had no effect on net assets.
| | |
| 124 | | • ALLIANCEBERNSTEIN MUNICIPAL INCOME FUND II |
Notes to Financial Statements
| | | | | | | | |
| Michigan Portfolio | | 2011 | | | 2010 | |
Distributions paid from: | | | | | | | | |
Ordinary income | | $ | 193,368 | | | $ | 194,950 | |
Net long-term capital gains | | | 7,782 | | | | – 0 | – |
| | | | | | | | |
Total taxable distributions paid | | | 201,150 | | | | 194,950 | |
Tax exempt distributions | | | 3,640,897 | | | | 3,869,044 | |
| | | | | | | | |
Total distributions paid | | $ | 3,842,047 | | | $ | 4,063,994 | |
| | | | | | | | |
As of September 30, 2011, the components of accumulated earnings/(deficit) on a tax basis were as follows:
| | | | |
Undistributed net long-term capital gain | | $ | 46,396 | (a) |
Unrealized appreciation/(depreciation) | | | 3,992,877 | (b) |
| | | | |
Total accumulated earnings/(deficit) | | $ | 4,039,273 | (c) |
| | | | |
| (a) | | During the fiscal year ended September 30, 2011, the Portfolio utilized capital loss carryforwards of $72,401. |
| (b) | | The difference between book-basis and tax-basis unrealized appreciation/(depreciation) is attributable primarily to the difference between the book and tax treatment of swap income. |
| (c) | | The difference between book-basis and tax-basis components of accumulated earnings/(deficit) is attributable to dividends payable. |
During the current fiscal year, permanent differences primarily due to the tax treatment of swaps and redesignations of distributions resulted in a net decrease in distributions in excess of net investment income and a net decrease in accumulated net realized gain on investment transactions. These reclassifications had no effect on net assets.
| | | | | | | | |
| Minnesota Portfolio | | 2011 | | | 2010 | |
Distributions paid from: | | | | | | | | |
Ordinary income | | $ | 113,207 | | | $ | 114,591 | |
Tax-exempt income | | | 3,856,317 | | | | 3,640,654 | |
| | | | | | | | |
Total distributions paid | | $ | 3,969,524 | | | $ | 3,755,245 | |
| | | | | | | | |
As of September 30, 2011, the components of accumulated earnings/(deficit) on a tax basis were as follows:
| | | | |
Undistributed tax-exempt net investment income | | $ | 6,444 | |
Accumulated capital and other losses | | | (171,573 | )(a) |
Unrealized appreciation/(depreciation) | | | 5,010,901 | (b) |
| | | | |
Total accumulated earnings/(deficit) | | $ | 4,845,772 | (c) |
| | | | |
| (a) | | On September 30, 2011, the Portfolio had a net capital loss carryforward for federal income tax purposes of $140,036 which expires in the year 2013. To the extent future capital gains are offset by capital loss carryforwards, such gains will not be distributed. At September 30, 2011, the Portfolio elected to defer $31,537 of capital losses that are deemed to arise on October 1, 2011. |
| | | | |
| ALLIANCEBERNSTEIN MUNICIPAL INCOME FUND II • | | | 125 | |
Notes to Financial Statements
| (b) | | The differences between book-basis and tax-basis unrealized appreciation/(depreciation) are attributable primarily to the tax deferral of losses on wash sales, and the difference between the book and tax treatment of swap income. |
| (c) | | The difference between book-basis and tax-basis components of accumulated earnings/(deficit) is attributable to dividends payable. |
During the current fiscal year, permanent differences primarily due to the tax treatment of swaps resulted in a net decrease in distributions in excess of net investment income and a corresponding net increase in accumulated net realized loss on investment transactions. This reclassification had no effect on net assets.
| | | | | | | | |
| New Jersey Portfolio | | 2011 | | | 2010 | |
Distributions paid from: | | | | | | | | |
Ordinary income | | $ | 124,568 | | | $ | 118,779 | |
Tax-exempt income | | | 6,173,553 | | | | 6,735,197 | |
| | | | | | | | |
Total distributions paid | | $ | 6,298,121 | | | $ | 6,853,976 | |
| | | | | | | | |
As of September 30, 2011, the components of accumulated earnings/(deficit) on a tax basis were as follows:
| | | | |
Accumulated capital and other losses | | $ | (1,244,253 | )(a) |
Unrealized appreciation/(depreciation) | | | 5,583,670 | (b) |
| | | | |
Total accumulated earnings/(deficit) | | $ | 4,339,417 | (c) |
| | | | |
| (a) | | On September 30, 2011, the Portfolio had a net capital loss carryforward for federal income tax purposes of $1,191,596 of which $364,906 expires in the year 2012, $731,070 expires in the year 2018 and $95,620 expires in the year 2019. To the extent future capital gains are offset by capital loss carryforwards, such gains will not be distributed. The Portfolio had a capital loss carryforward expire in the amount of $5,617,272 in the current fiscal year. Additionally, at September 30, 2011 the Portfolio elected to defer $52,657 of capital losses that are deemed to arise on October 1, 2011. |
| (b) | | The differences between book-basis and tax-basis unrealized appreciation/(depreciation) are attributable primarily to the tax deferral of losses on wash sales and the difference between book and tax treatment of swap income. |
| (c) | | The difference between book-basis and tax-basis components of accumulated earnings/(deficit) is attributable to dividends payable. |
During the current fiscal year, permanent differences primarily due to the tax treatment of swaps, redesignations of distributions, and a capital loss carryforward expiration resulted in a net decrease in distributions in excess of net investment income, a net decrease in accumulated net realized loss on investment transactions, and a net decrease in additional paid-in capital. These reclassifications had no effect on net assets.
| | | | | | | | |
| Ohio Portfolio | | 2011 | | | 2010 | |
Distributions paid from: | | | | | | | | |
Ordinary income | | $ | 123,769 | | | $ | 121,389 | |
Tax-exempt income | | | 5,456,664 | | | | 5,759,367 | |
| | | | | | | | |
Total distributions paid | | $ | 5,580,433 | | | $ | 5,880,756 | |
| | | | | | | | |
| | |
| 126 | | • ALLIANCEBERNSTEIN MUNICIPAL INCOME FUND II |
Notes to Financial Statements
As of September 30, 2011, the components of accumulated earnings/(deficit) on a tax basis were as follows:
| | | | |
Undistributed tax-exempt net investment income | | $ | 16,920 | |
Accumulated capital and other losses | | | (37,605 | )(a) |
Unrealized appreciation/(depreciation) | | | 5,251,486 | (b) |
| | | | |
Total accumulated earnings/(deficit) | | $ | 5,230,801 | (c) |
| | | | |
| (a) | | On September 30, 2011, the Portfolio had a net capital loss carryforward for federal income tax purposes of $37,605 which expires in the year 2012. To the extent future capital gains are offset by capital loss carryforwards, such gains will not be distributed. During the fiscal year ended September 30, 2011, the Portfolio utilized capital loss carryforwards of $368,584. Additionally, the Portfolio had capital loss carryforwards of $3,246,450 expire in the current fiscal year. |
| (b) | | The difference between book-basis and tax-basis unrealized appreciation/(depreciation) is attributable primarily to the difference between book and tax treatment of swap income. |
| (c) | | The difference between book-basis and tax-basis components of accumulated earnings/(deficit) is attributable to dividends payable. |
During the current fiscal year, permanent differences primarily due to the tax treatment of swaps and the expiration of capital loss carryforwards resulted in a net decrease in distributions in excess of net investment income, a net decrease in accumulated net realized loss on investment transactions, and a net decrease in additional paid-in-capital. These reclassifications had no effect on net assets.
| | | | | | | | |
| Pennsylvania Portfolio | | 2011 | | | 2010 | |
Distributions paid from: | | | | | | | | |
Ordinary income | | $ | 51,108 | | | $ | 51,805 | |
Net long-term capital gains | | | 1,217,967 | | | | – 0 | – |
| | | | | | | | |
Total taxable distributions paid | | | 1,269,075 | | | | 51,805 | |
Tax exempt distributions | | | 4,783,712 | | | | 4,994,998 | |
| | | | | | | | |
Total distributions paid | | $ | 6,052,787 | | | $ | 5,046,803 | |
| | | | | | | | |
As of September 30, 2011, the components of accumulated earnings/(deficit) on a tax basis were as follows:
| | | | |
Undistributed net long-term capital gain | | $ | 101,122 | |
Unrealized appreciation/(depreciation) | | | 3,586,895 | |
| | | | |
Total accumulated earnings/(deficit) | | $ | 3,688,017 | (a) |
| | | | |
| (a) | | The difference between book-basis and tax-basis components of accumulated earnings/(deficit) is attributable to dividends payable. |
During the current fiscal year, permanent differences primarily due to a redesignation of distributions resulted in a net decrease in distributions in excess of net investment income and a net decrease in accumulated net realized gain on investment transactions. This reclassification had no effect on net assets.
| | | | |
| ALLIANCEBERNSTEIN MUNICIPAL INCOME FUND II • | | | 127 | |
Notes to Financial Statements
| | | | | | | | |
| Virginia Portfolio | | 2011 | | | 2010 | |
Distributions paid from: | | | | | | | | |
Ordinary income | | $ | 302,697 | | | $ | 219,714 | |
Net long-term capital gains | | | 338,080 | | | | – 0 | – |
| | | | | | | | |
Total taxable distributions paid | | | 640,777 | | | | 219,714 | |
Tax exempt distributions | | | 9,138,159 | | | | 8,621,611 | |
| | | | | | | | |
Total distributions paid | | $ | 9,778,936 | | | $ | 8,841,325 | |
| | | | | | | | |
As of September 30, 2011, the components of accumulated earnings/(deficit) on a tax basis were as follows:
| | | | |
Undistributed tax-exempt net investment income | | $ | 241,888 | |
Undistributed net long-term capital gain | | | 1,007,693 | |
Unrealized appreciation/(depreciation) | | | 11,287,004 | (a) |
| | | | |
Total accumulated earnings/(deficit) | | $ | 12,536,585 | (b) |
| | | | |
| (a) | | The differences between book-basis and tax-basis unrealized appreciation/(depreciation) are attributable primarily to the tax deferral of losses on wash sales and the difference between book and tax treatment of swap income. |
| (b) | | The difference between book-basis and tax-basis components of accumulated earnings/(deficit) is attributable to dividends payable. |
During the current fiscal year, permanent differences primarily due to the tax treatment of swaps and redesignations of distributions resulted in a net decrease in distributions in excess of net investment income and a net decrease in accumulated net realized gain on investment transactions. These reclassifications had no effect on net assets.
NOTE I
Recent Accounting Pronouncement
In May 2011, the Financial Accounting Standards Board (“FASB”) issued an Accounting Standards Update (“ASU”) to develop common requirements for measuring fair value and for disclosing information about fair value measurements in U.S. GAAP and International Financial Reporting Standards (“IFRS”). The amendments are intended to improve the comparability of fair value measurements presented and disclosed in the financial statements prepared in accordance with U.S. GAAP and IFRS. The ASU is effective during interim or annual periods beginning after December 15, 2011. At this time, management is evaluating the implication of this ASU and its impact on the financial statements has not been determined.
NOTE J
Subsequent Events
Management has evaluated subsequent events for possible recognition or disclosure in the financial statements through the date the financial statements are issued. Management has determined that there are no material events that would require disclosure in the Portfolios’ financial statements through this date.
| | |
| 128 | | • ALLIANCEBERNSTEIN MUNICIPAL INCOME FUND II |
Notes to Financial Statements
FINANCIAL HIGHLIGHTS
Selected Data For A Share Of Beneficial Interest Outstanding Throughout Each Period
| | | | | | | | | | | | | | | | | | | | |
| | | Arizona Portfolio | |
| | | Class A | |
| | | Year Ended September 30, | |
| | | 2011 | | | 2010 | | | 2009 | | | 2008 | | | 2007 | |
| | | | |
| | | | | | | | | | | | | | | | | | | | |
Net asset value, beginning
of period | | | $ 11.17 | | | | $ 11.02 | | | | $ 10.28 | | | | $ 10.93 | | | | $ 11.07 | |
| | | | |
Income From Investment Operations | | | | | | | | | | | | | | | | | | | | |
Net investment income(a)(b) | | | .45 | | | | .44 | | | | .45 | | | | .44 | | | | .44 | |
Net realized and unrealized gain (loss) on investment transactions | | | (.13 | ) | | | .15 | | | | .74 | | | | (.65 | ) | | | (.14 | ) |
| | | | |
Net increase (decrease) in net asset value from operations | | | .32 | | | | .59 | | | | 1.19 | | | | (.21 | ) | | | .30 | |
| | | | |
Less: Dividends and Distributions | | | | | | | | | | | | | | | | | | | | |
Dividends from net investment income | | | (.46 | ) | | | (.44 | ) | | | (.45 | ) | | | (.44 | ) | | | (.44 | ) |
Distributions from net realized gain on investment transactions | | | (.08 | ) | | | – 0 | – | | | – 0 | – | | | – 0 | – | | | – 0 | – |
| | | | |
Total dividends and distributions | | | (.54 | ) | | | (.44 | ) | | | (.45 | ) | | | (.44 | ) | | | (.44 | ) |
| | | | |
Net asset value, end of period | | | $ 10.95 | | | | $ 11.17 | | | | $ 11.02 | | | | $ 10.28 | | | | $ 10.93 | |
| | | | |
Total Return | | | | | | | | | | | | | | | | | | | | |
Total investment return based on net asset value(c) | | | 3.07 | % | | | 5.55 | % | | | 11.97 | % | | | (2.08 | )% | | | 2.78 | % |
Ratios/Supplemental Data | | | | | | | | | | | | | | | | | |
Net assets, end of period
(000’s omitted) | �� | | $134,466 | | | | $159,374 | | | | $172,697 | | | | $166,997 | | | | $141,882 | |
Ratio to average net assets of: | | | | | | | | | | | | | | | | | | | | |
Expenses, net of waivers/reimbursements | | | .78 | % | | | .78 | %(d) | | | .78 | % | | | .78 | % | | | .78 | % |
Expenses, before waivers/reimbursements | | | .95 | % | | | .94 | %(d) | | | .93 | % | | | .93 | % | | | .96 | % |
Net investment income(a) | | | 4.22 | % | | | 4.06 | %(d) | | | 4.38 | % | | | 4.02 | % | | | 4.03 | % |
Portfolio turnover rate | | | 2 | % | | | 10 | % | | | 7 | % | | | 25 | % | | | 8 | % |
See footnote summary on page 153.
| | | | |
| ALLIANCEBERNSTEIN MUNICIPAL INCOME FUND II • | | | 129 | |
Financial Highlights
Selected Data For A Share Of Beneficial Interest Outstanding Throughout Each Period
| | | | | | | | | | | | | | | | | | | | |
| | | Arizona Portfolio | |
| | | Class B | |
| | | Year Ended September 30, | |
| | | 2011 | | | 2010 | | | 2009 | | | 2008 | | | 2007 | |
| | | | |
| | | | | | | | | | | | | | | | | | | | |
Net asset value, beginning
of period | | | $ 11.15 | | | | $ 11.01 | | | | $ 10.26 | | | | $ 10.91 | | | | $ 11.05 | |
| | | | |
Income From Investment Operations | | | | | | | | | | | | | | | | | | | | |
Net investment income(a)(b) | | | .38 | | | | .37 | | | | .38 | | | | .36 | | | | .37 | |
Net realized and unrealized gain (loss) on investment transactions | | | (.14 | ) | | | .14 | | | | .75 | | | | (.65 | ) | | | (.15 | ) |
| | | | |
Net increase (decrease) in net asset value from operations | | | .24 | | | | .51 | | | | 1.13 | | | | (.29 | ) | | | .22 | |
| | | | |
Less: Dividends and Distributions | | | | | | | | | | | | | | | | | | | | |
Dividends from net investment income | | | (.38 | ) | | | (.37 | ) | | | (.38 | ) | | | (.36 | ) | | | (.36 | ) |
Distributions from net realized gain on investment transactions | | | (.08 | ) | | | – 0 | – | | | – 0 | – | | | – 0 | – | | | – 0 | – |
| | | | |
Total dividends and distributions | | | (.46 | ) | | | (.37 | ) | | | (.38 | ) | | | (.36 | ) | | | (.36 | ) |
| | | | |
Net asset value, end of period | | | $ 10.93 | | | | $ 11.15 | | | | $ 11.01 | | | | $ 10.26 | | | | $ 10.91 | |
| | | | |
Total Return | | | | | | | | | | | | | | | | | | | | |
Total investment return based on net asset value(c) | | | 2.36 | % | | | 4.74 | % | | | 11.32 | % | | | (2.76 | )% | | | 2.07 | % |
Ratios/Supplemental Data | | | | | | | | | | | | | | | | | | | | |
Net assets, end of period (000’s omitted) | | | $2,330 | | | | $4,535 | | | | $7,409 | | | | $14,485 | | | | $36,136 | |
Ratio to average net assets of: | | | | | | | | | | | | | | | | | | | | |
Expenses, net of waivers/reimbursements | | | 1.48 | % | | | 1.48 | %(d) | | | 1.48 | % | | | 1.48 | % | | | 1.48 | % |
Expenses, before waivers/reimbursements | | | 1.67 | % | | | 1.65 | %(d) | | | 1.65 | % | | | 1.66 | % | | | 1.67 | % |
Net investment
income(a) | | | 3.53 | % | | | 3.37 | %(d) | | | 3.70 | % | | | 3.32 | % | | | 3.33 | % |
Portfolio turnover rate | | | 2 | % | | | 10 | % | | | 7 | % | | | 25 | % | | | 8 | % |
See footnote summary on page 153.
| | |
| 130 | | • ALLIANCEBERNSTEIN MUNICIPAL INCOME FUND II |
Financial Highlights
Selected Data For A Share Of Beneficial Interest Outstanding Throughout Each Period
| | | | | | | | | | | | | | | | | | | | |
| | | Arizona Portfolio | |
| | | Class C | |
| | | Year Ended September 30, | |
| | | 2011 | | | 2010 | | | 2009 | | | 2008 | | | 2007 | |
| | | | |
| | | | | | | | | | | | | | | | | | | | |
Net asset value, beginning of period | | | $ 11.15 | | | | $ 11.01 | | | | $ 10.26 | | | | $ 10.91 | | | | $ 11.05 | |
| | | | |
Income From Investment Operations | | | | | | | | | | | | | | | | | | | | |
Net investment income(a)(b) | | | .38 | | | | .37 | | | | .38 | | | | .36 | | | | .37 | |
Net realized and unrealized gain (loss) on investment transactions | | | (.14 | ) | | | .14 | | | | .75 | | | | (.65 | ) | | | (.14 | ) |
| | | | |
Net increase (decrease) in net asset value from operations | | | .24 | | | | .51 | | | | 1.13 | | | | (.29 | ) | | | .23 | |
| | | | |
Less: Dividends and Distributions | | | | | | | | | | | | | | | | | | | | |
Dividends from net investment income | | | (.38 | ) | | | (.37 | ) | | | (.38 | ) | | | (.36 | ) | | | (.37 | ) |
Distributions from net realized gain on investment transactions | | | (.08 | ) | | | – 0 | – | | | – 0 | – | | | – 0 | – | | | – 0 | – |
| | | | |
Total dividends and distributions | | | (.46 | ) | | | (.37 | ) | | | (.38 | ) | | | (.36 | ) | | | (.37 | ) |
| | | | |
Net asset value, end of period | | | $ 10.93 | | | | $ 11.15 | | | | $ 11.01 | | | | $ 10.26 | | | | $ 10.91 | |
| | | | |
Total Return | | | | | | | | | | | | | | | | | | | | |
Total investment return based on net asset value(c) | | | 2.35 | % | | | 4.74 | % | | | 11.32 | % | | | (2.76 | )% | | | 2.07 | % |
Ratios/Supplemental Data | | | | | | | | | | | | | | | | | |
Net assets, end of period (000’s omitted) | | | $32,103 | | | | $37,623 | | | | $34,975 | | | | $30,000 | | | | $26,474 | |
Ratio to average net assets of: | | | | | | | | | | | | | | | | | | | | |
Expenses, net of waivers/reimbursements | | | 1.48 | % | | | 1.48 | %(d) | | | 1.48 | % | | | 1.48 | % | | | 1.48 | % |
Expenses, before waivers/
reimbursements | | | 1.66 | % | | | 1.64 | %(d) | | | 1.64 | % | | | 1.64 | % | | | 1.66 | % |
Net investment income(a) | | | 3.53 | % | | | 3.37 | %(d) | | | 3.68 | % | | | 3.33 | % | | | 3.34 | % |
Portfolio turnover rate | | | 2 | % | | | 10 | % | | | 7 | % | | | 25 | % | | | 8 | % |
See footnote summary on page 153.
| | | | |
| ALLIANCEBERNSTEIN MUNICIPAL INCOME FUND II • | | | 131 | |
Financial Highlights
Selected Data For A Share Of Beneficial Interest Outstanding Throughout Each Period
| | | | | | | | | | | | | | | | | | | | |
| | | Massachusetts Portfolio | |
| | | Class A | |
| | | Year Ended September 30, | |
| | | 2011 | | | 2010 | | | 2009 | | | 2008 | | | 2007 | |
| | | | |
| | | | | | | | | | | | | | | | | | | | |
Net asset value, beginning of period | | | $ 11.32 | | | | $ 11.08 | | | | $ 10.36 | | | | $ 10.81 | | | | $ 10.94 | |
| | | | |
Income From Investment Operations | | | | | | | | | | | | | | | | | | | | |
Net investment income(a)(b) | | | .38 | | | | .39 | | | | .42 | | | | .42 | | | | .44 | |
Net realized and unrealized gain (loss) on investment transactions | | | (.02 | )† | | | .26 | | | | .74 | | | | (.43 | ) | | | (.13 | ) |
Contributions from Adviser | | | – 0 | – | | | – 0 | – | | | – 0 | – | | | .00 | (e) | | | – 0 | – |
| | | | |
Net increase (decrease) in net asset value from operations | | | .36 | | | | .65 | | | | 1.16 | | | | (.01 | ) | | | .31 | |
| | | | |
Less: Dividends | | | | | | | | | | | | | | | | | | | | |
Dividends from net investment income | | | (.40 | ) | | | (.41 | ) | | | (.44 | ) | | | (.44 | ) | | | (.44 | ) |
| | | | |
Net asset value, end of period | | | $ 11.28 | | | | $ 11.32 | | | | $ 11.08 | | | | $ 10.36 | | | | $ 10.81 | |
| | | | |
Total Return | | | | | | | | | | | | | | | | | | | | |
Total investment return based on net asset value(c) | | | 3.38 | % | | | 6.02 | % | | | 11.50 | % | | | (.22 | )% | | | 2.92 | % |
Ratios/Supplemental Data | | | | | | | | | | | | | | | | | |
Net assets, end of period (000’s omitted) | | | $215,025 | | | | $192,427 | | | | $158,368 | | | | $109,951 | | | | $74,341 | |
Ratio to average net assets of: | | | | | | | | | | | | | | | | | | | | |
Expenses, net of waivers/reimbursements | | | .82 | % | | | .82 | %(d) | | | .82 | % | | | .82 | % | | | .82 | % |
Expenses, before waivers/
reimbursements | | | .89 | % | | | .93 | %(d) | | | .95 | % | | | 1.01 | % | | | 1.06 | % |
Net investment income(a) | | | 3.51 | % | | | 3.50 | %(d) | | | 3.96 | % | | | 3.90 | % | | | 4.08 | % |
Portfolio turnover rate | | | 15 | % | | | 14 | % | | | 7 | % | | | 32 | % | | | 11 | % |
See footnote summary on page 153.
| | |
| 132 | | • ALLIANCEBERNSTEIN MUNICIPAL INCOME FUND II |
Financial Highlights
Selected Data For A Share Of Beneficial Interest Outstanding Throughout Each Period
| | | | | | | | | | | | | | | | | | | | |
| | | Massachusetts Portfolio | |
| | | Class B | |
| | | Year Ended September 30, | |
| | | 2011 | | | 2010 | | | 2009 | | | 2008 | | | 2007 | |
| | | | |
| | | | | | | | | | | | | | | | | | | | |
Net asset value, beginning
of period | | | $ 11.29 | | | | $ 11.06 | | | | $ 10.34 | | | | $ 10.79 | | | | $ 10.92 | |
| | | | |
Income From Investment Operations | | | | | | | | | | | | | | | | | | | | |
Net investment income(a)(b) | | | .30 | | | | .31 | | | | .34 | | | | .34 | | | | .37 | |
Net realized and unrealized gain (loss) on investment transactions | | | (.01 | )† | | | .25 | | | | .75 | | | | (.43 | ) | | | (.13 | ) |
Contributions from
Adviser | | | – 0 | – | | | – 0 | – | | | – 0 | – | | | .00 | (e) | | | – 0 | – |
| | | | |
Net increase (decrease) in
net asset value from operations | | | .29 | | | | .56 | | | | 1.09 | | | | (.09 | ) | | | .24 | |
| | | | |
Less: Dividends | | | | | | | | | | | | | | | | | | | | |
Dividends from net investment income | | | (.33 | ) | | | (.33 | ) | | | (.37 | ) | | | (.36 | ) | | | (.37 | ) |
| | | | |
Net asset value, end of period | | | $ 11.25 | | | | $ 11.29 | | | | $ 11.06 | | | | $ 10.34 | | | | $ 10.79 | |
| | | | |
Total Return | | | | | | | | | | | | | | | | | | | | |
Total investment return
based on net asset value(c) | | | 2.68 | % | | | 5.21 | % | | | 10.75 | % | | | (.91 | )% | | | 2.21 | % |
Ratios/Supplemental Data | | | | | | | | | | | | | | | | | | | | |
Net assets, end of period
(000’s omitted) | | | $3,086 | | | | $4,725 | | | | $7,600 | | | | $13,477 | | | �� | $25,209 | |
Ratio to average net assets of: | | | | | | | | | | | | | | | | | | | | |
Expenses, net of waivers/reimbursements | | | 1.52 | % | | | 1.52 | %(d) | | | 1.52 | % | | | 1.52 | % | | | 1.52 | % |
Expenses, before waivers/reimbursements | | | 1.61 | % | | | 1.64 | %(d) | | | 1.67 | % | | | 1.73 | % | | | 1.77 | % |
Net investment income(a) | | | 2.81 | % | | | 2.82 | %(d) | | | 3.29 | % | | | 3.23 | % | | | 3.38 | % |
Portfolio turnover rate | | | 15 | % | | | 14 | % | | | 7 | % | | | 32 | % | | | 11 | % |
See footnote summary on page 153.
| | | | |
| ALLIANCEBERNSTEIN MUNICIPAL INCOME FUND II • | | | 133 | |
Financial Highlights
Selected Data For A Share Of Beneficial Interest Outstanding Throughout Each Period
| | | | | | | | | | | | | | | | | | | | |
| | | Massachusetts Portfolio | |
| | | Class C | |
| | | Year Ended September 30, | |
| | | 2011 | | | 2010 | | | 2009 | | | 2008 | | | 2007 | |
| | | | |
| | | | | | | | | | | | | | | | | | | | |
Net asset value, beginning
of period | | | $ 11.30 | | | | $ 11.06 | | | | $ 10.34 | | | | $ 10.79 | | | | $ 10.92 | |
| | | | |
Income From Investment Operations | | | | | | | | | | | | | | | | | | | | |
Net investment income(a)(b) | | | .31 | | | | .31 | | | | .34 | | | | .34 | | | | .37 | |
Net realized and unrealized gain (loss) on investment transactions | | | (.02 | )† | | | .26 | | | | .75 | | | | (.43 | ) | | | (.13 | ) |
Contributions from
Adviser | | | – 0 | – | | | – 0 | – | | | – 0 | – | | | .00 | (e) | | | – 0 | – |
| | | | |
Net increase (decrease) in
net asset value from operations | | | .29 | | | | .57 | | | | 1.09 | | | | (.09 | ) | | | .24 | |
| | | | |
Less: Dividends | | | | | | | | | | | | | | | | | | | | |
Dividends from net investment income | | | (.33 | ) | | | (.33 | ) | | | (.37 | ) | | | (.36 | ) | | | (.37 | ) |
| | | | |
Net asset value, end of period | | | $ 11.26 | | | | $ 11.30 | | | | $ 11.06 | | | | $ 10.34 | | | | $ 10.79 | |
| | | | |
Total Return | | | | | | | | | | | | | | | | | | | | |
Total investment return
based on net asset value(c) | | | 2.67 | % | | | 5.29 | % | | | 10.75 | % | | | (.91 | )% | | | 2.22 | % |
Ratios/Supplemental Data | | | | | | | | | | | | | | | | | | | | |
Net assets, end of period
(000’s omitted) | | | $58,968 | | | | $65,011 | | | | $45,510 | | | | $36,834 | | | | $34,479 | |
Ratio to average net assets of: | | | | | | | | | | | | | | | | | | | | |
Expenses, net of waivers/reimbursements | | | 1.52 | % | | | 1.52 | %(d) | | | 1.52 | % | | | 1.52 | % | | | 1.52 | % |
Expenses, before waivers/reimbursements | | | 1.60 | % | | | 1.63 | %(d) | | | 1.66 | % | | | 1.72 | % | | | 1.76 | % |
Net investment income(a) | | | 2.81 | % | | | 2.80 | %(d) | | | 3.27 | % | | | 3.22 | % | | | 3.39 | % |
Portfolio turnover rate | | | 15 | % | | | 14 | % | | | 7 | % | | | 32 | % | | | 11 | % |
See footnote summary on page 153.
| | |
| 134 | | • ALLIANCEBERNSTEIN MUNICIPAL INCOME FUND II |
Financial Highlights
Selected Data For A Share Of Beneficial Interest Outstanding Throughout Each Period
| | | | | | | | | | | | | | | | | | | | |
| | | Michigan Portfolio | |
| | | Class A | |
| | | Year Ended September 30, | |
| | | 2011 | | | 2010 | | | 2009 | | | 2008 | | | 2007 | |
| | | | |
| | | | | | | | | | | | | | | | | | | | |
Net asset value, beginning
of period | | | $ 10.89 | | | | $ 10.79 | | | | $ 10.11 | | | | $ 10.74 | | | | $ 10.91 | |
| | | | |
Income From Investment Operations | | | | | | | | | | | | | | | | | | | | |
Net investment income(a)(b) | | | .41 | | | | .39 | | | | .40 | | | | .40 | | | | .42 | |
Net realized and unrealized gain (loss) on investment transactions | | | (.11 | ) | | | .13 | | | | .70 | | | | (.60 | ) | | | (.12 | ) |
Contributions from
Adviser | | | – 0 | – | | | .00 | (e) | | | – 0 | – | | | – 0 | – | | | – 0 | – |
| | | | |
Net increase (decrease) in
net asset value from operations | | | .30 | | | | .52 | | | | 1.10 | | | | (.20 | ) | | | .30 | |
| | | | |
Less: Dividends and Distributions | | | | | | | | | | | | | | | | | | | | |
Dividends from net investment income | | | (.43 | ) | | | (.42 | ) | | | (.42 | ) | | | (.41 | ) | | | (.42 | ) |
Distributions from net realized gain on investment transactions | | | – 0 | – | | | – 0 | – | | | – 0 | – | | | (.02 | ) | | | (.05 | ) |
| | | | |
Total dividends and distributions | | | (.43 | ) | | | (.42 | ) | | | (.42 | ) | | | (.43 | ) | | | (.47 | ) |
| | | | |
Net asset value, end of period | | | $ 10.76 | | | | $ 10.89 | | | | $ 10.79 | | | | $ 10.11 | | | | $ 10.74 | |
| | | | |
Total Return | | | | | | | | | | | | | | | | | | | | |
Total investment return
based on net asset value(c) | | | 2.92 | % | | | 4.92 | % | | | 11.18 | % | | | (1.97 | )% | | | 2.75 | % |
Ratios/Supplemental Data | | | | | | | | | | | | | | | | | | | | |
Net assets, end of period (000’s omitted) | | | $66,033 | | | | $73,445 | | | | $73,799 | | | | $67,798 | | | | $63,989 | |
Ratio to average net assets of: | | | | | | | | | | | | | | | | | | | | |
Expenses, net of waivers/reimbursements | | | 1.01 | % | | | 1.01 | %(d) | | | 1.01 | % | | | 1.01 | % | | | 1.01 | % |
Expenses, before waivers/reimbursements | | | 1.09 | % | | | 1.06 | %(d) | | | 1.07 | % | | | 1.06 | % | | | 1.10 | % |
Net investment income(a) | | | 3.84 | % | | | 3.67 | %(d) | | | 3.93 | % | | | 3.77 | % | | | 3.87 | % |
Portfolio turnover rate | | | 3 | % | | | 5 | % | | | 11 | % | | | 13 | % | | | 2 | % |
See footnote summary on page 153.
| | | | |
| ALLIANCEBERNSTEIN MUNICIPAL INCOME FUND II • | | | 135 | |
Financial Highlights
Selected Data For A Share Of Beneficial Interest Outstanding Throughout Each Period
| | | | | | | | | | | | | | | | | | | | |
| | | Michigan Portfolio | |
| | | Class B | |
| | | Year Ended September 30, | |
| | | 2011 | | | 2010 | | | 2009 | | | 2008 | | | 2007 | |
| | | | |
| | | | | | | | | | | | | | | | | | | | |
Net asset value, beginning
of period | | | $ 10.87 | | | | $ 10.77 | | | | $ 10.09 | | | | $ 10.72 | | | | $ 10.89 | |
| | | | |
Income From Investment Operations | | | | | | | | | | | | | | | | | | | | |
Net investment income(a)(b) | | | .34 | | | | .32 | | | | .33 | | | | .32 | | | | .34 | |
Net realized and unrealized gain (loss) on investment transactions | | | (.10 | ) | | | .12 | | | | .70 | | | | (.59 | ) | | | (.12 | ) |
Contributions from
Adviser | | | – 0 | – | | | .00 | (e) | | | – 0 | – | | | – 0 | – | | | – 0 | – |
| | | | |
Net increase (decrease) in
net asset value from operations | | | .24 | | | | .44 | | | | 1.03 | | | | (.27 | ) | | | .22 | |
| | | | |
Less: Dividends and Distributions | | | | | | | | | | | | | | | | | | | | |
Dividends from net investment income | | | (.37 | ) | | | (.34 | ) | | | (.35 | ) | | | (.34 | ) | | | (.34 | ) |
Distributions from net realized gain on investment transactions | | | – 0 | – | | | – 0 | – | | | – 0 | – | | | (.02 | ) | | | (.05 | ) |
| | | | |
Total dividends and distributions | | | (.37 | ) | | | (.34 | ) | | | (.35 | ) | | | (.36 | ) | | | (.39 | ) |
| | | | |
Net asset value, end of period | | | $ 10.74 | | | | $ 10.87 | | | | $ 10.77 | | | | $ 10.09 | | | | $ 10.72 | |
| | | | |
Total Return | | | | | | | | | | | | | | | | | | | | |
Total investment return
based on net asset value(c) | | | 2.27 | % | | | 4.17 | % | | | 10.45 | % | | | (2.65 | )% | | | 2.04 | % |
Ratios/Supplemental Data | | | | | | | | | | | | | | | | | | | | |
Net assets, end of period (000’s omitted) | | | $1,460 | | | | $3,235 | | | | $5,424 | | | | $10,378 | | | | $20,524 | |
Ratio to average net assets of: | | | | | | | | | | | | | | | | | | | | |
Expenses, net of waivers/reimbursements | | | 1.71 | % | | | 1.71 | %(d) | | | 1.71 | % | | | 1.71 | % | | | 1.71 | % |
Expenses, before waivers/reimbursements | | | 1.80 | % | | | 1.78 | %(d) | | | 1.79 | % | | | 1.78 | % | | | 1.81 | % |
Net investment income(a) | | | 3.16 | % | | | 2.99 | %(d) | | | 3.25 | % | | | 3.08 | % | | | 3.17 | % |
Portfolio turnover rate | | | 3 | % | | | 5 | % | | | 11 | % | | | 13 | % | | | 2 | % |
See footnote summary on page 153.
| | |
| 136 | | • ALLIANCEBERNSTEIN MUNICIPAL INCOME FUND II |
Financial Highlights
Selected Data For A Share Of Beneficial Interest Outstanding Throughout Each Period
| | | | | | | | | | | | | | | | | | | | |
| | | Michigan Portfolio | |
| | | Class C | |
| | | Year Ended September 30, | |
| | | 2011 | | | 2010 | | | 2009 | | | 2008 | | | 2007 | |
| | | | |
| | | | | | | | | | | | | | | | | | | | |
Net asset value, beginning
of period | | | $ 10.87 | | | | $ 10.78 | | | | $ 10.09 | | | | $ 10.73 | | | | $ 10.89 | |
| | | | |
Income From Investment Operations | | | | | | | | | | | | | | | | | | | | |
Net investment income(a)(b) | | | .33 | | | | .32 | | | | .33 | | | | .33 | | | | .34 | |
Net realized and unrealized
gain (loss) on investment transactions | | | (.09 | ) | | | .11 | | | | .71 | | | | (.61 | ) | | | (.11 | ) |
Contributions from
Adviser | | | – 0 | – | | | .00 | (e) | | | – 0 | – | | | – 0 | – | | | – 0 | – |
| | | | |
Net increase (decrease) in
net asset value from operations | | | .24 | | | | .43 | | | | 1.04 | | | | (.28 | ) | | | .23 | |
| | | | |
Less: Dividends and Distributions | | | | | | | | | | | | | | | | | | | | |
Dividends from net
investment income | | | (.36 | ) | | | (.34 | ) | | | (.35 | ) | | | (.34 | ) | | | (.34 | ) |
Distributions from net
realized gain on
investment transactions | | | – 0 | – | | | – 0 | – | | | – 0 | – | | | (.02 | ) | | | (.05 | ) |
| | | | |
Total dividends and distributions | | | (.36 | ) | | | (.34 | ) | | | (.35 | ) | | | (.36 | ) | | | (.39 | ) |
| | | | |
Net asset value, end of period | | | $ 10.75 | | | | $ 10.87 | | | | $ 10.78 | | | | $ 10.09 | | | | $ 10.73 | |
| | | | |
Total Return | | | | | | | | | | | | | | | | | | | | |
Total investment return
based on net asset
value(c) | | | 2.30 | % | | | 4.10 | % | | | 10.54 | % | | | (2.74 | )% | | | 2.13 | % |
Ratios/Supplemental Data | | | | | | | | | | | | | | | | | | | | |
Net assets, end of period (000’s omitted) | | | $28,813 | | | | $35,777 | | | | $35,905 | | | | $34,290 | | | | $37,755 | |
Ratio to average net assets
of: | | | | | | | | | | | | | | | | | | | | |
Expenses, net of waivers/reimbursements | | | 1.71 | % | | | 1.71 | %(d) | | | 1.71 | % | | | 1.71 | % | | | 1.71 | % |
Expenses, before waivers/reimbursements | | | 1.79 | % | | | 1.76 | %(d) | | | 1.78 | % | | | 1.76 | % | | | 1.81 | % |
Net investment
income(a) | | | 3.15 | % | | | 2.97 | %(d) | | | 3.24 | % | | | 3.08 | % | | | 3.17 | % |
Portfolio turnover rate | | | 3 | % | | | 5 | % | | | 11 | % | | | 13 | % | | | 2 | % |
See footnote summary on page 153.
| | | | |
| ALLIANCEBERNSTEIN MUNICIPAL INCOME FUND II • | | | 137 | |
Financial Highlights
Selected Data For A Share Of Beneficial Interest Outstanding Throughout Each Period
| | | | | | | | | | | | | | | | | | | | |
| | | Minnesota Portfolio | |
| | | Class A | |
| | | Year Ended September 30, | |
| | | 2011 | | | 2010 | | | 2009 | | | 2008 | | | 2007 | |
| | | | |
| | | | | | | | | | | | | | | | | | | | |
Net asset value, beginning
of period | | | $ 10.35 | | | | $ 10.17 | | | | $ 9.51 | | | | $ 10.05 | | | | $ 10.20 | |
| | | | |
Income From Investment Operations | | | | | | | | | | | | | | | | | | | | |
Net investment income(a)(b) | | | .35 | | | | .32 | | | | .37 | | | | .39 | | | | .41 | |
Net realized and unrealized
gain (loss) on investment transactions | | | .01 | † | | | .19 | | | | .67 | | | | (.53 | ) | | | (.15 | ) |
| | | | |
Net increase (decrease) in
net asset value from operations | | | .36 | | | | .51 | | | | 1.04 | | | | (.14 | ) | | | .26 | |
| | | | |
Less: Dividends | | | | | | | | | | | | | | | | | | | | |
Dividends from net
investment income | | | (.36 | ) | | | (.33 | ) | | | (.38 | ) | | | (.40 | ) | | | (.41 | ) |
| | | | |
Net asset value, end of period | | | $ 10.35 | | | | $ 10.35 | | | | $ 10.17 | | | | $ 9.51 | | | | $ 10.05 | |
| | | | |
Total Return | | | | | | | | | | | | | | | | | | | | |
Total investment return
based on net asset
value(c) | | | 3.68 | % | | | 5.10 | % | | | 11.20 | % | | | (1.53 | )% | | | 2.58 | % |
Ratios/Supplemental Data | | | | | | | | | | | | | | | | | | | | |
Net assets, end of period (000’s omitted) | | | $86,705 | | | | $107,206 | | | | $93,916 | | | | $78,064 | | | | $73,400 | |
Ratio to average net assets
of: | | | | | | | | | | | | | | | | | | | | |
Expenses, net of waivers/reimbursements | | | .90 | % | | | .90 | %(d) | | | .90 | % | | | .90 | % | | | .90 | % |
Expenses, before waivers/reimbursements | | | 1.02 | % | | | 1.02 | %(d) | | | 1.07 | % | | | 1.10 | % | | | 1.16 | % |
Net investment
income(a) | | | 3.48 | % | | | 3.11 | %(d) | | | 3.79 | % | | | 3.93 | % | | | 4.03 | % |
Portfolio turnover rate | | | 10 | % | | | 22 | % | | | 1 | % | | | 7 | % | | | 1 | % |
See footnote summary on page 153.
| | |
| 138 | | • ALLIANCEBERNSTEIN MUNICIPAL INCOME FUND II |
Financial Highlights
Selected Data For A Share Of Beneficial Interest Outstanding Throughout Each Period
| | | | | | | | | | | | | | | | | | | | |
| | | Minnesota Portfolio | |
| | | Class B | |
| | | Year Ended September 30, | |
| | | 2011 | | | 2010 | | | 2009 | | | 2008 | | | 2007 | |
| | | | |
| | | | | | | | | | | | | | | | | | | | |
Net asset value, beginning
of period | | | $ 10.35 | | | | $ 10.17 | | | | $ 9.51 | | | | $ 10.05 | | | | $ 10.20 | |
| | | | |
Income From Investment Operations | | | | | | | | | | | | | | | | | | | | |
Net investment income(a)(b) | | | .28 | | | | .25 | | | | .30 | | | | .32 | | | | .34 | |
Net realized and unrealized
gain (loss) on investment transactions | | | .01 | † | | | .19 | | | | .67 | | | | (.53 | ) | | | (.15 | ) |
| | | | |
Net increase (decrease) in
net asset value from operations | | | .29 | | | | .44 | | | | .97 | | | | (.21 | ) | | | .19 | |
| | | | |
Less: Dividends | | | | | | | | | | | | | | | | | | | | |
Dividends from net
investment income | | | (.29 | ) | | | (.26 | ) | | | (.31 | ) | | | (.33 | ) | | | (.34 | ) |
| | | | |
Net asset value, end of period | | | $ 10.35 | | | | $ 10.35 | | | | $ 10.17 | | | | $ 9.51 | | | | $ 10.05 | |
| | | | |
Total Return | | | | | | | | | | | | | | | | | | | | |
Total investment return
based on net asset
value(c) | | | 2.96 | % | | | 4.39 | % | | | 10.43 | % | | | (2.21 | )% | | | 1.86 | % |
Ratios/Supplemental Data | | | | | | | | | | | | | | | | | | | | |
Net assets, end of period (000’s omitted) | | | $440 | | | | $676 | | | | $1,165 | | | | $2,805 | | | | $6,571 | |
Ratio to average net assets
of: | | | | | | | | | | | | | | | | | | | | |
Expenses, net of waivers/reimbursements | | | 1.60 | % | | | 1.60 | %(d) | | | 1.60 | % | | | 1.60 | % | | | 1.60 | % |
Expenses, before waivers/reimbursements | | | 1.90 | % | | | 1.76 | %(d) | | | 1.81 | % | | | 1.81 | % | | | 1.87 | % |
Net investment
income(a) | | | 2.77 | % | | | 2.45 | %(d) | | | 3.19 | % | | | 3.21 | % | | | 3.33 | % |
Portfolio turnover rate | | | 10 | % | | | 22 | % | | | 1 | % | | | 7 | % | | | 1 | % |
See footnote summary on page 153.
| | | | |
| ALLIANCEBERNSTEIN MUNICIPAL INCOME FUND II • | | | 139 | |
Financial Highlights
Selected Data For A Share Of Beneficial Interest Outstanding Throughout Each Period
| | | | | | | | | | | | | | | | | | | | |
| | | Minnesota Portfolio | |
| | | Class C | |
| | | Year Ended September 30, | |
| | | 2011 | | | 2010 | | | 2009 | | | 2008 | | | 2007 | |
| | | | |
| | | | | | | | | | | | | | | | | | | | |
Net asset value, beginning
of period | | | $ 10.36 | | | | $ 10.18 | | | | $ 9.52 | | | | $ 10.06 | | | | $ 10.21 | |
| | | | |
Income From Investment Operations | | | | | | | | | | | | | | | | | | | | |
Net investment income(a)(b) | | | .28 | | | | .24 | | | | .30 | | | | .32 | | | | .34 | |
Net realized and unrealized
gain (loss) on investment transactions | | | .01 | † | | | .20 | | | | .67 | | | | (.53 | ) | | | (.15 | ) |
| | | | |
Net increase (decrease) in
net asset value from operations | | | .29 | | | | .44 | | | | .97 | | | | (.21 | ) | | | .19 | |
| | | | |
Less: Dividends | | | | | | | | | | | | | | | | | | | | |
Dividends from net
investment income | | | (.29 | ) | | | (.26 | ) | | | (.31 | ) | | | (.33 | ) | | | (.34 | ) |
| | | | |
Net asset value, end of period | | | $ 10.36 | | | | $ 10.36 | | | | $ 10.18 | | | | $ 9.52 | | | | $ 10.06 | |
| | | | |
Total Return | | | | | | | | | | | | | | | | | | | | |
Total investment return
based on net asset
value(c) | | | 2.95 | % | | | 4.37 | % | | | 10.42 | % | | | (2.21 | )% | | | 1.86 | % |
Ratios/Supplemental Data | | | | | | | | | | | | | | | | | | | | |
Net assets, end of period (000’s omitted) | | | $20,838 | | | | $22,240 | | | | $18,729 | | | | $14,192 | | | | $13,818 | |
Ratio to average net assets
of: | | | | | | | | | | | | | | | | | | | | |
Expenses, net of waivers/reimbursements | | | 1.60 | % | | | 1.60 | %(d) | | | 1.60 | % | | | 1.60 | % | | | 1.60 | % |
Expenses, before waivers/reimbursements | | | 1.73 | % | | | 1.72 | %(d) | | | 1.78 | % | | | 1.80 | % | | | 1.86 | % |
Net investment
income(a) | | | 2.79 | % | | | 2.41 | %(d) | | | 3.07 | % | | | 3.22 | % | | | 3.33 | % |
Portfolio turnover rate | | | 10 | % | | | 22 | % | | | 1 | % | | | 7 | % | | | 1 | % |
See footnote summary on page 153.
| | |
| 140 | | • ALLIANCEBERNSTEIN MUNICIPAL INCOME FUND II |
Financial Highlights
Selected Data For A Share Of Beneficial Interest Outstanding Throughout Each Period
| | | | | | | | | | | | | | | | | | | | |
| | | New Jersey Portfolio | |
| | | Class A | |
| | | Year Ended September 30, | |
| | | 2011 | | | 2010 | | | 2009 | | | 2008 | | | 2007 | |
| | | | |
| | | | | | | | | | | | | | | | | | | | |
Net asset value, beginning
of period | | | $ 9.82 | | | | $ 9.55 | | | | $ 9.13 | | | | $ 9.76 | | | | $ 9.93 | |
| | | | |
Income From Investment Operations | | | | | | | | | | | | | | | | | | | | |
Net investment income(a)(b) | | | .39 | | | | .39 | | | | .40 | | | | .40 | | | | .42 | |
Net realized and unrealized
gain (loss) on investment transactions | | | (.11 | ) | | | .28 | | | | .43 | | | | (.63 | ) | | | (.17 | ) |
| | | | |
Net increase (decrease) in
net asset value from operations | | | .28 | | | | .67 | | | | .83 | | | | (.23 | ) | | | .25 | |
| | | | |
Less: Dividends | | | | | | | | | | | | | | | | | | | | |
Dividends from net
investment income | | | (.39 | ) | | | (.40 | ) | | | (.41 | ) | | | (.40 | ) | | | (.42 | ) |
| | | | |
Net asset value, end of period | | | $ 9.71 | | | | $ 9.82 | | | | $ 9.55 | | | | $ 9.13 | | | | $ 9.76 | |
| | | | |
Total Return | | | | | | | | | | | | | | | | | | | | |
Total investment return
based on net asset
value(c) | | | 3.08 | % | | | 7.17 | % | | | 9.45 | % | | | (2.46 | )% | | | 2.52 | % |
Ratios/Supplemental Data | | | | | | | | | | | | | | | | | | | | |
Net assets, end of period
(000’s omitted) | | | $118,468 | | | | $129,078 | | | | $130,515 | | | | $116,562 | | | | $101,138 | |
Ratio to average net assets
of: | | | | | | | | | | | | | | | | | | | | |
Expenses, net of waivers/reimbursements | | | .87 | % | | | .87 | %(d) | | | .87 | % | | | .87 | % | | | .94 | % |
Expenses, net of waivers/reimbursements, excluding interest expense | | | .87 | % | | | .87 | %(d) | | | .87 | % | | | .87 | % | | | .87 | % |
Expenses, before waivers/reimbursements | | | .97 | % | | | .97 | %(d) | | | .99 | % | | | .99 | % | | | 1.10 | % |
Expenses, before waivers/reimbursements, excluding interest expense | | | .97 | % | | | .97 | %(d) | | | .99 | % | | | .99 | % | | | 1.03 | % |
Net investment
income(a) | | | 4.09 | % | | | 4.08 | %(d) | | | 4.48 | % | | | 4.15 | % | | | 4.23 | % |
Portfolio turnover rate | | | 0 | %(f) | | | 9 | % | | | 8 | % | | | 32 | % | | | 6 | % |
See footnote summary on page 153.
| | | | |
| ALLIANCEBERNSTEIN MUNICIPAL INCOME FUND II • | | | 141 | |
Financial Highlights
Selected Data For A Share Of Beneficial Interest Outstanding Throughout Each Period
| | | | | | | | | | | | | | | | | | | | |
| | | New Jersey Portfolio | |
| | | Class B | |
| | | Year Ended September 30, | |
| | | 2011 | | | 2010 | | | 2009 | | | 2008 | | | 2007 | |
| | | | |
| | | | | | | | | | | | | | | | | | | | |
Net asset value, beginning
of period | | | $ 9.82 | | | | $ 9.55 | | | | $ 9.13 | | | | $ 9.76 | | | | $ 9.93 | |
| | | | |
Income From Investment Operations | | | | | | | | | | | | | | | | | | | | |
Net investment income(a)(b) | | | .32 | | | | .32 | | | | .34 | | | | .33 | | | | .35 | |
Net realized and unrealized
gain (loss) on investment transactions | | | (.10 | ) | | | .28 | | | | .43 | | | | (.62 | ) | | | (.17 | ) |
| | | | |
Net increase (decrease) in
net asset value from operations | | | .22 | | | | .60 | | | | .77 | | | | (.29 | ) | | | .18 | |
| | | | |
Less: Dividends | | | | | | | | | | | | | | | | | | | | |
Dividends from net
investment income | | | (.33 | ) | | | (.33 | ) | | | (.35 | ) | | | (.34 | ) | | | (.35 | ) |
| | | | |
Net asset value, end of period | | | $ 9.71 | | | | $ 9.82 | | | | $ 9.55 | | | | $ 9.13 | | | | $ 9.76 | |
| | | | |
Total Return | | | | | | | | | | | | | | | | | | | | |
Total investment return
based on net asset
value(c) | | | 2.37 | % | | | 6.43 | % | | | 8.69 | % | | | (3.14 | )% | | | 1.80 | % |
Ratios/Supplemental Data | | | | | | | | | | | | | | | | | | | | |
Net assets, end of period
(000’s omitted) | | | $2,982 | | | | $4,878 | | | | $8,174 | | | | $13,898 | | | | $27,275 | |
Ratio to average net assets
of: | | | | | | | | | | | | | | | | | | | | |
Expenses, net of waivers/reimbursements | | | 1.57 | % | | | 1.57 | %(d) | | | 1.57 | % | | | 1.57 | % | | | 1.64 | % |
Expenses, net of waivers/reimbursements, excluding interest expense | | | 1.57 | % | | | 1.57 | %(d) | | | 1.57 | % | | | 1.57 | % | | | 1.57 | % |
Expenses, before waivers/reimbursements | | | 1.68 | % | | | 1.68 | %(d) | | | 1.71 | % | | | 1.72 | % | | | 1.81 | % |
Expenses, before waivers/reimbursements, excluding interest expense | | | 1.68 | % | | | 1.68 | %(d) | | | 1.71 | % | | | 1.72 | % | | | 1.74 | % |
Net investment
income(a) | | | 3.39 | % | | | 3.37 | %(d) | | | 3.82 | % | | | 3.44 | % | | | 3.52 | % |
Portfolio turnover rate | | | 0 | %(f) | | | 9 | % | | | 8 | % | | | 32 | % | | | 6 | % |
See footnote summary on page 153.
| | |
| 142 | | • ALLIANCEBERNSTEIN MUNICIPAL INCOME FUND II |
Financial Highlights
Selected Data For A Share Of Beneficial Interest Outstanding Throughout Each Period
| | | | | | | | | | | | | | | | | | | | |
| | | New Jersey Portfolio | |
| | | Class C | |
| | | Year Ended September 30, | |
| | | 2011 | | | 2010 | | | 2009 | | | 2008 | | | 2007 | |
| | | | |
| | | | | | | | | | | | | | | | | | | | |
Net asset value, beginning
of period | | | $ 9.82 | | | | $ 9.56 | | | | $ 9.13 | | | | $ 9.76 | | | | $ 9.93 | |
| | | | |
Income From Investment Operations | | | | | | | | | | | | | | | | | | | | |
Net investment income(a)(b) | | | .32 | | | | .32 | | | | .34 | | | | .33 | | | | .35 | |
Net realized and unrealized
gain (loss) on investment transactions | | | (.09 | ) | | | .27 | | | | .44 | | | | (.62 | ) | | | (.17 | ) |
| | | | |
Net increase (decrease) in
net asset value from operations | | | .23 | | | | .59 | | | | .78 | | | | (.29 | ) | | | .18 | |
| | | | |
Less: Dividends | | | | | | | | | | | | | | | | | | | | |
Dividends from net
investment income | | | (.33 | ) | | | (.33 | ) | | | (.35 | ) | | | (.34 | ) | | | (.35 | ) |
| | | | |
Net asset value, end of period | | | $ 9.72 | | | | $ 9.82 | | | | $ 9.56 | | | | $ 9.13 | | | | $ 9.76 | |
| | | | |
Total Return | | | | | | | | | | | | | | | | | | | | |
Total investment return
based on net asset
value(c) | | | 2.47 | % | | | 6.31 | % | | | 8.81 | % | | | (3.14 | )% | | | 1.80 | % |
Ratios/Supplemental Data | | | | | | | | | | | | | | | | | | | | |
Net assets, end of period
(000’s omitted) | | | $34,224 | | | | $38,765 | | | | $35,544 | | | | $32,332 | | | | $33,031 | |
Ratio to average net assets
of: | | | | | | | | | | | | | | | | | | | | |
Expenses, net of waivers/reimbursements | | | 1.57 | % | | | 1.57 | %(d) | | | 1.57 | % | | | 1.57 | % | | | 1.63 | % |
Expenses, net of waivers/reimbursements, excluding interest expense | | | 1.57 | % | | | 1.57 | %(d) | | | 1.57 | % | | | 1.57 | % | | | 1.57 | % |
Expenses, before waivers/reimbursements | | | 1.67 | % | | | 1.67 | %(d) | | | 1.69 | % | | | 1.70 | % | | | 1.80 | % |
Expenses, before waivers/reimbursements, excluding interest expense | | | 1.67 | % | | | 1.67 | %(d) | | | 1.69 | % | | | 1.70 | % | | | 1.74 | % |
Net investment
income(a) | | | 3.39 | % | | | 3.38 | %(d) | | | 3.78 | % | | | 3.44 | % | | | 3.52 | % |
Portfolio turnover rate | | | 0 | %(f) | | | 9 | % | | | 8 | % | | | 32 | % | | | 6 | % |
See footnote summary on page 153.
| | | | |
| ALLIANCEBERNSTEIN MUNICIPAL INCOME FUND II • | | | 143 | |
Financial Highlights
Selected Data For A Share Of Beneficial Interest Outstanding Throughout Each Period
| | | | | | | | | | | | | | | | | | | | |
| | | Ohio Portfolio | |
| | | Class A | |
| | | Year Ended September 30, | |
| | | 2011 | | | 2010 | | | 2009 | | | 2008 | | | 2007 | |
| | | | |
| | | | | | | | | | | | | | | | | | | | |
Net asset value, beginning
of period | | | $ 10.22 | | | | $ 10.12 | | | | $ 9.44 | | | | $ 10.06 | | | | $ 10.16 | |
| | | | |
Income From Investment Operations | | | | | | | | | | | | | | | | | | | | |
Net investment income(a)(b) | | | .37 | | | | .37 | | | | .40 | | | | .40 | | | | .40 | |
Net realized and unrealized
gain (loss) on investment transactions | | | (.01 | ) | | | .11 | | | | .69 | | | | (.62 | ) | | | (.10 | ) |
| | | | |
Net increase (decrease) in
net asset value from operations | | | .36 | | | | .48 | | | | 1.09 | | | | (.22 | ) | | | .30 | |
| | | | |
Less: Dividends | | | | | | | | | | | | | | | | | | | | |
Dividends from net
investment income | | | (.37 | ) | | | (.38 | ) | | | (.41 | ) | | | (.40 | ) | | | (.40 | ) |
| | | | |
Net asset value, end of period | | | $ 10.21 | | | | $ 10.22 | | | | $ 10.12 | | | | $ 9.44 | | | | $ 10.06 | |
| | | | |
Total Return | | | | | | | | | | | | | | | | | | | | |
Total investment return
based on net asset
value(c) | | | 3.71 | % | | | 4.89 | % | | | 11.84 | % | | | (2.33 | )% | | | 3.05 | % |
Ratios/Supplemental Data | | | | | | | | | | | | | | | | | | | | |
Net assets, end of period
(000’s omitted) | | | $106,356 | | | | $120,702 | | | | $112,101 | | | | $101,481 | | | | $93,801 | |
Ratio to average net assets
of: | | | | | | | | | | | | | | | | | | | | |
Expenses, net of waivers/reimbursements | | | .85 | % | | | .85 | %(d) | | | .85 | % | | | .85 | % | | | .85 | % |
Expenses, before waivers/reimbursements | | | .96 | % | | | .99 | %(d) | | | .99 | % | | | 1.00 | % | | | 1.01 | % |
Net investment
income(a) | | | 3.65 | % | | | 3.72 | %(d) | | | 4.18 | % | | | 3.97 | % | | | 4.00 | % |
Portfolio turnover rate | | | 8 | % | | | 3 | % | | | 3 | % | | | 7 | % | | | 4 | % |
See footnote summary on page 153.
| | |
| 144 | | • ALLIANCEBERNSTEIN MUNICIPAL INCOME FUND II |
Financial Highlights
Selected Data For A Share Of Beneficial Interest Outstanding Throughout Each Period
| | | | | | | | | | | | | | | | | | | | |
| | | Ohio Portfolio | |
| | | Class B | |
| | | Year Ended September 30, | |
| | | 2011 | | | 2010 | | | 2009 | | | 2008 | | | 2007 | |
| | | | |
| | | | | | | | | | | | | | | | | | | | |
Net asset value, beginning
of period | | | $ 10.21 | | | | $ 10.11 | | | | $ 9.43 | | | | $ 10.05 | | | | $ 10.15 | |
| | | | |
Income From Investment Operations | | | | | | | | | | | | | | | | | | | | |
Net investment income(a)(b) | | | .29 | | | | .30 | | | | .33 | | | | .32 | | | | .33 | |
Net realized and unrealized gain (loss) on investment transactions | | | .01 | † | | | .11 | | | | .69 | | | | (.61 | ) | | | (.10 | ) |
| | | | |
Net increase (decrease) in net asset value from operations | | | .30 | | | | .41 | | | | 1.02 | | | | (.29 | ) | | | .23 | |
| | | | |
Less: Dividends | | | | | | | | | | | | | | | | | | | | |
Dividends from net
investment income | | | (.31 | ) | | | (.31 | ) | | | (.34 | ) | | | (.33 | ) | | | (.33 | ) |
| | | | |
Net asset value, end of period | | | $ 10.20 | | | | $ 10.21 | | | | $ 10.11 | | | | $ 9.43 | | | | $ 10.05 | |
| | | | |
Total Return | | | | | | | | | | | | | | | | | | | | |
Total investment return
based on net asset value(c) | | | 3.00 | % | | | 4.18 | % | | | 11.08 | % | | | (3.02 | )% | | | 2.34 | % |
Ratios/Supplemental Data | | | | | | | | | | | | | | | | | | | | |
Net assets, end of period (000’s omitted) | | | $3,082 | | | | $4,991 | | | | $8,294 | | | | $16,192 | | | | $29,436 | |
Ratio to average net assets of: | | | | | | | | | | | | | | | | | | | | |
Expenses, net of waivers/reimbursements | | | 1.55 | % | | | 1.55 | %(d) | | | 1.55 | % | | | 1.55 | % | | | 1.55 | % |
Expenses, before waivers/
reimbursements | | | 1.68 | % | | | 1.71 | %(d) | | | 1.71 | % | | | 1.72 | % | | | 1.72 | % |
Net investment income(a) | | | 2.94 | % | | | 3.03 | %(d) | | | 3.50 | % | | | 3.26 | % | | | 3.30 | % |
Portfolio turnover rate | | | 8 | % | | | 3 | % | | | 3 | % | | | 7 | % | | | 4 | % |
See footnote summary on page 153.
| | | | |
| ALLIANCEBERNSTEIN MUNICIPAL INCOME FUND II • | | | 145 | |
Financial Highlights
Selected Data For A Share Of Beneficial Interest Outstanding Throughout Each Period
| | | | | | | | | | | | | | | | | | | | |
| | | Ohio Portfolio | |
| | | Class C | |
| | | Year Ended September 30, | |
| | | 2011 | | | 2010 | | | 2009 | | | 2008 | | | 2007 | |
| | | | |
| | | | | | | | | | | | | | | | | | | | |
Net asset value, beginning
of period | | | $ 10.21 | | | | $ 10.12 | | | | $ 9.43 | | | | $ 10.06 | | | | $ 10.16 | |
| | | | |
Income From Investment Operations | | | | | | | | | | | | | | | | | | | | |
Net investment income(a)(b) | | | .30 | | | | .30 | | | | .33 | | | | .33 | | | | .33 | |
Net realized and unrealized gain (loss) on investment transactions | | | .00 | (e)† | | | .10 | | | | .70 | | | | (.63 | ) | | | (.10 | ) |
| | | | |
Net increase (decrease) in net asset value from operations | | | .30 | | | | .40 | | | | 1.03 | | | | (.30 | ) | | | .23 | |
| | | | |
Less: Dividends | | | | | | | | | | | | | | | | | | | | |
Dividends from net investment income | | | (.31 | ) | | | (.31 | ) | | | (.34 | ) | | | (.33 | ) | | | (.33 | ) |
| | | | |
Net asset value, end of period | | | $ 10.20 | | | | $ 10.21 | | | | $ 10.12 | | | | $ 9.43 | | | | $ 10.06 | |
| | | | |
Total Return | | | | | | | | | | | | | | | | | | | | |
Total investment return based on net asset value(c) | | | 2.99 | % | | | 4.06 | % | | | 11.19 | % | | | (3.11 | )% | | | 2.33 | % |
Ratios/Supplemental Data | | | | | | | | | | | | | | | | | | | | |
Net assets, end of period (000’s omitted) | | | $41,520 | | | | $44,272 | | | | $41,008 | | | | $37,446 | | | | $40,087 | |
Ratio to average net assets of: | | | | | | | | | | | | | | | | | | | | |
Expenses, net of waivers/reimbursements | | | 1.55 | % | | | 1.55 | %(d) | | | 1.55 | % | | | 1.55 | % | | | 1.55 | % |
Expenses, before waivers/reimbursements | | | 1.66 | % | | | 1.69 | %(d) | | | 1.70 | % | | | 1.71 | % | | | 1.71 | % |
Net investment income(a) | | | 2.96 | % | | | 3.02 | %(d) | | | 3.48 | % | | | 3.27 | % | | | 3.31 | % |
Portfolio turnover rate | | | 8 | % | | | 3 | % | | | 3 | % | | | 7 | % | | | 4 | % |
See footnote summary on page 153.
| | |
| 146 | | • ALLIANCEBERNSTEIN MUNICIPAL INCOME FUND II |
Financial Highlights
Selected Data For A Share Of Beneficial Interest Outstanding Throughout Each Period
| | | | | | | | | | | | | | | | | | | | |
| | | Pennsylvania Portfolio | |
| | | Class A | |
| | | Year Ended September 30, | |
| | | 2011 | | | 2010 | | | 2009 | | | 2008 | | | 2007 | |
| | | | |
| | | | | | | | | | | | | | | | | | | | |
Net asset value, beginning
of period | | | $ 10.55 | | | | $ 10.28 | | | | $ 9.75 | | | | $ 10.44 | | | | $ 10.58 | |
| | | | |
Income From Investment Operations | | | | | | | | | | | | | | | | | | | | |
Net investment income(a)(b) | | | .40 | | | | .40 | | | | .41 | | | | .41 | | | | .41 | |
Net realized and unrealized gain (loss) on investment transactions | | | (.03 | ) | | | .27 | | | | .53 | | | | (.69 | ) | | | (.14 | ) |
| | | | |
Net increase (decrease) in net asset value from operations | | | .37 | | | | .67 | | | | .94 | | | | (.28 | ) | | | .27 | |
| | | | |
Less: Dividends and Distributions | | | | | | | | | | | | | | | | | | | | |
Dividends from net investment income | | | (.40 | ) | | | (.40 | ) | | | (.41 | ) | | | (.41 | ) | | | (.41 | ) |
Distributions from net realized gain on investment transactions | | | (.09 | ) | | | – 0 | – | | | – 0 | – | | | – 0 | – | | | – 0 | – |
| | | | |
Total dividends and distributions | | | (.49 | ) | | | (.40 | ) | | | (.41 | ) | | | (.41 | ) | | | (.41 | ) |
| | | | |
Net asset value, end of period | | | $ 10.43 | | | | $ 10.55 | | | | $ 10.28 | | | | $ 9.75 | | | | $ 10.44 | |
| | | | |
Total Return | | | | | | | | | | | | | | | | | | | | |
Total investment return based on net asset value(c) | | | 3.75 | % | | | 6.67 | % | | | 10.00 | % | | | (2.80 | )% | | | 2.60 | % |
Ratios/Supplemental Data | | | | | | | | | | | | | | | | | | | | |
Net assets, end of period (000’s omitted) | | | $101,432 | | | | $104,928 | | | | $103,024 | | | | $93,096 | | | | $92,626 | |
Ratio to average net assets of: | | | | | | | | | | | | | | | | | | | | |
Expenses, net of waivers/reimbursements | | | .95 | % | | | .95 | %(d) | | | .95 | % | | | .95 | % | | | .95 | % |
Expenses, before waivers/reimbursements | | | 1.00 | % | | | 1.01 | %(d) | | | 1.03 | % | | | 1.03 | % | | | 1.03 | % |
Net investment income(a) | | | 3.90 | % | | | 3.88 | %(d) | | | 4.25 | % | | | 3.99 | % | | | 3.92 | % |
Portfolio turnover rate | | | 6 | % | | | 17 | % | | | 9 | % | | | 9 | % | | | 8 | % |
See footnote summary on page 153.
| | | | |
| ALLIANCEBERNSTEIN MUNICIPAL INCOME FUND II • | | | 147 | |
Financial Highlights
Selected Data For A Share Of Beneficial Interest Outstanding Throughout Each Period
| | | | | | | | | | | | | | | | | | | | |
| | | Pennsylvania Portfolio | |
| | | Class B | |
| | | Year Ended September 30, | |
| | | 2011 | | | 2010 | | | 2009 | | | 2008 | | | 2007 | |
| | | | |
| | | | | | | | | | | | | | | | | | | | |
Net asset value, beginning
of period | | | $ 10.55 | | | | $ 10.28 | | | | $ 9.75 | | | | $ 10.44 | | | | $ 10.58 | |
| | | | |
Income From Investment Operations | | | | | | | | | | | | | | | | | | | | |
Net investment income(a)(b) | | | .32 | | | | .33 | | | | .34 | | | | .34 | | | | .34 | |
Net realized and unrealized gain (loss) on investment transactions | | | (.02 | ) | | | .27 | | | | .53 | | | | (.69 | ) | | | (.14 | ) |
| | | | |
Net increase (decrease) in net asset value from operations | | | .30 | | | | .60 | | | | .87 | | | | (.35 | ) | | | .20 | |
| | | | |
Less: Dividends and Distributions | | | | | | | | | | | | | | | | | | | | |
Dividends from net investment income | | | (.33 | ) | | | (.33 | ) | | | (.34 | ) | | | (.34 | ) | | | (.34 | ) |
Distributions from net realized gain on investment transactions | | | (.09 | ) | | | – 0 | – | | | – 0 | – | | | – 0 | – | | | – 0 | – |
| | | | |
Total dividends and distributions | | | (.42 | ) | | | (.33 | ) | | | (.34 | ) | | | (.34 | ) | | | (.34 | ) |
| | | | |
Net asset value, end of period | | | $ 10.43 | | | | $ 10.55 | | | | $ 10.28 | | | | $ 9.75 | | | | $ 10.44 | |
| | | | |
Total Return(c) | | | | | | | | | | | | | | | | | | | | |
Total investment return based on net asset value | | | 3.03 | % | | | 5.93 | % | | | 9.24 | % | | | (3.48 | )% | | | 1.89 | % |
Ratios/Supplemental Data | | | | | | | | | | | | | | | | | | | | |
Net assets, end of period (000’s omitted) | | | $3,164 | | | | $4,642 | | | | $7,135 | | | | $11,245 | | | | $21,329 | |
Ratio to average net assets of: | | | | | | | | | | | | | | | | | | | | |
Expenses, net of waivers/reimbursements | | | 1.65 | % | | | 1.65 | %(d) | | | 1.65 | % | | | 1.65 | % | | | 1.65 | % |
Expenses, before waivers/reimbursements | | | 1.72 | % | | | 1.73 | %(d) | | | 1.75 | % | | | 1.75 | % | | | 1.74 | % |
Net investment income(a) | | | 3.19 | % | | | 3.18 | %(d) | | | 3.57 | % | | | 3.27 | % | | | 3.21 | % |
Portfolio turnover rate | | | 6 | % | | | 17 | % | | | 9 | % | | | 9 | % | | | 8 | % |
See footnote summary on page 153.
| | |
| 148 | | • ALLIANCEBERNSTEIN MUNICIPAL INCOME FUND II |
Financial Highlights
Selected Data For A Share Of Beneficial Interest Outstanding Throughout Each Period
| | | | | | | | | | | | | | | | | | | | |
| | | Pennsylvania Portfolio | |
| | | Class C | |
| | | Year Ended September 30, | |
| | | 2011 | | | 2010 | | | 2009 | | | 2008 | | | 2007 | |
| | | | |
| | | | | | | | | | | | | | | | | | | | |
Net asset value, beginning
of period | | | $ 10.55 | | | | $ 10.28 | | | | $ 9.75 | | | | $ 10.44 | | | | $ 10.58 | |
| | | | |
Income From Investment Operations | | | | | | | | | | | | | | | | | | | | |
Net investment income(a)(b) | | | .32 | | | | .33 | | | | .34 | | | | .34 | | | | .34 | |
Net realized and unrealized gain (loss) on investment transactions | | | (.01 | ) | | | .27 | | | | .53 | | | | (.69 | ) | | | (.14 | ) |
| | | | |
Net increase (decrease) in net asset value from operations | | | .31 | | | | .60 | | | | .87 | | | | (.35 | ) | | | .20 | |
| | | | |
Less: Dividends and Distributions | | | | | | | | | | | | | | | | | | | | |
Dividends from net investment income | | | (.33 | ) | | | (.33 | ) | | | (.34 | ) | | | (.34 | ) | | | (.34 | ) |
Distributions from net realized gain on investment transactions | | | (.09 | ) | | | – 0 | – | | | – 0 | – | | | – 0 | – | | | – 0 | – |
| | | | |
Total dividends and distributions | | | (.42 | ) | | | (.33 | ) | | | (.34 | ) | | | (.34 | ) | | | (.34 | ) |
| | | | |
Net asset value, end of period | | | $ 10.44 | | | | $ 10.55 | | | | $ 10.28 | | | | $ 9.75 | | | | $ 10.44 | |
| | | | |
Total Return | | | | | | | | | | | | | | | | | | | | |
Total investment return based on net asset value(c) | | | 3.13 | % | | | 5.93 | % | | | 9.24 | % | | | (3.48 | )% | | | 1.89 | % |
Ratios/Supplemental Data | | | | | | | | | | | | | | | | | | | | |
Net assets, end of period (000’s omitted) | | | $25,694 | | | | $28,671 | | | | $28,583 | | | | $30,194 | | | | $31,295 | |
Ratio to average net assets of: | | | | | | | | | | | | | | | | | | | | |
Expenses, net of waivers/reimbursements | | | 1.65 | % | | | 1.65 | %(d) | | | 1.65 | % | | | 1.65 | % | | | 1.65 | % |
Expenses, before waivers/reimbursements | | | 1.71 | % | | | 1.71 | %(d) | | | 1.73 | % | | | 1.74 | % | | | 1.74 | % |
Net investment income(a) | | | 3.19 | % | | | 3.17 | %(d) | | | 3.55 | % | | | 3.29 | % | | | 3.22 | % |
Portfolio turnover rate | | | 6 | % | | | 17 | % | | | 9 | % | | | 9 | % | | | 8 | % |
See footnote summary on page 153.
| | | | |
| ALLIANCEBERNSTEIN MUNICIPAL INCOME FUND II • | | | 149 | |
Financial Highlights
Selected Data For A Share Of Beneficial Interest Outstanding Throughout Each Period
| | | | | | | | | | | | | | | | | | | | |
| | | Virginia Portfolio | |
| | | Class A | |
| | | Year Ended September 30, | |
| | | 2011 | | | 2010 | | | 2009 | | | 2008 | | | 2007 | |
| | | | |
| | | | | | | | | | | | | | | | | | | | |
Net asset value, beginning
of period | | | $ 11.07 | | | | $ 10.84 | | | | $ 10.01 | | | | $ 10.68 | | | | $ 10.84 | |
| | | | |
Income From Investment Operations | | | | | | | | | | | | | | | | | | | | |
Net investment income(a)(b) | | | .41 | | | | .39 | | | | .42 | | | | .43 | | | | .45 | |
Net realized and unrealized gain (loss) on investment transactions | | | .09 | | | | .24 | | | | .85 | | | | (.66 | ) | | | (.16 | ) |
| | | | |
Net increase (decrease) in net asset value from operations | | | .50 | | | | .63 | | | | 1.27 | | | | (.23 | ) | | | .29 | |
| | | | |
Less: Dividends and Distributions | | | | | | | | | | | | | | | | | | | | |
Dividends from net investment income | | | (.43 | ) | | | (.40 | ) | | | (.44 | ) | | | (.44 | ) | | | (.45 | ) |
Distributions from net realized gain on investment transactions | | | (.02 | ) | | | – 0 | – | | | – 0 | – | | | – 0 | – | | | – 0 | – |
| | | | |
Total dividends and distributions | | | (.45 | ) | | | (.40 | ) | | | (.44 | ) | | | (.44 | ) | | | (.45 | ) |
| | | | |
Net asset value, end of period | | | $ 11.12 | | | | $ 11.07 | | | | $ 10.84 | | | | $ 10.01 | | | | $ 10.68 | |
| | | | |
Total Return | | | | | | | | | | | | | | | | | | | | |
Total investment return based on net asset value(c) | | | 4.72 | % | | | 6.00 | % | | | 13.03 | % | | | (2.33 | )% | | | 2.72 | % |
Ratios/Supplemental Data | | | | | | | | | | | | | | | | | | | | |
Net assets, end of period (000’s omitted) | | | $189,326 | | | | $204,517 | | | | $178,412 | | | | $141,216 | | | | $119,858 | |
Ratio to average net assets of: | | | | | | | | | | | | | | | | | | | | |
Expenses, net of waivers/reimbursements | | | .72 | % | | | .72 | %(d) | | | .72 | % | | | .72 | % | | | .72 | % |
Expenses, before waivers/reimbursements | | | .91 | % | | | .92 | %(d) | | | .94 | % | | | .96 | % | | | .99 | % |
Net investment income(a) | | | 3.84 | % | | | 3.64 | %(d) | | | 4.17 | % | | | 4.07 | % | | | 4.19 | % |
Portfolio turnover rate | | | 24 | % | | | 8 | % | | | 9 | % | | | 26 | % | | | 15 | % |
See footnote summary on page 153.
| | |
| 150 | | • ALLIANCEBERNSTEIN MUNICIPAL INCOME FUND II |
Financial Highlights
Selected Data For A Share Of Beneficial Interest Outstanding Throughout Each Period
| | | | | | | | | | | | | | | | | | | | |
| | | Virginia Portfolio | |
| | | Class B | |
| | | Year Ended September 30, | |
| | | 2011 | | | 2010 | | | 2009 | | | 2008 | | | 2007 | |
| | | | |
| | | | | | | | | | | | | | | | | | | | |
Net asset value, beginning
of period | | | $ 11.05 | | | | $ 10.82 | | | | $ 9.99 | | | | $ 10.66 | | | | $ 10.82 | |
| | | | |
Income From Investment Operations | | | | | | | | | | | | | | | | | | | | |
Net investment income(a)(b) | | | .34 | | | | .32 | | | | .35 | | | | .35 | | | | .38 | |
Net realized and unrealized gain (loss) on investment transactions | | | .08 | | | | .24 | | | | .85 | | | | (.66 | ) | | | (.17 | ) |
| | | | |
Net increase (decrease) in net asset value from operations | | | .42 | | | | .56 | | | | 1.20 | | | | (.31 | ) | | | .21 | |
| | | | |
Less: Dividends and Distributions | | | | | | | | | | | | | | | | | | | | |
Dividends from net investment income | | | (.35 | ) | | | (.33 | ) | | | (.37 | ) | | | (.36 | ) | | | (.37 | ) |
Distributions from net realized gain on investment transactions | | | (.02 | ) | | | – 0 | – | | | – 0 | – | | | – 0 | – | | | – 0 | – |
| | | | |
Total dividends and distributions | | | (.37 | ) | | | (.33 | ) | | | (.37 | ) | | | (.36 | ) | | | (.37 | ) |
| | | | |
Net asset value, end of period | | | $ 11.10 | | | | $ 11.05 | | | | $ 10.82 | | | | $ 9.99 | | | | $ 10.66 | |
| | | | |
Total Return | | | | | | | | | | | | | | | | | | | | |
Total investment return based on net asset value(c) | | | 4.01 | % | | | 5.29 | % | | | 12.27 | % | | | (3.02 | )% | | | 2.01 | % |
Ratios/Supplemental Data | | | | | | | | | | | | | | | | | | | | |
Net assets, end of period (000’s omitted) | | | $3,132 | | | | $4,752 | | | | $6,578 | | | | $11,582 | | | | $23,486 | |
Ratio to average net assets of: | | | | | | | | | | | | | | | | | | | | |
Expenses, net of waivers/reimbursements | | | 1.42 | % | | | 1.42 | %(d) | | | 1.42 | % | | | 1.42 | % | | | 1.42 | % |
Expenses, before waivers/reimbursements | | | 1.63 | % | | | 1.64 | %(d) | | | 1.67 | % | | | 1.67 | % | | | 1.69 | % |
Net investment income(a) | | | 3.15 | % | | | 2.96 | %(d) | | | 3.55 | % | | | 3.37 | % | | | 3.49 | % |
Portfolio turnover rate | | | 24 | % | | | 8 | % | | | 9 | % | | | 26 | % | | | 15 | % |
See footnote summary on page 153.
| | | | |
| ALLIANCEBERNSTEIN MUNICIPAL INCOME FUND II • | | | 151 | |
Financial Highlights
Selected Data For A Share Of Beneficial Interest Outstanding Throughout Each Period
| | | | | | | | | | | | | | | | | | | | |
| | | Virginia Portfolio | |
| | | Class C | |
| | | Year Ended September 30, | |
| | | 2011 | | | 2010 | | | 2009 | | | 2008 | | | 2007 | |
| | | | |
| | | | | | | | | | | | | | | | | | | | |
Net asset value, beginning
of period | | | $ 11.04 | | | | $ 10.81 | | | | $ 9.98 | | | | $ 10.66 | | | | $ 10.81 | |
| | | | |
Income From Investment Operations | | | | | | | | | | | | | | | | | | | | |
Net investment income(a)(b) | | | .34 | | | | .32 | | | | .35 | | | | .36 | | | | .38 | |
Net realized and unrealized gain (loss) on investment transactions | | | .08 | | | | .24 | | | | .85 | | | | (.68 | ) | | | (.16 | ) |
| | | | |
Net increase (decrease) in net asset value from operations | | | .42 | | | | .56 | | | | 1.20 | | | | (.32 | ) | | | .22 | |
| | | | |
Less: Dividends and Distributions | | | | | | | | | | | | | | | | | | | | |
Dividends from net investment income | | | (.35 | ) | | | (.33 | ) | | | (.37 | ) | | | (.36 | ) | | | (.37 | ) |
Distributions from net realized gain on investment transactions | | | (.02 | ) | | | – 0 | – | | | – 0 | – | | | – 0 | – | | | – 0 | – |
| | | | |
Total dividends and distributions | | | (.37 | ) | | | (.33 | ) | | | (.37 | ) | | | (.36 | ) | | | (.37 | ) |
| | | | |
Net asset value, end of period | | | $ 11.09 | | | | $ 11.04 | | | | $ 10.81 | | | | $ 9.98 | | | | $ 10.66 | |
| | | | |
Total Return | | | | | | | | | | | | | | | | | | | | |
Total investment return based on net asset value(c) | | | 4.01 | % | | | 5.29 | % | | | 12.28 | % | | | (3.11 | )% | | | 2.11 | % |
Ratios/Supplemental Data | | | | | | | | | | | | | | | | | | | | |
Net assets, end of period (000’s omitted) | | | $61,044 | | | | $59,844 | | | | $49,137 | | | | $36,517 | | | | $35,516 | |
Ratio to average net assets of: | | | | | | | | | | | | | | | | | | | | |
Expenses, net of waivers/reimbursements | | | 1.42 | % | | | 1.42 | %(d) | | | 1.42 | % | | | 1.42 | % | | | 1.42 | % |
Expenses, before waivers/reimbursements | | | 1.61 | % | | | 1.62 | %(d) | | | 1.65 | % | | | 1.66 | % | | | 1.69 | % |
Net investment income(a) | | | 3.14 | % | | | 2.95 | %(d) | | | 3.48 | % | | | 3.38 | % | | | 3.50 | % |
Portfolio turnover rate | | | 24 | % | | | 8 | % | | | 9 | % | | | 26 | % | | | 15 | % |
See footnote summary on page 153.
| | |
| 152 | | • ALLIANCEBERNSTEIN MUNICIPAL INCOME FUND II |
Financial Highlights
| (a) | | Net of fees waived and expenses reimbursed by the Adviser. |
| (b) | | Based on average shares outstanding. |
| (c) | | Total investment return is calculated assuming an initial investment made at the net asset value at the beginning of the period, reinvestment of all dividends and distributions at net asset value during the period, and redemption on the last day of the period. Initial sales charges or contingent deferred sales charges are not reflected in the calculation of total investment return. Total return does not reflect the deduction of taxes that a shareholder would pay on fund distributions or the redemption of fund shares. Total investment return calculated for a period of less than one year is not annualized. |
| (d) | | The ratio includes expenses attributable to costs of proxy solicitation. |
| (e) | | Amount is less than $.005. |
| (f) | | Amount is less than .5%. |
| † | | Due to timing of sales and repurchase of capital shares, the net realized and unrealized gain (loss) per share is not in accord with the Portfolio’s change in net realized and unrealized gain (loss) on investment transactions for the period. |
See notes to financial statements.
| | | | |
| ALLIANCEBERNSTEIN MUNICIPAL INCOME FUND II • | | | 153 | |
Financial Highlights
REPORT OF INDEPENDENT REGISTERED
PUBLIC ACCOUNTING FIRM
To the Board of Trustees of AllianceBernstein Municipal Income Fund II and Shareholders of the Portfolios
We have audited the accompanying statements of assets and liabilities, including the portfolios of investments, of AllianceBernstein Municipal Income Fund II (the “Fund”) (comprising, respectively, the Arizona, Massachusetts, Michigan, Minnesota, New Jersey, Ohio, Pennsylvania and Virginia Portfolios; the “Portfolios”) as of September 30, 2011, and the related statements of operations for the year then ended, the statements of changes in net assets for each of the two years in the period then ended, and the financial highlights for each of the five years in the period then ended. These financial statements and financial highlights are the responsibility of the Fund’s management. Our responsibility is to express an opinion on these financial statements and financial highlights based on our audits.
We conducted our audits in accordance with the standards of the Public Company Accounting Oversight Board (United States). Those standards require that we plan and perform the audit to obtain reasonable assurance about whether the financial statements and financial highlights are free of material misstatement. We were not engaged to perform an audit of the Fund’s internal control over financial reporting. Our audits included consideration of internal control over financial reporting as a basis for designing audit procedures that are appropriate in the circumstances, but not for the purpose of expressing an opinion on the effectiveness of the Fund’s internal control over financial reporting. Accordingly, we express no such opinion. An audit also includes examining, on a test basis, evidence supporting the amounts and disclosures in the financial statements and financial highlights, assessing the accounting principles used and significant estimates made by management, and evaluating the overall financial statement presentation. Our procedures included confirmation of securities owned as of September 30, 2011 by correspondence with the custodian and others or by other appropriate auditing procedures where replies from others were not received. We believe that our audits provide a reasonable basis for our opinion.
In our opinion, the financial statements and financial highlights referred to above present fairly, in all material respects, the financial position of each of the respective Portfolios constituting AllianceBernstein Municipal Income Fund II at September 30, 2011, the results of their operations for the year then ended, the changes in their net assets for each of the two years in the period then ended, and the financial highlights for each of the five years in the period then ended, in conformity with U.S. generally accepted accounting principles.

New York, New York
November 25, 2011
| | |
| 154 | | • ALLIANCEBERNSTEIN MUNICIPAL INCOME FUND II |
Report of Independent Registered Public Accounting Firm
BOARD OF TRUSTEES
William H. Foulk, Jr.,(1) Chairman
John H. Dobkin(1)
Michael J. Downey(1)
D. James Guzy(1)
Nancy P. Jacklin(1)
Robert M. Keith, President and Chief Executive Officer
Garry L. Moody(1)
Marshall C. Turner, Jr.(1)
Earl D. Weiner(1)
OFFICERS
Philip L. Kirstein, Senior Vice President and Independent Compliance Officer
(Guy) Robert B. Davidson III(2), Senior Vice President
Douglas J. Peebles, Senior Vice President
Michael G. Brooks(2), Vice President
Fred S. Cohen(2), Vice President
Wayne D. Godlin(2) , Vice President
Terrance T. Hults(2), Vice President
Emilie D. Wrapp, Secretary
Joseph J. Mantineo, Treasurer and Chief Financial Officer
Phyllis J. Clarke, Controller
| | |
Custodian and Accounting Agent State Street Bank and Trust Company
One Lincoln Street
Boston, MA 02111 Principal Underwriter AllianceBernstein Investments, Inc.
1345 Avenue of the Americas
New York, NY 10105 Legal Counsel Seward & Kissel LLP
One Battery Park Plaza
New York, NY 10004 | | Independent Registered Public Accounting Firm Ernst & Young LLP
5 Times Square
New York, NY 10036 Transfer Agent AllianceBernstein Investor
Services, Inc.
P.O. Box 786003
San Antonio, TX 78278-6003
Toll-free (800) 221-5672 |
| (1) | | Member of the Audit Committee, the Governance and Nominating Committee and the Independent Directors Committee. Mr. Foulk is the sole member of the Fair Value Pricing Committee. |
| (2) | | The day-to-day management of, and investment decisions for, the Portfolios’ portfolios are made by the Municipal Bond Investment Team. Michael G. Brooks, Fred S. Cohen, (Guy) Robert B. Davidson III, Wayne D. Godlin and Terrance T. Hults are the investment professionals with the most significant responsibility for the day-to-day management of the Portfolios’ portfolios. |
| | | | |
| ALLIANCEBERNSTEIN MUNICIPAL INCOME FUND II • | | | 155 | |
Board of Trustees
MANAGEMENT OF THE FUND
Board of Trustees Information
The business and affairs of the Fund are managed under the direction of the Board of Trustees. Certain information concerning the Fund’s Trustees is set forth below.
| | | | | | | | |
NAME,
ADDRESS* AND AGE
(YEAR FIRST ELECTED**) | | PRINCIPAL
OCCUPATION(S)
DURING PAST FIVE YEARS
AND OTHER RELEVANT
QUALIFICATIONS*** | | PORTFOLIOS
IN FUND
COMPLEX
OVERSEEN BY
TRUSTEE | | | OTHER
TRUSTEESHIPS
HELD BY
TRUSTEE IN PAST
FIVE YEARS |
| INTERESTED TRUSTEE |
Robert M. Keith †
President and Chief Executive Officer 51 | | Senior Vice President of AllianceBernstein L.P. (the “Adviser”) and the head of AllianceBernstein Investments, Inc. (“ABI”) since July 2008; Director of ABI and President of the AllianceBernstein Mutual Funds. Previously, he served as Executive Managing Director of ABI from December 2006 to June 2008. Prior to joining ABI in 2006, Executive Managing Director of Bernstein Global Wealth Management, and prior thereto, Senior Managing Director and Global Head of Client Service and Sales of the Adviser’s institutional investment management business since 2004. Prior thereto, he was Managing Director and Head of North American Client Service and Sales in the Adviser’s institutional investment management business, with which he had been associated since prior to 2004. | | | 99 | | | None |
| | | | | | | | |
| DISINTERESTED TRUSTEES | | | | | | |
William H. Foulk, Jr., #, ##
Chairman of the Board
79
(1998) | | Investment Adviser and an Independent Consultant since prior to 2006. Previously, he was Senior Manager of Barrett Associates, Inc., a registered investment adviser. He was formerly Deputy Comptroller and Chief Investment Officer of the State of New York and, prior thereto, Chief Investment Officer of the New York Bank for Savings. He has served as a director or trustee of various AllianceBernstein Funds since 1983 and has been Chairman of the AllianceBernstein Funds and of the Independent Directors Committee of such Funds since 2003. He is also active in a number of mutual fund related organizations and committees. | | | 99 | | | None |
| | |
| 156 | | • ALLIANCEBERNSTEIN MUNICIPAL INCOME FUND II |
Management of the Fund
| | | | | | | | |
NAME,
ADDRESS* AND AGE
(YEAR FIRST ELECTED**) | | PRINCIPAL
OCCUPATION(S)
DURING PAST FIVE YEARS
AND OTHER RELEVANT
QUALIFICATIONS*** | | PORTFOLIOS
IN FUND
COMPLEX
OVERSEEN BY
TRUSTEE | | | OTHER
TRUSTEESHIPS
HELD BY
TRUSTEE IN PAST
FIVE YEARS |
DISINTERESTED TRUSTEES
(continued) | | | | | | |
John H. Dobkin, # 69 (1998) | | Independent Consultant since prior to 2006. Formerly, President of Save Venice, Inc. (preservation organization) from 2001-2002; Senior Advisor from June 1999-June 2000 and President of Historic Hudson Valley (historic preservation) from December 1989-May 1999. Previously, Director of the National Academy of Design. He has served as a director or trustee of various AllianceBernstein Funds since 1992, and as Chairman of the Audit Committees of a number of such Funds from 2001-2008. | | | 99 | | | None |
| | | | | | | | |
Michael J. Downey, # 67 (2005) | | Private Investor since prior to 2006. Formerly, managing partner of Lexington Capital, LLC (investment advisory firm) from December 1997 until December 2003. From 1987 until 1993, Chairman and CEO of Prudential Mutual Fund Management, director of the Prudential Mutual funds, and member of the Executive Committee of Prudential Securities Inc. He has served as a director or trustee of the AllianceBernstein Funds since 2005 and is a director of two other registered investment companies (and Chairman of one of them). | | | 99 | | | Asia Pacific Fund, Inc. and The Merger Fund since prior to 2006, and Prospect Acquisition Corp. (financial services) since 2007 until 2009 |
| | | | | | | | |
| | | | |
| ALLIANCEBERNSTEIN MUNICIPAL INCOME FUND II • | | | 157 | |
Management of the Fund
| | | | | | | | |
NAME,
ADDRESS* AND AGE
(YEAR FIRST ELECTED**) | | PRINCIPAL
OCCUPATION(S)
DURING PAST FIVE YEARS
AND OTHER RELEVANT
QUALIFICATIONS*** | | PORTFOLIOS
IN FUND
COMPLEX
OVERSEEN BY
TRUSTEE | | | OTHER
TRUSTEESHIPS
HELD BY
TRUSTEE IN PAST
FIVE YEARS |
DISINTERESTED TRUSTEES
(continued) | | | | | | |
D. James Guzy, #
75
(2005) | | Chairman of the Board of PLX Technology (semi-conductors) and of SRC Computers Inc., with which he has been associated since prior to 2006. He was a director of Intel Corporation (semi-conductors) from 1969 until 2008, and served as Chairman of the Finance Committee of such company for several years until May 2008. He has served as a director or trustee of one or more of the AllianceBernstein Funds since 1982. | | | 99 | | | Cirrus Logic Corporation (semi-conductors) since prior to 2006, and PLX Technology (semi-conductors) since prior to 2006 and Intel Corporation (semi-conductors) since prior to 2006 until 2008 |
| | | | | | | | |
Nancy P. Jacklin, #
63
(2006) | | Professorial Lecturer at the Johns Hopkins School of Advanced International Studies since 2008. Formerly, U.S. Executive Director of the International Monetary Fund (December 2002-May 2006); Partner, Clifford Chance (1992-2002); Sector Counsel, International Banking and Finance, and Associate General Counsel, Citicorp (1985-1992); Assistant General Counsel (International), Federal Reserve Board of Governors (1982-1985); and Attorney Advisor, U.S. Department of the Treasury (1973-1982). Member of the Bar of the District of Columbia and of New York; and member of the Council on Foreign Relations. She has served as a director or trustee of the AllianceBernstein Funds since 2006. | | | 99 | | | None |
| | | | | | | | |
| | |
| 158 | | • ALLIANCEBERNSTEIN MUNICIPAL INCOME FUND II |
Management of the Fund
| | | | | | | | |
NAME,
ADDRESS* AND AGE
(YEAR FIRST ELECTED**) | | PRINCIPAL
OCCUPATION(S)
DURING PAST FIVE YEARS
AND OTHER RELEVANT
QUALIFICATIONS*** | | PORTFOLIOS
IN FUND
COMPLEX
OVERSEEN BY
TRUSTEE | | | OTHER
TRUSTEESHIPS
HELD BY
TRUSTEE IN PAST
FIVE YEARS |
DISINTERESTED TRUSTEES
(continued) | | | | | | |
Garry L. Moody, # 59
(2008) | | Independent Consultant. Formerly, Partner, Deloitte & Touche LLP (1995-2008) where he held a number of senior positions, including Vice Chairman, and U.S. and Global Investment Management Practice Managing Partner; President, Fidelity Accounting and Custody Services Company (1993-1995); and Partner, Ernst & Young LLP (1975-1993), where he served as the National Director of Mutual Fund Tax Services. He is also a member of the Governing Council of the Independent Directors Council (IDC), an organization of independent directors of mutual funds, and serves on that organization’s Education and Communications Committee. He has served as a director or trustee, and as Chairman of the Audit Committee, of most of the AllianceBernstein Funds since 2008. | | | 99 | | | None |
| | | | | | | | |
| | | | |
| ALLIANCEBERNSTEIN MUNICIPAL INCOME FUND II • | | | 159 | |
Management of the Fund
| | | | | | | | |
NAME,
ADDRESS* AND AGE
(YEAR FIRST ELECTED**) | | PRINCIPAL
OCCUPATION(S)
DURING PAST FIVE YEARS
AND OTHER RELEVANT
QUALIFICATIONS*** | | PORTFOLIOS
IN FUND
COMPLEX
OVERSEEN BY
TRUSTEE | | | OTHER
TRUSTEESHIPS
HELD BY
TRUSTEE IN PAST
FIVE YEARS |
DISINTERESTED TRUSTEES
(continued) | | | | | | |
Marshall C. Turner, Jr., #
70
(2005) | | Private Investor since prior to 2006. Interim CEO of MEMC Electronic Materials, Inc. (semi-conductor and solar cell substrates) from November 2008 until March 2009. He was Chairman and CEO of Dupont Photomasks, Inc. (components of semi-conductor manufacturing), 2003-2005, and President and CEO, 2005-2006, after the company was acquired and renamed Toppan Photomasks, Inc. He has extensive experience in venture capital investing including prior service as general partner of three institutional venture capital partnerships, and serves on the boards of a number of education and science-related non-profit organizations. He has served as a director or trustee of one or more of the AllianceBernstein Funds since 1992. | | | 99 | | | Xilinx, Inc. (programmable logic semi-
conductors) and MEMC Electronic Materials, Inc. (semi-conductor and solar cell substrates) since prior to 2006 |
| | | | | | | | |
Earl D. Weiner, #
72
(2007) | | Of Counsel, and Partner prior to January 2007, of the law firm Sullivan & Cromwell LLP and member of ABA Federal Regulation of Securities Committee Task Force to draft editions of the Fund Director’s Guidebook. He also serves as a director or trustee of various non-profit organizations and has served as Chairman or Vice Chairman of a number of them. He has served as a director or trustee of the AllianceBernstein Funds since 2007 and is Chairman of the Governance and Nominating Committees of most of the Funds. | | | 99 | | | None |
| | |
| 160 | | • ALLIANCEBERNSTEIN MUNICIPAL INCOME FUND II |
Management of the Fund
| * | The address for each of the Fund’s disinterested Trustees is c/o AllianceBernstein L.P., Attention: Philip L. Kirstein, 1345 Avenue of the Americas, New York, NY 10105. |
| ** | There is no stated term of office for the Fund’s Trustees. |
| *** | The information above includes each Trustee’s principal occupation during the last five years and other information relating to the experience, attributes and skills relevant to each Trustee’s qualifications to serve as a Trustee, which led to the conclusion that each Trustee should serve as a Trustee for the Fund. |
| † | | Mr. Keith is an “interested person” of the Fund, as defined in the 1940 Act, due to his position as a Senior Vice President of the Adviser. |
| # | Member of the Audit Committee, the Governance and Nominating Committee and the Independent Directors Committee. |
| ## | Member of the Fair Value Pricing Committee. |
| | | | |
| ALLIANCEBERNSTEIN MUNICIPAL INCOME FUND II • | | | 161 | |
Management of the Fund
Officer Information
Certain information concerning the Fund’s Officers is listed below.
| | | | |
NAME, ADDRESS*
AND AGE | | POSITION(S)
HELD WITH FUND | | PRINCIPAL OCCUPATION
DURING PAST FIVE YEARS** |
Philip L. Kirstein
66 | | Senior Vice President and Independent Compliance Officer | | Senior Vice President and Independent Compliance Officer of the AllianceBernstein Funds, with which he has been associated since October 2004. Prior thereto, he was Of Counsel to Kirkpatrick & Lockhart, LLP from October 2003 to October 2004 and General Counsel of Merrill Lynch Investment Managers, L.P. since prior to March 2003. |
| | | | |
(Guy) Robert B. Davidson III
50 | | Senior Vice President | | Senior Vice President of the Adviser,** with which he has been associated since prior to 2006. |
| | | | |
Douglas J. Peebles
46 | | Senior Vice President | | Senior Vice President of the Adviser,** with which he has been associated since prior to 2006. |
| | | | |
Michael G. Brooks
63 | | Vice President | | Senior Vice President of the Adviser,** with which he has been associated since prior to 2006. |
| | | | |
Fred S. Cohen
53 | | Vice President | | Senior Vice President of the Adviser,** with which he has been associated since prior to 2006. |
| | | | |
Wayne D. Godlin
50 | | Vice President | | Senior Vice President of the Adviser,** since December 2009. Prior thereto, he was an investment manager and a Managing Director of Van Kampen Asset Management with which he had been associated since prior to 2006. |
| | | | |
Terrance T. Hults
45 | | Vice President | | Senior Vice President of the Adviser,** with which he has been associated since prior to 2006. |
| | | | |
Emilie D. Wrapp 55 | | Secretary | | Senior Vice President, Assistant General Counsel and Assistant Secretary of ABI,** with which she has been associated since prior to 2006. |
| | | | |
Joseph J. Mantineo 52 | | Treasurer and Chief Financial Officer | | Senior Vice President of AllianceBernstein Investor Services, Inc. (“ABIS”),** with which he has been associated since prior to 2006. |
| | | | |
Phyllis J. Clarke 50 | | Controller | | Vice President of the ABIS,** with which she has been associated since prior to 2006. |
| | |
| 162 | | • ALLIANCEBERNSTEIN MUNICIPAL INCOME FUND II |
Management of the Fund
| * | | The address for each of the Fund’s Officers is 1345 Avenue of the Americas, New York, NY 10105. |
| ** | | The Adviser, ABI and ABIS are affiliates of the Fund. |
| | | The Fund’s Statement of Additional Information (“SAI”) has additional information about the Fund’s Trustees and Officers and is available without charge upon request. Contact your financial representative or AllianceBernstein at 1-800-227-4618, or visit www.alliancebernstein.com, for a free prospectus or SAI. |
| | | | |
| ALLIANCEBERNSTEIN MUNICIPAL INCOME FUND II • | | | 163 | |
Management of the Fund
THE FOLLOWING IS NOT PART OF THE SHAREHOLDER REPORT OR THE FINANCIAL STATEMENTS
SUMMARY OF SENIOR OFFICER’S EVALUATION OF INVESTMENT ADVISORY AGREEMENT1
The following is a summary of the evaluation of the Investment Advisory Agreement between AllianceBernstein L.P. (the “Adviser”) and AllianceBernstein Municipal Income Fund II (the “Trust”) in respect of the following Portfolios:2
Arizona Portfolio
Massachusetts Portfolio
Michigan Portfolio
Minnesota Portfolio
New Jersey Portfolio
Ohio Portfolio
Pennsylvania Portfolio
Virginia Portfolio
The evaluation of the Investment Advisory Agreement was prepared by Philip L. Kirstein, the Senior Officer of the Trust, for the Trustees of the Trust, as required by the September 1, 2004 Assurance of Discontinuance (“AOD”) between the Adviser and the New York State Attorney General (“the NYAG”). The Senior Officer’s evaluation of the Investment Advisory Agreement is not meant to diminish the responsibility or authority of the Trustees of the Trust to perform its duties pursuant to Section 15 of the Investment Company Act of 1940 (the “40 Act”) and applicable state law. The purpose of the summary is to provide shareholders with a synopsis of the independent evaluation of the reasonableness of the advisory fees proposed to be paid by the Portfolios, which was provided to the Trustees in connection with their review of the proposed approval of the continuance of the Investment Advisory Agreement. The Senior Officer’s evaluation considered the following factors:
| | 1. | Advisory fees charged to institutional and other clients of the Adviser for like services; |
| | 2. | Advisory fees charged by other mutual fund companies for like services; |
| | 3. | Costs to the Adviser and its affiliates of supplying services pursuant to the advisory agreements, excluding any intra-corporate profit; |
| | 4. | Profit margins of the Adviser and its affiliates from supplying such services; |
| 1 | | It should be noted that Senior Officer’s fee evaluation was completed on October 21, 2010 and discussed with the Board of Trustees on November 2-4, 2010. |
| 2 | | Future references to the Portfolios do not include “AllianceBernstein.” References in the fee summary pertaining to performance and expense ratios refer to the Class A shares of the Portfolios. |
| | |
| 164 | | • ALLIANCEBERNSTEIN MUNICIPAL INCOME FUND II |
| | 5. | Possible economies of scale as the Portfolios grow larger; and |
| | 6. | Nature and quality of the Adviser’s services including the performance of the Portfolios. |
These factors, with the exception of the first factor, are generally referred to as the “Gartenberg factors,” which were articulated by the United States Court of Appeals for the Second Circuit in 1982. The first factor is an additional factor required to be considered by the AoD. The Supreme Court recently held the Gartenberg decision was correct in its basic formulation of what Section 36(b) of the 40 Act requires: to face liability under Section 36(b), “an investment adviser must charge a fee that is so disproportionately large that it bears no reasonable relationship to the services rendered and could not have been the product of arms length bargaining.” Jones v. Harris Associates L.P., (No. 08-586), slip op. at 9, 559 U.S. 2010. In the Jones decision, the Court stated the Gartenberg approach fully incorporates the correct understanding of fiduciary duty within the context of Section 36(b) and noted with approval that “Gartenberg insists that all relevant circumstances be taken into account” and “uses the range of fees that might result from arms-length bargaining as the benchmark for reviewing challenged fees.”3
PORTFOLIO ADVISORY FEES, EXPENSE REIMBURSEMENTS, CAPS & RATIOS
The Adviser proposed that each Portfolio pays the advisory fee set forth in the table below for receiving the services to be provided pursuant to the Investment Advisory Agreement. The fee schedule below, implemented in January 2004 in consideration of the Adviser’s settlement with the NYAG in December 2003, is based on a master schedule that contemplates eight categories of funds with almost all funds in each category having the same advisory fee schedule.4
| | | | |
| Category | | Advisory Fee5 | | Trust |
| Low Risk Income | | 45 bp on 1st $2.5 billion 40 bp on next $2.5 billion 35 bp on the balance | | Arizona Portfolio
Massachusetts Portfolio Michigan Portfolio Minnesota Portfolio New Jersey Portfolio Ohio Portfolio Pennsylvania Portfolio Virginian Portfolio |
| 4 | | Most of the AllianceBernstein Mutual Funds, which the Adviser manages, were affected by the Adviser’s settlement with the NYAG. |
| 5 | | The advisory fees for each Portfolio are based on the percentage of each Portfolio’s average daily net assets, not a combination of any of the Portfolios. |
| | | | |
| ALLIANCEBERNSTEIN MUNICIPAL INCOME FUND II • | | | 165 | |
The Portfolios’ net assets on September 30, 2010 are set forth below:
| | | | |
| Portfolio | | September 30, 2010 Net Assets ($MM) | |
| Arizona Portfolio | | $ | 201.5 | |
| Massachusetts Portfolio | | $ | 261.9 | |
| Michigan Portfolio | | $ | 112.5 | |
| Minnesota Portfolio | | $ | 130.1 | |
| New Jersey Portfolio | | $ | 172.7 | |
| Ohio Portfolio | | $ | 170.0 | |
| Pennsylvania Portfolio | | $ | 138.3 | |
| Virginia Portfolio | | $ | 269.3 | |
The Adviser is reimbursed as specified in the Investment Advisory Agreement for certain clerical, legal, accounting, administrative, and other services. Indicated below are the reimbursement amounts, which the Adviser received from the Portfolios during their most recently completed fiscal year; expressed in dollars and as a percentage of average daily net assets:
| | | | | | | | |
| Portfolio | | Amount | | | As a % of Average Daily Net Assets | |
| Arizona Portfolio | | $ | 99,502 | | | | 0.049 | % |
| Massachusetts Portfolio | | $ | 102,731 | | | | 0.056 | % |
| Michigan Portfolio6 | | $ | 94,652 | | | | 0.085 | % |
| Minnesota Portfolio | | $ | 94,879 | | | | 0.094 | % |
| New Jersey Portfolio | | $ | 95,439 | | | | 0.060 | % |
| Ohio Portfolio | | $ | 101,488 | | | | 0.067 | % |
| Pennsylvania Portfolio | | $ | 92,920 | | | | 0.070 | % |
| Virginia Portfolio6 | | $ | 103,410 | | | | 0.052 | % |
The Adviser has agreed to waive that portion of its advisory fees and/or reimburse certain of the Portfolios for that portion of the Portfolios’ total operating expenses to the degree necessary to limit each Portfolio’s expense ratios to the amounts set forth below for each Portfolio’s current fiscal year. The waiver agreement is terminable by the Adviser at the end of the Portfolios’ fiscal year upon at least 60 days written notice. In addition, set forth below are the gross expense ratios of the Portfolios, annualized for the most recent semi-annual period:
| | | | | | | | | | | | | | |
| Portfolio | | Expense Cap Pursuant to
Expense Limitation
Undertaking | | | Gross
Expense
Ratio (3/31/10)7 | | | Fiscal
Year End | |
| Arizona Portfolio | | Class A
Class B Class C | |
| 0.78
1.48 1.48 | %
% % | |
| 0.93
1.65 1.64 | %
% % | | | September 30 | |
| 6 | | The Adviser waived the amount in its entirety. |
| | |
| 166 | | • ALLIANCEBERNSTEIN MUNICIPAL INCOME FUND II |
| | | | | | | | | | | | | | |
| Portfolio | | Expense Cap Pursuant to
Expense Limitation
Undertaking | | | Gross
Expense
Ratio (3/31/10)7 | | | Fiscal
Year End | |
| Massachusetts Portfolio | | Class A
Class B Class C | |
| 0.82
1.52 1.52 | %
% % | |
| 0.93
1.65 1.63 | %
% % | | | September 30 | |
| | | | | | | | | | | | | | |
| Michigan Portfolio | | Class A
Class B Class C | |
| 1.01
1.71 1.71 | %
% % | |
| 1.06
1.77 1.76 | %
% % | | | September 30 | |
| | | | | | | | | | | | | | |
| Minnesota Portfolio | | Class A
Class B Class C | |
| 0.90
1.60 1.60 | %
% % | |
| 1.02
1.76 1.73 | %
% % | | | September 30 | |
| | | | | | | | | | | | | | |
| New Jersey Portfolio | | Class A
Class B Class C | |
| 0.87
1.57 1.57 | %
% % | |
| 0.96
1.68 1.66 | %
% % | | | September 30 | |
| | | | | | | | | | | | | | |
| Ohio Portfolio | | Class A
Class B Class C | |
| 0.85
1.55 1.55 | %
% % | |
| 1.00
1.72 1.70 | %
% % | | | September 30 | |
| | | | | | | | | | | | | | |
| Pennsylvania Portfolio | | Class A
Class B Class C | |
| 0.95
1.65 1.65 | %
% % | |
| 1.01
1.73 1.71 | %
% % | | | September 30 | |
| | | | | | | | | | | | | | |
| Virginia Portfolio | | Class A
Class B Class C | |
| 0.72
1.42 1.42 | %
% % | |
| 0.92
1.64 1.62 | %
% % | | | September 30 | |
| I. | ADVISORY FEES CHARGED TO INSTITUTIONAL AND OTHER CLIENTS |
The advisory fees charged to investment companies which the Adviser manages and sponsors are normally higher than those charged to similar sized institutional accounts, including pension plans and sub-advised investment companies. The fee differential reflects, among other things, different services provided to such clients, and different liabilities assumed. Services provided by the Adviser to the Portfolios that are not provided to non-investment company clients include providing office space and personnel to serve as Fund Officers, who among other responsibilities make the certifications required under the Sarbanes–Oxley Act of 2002, and coordinating with and monitoring the Portfolios’ third party service providers such as Fund counsel, auditors, custodians, transfer agents and pricing services. The accounting, administrative, legal and compliance requirements for the Portfolios are more costly than those for institutional client assets due to the greater complexities and time required for investment companies, although as previously noted, the Adviser is reimbursed for providing such services. Also, retail mutual funds managed by the Adviser are widely held. Servicing the Portfolios’ investors is more time consuming and labor intensive compared to institutional clients since the Adviser needs to communicate with a more extensive network of financial intermediaries and shareholders. The Adviser also believes that it incurs substantial entrepreneurial risk when offering a new mutual fund since establishing a new mutual fund requires a large upfront investment, and it may take a long time for the fund to achieve profitability since the fund
| | | | |
| ALLIANCEBERNSTEIN MUNICIPAL INCOME FUND II • | | | 167 | |
must be priced to scale from inception in order to be competitive and assets are acquired one account at a time. In addition, managing the cash flow of an investment company may be more difficult than that of a stable pool of assets, such as an institutional client account with little cash movement in either direction, particularly, if a fund is in net redemption and the Adviser is frequently forced to sell securities to raise cash for redemptions. However, managing a fund with positive cash flow may be easier at times than managing a stable pool of assets. Finally, in recent years, investment advisers have been sued by institutional clients and have suffered reputational damage both by the attendant publicity and outcomes other than complete victories. Accordingly, the legal and reputational risks associated with institutional accounts are greater than previously thought, although arguably still not equal to those related to the mutual fund industry.
Notwithstanding the Adviser’s view that managing an investment company is not comparable to managing other institutional accounts because the services provided are different, the Supreme Court has indicated consideration should be given to the advisory fees charged to institutional accounts that have a substantially similar investment style as the Portfolios.8 However, with respect to the Portfolios, the Adviser represented that there is no institutional product in the Adviser’s Form ADV that has a substantially similar investment style as the Portfolios. It should be noted that the Adviser represented that it does manage separately managed accounts that invest principally in municipal securities but those mandates have a substantially lower risk profile (credit and interest rate risk) that the Portfolios.
The Adviser represented that it does not sub-advise any registered investment companies of other fund families with a substantially similar investment style as any of the Portfolios.
| II. | MANAGEMENT FEES CHARGED BY OTHER MUTUAL FUNDS COMPANIES FOR LIKE SERVICES. |
Lipper, Inc. (“Lipper”), an analytical service that is not affiliated with the Adviser, compared the fees charged to the Portfolios with fees charged to other investment companies for similar services by other investment advisers.9 Lipper’s analysis included the Portfolios’ ranking with respect to the contractual
| 8 | | It should be noted that the Supreme Court stated that “courts may give such comparisons the weight that they merit in light of the similarities and differences between the services that the clients in question require, but the courts must be wary of inapt comparisons.” Among the significant differences the Supreme Court noted that may exist between services provided to mutual funds and institutional accounts are “higher marketing costs.” Jones v. Harris at 13. |
| 9 | | In considering this section, it should be noted that the Supreme Court cautioned against accepting mutual fund fee comparisons without careful scrutiny since “these comparisons are problematic because these fees, like those challenged, may not be the product of the negotiations conducted at arms length.” Jones v. Harris at 14. |
| | |
| 168 | | • ALLIANCEBERNSTEIN MUNICIPAL INCOME FUND II |
management fee relative to the median of the Portfolios’ Lipper Expense Group (“EG”)10 at the approximate current asset level of the subject Portfolios.11
Lipper describes an EG as a representative sample of comparable funds. Lipper’s standard methodology for screening funds to be included in an EG entails the consideration of several fund criteria, including fund type, investment classification/objective, load type and similar 12b-1/non-12b-1 service fees, asset (size) comparability, and expense components and attributes.12 An EG will typically consist of seven to twenty funds. Certain of the Portfolios had original EGs that had an insufficient number of peers. Consequently Lipper expanded the EGs of the Portfolios to include peers that had a similar but not the same Lipper investment classification/objective.
| | | | | | | | | | |
| Portfolio | | Contractual
Management
Fee13 | | | Lipper Exp.
Group Median | | | Rank |
| Arizona Portfolio14,15 | | | 0.450 | | | | 0.545 | | | 2/13 |
| Massachusetts Portfolio 15 | | | 0.450 | | | | 0.498 | | | 2/8 |
| Michigan Portfolio14,15 | | | 0.450 | | | | 0.520 | | | 2/10 |
| Minnesota Portfolio14,15 | | | 0.450 | | | | 0.500 | | | 2/13 |
| New Jersey Portfolio15 | | | 0.450 | | | | 0.523 | | | 2/8 |
| Ohio Portfolio14,15 | | | 0.450 | | | | 0.495 | | | 2/10 |
| Pennsylvania Portfolio15 | | | 0.450 | | | | 0.478 | | | 2/9 |
| Virginia Portfolio14,15 | | | 0.450 | | | | 0.490 | | | 3/11 |
| 10 | | It should be noted that Lipper does not consider average account size when constructing EGs. Portfolios with relatively small average account sizes tend to have higher transfer agent expense ratios than comparable sized funds that have relatively large average account sizes. Note that there are limitations on Lipper expense category data because different funds categorize expenses differently. |
| 11 | | The contractual management fee is calculated by Lipper using the Portfolio’s contractual management fee rate at a hypothetical asset level. The hypothetical asset level is based on the combined net assets of all classes of the Portfolio, rounded up to the next $25 million. Lipper’s total expense ratio information is based on the most recent annual report except as otherwise noted. A ranking of “1” means that the Portfolio has the lowest effective fee rate in the Lipper peer group. |
| 12 | | Lipper does not consider average account size when constructing EGs. Portfolios with relatively small average account sizes tend to have higher transfer agent expense ratios than comparable sized funds that have relatively large average account sizes. Note that there are limitations on Lipper expense category data because different funds categorize expenses differently. |
| 13 | | The contractual management fees for the Portfolios do not reflect any expense reimbursements made by the Portfolios to the Adviser for certain clerical, legal, accounting, administrative, and other services. In addition, the contractual management fees do not reflect any management waivers for expense caps that effectively reduce the contractual management fee. |
| 14 | | The Portfolio’s EG was expanded by Lipper. |
| 15 | | Note that one of the Portfolio’s peers is excluded in the contractual management fee rankings because Lipper is unable to calculate the fund’s contractual management fee due to the fund’s breakpoint gross income component. |
| | | | |
| ALLIANCEBERNSTEIN MUNICIPAL INCOME FUND II • | | | 169 | |
Because Lipper had expanded certain of the Portfolios’ EGs, under Lipper’s standard guidelines, those Portfolios’ Lipper Expense Universes (“EU”) were also expanded to include the universes of the peers that had a similar but not the same Lipper investment objective/classification as the subject Portfolio. A “normal” EU will include funds that have the same investment objective/classification as the subject Portfolio.16
It should be noted that Lipper uses expense ratio data from financial statements of the most current fiscal year in their database. This has several implications: the total expense ratio of each fund that Lipper uses in their report is based on each fund’s average net assets during its fiscal year. Since funds have different fiscal year ends, the total expense ratios of the funds may cover different twelve month periods, depending on the funds’ fiscal year ends. This is the process that Lipper always follows but given the volatile market conditions during 2008 and 2009, notably the last three months of 2008 through the first three months of 2009 when equity markets declined substantially, and conversely through the remainder of 2009 when equity markets rallied, the effects on the funds’ total expense ratios caused by the differences in fiscal year ends may be more pronounced in 2008 and 2009 compared to other years under more normal market conditions.17
| | | | | | | | | | | | | | | | |
| Portfolio | | Expense Ratio (%)18 | | | Lipper Exp. Group
Median (%) | | | Lipper Group Rank | | Lipper Exp. Universe Median (%) | | | Lipper
Universe Rank |
| Arizona Portfolio19 | | | 0.780 | | | | 0.803 | | | 6/14 | | | 0.802 | | | 31/78 |
| Massachusetts Portfolio | | | 0.819 | | | | 0.852 | | | 3/9 | | | 0.852 | | | 5/13 |
| Michigan Portfolio19 | | | 1.009 | | | | 0.851 | | | 10/11 | | | 0.815 | | | 45/50 |
| Minnesota Portfolio19 | | | 0.899 | | | | 0.859 | | | 10/14 | | | 0.849 | | | 30/43 |
| New Jersey Portfolio | | | 0.869 | | | | 0.841 | | | 8/9 | | | 0.827 | | | 10/12 |
| Ohio Portfolio19 | | | 0.849 | | | | 0.849 | | | 6/11 | | | 0.826 | | | 20/34 |
| Pennsylvania Portfolio | | | 0.949 | | | | 0.829 | | | 9/10 | | | 0.824 | | | 15/17 |
| Virginia Portfolio19 | | | 0.720 | | | | 0.813 | | | 2/12 | | | 0.815 | | | 8/42 |
Based on this analysis, the Portfolios’ contractual management fees are lower than their respective Lipper EG medians. The total expense ratios of Arizona Portfolio, Massachusetts Portfolio and Virginia Portfolio are lower than their respective EG and EU medians. The total expense ratios of Michigan Portfolio, Minnesota Portfolio, New Jersey Portfolio and Pennsylvania Portfolio are higher
| 16 | | Except for asset size comparability, Lipper uses the same criteria for selecting an EG peer when selecting an EU peer. Unlike the EG, the EU allows for the same adviser to be represented by more than just one fund. |
| 17 | | To cite an example, the average net assets and total expense ratio of a fund with a fiscal year end of March 31, 2009 will not be reflective of the market rally that occurred post March 2009, in contrast to a fund with a fiscal year end of December 31, 2009. |
| 18 | | Most recently completed fiscal year Class A share total expense ratio. As previously mentioned, the Portfolios’ total expense ratios are capped. |
| 19 | | The Portfolio’s EG and EU were expanded by Lipper. |
| | |
| 170 | | • ALLIANCEBERNSTEIN MUNICIPAL INCOME FUND II |
than their respective EG and EU medians. Ohio Portfolio’s total expense ratio is equal to the EG median and is lower than the EU median.
| III. | COSTS TO THE ADVISER AND ITS AFFILIATES OF SUPPLYING SERVICES PURSUANT TO THE ADVISORY FEE ARRANGEMENT, EXCLUDING ANY INTRA-CORPORATE PROFIT. |
The Adviser utilizes two profitability reporting systems, which operate independently but are aligned with each other, to estimate the Adviser’s profitability in connection with investment advisory services provided to the Portfolios. The Senior Officer has retained an independent consultant to provide independent advice regarding the alignment of the two profitability systems as well as the methodologies and allocations utilized by both profitability systems. See Section IV for additional discussion.
| IV. | PROFIT MARGINS OF THE ADVISER AND ITS AFFILIATES FOR SUPPLYING SUCH SERVICES. |
The Adviser’s profitability information for the Portfolios prepared by the Adviser for the Trustees of the Trust was reviewed by the Senior Officer and the independent consultant. The Adviser’s profitability from providing investment advisory services to the Portfolios increased during the calendar year 2009, relative to 2008.
In addition to the Adviser’s direct profits from managing the Portfolios, certain of the Adviser’s affiliates have business relationships with the Portfolios and may earn a profit from providing other services to the Adviser. The courts have referred to this type of business opportunity as “fall-out benefits” to the Adviser and indicated that they should be factored into the evaluation of the total relationship between the Portfolios and the Adviser. Neither case law nor common business practice precludes the Adviser’s affiliates from earning a reasonable profit on this type of relationship. These affiliates provide transfer agent and distribution services to the Portfolios and receive transfer agent fees, front-end sales loads, Rule 12b-1 payments and contingent deferred sales charges (“CDSC”).
ABI retained the following amounts for Class A front-end load sales charges from sales of the Portfolios’ Class A shares during the Portfolios’ most recently completed fiscal year:
| | | | |
| Portfolio | | Amount Received | |
| Arizona Portfolio | | $ | 20,009 | |
| Massachusetts Portfolio | | $ | 22,388 | |
| Michigan Portfolio | | $ | 8,226 | |
| Minnesota Portfolio | | $ | 7,541 | |
| New Jersey Portfolio | | $ | 8,354 | |
| Ohio Portfolio | | $ | 8,876 | |
| Pennsylvania Portfolio | | $ | 6,111 | |
| Virginia Portfolio | | $ | 21,330 | |
| | | | |
| ALLIANCEBERNSTEIN MUNICIPAL INCOME FUND II • | | | 171 | |
ABI received the following Rule 12b-1 fees and CDSC for the Portfolios during the Portfolios’ most recently completed fiscal year:
| | | | | | | | |
| Portfolio | | 12b-1 Fee Received | | | CDSC Received | |
| Arizona Portfolio | | $ | 906,251 | | | $ | 23,392 | |
| Massachusetts Portfolio | | $ | 882,203 | | | $ | 36,819 | |
| Michigan Portfolio | | $ | 626,173 | | | $ | 12,212 | |
| Minnesota Portfolio | | $ | 431,954 | | | $ | 13,424 | |
| New Jersey Portfolio | | $ | 769,216 | | | $ | 16,302 | |
| Ohio Portfolio | | $ | 806,277 | | | $ | 7,998 | |
| Pennsylvania Portfolio | | $ | 648,686 | | | $ | 9,761 | |
| Virginia Portfolio | | $ | 923,667 | | | $ | 10,446 | |
AllianceBernstein Investments, Inc. (“ABI”), an affiliate of the Adviser, is the Portfolios’ principal underwriter. ABI and the Adviser have disclosed in the Portfolios’ prospectus that they may make revenue sharing payments from their own resources, in addition to revenues derived from sales loads and Rule 12b-1 fees, to firms that sell shares of the Portfolios. In 2009, ABI paid approximately 0.04% of the average monthly assets of the AllianceBernstein Mutual Funds or approximately $13.8 million for distribution services and educational support (revenue sharing payments).
Fees and reimbursements for out of pocket expenses charged by AllianceBernstein Investor Services, Inc. (“ABIS”), the affiliated transfer agent for the Portfolios, are charged on a per account basis, based on the level of service provided and the class of share held by the account. ABIS also receives a fee per shareholder sub-account for each account maintained by an intermediary on an omnibus basis. Set forth below are the net fees which ABIS retained from the Portfolios during the Portfolios’ most recently completed fiscal year:20
| | | | | | | | |
| Portfolio | | ABIS Fee | | | Expense Offset | |
| Arizona Portfolio | | $ | 32,082 | | | $ | 146 | |
| Massachusetts Portfolio | | $ | 37,026 | | | $ | 138 | |
| Michigan Portfolio | | $ | 34,993 | | | $ | 128 | |
| Minnesota Portfolio | | $ | 25,236 | | | $ | 80 | |
| New Jersey Portfolio | | $ | 44,450 | | | $ | 163 | |
| Ohio Portfolio | | $ | 38,053 | | | $ | 154 | |
| Pennsylvania Portfolio | | $ | 39,991 | | | $ | 131 | |
| Virginia Portfolio | | $ | 35,730 | | | $ | 130 | |
| 20 | | The fees disclosed are net of any expense offsets with ABIS. An expense offset is created by the interest earned on the positive cash balance that occur within the transfer agent account as there is a one day lag with regards to money movement from the shareholder’s account to the transfer agent’s account and then from the transfer agent’s account to the Portfolio’s account. |
| | |
| 172 | | • ALLIANCEBERNSTEIN MUNICIPAL INCOME FUND II |
| V. | POSSIBLE ECONOMIES OF SCALE |
The Adviser has indicated that economies of scale are being shared with shareholders through fee structures,21 subsidies and enhancement to services. Based on some of the professional literature that has considered economies of scale in the mutual fund industry, it is thought that to the extent economies of scale exist, they may more often exist across a fund family as opposed to a specific fund. This is because the costs incurred by the Adviser, such as investment research or technology for trading or compliance systems, can be spread across a greater asset base as the fund family increases in size. It is also possible that as the level of services required to operate a successful investment company has increased over time, and advisory firms have made such investments in their business to provide services, there may be a sharing of economies of scale without a reduction in advisory fees.
An independent consultant, retained by the Senior Officer, provided the Board of Trustees an update of the Deli22 study on advisory fees and various fund characteristics.23 The independent consultant first reiterated the results of his previous two dimensional comparison analysis (fund size and family size) with the Board of Trustees.24 The independent consultant then discussed the results of the regression model that was utilized to study the effects of various factors on advisory fees. The regression model output indicated that the bulk of the variation in fees predicted were explained by various factors, but substantially by fund assets under management (“AUM”), family AUM, index fund indicator and investment style. The independent consultant also compared the advisory fees of the AllianceBernstein Mutual Funds to similar funds managed by 19 other large asset managers, regardless of fund size and the large asset manager’s proportion of mutual fund assets to non-mutual fund assets.
| VI. | NATURE AND QUALITY OF THE ADVISER’S SERVICES INCLUDING THE PERFORMANCE OF THE PORTFOLIOS. |
With assets under management of $484 billion as of September 30, 2010, the Adviser has the investment experience to manage and provide non-investment services (described in Section I) to the Portfolios.
| 21 | | Fee structures include fee reductions, pricing at scale and breakpoints in advisory fee schedules. |
| 22 | | The Deli study was originally published in 2002 based on 1997 data. |
| 23 | | As mentioned previously, the Supreme Court cautioned against accepting mutual fund fee comparisons without careful scrutiny since the fees may not be the product of negotiations conducted at arms length. See Jones V. Harris at 14. |
| 24 | | The two dimensional analysis also showed patterns of lower advisory fees for funds with larger asset sizes and funds from larger family sizes compared to funds with smaller asset sizes and funds from smaller family sizes, which according to the independent consultant is indicative of a sharing of economies of scale and scope. However, in less liquid and active markets, such is not the case, as the empirical analysis showed potential for diseconomies of scale in those markets. The empirical analysis also showed diminishing economies of scale and scope as funds surpassed a certain high level of assets. |
| | | | |
| ALLIANCEBERNSTEIN MUNICIPAL INCOME FUND II • | | | 173 | |
The information below, prepared by Lipper, shows the 1, 3, 5 and 10 year net performance returns and rankings of the Portfolios25 relative to their Lipper Performance Group (“PG”) and Lipper Performance Universe (“PU”)26 for the periods ended July 31, 2010.27
| | | | | | | | | | | | | | | | |
| | | Portfolio Return (%) | | | PG Median (%) | | | PU Median (%) | | | PG Rank | | PU Rank |
| Arizona Portfolio | | | | | | | | | | | | | | | | |
1 year | | | 8.22 | | | | 8.22 | | | | 9.38 | | | 2/3 | | 12/14 |
3 year | | | 4.48 | | | | 4.88 | | | | 4.55 | | | 3/3 | | 8/12 |
5 year | | | 4.05 | | | | 4.05 | | | | 4.03 | | | 2/3 | | 4/11 |
10 year | | | 5.13 | | | | 5.06 | | | | 4.89 | | | 1/3 | | 1/11 |
| | | | | | | | | | | | | | | | |
| Massachusetts Portfolio | | | | | | | | | | | | | | | | |
1 year | | | 8.44 | | | | 9.41 | | | | 9.58 | | | 7/9 | | 11/13 |
3 year | | | 5.34 | | | | 5.03 | | | | 5.03 | | | 3/9 | | 4/13 |
5 year | | | 4.49 | | | | 4.22 | | | | 4.24 | | | 2/9 | | 3/12 |
10 year | | | 5.19 | | | | 5.19 | | | | 5.19 | | | 5/9 | | 5/11 |
| | | | | | | | | | | | | | | | |
| Michigan Portfolio | | | | | | | | | | | | | | | | |
1 year | | | 7.10 | | | | N/A | | | | 9.40 | | | N/A | | 7/7 |
3 year | | | 4.41 | | | | N/A | | | | 4.39 | | | N/A | | 3/7 |
5 year | | | 3.96 | | | | N/A | | | | 3.83 | | | N/A | | 2/6 |
10 year | | | 5.21 | | | | N/A | | | | 4.89 | | | N/A | | 1/6 |
| | | | | | | | | | | | | | | | |
| Minnesota Portfolio | | | | | | | | | | | | | | | | |
1 year | | | 6.38 | | | | 8.40 | | | | 8.40 | | | 7/7 | | 13/13 |
3 year | | | 4.53 | | | | 4.73 | | | | 4.75 | | | 6/7 | | 11/13 |
5 year | | | 3.97 | | | | 4.10 | | | | 4.13 | | | 7/7 | | 10/12 |
10 year | | | 5.00 | | | | 5.00 | | | | 4.99 | | | 4/7 | | 6/12 |
| | | | | | | | | | | | | | | | |
| New Jersey Portfolio | | | | | | | | | | | | | | | | |
1 year | | | 10.41 | | | | 10.59 | | | | 10.50 | | | 6/9 | | 7/12 |
3 year | | | 4.15 | | | | 4.25 | | | | 4.41 | | | 6/9 | | 9/12 |
5 year | | | 3.86 | | | | 3.79 | | | | 4.07 | | | 4/8 | | 7/11 |
10 year | | | 4.47 | | | | 4.93 | | | | 5.02 | | | 6/8 | | 9/11 |
| 25 | | The performance returns and rankings are for the Class A shares of the Portfolios. It should be noted that the performance returns of the Portfolios that were shown were provided by Lipper. Lipper maintains its own database that includes the Portfolios’ performance returns. However, differences in the distribution price (ex-date versus payable date) and rounding differences may cause the Adviser’s own performance returns of the Portfolios to be different from Lipper. |
| 26 | | The Portfolios PG/PU may not be necessarily identical to the Portfolios EG/EU as the cri-teria for including or excluding a fund in/from a PG/PU are somewhat different than that of an EU/EG. |
| 27 | | Note that the current Lipper investment classification/objective dictates the PG and PU throughout the life of each Portfolio even if a Portfolio may have had a different investment classification/objective at different points in time. |
| | |
| 174 | | • ALLIANCEBERNSTEIN MUNICIPAL INCOME FUND II |
| | | | | | | | | | | | | | | | |
| | | Portfolio Return (%) | | | PG Median (%) | | | PU Median (%) | | | PG Rank | | PU Rank |
| Ohio Portfolio | | | | | | | | | | | | | | | | |
1 year | | | 7.99 | | | | 7.42 | | | | 7.71 | | | 1/4 | | 6/14 |
3 year | | | 4.44 | | | | 4.44 | | | | 4.66 | | | 2/3 | | 8/13 |
5 year | | | 4.04 | | | | 4.04 | | | | 3.95 | | | 2/3 | | 4/12 |
10 year | | | 5.07 | | | | 4.80 | | | | 4.81 | | | 1/3 | | 2/11 |
| | | | | | | | | | | | | | | | |
| Pennsylvania Portfolio | | | | | | | | | | | | | | | | |
1 year | | | 10.57 | | | | 9.41 | | | | 10.20 | | | 3/10 | | 5/17 |
3 year | | | 4.17 | | | | 4.36 | | | | 4.44 | | | 6/10 | | 11/17 |
5 year | | | 3.84 | | | | 3.90 | | | | 3.81 | | | 6/10 | | 8/16 |
10 year | | | 5.14 | | | | 4.90 | | | | 5.06 | | | 4/10 | | 7/16 |
| | | | | | | | | | | | | | | | |
| Virginia Portfolio | | | | | | | | | | | | | | | | |
1 year | | | 8.35 | | | | 8.49 | | | | 8.54 | | | 4/4 | | 7/8 |
3 year | | | 4.90 | | | | 4.89 | | | | 4.63 | | | 2/4 | | 2/8 |
5 year | | | 4.31 | | | | 4.12 | | | | 4.01 | | | 1/4 | | 1/7 |
10 year | | | 5.22 | | | | 5.09 | | | | 5.00 | | | 1/4 | | 1/7 |
Set forth below are the 1, 3, 5, 10 year and since inception net performance returns of the Portfolios (in bold)28 versus its benchmarks.29 Portfolio and benchmark volatility and reward-to-variability ratio (“Sharpe Ratio”) information is also shown.30 Note that each Portfolio’s benchmark is the Barclays Capital Municipal Bond Index.
| | | | | | | | | | | | | | | | | | | | | | | | | | | | | | | | |
| | | Periods Ending July 31, 2010 Annualized Net Performance | |
| | | 1 Year
(%) | | | 3 Year
(%) | | | 5 Year
(%) | | | 10 Year
(%) | | | Since
Inception
(%) | | | Annualized | | | Risk
Period
(Year) | |
| | | | | | | Volatility
(%) | | | Sharpe
(%) | | |
| Arizona Portfolio | | | 8.09 | | | | 4.40 | | | | 3.99 | | | | 5.10 | | | | 5.75 | | | | 3.96 | | | | 0.61 | | | | 10 | |
| Barclays Capital Municipal Bond Index | | | 9.15 | | | | 5.67 | | | | 4.75 | | | | 5.62 | | | | 5.96 | | | | 4.52 | | | | 0.64 | | | | 10 | |
| Inception Date: June 1, 1994 | | | | | | | | | | | | | |
| 28 | | The performance returns and risk measures shown in the table are for the Class A shares of the Portfolios. |
| 29 | | The Adviser provided Portfolio and benchmark performance return information for periods through July 31, 2010. |
| 30 | | Portfolio and benchmark volatility and Sharpe Ratio information was obtained through Lipper LANA, a database maintained by Lipper. Volatility is a statistical measure of the tendency of a market price or yield to vary over time. A Sharpe Ratio is a risk adjusted measure of return that divides a fund’s return in excess of the riskless return by the fund’s standard deviation. A fund with a greater volatility would be seen as more risky than a fund with equivalent performance but lower volatility; for that reason, a greater return would be demanded for the more risky fund. A fund with a higher Sharpe Ratio would be viewed as better performing than a fund with a lower Sharpe Ratio. |
| | | | |
| ALLIANCEBERNSTEIN MUNICIPAL INCOME FUND II • | | | 175 | |
| | | | | | | | | | | | | | | | | | | | | | | | | | | | | | | | |
| | | Periods Ending July 31, 2010 Annualized Net Performance | |
| | | 1 Year
(%) | | | 3 Year
(%) | | | 5 Year
(%) | | | 10 Year
(%) | | | Since
Inception
(%) | | | Annualized | | | Risk
Period
(Year) | |
| | | | | | | Volatility
(%) | | | Sharpe
(%) | | |
| Massachusetts Portfolio | | | 8.32 | | | | 5.26 | | | | 4.44 | | | | 5.17 | | | | 6.02 | | | | 3.99 | | | | 0.62 | | | | 10 | |
| Barclays Capital Municipal Bond Index | | | 9.15 | | | | 5.67 | | | | 4.75 | | | | 5.62 | | | | 5.93 | | | | 4.52 | | | | 0.64 | | | | 10 | |
| Inception Date: March 29, 1994 | | | | | | | | | | | | | |
| | | | | | | | | | | | | | | | | | | | | | | | | | | | | | | | |
| Michigan Portfolio | | | 6.98 | | | | 4.33 | | | | 3.92 | | | | 5.19 | | | | 5.76 | | | | 3.93 | | | | 0.64 | | | | 10 | |
| Barclays Capital Municipal Bond Index | | | 9.15 | | | | 5.67 | | | | 4.75 | | | | 5.62 | | | | 5.64 | | | | 4.52 | | | | 0.64 | | | | 10 | |
| Inception Date: February 25, 1994 | | | | | | | | | | | | | |
| | | | | | | | | | | | | | | | | | | | | | | | | | | | | | | | |
| Minnesota Portfolio | | | 6.26 | | | | 4.45 | | | | 3.92 | | | | 4.98 | | | | 5.06 | | | | 3.99 | | | | 0.58 | | | | 10 | |
| Barclays Capital Municipal Bond Index | | | 9.15 | | | | 5.67 | | | | 4.75 | | | | 5.62 | | | | 5.61 | | | | 4.52 | | | | 0.64 | | | | 10 | |
| Inception Date: June 25, 1993 | | | | | | | | | | | | | |
| | | | | | | | | | | | | | | | | | | | | | | | | | | | | | | | |
| New Jersey Portfolio | | | 10.27 | | | | 4.06 | | | | 3.81 | | | | 4.44 | | | | 4.82 | | | | 4.63 | | | | 0.40 | | | | 10 | |
| Barclays Capital Municipal Bond Index | | | 9.15 | | | | 5.67 | | | | 4.75 | | | | 5.62 | | | | 5.61 | | | | 4.52 | | | | 0.64 | | | | 10 | |
| Inception Date: June 25, 1993 | | | | | | | | | | | | | |
| | | | | | | | | | | | | | | | | | | | | | | | | | | | | | | | |
| Ohio Portfolio | | | 7.86 | | | | 4.36 | | | | 3.99 | | | | 5.05 | | | | 5.07 | | | | 4.13 | | | | 0.58 | | | | 10 | |
| Barclays Capital Municipal Bond Index | | | 9.15 | | | | 5.67 | | | | 4.75 | | | | 5.62 | | | | 5.61 | | | | 4.52 | | | | 0.64 | | | | 10 | |
| Inception Date: June 25, 1993 | | | | | | | | | | | | | |
| | | | | | | | | | | | | | | | | | | | | | | | | | | | | | | | |
| Pennsylvania Portfolio | | | 10.44 | | | | 4.09 | | | | 3.80 | | | | 5.12 | | | | 5.27 | | | | 4.15 | | | | 0.59 | | | | 10 | |
| Barclays Capital Municipal Bond Index | | | 9.15 | | | | 5.67 | | | | 4.75 | | | | 5.62 | | | | 5.61 | | | | 4.52 | | | | 0.64 | | | | 10 | |
| Inception Date: June 25, 1993 | | | | | | | | | | | | | |
| | | | | | | | | | | | | | | | | | | | | | | | | | | | | | | | |
| Virginia Portfolio | | | 8.23 | | | | 4.81 | | | | 4.26 | | | | 5.20 | | | | 5.95 | | | | 4.02 | | | | 0.62 | | | | 10 | |
| Barclays Capital Municipal Bond Index | | | 9.15 | | | | 5.67 | | | | 4.75 | | | | 5.62 | | | | 5.91 | | | | 4.52 | | | | 0.64 | | | | 10 | |
| Inception Date: April 29, 1994 | | | | | | | | | | | | | |
CONCLUSION:
Based on the factors discussed above the Senior Officer’s conclusion is that the proposed fees for the Portfolios are reasonable and within the range of what would have been negotiated at arms-length in light of all the surrounding circumstances. This conclusion in respect of the Portfolios is based on an evaluation of all of these factors and no single factor was dispositive.
Dated: November 22, 2010
| | |
| 176 | | • ALLIANCEBERNSTEIN MUNICIPAL INCOME FUND II |
THIS PAGE IS NOT PART OF THE SHAREHOLDER REPORT OR THE FINANCIAL STATEMENTS
ALLIANCEBERNSTEIN FAMILY OF FUNDS
Wealth Strategies Funds
Balanced Wealth Strategy
Conservative Wealth Strategy
Wealth Appreciation Strategy
Tax-Managed Balanced Wealth Strategy
Tax-Managed Conservative Wealth Strategy
Tax-Managed Wealth Appreciation Strategy
Asset Allocation/Multi-Asset
Emerging Markets Multi-Asset
International Portfolio
Real Asset Strategy
Tax-Managed International Portfolio
Growth Funds
Domestic
Growth Fund
Large Cap Growth Fund
Small Cap Growth Portfolio
Small/Mid Cap Growth Fund
U.S. Strategic Research Portfolio
Global & International
Global Thematic Growth Fund
Greater China ’97 Fund
International Discovery Equity Portfolio
International Focus 40 Portfolio
International Growth Fund
Value Funds
Domestic
Core Opportunities Fund
Equity Income Fund
Growth & Income Fund
Small/Mid Cap Value Fund
Value Fund
Global & International
Global Real Estate Investment Fund
Global Value Fund
International Value Fund
Taxable Bond Funds
Bond Inflation Strategy
Global Bond Fund
High Income Fund
Intermediate Bond Portfolio
Short Duration Portfolio
Unconstrained Bond Fund*
Municipal Bond Funds
| | |
Arizona California High Income Massachusetts Michigan Minnesota Municipal Bond Inflation Strategy | | National New Jersey New York Ohio Pennsylvania Virginia |
Intermediate Municipal Bond Funds
Intermediate California
Intermediate Diversified
Intermediate New York
Closed-End Funds
Alliance California Municipal Income Fund
Alliance New York Municipal Income Fund
AllianceBernstein Global High Income Fund
AllianceBernstein Income Fund
AllianceBernstein National Municipal Income Fund
Alternatives
Market Neutral Strategy-Global
Market Neutral Strategy-U.S.
Balanced
Balanced Shares
Retirement Strategies Funds
| | | | |
2000 Retirement Strategy | | 2020 Retirement Strategy | | 2040 Retirement Strategy |
2005 Retirement Strategy | | 2025 Retirement Strategy | | 2045 Retirement Strategy |
2010 Retirement Strategy | | 2030 Retirement Strategy | | 2050 Retirement Strategy |
2015 Retirement Strategy | | 2035 Retirement Strategy | | 2055 Retirement Strategy |
We also offer Exchange Reserves,** which serves as the money market fund exchange vehicle for the AllianceBernstein mutual funds.
You should consider the investment objectives, risks, charges and expenses of any AllianceBernstein fund/portfolio carefully before investing. For free copies of our prospectuses, which contain this and other information, visit us online at www.alliancebernstein.com or contact your financial advisor. Please read the prospectus carefully before investing.
| * | | Prior to February 3, 2011, Unconstrained Bond Fund was named Diversified Yield Fund. |
| ** | An investment in the Fund is not a deposit in a bank and is not insured or guaranteed by the Federal Deposit Insurance Corporation or any other government agency. Although the Fund seeks to preserve the value of your investment at $1.00 per share, it is possible to lose money by investing in the Fund. |
| | | | |
| ALLIANCEBERNSTEIN MUNICIPAL INCOME FUND II • | | | 177 | |
AllianceBernstein Family of Funds
NOTES
| | |
| 178 | | • ALLIANCEBERNSTEIN MUNICIPAL INCOME FUND II |
NOTES
| | | | |
| ALLIANCEBERNSTEIN MUNICIPAL INCOME FUND II • | | | 179 | |
NOTES
| | |
| 180 | | • ALLIANCEBERNSTEIN MUNICIPAL INCOME FUND II |
NOTES
| | | | |
| ALLIANCEBERNSTEIN MUNICIPAL INCOME FUND II • | | | 181 | |
NOTES
| | |
| 182 | | • ALLIANCEBERNSTEIN MUNICIPAL INCOME FUND II |
NOTES
| | | | |
| ALLIANCEBERNSTEIN MUNICIPAL INCOME FUND II • | | | 183 | |
NOTES
| | |
| 184 | | • ALLIANCEBERNSTEIN MUNICIPAL INCOME FUND II |
ALLIANCEBERNSTEIN MUNICIPAL INCOME FUND II
1345 Avenue of the Americas
New York, NY 10105
800.221.5672
| | |
| |
| MIFII-0151-0911 | |  |
(a) The registrant has adopted a code of ethics that applies to its principal executive officer, principal financial officer and principal accounting officer. A copy of the registrant’s code of ethics is filed herewith as Exhibit 12(a)(1).
(b) During the period covered by this report, no material amendments were made to the provisions of the code of ethics adopted in 2(a) above.
(c) During the period covered by this report, no implicit or explicit waivers to the provisions of the code of ethics adopted in 2(a) above were granted.
| ITEM 3. | AUDIT COMMITTEE FINANCIAL EXPERT. |
The registrant’s Board of Directors has determined that independent directors Garry L. Moody and William H. Foulk, Jr. qualify as audit committee financial experts.
| ITEM 4. | PRINCIPAL ACCOUNTANT FEES AND SERVICES. |
(a) - (c) The following table sets forth the aggregate fees billed by the independent registered public accounting firm Ernst & Young LLP, for the Fund’s last two fiscal years for professional services rendered for: (i) the audit of the Fund’s annual financial statements included in the Fund’s annual report to stockholders; (ii) assurance and related services that are reasonably related to the performance of the audit of the Fund’s financial statements and are not reported under (i), which include advice and education related to accounting and auditing issues and quarterly press release review (for those Funds which issue press releases), and preferred stock maintenance testing (for those Funds that issue preferred stock); and (iii) tax compliance, tax advice and tax return preparation.
| | | | | | | | | | | | | | | | |
| | | | | | Audit
Fees | | | Audit-
Related
Fees | | | Tax Fees | |
Arizona Portfolio | | | 2010 | | | $ | 26,880 | | | $ | — | | | $ | 14,220 | |
| | | 2011 | | | $ | 26,880 | | | $ | 253 | | | $ | 12,467 | |
Florida Portfolio | | | 2010 | | | $ | — | | | $ | — | | | $ | — | |
| | | 2011 | | | $ | — | | | $ | — | | | $ | — | |
Massachusetts Portfolio | | | 2010 | | | $ | 26,880 | | | $ | — | | | $ | 15,149 | |
| | | 2011 | | | $ | 26,880 | | | $ | 253 | | | $ | 12,467 | |
Michigan Portfolio | | | 2010 | | | $ | 26,880 | | | $ | — | | | $ | 11,245 | |
| | | 2011 | | | $ | 26,880 | | | $ | 253 | | | $ | 12,467 | |
Minnesota Portfolio | | | 2010 | | | $ | 26,880 | | | $ | — | | | $ | 11,494 | |
| | | 2011 | | | $ | 26,880 | | | $ | 253 | | | $ | 12,467 | |
New Jersey Portfolio | | | 2010 | | | $ | 26,880 | | | $ | — | | | $ | 13,354 | |
| | | 2011 | | | $ | 26,880 | | | $ | 253 | | | $ | 12,467 | |
Ohio Portfolio | | | 2010 | | | $ | 26,880 | | | $ | — | | | $ | 12,856 | |
| | | 2011 | | | $ | 26,880 | | | $ | 253 | | | $ | 12,467 | |
Pennsylvania Portfolio | | | 2010 | | | $ | 26,880 | | | $ | — | | | $ | 12,028 | |
| | | 2011 | | | $ | 26,880 | | | $ | 253 | | | $ | 12,467 | |
Virginia Portfolio | | | 2010 | | | $ | 26,880 | | | $ | — | | | $ | 15,488 | |
| | | 2011 | | | $ | 26,880 | | | $ | 253 | | | $ | 12,467 | |
(d) Not applicable.
(e) (1) Beginning with audit and non-audit service contracts entered into on or after May 6, 2003, the Fund’s Audit Committee policies and procedures require the pre-approval of all audit and non-audit services provided to the Fund by the Fund’s independent registered public accounting firm. The Fund’s Audit Committee policies and procedures also require pre-approval of all audit and non-audit services provided to the Adviser and Service Affiliates to the extent that these services are directly related to the operations or financial reporting of the Fund.
(e) (2) All of the amounts for Audit Fees, Audit-Related Fees and Tax Fees in the table under Item 4 (a)–(c) are for services pre-approved by the Fund’s Audit Committee.
(f) Not applicable.
(g) The following table sets forth the aggregate non-audit services provided to the Fund, the Fund’s Adviser and entities that control, are controlled by or under common control with the Adviser that provide ongoing services to the Fund, which include preparing an annual internal control report pursuant to Statement on Auditing Standards No. 70 (“Service Affiliates”):
| | | | | | | | | | | | |
| | | | | | All Fees for
Non-Audit
Services Provided
to the Portfolio,
the Adviser and
Service Affiliates | | | Pre-approved by
the Audit Committee
(Portion Comprised
of Audit Related Fees)
(Portion Comprised
of Tax Fees) | |
Arizona Portfolio | | | 2010 | | | $ | 725,617 | | | $ | 141,935 | |
| | | | | | | | | | $ | (127,715 | ) |
| | | | | | | | | | $ | (14,220 | ) |
| | | 2011 | | | $ | 801,468 | | | $ | 12,720 | |
| | | | | | | | | | $ | (253 | ) |
| | | | | | | | | | $ | (12,467 | ) |
Florida Portfolio | | | 2010 | | | $ | — | | | $ | — | |
| | | | | | | | | | $ | — | |
| | | | | | | | | | $ | — | |
| | | 2011 | | | $ | — | | | $ | — | |
| | | | | | | | | | $ | — | |
| | | | | | | | | | $ | — | |
Massachusetts Portfolio | | | 2010 | | | $ | 726,546 | | | $ | 142,864 | |
| | | | | | | | | | $ | (127,715 | ) |
| | | | | | | | | | $ | (15,149 | ) |
| | | 2011 | | | $ | 801,468 | | | $ | 12,720 | |
| | | | | | | | | | $ | (253 | ) |
| | | | | | | | | | $ | (12,467 | ) |
Michigan Portfolio | | | 2010 | | | $ | 722,642 | | | $ | 138,960 | |
| | | | | | | | | | $ | (127,715 | ) |
| | | | | | | | | | $ | (11,245 | ) |
| | | 2011 | | | $ | 801,468 | | | $ | 12,720 | |
| | | | | | | | | | $ | (253 | ) |
| | | | | | | | | | $ | (12,467 | ) |
Minnesota Portfolio | | | 2010 | | | $ | 722,891 | | | $ | 139,209 | |
| | | | | | | | | | $ | (127,715 | ) |
| | | | | | | | | | $ | (11,494 | ) |
| | | 2011 | | | $ | 801,468 | | | $ | 12,720 | |
| | | | | | | | | | $ | (253 | ) |
| | | | | | | | | | $ | (12,467 | ) |
New Jersey Portfolio | | | 2010 | | | $ | 724,751 | | | $ | 141,069 | |
| | | | | | | | | | $ | (127,715 | ) |
| | | | | | | | | | $ | (13,354 | ) |
| | | 2011 | | | $ | 801,468 | | | $ | 12,720 | |
| | | | | | | | | | $ | (253 | ) |
| | | | | | | | | | $ | (12,467 | ) |
Ohio Portfolio | | | 2010 | | | $ | 724,253 | | | $ | 140,571 | |
| | | | | | | | | | $ | (127,715 | ) |
| | | | | | | | | | $ | (12,856 | ) |
| | | 2011 | | | $ | 801,468 | | | $ | 12,720 | |
| | | | | | | | | | $ | (253 | ) |
| | | | | | | | | | $ | (12,467 | ) |
| | | | | | | | | | | | |
| | | | | | All Fees for
Non-Audit
Services Provided
to the Portfolio,
the Adviser and
Service Affiliates | | | Pre-approved by
the Audit Committee
(Portion Comprised
of Audit Related Fees)
(Portion Comprised
of Tax Fees) | |
Pennsylvania Portfolio | | | 2010 | | | $ | 723,425 | | | $ | 139,743 | |
| | | | | | | | | | $ | (127,715 | ) |
| | | | | | | | | | $ | (12,028 | ) |
| | | 2011 | | | $ | 801,468 | | | $ | 12,720 | |
| | | | | | | | | | $ | (253 | ) |
| | | | | | | | | | $ | (12,467 | ) |
Virginia Portfolio | | | 2010 | | | $ | 726,885 | | | $ | 143,203 | |
| | | | | | | | | | $ | (127,715 | ) |
| | | | | | | | | | $ | (15,488 | ) |
| | | 2011 | | | $ | 801,468 | | | $ | 12,720 | |
| | | | | | | | | | $ | (253 | ) |
| | | | | | | | | | $ | (12,467 | ) |
(h) The Audit Committee of the Fund has considered whether the provision of any non-audit services not pre-approved by the Audit Committee provided by the Fund’s independent registered public accounting firm to the Adviser and Service Affiliates is compatible with maintaining the auditor’s independence.
| ITEM 5. | AUDIT COMMITTEE OF LISTED REGISTRANTS. |
Not applicable to the registrant.
| ITEM 6. | SCHEDULE OF INVESTMENTS. |
Please see Schedule of Investments contained in the Report to Shareholders included under Item 1 of this Form N-CSR.
| ITEM 7. | DISCLOSURE OF PROXY VOTING POLICIES AND PROCEDURES FOR CLOSED-END MANAGEMENT INVESTMENT COMPANIES. |
Not applicable to the registrant.
| ITEM 8. | PORTFOLIO MANAGERS OF CLOSED-END MANAGEMENT INVESTMENT COMPANIES. |
Not applicable to the registrant.
| ITEM 9. | PURCHASES OF EQUITY SECURITIES BY CLOSED-END MANAGEMENT INVESTMENT COMPANY AND AFFILIATED PURCHASERS. |
Not applicable to the registrant.
| ITEM 10. | SUBMISSION OF MATTERS TO A VOTE OF SECURITY HOLDERS. |
There have been no material changes to the procedures by which shareholders may recommend nominees to the Fund’s Board of Directors since the Fund last provided disclosure in response to this item.
ITEM 11. CONTROLS AND PROCEDURES.
(a) The registrant’s principal executive officer and principal financial officer have concluded that the registrant’s disclosure controls and procedures (as defined in Rule 30a-2(c) under the Investment Company Act of 1940, as amended) are effective at the reasonable assurance level based on their evaluation of these controls and procedures as of a date within 90 days of the filing date of this document.
(b) There were no changes in the registrant’s internal controls over financial reporting that occurred during the second fiscal quarter of the period that has materially affected, or is reasonably likely to materially affect, the registrant’s internal control over financial reporting.
The following exhibits are attached to this Form N-CSR:
| | |
EXHIBIT NO. | | DESCRIPTION OF EXHIBIT |
| |
| 12 (a) (1) | | Code of Ethics that is subject to the disclosure of Item 2 hereof |
| |
| 12 (b) (1) | | Certification of Principal Executive Officer Pursuant to Section 302 of the Sarbanes-Oxley Act of 2002 |
| |
| 12 (b) (2) | | Certification of Principal Financial Officer Pursuant to Section 302 of the Sarbanes-Oxley Act of 2002 |
| |
| 12 (c) | | Certification of Principal Executive Officer and Principal Financial Officer Pursuant to Section 906 of the Sarbanes-Oxley Act of 2002 |
SIGNATURES
Pursuant to the requirements of the Securities Exchange Act of 1934 and the Investment Company Act of 1940, the registrant has duly caused this report to be signed on its behalf by the undersigned, thereunto duly authorized.
| | |
| (Registrant): AllianceBernstein Municipal Income Fund II |
| |
| By: | | /s/ Robert M. Keith |
| | Robert M. Keith President |
| |
| Date: | | November 21, 2011 |
Pursuant to the requirements of the Securities Exchange Act of 1934 and the Investment Company Act of 1940, this report has been signed below by the following persons on behalf of the registrant and in the capacities and on the dates indicated.
| | |
| |
| By: | | /s/ Robert M. Keith |
| | Robert M. Keith President |
| |
| Date: | | November 21, 2011 |
| | |
| |
| By: | | /s/ Joseph J. Mantineo |
| | Joseph J. Mantineo Treasurer and Chief Financial Officer |
| |
| Date: | | November 21, 2011 |