UNITED STATES
SECURITIES AND EXCHANGE COMMISSION
WASHINGTON, D.C. 20549
FORM N-CSR
CERTIFIED SHAREHOLDER REPORT OF REGISTERED
MANAGEMENT INVESTMENT COMPANIES
Investment Company Act file number: 811-07618
AB MUNICIPAL INCOME FUND II
(Exact name of registrant as specified in charter)
1345 Avenue of the Americas, New York, New York 10105
(Address of principal executive offices) (Zip code)
Joseph J. Mantineo
AllianceBernstein L.P.
1345 Avenue of the Americas
New York, New York 10105
(Name and address of agent for service)
Registrant’s telephone number, including area code: (800) 221-5672
Date of fiscal year end: May 31, 2016
Date of reporting period: May 31, 2016
| ITEM 1. | REPORTS TO STOCKHOLDERS. |
MAY 05.31.16

ANNUAL REPORT
AB MUNICIPAL INCOME FUND II
| + | AB ARIZONA PORTFOLIO |
| + | AB MASSACHUSETTS PORTFOLIO |
| + | AB MICHIGAN PORTFOLIO |
| + | AB MINNESOTA PORTFOLIO |
| + | AB NEW JERSEY PORTFOLIO |
| + | AB OHIO PORTFOLIO |
| + | AB PENNSYLVANIA PORTFOLIO |
| + | AB VIRGINIA PORTFOLIO |
Investment Products Offered
• Are Not FDIC Insured • May Lose Value • Are Not Bank Guaranteed |
Investors should consider the investment objectives, risks, charges and expenses of the Fund carefully before investing. For copies of our prospectus or summary prospectus, which contain this and other information, visit us online at www.abfunds.com or contact your AB representative. Please read the prospectus and/or summary prospectus carefully before investing.
This shareholder report must be preceded or accompanied by the Fund’s prospectus for individuals who are not current shareholders of the Fund.
You may obtain a description of the Fund’s proxy voting policies and procedures, and information regarding how the Fund voted proxies relating to portfolio securities during the most recent 12-month period ended June 30, without charge. Simply visit AB’s website at www.abfunds.com, or go to the Securities and Exchange Commission’s (the “Commission”) website at www.sec.gov, or call AB at (800) 227-4618.
The Fund files its complete schedule of portfolio holdings with the Commission for the first and third quarters of each fiscal year on Form N-Q. The Fund’s Forms N-Q are available on the Commission’s website at www.sec.gov. The Fund’s Forms N-Q may also be reviewed and copied at the Commission’s Public Reference Room in Washington, DC; information on the operation of the Public Reference Room may be obtained by calling (800) SEC-0330. AB publishes full portfolio holdings for the Fund monthly at www.abfunds.com.
AllianceBernstein Investments, Inc. (ABI) is the distributor of the AB family of mutual funds. ABI is a member of FINRA and is an affiliate of AllianceBernstein L.P., the Adviser of the funds.
The [A/B] logo is a registered service mark of AllianceBernstein and AllianceBernstein® is a registered service mark used by permission of the owner, AllianceBernstein L.P.
July 15, 2016
Annual Report
This report provides management’s discussion of fund performance for the portfolios of AB Municipal Income Fund II (the “Fund”) for the annual reporting period ended May 31, 2016. The Fund has eight portfolios: AB Arizona Portfolio, AB Massachusetts Portfolio, AB Michigan Portfolio, AB Minnesota Portfolio, AB New Jersey Portfolio, AB Ohio Portfolio, AB Pennsylvania Portfolio and AB Virginia Portfolio (together, the “Portfolios”).
Investment Objectives and Policies
The eight Portfolios, by investing principally in high-yielding, predominantly investment-grade municipal securities, seek to provide their shareholders with the highest level of current income exempt from federal taxation and state taxation of the respective state that is available without assuming what AllianceBernstein L.P. (the “Adviser”) considers to be undue risk. Each of the Portfolios invests, under normal circumstances, at least 80% of its net assets in municipal securities that pay interest that is exempt from federal income tax. Each of the Portfolios pursues its objective by investing at least 80% of its net assets in municipal securities issued by the named state or municipal securities with interest that is otherwise exempt from the named state’s income tax.
The Portfolios may also invest in forward commitments; zero-coupon municipal securities and variable, floating and inverse floating-rate municipal securities; and derivatives, such as options, futures contracts, forwards and swaps.
Investment Results
The tables on pages 7-14 show performance for each Portfolio compared to its benchmark, the Barclays Municipal Bond Index, which represents the municipal market, for the
six- and 12-month periods ended May 31, 2016.
AB Arizona Portfolio – For the six-month period, all share classes of the Portfolio outperformed the benchmark; for the 12-month period, Class A shares outperformed the benchmark while Classes B and C underperformed, before sales charges. An underweight in the state general obligation (“GO”) sector and sector selection in the special tax, education, health care and leasing sectors contributed to performance for both periods, relative to the benchmark. Security selection in the local GO sector also contributed in the six-month period and security selection in the transportation sector contributed for the 12-month period. For the six-month period, an underweight to the leasing sector and overweight to the special tax sector detracted; for the 12-month period, an overweight to the insured sector and underweight to the industrial and leasing sectors detracted.
AB Massachusetts Portfolio – For both periods, all share classes of the Portfolio underperformed the benchmark, before sales charges. An underweight to the leasing, transportation and industrial sectors and security selection in the water, insured and transportation sectors detracted for both periods, relative to the benchmark. For the six-month period, an overweight to the pre-refunded sector also detracted. For both periods, an underweight in the state GO sector and security selection in the health care sector contributed. Security selection in the special tax sector also contributed to 12-month performance.
AB Michigan Portfolio – For both periods, all share classes of the Portfolio outperformed the benchmark, before sales charges. Security selection in the education, water, health care, special tax and housing sectors contributed, for both periods, relative to the benchmark. For the six-month period, an under-
| AB MUNICIPAL INCOME FUND II • | 1 |
weight in the pre-refunded and state GO sectors and an overweight in the health care sector contributed; for the 12-month period, an underweight in the pre-refunded and state GO sectors contributed. For both periods, security selection in the local GO sector and an underweight to the transportation sector, and overweight to the housing and insured sectors, detracted.
AB Minnesota Portfolio – For both periods, all share classes of the Portfolio underperformed the benchmark, before sales charges. An underweight in the transportation sector and security selection in insured bonds detracted from performance for both periods, relative to the benchmark. For the six-month period, security selection in the transportation sector detracted; security selection in the special tax sector detracted for the 12-month period. An underweight in the state GO sector and security selection in the education and power sectors contributed, for both periods. Security selection in health care, housing and local GO sectors also contributed for the 12-month period.
AB New Jersey Portfolio – For the six-month period, Class A and B shares outperformed the benchmark while Class C underperformed; for the 12-month period, Class A shares outperformed the benchmark while Classes B and C underperformed, before sales charges. For both periods, an underweight in the state GO sector and security selection in the industrial, leasing and transportation sectors contributed, relative to the benchmark; for the six-month period, security selection in the health care sector also contributed. An overweight in the pre-refunded sector and security selection in the water sector detracted. Security selection in the insured sector was also a detractor for the six-month period, as was security selection in the local GO sector for the 12-month period.
AB Ohio Portfolio – For the six-month period, Class A and B shares outperformed the benchmark, while Class C shares performed inline with the benchmark; for the 12-month period, Class A shares outperformed the benchmark, while Class B and C shares underperformed, before sales charges. For the six-month period, an underweight in the state GO sector and security selection in the education, special tax and local GO sectors contributed to performance, relative to the benchmark. For the 12-month period, an underweight to the state GO sector and security selection to the education, special tax and local GO sectors contributed. An overweight in the pre-refunded sector and security selection in the transportation, leasing and power sectors detracted for the six-month period; an overweight to the pre-refunded sector and security selection in the industrials, health care and transportation sectors detracted, for the 12-month period.
AB Pennsylvania Portfolio – For both periods, all share classes of the Portfolio underperformed the benchmark, before sales charges. An underweight to the leasing sector and security selection in the pre-refunded sector detracted for both periods, relative to the benchmark. Security selection in the special tax sector detracted from performance in the six-month period, but contributed for the 12-month period; security selection in the local GO sector also contributed. An underweight in the state GO sector and security selection in the water, transportation and education sectors contributed for both periods.
AB Virginia Portfolio – Class A shares outperformed the benchmark for the six-month period, while Class B and C shares underperformed; for the 12-month period, all share classes underperformed the benchmark, before sales charges. For
| 2 | • AB MUNICIPAL INCOME FUND II |
the six-month period, an underweight in the state GO sector and security selection in the industrial, transportation and special tax sectors contributed to performance, relative to the benchmark; an overweight in the pre-refunded sector and security selection in the local GO and leasing sectors detracted. For the 12-month period, an underweight to the state GO sector and security selection in the industrial, special tax and housing sectors contributed; an overweight in the pre-refunded sector and security selection in the local GO and pre-refunded sectors detracted.
All Portfolios used derivatives in the form of interest rate swaps and inflation (“CPI”) swaps for the six- and 12-month periods for hedging purposes, which had no material impact on absolute performance.
Market Review and Investment Strategy
Intermediate- and long-maturity bonds had strong returns over both periods as falling global commodity prices and slowing economic growth drove yields lower. Shorter-maturity bonds underperformed as the US Federal Reserve increased the Federal Funds rate above its zero target to a 0.25% target for the first time since 2008. Across fixed-income sectors, municipals had strong performance due primarily to a combination of continued investor demand and limited supply. The total volume of municipal bonds outstanding has declined since 2010, unlike the corporate and Treasury markets which have seen an increase in issuance. Municipal credit continues to do well, as economic growth and tax receipts are correlated, which has caused tax revenues for state and local governments to hit all-time highs. State and local governments have kept payrolls and expenditures in check as government employment is approximately 500,000 below the peak during the financial crisis. The Portfolios’ Senior Investment Management Team continues to be over-
weight credit (municipal bonds rated A and below) and underweight the longest-maturity bonds in the Portfolios.
The Portfolios may purchase municipal securities that are insured under policies issued by certain insurance companies. Historically, insured municipal securities typically received a higher credit rating, which meant that the issuer of the securities paid a lower interest rate. As a result of declines in the credit quality and associated downgrades of most fund insurers, insurance has less value than it did in the past. The market now values insured municipal securities primarily based on the credit quality of the issuer of the security with little value given to the insurance feature. In purchasing such insured securities, the Adviser evaluates the risk and return of municipal securities through its own research. If an insurance company’s rating is downgraded or the company becomes insolvent, the prices of municipal securities insured by the insurance company may decline.
| Portfolio | Insured Bonds* | Pre-Refunded/ ETM†/Insured Bonds* | ||||||
Arizona | 22.53 | % | 5.05 | % | ||||
Massachusetts | 6.75 | 0.00 | ||||||
Michigan | 8.11 | 0.00 | ||||||
Minnesota | 8.51 | 0.00 | ||||||
New Jersey | 24.98 | 8.92 | ||||||
Ohio | 9.64 | 3.28 | ||||||
Pennsylvania | 9.08 | 2.08 | ||||||
Virginia | 9.19 | 2.63 | ||||||
| * | Breakdowns expressed as a percentage of investments in municipal bonds. |
| † | Escrowed to maturity. |
On June 23, 2016, the UK voted to leave the European Union (“EU”) in a popular referendum. At this moment in time, the UK remains a member of the EU and the rules and regulations remain unchanged, as do all the protections in place. Exactly how the UK’s role in the EU will change will become clear over time. The Adviser continues to monitor the heightened market volatility.
| AB MUNICIPAL INCOME FUND II • | 3 |
DISCLOSURES AND RISKS
Benchmark Disclosure
The Barclays Municipal Bond Index is unmanaged and does not reflect fees and expenses associated with the active management of a mutual fund portfolio. The Barclays Municipal Bond Index is a total return performance benchmark for the long-term investment grade, tax-exempt bond market. An investor cannot invest directly in an index, and its results are not indicative of the performance for any specific investment, including the Portfolios.
A Word About Risk
Market Risk: The value of the Portfolios’ assets will fluctuate as the bond market fluctuates. The value of the Portfolios’ investments may decline, sometimes rapidly and unpredictably, simply because of economic changes or other events that affect large portions of the market.
Credit Risk: An issuer or guarantor of a fixed-income security, or the counterparty to a derivatives or other contract, may be unable or unwilling to make timely payments of interest or principal, or to otherwise honor its obligations. The issuer or guarantor may default, causing a loss of the full principal amount of a security. The degree of risk for a particular security may be reflected in its credit rating. There is the possibility that the credit rating of a fixed-income security may be downgraded after purchase, which may adversely affect the value of the security. Investments in fixed-income securities with lower ratings tend to have a higher probability that an issuer will default or fail to meet its payment obligations.
Municipal Market Risk: This is the risk that special factors may adversely affect the value of municipal securities and have a significant effect on the yield or value of the Portfolios’ investments in municipal securities. These factors include economic conditions, political or legislative changes, uncertainties related to the tax status of municipal securities, or the rights of investors in these securities. To the extent that the Portfolios invest more of their assets in a particular state’s municipal securities, the Portfolios may be vulnerable to events adversely affecting that state, including economic, political and regulatory occurrences, court decisions, terrorism and catastrophic natural disasters, such as hurricanes or earthquakes. The Portfolios’ investments in certain municipal securities with principal and interest payments that are made from the revenues of a specific project or facility, and not general tax revenues, may have increased risks. Factors affecting the project or facility, such as local business or economic conditions, could have a significant effect on the project’s ability to make payments of principal and interest on these securities.
The Portfolios may invest in the municipal securities of Puerto Rico and other US territories and their governmental agencies and municipalities, which are exempt from federal, state, and, where applicable, local income taxes. These municipal securities may have more risks than those of other US issuers of municipal securities. Like many US states and municipalities, Puerto Rico experienced a significant downturn during the recent recession. Puerto Rico’s downturn was particularly severe, and Puerto Rico continues to face a very challenging economic and fiscal environment. Municipal securities issued by Puerto Rico issuers have extremely low credit ratings and are on “negative watch” by credit rating organizations. Some Puerto Rico issuers are in default on principal and interest payments. The Government Development Bank, which provides liquidity to Puerto Rico’s government agencies, recently defaulted on a $400 million debt payment. This default casts doubts on the ability of Puerto Rico and its government agencies to make future payments. If this and the general economic situation in Puerto Rico persist or worsen, the volatility and credit quality of Puerto Rican municipal securities could be adversely affected, and the market for such securities may experience continued volatility. In addition, Puerto Rico’s difficulties
(Disclosures, Risks and Note about Historical Performance continued on next page)
| 4 | • AB MUNICIPAL INCOME FUND II |
Disclosures and Risks
DISCLOSURES AND RISKS
(continued from previous page)
have resulted in increased volatility in portions of the broader municipal securities market from time to time, and this may recur in the future.
Tax Risk: There is no guarantee that all of the Portfolios’ income will remain exempt from federal or state income taxes. From time to time, the US government and the US Congress consider changes in federal tax law that could limit or eliminate the federal tax exemption for municipal bond income, which would in effect reduce the income received by shareholders from the Portfolios by increasing taxes on that income. In such event, the Portfolios’ net asset value (“NAV”) could also decline as yields on municipal bonds, which are typically lower than those on taxable bonds, would be expected to increase to approximately the yield of comparable taxable bonds. Actions or anticipated actions affecting the tax exempt status of municipal bonds could also result in significant shareholder redemptions of shares of the Portfolios as investors anticipate adverse effects on the Portfolios or seek higher yields to offset the potential loss of the tax deduction. As a result, the Portfolios would be required to maintain higher levels of cash to meet the redemptions, which would negatively affect the Portfolios’ yield.
Interest Rate Risk: Changes in interest rates will affect the value of investments in fixed-income securities. When interest rates rise, the value of investments in fixed-income securities tends to fall and this decrease in value may not be offset by higher income from new investments. Interest rate risk is generally greater for fixed-income securities with longer maturities or durations.
Duration Risk: Duration is a measure that relates the expected price volatility of a fixed-income security to changes in interest rates. The duration of a fixed-income security may be shorter than or equal to full maturity of a fixed-income security. Fixed-income securities with longer durations have more risk and will decrease in price as interest rates rise. For example, a fixed-income security with a duration of three years will decrease in value by approximately 3% if interest rates increase by 1%.
Inflation Risk: This is the risk that the value of assets or income from investments will be less in the future as inflation decreases the value of money. As inflation increases, the value of the Portfolios’ assets can decline as can the value of the Portfolios’ distributions. This risk is significantly greater for fixed-income securities with longer maturities.
Liquidity Risk: Liquidity risk occurs when certain investments become difficult to purchase or sell. Difficulty in selling less liquid securities may result in sales at disadvantageous prices affecting the value of your investment in the Portfolios. Causes of liquidity risk may include low trading volumes, large positions and heavy redemptions of the Portfolios’ shares. Over recent years liquidity risk has also increased because the capacity of dealers in the secondary market for fixed-income securities to make markets in these securities has decreased, even as the overall bond market has grown significantly, due to, among other things, structural changes, additional regulatory requirements and capital and risk restraints that have led to reduced inventories. Liquidity risk may be higher in a rising interest rate environment, when the value and liquidity of fixed-income securities generally decline. Municipal securities may have more liquidity risk than other fixed-income securities because they trade less frequently and the market for municipal securities is generally smaller than many other markets.
Derivatives Risk: Investments in derivatives may be illiquid, difficult to price, and leveraged so that small changes may produce disproportionate losses for the Portfolios, and may be subject to counterparty risk to a greater degree than more traditional investments.
(Disclosures, Risks and Note about Historical Performance continued on next page)
| AB MUNICIPAL INCOME FUND II • | 5 |
Disclosures and Risks
DISCLOSURES AND RISKS
(continued from previous page)
Management Risk: The Portfolios are subject to management risk because they are actively managed investment funds. The Adviser will apply its investment techniques and risk analyses in making investment decisions, but there is no guarantee that its techniques will produce the intended results.
These risks are fully discussed in the Portfolios’ prospectus. As with all investments, you may lose money by investing in the Portfolios.
An Important Note About Historical Performance
The investment return and principal value of an investment in the Portfolios will fluctuate, so that shares, when redeemed, may be worth more or less than their original cost. Performance shown on the following pages represents past performance and does not guarantee future results. Current performance may be lower or higher than the performance information shown. You may obtain performance information current to the most recent month-end by visiting www.abfunds.com.
All fees and expenses related to the operation of the Portfolios have been deducted. Net asset value returns do not reflect sales charges; if sales charges were reflected, the Portfolios’ quoted performance would be lower. SEC returns reflect the applicable sales charges for each share class: a 3.00% maximum front-end sales charge for Class A shares; the applicable contingent deferred sales charge for Class B shares (3% year 1, 2% year 2, 1% year 3); a 1% 1-year contingent deferred sales charge for Class C shares. Returns for the different share classes will vary due to different expenses associated with each class. Performance assumes reinvestment of distributions and does not account for taxes.
| 6 | • AB MUNICIPAL INCOME FUND II |
Disclosures and Risks
AB ARIZONA PORTFOLIO
HISTORICAL PERFORMANCE
THE PORTFOLIO VS ITS BENCHMARK PERIODS ENDED MAY 31, 2016 (unaudited) | NAV Returns | |||||||||
| 6 Months | 12 Months | |||||||||
| AB Arizona Portfolio | ||||||||||
Class A | 3.82% | 6.50% | ||||||||
| ||||||||||
Class B* | 3.53% | 5.81% | ||||||||
| ||||||||||
Class C | 3.53% | 5.81% | ||||||||
| ||||||||||
| Barclays Municipal Bond Index | 3.42% | 5.87% | ||||||||
| ||||||||||
* Effective January 31, 2009, Class B shares are no longer available for purchase to new investors. Please see Note A for more information. | ||||||||||
GROWTH OF A $10,000 INVESTMENT IN THE PORTFOLIO
5/31/06 TO 5/31/16 (unaudited)
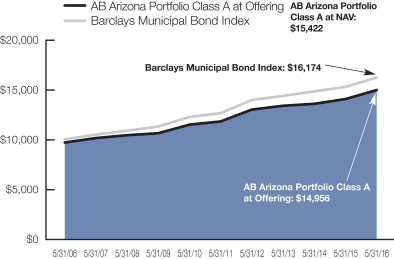
This chart illustrates the total value of an assumed $10,000 investment in AB Arizona Portfolio Class A shares (from 5/31/06 to 5/31/16) as compared to the performance of the Portfolio’s benchmark. The chart showing the Class A at Offering reflects the deduction of the maximum 3% sales charge from the initial $10,000 investment in the Portfolio and assumes the reinvestment of dividends and capital gains distributions.
See Disclosures, Risks and Note about Historical Performance on pages 4-6.
(Historical Performance continued on next page).
| AB MUNICIPAL INCOME FUND II • | 7 |
Historical Performance
AB MASSACHUSETTS PORTFOLIO
HISTORICAL PERFORMANCE
(continued from previous page)
THE PORTFOLIO VS ITS BENCHMARK PERIODS ENDED MAY 31, 2016 (unaudited) | NAV Returns | |||||||||||
| 6 Months | 12 Months | |||||||||||
| AB Massachusetts Portfolio | ||||||||||||
Class A | 3.08% | 5.38% | ||||||||||
| ||||||||||||
Class B* | 2.70% | 4.61% | ||||||||||
| ||||||||||||
Class C | 2.70% | 4.61% | ||||||||||
| ||||||||||||
| Barclays Municipal Bond Index | 3.42% | 5.87% | ||||||||||
| ||||||||||||
* Effective January 31, 2009, Class B shares are no longer available for purchase to new investors. Please see Note A for more information. |
| |||||||||||
GROWTH OF A $10,000 INVESTMENT IN THE PORTFOLIO
5/31/06 TO 5/31/16 (unaudited)
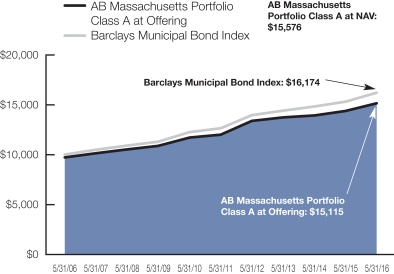
This chart illustrates the total value of an assumed $10,000 investment in AB Massachusetts Portfolio Class A shares (from 5/31/06 to 5/31/16) as compared to the performance of the Portfolio’s benchmark. The chart showing the Class A at Offering reflects the deduction of the maximum 3% sales charge from the initial $10,000 investment in the Portfolio and assumes the reinvestment of dividends and capital gains distributions.
See Disclosures, Risks and Note about Historical Performance on pages 4-6.
(Historical Performance continued on next page).
| 8 | • AB MUNICIPAL INCOME FUND II |
Historical Performance
AB MICHIGAN PORTFOLIO
HISTORICAL PERFORMANCE
(continued from previous page)
THE PORTFOLIO VS ITS BENCHMARK PERIODS ENDED MAY 31, 2016 (unaudited) | NAV Returns | |||||||||
| 6 Months | 12 Months | |||||||||
| AB Michigan Portfolio | ||||||||||
Class A | 4.10% | 6.85% | ||||||||
| ||||||||||
Class B* | 3.72% | 6.07% | ||||||||
| ||||||||||
Class C | 3.81% | 6.16% | ||||||||
| ||||||||||
| Barclays Municipal Bond Index | 3.42% | 5.87% | ||||||||
| ||||||||||
* Effective January 31, 2009, Class B shares are no longer available for purchase to new investors. Please see Note A for more information. | ||||||||||
GROWTH OF A $10,000 INVESTMENT IN THE PORTFOLIO 5/31/06 TO 5/31/16 (unaudited)
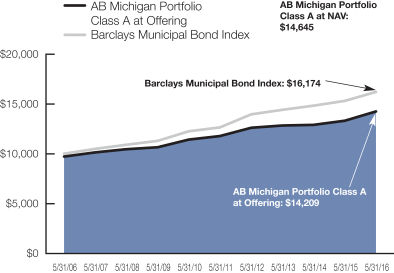
This chart illustrates the total value of an assumed $10,000 investment in AB Michigan Portfolio Class A shares (from 5/31/06 to 5/31/16) as compared to the performance of the Portfolio’s benchmark. The chart showing the Class A at Offering reflects the deduction of the maximum 3% sales charge from the initial $10,000 investment in the Portfolio and assumes the reinvestment of dividends and capital gains distributions.
See Disclosures, Risks and Note about Historical Performance on pages 4-6.
(Historical Performance continued on next page).
| AB MUNICIPAL INCOME FUND II • | 9 |
Historical Performance
AB MINNESOTA PORTFOLIO
HISTORICAL PERFORMANCE
(continued from previous page)
THE PORTFOLIO VS ITS BENCHMARK PERIODS ENDED MAY 31, 2016 (unaudited) | NAV Returns | |||||||||
| 6 Months | 12 Months | |||||||||
| AB Minnesota Portfolio | ||||||||||
Class A | 2.99% | 5.24% | ||||||||
| ||||||||||
Class B* | 2.80% | 4.55% | ||||||||
| ||||||||||
Class C | 2.61% | 4.45% | ||||||||
| ||||||||||
| Barclays Municipal Bond Index | 3.42% | 5.87% | ||||||||
| ||||||||||
* Effective January 31, 2009, Class B shares are no longer available for purchase to new investors. Please see Note A for more information. | ||||||||||
GROWTH OF A $10,000 INVESTMENT IN THE PORTFOLIO 5/31/06 TO 5/31/16 (unaudited)
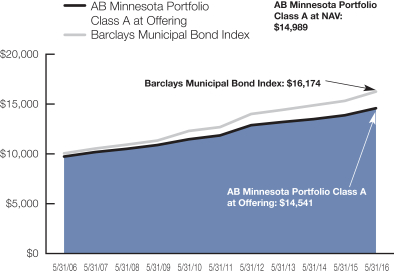
This chart illustrates the total value of an assumed $10,000 investment in AB Minnesota Portfolio Class A shares (from 5/31/06 to 5/31/16) as compared to the performance of the Portfolio’s benchmark. The chart showing the Class A at Offering reflects the deduction of the maximum 3% sales charge from the initial $10,000 investment in the Portfolio and assumes the reinvestment of dividends and capital gains distributions.
See Disclosures, Risks and Note about Historical Performance on pages 4-6.
(Historical Performance continued on next page).
| 10 | • AB MUNICIPAL INCOME FUND II |
Historical Performance
AB NEW JERSEY PORTFOLIO
HISTORICAL PERFORMANCE
(continued from previous page)
THE PORTFOLIO VS ITS BENCHMARK PERIODS ENDED MAY 31, 2016 (unaudited) | NAV Returns | |||||||||
| 6 Months | 12 Months | |||||||||
| AB New Jersey Portfolio | ||||||||||
Class A | 3.90% | 6.27% | ||||||||
| ||||||||||
Class B* | 3.52% | 5.48% | ||||||||
| ||||||||||
Class C | 3.41% | 5.47% | ||||||||
| ||||||||||
| Barclays Municipal Bond Index | 3.42% | 5.87% | ||||||||
| ||||||||||
* Effective January 31, 2009, Class B shares are no longer available for purchase to new investors. Please see Note A for more information. | ||||||||||
GROWTH OF A $10,000 INVESTMENT IN THE PORTFOLIO
5/31/06 TO 5/31/16 (unaudited)
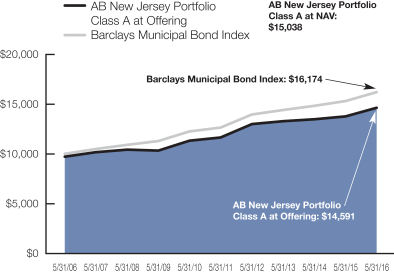
This chart illustrates the total value of an assumed $10,000 investment in AB New Jersey Portfolio Class A shares (from 5/31/06 to 5/31/16) as compared to the performance of the Portfolio’s benchmark. The chart showing the Class A at Offering reflects the deduction of the maximum 3% sales charge from the initial $10,000 investment in the Portfolio and assumes the reinvestment of dividends and capital gains distributions.
See Disclosures, Risks and Note about Historical Performance on pages 4-6.
(Historical Performance continued on next page).
| AB MUNICIPAL INCOME FUND II • | 11 |
Historical Performance
AB OHIO PORTFOLIO
HISTORICAL PERFORMANCE
(continued from previous page)
| THE PORTFOLIO VS ITS BENCHMARK PERIODS ENDED MAY 31, 2016 (unaudited) | NAV Returns | |||||||||
| 6 Months | 12 Months | |||||||||
| AB Ohio Portfolio | ||||||||||
Class A | 3.81% | 6.29% | ||||||||
| ||||||||||
Class B* | 3.43% | 5.40% | ||||||||
| ||||||||||
Class C | 3.42% | 5.50% | ||||||||
| ||||||||||
| Barclays Municipal Bond Index | 3.42% | 5.87% | ||||||||
| ||||||||||
* Effective January 31, 2009, Class B shares are no longer available for purchase to new investors. Please see Note A for more information. | ||||||||||
GROWTH OF A $10,000 INVESTMENT IN THE PORTFOLIO 5/31/06 TO 5/31/16 (unaudited)
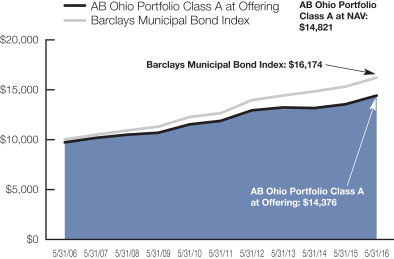
This chart illustrates the total value of an assumed $10,000 investment in AB Ohio Portfolio Class A shares (from 5/31/06 to 5/31/16) as compared to the performance of the Portfolio’s benchmark. The chart showing the Class A at Offering reflects the deduction of the maximum 3% sales charge from the initial $10,000 investment in the Portfolio and assumes the reinvestment of dividends and capital gains distributions.
See Disclosures, Risks and Note about Historical Performance on pages 4-6.
(Historical Performance continued on next page).
| 12 | • AB MUNICIPAL INCOME FUND II |
Historical Performance
AB PENNSYLVANIA PORTFOLIO
HISTORICAL PERFORMANCE
(continued from previous page)
THE PORTFOLIO VS ITS BENCHMARK PERIODS ENDED MAY 31, 2016 (unaudited) | NAV Returns | |||||||||
| 6 Months | 12 Months | |||||||||
| AB Pennsylvania Portfolio | ||||||||||
Class A | 3.41% | 5.83% | ||||||||
| ||||||||||
Class B* | 3.03% | 5.04% | ||||||||
| ||||||||||
Class C | 3.03% | 5.04% | ||||||||
| ||||||||||
| Barclays Municipal Bond Index | 3.42% | 5.87% | ||||||||
| ||||||||||
* Effective January 31, 2009, Class B shares are no longer available for purchase to new investors. Please see Note A for more information. | ||||||||||
GROWTH OF A $10,000 INVESTMENT IN THE PORTFOLIO 5/31/06 TO 5/31/16 (unaudited)
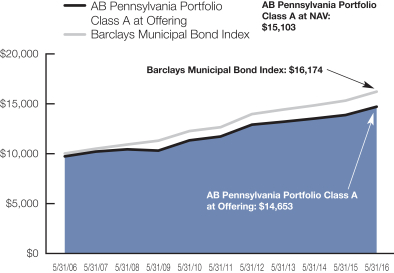
This chart illustrates the total value of an assumed $10,000 investment in AB Pennsylvania Portfolio Class A shares (from 5/31/06 to 5/31/16) as compared to the performance of the Portfolio’s benchmark. The chart showing the Class A at Offering reflects the deduction of the maximum 3% sales charge from the initial $10,000 investment in the Portfolio and assumes the reinvestment of dividends and capital gains distributions.
See Disclosures, Risks and Note about Historical Performance on pages 4-6.
(Historical Performance continued on next page).
| AB MUNICIPAL INCOME FUND II • | 13 |
Historical Performance
AB VIRGINIA PORTFOLIO
HISTORICAL PERFORMANCE
(continued from previous page)
THE PORTFOLIO VS ITS BENCHMARK PERIODS ENDED MAY 31, 2016 (unaudited) | NAV Returns | |||||||||
| 6 Months | 12 Months | |||||||||
| AB Virginia Portfolio | ||||||||||
Class A | 3.45% | 5.77% | ||||||||
| ||||||||||
Class B* | 2.98% | 4.99% | ||||||||
| ||||||||||
Class C | 3.08% | 5.00% | ||||||||
| ||||||||||
| Barclays Municipal Bond Index | 3.42% | 5.87% | ||||||||
| ||||||||||
* Effective January 31, 2009, Class B shares are no longer available for purchase to new investors. Please see Note A for more information. | ||||||||||
GROWTH OF A $10,000 INVESTMENT IN THE PORTFOLIO
5/31/06 TO 5/31/16 (unaudited)
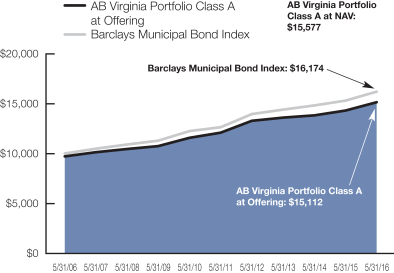
This chart illustrates the total value of an assumed $10,000 investment in AB Virginia Portfolio Class A shares (from 5/31/06 to 5/31/16) as compared to the performance of the Portfolio’s benchmark. The chart showing the Class A at Offering reflects the deduction of the maximum 3% sales charge from the initial $10,000 investment in the Portfolio and assumes the reinvestment of dividends and capital gains distributions.
See Disclosures, Risks and Note about Historical Performance on pages 4-6.
(Historical Performance continued on next page).
| 14 | • AB MUNICIPAL INCOME FUND II |
Historical Performance
AB ARIZONA PORTFOLIO
HISTORICAL PERFORMANCE
(continued from previous page)
| AVERAGE ANNUAL RETURNS AS OF MAY 31, 2016 (unaudited) | ||||||||||||||||
| NAV Returns | SEC Returns (reflects applicable | SEC Yields* | Taxable Equivalent Yields† | |||||||||||||
| Class A Shares | 1.25 | % | 2.01 | % | ||||||||||||
1 Year | 6.50 | % | 3.31 | % | ||||||||||||
5 Years | 4.84 | % | 4.21 | % | ||||||||||||
10 Years | 4.43 | % | 4.11 | % | ||||||||||||
| Class B Shares | 0.55 | % | 0.89 | % | ||||||||||||
1 Year | 5.81 | % | 2.81 | % | ||||||||||||
5 Years | 4.13 | % | 4.13 | % | ||||||||||||
10 Years(a) | 4.00 | % | 4.00 | % | ||||||||||||
| Class C Shares | 0.54 | % | 0.87 | % | ||||||||||||
1 Year | 5.81 | % | 4.81 | % | ||||||||||||
5 Years | 4.12 | % | 4.12 | % | ||||||||||||
10 Years | 3.71 | % | 3.71 | % | ||||||||||||
SEC AVERAGE ANNUAL RETURNS AS OF THE MOST RECENT CALENDAR QUARTER-END JUNE 30, 2016 (unaudited) | ||||||||||||||||
SEC Returns (reflects applicable | ||||||||||||||||
| Class A Shares | ||||||||||||||||
1 Year | 5.09 | % | ||||||||||||||
5 Years | 4.48 | % | ||||||||||||||
10 Years | 4.30 | % | ||||||||||||||
| Class B Shares | ||||||||||||||||
1 Year | 4.56 | % | ||||||||||||||
5 Years | 4.36 | % | ||||||||||||||
10 Years(a) | 4.18 | % | ||||||||||||||
| Class C Shares | ||||||||||||||||
1 Year | 6.56 | % | ||||||||||||||
5 Years | 4.36 | % | ||||||||||||||
10 Years | 3.89 | % | ||||||||||||||
(Historical Performance and footnotes continued on next page)
| AB MUNICIPAL INCOME FUND II • | 15 |
Historical Performance
AB ARIZONA PORTFOLIO
HISTORICAL PERFORMANCE
(continued from previous page)
The Portfolio’s current prospectus fee table shows the Portfolio’s total annual operating expense ratios as 0.97%, 1.72% and 1.72% for Class A, Class B and Class C shares, respectively, gross of any fee waivers or expense reimbursements. Contractual fee waivers and/or expense reimbursements limit the Portfolio’s annual operating expense ratios, exclusive of interest expense, to 0.78%, 1.53% and 1.53% for Class A, Class B and Class C shares, respectively. These waivers/reimbursements may not be terminated before September 30, 2016 and may be extended by the Adviser for additional one-year terms. Absent reimbursements or waivers, performance would have been lower. The Financial Highlights section of this report sets forth expense ratio data for the current reporting period; the expense ratios shown above may differ from the expense ratios in the Financial Highlights section since they are based on different time periods.
| * | SEC yields are calculated based on SEC guidelines for the 30-day period ended May 31, 2016. |
| † | Taxable equivalent yields are based on SEC yields and a 35% marginal federal income tax rate and maximum state taxes where applicable. |
| (a) | Assumes conversion of Class B shares into Class A shares after six years. |
See Disclosures, Risks and Note about Historical Performance on pages 4-6.
(Historical Performance continued on next page)
| 16 | • AB MUNICIPAL INCOME FUND II |
Historical Performance
AB MASSACHUSETTS PORTFOLIO
HISTORICAL PERFORMANCE
(continued from previous page)
| AVERAGE ANNUAL RETURNS AS OF MAY 31, 2016 (unaudited) | ||||||||||||||||
| NAV Returns | SEC Returns (reflects applicable | SEC Yields* | Taxable Equivalent Yields† | |||||||||||||
| Class A Shares | 0.87 | % | 1.41 | % | ||||||||||||
1 Year | 5.38 | % | 2.24 | % | ||||||||||||
5 Years | 4.74 | % | 4.10 | % | ||||||||||||
10 Years | 4.53 | % | 4.22 | % | ||||||||||||
| Class B Shares | 0.11 | % | 0.18 | % | ||||||||||||
1 Year | 4.61 | % | 1.61 | % | ||||||||||||
5 Years | 4.01 | % | 4.01 | % | ||||||||||||
10 Years(a) | 4.10 | % | 4.10 | % | ||||||||||||
| Class C Shares | 0.15 | % | 0.24 | % | ||||||||||||
1 Year | 4.61 | % | 3.61 | % | ||||||||||||
5 Years | 4.01 | % | 4.01 | % | ||||||||||||
10 Years | 3.81 | % | 3.81 | % | ||||||||||||
SEC AVERAGE ANNUAL RETURNS AS OF THE MOST RECENT CALENDAR QUARTER-END | ||||||||||||||||
SEC Returns (reflects applicable | ||||||||||||||||
| Class A Shares | ||||||||||||||||
1 Year | 4.06 | % | ||||||||||||||
5 Years | 4.43 | % | ||||||||||||||
10 Years | 4.42 | % | ||||||||||||||
| Class B Shares | ||||||||||||||||
1 Year | 3.50 | % | ||||||||||||||
5 Years | 4.34 | % | ||||||||||||||
10 Years(a) | 4.31 | % | ||||||||||||||
| Class C Shares | ||||||||||||||||
1 Year | 5.50 | % | ||||||||||||||
5 Years | 4.32 | % | ||||||||||||||
10 Years | 4.01 | % | ||||||||||||||
(Historical Performance and footnotes continued on next page)
| AB MUNICIPAL INCOME FUND II • | 17 |
Historical Performance
AB MASSACHUSETTS PORTFOLIO
HISTORICAL PERFORMANCE
(continued from previous page)
The Portfolio’s current prospectus fee table shows the Portfolio’s total annual operating expense ratios as 0.87%, 1.63% and 1.63% for Class A, Class B and Class C shares, respectively, gross of any fee waivers or expense reimbursements. Contractual fee waivers and/or expense reimbursements limit the Portfolio’s annual operating expense ratios to 0.77%, 1.52% and 1.52% for Class A, Class B and Class C shares, respectively. These waivers/reimbursements may not be terminated before September 30, 2016 and may be extended by the Adviser for additional one-year terms. Absent reimbursements or waivers, performance would have been lower. The Financial Highlights section of this report sets forth expense ratio data for the current reporting period; the expense ratios shown above may differ from the expense ratios in the Financial Highlights section since they are based on different time periods.
| * | SEC yields are calculated based on SEC guidelines for the 30-day period ended May 31, 2016. |
| † | Taxable equivalent yields are based on SEC yields and a 35% marginal federal income tax rate and maximum state taxes where applicable. |
| (a) | Assumes conversion of Class B shares into Class A shares after six years. |
See Disclosures, Risks and Note about Historical Performance on pages 4-6.
(Historical Performance continued on next page)
| 18 | • AB MUNICIPAL INCOME FUND II |
Historical Performance
AB MICHIGAN PORTFOLIO
HISTORICAL PERFORMANCE
(continued from previous page)
| AVERAGE ANNUAL RETURNS AS OF MAY 31, 2016 (unaudited) | ||||||||||||||||
| NAV Returns | SEC Returns (reflects applicable | SEC Yields* | Taxable Equivalent Yields† | |||||||||||||
| Class A Shares | 1.12 | % | 1.80 | % | ||||||||||||
1 Year | 6.85 | % | 3.64 | % | ||||||||||||
5 Years | 3.88 | % | 3.24 | % | ||||||||||||
10 Years | 3.89 | % | 3.58 | % | ||||||||||||
| Class B Shares | 0.40 | % | 0.64 | % | ||||||||||||
1 Year | 6.07 | % | 3.07 | % | ||||||||||||
5 Years | 3.13 | % | 3.13 | % | ||||||||||||
10 Years(a) | 3.46 | % | 3.46 | % | ||||||||||||
| Class C Shares | 0.41 | % | 0.66 | % | ||||||||||||
1 Year | 6.16 | % | 5.16 | % | ||||||||||||
5 Years | 3.15 | % | 3.15 | % | ||||||||||||
10 Years | 3.18 | % | 3.18 | % | ||||||||||||
SEC AVERAGE ANNUAL RETURNS AS OF THE MOST RECENT CALENDAR QUARTER-END JUNE 30, 2016 (unaudited) | ||||||||||||||||
SEC Returns (reflects applicable | ||||||||||||||||
| Class A Shares | ||||||||||||||||
1 Year | 5.65 | % | ||||||||||||||
5 Years | 3.59 | % | ||||||||||||||
10 Years | 3.81 | % | ||||||||||||||
| Class B Shares | ||||||||||||||||
1 Year | 5.25 | % | ||||||||||||||
5 Years | 3.50 | % | ||||||||||||||
10 Years(a) | 3.70 | % | ||||||||||||||
| Class C Shares | ||||||||||||||||
1 Year | 7.14 | % | ||||||||||||||
5 Years | 3.49 | % | ||||||||||||||
10 Years | 3.40 | % | ||||||||||||||
(Historical Performance and footnotes continued on next page)
| AB MUNICIPAL INCOME FUND II • | 19 |
Historical Performance
AB MICHIGAN PORTFOLIO
HISTORICAL PERFORMANCE
(continued from previous page)
The Portfolio’s current prospectus fee table shows the Portfolio’s total annual operating expense ratios as 1.22%, 1.99% and 1.98% for Class A, Class B and Class C shares, respectively, gross of any fee waivers or expense reimbursements. Contractual fee waivers and/or expense reimbursements limit the Portfolio’s annual operating expense ratios to 0.85%, 1.60% and 1.60% for Class A, Class B and Class C shares, respectively. These waivers/reimbursements may not be terminated before September 30, 2016 and may be extended by the Adviser for additional one-year terms. Absent reimbursements or waivers, performance would have been lower. The Financial Highlights section of this report sets forth expense ratio data for the current reporting period; the expense ratios shown above may differ from the expense ratios in the Financial Highlights section since they are based on different time periods.
| * | SEC yields are calculated based on SEC guidelines for the 30-day period ended May 31, 2016. |
| † | Taxable equivalent yields are based on SEC yields and a 35% marginal federal income tax rate and maximum state taxes where applicable. |
| (a) | Assumes conversion of Class B shares into Class A shares after six years. |
See Disclosures, Risks and Note about Historical Performance on pages 4-6.
(Historical Performance continued on next page)
| 20 | • AB MUNICIPAL INCOME FUND II |
Historical Performance
AB MINNESOTA PORTFOLIO
HISTORICAL PERFORMANCE
(continued from previous page)
| AVERAGE ANNUAL RETURNS AS OF MAY 31, 2016 (unaudited) | ||||||||||||||||
| NAV Returns | SEC Returns (reflects applicable | SEC Yields* | Taxable Equivalent Yields† | |||||||||||||
| Class A Shares | 0.90 | % | 1.54 | % | ||||||||||||
1 Year | 5.24 | % | 2.08 | % | ||||||||||||
5 Years | 4.25 | % | 3.62 | % | ||||||||||||
10 Years | 4.13 | % | 3.81 | % | ||||||||||||
| Class B Shares | 0.17 | % | 0.29 | % | ||||||||||||
1 Year | 4.55 | % | 1.55 | % | ||||||||||||
5 Years | 3.55 | % | 3.55 | % | ||||||||||||
10 Years(a) | 3.70 | % | 3.70 | % | ||||||||||||
| Class C Shares | 0.18 | % | 0.31 | % | ||||||||||||
1 Year | 4.45 | % | 3.45 | % | ||||||||||||
5 Years | 3.50 | % | 3.50 | % | ||||||||||||
10 Years | 3.40 | % | 3.40 | % | ||||||||||||
SEC AVERAGE ANNUAL RETURNS AS OF THE MOST RECENT CALENDAR QUARTER-END | ||||||||||||||||
SEC Returns (reflects applicable | ||||||||||||||||
| Class A Shares | ||||||||||||||||
1 Year | 3.60 | % | ||||||||||||||
5 Years | 3.96 | % | ||||||||||||||
10 Years | 4.00 | % | ||||||||||||||
| Class B Shares | ||||||||||||||||
1 Year | 3.11 | % | ||||||||||||||
5 Years | 3.87 | % | ||||||||||||||
10 Years(a) | 3.88 | % | ||||||||||||||
| Class C Shares | ||||||||||||||||
1 Year | 5.01 | % | ||||||||||||||
5 Years | 3.84 | % | ||||||||||||||
10 Years | 3.58 | % | ||||||||||||||
(Historical Performance and footnotes continued on next page)
| AB MUNICIPAL INCOME FUND II • | 21 |
Historical Performance
AB MINNESOTA PORTFOLIO
HISTORICAL PERFORMANCE
(continued from previous page)
The Portfolio’s current prospectus fee table shows the Portfolio’s total annual operating expense ratios as 1.05%, 1.82% and 1.81% for Class A, Class B and Class C shares, respectively, gross of any fee waivers or expense reimbursements. Contractual fee waivers and/or expense reimbursements limit the Portfolio’s annual operating expense ratios to 0.85%, 1.60% and 1.60% for Class A, Class B and Class C shares, respectively. These waivers/reimbursements may not be terminated before September 30, 2016 and may be extended by the Adviser for additional one-year terms. Absent reimbursements or waivers, performance would have been lower. The Financial Highlights section of this report sets forth expense ratio data for the current reporting period; the expense ratios shown above may differ from the expense ratios in the Financial Highlights section since they are based on different time periods.
| * | SEC yields are calculated based on SEC guidelines for the 30-day period ended May 31, 2016. |
| † | Taxable equivalent yields are based on SEC yields and a 35% marginal federal income tax rate and maximum state taxes where applicable. |
| (a) | Assumes conversion of Class B shares into Class A shares after six years. |
See Disclosures, Risks and Note about Historical Performance on pages 4-6.
(Historical Performance continued on next page)
| 22 | • AB MUNICIPAL INCOME FUND II |
Historical Performance
AB NEW JERSEY PORTFOLIO
HISTORICAL PERFORMANCE
(continued from previous page)
| AVERAGE ANNUAL RETURNS AS OF MAY 31, 2016 (unaudited) | ||||||||||||||||
| NAV Returns | SEC Returns (reflects applicable | SEC Yields* | Taxable Equivalent Yields† | |||||||||||||
| Class A Shares | 1.34 | % | 2.26 | % | ||||||||||||
1 Year | 6.27 | % | 3.07 | % | ||||||||||||
5 Years | 4.63 | % | 4.00 | % | ||||||||||||
10 Years | 4.16 | % | 3.85 | % | ||||||||||||
| Class B Shares | 0.54 | % | 0.91 | % | ||||||||||||
1 Year | 5.48 | % | 2.48 | % | ||||||||||||
5 Years | 3.89 | % | 3.89 | % | ||||||||||||
10 Years(a) | 3.73 | % | 3.73 | % | ||||||||||||
| Class C Shares | 0.64 | % | 1.08 | % | ||||||||||||
1 Year | 5.47 | % | 4.47 | % | ||||||||||||
5 Years | 3.89 | % | 3.89 | % | ||||||||||||
10 Years | 3.42 | % | 3.42 | % | ||||||||||||
SEC AVERAGE ANNUAL RETURNS AS OF THE MOST RECENT CALENDAR QUARTER-END | ||||||||||||||||
SEC Returns (reflects applicable | ||||||||||||||||
| Class A Shares | ||||||||||||||||
1 Year | 4.81 | % | ||||||||||||||
5 Years | 4.24 | % | ||||||||||||||
10 Years | 4.04 | % | ||||||||||||||
| Class B Shares | ||||||||||||||||
1 Year | 4.28 | % | ||||||||||||||
5 Years | 4.10 | % | ||||||||||||||
10 Years(a) | 3.91 | % | ||||||||||||||
| Class C Shares | ||||||||||||||||
1 Year | 6.28 | % | ||||||||||||||
5 Years | 4.10 | % | ||||||||||||||
10 Years | 3.61 | % | ||||||||||||||
(Historical Performance and footnotes continued on next page)
| AB MUNICIPAL INCOME FUND II • | 23 |
Historical Performance
AB NEW JERSEY PORTFOLIO
HISTORICAL PERFORMANCE
(continued from previous page)
The Portfolio’s current prospectus fee table shows the Portfolio’s total annual operating expense ratios as 0.97%, 1.73% and 1.72% for Class A, Class B and Class C shares, respectively, gross of any fee waivers or expense reimbursements. Contractual fee waivers and/or expense reimbursements limit the Portfolio’s annual operating expense ratios to 0.82%, 1.57% and 1.57% for Class A, Class B and Class C shares, respectively. These waivers/reimbursements may not be terminated before September 30, 2016 and may be extended by the Adviser for additional one-year terms. Absent reimbursements or waivers, performance would have been lower. The Financial Highlights section of this report sets forth expense ratio data for the current reporting period; the expense ratios shown above may differ from the expense ratios in the Financial Highlights section since they are based on different time periods.
| * | SEC yields are calculated based on SEC guidelines for the 30-day period ended May 31, 2016. |
| † | Taxable equivalent yields are based on SEC yields and a 35% marginal federal income tax rate and maximum state taxes where applicable. |
| (a) | Assumes conversion of Class B shares into Class A shares after six years. |
See Disclosures, Risks and Note about Historical Performance on pages 4-6.
(Historical Performance continued on next page)
| 24 | • AB MUNICIPAL INCOME FUND II |
Historical Performance
AB OHIO PORTFOLIO
HISTORICAL PERFORMANCE
(continued from previous page)
| AVERAGE ANNUAL RETURNS AS OF MAY 31, 2016 (unaudited) | ||||||||||||||||
| NAV Returns | SEC Returns (reflects applicable | SEC Yields* | Taxable Equivalent Yields† | |||||||||||||
| Class A Shares | 1.14 | % | 1.85 | % | ||||||||||||
1 Year | 6.29 | % | 3.06 | % | ||||||||||||
5 Years | 3.91 | % | 3.29 | % | ||||||||||||
10 Years | 4.01 | % | 3.70 | % | ||||||||||||
| Class B Shares | 0.42 | % | 0.68 | % | ||||||||||||
1 Year | 5.40 | % | 2.40 | % | ||||||||||||
5 Years | 3.17 | % | 3.17 | % | ||||||||||||
10 Years(a) | 3.57 | % | 3.57 | % | ||||||||||||
| Class C Shares | 0.43 | % | 0.70 | % | ||||||||||||
1 Year | 5.50 | % | 4.50 | % | ||||||||||||
5 Years | 3.18 | % | 3.18 | % | ||||||||||||
10 Years | 3.29 | % | 3.29 | % | ||||||||||||
SEC AVERAGE ANNUAL RETURNS AS OF THE MOST RECENT CALENDAR QUARTER-END JUNE 30, 2016 (unaudited) | ||||||||||||||||
SEC Returns (reflects applicable | ||||||||||||||||
| Class A Shares | ||||||||||||||||
1 Year | 4.97 | % | ||||||||||||||
5 Years | 3.55 | % | ||||||||||||||
10 Years | 3.90 | % | ||||||||||||||
| Class B Shares | ||||||||||||||||
1 Year | 4.27 | % | ||||||||||||||
5 Years | 3.45 | % | ||||||||||||||
10 Years(a) | 3.79 | % | ||||||||||||||
| Class C Shares | ||||||||||||||||
1 Year | 6.37 | % | ||||||||||||||
5 Years | 3.45 | % | ||||||||||||||
10 Years | 3.49 | % | ||||||||||||||
(Historical Performance and footnotes continued on next page)
| AB MUNICIPAL INCOME FUND II • | 25 |
Historical Performance
AB OHIO PORTFOLIO
HISTORICAL PERFORMANCE
(continued from previous page)
The Portfolio’s current prospectus fee table shows the Portfolio’s total annual operating expense ratios as 0.98%, 1.75% and 1.74% for Class A, Class B and Class C shares, respectively, gross of any fee waivers or expense reimbursements. Contractual fee waivers and/or expense reimbursements limit the Portfolio’s annual operating expense ratios to 0.80%, 1.55% and 1.55% for Class A, Class B and Class C shares, respectively. These waivers/reimbursements may not be terminated before September 30, 2016 and may be extended by the Adviser for additional one-year terms. Absent reimbursements or waivers, performance would have been lower. The Financial Highlights section of this report sets forth expense ratio data for the current reporting period; the expense ratios shown above may differ from the expense ratios in the Financial Highlights section since they are based on different time periods.
| * | SEC yields are calculated based on SEC guidelines for the 30-day period ended May 31, 2016. |
| † | Taxable equivalent yields are based on SEC yields and a 35% marginal federal income tax rate and maximum state taxes where applicable. |
| (a) | Assumes conversion of Class B shares into Class A shares after six years. |
See Disclosures, Risks and Note about Historical Performance on pages 4-6.
(Historical Performance continued on next page)
| 26 | • AB MUNICIPAL INCOME FUND II |
Historical Performance
AB PENNSYLVANIA PORTFOLIO
HISTORICAL PERFORMANCE
(continued from previous page)
| AVERAGE ANNUAL RETURNS AS OF MAY 31, 2016 (unaudited) | ||||||||||||||||
| NAV Returns | SEC Returns (reflects applicable | SEC Yields* | Taxable Equivalent Yields† | |||||||||||||
| Class A Shares | 0.70 | % | 1.11 | % | ||||||||||||
1 Year | 5.83 | % | 2.67 | % | ||||||||||||
5 Years | 4.62 | % | 3.99 | % | ||||||||||||
10 Years | 4.21 | % | 3.89 | % | ||||||||||||
| Class B Shares | -0.39 | % | -0.62 | % | ||||||||||||
1 Year | 5.04 | % | 2.04 | % | ||||||||||||
5 Years | 3.88 | % | 3.88 | % | ||||||||||||
10 Years(a) | 3.78 | % | 3.78 | % | ||||||||||||
| Class C Shares | -0.02 | % | -0.03 | % | ||||||||||||
1 Year | 5.04 | % | 4.04 | % | ||||||||||||
5 Years | 3.88 | % | 3.88 | % | ||||||||||||
10 Years | 3.48 | % | 3.48 | % | ||||||||||||
SEC AVERAGE ANNUAL RETURNS AS OF THE MOST RECENT CALENDAR QUARTER-END JUNE 30, 2016 (unaudited) | ||||||||||||||||
SEC Returns (reflects applicable | ||||||||||||||||
| Class A Shares | ||||||||||||||||
1 Year | 4.48 | % | ||||||||||||||
5 Years | 4.25 | % | ||||||||||||||
10 Years | 4.09 | % | ||||||||||||||
| Class B Shares | ||||||||||||||||
1 Year | 3.90 | % | ||||||||||||||
5 Years | 4.13 | % | ||||||||||||||
10 Years(a) | 3.96 | % | ||||||||||||||
| Class C Shares | ||||||||||||||||
1 Year | 5.91 | % | ||||||||||||||
5 Years | 4.13 | % | ||||||||||||||
10 Years | 3.67 | % | ||||||||||||||
(Historical Performance and footnotes continued on next page)
| AB MUNICIPAL INCOME FUND II • | 27 |
Historical Performance
AB PENNSYLVANIA PORTFOLIO
HISTORICAL PERFORMANCE
(continued from previous page)
The Portfolio’s current prospectus fee table shows the Portfolio’s total annual operating expense ratios as 1.01%, 1.79% and 1.77% for Class A, Class B and Class C shares, respectively, gross of any fee waivers or expense reimbursements. Contractual fee waivers and/or expense reimbursements limit the Portfolio’s annual operating expense ratios to 0.85%, 1.60% and 1.60% for Class A, Class B and Class C shares, respectively. These waivers/reimbursements may not be terminated before September 30, 2016 and may be extended by the Adviser for additional one-year terms. Absent reimbursements or waivers, performance would have been lower. The Financial Highlights section of this report sets forth expense ratio data for the current reporting period; the expense ratios shown above may differ from the expense ratios in the Financial Highlights section since they are based on different time periods.
| * | SEC yields are calculated based on SEC guidelines for the 30-day period ended May 31, 2016. |
| † | Taxable equivalent yields are based on SEC yields and a 35% marginal federal income tax rate and maximum state taxes where applicable. |
| (a) | Assumes conversion of Class B shares into Class A shares after six years. |
See Disclosures, Risks and Note about Historical Performance on pages 4-6.
(Historical Performance continued on next page)
| 28 | • AB MUNICIPAL INCOME FUND II |
Historical Performance
AB VIRGINIA PORTFOLIO
HISTORICAL PERFORMANCE
(continued from previous page)
| AVERAGE ANNUAL RETURNS AS OF MAY 31, 2016 (unaudited) | ||||||||||||||||
| NAV Returns | SEC Returns (reflects applicable | SEC Yields* | Taxable Equivalent Yields† | |||||||||||||
| Class A Shares | 1.02 | % | 1.66 | % | ||||||||||||
1 Year | 5.77 | % | 2.63 | % | ||||||||||||
5 Years | 4.62 | % | 3.97 | % | ||||||||||||
10 Years | 4.53 | % | 4.22 | % | ||||||||||||
| Class B Shares | 0.24 | % | 0.39 | % | ||||||||||||
1 Year | 4.99 | % | 1.99 | % | ||||||||||||
5 Years | 3.89 | % | 3.89 | % | ||||||||||||
10 Years(a) | 4.09 | % | 4.09 | % | ||||||||||||
| Class C Shares | 0.31 | % | 0.51 | % | ||||||||||||
1 Year | 5.00 | % | 4.00 | % | ||||||||||||
5 Years | 3.89 | % | 3.89 | % | ||||||||||||
10 Years | 3.80 | % | 3.80 | % | ||||||||||||
SEC AVERAGE ANNUAL RETURNS AS OF THE MOST RECENT CALENDAR QUARTER-END | ||||||||||||||||
SEC Returns (reflects applicable | ||||||||||||||||
| Class A Shares | ||||||||||||||||
1 Year | 4.23 | % | ||||||||||||||
5 Years | 4.25 | % | ||||||||||||||
10 Years | 4.39 | % | ||||||||||||||
| Class B Shares | ||||||||||||||||
1 Year | 3.65 | % | ||||||||||||||
5 Years | 4.14 | % | ||||||||||||||
10 Years(a) | 4.28 | % | ||||||||||||||
| Class C Shares | ||||||||||||||||
1 Year | 5.66 | % | ||||||||||||||
5 Years | 4.15 | % | ||||||||||||||
10 Years | 3.99 | % | ||||||||||||||
(Historical Performance and footnotes continued on next page)
| AB MUNICIPAL INCOME FUND II • | 29 |
Historical Performance
AB VIRGINIA PORTFOLIO
HISTORICAL PERFORMANCE
(continued from previous page)
The Portfolio’s current prospectus fee table shows the Portfolio’s total annual operating expense ratios as 0.87%, 1.63% and 1.63% for Class A, Class B and Class C shares, respectively, gross of any fee waivers or expense reimbursements. Contractual fee waivers and/or expense reimbursements limit the Portfolio’s annual operating expense ratios to 0.80%, 1.55% and 1.55% for Class A, Class B and Class C shares, respectively. These waivers/reimbursements may not be terminated before September 30, 2016 and may be extended by the Adviser for additional one-year terms. Absent reimbursements or waivers, performance would have been lower. The Financial Highlights section of this report sets forth expense ratio data for the current reporting period; the expense ratios shown above may differ from the expense ratios in the Financial Highlights section since they are based on different time periods.
| * | SEC yields are calculated based on SEC guidelines for the 30-day period ended May 31, 2016. |
| † | Taxable equivalent yields are based on SEC yields and a 35% marginal federal income tax rate and maximum state taxes where applicable. |
| (a) | Assumes conversion of Class B shares into Class A shares after six years. |
See Disclosures, Risks and Note about Historical Performance on pages 4-6.
| 30 | • AB MUNICIPAL INCOME FUND II |
Historical Performance
FUND EXPENSES
(unaudited)
As a shareholder of the Fund, you incur two types of costs: (1) transaction costs, including sales charges (loads) on purchase payments, contingent deferred sales charges on redemptions and (2) ongoing costs, including management fees; distribution (12b-1) fees; and other Fund expenses. This example is intended to help you understand your ongoing costs (in dollars) of investing in the Fund and to compare these costs with the ongoing costs of investing in other mutual funds.
The Example is based on an investment of $1,000 invested at the beginning of the period and held for the entire period as indicated below.
Actual Expenses
The first line of the table below provides information about actual account values and actual expenses. You may use the information in this line, together with the amount you invested, to estimate the expenses that you paid over the period. Simply divide your account value by $1,000 (for example, an $8,600 account value divided by $1,000 = 8.6), then multiply the result by the number in the first line under the heading entitled “Expenses Paid During Period” to estimate the expenses you paid on your account during this period.
Hypothetical Example for Comparison Purposes
The second line of the table below provides information about hypothetical account values and hypothetical expenses based on the Fund’s actual expense ratio and an assumed annual rate of return of 5% before expenses, which is not the Fund’s actual return. The hypothetical account values and expenses may not be used to estimate the actual ending account balance or expenses you paid for the period. You may use this information to compare the ongoing costs of investing in the Fund and other funds by comparing this 5% hypothetical example with the 5% hypothetical examples that appear in the shareholder reports of other funds.
Please note that the expenses shown in the table are meant to highlight your ongoing costs only and do not reflect any transactional costs, such as sales charges (loads), or contingent deferred sales charges on redemptions. Therefore, the second line of the table is useful in comparing ongoing costs only, and will not help you determine the relative total costs of owning different funds. In addition, if these transactional costs were included, your costs would have been higher.
AB Arizona Portfolio
| Beginning Account Value December 1, 2015 | Ending Account Value May 31, 2016 | Expenses Paid During Period* | Annualized Expense Ratio* | |||||||||||||
| Class A | ||||||||||||||||
Actual | $ | 1,000 | $ | 1,038.20 | $ | 3.97 | 0.78 | % | ||||||||
Hypothetical** | $ | 1,000 | $ | 1,021.10 | $ | 3.94 | 0.78 | % | ||||||||
| Class B | ||||||||||||||||
Actual | $ | 1,000 | $ | 1,035.30 | $ | 7.79 | 1.53 | % | ||||||||
Hypothetical** | $ | 1,000 | $ | 1,017.35 | $ | 7.72 | 1.53 | % | ||||||||
| Class C | ||||||||||||||||
Actual | $ | 1,000 | $ | 1,035.30 | $ | 7.79 | 1.53 | % | ||||||||
Hypothetical** | $ | 1,000 | $ | 1,017.35 | $ | 7.72 | 1.53 | % | ||||||||
| AB MUNICIPAL INCOME FUND II • | 31 |
Fund Expenses
FUND EXPENSES
(unaudited)
(continued from previous page)
AB Massachusetts Portfolio
| Beginning Account Value December 1, 2015 | Ending Account Value May 31, 2016 | Expenses Paid��During Period* | Annualized Expense Ratio* | |||||||||||||
| Class A | ||||||||||||||||
Actual | $ | 1,000 | $ | 1,030.80 | $ | 3.91 | 0.77 | % | ||||||||
Hypothetical** | $ | 1,000 | $ | 1,021.15 | $ | 3.89 | 0.77 | % | ||||||||
| Class B | ||||||||||||||||
Actual | $ | 1,000 | $ | 1,027.00 | $ | 7.70 | 1.52 | % | ||||||||
Hypothetical** | $ | 1,000 | $ | 1,017.40 | $ | 7.67 | 1.52 | % | ||||||||
| Class C | ||||||||||||||||
Actual | $ | 1,000 | $ | 1,027.00 | $ | 7.70 | 1.52 | % | ||||||||
Hypothetical** | $ | 1,000 | $ | 1,017.40 | $ | 7.67 | 1.52 | % | ||||||||
AB Michigan Portfolio
| Beginning Account Value December 1, 2015 | Ending Account Value May 31, 2016 | Expenses Paid During Period* | Annualized Expense Ratio* | |||||||||||||
| Class A | ||||||||||||||||
Actual | $ | 1,000 | $ | 1,041.00 | $ | 4.34 | 0.85 | % | ||||||||
Hypothetical** | $ | 1,000 | $ | 1,020.75 | $ | 4.29 | 0.85 | % | ||||||||
| Class B | ||||||||||||||||
Actual | $ | 1,000 | $ | 1,037.20 | $ | 8.15 | 1.60 | % | ||||||||
Hypothetical** | $ | 1,000 | $ | 1,017.00 | $ | 8.07 | 1.60 | % | ||||||||
| Class C | ||||||||||||||||
Actual | $ | 1,000 | $ | 1,038.10 | $ | 8.15 | 1.60 | % | ||||||||
Hypothetical** | $ | 1,000 | $ | 1,017.00 | $ | 8.07 | 1.60 | % | ||||||||
AB Minnesota Portfolio
| Beginning Account Value December 1, 2015 | Ending Account Value May 31, 2016 | Expenses Paid During Period* | Annualized Expense Ratio* | |||||||||||||
| Class A | ||||||||||||||||
Actual | $ | 1,000 | $ | 1,029.90 | $ | 4.31 | 0.85 | % | ||||||||
Hypothetical** | $ | 1,000 | $ | 1,020.75 | $ | 4.29 | 0.85 | % | ||||||||
| Class B | ||||||||||||||||
Actual | $ | 1,000 | $ | 1,028.00 | $ | 8.11 | 1.60 | % | ||||||||
Hypothetical** | $ | 1,000 | $ | 1,017.00 | $ | 8.07 | 1.60 | % | ||||||||
| Class C | ||||||||||||||||
Actual | $ | 1,000 | $ | 1,026.10 | $ | 8.10 | 1.60 | % | ||||||||
Hypothetical** | $ | 1,000 | $ | 1,017.00 | $ | 8.07 | 1.60 | % | ||||||||
| 32 | • AB MUNICIPAL INCOME FUND II |
Fund Expenses
FUND EXPENSES
(unaudited)
(continued from previous page)
AB New Jersey Portfolio
| Beginning Account Value December 1, 2015 | Ending Account Value May 31, 2016 | Expenses Paid During Period* | Annualized Expense Ratio*† | |||||||||||||
| Class A | ||||||||||||||||
Actual | $ | 1,000 | $ | 1,039.00 | $ | 4.23 | 0.83 | % | ||||||||
Hypothetical** | $ | 1,000 | $ | 1,020.85 | $ | 4.19 | 0.83 | % | ||||||||
| Class B | ||||||||||||||||
Actual | $ | 1,000 | $ | 1,035.20 | $ | 8.04 | 1.58 | % | ||||||||
Hypothetical** | $ | 1,000 | $ | 1,017.10 | $ | 7.97 | 1.58 | % | ||||||||
| Class C | ||||||||||||||||
Actual | $ | 1,000 | $ | 1,034.10 | $ | 8.03 | 1.58 | % | ||||||||
Hypothetical** | $ | 1,000 | $ | 1,017.10 | $ | 7.97 | 1.58 | % | ||||||||
AB Ohio Portfolio
| Beginning Account Value December 1, 2015 | Ending Account Value May 31, 2016 | Expenses Paid During Period* | Annualized Expense Ratio* | |||||||||||||
| Class A | ||||||||||||||||
Actual | $ | 1,000 | $ | 1,038.10 | $ | 4.08 | 0.80 | % | ||||||||
Hypothetical** | $ | 1,000 | $ | 1,021.00 | $ | 4.04 | 0.80 | % | ||||||||
| Class B | ||||||||||||||||
Actual | $ | 1,000 | $ | 1,034.30 | $ | 7.88 | 1.55 | % | ||||||||
Hypothetical** | $ | 1,000 | $ | 1,017.25 | $ | 7.82 | 1.55 | % | ||||||||
| Class C | ||||||||||||||||
Actual | $ | 1,000 | $ | 1,034.20 | $ | 7.88 | 1.55 | % | ||||||||
Hypothetical** | $ | 1,000 | $ | 1,017.25 | $ | 7.82 | 1.55 | % | ||||||||
AB Pennsylvania Portfolio
| Beginning Account Value December 1, 2015 | Ending Account Value May 31, 2016 | Expenses Paid During Period* | Annualized Expense Ratio* | |||||||||||||
| Class A | ||||||||||||||||
Actual | $ | 1,000 | $ | 1,034.10 | $ | 4.32 | 0.85 | % | ||||||||
Hypothetical** | $ | 1,000 | $ | 1,020.75 | $ | 4.29 | 0.85 | % | ||||||||
| Class B | ||||||||||||||||
Actual | $ | 1,000 | $ | 1,030.30 | $ | 8.12 | 1.60 | % | ||||||||
Hypothetical** | $ | 1,000 | $ | 1,017.00 | $ | 8.07 | 1.60 | % | ||||||||
| Class C | ||||||||||||||||
Actual | $ | 1,000 | $ | 1,030.30 | $ | 8.12 | 1.60 | % | ||||||||
Hypothetical** | $ | 1,000 | $ | 1,017.00 | $ | 8.07 | 1.60 | % | ||||||||
| AB MUNICIPAL INCOME FUND II • | 33 |
Fund Expenses
FUND EXPENSES
(unaudited)
(continued from previous page)
AB Virginia Portfolio
| Beginning Account Value December 1, 2015 | Ending Account Value May 31, 2016 | Expenses Paid During Period* | Annualized Expense Ratio* | |||||||||||||
| Class A | ||||||||||||||||
Actual | $ | 1,000 | $ | 1,034.50 | $ | 4.07 | 0.80 | % | ||||||||
Hypothetical** | $ | 1,000 | $ | 1,021.00 | $ | 4.04 | 0.80 | % | ||||||||
| Class B | ||||||||||||||||
Actual | $ | 1,000 | $ | 1,029.80 | $ | 7.87 | 1.55 | % | ||||||||
Hypothetical** | $ | 1,000 | $ | 1,017.25 | $ | 7.82 | 1.55 | % | ||||||||
| Class C | ||||||||||||||||
Actual | $ | 1,000 | $ | 1,030.80 | $ | 7.87 | 1.55 | % | ||||||||
Hypothetical** | $ | 1,000 | $ | 1,017.25 | $ | 7.82 | 1.55 | % | ||||||||
| * | Expenses are equal to the classes’ annualized expense ratios multiplied by the average account value over the period, multiplied by 183/366 (to reflect the one-half year period). |
| ** | Assumes 5% annual return before expenses. |
| † | Expense ratios are inclusive of interest expense. |
| 34 | • AB MUNICIPAL INCOME FUND II |
Fund Expenses
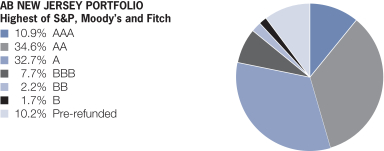
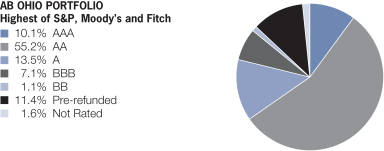
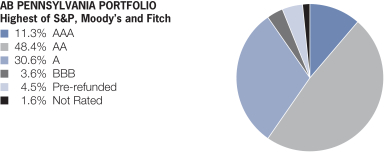
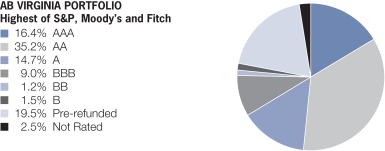
BOND RATING SUMMARY*
May 31, 2016 (unaudited)
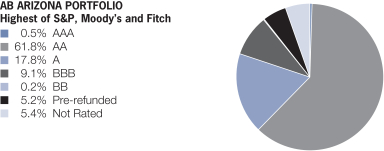
| * | All data are as of May 31, 2016. The Portfolio’s quality rating breakdowns are expressed as a percentage of the Portfolio’s total investments in municipal securities and may vary over time. The Portfolio also enters into derivative transactions, which may be used for hedging or investment purposes (see “Portfolio of Investments” section of the report for additional details). The quality ratings are determined by using the Standard & Poor’s Ratings Services (“S&P”), Moody’s Investors Services, Inc. (“Moody’s”) and Fitch Ratings, Ltd. (“Fitch”). The Portfolio considers the credit ratings issued by S&P, Moody’s and Fitch and uses the highest rating issued by the agencies, including when there is a split rating. These ratings are a measure of the quality and safety of a bond or portfolio, based on the issuer’s financial condition. AAA is the highest (best) and D is the lowest (worst). If applicable, the pre-refunded category includes bonds which are secured by US government securities and therefore are deemed high-quality investment-grade by the Adviser. If applicable, Not Applicable (N/A) includes non-creditworthy investments, such as equities, currency contracts, futures and options. If applicable, the Not Rated category includes bonds that are not rated by a nationally recognized statistical rating organization. The Adviser evaluates the creditworthiness of non-rated securities based on a number of factors including, but not limited to, cash flows, enterprise value and economic environment. |
| AB MUNICIPAL INCOME FUND II • | 35 |
Bond Rating Summary
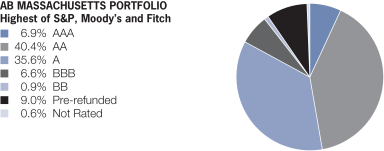
BOND RATING SUMMARY*
May 31, 2016 (unaudited)
| * | All data are as of May 31, 2016. The Portfolio’s quality rating breakdowns are expressed as a percentage of the Portfolio’s total investments in municipal securities and may vary over time. The Portfolio also enters into derivative transactions, which may be used for hedging or investment purposes (see “Portfolio of Investments” section of the report for additional details). The quality ratings are determined by using the Standard & Poor’s Ratings Services (“S&P”), Moody’s Investors Services, Inc. (“Moody’s”) and Fitch Ratings, Ltd. (“Fitch”). The Portfolio considers the credit ratings issued by S&P, Moody’s and Fitch and uses the highest rating issued by the agencies, including when there is a split rating. These ratings are a measure of the quality and safety of a bond or portfolio, based on the issuer’s financial condition. AAA is the highest (best) and D is the lowest (worst). If applicable, the pre-refunded category includes bonds which are secured by US government securities and therefore are deemed high-quality investment-grade by the Adviser. If applicable, Not Applicable (N/A) includes non-creditworthy investments, such as equities, currency contracts, futures and options. If applicable, the Not Rated category includes bonds that are not rated by a nationally recognized statistical rating organization. The Adviser evaluates the creditworthiness of non-rated securities based on a number of factors including, but not limited to, cash flows, enterprise value and economic environment. |
| 36 | • AB MUNICIPAL INCOME FUND II |
Bond Rating Summary
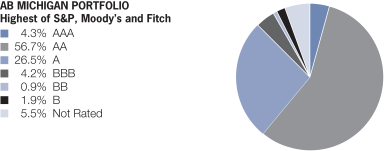
BOND RATING SUMMARY*
May 31, 2016 (unaudited)
| * | All data are as of May 31, 2016. The Portfolio’s quality rating breakdowns are expressed as a percentage of the Portfolio’s total investments in municipal securities and may vary over time. The Portfolio also enters into derivative transactions, which may be used for hedging or investment purposes (see “Portfolio of Investments” section of the report for additional details). The quality ratings are determined by using the Standard & Poor’s Ratings Services (“S&P”), Moody’s Investors Services, Inc. (“Moody’s”) and Fitch Ratings, Ltd. (“Fitch”). The Portfolio considers the credit ratings issued by S&P, Moody’s and Fitch and uses the highest rating issued by the agencies, including when there is a split rating. These ratings are a measure of the quality and safety of a bond or portfolio, based on the issuer’s financial condition. AAA is the highest (best) and D is the lowest (worst). If applicable, the pre-refunded category includes bonds which are secured by US government securities and therefore are deemed high-quality investment-grade by the Adviser. If applicable, Not Applicable (N/A) includes non-creditworthy investments, such as equities, currency contracts, futures and options. If applicable, the Not Rated category includes bonds that are not rated by a nationally recognized statistical rating organization. The Adviser evaluates the creditworthiness of non-rated securities based on a number of factors including, but not limited to, cash flows, enterprise value and economic environment. |
| AB MUNICIPAL INCOME FUND II • | 37 |
Bond Rating Summary
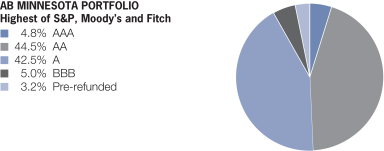
BOND RATING SUMMARY*
May 31, 2016 (unaudited)
| * | All data are as of May 31, 2016. The Portfolio’s quality rating breakdowns are expressed as a percentage of the Portfolio’s total investments in municipal securities and may vary over time. The Portfolio also enters into derivative transactions, which may be used for hedging or investment purposes (see “Portfolio of Investments” section of the report for additional details). The quality ratings are determined by using the Standard & Poor’s Ratings Services (“S&P”), Moody’s Investors Services, Inc. (“Moody’s”) and Fitch Ratings, Ltd. (“Fitch”). The Portfolio considers the credit ratings issued by S&P, Moody’s and Fitch and uses the highest rating issued by the agencies, including when there is a split rating. These ratings are a measure of the quality and safety of a bond or portfolio, based on the issuer’s financial condition. AAA is the highest (best) and D is the lowest (worst). If applicable, the pre-refunded category includes bonds which are secured by US government securities and therefore are deemed high-quality investment-grade by the Adviser. If applicable, Not Applicable (N/A) includes non-creditworthy investments, such as equities, currency contracts, futures and options. If applicable, the Not Rated category includes bonds that are not rated by a nationally recognized statistical rating organization. The Adviser evaluates the creditworthiness of non-rated securities based on a number of factors including, but not limited to, cash flows, enterprise value and economic environment. |
| 38 | • AB MUNICIPAL INCOME FUND II |
Bond Rating Summary
AB ARIZONA PORTFOLIO
PORTFOLIO OF INVESTMENTS
May 31, 2016
| Principal Amount (000) | U.S. $ Value | |||||||
| ||||||||
MUNICIPAL OBLIGATIONS – 96.5% | ||||||||
Long-Term Municipal Bonds – 96.5% | ||||||||
Arizona – 78.6% | ||||||||
Arizona Department of Transportation State | $ | 1,500 | $ | 1,778,040 | ||||
Series 2013A | 3,000 | 3,544,620 | ||||||
Arizona Game & Fish Department & Commission | 1,000 | 1,003,180 | ||||||
Arizona Health Facilities Authority | 1,000 | 1,000,450 | ||||||
Arizona Health Facilities Authority | 1,000 | 1,104,560 | ||||||
Arizona Health Facilities Authority | 3,000 | 3,493,410 | ||||||
Arizona State University | 2,050 | 2,403,030 | ||||||
City of Glendale AZ Water & Sewer Revenue | 2,000 | 2,348,000 | ||||||
City of Mesa AZ | 5,000 | 5,907,700 | ||||||
City of Mesa AZ Utility System Revenue | 1,000 | 1,126,240 | ||||||
City of Phoenix Civic Improvement Corp. | 4,080 | 4,412,112 | ||||||
Series 2010A | 2,000 | 2,258,080 | ||||||
| AB MUNICIPAL INCOME FUND II • | 39 |
AB Arizona Portfolio—Portfolio of Investments
Principal Amount (000) | U.S. $ Value | |||||||
| ||||||||
City of Show Low AZ | $ | 250 | $ | 251,990 | ||||
City of Tempe AZ | 520 | 651,940 | ||||||
City of Tucson AZ Water System Revenue | 2,360 | 2,822,999 | ||||||
County of Pima AZ Sewer System Revenue | 1,000 | 1,175,310 | ||||||
AGM Series 2010 | 2,000 | 2,305,860 | ||||||
County of Pinal AZ | 4,540 | 5,373,045 | ||||||
Estrella Mountain Ranch Community Facilities District | 844 | 846,507 | ||||||
Estrella Mountain Ranch Community Facilities District | 1,511 | 1,514,067 | ||||||
Glendale Municipal Property Corp. | 2,500 | 2,834,700 | ||||||
Greater Arizona Development Authority | 230 | 230,787 | ||||||
Hassayampa Community Facilities District | 290 | 291,206 | ||||||
Industrial Development Authority of the City of Phoenix (The) | 250 | 273,362 | ||||||
Industrial Development Authority of the City of Phoenix (The) | 2,500 | 2,914,900 | ||||||
| 40 | • AB MUNICIPAL INCOME FUND II |
AB Arizona Portfolio—Portfolio of Investments
Principal Amount (000) | U.S. $ Value | |||||||
| ||||||||
Industrial Development Authority of the County of Pima (The) | $ | 1,280 | $ | 1,280,000 | ||||
Mohave County Industrial Development Authority | 2,000 | 2,237,240 | ||||||
Northern Arizona University | 1,000 | 1,185,210 | ||||||
Pima County Regional Transportation Authority | 3,000 | 3,492,450 | ||||||
Pinal County Industrial Development Authority | 1,400 | 1,412,964 | ||||||
Salt River Project Agricultural Improvement & | 1,500 | 1,792,305 | ||||||
Series 2015A | 2,000 | 2,445,580 | ||||||
Salt Verde Financial Corp. | 1,000 | 1,244,340 | ||||||
5.25%, 12/01/22-12/01/23 | 1,165 | 1,389,441 | ||||||
State of Arizona COP | 6,000 | 6,432,360 | ||||||
State of Arizona Lottery Revenue | 6,000 | 6,715,440 | ||||||
Student & Academic Services LLC | 1,200 | 1,372,224 | ||||||
Sundance Community Facilities District | 302 | 302,269 | ||||||
| AB MUNICIPAL INCOME FUND II • | 41 |
AB Arizona Portfolio—Portfolio of Investments
Principal Amount (000) | U.S. $ Value | |||||||
| ||||||||
Town of Buckeye AZ | $ | 3,450 | $ | 4,039,536 | ||||
Tucson Airport Authority, Inc. | 6,475 | 6,498,504 | ||||||
Tucson Industrial Development Authority | 985 | 985,758 | ||||||
University of Arizona | 3,765 | 4,542,247 | ||||||
Western Maricopa Education Center District No 402 | 3,940 | 4,441,776 | ||||||
|
| |||||||
| 103,675,739 | ||||||||
|
| |||||||
Delaware – 0.4% | ||||||||
Delaware State Economic Development Authority | 520 | 592,322 | ||||||
|
| |||||||
Florida – 2.6% | ||||||||
City of Orlando FL | 1,820 | 2,219,527 | ||||||
Halifax Hospital Medical Center | 1,000 | 1,156,640 | ||||||
|
| |||||||
| 3,376,167 | ||||||||
|
| |||||||
Illinois – 2.8% | ||||||||
Cook County Forest Preserve District | 2,360 | 2,643,578 | ||||||
Metropolitan Pier & Exposition Authority | 1,000 | 1,120,160 | ||||||
|
| |||||||
| 3,763,738 | ||||||||
|
| |||||||
| 42 | • AB MUNICIPAL INCOME FUND II |
AB Arizona Portfolio—Portfolio of Investments
Principal Amount (000) | U.S. $ Value | |||||||
| ||||||||
Louisiana – 0.4% | ||||||||
Louisiana Local Government Environmental | $ | 500 | $ | 510,705 | ||||
|
| |||||||
Massachusetts – 0.6% | ||||||||
Commonwealth of Massachusetts | 700 | 635,353 | ||||||
NATL Series 2000G | 225 | 204,254 | ||||||
|
| |||||||
| 839,607 | ||||||||
|
| |||||||
Minnesota – 1.0% | ||||||||
Western Minnesota Municipal Power Agency | 1,130 | 1,376,803 | ||||||
|
| |||||||
Nebraska – 1.0% | ||||||||
Omaha Public Power District | 1,165 | 1,370,436 | ||||||
|
| |||||||
New York – 1.1% | ||||||||
New York State Energy Research & Development Authority | 500 | 475,375 | ||||||
Suffolk County Economic Development Corp. | 120 | 142,397 | ||||||
Suffolk County Economic Development Corp. | 700 | 782,243 | ||||||
|
| |||||||
| 1,400,015 | ||||||||
|
| |||||||
North Carolina – 0.9% | ||||||||
North Carolina Medical Care Commission | 600 | 631,224 | ||||||
| AB MUNICIPAL INCOME FUND II • | 43 |
AB Arizona Portfolio—Portfolio of Investments
Principal Amount (000) | U.S. $ Value | |||||||
| ||||||||
North Carolina Medical Care Commission | $ | 500 | $ | 538,025 | ||||
|
| |||||||
| 1,169,249 | ||||||||
|
| |||||||
Puerto Rico – 3.0% | ||||||||
Puerto Rico Housing Finance Authority | 1,855 | 1,916,252 | ||||||
Series 2008 | 385 | 418,052 | ||||||
Puerto Rico Industrial Tourist Educational Medical & Envirml Ctl Facs Fing Auth | 1,500 | 1,593,510 | ||||||
|
| |||||||
| 3,927,814 | ||||||||
|
| |||||||
Texas – 3.2% | ||||||||
North Texas Tollway Authority | 1,000 | 1,178,390 | ||||||
Series 2015B | 1,300 | 1,537,380 | ||||||
Texas Private Activity Bond Surface Transportation Corp. | 840 | 1,002,834 | ||||||
Texas Private Activity Bond Surface Transportation Corp. | 420 | 494,487 | ||||||
|
| |||||||
| 4,213,091 | ||||||||
|
| |||||||
Washington – 0.9% | ||||||||
Port of Seattle WA | 1,000 | 1,174,539 | ||||||
|
| |||||||
Total Municipal Obligations | 127,390,225 | |||||||
|
| |||||||
| 44 | • AB MUNICIPAL INCOME FUND II |
AB Arizona Portfolio—Portfolio of Investments
| Company | Shares | U.S. $ Value | ||||||
| ||||||||
SHORT-TERM INVESTMENTS – 2.5% | ||||||||
Investment Companies – 2.5% | ||||||||
AB Fixed Income Shares, Inc. – Government STIF Portfolio, 0.41%(c)(d) | 3,224,919 | $ | 3,224,919 | |||||
|
| |||||||
Total Investments – 99.0% | 130,615,144 | |||||||
Other assets less liabilities – 1.0% | 1,358,444 | |||||||
|
| |||||||
Net Assets – 100.0% | $ | 131,973,588 | ||||||
|
| |||||||
CENTRALLY CLEARED INTEREST RATE SWAPS (see Note D)
| Rate Type | ||||||||||||||||
| Clearing Broker/ (Exchange) | Notional Amount (000) | Termination Date | Payments by the Fund | Payments received by the Fund | Unrealized Appreciation/ (Depreciation) | |||||||||||
Morgan Stanley & Co., LLC/(CME Group) | $ | 7,200 | 3/09/21 | 3 Month LIBOR | 1.383% | $ | (4,895 | ) | ||||||||
INFLATION (CPI) SWAPS (see Note D)
| Rate Type | ||||||||||||||||
Swap Counterparty | Notional Amount (000) | Termination Date | Payments made by the Fund | Payments received by the Fund | Unrealized Appreciation/ (Depreciation) | |||||||||||
Citibank, NA | $ | 100 | 9/15/20 | 1.455% | CPI# | $ | 204 | |||||||||
Citibank, NA | 1,230 | 12/14/20 | 1.548% | CPI# | 4,274 | |||||||||||
Deutsche Bank AG | 1,350 | 7/15/20 | 1.265% | CPI# | 29,426 | |||||||||||
|
| |||||||||||||||
| $ | 33,904 | |||||||||||||||
|
| |||||||||||||||
| # | Variable interest rate based on the rate of inflation as determined by the Consumer Price Index (CPI). |
| (a) | When-Issued or delayed delivery security. |
| (b) | An auction rate security whose interest rate resets at each auction date. Auctions are typically held every week or month. The rate shown is as of May 31, 2016 and the aggregate market value of these securities amounted to $1,314,982 or 1.00% of net assets. |
| (c) | To obtain a copy of the fund’s financial statements, please go to the Securities and Exchange Commission’s website at www.sec.gov, or call AB at (800) 227-4618. |
| (d) | Investment in affiliated money market mutual fund. The rate shown represents the 7-day yield as of period end. |
As of May 31, 2016, the Fund’s percentages of investments in municipal bonds that are insured and in insured municipal bonds that have been pre-refunded or escrowed to maturity are 22.5% and 5.0%, respectively.
| AB MUNICIPAL INCOME FUND II • | 45 |
AB Arizona Portfolio—Portfolio of Investments
Glossary:
| ACA | – ACA Financial Guaranty Corporation |
| AGM | – Assured Guaranty Municipal |
| AMBAC | – Ambac Assurance Corporation |
| BAM | – Build American Mutual |
| CFD | – Community Facilities District |
| CME | – Chicago Mercantile Exchange |
| COP | – Certificate of Participation |
| ETM | – Escrowed to Maturity |
| LIBOR | – London Interbank Offered Rates |
| NATL | – National Interstate Corporation |
See notes to financial statements.
| 46 | • AB MUNICIPAL INCOME FUND II |
AB Arizona Portfolio—Portfolio of Investments
AB MASSACHUSETTS PORTFOLIO
PORTFOLIO OF INVESTMENTS
May 31, 2016
Principal Amount (000) | U.S. $ Value | |||||||
| ||||||||
MUNICIPAL OBLIGATIONS – 97.0% | ||||||||
Long-Term Municipal Bonds – 97.0% | ||||||||
Massachusetts – 81.2% | ||||||||
Boston Water & Sewer Commission | $ | 2,000 | $ | 2,232,620 | ||||
Series 2010A | 5,000 | 5,638,820 | ||||||
City of Fall River MA | 5,085 | 5,523,327 | ||||||
City of Springfield MA | 2,565 | 2,636,897 | ||||||
Commonwealth of Massachusetts | 10,000 | 12,145,700 | ||||||
NATL Series 2000E | 1,350 | 1,225,327 | ||||||
NATL Series 2000F | 1,225 | 1,111,869 | ||||||
Commonwealth of Massachusetts | 2,500 | 2,920,850 | ||||||
AGM Series 2005A | 2,000 | 2,103,540 | ||||||
Marthas Vineyard Land Bank | 2,830 | 3,374,078 | ||||||
Massachusetts Bay Transportation Authority | 1,670 | 1,921,405 | ||||||
Massachusetts Clean Water Trust (The) | 3,000 | 3,372,450 | ||||||
Massachusetts Department of Transportation | 6,900 | 7,805,142 | ||||||
Massachusetts Development Finance Agency | 3,000 | 3,281,100 | ||||||
5.00%, 9/01/22 (Pre-refunded/ETM) | 3,000 | 3,281,100 | ||||||
| AB MUNICIPAL INCOME FUND II • | 47 |
AB Massachusetts Portfolio—Portfolio of Investments
Principal Amount (000) | U.S. $ Value | |||||||
| ||||||||
Massachusetts Development Finance Agency (Baystate Medical Obligated Group) | $ | 7,000 | $ | 7,933,100 | ||||
Massachusetts Development Finance Agency | 4,500 | 5,137,965 | ||||||
Massachusetts Development Finance Agency | 3,970 | 4,473,139 | ||||||
Massachusetts Development Finance Agency | 3,250 | 3,720,470 | ||||||
Massachusetts Development Finance Agency (Boston University) | 3,300 | 3,680,325 | ||||||
Massachusetts Development Finance Agency | 3,300 | 3,592,065 | ||||||
Series 2010O-2 | 3,500 | 3,909,430 | ||||||
Massachusetts Development Finance Agency | 1,055 | 1,246,926 | ||||||
Massachusetts Development Finance Agency | 5,000 | 5,859,200 | ||||||
Massachusetts Development Finance Agency | 1,000 | 1,076,550 | ||||||
Massachusetts Development Finance Agency (Merrimack College) | 3,980 | 4,378,583 | ||||||
Massachusetts Development Finance Agency | 950 | 993,567 | ||||||
| 48 | • AB MUNICIPAL INCOME FUND II |
AB Massachusetts Portfolio—Portfolio of Investments
Principal Amount (000) | U.S. $ Value | |||||||
| ||||||||
Massachusetts Development Finance Agency | $ | 2,000 | $ | 2,145,780 | ||||
5.00%, 7/01/32 | 1,600 | 1,908,736 | ||||||
Massachusetts Development Finance Agency | 7,000 | 8,200,920 | ||||||
Massachusetts Development Finance Agency | 5,000 | 5,782,850 | ||||||
Massachusetts Development Finance Agency | 1,500 | 1,750,680 | ||||||
Massachusetts Development Finance Agency | 1,460 | 1,714,230 | ||||||
Series 2011A | 3,225 | 3,773,716 | ||||||
Massachusetts Health & Educational Facilities Authority | 5,500 | 6,064,685 | ||||||
Massachusetts Health & Educational Facilities Authority | 3,000 | 3,148,050 | ||||||
Massachusetts Health & Educational Facilities Authority | 1,005 | 1,120,876 | ||||||
Massachusetts Health & Educational Facilities Authority | 1,220 | 1,264,359 | ||||||
| AB MUNICIPAL INCOME FUND II • | 49 |
AB Massachusetts Portfolio—Portfolio of Investments
Principal Amount (000) | U.S. $ Value | |||||||
| ||||||||
Massachusetts Health & Educational Facilities Authority | $ | 7,025 | $ | 8,007,579 | ||||
Massachusetts Health & Educational Facilities Authority | 2,000 | 2,213,940 | ||||||
Massachusetts Health & Educational Facilities Authority | 3,860 | 4,465,364 | ||||||
Massachusetts Health & Educational Facilities Authority | 2,000 | 2,276,160 | ||||||
Massachusetts Health & Educational Facilities Authority | 2,500 | 2,809,300 | ||||||
Massachusetts Health & Educational Facilities Authority | 1,905 | 2,065,268 | ||||||
5.375%, 6/01/27 | 3,060 | 3,324,353 | ||||||
Massachusetts Port Authority | 2,750 | 3,130,490 | ||||||
Series 2012B | 1,430 | 1,688,701 | ||||||
Massachusetts School Building Authority (Massachusetts School Building Authority Sales Tax) | 3,720 | 4,376,282 | ||||||
Series 2013A | 2,500 | 3,000,525 | ||||||
Series 2015B | 3,770 | 4,624,207 | ||||||
Massachusetts Water Resources Authority | 2,425 | 2,880,779 | ||||||
| 50 | • AB MUNICIPAL INCOME FUND II |
AB Massachusetts Portfolio—Portfolio of Investments
Principal Amount (000) | U.S. $ Value | |||||||
| ||||||||
5.00%, 8/01/29 (Pre-refunded/ETM) | $ | 2,000 | $ | 2,375,900 | ||||
Metropolitan Boston Transit Parking Corp. | 6,000 | 7,035,780 | ||||||
University of Massachusetts Building Authority (University of Massachusetts) | 2,000 | 2,380,460 | ||||||
|
| |||||||
| 198,105,515 | ||||||||
|
| |||||||
Arizona – 2.2% | ||||||||
Arizona Sports & Tourism Authority | 4,065 | 4,600,361 | ||||||
Salt Verde Financial Corp. | 660 | 821,264 | ||||||
|
| |||||||
| 5,421,625 | ||||||||
|
| |||||||
California – 0.7% | ||||||||
California Statewide Communities Development Authority | 1,055 | 1,180,862 | ||||||
California Statewide Communities Development Authority | 360 | 395,906 | ||||||
|
| |||||||
| 1,576,768 | ||||||||
|
| |||||||
Connecticut – 0.5% | ||||||||
State of Connecticut | 1,000 | 1,193,460 | ||||||
|
| |||||||
Florida – 1.9% | ||||||||
Brevard County Health Facilities Authority | 1,000 | 1,154,410 | ||||||
County of Miami-Dade FL Aviation Revenue | 3,000 | 3,568,050 | ||||||
|
| |||||||
| 4,722,460 | ||||||||
|
| |||||||
| AB MUNICIPAL INCOME FUND II • | 51 |
AB Massachusetts Portfolio—Portfolio of Investments
Principal Amount (000) | U.S. $ Value | |||||||
| ||||||||
Georgia – 0.2% | ||||||||
City of Atlanta GA | $ | 500 | $ | 501,210 | ||||
|
| |||||||
Illinois – 1.9% | ||||||||
Illinois Finance Authority | 1,050 | 1,082,834 | ||||||
Illinois State Toll Highway Authority | 2,475 | 2,985,023 | ||||||
Village of Bolingbrook IL | 455 | 455,086 | ||||||
|
| |||||||
| 4,522,943 | ||||||||
|
| |||||||
Kentucky – 0.5% | ||||||||
Kentucky Economic Development Finance Authority | 1,000 | 1,137,440 | ||||||
|
| |||||||
Michigan – 0.7% | ||||||||
Michigan Public Power Agency | 1,605 | 1,787,890 | ||||||
|
| |||||||
New York – 2.5% | ||||||||
Metropolitan Transportation Authority | 5,065 | 5,977,713 | ||||||
|
| |||||||
North Carolina – 0.4% | ||||||||
North Carolina Medical Care Commission | 1,000 | 1,052,040 | ||||||
|
| |||||||
Ohio – 0.5% | ||||||||
Ohio Air Quality Development Authority | 1,295 | 1,314,024 | ||||||
|
| |||||||
| 52 | • AB MUNICIPAL INCOME FUND II |
AB Massachusetts Portfolio—Portfolio of Investments
Principal Amount (000) | U.S. $ Value | |||||||
| ||||||||
Pennsylvania – 0.5% | ||||||||
Pennsylvania Economic Development Financing Authority | $ | 1,140 | $ | 1,321,899 | ||||
|
| |||||||
Puerto Rico – 1.2% | ||||||||
Puerto Rico Housing Finance Authority | 695 | 713,480 | ||||||
Series 2008 | 1,965 | 2,133,695 | ||||||
|
| |||||||
| 2,847,175 | ||||||||
|
| |||||||
Texas – 1.3% | ||||||||
North Texas Tollway Authority | 1,000 | 1,178,390 | ||||||
Texas Private Activity Bond Surface | 1,090 | 1,301,296 | ||||||
Texas Private Activity Bond Surface | 545 | 641,656 | ||||||
|
| |||||||
| 3,121,342 | ||||||||
|
| |||||||
Wisconsin – 0.8% | ||||||||
Oneida Tribe of Indians of Wisconsin | 750 | 869,400 | ||||||
Wisconsin Public Finance Authority | 1,000 | 1,149,030 | ||||||
|
| |||||||
| 2,018,430 | ||||||||
|
| |||||||
Total Municipal Obligations | 236,621,934 | |||||||
|
| |||||||
| AB MUNICIPAL INCOME FUND II • | 53 |
AB Massachusetts Portfolio—Portfolio of Investments
| Company | Shares | U.S. $ Value | ||||||
| ||||||||
SHORT-TERM INVESTMENTS – 1.4% | ||||||||
Investment Companies – 1.4% | ||||||||
AB Fixed Income Shares, Inc. – | 3,264,601 | $ | 3,264,601 | |||||
|
| |||||||
Total Investments – 98.4% | 239,886,535 | |||||||
Other assets less liabilities – 1.6% | 4,014,488 | |||||||
|
| |||||||
Net Assets – 100.0% | $ | 243,901,023 | ||||||
|
| |||||||
CENTRALLY CLEARED INTEREST RATE SWAPS (see Note D)
| Rate Type | ||||||||||||||||
| Clearing Broker/ (Exchange) | Notional Amount (000) | Termination Date | Payments made by the Fund | Payments received by the Fund | Unrealized Appreciation/ (Depreciation) | |||||||||||
Morgan Stanley & Co., LLC/(CME Group) | $ | 11,000 | 10/29/21 | 3 Month LIBOR | 2.022% | $ | 298,004 | |||||||||
INFLATION (CPI) SWAPS (see Note D)
| Rate Type | ||||||||||||||||
| Swap Counterparty | Notional Amount (000) | Termination Date | Payments made by the Fund | Payments received by the Fund | Unrealized Appreciation/ (Depreciation) | |||||||||||
Citibank, NA | $ | 2,300 | 12/14/20 | 1.548% | CPI# | $ | 7,992 | |||||||||
Deutsche Bank AG | 2,400 | 7/15/20 | 1.265% | CPI# | 52,314 | |||||||||||
|
| |||||||||||||||
| $ | 60,306 | |||||||||||||||
|
| |||||||||||||||
| # | Variable interest rate based on the rate of inflation as determined by the Consumer Price Index (CPI). |
INTEREST RATE SWAPS (see Note D)
| Rate Type | ||||||||||||||||
| Swap Counterparty | Notional Amount (000) | Termination Date | Payments made by the Fund | Payments received by the Fund | Unrealized Appreciation/ (Depreciation) | |||||||||||
Citibank, NA | $ | 8,000 | 12/01/17 | SIFMA* | 3.792% | $ | 457,820 | |||||||||
| * | Variable interest rate based on the Securities Industry & Financial Markets Association (SIFMA) Municipal Swap Index. |
| 54 | • AB MUNICIPAL INCOME FUND II |
AB Massachusetts Portfolio—Portfolio of Investments
| (a) | An auction rate security whose interest rate resets at each auction date. Auctions are typically held every week or month. The rate shown is as of May 31, 2016 and the aggregate market value of these securities amounted to $2,337,196 or 0.96% of net assets. |
| (b) | Variable rate coupon, rate shown as of May 31, 2016. |
| (c) | Security is exempt from registration under Rule 144A of the Securities Act of 1933. This security is considered restricted, but liquid and may be resold in transactions exempt from registration, normally to qualified institutional buyers. At May 31, 2016, the market value of this security amounted to $869,400 or 0.4% of net assets. |
| (d) | Investment in affiliated money market mutual fund. The rate shown represents the 7-day yield as of period end. |
| (e) | To obtain a copy of the fund’s financial statements, please go to the Securities and Exchange Commission’s website at www.sec.gov, or call AB at (800) 227-4618. |
As of May 31, 2016, the Fund’s percentages of investments in municipal bonds that are insured and in insured municipal bonds that have been pre-refunded or escrowed to maturity are 6.8% and 0.0%, respectively.
Glossary:
| AGM | – Assured Guaranty Municipal |
| BAM | – Build American Mutual |
| CME | – Chicago Mercantile Exchange |
| ETM | – Escrowed to Maturity |
| LIBOR | – London Interbank Offered Rates |
| NATL | – National Interstate Corporation |
| SRF | – State Revolving Fund |
See notes to financial statements.
| AB MUNICIPAL INCOME FUND II • | 55 |
AB Massachusetts Portfolio—Portfolio of Investments
AB MICHIGAN PORTFOLIO
PORTFOLIO OF INVESTMENTS
May 31, 2016
| Principal Amount (000) | U.S. $ Value | |||||||
| ||||||||
MUNICIPAL OBLIGATIONS – 98.3% | ||||||||
Long-Term Municipal Bonds – 98.3% | ||||||||
Michigan – 78.0% | ||||||||
Birmingham City School District/MI | $ | 1,000 | $ | 1,229,070 | ||||
City of Detroit MI | 2,000 | 2,114,040 | ||||||
City of Detroit MI Sewage Disposal System Revenue | 2,000 | 2,245,480 | ||||||
City of Grand Rapids MI Sanitary Sewer System Revenue | 1,180 | 1,382,866 | ||||||
Series 2016 | 1,000 | 1,214,600 | ||||||
City of Holland MI | 1,250 | 1,406,387 | ||||||
Detroit City School District | 2,365 | 2,646,577 | ||||||
Dexter Community Schools | 1,250 | 1,343,412 | ||||||
Lansing Community College | 1,240 | 1,427,724 | ||||||
Michigan Finance Authority | 10 | 11,696 | ||||||
Michigan Finance Authority | 1,000 | 1,147,140 | ||||||
Michigan Finance Authority | 200 | 200,000 | ||||||
Michigan Finance Authority | 1,000 | 1,176,150 | ||||||
| 56 | • AB MUNICIPAL INCOME FUND II |
AB Michigan Portfolio—Portfolio of Investments
| Principal Amount (000) | U.S. $ Value | |||||||
| ||||||||
Michigan Finance Authority | $ | 1,500 | $ | 1,749,945 | ||||
Michigan Finance Authority | 1,165 | 1,339,121 | ||||||
Michigan Finance Authority | 990 | 1,132,174 | ||||||
Michigan Public Power Agency | 1,875 | 2,088,656 | ||||||
Michigan State Building Authority | 2,250 | 2,694,217 | ||||||
Michigan State Hospital Finance Authority | 1,600 | 1,633,456 | ||||||
Michigan State Housing Development Authority | 2,255 | 2,271,484 | ||||||
Michigan State University | 2,000 | 2,369,480 | ||||||
Michigan Strategic Fund | 620 | 596,372 | ||||||
Michigan Strategic Fund | 500 | 525,745 | ||||||
Michigan Strategic Fund | 2,150 | 2,481,358 | ||||||
Oakland University | 2,600 | 2,986,713 | ||||||
| AB MUNICIPAL INCOME FUND II • | 57 |
AB Michigan Portfolio—Portfolio of Investments
| Principal Amount (000) | U.S. $ Value | |||||||
| ||||||||
Plymouth Educational Center Charter School | $ | 1,050 | $ | 1,048,887 | ||||
State of Michigan | 2,500 | 2,626,525 | ||||||
Wayne County Airport Authority | 1,000 | 1,144,150 | ||||||
|
| |||||||
| 44,233,425 | ||||||||
|
| |||||||
Florida – 1.0% | ||||||||
Pinellas County Educational Facilities Authority | 500 | 564,910 | ||||||
|
| |||||||
Georgia – 2.6% | ||||||||
City of Atlanta Department of Aviation | 1,250 | 1,488,237 | ||||||
|
| |||||||
Illinois – 2.1% | ||||||||
Illinois State Toll Highway Authority | 1,000 | 1,206,070 | ||||||
|
| |||||||
Massachusetts – 0.9% | ||||||||
Massachusetts Development Finance Agency | 450 | 481,572 | ||||||
|
| |||||||
New York – 3.1% | ||||||||
New York City Municipal Water Finance Authority | 1,000 | 1,194,570 | ||||||
New York State Energy Research & Development Authority | 300 | 267,071 | ||||||
New York State Energy Research & Development Authority | 300 | 285,225 | ||||||
|
| |||||||
| 1,746,866 | ||||||||
|
| |||||||
| 58 | • AB MUNICIPAL INCOME FUND II |
AB Michigan Portfolio—Portfolio of Investments
| Principal Amount (000) | U.S. $ Value | |||||||
| ||||||||
Puerto Rico – 6.2% | ||||||||
Puerto Rico Housing Finance Authority | $ | 1,215 | $ | 1,255,120 | ||||
Series 2008 | 145 | 157,448 | ||||||
Puerto Rico Industrial Tourist Educational Medical & Envirml Ctl Facs Fing Auth | 2,000 | 2,124,680 | ||||||
|
| |||||||
| 3,537,248 | ||||||||
|
| |||||||
Tennessee – 0.8% | ||||||||
Metropolitan Government Nashville & Davidson County Health & Educational Facs Bd | 400 | 453,776 | ||||||
|
| |||||||
Texas – 3.6% | ||||||||
Dallas Area Rapid Transit | 1,000 | 1,219,330 | ||||||
Texas Private Activity Bond Surface | 470 | 561,110 | ||||||
Texas Private Activity Bond Surface Transportation Corp. | 235 | 276,677 | ||||||
|
| |||||||
| 2,057,117 | ||||||||
|
| |||||||
Total Municipal Obligations | 55,769,221 | |||||||
|
| |||||||
| AB MUNICIPAL INCOME FUND II • | 59 |
AB Michigan Portfolio—Portfolio of Investments
| Company |
Shares | U.S. $ Value | ||||||
| ||||||||
SHORT-TERM INVESTMENTS – 0.6% | ||||||||
Investment Companies – 0.6% | ||||||||
AB Fixed Income Shares, Inc. – | 314,004 | $ | 314,004 | |||||
|
| |||||||
Total Investments – 98.9% | 56,083,225 | |||||||
Other assets less liabilities – 1.1% | 625,333 | |||||||
|
| |||||||
Net Assets – 100.0% | $ | 56,708,558 | ||||||
|
| |||||||
CENTRALLY CLEARED INTEREST RATE SWAPS (see Note D)
| Rate Type | ||||||||||||||||
| Clearing Broker/ (Exchange) | Notional Amount (000) | Termination Date | Payments made by the Fund | Payments received by the Fund | Unrealized Appreciation/ (Depreciation) | |||||||||||
Morgan Stanley & Co., LLC/(CME Group) | $ | 1,500 | 10/29/21 | 3 Month LIBOR | 2.022% | $ | 40,637 | |||||||||
INFLATION (CPI) SWAPS (see Note D)
| Rate Type | ||||||||||||||||||||
Swap Counterparty | Notional Amount (000) | Termination Date | Payments made by the Fund | Payments received by the Fund | Unrealized Appreciation/ (Depreciation) | |||||||||||||||
Citibank, NA | $ | 500 | 12/14/20 | 1.548 | % | CPI | # | $ | 1,737 | |||||||||||
Deutsche Bank AG | 600 | 7/15/20 | 1.265 | % | CPI | # | 13,079 | |||||||||||||
|
| |||||||||||||||||||
| $ | 14,816 | |||||||||||||||||||
|
| |||||||||||||||||||
| # | Variable interest rate based on the rate of inflation as determined by the Consumer Price Index (CPI). |
| (a) | Security is exempt from registration under Rule 144A of the Securities Act of 1933. These securities are considered restricted, but liquid and may be resold in transactions exempt from registration, normally to qualified institutional buyers. At May 31, 2016, the aggregate market value of these securities amounted to $796,372 or 1.4% of net assets. |
| (b) | Restricted and illiquid security. |
| Restricted Securities | Acquisition Date | Cost | Market Value | Percentage of Net Assets | ||||||||||||
Plymouth Educational Center | 11/30/05 | $ | 1,050,000 | $ | 1,048,887 | 1.85 | % | |||||||||
| (c) | An auction rate security whose interest rate resets at each auction date. Auctions are typically held every week or month. The rate shown is as of May 31, 2016 and the aggregate market value of these securities amounted to $552,296 or 0.97% of net assets. |
| 60 | • AB MUNICIPAL INCOME FUND II |
AB Michigan Portfolio—Portfolio of Investments
| (d) | Investment in affiliated money market mutual fund. The rate shown represents the 7-day yield as of period end. |
| (e) | To obtain a copy of the fund’s financial statements, please go to the Securities and Exchange Commission’s website at www.sec.gov, or call AB at (800) 227-4618. |
As of May 31, 2016, the Fund’s percentages of investments in municipal bonds that are insured and in insured municipal bonds that have been pre-refunded or escrowed to maturity are 8.1% and 0.0%, respectively.
Glossary:
| AGM | – Assured Guaranty Municipal |
| AMBAC | – Ambac Assurance Corporation |
| CME | – Chicago Mercantile Exchange |
| ETM | – Escrowed to Maturity |
| LIBOR | – London Interbank Offered Rates |
| SRF | – State Revolving Fund |
| XLCA | – XL Capital Assurance Inc. |
See notes to financial statements.
| AB MUNICIPAL INCOME FUND II • | 61 |
AB Michigan Portfolio—Portfolio of Investments
AB MINNESOTA PORTFOLIO
PORTFOLIO OF INVESTMENTS
May 31, 2016
| Principal Amount (000) | U.S. $ Value | |||||||
| ||||||||
MUNICIPAL OBLIGATIONS – 96.6% | ||||||||
Long-Term Municipal Bonds – 96.6% | ||||||||
Minnesota – 96.6% | ||||||||
Anoka-Hennepin Independent School District | $ | 1,695 | $ | 1,954,250 | ||||
Central Minnesota Municipal Power Agency | 2,200 | 2,520,408 | ||||||
City of Center City MN | 800 | 926,013 | ||||||
City of Duluth MN | 1,000 | 1,236,580 | ||||||
City of Maple Grove MN | 650 | 671,769 | ||||||
City of Minneapolis MN | 1,170 | 1,270,094 | ||||||
City of Minneapolis MN | 1,000 | 1,173,380 | ||||||
City of Minneapolis MN | 1,000 | 1,206,670 | ||||||
City of Minneapolis MN/St Paul Housing & | 1,500 | 1,723,065 | ||||||
City of Minnetonka MN | 1,620 | 1,621,701 | ||||||
City of Rochester MN | 1,000 | 1,128,040 | ||||||
| 62 | • AB MUNICIPAL INCOME FUND II |
AB Minnesota Portfolio—Portfolio of Investments
| Principal Amount (000) | U.S. $ Value | |||||||
| ||||||||
City of St Cloud MN | $ | 1,500 | $ | 1,730,333 | ||||
City of St Louis Park MN | 1,150 | 1,308,332 | ||||||
City of St Paul MN | 2,900 | 3,454,452 | ||||||
City of St Paul MN Recreational Facilities Revenue | 750 | 752,640 | ||||||
City of White Bear Lake MN | 1,000 | 999,990 | ||||||
Cloquet Independent School District No 94 | 2,200 | 2,660,152 | ||||||
County of Hennepin MN Sales Tax Revenue | 3,475 | 3,699,728 | ||||||
Housing & Redevelopment Authority of The City of St Paul Minnesota | 1,200 | 1,360,272 | ||||||
Housing & Redevelopment Authority of The City of St Paul Minnesota | 1,870 | 2,052,044 | ||||||
Housing & Redevelopment Authority of The City of St Paul Minnesota | 600 | 683,370 | ||||||
Housing & Redevelopment Authority of The City of St Paul Minnesota | 1,000 | 1,184,940 | ||||||
Hutchinson Utilities Commission | 420 | 500,892 | ||||||
| AB MUNICIPAL INCOME FUND II • | 63 |
AB Minnesota Portfolio—Portfolio of Investments
| Principal Amount (000) | U.S. $ Value | |||||||
| ||||||||
Minneapolis-St Paul Metropolitan Airports Commission | $ | 1,250 | $ | 1,405,087 | ||||
Series 2012B | 1,250 | 1,446,975 | ||||||
Minnesota Agricultural & Economic Development Board | 1,000 | 1,143,810 | ||||||
Minnesota Higher Education Facilities Authority | 2,000 | 2,204,540 | ||||||
Minnesota Higher Education Facilities Authority | 1,000 | 1,117,890 | ||||||
Minnesota Higher Education Facilities Authority | 2,770 | 3,067,304 | ||||||
Minnesota Higher Education Facilities Authority | 1,400 | 1,570,520 | ||||||
Minnesota Higher Education Facilities Authority | 700 | 784,560 | ||||||
Series 20158 | 1,000 | 1,207,310 | ||||||
Minnesota Higher Education Facilities Authority | 1,000 | 1,116,630 | ||||||
Minnesota Municipal Power Agency | 750 | 890,768 | ||||||
Minnesota Public Facilities Authority | 1,000 | 1,253,320 | ||||||
New Prague Independent School District No 721 | 1,000 | 1,118,620 | ||||||
| 64 | • AB MUNICIPAL INCOME FUND II |
AB Minnesota Portfolio—Portfolio of Investments
| Principal Amount (000) | U.S. $ Value | |||||||
| ||||||||
North St Paul-Maplewood-Oakdale Independent School District No 622 | $ | 3,425 | $ | 3,520,318 | ||||
Northern Municipal Power Agency | 4,135 | 4,705,204 | ||||||
St Paul Port Authority | 2,445 | 2,660,967 | ||||||
St Paul Port Authority | 3,945 | 4,848,089 | ||||||
State of Minnesota | 1,970 | 2,206,853 | ||||||
University of Minnesota | 2,000 | 2,233,700 | ||||||
5.00%, 1/01/39 | 1,500 | 1,766,445 | ||||||
Waconia Independent School District No 110 | 1,545 | 1,714,270 | ||||||
Western Minnesota Municipal Power Agency | 2,500 | 2,900,900 | ||||||
|
| |||||||
Total Municipal Obligations | 80,703,195 | |||||||
|
| |||||||
| Shares | ||||||||
SHORT-TERM INVESTMENTS – 2.0% | ||||||||
Investment Companies – 2.0% | ||||||||
AB Fixed Income Shares, Inc. – | 1,702,666 | 1,702,666 | ||||||
|
| |||||||
Total Investments – 98.6% | 82,405,861 | |||||||
Other assets less liabilities – 1.4% | 1,167,119 | |||||||
|
| |||||||
Net Assets – 100.0% | $ | 83,572,980 | ||||||
|
| |||||||
| AB MUNICIPAL INCOME FUND II • | 65 |
AB Minnesota Portfolio—Portfolio of Investments
CENTRALLY CLEARED INTEREST RATE SWAPS (see Note D)
| Rate Type | ||||||||||||||||
Clearing Broker/ (Exchange) | Notional Amount (000) | Termination Date | Payments made by the Fund | Payments received by the Fund | Unrealized Appreciation/ (Depreciation) | |||||||||||
Morgan Stanley & Co., LLC/(CME Group) | $ | 5,000 | 1/10/21 | 3 Month LIBOR | 1.898% | $ | 102,991 | |||||||||
INFLATION (CPI) SWAPS (see Note D)
| Rate Type | ||||||||||||||||
| Swap Counterparty | Notional Amount (000) | Termination Date | Payments made by the Fund | Payments received by the Fund | Unrealized Appreciation/ (Depreciation) | |||||||||||
Citibank, NA | $ | 850 | 12/14/20 | 1.548% | CPI# | $ | 2,953 | |||||||||
Deutsche Bank AG | 800 | 7/15/20 | 1.265% | CPI# | 17,438 | |||||||||||
|
| |||||||||||||||
| $ | 20,391 | |||||||||||||||
|
| |||||||||||||||
| # | Variable interest rate based on the rate of inflation as determined by the Consumer Price Index (CPI). |
INTEREST RATE SWAPS (see Note D)
| Rate Type | ||||||||||||||||
| Swap Counterparty | Notional Amount (000) | Termination Date | Payments made by the Fund | Payments received by the Fund | Unrealized Appreciation/ (Depreciation) | |||||||||||
Merrill Lynch Capital Services, Inc. | $ | 3,500 | 8/01/16 | SIFMA* | 4.071% | $ | 31,723 | |||||||||
| * | Variable interest rate based on the Securities Industry & Financial Markets Association (SIFMA) Municipal Swap Index. |
| (a) | Investment in affiliated money market mutual fund. The rate shown represents the 7-day yield as of period end. |
| (b) | To obtain a copy of the fund’s financial statements, please go to the Securities and Exchange Commission’s website at www.sec.gov, or call AB at (800) 227-4618. |
As of May 31, 2016, the Fund’s percentages of investments in municipal bonds that are insured and in insured municipal bonds that have been pre-refunded or escrowed to maturity are 8.5% and 0.0%, respectively.
Glossary:
| AGC | – Assured Guaranty Corporation |
| AGM | – Assured Guaranty Municipal |
| CME | – Chicago Mercantile Exchange |
| COP | – Certificate of Participation |
| ETM | – Escrowed to Maturity |
| LIBOR | – London Interbank Offered Rates |
| SRF | – State Revolving Fund |
See notes to financial statements.
| 66 | • AB MUNICIPAL INCOME FUND II |
AB Minnesota Portfolio—Portfolio of Investments
AB NEW JERSEY PORTFOLIO
PORTFOLIO OF INVESTMENTS
May 31, 2016
| Principal Amount (000) | U.S. $ Value | |||||||
| ||||||||
MUNICIPAL OBLIGATIONS – 98.2% | ||||||||
Long-Term Municipal Bonds – 98.2% | ||||||||
New Jersey – 71.0% | ||||||||
Hudson County Improvement Authority | $ | 3,500 | $ | 4,229,680 | ||||
Landis Sewage Authority | 1,150 | 1,267,519 | ||||||
Middlesex County Improvement Authority | 555 | 556,460 | ||||||
Morris-Union Jointure Commission COP | 3,320 | 3,733,506 | ||||||
New Jersey Economic Development Authority | 4,000 | 4,315,080 | ||||||
New Jersey Economic Development Authority | 1,000 | 1,242,790 | ||||||
New Jersey Economic Development Authority | 1,000 | 1,135,370 | ||||||
5.50%, 1/01/27 | 1,000 | 1,183,930 | ||||||
New Jersey Economic Development Authority (Seeing Eye, Inc. (The)) | 4,000 | 4,546,320 | ||||||
New Jersey Economic Development Authority (United Airlines, Inc.) | 1,165 | 1,293,500 | ||||||
New Jersey Educational Facilities Authority | 2,500 | 2,911,975 | ||||||
New Jersey Educational Facilities Authority | 5,000 | 5,814,600 | ||||||
| AB MUNICIPAL INCOME FUND II • | 67 |
AB New Jersey Portfolio—Portfolio of Investments
| Principal Amount (000) | U.S. $ Value | |||||||
| ||||||||
New Jersey Educational Facilities Authority | $ | 4,500 | $ | 4,879,395 | ||||
New Jersey Health Care Facilities Financing Authority | 2,085 | 2,565,655 | ||||||
New Jersey Health Care Facilities Financing Authority | 1,000 | 1,085,690 | ||||||
New Jersey Health Care Facilities Financing Authority | 1,940 | 2,126,570 | ||||||
New Jersey Health Care Facilities Financing Authority | 2,100 | 2,356,011 | ||||||
New Jersey Health Care Facilities Financing Authority | 1,800 | 2,015,064 | ||||||
New Jersey Transportation Trust Fund Authority | 3,400 | 3,406,426 | ||||||
New Jersey Transportation Trust Fund Authority | 1,250 | 1,381,437 | ||||||
New Jersey Turnpike Authority | 5,200 | 5,966,584 | ||||||
Series 2013C | 1,000 | 996,700 | ||||||
NATL Series 2000B | 600 | 551,195 | ||||||
North Hudson Sewerage Authority/NJ | 8,875 | 7,748,585 | ||||||
| 68 | • AB MUNICIPAL INCOME FUND II |
AB New Jersey Portfolio—Portfolio of Investments
| Principal Amount (000) | U.S. $ Value | |||||||
| ||||||||
Rutgers The State University of New Jersey | $ | 1,000 | $ | 1,116,310 | ||||
Series 2013L | 4,500 | 5,373,675 | ||||||
Tobacco Settlement Financing Corp./NJ | 2,000 | 1,928,140 | ||||||
Union County Improvement Authority | 2,885 | 2,895,299 | ||||||
Union County Utilities Authority | 4,560 | 5,032,416 | ||||||
|
| |||||||
| 83,655,882 | ||||||||
|
| |||||||
California – 0.4% | ||||||||
California Statewide Communities Development Authority | 400 | 439,896 | ||||||
|
| |||||||
District of Columbia – 3.0% | ||||||||
District of Columbia | 3,070 | 3,496,515 | ||||||
|
| |||||||
Idaho – 3.6% | ||||||||
Idaho Housing & Finance Association | 3,600 | 4,234,644 | ||||||
|
| |||||||
Illinois – 1.9% | ||||||||
Kane Cook & DuPage Counties School District No U-46 Elgin | 1,000 | 1,131,020 | ||||||
Metropolitan Pier & Exposition Authority | 1,000 | 1,111,260 | ||||||
|
| |||||||
| 2,242,280 | ||||||||
|
| |||||||
| AB MUNICIPAL INCOME FUND II • | 69 |
AB New Jersey Portfolio—Portfolio of Investments
| Principal Amount (000) | U.S. $ Value | |||||||
| ||||||||
Maryland – 1.0% | ||||||||
Maryland Health & Higher Educational Facilities Authority | $ | 1,000 | $ | 1,133,230 | ||||
|
| |||||||
Massachusetts – 0.1% | ||||||||
Commonwealth of Massachusetts | 200 | 181,559 | ||||||
|
| |||||||
New York – 10.5% | ||||||||
New York State Dormitory Authority | 290 | 349,114 | ||||||
New York State Dormitory Authority | 1,750 | 2,084,443 | ||||||
New York State Energy Research & Development Authority | 470 | 446,853 | ||||||
Port Authority of New York & New Jersey | 4,250 | 4,965,912 | ||||||
Series 2014 | 1,100 | 1,302,796 | ||||||
Port Authority of New York & New Jersey | 3,175 | 3,187,065 | ||||||
|
| |||||||
| 12,336,183 | ||||||||
|
| |||||||
Ohio – 0.0% | ||||||||
Columbiana County Port Authority | 500 | 10,000 | ||||||
Series 2014 | 67 | 1,346 | ||||||
|
| |||||||
| 11,346 | ||||||||
|
| |||||||
Pennsylvania – 4.3% | ||||||||
Delaware River Port Authority | 4,530 | 5,091,247 | ||||||
|
| |||||||
| 70 | • AB MUNICIPAL INCOME FUND II |
AB New Jersey Portfolio—Portfolio of Investments
| Principal Amount (000) | U.S. $ Value | |||||||
| ||||||||
Puerto Rico – 1.4% | ||||||||
Puerto Rico Housing Finance Authority | $ | 1,310 | $ | 1,353,256 | ||||
Series 2008 | 305 | 331,184 | ||||||
|
| |||||||
| 1,684,440 | ||||||||
|
| |||||||
Texas – 1.0% | ||||||||
Texas State Public Finance Authority Charter School Finance Corp. | 1,000 | 1,167,330 | ||||||
|
| |||||||
Total Municipal Obligations | 115,674,552 | |||||||
|
| |||||||
| Shares | ||||||||
SHORT-TERM INVESTMENTS – 0.4% | ||||||||
Investment Companies – 0.4% | ||||||||
AB Fixed Income Shares, Inc. – Government STIF Portfolio, 0.41%(e)(f) | 448,507 | 448,507 | ||||||
|
| |||||||
Total Investments – 98.6% | 116,123,059 | |||||||
Other assets less liabilities – 1.4% | 1,617,643 | |||||||
|
| |||||||
Net Assets – 100.0% | $ | 117,740,702 | ||||||
|
| |||||||
INFLATION (CPI) SWAPS (see Note D)
| Rate Type | ||||||||||||||||||||
Swap Counterparty | Notional Amount (000) | Termination Date | Payments made by the Fund | Payments received by the Fund | Unrealized Appreciation/ (Depreciation) | |||||||||||||||
Citibank, NA | $ | 1,100 | 12/14/20 | 1.548 | % | CPI | # | $ | 3,822 | |||||||||||
Deutsche Bank AG | 1,200 | 7/15/20 | 1.265 | % | CPI | # | 26,157 | |||||||||||||
|
| |||||||||||||||||||
| $ | 29,979 | |||||||||||||||||||
|
| |||||||||||||||||||
| # | Variable interest rate based on the rate of inflation as determined by the Consumer Price Index (CPI). |
| AB MUNICIPAL INCOME FUND II • | 71 |
AB New Jersey Portfolio—Portfolio of Investments
INTEREST RATE SWAPS (see Note D)
| Rate Type | ||||||||||||||||||||
Clearing Broker/ (Exchange) | Notional Amount (000) | Termination Date | Payments by the | Payments received by the Fund | Unrealized Appreciation/ (Depreciation) | |||||||||||||||
Merrill Lynch Capital Services, Inc. | $ | 3,000 | 10/21/16 | SIFMA | * | 4.129 | % | $ | 55,499 | |||||||||||
| * | Variable interest rate based on the Securities Industry & Financial Markets Association (SIFMA) Municipal Swap Index. |
| (a) | Variable rate coupon, rate shown as of May 31, 2016. |
| (b) | Floating Rate Security. Stated interest rate was in effect at May 31, 2016. |
| (c) | An auction rate security whose interest rate resets at each auction date. Auctions are typically held every week or month. The rate shown is as of May 31, 2016 and the aggregate market value of these securities amounted to $1,179,607 or 1.00% of net assets. |
| (d) | Illiquid security. |
| (e) | Investment in affiliated money market mutual fund. The rate shown represents the 7-day yield as of period end. |
| (f) | To obtain a copy of the fund’s financial statements, please go to the Securities and Exchange Commission’s website at www.sec.gov, or call AB at (800) 227-4618. |
As of May 31, 2016, the Fund’s percentages of investments in municipal bonds that are insured and in insured municipal bonds that have been pre-refunded or escrowed to maturity are 25.0% and 8.9%, respectively.
Glossary:
| AGC | – Assured Guaranty Corporation |
| AGM | – Assured Guaranty Municipal |
| AMBAC | – Ambac Assurance Corporation |
| COP | – Certificate of Participation |
| ETM | – Escrowed to Maturity |
| NATL | – National Interstate Corporation |
See notes to financial statements.
| 72 | • AB MUNICIPAL INCOME FUND II |
AB New Jersey Portfolio—Portfolio of Investments
AB OHIO PORTFOLIO
PORTFOLIO OF INVESTMENTS
May 31, 2016
| Principal Amount (000) | U.S. $ Value | |||||||
| ||||||||
MUNICIPAL OBLIGATIONS – 99.2% | ||||||||
Long-Term Municipal Bonds – 99.2% | ||||||||
Ohio – 83.4% | ||||||||
Buckeye Tobacco Settlement Financing Authority | $ | 1,300 | $ | 1,259,492 | ||||
Central Ohio Solid Waste Authority | 155 | 188,469 | ||||||
City of Akron OH | 4,500 | 5,314,770 | ||||||
City of Cleveland OH | 2,500 | 2,715,325 | ||||||
Series 2012 | 2,215 | 2,638,619 | ||||||
City of Cleveland OH Airport System Revenue | 4,000 | 4,090,040 | ||||||
City of Columbus OH | 3,510 | 3,965,809 | ||||||
Cleveland Department of Public Utilities Division of Public Power | 1,135 | 1,157,609 | ||||||
5.00%, 11/15/18 | 1,030 | 1,050,899 | ||||||
Cleveland Department of Public Utilities Division of Water | 2,500 | 2,563,625 | ||||||
Cleveland Municipal School District | 3,000 | 3,503,700 | ||||||
Cleveland State University | 3,000 | 3,525,840 | ||||||
Columbiana County Port Authority | 500 | 10,000 | ||||||
Series 2014 | 67 | 1,346 | ||||||
Columbus City School District | 1,000 | 1,215,300 | ||||||
| AB MUNICIPAL INCOME FUND II • | 73 |
AB Ohio Portfolio—Portfolio of Investments
| Principal Amount (000) | U.S. $ Value | |||||||
| ||||||||
County of Allen OH | $ | 2,350 | $ | 2,711,007 | ||||
County of Cuyahoga OH | 1,515 | 1,519,378 | ||||||
County of Cuyahoga OH | 3,200 | 3,770,016 | ||||||
County of Cuyahoga OH | 1,000 | 1,208,970 | ||||||
County of Franklin OH | 770 | 772,741 | ||||||
5.80%, 5/20/44 | 1,150 | 1,153,933 | ||||||
County of Franklin OH | 865 | 868,062 | ||||||
County of Hamilton OH | 1,625 | 1,726,806 | ||||||
County of Hamilton OH Sewer System Revenue | 4,305 | 5,153,343 | ||||||
County of Scioto OH | 1,000 | 1,191,320 | ||||||
Cuyahoga Community College District | 1,545 | 1,765,394 | ||||||
Dayton-Montgomery County Port Authority | 575 | 590,255 | ||||||
Franklin County Convention Facilities Authority | 1,300 | 1,571,661 | ||||||
| 74 | • AB MUNICIPAL INCOME FUND II |
AB Ohio Portfolio—Portfolio of Investments
| Principal Amount (000) | U.S. $ Value | |||||||
| ||||||||
Gallia County Local School District | $ | 2,000 | $ | 2,404,020 | ||||
Kent State University | 4,005 | 4,688,493 | ||||||
Miami University/Oxford OH | 1,000 | 1,154,560 | ||||||
Mount Healthy City School District | 1,000 | 1,182,700 | ||||||
Northeast Ohio Regional Sewer District | 3,000 | 3,504,900 | ||||||
Ohio Higher Educational Facility Commission | 590 | 692,518 | ||||||
Ohio Higher Educational Facility Commission | 750 | 873,015 | ||||||
Ohio University | 3,120 | 3,710,398 | ||||||
Ohio Water Development Authority | 3,900 | 4,434,417 | ||||||
Ohio Water Development Authority | 1,200 | 1,221,744 | ||||||
Ohio Water Development Authority Water Pollution Control Loan Fund | 1,500 | 1,596,015 | ||||||
Princeton City School District | 1,000 | 1,107,700 | ||||||
5.00%, 12/01/39 | 750 | 883,897 | ||||||
Summit County Development Finance Authority | 3,760 | 4,589,682 | ||||||
Toledo-Lucas County Port Authority | 1,270 | 1,569,136 | ||||||
| AB MUNICIPAL INCOME FUND II • | 75 |
AB Ohio Portfolio—Portfolio of Investments
| Principal Amount (000) | U.S. $ Value | |||||||
| ||||||||
University of Akron (The) | $ | 4,080 | $ | 4,770,866 | ||||
|
| |||||||
| 95,587,790 | ||||||||
|
| |||||||
California – 0.7% | ||||||||
California Pollution Control Financing Authority | 750 | 830,557 | ||||||
State of California | 5 | 5,019 | ||||||
|
| |||||||
| 835,576 | ||||||||
|
| |||||||
Florida – 2.3% |
| |||||||
Brevard County Health Facilities Authority | 1,000 | 1,154,410 | ||||||
County of Miami-Dade FL Aviation Revenue | 1,300 | 1,499,602 | ||||||
|
| |||||||
| 2,654,012 | ||||||||
|
| |||||||
Georgia – 0.4% |
| |||||||
City of Atlanta GA | 500 | 501,210 | ||||||
|
| |||||||
Illinois – 2.3% |
| |||||||
Illinois State Toll Highway Authority | 2,250 | 2,603,970 | ||||||
|
| |||||||
Massachusetts – 0.5% | ||||||||
Commonwealth of Massachusetts | 625 | 567,371 | ||||||
|
| |||||||
New York – 4.2% | ||||||||
Metropolitan Transportation Authority | 3,365 | 3,961,749 | ||||||
Suffolk County Economic Development Corp. | 110 | 130,531 | ||||||
| 76 | • AB MUNICIPAL INCOME FUND II |
AB Ohio Portfolio—Portfolio of Investments
| Principal Amount (000) | U.S. $ Value | |||||||
| ||||||||
Suffolk County Economic Development Corp. | $ | 635 | $ | 709,606 | ||||
|
| |||||||
| 4,801,886 | ||||||||
|
| |||||||
North Carolina – 0.4% | ||||||||
North Carolina Medical Care Commission | 375 | 403,519 | ||||||
|
| |||||||
Puerto Rico – 0.4% | ||||||||
Puerto Rico Housing Finance Authority | 375 | 407,194 | ||||||
|
| |||||||
Tennessee – 0.6% | ||||||||
Metropolitan Government Nashville & Davidson County Health & Educational Facs Bd | 630 | 714,697 | ||||||
|
| |||||||
Texas – 4.0% | ||||||||
Arlington Higher Education Finance Corp. | 1,000 | 1,171,340 | ||||||
City of Houston TX | 1,025 | 1,209,787 | ||||||
North Texas Tollway Authority | 700 | 827,820 | ||||||
Texas Private Activity Bond Surface Transportation Corp. | 740 | 883,449 | ||||||
Texas Private Activity Bond Surface | 370 | 435,620 | ||||||
|
| |||||||
| 4,528,016 | ||||||||
|
| |||||||
Total Municipal Obligations | 113,605,241 | |||||||
|
| |||||||
| AB MUNICIPAL INCOME FUND II • | 77 |
AB Ohio Portfolio—Portfolio of Investments
| Company |
Shares | U.S. $ Value | ||||||
| ||||||||
SHORT-TERM INVESTMENTS – 0.5% |
| |||||||
Investment Companies – 0.5% |
| |||||||
AB Fixed Income Shares, Inc. – | 628,933 | $ | 628,933 | |||||
|
| |||||||
Total Investments – 99.7% | 114,234,174 | |||||||
Other assets less liabilities – 0.3% | 343,059 | |||||||
|
| |||||||
Net Assets – 100.0% | $ | 114,577,233 | ||||||
|
| |||||||
INFLATION (CPI) SWAPS (see Note D)
| Rate Type | ||||||||||||||||||||
Swap | Notional Amount (000) | Termination Date | Payments made by the Fund | Payments received by the Fund | Unrealized Appreciation/ (Depreciation) | |||||||||||||||
Citibank, NA | $ | 1,050 | 12/14/20 | 1.548% | CPI# | $ | 3,648 | |||||||||||||
Deutsche Bank AG | 1,200 | 7/15/20 | 1.265% | CPI# | 26,157 | |||||||||||||||
|
| |||||||||||||||||||
| $ | 29,805 | |||||||||||||||||||
|
| |||||||||||||||||||
| # | Variable interest rate based on the rate of inflation as determined by the Consumer Price Index (CPI). |
INTEREST RATE SWAPS (see Note D)
| Rate Type | ||||||||||||||||
| Swap Counterparty | Notional Amount (000) | Termination Date | Payments made by the Fund | Payments received by the Fund | Unrealized Appreciation/ (Depreciation) | |||||||||||
Merrill Lynch Capital Services, Inc. | $ | 3,600 | 8/01/16 | SIFMA* | 4.071% | $ | 32,629 | |||||||||
| * | Variable interest rate based on the Securities Industry & Financial Markets Association (SIFMA) Municipal Swap Index. |
| (a) | Illiquid security. |
| (b) | When-Issued or delayed delivery security. |
| (c) | Security is exempt from registration under Rule 144A of the Securities Act of 1933. This security is considered restricted, but liquid and may be resold in transactions exempt from registration, normally to qualified institutional buyers. At May 31, 2016, the market value of this security amounted to $830,557 or 0.7% of net assets. |
| (d) | An auction rate security whose interest rate resets at each auction date. Auctions are typically held every week or month. The rate shown is as of May 31, 2016 and the aggregate market value of this security amounted to $567,371 or 0.50% of net assets. |
| (e) | Investment in affiliated money market mutual fund. The rate shown represents the 7-day yield as of period end. |
| 78 | • AB MUNICIPAL INCOME FUND II |
AB Ohio Portfolio—Portfolio of Investments
| (f) | To obtain a copy of the fund’s financial statements, please go to the Securities and Exchange Commission’s website at www.sec.gov, or call AB at (800) 227-4618. |
As of May 31, 2016, the Fund’s percentages of investments in municipal bonds that are insured and in insured municipal bonds that have been pre-refunded or escrowed to maturity are 9.6% and 3.3%, respectively.
Glossary:
AGC – Assured Guaranty Corporation
AMBAC – Ambac Assurance Corporation
ETM – Escrowed to Maturity
NATL – National Interstate Corporation
See notes to financial statements.
| AB MUNICIPAL INCOME FUND II • | 79 |
AB Ohio Portfolio—Portfolio of Investments
AB PENNSYLVANIA PORTFOLIO
PORTFOLIO OF INVESTMENTS
May 31, 2016
| Principal Amount (000) | U.S. $ Value | |||||||
| ||||||||
MUNICIPAL OBLIGATIONS – 99.9% | ||||||||
Long-Term Municipal Bonds – 99.9% | ||||||||
Pennsylvania – 84.2% |
| |||||||
Adams County Industrial Development Authority | $ | 1,090 | $ | 1,243,265 | ||||
Allegheny County Industrial Development Authority | 500 | 503,665 | ||||||
Bensalem Township School District | 3,345 | 3,993,963 | ||||||
Bucks County Water & Sewer Authority | 1,255 | 1,458,498 | ||||||
AGM Series 2015A | 1,780 | 2,081,479 | ||||||
Carlisle Area School District | 4,000 | 4,784,760 | ||||||
Cheltenham Township School District | 1,000 | 1,176,980 | ||||||
City of Philadelphia PA | 2,500 | 2,993,225 | ||||||
City of Pittsburgh PA | 2,000 | 2,023,120 | ||||||
Commonwealth of Pennsylvania | 1,800 | 2,116,602 | ||||||
Cumberland County Municipal Authority | 300 | 320,529 | ||||||
Delaware County Authority | 1,645 | 1,696,159 | ||||||
Delaware County Regional Water Quality Control Authority | 2,070 | 2,448,417 | ||||||
| 80 | • AB MUNICIPAL INCOME FUND II |
AB Pennsylvania Portfolio—Portfolio of Investments
| Principal Amount (000) | U.S. $ Value | |||||||
| ||||||||
Delaware River Port Authority | $ | 4,470 | $ | 5,017,933 | ||||
Lancaster County Hospital Authority/PA | 1,165 | 1,417,549 | ||||||
Montgomery County Industrial Development Authority/PA | 735 | 858,392 | ||||||
Moon Industrial Development Authority | 765 | 833,207 | ||||||
New Wilmington Municipal Authority | 1,040 | 1,063,254 | ||||||
Norristown Area School District COP | 1,000 | 1,078,410 | ||||||
Northampton County General Purpose Authority | 2,000 | 2,394,600 | ||||||
Pennsylvania Economic Development Financing Authority | 2,000 | 2,262,800 | ||||||
Pennsylvania Higher Educational Facilities Authority | 1,000 | 1,176,030 | ||||||
Pennsylvania Higher Educational Facilities Authority | 2,850 | 3,199,707 | ||||||
Pennsylvania Industrial Development Authority | 1,060 | 1,162,216 | ||||||
Pennsylvania Intergovernmental Cooperation Authority | 4,000 | 4,478,120 | ||||||
| AB MUNICIPAL INCOME FUND II • | 81 |
AB Pennsylvania Portfolio—Portfolio of Investments
| Principal Amount (000) | U.S. $ Value | |||||||
| ||||||||
Pennsylvania Turnpike Commission | $ | 2,185 | $ | 2,495,729 | ||||
Philadelphia Authority for Industrial Development | 400 | 405,320 | ||||||
Philadelphia Authority for Industrial Development | 350 | 3,500 | ||||||
Philadelphia Authority for Industrial Development | 1,000 | 1,205,700 | ||||||
Philadelphia Gas Works Co. | 2,000 | 2,239,220 | ||||||
Philadelphia Parking Authority (The) | 2,725 | 3,110,887 | ||||||
Reading Area Water Authority | 1,000 | 1,159,310 | ||||||
School District of Philadelphia (The) | 4,000 | 4,362,640 | ||||||
Sports & Exhibition Authority of Pittsburgh and Allegheny County | 1,075 | 1,218,297 | ||||||
St Mary Hospital Authority | 2,085 | 2,210,976 | ||||||
Township of Lower Paxton PA | 4,000 | 4,623,720 | ||||||
University of Pittsburgh-of the Commonwealth System of Higher Education | 3,320 | 3,604,922 | ||||||
Wilkes-Barre Finance Authority | 305 | 314,812 | ||||||
| 82 | • AB MUNICIPAL INCOME FUND II |
AB Pennsylvania Portfolio—Portfolio of Investments
| Principal Amount (000) | U.S. $ Value | |||||||
| ||||||||
Wilkes-Barre Finance Authority | $ | 2,500 | $ | 2,843,425 | ||||
Wilkes-Barre Finance Authority | 205 | 211,095 | ||||||
|
| |||||||
| 81,792,433 | ||||||||
|
| |||||||
District of Columbia – 3.1% |
| |||||||
District of Columbia | 2,625 | 2,989,691 | ||||||
|
| |||||||
Massachusetts – 1.8% |
| |||||||
Massachusetts School Building Authority | 1,500 | 1,800,315 | ||||||
|
| |||||||
New York – 7.5% |
| |||||||
New York City Municipal Water Finance Authority | 1,000 | 1,194,570 | ||||||
New York City Transitional Finance Authority Future Tax Secured Revenue | 1,735 | 2,089,530 | ||||||
New York State Energy Research & Development Authority | 490 | 465,868 | ||||||
Triborough Bridge & Tunnel Authority | 3,000 | 3,566,850 | ||||||
|
| |||||||
| 7,316,818 | ||||||||
|
| |||||||
Puerto Rico – 1.3% | ||||||||
Puerto Rico Housing Finance Authority | 1,180 | 1,281,303 | ||||||
|
| |||||||
| AB MUNICIPAL INCOME FUND II • | 83 |
AB Pennsylvania Portfolio—Portfolio of Investments
| Principal Amount (000) | U.S. $ Value | |||||||
| ||||||||
Texas – 2.0% | ||||||||
Arlington Higher Education Finance Corp. | $ | 1,200 | $ | 1,405,608 | ||||
City of Houston TX Airport System Revenue | 550 | 506,008 | ||||||
|
| |||||||
| 1,911,616 | ||||||||
|
| |||||||
Total Investments – 99.9% | 97,092,176 | |||||||
Other assets less liabilities – 0.1% | 71,698 | |||||||
|
| |||||||
Net Assets – 100.0% | $ | 97,163,874 | ||||||
|
| |||||||
CENTRALLY CLEARED INTEREST RATE SWAPS (see Note D)
| Rate Type | ||||||||||||||||||
| Clearing Broker/ (Exchange) | Notional Amount (000) | Termination Date | Payments made by the Fund | Payments received by the Fund | Unrealized Appreciation/ (Depreciation) | |||||||||||||
Morgan Stanley & Co., LLC/(CME Group) | $ | 2,900 | 1/10/21 | 3 Month LIBOR | 1.898 | % | $ | 59,735 | ||||||||||
INFLATION (CPI) SWAPS (see Note D)
| Rate Type | ||||||||||||||||
| Swap Counterparty | Notional Amount (000) | Termination Date | Payments made by the Fund | Payments received by the Fund | Unrealized Appreciation/ (Depreciation) | |||||||||||
Citibank, NA | $ | 980 | 12/14/20 | 1.548% | CPI# | $ | 3,405 | |||||||||
Deutsche Bank AG | 1,000 | 7/15/20 | 1.265% | CPI# | 21,798 | |||||||||||
|
| |||||||||||||||
| $ | 25,203 | |||||||||||||||
|
| |||||||||||||||
| # | Variable interest rate based on the rate of inflation as determined by the Consumer Price Index (CPI). |
| (a) | Illiquid security. |
| (b) | Security is in default and is non-income producing. |
| (c) | An auction rate security whose interest rate resets at each auction date. Auctions are typically held every week or month. The rate shown is as of May 31, 2016 and the aggregate market value of these securities amounted to $971,876 or 1.00% of net assets. |
As of May 31, 2016, the Fund’s percentages of investments in municipal bonds that are insured and in insured municipal bonds that have been pre-refunded or escrowed to maturity are 9.1% and 2.1%, respectively.
| 84 | • AB MUNICIPAL INCOME FUND II |
AB Pennsylvania Portfolio—Portfolio of Investments
Glossary:
| AGC | – Assured Guaranty Corporation |
| AGM | – Assured Guaranty Municipal |
| AMBAC | – Ambac Assurance Corporation |
| CME | – Chicago Mercantile Exchange |
| COP | – Certificate of Participation |
| ETM | – Escrowed to Maturity |
| LIBOR | – London Interbank Offered Rates |
See notes to financial statements.
| AB MUNICIPAL INCOME FUND II • | 85 |
AB Pennsylvania Portfolio—Portfolio of Investments
AB VIRGINIA PORTFOLIO
PORTFOLIO OF INVESTMENTS
May 31, 2016
| Principal Amount (000) | U.S. $ Value | |||||||
| ||||||||
MUNICIPAL OBLIGATIONS – 98.1% | ||||||||
Long-Term Municipal Bonds – 98.1% | ||||||||
Virginia – 74.1% | ||||||||
Arlington County Industrial Development Authority | $ | 1,345 | $ | 1,347,233 | ||||
Cherry Hill Community Development Authority | 585 | 603,872 | ||||||
Chesterfield County Economic Development Authority | 1,000 | 1,035,980 | ||||||
City of Chesapeake VA | 2,275 | 2,653,241 | ||||||
City of Hampton VA | 1,750 | 1,928,412 | ||||||
City of Newport News VA | 2,000 | 2,440,740 | ||||||
City of Richmond VA | 1,400 | 1,568,644 | ||||||
City of Richmond VA | 1,000 | 1,099,770 | ||||||
Series 2013A | 1,970 | 2,361,537 | ||||||
City of Suffolk VA | 2,080 | 2,409,035 | ||||||
Series 2011 | 5,060 | 5,876,583 | ||||||
NATL Series 2007A | 1,710 | 1,759,676 | ||||||
5.00%, 2/01/20 | 1,290 | 1,327,733 | ||||||
City of Virginia Beach VA Water & Sewer System Revenue | 2,000 | 2,006,500 | ||||||
| 86 | • AB MUNICIPAL INCOME FUND II |
AB Virginia Portfolio—Portfolio of Investments
| Principal Amount (000) | U.S. $ Value | |||||||
| ||||||||
County of Henrico VA | $ | 1,000 | $ | 1,103,520 | ||||
Series 2010 | 6,600 | 7,627,356 | ||||||
County of Henrico VA Water & Sewer Revenue | 1,165 | 1,302,284 | ||||||
Series 2009A | 1,200 | 1,341,408 | ||||||
County of Isle Wight VA | 3,500 | 3,958,605 | ||||||
Culpeper County Economic Development Authority | 2,955 | 3,308,477 | ||||||
Dullles Town Center Community Development Authority | 1,000 | 1,021,420 | ||||||
Fairfax County Economic Development Authority | 8,635 | 9,921,788 | ||||||
Fairfax County Economic Development Authority | 1,000 | 1,200,180 | ||||||
Fairfax County Economic Development Authority | 2,000 | 2,243,240 | ||||||
Fairfax County Economic Development Authority | 1,000 | 1,054,390 | ||||||
Fairfax County Industrial Development Authority | 1,000 | 1,119,090 | ||||||
Series 2012 | 1,800 | 2,103,678 | ||||||
Series 2014A | 2,000 | 2,328,660 | ||||||
| AB MUNICIPAL INCOME FUND II • | 87 |
AB Virginia Portfolio—Portfolio of Investments
| Principal Amount (000) | U.S. $ Value | |||||||
| ||||||||
Greater Richmond Convention Center Authority | $ | 5,000 | $ | 6,024,850 | ||||
Hampton Roads Sanitation District | 6,650 | 7,158,259 | ||||||
Series 2016A | 4,000 | 4,977,600 | ||||||
Hanover County Economic Development Authority | 2,000 | 2,095,900 | ||||||
Harrisonburg Industrial Development Authority | 7,850 | 7,924,472 | ||||||
Henrico County Economic Development Authority | 2,000 | 2,279,200 | ||||||
James City County Economic Development Authority | 4,385 | 4,581,580 | ||||||
Lexington Industrial Development Authority | 3,885 | 4,349,646 | ||||||
Loudoun County Sanitation Authority | 3,820 | 4,318,243 | ||||||
Montgomery County Industrial Development Authority/VA | 2,000 | 2,139,340 | ||||||
Mosaic District Community Development Authority | 250 | 286,455 | ||||||
Newport News Redevelopment & Housing Authority | 1,880 | 1,887,294 | ||||||
5.65%, 3/20/44 | 1,660 | 1,666,142 | ||||||
| 88 | • AB MUNICIPAL INCOME FUND II |
AB Virginia Portfolio—Portfolio of Investments
| Principal Amount (000) | U.S. $ Value | |||||||
| ||||||||
Norfolk Economic Development Authority | $ | 2,200 | $ | 2,511,300 | ||||
Prince William County Industrial Development Authority | 3,750 | 4,457,850 | ||||||
Roanoke County Economic Development Authority | 1,750 | 2,113,282 | ||||||
Roanoke Economic Development Authority | 3,000 | 3,392,190 | ||||||
Tobacco Settlement Financing Corp./VA | 4,000 | 3,726,440 | ||||||
Town of Leesburg VA | 2,040 | 2,379,109 | ||||||
Virginia College Building Authority | 5,000 | 5,751,100 | ||||||
Virginia College Building Authority | 1,615 | 1,770,363 | ||||||
Virginia College Building Authority | 1,000 | 1,033,640 | ||||||
Virginia Commonwealth University Health System Authority | 1,000 | 1,165,170 | ||||||
Virginia Port Authority | 2,250 | 2,485,260 | ||||||
Series 2015A | 4,500 | 5,253,300 | ||||||
| AB MUNICIPAL INCOME FUND II • | 89 |
AB Virginia Portfolio—Portfolio of Investments
| Principal Amount (000) | U.S. $ Value | |||||||
| ||||||||
Virginia Resources Authority | $ | 3,345 | $ | 3,790,052 | ||||
Virginia Resources Authority | 5,000 | 5,963,600 | ||||||
Virginia Resources Authority | 4,000 | 4,983,720 | ||||||
Virginia Small Business Financing Authority | 2,500 | 2,864,125 | ||||||
5.50%, 1/01/42 | 1,000 | 1,147,500 | ||||||
Virginia Small Business Financing Authority | 4,125 | 4,993,601 | ||||||
Virginia Small Business Financing Authority | 710 | 742,135 | ||||||
Winchester Economic Development Authority | 3,500 | 4,102,545 | ||||||
|
| |||||||
| 182,368,315 | ||||||||
|
| |||||||
Arizona – 2.2% | ||||||||
Arizona Sports & Tourism Authority | 3,945 | 4,464,556 | ||||||
Salt Verde Financial Corp. | 705 | 877,260 | ||||||
|
| |||||||
| 5,341,816 | ||||||||
|
| |||||||
California – 1.2% | ||||||||
California Statewide Communities Development Authority | 1,910 | 2,137,863 | ||||||
| 90 | • AB MUNICIPAL INCOME FUND II |
AB Virginia Portfolio—Portfolio of Investments
| Principal Amount (000) | U.S. $ Value | |||||||
| ||||||||
California Statewide Communities Development Authority | $ | 660 | $ | 725,828 | ||||
|
| |||||||
| 2,863,691 | ||||||||
|
| |||||||
Colorado – 0.6% | ||||||||
City & County of Denver CO Airport System Revenue | 1,220 | 1,413,224 | ||||||
|
| |||||||
District of Columbia – 6.8% | ||||||||
Metropolitan Washington Airports Authority | 5,130 | 5,594,470 | ||||||
Series 2012A | 2,480 | 2,836,029 | ||||||
Metropolitan Washington Airports Authority | 4,300 | 4,913,911 | ||||||
Washington Metropolitan Area Transit Authority | 3,000 | 3,344,790 | ||||||
|
| |||||||
| 16,689,200 | ||||||||
|
| |||||||
Florida – 0.6% | ||||||||
Pinellas County Educational Facilities Authority | 400 | 451,928 | ||||||
5.25%, 10/01/30 | 1,000 | 1,122,630 | ||||||
|
| |||||||
| 1,574,558 | ||||||||
|
| |||||||
Georgia – 0.2% | ||||||||
City of Atlanta GA | 500 | 501,210 | ||||||
|
| |||||||
Illinois – 1.0% | ||||||||
Metropolitan Pier & Exposition Authority | 2,200 | 2,444,772 | ||||||
|
| |||||||
| AB MUNICIPAL INCOME FUND II • | 91 |
AB Virginia Portfolio—Portfolio of Investments
| Principal Amount (000) | U.S. $ Value | |||||||
| ||||||||
Massachusetts – 0.5% | ||||||||
Commonwealth of Massachusetts | $ | 1,250 | $ | 1,134,743 | ||||
|
| |||||||
Michigan – 0.7% | ||||||||
Michigan Public Power Agency | 1,575 | 1,754,471 | ||||||
|
| |||||||
Minnesota – 0.5% | ||||||||
Western Minnesota Municipal Power Agency | 1,000 | 1,218,410 | ||||||
|
| |||||||
New York – 3.3% | ||||||||
Metropolitan Transportation Authority | 5,745 | 6,771,641 | ||||||
Suffolk County Economic Development Corp. | 185 | 219,528 | ||||||
Suffolk County Economic Development Corp. | 1,090 | 1,218,064 | ||||||
|
| |||||||
| 8,209,233 | ||||||||
|
| |||||||
North Carolina – 0.4% | ||||||||
North Carolina Medical Care Commission | 1,000 | 1,052,040 | ||||||
|
| |||||||
Puerto Rico – 1.6% | ||||||||
Puerto Rico Electric Power Authority | 2,000 | 2,071,520 | ||||||
Puerto Rico Housing Finance Authority | 1,580 | 1,622,012 | ||||||
Series 2008 | 290 | 314,897 | ||||||
|
| |||||||
| 4,008,429 | ||||||||
|
| |||||||
| 92 | • AB MUNICIPAL INCOME FUND II |
AB Virginia Portfolio—Portfolio of Investments
| Principal Amount (000) | U.S. $ Value | |||||||
| ||||||||
Texas – 2.4% | ||||||||
North Texas Tollway Authority | $ | 1,300 | $ | 1,537,380 | ||||
Tarrant County Cultural Education Facilities Finance Corp. | 1,150 | 1,254,869 | ||||||
Texas Private Activity Bond Surface Transportation Corp. | 1,110 | 1,325,173 | ||||||
Texas Private Activity Bond Surface Transportation Corp. | 555 | 653,429 | ||||||
Texas Private Activity Bond Surface Transportation Corp. | 1,000 | 1,234,420 | ||||||
|
| |||||||
| 6,005,271 | ||||||||
|
| |||||||
Washington – 0.2% | ||||||||
Washington Higher Education Facilities Authority | 400 | 451,128 | ||||||
|
| |||||||
Wisconsin – 1.8% | ||||||||
Wisconsin Health & Educational Facilities Authority | 2,700 | 3,293,163 | ||||||
Wisconsin Public Finance Authority | 1,000 | 1,136,090 | ||||||
|
| |||||||
| 4,429,253 | ||||||||
|
| |||||||
Total Municipal Obligations | 241,459,764 | |||||||
|
| |||||||
| AB MUNICIPAL INCOME FUND II • | 93 |
AB Virginia Portfolio—Portfolio of Investments
| Company | Shares | U.S. $ Value | ||||||
| ||||||||
SHORT-TERM INVESTMENTS – 0.5% | ||||||||
Investment Companies – 0.5% | ||||||||
AB Fixed Income Shares, Inc. – | 1,253,158 | $ | 1,253,158 | |||||
|
| |||||||
Total Investments – 98.6% | 242,712,922 | |||||||
Other assets less liabilities – 1.4% | 3,445,951 | |||||||
|
| |||||||
Net Assets – 100.0% | $ | 246,158,873 | ||||||
|
| |||||||
CENTRALLY CLEARED INTEREST RATE SWAPS (see Note D)
| Rate Type | ||||||||||||||||
Clearing Broker/ (Exchange) | Notional Amount (000) | Termination Date | Payments made by the Fund | Payments received by the Fund | Unrealized Appreciation/ (Depreciation) | |||||||||||
Morgan Stanley & Co., LLC/(CME Group) | $ | 10,900 | 3/09/21 | 3 Month LIBOR | 1.383% | $ | (7,410 | ) | ||||||||
INFLATION (CPI) SWAPS (see Note D)
| Rate Type | ||||||||||||||||
| Swap Counterparty | Notional Amount (000) | Termination Date | Payments made by the Fund | Payments received by the Fund | Unrealized Appreciation/ (Depreciation) | |||||||||||
Citibank, NA | $ | 300 | 9/15/20 | 1.455% | CPI# | $ | 612 | |||||||||
Citibank, NA | 2,270 | 12/14/20 | 1.548% | CPI# | 7,888 | |||||||||||
Deutsche Bank AG | 2,400 | 7/15/20 | 1.265% | CPI# | 52,314 | |||||||||||
|
| |||||||||||||||
| $ | 60,814 | |||||||||||||||
|
| |||||||||||||||
| # | Variable interest rate based on the rate of inflation as determined by the Consumer Price Index (CPI). |
INTEREST RATE SWAPS (see Note D)
| Rate Type | ||||||||||||||||
| Swap Counterparty | Notional Amount (000) | Termination Date | Payments made by the Fund | Payments received by the Fund | Unrealized Appreciation/ (Depreciation) | |||||||||||
Citibank, NA | $ | 7,000 | 12/01/17 | SIFMA* | 3.792% | $ | 400,592 | |||||||||
| * | Variable interest rate based on the Securities Industry & Financial Markets Association (SIFMA) Municipal Swap Index. |
| 94 | • AB MUNICIPAL INCOME FUND II |
AB Virginia Portfolio—Portfolio of Investments
| (a) | Security is exempt from registration under Rule 144A of the Securities Act of 1933. These securities are considered restricted, but liquid and may be resold in transactions exempt from registration, normally to qualified institutional buyers. At May 31, 2016, the aggregate market value of these securities amounted to $2,374,235 or 1.0% of net assets. |
| (b) | Indicates a security that has a zero coupon that remains in effect until a predetermined date at which time the stated coupon rate becomes effective until final maturity. |
| (c) | An auction rate security whose interest rate resets at each auction date. Auctions are typically held every week or month. The rate shown is as of May 31, 2016 and the aggregate market value of this security amounted to $1,134,743 or 0.46% of net assets. |
| (d) | Investment in affiliated money market mutual fund. The rate shown represents the 7-day yield as of period end. |
| (e) | To obtain a copy of the fund’s financial statements, please go to the Securities and Exchange Commission’s website at www.sec.gov, or call AB at (800) 227-4618. |
As of May 31, 2016, the Fund’s percentages of investments in municipal bonds that are insured and in insured municipal bonds that have been pre-refunded or escrowed to maturity are 9.2% and 2.6%, respectively.
Glossary:
| AGM | – Assured Guaranty Municipal |
| AMBAC | – Ambac Assurance Corporation |
| CME | – Chicago Mercantile Exchange |
| EDA | – Economic Development Agency |
| ETM | – Escrowed to Maturity |
| LIBOR | – London Interbank Offered Rates |
| NATL | – National Interstate Corporation |
| SRF | – State Revolving Fund |
See notes to financial statements.
| AB MUNICIPAL INCOME FUND II • | 95 |
AB Virginia Portfolio—Portfolio of Investments
STATEMENT OF ASSETS & LIABILITIES
May 31, 2016
| AB Arizona | AB Massachusetts | |||||||
| Assets | ||||||||
Investments in securities, at value | ||||||||
Unaffiliated issuers (cost $119,190,374 and $217,394,753, respectively) | $ | 127,390,225 | $ | 236,621,934 | ||||
Affiliated issuers (cost $3,224,919 and $3,264,601, respectively) | 3,224,919 | 3,264,601 | ||||||
Cash | 65 | – 0 | – | |||||
Cash collateral due from broker | 129,891 | 222,354 | ||||||
Receivable for investment securities sold | 57,000 | – 0 | – | |||||
Interest receivable | 2,225,004 | 3,186,052 | ||||||
Receivable for shares of beneficial interest sold | 436,324 | 730,226 | ||||||
Receivable for variation margin on exchange-traded derivatives | 6,747 | 11,653 | ||||||
Unrealized appreciation on interest rate swaps | – 0 | – | 457,820 | |||||
Unrealized appreciation on inflation swaps | 33,904 | 60,306 | ||||||
|
|
|
| |||||
Total assets | 133,504,079 | 244,554,946 | ||||||
|
|
|
| |||||
| Liabilities | ||||||||
Payable for investment securities purchased | 1,244,500 | – 0 | – | |||||
Payable for shares of beneficial interest redeemed | 108,315 | 307,193 | ||||||
Advisory fee payable | 21,511 | 57,240 | ||||||
Distribution fee payable | 43,422 | 83,693 | ||||||
Transfer Agent fee payable | 1,471 | 4,860 | ||||||
Administrative fee payable | 7,943 | 7,210 | ||||||
Dividends payable | 38,828 | 113,059 | ||||||
Accrued expenses | 64,501 | 80,668 | ||||||
|
|
|
| |||||
Total liabilities | 1,530,491 | 653,923 | ||||||
|
|
|
| |||||
Net Assets | $ | 131,973,588 | $ | 243,901,023 | ||||
|
|
|
| |||||
| Composition of Net Assets | ||||||||
Shares of beneficial interest, at par | $ | 116,177 | $ | 210,196 | ||||
Additional paid-in capital | 125,085,849 | 224,216,290 | ||||||
Distributions in excess of net investment income | (38,828 | ) | (182,758 | ) | ||||
Accumulated net realized loss on investment transactions | (1,418,470 | ) | (386,016 | ) | ||||
Net unrealized appreciation on investments | 8,228,860 | 20,043,311 | ||||||
|
|
|
| |||||
| $ | 131,973,588 | $ | 243,901,023 | |||||
|
|
|
| |||||
See notes to financial statements.
| 96 | • AB MUNICIPAL INCOME FUND II |
Statement of Assets & Liabilities
Net Asset Value Per Share—unlimited shares authorized, $.01 par value
| AB Arizona Portfolio | Net Assets | Shares Outstanding | Net Asset Value | |||||||||
| ||||||||||||
| Class A | $ | 106,036,805 | 9,331,701 | $ | 11.36 | * | ||||||
| ||||||||||||
| Class B | $ | 386,489 | 34,066 | $ | 11.35 | |||||||
| ||||||||||||
| Class C | $ | 25,550,294 | 2,251,970 | $ | 11.35 | |||||||
| ||||||||||||
| AB Massachusetts Portfolio | ||||||||||||
| ||||||||||||
| Class A | $ | 189,259,361 | 16,304,124 | $ | 11.61 | * | ||||||
| ||||||||||||
| Class B | $ | 159,841 | 13,795 | $ | 11.59 | |||||||
| ||||||||||||
| Class C | $ | 54,481,821 | 4,701,685 | $ | 11.59 | |||||||
| ||||||||||||
| * | The maximum offering price per share for Class A of AB Arizona Portfolio and AB Massachusetts Portfolio were $11.71 and $11.97, respectively, which reflects a sales charge of 3.00%. |
See notes to financial statements.
| AB MUNICIPAL INCOME FUND II • | 97 |
Statement of Assets & Liabilities
| AB Michigan | AB Minnesota | |||||||
| Assets | ||||||||
Investments in securities, at value | ||||||||
Unaffiliated issuers (cost $52,339,329 and $75,135,903, respectively) | $ | 55,769,221 | $ | 80,703,195 | ||||
Affiliated issuers (cost $314,004 and $1,702,666, respectively) | 314,004 | 1,702,666 | ||||||
Cash collateral due from broker | 30,321 | 90,686 | ||||||
Receivable for investment securities sold | 10,000 | – 0 | – | |||||
Interest receivable | 704,454 | 1,176,358 | ||||||
Receivable for shares of beneficial interest sold | 5,555 | 40,603 | ||||||
Receivable for variation margin on exchange-traded derivatives | 1,589 | 4,378 | ||||||
Unrealized appreciation on interest rate swaps | – 0 | – | 31,723 | |||||
Unrealized appreciation on inflation swaps | 14,816 | 20,391 | ||||||
Receivable due from Adviser | 5,674 | – 0 | – | |||||
|
|
|
| |||||
Total assets | 56,855,634 | 83,770,000 | ||||||
|
|
|
| |||||
| Liabilities | ||||||||
Payable for shares of beneficial interest redeemed | 35,178 | 68,988 | ||||||
Advisory fee payable | – 0 | – | 7,133 | |||||
Distribution fee payable | 23,290 | 27,095 | ||||||
Transfer Agent fee payable | 1,572 | 1,357 | ||||||
Administrative fee payable | 7,943 | 7,210 | ||||||
Dividends payable | 16,198 | 19,772 | ||||||
Legal fee payable | 12,166 | 12,166 | ||||||
Audit and tax fee payable | 29,262 | 31,148 | ||||||
Custody fee payable | 11,234 | – 0 | – | |||||
Accrued expenses | 10,233 | 22,151 | ||||||
|
|
|
| |||||
Total liabilities | 147,076 | 197,020 | ||||||
|
|
|
| |||||
Net Assets | $ | 56,708,558 | $ | 83,572,980 | ||||
|
|
|
| |||||
| Composition of Net Assets | ||||||||
Shares of beneficial interest, at par | $ | 53,054 | $ | 79,287 | ||||
Additional paid-in capital | 55,552,947 | 77,649,085 | ||||||
Distributions in excess of net investment income | (16,198 | ) | (30,359 | ) | ||||
Accumulated net realized gain (loss) on investment transactions | (2,366,590 | ) | 152,570 | |||||
Net unrealized appreciation on investments | 3,485,345 | 5,722,397 | ||||||
|
|
|
| |||||
| $ | 56,708,558 | $ | 83,572,980 | |||||
|
|
|
| |||||
See notes to financial statements.
| 98 | • AB MUNICIPAL INCOME FUND II |
Statement of Assets & Liabilities
Net Asset Value Per Share—unlimited shares authorized, $.01 par value
| AB Michigan Portfolio | Net Assets | Shares Outstanding | Net Asset Value | |||||||||
| ||||||||||||
| Class A | $ | 37,799,676 | 3,534,591 | $ | 10.69 | * | ||||||
| ||||||||||||
| Class B | $ | 238,715 | 22,368 | $ | 10.67 | |||||||
| ||||||||||||
| Class C | $ | 18,670,167 | 1,748,470 | $ | 10.68 | |||||||
| ||||||||||||
| AB Minnesota Portfolio | ||||||||||||
| ||||||||||||
| Class A | $ | 67,380,592 | 6,393,672 | $ | 10.54 | * | ||||||
| ||||||||||||
| Class B | $ | 14,769 | 1,400 | $ | 10.55 | |||||||
| ||||||||||||
| Class C | $ | 16,177,619 | 1,533,580 | $ | 10.55 | |||||||
| ||||||||||||
| * | The maximum offering price per share for Class A of AB Michigan Portfolio and AB Minnesota Portfolio were $11.02 and $10.87, respectively, which reflects a sales charge of 3.00%. |
See notes to financial statements.
| AB MUNICIPAL INCOME FUND II • | 99 |
Statement of Assets & Liabilities
| AB New Jersey | AB Ohio | |||||||
| Assets | ||||||||
Investments in securities, at value | ||||||||
Unaffiliated issuers (cost $105,204,274 and $105,494,537, respectively) | $ | 115,674,552 | $ | 113,605,241 | ||||
Affiliated issuers (cost $448,507 and $628,933, respectively) | 448,507 | 628,933 | ||||||
Cash | 80 | – 0 | – | |||||
Interest receivable | 1,792,589 | 1,697,985 | ||||||
Receivable for shares of beneficial interest sold | 63,572 | 82,023 | ||||||
Unrealized appreciation on interest rate swaps | 55,499 | 32,629 | ||||||
Unrealized appreciation on inflation swaps | 29,979 | 29,805 | ||||||
|
|
|
| |||||
Total assets | 118,064,778 | 116,076,616 | ||||||
|
|
|
| |||||
| Liabilities | ||||||||
Payable for investment securities purchased | – 0 | – | 1,183,080 | |||||
Payable for shares of beneficial interest redeemed | 119,105 | 140,630 | ||||||
Advisory fee payable | 19,351 | 19,598 | ||||||
Distribution fee payable | 42,868 | 40,137 | ||||||
Transfer Agent fee payable | 2,084 | 1,686 | ||||||
Administrative fee payable | 7,210 | 7,210 | ||||||
Dividends payable | 65,497 | 39,065 | ||||||
Audit and tax fee payable | 31,148 | – 0 | – | |||||
Accrued expenses | 36,813 | 67,977 | ||||||
|
|
|
| |||||
Total liabilities | 324,076 | 1,499,383 | ||||||
|
|
|
| |||||
Net Assets | $ | 117,740,702 | $ | 114,577,233 | ||||
|
|
|
| |||||
| Composition of Net Assets | ||||||||
Shares of beneficial interest, at par | $ | 118,596 | $ | 112,379 | ||||
Additional paid-in capital | 111,553,567 | 111,949,033 | ||||||
Distributions in excess of net investment income | (78,096 | ) | (49,955 | ) | ||||
Accumulated net realized loss on investment transactions | (4,409,121 | ) | (5,607,362 | ) | ||||
Net unrealized appreciation on investments | 10,555,756 | 8,173,138 | ||||||
|
|
|
| |||||
| $ | 117,740,702 | $ | 114,577,233 | |||||
|
|
|
| |||||
See notes to financial statements.
| 100 | • AB MUNICIPAL INCOME FUND II |
Statement of Assets & Liabilities
Net Asset Value Per Share—unlimited shares authorized, $.01 par value
| AB New Jersey Portfolio | Net Assets | Shares Outstanding | Net Asset Value | |||||||||
| ||||||||||||
| Class A | $ | 87,364,723 | 8,801,276 | $ | 9.93 | * | ||||||
| ||||||||||||
| Class B | $ | 281,536 | 28,361 | $ | 9.93 | |||||||
| ||||||||||||
| Class C | $ | 30,094,443 | 3,029,935 | $ | 9.93 | |||||||
| ||||||||||||
| AB Ohio Portfolio | ||||||||||||
| ||||||||||||
| Class A | $ | 87,480,159 | 8,579,186 | $ | 10.20 | * | ||||||
| ||||||||||||
| Class B | $ | 52,173 | 5,123 | $ | 10.18 | |||||||
| ||||||||||||
| Class C | $ | 27,044,901 | 2,653,596 | $ | 10.19 | |||||||
| ||||||||||||
| * | The maximum offering price per share for Class A of AB New Jersey Portfolio and AB Ohio Portfolio were $10.24 and $10.52, respectively, which reflects a sales charge of 3.00%. |
See notes to financial statements.
| AB MUNICIPAL INCOME FUND II • | 101 |
Statement of Assets & Liabilities
| AB Pennsylvania | AB Virginia | |||||||
| Assets | ||||||||
Investments in securities, at value | ||||||||
Unaffiliated issuers (cost $89,022,149 and $222,460,125, respectively) | $ | 97,092,176 | $ | 241,459,764 | ||||
Affiliated issuers (cost $0 and $1,253,158, respectively) | – 0 | – | 1,253,158 | |||||
Cash collateral due from broker | 52,598 | 196,641 | ||||||
Interest receivable | 1,251,273 | 3,139,006 | ||||||
Receivable for shares of beneficial interest sold | 17,883 | 324,110 | ||||||
Receivable for variation margin on exchange-traded derivatives | 2,537 | 10,214 | ||||||
Unrealized appreciation on interest rate swaps | – 0 | – | 400,592 | |||||
Unrealized appreciation on inflation swaps | 25,203 | 60,814 | ||||||
|
|
|
| |||||
Total assets | 98,441,670 | 246,844,299 | ||||||
|
|
|
| |||||
| Liabilities | ||||||||
Due to custodian | 883,957 | – 0 | – | |||||
Payable for shares of beneficial interest redeemed | 240,591 | 284,429 | ||||||
Advisory fee payable | 4,194 | 63,768 | ||||||
Distribution fee payable | 33,835 | 84,963 | ||||||
Transfer Agent fee payable | 2,071 | 2,337 | ||||||
Administrative fee payable | 7,943 | 7,943 | ||||||
Dividends payable | 30,274 | 164,072 | ||||||
Accrued expenses | 74,931 | 77,914 | ||||||
|
|
|
| |||||
Total liabilities | 1,277,796 | 685,426 | ||||||
|
|
|
| |||||
Net Assets | $ | 97,163,874 | $ | 246,158,873 | ||||
|
|
|
| |||||
| Composition of Net Assets | ||||||||
Shares of beneficial interest, at par | $ | 90,810 | $ | 216,220 | ||||
Additional paid-in capital | 91,662,112 | 231,681,490 | ||||||
Distributions in excess of net investment income | (44,272 | ) | (225,057 | ) | ||||
Accumulated net realized loss on investment transactions | (2,699,741 | ) | (4,967,415 | ) | ||||
Net unrealized appreciation on investments | 8,154,965 | 19,453,635 | ||||||
|
|
|
| |||||
| $ | 97,163,874 | $ | 246,158,873 | |||||
|
|
|
| |||||
See notes to financial statements.
| 102 | • AB MUNICIPAL INCOME FUND II |
Statement of Assets & Liabilities
Net Asset Value Per Share—unlimited shares authorized, $.01 par value
| AB Pennsylvania Portfolio | Net Assets | Shares Outstanding | Net Asset Value | |||||||||
| ||||||||||||
| Class A | $ | 74,733,301 | 6,984,761 | $ | 10.70 | * | ||||||
| ||||||||||||
| Class B | $ | 74,362 | 6,949 | $ | 10.70 | |||||||
| ||||||||||||
| Class C | $ | 22,356,211 | 2,089,299 | $ | 10.70 | |||||||
| ||||||||||||
| AB Virginia Portfolio | ||||||||||||
| ||||||||||||
| Class A | $ | 189,952,967 | 16,675,049 | $ | 11.39 | * | ||||||
| ||||||||||||
| Class B | $ | 126,060 | 11,083 | $ | 11.37 | |||||||
| ||||||||||||
| Class C | $ | 56,079,846 | 4,935,891 | $ | 11.36 | |||||||
| ||||||||||||
| * | The maximum offering price per share for Class A of AB Pennsylvania Portfolio and AB Virginia Portfolio were $11.03 and $11.74, respectively, which reflects a sales charge of 3.00%. |
See notes to financial statements.
| AB MUNICIPAL INCOME FUND II • | 103 |
Statement of Assets & Liabilities
STATEMENT OF OPERATIONS
Year Ended May 31, 2016
| AB Arizona | AB Massachusetts | |||||||
| Investment Income | ||||||||
Interest | $ | 5,093,251 | $ | 9,076,486 | ||||
Dividends – Affiliated issuers | 7,426 | 3,226 | ||||||
|
|
|
| |||||
Total income | 5,100,677 | 9,079,712 | ||||||
|
|
|
| |||||
| Expenses | ||||||||
Advisory fee (see Note B) | 580,097 | 1,071,360 | ||||||
Distribution fee – Class A | 258,527 | 460,702 | ||||||
Distribution fee – Class B | 4,001 | 2,188 | ||||||
Distribution fee – Class C | 250,994 | 535,805 | ||||||
Transfer agency – Class A | 37,995 | 71,114 | ||||||
Transfer agency – Class B | 153 | 123 | ||||||
Transfer agency – Class C | 9,678 | 23,224 | ||||||
Custodian | 85,894 | 101,101 | ||||||
Administrative | 53,226 | 51,402 | ||||||
Audit and tax | 44,427 | 49,054 | ||||||
Legal | 32,489 | 32,489 | ||||||
Printing | 18,056 | 33,532 | ||||||
Trustees’ fees | 21,940 | 21,936 | ||||||
Registration fees | 10,739 | 9,385 | ||||||
Miscellaneous | 17,890 | 26,078 | ||||||
|
|
|
| |||||
Total expenses before interest expense | 1,426,106 | 2,489,493 | ||||||
Interest expense | 982 | – 0 | – | |||||
|
|
|
| |||||
Total expenses | 1,427,088 | 2,489,493 | ||||||
Less: expenses waived and reimbursed by the Adviser (see Note B) | (224,707 | ) | (242,995 | ) | ||||
|
|
|
| |||||
Net expenses | 1,202,381 | 2,246,498 | ||||||
|
|
|
| |||||
Net investment income | 3,898,296 | 6,833,214 | ||||||
|
|
|
| |||||
| Realized and Unrealized Gain on Investment Transactions | ||||||||
Net realized gain on: |
| |||||||
Investment transactions | 366,876 | 1,715,963 | ||||||
Swaps | 2,554 | 305,145 | ||||||
Net change in unrealized appreciation/depreciation of: | ||||||||
Investments | 3,665,931 | 3,036,462 | ||||||
Swaps | 29,009 | 84,143 | ||||||
|
|
|
| |||||
Net gain on investment transactions | 4,064,370 | 5,141,713 | ||||||
|
|
|
| |||||
Net Increase in Net Assets from Operations | $ | 7,962,666 | $ | 11,974,927 | ||||
|
|
|
| |||||
See notes to financial statements.
| 104 | • AB MUNICIPAL INCOME FUND II |
Statement of Operations
| AB Michigan | AB Minnesota | |||||||
| Investment Income | ||||||||
Interest | $ | 2,247,395 | $ | 3,133,319 | ||||
Dividends – Affiliated issuers | 1,737 | 1,985 | ||||||
|
|
|
| |||||
Total income | 2,249,132 | 3,135,304 | ||||||
|
|
|
| |||||
| Expenses | ||||||||
Advisory fee (see Note B) | 249,326 | 372,198 | ||||||
Distribution fee – Class A | 91,897 | 167,623 | ||||||
Distribution fee – Class B | 2,811 | 271 | ||||||
Distribution fee – Class C | 183,659 | 156,342 | ||||||
Transfer agency – Class A | 24,167 | 34,754 | ||||||
Transfer agency – Class B | 213 | 20 | ||||||
Transfer agency – Class C | 12,788 | 8,325 | ||||||
Custodian | 75,385 | 80,130 | ||||||
Administrative | 53,226 | 51,402 | ||||||
Audit and tax | 44,427 | 53,928 | ||||||
Legal | 32,489 | 32,489 | ||||||
Trustees’ fees | 21,935 | 21,755 | ||||||
Printing | 16,510 | 17,174 | ||||||
Registration fees | 7,692 | 3,482 | ||||||
Miscellaneous | 10,159 | 9,024 | ||||||
|
|
|
| |||||
Total expenses before interest expense | 826,684 | 1,008,917 | �� | |||||
Interest expense | – 0 | – | 4,961 | |||||
|
|
|
| |||||
Total expenses | 826,684 | 1,013,878 | ||||||
Less: expenses waived and reimbursed by the Adviser (see Note B) | (214,965 | ) | (188,417 | ) | ||||
|
|
|
| |||||
Net expenses | 611,719 | 825,461 | ||||||
|
|
|
| |||||
Net investment income | 1,637,413 | 2,309,843 | ||||||
|
|
|
| |||||
| Realized and Unrealized Gain (Loss) on Investment Transactions | ||||||||
Net realized gain on: |
| |||||||
Investment transactions | 271,928 | 245,184 | ||||||
Swaps | 40,437 | 141,735 | ||||||
Net change in unrealized appreciation/depreciation of: | ||||||||
Investments | 1,535,990 | 1,359,530 | ||||||
Swaps | 55,453 | (15,261 | ) | |||||
|
|
|
| |||||
Net gain on investment transactions | 1,903,808 | 1,731,188 | ||||||
|
|
|
| |||||
Net Increase in Net Assets from Operations | $ | 3,541,221 | $ | 4,041,031 | ||||
|
|
|
| |||||
See notes to financial statements.
| AB MUNICIPAL INCOME FUND II • | 105 |
Statement of Operations
| AB New Jersey | AB Ohio | |||||||
| Investment Income | ||||||||
Interest | $ | 4,816,546 | $ | 4,221,788 | ||||
Dividends – Affiliated issuers | 3,360 | 3,806 | ||||||
|
|
|
| |||||
Total income | 4,819,906 | 4,225,594 | ||||||
|
|
|
| |||||
| Expenses | ||||||||
Advisory fee (see Note B) | 522,299 | 514,084 | ||||||
Distribution fee – Class A | 216,809 | 215,300 | ||||||
Distribution fee – Class B | 2,940 | 871 | ||||||
Distribution fee – Class C | 290,489 | 280,340 | ||||||
Transfer agency – Class A | 40,896 | 43,165 | ||||||
Transfer agency – Class B | 253 | 58 | ||||||
Transfer agency – Class C | 14,080 | 14,379 | ||||||
Custodian | 82,586 | 84,671 | ||||||
Audit and tax | 53,928 | 53,928 | ||||||
Administrative | 51,402 | 51,402 | ||||||
Legal | 32,489 | 32,489 | ||||||
Trustees’ fees | 21,755 | 21,755 | ||||||
Printing | 17,221 | 15,876 | ||||||
Registration fees | 4,922 | 3,226 | ||||||
Miscellaneous | 15,810 | 10,781 | ||||||
|
|
|
| |||||
Total expenses | 1,367,879 | 1,342,325 | ||||||
Less: expenses waived and reimbursed by the Adviser (see Note B) | (190,777 | ) | (216,976 | ) | ||||
|
|
|
| |||||
Net expenses | 1,177,102 | 1,125,349 | ||||||
|
|
|
| |||||
Net investment income | 3,642,804 | 3,100,245 | ||||||
|
|
|
| |||||
| Realized and Unrealized Gain (Loss) on Investment Transactions | ||||||||
Net realized gain (loss) on: |
| |||||||
Investment transactions | 14,817 | (221,803 | ) | |||||
Swaps | 124,700 | 146,705 | ||||||
Net change in unrealized appreciation/depreciation of: | ||||||||
Investments | 3,127,381 | 3,793,908 | ||||||
Swaps | (90,741 | ) | (112,799 | ) | ||||
|
|
|
| |||||
Net gain on investment transactions | 3,176,157 | 3,606,011 | ||||||
|
|
|
| |||||
Net Increase in Net Assets from Operations | $ | 6,818,961 | $ | 6,706,256 | ||||
|
|
|
| |||||
See notes to financial statements.
| 106 | • AB MUNICIPAL INCOME FUND II |
Statement of Operations
| AB Pennsylvania | AB Virginia | |||||||
| Investment Income | ||||||||
Interest | $ | 3,813,040 | $ | 9,034,056 | ||||
Dividends – Affiliated issuers | 3,945 | 3,619 | ||||||
|
|
|
| |||||
Total income | 3,816,985 | 9,037,675 | ||||||
|
|
|
| |||||
| Expenses | ||||||||
Advisory fee (see Note B) | 443,936 | 1,064,218 | ||||||
Distribution fee – Class A | 191,628 | 454,961 | ||||||
Distribution fee – Class B | 1,146 | 1,843 | ||||||
Distribution fee – Class C | 218,865 | 543,243 | ||||||
Transfer agency – Class A | 37,980 | 66,968 | ||||||
Transfer agency – Class B | 185 | 121 | ||||||
Transfer agency – Class C | 11,192 | 20,321 | ||||||
Custodian | 80,925 | 102,946 | ||||||
Administrative | 53,226 | 53,226 | ||||||
Audit and tax | 52,202 | 50,074 | ||||||
Legal | 32,489 | 33,925 | ||||||
Printing | 20,130 | 34,064 | ||||||
Trustees’ fees | 21,687 | 21,935 | ||||||
Registration fees | 5,613 | 7,353 | ||||||
Miscellaneous | 10,745 | 18,250 | ||||||
|
|
|
| |||||
Total expenses | 1,181,949 | 2,473,448 | ||||||
Less: expenses waived and reimbursed by the Adviser (see Note B) | (178,243 | ) | (169,536 | ) | ||||
|
|
|
| |||||
Net expenses | 1,003,706 | 2,303,912 | ||||||
|
|
|
| |||||
Net investment income | 2,813,279 | 6,733,763 | ||||||
|
|
|
| |||||
| Realized and Unrealized Gain (Loss) on Investment Transactions | ||||||||
Net realized gain on: |
| |||||||
Investment transactions | 113,547 | 122,860 | ||||||
Swaps | 22,251 | 266,991 | ||||||
Net change in unrealized appreciation/depreciation of: | ||||||||
Investments | 2,370,839 | 6,034,865 | ||||||
Swaps | 84,938 | (186,492 | ) | |||||
|
|
|
| |||||
Net gain on investment transactions | 2,591,575 | 6,238,224 | ||||||
|
|
|
| |||||
Net Increase in Net Assets from Operations | $ | 5,404,854 | $ | 12,971,987 | ||||
|
|
|
| |||||
See notes to financial statements.
| AB MUNICIPAL INCOME FUND II • | 107 |
Statement of Operations
STATEMENT OF CHANGES IN NET ASSETS
| AB Arizona | ||||||||||||
| Year Ended May 31, 2016 | October 1, 2014 to May 31, 2015(a) | Year Ended September 30, 2014 | ||||||||||
| Increase (Decrease) in Net Assets from Operations | ||||||||||||
Net investment income | $ | 3,898,296 | $ | 2,937,609 | $ | 4,844,439 | ||||||
Net realized gain (loss) on investment transactions | 369,430 | 2,089,632 | (3,513,960 | ) | ||||||||
Net change in unrealized appreciation/depreciation of investments | 3,694,940 | (2,522,554 | ) | 7,595,813 | ||||||||
|
|
|
|
|
| |||||||
Net increase in net assets from operations | 7,962,666 | 2,504,687 | 8,926,292 | |||||||||
| Dividends to Shareholders from | ||||||||||||
Net investment income |
| |||||||||||
Class A | (3,279,548 | ) | (2,467,158 | ) | (4,029,599 | ) | ||||||
Class B | (9,735 | ) | (8,997 | ) | (18,362 | ) | ||||||
Class C | (609,022 | ) | (461,454 | ) | (796,478 | ) | ||||||
| Transactions in Shares of Beneficial Interest | ||||||||||||
Net decrease | (1,891,774 | ) | (3,357,843 | ) | (18,661,575 | ) | ||||||
|
|
|
|
|
| |||||||
Total increase (decrease) | 2,172,587 | (3,790,765 | ) | (14,579,722 | ) | |||||||
| Net Assets | ||||||||||||
Beginning of period | 129,801,001 | 133,591,766 | 148,171,488 | |||||||||
|
|
|
|
|
| |||||||
End of period (including distributions in excess of net investment income of ($38,828), ($51,990) and ($74,074), respectively) | $ | 131,973,588 | $ | 129,801,001 | $ | 133,591,766 | ||||||
|
|
|
|
|
| |||||||
| (a) | The Portfolio changed its fiscal year end from September 30 to May 31. |
See notes to financial statements.
| 108 | • AB MUNICIPAL INCOME FUND II |
Statement of Changes in Net Assets
| AB Massachusetts | ||||||||||||
| Year Ended May 31, 2016 | October 1, 2014 to May 31, 2015(a) | Year Ended September 30, 2014 | ||||||||||
| Increase (Decrease) in Net Assets from Operations | ||||||||||||
Net investment income | $ | 6,833,214 | $ | 4,883,121 | $ | 8,161,500 | ||||||
Net realized gain (loss) on investment transactions | 2,021,108 | 1,608,971 | (3,120,583 | ) | ||||||||
Net change in unrealized appreciation/depreciation of investments | 3,120,605 | (1,070,036 | ) | 10,434,543 | ||||||||
|
|
|
|
|
| |||||||
Net increase in net assets from operations | 11,974,927 | 5,422,056 | 15,475,460 | |||||||||
| Dividends to Shareholders from | ||||||||||||
Net investment income | ||||||||||||
Class A | (5,826,919 | ) | (4,168,201 | ) | (6,835,497 | ) | ||||||
Class B | (5,350 | ) | (9,066 | ) | (28,357 | ) | ||||||
Class C | (1,295,946 | ) | (906,703 | ) | (1,596,381 | ) | ||||||
| Transactions in Shares of Beneficial Interest | ||||||||||||
Net decrease | (3,848,669 | ) | (6,473,312 | ) | (25,930,851 | ) | ||||||
|
|
|
|
|
| |||||||
Total increase (decrease) | 998,043 | (6,135,226 | ) | (18,915,626 | ) | |||||||
| Net Assets | ||||||||||||
Beginning of period | 242,902,980 | 249,038,206 | 267,953,832 | |||||||||
|
|
|
|
|
| |||||||
End of period (including distributions in excess of net investment income of ($182,758), ($212,106) and ($161,574), respectively) | $ | 243,901,023 | $ | 242,902,980 | $ | 249,038,206 | ||||||
|
|
|
|
|
| |||||||
| (a) | The Portfolio changed its fiscal year end from September 30 to May 31. |
See notes to financial statements.
| AB MUNICIPAL INCOME FUND II • | 109 |
Statement of Changes in Net Assets
| AB Michigan | ||||||||||||
| Year Ended May 31, 2016 | October 1, 2014 to May 31, 2015(a) | Year Ended September 30, 2014 | ||||||||||
| Increase (Decrease) in Net Assets from Operations | ||||||||||||
Net investment income | $ | 1,637,413 | $ | 1,179,409 | $ | 2,095,017 | ||||||
Net realized gain (loss) on investment transactions | 312,365 | 57,133 | (2,272,902 | ) | ||||||||
Net change in unrealized appreciation/depreciation of investments | 1,591,443 | (66,218 | ) | 4,473,041 | ||||||||
|
|
|
|
|
| |||||||
Net increase in net assets from operations | 3,541,221 | 1,170,324 | 4,295,156 | |||||||||
| Dividends to Shareholders from | ||||||||||||
Net investment income | ||||||||||||
Class A | (1,178,406 | ) | (847,702 | ) | (1,518,517 | ) | ||||||
Class B | (6,935 | ) | (6,104 | ) | (11,588 | ) | ||||||
Class C | (452,153 | ) | (325,603 | ) | (564,912 | ) | ||||||
| Transactions in Shares of Beneficial Interest | ||||||||||||
Net decrease | (1,273,624 | ) | (2,311,237 | ) | (15,153,406 | ) | ||||||
|
|
|
|
|
| |||||||
Total increase (decrease) | 630,103 | (2,320,322 | ) | (12,953,267 | ) | |||||||
| Net Assets | ||||||||||||
Beginning of period | 56,078,455 | 58,398,777 | 71,352,044 | |||||||||
|
|
|
|
|
| |||||||
End of period (including distributions in excess of net investment income of ($16,198), ($18,545) and ($29,379), respectively) | $ | 56,708,558 | $ | 56,078,455 | $ | 58,398,777 | ||||||
|
|
|
|
|
| |||||||
| (a) | The Portfolio changed its fiscal year end from September 30 to May 31. |
See notes to financial statements.
| 110 | • AB MUNICIPAL INCOME FUND II |
Statement of Changes in Net Assets
| AB Minnesota | ||||||||||||
| Year Ended May 31, 2016 | October 1, 2014 to May 31, 2015(a) | Year Ended September 30, 2014 | ||||||||||
| Increase (Decrease) in Net Assets from Operations | ||||||||||||
Net investment income | $ | 2,309,843 | $ | 1,586,441 | $ | 2,491,067 | ||||||
Net realized gain on investment transactions | 386,919 | 44,793 | 893,795 | |||||||||
Net change in unrealized appreciation/depreciation of investments | 1,344,269 | (490,589 | ) | 1,974,207 | ||||||||
|
|
|
|
|
| |||||||
Net increase in net assets from operations | 4,041,031 | 1,140,645 | 5,359,069 | |||||||||
| Dividends and Distributions to Shareholders from | ||||||||||||
Net investment income | ||||||||||||
Class A | (2,081,036 | ) | (1,430,488 | ) | (2,199,013 | ) | ||||||
Class B | (644 | ) | (854 | ) | (2,473 | ) | ||||||
Class C | (367,356 | ) | (249,601 | ) | (429,536 | ) | ||||||
Net realized gain on investment transactions | ||||||||||||
Class A | – 0 | – | (399,039 | ) | – 0 | – | ||||||
Class B | – 0 | – | (285 | ) | – 0 | – | ||||||
Class C | – 0 | – | (91,759 | ) | – 0 | – | ||||||
| Transactions in Shares of Beneficial Interest | ||||||||||||
Net increase (decrease) | (3,930,204 | ) | 1,130,486 | (8,329,236 | ) | |||||||
|
|
|
|
|
| |||||||
Total increase (decrease) | (2,338,209 | ) | 99,105 | (5,601,189 | ) | |||||||
| Net Assets | ||||||||||||
Beginning of period | 85,911,189 | 85,812,084 | 91,413,273 | |||||||||
|
|
|
|
|
| |||||||
End of period (including distributions in excess of net investment income of ($30,359), ($34,574) and ($48,003), respectively) | $ | 83,572,980 | $ | 85,911,189 | $ | 85,812,084 | ||||||
|
|
|
|
|
| |||||||
| (a) | The Portfolio changed its fiscal year end from September 30 to May 31. |
See notes to financial statements.
| AB MUNICIPAL INCOME FUND II • | 111 |
Statement of Changes in Net Assets
| AB New Jersey | ||||||||||||
| Year Ended May 31, 2016 | October 1, 2014 to May 31, 2015(a) | Year Ended September 30, 2014 | ||||||||||
| Increase (Decrease) in Net Assets from Operations | ||||||||||||
Net investment income | $ | 3,642,804 | $ | 2,713,650 | $ | 4,659,523 | ||||||
Net realized gain (loss) on investment transactions | 139,517 | 254,034 | (2,194,029 | ) | ||||||||
Net change in unrealized appreciation/depreciation of investments | 3,036,640 | (1,312,345 | ) | 5,253,350 | ||||||||
|
|
|
|
|
| |||||||
Net increase in net assets from operations | 6,818,961 | 1,655,339 | 7,718,844 | |||||||||
| Dividends to Shareholders from | ||||||||||||
Net investment income | ||||||||||||
Class A | (2,977,637 | ) | (2,244,582 | ) | (3,842,390 | ) | ||||||
Class B | (7,900 | ) | (7,651 | ) | (22,686 | ) | ||||||
Class C | (778,276 | ) | (543,109 | ) | (916,639 | ) | ||||||
| Transactions in Shares of Beneficial Interest | ||||||||||||
Net decrease | (4,657,467 | ) | (9,715,965 | ) | (19,610,488 | ) | ||||||
|
|
|
|
|
| |||||||
Total decrease | (1,602,319 | ) | (10,855,968 | ) | (16,673,359 | ) | ||||||
| Net Assets | ||||||||||||
Beginning of period | 119,343,021 | 130,198,989 | 146,872,348 | |||||||||
|
|
|
|
|
| |||||||
End of period (including distributions in excess of net investment income of ($78,096), ($83,705) and ($101,274), respectively) | $ | 117,740,702 | $ | 119,343,021 | $ | 130,198,989 | ||||||
|
|
|
|
|
| |||||||
| (a) | The Portfolio changed its fiscal year end from September 30 to May 31. |
See notes to financial statements.
| 112 | • AB MUNICIPAL INCOME FUND II |
Statement of Changes in Net Assets
| AB Ohio | ||||||||||||
| Year Ended May 31, 2016 | October 1, 2014 to May 31, 2015(a) | Year Ended September 30, 2014 | ||||||||||
| Increase (Decrease) in Net Assets from Operations | ||||||||||||
Net investment income | $ | 3,100,245 | $ | 2,299,431 | $ | 4,187,195 | ||||||
Net realized gain (loss) on investment transactions | (75,098 | ) | 4,091 | (3,654,532 | ) | |||||||
Net change in unrealized appreciation/depreciation of investments | 3,681,109 | (367,217 | ) | 5,189,512 | ||||||||
|
|
|
|
|
| |||||||
Net increase in net assets from operations | 6,706,256 | 1,936,305 | 5,722,175 | |||||||||
| Dividends to Shareholders from | ||||||||||||
Net investment income | ||||||||||||
Class A | (2,602,877 | ) | (1,876,763 | ) | (3,348,092 | ) | ||||||
Class B | (2,009 | ) | (2,891 | ) | (13,479 | ) | ||||||
Class C | (638,529 | ) | (516,978 | ) | (969,577 | ) | ||||||
| Transactions in Shares of Beneficial Interest | ||||||||||||
Net decrease | (5,477,808 | ) | (2,250,844 | ) | (24,310,367 | ) | ||||||
|
|
|
|
|
| |||||||
Total decrease | (2,014,967 | ) | (2,711,171 | ) | (22,919,340 | ) | ||||||
| Net Assets | ||||||||||||
Beginning of period | 116,592,200 | 119,303,371 | 142,222,711 | |||||||||
|
|
|
|
|
| |||||||
End of period (including distributions in excess of net investment income of ($49,955), ($59,574) and ($91,322), respectively) | $ | 114,577,233 | $ | 116,592,200 | $ | 119,303,371 | ||||||
|
|
|
|
|
| |||||||
| (a) | The Portfolio changed its fiscal year end from September 30 to May 31. |
See notes to financial statements.
| AB MUNICIPAL INCOME FUND II • | 113 |
Statement of Changes in Net Assets
| AB Pennsylvania | ||||||||||||
| Year Ended May 31, 2016 | October 1, 2014 to May 31, 2015(a) | Year Ended September 30, 2014 | ||||||||||
| Increase (Decrease) in Net Assets from Operations | ||||||||||||
Net investment income | $ | 2,813,279 | $ | 2,039,348 | $ | 3,335,494 | ||||||
Net realized gain (loss) on investment transactions | 135,798 | 26,263 | (2,861,951 | ) | ||||||||
Net change in unrealized appreciation/depreciation of investments | 2,455,777 | (93,796 | ) | 6,456,895 | ||||||||
|
|
|
|
|
| |||||||
Net increase in net assets from operations | 5,404,854 | 1,971,815 | 6,930,438 | |||||||||
| Dividends and Distributions to Shareholders from | ||||||||||||
Net investment income | ||||||||||||
Class A | (2,314,328 | ) | (1,687,320 | ) | (2,742,320 | ) | ||||||
Class B | (2,616 | ) | (3,452 | ) | (16,214 | ) | ||||||
Class C | (496,335 | ) | (348,576 | ) | (576,960 | ) | ||||||
Net realized gain on investment transactions | ||||||||||||
Class A | – 0 | – | – 0 | – | (264,229 | ) | ||||||
Class B | – 0 | – | – 0 | – | (2,443 | ) | ||||||
Class C | – 0 | – | – 0 | – | (70,468 | ) | ||||||
| Transactions in Shares of Beneficial Interest | ||||||||||||
Net decrease | (6,137,580 | ) | (4,021,471 | ) | (11,347,968 | ) | ||||||
|
|
|
|
|
| |||||||
Total decrease | (3,546,005 | ) | (4,089,004 | ) | (8,090,164 | ) | ||||||
| Net Assets | ||||||||||||
Beginning of period | 100,709,879 | 104,798,883 | 112,889,047 | |||||||||
|
|
|
|
|
| |||||||
End of period (including distributions in excess of net investment income of ($44,272), ($44,123) and ($52,157), respectively) | $ | 97,163,874 | $ | 100,709,879 | $ | 104,798,883 | ||||||
|
|
|
|
|
| |||||||
| (a) | The Portfolio changed its fiscal year end from September 30 to May 31. |
See notes to financial statements.
| 114 | • AB MUNICIPAL INCOME FUND II |
Statement of Changes in Net Assets
| AB Virginia | ||||||||||||
| Year Ended May 31, 2016 | October 1, 2014 to May 31, 2015(a) | Year Ended September 30, 2014 | ||||||||||
| Increase (Decrease) in Net Assets from Operations | ||||||||||||
Net investment income | $ | 6,733,763 | $ | 4,450,717 | $ | 7,168,090 | ||||||
Net realized gain (loss) on investment transactions | 389,851 | 331,462 | (1,819,542 | ) | ||||||||
Net change in unrealized appreciation/depreciation of investments | 5,848,373 | (684,061 | ) | 10,919,874 | ||||||||
|
|
|
|
|
| |||||||
Net increase in net assets from operations | 12,971,987 | 4,098,118 | 16,268,422 | |||||||||
| Dividends to Shareholders from | ||||||||||||
Net investment income | ||||||||||||
Class A | (5,690,164 | ) | (3,716,292 | ) | (5,904,701 | ) | ||||||
Class B | (4,412 | ) | (8,031 | ) | (26,394 | ) | ||||||
Class C | (1,297,297 | ) | (902,137 | ) | (1,498,388 | ) | ||||||
| Transactions in Shares of Beneficial Interest | ||||||||||||
Net increase (decrease) | 3,838,205 | 7,782,244 | (26,642,385 | ) | ||||||||
|
|
|
|
|
| |||||||
Total increase (decrease) | 9,818,319 | 7,253,902 | (17,803,446 | ) | ||||||||
| Net Assets | ||||||||||||
Beginning of period | 236,340,554 | 229,086,652 | 246,890,098 | |||||||||
|
|
|
|
|
| |||||||
End of period (including distributions in excess of net investment income of ($225,057), ($243,299) and ($199,948), respectively) | $ | 246,158,873 | $ | 236,340,554 | $ | 229,086,652 | ||||||
|
|
|
|
|
| |||||||
| (a) | The Portfolio changed its fiscal year end from September 30 to May 31. |
See notes to financial statements.
| AB MUNICIPAL INCOME FUND II • | 115 |
Statement of Changes in Net Assets
NOTES TO FINANCIAL STATEMENTS
May 31, 2016
NOTE A
Significant Accounting Policies
AB Municipal Income Fund II (the “Fund”) which is a Massachusetts Business Trust, is registered under the Investment Company Act of 1940, as a diversified, open-end management investment company. The Fund operates as a series company currently comprised of eight portfolios: AB Arizona Portfolio, AB Massachusetts Portfolio, AB Michigan Portfolio, AB Minnesota Portfolio, AB New Jersey Portfolio, AB Ohio Portfolio, AB Pennsylvania Portfolio and AB Virginia Portfolio (the “Portfolios”). Each series is considered to be a separate entity for financial reporting and tax purposes. Each Portfolio offers Class A, Class B and Class C shares. Class A shares are sold with a front-end sales charge of up to 3% for purchases up to $500,000; purchases of $500,000 or more are not subject to a sales charge. With respect to purchases of $500,000 or more, Class A shares redeemed within one year of purchase may be subject to a contingent deferred sales charge of 1%. Class B shares are currently sold with a contingent deferred sales charge which declines from 3% to zero depending on the period of time the shares are held. Effective January 31, 2009, sales of Class B shares of the Portfolios to new investors were suspended. Class B shares will only be issued (i) upon the exchange of Class B shares from another AB Mutual Fund, (ii) for purposes of dividend reinvestment, (iii) through the Portfolios’ Automatic Investment Program (the “Program”) for accounts that established the Program prior to January 31, 2009, and (iv) for purchases of additional shares by Class B shareholders as of January 31, 2009. The ability to establish a new Program for accounts containing Class B shares was suspended as of January 31, 2009. Class B shares will automatically convert to Class A shares six years after the end of the calendar month of purchase. Class C shares are subject to a contingent deferred sales charge of 1% on redemptions made within the first year after purchase. All three classes of shares have identical voting, dividend, liquidation and other rights, except that the classes bear different distribution and transfer agency expenses. Each class has exclusive voting rights with respect to its distribution plan. The financial statements have been prepared in conformity with U.S. generally accepted accounting principles (“U.S. GAAP”) which require management to make certain estimates and assumptions that affect the reported amounts of assets and liabilities in the financial statements and amounts of income and expenses during the reporting period. Actual results could differ from those estimates. The Fund is an investment company under U.S. GAAP and follows the accounting and reporting guidance applicable to investment companies. The following is a summary of significant accounting policies followed by the Portfolios.
1. Security Valuation
Portfolio securities are valued at their current market value determined on the basis of market quotations or, if market quotations are not readily available or are deemed unreliable, at “fair value” as determined in accordance with procedures established by and under the general supervision of the Fund’s Board of Trustees (the “Board”).
| 116 | • AB MUNICIPAL INCOME FUND II |
Notes to Financial Statements
In general, the market values of securities which are readily available and deemed reliable are determined as follows: securities listed on a national securities exchange (other than securities listed on the NASDAQ Stock Market, Inc. (“NASDAQ”)) or on a foreign securities exchange are valued at the last sale price at the close of the exchange or foreign securities exchange. If there has been no sale on such day, the securities are valued at the last traded price from the previous day. Securities listed on more than one exchange are valued by reference to the principal exchange on which the securities are traded; securities listed only on NASDAQ are valued in accordance with the NASDAQ Official Closing Price; listed or over the counter (“OTC”) market put or call options are valued at the mid level between the current bid and ask prices. If either a current bid or current ask price is unavailable, AllianceBernstein L.P. (the “Adviser”) will have discretion to determine the best valuation (e.g. last trade price in the case of listed options); open futures are valued using the closing settlement price or, in the absence of such a price, the most recent quoted bid price. If there are no quotations available for the day of valuation, the last available closing settlement price is used; U.S. Government securities and any other debt instruments having 60 days or less remaining until maturity are generally valued at market by an independent pricing vendor, if a market price is available. If a market price is not available, the securities are valued at amortized cost. This methodology is commonly used for short term securities that have an original maturity of 60 days or less, as well as short term securities that had an original term to maturity that exceeded 60 days. In instances when amortized cost is utilized, the Valuation Committee (the “Committee”) must reasonably conclude that the utilization of amortized cost is approximately the same as the fair value of the security. Such factors the Committee will consider include, but are not limited to, an impairment of the creditworthiness of the issuer or material changes in interest rates. Fixed-income securities, including mortgage-backed and asset-backed securities, may be valued on the basis of prices provided by a pricing service or at a price obtained from one or more of the major broker-dealers. In cases where broker-dealer quotes are obtained, the Adviser may establish procedures whereby changes in market yields or spreads are used to adjust, on a daily basis, a recently obtained quoted price on a security. Swaps and other derivatives are valued daily, primarily using independent pricing services, independent pricing models using market inputs, as well as third party broker-dealers or counterparties. Investment companies are valued at their net asset value each day.
Securities for which market quotations are not readily available (including restricted securities) or are deemed unreliable are valued at fair value. Factors considered in making this determination may include, but are not limited to, information obtained by contacting the issuer, analysts, analysis of the issuer’s financial statements or other available documents. In addition, the Portfolios may use fair value pricing for securities primarily traded in non-U.S. markets because most foreign markets close well before the Portfolios value their securities at 4:00 p.m., Eastern Time. The earlier close of these foreign markets gives
| AB MUNICIPAL INCOME FUND II • | 117 |
Notes to Financial Statements
rise to the possibility that significant events, including broad market moves, may have occurred in the interim and may materially affect the value of those securities. To account for this, the Portfolios may frequently value many of their foreign equity securities using fair value prices based on third party vendor modeling tools to the extent available.
2. Fair Value Measurements
In accordance with U.S. GAAP regarding fair value measurements, fair value is defined as the price that the Portfolios would receive to sell an asset or pay to transfer a liability in an orderly transaction between market participants at the measurement date. U.S. GAAP establishes a framework for measuring fair value, and a three-level hierarchy for fair value measurements based upon the transparency of inputs to the valuation of an asset or liability (including those valued based on their market values as described in Note A.1 above). Inputs may be observable or unobservable and refer broadly to the assumptions that market participants would use in pricing the asset or liability. Observable inputs reflect the assumptions market participants would use in pricing the asset or liability based on market data obtained from sources independent of the Portfolios. Unobservable inputs reflect the Portfolios’ own assumptions about the assumptions that market participants would use in pricing the asset or liability based on the best information available in the circumstances. Each investment is assigned a level based upon the observability of the inputs which are significant to the overall valuation. The three-tier hierarchy of inputs is summarized below.
| • | Level 1—quoted prices in active markets for identical investments |
| • | Level 2—other significant observable inputs (including quoted prices for similar investments, interest rates, prepayment speeds, credit risk, etc.) |
| • | Level 3—significant unobservable inputs (including the Portfolios’ own assumptions in determining the fair value of investments) |
The fair value of debt instruments, such as bonds, and over-the-counter derivatives is generally based on market price quotations, recently executed market transactions (where observable) or industry recognized modeling techniques and are generally classified as Level 2. Pricing vendor inputs to Level 2 valuations may include quoted prices for similar investments in active markets, interest rate curves, coupon rates, currency rates, yield curves, option adjusted spreads, default rates, credit spreads and other unique security features in order to estimate the relevant cash flows which are then discounted to calculate fair values. If these inputs are unobservable and significant to the fair value, these investments will be classified as Level 3. In addition, non-agency rated investments are classified as Level 3.
Other fixed income investments, including non-U.S. government and corporate debt, are generally valued using quoted market prices, if available, which are typically impacted by current interest rates, maturity dates and any perceived credit risk of the issuer. Additionally, in the absence of quoted market prices, these inputs are used by pricing vendors to derive a valuation based upon industry or proprietary
| 118 | • AB MUNICIPAL INCOME FUND II |
Notes to Financial Statements
models which incorporate issuer specific data with relevant yield/spread comparisons with more widely quoted bonds with similar key characteristics. Those investments for which there are observable inputs are classified as Level 2. Where the inputs are not observable, the investments are classified as Level 3.
The following tables summarize the valuation of the Portfolios’ investments by the above fair value hierarchy levels as of May 31, 2016:
| AB Arizona Portfolio | ||||||||||||||||
| Investments in Securities: | Level 1 | Level 2 | Level 3 | Total | ||||||||||||
Assets: | ||||||||||||||||
Long-Term Municipal Bonds | $ | – 0 | – | $ | 120,375,627 | $ | 7,014,598 | $ | 127,390,225 | |||||||
Short-Term Investments | 3,224,919 | – 0 | – | – 0 | – | 3,224,919 | ||||||||||
|
|
|
|
|
|
|
| |||||||||
Total Investments in Securities | 3,224,919 | 120,375,627 | 7,014,598 | 130,615,144 | ||||||||||||
Other Financial Instruments(a): | ||||||||||||||||
Assets: | ||||||||||||||||
Inflation (CPI) Swaps | – 0 | – | 33,904 | – 0 | – | 33,904 | ||||||||||
Liabilities: | ||||||||||||||||
Centrally Cleared Interest Rate Swaps | – 0 | – | (4,895 | ) | – 0 | – | (4,895 | )(b) | ||||||||
|
|
|
|
|
|
|
| |||||||||
Total(c) | $ | 3,224,919 | $ | 120,404,636 | $ | 7,014,598 | $ | 130,644,153 | ||||||||
|
|
|
|
|
|
|
| |||||||||
| AB Massachusetts Portfolio | ||||||||||||||||
| Investments in Securities: | Level 1 | Level 2 | Level 3 | Total | ||||||||||||
Assets: | ||||||||||||||||
Long-Term Municipal Bonds | $ | – 0 | – | $ | 235,114,808 | $ | 1,507,126 | $ | 236,621,934 | |||||||
Short-Term Investments | 3,264,601 | – 0 | – | – 0 | – | 3,264,601 | ||||||||||
|
|
|
|
|
|
|
| |||||||||
Total Investments in Securities | 3,264,601 | 235,114,808 | 1,507,126 | 239,886,535 | ||||||||||||
Other Financial Instruments(a): | ||||||||||||||||
Assets: | ||||||||||||||||
Centrally Cleared Interest Rate Swaps | – 0 | – | 298,004 | – 0 | – | 298,004 | (b) | |||||||||
Inflation (CPI) Swaps | – 0 | – | 60,306 | – 0 | – | 60,306 | ||||||||||
Interest Rate Swaps | – 0 | – | 457,820 | – 0 | – | 457,820 | ||||||||||
Liabilities | – 0 | – | – 0 | – | – 0 | – | – 0 | – | ||||||||
|
|
|
|
|
|
|
| |||||||||
Total(c) | $ | 3,264,601 | $ | 235,930,938 | $ | 1,507,126 | $ | 240,702,665 | ||||||||
|
|
|
|
|
|
|
| |||||||||
| AB MUNICIPAL INCOME FUND II • | 119 |
Notes to Financial Statements
| AB Michigan Portfolio | ||||||||||||||||
| Investments in Securities: | Level 1 | Level 2 | Level 3 | Total | ||||||||||||
Assets: | ||||||||||||||||
Long-Term Municipal Bonds | $ | – 0 | – | $ | 52,889,669 | $ | 2,879,552 | $ | 55,769,221 | |||||||
Short-Term Investments | 314,004 | – 0 | – | – 0 | – | 314,004 | ||||||||||
|
|
|
|
|
|
|
| |||||||||
Total Investments in Securities | 314,004 | 52,889,669 | 2,879,552 | 56,083,225 | ||||||||||||
Other Financial Instruments(a): | ||||||||||||||||
Assets: | ||||||||||||||||
Centrally Cleared Interest Rate Swaps | – 0 | – | 40,637 | – 0 | – | 40,637 | (b) | |||||||||
Inflation (CPI) Swaps | – 0 | – | 14,816 | – 0 | – | 14,816 | ||||||||||
Liabilities | – 0 | – | – 0 | – | – 0 | – | – 0 | – | ||||||||
|
|
|
|
|
|
|
| |||||||||
Total(c) | $ | 314,004 | $ | 52,945,122 | $ | 2,879,552 | $ | 56,138,678 | ||||||||
|
|
|
|
|
|
|
| |||||||||
| AB Minnesota Portfolio | ||||||||||||||||
| Investments in Securities: | Level 1 | Level 2 | Level 3 | Total | ||||||||||||
Assets: | ||||||||||||||||
Long-Term Municipal Bonds | $ | – 0 | – | $ | 78,972,862 | $ | 1,730,333 | $ | 80,703,195 | |||||||
Short-Term Investments | 1,702,666 | – 0 | – | – 0 | – | 1,702,666 | ||||||||||
|
|
|
|
|
|
|
| |||||||||
Total Investments in Securities | 1,702,666 | 78,972,862 | 1,730,333 | 82,405,861 | ||||||||||||
Other Financial Instruments(a): | ||||||||||||||||
Assets: | ||||||||||||||||
Centrally Cleared Interest Rate Swaps | – 0 | – | 102,991 | – 0 | – | 102,991 | (b) | |||||||||
Inflation (CPI) Swaps | – 0 | – | 20,391 | – 0 | – | 20,391 | ||||||||||
Interest Rate Swaps | – 0 | – | 31,723 | – 0 | – | 31,723 | ||||||||||
Liabilities | – 0 | – | – 0 | – | – 0 | – | – 0 | – | ||||||||
|
|
|
|
|
|
|
| |||||||||
Total(c) | $ | 1,702,666 | $ | 79,127,967 | $ | 1,730,333 | $ | 82,560,966 | ||||||||
|
|
|
|
|
|
|
| |||||||||
| 120 | • AB MUNICIPAL INCOME FUND II |
Notes to Financial Statements
| AB New Jersey Portfolio | ||||||||||||||||
| Investments in Securities: | Level 1 | Level 2 | Level 3 | Total | ||||||||||||
Assets: | ||||||||||||||||
Long-Term Municipal Bonds | $ | – 0 | – | $ | 115,314,092 | $ | 360,460 | $ | 115,674,552 | |||||||
Short-Term Investments | 448,507 | – 0 | – | – 0 | – | 448,507 | ||||||||||
|
|
|
|
|
|
|
| |||||||||
Total Investments in Securities | 448,507 | 115,314,092 | 360,460 | 116,123,059 | ||||||||||||
Other Financial Instruments(a): | ||||||||||||||||
Assets: | ||||||||||||||||
Inflation (CPI) Swaps | – 0 | – | 29,979 | – 0 | – | 29,979 | ||||||||||
Interest Rate Swaps | – 0 | – | 55,499 | – 0 | – | 55,499 | ||||||||||
Liabilities | – 0 | – | – 0 | – | – 0 | – | – 0 | – | ||||||||
|
|
|
|
|
|
|
| |||||||||
Total(c) | $ | 448,507 | $ | 115,399,570 | $ | 360,460 | $ | 116,208,537 | ||||||||
|
|
|
|
|
|
|
| |||||||||
| AB Ohio Portfolio | ||||||||||||||||
| Investments in Securities: | Level 1 | Level 2 | Level 3 | Total | ||||||||||||
Assets: | ||||||||||||||||
Long-Term Municipal Bonds | $ | – 0 | – | $ | 111,413,059 | $ | 2,192,182 | $ | 113,605,241 | |||||||
Short-Term Investments | 628,933 | – 0 | – | – 0 | – | 628,933 | ||||||||||
|
|
|
|
|
|
|
| |||||||||
Total Investments in Securities | 628,933 | 111,413,059 | 2,192,182 | 114,234,174 | ||||||||||||
Other Financial Instruments(a): | ||||||||||||||||
Assets: | ||||||||||||||||
Inflation (CPI) Swaps | – 0 | – | 29,805 | – 0 | – | 29,805 | ||||||||||
Interest Rate Swaps | – 0 | – | 32,629 | – 0 | – | 32,629 | ||||||||||
Liabilities | – 0 | – | – 0 | – | – 0 | – | – 0 | – | ||||||||
|
|
|
|
|
|
|
| |||||||||
Total(c) | $ | 628,933 | $ | 111,475,493 | $ | 2,192,182 | $ | 114,296,608 | ||||||||
|
|
|
|
|
|
|
| |||||||||
| AB MUNICIPAL INCOME FUND II • | 121 |
Notes to Financial Statements
| AB Pennsylvania Portfolio | ||||||||||||||||
| Investments in Securities: | Level 1 | Level 2 | Level 3 | Total | ||||||||||||
Assets: | ||||||||||||||||
Long-Term Municipal Bonds | $ | – 0 | – | $ | 94,213,880 | $ | 2,878,296 | $ | 97,092,176 | |||||||
|
|
|
|
|
|
|
| |||||||||
Total Investments in Securities | – 0 | – | 94,213,880 | 2,878,296 | 97,092,176 | |||||||||||
Other Financial Instruments(a): | ||||||||||||||||
Assets: | ||||||||||||||||
Centrally Cleared Interest Rate Swaps | – 0 | – | 59,735 | – 0 | – | 59,735 | (b) | |||||||||
Inflation (CPI) Swaps | – 0 | – | 25,203 | – 0 | – | 25,203 | ||||||||||
Liabilities | – 0 | – | – 0 | – | – 0 | – | – 0 | – | ||||||||
|
|
|
|
|
|
|
| |||||||||
Total(d) | $ | – 0 | – | $ | 94,298,818 | $ | 2,878,296 | $ | 97,177,114 | |||||||
|
|
|
|
|
|
|
| |||||||||
| AB Virginia Portfolio | ||||||||||||||||
| Investments in Securities: | Level 1 | Level 2 | Level 3 | Total | ||||||||||||
Assets: | ||||||||||||||||
Long-Term Municipal Bonds | $ | – 0 | – | $ | 235,144,569 | $ | 6,315,195 | $ | 241,459,764 | |||||||
Short-Term Investments | 1,253,158 | – 0 | – | – 0 | – | 1,253,158 | ||||||||||
|
|
|
|
|
|
|
| |||||||||
Total Investments in Securities | 1,253,158 | 235,144,569 | 6,315,195 | 242,712,922 | ||||||||||||
Other Financial Instruments(a): | ||||||||||||||||
Assets: | ||||||||||||||||
Inflation (CPI) Swaps | – 0 | – | 60,814 | – 0 | – | 60,814 | ||||||||||
Interest Rate Swaps | – 0 | – | 400,592 | – 0 | – | 400,592 | ||||||||||
Liabilities: | ||||||||||||||||
Centrally Cleared Interest Rate Swaps | – 0 | – | (7,410 | ) | – 0 | – | (7,410 | )(b) | ||||||||
|
|
|
|
|
|
|
| |||||||||
Total(c) | $ | 1,253,158 | $ | 235,598,565 | $ | 6,315,195 | $ | 243,166,918 | ||||||||
|
|
|
|
|
|
|
| |||||||||
| (a) | Other financial instruments are derivative instruments, such as futures, forwards and swaps, which are valued at the unrealized appreciation/depreciation on the instrument. |
| (b) | Only variation margin receivable/payable at period end is reported within the statement of assets and liabilities. This amount reflects cumulative appreciation/(depreciation) of exchange-traded derivatives as reported in the portfolio of investments. |
| (c) | There were no transfers between any levels during the reporting period. |
| (d) | There were no transfers between Level 1 and Level 2 during the reporting period. |
The Portfolios recognize all transfers between levels of the fair value hierarchy assuming the financial instruments were transferred at the beginning of the reporting period.
| 122 | • AB MUNICIPAL INCOME FUND II |
Notes to Financial Statements
The following is a reconciliation of investments in which significant unobservable inputs (Level 3) were used in determining fair value.
AB Arizona Portfolio | Long-Term Municipal Bonds | Total | ||||||
Balance as of 5/31/15 | $ | 9,205,348 | $ | 9,205,348 | ||||
Accrued discounts/(premiums) | 3,692 | 3,692 | ||||||
Realized gain (loss) | 27,015 | 27,015 | ||||||
Change in unrealized appreciation/depreciation | 103,111 | 103,111 | ||||||
Purchases | 720,432 | 720,432 | ||||||
Sales | (3,045,000 | ) | (3,045,000 | ) | ||||
Transfers in to Level 3 | – 0 | – | – 0 | – | ||||
Transfers out of Level 3 | – 0 | – | – 0 | – | ||||
|
|
|
| |||||
Balance as of 5/31/16 | $ | 7,014,598 | $ | 7,014,598 | ||||
|
|
|
| |||||
Net change in unrealized appreciation/depreciation from investments held as of 5/31/16(a) | $ | 129,433 | $ | 129,433 | ||||
|
|
|
| |||||
AB Massachusetts Portfolio | Long-Term Municipal Bonds | Total | ||||||
Balance as of 5/31/15 | $ | 9,074,551 | $ | 9,074,551 | ||||
Accrued discounts/(premiums) | (801 | ) | (801 | ) | ||||
Realized gain (loss) | 318,886 | 318,886 | ||||||
Change in unrealized appreciation/depreciation | (281,677 | ) | (281,677 | ) | ||||
Purchases | 997,250 | 997,250 | ||||||
Sales | (8,601,083 | ) | (8,601,083 | ) | ||||
Transfers in to Level 3 | – 0 | –�� | – 0 | – | ||||
Transfers out of Level 3 | – 0 | – | – 0 | – | ||||
|
|
|
| |||||
Balance as of 5/31/16 | $ | 1,507,126 | $ | 1,507,126 | ||||
|
|
|
| |||||
Net change in unrealized appreciation/depreciation from investments held as of 5/31/16(a) | $ | 56,966 | $ | 56,966 | ||||
|
|
|
| |||||
AB Michigan Portfolio | Long-Term Municipal Bonds | Total | ||||||
Balance as of 5/31/15 | $ | 3,469,981 | $ | 3,469,981 | ||||
Accrued discounts/(premiums) | 3,220 | 3,220 | ||||||
Realized gain (loss) | 10,591 | 10,591 | ||||||
Change in unrealized appreciation/depreciation | 62,395 | 62,395 | ||||||
Purchases | 10,365 | 10,365 | ||||||
Sales | (677,000 | ) | (677,000 | ) | ||||
Transfers in to Level 3 | – 0 | – | – 0 | – | ||||
Transfers out of Level 3 | – 0 | – | – 0 | – | ||||
|
|
|
| |||||
Balance as of 5/31/16 | $ | 2,879,552 | $ | 2,879,552 | ||||
|
|
|
| |||||
Net change in unrealized appreciation/depreciation from investments held as of 5/31/16(a) | $ | 15,832 | $ | 15,832 | ||||
|
|
|
| |||||
| AB MUNICIPAL INCOME FUND II • | 123 |
Notes to Financial Statements
AB Minnesota Portfolio | Long-Term Municipal Bonds | Total | ||||||
Balance as of 5/31/15 | $ | 441,495 | $ | 441,495 | ||||
Accrued discounts/(premiums) | (63 | ) | (63 | ) | ||||
Realized gain (loss) | 4,789 | 4,789 | ||||||
Change in unrealized appreciation/depreciation | 204,016 | 204,016 | ||||||
Purchases | 1,519,885 | 1,519,885 | ||||||
Sales | (439,789 | ) | (439,789 | ) | ||||
Transfers in to Level 3 | – 0 | – | – 0 | – | ||||
Transfers out of Level 3 | – 0 | – | – 0 | – | ||||
|
|
|
| |||||
Balance as of 5/31/16 | $ | 1,730,333 | $ | 1,730,333 | ||||
|
|
|
| |||||
Net change in unrealized appreciation/depreciation from investments held as of 5/31/16(a) | $ | 210,511 | $ | 210,511 | ||||
|
|
|
| |||||
AB New Jersey Portfolio | Long-Term Municipal Bonds | Total | ||||||
Balance as of 5/31/15 | $ | 1,781,897 | $ | 1,781,897 | ||||
Accrued discounts/(premiums) | 1,968 | 1,968 | ||||||
Realized gain (loss) | (350,959 | ) | (350,959 | ) | ||||
Change in unrealized appreciation/depreciation | 122,696 | 122,696 | ||||||
Purchases | 318,562 | 318,562 | ||||||
Sales | (1,513,704 | ) | (1,513,704 | ) | ||||
Transfers in to Level 3 | – 0 | – | – 0 | – | ||||
Transfers out of Level 3 | – 0 | – | – 0 | – | ||||
|
|
|
| |||||
Balance as of 5/31/16 | $ | 360,460 | $ | 360,460 | ||||
|
|
|
| |||||
Net change in unrealized appreciation/depreciation from investments held as of 5/31/16(a) | $ | 60,741 | $ | 60,741 | ||||
|
|
|
| |||||
AB Ohio Portfolio | Long-Term Municipal Bonds | Total | ||||||
Balance as of 5/31/15 | $ | 4,327,479 | $ | 4,327,479 | ||||
Accrued discounts/(premiums) | (225 | ) | (225 | ) | ||||
Realized gain (loss) | (369,227 | ) | (369,227 | ) | ||||
Change in unrealized appreciation/depreciation | 315,128 | 315,128 | ||||||
Purchases | 704,721 | 704,721 | ||||||
Sales | (2,785,694 | ) | (2,785,694 | ) | ||||
Transfers in to Level 3 | – 0 | – | – 0 | – | ||||
Transfers out of Level 3 | – 0 | – | – 0 | – | ||||
|
|
|
| |||||
Balance as of 5/31/16 | $ | 2,192,182 | $ | 2,192,182 | ||||
|
|
|
| |||||
Net change in unrealized appreciation/depreciation from investments held as of 5/31/16(a) | $ | 114,881 | $ | 114,881 | ||||
|
|
|
| |||||
| 124 | • AB MUNICIPAL INCOME FUND II |
Notes to Financial Statements
AB Pennsylvania Portfolio | Long-Term Municipal Bonds | Total | ||||||
Balance as of 5/31/15 | $ | 2,333,445 | $ | 2,333,445 | ||||
Accrued discounts/(premiums) | 3,507 | 3,507 | ||||||
Realized gain (loss) | 13,819 | 13,819 | ||||||
Change in unrealized appreciation/depreciation | 98,676 | 98,676 | ||||||
Purchases | 1,059,746 | 1,059,746 | ||||||
Sales | (1,477,007 | ) | (1,477,007 | ) | ||||
Transfers in to Level 3 | 846,110 | 846,110 | ||||||
Transfers out of Level 3 | – 0 | – | – 0 | – | ||||
|
|
|
| |||||
Balance as of 5/31/16 | $ | 2,878,296 | $ | 2,878,296 | (b) | |||
|
|
|
| |||||
Net change in unrealized appreciation/depreciation from investments held as of 5/31/16(a) | $ | 1,891 | $ | 1,891 | ||||
|
|
|
| |||||
AB Virginia Portfolio | Long-Term Municipal Bonds | Total | ||||||
Balance as of 5/31/15 | $ | 5,732,691 | $ | 5,732,691 | ||||
Accrued discounts/(premiums) | (2,411 | ) | (2,411 | ) | ||||
Realized gain (loss) | 40,772 | 40,772 | ||||||
Change in unrealized appreciation/depreciation | 179,701 | 179,701 | ||||||
Purchases | 1,770,460 | 1,770,460 | ||||||
Sales | (1,406,018 | ) | (1,406,018 | ) | ||||
Transfers in to Level 3 | – 0 | – | – 0 | – | ||||
Transfers out of Level 3 | – 0 | – | – 0 | – | ||||
|
|
|
| |||||
Balance as of 5/31/16 | $ | 6,315,195 | $ | 6,315,195 | ||||
|
|
|
| |||||
Net change in unrealized appreciation/depreciation from investments held as of 5/31/16(a) | $ | 238,932 | $ | 238,932 | ||||
|
|
|
| |||||
| (a) | The unrealized appreciation/depreciation is included in net change in unrealized appreciation/depreciation on investments and other financial instruments in the accompanying statement of operations. |
| (b) | There were de minimis transfers under 1% of net assets during the reporting period. |
As of May 31, 2016, all Level 3 securities were priced by third party vendors.
The Adviser established the Committee to oversee the pricing and valuation of all securities held in the Portfolio. The Committee operates under pricing and valuation policies and procedures established by the Adviser and approved by the Board, including pricing policies which set forth the mechanisms and processes to be employed on a daily basis to implement these policies and procedures. In particular, the pricing policies describe how to determine market quotations for securities and other instruments. The Committee’s responsibilities include: 1) fair value and liquidity determinations (and oversight of any third parties to whom any responsibility for fair value and liquidity determinations is delegated), and 2) regular monitoring of the Adviser’s pricing and valuation policies and procedures and modification or enhancement of these policies and procedures (or recommendation of the modification of these policies and procedures) as the Committee believes appropriate.
| AB MUNICIPAL INCOME FUND II • | 125 |
Notes to Financial Statements
The Committee is also responsible for monitoring the implementation of the pricing policies by the Adviser’s Pricing Group (the “Pricing Group”) and a third party which performs certain pricing functions in accordance with the pricing policies. The Pricing Group is responsible for the oversight of the third party on a day-to-day basis. The Committee and the Pricing Group perform a series of activities to provide reasonable assurance of the accuracy of prices including: 1) periodic vendor due diligence meetings, review of methodologies, new developments and processes at vendors, 2) daily comparison of security valuation versus prior day for all securities that exceeded established thresholds, and 3) daily review of unpriced, stale, and variance reports with exceptions reviewed by senior management and the Committee.
In addition, several processes outside of the pricing process are used to monitor valuation issues including: 1) performance and performance attribution reports are monitored for anomalous impacts based upon benchmark performance, and 2) portfolio managers review all portfolios for performance and analytics (which are generated using the Adviser’s prices).
3. Taxes
It is each Portfolio’s policy to meet the requirements of the Internal Revenue Code applicable to regulated investment companies and to distribute all of its investment company taxable income and net realized gains, if any, to shareholders. Therefore, no provisions for federal income or excise taxes are required.
In accordance with U.S. GAAP requirements regarding accounting for uncertainties in income taxes, management has analyzed the Portfolios’ tax positions taken or expected to be taken on federal and state income tax returns for all open tax years (the current and the prior three tax years) and has concluded that no provision for income tax is required in the Portfolios’ financial statements.
4. Investment Income and Investment Transactions
Dividend income is recorded on the ex-dividend date or as soon as the portfolio is informed of the dividend. Interest income is accrued daily. Investment transactions are accounted for on the date the securities are purchased or sold. Each Portfolio may buy and sell securities from other affiliated funds in accordance with the requirements of Rule 17a-7 of the Investment Company Act of 1940. Each Portfolio has adopted procedures to ensure that all such transactions are done in accordance with the requirements of Rule 17a-7. Investment gains and losses are determined on the identified cost basis. The Portfolios amortize premiums and accrete original issue discount and market discount as adjustments to interest income.
5. Class Allocations
All income earned and expenses incurred by the Portfolios are borne on a pro-rata basis by each settled class of shares, based on the proportionate interest in each Portfolio represented by the net assets of such class, except for class specific expenses which are allocated to the respective class. Expenses of the Fund are
| 126 | • AB MUNICIPAL INCOME FUND II |
Notes to Financial Statements
charged proportionately to each Portfolio or based on other appropriate methods. Realized and unrealized gains and losses are allocated among the various share classes based on respective net assets.
6. Dividends and Distributions
Dividends and distributions to shareholders, if any, are recorded on the ex-dividend date. Income dividends and capital gains distributions are determined in accordance with federal tax regulations and may differ from those determined in accordance with U.S. GAAP. To the extent these differences are permanent, such amounts are reclassified within the capital accounts based on their federal tax basis treatment; temporary differences do not require such reclassification.
7. Change of Fiscal Year End
In 2015, the Fund changed its fiscal year end from September 30 to May 31. For the fiscal year ended May 31, 2015, the statement of changes in net assets and financial highlights reflect the period from October 1, 2014 to May 31, 2015.
NOTE B
Advisory Fee and Other Transactions with Affiliates
Under the terms of the investment advisory agreement, each Portfolio pays the Adviser an advisory fee at an annual rate of .45% of the first $2.5 billion, .40% of the next $2.5 billion and .35% in excess of $5 billion, of each Portfolio’s average daily net assets. Such fee is accrued daily and paid monthly.
The Adviser has agreed to waive its fees and bear certain expenses to the extent necessary to limit the total portfolio operating expenses as a percentage of daily average net assets on an annual basis (the “Expense Caps”) as follows:
| Effective February 1, 2013 to January 29, 2015 | ||||||||||||
| Portfolio | Class A | Class B | Class C | |||||||||
AB Arizona | .78% | 1.48% | 1.48% | |||||||||
AB Massachusetts | .82% | 1.52% | 1.52% | |||||||||
AB Michigan | .90% | 1.60% | 1.60% | |||||||||
AB Minnesota | .90% | 1.60% | 1.60% | |||||||||
AB New Jersey | .87% | 1.57% | 1.57% | |||||||||
AB Ohio | .85% | 1.55% | 1.55% | |||||||||
AB Pennsylvania | .90% | 1.60% | 1.60% | |||||||||
AB Virginia | .80% | 1.50% | 1.50% | |||||||||
| Effective January 30, 2015 | ||||||||||||
| Portfolio | Class A | Class B | Class C | |||||||||
AB Arizona | .78% | 1.53% | 1.53% | |||||||||
AB Massachusetts | .77% | 1.52% | 1.52% | |||||||||
AB Michigan | .85% | 1.60% | 1.60% | |||||||||
AB Minnesota | .85% | 1.60% | 1.60% | |||||||||
AB New Jersey | .82% | 1.57% | 1.57% | |||||||||
AB Ohio | .80% | 1.55% | 1.55% | |||||||||
AB Pennsylvania | .85% | 1.60% | 1.60% | |||||||||
AB Virginia | .80% | 1.55% | 1.55% | |||||||||
| AB MUNICIPAL INCOME FUND II • | 127 |
Notes to Financial Statements
The Expense Caps will extend through September 30, 2016 and then may be extended by the Adviser for additional one year terms. For the year ended May 31, 2016, such reimbursements/waivers amounted to $224,707, $242,995, $214,965, $188,417, $190,777, $216,976, $178,243 and $169,536 for AB Arizona Portfolio, AB Massachusetts Portfolio, AB Michigan Portfolio, AB Minnesota Portfolio, AB New Jersey Portfolio, AB Ohio Portfolio, AB Pennsylvania Portfolio and AB Virginia Portfolios, respectively.
Pursuant to the investment advisory agreement, each Portfolio may reimburse the Adviser for certain legal and accounting services provided to each Portfolio by the Adviser. For the year ended May 31, 2016, the reimbursement for such services amounted to $53,226, $51,402, $53,226, $51,402, $51,402, $51,402, $53,226 and $53,226 for AB Arizona Portfolio, AB Massachusetts Portfolio, AB Michigan Portfolio, AB Minnesota Portfolio, AB New Jersey Portfolio, AB Ohio Portfolio, AB Pennsylvania Portfolio and AB Virginia Portfolios, respectively.
The Portfolios compensate AllianceBernstein Investor Services, Inc. (“ABIS”), a wholly-owned subsidiary of the Adviser, under a Transfer Agency Agreement for providing personnel and facilities to perform transfer agency services for the Portfolios. ABIS may make payments to intermediaries that provide omnibus account services, sub-accounting services and/or networking services. For the year ended May 31, 2016, such compensation retained by ABIS amounted to: $18,297, $32,405, $18,158, $18,090, $21,254, $19,198, $19,866 and $29,088 for AB Arizona Portfolio, AB Massachusetts Portfolio, AB Michigan Portfolio, AB Minnesota Portfolio, AB New Jersey Portfolio, AB Ohio Portfolio, AB Pennsylvania Portfolio and AB Virginia Portfolio, respectively.
AllianceBernstein Investments, Inc. (the “Distributor”), a wholly-owned subsidiary of the Adviser, serves as the distributor of the Portfolios’ shares. The Distributor has advised the Portfolios that it has retained front-end sales charges from the sale of Class A shares and received contingent deferred sales charges imposed upon redemptions by shareholders of Class A, Class B and Class C shares for each Portfolio for the year ended May 31, 2016 as follows:
| Front-End Sales Charges | Contingent Deferred Sales Charges | |||||||||||||||
| Portfolio | Class A | Class A | Class B | Class C | ||||||||||||
AB Arizona | $ | – 0 | – | $ | 500 | $ | – 0 | – | $ | 2,187 | ||||||
AB Massachusetts | 55 | 3,611 | – 0 | – | 2,099 | |||||||||||
AB Michigan | 122 | – 0 | – | – 0 | – | 1,214 | ||||||||||
AB Minnesota | 21 | – 0 | – | – 0 | – | 524 | ||||||||||
AB New Jersey | 71 | 820 | – 0 | – | 769 | |||||||||||
AB Ohio | 51 | – 0 | – | – 0 | – | 1,391 | ||||||||||
AB Pennsylvania | 126 | – 0 | – | – 0 | – | 326 | ||||||||||
AB Virginia | 50 | 60 | 66 | 2,037 | ||||||||||||
| 128 | • AB MUNICIPAL INCOME FUND II |
Notes to Financial Statements
The Portfolios may invest in the AB Fixed-Income Shares, Inc. – Government STIF Portfolio (“Government STIF Portfolio”), an open-end management investment company managed by the Adviser. The Government STIF Portfolio is offered as a cash management option to mutual funds and other institutional accounts of the Adviser, and is not currently available for direct purchase by members of the public. The Government STIF Portfolio currently pays no investment management fees but does bear its own expenses. A summary of the Portfolios’ transactions in shares of the Government STIF Portfolio for the year ended May 31, 2016 is as follows:
| Portfolio | Market Value May 31, 2015 (000) | Purchases at Cost (000) | Sales Proceeds (000) | Market Value May 31, 2016 (000) | Dividend Income (000) | |||||||||||||||
AB Arizona Portfolio | $ | – 0 | – | $ | 27,159 | $ | 23,934 | $ | 3,225 | $ | 7 | |||||||||
AB Massachusetts Portfolio | 1,092 | 31,551 | 29,378 | 3,265 | 3 | |||||||||||||||
AB Michigan Portfolio | 2,034 | 9,720 | 11,440 | 314 | 2 | |||||||||||||||
AB Minnesota Portfolio | 2,701 | 5,986 | 6,984 | 1,703 | 2 | |||||||||||||||
AB New Jersey Portfolio | 1,022 | 12,642 | 13,215 | 449 | 3 | |||||||||||||||
AB Ohio Portfolio | 1,125 | 28,038 | 28,534 | 629 | 4 | |||||||||||||||
AB Pennsylvania Portfolio | 1,263 | 18,741 | 20,004 | – 0 | – | 4 | ||||||||||||||
AB Virginia Portfolio | 4,948 | 26,004 | 29,699 | 1,253 | 4 | |||||||||||||||
NOTE C
Distribution Services Agreement
The Portfolios have adopted a Distribution Services Agreement (the “Agreement”) pursuant to Rule 12b-1 under the Investment Company Act of 1940. Under the Agreement, the Portfolios pay distribution and servicing fees to the Distributor at an annual rate of up to .30% of the Portfolios’ average daily net assets attributable to class A shares and 1% of the Portfolios’ average daily net assets attributable to both Class B and Class C shares. Effective January 30, 2015, payments under the Agreement in respect of Class A shares are limited to an annual rate of .25% of Class A shares’ average daily net assets. The fees are accrued daily and paid monthly. The Agreement provides that the Distributor will use such payments in their entirety for distribution assistance and promotional activities. Since the commencement of the Portfolios’ operations, the distributor has incurred expenses in excess of the distribution costs reimbursed by each Portfolio as follows:
| Portfolio | Class B | Class C | ||||||
AB Arizona | $ | 3,378,348 | $ | 2,220,389 | ||||
AB Massachusetts | 3,328,902 | 3,996,284 | ||||||
AB Michigan | 3,152,080 | 4,559,491 | ||||||
AB Minnesota | 2,639,021 | 2,845,734 | ||||||
AB New Jersey | 5,237,345 | 3,774,946 | ||||||
AB Ohio | 4,271,108 | 4,042,366 | ||||||
AB Pennsylvania | 3,519,150 | 3,568,440 | ||||||
AB Virginia | 3,534,971 | 3,372,356 | ||||||
| AB MUNICIPAL INCOME FUND II • | 129 |
Notes to Financial Statements
While such costs may be recovered from the Portfolios in future periods so long as the Agreement is in effect, the rate of the distribution and servicing fees payable under the Agreement may not be increased without a shareholder vote. In accordance with the Agreement, there is no provision for recovery of unreimbursed distribution costs incurred by the Distributor beyond the current fiscal year for Class A shares. The Agreement also provides that the Adviser may use its own resources to finance the distribution of the Portfolios’ shares.
NOTE D
Investment Transactions
Purchases and sales of investment securities (excluding short-term investments) for the year ended May 31, 2016, were as follows:
| Portfolio | Purchases | Sales | ||||||
AB Arizona | $ | 14,153,592 | $ | 22,459,416 | ||||
AB Massachusetts | 36,178,270 | 43,514,577 | ||||||
AB Michigan | 7,393,279 | 6,781,222 | ||||||
AB Minnesota | 7,924,064 | 13,943,528 | ||||||
AB New Jersey | 16,437,680 | 20,147,461 | ||||||
AB Ohio | 14,995,225 | 17,461,030 | ||||||
AB Pennsylvania | 10,648,990 | 14,239,626 | ||||||
AB Virginia | 24,013,159 | 16,688,801 | ||||||
There were no purchases or sales of U.S. government and government agency obligations for the year ended May 31, 2016.
The cost of investments for federal income tax purposes, gross unrealized appreciation and unrealized depreciation (excluding swap transactions) are as follows:
| Gross Unrealized | Net Unrealized Appreciation | |||||||||||||||
Portfolio | Cost | Appreciation | (Depreciation) | |||||||||||||
AB Arizona | $ | 122,415,293 | $ | 8,237,650 | $ | (37,799 | ) | $ | 8,199,851 | |||||||
AB Massachusetts | 220,659,354 | 19,313,512 | (86,331 | ) | 19,227,181 | |||||||||||
AB Michigan | 52,653,333 | 3,449,083 | (19,191 | ) | 3,429,892 | |||||||||||
AB Minnesota | 76,865,047 | 5,569,431 | (28,617 | ) | 5,540,814 | |||||||||||
AB New Jersey | 105,658,865 | 10,496,323 | (32,129 | ) | 10,464,194 | |||||||||||
AB Ohio | 106,123,470 | 8,134,297 | (23,593 | ) | 8,110,704 | |||||||||||
AB Pennsylvania | 89,022,149 | 8,270,921 | (200,894 | ) | 8,070,027 | |||||||||||
AB Virginia | 223,713,283 | 19,046,824 | (47,185 | ) | 18,999,639 | |||||||||||
1. Derivative Financial Instruments
Each Portfolio may use derivatives in an effort to earn income and enhance returns, to replace more traditional direct investments, to obtain exposure to otherwise inaccessible markets (collectively, “investment purposes”), or to hedge or adjust the risk profile of its portfolio.
| 130 | • AB MUNICIPAL INCOME FUND II |
Notes to Financial Statements
The principal types of derivatives utilized by the Portfolios, as well as the methods in which they may be used are:
| • | Swaps |
Each Portfolio may enter into swaps to hedge their exposure to interest rates or credit risk. A swap is an agreement that obligates two parties to exchange a series of cash flows at specified intervals based upon or calculated by reference to changes in specified prices or rates for a specified amount of an underlying asset. The payment flows are usually netted against each other, with the difference being paid by one party to the other. In addition, collateral may be pledged or received by the Portfolio in accordance with the terms of the respective swaps to provide value and recourse to the Portfolio or its counterparties in the event of default, bankruptcy or insolvency by one of the parties to the swap.
Risks may arise as a result of the failure of the counterparty to the swap to comply with the terms of the swap. The loss incurred by the failure of a counterparty is generally limited to the net interim payment to be received by the Portfolio, and/or the termination value at the end of the contract. Therefore, the Portfolio considers the creditworthiness of each counterparty to a swap in evaluating potential counterparty risk. This risk is mitigated by having a netting arrangement between the Portfolio and the counterparty and by the posting of collateral by the counterparty to the Portfolio to cover the Portfolio’s exposure to the counterparty. Additionally, risks may arise from unanticipated movements in interest rates or in the value of the underlying securities. The Portfolio accrues for the interim payments on swaps on a daily basis, with the net amount recorded within unrealized appreciation/depreciation of swaps on the statement of assets and liabilities, where applicable. Once the interim payments are settled in cash, the net amount is recorded as realized gain/(loss) on swaps on the statement of operations, in addition to any realized gain/(loss) recorded upon the termination of swaps. Upfront premiums paid or received are recognized at cost or proceeds on the statement of assets and liabilities and are amortized on a straight line basis over the life of the contract. Amortized upfront premiums are included in the net realized gain/(loss) from swaps on the statement of operations. Fluctuations in the value of swaps are recorded as a component of net change in unrealized appreciation/depreciation of swaps on the statement of operations.
Certain standardized swaps, including certain interest rate swaps and credit default swaps, are (or soon will be) subject to mandatory central clearing. Cleared swaps are transacted through futures commission merchants (“FCMs”) that are members of central clearinghouses, with the clearinghouse serving as central counterparty, similar to transactions in futures contracts. Centralized clearing will be required for additional
| AB MUNICIPAL INCOME FUND II • | 131 |
Notes to Financial Statements
categories of swaps on a phased-in basis based on requirements published by the Securities and Exchange Commission and Commodity Futures Trading Commission.
At the time the Portfolio enters into a centrally cleared swap, the Portfolio deposits and maintains as collateral an initial margin with the broker, as required by the clearinghouse on which the transaction is effected. Such amount is shown as cash collateral due from broker on the statement of assets and liabilities. Pursuant to the contract, the Portfolio agrees to receive from or pay to the broker an amount of cash equal to the daily fluctuation in the value of the contract. Such receipts or payments are known as variation margin and are recorded by the Portfolio as unrealized gains or losses. Risks may arise from the potential inability of a counterparty to meet the terms of the contract. The credit/counterparty risk for centrally cleared swaps is generally less than non-centrally cleared swaps, since the clearinghouse, which is the issuer or counterparty to each centrally cleared swap, has robust risk mitigation standards, including the requirement to provide initial and variation margin. When the contract is closed, the Portfolio records a realized gain or loss equal to the difference between the value of the contract at the time it was opened and the time it was closed.
Interest Rate Swaps:
Each Portfolio is subject to interest rate risk exposure in the normal course of pursuing its investment objectives. Because the Portfolio holds fixed rate bonds, the value of these bonds may decrease if interest rates rise. To help hedge against this risk and to maintain its ability to generate income at prevailing market rates, the Portfolio may enter into interest rate swaps. Interest rate swaps are agreements between two parties to exchange cash flows based on a notional amount. The Portfolio may elect to pay a fixed rate and receive a floating rate, or, receive a fixed rate and pay a floating rate on a notional amount.
In addition, each Portfolio may also enter into interest rate swap transactions to preserve a return or spread on a particular investment or portion of its portfolio, or protecting against an increase in the price of securities the Portfolio anticipates purchasing at a later date. Interest rate swaps involve the exchange by a Portfolio with another party of their respective commitments to pay or receive interest (e.g., an exchange of floating rate payments for fixed rate payments) computed based on a contractually-based principal (or “notional”) amount. Interest rate swaps are entered into on a net basis (i.e., the two payment streams are netted out, with the Portfolio receiving or paying, as the case may be, only the net amount of the two payments).
During the year ended May 31, 2016, the Portfolios held interest rate swaps for hedging purposes.
| 132 | • AB MUNICIPAL INCOME FUND II |
Notes to Financial Statements
Inflation (CPI) Swaps:
Inflation swap agreements are contracts in which one party agrees to pay the cumulative percentage increase in a price index (the Consumer Price Index with respect to CPI swaps) over the term of the swap (with some lag on the inflation index), and the other pays a compounded fixed rate. Inflation swaps may be used to protect the net asset value, or NAV, of a Portfolio against an unexpected change in the rate of inflation measured by an inflation index since the value of these agreements is expected to increase if unexpected inflation increases.
During the year ended May 31, 2016, the Portfolios held inflation (CPI) swaps for hedging purposes.
The Portfolios typically enter into International Swaps and Derivatives Association, Inc. Master Agreements (“ISDA Master Agreement”) or similar master agreements (collectively, “Master Agreements”) with its derivative contract counterparties in order to, among other things, reduce its credit risk to counterparties. ISDA Master Agreements include provisions for general obligations, representations, collateral and events of default or termination. Under an ISDA Master Agreement, the Portfolios typically may offset with the counterparty certain derivative financial instrument’s payables and/or receivables with collateral held and/or posted and create one single net payment (close-out netting) in the event of default or termination.
Various Master Agreements govern the terms of certain transactions with counterparties, including transactions such as derivative transactions, repurchase and reverse repurchase agreements. These Master Agreements typically attempt to reduce the counterparty risk associated with such transactions by specifying credit protection mechanisms and providing standardization that improves legal certainty. Cross-termination provisions under Master Agreements typically provide that a default in connection with one transaction between the Portfolio and a counterparty gives the non-defaulting party the right to terminate any other transactions in place with the defaulting party to create one single net payment due to/due from the defaulting party. In the event of a default by a Master Agreements counterparty, the return of collateral with market value in excess of the Portfolio’s net liability, held by the defaulting party, may be delayed or denied.
The Portfolio’s Master Agreements may contain provisions for early termination of OTC derivative transactions in the event the net assets of the Portfolio decline below specific levels (“net asset contingent features”). If these levels are triggered, the Portfolio’s counterparty has the right to terminate such transaction and require the Portfolio to pay or receive a settlement amount in connection with the terminated transaction. For additional details, please refer to netting arrangements by counterparty tables below.
| AB MUNICIPAL INCOME FUND II • | 133 |
Notes to Financial Statements
At May 31, 2016, the Portfolios had entered into the following derivatives:
| AB Arizona Portfolio | ||||||||||||
Asset Derivatives | Liability Derivatives | |||||||||||
| Derivative Type | Statement of Assets and Liabilities Location | Fair Value | Statement of Assets and Liabilities Location | Fair Value | ||||||||
Interest rate contracts | Receivable/Payable for variation margin on exchange-traded derivatives | $ | 4,895 | * | ||||||||
Interest rate contracts | Unrealized appreciation on inflation swaps | $ | 33,904 | |||||||||
|
|
|
| |||||||||
Total | $ | 33,904 | $ | 4,895 | ||||||||
|
|
|
| |||||||||
| * | Only variation margin receivable/payable at period end is reported within the statement of assets and liabilities. This amount reflects cumulative appreciation/(depreciation) of exchange-traded derivatives as reported in the portfolio of investments. |
Derivative Type | Location of | Realized Gain or (Loss) on Derivatives | Change in Unrealized Appreciation or (Depreciation) | |||||||
Interest rate contracts | Net realized gain (loss) on swaps; Net change in unrealized appreciation/depreciation of swaps | $ | 2,554 | $ | 29,009 | |||||
|
|
|
| |||||||
Total | $ | 2,554 | $ | 29,009 | ||||||
|
|
|
| |||||||
| AB Massachusetts Portfolio | ||||||||||
Asset Derivatives | Liability Derivatives | |||||||||
| Derivative Type | Statement of Assets and Liabilities Location | Fair Value | Statement of Assets and Liabilities Location | Fair Value | ||||||
Interest rate contracts | Receivable/Payable for variation margin on exchange-traded derivatives | $ | 298,004 | * | ||||||
Interest rate contracts | Unrealized appreciation on interest rate swaps | 457,820 | ||||||||
Interest rate contracts | Unrealized appreciation on inflation swaps | 60,306 | ||||||||
|
| |||||||||
Total | $ | 816,130 | ||||||||
|
| |||||||||
| * | Only variation margin receivable/payable at period end is reported within the statement of assets and liabilities. This amount reflects cumulative appreciation/(depreciation) of exchange-traded derivatives as reported in the portfolio of investments. |
| 134 | • AB MUNICIPAL INCOME FUND II |
Notes to Financial Statements
Derivative Type | Location of | Realized Gain or (Loss) on Derivatives | Change in Unrealized Appreciation or (Depreciation) | |||||||
Interest rate contracts | Net realized gain (loss) on swaps; Net change in unrealized appreciation/depreciation of swaps | $ | 305,145 | $ | 84,143 | |||||
|
|
|
| |||||||
Total | $ | 305,145 | $ | 84,143 | ||||||
|
|
|
| |||||||
| AB Michigan Portfolio | ||||||||||
Asset Derivatives | Liability Derivatives | |||||||||
| Derivative Type | Statement of Assets and Liabilities Location | Fair Value | Statement of Assets and Liabilities Location | Fair Value | ||||||
Interest rate contracts | Receivable/Payable for variation margin on exchange-traded derivatives | $ | 40,637 | * | ||||||
Interest rate contracts | Unrealized appreciation on inflation swaps | 14,816 | ||||||||
|
| |||||||||
Total | $ | 55,453 | ||||||||
|
| |||||||||
| * | Only variation margin receivable/payable at period end is reported within the statement of assets and liabilities. This amount reflects cumulative appreciation/(depreciation) of exchange-traded derivatives as reported in the portfolio of investments. |
Derivative Type | Location of | Realized Gain or (Loss) on Derivatives | Change in Unrealized Appreciation or (Depreciation) | |||||||
Interest rate contracts | Net realized gain (loss) on swaps; Net change in unrealized appreciation/depreciation of swaps | $ | 40,437 | $ | 55,453 | |||||
|
|
|
| |||||||
Total | $ | 40,437 | $ | 55,453 | ||||||
|
|
|
| |||||||
| AB MUNICIPAL INCOME FUND II • | 135 |
Notes to Financial Statements
| AB Minnesota Portfolio | ||||||||||
Asset Derivatives | Liability Derivatives | |||||||||
| Derivative Type | Statement of Assets and Liabilities Location | Fair Value | Statement of Assets and Liabilities Location | Fair Value | ||||||
Interest rate contracts | Receivable/Payable for variation margin on exchange-traded derivatives | $ | 102,991 | * | ||||||
Interest rate contracts | Unrealized appreciation on interest rate swaps | 31,723 | ||||||||
Interest rate contracts | Unrealized appreciation on inflation swaps | 20,391 | ||||||||
|
| |||||||||
Total | $ | 155,105 | ||||||||
|
| |||||||||
| * | Only variation margin receivable/payable at period end is reported within the statement of assets and liabilities. This amount reflects cumulative appreciation/(depreciation) of exchange-traded derivatives as reported in the portfolio of investments. |
Derivative Type | Location of Gain or (Loss) on Derivatives of Operations | Realized Gain or (Loss) on Derivatives | Change in Unrealized Appreciation or (Depreciation) | |||||||
Interest rate contracts | Net realized gain (loss) on swaps; Net change in unrealized appreciation/depreciation of swaps | $ | 141,735 | $ | (15,261 | ) | ||||
|
|
|
| |||||||
Total | $ | 141,735 | $ | (15,261 | ) | |||||
|
|
|
| |||||||
| AB New Jersey Portfolio | ||||||||||
Asset Derivatives | Liability Derivatives | |||||||||
| Derivative Type | Statement of Assets and Liabilities Location | Fair Value | Statement of Assets and Liabilities Location | Fair Value | ||||||
Interest rate contracts | Unrealized appreciation on interest rate swaps | $ | 55,499 | |||||||
Interest rate contracts | Unrealized appreciation on inflation swaps | 29,979 | ||||||||
|
| |||||||||
Total | $ | 85,478 | ||||||||
|
| |||||||||
| 136 | • AB MUNICIPAL INCOME FUND II |
Notes to Financial Statements
Derivative Type | Location of Gain or (Loss) on Derivatives of Operations | Realized Gain or (Loss) on Derivatives | Change in Unrealized Appreciation or (Depreciation) | |||||||||
Interest rate contracts | Net realized gain (loss) on swaps; Net change in unrealized appreciation/depreciation of swaps | $ | 124,700 | $ | (90,741 | ) | ||||||
|
|
|
| |||||||||
Total | $ | 124,700 | $ | (90,741 | ) | |||||||
|
|
|
| |||||||||
| AB Ohio Portfolio | ||||||||||
Asset Derivatives | Liability Derivatives | |||||||||
| Derivative Type | Statement of Assets and Liabilities Location | Fair Value | Statement of Assets and Liabilities Location | Fair Value | ||||||
Interest rate contracts | Unrealized appreciation on interest rate swaps | $ | 32,629 | |||||||
Interest rate contracts | Unrealized appreciation on inflation swaps | 29,805 | ||||||||
|
| |||||||||
Total | $ | 62,434 | ||||||||
|
| |||||||||
Derivative Type | Location of Gain or (Loss) on Derivatives of Operations | Realized Gain or (Loss) on Derivatives | Change in Unrealized Appreciation or (Depreciation) | |||||||||
Interest rate contracts | Net realized gain (loss) on swaps; Net change in unrealized appreciation/depreciation of swaps | $ | 146,705 | $ | (112,799 | ) | ||||||
|
|
|
| |||||||||
Total | $ | 146,705 | $ | (112,799 | ) | |||||||
|
|
|
| |||||||||
| AB MUNICIPAL INCOME FUND II • | 137 |
Notes to Financial Statements
| AB Pennsylvania Portfolio | ||||||||||
Asset Derivatives | Liability Derivatives | |||||||||
| Derivative Type | Statement of Assets and Liabilities Location | Fair Value | Statement of Assets and Liabilities Location | Fair Value | ||||||
Interest rate contracts | Receivable/Payable for variation margin on exchange-traded derivatives | $ | 59,735 | * | ||||||
Interest rate contracts | Unrealized appreciation on inflation swaps | 25,203 | ||||||||
|
| |||||||||
Total | $ | 84,938 | ||||||||
|
| |||||||||
| * | Only variation margin receivable/payable at period end is reported within the statement of assets and liabilities. This amount reflects cumulative appreciation/(depreciation) of exchange-traded derivatives as reported in the portfolio of investments. |
Derivative Type | Location of Gain or (Loss) | Realized Gain or (Loss) on Derivatives | Change in Unrealized Appreciation or (Depreciation) | |||||||
Interest rate contracts | Net realized gain (loss) on swaps; Net change in unrealized appreciation/depreciation of swaps | $ | 22,251 | $ | 84,938 | |||||
|
|
|
| |||||||
Total | $ | 22,251 | $ | 84,938 | ||||||
|
|
|
| |||||||
| AB Virginia Portfolio | ||||||||||||
Asset Derivatives | Liability Derivatives | |||||||||||
| Derivative Type | Statement of Assets and Liabilities Location | Fair Value | Statement of Assets and Liabilities Location | Fair Value | ||||||||
Interest rate contracts | Receivable/Payable for variation margin on exchange-traded derivatives | $ | 7,410 | * | ||||||||
Interest rate contracts | Unrealized appreciation on interest rate swaps | $ | 400,592 | |||||||||
Interest rate contracts | Unrealized appreciation on inflation swaps | 60,814 | ||||||||||
|
|
|
| |||||||||
Total | $ | 461,406 | $ | 7,410 | ||||||||
|
|
|
| |||||||||
| * | Only variation margin receivable/payable at period end is reported within the statement of assets and liabilities. This amount reflects cumulative appreciation/(depreciation) of exchange-traded derivatives as reported in the portfolio of investments. |
| 138 | • AB MUNICIPAL INCOME FUND II |
Notes to Financial Statements
Derivative Type | Location of | Realized Gain or (Loss) on Derivatives | Change in Unrealized Appreciation or (Depreciation) | |||||||
Interest rate contracts | Net realized gain (loss) on swaps; Net change in unrealized appreciation/depreciation of swaps | $ | 266,991 | $ | (186,492 | ) | ||||
|
|
|
| |||||||
Total | $ | 266,991 | $ | (186,492 | ) | |||||
|
|
|
| |||||||
The following tables represent the average monthly volume of the Portfolio’s derivative transactions during the year ended May 31, 2016:
AB Arizona Portfolio | ||||
Inflation Swaps: | ||||
Average notional amount | $ | 2,320,000 | (a) | |
Centrally Cleared Interest Rate Swaps: | ||||
Average notional amount | $ | 7,200,000 | (b) |
| (a) | Positions were open for nine months during the year. |
| (b) | Positions were open for four months during the year. |
AB Massachusetts Portfolio | ||||
Interest Rate Swaps: | ||||
Average notional amount | $ | 8,000,000 | ||
Inflation Swaps: | ||||
Average notional amount | $ | 4,200,000 | (a) | |
Centrally Cleared Interest Rate Swaps: | ||||
Average notional amount | $ | 11,000,000 | (b) |
| (a) | Positions were open for nine months during the year. |
| (b) | Positions were open for six months during the year. |
AB Michigan Portfolio | ||||
Inflation Swaps: | ||||
Average notional amount | $ | 1,000,000 | (a) | |
Centrally Cleared Interest Rate Swaps: | ||||
Average notional amount | $ | 2,041,667 | (b) |
| (a) | Positions were open for nine months during the year. |
| (b) | Positions were open for six months during the year. |
AB Minnesota Portfolio |
| |||
Interest Rate Swaps: | ||||
Average notional amount | $ | 3,500,000 | ||
Inflation Swaps: | ||||
Average notional amount | $ | 1,455,556 | (a) | |
Centrally Cleared Interest Rate Swaps: | ||||
Average notional amount | $ | 5,000,000 | (b) | |
| (a) | Positions were open for nine months during the year. |
| (b) | Positions were open for six months during the year. |
| AB MUNICIPAL INCOME FUND II • | 139 |
Notes to Financial Statements
AB New Jersey Portfolio |
| |||
Interest Rate Swaps: | ||||
Average notional amount | $ | 3,000,000 | ||
Inflation Swaps: | ||||
Average notional amount | $ | 2,066,667 | (a) | |
| (a) | Positions were open for nine months during the year. |
AB Ohio Portfolio | ||||
Interest Rate Swaps: | ||||
Average notional amount | $ | 3,600,000 | ||
Inflation Swaps: | ||||
Average notional amount | $ | 2,033,333 | (a) |
| (a) | Positions were open for nine months during the year. |
AB Pennsylvania Portfolio | ||||
Inflation Swaps: | ||||
Average notional amount | $ | 1,764,444 | (a) | |
Centrally Cleared Interest Rate Swaps: | ||||
Average notional amount | $ | 3,775,000 | (b) |
| (a) | Positions were open for nine months during the year. |
| (b) | Positions were open for six months during the year. |
AB Virginia Portfolio | ||||
Interest Rate Swaps: | ||||
Average notional amount | $ | 7,000,000 | ||
Inflation Swaps: | ||||
Average notional amount | $ | 4,280,000 | (a) | |
Centrally Cleared Interest Rate Swaps: | ||||
Average notional amount | $ | 10,900,000 | (b) |
| (a) | Positions were open for nine months during the year. |
| (b) | Positions were open for four months during the year. |
For financial reporting purposes, the Portfolios do not offset derivative assets and derivative liabilities that are subject to netting arrangements in the statement of assets and liabilities.
| 140 | • AB MUNICIPAL INCOME FUND II |
Notes to Financial Statements
All derivatives held at period end were subject to netting arrangements. The following tables present the Portfolios’ derivative assets and liabilities by counterparty net of amounts available for offset under Master Agreements (“MA”) and net of the related collateral received/ pledged by the Portfolios as of May 31, 2016:
| AB Arizona Portfolio | ||||||||||||||||||||
Counterparty | Derivative Assets Subject to a MA | Derivative Available for Offset | Cash Collateral Received | Security Collateral Received | Net Amount of Derivatives Assets | |||||||||||||||
Exchange-Traded Derivatives: |
| |||||||||||||||||||
Morgan Stanley & Co., LLC** | $ | 6,747 | $ | – 0 | – | $ | – 0 | – | $ | – 0 | – | $ | 6,747 | |||||||
|
|
|
|
|
|
|
|
|
| |||||||||||
Total | $ | 6,747 | $ | – 0 | – | $ | – 0 | – | $ | – 0 | – | $ | 6,747 | |||||||
|
|
|
|
|
|
|
|
|
| |||||||||||
OTC Derivatives: | ||||||||||||||||||||
Citibank, NA | $ | 4,478 | $ | – 0 | – | $ | – 0 | – | $ | – 0 | – | $ | 4,478 | |||||||
Deutsche Bank AG | 29,426 | – 0 | – | – 0 | – | – 0 | – | 29,426 | ||||||||||||
|
|
|
|
|
|
|
|
|
| |||||||||||
Total | $ | 33,904 | $ | – 0 | – | $ | – 0 | – | $ | – 0 | – | $ | 33,904 | ^ | ||||||
|
|
|
|
|
|
|
|
|
| |||||||||||
| ** | Cash has been posted for initial margin requirements for exchange-traded derivatives outstanding at May 31, 2016. |
| ^ | Net amount represents the net receivable/(payable) that would be due from/to the counterparty in the event of default or termination. The net amount from OTC financial derivative instruments can only be netted across transactions governed under the same master agreement with the same counterparty. |
| AB Massachusetts Portfolio | ||||||||||||||||||||
Counterparty | Derivative Assets Subject to a MA | Derivative Available for Offset | Cash Collateral Received | Security Collateral Received* | Net Amount of Derivatives Assets | |||||||||||||||
Exchange-Traded Derivatives: |
| |||||||||||||||||||
Morgan Stanley & Co., LLC** | $ | 11,653 | $ | – 0 | – | $ | – 0 | – | $ | – 0 | – | $ | 11,653 | |||||||
|
|
|
|
|
|
|
|
|
| |||||||||||
Total | $ | 11,653 | $ | – 0 | – | $ | – 0 | – | $ | – 0 | – | $ | 11,653 | |||||||
|
|
|
|
|
|
|
|
|
| |||||||||||
OTC Derivatives: |
| |||||||||||||||||||
Citibank, NA | $ | 465,812 | $ | – 0 | – | $ | – 0 | – | $ | (465,812 | ) | $ | – 0 | – | ||||||
Deutsche Bank AG | 52,314 | – 0 | – | – 0 | – | – 0 | – | 52,314 | ||||||||||||
|
|
|
|
|
|
|
|
|
| |||||||||||
Total | $ | 518,126 | $ | – 0 | – | $ | – 0 | – | $ | (465,812 | ) | $ | 52,314 | ^ | ||||||
|
|
|
|
|
|
|
|
|
| |||||||||||
| * | The actual collateral received/pledged is more than the amount reported due to over-collateralization. |
| ** | Cash has been posted for initial margin requirements for exchange-traded derivatives outstanding at May 31, 2016. |
| ^ | Net amount represents the net receivable/(payable) that would be due from/to the counterparty in the event of default or termination. The net amount from OTC financial derivative instruments can only be netted across transactions governed under the same master agreement with the same counterparty. |
| AB MUNICIPAL INCOME FUND II • | 141 |
Notes to Financial Statements
| AB Michigan Portfolio | ||||||||||||||||||||
Counterparty | Derivative Assets Subject to a MA | Derivative Available for Offset | Cash Collateral Received | Security Collateral Received | Net Amount of Derivatives Assets | |||||||||||||||
Exchange-Traded Derivatives: |
| |||||||||||||||||||
Morgan Stanley & Co., LLC** | $ | 1,589 | $ | – 0 | – | $ | – 0 | – | $ | – 0 | – | $ | 1,589 | |||||||
|
|
|
|
|
|
|
|
|
| |||||||||||
Total | $ | 1,589 | $ | – 0 | – | $ | – 0 | – | $ | – 0 | – | $ | 1,589 | |||||||
|
|
|
|
|
|
|
|
|
| |||||||||||
OTC Derivatives: |
| |||||||||||||||||||
Citibank, NA | $ | 1,737 | $ | – 0 | – | $ | – 0 | – | $ | – 0 | – | $ | 1,737 | |||||||
Deutsche Bank AG | 13,079 | – 0 | – | – 0 | – | – 0 | – | 13,079 | ||||||||||||
|
|
|
|
|
|
|
|
|
| |||||||||||
Total | $ | 14,816 | $ | – 0 | – | $ | – 0 | – | $ | – 0 | – | $ | 14,816 | ^ | ||||||
|
|
|
|
|
|
|
|
|
| |||||||||||
| ** | Cash has been posted for initial margin requirements for exchange-traded derivatives outstanding at May 31, 2016. |
| ^ | Net amount represents the net receivable/(payable) that would be due from/to the counterparty in the event of default or termination. The net amount from OTC financial derivative instruments can only be netted across transactions governed under the same master agreement with the same counterparty. |
| AB Minnesota Portfolio | ||||||||||||||||||||
Counterparty | Derivative Assets Subject to a MA | Derivative Available for Offset | Cash Collateral Received | Security Collateral Received | Net Amount of Derivatives Assets | |||||||||||||||
Exchange-Traded Derivatives: |
| |||||||||||||||||||
Morgan Stanley & Co., LLC** | $ | 4,378 | $ | – 0 | – | $ | – 0 | – | $ | – 0 | – | $ | 4,378 | |||||||
|
|
|
|
|
|
|
|
|
| |||||||||||
Total | $ | 4,378 | $ | – 0 | – | $ | – 0 | – | $ | – 0 | – | $ | 4,378 | |||||||
|
|
|
|
|
|
|
|
|
| |||||||||||
OTC Derivatives: |
| |||||||||||||||||||
Citibank, NA | $ | 2,953 | $ | – 0 | – | $ | – 0 | – | $ | – 0 | – | $ | 2,953 | |||||||
Deutsche Bank AG | 17,438 | – 0 | – | – 0 | – | – 0 | – | 17,438 | ||||||||||||
Merrill Lynch Capital Services, Inc. | 31,723 | – 0 | – | – 0 | – | – 0 | – | 31,723 | ||||||||||||
|
|
|
|
|
|
|
|
|
| |||||||||||
Total | $ | 52,114 | $ | – 0 | – | $ | – 0 | – | $ | – 0 | – | $ | 52,114 | ^ | ||||||
|
|
|
|
|
|
|
|
|
| |||||||||||
| ** | Cash has been posted for initial margin requirements for exchange-traded derivatives outstanding at May 31, 2016. |
| ^ | Net amount represents the net receivable/(payable) that would be due from/to the counterparty in the event of default or termination. The net amount from OTC financial derivative instruments can only be netted across transactions governed under the same master agreement with the same counterparty. |
| 142 | • AB MUNICIPAL INCOME FUND II |
Notes to Financial Statements
| AB New Jersey Portfolio | ||||||||||||||||||||
Counterparty | Derivative Assets Subject to a MA | Derivative Available for Offset | Cash Collateral Received | Security Collateral Received | Net Amount of Derivatives Assets | |||||||||||||||
OTC Derivatives: |
| |||||||||||||||||||
Citibank, NA | $ | 3,822 | $ | – 0 | – | $ | – 0 | – | $ | – 0 | – | $ | 3,822 | |||||||
Deutsche Bank AG | 26,157 | – 0 | – | – 0 | – | – 0 | – | 26,157 | ||||||||||||
Merrill Lynch Capital Services, Inc. | 55,499 | – 0 | – | – 0 | – | – 0 | – | 55,499 | ||||||||||||
|
|
|
|
|
|
|
|
|
| |||||||||||
Total | $ | 85,478 | $ | – 0 | – | $ | – 0 | – | $ | – 0 | – | $ | 85,478 | ^ | ||||||
|
|
|
|
|
|
|
|
|
| |||||||||||
| ^ | Net amount represents the net receivable/(payable) that would be due from/to the counterparty in the event of default or termination. The net amount from OTC financial derivative instruments can only be netted across transactions governed under the same master agreement with the same counterparty. |
| AB Ohio Portfolio | ||||||||||||||||||||
Counterparty | Derivative Assets Subject to a MA | Derivative Available for Offset | Cash Collateral Received | Security Collateral Received | Net Amount of Derivatives Assets | |||||||||||||||
OTC Derivatives: |
| |||||||||||||||||||
Citibank, NA | $ | 3,648 | $ | – 0 | – | $ | – 0 | – | $ | – 0 | – | $ | 3,648 | |||||||
Deutsche Bank AG | 26,157 | – 0 | – | – 0 | – | – 0 | – | 26,157 | ||||||||||||
Merrill Lynch Capital Services, Inc. | 32,629 | – 0 | – | – 0 | – | – 0 | – | 32,629 | ||||||||||||
|
|
|
|
|
|
|
|
|
| |||||||||||
Total | $ | 62,434 | $ | – 0 | – | $ | – 0 | – | $ | – 0 | – | $ | 62,434 | ^ | ||||||
|
|
|
|
|
|
|
|
|
| |||||||||||
| ^ | Net amount represents the net receivable/(payable) that would be due from/to the counterparty in the event of default or termination. The net amount from OTC financial derivative instruments can only be netted across transactions governed under the same master agreement with the same counterparty. |
| AB Pennsylvania Portfolio | ||||||||||||||||||||
Counterparty | Derivative Assets Subject to a MA | Derivative Available for Offset | Cash Collateral Received | Security Collateral Received | Net Amount of Derivatives Assets | |||||||||||||||
Exchange-Traded Derivatives: |
| |||||||||||||||||||
Morgan Stanley & Co., LLC** | $ | 2,537 | $ | – 0 | – | $ | – 0 | – | $ | – 0 | – | $ | 2,537 | |||||||
|
|
|
|
|
|
|
|
|
| |||||||||||
Total | $ | 2,537 | $ | – 0 | – | $ | – 0 | – | $ | – 0 | – | $ | 2,537 | |||||||
|
|
|
|
|
|
|
|
|
| |||||||||||
OTC Derivatives: |
| |||||||||||||||||||
Citibank, NA | $ | 3,405 | $ | – 0 | – | $ | – 0 | – | $ | – 0 | – | $ | 3,405 | |||||||
Deutsche Bank AG | 21,798 | – 0 | – | – 0 | – | – 0 | – | 21,798 | ||||||||||||
|
|
|
|
|
|
|
|
|
| |||||||||||
Total | $ | 25,203 | $ | – 0 | – | $ | – 0 | – | $ | – 0 | – | $ | 25,203 | ^ | ||||||
|
|
|
|
|
|
|
|
|
| |||||||||||
| ** | Cash has been posted for initial margin requirements for exchange-traded derivatives outstanding at May 31, 2016. |
| ^ | Net amount represents the net receivable/(payable) that would be due from/to the counterparty in the event of default or termination. The net amount from OTC financial derivative instruments can only be netted across transactions governed under the same master agreement with the same counterparty. |
| AB MUNICIPAL INCOME FUND II • | 143 |
Notes to Financial Statements
| AB Virginia Portfolio | ||||||||||||||||||||
Counterparty | Derivative Assets Subject to a MA | Derivative Available for Offset | Cash Collateral Received | Security Collateral Received* | Net Amount of Derivatives Assets | |||||||||||||||
Exchange-Traded Derivatives: |
| |||||||||||||||||||
Morgan Stanley & Co., LLC** | $ | 10,214 | $ | – 0 | – | $ | – 0 | – | $ | – 0 | – | $ | 10,214 | |||||||
|
|
|
|
|
|
|
|
|
| |||||||||||
Total | $ | 10,214 | $ | – 0 | – | $ | – 0 | – | $ | – 0 | – | $ | 10,214 | |||||||
|
|
|
|
|
|
|
|
|
| |||||||||||
OTC Derivatives: | ||||||||||||||||||||
Citibank, NA | $ | 409,092 | $ | – 0 | – | $ | – 0 | – | $ | (409,092 | ) | $ | – 0 | – | ||||||
Deutsche Bank AG | 52,314 | – 0 | – | – 0 | – | – 0 | – | 52,314 | ||||||||||||
|
|
|
|
|
|
|
|
|
| |||||||||||
Total | $ | 461,406 | $ | – 0 | – | $ | – 0 | – | $ | (409,092 | ) | $ | 52,314 | ^ | ||||||
|
|
|
|
|
|
|
|
|
| |||||||||||
| * | The actual collateral received/pledged is more than the amount reported due to over-collateralization. |
| ** | Cash has been posted for initial margin requirements for exchange-traded derivatives outstanding at May 31, 2016. |
| ^ | Net amount represents the net receivable/(payable) that would be due from/to the counterparty in the event of default or termination. The net amount from OTC financial derivative instruments can only be netted across transactions governed under the same master agreement with the same counterparty. |
NOTE E
Shares of Beneficial Interest
Transactions in shares of beneficial interest for each Portfolio were as follows:
| AB Arizona Portfolio | ||||||||||||||||||||||||||||
| Shares | Amount | |||||||||||||||||||||||||||
| Year Ended May 31, 2016 | October 1, 2014 to May 31, 2015(a) | Year Ended 2014 | Year Ended May 31, 2016 | October 1, 2014 to May 31, 2015(a) | Year Ended September 30, 2014 | |||||||||||||||||||||||
| ||||||||||||||||||||||||||||
| Class A | ||||||||||||||||||||||||||||
Shares sold | 1,111,356 | 647,396 | 573,931 | $ | 12,471,461 | $ | 7,218,558 | $ | 6,229,413 | |||||||||||||||||||
| ||||||||||||||||||||||||||||
Shares issued in reinvestment of dividends | 163,623 | 122,111 | 197,667 | 1,825,500 | 1,359,112 | 2,145,607 | ||||||||||||||||||||||
| ||||||||||||||||||||||||||||
Shares converted from Class B | 2,331 | 4,224 | 15,273 | 26,014 | 47,479 | 165,251 | ||||||||||||||||||||||
| ||||||||||||||||||||||||||||
Shares redeemed | (1,437,307 | ) | (1,043,816 | ) | (1,976,025 | ) | (16,033,712 | ) | (11,626,423 | ) | (21,313,971 | ) | ||||||||||||||||
| ||||||||||||||||||||||||||||
Net decrease | (159,997 | ) | (270,085 | ) | (1,189,154 | ) | $ | (1,710,737 | ) | $ | (3,001,274 | ) | $ | (12,773,700 | ) | |||||||||||||
| ||||||||||||||||||||||||||||
| Class B | ||||||||||||||||||||||||||||
Shares sold | 54 | 43 | 56 | $ | 600 | $ | 476 | $ | 600 | |||||||||||||||||||
| ||||||||||||||||||||||||||||
Shares issued in reinvestment of dividends | 65 | 122 | 448 | 726 | 1,366 | 4,843 | ||||||||||||||||||||||
| ||||||||||||||||||||||||||||
Shares converted to Class A | (2,335 | ) | (4,232 | ) | (15,291 | ) | (26,014 | ) | (47,479 | ) | (165,251 | ) | ||||||||||||||||
| ||||||||||||||||||||||||||||
Shares redeemed | (1,224 | ) | (7,940 | ) | (7,537 | ) | (13,764 | ) | (88,490 | ) | (80,627 | ) | ||||||||||||||||
| ||||||||||||||||||||||||||||
Net decrease | (3,440 | ) | (12,007 | ) | (22,324 | ) | $ | (38,452 | ) | $ | (134,127 | ) | $ | (240,435 | ) | |||||||||||||
| ||||||||||||||||||||||||||||
| 144 | • AB MUNICIPAL INCOME FUND II |
Notes to Financial Statements
| AB Arizona Portfolio | ||||||||||||||||||||||||||||
| Shares | Amount | |||||||||||||||||||||||||||
| Year Ended May 31, 2016 | October 1, 2014 to May 31, 2015(a) | Year Ended 2014 | Year Ended May 31, 2016 | October 1, 2014 to May 31, 2015(a) | Year Ended September 30, 2014 | |||||||||||||||||||||||
| ||||||||||||||||||||||||||||
| Class C | ||||||||||||||||||||||||||||
Shares sold | 319,230 | 142,728 | 161,530 | $ | 3,578,570 | $ | 1,585,695 | $ | 1,753,211 | |||||||||||||||||||
| ||||||||||||||||||||||||||||
Shares issued in reinvestment of dividends | 34,159 | 25,944 | 43,748 | 380,439 | 288,390 | 473,861 | ||||||||||||||||||||||
| ||||||||||||||||||||||||||||
Shares redeemed | (366,688 | ) | (188,230 | ) | (730,001 | ) | (4,101,594 | ) | (2,096,527 | ) | (7,874,512 | ) | ||||||||||||||||
| ||||||||||||||||||||||||||||
Net decrease | (13,299 | ) | (19,558 | ) | (524,723 | ) | $ | (142,585 | ) | $ | (222,442 | ) | $ | (5,647,440 | ) | |||||||||||||
| ||||||||||||||||||||||||||||
| AB Massachusetts Portfolio | ||||||||||||||||||||||||||||
| Shares | Amount | |||||||||||||||||||||||||||
| Year Ended May 31, 2016 | October 1, May 31, | Year Ended September 30, 2014 | Year Ended May 31, 2016 | October 1, May 31, | Year Ended September 30, 2014 | |||||||||||||||||||||||
|
| |||||||||||||||||||||||||||
| Class A | ||||||||||||||||||||||||||||
Shares sold | 2,549,347 | 1,342,075 | 2,878,225 | $ | 29,351,253 | $ | 15,416,051 | $ | 32,138,616 | |||||||||||||||||||
| ||||||||||||||||||||||||||||
Shares issued in reinvestment of dividends | 277,130 | 192,964 | 316,758 | 3,183,230 | 2,215,346 | 3,549,776 | ||||||||||||||||||||||
| ||||||||||||||||||||||||||||
Shares converted from Class B | 15,871 | 15,518 | 58,212 | 181,212 | 179,235 | 650,814 | ||||||||||||||||||||||
| ||||||||||||||||||||||||||||
Shares redeemed | (3,152,594 | ) | (2,038,286 | ) | (4,457,081 | ) | (36,137,677 | ) | (23,426,821 | ) | (49,734,756 | ) | ||||||||||||||||
| ||||||||||||||||||||||||||||
Net decrease | (310,246 | ) | (487,729 | ) | (1,203,886 | ) | $ | (3,421,982 | ) | $ | (5,616,189 | ) | $ | (13,395,550 | ) | |||||||||||||
| ||||||||||||||||||||||||||||
| Class B | ||||||||||||||||||||||||||||
Shares sold | 1,042 | 139 | 3,156 | $ | 11,951 | $ | 1,601 | $ | 34,700 | |||||||||||||||||||
| ||||||||||||||||||||||||||||
Shares issued in reinvestment of dividends | 427 | 577 | 1,696 | 4,887 | 6,613 | 18,927 | ||||||||||||||||||||||
| ||||||||||||||||||||||||||||
Shares converted to Class A | (15,895 | ) | (15,547 | ) | (58,317 | ) | (181,212 | ) | (179,235 | ) | (650,814 | ) | ||||||||||||||||
| ||||||||||||||||||||||||||||
Shares redeemed | (6,933 | ) | (7,841 | ) | (18,049 | ) | (78,251 | ) | (89,822 | ) | (200,683 | ) | ||||||||||||||||
| ||||||||||||||||||||||||||||
Net decrease | (21,359 | ) | (22,672 | ) | (71,514 | ) | $ | (242,625 | ) | $ | (260,843 | ) | $ | (797,870 | ) | |||||||||||||
| ||||||||||||||||||||||||||||
| Class C | ||||||||||||||||||||||||||||
Shares sold | 431,364 | 222,782 | 259,405 | $ | 4,953,748 | $ | 2,556,531 | $ | 2,896,903 | |||||||||||||||||||
| ||||||||||||||||||||||||||||
Shares issued in reinvestment of dividends | 85,648 | 60,630 | 109,150 | 982,047 | 694,877 | 1,220,343 | ||||||||||||||||||||||
| ||||||||||||||||||||||||||||
Shares redeemed | (534,316 | ) | (335,993 | ) | (1,427,441 | ) | (6,119,857 | ) | (3,847,688 | ) | (15,854,677 | ) | ||||||||||||||||
| ||||||||||||||||||||||||||||
Net decrease | (17,304 | ) | (52,581 | ) | (1,058,886 | ) | $ | (184,062 | ) | $ | (596,280 | ) | $ | (11,737,431 | ) | |||||||||||||
| ||||||||||||||||||||||||||||
| AB MUNICIPAL INCOME FUND II • | 145 |
Notes to Financial Statements
| AB Michigan Portfolio | ||||||||||||||||||||||||||||
| Shares | Amount | |||||||||||||||||||||||||||
Year Ended 2016 | October 1, 2014 to May 31, 2015(a) | Year Ended September 30, 2014 | Year Ended May 31, 2016 | October 1, May 31, | Year Ended September 30, 2014 | |||||||||||||||||||||||
|
| |||||||||||||||||||||||||||
| Class A | ||||||||||||||||||||||||||||
Shares sold | 530,410 | 146,065 | 124,440 | $ | 5,566,328 | $ | 1,533,441 | $ | 1,263,820 | |||||||||||||||||||
| ||||||||||||||||||||||||||||
Shares issued in reinvestment of dividends | 71,191 | 53,270 | 97,411 | 746,157 | 555,963 | 985,982 | ||||||||||||||||||||||
| ||||||||||||||||||||||||||||
Shares converted from Class B | 9,462 | 3,987 | 7,724 | 99,296 | 41,730 | 78,133 | ||||||||||||||||||||||
| ||||||||||||||||||||||||||||
Shares redeemed | (682,720 | ) | (378,663 | ) | (1,340,398 | ) | (7,123,862 | ) | (3,943,368 | ) | (13,490,700 | ) | ||||||||||||||||
| ||||||||||||||||||||||||||||
Net decrease | (71,657 | ) | (175,341 | ) | (1,110,823 | ) | $ | (712,081 | ) | $ | (1,812,234 | ) | $ | (11,162,765 | ) | |||||||||||||
| ||||||||||||||||||||||||||||
| Class B | ||||||||||||||||||||||||||||
Shares sold | 1,290 | 792 | 1,292 | $ | 13,468 | $ | 8,252 | $ | 13,032 | |||||||||||||||||||
| ||||||||||||||||||||||||||||
Shares issued in reinvestment of dividends | 661 | 585 | 1,121 | 6,904 | 6,089 | 11,324 | ||||||||||||||||||||||
| ||||||||||||||||||||||||||||
Shares converted to Class A | (9,481 | ) | (3,994 | ) | (7,739 | ) | (99,296 | ) | (41,730 | ) | (78,133 | ) | ||||||||||||||||
| ||||||||||||||||||||||||||||
Shares redeemed | (3,214 | ) | (583 | ) | (3,414 | ) | (33,239 | ) | (6,027 | ) | (34,204 | ) | ||||||||||||||||
| ||||||||||||||||||||||||||||
Net decrease | (10,744 | ) | (3,200 | ) | (8,740 | ) | $ | (112,163 | ) | $ | (33,416 | ) | $ | (87,981 | ) | |||||||||||||
| ||||||||||||||||||||||||||||
| Class C | ||||||||||||||||||||||||||||
Shares sold | 173,036 | 126,096 | 75,249 | $ | 1,816,157 | $ | 1,314,259 | $ | 755,436 | |||||||||||||||||||
| ||||||||||||||||||||||||||||
Shares issued in reinvestment of dividends | 31,950 | 23,327 | 40,327 | 334,389 | 243,019 | 407,477 | ||||||||||||||||||||||
| ||||||||||||||||||||||||||||
Shares redeemed | (248,505 | ) | (194,088 | ) | (506,596 | ) | (2,599,926 | ) | (2,022,865 | ) | (5,065,573 | ) | ||||||||||||||||
| ||||||||||||||||||||||||||||
Net decrease | (43,519 | ) | (44,665 | ) | (391,020 | ) | $ | (449,380 | ) | $ | (465,587 | ) | $ | (3,902,660 | ) | |||||||||||||
| ||||||||||||||||||||||||||||
| AB Minnesota Portfolio | ||||||||||||||||||||||||||||
| Shares | Amount | |||||||||||||||||||||||||||
| Year Ended May 31, 2016 | October 1, 2014 to May 31, 2015(a) | Year Ended September 30, 2014 | Year Ended May 31, 2016 | October 1, 2014 to May 31, 2015(a) | Year Ended September 30, 2014 | |||||||||||||||||||||||
|
| |||||||||||||||||||||||||||
Class A | ||||||||||||||||||||||||||||
Shares sold | 637,238 | 537,113 | 876,484 | $ | 6,653,214 | $ | 5,626,202 | $ | 8,989,925 | |||||||||||||||||||
| ||||||||||||||||||||||||||||
Shares issued in reinvestment of dividends and distributions | 137,180 | 120,844 | 139,095 | 1,430,968 | 1,264,505 | 1,430,970 | ||||||||||||||||||||||
| ||||||||||||||||||||||||||||
Shares converted from Class B | 202 | 5,634 | 3,393 | 2,093 | 59,103 | 34,544 | ||||||||||||||||||||||
| ||||||||||||||||||||||||||||
Shares redeemed | (1,173,230 | ) | (525,342 | ) | (1,496,713 | ) | (12,192,050 | ) | (5,503,788 | ) | (15,268,596 | ) | ||||||||||||||||
| ||||||||||||||||||||||||||||
Net increase (decrease) | (398,610 | ) | 138,249 | (477,741 | ) | $ | (4,105,775 | ) | $ | 1,446,022 | $ | (4,813,157 | ) | |||||||||||||||
| ||||||||||||||||||||||||||||
| 146 | • AB MUNICIPAL INCOME FUND II |
Notes to Financial Statements
| AB Minnesota Portfolio | ||||||||||||||||||||||||||||
| Shares | Amount | |||||||||||||||||||||||||||
| Year Ended May 31, 2016 | October 1, 2014 to May 31, 2015(a) | Year Ended September 30, 2014 | Year Ended May 31, 2016 | October 1, 2014 to May 31, 2015(a) | Year Ended September 30, 2014 | |||||||||||||||||||||||
|
| |||||||||||||||||||||||||||
Class B | ||||||||||||||||||||||||||||
Shares sold | 29 | 68 | 30 | $ | 300 | $ | 701 | $ | 304 | |||||||||||||||||||
| ||||||||||||||||||||||||||||
Shares issued in reinvestment of dividends and distributions | 62 | 102 | 230 | 635 | 1,063 | 2,363 | ||||||||||||||||||||||
| ||||||||||||||||||||||||||||
Shares converted to Class A | (202 | ) | (5,635 | ) | (3,393 | ) | (2,093 | ) | (59,103 | ) | (34,544 | ) | ||||||||||||||||
| ||||||||||||||||||||||||||||
Shares redeemed | (1,736 | ) | (50 | ) | (800 | ) | (18,291 | ) | (506 | ) | (8,075 | ) | ||||||||||||||||
| ||||||||||||||||||||||||||||
Net decrease | (1,847 | ) | (5,515 | ) | (3,933 | ) | $ | (19,449 | ) | $ | (57,845 | ) | $ | (39,952 | ) | |||||||||||||
| ||||||||||||||||||||||||||||
Class C | ||||||||||||||||||||||||||||
Shares sold | 146,465 | 80,832 | 122,771 | $ | 1,530,483 | $ | 847,690 | $ | 1,262,819 | |||||||||||||||||||
| ||||||||||||||||||||||||||||
Shares issued in reinvestment of dividends and distributions | 26,927 | 24,873 | 29,753 | 281,172 | 260,520 | 306,206 | ||||||||||||||||||||||
| ||||||||||||||||||||||||||||
Shares redeemed | (155,563 | ) | (130,240 | ) | (492,938 | ) | (1,616,635 | ) | (1,365,901 | ) | (5,045,152 | ) | ||||||||||||||||
| ||||||||||||||||||||||||||||
Net increase (decrease) | 17,829 | (24,535 | ) | (340,414 | ) | $ | 195,020 | $ | (257,691 | ) | $ | (3,476,127 | ) | |||||||||||||||
| ||||||||||||||||||||||||||||
| AB New Jersey Portfolio | ||||||||||||||||||||||||||||
| Shares | Amount | |||||||||||||||||||||||||||
| Year Ended May 31, 2016 | October 1, 2014 to May 31, 2015(a) | Year Ended September 30, 2014 | Year Ended May 31, 2016 | October 1, 2014 to May 31, 2015(a) | Year Ended September 30, 2014 | |||||||||||||||||||||||
|
| |||||||||||||||||||||||||||
Class A | ||||||||||||||||||||||||||||
Shares sold | 775,512 | 618,946 | 961,030 | $ | 7,610,479 | $ | 6,067,290 | $ | 9,252,855 | |||||||||||||||||||
| ||||||||||||||||||||||||||||
Shares issued in reinvestment of dividends | 156,060 | 112,022 | 187,608 | 1,524,430 | 1,097,494 | 1,810,822 | ||||||||||||||||||||||
| ||||||||||||||||||||||||||||
Shares converted from Class B | 11,918 | 8,724 | 45,212 | 115,261 | 85,498 | 435,607 | ||||||||||||||||||||||
| ||||||||||||||||||||||||||||
Shares redeemed | (1,511,262 | ) | (1,618,629 | ) | (2,789,281 | ) | (14,716,793 | ) | (15,867,624 | ) | (26,769,741 | ) | ||||||||||||||||
| ||||||||||||||||||||||||||||
Net decrease | (567,772 | ) | (878,937 | ) | (1,595,431 | ) | $ | (5,466,623 | ) | $ | (8,617,342 | ) | $ | (15,270,457 | ) | |||||||||||||
| ||||||||||||||||||||||||||||
Class B | ||||||||||||||||||||||||||||
Shares sold | 1,818 | 316 | 19,808 | $ | 18,042 | $ | 3,100 | $ | 189,258 | |||||||||||||||||||
| ||||||||||||||||||||||||||||
Shares issued in reinvestment of dividends | 804 | 772 | 1,848 | 7,842 | 7,564 | 17,827 | ||||||||||||||||||||||
| ||||||||||||||||||||||||||||
Shares converted to Class A | (11,916 | ) | (8,718 | ) | (45,210 | ) | (115,261 | ) | (85,498 | ) | (435,607 | ) | ||||||||||||||||
| ||||||||||||||||||||||||||||
Shares redeemed | (107 | ) | (2,354 | ) | (31,158 | ) | (1,048 | ) | (23,132 | ) | (299,274 | ) | ||||||||||||||||
| ||||||||||||||||||||||||||||
Net decrease | (9,401 | ) | (9,984 | ) | (54,712 | ) | $ | (90,425 | ) | $ | (97,966 | ) | $ | (527,796 | ) | |||||||||||||
| ||||||||||||||||||||||||||||
| AB MUNICIPAL INCOME FUND II • | 147 |
Notes to Financial Statements
| AB New Jersey Portfolio | ||||||||||||||||||||||||||||
| Shares | Amount | |||||||||||||||||||||||||||
| Year Ended May 31, 2016 | October 1, 2014 to May 31, 2015(a) | Year Ended September 30, 2014 | Year Ended May 31, 2016 | October 1, 2014 to May 31, 2015(a) | Year Ended September 30, 2014 | |||||||||||||||||||||||
|
| |||||||||||||||||||||||||||
| Class C | ||||||||||||||||||||||||||||
Shares sold | 312,531 | 123,244 | 212,766 | $ | 3,057,868 | $ | 1,209,191 | $ | 2,057,122 | |||||||||||||||||||
| ||||||||||||||||||||||||||||
Shares issued in reinvestment of dividends | 52,647 | 36,597 | 63,305 | 514,539 | 358,796 | 611,306 | ||||||||||||||||||||||
| ||||||||||||||||||||||||||||
Shares redeemed | (273,704 | ) | (261,414 | ) | (675,053 | ) | (2,672,826 | ) | (2,568,644 | ) | (6,480,663 | ) | ||||||||||||||||
| ||||||||||||||||||||||||||||
Net increase (decrease) | 91,474 | (101,573 | ) | (398,982 | ) | $ | 899,581 | $ | (1,000,657 | ) | $ | (3,812,235 | ) | |||||||||||||||
| ||||||||||||||||||||||||||||
| AB Ohio Portfolio | ||||||||||||||||||||||||||||
| Shares | Amount | |||||||||||||||||||||||||||
| Year Ended May 31, 2016 | October 1, 2014 to May 31, 2015(a) | Year Ended September 30, 2014 | Year Ended May 31, 2016 | October 1, 2014 to May 31, 2015(a) | Year Ended September 30, 2014 | |||||||||||||||||||||||
|
| |||||||||||||||||||||||||||
| Class A | ||||||||||||||||||||||||||||
Shares sold | 468,458 | 575,276 | 862,908 | $ | 4,693,356 | $ | 5,746,016 | $ | 8,425,806 | |||||||||||||||||||
| ||||||||||||||||||||||||||||
Shares issued in reinvestment of dividends | 159,196 | 114,044 | 207,644 | 1,594,894 | 1,139,027 | 2,034,219 | ||||||||||||||||||||||
| ||||||||||||||||||||||||||||
Shares converted from Class B | 9,541 | 6,587 | 58,886 | 94,895 | 65,865 | 576,380 | ||||||||||||||||||||||
| ||||||||||||||||||||||||||||
Shares redeemed | (833,018 | ) | (751,797 | ) | (2,854,557 | ) | (8,304,852 | ) | (7,513,920 | ) | (27,848,488 | ) | ||||||||||||||||
| ||||||||||||||||||||||||||||
Net decrease | (195,823 | ) | (55,890 | ) | (1,725,119 | ) | $ | (1,921,707 | ) | $ | (563,012 | ) | $ | (16,812,083 | ) | |||||||||||||
| ||||||||||||||||||||||||||||
| Class B | ||||||||||||||||||||||||||||
Shares sold | 421 | 289 | 430 | $ | 4,200 | $ | 2,881 | $ | 4,200 | |||||||||||||||||||
| ||||||||||||||||||||||||||||
Shares issued in reinvestment of dividends | 198 | 284 | 1,236 | 1,975 | 2,839 | 12,065 | ||||||||||||||||||||||
| ||||||||||||||||||||||||||||
Shares converted to Class A | (9,544 | ) | (6,593 | ) | (58,952 | ) | (94,895 | ) | (65,865 | ) | (576,380 | ) | ||||||||||||||||
| ||||||||||||||||||||||||||||
Shares redeemed | (479 | ) | (551 | ) | (4,307 | ) | (4,709 | ) | (5,509 | ) | (41,975 | ) | ||||||||||||||||
| ||||||||||||||||||||||||||||
Net decrease | (9,404 | ) | (6,571 | ) | (61,593 | ) | $ | (93,429 | ) | $ | (65,654 | ) | $ | (602,090 | ) | |||||||||||||
| ||||||||||||||||||||||||||||
| Class C | ||||||||||||||||||||||||||||
Shares sold | 112,921 | 79,745 | 143,044 | $ | 1,131,579 | $ | 795,292 | $ | 1,403,469 | |||||||||||||||||||
| ||||||||||||||||||||||||||||
Shares issued in reinvestment of dividends | 43,429 | 35,516 | 68,062 | 434,544 | 354,642 | 666,213 | ||||||||||||||||||||||
| ||||||||||||||||||||||||||||
Shares redeemed | (504,896 | ) | (277,980 | ) | (919,712 | ) | (5,028,796 | ) | (2,772,112 | ) | (8,965,876 | ) | ||||||||||||||||
| ||||||||||||||||||||||||||||
Net decrease | (348,546 | ) | (162,719 | ) | (708,606 | ) | $ | (3,462,673 | ) | $ | (1,622,178 | ) | $ | (6,896,194 | ) | |||||||||||||
| ||||||||||||||||||||||||||||
| 148 | • AB MUNICIPAL INCOME FUND II |
Notes to Financial Statements
| AB Pennsylvania Portfolio | ||||||||||||||||||||||||||||
| Shares | Amount | |||||||||||||||||||||||||||
| Year Ended May 31, 2016 | October 1, 2014 to May 31, 2015(a) | Year Ended September 30, 2014 | Year Ended May 31, 2016 | October 1, May 31, | Year Ended September 30, 2014 | |||||||||||||||||||||||
|
| |||||||||||||||||||||||||||
| Class A | ||||||||||||||||||||||||||||
Shares sold | 449,263 | 368,086 | 358,028 | $ | 4,713,111 | $ | 3,899,480 | $ | 3,648,627 | |||||||||||||||||||
| ||||||||||||||||||||||||||||
Shares issued in reinvestment of dividends and distributions | 131,927 | 93,267 | 172,726 | 1,391,276 | 981,784 | 1,766,875 | ||||||||||||||||||||||
| ||||||||||||||||||||||||||||
Shares converted from Class B | 6,695 | 13,271 | 47,221 | 70,434 | 139,255 | 486,155 | ||||||||||||||||||||||
| ||||||||||||||||||||||||||||
Shares redeemed | (1,174,378 | ) | (802,666 | ) | (1,401,858 | ) | (12,362,957 | ) | (8,463,673 | ) | (14,261,253 | ) | ||||||||||||||||
| ||||||||||||||||||||||||||||
Net decrease | (586,493 | ) | (328,042 | ) | (823,883 | ) | $ | (6,188,136 | ) | $ | (3,443,154 | ) | $ | (8,359,596 | ) | |||||||||||||
| ||||||||||||||||||||||||||||
| Class B | ||||||||||||||||||||||||||||
Shares sold | 308 | 205 | 759 | $ | 3,240 | $ | 2,160 | $ | 7,696 | |||||||||||||||||||
| ||||||||||||||||||||||||||||
Shares issued in reinvestment of dividends and distributions | 240 | 288 | 1,376 | 2,528 | 3,027 | 14,022 | ||||||||||||||||||||||
| ||||||||||||||||||||||||||||
Shares converted to Class A | (6,695 | ) | (13,271 | ) | (47,224 | ) | (70,434 | ) | (139,255 | ) | (486,155 | ) | ||||||||||||||||
| ||||||||||||||||||||||||||||
Shares redeemed | (3,049 | ) | (3,698 | ) | (11,452 | ) | (32,090 | ) | (38,805 | ) | (116,254 | ) | ||||||||||||||||
| ||||||||||||||||||||||||||||
Net decrease | (9,196 | ) | (16,476 | ) | (56,541 | ) | $ | (96,756 | ) | $ | (172,873 | ) | $ | (580,691 | ) | |||||||||||||
| ||||||||||||||||||||||||||||
| Class C | ||||||||||||||||||||||||||||
Shares sold | 134,345 | 71,133 | 85,052 | $ | 1,418,446 | $ | 749,710 | $ | 872,643 | |||||||||||||||||||
| ||||||||||||||||||||||||||||
Shares issued in reinvestment of dividends and distributions | 34,737 | 24,128 | 47,112 | 366,393 | 254,001 | 481,565 | ||||||||||||||||||||||
| ||||||||||||||||||||||||||||
Shares redeemed | (155,505 | ) | (133,735 | ) | (370,534 | ) | (1,637,527 | ) | (1,409,155 | ) | (3,761,889 | ) | ||||||||||||||||
| ||||||||||||||||||||||||||||
Net increase (decrease) | 13,577 | (38,474 | ) | (238,370 | ) | $ | 147,312 | $ | (405,444 | ) | $ | (2,407,681 | ) | |||||||||||||||
| ||||||||||||||||||||||||||||
| AB Virginia Portfolio | ||||||||||||||||||||||||||||
| Shares | Amount | |||||||||||||||||||||||||||
Year Ended May 31, 2016 | October 1, May 31, 2015(a) | Year Ended September 30, 2014 | Year Ended May 31, 2016 | October 1, May 31, 2015(a) | Year Ended September 30, 2014 | |||||||||||||||||||||||
|
| |||||||||||||||||||||||||||
| Class A | ||||||||||||||||||||||||||||
Shares sold | 1,771,701 | 1,457,408 | 1,190,701 | $ | 19,977,912 | $ | 16,345,109 | $ | 12,915,731 | |||||||||||||||||||
| ||||||||||||||||||||||||||||
Shares issued in reinvestment of dividends | 269,980 | 184,625 | 307,132 | 3,030,914 | 2,070,245 | 3,347,004 | ||||||||||||||||||||||
| ||||||||||||||||||||||||||||
Shares converted from Class B | 19,692 | 29,391 | 57,896 | 218,951 | 329,613 | 629,118 | ||||||||||||||||||||||
| ||||||||||||||||||||||||||||
Shares redeemed | (1,742,490 | ) | (897,713 | ) | (3,397,801 | ) | (19,509,514 | ) | (10,059,039 | ) | (36,619,917 | ) | ||||||||||||||||
| ||||||||||||||||||||||||||||
Net increase (decrease) | 318,883 | 773,711 | (1,842,072 | ) | $ | 3,718,263 | $ | 8,685,928 | $ | (19,728,064 | ) | |||||||||||||||||
| ||||||||||||||||||||||||||||
| AB MUNICIPAL INCOME FUND II • | 149 |
Notes to Financial Statements
| AB Virginia Portfolio | ||||||||||||||||||||||||||||
| Shares | Amount | |||||||||||||||||||||||||||
Year Ended May 31, 2016 | October 1, May 31, 2015(a) | Year Ended September 30, 2014 | Year Ended May 31, 2016 | October 1, May 31, 2015(a) | Year Ended September 30, 2014 | |||||||||||||||||||||||
|
| |||||||||||||||||||||||||||
| Class B | ||||||||||||||||||||||||||||
Shares sold | 545 | 449 | 895 | $ | 6,100 | $ | 5,016 | $ | 9,700 | |||||||||||||||||||
| ||||||||||||||||||||||||||||
Shares issued in reinvestment of dividends | 318 | 447 | 1,472 | 3,562 | 5,005 | 15,963 | ||||||||||||||||||||||
| ||||||||||||||||||||||||||||
Shares converted to Class A | (19,724 | ) | (29,443 | ) | (57,997 | ) | (218,951 | ) | (329,613 | ) | (629,118 | ) | ||||||||||||||||
| ||||||||||||||||||||||||||||
Shares redeemed | (735 | ) | (921 | ) | (2,810 | ) | (8,378 | ) | (10,318 | ) | (30,238 | ) | ||||||||||||||||
| ||||||||||||||||||||||||||||
Net decrease | (19,596 | ) | (29,468 | ) | (58,440 | ) | $ | (217,667 | ) | $ | (329,910 | ) | $ | (633,693 | ) | |||||||||||||
| ||||||||||||||||||||||||||||
| Class C | ||||||||||||||||||||||||||||
Shares sold | 473,447 | 246,598 | 350,918 | $ | 5,305,498 | $ | 2,758,541 | $ | 3,819,264 | |||||||||||||||||||
| ||||||||||||||||||||||||||||
Shares issued in reinvestment of dividends | 85,677 | 59,905 | 101,472 | 959,418 | 669,990 | 1,102,530 | ||||||||||||||||||||||
| ||||||||||||||||||||||||||||
Shares redeemed | (530,867 | ) | (358,176 | ) | (1,039,994 | ) | (5,927,307 | ) | (4,002,305 | ) | (11,202,422 | ) | ||||||||||||||||
| ||||||||||||||||||||||||||||
Net increase (decrease) | 28,257 | (51,673 | ) | (587,604 | ) | $ | 337,609 | $ | (573,774 | ) | $ | (6,280,628 | ) | |||||||||||||||
| ||||||||||||||||||||||||||||
| (a) | The Portfolio changed its fiscal year end from September 30 to May 31. |
NOTE F
Risks Involved in Investing in the Portfolios
Credit Risk—An issuer or guarantor of a fixed-income security, or the counterparty to a derivatives or other contract, may be unable or unwilling to make timely payments of interest or principal, or to otherwise honor its obligations. The issuer or guarantor may default, causing a loss of the full principal amount of a security. The degree of risk for a particular security may be reflected in its credit rating. There is the possibility that the credit rating of a fixed-income security may be downgraded after purchase, which may adversely affect the value of the security. Investments in fixed-income securities with lower ratings tend to have a higher probability that an issuer will default or fail to meet its payment obligations.
Municipal Market Risk—This is the risk that special factors may adversely affect the value of municipal securities and have a significant effect on the yield or value of the Portfolios’ investments in municipal securities. These factors include economic conditions, political or legislative changes, uncertainties related to the tax status of municipal securities, or the rights of investors in these securities. The Portfolios of the AllianceBernstein Municipal Income Fund II are State Portfolios that may invest a large portion of their assets in a particular state’s municipal securities and their various political subdivisions. To the extent that these Portfolios invest more of their assets in a particular state’s municipal securities, these Portfolios may be vulnerable to events adversely affecting that state, including economic, political and regulatory occurrences, court decisions, terrorism and catastrophic natural disasters, such as hurricanes or earthquakes. These
| 150 | • AB MUNICIPAL INCOME FUND II |
Notes to Financial Statements
Portfolios’ investments in certain municipal securities with principal and interest payments that are made from the revenues of a specific project or facility, and not general tax revenues, may have increased risks. Factors affecting the project or facility, such as local business or economic conditions, could have a significant effect on the project’s ability to make payments of principal and interest on these securities.
The Portfolios may invest in the municipal securities of Puerto Rico and other U.S. territories and their governmental agencies and municipalities, which are exempt from federal, state, and, where applicable, local income taxes. These municipal securities may have more risks than those of other U.S. issuers of municipal securities. Like many U.S. states and municipalities, Puerto Rico experienced a significant downturn during the recent recession. Puerto Rico’s downturn was particularly severe, and Puerto Rico continues to face a very challenging economic and fiscal environment. Municipal securities issued by Puerto Rico issuers have extremely low credit ratings and are on “negative watch” by credit rating organizations. Some Puerto Rico issuers are in default on principal and interest payments. The Government Development Bank, which provides liquidity to Puerto Rico’s government agencies, recently defaulted on a $400 million debt payment. This default casts doubts on the ability of Puerto Rico and its government agencies to make future payments. If this and the general economic situation in Puerto Rico persist or worsen, the volatility and credit quality of Puerto Rican municipal securities could be adversely affected, and the market for such securities may experience continued volatility. In addition, Puerto Rico’s difficulties have resulted in increased volatility in portions of the broader municipal securities market from time to time, and this may recur in the future.
Interest Rate Risk—Changes in interest rates will affect the value of investments in fixed-income securities. When interest rates rise, the value of investments in fixed-income securities tends to fall and this decrease in value may not be offset by higher income from new investments. The Portfolio may be subject to a heightened risk of rising interest rates as the current period of historically low rates is expected to end, and rates are expected to begin rising in the near future. Interest rate risk is generally greater for fixed-income securities with longer maturities or durations.
Duration Risk—Duration is the measure that relates the expected price volatility of a fixed-income security to changes in interest rates. The duration of a fixed-income security may be shorter than or equal to full maturity of a fixed-income security. Fixed-income securities with longer durations have more risk and will decrease in price as interest rates rise. For example, a fixed-income security with a duration of three years will decrease in value by approximately 3% if interest rates increase by 1%.
Inflation Risk—This is the risk that the value of assets or income from investments will be less in the future as inflation decreases the value of money. As
| AB MUNICIPAL INCOME FUND II • | 151 |
Notes to Financial Statements
inflation increases, the value of the Portfolio’s assets can decline as can the value of the Portfolio’s distributions. This risk is significantly greater for fixed-income securities with longer maturities.
Liquidity Risk—Liquidity risk occurs when certain investments become difficult to purchase or sell. Difficulty in selling less liquid securities may result in sales at disadvantageous prices affecting the value of your investment in the Portfolio. Causes of liquidity risk may include low trading volumes, large positions and heavy redemptions of Portfolio shares. Over recent years liquidity risk has also increased because the capacity of dealers in the secondary market for fixed-income securities to make markets in these securities has decreased, even as the overall bond market has grown significantly, due to, among other things, structural changes, additional regulatory requirements and capital and risk restraints that have led to reduced inventories. Liquidity risk may be higher in a rising interest rate environment, when the value and liquidity of fixed-income securities generally decline. Municipal securities may have more liquidity risk than other fixed-income securities because they trade less frequently and the market for municipal securities is generally smaller than many other markets.
Derivatives Risk—The Portfolios may enter into derivative transactions such as forwards, options, futures and swaps. Derivatives may be illiquid, difficult to price, and leveraged so that small changes may produce disproportionate losses for the Portfolios, and subject to counterparty risk to a greater degree than more traditional investments. Derivatives may result in significant losses, including losses that are far greater than the value of the derivatives reflected on the statement of assets and liabilities.
Tax Risk—There is no guarantee that all of a Portfolio’s income will remain exempt from federal or state income taxes. From time to time, the U.S. Government and the U.S. Congress consider changes in federal tax law that could limit or eliminate the federal tax exemption for municipal bond income, which would in effect reduce the net income received by shareholders from the Portfolio by increasing taxes on that income. In such event, the Portfolio’s NAV could also decline as yields on municipal bonds, which are typically lower than those on taxable bonds, would be expected to increase to approximately the yield of comparable taxable bonds. Actions or anticipated actions affecting the tax exempt status of municipal bonds could also result in significant shareholder redemptions of Portfolio shares as investors anticipate adverse effects on the Portfolio or seek higher yields to offset the potential loss of the tax deduction. As a result, the Portfolio would be required to maintain higher levels of cash to meet the redemptions, which would negatively affect the Portfolio’s yield.
Indemnification Risk—In the ordinary course of business, the Portfolio enters into contracts that contain a variety of indemnifications. The Portfolios’ maximum exposure under these arrangements is unknown. However, the Portfolios have not had prior claims or losses pursuant to these indemnification provisions and expect
| 152 | • AB MUNICIPAL INCOME FUND II |
Notes to Financial Statements
the risk of loss thereunder to be remote. Therefore, the Portfolios have not accrued any liability in connection with these indemnification provisions.
NOTE G
Joint Credit Facility
A number of open-end mutual funds managed by the Adviser, including the Portfolios, participate in a $280 million revolving credit facility (the “Facility”) intended to provide short-term financing, if necessary, subject to certain restrictions in connection with abnormal redemption activity. Commitment fees related to the Facility are paid by the participating funds and are included in miscellaneous expenses in the statement of operations. The Portfolios did not utilize the Facility during the year ended May 31, 2016.
NOTE H
Distributions to Shareholders
The tax character of distributions paid during the fiscal year ended May 31, 2016, period ended May 31, 2015 and year ended September 30, 2014 were as follows:
| AB Arizona Portfolio | 2016 | 2015 | 2014 | |||||||||
Distributions paid from: | ||||||||||||
Ordinary income | $ | 17,423 | $ | 14,371 | $ | 23,819 | ||||||
|
|
|
|
|
| |||||||
Total taxable distributions | 17,423 | 14,371 | 23,819 | |||||||||
Tax exempt distributions | 3,880,882 | 2,923,238 | 4,820,620 | |||||||||
|
|
|
|
|
| |||||||
Total distributions paid | $ | 3,898,305 | $ | 2,937,609 | $ | 4,844,439 | ||||||
|
|
|
|
|
| |||||||
| AB Massachusetts Portfolio | 2016 | 2015 | 2014 | |||||||||
Distributions paid from: | ||||||||||||
Ordinary income | $ | 253,184 | $ | 171,400 | $ | 258,707 | ||||||
|
|
|
|
|
| |||||||
Total taxable distributions | 253,184 | 171,400 | 258,707 | |||||||||
Tax exempt distributions | 6,875,031 | 4,912,570 | 8,201,528 | |||||||||
|
|
|
|
|
| |||||||
Total distributions paid | $ | 7,128,215 | $ | 5,083,970 | $ | 8,460,235 | ||||||
|
|
|
|
|
| |||||||
| AB Michigan Portfolio | 2016 | 2015 | 2014 | |||||||||
Distributions paid from: | ||||||||||||
Ordinary income | $ | 4,531 | $ | 4,449 | $ | 6,802 | ||||||
|
|
|
|
|
| |||||||
Total taxable distributions | 4,531 | 4,449 | 6,802 | |||||||||
Tax exempt distributions | 1,632,963 | 1,174,960 | 2,088,215 | |||||||||
|
|
|
|
|
| |||||||
Total distributions paid | $ | 1,637,494 | $ | 1,179,409 | $ | 2,095,017 | ||||||
|
|
|
|
|
| |||||||
| AB MUNICIPAL INCOME FUND II • | 153 |
Notes to Financial Statements
| AB Minnesota Portfolio | 2016 | 2015 | 2014 | |||||||||
Distributions paid from: | ||||||||||||
Ordinary income | $ | 116,840 | $ | 78,065 | $ | 115,117 | ||||||
Long-term capital gains | 3,454 | 493,088 | – 0 | – | ||||||||
|
|
|
|
|
| |||||||
Total taxable distributions | 120,294 | 571,153 | 115,117 | |||||||||
Tax exempt distributions | 2,328,742 | 1,600,873 | 2,515,905 | |||||||||
|
|
|
|
|
| |||||||
Total distributions paid | $ | 2,449,036 | $ | 2,172,026 | $ | 2,631,022 | ||||||
|
|
|
|
|
| |||||||
| AB New Jersey Portfolio | 2016 | 2015 | 2014 | |||||||||
Distributions paid from: | ||||||||||||
Ordinary income | $ | 117,128 | $ | 78,988 | $ | 118,332 | ||||||
|
|
|
|
|
| |||||||
Total taxable distributions | 117,128 | 78,988 | 118,332 | |||||||||
Tax exempt distributions | 3,646,685 | 2,716,354 | 4,663,383 | |||||||||
|
|
|
|
|
| |||||||
Total distributions paid | $ | 3,763,813 | $ | 2,795,342 | $ | 4,781,715 | ||||||
|
|
|
|
|
| |||||||
| AB Ohio Portfolio | 2016 | 2015 | 2014 | |||||||||
Distributions paid from: | ||||||||||||
Ordinary income | $ | 130,039 | $ | 88,812 | $ | 133,123 | ||||||
|
|
|
|
|
| |||||||
Total taxable distributions | 130,039 | 88,812 | 133,123 | |||||||||
Tax exempt distributions | 3,113,376 | 2,307,820 | 4,198,025 | |||||||||
|
|
|
|
|
| |||||||
Total distributions paid | $ | 3,243,415 | $ | 2,396,632 | $ | 4,331,148 | ||||||
|
|
|
|
|
| |||||||
| AB Pennsylvania Portfolio | 2016 | 2015 | 2014 | |||||||||
Distributions paid from: | ||||||||||||
Ordinary income | $ | 4,793 | $ | 3,732 | $ | 15,984 | ||||||
Long-term capital gains | – 0 | – | – 0 | – | 335,541 | |||||||
|
|
|
|
|
| |||||||
Total taxable distributions | 4,793 | 3,732 | 351,525 | |||||||||
Tax exempt distributions | 2,808,486 | 2,035,616 | 3,321,109 | |||||||||
|
|
|
|
|
| |||||||
Total distributions paid | $ | 2,813,279 | $ | 2,039,348 | $ | 3,672,634 | ||||||
|
|
|
|
|
| |||||||
| AB Virginia Portfolio | 2016 | 2015 | 2014 | |||||||||
Distributions paid from: | ||||||||||||
Ordinary income | $ | 238,512 | $ | 984,666 | $ | 265,735 | ||||||
|
|
|
|
|
| |||||||
Total taxable distributions | 238,512 | 984,666 | 265,735 | |||||||||
Tax exempt distributions | 6,753,361 | 3,641,794 | 7,163,748 | |||||||||
|
|
|
|
|
| |||||||
Total distributions paid | $ | 6,991,873 | $ | 4,626,460 | $ | 7,429,483 | ||||||
|
|
|
|
|
| |||||||
| 154 | • AB MUNICIPAL INCOME FUND II |
Notes to Financial Statements
As of May 31, 2016, the components of accumulated earnings/(deficit) on a tax basis were as follows:
| Portfolio | Undistributed Ordinary Income(a) | Undistributed Long-Term Gains | Accumulated Capital and Other Losses(b) | Unrealized Appreciation/ (Depreciation)(c) | Total Accumulated Earnings/ (Deficit)(d) | |||||||||||||||
AB Arizona | $ | – 0 | – | $ | – 0 | – | $ | (1,418,469 | ) | $ | 8,228,860 | $ | 6,810,391 | |||||||
AB Massachusetts | – 0 | – | – 0 | – | (386,016 | ) | 19,973,612 | 19,587,596 | ||||||||||||
AB Michigan | – 0 | – | – 0 | – | (2,366,590 | ) | 3,485,345 | 1,118,755 | ||||||||||||
AB Minnesota | – 0 | – | 179,048 | – 0 | – | 5,685,332 | 5,864,380 | |||||||||||||
AB New Jersey | – 0 | – | – 0 | – | (4,403,037 | ) | 10,537,073 | 6,134,036 | ||||||||||||
AB Ohio | – 0 | – | – 0 | – | (5,607,362 | ) | 8,162,248 | 2,554,886 | ||||||||||||
AB Pennsylvania | 12,740 | – 0 | – | (2,699,741 | ) | 8,154,965 | 5,467,964 | |||||||||||||
AB Virginia | – 0 | – | – 0 | – | (4,967,415 | ) | 19,392,649 | 14,425,234 | ||||||||||||
| (a) | These amounts represent 100% tax exempt income. |
| (b) | At May 31, 2016, AB Arizona Portfolio, AB Massachusetts Portfolio, AB Michigan Portfolio, AB New Jersey Portfolio, AB Ohio Portfolio, AB Pennsylvania Portfolio and AB Virginia Portfolio had capital loss carryforwards for federal income tax purposes. During the fiscal period, AB Arizona Portfolio, AB Massachusetts Portfolio, AB Michigan Portfolio, AB New Jersey Portfolio, AB Pennsylvania Portfolio and AB Virginia Portfolio utilized capital loss carryforwards of $359,635, $1,721,306, $312,383, $17,489, $135,947 and $127,555, respectively, to offset current year net realized gains. |
| (c) | The differences between book-basis and tax-basis unrealized appreciation/(depreciation) are attributable primarily to the tax treatment of swaps, the tax deferral of losses on wash sales, the tax treatment of tender option bonds. |
| (d) | The differences between book-basis and tax-basis components of accumulated earnings/(deficit) are attributable primarily to the tax treatment of defaulted securities and dividends payable to shareholders. |
For tax purposes, net capital losses may be carried over to offset future capital gains, if any. Funds are permitted to carry forward capital losses incurred in taxable years beginning after December 22, 2010 for an indefinite period. These post-December 22, 2010 capital losses must be utilized prior to the earlier capital losses, which are subject to expiration. Post-December 22, 2010 capital loss carryforwards will retain their character as either short-term or long-term capital losses rather than being considered short-term as under previous regulation.
As of May 31, 2016, certain Portfolios had net capital loss carryforwards which will expire as follows:
| Portfolio | Short-Term Amount | Long-Term Amount | Expiration | |||||||||
AB Arizona | $ | 520,075 | $ | 898,394 | No expiration | |||||||
AB Massachusetts | 55,827 | 330,189 | No expiration | |||||||||
AB Michigan | 682,935 | 1,683,655 | No expiration | |||||||||
AB New Jersey | 236,173 | n/a | 2018 | |||||||||
AB New Jersey | 95,620 | n/a | 2019 | |||||||||
AB New Jersey | 2,295,421 | 1,775,823 | No expiration | |||||||||
AB Ohio | 1,705,408 | 3,901,954 | No expiration | |||||||||
AB Pennsylvania | – 0 | – | 2,699,741 | No expiration | ||||||||
AB Virginia | 1,382,340 | 3,585,075 | No expiration | |||||||||
| AB MUNICIPAL INCOME FUND II • | 155 |
Notes to Financial Statements
During the current fiscal year, the Portfolios had adjustments due to permanent differences. Permanent differences have no effect on net assets. The effect of such permanent differences on each Portfolio—primarily due to the tax treatment of swaps and the redesignation of dividends—is reflected as an adjustment to the components of capital as of May 31, 2016 as shown below:
| Portfolio | Increase(Decrease) to Additional Paid-In Capital | Increase(Decrease) to Undistributed/ (Distributions in Excess of) Net Investment Income | Increase(Decrease) to Accumulated Net Gain(Loss) on Investment Transactions | |||||||||
AB Arizona | $ | (13,303 | ) | $ | 13,171 | $ | 132 | |||||
AB Massachusetts | (24,547 | ) | 324,349 | (299,802 | ) | |||||||
AB Michigan | (2,446 | ) | 2,428 | 18 | ||||||||
AB Minnesota | – 0 | – | 143,408 | (143,408 | ) | |||||||
AB New Jersey | (4,590 | ) | 126,618 | (122,028 | ) | |||||||
AB Ohio | (8,756 | ) | 152,789 | (144,033 | ) | |||||||
AB Pennsylvania | – 0 | – | (149 | ) | 149 | |||||||
AB Virginia | (14,056 | ) | 276,352 | (262,296 | ) | |||||||
NOTE I
Floating Rate Notes Issued in Connection with Securities Held
Each Portfolio may engage in tender option bond transactions in which the Portfolio may transfer a fixed rate bond (“Fixed Rate Bond”) to a broker for cash. The broker deposits the Fixed Rate Bond into a Special Purpose Vehicle (the “SPV”, which is generally organized as a trust), organized by the broker. The Portfolio buys a residual interest in the assets and cash flows of the SPV, often referred to as an inverse floating rate obligation (“Inverse Floater”). The SPV also issues floating rate notes (“Floating Rate Notes”) which are sold to third parties. The Floating Rate Notes pay interest at rates that generally reset weekly and their holders have the option to tender their notes to a liquidity provider for redemption at par. The Inverse Floater held by the Portfolio gives the Portfolio the right (1) to cause the holders of the Floating Rate Notes to tender their notes at par, and (2) to have the trustee transfer the Fixed Rate Bond held by the SPV to the Portfolio, thereby collapsing the SPV. The SPV may also be collapsed in certain other circumstances. In accordance with U.S. GAAP requirements regarding accounting for transfers and servicing of financial assets and extinguishments of liabilities, the Portfolio accounts for the transaction described above as a secured borrowing by including the Fixed Rate Bond in its portfolio of investments and the Floating Rate Notes as a liability under the caption “Payable for floating rate notes issued” in its statement of assets and liabilities. Interest expense related to the Portfolios’ liability with respect to Floating Rate Notes is recorded as incurred. The interest expense is also included in the Portfolios’ expense ratio. At May 31, 2016, the Portfolios did not have any Floating Rate Notes outstanding.
| 156 | • AB MUNICIPAL INCOME FUND II |
Notes to Financial Statements
Each Portfolio may also purchase Inverse Floaters in the secondary market without first owning the underlying bond. Such an Inverse Floater is included in the portfolio of investments but is not required to be treated as a secured borrowing and reflected in the Portfolio’s financial statements as a secured borrowing. For the year ended May 31, 2016, the Portfolios did not engage in such transactions.
NOTE J
New Accounting Pronouncement
In May 2015, the Financial Accounting Standards Board issued an Accounting Standards Update, ASU 2015-07 (the “ASU”) which removes the requirement to categorize within the fair value hierarchy all investments for which fair value is measured using the net asset value per share practical expedient. The ASU also removes the requirement to make certain disclosures for investments that are eligible to be measured at fair value using the net asset value per share practical expedient but do not utilize that practical expedient. The ASU is effective for annual periods beginning after December 15, 2015 and interim periods within those annual periods. At this time, management is evaluating the implications of these changes on the financial statements.
NOTE K
Subsequent Events
The Government STIF Portfolio, prior to June 1, 2016, was offered as a cash management option to mutual funds and other institutional accounts of the Adviser, and was not available for direct purchase by members of the public. Prior to June 1, 2016, the Government STIF Portfolio paid no investment management fees but did bear its own expenses. As of June 1, 2016, the Government STIF Portfolio, which was renamed “AB Government Money Market Portfolio” (the “Government Money Market Portfolio”), will have a contractual investment management fee rate of .20% and will continue to bear its own expenses. In connection with the investment by the Fund in the Government Money Market Portfolio, the Adviser will waive its investment management fee from the Fund in an amount equal to Government Money Market Portfolio’s effective management fee.
The Board previously approved the creation of Advisor Class shares on the Massachusetts Portfolio and Virginia Portfolio. The new shares launched on July 25, 2016.
Management has evaluated subsequent events for possible recognition or disclosure in the financial statements through the date the financial statements are issued. Management has determined that there are no other material events that would require disclosure in the Portfolios’ financial statements through this date.
| AB MUNICIPAL INCOME FUND II • | 157 |
Notes to Financial Statements
FINANCIAL HIGHLIGHTS
Selected Data For A Share Of Beneficial Interest Outstanding Throughout Each Period
| AB Arizona Portfolio | ||||||||||||||||||||||||
| Class A | ||||||||||||||||||||||||
Year Ended 2016 | October 1, 2014 to May 31, 2015(a) | Year Ended September 30, | ||||||||||||||||||||||
| 2014 | 2013 | 2012 | 2011 | |||||||||||||||||||||
|
| |||||||||||||||||||||||
Net asset value, beginning of period | $ 11.01 | $ 11.05 | $ 10.72 | $ 11.41 | $ 10.95 | $ 11.17 | ||||||||||||||||||
|
| |||||||||||||||||||||||
Income From Investment Operations | ||||||||||||||||||||||||
Net investment income(b)(c) | .35 | .25 | .40 | .40 | .43 | .45 | ||||||||||||||||||
Net realized and unrealized gain (loss) on investment transactions | .35 | (.04 | ) | .33 | (.69 | ) | .46 | (.13 | ) | |||||||||||||||
|
| |||||||||||||||||||||||
Net increase (decrease) in net asset value from operations | .70 | .21 | .73 | (.29 | ) | .89 | .32 | |||||||||||||||||
|
| |||||||||||||||||||||||
Less: Dividends and Distributions | ||||||||||||||||||||||||
Dividends from net investment income | (.35 | ) | (.25 | ) | (.40 | ) | (.40 | ) | (.43 | ) | (.46 | ) | ||||||||||||
Distributions from net realized gain on investment transactions | – 0 | – | – 0 | – | – 0 | – | – 0 | – | – 0 | – | (.08 | ) | ||||||||||||
|
| |||||||||||||||||||||||
Total dividends and distributions | (.35 | ) | (.25 | ) | (.40 | ) | (.40 | ) | (.43 | ) | (.54 | ) | ||||||||||||
|
| |||||||||||||||||||||||
Net asset value, end of period | $ 11.36 | $ 11.01 | $ 11.05 | $ 10.72 | $ 11.41 | $ 10.95 | ||||||||||||||||||
|
| |||||||||||||||||||||||
Total Return | ||||||||||||||||||||||||
Total investment return based on net asset value(d) | 6.50 | % | 1.94 | % | 6.90 | % | (2.65 | )% | 8.27 | % | 3.07 | % | ||||||||||||
Ratios/Supplemental Data | ||||||||||||||||||||||||
Net assets, end of period | $106,037 | $104,489 | $107,843 | $117,342 | $140,768 | $134,466 | ||||||||||||||||||
Ratio to average net assets of: | ||||||||||||||||||||||||
Expenses, net of waivers/reimbursements(e) | .78 | % | .80 | %^ | .79 | % | .79 | % | .79 | % | .78 | % | ||||||||||||
Expenses, before waivers/reimbursements(e) | .96 | % | 1.00 | %^ | .99 | % | .93 | % | .95 | % | .95 | % | ||||||||||||
Net investment income(b) | 3.17 | % | 3.43 | %^ | 3.65 | % | 3.54 | % | 3.85 | % | 4.22 | % | ||||||||||||
Portfolio turnover rate | 11 | % | 21 | % | 15 | % | 24 | % | 17 | % | 2 | % | ||||||||||||
See footnote summary on pages 182-183.
| 158 | • AB MUNICIPAL INCOME FUND II |
Financial Highlights
Selected Data For A Share Of Beneficial Interest Outstanding Throughout Each Period
| AB Arizona Portfolio | ||||||||||||||||||||||||
| Class B | ||||||||||||||||||||||||
| Year Ended May 31, 2016 | October 1, 2014 to May 31, 2015(a) | Year Ended September 30, | ||||||||||||||||||||||
| 2014 | 2013 | 2012 | 2011 | |||||||||||||||||||||
|
| |||||||||||||||||||||||
Net asset value, beginning of period | $ 10.99 | $ 11.03 | $ 10.70 | $ 11.39 | $ 10.93 | $ 11.15 | ||||||||||||||||||
|
| |||||||||||||||||||||||
Income From Investment Operations | ||||||||||||||||||||||||
Net investment income(b)(c) | .27 | .20 | .32 | .32 | .35 | .38 | ||||||||||||||||||
Net realized and unrealized gain (loss) on investment transactions | .36 | (.04 | ) | .33 | (.69 | ) | .46 | (.14 | ) | |||||||||||||||
|
| |||||||||||||||||||||||
Net increase (decrease) in net asset value from operations | .63 | .16 | .65 | (.37 | ) | .81 | .24 | |||||||||||||||||
|
| |||||||||||||||||||||||
Less: Dividends and Distributions | ||||||||||||||||||||||||
Dividends from net investment income | (.27 | ) | (.20 | ) | (.32 | ) | (.32 | ) | (.35 | ) | (.38 | ) | ||||||||||||
Distributions from net realized gain on investment transactions | – 0 | – | – 0 | – | – 0 | – | – 0 | – | – 0 | – | (.08 | ) | ||||||||||||
|
| |||||||||||||||||||||||
Total dividends and distributions | (.27 | ) | (.20 | ) | (.32 | ) | (.32 | ) | (.35 | ) | (.46 | ) | ||||||||||||
|
| |||||||||||||||||||||||
Net asset value, end of period | $ 11.35 | $ 10.99 | $ 11.03 | $ 10.70 | $ 11.39 | $ 10.93 | ||||||||||||||||||
|
| |||||||||||||||||||||||
Total Return | ||||||||||||||||||||||||
Total investment return based on net asset value(d) | 5.81 | % | 1.45 | % | 6.17 | % | (3.34 | )% | 7.54 | % | 2.36 | % | ||||||||||||
Ratios/Supplemental Data | ||||||||||||||||||||||||
Net assets, end of period | $387 | $412 | $546 | $769 | $1,933 | $2,330 | ||||||||||||||||||
Ratio to average net assets of: | ||||||||||||||||||||||||
Expenses, net of waivers/reimbursements(e) | 1.53 | % | 1.53 | %^ | 1.49 | % | 1.49 | % | 1.49 | % | 1.48 | % | ||||||||||||
Expenses, before waivers/reimbursements(e) | 1.71 | % | 1.72 | %^ | 1.70 | % | 1.63 | % | 1.67 | % | 1.67 | % | ||||||||||||
Net investment income(b) | 2.43 | % | 2.72 | %^ | 2.96 | % | 2.83 | % | 3.17 | % | 3.53 | % | ||||||||||||
Portfolio turnover rate | 11 | % | 21 | % | 15 | % | 24 | % | 17 | % | 2 | % | ||||||||||||
See footnote summary on pages 182-183.
| AB MUNICIPAL INCOME FUND II • | 159 |
Financial Highlights
Selected Data For A Share Of Beneficial Interest Outstanding Throughout Each Period
| AB Arizona Portfolio | ||||||||||||||||||||||||
| Class C | ||||||||||||||||||||||||
Year Ended 2016 | October 1, 2014 to May 31, 2015(a) | Year Ended September 30, | ||||||||||||||||||||||
| 2014 | 2013 | 2012 | 2011 | |||||||||||||||||||||
|
| |||||||||||||||||||||||
Net asset value, beginning of period | $ 10.99 | $ 11.03 | $ 10.70 | $ 11.39 | $ 10.93 | $ 11.15 | ||||||||||||||||||
|
| |||||||||||||||||||||||
Income From Investment Operations | ||||||||||||||||||||||||
Net investment income(b)(c) | .27 | .20 | .32 | .32 | .35 | .38 | ||||||||||||||||||
Net realized and unrealized gain (loss) on investment transactions | .36 | (.04 | ) | .33 | (.69 | ) | .46 | (.14 | ) | |||||||||||||||
|
| |||||||||||||||||||||||
Net increase (decrease) in net asset value from operations | .63 | .16 | .65 | (.37 | ) | .81 | .24 | |||||||||||||||||
|
| |||||||||||||||||||||||
Less: Dividends and Distributions | ||||||||||||||||||||||||
Dividends from net investment income | (.27 | ) | (.20 | ) | (.32 | ) | (.32 | ) | (.35 | ) | (.38 | ) | ||||||||||||
Distributions from net realized gain on investment transactions | – 0 | – | – 0 | – | – 0 | – | – 0 | – | – 0 | – | (.08 | ) | ||||||||||||
|
| |||||||||||||||||||||||
Total dividends and distributions | (.27 | ) | (.20 | ) | (.32 | ) | (.32 | ) | (.35 | ) | (.46 | ) | ||||||||||||
|
| |||||||||||||||||||||||
Net asset value, end of period | $ 11.35 | $ 10.99 | $ 11.03 | $ 10.70 | $ 11.39 | $ 10.93 | ||||||||||||||||||
|
| |||||||||||||||||||||||
Total Return | ||||||||||||||||||||||||
Total investment return based on net asset value(d) | 5.81 | % | 1.45 | % | 6.17 | % | (3.34 | )% | 7.54 | % | 2.35 | % | ||||||||||||
Ratios/Supplemental Data | ||||||||||||||||||||||||
Net assets, end of period | $25,550 | $24,900 | $25,203 | $30,060 | $35,464 | $32,103 | ||||||||||||||||||
Ratio to average net assets of: | ||||||||||||||||||||||||
Expenses, net of waivers/reimbursements(e) | 1.53 | % | 1.53 | %^ | 1.49 | % | 1.49 | % | 1.49 | % | 1.48 | % | ||||||||||||
Expenses, before waivers/reimbursements(e) | 1.71 | % | 1.72 | %^ | 1.70 | % | 1.63 | % | 1.65 | % | 1.66 | % | ||||||||||||
Net investment income(b) | 2.43 | % | 2.71 | %^ | 2.96 | % | 2.84 | % | 3.16 | % | 3.53 | % | ||||||||||||
Portfolio turnover rate | 11 | % | 21 | % | 15 | % | 24 | % | 17 | % | 2 | % | ||||||||||||
See footnote summary on pages 182-183.
| 160 | • AB MUNICIPAL INCOME FUND II |
Financial Highlights
Selected Data For A Share Of Beneficial Interest Outstanding Throughout Each Period
| AB Massachusetts Portfolio | ||||||||||||||||||||||||
| Class A | ||||||||||||||||||||||||
Year Ended May 31, 2016 | October 1, 2014 to May 31, 2015(a) | Year Ended September 30, | ||||||||||||||||||||||
| 2014 | 2013 | 2012 | 2011 | |||||||||||||||||||||
|
| |||||||||||||||||||||||
Net asset value, beginning of period | $ 11.37 | $ 11.36 | $ 11.05 | $ 11.87 | $ 11.28 | $ 11.32 | ||||||||||||||||||
|
| |||||||||||||||||||||||
Income From Investment Operations | ||||||||||||||||||||||||
Net investment income(b)(c) | .35 | .24 | .37 | .37 | .39 | .38 | ||||||||||||||||||
Net realized and unrealized gain (loss) on investment transactions | .25 | .02 | .33 | (.76 | ) | .61 | (.02 | )† | ||||||||||||||||
|
| |||||||||||||||||||||||
Net increase (decrease) in net asset value from operations | .60 | .26 | .70 | (.39 | ) | 1.00 | .36 | |||||||||||||||||
|
| |||||||||||||||||||||||
Less: Dividends and Distributions | ||||||||||||||||||||||||
Dividends from net investment income | (.36 | ) | (.25 | ) | (.39 | ) | (.39 | ) | (.41 | ) | (.40 | ) | ||||||||||||
Distributions from net realized gain on investment transactions | – 0 | – | – 0 | – | – 0 | – | (.04 | ) | – 0 | – | – 0 | – | ||||||||||||
|
| |||||||||||||||||||||||
Total dividends and distributions | (.36 | ) | (.25 | ) | (.39 | ) | (.43 | ) | (.41 | ) | (.40 | ) | ||||||||||||
|
| |||||||||||||||||||||||
Net asset value, end of period | $ 11.61 | $ 11.37 | $ 11.36 | $ 11.05 | $ 11.87 | $ 11.28 | ||||||||||||||||||
|
| |||||||||||||||||||||||
Total Return | ||||||||||||||||||||||||
Total investment return based on net asset value(d) | 5.38 | % | 2.26 | % | 6.42 | % | (3.38 | )% | 8.98 | % | 3.38 | % | ||||||||||||
Ratios/Supplemental Data | ||||||||||||||||||||||||
Net assets, end of period | $189,259 | $188,934 | $194,274 | $202,230 | $233,271 | $215,025 | ||||||||||||||||||
Ratio to average net assets of: | ||||||||||||||||||||||||
Expenses, net of waivers/reimbursements | .77 | % | .80 | %^ | .82 | % | .82 | % | .82 | % | .82 | % | ||||||||||||
Expenses, before waivers/reimbursements | .87 | % | .90 | %^ | .91 | % | .88 | % | .88 | % | .89 | % | ||||||||||||
Net investment income(b) | 3.04 | % | 3.10 | %^ | 3.35 | % | 3.18 | % | 3.33 | % | 3.51 | % | ||||||||||||
Portfolio turnover rate | 15 | % | 12 | % | 9 | % | 19 | % | 6 | % | 15 | % | ||||||||||||
See footnote summary on pages 182-183.
| AB MUNICIPAL INCOME FUND II • | 161 |
Financial Highlights
Selected Data For A Share Of Beneficial Interest Outstanding Throughout Each Period
| AB Massachusetts Portfolio | ||||||||||||||||||||||||
| Class B | ||||||||||||||||||||||||
Year Ended May 31, 2016 | October 1, 2014 to May 31, 2015(a) | Year Ended September 30, | ||||||||||||||||||||||
| 2014 | 2013 | 2012 | 2011 | |||||||||||||||||||||
|
| |||||||||||||||||||||||
Net asset value, beginning of period | $ 11.35 | $ 11.34 | $ 11.03 | $ 11.85 | $ 11.25 | $ 11.29 | ||||||||||||||||||
|
| |||||||||||||||||||||||
Income From Investment Operations | ||||||||||||||||||||||||
Net investment income(b)(c) | .27 | .18 | .30 | .29 | .31 | .30 | ||||||||||||||||||
Net realized and unrealized gain (loss) on investment transactions | .25 | .02 | .32 | (.76 | ) | .62 | (.01 | )† | ||||||||||||||||
|
| |||||||||||||||||||||||
Net increase (decrease) in net asset value from operations | .52 | .20 | .62 | (.47 | ) | .93 | .29 | |||||||||||||||||
|
| |||||||||||||||||||||||
Less: Dividends and Distributions | ||||||||||||||||||||||||
Dividends from net investment income | (.28 | ) | (.19 | ) | (.31 | ) | (.31 | ) | (.33 | ) | (.33 | ) | ||||||||||||
Distributions from net realized gain on investment transactions | – 0 | – | – 0 | – | – 0 | – | (.04 | ) | – 0 | – | – 0 | – | ||||||||||||
|
| |||||||||||||||||||||||
Total dividends and distributions | (.28 | ) | (.19 | ) | (.31 | ) | (.35 | ) | (.33 | ) | (.33 | ) | ||||||||||||
|
| |||||||||||||||||||||||
Net asset value, end of period | $ 11.59 | $ 11.35 | $ 11.34 | $ 11.03 | $ 11.85 | $ 11.25 | ||||||||||||||||||
|
| |||||||||||||||||||||||
Total Return | ||||||||||||||||||||||||
Total investment return based on net asset value(d) | 4.61 | % | 1.77 | % | 5.70 | % | (4.05 | )% | 8.34 | % | 2.68 | % | ||||||||||||
Ratios/Supplemental Data | ||||||||||||||||||||||||
Net assets, end of period | $160 | $399 | $656 | $1,426 | $2,223 | $3,086 | ||||||||||||||||||
Ratio to average net assets of: | ||||||||||||||||||||||||
Expenses, net of waivers/reimbursements | 1.52 | % | 1.52 | %^ | 1.52 | % | 1.52 | % | 1.52 | % | 1.52 | % | ||||||||||||
Expenses, before waivers/reimbursements | 1.64 | % | 1.63 | %^ | 1.61 | % | 1.58 | % | 1.60 | % | 1.61 | % | ||||||||||||
Net investment income(b) | 2.32 | % | 2.39 | %^ | 2.69 | % | 2.49 | % | 2.66 | % | 2.81 | % | ||||||||||||
Portfolio turnover rate | 15 | % | 12 | % | 9 | % | 19 | % | 6 | % | 15 | % | ||||||||||||
See footnote summary on pages 182-183.
| 162 | • AB MUNICIPAL INCOME FUND II |
Financial Highlights
Selected Data For A Share Of Beneficial Interest Outstanding Throughout Each Period
| AB Massachusetts Portfolio | ||||||||||||||||||||||||
| Class C | ||||||||||||||||||||||||
Year Ended May 31, 2016 | October 1, 2014 to May 31, 2015(a) | Year Ended September 30, | ||||||||||||||||||||||
| 2014 | 2013 | 2012 | 2011 | |||||||||||||||||||||
|
| |||||||||||||||||||||||
Net asset value, beginning of period | $ 11.35 | $ 11.34 | $ 11.03 | $ 11.85 | $ 11.26 | $ 11.30 | ||||||||||||||||||
|
| |||||||||||||||||||||||
Income From Investment Operations | ||||||||||||||||||||||||
Net investment income(b)(c) | .26 | .18 | .30 | .29 | .31 | .31 | ||||||||||||||||||
Net realized and unrealized gain (loss) on investment transactions | .26 | .02 | .32 | (.76 | ) | .61 | (.02 | )† | ||||||||||||||||
|
| |||||||||||||||||||||||
Net increase (decrease) in net asset value from operations | .52 | .20 | .62 | (.47 | ) | .92 | .29 | |||||||||||||||||
|
| |||||||||||||||||||||||
Less: Dividends and Distributions | ||||||||||||||||||||||||
Dividends from net investment income | (.28 | ) | (.19 | ) | (.31 | ) | (.31 | ) | (.33 | ) | (.33 | ) | ||||||||||||
Distributions from net realized gain on investment transactions | – 0 | – | – 0 | – | – 0 | – | (.04 | ) | – 0 | – | – 0 | – | ||||||||||||
|
| |||||||||||||||||||||||
Total dividends and distributions | (.28 | ) | (.19 | ) | (.31 | ) | (.35 | ) | (.33 | ) | (.33 | ) | ||||||||||||
|
| |||||||||||||||||||||||
Net asset value, end of period | $ 11.59 | $ 11.35 | $ 11.34 | $ 11.03 | $ 11.85 | $ 11.26 | ||||||||||||||||||
|
| |||||||||||||||||||||||
Total Return | ||||||||||||||||||||||||
Total investment return based on net asset value(d) | 4.61 | % | 1.77 | % | 5.70 | % | (4.06 | )% | 8.24 | % | 2.67 | % | ||||||||||||
Ratios/Supplemental Data | ||||||||||||||||||||||||
Net assets, end of period | $54,482 | $53,570 | $54,108 | $64,298 | $70,889 | $58,968 | ||||||||||||||||||
Ratio to average net assets of: | ||||||||||||||||||||||||
Expenses, net of waivers/reimbursements | 1.52 | % | 1.52 | %^ | 1.52 | % | 1.52 | % | 1.52 | % | 1.52 | % | ||||||||||||
Expenses, before waivers/reimbursements | 1.63 | % | 1.63 | %^ | 1.61 | % | 1.59 | % | 1.59 | % | 1.60 | % | ||||||||||||
Net investment income(b) | 2.29 | % | 2.39 | %^ | 2.67 | % | 2.49 | % | 2.64 | % | 2.81 | % | ||||||||||||
Portfolio turnover rate | 15 | % | 12 | % | 9 | % | 19 | % | 6 | % | 15 | % | ||||||||||||
See footnote summary on pages 182-183.
| AB MUNICIPAL INCOME FUND II • | 163 |
Financial Highlights
Selected Data For A Share Of Beneficial Interest Outstanding Throughout Each Period
| AB Michigan Portfolio | ||||||||||||||||||||||||
| Class A | ||||||||||||||||||||||||
Year Ended 2016 | October 1, 2014 to May 31, | Year Ended September 30, | ||||||||||||||||||||||
| 2014 | 2013 | 2012 | 2011 | |||||||||||||||||||||
|
| |||||||||||||||||||||||
Net asset value, beginning of period | $ 10.33 | $ 10.33 | $ 9.96 | $ 11.01 | $ 10.76 | $ 10.89 | ||||||||||||||||||
|
| |||||||||||||||||||||||
Income From Investment Operations | ||||||||||||||||||||||||
Net investment income(b)(c) | .34 | .23 | .36 | .35 | .39 | .41 | ||||||||||||||||||
Net realized and unrealized gain (loss) on investment transactions | .36 | (.00 | )(f) | .37 | (.94 | ) | .28 | (.11 | ) | |||||||||||||||
|
| |||||||||||||||||||||||
Net increase (decrease) in net asset value from operations | .70 | .23 | .73 | (.59 | ) | .67 | .30 | |||||||||||||||||
|
| |||||||||||||||||||||||
Less: Dividends and Distributions | ||||||||||||||||||||||||
Dividends from net investment income | (.34 | ) | (.23 | ) | (.36 | ) | (.37 | ) | (.41 | ) | (.43 | ) | ||||||||||||
Distributions from net realized gain on investment transactions | – 0 | – | – 0 | – | – 0 | – | (.09 | ) | (.01 | ) | – 0 | – | ||||||||||||
|
| |||||||||||||||||||||||
Total dividends and distributions | (.34 | ) | (.23 | ) | (.36 | ) | (.46 | ) | (.42 | ) | (.43 | ) | ||||||||||||
|
| |||||||||||||||||||||||
Net asset value, end of period | $ 10.69 | $ 10.33 | $ 10.33 | $ 9.96 | $ 11.01 | $ 10.76 | ||||||||||||||||||
|
| |||||||||||||||||||||||
Total Return | ||||||||||||||||||||||||
Total investment return based on net asset value(d) | 6.85 | % | 2.22 | % | 7.42 | % | (5.57 | )% | 6.33 | % | 2.92 | % | ||||||||||||
Ratios/Supplemental Data | ||||||||||||||||||||||||
Net assets, end of period | $37,800 | $37,254 | $39,075 | $48,743 | $71,424 | $66,033 | ||||||||||||||||||
Ratio to average net assets of: | ||||||||||||||||||||||||
Expenses, net of waivers/reimbursements(e) | .85 | % | .88 | %^ | .90 | % | .95 | % | 1.01 | % | 1.01 | % | ||||||||||||
Expenses, before waivers/reimbursements(e) | 1.24 | % | 1.25 | %^ | 1.21 | % | 1.06 | % | 1.05 | % | 1.09 | % | ||||||||||||
Net investment income(b) | 3.21 | % | 3.30 | %^ | 3.53 | % | 3.23 | % | 3.55 | % | 3.84 | % | ||||||||||||
Portfolio turnover rate | 12 | % | 5 | % | 12 | % | 28 | % | 28 | % | 3 | % | ||||||||||||
See footnote summary on pages 182-183.
| 164 | • AB MUNICIPAL INCOME FUND II |
Financial Highlights
Selected Data For A Share Of Beneficial Interest Outstanding Throughout Each Period
| AB Michigan Portfolio | ||||||||||||||||||||||||
| Class B | ||||||||||||||||||||||||
Year Ended 2016 | October 1, 2014 to May 31, 2015(a) | Year Ended September 30, | ||||||||||||||||||||||
| 2014 | 2013 | 2012 | 2011 | |||||||||||||||||||||
|
| |||||||||||||||||||||||
Net asset value, beginning of period | $ 10.31 | $ 10.31 | $ 9.94 | $ 10.98 | $ 10.74 | $ 10.87 | ||||||||||||||||||
|
| |||||||||||||||||||||||
Income From Investment Operations | ||||||||||||||||||||||||
Net investment income(b)(c) | .26 | .18 | .29 | .27 | .31 | .34 | ||||||||||||||||||
Net realized and unrealized gain (loss) on investment transactions | .36 | (.00 | )(f) | .37 | (.92 | ) | .27 | (.10 | ) | |||||||||||||||
|
| |||||||||||||||||||||||
Net increase (decrease) in net asset value from operations | .62 | .18 | .66 | (.65 | ) | .58 | .24 | |||||||||||||||||
|
| |||||||||||||||||||||||
Less: Dividends and Distributions | ||||||||||||||||||||||||
Dividends from net investment income | (.26 | ) | (.18 | ) | (.29 | ) | (.30 | ) | (.33 | ) | (.37 | ) | ||||||||||||
Distributions from net realized gain on investment transactions | – 0 | – | – 0 | – | – 0 | – | (.09 | ) | (.01 | ) | – 0 | – | ||||||||||||
|
| |||||||||||||||||||||||
Total dividends and distributions | (.26 | ) | (.18 | ) | (.29 | ) | (.39 | ) | (.34 | ) | (.37 | ) | ||||||||||||
|
| |||||||||||||||||||||||
Net asset value, end of period | $ 10.67 | $ 10.31 | $ 10.31 | $ 9.94 | $ 10.98 | $ 10.74 | ||||||||||||||||||
|
| |||||||||||||||||||||||
Total Return | ||||||||||||||||||||||||
Total investment return based on net asset value(d) | 6.07 | % | 1.73 | % | 6.69 | % | (6.15 | )% | 5.52 | % | 2.27 | % | ||||||||||||
Ratios/Supplemental Data | ||||||||||||||||||||||||
Net assets, end of period (000’s omitted) | $239 | $341 | $375 | $448 | $1,003 | $1,460 | ||||||||||||||||||
Ratio to average net assets of: | ||||||||||||||||||||||||
Expenses, net of waivers/reimbursements(e) | 1.60 | % | 1.60 | %^ | 1.60 | % | 1.66 | % | 1.71 | % | 1.71 | % | ||||||||||||
Expenses, before waivers/reimbursements(e) | 2.00 | % | 1.99 | %^ | 1.93 | % | 1.77 | % | 1.78 | % | 1.80 | % | ||||||||||||
Net investment income(b) | 2.47 | % | 2.58 | %^ | 2.84 | % | 2.54 | % | 2.88 | % | 3.16 | % | ||||||||||||
Portfolio turnover rate | 12 | % | 5 | % | 12 | % | 28 | % | 28 | % | 3 | % | ||||||||||||
See footnote summary on pages 182-183.
| AB MUNICIPAL INCOME FUND II • | 165 |
Financial Highlights
Selected Data For A Share Of Beneficial Interest Outstanding Throughout Each Period
| AB Michigan Portfolio | ||||||||||||||||||||||||
| Class C | ||||||||||||||||||||||||
Year Ended May 31, 2016 | October 1, 2014 to May 31, 2015(a) | Year Ended September 30, | ||||||||||||||||||||||
| 2014 | 2013 | 2012 | 2011 | |||||||||||||||||||||
|
| |||||||||||||||||||||||
Net asset value, beginning of period | $ 10.31 | $ 10.32 | $ 9.95 | $ 10.99 | $ 10.75 | $ 10.87 | ||||||||||||||||||
|
| |||||||||||||||||||||||
Income From Investment Operations | ||||||||||||||||||||||||
Net investment income(b)(c) | .26 | .18 | .29 | .27 | .31 | .33 | ||||||||||||||||||
Net realized and unrealized gain (loss) on investment transactions | .37 | (.01 | ) | .37 | (.92 | ) | .27 | (.09 | ) | |||||||||||||||
|
| |||||||||||||||||||||||
Net increase (decrease) in net asset value from operations | .63 | .17 | .66 | (.65 | ) | .58 | .24 | |||||||||||||||||
|
| |||||||||||||||||||||||
Less: Dividends and Distributions | ||||||||||||||||||||||||
Dividends from net investment income | (.26 | ) | (.18 | ) | (.29 | ) | (.30 | ) | (.33 | ) | (.36 | ) | ||||||||||||
Distributions from net realized gain on investment transactions | – 0 | – | – 0 | – | – 0 | – | (.09 | ) | (.01 | ) | – 0 | – | ||||||||||||
|
| |||||||||||||||||||||||
Total dividends and distributions | (.26 | ) | (.18 | ) | (.29 | ) | (.39 | ) | (.34 | ) | (.36 | ) | ||||||||||||
|
| |||||||||||||||||||||||
Net asset value, end of period | $ 10.68 | $ 10.31 | $ 10.32 | $ 9.95 | $ 10.99 | $ 10.75 | ||||||||||||||||||
|
| |||||||||||||||||||||||
Total Return | ||||||||||||||||||||||||
Total investment return based on net asset value(d) | 6.16 | % | 1.63 | % | 6.69 | % | (6.15 | )% | 5.51 | % | 2.30 | % | ||||||||||||
Ratios/Supplemental Data | ||||||||||||||||||||||||
Net assets, end of period | $18,670 | $18,483 | $18,949 | $22,161 | $28,668 | $28,813 | ||||||||||||||||||
Ratio to average net assets of: | ||||||||||||||||||||||||
Expenses, net of waivers/reimbursements(e) | 1.60 | % | 1.60 | %^ | 1.60 | % | 1.65 | % | 1.71 | % | 1.71 | % | ||||||||||||
Expenses, before waivers/reimbursements(e) | 1.99 | % | 1.98 | %^ | 1.92 | % | 1.77 | % | 1.76 | % | 1.79 | % | ||||||||||||
Net investment income(b) | 2.46 | % | 2.58 | %^ | 2.83 | % | 2.55 | % | 2.86 | % | 3.15 | % | ||||||||||||
Portfolio turnover rate | 12 | % | 5 | % | 12 | % | 28 | % | 28 | % | 3 | % | ||||||||||||
See footnote summary on pages 182-183.
| 166 | • AB MUNICIPAL INCOME FUND II |
Financial Highlights
Selected Data For A Share Of Beneficial Interest Outstanding Throughout Each Period
| AB Minnesota Portfolio | ||||||||||||||||||||||||
| Class A | ||||||||||||||||||||||||
Year Ended May 31, 2016 | October 1, 2014 to May 31, | Year Ended September 30, | ||||||||||||||||||||||
| 2014 | 2013 | 2012 | 2011 | |||||||||||||||||||||
|
| |||||||||||||||||||||||
Net asset value, beginning of period | $ 10.33 | $ 10.46 | $ 10.13 | $ 10.72 | $ 10.35 | $ 10.35 | ||||||||||||||||||
|
| |||||||||||||||||||||||
Income From Investment Operations | ||||||||||||||||||||||||
Net investment income(b)(c) | .31 | .20 | .31 | .31 | .35 | .35 | ||||||||||||||||||
Net realized and unrealized gain (loss) on investment transactions | .22 | (.06 | ) | .35 | (.54 | ) | .38 | .01 | † | |||||||||||||||
|
| |||||||||||||||||||||||
Net increase (decrease) in net asset value from operations | .53 | .14 | .66 | (.23 | ) | .73 | .36 | |||||||||||||||||
|
| |||||||||||||||||||||||
Less: Dividends and Distributions | ||||||||||||||||||||||||
Dividends from net investment income | (.32 | ) | (.21 | ) | (.33 | ) | (.32 | ) | (.36 | ) | (.36 | ) | ||||||||||||
Distributions from net realized gain on investment transactions | – 0 | – | (.06 | ) | – 0 | – | (.04 | ) | – 0 | – | – 0 | – | ||||||||||||
|
| |||||||||||||||||||||||
Total dividends and distributions | (.32 | ) | (.27 | ) | (.33 | ) | (.36 | ) | (.36 | ) | (.36 | ) | ||||||||||||
|
| |||||||||||||||||||||||
Net asset value, end of period | $ 10.54 | $ 10.33 | $ 10.46 | $ 10.13 | $ 10.72 | $ 10.35 | ||||||||||||||||||
|
| |||||||||||||||||||||||
Total Return | ||||||||||||||||||||||||
Total investment return based on net asset value(d) | 5.24 | % | 1.37 | % | 6.60 | % | (2.24 | )% | 7.17 | % | 3.68 | % | ||||||||||||
Ratios/Supplemental Data | ||||||||||||||||||||||||
Net assets, end of period | $67,380 | $70,197 | $69,595 | $72,221 | $85,035 | $86,705 | ||||||||||||||||||
Ratio to average net assets of: | ||||||||||||||||||||||||
Expenses, net of waivers/reimbursements(e) | .86 | % | .88 | %^ | .90 | % | .90 | % | .91 | % | .90 | % | ||||||||||||
Expenses, before waivers/reimbursements(e) | 1.08 | % | 1.08 | %^ | 1.09 | % | 1.02 | % | 1.02 | % | 1.02 | % | ||||||||||||
Net investment income(b) | 2.94 | % | 2.90 | %^ | 3.04 | % | 2.93 | % | 3.29 | % | 3.48 | % | ||||||||||||
Portfolio turnover rate | 10 | % | 11 | % | 19 | % | 17 | % | 14 | % | 10 | % | ||||||||||||
See footnote summary on pages 182-183.
| AB MUNICIPAL INCOME FUND II • | 167 |
Financial Highlights
Selected Data For A Share Of Beneficial Interest Outstanding Throughout Each Period
| AB Minnesota Portfolio | ||||||||||||||||||||||||
| Class B | ||||||||||||||||||||||||
Year Ended May 31, 2016 | October 1, 2014 to May 31, 2015(a) | Year Ended September 30, | ||||||||||||||||||||||
| 2014 | 2013 | 2012 | 2011 | |||||||||||||||||||||
|
| |||||||||||||||||||||||
Net asset value, beginning of period | $ 10.33 | $ 10.45 | $ 10.12 | $ 10.71 | $ 10.35 | $ 10.35 | ||||||||||||||||||
|
| |||||||||||||||||||||||
Income From Investment Operations | ||||||||||||||||||||||||
Net investment income(b)(c) | .23 | .15 | .24 | .24 | .28 | .28 | ||||||||||||||||||
Net realized and unrealized gain (loss) on investment transactions | .23 | (.05 | ) | .35 | (.54 | ) | .37 | .01 | † | |||||||||||||||
|
| |||||||||||||||||||||||
Net increase (decrease) in net asset value from operations | .46 | .10 | .59 | (.30 | ) | .65 | .29 | |||||||||||||||||
|
| |||||||||||||||||||||||
Less: Dividends and Distributions | ||||||||||||||||||||||||
Dividends from net investment income | (.24 | ) | (.16 | ) | (.26 | ) | (.25 | ) | (.29 | ) | (.29 | ) | ||||||||||||
Distributions from net realized gain on investment transactions | – 0 | – | (.06 | ) | – 0 | – | (.04 | ) | – 0 | – | – 0 | – | ||||||||||||
|
| |||||||||||||||||||||||
Total dividends and distributions | (.24 | ) | (.22 | ) | (.26 | ) | (.29 | ) | (.29 | ) | (.29 | ) | ||||||||||||
|
| |||||||||||||||||||||||
Net asset value, end of period | $ 10.55 | $ 10.33 | $ 10.45 | $ 10.12 | $ 10.71 | $ 10.35 | ||||||||||||||||||
|
| |||||||||||||||||||||||
Total Return | ||||||||||||||||||||||||
Total investment return based on net asset value(d) | 4.55 | % | .98 | % | 5.86 | % | (2.92 | )% | 6.33 | % | 2.96 | % | ||||||||||||
Ratios/Supplemental Data | ||||||||||||||||||||||||
Net assets, end of period | $15 | $34 | $91 | $128 | $196 | $440 | ||||||||||||||||||
Ratio to average net assets of: | ||||||||||||||||||||||||
Expenses, net of waivers/reimbursements(e) | 1.60 | % | 1.60 | %^ | 1.60 | % | 1.60 | % | 1.61 | % | 1.60 | % | ||||||||||||
Expenses, before waivers/reimbursements(e) | 1.84 | % | 1.82 | %^ | 1.81 | % | 1.73 | % | 1.94 | % | 1.90 | % | ||||||||||||
Net investment income(b) | 2.20 | % | 2.18 | %^ | 2.34 | % | 2.23 | % | 2.62 | % | 2.77 | % | ||||||||||||
Portfolio turnover rate | 10 | % | 11 | % | 19 | % | 17 | % | 14 | % | 10 | % | ||||||||||||
See footnote summary on pages 182-183.
| 168 | • AB MUNICIPAL INCOME FUND II |
Financial Highlights
Selected Data For A Share Of Beneficial Interest Outstanding Throughout Each Period
| AB Minnesota Portfolio | ||||||||||||||||||||||||
| Class C | ||||||||||||||||||||||||
Year Ended 2016 | October 1, 2015(a) | Year Ended September 30, | ||||||||||||||||||||||
| 2014 | 2013 | 2012 | 2011 | |||||||||||||||||||||
|
| |||||||||||||||||||||||
Net asset value, beginning of period | $ 10.34 | $ 10.47 | $ 10.14 | $ 10.73 | $ 10.36 | $ 10.36 | ||||||||||||||||||
|
| |||||||||||||||||||||||
Income From Investment Operations | ||||||||||||||||||||||||
Net investment income(b)(c) | .23 | .15 | .24 | .24 | .27 | .28 | ||||||||||||||||||
Net realized and unrealized gain (loss) on investment transactions | .23 | (.06 | ) | .35 | (.54 | ) | .39 | .01 | † | |||||||||||||||
|
| |||||||||||||||||||||||
Net increase (decrease) in net asset value from operations | .46 | .09 | .59 | (.30 | ) | .66 | .29 | |||||||||||||||||
|
| |||||||||||||||||||||||
Less: Dividends and Distributions | ||||||||||||||||||||||||
Dividends from net investment income | (.25 | ) | (.16 | ) | (.26 | ) | (.25 | ) | (.29 | ) | (.29 | ) | ||||||||||||
Distributions from net realized gain on investment transactions | – 0 | – | (.06 | ) | – 0 | – | (.04 | ) | – 0 | – | – 0 | – | ||||||||||||
|
| |||||||||||||||||||||||
Total dividends and distributions | (.25 | ) | (.22 | ) | (.26 | ) | (.29 | ) | (.29 | ) | (.29 | ) | ||||||||||||
|
| |||||||||||||||||||||||
Net asset value, end of period | $ 10.55 | $ 10.34 | $ 10.47 | $ 10.14 | $ 10.73 | $ 10.36 | ||||||||||||||||||
|
| |||||||||||||||||||||||
Total Return | ||||||||||||||||||||||||
Total investment return based on net asset value(d) | 4.45 | % | .88 | % | 5.86 | % | (2.92 | )% | 6.41 | % | 2.95 | % | ||||||||||||
Ratios/Supplemental Data | ||||||||||||||||||||||||
Net assets, end of period | $16,178 | $15,680 | $16,126 | $19,064 | $22,445 | $20,838 | ||||||||||||||||||
Ratio to average net assets of: | ||||||||||||||||||||||||
Expenses, net of waivers/reimbursements(e) | 1.61 | % | 1.60 | %^ | 1.60 | % | 1.60 | % | 1.61 | % | 1.60 | % | ||||||||||||
Expenses, before waivers/reimbursements(e) | 1.84 | % | 1.81 | %^ | 1.79 | % | 1.72 | % | 1.72 | % | 1.73 | % | ||||||||||||
Net investment income(b) | 2.18 | % | 2.17 | %^ | 2.34 | % | 2.23 | % | 2.58 | % | 2.79 | % | ||||||||||||
Portfolio turnover rate | 10 | % | 11 | % | 19 | % | 17 | % | 14 | % | 10 | % | ||||||||||||
See footnote summary on pages 182-183.
| AB MUNICIPAL INCOME FUND II • | 169 |
Financial Highlights
Selected Data For A Share Of Beneficial Interest Outstanding Throughout Each Period
| AB New Jersey Portfolio | ||||||||||||||||||||||||
| Class A | ||||||||||||||||||||||||
Year Ended May 31, 2016 | October 1, 2014 to May 31, 2015(a) | Year Ended September 30, | ||||||||||||||||||||||
| 2014 | 2013 | 2012 | 2011 | |||||||||||||||||||||
|
| |||||||||||||||||||||||
Net asset value, beginning of period | $ 9.67 | $ 9.76 | $ 9.55 | $ 10.22 | $ 9.71 | $ 9.82 | ||||||||||||||||||
|
| |||||||||||||||||||||||
Income From Investment Operations | ||||||||||||||||||||||||
Net investment income(b)(c) | .32 | .22 | .35 | .33 | .37 | .39 | ||||||||||||||||||
Net realized and unrealized gain (loss) on investment transactions | .28 | (.08 | ) | .22 | (.66 | ) | .52 | (.11 | ) | |||||||||||||||
|
| |||||||||||||||||||||||
Net increase (decrease) in net asset value from operations | .60 | .14 | .57 | (.33 | ) | .89 | .28 | |||||||||||||||||
|
| |||||||||||||||||||||||
Less: Dividends | ||||||||||||||||||||||||
Dividends from net investment income | (.34 | ) | (.23 | ) | (.36 | ) | (.34 | ) | (.38 | ) | (.39 | ) | ||||||||||||
|
| |||||||||||||||||||||||
Net asset value, end of period | $ 9.93 | $ 9.67 | $ 9.76 | $ 9.55 | $ 10.22 | $ 9.71 | ||||||||||||||||||
|
| |||||||||||||||||||||||
Total Return | ||||||||||||||||||||||||
Total investment return based on net asset | 6.27 | % | 1.43 | % | 6.04 | % | (3.30 | )% | 9.29 | % | 3.08 | % | ||||||||||||
Ratios/Supplemental Data | ||||||||||||||||||||||||
Net assets, end of period | $87,365 | $90,559 | $100,039 | $113,048 | $122,671 | $118,468 | ||||||||||||||||||
Ratio to average net assets of: | ||||||||||||||||||||||||
Expenses, net of waivers/reimbursements | .82 | % | .85 | %^ | .87 | % | .87 | % | .87 | % | .87 | % | ||||||||||||
Expenses, before waivers/reimbursements | .99 | % | 1.00 | %^ | 1.00 | % | .95 | % | .96 | % | .97 | % | ||||||||||||
Net investment income(b) | 3.33 | % | 3.42 | %^ | 3.62 | % | 3.34 | % | 3.70 | % | 4.09 | % | ||||||||||||
Portfolio turnover rate | 14 | % | 2 | % | 16 | % | 30 | % | 14 | % | 0 | %(g) | ||||||||||||
See footnote summary on pages 182-183.
| 170 | • AB MUNICIPAL INCOME FUND II |
Financial Highlights
Selected Data For A Share Of Beneficial Interest Outstanding Throughout Each Period
| AB New Jersey Portfolio | ||||||||||||||||||||||||
| Class B | ||||||||||||||||||||||||
Year Ended 2016 | October 1, 2014 to May 31, 2015(a) | Year Ended September 30, | ||||||||||||||||||||||
| 2014 | 2013 | 2012 | 2011 | |||||||||||||||||||||
|
| |||||||||||||||||||||||
Net asset value, beginning of period | $ 9.67 | $ 9.76 | $ 9.55 | $ 10.22 | $ 9.71 | $ 9.82 | ||||||||||||||||||
|
| |||||||||||||||||||||||
Income From Investment Operations | ||||||||||||||||||||||||
Net investment income(b)(c) | .25 | .18 | .28 | .26 | .30 | .32 | ||||||||||||||||||
Net realized and unrealized gain (loss) on investment transactions | .27 | (.09 | ) | .22 | (.66 | ) | .52 | (.10 | ) | |||||||||||||||
|
| |||||||||||||||||||||||
Net increase (decrease) in net asset value from operations | .52 | .09 | .50 | (.40 | ) | .82 | .22 | |||||||||||||||||
|
| |||||||||||||||||||||||
Less: Dividends | ||||||||||||||||||||||||
Dividends from net investment income | (.26 | ) | (.18 | ) | (.29 | ) | (.27 | ) | (.31 | ) | (.33 | ) | ||||||||||||
|
| |||||||||||||||||||||||
Net asset value, end of period | $ 9.93 | $ 9.67 | $ 9.76 | $ 9.55 | $ 10.22 | $ 9.71 | ||||||||||||||||||
|
| |||||||||||||||||||||||
Total Return | ||||||||||||||||||||||||
Total investment return based on net asset value(d) | 5.48 | % | .95 | % | 5.32 | % | (3.97 | )% | 8.53 | % | 2.37 | % | ||||||||||||
Ratios/Supplemental Data | ||||||||||||||||||||||||
Net assets, end of period | $282 | $365 | $466 | $978 | $1,997 | $2,982 | ||||||||||||||||||
Ratio to average net assets of: | ||||||||||||||||||||||||
Expenses, net of waivers/reimbursements | 1.57 | % | 1.57 | %^ | 1.57 | % | 1.57 | % | 1.57 | % | 1.57 | % | ||||||||||||
Expenses, before waivers/reimbursements | 1.78 | % | 1.73 | %^ | 1.71 | % | 1.65 | % | 1.68 | % | 1.68 | % | ||||||||||||
Net investment income(b) | 2.58 | % | 2.70 | %^ | 2.94 | % | 2.62 | % | 3.02 | % | 3.39 | % | ||||||||||||
Portfolio turnover rate | 14 | % | 2 | % | 16 | % | 30 | % | 14 | % | 0 | %(g) | ||||||||||||
See footnote summary on pages 182-183.
| AB MUNICIPAL INCOME FUND II • | 171 |
Financial Highlights
Selected Data For A Share Of Beneficial Interest Outstanding Throughout Each Period
| AB New Jersey Portfolio | ||||||||||||||||||||||||
| Class C | ||||||||||||||||||||||||
Year Ended 2016 | October 1, 2014 to May 31, 2015(a) | Year Ended September 30, | ||||||||||||||||||||||
| 2014 | 2013 | 2012 | 2011 | |||||||||||||||||||||
|
| |||||||||||||||||||||||
Net asset value, beginning of period | $ 9.67 | $ 9.77 | $ 9.55 | $ 10.23 | $ 9.72 | $ 9.82 | ||||||||||||||||||
|
| |||||||||||||||||||||||
Income From Investment Operations | ||||||||||||||||||||||||
Net investment income(b)(c) | .25 | .18 | .28 | .26 | .30 | .32 | ||||||||||||||||||
Net realized and unrealized gain (loss) on investment transactions | .27 | (.10 | ) | .23 | (.67 | ) | .52 | (.09 | ) | |||||||||||||||
|
| |||||||||||||||||||||||
Net increase (decrease) in net asset value from operations | .52 | .08 | .51 | (.41 | ) | .82 | .23 | |||||||||||||||||
|
| |||||||||||||||||||||||
Less: Dividends | ||||||||||||||||||||||||
Dividends from net investment income | (.26 | ) | (.18 | ) | (.29 | ) | (.27 | ) | (.31 | ) | (.33 | ) | ||||||||||||
|
| |||||||||||||||||||||||
Net asset value, end of period | $ 9.93 | $ 9.67 | $ 9.77 | $ 9.55 | $ 10.23 | $ 9.72 | ||||||||||||||||||
|
| |||||||||||||||||||||||
Total Return | ||||||||||||||||||||||||
Total investment return based on net asset | 5.47 | % | .84 | % | 5.41 | % | (4.07 | )% | 8.52 | % | 2.47 | % | ||||||||||||
Ratios/Supplemental Data | ||||||||||||||||||||||||
Net assets, end of period | $30,094 | $28,419 | $29,694 | $32,846 | $37,604 | $34,224 | ||||||||||||||||||
Ratio to average net assets of: | ||||||||||||||||||||||||
Expenses, net of waivers/reimbursements | 1.57 | % | 1.57 | %^ | 1.57 | % | 1.57 | % | 1.57 | % | 1.57 | % | ||||||||||||
Expenses, before waivers/reimbursements | 1.74 | % | 1.72 | %^ | 1.70 | % | 1.65 | % | 1.66 | % | 1.67 | % | ||||||||||||
Net investment income(b) | 2.58 | % | 2.70 | %^ | 2.91 | % | 2.64 | % | 2.99 | % | 3.39 | % | ||||||||||||
Portfolio turnover rate | 14 | % | 2 | % | 16 | % | 30 | % | 14 | % | 0 | %(g) | ||||||||||||
See footnote summary on pages 182-183.
| 172 | • AB MUNICIPAL INCOME FUND II |
Financial Highlights
Selected Data For A Share Of Beneficial Interest Outstanding Throughout Each Period
| AB Ohio Portfolio | ||||||||||||||||||||||||
| Class A | ||||||||||||||||||||||||
Year Ended 2016 | October 1, 2014 to May 31, 2015(a) | Year Ended September 30, | ||||||||||||||||||||||
| 2014 | 2013 | 2012 | 2011 | |||||||||||||||||||||
|
| |||||||||||||||||||||||
Net asset value, beginning of period | $ 9.89 | $ 9.93 | $ 9.80 | $ 10.58 | $ 10.21 | $ 10.22 | ||||||||||||||||||
|
| |||||||||||||||||||||||
Income From Investment Operations | ||||||||||||||||||||||||
Net investment income(b)(c) | .29 | .21 | .34 | .34 | .37 | .37 | ||||||||||||||||||
Net realized and unrealized gain (loss) on investment transactions | .32 | (.03 | ) | .14 | (.72 | ) | .38 | (.01 | ) | |||||||||||||||
|
| |||||||||||||||||||||||
Net increase (decrease) in net asset value from operations | .61 | .18 | .48 | (.38 | ) | .75 | .36 | |||||||||||||||||
|
| |||||||||||||||||||||||
Less: Dividends and Distributions | ||||||||||||||||||||||||
Dividends from net investment income | (.30 | ) | (.22 | ) | (.35 | ) | (.35 | ) | (.38 | ) | (.37 | ) | ||||||||||||
Distributions from net realized gain on investment transactions | – 0 | – | – 0 | – | – 0 | – | (.05 | ) | – 0 | – | – 0 | – | ||||||||||||
|
| |||||||||||||||||||||||
Total dividends and distributions | (.30 | ) | (.22 | ) | (.35 | ) | (.40 | ) | (.38 | ) | (.37 | ) | ||||||||||||
|
| |||||||||||||||||||||||
Net asset value, end of period | $ 10.20 | $ 9.89 | $ 9.93 | $ 9.80 | $ 10.58 | $ 10.21 | ||||||||||||||||||
|
| |||||||||||||||||||||||
Total Return | ||||||||||||||||||||||||
Total investment return based on net asset value(d) | 6.29 | % | 1.76 | % | 5.04 | % | (3.77 | )% | 7.47 | % | 3.71 | % | ||||||||||||
Ratios/Supplemental Data | ||||||||||||||||||||||||
Net assets, end of period | $87,480 | $86,775 | $87,685 | $103,466 | $120,573 | $106,356 | ||||||||||||||||||
Ratio to average net assets of: | ||||||||||||||||||||||||
Expenses, net of waivers/reimbursements(e) | .80 | % | .83 | %^ | .85 | % | .86 | % | .86 | % | .85 | % | ||||||||||||
Expenses, before waivers/reimbursements(e) | .99 | % | 1.01 | %^ | 1.02 | % | .96 | % | .97 | % | .96 | % | ||||||||||||
Net investment income(b) | 2.90 | % | 3.11 | %^ | 3.50 | % | 3.27 | % | 3.55 | % | 3.65 | % | ||||||||||||
Portfolio turnover rate | 13 | % | 14 | % | 17 | % | 26 | % | 27 | % | 8 | % | ||||||||||||
See footnote summary on pages 182-183.
| AB MUNICIPAL INCOME FUND II • | 173 |
Financial Highlights
Selected Data For A Share Of Beneficial Interest Outstanding Throughout Each Period
| AB Ohio Portfolio | ||||||||||||||||||||||||
| Class B | ||||||||||||||||||||||||
Year Ended 2016 | October 1, May 31, 2015(a) | Year Ended September 30, | ||||||||||||||||||||||
| 2014 | 2013 | 2012 | 2011 | |||||||||||||||||||||
|
| |||||||||||||||||||||||
Net asset value, beginning of period | $ 9.88 | $ 9.92 | $ 9.79 | $ 10.57 | $ 10.20 | $ 10.21 | ||||||||||||||||||
|
| |||||||||||||||||||||||
Income From Investment Operations | ||||||||||||||||||||||||
Net investment income(b)(c) | .22 | .16 | .28 | .26 | .30 | .29 | ||||||||||||||||||
Net realized and unrealized gain (loss) on investment transactions | .31 | (.03 | ) | .14 | (.71 | ) | .38 | .01 | † | |||||||||||||||
|
| |||||||||||||||||||||||
Net increase (decrease) in net asset value from operations | .53 | .13 | .42 | (.45 | ) | .68 | .30 | |||||||||||||||||
|
| |||||||||||||||||||||||
Less: Dividends and Distributions | ||||||||||||||||||||||||
Dividends from net investment income | (.23 | ) | (.17 | ) | (.29 | ) | (.28 | ) | (.31 | ) | (.31 | ) | ||||||||||||
Distributions from net realized gain on investment transactions | – 0 | – | – 0 | – | – 0 | – | (.05 | ) | – 0 | – | – 0 | – | ||||||||||||
|
| |||||||||||||||||||||||
Total dividends and distributions | (.23 | ) | (.17 | ) | (.29 | ) | (.33 | ) | (.31 | ) | (.31 | ) | ||||||||||||
|
| |||||||||||||||||||||||
Net asset value, end of period | $ 10.18 | $ 9.88 | $ 9.92 | $ 9.79 | $ 10.57 | $ 10.20 | ||||||||||||||||||
|
| |||||||||||||||||||||||
Total Return | ||||||||||||||||||||||||
Total investment return based on net asset | 5.40 | % | 1.28 | % | 4.32 | % | (4.43 | ) % | 6.74 | % | 3.00 | % | ||||||||||||
Ratios/Supplemental Data | ||||||||||||||||||||||||
Net assets, end of period | $52 | $144 | $209 | $810 | $1,833 | $3,082 | ||||||||||||||||||
Ratio to average net assets of: | ||||||||||||||||||||||||
Expenses, net of waivers/reimbursements(e) | 1.55 | % | 1.55 | %^ | 1.55 | % | 1.56 | % | 1.55 | % | 1.55 | % | ||||||||||||
Expenses, before waivers/reimbursements(e) | 1.75 | % | 1.75 | %^ | 1.72 | % | 1.66 | % | 1.70 | % | 1.68 | % | ||||||||||||
Net investment income(b) | 2.18 | % | 2.39 | %^ | 2.85 | % | 2.57 | % | 2.90 | % | 2.94 | % | ||||||||||||
Portfolio turnover rate | 13 | % | 14 | % | 17 | % | 26 | % | 27 | % | 8 | % | ||||||||||||
See footnote summary on pages 182-183.
| 174 | • AB MUNICIPAL INCOME FUND II |
Financial Highlights
Selected Data For A Share Of Beneficial Interest Outstanding Throughout Each Period
| AB Ohio Portfolio | ||||||||||||||||||||||||
| Class C | ||||||||||||||||||||||||
Year Ended 2016 | October 1, 2014 to May 31, 2015(a) | Year Ended September 30, | ||||||||||||||||||||||
| 2014 | 2013 | 2012 | 2011 | |||||||||||||||||||||
|
| |||||||||||||||||||||||
Net asset value, beginning of period | $ 9.88 | $ 9.92 | $ 9.80 | $ 10.58 | $ 10.20 | $ 10.21 | ||||||||||||||||||
|
| |||||||||||||||||||||||
Income From Investment Operations | ||||||||||||||||||||||||
Net investment income(b)(c) | .22 | .16 | .27 | .27 | .30 | .30 | ||||||||||||||||||
Net realized and unrealized gain (loss) on investment transactions | .32 | (.03 | ) | .14 | (.73 | ) | .39 | .00 | (f)† | |||||||||||||||
|
| |||||||||||||||||||||||
Net increase (decrease) in net asset value from operations | .54 | .13 | .41 | (.46 | ) | .69 | .30 | |||||||||||||||||
|
| |||||||||||||||||||||||
Less: Dividends and Distributions | ||||||||||||||||||||||||
Dividends from net investment income | (.23 | ) | (.17 | ) | (.29 | ) | (.27 | ) | (.31 | ) | (.31 | ) | ||||||||||||
Distributions from net realized gain on investment transactions | – 0 | – | – 0 | – | – 0 | – | (.05 | ) | – 0 | – | – 0 | – | ||||||||||||
|
| |||||||||||||||||||||||
Total dividends and distributions | (.23 | ) | (.17 | ) | (.29 | ) | (.32 | ) | (.31 | ) | (.31 | ) | ||||||||||||
|
| |||||||||||||||||||||||
Net asset value, end of period | $ 10.19 | $ 9.88 | $ 9.92 | $ 9.80 | $ 10.58 | $ 10.20 | ||||||||||||||||||
|
| |||||||||||||||||||||||
Total Return | ||||||||||||||||||||||||
Total investment return based on net asset | 5.50 | % | 1.28 | % | 4.21 | % | (4.44 | )% | 6.83 | % | 2.99 | % | ||||||||||||
Ratios/Supplemental Data | ||||||||||||||||||||||||
Net assets, end of period | $27,045 | $29,673 | $31,409 | $37,947 | $43,943 | $41,520 | ||||||||||||||||||
Ratio to average net assets of: | ||||||||||||||||||||||||
Expenses, net of waivers/reimbursements(e) | 1.55 | % | 1.55 | %^ | 1.55 | % | 1.56 | % | 1.56 | % | 1.55 | % | ||||||||||||
Expenses, before waivers/reimbursements(e) | 1.74 | % | 1.74 | %^ | 1.72 | % | 1.66 | % | 1.67 | % | 1.66 | % | ||||||||||||
Net investment income(b) | 2.15 | % | 2.39 | %^ | 2.81 | % | 2.58 | % | 2.86 | % | 2.96 | % | ||||||||||||
Portfolio turnover rate | 13 | % | 14 | % | 17 | % | 26 | % | 27 | % | 8 | % | ||||||||||||
See footnote summary on pages 182-183.
| AB MUNICIPAL INCOME FUND II • | 175 |
Financial Highlights
Selected Data For A Share Of Beneficial Interest Outstanding Throughout Each Period
| AB Pennsylvania Portfolio | ||||||||||||||||||||||||
| Class A | ||||||||||||||||||||||||
Year Ended 2016 | October 1, 2014 to May 31, 2015(a) | Year Ended September 30, | ||||||||||||||||||||||
| 2014 | 2013 | 2012 | 2011 | |||||||||||||||||||||
|
| |||||||||||||||||||||||
Net asset value, beginning of period | $ 10.42 | $ 10.43 | $ 10.11 | $ 10.95 | $ 10.43 | $ 10.55 | ||||||||||||||||||
|
| |||||||||||||||||||||||
Income From Investment Operations | ||||||||||||||||||||||||
Net investment income(b)(c) | .32 | .22 | .34 | .34 | .37 | .40 | ||||||||||||||||||
Net realized and unrealized gain (loss) on investment transactions | .28 | (.01 | ) | .35 | (.75 | ) | .53 | (.03 | ) | |||||||||||||||
|
| |||||||||||||||||||||||
Net increase (decrease) in net asset value from operations | .60 | .21 | .69 | (.41 | ) | .90 | .37 | |||||||||||||||||
|
| |||||||||||||||||||||||
Less: Dividends and Distributions | ||||||||||||||||||||||||
Dividends from net investment income | (.32 | ) | (.22 | ) | (.34 | ) | (.34 | ) | (.37 | ) | (.40 | ) | ||||||||||||
Distributions from net realized gain on investment transactions | – 0 | – | – 0 | – | (.03 | ) | (.09 | ) | (.01 | ) | (.09 | ) | ||||||||||||
|
| |||||||||||||||||||||||
Total dividends and distributions | (.32 | ) | (.22 | ) | (.37 | ) | (.43 | ) | (.38 | ) | (.49 | ) | ||||||||||||
|
| |||||||||||||||||||||||
Net asset value, end of period | $ 10.70 | $ 10.42 | $ 10.43 | $ 10.11 | $ 10.95 | $ 10.43 | ||||||||||||||||||
|
| |||||||||||||||||||||||
Total Return | ||||||||||||||||||||||||
Total investment return based on net asset value(d) | 5.83 | % | 1.99 | % | 6.93 | % | (3.82 | )% | 8.74 | % | 3.75 | % | ||||||||||||
Ratios/Supplemental Data | ||||||||||||||||||||||||
Net assets, end of period | $74,734 | $78,907 | $82,402 | $88,199 | $105,045 | $101,432 | ||||||||||||||||||
Ratio to average net assets of: | ||||||||||||||||||||||||
Expenses, net of waivers/reimbursements | .85 | % | .88 | %^ | .90 | % | .92 | % | .95 | % | .95 | % | ||||||||||||
Expenses, before waivers/reimbursements | 1.03 | % | 1.04 | %^ | 1.07 | % | 1.01 | % | .99 | % | 1.00 | % | ||||||||||||
Net investment income(b) | 3.02 | % | 3.10 | %^ | 3.29 | % | 3.23 | % | 3.44 | % | 3.90 | % | ||||||||||||
Portfolio turnover rate | 11 | % | 2 | % | 25 | % | 17 | % | 20 | % | 6 | % | ||||||||||||
See footnote summary on pages 182-183.
| 176 | • AB MUNICIPAL INCOME FUND II |
Financial Highlights
Selected Data For A Share Of Beneficial Interest Outstanding Throughout Each Period
| AB Pennsylvania Portfolio | ||||||||||||||||||||||||
| Class B | ||||||||||||||||||||||||
Year Ended 2016 | October 1, 2014 to May 31, 2015(a) | Year Ended September 30, | ||||||||||||||||||||||
| 2014 | 2013 | 2012 | 2011 | |||||||||||||||||||||
|
| |||||||||||||||||||||||
Net asset value, beginning of period | $ 10.42 | $ 10.43 | $ 10.11 | $ 10.95 | $ 10.43 | $ 10.55 | ||||||||||||||||||
|
| |||||||||||||||||||||||
Income From Investment Operations | ||||||||||||||||||||||||
Net investment income(b)c) | .24 | .17 | .27 | .27 | .29 | .32 | ||||||||||||||||||
Net realized and unrealized gain (loss) on investment transactions | .28 | (.01 | ) | .34 | (.75 | ) | .53 | (.02 | ) | |||||||||||||||
|
| |||||||||||||||||||||||
Net increase (decrease) in net asset value from operations | .52 | .16 | .61 | (.48 | ) | .82 | .30 | |||||||||||||||||
|
| |||||||||||||||||||||||
Less: Dividends and Distributions | ||||||||||||||||||||||||
Dividends from net investment income | (.24 | ) | (.17 | ) | (.26 | ) | (.27 | ) | (.29 | ) | (.33 | ) | ||||||||||||
Distributions from net realized gain on investment transactions | – 0 | – | – 0 | – | (.03 | ) | (.09 | ) | (.01 | ) | (.09 | ) | ||||||||||||
|
| |||||||||||||||||||||||
Total dividends and distributions | (.24 | ) | (.17 | ) | (.29 | ) | (.36 | ) | (.30 | ) | (.42 | ) | ||||||||||||
|
| |||||||||||||||||||||||
Net asset value, end of period | $ 10.70 | $ 10.42 | $ 10.43 | $ 10.11 | $ 10.95 | $ 10.43 | ||||||||||||||||||
|
| |||||||||||||||||||||||
Total Return | ||||||||||||||||||||||||
Total investment return based on net asset value(d) | 5.04 | % | 1.50 | % | 6.19 | % | (4.49 | )% | 7.99 | % | 3.03 | % | ||||||||||||
Ratios/Supplemental Data | ||||||||||||||||||||||||
Net assets, end of period | $74 | $168 | $340 | $901 | $1,699 | $3,164 | ||||||||||||||||||
Ratio to average net assets of: | ||||||||||||||||||||||||
Expenses, net of waivers/reimbursements | 1.60 | % | 1.60 | %^ | 1.60 | % | 1.62 | % | 1.65 | % | 1.65 | % | ||||||||||||
Expenses, before waivers/reimbursements | 1.88 | % | 1.79 | %^ | 1.78 | % | 1.72 | % | 1.71 | % | 1.72 | % | ||||||||||||
Net investment income(b) | 2.28 | % | 2.38 | %^ | 2.62 | % | 2.51 | % | 2.77 | % | 3.19 | % | ||||||||||||
Portfolio turnover rate | 11 | % | 2 | % | 25 | % | 17 | % | 20 | % | 6 | % | ||||||||||||
See footnote summary on pages 182-183.
| AB MUNICIPAL INCOME FUND II • | 177 |
Financial Highlights
Selected Data For A Share Of Beneficial Interest Outstanding Throughout Each Period
| AB Pennsylvania Portfolio | ||||||||||||||||||||||||
| Class C | ||||||||||||||||||||||||
Year Ended 2016 | October 1, 2014 to May 31, 2015(a) | Year Ended September 30, | ||||||||||||||||||||||
| 2014 | 2013 | 2012 | 2011 | |||||||||||||||||||||
|
| |||||||||||||||||||||||
Net asset value, beginning of period | $ 10.42 | $ 10.43 | $ 10.11 | $ 10.95 | $ 10.44 | $ 10.55 | ||||||||||||||||||
|
| |||||||||||||||||||||||
Income From Investment Operations | ||||||||||||||||||||||||
Net investment income(b)(c) | .24 | .17 | .26 | .27 | .29 | .32 | ||||||||||||||||||
Net realized and unrealized gain (loss) on investment transactions | .28 | (.01 | ) | .35 | (.75 | ) | .52 | (.01 | ) | |||||||||||||||
|
| |||||||||||||||||||||||
Net increase (decrease) in net asset value from operations | .52 | .16 | .61 | (.48 | ) | .81 | .31 | |||||||||||||||||
|
| |||||||||||||||||||||||
Less: Dividends and Distributions | ||||||||||||||||||||||||
Dividends from net investment income | (.24 | ) | (.17 | ) | (.26 | ) | (.27 | ) | (.29 | ) | (.33 | ) | ||||||||||||
Distributions from net realized gain on investment transactions | – 0 | – | – 0 | – | (.03 | ) | (.09 | ) | (.01 | ) | (.09 | ) | ||||||||||||
|
| |||||||||||||||||||||||
Total dividends and distributions | (.24 | ) | (.17 | ) | (.29 | ) | (.36 | ) | (.30 | ) | (.42 | ) | ||||||||||||
|
| |||||||||||||||||||||||
Net asset value, end of period | $ 10.70 | $ 10.42 | $ 10.43 | $ 10.11 | $ 10.95 | $ 10.44 | ||||||||||||||||||
|
| |||||||||||||||||||||||
Total Return | ||||||||||||||||||||||||
Total investment return based on net asset value(d) | 5.04 | % | 1.49 | % | 6.19 | % | (4.49 | )% | 7.88 | % | 3.13 | % | ||||||||||||
Ratios/Supplemental Data | ||||||||||||||||||||||||
Net assets, end of period | $22,356 | $21,635 | $22,057 | $23,789 | $28,555 | $25,694 | ||||||||||||||||||
Ratio to average net assets of: | ||||||||||||||||||||||||
Expenses, net of waivers/reimbursements | 1.60 | % | 1.60 | %^ | 1.60 | % | 1.62 | % | 1.65 | % | 1.65 | % | ||||||||||||
Expenses, before waivers/reimbursements | 1.78 | % | 1.77 | %^ | 1.77 | % | 1.71 | % | 1.69 | % | 1.71 | % | ||||||||||||
Net investment income(b) | 2.27 | % | 2.38 | %^ | 2.59 | % | 2.53 | % | 2.74 | % | 3.19 | % | ||||||||||||
Portfolio turnover rate | 11 | % | 2 | % | 25 | % | 17 | % | 20 | % | 6 | % | ||||||||||||
See footnote summary on pages 182-183.
| 178 | • AB MUNICIPAL INCOME FUND II |
Financial Highlights
Selected Data For A Share Of Beneficial Interest Outstanding Throughout Each Period
| AB Virginia Portfolio | ||||||||||||||||||||||||
| Class A | ||||||||||||||||||||||||
Year Ended 2016 | October 1, 2014 to May 31, 2015(a) | Year Ended September 30, | ||||||||||||||||||||||
| 2014 | 2013 | 2012 | 2011 | |||||||||||||||||||||
|
| |||||||||||||||||||||||
Net asset value, beginning of period | $ 11.11 | $ 11.13 | $ 10.70 | $ 11.61 | $ 11.12 | $ 11.07 | ||||||||||||||||||
|
| |||||||||||||||||||||||
Income From Investment Operations | ||||||||||||||||||||||||
Net investment income(b)(c) | .34 | .23 | .36 | .34 | .37 | .41 | ||||||||||||||||||
Net realized and unrealized gain (loss) on investment transactions | .29 | (.01 | ) | .44 | (.81 | ) | .56 | .09 | ||||||||||||||||
|
| |||||||||||||||||||||||
Net increase (decrease) in net asset value from operations | .63 | .22 | .80 | (.47 | ) | .93 | .50 | |||||||||||||||||
|
| |||||||||||||||||||||||
Less: Dividends and Distributions | ||||||||||||||||||||||||
Dividends from net investment income | (.35 | ) | (.24 | ) | (.37 | ) | (.35 | ) | (.38 | ) | (.43 | ) | ||||||||||||
Distributions from net realized gain on investment transactions | – 0 | – | – 0 | – | – 0 | – | (.09 | ) | (.06 | ) | (.02 | ) | ||||||||||||
|
| |||||||||||||||||||||||
Total dividends and distributions | (.35 | ) | (.24 | ) | (.37 | ) | (.44 | ) | (.44 | ) | (.45 | ) | ||||||||||||
|
| |||||||||||||||||||||||
Net asset value, end of period | $ 11.39 | $ 11.11 | $ 11.13 | $ 10.70 | $ 11.61 | $ 11.12 | ||||||||||||||||||
|
| |||||||||||||||||||||||
Total Return | ||||||||||||||||||||||||
Total investment return based on net asset value(d) | 5.77 | % | 1.94 | % | 7.60 | % | (4.21 | )% | 8.55 | % | 4.72 | % | ||||||||||||
Ratios/Supplemental Data | ||||||||||||||||||||||||
Net assets, end of period | $189,953 | $181,642 | $173,381 | $186,429 | $228,317 | $189,326 | ||||||||||||||||||
Ratio to average net assets of: | ||||||||||||||||||||||||
Expenses, net of waivers/reimbursements | .80 | % | .80 | %^ | .80 | % | .77 | % | .72 | % | .72 | % | ||||||||||||
Expenses, before waivers/reimbursements | .87 | % | .90 | %^ | .92 | % | .88 | % | .89 | % | .91 | % | ||||||||||||
Net investment income(b) | 3.02 | % | 3.05 | %^ | 3.29 | % | 2.98 | % | 3.28 | % | 3.84 | % | ||||||||||||
Portfolio turnover rate | 7 | % | 5 | % | 8 | % | 16 | % | 23 | % | 24 | % | ||||||||||||
See footnote summary on pages 182-183.
| AB MUNICIPAL INCOME FUND II • | 179 |
Financial Highlights
Selected Data For A Share Of Beneficial Interest Outstanding Throughout Each Period
| AB Virginia Portfolio | ||||||||||||||||||||||||
| Class B | ||||||||||||||||||||||||
Year Ended 2016 | October 1, 2014 to May 31, 2015(a) | Year Ended September 30, | ||||||||||||||||||||||
| 2014 | 2013 | 2012 | 2011 | |||||||||||||||||||||
|
| |||||||||||||||||||||||
Net asset value, beginning of period | $ 11.09 | $ 11.11 | $ 10.68 | $ 11.59 | $ 11.10 | $ 11.05 | ||||||||||||||||||
|
| |||||||||||||||||||||||
Income From Investment Operations | ||||||||||||||||||||||||
Net investment income(b)(c) | .26 | .17 | .29 | .26 | .29 | .34 | ||||||||||||||||||
Net realized and unrealized gain (loss) on investment transactions | .29 | (.01 | ) | .43 | (.81 | ) | .56 | .08 | ||||||||||||||||
|
| |||||||||||||||||||||||
Net increase (decrease) in net asset value from operations | .55 | .16 | .72 | (.55 | ) | .85 | .42 | |||||||||||||||||
|
| |||||||||||||||||||||||
Less: Dividends and Distributions | ||||||||||||||||||||||||
Dividends from net investment income | (.27 | ) | (.18 | ) | (.29 | ) | (.27 | ) | (.30 | ) | (.35 | ) | ||||||||||||
Distributions from net realized gain on investment transactions | – 0 | – | – 0 | – | – 0 | – | (.09 | ) | (.06 | ) | (.02 | ) | ||||||||||||
|
| |||||||||||||||||||||||
Total dividends and distributions | (.27 | ) | (.18 | ) | (.29 | ) | (.36 | ) | (.36 | ) | (.37 | ) | ||||||||||||
|
| |||||||||||||||||||||||
Net asset value, end of period | $ 11.37 | $ 11.09 | $ 11.11 | $ 10.68 | $ 11.59 | $ 11.10 | ||||||||||||||||||
|
| |||||||||||||||||||||||
Total Return | ||||||||||||||||||||||||
Total investment return based on net asset value(d) | 4.99 | % | 1.46 | % | 6.87 | % | (4.88 | )% | 7.83 | % | 4.01 | % | ||||||||||||
Ratios/Supplemental Data | ||||||||||||||||||||||||
Net assets, end of period | $126 | $340 | $668 | $1,267 | $2,083 | $3,132 | ||||||||||||||||||
Ratio to average net assets of: | ||||||||||||||||||||||||
Expenses, net of waivers/reimbursements | 1.55 | % | 1.52 | %^ | 1.50 | % | 1.47 | % | 1.42 | % | 1.42 | % | ||||||||||||
Expenses, before waivers/reimbursements | 1.65 | % | 1.63 | %^ | 1.62 | % | 1.59 | % | 1.61 | % | 1.63 | % | ||||||||||||
Net investment income(b) | 2.28 | % | 2.34 | %^ | 2.63 | % | 2.28 | % | 2.62 | % | 3.15 | % | ||||||||||||
Portfolio turnover rate | 7 | % | 5 | % | 8 | % | 16 | % | 23 | % | 24 | % | ||||||||||||
See footnote summary on pages 182-183.
| 180 | • AB MUNICIPAL INCOME FUND II |
Financial Highlights
Selected Data For A Share Of Beneficial Interest Outstanding Throughout Each Period
| AB Virginia Portfolio | ||||||||||||||||||||||||
| Class C | ||||||||||||||||||||||||
Year Ended 2016 | October 1, 2014 to May 31, 2015(a) | Year Ended September 30, | ||||||||||||||||||||||
| 2014 | 2013 | 2012 | 2011 | |||||||||||||||||||||
|
| |||||||||||||||||||||||
Net asset value, beginning of period | $ 11.08 | $ 11.10 | $ 10.67 | $ 11.59 | $ 11.09 | $ 11.04 | ||||||||||||||||||
|
| |||||||||||||||||||||||
Income From Investment Operations | ||||||||||||||||||||||||
Net investment income(b)(c) | .25 | .17 | .28 | .26 | .29 | .34 | ||||||||||||||||||
Net realized and unrealized gain (loss) on investment transactions | .30 | (.01 | ) | .44 | (.82 | ) | .57 | .08 | ||||||||||||||||
|
| |||||||||||||||||||||||
Net increase (decrease) in net asset value from operations | .55 | .16 | .72 | (.56 | ) | .86 | .42 | |||||||||||||||||
|
| |||||||||||||||||||||||
Less: Dividends and Distributions | ||||||||||||||||||||||||
Dividends from net investment income | (.27 | ) | (.18 | ) | (.29 | ) | (.27 | ) | (.30 | ) | (.35 | ) | ||||||||||||
Distributions from net realized gain on investment transactions | – 0 | – | – 0 | – | – 0 | – | (.09 | ) | (.06 | ) | (.02 | ) | ||||||||||||
|
| |||||||||||||||||||||||
Total dividends and distributions | (.27 | ) | (.18 | ) | (.29 | ) | (.36 | ) | (.36 | ) | (.37 | ) | ||||||||||||
|
| |||||||||||||||||||||||
Net asset value, end of period | $ 11.36 | $ 11.08 | $ 11.10 | $ 10.67 | $ 11.59 | $ 11.09 | ||||||||||||||||||
|
| |||||||||||||||||||||||
Total Return | ||||||||||||||||||||||||
Total investment return based on net asset value(d) | 5.00 | % | 1.46 | % | 6.88 | % | (4.97 | )% | 7.91 | % | 4.01 | % | ||||||||||||
Ratios/Supplemental Data | ||||||||||||||||||||||||
Net assets, end of period | $56,080 | $54,359 | $55,038 | $59,194 | $73,102 | $61,044 | ||||||||||||||||||
Ratio to average net assets of: | ||||||||||||||||||||||||
Expenses, net of waivers/reimbursements | 1.55 | % | 1.53 | %^ | 1.50 | % | 1.47 | % | 1.42 | % | 1.42 | % | ||||||||||||
Expenses, before waivers/reimbursements | 1.62 | % | 1.63 | %^ | 1.62 | % | 1.59 | % | 1.59 | % | 1.61 | % | ||||||||||||
Net investment income(b) | 2.28 | % | 2.34 | %^ | 2.60 | % | 2.29 | % | 2.59 | % | 3.14 | % | ||||||||||||
Portfolio turnover rate | 7 | % | 5 | % | 8 | % | 16 | % | 23 | % | 24 | % | ||||||||||||
See footnote summary on pages 182-183.
| AB MUNICIPAL INCOME FUND II • | 181 |
Financial Highlights
| (a) | The Portfolio changed its fiscal year end from September 30 to May 31. |
| (b) | Net of fees waived and expenses reimbursed by the Adviser. |
| (c) | Based on average shares outstanding. |
| (d) | Total investment return is calculated assuming an initial investment made at the net asset value at the beginning of the period, reinvestment of all dividends and distributions at net asset value during the period, and redemption on the last day of the period. Initial sales charges or contingent deferred sales charges are not reflected in the calculation of total investment return. Total return does not reflect the deduction of taxes that a shareholder would pay on fund distributions or the redemption of fund shares. Total investment return calculated for a period of less than one year is not annualized. |
| (e) | The expense ratios presented below exclude interest expense: |
Year Ended May 31, | October 1, 2014 to May 31, 2015(a) | Year Ended September 30, | ||||||||||||||||||||||
| 2014 | 2013 | 2012 | 2011 | |||||||||||||||||||||
|
|
|
|
|
|
|
|
|
|
|
| |||||||||||||
AB Arizona Portfolio | ||||||||||||||||||||||||
Class A | ||||||||||||||||||||||||
Net of waivers | .78 | % | .78 | %^ | .78 | % | .78 | % | .78 | % | .78 | % | ||||||||||||
Before waivers | .96 | % | .97 | %^ | .98 | % | .92 | % | .94 | % | .95 | % | ||||||||||||
Class B | ||||||||||||||||||||||||
Net of waivers | 1.53 | % | 1.50 | %^ | 1.48 | % | 1.48 | % | 1.48 | % | 1.48 | % | ||||||||||||
Before waivers | 1.71 | % | 1.70 | %^ | 1.68 | % | 1.63 | % | 1.66 | % | 1.67 | % | ||||||||||||
Class C | ||||||||||||||||||||||||
Net of waivers | 1.53 | % | 1.50 | %^ | 1.48 | % | 1.48 | % | 1.48 | % | 1.48 | % | ||||||||||||
Before waivers | 1.71 | % | 1.70 | %^ | 1.68 | % | 1.63 | % | 1.64 | % | 1.66 | % | ||||||||||||
AB Michigan Portfolio | ||||||||||||||||||||||||
Class A | ||||||||||||||||||||||||
Net of waivers | .85 | % | .88 | %^ | .90 | % | .94 | % | 1.01 | % | 1.01 | % | ||||||||||||
Before waivers | 1.24 | % | 1.25 | %^ | 1.21 | % | 1.05 | % | 1.05 | % | 1.09 | % | ||||||||||||
Class B | ||||||||||||||||||||||||
Net of waivers | 1.60 | % | 1.60 | %^ | 1.60 | % | 1.65 | % | 1.71 | % | 1.71 | % | ||||||||||||
Before waivers | 2.00 | % | 1.99 | %^ | 1.93 | % | 1.76 | % | 1.78 | % | 1.80 | % | ||||||||||||
Class C | ||||||||||||||||||||||||
Net of waivers | 1.60 | % | 1.60 | %^ | 1.60 | % | 1.64 | % | 1.71 | % | 1.71 | % | ||||||||||||
Before waivers | 1.99 | % | 1.98 | %^ | 1.92 | % | 1.76 | % | 1.76 | % | 1.79 | % | ||||||||||||
AB Minnesota Portfolio | ||||||||||||||||||||||||
Class A | ||||||||||||||||||||||||
Net of waivers | .85 | % | .88 | %^ | .90 | % | .90 | % | .90 | % | .90 | % | ||||||||||||
Before waivers | 1.08 | % | 1.08 | %^ | 1.09 | % | 1.02 | % | 1.02 | % | 1.02 | % | ||||||||||||
Class B | ||||||||||||||||||||||||
Net of waivers | 1.60 | % | 1.60 | %^ | 1.60 | % | 1.60 | % | 1.60 | % | 1.60 | % | ||||||||||||
Before waivers | 1.84 | % | 1.82 | %^ | 1.81 | % | 1.73 | % | 1.94 | % | 1.90 | % | ||||||||||||
Class C | ||||||||||||||||||||||||
Net of waivers | 1.60 | % | 1.60 | %^ | 1.60 | % | 1.60 | % | 1.60 | % | 1.60 | % | ||||||||||||
Before waivers | 1.83 | % | 1.81 | %^ | 1.79 | % | 1.72 | % | 1.72 | % | 1.73 | % | ||||||||||||
| 182 | • AB MUNICIPAL INCOME FUND II |
Financial Highlights
Year Ended May 31, | October 1, 2014 to May 31, 2015(a) | Year Ended September 30, | ||||||||||||||||||||||
| 2014 | 2013 | 2012 | 2011 | |||||||||||||||||||||
|
|
|
|
|
|
|
|
|
|
|
| |||||||||||||
AB Ohio Portfolio | ||||||||||||||||||||||||
Class A | ||||||||||||||||||||||||
Net of waivers | .80 | % | .83 | %^ | .85 | % | .85 | % | .85 | % | .85 | % | ||||||||||||
Before waivers | .99 | % | 1.01 | %^ | 1.01 | % | .96 | % | .96 | % | .96 | % | ||||||||||||
Class B | ||||||||||||||||||||||||
Net of waivers | 1.55 | % | 1.55 | %^ | 1.55 | % | 1.55 | % | 1.55 | % | 1.55 | % | ||||||||||||
Before waivers | 1.75 | % | 1.75 | %^ | 1.72 | % | 1.66 | % | 1.69 | % | 1.68 | % | ||||||||||||
Class C | ||||||||||||||||||||||||
Net of waivers | 1.55 | % | 1.55 | %^ | 1.55 | % | 1.55 | % | 1.55 | % | 1.55 | % | ||||||||||||
Before waivers | 1.74 | % | 1.74 | %^ | 1.72 | % | 1.66 | % | 1.66 | % | 1.66 | % | ||||||||||||
| (f) | Amount is less than $.005. |
| (g) | Amount is less than .005%. |
| ^ | Annualized. |
| † | Due to timing of sales and repurchase of capital shares, the net realized and unrealized gain (loss) per share is not in accord with the Portfolio’s change in net realized and unrealized gain (loss) on investment transactions for the period. |
See notes to financial statements.
| AB MUNICIPAL INCOME FUND II • | 183 |
Financial Highlights
REPORT OF INDEPENDENT REGISTERED
PUBLIC ACCOUNTING FIRM
To the Board of Trustees and Shareholders of
AB Municipal Income Fund II
We have audited the accompanying statements of assets and liabilities, including the portfolios of investments, of AB Municipal Income Fund II (the “Fund”), comprising, respectively, the Arizona, Massachusetts, Michigan, Minnesota, New Jersey, Ohio, Pennsylvania and Virginia Portfolios, as of May 31, 2016, and the related statements of operations for the year then ended, the statements of changes in net assets for the year then ended, the period October 1, 2014 to May 31, 2015 and the year ended September 30, 2014, and the financial highlights for each of the periods indicated therein. These financial statements and financial highlights are the responsibility of the Fund’s management. Our responsibility is to express an opinion on these financial statements and financial highlights based on our audits.
We conducted our audits in accordance with the standards of the Public Company Accounting Oversight Board (United States). Those standards require that we plan and perform the audit to obtain reasonable assurance about whether the financial statements and financial highlights are free of material misstatement. We were not engaged to perform an audit of the Fund’s internal control over financial reporting. Our audits included consideration of internal control over financial reporting as a basis for designing audit procedures that are appropriate in the circumstances, but not for the purpose of expressing an opinion on the effectiveness of the Fund’s internal control over financial reporting. Accordingly, we express no such opinion. An audit also includes examining, on a test basis, evidence supporting the amounts and disclosures in the financial statements and financial highlights, assessing the accounting principles used and significant estimates made by management, and evaluating the overall financial statement presentation. Our procedures included confirmation of securities owned as of May 31, 2016 by correspondence with the custodian and others or by other appropriate auditing procedures where replies from others were not received. We believe that our audits provide a reasonable basis for our opinion.
In our opinion, the financial statements and financial highlights referred to above present fairly, in all material respects, the financial position of each of the respective portfolios constituting AB Municipal Income Fund II at May 31, 2016, and the results of their operations for the year then ended, the changes in their net assets for the year then ended, the period October 1, 2014 to May 31, 2015 and the year ended September 30, 2014, and the financial highlights for each of the periods indicated therein, in conformity with U.S. generally accepted accounting principles.

New York, New York
July 29, 2016
| 184 | • AB MUNICIPAL INCOME FUND II |
Report of Independent Registered Public Accounting Firm
BOARD OF TRUSTEES
Marshall C. Turner, Jr.(1) , Chairman
John H. Dobkin(1)
Michael J. Downey(1)
William H. Foulk, Jr.(1)
D. James Guzy(1)
Nancy P. Jacklin(1)
Robert M. Keith, President and Chief Executive Officer
Carol C. McMullen(1)
Garry L. Moody(1)
Earl D. Weiner(1)
OFFICERS
Philip L. Kirstein, Senior Vice President and Independent Compliance Officer
Robert (“Guy”) B. Davidson III(2), Senior Vice President
Fred S. Cohen(2), Vice President
Terrance T. Hults(2), Vice President
Matthew J. Norton(2), Vice President
Emilie D. Wrapp, Secretary
Joseph J. Mantineo, Treasurer and Chief Financial Officer
Phyllis J. Clarke, Controller
Vincent S. Noto, Chief Compliance Officer
Custodian and Accounting Agent State Street Bank and Trust Company
Principal Underwriter AllianceBernstein Investments, Inc.
Legal Counsel Seward & Kissel LLP | Independent Registered Public Accounting Firm Ernst & Young LLP
Transfer Agent AllianceBernstein Investor |
| (1) | Member of the Audit Committee, the Governance and Nominating Committee and the Independent Directors Committee. |
| (2) | The day-to-day management of, and investment decisions for, the Portfolios’ portfolios are made by the Municipal Bond Investment Team. Fred S. Cohen, Robert “Guy” B. Davidson III, Terrance T. Hults and Matthew J. Norton are the investment professionals with the most significant responsibility for the day-to-day management of the Portfolios’ portfolios. |
| AB MUNICIPAL INCOME FUND II • | 185 |
Board of Trustees
MANAGEMENT OF THE FUND
Board of Trustees Information
The business and affairs of the Fund are managed under the direction of the Board of Trustees. Certain information concerning the Fund’s Trustees is set forth below.
NAME, ADDRESS*, AGE, (YEAR FIRST ELECTED**) | PRINCIPAL OCCUPATION(S) DURING PAST FIVE YEARS AND OTHER RELEVANT | PORTFOLIOS IN FUND COMPLEX OVERSEEN BY TRUSTEE | OTHER PUBLIC COMPANY HELD BY TRUSTEE | |||
| INTERESTED TRUSTEE | ||||||
Robert M. Keith, # 1345 Avenue of the Americas New York, NY 10105 56 (2010) | Senior Vice President of AllianceBernstein L.P. (the “Adviser”) and the head of AllianceBernstein Investments, Inc. (“ABI”) since July 2008; Director of ABI and President of the AB Mutual Funds. Previously, he served as Executive Managing Director of ABI from December 2006 to June 2008. Prior to joining ABI in 2006, Executive Managing Director of Bernstein Global Wealth Management, and prior thereto, Senior Managing Director and Global Head of Client Service and Sales of the Adviser’s institutional investment management business since 2004. Prior thereto, he was Managing Director and Head of North American Client Service and Sales in the Adviser’s institutional investment management business, with which he had been associated since prior to 2004. | 109 | None | |||
| 186 | • AB MUNICIPAL INCOME FUND II |
Management of the Fund
NAME, ADDRESS*, AGE, (YEAR FIRST ELECTED**) | PRINCIPAL OCCUPATION(S) DURING PAST FIVE YEARS AND OTHER RELEVANT | PORTFOLIOS IN FUND COMPLEX OVERSEEN BY TRUSTEE | OTHER PUBLIC COMPANY HELD BY TRUSTEE | |||
| DISINTERESTED TRUSTEES | ||||||
Marshall C. Turner, Jr., ## Chairman of the Board 74 (2005) | Private Investor since prior to 2011. Former Chairman and CEO of Dupont Photomasks, Inc. (components of semi-conductor manufacturing). He has extensive operating leadership and venture capital investing experience, including five interim or full-time CEO roles, and prior service as general partner of institutional venture capital partnerships. He also has extensive non-profit board leadership experience, and currently serves on the boards of two education and science-related non-profit organizations. He has served as a director of one AB Fund since 1992, and director or trustee of multiple AB Funds since 2005. He has been Chairman of the AB Funds since January 2014, and the Chairman of the Independent Directors Committees of such AB Funds since February 2014. | 109 | Xilinx, Inc. (programmable logic semi-conductors) since 2007 | |||
John H. Dobkin, ## 74 (2004) | Independent Consultant since prior to 2011. Formerly, President of Save Venice, Inc. (preservation organization) from 2001-2002; Senior Advisor from June 1999-June 2000 and President of Historic Hudson Valley (historic preservation) from December 1989-May 1999. Previously, Director of the National Academy of Design. He has served as a director or trustee of various AB Funds since 1992, and as Chairman of the Audit Committees of a number of such Funds from 2001-2008. | 109 | None | |||
| AB MUNICIPAL INCOME FUND II • | 187 |
Management of the Fund
NAME, ADDRESS*, AGE, (YEAR FIRST ELECTED**) | PRINCIPAL OCCUPATION(S) DURING PAST FIVE YEARS AND OTHER RELEVANT | PORTFOLIOS IN FUND COMPLEX OVERSEEN BY TRUSTEE | OTHER PUBLIC COMPANY HELD BY TRUSTEE | |||
| DISINTERESTED TRUSTEES (continued) | ||||||
Michael J. Downey, ## 72 (2005) | Private Investor since prior to 2011. Formerly, managing partner of Lexington Capital, LLC (investment advisory firm) from December 1997 until December 2003. He served as a Director of The Merger Fund (registered investment company) since prior to 2011 until 2013. He also served as a Director of Prospect Acquisition Corp. (financial services) from 2007 until 2009. From 1987 until 1993, Chairman and CEO of Prudential Mutual Fund Management, director of the Prudential mutual funds, and member of the Executive Committee of Prudential Securities Inc. He has served as a director or trustee of the AB Funds since 2005 and is a director and Chairman of one other registered investment company. | 109 | Asia Pacific Fund,Inc. (registered investment company) since prior to 2011 | |||
William H. Foulk, Jr., ## 83 (2004) | Investment Adviser and an Independent Consultant since prior to 2011. Previously, he was Senior Manager of Barrett Associates, Inc., a registered investment adviser. He was formerly Deputy Comptroller and Chief Investment Officer of the State of New York and, prior thereto, Chief Investment Officer of the New York Bank for Savings. He has served as a director or trustee of various AB Funds since 1983, and was Chairman of the Independent Directors Committees of the AB Funds from 2003 until early February 2014. He served as Chairman of such Funds from 2003 through December 2013. He is also active in a number of mutual fund related organizations and committees. | 109 | None | |||
| 188 | • AB MUNICIPAL INCOME FUND II |
Management of the Fund
NAME, ADDRESS*, AGE, (YEAR FIRST ELECTED**) | PRINCIPAL OCCUPATION(S) DURING PAST FIVE YEARS AND OTHER RELEVANT | PORTFOLIOS IN FUND COMPLEX OVERSEEN BY TRUSTEE | OTHER PUBLIC COMPANY HELD BY TRUSTEE | |||
| DISINTERESTED TRUSTEES (continued) | ||||||
D. James Guzy, ## 80 (2005) | Chairman of the Board of SRC Computers, Inc. (semi-conductors), with which he has been associated since prior to 2011. He served as Chairman of the Board of PLX Technology (semi-conductors) since prior to 2011 until November 2013. He was a Director of Cirrus Logic Corporation (semi-conductors) from 1984 until July 2011. He was a Director of Intel Corporation (semi-conductors) from 1969 until 2008, and served as Chairman of the Finance Committee of such company for several years until May 2008. He has served as a director or trustee of one or more of the AB Funds since 1982. | 109 | None | |||
Nancy P. Jacklin, ## 68 (2006) | Professorial Lecturer at the Johns Hopkins School of Advanced International Studies (2008-2015). U.S. Executive Director of the International Monetary Fund (which is responsible for ensuring the stability of the international monetary system), (December 2002-May 2006); Partner, Clifford Chance (1992-2002); Sector Counsel, International Banking and Finance, and Associate General Counsel, Citicorp (1985-1992); Assistant General Counsel (International), Federal Reserve Board of Governors (1982-1985); and Attorney Advisor, U.S. Department of the Treasury (1973-1982). Member of the Bar of the District of Columbia and of New York; and member of the Council on Foreign Relations. She has served as a director or trustee of the AB Funds since 2006 and has been Chairman of the Governance and Nominating Committees of the AB Funds since August 2014. | 109 | None | |||
| AB MUNICIPAL INCOME FUND II • | 189 |
Management of the Fund
NAME, ADDRESS*, AGE, (YEAR FIRST ELECTED**) | PRINCIPAL OCCUPATION(S) DURING PAST FIVE YEARS AND OTHER RELEVANT | PORTFOLIOS IN FUND COMPLEX OVERSEEN BY TRUSTEE | OTHER PUBLIC COMPANY HELD BY TRUSTEE | |||||
| DISINTERESTED TRUSTEES (continued) | ||||||||
Carol C. McMullen, ## 60 (2016) | Managing Director and Advisor, Leadership Development, Strategy, Corporate Social Responsibility of Slalom Consulting (consulting) since 2014; Director of Graebel Companies, Inc. (relocation services) and member of the Risk Management, Audit and Compliance Committees since 2014; Director and member of Finance/Investment and Audit Committees of Norfolk & Dedham Group (property and casualty insurance) since 2011. She is also lead investment director for business and family assets at Sydney Associates (real estate development) from prior to 2011 to present and serves on a number of non-profit boards. Formerly, Principal and Managing Director of The Crossland Group (consulting) from 2012 until 2013. She has served as a director or trustee of the AB Funds since June 2016. | 109 | None | |||||
| 190 | • AB MUNICIPAL INCOME FUND II |
Management of the Fund
NAME, ADDRESS*, AGE, (YEAR FIRST ELECTED**) | PRINCIPAL OCCUPATION(S) DURING PAST FIVE YEARS AND OTHER RELEVANT | PORTFOLIOS IN FUND COMPLEX OVERSEEN BY TRUSTEE | OTHER PUBLIC COMPANY HELD BY TRUSTEE | |||||
| DISINTERESTED TRUSTEES (continued) | ||||||||
Garry L. Moody, ## 64 (2008) | Independent Consultant. Formerly, Partner, Deloitte & Touche LLP (1995-2008) where he held a number of senior positions, including Vice Chairman, and U.S. and Global Investment Management Practice Managing Partner; President, Fidelity Accounting and Custody Services Company (1993-1995); where he was responsible for the accounting, pricing, custody and reporting for the Fidelity mutual funds; and Partner, Ernst & Young LLP (1975-1993), where he served as the National Director of Mutual Fund Tax Services and Managing Partner of its Chicago Office Tax department. He is a member of the Trustee Advisory Board of BoardlQ, a biweekly publication focused on issues and news affecting directors of mutual funds. He has served as a director or trustee, and as Chairman of the Audit Committees of the AB Funds since 2008. | 109 | None | |||||
Earl D. Weiner, ## 76 (2007) | Of Counsel, and Partner prior to January 2007, of the law firm Sullivan & Cromwell LLP and is a former member of the ABA Federal Regulation of Securities Committee Task Force to draft editions of the Fund Director’s Guidebook. He also serves as a director or trustee of various non-profit organizations and has served as Chairman or Vice Chairman of a number of them. He has served as a director or trustee of the AB Funds since 2007 and served as Chairman of the Governance and Nominating Committees of the AB Funds from 2007 until August 2014. | 109 | None | |||||
| AB MUNICIPAL INCOME FUND II • | 191 |
Management of the Fund
| * | The address for each of the Fund’s disinterested Trustees is c/o AllianceBernstein L.P., Attention: Philip L. Kirstein, 1345 Avenue of the Americas, New York, NY 10105. |
| ** | There is no stated term of office for the Fund’s Trustees. |
| *** | The information above includes each Trustee’s principal occupation during the last five years and other information relating to the experience, attributes and skills relevant to each Trustee’s qualifications to serve as a Trustee, which led to the conclusion that each Trustee should serve as a Trustee for the Fund. |
| # | Mr. Keith is an “interested person” of the Fund, as defined in the 1940 Act, due to his position as a Senior Vice President of the Adviser. |
| ## | Member of the Audit Committee, the Governance and Nominating Committee and the Independent Directors Committee. |
| 192 | • AB MUNICIPAL INCOME FUND II |
Management of the Fund
Officer Information
Certain information concerning the Fund’s Officers is listed below.
| NAME, ADDRESS* AND AGE | POSITION(S) HELD WITH FUND | PRINCIPAL OCCUPATION DURING PAST FIVE YEARS** | ||
| Robert M. Keith 56 | President and Chief Executive Officer | See biography above. | ||
| Philip L. Kirstein 71 | Senior Vice President and Independent Compliance Officer | Senior Vice President and Independent Compliance Officer of the AB Funds, with which he has been associated since October 2004. Prior thereto, he was Of Counsel to Kirkpatrick & Lockhart, LLP from October 2003 to October 2004, and General Counsel of Merrill Lynch Investment Managers, L.P. since prior to March 2003. | ||
| (Guy) Robert B. Davidson III 55 | Senior Vice President | Senior Vice President of the Adviser,** with which he has been associated since prior to 2011. | ||
| Fred S. Cohen 58 | Vice President | Senior Vice President of the Adviser,** with which he has been associated since prior to 2011. | ||
| Terrance T. Hults 50 | Vice President | Senior Vice President of the Adviser,** with which he has been associated since prior to 2011. | ||
| Matthew J. Norton 32 | Vice President | Vice President of the Adviser,** with which he has been associated since prior to 2011. | ||
| Emilie D. Wrapp 60 | Secretary | Senior Vice President, Assistant General Counsel and Assistant Secretary of ABI,** with which she has been associated since prior to 2011. | ||
| Joseph J. Mantineo 57 | Treasurer and Chief Financial Officer | Senior Vice President of AllianceBernstein Investor Services, Inc. (“ABIS”),** with which he has been associated since prior to 2011. | ||
| Phyllis J. Clarke 55 | Controller | Vice President of the ABIS,** with which she has been associated since prior to 2011. | ||
Vincent S. Noto 51 | Chief Compliance Officer | Senior Vice President since 2015 and Mutual Fund Chief Compliance Officer of the Adviser** since 2014. Prior thereto, he was Vice President and Director of Mutual Fund Compliance of the Adviser** since prior to 2011. |
| * | The address for each of the Fund’s Officers is 1345 Avenue of the Americas, New York, NY 10105. |
| ** | The Adviser, ABI and ABIS are affiliates of the Fund. |
| The Fund’s Statement of Additional Information (“SAI”) has additional information about the Fund’s Trustees and Officers and is available without charge upon request. Contact your financial representative or AB at 1-800-227-4618, or visit www.ABglobal.com, for a free prospectus or SAI. |
| AB MUNICIPAL INCOME FUND II • | 193 |
Management of the Fund
THE FOLLOWING IS NOT PART OF THE SHAREHOLDER REPORT OR THE FINANCIAL STATEMENTS
SUMMARY OF SENIOR OFFICER’S EVALUATION OF INVESTMENT ADVISORY AGREEMENT1
The following is a summary of the evaluation of the Investment Advisory Agreement between AllianceBernstein L.P. (the “Adviser”) and AB Municipal Income Fund II (the “Trust”) in respect of the following Portfolios (the “Portfolios”):2
Arizona Portfolio
Massachusetts Portfolio
Michigan Portfolio
Minnesota Portfolio
New Jersey Portfolio
Ohio Portfolio
Pennsylvania Portfolio
Virginia Portfolio
The evaluation of the Investment Advisory Agreement was prepared by Philip L. Kirstein, the Senior Officer of the Trust, for the Trustees of the Trust, as required by the August 2004 agreement between the Adviser and the New York State Attorney General (the “NYAG”). The Senior Officer’s evaluation of the Investment Advisory Agreement is not meant to diminish the responsibility or authority of the Board of Trustees to perform its duties pursuant to Section 15 of the Investment Company Act of 1940 (the “40 Act”) and applicable state law. The purpose of this summary is to provide shareholders with a synopsis of the independent evaluation of the reasonableness of the advisory fees proposed to be paid by the Portfolios which was provided to the Trustees in connection with their review of the proposed approval of the continuance of the Investment Advisory Agreement.
The Senior Officer’s evaluation considered the following factors:
| 1. | Advisory fees charged to institutional and other clients of the Adviser for like services; |
| 2. | Advisory fees charged by other mutual fund companies for like services; |
| 3. | Costs to the Adviser and its affiliates of supplying services pursuant to the advisory agreement, excluding any intra-corporate profit; |
| 4. | Profit margins of the Adviser and its affiliates from supplying such services; |
| 1 | The information in the fee evaluation was completed on October 22, 2015 and discussed with the Board of Trustees on November 3-5, 2015. |
| 2 | Future references to the Portfolios do not include “AB” References in the fee summary pertaining to performance and expense ratios refer to Class A shares of the Portfolios. |
| 194 | • AB MUNICIPAL INCOME FUND II |
| 5. | Possible economies of scale as the Portfolios grows larger; and |
| 6. | Nature and quality of the Adviser’s services including the performance of the Portfolios. |
These factors, with the exception of the first factor, are generally referred to as the “Gartenberg factors,” which were articulated by the United States Court of Appeals for the Second Circuit in 1982. Gartenberg v. Merrill Lynch Asset Management, Inc., 694 F. 2d 923 (2d Cir. 1982). On March 30, 2010, the Supreme Court held the Gartenberg decision was correct in its basic formulation of what Section 36(b) requires: to face liability under Section 36(b), “an investment adviser must charge a fee that is so disproportionately large that it bears no reasonable relationship to the services rendered and could not have been the product of arm’s length bargaining.” Jones v. Harris Associates L.P., 130 S.Ct. 1418 (2010). In Jones, the Court stated the Gartenberg approach fully incorporates the correct understanding of fiduciary duty within the context of Section 36(b) and noted with approval that “Gartenberg insists that all relevant circumstances be taken into account” and “uses the range of fees that might result from arm’s length bargaining as the benchmark for reviewing challenged fees.”3
INVESTMENT ADVISORY FEES, NET ASSETS, EXPENSE CAPS & RATIOS
The Adviser proposed that each Portfolio pays the advisory fee set forth in the table below for receiving the services to be provided pursuant to the Investment Advisory Agreement. The fee schedule below, implemented in January 2004 in consideration of the Adviser’s settlement with the NYAG in December 2003, is based on a master schedule that contemplates eight categories of funds with almost all funds in each category having the same advisory fee schedule.4
| Category | Advisory Fee Schedule5 | Portfolio | ||
| Low Risk Income | 0.45% on 1st $2.5 billion 0.40% on next $2.5 billion 0.35% on the balance | Arizona Portfolio Massachusetts Portfolio Michigan Portfolio Minnesota Portfolio New Jersey Portfolio Ohio Portfolio Pennsylvania Portfolio Virginia Portfolio |
| 3 | Jones v. Harris at 1427. |
| 4 | Most of the AB Mutual Funds, which the Adviser manages, were affected by the Adviser’s settlement with the NYAG. |
| 5 | The advisory fees for each Portfolio are based on the percentage of each Portfolio’s average daily net assets, not a combination of any of the Portfolios. |
| AB MUNICIPAL INCOME FUND II • | 195 |
The Portfolios’ net assets on September 30, 2015 are set forth below:
| Portfolio | September 30, 2015 Net Assets ($MM) | |||
| Arizona Portfolio | $ | 128.6 | ||
| Massachusetts Portfolio | $ | 236.7 | ||
| Michigan Portfolio | $ | 54.8 | ||
| Minnesota Portfolio | $ | 82.6 | ||
| New Jersey Portfolio | $ | 115.0 | ||
| Ohio Portfolio | $ | 114.2 | ||
| Pennsylvania Portfolio | $ | 98.4 | ||
| Virginia Portfolio | $ | 232.4 | ||
The Portfolios’ Investment Advisory Agreements provide for the Adviser to be reimbursed for certain clerical, legal, accounting, administrative and other services provided to each Portfolio. Indicated below are the reimbursement amounts, which the Adviser received from the Portfolios during their most recently completed fiscal year, expressed in dollars and as a percentage of average daily net assets:
| Portfolio6 | Amount | As a % of Average Daily Net Assets | ||||||
| Arizona Portfolio | $ | 37,430 | 0.028 | % | ||||
| Massachusetts Portfolio | $ | 35,737 | 0.014 | % | ||||
| Michigan Portfolio | $ | 37,430 | 0.065 | % | ||||
| Minnesota Portfolio | $ | 35,738 | 0.041 | % | ||||
| New Jersey Portfolio | $ | 35,737 | 0.029 | % | ||||
| Ohio Portfolio | $ | 35,737 | 0.030 | % | ||||
| Pennsylvania Portfolio | $ | 37,430 | 0.036 | % | ||||
| Virginia Portfolio | $ | 37,430 | 0.016 | % | ||||
The Adviser has agreed to waive that portion of its advisory fees and/or reimburse the Portfolios for that portion of the Portfolios’ total operating expenses to the degree necessary to limit each Portfolio’s expense ratio to the amounts set forth below for each Portfolio’s current fiscal year. The waiver is
| 6 | The reimbursements are for the fiscal period from October 1, 2014 through May 31, 2015. |
| 196 | • AB MUNICIPAL INCOME FUND II |
terminable by the Adviser upon at least 60 days’ notice prior to Portfolios’ prospectus update. In addition, set forth below are the gross expense ratios of the Portfolios for the fiscal year ended May 31, 2015 (Oct. 1, 2014 – May 31, 2015):
| Portfolio | Expense Cap Pursuant to Expense Limitation Undertaking | Gross Expense Ratio7 | Fiscal Year End8 | |||||
| Arizona Portfolio9, 10 | Class A Class B Class C | 0.78% 1.48% 1.48% | 0.97% 1.70% 1.70% | May 31, 2015 | ||||
| Massachusetts Portfolio11, 12 | Class A Class B Class C | 0.77% 1.52% 1.52% | 0.90% 1.63% 1.63% | May 31, 2015 | ||||
| Michigan Portfolio13, 14 | Class A Class B Class C | 0.85% 1.60% 1.60% | 1.25% 1.99% 1.98% | May 31, 2015 | ||||
| Minnesota Portfolio13, 14 | Class A Class B Class C | 0.85% 1.60% 1.60% | 1.08% 1.82% 1.81% | May 31, 2015 | ||||
| New Jersey Portfolio15, 16 | Class A Class B Class C | 0.82% 1.57% 1.57% | 1.00% 1.73% 1.72% | May 31, 2015 | ||||
| 7 | Annualized. |
| 8 | The Fund changed its fiscal year end from September 30 to May 31. |
| 9 | Effective January 30, 2015, the Rule 12b-1 fee for Class A shares of the Fund was reduced from 0.30% to 0.25%. The expense cap remained at the same level (78%). |
| 10 | The Fund’s expense ratios exclude interest expense of 0.02% for Class A shares and 0.03% for Class B and Class C shares. |
| 11 | Effective January 30, 2015, the Rule 12b-1 fee for Class A shares of the Fund was reduced from 0.30% to 0.25%. At the same time, the expense cap for the Class A shares was also reduced from 0.82% to 0.77%. |
| 12 | The net expense ratio for Class A shares of the Fund during the fiscal year ended May 31, 2015 was 0.80%. |
| 13 | Effective January 30, 2015, the Rule 12b-1 fee for Class A shares of the Fund was reduced from 0.30% to 0.25%. At the same time, the expense cap for the Class A shares was also reduced from 0.90% to 0.85%. |
| 14 | The net expense ratio for Class A shares of the Fund during the fiscal year ended May 31, 2015 was 0.88%. |
| 15 | Effective January 30, 2015, the Rule 12b-1 fee for Class A shares of the Fund was reduced from 0.30% to 0.25%. At the same time, the expense cap for the Class A shares was also reduced from 0.87% to 0.82%. |
| 16 | The net expense ratio for Class A shares of the Fund during the fiscal year ended May 31, 2015 was 0.85%. |
| AB MUNICIPAL INCOME FUND II • | 197 |
| Portfolio | Expense Cap Pursuant to Expense Limitation Undertaking | Gross Expense Ratio7 | Fiscal Year End8 | |||||
| Ohio Portfolio17,18 | Class A Class B Class C | 0.80% 1.55% 1.55% | 1.01% 1.75% 1.74% | May 31, 2015 | ||||
| Pennsylvania Portfolio13,14 | Class A Class B Class C | 0.85% 1.60% 1.60% | 1.04% 1.79% 1.77% | May 31, 2015 | ||||
| Virginia Portfolio17,19 | Class A Class B Class C | 0.80% 1.50% 1.50% | 0.90% 1.63% 1.63% | May 31, 2015 | ||||
| I. | ADVISORY FEES CHARGED TO INSTITUTIONAL AND OTHER CLIENTS |
The advisory fees charged to investment companies which the Adviser manages and sponsors are normally higher than those charged to similar sized institutional accounts, including pension plans and sub-advised investment companies. The fee differential reflects, among other things, different services provided to such clients, and different liabilities assumed. Services provided by the Adviser to the Portfolios that are not provided to non-investment company clients and sub-advised investment companies include providing office space and personnel to serve as Fund Officers, who among other responsibilities make the certifications required under the Sarbanes–Oxley Act of 2002, and coordinating with and monitoring the Portfolios’ third party service providers such as Fund counsel, auditors, custodians, transfer agents and pricing services. The accounting, administrative, legal and compliance requirements for the Portfolios are more costly than those for institutional assets due to the greater complexities and time required for investment companies, although as previously noted, the Adviser is reimbursed for providing such services. Also, retail mutual funds managed by the Adviser are widely held. Servicing the Portfolios’ investors is more time consuming and labor intensive compared to institutional clients since the Adviser needs to communicate with a more extensive network of financial intermediaries and shareholders. The Adviser also believes that it incurs substantial entrepreneurial risk when offering a new mutual fund since establishing a new mutual fund requires a large upfront investment and it may take a long time for the fund to achieve profitability since the fund must be priced to scale from inception in order to be competitive and assets are acquired one account at a time. In addition, managing the cash flow of an investment company may be
| 17 | Effective January 30, 2015, the Rule 12b-1 fee for Class A shares of the Fund was reduced from 0.30% to 0.25%. At the same time, the expense cap for the Class A shares was also reduced from 0.85% to 0.80%. |
| 18 | The net expense ratio for Class A shares of the Fund during the fiscal year ended May 31, 2015 was 0.83%. |
| 19 | The net expense ratios for Class A, Class B, and Class C shares of the Fund during the fiscal year ended May 31, 2015 were 0.80%, 1.52%, and 1.53%, respectively. |
| 198 | • AB MUNICIPAL INCOME FUND II |
more difficult than managing that of a stable pool of assets, such as an institutional account with little cash movement in either direction, particularly, if a fund is in net redemption and the Adviser is frequently forced to sell securities to raise cash for redemptions. However, managing a fund with positive cash flow may be easier at times than managing a stable pool of assets. Finally, in recent years, investment advisers have been sued by institutional clients and have suffered reputational damage both by the attendant publicity and outcomes other than complete victories. Accordingly, the legal and reputational risks associated with institutional accounts are greater than previously thought, although still not equal to those related to the mutual fund industry.
Notwithstanding the Adviser’s view that managing an investment company is not comparable to managing other institutional accounts because the services provided are different, the Supreme Court has indicated consideration should be given to the advisory fees charged to institutional accounts with a similar investment style as the Portfolios.20 With respect to the Portfolios, the Adviser represented that there are no categories in the Form ADV for institutional products that have a substantially similar investment styles as the Portfolios. The Adviser does manage separately managed accounts that invest principally in municipal securities, but those mandates have a substantially lower risk profile (credit and interest rate risk) than that of the Portfolios.
The Adviser represented that it does not sub-advise any registered investment companies of other fund families with a substantially similar investment style as any of the Portfolios.
| II. | MANAGEMENT FEES CHARGED BY OTHER MUTUAL FUND COMPANIES FOR LIKE SERVICES. |
Broadridge Financial Solutions, Inc. (“Broadridge”), an analytical service that is not affiliated with the Adviser, compared the fees charged to the Portfolios with fees charged to other investment companies for similar services offered by other investment advisers.21,22 Broadridge’s analysis included the comparison of each
| 20 | The Supreme Court stated that “courts may give such comparisons the weight that they merit in light of the similarities and differences between the services that the clients in question require, but the courts must be wary of inapt comparisons.” Among the significant differences the Supreme Court noted that may exist between services provided to mutual funds and institutional accounts are “higher marketing costs.” Jones v. Harris at 1428. |
| 21 | The Supreme Court cautioned against accepting mutual fund fee comparisons without careful scrutiny since “these comparisons are problematic because these fees, like those challenged, may not be the product of negotiations conducted at arm’s length.” Jones v. Harris at 1429. |
| 22 | On June 5, 2015, Broadridge acquired the Fiduciary Services and Competitive Intelligence unit, i.e., the group responsible for providing the Funds’ 15(c) reports, from Thomson Reuters’ Lipper division. The group that maintains Lipper’s expense and performance databases and investment classifications/objectives remains a part of Thomson Reuters’ Lipper division. Accordingly, the Funds’ investment classifications/objectives continued to be determined by Lipper. |
| AB MUNICIPAL INCOME FUND II • | 199 |
Portfolio’s contractual management fee, estimated at the approximate current asset level of the subject Portfolio, to the median of the Portfolio’s Broadridge Expense Group (“EG”)23 and the Portfolio’s contractual management fee ranking.24
Broadridge describes an EG as a representative sample of comparable funds. Broadridge’s standard methodology for screening funds to be included in an EG entails the consideration of several fund criteria, including fund type, Lipper investment classification/objective, load type and similar 12b-1/non-12b-1 service fees, asset (size) comparability, expense components and attributes. An EG will typically consist of seven to twenty funds.
| Portfolio | Contractual Management Fee(%)25 | Broadridge EG Median(%) | Rank | |||||||
| Arizona Portfolio26 | 0.450 | 0.500 | 3/12 | |||||||
| Massachusetts Portfolio26 | 0.450 | 0.506 | 2/8 | |||||||
| Michigan Portfolio26 | 0.450 | 0.516 | 2/13 | |||||||
| Minnesota Portfolio26 | 0.450 | 0.543 | 2/8 | |||||||
| New Jersey Portfolio26 | 0.450 | 0.517 | 2/9 | |||||||
| Ohio Portfolio26 | 0.450 | 0.519 | 2/7 | |||||||
| Pennsylvania Portfolio26 | 0.450 | 0.500 | 2/11 | |||||||
| Virginia Portfolio26 | 0.450 | 0.463 | 2/5 | |||||||
Broadridge also compared the Portfolios’ total expense ratios to the medians of the Portfolios’ EGs and the Broadridge Expense Universes (“EU”). The EU is a broader group compared to the EG, consisting of all funds that have the same investment classifications/objective and load type as the subject Portfolio.27 Set forth below is a comparison of the Portfolios’ total expense ratios and the
| 23 | Broadridge does not consider average account size when constructing EGs. Funds with relatively small average account sizes tend to have higher transfer agent expense ratios than comparable sized funds that have relatively large average account sizes. Note that there are limitations on Lipper expense category data because different funds categorize expenses differently. |
| 24 | The contractual management fee is calculated by Broadridge using each Portfolio’s contractual management fee rate at the hypothetical asset level. The hypothetical asset level is based on the combined net assets of all classes of each Portfolio, rounded up to the next $25 million. Broadridge’s total expense ratio information is based on the most recent annual report except as otherwise noted. A ranking of “1” would mean that the Portfolio had the lowest effective fee rate in the Broadridge peer group. |
| 25 | The contractual management fees for the Portfolios do not reflect any expense reimbursements made by the Portfolios to the Adviser for certain clerical, legal, accounting, administrative, and other services. In addition, the contractual management fees do not reflect any management waivers for expense caps that effectively reduce the contractual management fee. |
| 26 | One of the Portfolio’s EG peer is excluded from the contractual management fee comparison because Broadridge Lipper is unable to calculate the peer’s contractual management fee of the peer’s breakpoint gross income component. |
| 27 | Except for asset (size) comparability, Broadridge uses the same criteria for selecting an EG peer when selecting an EU peer. Unlike the EG, the EU allows for the same adviser to be represented by more than just one fund. |
| 200 | • AB MUNICIPAL INCOME FUND II |
medians of the Portfolios’ EGs and EUs. The Portfolios’ total expense ratio rankings are also shown. Pro-forma total expense ratio (italicized) is shown to reflect the Portfolios’ 12b-1 fee reductions.
| Portfolio | Expense Ratio (%)28 | Broadridge EG Median (%) | Broadridge EG Rank | Broadridge EU Median (%) | Broadridge Rank | |||||||||||
| Arizona Portfolio | 0.780 | 0.801 | 6/13 | 0.801 | 31/84 | |||||||||||
Pro-forma | 0.780 | 0.801 | 6/13 | 0.801 | 31/84 | |||||||||||
| Massachusetts Portfolio | 0.822 | 0.817 | 6/9 | 0.817 | 7/12 | |||||||||||
Pro-forma | 0.772 | 0.817 | 5/9 | 0.817 | 5/12 | |||||||||||
| Michigan Portfolio | 0.904 | 0.843 | 12/14 | 0.809 | 65/83 | |||||||||||
Pro-forma | 0.854 | 0.843 | 10/14 | 0.809 | 54/83 | |||||||||||
| Minnesota Portfolio | 0.903 | 0.850 | 8/9 | 0.853 | 10/12 | |||||||||||
Pro-forma | 0.853 | 0.850 | 6/9 | 0.853 | 7/12 | |||||||||||
| New Jersey Portfolio | 0.873 | 0.839 | 9/10 | 0.828 | 11/13 | |||||||||||
Pro-forma | 0.823 | 0.839 | 5/10 | 0.828 | 7/13 | |||||||||||
| Ohio Portfolio | 0.850 | 0.805 | 6/8 | 0.805 | 7/11 | |||||||||||
Pro-forma | 0.800 | 0.805 | 4/8 | 0.805 | 5/11 | |||||||||||
| Pennsylvania Portfolio | 0.902 | 0.808 | 10/12 | 0.808 | 13/17 | |||||||||||
Pro-forma | 0.852 | 0.808 | 8/12 | 0.808 | 11/17 | |||||||||||
| Virginia Portfolio | 0.802 | 0.801 | 4/6 | 0.802 | 5/8 | |||||||||||
Pro-forma | 0.802 | 0.801 | 4/6 | 0.802 | 5/8 | |||||||||||
Based on this analysis, considering pro-forma information where available, the Portfolios have a more favorable ranking on a contractual management fee basis than on a total expense ratio basis.
| III. | COSTS TO THE ADVISER AND ITS AFFILIATES OF SUPPLYING SERVICES PURSUANT TO THE MANAGEMENT FEE ARRANGEMENT, EXCLUDING ANY INTRA-CORPORATE PROFIT. |
The Adviser utilizes two profitability reporting systems, which operate independently but are aligned with each other, to estimate the Adviser’s profitability in connection with investment advisory services provided to the Portfolios. The Senior Officer has retained a consultant to provide independent advice regarding the alignment of the two profitability systems as well as the methodologies and allocations utilized by both profitability systems. See Section IV for additional discussion.
| 28 | Most recently completed fiscal year Class A share total expense ratio. |
| AB MUNICIPAL INCOME FUND II • | 201 |
| IV. | PROFIT MARGINS OF THE ADVISER AND ITS AFFILIATES FOR SUPPLYING SUCH SERVICES. |
The Portfolios’ profitability information, prepared by the Adviser for the Board of Trustees, was reviewed by the Senior Officer and the consultant. The Adviser’s profitability from providing investment advisory services to the Portfolios decreased during calendar year 2014, relative to 2013.
In addition to the Adviser’s direct profits from managing the Portfolios, certain of the Adviser’s affiliates have business relationships with the Portfolios and may earn a profit from providing other services to the Portfolios. The courts have referred to this type of business opportunity as “fall-out benefits” to the Adviser and indicated that such benefits should be factored into the evaluation of the total relationship between the Portfolios and the Adviser. Neither case law nor common business practice precludes the Adviser’s affiliates from earning a reasonable profit on this type of relationship provided the affiliates’ charges and services are competitive and the relationship otherwise complies with the 40 Act restrictions. These affiliates provide transfer agent and distribution services to the Portfolios and receive transfer agent fees, Rule 12b-1 payments, front-end sales loads and contingent deferred sales charges (“CDSC”).
AllianceBernstein Investments, Inc. (“ABI”), an affiliate of the Adviser, is the Portfolios’ principal underwriter. ABI and the Adviser have disclosed in the Portfolios’ prospectus that they may make revenue sharing payments from their own resources, in addition to resources derived from sales loads and Rule 12b-1 fees, to firms that sell shares of the Portfolios. In 2014, ABI paid approximately 0.05% of the average monthly assets of the AB Mutual Funds or approximately $20.4 million for distribution services and educational support (revenue sharing payments).
ABI retained the following amounts for Class A front-end load sales charges from sales of the Portfolios’ Class A shares during the Portfolios’ most recently completed fiscal year:
| Portfolio | Amount Received | |||
| Arizona Portfolio | $ | 41 | ||
| Massachusetts Portfolio | $ | – 0 | – | |
| Michigan Portfolio | $ | 51 | ||
| Minnesota Portfolio | $ | – 0 | – | |
| New Jersey Portfolio | $ | 90 | ||
| Ohio Portfolio | $ | – 0 | – | |
| Pennsylvania Portfolio | $ | – 0 | – | |
| Virginia Portfolio | $ | 215 | ||
| 202 | • AB MUNICIPAL INCOME FUND II |
ABI received the amounts set forth below in Rule 12b-1 fees and CDSC from the Portfolios during the Portfolios’ most recently completed fiscal year:
| Portfolio | 12b-1 Fee Received | CDSC Received | ||||||
| Arizona Portfolio | $ | 371,040 | $ | 4,550 | ||||
| Massachusetts Portfolio | $ | 720,862 | $ | 50,923 | ||||
| Michigan Portfolio | $ | 199,280 | $ | 511 | ||||
| Minnesota Portfolio | $ | 235,341 | $ | 823 | ||||
| New Jersey Portfolio | $ | 372,436 | $ | 2,026 | ||||
| Ohio Portfolio | $ | 366,247 | $ | 852 | ||||
| Pennsylvania Portfolio | $ | 297,779 | $ | 42 | ||||
| Virginia Portfolio | $ | 693,447 | $ | 694 | ||||
Fees and reimbursements for out of pocket expenses charged by AllianceBernstein Investor Services, Inc. (“ABIS”), the affiliated transfer agent for the Portfolios, are based on the level of the network account and the class of shares held by the account. ABIS also receives a fee per shareholder sub-account for each account maintained by an intermediary on an omnibus basis. ABIS received the following net fees from the Portfolios during the Portfolios’ most recently completed fiscal year:
| Portfolio | ABIS Fee | |||
| Arizona Portfolio | $ | 11,954 | ||
| Massachusetts Portfolio | $ | 23,432 | ||
| Michigan Portfolio | $ | 12,562 | ||
| Minnesota Portfolio | $ | 12,063 | ||
| New Jersey Portfolio | $ | 15,094 | ||
| Ohio Portfolio | $ | 13,362 | ||
| Pennsylvania Portfolio | $ | 14,095 | ||
| Virginia Portfolio | $ | 20,024 | ||
| V. | POSSIBLE ECONOMIES OF SCALE |
The Adviser has indicated that economies of scale are being shared with shareholders through pricing to scale, breakpoints, fee reductions/waivers and enhancement to services.
In May 2012, an independent consultant, retained by the Senior Officer, provided the Board of Trustees information on the Adviser’s firm-wide average costs from 2005 through 2011 and the potential economies of scale. The independent consultant noted that from 2005 through 2007 the Adviser experienced significant growth in assets under management (“AUM”). During this period, operating expenses increased, in part to keep up with growth, and in part reflecting market returns. However, from 2008 through the first quarter of 2009, AUM rapidly and significantly decreased due to declines in market value and client withdrawals. When AUM rapidly decreased, some operating expenses categories, including base compensation and office space, adjusted more slowly during this period, resulting in an increase in average costs. Since 2009, AUM
| AB MUNICIPAL INCOME FUND II • | 203 |
has experienced less significant changes. The independent consultant noted that changes in operating expenses reflect changes in business composition and business practices in response to changes in financial markets. Finally, the independent consultant concluded that the increase in average cost and the decline in net operating margin across the Adviser since late 2008 are inconsistent with the view that there are currently reductions in average costs due to economies of scale that can be shared with the AB Mutual Funds managed by the Adviser through lower fees.
Previously, in February 2008, the independent consultant provided the Board of Trustees an update of the Deli29 study on advisory fees and various fund characteristics.30 The independent consultant first reiterated the results of his previous two dimensional comparison analysis (fund size and family size) with the Board of Trustees.31 The independent consultant then discussed the results of the regression model that was utilized to study the effects of various factors on advisory fees. The regression model output indicated that the bulk of the variation in fees predicted were explained by various factors, but substantially by fund AUM, family AUM, index fund indicator and investment style. The independent consultant also compared the advisory fees of the AB Mutual Funds to similar funds managed by 19 other large asset managers, regardless of the fund size and each Adviser’s proportion of mutual fund assets to non-mutual fund assets.
| VI. | NATURE AND QUALITY OF THE ADVISER’S SERVICES, INCLUDING THE PERFORMANCE OF THE FUND |
With assets under management of approximately $463 billion as of September 30, 2015, the Adviser has the investment experience to manage and provide non-investment services (described in Section I) to the Portfolios.
| 29 | The Deli study, originally published in 2002 based on 1997 data and updated for the February 2008 Presentation, may be of diminished value due to the age of the data used in the presentation and the changes experienced in the industry since 2008. |
| 30 | The Supreme Court cautioned against accepting mutual fund fee comparisons without careful scrutiny since the fees may not be the product of negotiations conducted at arm’s length. See Jones v. Harris at 1429. |
| 31 | The two dimensional analysis showed patterns of lower advisory fees for funds with larger asset sizes and funds from larger family sizes compared to funds with smaller asset sizes and funds from smaller family sizes, which according to the independent consultant is indicative of a sharing of economies of scale and scope. However, in less liquid and active markets, such is not the case, as the empirical analysis showed potential for diseconomies of scale in those markets. The empirical analysis also showed diminishing economies of scale and scope as funds surpassed a certain high level of assets. |
| 204 | • AB MUNICIPAL INCOME FUND II |
The information prepared by Broadridge shows the 1, 3, 5 and 10 year performance rankings32 of the Portfolios relative to their Broadridge Performance Group (“PG”) and Broadridge Performance Universe (“PU”)33 for the period ended July 31, 2015.34
Portfolio Return (%) | PG Median (%) | PU Median (%) | PG Rank | PU Rank | ||||||||||||
| Arizona Portfolio35 | ||||||||||||||||
1 year | 4.04 | 3.50 | 3.66 | 4/13 | 26/85 | |||||||||||
3 year | 2.41 | 2.00 | 2.10 | 4/13 | 22/85 | |||||||||||
5 year | 4.04 | 3.92 | 3.81 | 4/13 | 27/83 | |||||||||||
10 year | 4.02 | 4.00 | 3.91 | 5/12 | 29/79 | |||||||||||
| Massachusetts Portfolio | ||||||||||||||||
1 year | 4.18 | 3.96 | 3.72 | 2/9 | 3/12 | |||||||||||
3 year | 2.12 | 2.18 | 2.14 | 6/9 | 7/12 | |||||||||||
5 year | 4.01 | 3.94 | 3.98 | 4/9 | 6/12 | |||||||||||
10 year | 4.22 | 4.22 | 4.13 | 5/9 | 5/11 | |||||||||||
| Michigan Portfolio36 | ||||||||||||||||
1 year | 4.76 | 3.80 | 3.66 | 1/14 | 8/85 | |||||||||||
3 year | 1.57 | 2.09 | 2.10 | 11/14 | 65/85 | |||||||||||
5 year | 2.99 | 3.83 | 3.81 | 12/14 | 76/83 | |||||||||||
10 year | 3.45 | 3.92 | 3.91 | 10/13 | 73/79 | |||||||||||
| Minnesota Portfolio | ||||||||||||||||
1 year | 3.32 | 3.37 | 3.35 | 6/9 | 7/12 | |||||||||||
3 year | 2.33 | 2.54 | 2.51 | 8/9 | 9/12 | |||||||||||
5 year | 3.77 | 4.12 | 4.09 | 8/9 | 11/12 | |||||||||||
10 year | 3.85 | 4.15 | 4.09 | 8/8 | 10/11 | |||||||||||
| New Jersey Portfolio | ||||||||||||||||
1 year | 3.24 | 2.93 | 2.86 | 3/10 | 3/13 | |||||||||||
3 year | 1.60 | 1.83 | 1.69 | 8/10 | 9/13 | |||||||||||
5 year | 3.73 | 3.92 | 3.82 | 7/10 | 8/13 | |||||||||||
10 year | 3.77 | 3.77 | 3.77 | 5/9 | 6/12 | |||||||||||
| 32 | The performance returns and rankings of the Portfolios are for the Portfolios’ Class A shares. The performance returns of the Portfolios were provided by Broadridge. |
| 33 | A Portfolio’s PG/PU may not necessarily be identical to its respective EG/EU, as the criteria for including/excluding a fund from a PG/PU is somewhat different from that of an EG/EU. |
| 34 | The current Lipper investment classification/objective dictates the PG and PU throughout the life of each Portfolio even if a Portfolio had a different investment classification/objective at a different point in time. |
| 35 | Prior to the third quarter of 2013, the Portfolio was classified by Lipper as an Arizona Municipal Debt Fund. From the third quarter of 2013 through the present, the Portfolio is classified by Lipper as an Other States Municipal Debt Fund. |
| 36 | Prior to the third quarter of 2013, the Portfolio was classified by Lipper as a Michigan Municipal Debt Fund. From the third quarter of 2013 through the present, the Fund is classified by Lipper as an Other States Municipal Debt Fund. |
| AB MUNICIPAL INCOME FUND II • | 205 |
Portfolio Return (%) | PG Median (%) | PU Median (%) | PG Rank | PU Rank | ||||||||||||
| Ohio Portfolio | ||||||||||||||||
1 year | 3.58 | 3.32 | 3.39 | 3/8 | 5/11 | |||||||||||
3 year | 1.24 | 2.34 | 2.37 | 8/8 | 11/11 | |||||||||||
5 year | 3.18 | 3.94 | 3.88 | 7/8 | 10/11 | |||||||||||
10 year | 3.58 | 3.83 | 3.89 | 5/6 | 7/9 | |||||||||||
| Pennsylvania Portfolio | ||||||||||||||||
1 year | 3.82 | 4.24 | 4.18 | 10/12 | 13/17 | |||||||||||
3 year | 2.11 | 2.50 | 2.51 | 12/12 | 15/17 | |||||||||||
5 year | 3.90 | 4.06 | 4.14 | 9/12 | 12/17 | |||||||||||
10 year | 3.85 | 3.93 | 3.99 | 8/11 | 11/16 | |||||||||||
| Virginia Portfolio | ||||||||||||||||
1 year | 3.94 | 3.13 | 3.01 | 2/6 | 2/8 | |||||||||||
3 year | 2.07 | 1.93 | 1.93 | 2/6 | 2/8 | |||||||||||
5 year | 4.21 | 3.52 | 3.52 | 1/6 | 1/8 | |||||||||||
10 year | 4.24 | 3.86 | 3.85 | 1/5 | 1/7 | |||||||||||
Set forth below are the 1, 3, 5, 10 year and since inception performance returns of the Portfolios (in bold)37 versus their benchmarks.38 Portfolio and benchmark volatility and reward-to-variability ratio (“Sharpe Ratio”) information is also shown.39
Period Ending July 31, 2015 Annualized Net Performance | ||||||||||||||||||||||||||||||||
| 1 Year (%) | 3 Year (%) | 5 Year (%) | 10 Year (%) | Since Inception (%) | Annualized | Risk Period (Year) | ||||||||||||||||||||||||||
| Volatility (%) | Sharpe (%) | |||||||||||||||||||||||||||||||
| Arizona Portfolio | 4.05 | 2.42 | 4.04 | 4.02 | 5.35 | 3.98 | 0.64 | 10 | ||||||||||||||||||||||||
| Barclays Capital Municipal Bond Index | 3.56 | 2.81 | 4.39 | 4.57 | 5.58 | 4.34 | 0.72 | 10 | ||||||||||||||||||||||||
| Inception Date: June 1, 1994 | ||||||||||||||||||||||||||||||||
| Massachusetts Portfolio | 4.19 | 2.12 | 4.01 | 4.23 | 5.54 | 4.02 | 0.69 | 10 | ||||||||||||||||||||||||
| Barclays Capital Municipal Bond Index | 3.56 | 2.81 | 4.39 | 4.57 | 5.57 | 4.34 | 0.72 | 10 | ||||||||||||||||||||||||
| Inception Date: March 29, 1994 | ||||||||||||||||||||||||||||||||
| 37 | The performance returns and risk measures shown in the table are for the Class A shares of the Portfolios. |
| 38 | The Adviser provided Portfolio and benchmark performance return information for periods through July 31, 2015. |
| 39 | Portfolio and benchmark volatility and Sharpe Ratio information was obtained through Lipper LANA, a database maintained by Lipper. Volatility is a statistical measure of the tendency of a market price or yield to vary over time. A Sharpe Ratio is a risk adjusted measure of return that divides a fund’s return in excess of the riskless return by the fund’s standard deviation. A fund with a greater volatility would be seen as more risky than a fund with equivalent performance but lower volatility; for that reason, a greater return would be demanded for the more risky fund. A fund with a higher Sharpe Ratio would be viewed as better performing than a fund with a lower Sharpe Ratio. |
| 206 | • AB MUNICIPAL INCOME FUND II |
Period Ending July 31, 2015 Annualized Net Performance | ||||||||||||||||||||||||||||||||
| 1 Year (%) | 3 Year (%) | 5 Year (%) | 10 Year (%) | Since Inception (%) | Annualized | Risk Period (Year) | ||||||||||||||||||||||||||
| Volatility (%) | Sharpe (%) | |||||||||||||||||||||||||||||||
| Michigan Portfolio | 4.76 | 1.57 | 2.99 | 3.45 | 5.11 | 3.73 | 0.54 | 10 | ||||||||||||||||||||||||
| Barclays Capital Municipal Bond Index | 3.56 | 2.81 | 4.39 | 4.57 | 5.34 | 4.34 | 0.72 | 10 | ||||||||||||||||||||||||
| Inception Date: February 25, 1994 | ||||||||||||||||||||||||||||||||
| Minnesota Portfolio | 3.33 | 2.34 | 3.77 | 3.85 | 4.77 | 3.73 | 0.64 | 10 | ||||||||||||||||||||||||
| Barclays Capital Municipal Bond Index | 3.56 | 2.81 | 4.39 | 4.57 | 5.33 | 4.34 | 0.72 | 10 | ||||||||||||||||||||||||
| Inception Date: June 25, 1993 | ||||||||||||||||||||||||||||||||
| New Jersey Portfolio | 3.25 | 1.61 | 3.74 | 3.77 | 4.57 | 4.17 | 0.56 | 10 | ||||||||||||||||||||||||
| Barclays Capital Municipal Bond Index | 3.56 | 2.81 | 4.39 | 4.57 | 5.33 | 4.34 | 0.72 | 10 | ||||||||||||||||||||||||
| Inception Date: June 25, 1993 | ||||||||||||||||||||||||||||||||
| Ohio Portfolio | 3.59 | 1.24 | 3.19 | 3.59 | 4.64 | 3.83 | 0.56 | 10 | ||||||||||||||||||||||||
| Barclays Capital Municipal Bond Index | 3.56 | 2.81 | 4.39 | 4.57 | 5.33 | 4.34 | 0.72 | 10 | ||||||||||||||||||||||||
| Inception Date: June 25, 1993 | ||||||||||||||||||||||||||||||||
| Pennsylvania Portfolio | 3.83 | 2.12 | 3.9 | 3.85 | 4.96 | 4.13 | 0.59 | 10 | ||||||||||||||||||||||||
| Barclays Capital Municipal Bond Index | 3.56 | 2.81 | 4.39 | 4.57 | 5.33 | 4.34 | 0.72 | 10 | ||||||||||||||||||||||||
| Inception Date: June 25, 1993 | ||||||||||||||||||||||||||||||||
| Virginia Portfolio | 3.95 | 2.07 | 4.21 | 4.24 | 5.54 | 4.28 | 0.65 | 10 | ||||||||||||||||||||||||
| Barclays Capital Municipal Bond Index | 3.56 | 2.81 | 4.39 | 4.57 | 5.55 | 4.34 | 0.72 | 10 | ||||||||||||||||||||||||
| Inception Date: April 29, 1994 | ||||||||||||||||||||||||||||||||
CONCLUSION:
Based on the factors discussed above the Senior Officer’s conclusion is that the proposed advisory fee for each Portfolio is reasonable and within the range of what would have been negotiated at arm’s length in light of all the surrounding circumstances. With respect to Pennsylvania Portfolio, the Senior Officer recommended that the Trustees consider asking the Adviser its plans to reduce the Portfolio’s expenses. This conclusion in respect of the Portfolios is based on an evaluation of all of these factors and no single factor was dispositive.
Dated: November 25, 2015
| AB MUNICIPAL INCOME FUND II • | 207 |
THIS PAGE IS NOT PART OF THE SHAREHOLDER REPORT OR THE FINANCIAL STATEMENTS
AB FAMILY OF FUNDS
US EQUITY
US Core
Core Opportunities Fund
Select US Equity Portfolio
US Growth
Concentrated Growth Fund
Discovery Growth Fund
Growth Fund
Large Cap Growth Fund
Small Cap Growth Portfolio
US Value
Discovery Value Fund
Equity Income Fund
Growth & Income Fund
Small Cap Value Portfolio
Value Fund
INTERNATIONAL/ GLOBAL EQUITY
International/Global Core
Global Core Equity Portfolio
Global Equity & Covered Call Strategy Fund
Global Thematic Growth Fund
International Portfolio
International Strategic Core Portfolio
Tax-Managed International Portfolio
International/Global Growth
International Growth Fund
International/Global Value
Asia ex-Japan Equity Portfolio
International Value Fund
FIXED INCOME
Municipal
High Income Municipal Portfolio
Intermediate California Municipal Portfolio
Intermediate Diversified Municipal Portfolio
Intermediate New York Municipal Portfolio
Municipal Bond Inflation Strategy
FIXED INCOME (continued)
Tax-Aware Fixed Income Portfolio
National Portfolio
Arizona Portfolio
California Portfolio
Massachusetts Portfolio
Michigan Portfolio
Minnesota Portfolio
New Jersey Portfolio
New York Portfolio
Ohio Portfolio
Pennsylvania Portfolio
Virginia Portfolio
Taxable
Bond Inflation Strategy
Global Bond Fund
High Income Fund
High Yield Portfolio
Income Fund
Intermediate Bond Portfolio
Limited Duration High Income Portfolio
Short Duration Portfolio
ALTERNATIVES
All Market Real Return Portfolio
Credit Long/Short Portfolio
Global Real Estate Investment Fund
Long/Short Multi-Manager Fund
Multi-Manager Alternative Strategies Fund
Select US Long/Short Portfolio
Unconstrained Bond Fund
MULTI-ASSET
All Market Income Portfolio
Emerging Markets Multi-Asset Portfolio
Global Risk Allocation Fund
MULTI-ASSET (continued)
Target-Date
Multi-Manager Select Retirement Allocation Fund
Multi-Manager Select 2010 Fund
Multi-Manager Select 2015 Fund
Multi-Manager Select 2020 Fund
Multi-Manager Select 2025 Fund
Multi-Manager Select 2030 Fund
Multi-Manager Select 2035 Fund
Multi-Manager Select 2040 Fund
Multi-Manager Select 2045 Fund
Multi-Manager Select 2050 Fund
Multi-Manager Select 2055 Fund
Wealth Strategies
Balanced Wealth Strategy
Conservative Wealth Strategy
Wealth Appreciation Strategy
Tax-Managed Balanced Wealth Strategy
Tax-Managed Conservative Wealth Strategy
Tax-Managed Wealth Appreciation Strategy
CLOSED-END FUNDS
AB Multi-Manager Alternative Fund
Alliance California Municipal Income Fund
AllianceBernstein Global High Income Fund
AllianceBernstein National Municipal Income Fund
We also offer Government Exchange Reserves, which serves as the money market fund exchange vehicle for the AB mutual funds. An investment in Government Exchange Reserves is not a deposit in a bank and is not insured or guaranteed by the Federal Deposit Insurance Corporation or any other government agency. Although the Fund seeks to preserve the value of your investment at $1.00 per share, it is possible to lose money by investing in the Fund.
Investors should consider the investment objectives, risks, charges and expenses of the Fund carefully before investing. For copies of our prospectus or summary prospectus, which contain this and other information, visit us online at www.abfunds.com or contact your AB representative. Please read the prospectus and/or summary prospectus carefully before investing.
| 208 | • AB MUNICIPAL INCOME FUND II |
AB Family of Funds
AB MUNICIPAL INCOME FUND II
1345 Avenue of the Americas
New York, NY 10105
800.221.5672
MIFII-0151-0516 
| ITEM 2. | CODE OF ETHICS. |
(a) The registrant has adopted a code of ethics that applies to its principal executive officer, principal financial officer and principal accounting officer. A copy of the registrant’s code of ethics is filed herewith as Exhibit 12(a)(1).
(b) During the period covered by this report, no material amendments were made to the provisions of the code of ethics adopted in 2(a) above.
(c) During the period covered by this report, no implicit or explicit waivers to the provisions of the code of ethics adopted in 2(a) above were granted.
| ITEM 3. | AUDIT COMMITTEE FINANCIAL EXPERT. |
The registrant’s Board of Directors has determined that independent directors Garry L. Moody, William H. Foulk, Jr. and Marshall C. Turner, Jr. qualify as audit committee financial experts.
| ITEM 4. | PRINCIPAL ACCOUNTANT FEES AND SERVICES. |
(a) - (c) The following table sets forth the aggregate fees billed by the independent registered public accounting firm Ernst & Young LLP, for the Fund’s last two fiscal years for professional services rendered for: (i) the audit of the Fund’s annual financial statements included in the Fund’s annual report to stockholders; (ii) assurance and related services that are reasonably related to the performance of the audit of the Fund’s financial statements and are not reported under (i), which include advice and education related to accounting and auditing issues and quarterly press release review (for those Funds which issue press releases), and preferred stock maintenance testing (for those Funds that issue preferred stock); and (iii) tax compliance, tax advice and tax return preparation.
| Audit Fees | Audit-Related Fees | Tax Fees | ||||||||||||||
Arizona Portfolio | 2015 | $ | 26,418 | $ | — | $ | 17,130 | |||||||||
| 2016 | $ | 28,895 | $ | — | $ | 22,780 | ||||||||||
Massachusetts Portfolio | 2015 | $ | 28,143 | $ | — | $ | 17,130 | |||||||||
| 2016 | $ | 30,781 | $ | — | $ | 22,780 | ||||||||||
Michigan Portfolio | 2015 | $ | 26,418 | $ | — | $ | 17,130 | |||||||||
| 2016 | $ | 28,895 | $ | — | $ | 22,780 | ||||||||||
Minnesota Portfolio | 2015 | $ | 28,143 | $ | — | $ | 17,130 | |||||||||
| 2016 | $ | 30,781 | $ | — | $ | 22,780 | ||||||||||
New Jersey Portfolio | 2015 | $ | 28,143 | $ | — | $ | 17,130 | |||||||||
| 2016 | $ | 30,781 | $ | — | $ | 22,780 | ||||||||||
Ohio Portfolio | 2015 | $ | 28,143 | $ | — | $ | 17,130 | |||||||||
| 2016 | $ | 30,781 | $ | — | $ | 22,780 | ||||||||||
Pennsylvania Portfolio | 2015 | $ | 26,418 | $ | — | $ | 17,130 | |||||||||
| 2016 | $ | 28,895 | $ | — | $ | 22,780 | ||||||||||
Virginia Portfolio | 2015 | $ | 28,143 | $ | — | $ | 17,130 | |||||||||
| 2016 | $ | 30,781 | $ | — | $ | 22,780 | ||||||||||
(d) Not applicable.
(e) (1) Beginning with audit and non-audit service contracts entered into on or after May 6, 2003, the Fund’s Audit Committee policies and procedures require the pre-approval of all audit and non-audit services provided to the Fund by the Fund’s independent registered public accounting firm. The Fund’s Audit Committee policies and procedures also require pre-approval of all audit and non-audit services provided to the Adviser and Service Affiliates to the extent that these services are directly related to the operations or financial reporting of the Fund.
(e) (2) All of the amounts for Audit Fees, Audit-Related Fees and Tax Fees in the table under Item 4 (a)–(c) are for services pre-approved by the Fund’s Audit Committee.
(f) Not applicable.
(g) The following table sets forth the aggregate non-audit services provided to the Fund, the Fund’s Adviser and entities that control, are controlled by or under common control with the Adviser that provide ongoing services to the Fund:
| All Fees for Non-Audit Services Provided to the Portfolio, the Adviser and Service Affiliates | Total Amount of Foregoing Column Pre- approved by the Audit Committee (Portion Comprised of Audit Related Fees) (Portion Comprised of Tax Fees) | |||||||||||
Arizona Portfolio | 2015 | $ | 225,380 | $ | 17,130 | |||||||
| $ | — | |||||||||||
| $ | (17,130 | ) | ||||||||||
| 2016 | $ | 426,525 | $ | 22,780 | ||||||||
| $ | — | |||||||||||
| $ | (22,780 | ) | ||||||||||
Massachusetts Portfolio | 2015 | $ | 225,380 | $ | 17,130 | |||||||
| $ | — | |||||||||||
| $ | (17,130 | ) | ||||||||||
| 2016 | $ | 426,525 | $ | 22,780 | ||||||||
| $ | — | |||||||||||
| $ | (22,780 | ) | ||||||||||
Michigan Portfolio | 2015 | $ | 225,380 | $ | 17,130 | |||||||
| $ | — | |||||||||||
| $ | (17,130 | ) | ||||||||||
| 2016 | $ | 426,525 | $ | 22,780 | ||||||||
| $ | — | |||||||||||
| $ | (22,780 | ) | ||||||||||
Minnesota Portfolio | 2015 | $ | 225,380 | $ | 17,130 | |||||||
| $ | — | |||||||||||
| $ | (17,130 | ) | ||||||||||
| 2016 | $ | 426,525 | $ | 22,780 | ||||||||
| $ | — | |||||||||||
| $ | (22,780 | ) | ||||||||||
New Jersey Portfolio | 2015 | $ | 225,380 | $ | 17,130 | |||||||
| $ | — | |||||||||||
| $ | (17,130 | ) | ||||||||||
| 2016 | $ | 426,525 | $ | 22,780 | ||||||||
| $ | — | |||||||||||
| $ | (22,780 | ) | ||||||||||
Ohio Portfolio | 2015 | $ | 225,380 | $ | 17,130 | |||||||
| $ | — | |||||||||||
| $ | (17,130 | ) | ||||||||||
| 2016 | $ | 426,525 | $ | 22,780 | ||||||||
| $ | — | |||||||||||
| $ | (22,780 | ) | ||||||||||
Pennsylvania Portfolio | 2015 | $ | 225,380 | $ | 17,130 | |||||||
| $ | — | |||||||||||
| $ | (17,130 | ) | ||||||||||
| 2016 | $ | 426,525 | $ | 22,780 | ||||||||
| $ | — | |||||||||||
| $ | (22,780 | ) | ||||||||||
Virginia Portfolio | 2015 | $ | 225,380 | $ | 17,130 | |||||||
| $ | — | |||||||||||
| $ | (17,130 | ) | ||||||||||
| 2016 | $ | 426,525 | $ | 22,780 | ||||||||
| $ | — | |||||||||||
| $ | (22,780 | ) | ||||||||||
(h) The Audit Committee of the Fund has considered whether the provision of any non-audit services not pre-approved by the Audit Committee provided by the Fund’s independent registered public accounting firm to the Adviser and Service Affiliates is compatible with maintaining the auditor’s independence.
| ITEM 5. | AUDIT COMMITTEE OF LISTED REGISTRANTS. |
Not applicable to the registrant.
| ITEM 6. | SCHEDULE OF INVESTMENTS. |
Please see Schedule of Investments contained in the Report to Shareholders included under Item 1 of this Form N-CSR.
ITEM 7. DISCLOSURE OF PROXY VOTING POLICIES AND PROCEDURES FOR CLOSED-END MANAGEMENT INVESTMENT COMPANIES.
Not applicable to the registrant.
| ITEM 8. | PORTFOLIO MANAGERS OF CLOSED-END MANAGEMENT INVESTMENT COMPANIES. |
Not applicable to the registrant.
ITEM 9. PURCHASES OF EQUITY SECURITIES BY CLOSED-END MANAGEMENT INVESTMENT COMPANY AND AFFILIATED PURCHASERS.
Not applicable to the registrant.
| ITEM 10. | SUBMISSION OF MATTERS TO A VOTE OF SECURITY HOLDERS. |
There have been no material changes to the procedures by which shareholders may recommend nominees to the Fund’s Board of Directors since the Fund last provided disclosure in response to this item.
| ITEM 11. | CONTROLS AND PROCEDURES. |
(a) The registrant’s principal executive officer and principal financial officer have concluded that the registrant’s disclosure controls and procedures (as defined in Rule 30a-2(c) under the Investment Company Act of 1940, as amended) are effective at the reasonable assurance level based on their evaluation of these controls and procedures as of a date within 90 days of the filing date of this document.
(b) There were no changes in the registrant’s internal controls over financial reporting that occurred during the second fiscal quarter of the period that has materially affected, or is reasonably likely to materially affect, the registrant’s internal control over financial reporting.
| ITEM 12. | EXHIBITS. |
The following exhibits are attached to this Form N-CSR:
EXHIBIT | DESCRIPTION OF EXHIBIT | |
| 12 (a) (1) | Code of Ethics that is subject to the disclosure of Item 2 hereof | |
| 12 (b) (1) | Certification of Principal Executive Officer Pursuant to Section 302 of the Sarbanes-Oxley Act of 2002 | |
| 12 (b) (2) | Certification of Principal Financial Officer Pursuant to Section 302 of the Sarbanes-Oxley Act of 2002 | |
| 12 (c) | Certification of Principal Executive Officer and Principal Financial Officer Pursuant to Section 906 of the Sarbanes-Oxley Act of 2002 | |
SIGNATURES
Pursuant to the requirements of the Securities Exchange Act of 1934 and the Investment Company Act of 1940, the registrant has duly caused this report to be signed on its behalf by the undersigned, thereunto duly authorized.
(Registrant): AB Municipal Income Fund II
| By: | /s/ Robert M. Keith | |
| Robert M. Keith | ||
| President | ||
| Date: | August 1, 2016 | |
Pursuant to the requirements of the Securities Exchange Act of 1934 and the Investment Company Act of 1940, this report has been signed below by the following persons on behalf of the registrant and in the capacities and on the dates indicated.
| By: | /s/ Robert M. Keith | |
| Robert M. Keith | ||
| President | ||
| Date: | August 1, 2016 | |
| By: | /s/ Joseph J. Mantineo | |
| Joseph J. Mantineo | ||
| Treasurer and Chief Financial Officer | ||
| Date: | August 1, 2016 | |