UNITED STATES
SECURITIES AND EXCHANGE COMMISSION
WASHINGTON, D.C. 20549
FORM N-CSR
CERTIFIED SHAREHOLDER REPORT OF REGISTERED
MANAGEMENT INVESTMENT COMPANIES
Investment Company Act file number: 811-07618
AB MUNICIPAL INCOME FUND II
(Exact name of registrant as specified in charter)
1345 Avenue of the Americas, New York, New York 10105
(Address of principal executive offices) (Zip code)
Joseph J. Mantineo
AllianceBernstein L.P.
1345 Avenue of the Americas
New York, New York 10105
(Name and address of agent for service)
Registrant’s telephone number, including area code: (800) 221-5672
Date of fiscal year end: May 31, 2018
Date of reporting period: May 31, 2018
ITEM 1. REPORTS TO STOCKHOLDERS.
MAY 05.31.18
ANNUAL REPORT
AB MUNICIPAL INCOME FUND II
| + | | AB MASSACHUSETTS PORTFOLIO |
| + | | AB NEW JERSEY PORTFOLIO |
| + | | AB PENNSYLVANIA PORTFOLIO |

| | |
| |
| Investment Products Offered | | • Are Not FDIC Insured • May Lose Value • Are Not Bank Guaranteed |
Investors should consider the investment objectives, risks, charges and expenses of the Fund carefully before investing. For copies of our prospectus or summary prospectus, which contain this and other information, visit us online at www.abfunds.com or contact your AB representative. Please read the prospectus and/or summary prospectus carefully before investing.
This shareholder report must be preceded or accompanied by the Fund’s prospectus for individuals who are not current shareholders of the Fund.
You may obtain a description of the Fund’s proxy voting policies and procedures, and information regarding how the Fund voted proxies relating to portfolio securities during the most recent 12-month period ended June 30, without charge. Simply visit AB’s website at www.abfunds.com, or go to the Securities and Exchange Commission’s (the “Commission”) website at www.sec.gov, or call AB at (800) 227 4618.
The Fund files its complete schedule of portfolio holdings with the Commission for the first and third quarters of each fiscal year on Form N-Q. The Fund’s Forms N-Q are available on the Commission’s website at www.sec.gov. The Fund’s Forms N-Q may also be reviewed and copied at the Commission’s Public Reference Room in Washington, DC; information on the operation of the Public Reference Room may be obtained by calling (800) SEC 0330. AB publishes full portfolio holdings for the Fund monthly at www.abfunds.com.
AllianceBernstein Investments, Inc. (ABI) is the distributor of the AB family of mutual funds. ABI is a member of FINRA and is an affiliate of AllianceBernstein L.P., the Adviser of the funds.
The [A/B] logo is a registered service mark of AllianceBernstein and AllianceBernstein® is a registered service mark used by permission of the owner, AllianceBernstein L.P.
| | |
| FROM THE PRESIDENT | |  |
Dear Shareholder,
We are pleased to provide this report for AB Municipal Income Fund II: AB Arizona Portfolio, AB Massachusetts Portfolio, AB Minnesota Portfolio, AB New Jersey Portfolio, AB Ohio Portfolio, AB Pennsylvania Portfolio and AB Virginia Portfolio (each a “Portfolio,” and collectively, the “Portfolios”). Please review the discussion of Portfolio performance, the market conditions during the reporting period and the Portfolios’ investment strategies.
As always, AB strives to keep clients ahead of what’s next by:
| + | | Transforming uncommon insights into uncommon knowledge with a global research scope |
| + | | Navigating markets with seasoned investment experience and sophisticated solutions |
| + | | Providing thoughtful investment insights and actionable ideas |
Whether you’re an individual investor or a multi-billion-dollar institution, we put knowledge and experience to work for you.
AB’s global research organization connects and collaborates across platforms and teams to deliver impactful insights and innovative products. Better insights lead to better opportunities—anywhere in the world.
For additional information about AB’s range of products and shareholder resources, please log on to www.abfunds.com.
Thank you for your investment in the AB Mutual Funds.
Sincerely,

Robert M. Keith
President and Chief Executive Officer, AB Mutual Funds
| | |
| abfunds.com | | AB MUNICIPAL INCOME FUND II | 1 |
ANNUAL REPORT
July 11, 2018
This report provides management’s discussion of fund performance for AB Municipal Income Fund II: AB Arizona Portfolio, AB Massachusetts Portfolio, AB Minnesota Portfolio, AB New Jersey Portfolio, AB Ohio Portfolio, AB Pennsylvania Portfolio and AB Virginia Portfolio for the annual reporting period ended May 31, 2018.
The investment objective of the Portfolios is to earn the highest level of current income, exempt from both federal income tax and state taxation of the respective state, that is available without assuming what the Adviser considers to be undue risk.
NAV RETURNS AS OF MAY 31, 2018 (unaudited)
| | | | | | | | |
| | | 6 Months | | | 12 Months | |
| AB ARIZONA PORTFOLIO | | | | | | | | |
| Class A Shares | | | 0.64% | | | | 1.30% | |
| Class B Shares1 | | | 0.17% | | | | 0.54% | |
| Class C Shares | | | 0.18% | | | | 0.55% | |
| Bloomberg Barclays Municipal Bond Index | | | 0.71% | | | | 1.11% | |
| | | | | | | | |
| | | 6 Months | | | 12 Months | |
| AB MASSACHUSETTS PORTFOLIO | | | | | | | | |
| Class A Shares | | | 0.21% | | | | 0.75% | |
| Class B Shares1 | | | -0.17% | | | | -0.01% | |
| Class C Shares | | | -0.17% | | | | -0.01% | |
| Advisor Class Shares2 | | | 0.33% | | | | 1.00% | |
| Bloomberg Barclays Municipal Bond Index | | | 0.71% | | | | 1.11% | |
| | | | | | | | |
| | | 6 Months | | | 12 Months | |
| AB MINNESOTA PORTFOLIO | | | | | | | | |
| Class A Shares | | | 0.26% | | | | 0.69% | |
| Class B Shares1 | | | -0.01% | | | | 0.04% | |
| Class C Shares | | | -0.11% | | | | -0.06% | |
| Bloomberg Barclays Municipal Bond Index | | | 0.71% | | | | 1.11% | |
| 1 | Effective January 31, 2009, Class B shares are no longer available for purchase to new investors. Please see Note A for more information. |
| 2 | Please note that this share class is for investors purchasing shares through accounts established under certain fee-based programs sponsored and maintained by certain broker-dealers and financial intermediaries, institutional pension plans and/or investment advisory clients of, and certain other persons associated with, the Adviser and its affiliates or the Portfolios. |
| | |
| 2 | AB MUNICIPAL INCOME FUND II | | abfunds.com |
NAV RETURNS AS OF MAY 31, 2018 (unaudited)
| | | | | | | | |
| | | 6 Months | | | 12 Months | |
| AB NEW JERSEY PORTFOLIO | | | | | | | | |
| Class A Shares | | | 0.34% | | | | 1.65% | |
| Class B Shares1 | | | -0.04% | | | | 0.88% | |
| Class C Shares | | | 0.07% | | | | 0.89% | |
| Bloomberg Barclays Municipal Bond Index | | | 0.71% | | | | 1.11% | |
| | | | | | | | |
| | | 6 Months | | | 12 Months | |
| AB OHIO PORTFOLIO | | | | | | | | |
| Class A Shares | | | 0.20% | | | | 0.58% | |
| Class B Shares1 | | | -0.17% | | | | -0.17% | |
| Class C Shares | | | -0.07% | | | | -0.07% | |
| Bloomberg Barclays Municipal Bond Index | | | 0.71% | | | | 1.11% | |
| | | | | | | | |
| | | 6 Months | | | 12 Months | |
| AB PENNSYLVANIA PORTFOLIO | | | | | | | | |
| Class A Shares | | | 0.60% | | | | 1.10% | |
| Class B Shares1 | | | 0.13% | | | | 0.35% | |
| Class C Shares | | | 0.23% | | | | 0.35% | |
| Bloomberg Barclays Municipal Bond Index | | | 0.71% | | | | 1.11% | |
| | | | | | | | |
| | | 6 Months | | | 12 Months | |
| AB VIRGINIA PORTFOLIO | | | | | | | | |
| Class A Shares | | | 0.51% | | | | 1.10% | |
| Class B Shares1 | | | 0.04% | | | | 0.34% | |
| Class C Shares | | | 0.14% | | | | 0.35% | |
| Advisor Class Shares2 | | | 0.55% | | | | 1.35% | |
| Bloomberg Barclays Municipal Bond Index | | | 0.71% | | | | 1.11% | |
| 1 | Effective January 31, 2009, Class B shares are no longer available for purchase to new investors. Please see Note A for more information. |
| 2 | Please note that this share class is for investors purchasing shares through accounts established under certain fee-based programs sponsored and maintained by certain broker-dealers and financial intermediaries, institutional pension plans and/or investment advisory clients of, and certain other persons associated with, the Adviser and its affiliates or the Portfolios. |
INVESTMENT RESULTS
The preceding tables show performance for each Portfolio compared to its benchmark, the Bloomberg Barclays Municipal Bond Index, for the six- and 12-month periods ended May 31, 2018. All performance comparisons are before sales charges.
| | |
| abfunds.com | | AB MUNICIPAL INCOME FUND II | 3 |
Arizona Portfolio: For the 12-month period, all share classes of the Portfolio except Class A shares underperformed the benchmark; all share classes underperformed for the six-month period.
For both periods, yield-curve positioning in seven- to 10-year duration municipals and an underweight to pre-refunded bonds detracted relative to the benchmark. Security selection within the public higher education and senior living sectors contributed. For the 12-month period, yield-curve positioning in six- to seven-year duration municipals and an underweight to the special tax sector detracted. Yield-curve positioning in less-than-one-year duration municipals and an overweight to the senior living sector contributed. For the six-month period, security selection within the pre-refunded and not-for-profit health care sectors detracted, while selection in the special tax and local general obligation (“GO”) sectors contributed.
Massachusetts Portfolio: All share classes of the Portfolio underperformed the benchmark for both periods.
Yield-curve positioning, particularly in seven- to 10-year duration municipals, detracted for both periods relative to the benchmark; an overweight to pre-refunded bonds also detracted. Security selection within the miscellaneous revenue and state GO sectors contributed. For the 12-month period, yield-curve positioning in three- to four-year duration municipals detracted. Security selection within the not-for-profit health care sector and yield-curve positioning in five- to six-year duration municipals contributed. For the six-month period, security selection within the private higher education sector detracted, although an overweight to the sector contributed. Yield-curve positioning in three- to four-year duration municipals also contributed.
Minnesota Portfolio: All share classes of the Portfolio underperformed the benchmark for both periods.
For both periods, yield-curve positioning in seven- to 10-year duration municipals and an overweight to pre-refunded bonds detracted relative to the benchmark. Security selection within the electric utility sector and an overweight to the not-for-profit health care sector contributed. For the 12-month period, yield-curve positioning in five- to six-year duration municipals and security selection within the tax-supported state lease sector detracted. Security selection within the pre-refunded sector and yield-curve positioning in four- to five-year duration municipals contributed. For the six-month period, security selection within the pre-refunded and not-for-profit health care sectors detracted, while selection in the local GO sector contributed. Yield-curve positioning in three- to four-year duration municipals also contributed.
| | |
| 4 | AB MUNICIPAL INCOME FUND II | | abfunds.com |
New Jersey Portfolio: For the 12-month period, all share classes of the Portfolio except Class A shares underperformed the benchmark, all share classes underperformed for the six-month period.
For both periods, yield-curve positioning in six- to seven-year duration municipals and security selection within the pre-refunded sector detracted relative to the benchmark. Yield-curve positioning in seven- to 10-year duration municipals contributed. For the 12-month period, yield-curve positioning in two- to three-year duration municipals and an overweight to pre-refunded bonds detracted. Security selection within the miscellaneous revenue, tax-supported local lease and tax-supported state lease sectors contributed. For the six-month period, security selection within the toll roads/transit sector and yield-curve positioning in four- to five-year duration municipals detracted. Security selection within the tobacco and local GO sectors contributed. Yield-curve positioning in five- to six-year duration municipals also contributed.
Ohio Portfolio: All share classes of the Portfolio underperformed the benchmark for both periods.
For both periods, security selection within the public higher education sector detracted relative to the benchmark, while selection in the miscellaneous revenue sector contributed. For the 12-month period, yield-curve positioning, particularly in four- to five-year and five- to six-year duration municipals, detracted. Security selection within the pre-refunded sector, an overweight to senior living and underweight to the state GO sectors contributed. For the six-month period, security selection within the local GO, special tax and tax-supported local lease sectors detracted, while selection in the tobacco sector contributed. Yield-curve positioning contributed, driven by an underweight to over-10-year duration municipals.
Pennsylvania Portfolio: All share classes of the Portfolio underperformed the benchmark for both periods.
For both periods, an overweight to pre-refunded bonds detracted relative to the benchmark. Yield-curve positioning also detracted, particularly in two- to three-year duration municipals. Security selection within the tax-supported state lease sector contributed. For the 12-month period, an underweight to the tax-supported state lease sector detracted. Security selection within the miscellaneous revenue and water and sewer sectors contributed. Yield-curve positioning in four- to five-year duration municipals also contributed. For the six-month period, yield-curve positioning in over-10-year duration municipals detracted, while positioning in two- to three-year and seven- to 10-year duration municipals contributed. Security selection within the not-for-profit health care sector also contributed.
| | |
| abfunds.com | | AB MUNICIPAL INCOME FUND II | 5 |
Virginia Portfolio: For the 12-month period, all share classes of the Portfolio except Advisor Class shares underperformed the benchmark; all share classes underperformed for the six-month period.
For both periods, security selection within the local GO and pre-refunded sectors detracted relative to the benchmark. An overweight to pre-refunded bonds and yield-curve positioning in seven- to 10-year duration municipals also detracted. Security selection within the toll roads/transit sector and an overweight to the senior living sector contributed. For the 12-month period, security selection within the special tax and senior living sectors contributed. For the six-month period, security selection within the tobacco sector and an underweight to the state GO sector contributed.
During the six-month period, all Portfolios except the Pennsylvania Portfolio, used derivatives in the form of interest rate swaps for hedging purposes, which had an immaterial impact on absolute performance. During the 12-month period, all Portfolios used interest rate swaps for hedging purposes, which had an immaterial impact on absolute performance. During both periods, the Massachusetts Portfolio also used interest rate swaps for investment purposes, which had an immaterial impact on absolute performance.
MARKET REVIEW AND INVESTMENT STRATEGY
Against the backdrop of three interest rate hikes by the US Federal Reserve and concerns about tax reform, municipals remained resilient throughout 2017 and outperformed US Treasuries. Yields rose at the beginning of 2018; by the end of February, 10-year AAA municipal yields were 50 basis points higher than at the end of 2017. Longer-term municipal yields staged a slight rally for the remainder of the period ended May 31, 2018, though short-term yields increased another 25 basis points as the yield curve flattened. For the entire 12-month period, short-maturity yields increased significantly more than intermediate- and long-maturity yields; for example, AAA-rated two-year yields increased 86 basis points, while AAA-rated 30-year yields only rose 13 basis points.
The Fund’s Senior Investment Management Team (the “Team”) maintains the Fund’s underweight to the longest-maturity municipal bonds and a modest overweight to municipal credit, finding this position attractive given the current strength of the US economy. Fiscal conditions continue to improve for the majority of states, according to the National Association of State Budget Officers. For example, overall revenue growth for fiscal year 2018 grew nearly 5% on average for all states, the largest increase since 2015. The Team continues to focus on after-tax return by investing in investment-grade municipal bonds with selective investments in high yield that generate income exempt from federal income taxes.
The Portfolios may purchase municipal securities that are insured under policies issued by certain insurance companies. Historically, insured municipal securities typically received a higher credit rating, which meant
| | |
| 6 | AB MUNICIPAL INCOME FUND II | | abfunds.com |
that the issuer of the securities paid a lower interest rate. As a result of declines in the credit quality and associated downgrades of most bond insurers, insurance has less value than it did in the past. The market now values insured municipal securities primarily based on the credit quality of the issuer of the security with little value given to the insurance feature. In purchasing such insured securities, the Adviser evaluates the risk and return of municipal securities through its own research. If an insurance company’s rating is downgraded or the company becomes insolvent, the prices of municipal securities insured by the insurance company may decline.
| | | | | | | | |
| Portfolio | | Insured Bonds1 | | | Pre-refunded/ ETM2/Insured Bonds1 | |
| Arizona | | | 16.01% | | | | 0.91% | |
| Massachusetts | | | 3.12% | | | | 0.00% | |
| Minnesota | | | 1.54% | | | | 0.00% | |
| New Jersey | | | 24.44% | | | | 9.37% | |
| Ohio | | | 1.41% | | | | 0.00% | |
| Pennsylvania | | | 12.50% | | | | 1.59% | |
| Virginia | | | 2.05% | | | | 0.00% | |
| 1 | Breakdowns expressed as a percentage of investments in municipal bonds. |
INVESTMENT POLICIES
Each of the Portfolios pursues its objective by investing principally in high-yielding, predominantly investment-grade municipal securities. Each of the Portfolios invests, under normal circumstances, at least 80% of its net assets in municipal securities that pay interest that is exempt from federal income tax. These securities may pay interest that is subject to the federal alternative minimum tax for certain taxpayers. Each of the Portfolios pursues its objective by investing at least 80% of its net assets in municipal securities issued by the named state or municipal securities with interest that is otherwise exempt from the named state’s income tax.
The Portfolios may also invest in forward commitments; zero-coupon municipal securities and variable, floating and inverse floating-rate municipal securities; and derivatives, such as options, futures contracts, forwards and swaps.
| | |
| abfunds.com | | AB MUNICIPAL INCOME FUND II | 7 |
DISCLOSURES AND RISKS
Benchmark Disclosure
The Bloomberg Barclays Municipal Bond Index is unmanaged and does not reflect fees and expenses associated with the active management of a mutual fund portfolio. The Bloomberg Barclays Municipal Bond Index represents the performance of the long-term tax-exempt bond market consisting of investment-grade bonds. An investor cannot invest directly in an index, and its results are not indicative of the performance for any specific investment, including the Portfolios.
A Word About Risk
Market Risk: The value of the Portfolios’ assets will fluctuate as the bond market fluctuates. The value of the Portfolios’ investments may decline, sometimes rapidly and unpredictably, simply because of economic changes or other events that affect large portions of the market.
Credit Risk: An issuer or guarantor of a fixed-income security, or the counterparty to a derivatives or other contract, may be unable or unwilling to make timely payments of interest or principal, or to otherwise honor its obligations. The issuer or guarantor may default, causing a loss of the full principal amount of a security. The degree of risk for a particular security may be reflected in its credit rating. There is the possibility that the credit rating of a fixed-income security may be downgraded after purchase, which may adversely affect the value of the security. Investments in fixed-income securities with lower ratings tend to have a higher probability that an issuer will default or fail to meet its payment obligations.
Municipal Market Risk: This is the risk that special factors may adversely affect the value of municipal securities and have a significant effect on the yield or value of the Portfolios’ investments in municipal securities. These factors include economic conditions, political or legislative changes, uncertainties related to the tax status of municipal securities, or the rights of investors in these securities. To the extent that the Portfolios invest more of their assets in a particular state’s municipal securities, the Portfolios may be vulnerable to events adversely affecting that state, including economic, political and regulatory occurrences, court decisions, terrorism and catastrophic natural disasters, such as hurricanes or earthquakes. The Portfolios’ investments in certain municipal securities with principal and interest payments that are made from the revenues of a specific project or facility, and not general tax revenues, may have increased risks. Factors affecting the project or facility, such as local business or economic conditions, could have a significant effect on the project’s ability to make payments of principal and interest on these securities.
In addition, recent tax law changes could have a material impact on the value of municipal securities. Changes in tax rates or the treatment of income from municipal securities, among other things, could negatively affect the municipal securities markets.
| | |
| 8 | AB MUNICIPAL INCOME FUND II | | abfunds.com |
DISCLOSURES AND RISKS (continued)
The Portfolios may invest in municipal securities of issuers in Puerto Rico or other US territories and their governmental agencies and municipalities, which are exempt from federal, state, and, where applicable, local income taxes. These municipal securities may have more risks than those of other US issuers of municipal securities. Like many US states and municipalities, Puerto Rico experienced a significant downturn during the recent recession. Puerto Rico’s downturn was particularly severe, and Puerto Rico continues to face a very challenging economic and fiscal environment. If the general economic situation in Puerto Rico continues to persist or worsens, the volatility and credit quality of Puerto Rican municipal securities could continue to be adversely affected, and the market for such securities may experience continued volatility.
Tax Risk: There is no guarantee that the income on the Portfolios’ municipal securities will be exempt from regular federal income and state income taxes. Unfavorable legislation, adverse interpretations by federal or state authorities, litigation or noncompliant conduct by the issuer of a municipal security could affect the tax-exempt status of municipal securities. If the Internal Revenue Service or a state authority determines that an issuer of a municipal security has not complied with applicable requirements, interest from the security could become subject to regular federal income tax and/or state personal income tax, possibly retroactively to the date the security was issued, the value of the security could decline significantly, and a portion of the distributions to Portfolio shareholders could be recharacterized as taxable. Recent federal legislation included reductions in tax rates for individuals, with relatively larger reductions in tax rates for corporations. These tax rate reductions may reduce the demand for municipal bonds which could reduce the value of municipal bonds held by the Portfolios.
Interest Rate Risk: Changes in interest rates will affect the value of investments in fixed-income securities. When interest rates rise, the value of existing investments in fixed-income securities tends to fall and this decrease in value may not be offset by higher income from new investments. The Portfolios may be subject to heightened interest rate risk due to rising rates as the current period of historically low interest rates may be ending. Interest rate risk is generally greater for fixed-income securities with longer maturities or durations.
Duration Risk: Duration is a measure that relates the expected price volatility of a fixed-income security to changes in interest rates. The duration of a fixed-income security may be shorter than or equal to full maturity of a fixed-income security. Fixed-income securities with longer durations have more risk and will decrease in price as interest rates rise. For example, generally a fixed-income security with a duration of three years will decrease in value by approximately 3% if interest rates increase by 1%.
| | |
| abfunds.com | | AB MUNICIPAL INCOME FUND II | 9 |
DISCLOSURES AND RISKS (continued)
Inflation Risk: This is the risk that the value of assets or income from investments will be less in the future as inflation decreases the value of money. As inflation increases, the value of the Portfolios’ assets can decline as can the value of the Portfolios’ distributions. This risk is significantly greater for fixed-income securities with longer maturities.
Liquidity Risk: Liquidity risk occurs when certain investments become difficult to purchase or sell. Difficulty in selling less liquid securities may result in sales at disadvantageous prices affecting the value of your investment in the Portfolios. Causes of liquidity risk may include low trading volumes, large positions and heavy redemptions of the Portfolios’ shares. Over recent years liquidity risk has also increased because the capacity of dealers in the secondary market for fixed-income securities to make markets in these securities has decreased, even as the overall bond market has grown significantly, due to, among other things, structural changes, additional regulatory requirements and capital and risk restraints that have led to reduced inventories. Liquidity risk may be higher in a rising interest rate environment, when the value and liquidity of fixed-income securities generally decline. Municipal securities may have more liquidity risk than other fixed-income securities because they trade less frequently and the market for municipal securities is generally smaller than many other markets.
Derivatives Risk: Investments in derivatives may be illiquid, difficult to price, and leveraged so that small changes may produce disproportionate losses for the Portfolios, and may be subject to counterparty risk to a greater degree than more traditional investments.
Management Risk: The Portfolios are subject to management risk because they are actively managed investment funds. The Adviser will apply its investment techniques and risk analyses in making investment decisions, but there is no guarantee that its techniques will produce the intended results.
These risks are fully discussed in the Portfolios’ prospectus. As with all investments, you may lose money by investing in the Portfolios.
An Important Note About Historical Performance
The investment return and principal value of an investment in the Portfolios will fluctuate, so that shares, when redeemed, may be worth more or less than their original cost. Performance shown in this report represents past performance and does not guarantee future results. Current performance may be lower or higher than the performance information shown. You may obtain performance information current to the most recent month-end by visiting www.abfunds.com.
| | |
| 10 | AB MUNICIPAL INCOME FUND II | | abfunds.com |
DISCLOSURES AND RISKS (continued)
All fees and expenses related to the operation of the Portfolios have been deducted. Net asset value (“NAV”) returns do not reflect sales charges; if sales charges were reflected, the Portfolios’ quoted performance would be lower. SEC returns reflect the applicable sales charges for each share class: a 3.00% maximum front-end sales charge for Class A shares; the applicable contingent deferred sales charge for Class B shares (3% year 1, 2% year 2, 1% year 3) and a 1% 1-year contingent deferred sales charge for Class C shares. Returns for the different share classes will vary due to different expenses associated with each class. Performance assumes reinvestment of distributions and does not account for taxes.
| | |
| abfunds.com | | AB MUNICIPAL INCOME FUND II | 11 |
HISTORICAL PERFORMANCE
AB ARIZONA PORTFOLIO
GROWTH OF A $10,000 INVESTMENT IN THE PORTFOLIO (unaudited)
5/31/2008 TO 5/31/2018
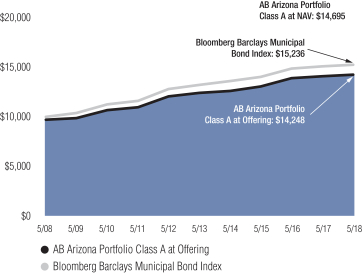
This chart illustrates the total value of an assumed $10,000 investment in AB Arizona Portfolio Class A shares (from 5/31/2008 to 5/31/2018) as compared to the performance of the Portfolio’s benchmark. Class A at Offering reflects the deduction of the maximum 3% sales charge from the initial $10,000 investment in the Portfolio and assumes the reinvestment of dividends and capital gains distributions.
| | |
| 12 | AB MUNICIPAL INCOME FUND II | | abfunds.com |
HISTORICAL PERFORMANCE (continued)
AB ARIZONA PORTFOLIO
AVERAGE ANNUAL RETURNS AS OF MAY 31, 2018 (unaudited)
| | | | | | | | | | | | | | | | |
| | | NAV Returns | | | SEC Returns
(reflects applicable
sales charges) | | | SEC Yields1 | | | Taxable
Equivalent Yields2 | |
| CLASS A SHARES | | | | | | | | | | | 2.02% | | | | 3.26% | |
| 1 Year | | | 1.30% | | | | -1.78% | | | | | | | | | |
| 5 Years | | | 2.81% | | | | 2.18% | | | | | | | | | |
| 10 Years | | | 3.92% | | | | 3.60% | | | | | | | | | |
| CLASS B SHARES | | | | | | | | | | | 1.24% | | | | 2.00% | |
| 1 Year | | | 0.54% | | | | -2.41% | | | | | | | | | |
| 5 Years | | | 2.04% | | | | 2.04% | | | | | | | | | |
| 10 Years3 | | | 3.50% | | | | 3.50% | | | | | | | | | |
| CLASS C SHARES | | | | | | | | | | | 1.34% | | | | 2.16% | |
| 1 Year | | | 0.55% | | | | -0.44% | | | | | | | | | |
| 5 Years | | | 2.04% | | | | 2.04% | | | | | | | | | |
| 10 Years | | | 3.19% | | | | 3.19% | | | | | | | | | |
The Portfolio’s current prospectus fee table shows the Portfolio’s total annual operating expense ratios as 0.97%, 1.73% and 1.72% for Class A, Class B and Class C shares, respectively, gross of any fee waivers or expense reimbursements. Contractual fee waivers and/or expense reimbursements limit the Portfolio’s annual operating expense ratios to 0.78%, 1.53% and 1.53% for Class A, Class B and Class C shares, respectively. These waivers/reimbursements may not be terminated before September 29, 2018 and may be extended by the Adviser for additional one-year terms. Absent reimbursements or waivers, performance would have been lower. The Financial Highlights section of this report sets forth expense ratio data for the current reporting period; the expense ratios shown above may differ from the expense ratios in the Financial Highlights section since they are based on different time periods.
| 1 | SEC yields are calculated based on SEC guidelines for the 30-day period ended May 31, 2018. |
| 2 | Taxable equivalent yields are based on SEC yields and a 35% marginal federal income tax rate and maximum state taxes where applicable. |
| 3 | Assumes conversion of Class B shares into Class A shares after six years. |
| | |
| abfunds.com | | AB MUNICIPAL INCOME FUND II | 13 |
HISTORICAL PERFORMANCE (continued)
AB ARIZONA PORTFOLIO
SEC AVERAGE ANNUAL RETURNS
AS OF THE MOST RECENT CALENDAR QUARTER-END
JUNE 30, 2018 (unaudited)
| | | | |
| | | SEC Returns
(reflects applicable
sales charges) | |
| CLASS A SHARES | | | | |
| 1 Year | | | -1.36% | |
| 5 Years | | | 2.80% | |
| 10 Years | | | 3.70% | |
| CLASS B SHARES | | | | |
| 1 Year | | | -2.06% | |
| 5 Years | | | 2.68% | |
| 10 Years1 | | | 3.59% | |
| CLASS C SHARES | | | | |
| 1 Year | | | -0.08% | |
| 5 Years | | | 2.68% | |
| 10 Years | | | 3.28% | |
| 1 | Assumes conversion of Class B shares into Class A shares after six years. |
| | |
| 14 | AB MUNICIPAL INCOME FUND II | | abfunds.com |
HISTORICAL PERFORMANCE
AB MASSACHUSETTS PORTFOLIO
GROWTH OF A $10,000 INVESTMENT IN THE PORTFOLIO (unaudited)
5/31/2008 TO 5/31/2018
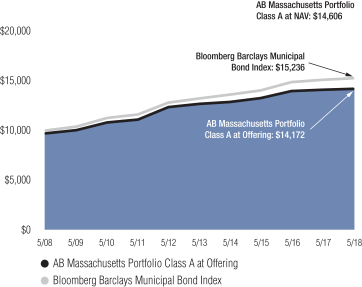
This chart illustrates the total value of an assumed $10,000 investment in AB Massachusetts Portfolio Class A shares (from 5/31/2008 to 5/31/2018) as compared to the performance of the Portfolio’s benchmark. Class A at Offering reflects the deduction of the maximum 3% sales charge from the initial $10,000 investment in the Portfolio and assumes the reinvestment of dividends and capital gains distributions.
| | |
| abfunds.com | | AB MUNICIPAL INCOME FUND II | 15 |
HISTORICAL PERFORMANCE (continued)
AB MASSACHUSETTS PORTFOLIO
AVERAGE ANNUAL RETURNS AS OF MAY 31, 2018 (unaudited)
| | | | | | | | | | | | | | | | |
| | | NAV Returns | | | SEC Returns
(reflects applicable
sales charges) | | | SEC Yields1 | | | Taxable
Equivalent Yields2 | |
| CLASS A SHARES | | | | | | | | | | | 1.79% | | | | 2.90% | |
| 1 Year | | | 0.75% | | | | -2.27% | | | | | | | | | |
| 5 Years | | | 2.30% | | | | 1.68% | | | | | | | | | |
| 10 Years | | | 3.86% | | | | 3.55% | | | | | | | | | |
| CLASS B SHARES | | | | | | | | | | | 1.09% | | | | 1.77% | |
| 1 Year | | | -0.01% | | | | -2.94% | | | | | | | | | |
| 5 Years | | | 1.56% | | | | 1.56% | | | | | | | | | |
| 10 Years3 | | | 3.45% | | | | 3.45% | | | | | | | | | |
| CLASS C SHARES | | | | | | | | | | | 1.11% | | | | 1.80% | |
| 1 Year | | | -0.01% | | | | -0.98% | | | | | | | | | |
| 5 Years | | | 1.56% | | | | 1.56% | | | | | | | | | |
| 10 Years | | | 3.13% | | | | 3.13% | | | | | | | | | |
| ADVISOR CLASS SHARES4 | | | | | | | | | | | 2.10% | | | | 3.40% | |
| 1 Year | | | 1.00% | | | | 1.00% | | | | | | | | | |
| Since Inception5 | | | 0.28% | | | | 0.28% | | | | | | | | | |
The Portfolio’s current prospectus fee table shows the Portfolio’s total annual operating expense ratios as 0.88%, 1.63%, 1.63% and 0.65% for Class A, Class B, Class C and Advisor Class shares, respectively, gross of any fee waivers or expense reimbursements. Contractual fee waivers and/or expense reimbursements limit the Portfolio’s annual operating expense ratios to 0.77%, 1.52%, 1.52% and 0.52% for Class A, Class B, Class C and Advisor Class shares, respectively. These waivers/reimbursements may not be terminated before September 29, 2018 and may be extended by the Adviser for additional one-year terms. Absent reimbursements or waivers, performance would have been lower. The Financial Highlights section of this report sets forth expense ratio data for the current reporting period; the expense ratios shown above may differ from the expense ratios in the Financial Highlights section since they are based on different time periods.
| 1 | SEC yields are calculated based on SEC guidelines for the 30-day period ended May 31, 2018. |
| 2 | Taxable equivalent yields are based on SEC yields and a 35% marginal federal income tax rate and maximum state taxes where applicable. |
| 3 | Assumes conversion of Class B shares into Class A shares after six years. |
| 4 | This share class is offered at NAV to eligible investors and the SEC returns are the same as the NAV returns. Please note that this share class is for investors purchasing shares through accounts established under certain fee-based programs sponsored and maintained by certain broker-dealers and financial intermediaries, institutional pension plans and/or investment advisory clients of, and certain other persons associated with, the Adviser and its affiliates or the Portfolios. |
| 5 | Inception date: 7/25/2016. |
| | |
| 16 | AB MUNICIPAL INCOME FUND II | | abfunds.com |
HISTORICAL PERFORMANCE (continued)
AB MASSACHUSETTS PORTFOLIO
SEC AVERAGE ANNUAL RETURNS
AS OF THE MOST RECENT CALENDAR QUARTER-END
JUNE 30, 2018 (unaudited)
| | | | |
| | | SEC Returns
(reflects applicable
sales charges) | |
| CLASS A SHARES | | | | |
| 1 Year | | | -1.95% | |
| 5 Years | | | 2.36% | |
| 10 Years | | | 3.62% | |
| CLASS B SHARES | | | | |
| 1 Year | | | -2.60% | |
| 5 Years | | | 2.25% | |
| 10 Years1 | | | 3.51% | |
| CLASS C SHARES | | | | |
| 1 Year | | | -0.64% | |
| 5 Years | | | 2.25% | |
| 10 Years | | | 3.20% | |
| ADVISOR CLASS SHARES2 | | | | |
| 1 Year | | | 1.26% | |
| Since Inception3 | | | 0.31% | |
| 1 | Assumes conversion of Class B shares into Class A shares after six years. |
| 2 | Please note that this share class is for investors purchasing shares through accounts established under certain fee-based programs sponsored and maintained by certain broker-dealers and financial intermediaries, institutional pension plans and/or investment advisory clients of, and certain other persons associated with, the Adviser and its affiliates or the Portfolios. |
| 3 | Inception date: 7/25/2016. |
| | |
| abfunds.com | | AB MUNICIPAL INCOME FUND II | 17 |
HISTORICAL PERFORMANCE
AB MINNESOTA PORTFOLIO
GROWTH OF A $10,000 INVESTMENT IN THE PORTFOLIO (unaudited)
5/31/2008 TO 5/31/2018
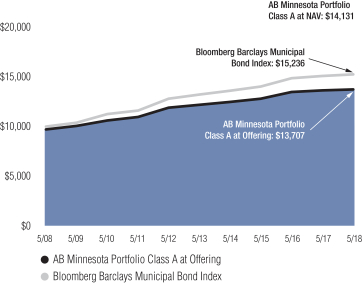
This chart illustrates the total value of an assumed $10,000 investment in AB Minnesota Portfolio Class A shares (from 5/31/2008 to 5/31/2018) as compared to the performance of the Portfolio’s benchmark. Class A at Offering reflects the deduction of the maximum 3% sales charge from the initial $10,000 investment in the Portfolio and assumes the reinvestment of dividends and capital gains distributions.
| | |
| 18 | AB MUNICIPAL INCOME FUND II | | abfunds.com |
HISTORICAL PERFORMANCE (continued)
AB MINNESOTA PORTFOLIO
AVERAGE ANNUAL RETURNS AS OF MAY 31, 2018 (unaudited)
| | | | | | | | | | | | | | | | |
| | | NAV Returns | | | SEC Returns
(reflects applicable
sales charges) | | | SEC Yields1 | | | Taxable
Equivalent Yields2 | |
| CLASS A SHARES | | | | | | | | | | | 1.38% | | | | 2.36% | |
| 1 Year | | | 0.69% | | | | -2.33% | | | | | | | | | |
| 5 Years | | | 2.40% | | | | 1.77% | | | | | | | | | |
| 10 Years | | | 3.52% | | | | 3.20% | | | | | | | | | |
| CLASS B SHARES | | | | | | | | | | | 0.71% | | | | 1.21% | |
| 1 Year | | | 0.04% | | | | -2.90% | | | | | | | | | |
| 5 Years | | | 1.67% | | | | 1.67% | | | | | | | | | |
| 10 Years3 | | | 3.08% | | | | 3.08% | | | | | | | | | |
| CLASS C SHARES | | | | | | | | | | | 0.68% | | | | 1.16% | |
| 1 Year | | | -0.06% | | | | -1.04% | | | | | | | | | |
| 5 Years | | | 1.65% | | | | 1.65% | | | | | | | | | |
| 10 Years | | | 2.78% | | | | 2.78% | | | | | | | | | |
The Portfolio’s current prospectus fee table shows the Portfolio’s total annual operating expense ratios as 1.11%, 1.92% and 1.85% for Class A, Class B and Class C shares, respectively, gross of any fee waivers or expense reimbursements. Contractual fee waivers and/or expense reimbursements limit the Portfolio’s annual operating expense ratios inclusive of interest expense to 0.85%, 1.60% and 1.60% for Class A, Class B and Class C shares, respectively. These waivers/reimbursements may not be terminated before September 29, 2018 and may be extended by the Adviser for additional one-year terms. Absent reimbursements or waivers, performance would have been lower. The Financial Highlights section of this report sets forth expense ratio data for the current reporting period; the expense ratios shown above may differ from the expense ratios in the Financial Highlights section since they are based on different time periods.
| 1 | SEC yields are calculated based on SEC guidelines for the 30-day period ended May 31, 2018. |
| 2 | Taxable equivalent yields are based on SEC yields and a 35% marginal federal income tax rate and maximum state taxes where applicable. |
| 3 | Assumes conversion of Class B shares into Class A shares after six years. |
| | |
| abfunds.com | | AB MUNICIPAL INCOME FUND II | 19 |
HISTORICAL PERFORMANCE (continued)
AB MINNESOTA PORTFOLIO
SEC AVERAGE ANNUAL RETURNS
AS OF THE MOST RECENT CALENDAR QUARTER-END
JUNE 30, 2018 (unaudited)
| | | | |
| | | SEC Returns
(reflects applicable
sales charges) | |
| CLASS A SHARES | | | | |
| 1 Year | | | -1.89% | |
| 5 Years | | | 2.32% | |
| 10 Years | | | 3.27% | |
| CLASS B SHARES | | | | |
| 1 Year | | | -2.54% | |
| 5 Years | | | 2.24% | |
| 10 Years1 | | | 3.15% | |
| CLASS C SHARES | | | | |
| 1 Year | | | -0.57% | |
| 5 Years | | | 2.19% | |
| 10 Years | | | 2.85% | |
| 1 | Assumes conversion of Class B shares into Class A shares after six years. |
| | |
| 20 | AB MUNICIPAL INCOME FUND II | | abfunds.com |
HISTORICAL PERFORMANCE
AB NEW JERSEY PORTFOLIO
GROWTH OF A $10,000 INVESTMENT IN THE PORTFOLIO (unaudited)
5/31/2008 TO 5/31/2018
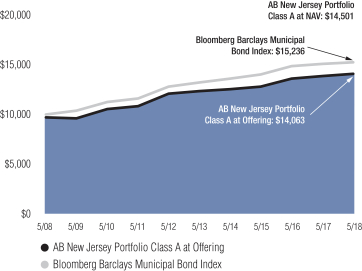
This chart illustrates the total value of an assumed $10,000 investment in AB New Jersey Portfolio Class A shares (from 5/31/2008 to 5/31/2018) as compared to the performance of the Portfolio’s benchmark. Class A at Offering reflects the deduction of the maximum 3% sales charge from the initial $10,000 investment in the Portfolio and assumes the reinvestment of dividends and capital gains distributions.
| | |
| abfunds.com | | AB MUNICIPAL INCOME FUND II | 21 |
HISTORICAL PERFORMANCE (continued)
AB NEW JERSEY PORTFOLIO
AVERAGE ANNUAL RETURNS AS OF MAY 31, 2018 (unaudited)
| | | | | | | | | | | | | | | | |
| | | NAV Returns | | | SEC Returns
(reflects applicable
sales charges) | | | SEC Yields1 | | | Taxable
Equivalent Yields2 | |
| CLASS A SHARES | | | | | | | | | | | 1.73% | | | | 2.92% | |
| 1 Year | | | 1.65% | | | | -1.38% | | | | | | | | | |
| 5 Years | | | 2.66% | | | | 2.03% | | | | | | | | | |
| 10 Years | | | 3.79% | | | | 3.47% | | | | | | | | | |
| CLASS B SHARES | | | | | | | | | | | 1.02% | | | | 1.72% | |
| 1 Year | | | 0.88% | | | | -2.07% | | | | | | | | | |
| 5 Years | | | 1.92% | | | | 1.92% | | | | | | | | | |
| 10 Years3 | | | 3.35% | | | | 3.35% | | | | | | | | | |
| CLASS C SHARES | | | | | | | | | | | 1.04% | | | | 1.76% | |
| 1 Year | | | 0.89% | | | | -0.10% | | | | | | | | | |
| 5 Years | | | 1.92% | | | | 1.92% | | | | | | | | | |
| 10 Years | | | 3.04% | | | | 3.04% | | | | | | | | | |
The Portfolio’s current prospectus fee table shows the Portfolio’s total annual operating expense ratios as 1.01%, 1.76% and 1.76% for Class A, Class B and Class C shares, respectively, gross of any fee waivers or expense reimbursements. Contractual fee waivers and/or expense reimbursements limit the Portfolio’s annual operating expense ratios to 0.82%, 1.57% and 1.57% for Class A, Class B and Class C shares, respectively. These waivers/reimbursements may not be terminated before September 29, 2018 and may be extended by the Adviser for additional one-year terms. Absent reimbursements or waivers, performance would have been lower. The Financial Highlights section of this report sets forth expense ratio data for the current reporting period; the expense ratios shown above may differ from the expense ratios in the Financial Highlights section since they are based on different time periods.
| 1 | SEC yields are calculated based on SEC guidelines for the 30-day period ended May 31, 2018. |
| 2 | Taxable equivalent yields are based on SEC yields and a 35% marginal federal income tax rate and maximum state taxes where applicable. |
| 3 | Assumes conversion of Class B shares into Class A shares after six years. |
| | |
| 22 | AB MUNICIPAL INCOME FUND II | | abfunds.com |
HISTORICAL PERFORMANCE (continued)
AB NEW JERSEY PORTFOLIO
SEC AVERAGE ANNUAL RETURNS
AS OF THE MOST RECENT CALENDAR QUARTER-END
JUNE 30, 2018 (unaudited)
| | | | |
| | | SEC Returns
(reflects applicable
sales charges) | |
| CLASS A SHARES | | | | |
| 1 Year | | | -1.20% | |
| 5 Years | | | 2.67% | |
| 10 Years | | | 3.58% | |
| CLASS B SHARES | | | | |
| 1 Year | | | -1.88% | |
| 5 Years | | | 2.55% | |
| 10 Years1 | | | 3.46% | |
| CLASS C SHARES | | | | |
| 1 Year | | | 0.10% | |
| 5 Years | | | 2.54% | |
| 10 Years | | | 3.14% | |
| 1 | Assumes conversion of Class B shares into Class A shares after six years. |
| | |
| abfunds.com | | AB MUNICIPAL INCOME FUND II | 23 |
HISTORICAL PERFORMANCE
AB OHIO PORTFOLIO
GROWTH OF A $10,000 INVESTMENT IN THE PORTFOLIO (unaudited)
5/31/2008 TO 5/31/2018
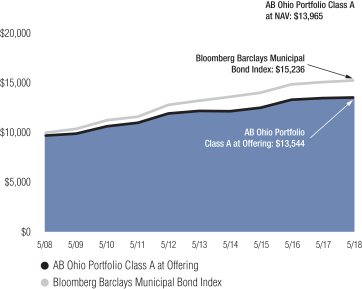
This chart illustrates the total value of an assumed $10,000 investment in AB Ohio Portfolio Class A shares (from 5/31/2008 to 5/31/2018) as compared to the performance of the Portfolio’s benchmark. Class A at Offering reflects the deduction of the maximum 3% sales charge from the initial $10,000 investment in the Portfolio and assumes the reinvestment of dividends and capital gains distributions.
| | |
| 24 | AB MUNICIPAL INCOME FUND II | | abfunds.com |
HISTORICAL PERFORMANCE (continued)
AB OHIO PORTFOLIO
AVERAGE ANNUAL RETURNS AS OF MAY 31, 2018 (unaudited)
| | | | | | | | | | | | | | | | |
| | | NAV Returns | | | SEC Returns
(reflects applicable
sales charges) | | | SEC Yields1 | | | Taxable
Equivalent Yields2 | |
| CLASS A SHARES | | | | | | | | | | | 1.80% | | | | 2.93% | |
| 1 Year | | | 0.58% | | | | -2.43% | | | | | | | | | |
| 5 Years | | | 2.13% | | | | 1.51% | | | | | | | | | |
| 10 Years | | | 3.40% | | | | 3.08% | | | | | | | | | |
| CLASS B SHARES | | | | | | | | | | | 1.06% | | | | 1.73% | |
| 1 Year | | | -0.17% | | | | -3.10% | | | | | | | | | |
| 5 Years | | | 1.39% | | | | 1.39% | | | | | | | | | |
| 10 Years3 | | | 2.97% | | | | 2.97% | | | | | | | | | |
| CLASS C SHARES | | | | | | | | | | | 1.12% | | | | 1.82% | |
| 1 Year | | | -0.07% | | | | -1.05% | | | | | | | | | |
| 5 Years | | | 1.39% | | | | 1.39% | | | | | | | | | |
| 10 Years | | | 2.67% | | | | 2.67% | | | | | | | | | |
The Portfolio’s current prospectus fee table shows the Portfolio’s total annual operating expense ratios as 1.03%, 1.85% and 1.78% for Class A, Class B and Class C shares, respectively, gross of any fee waivers or expense reimbursements. Contractual fee waivers and/or expense reimbursements limit the Portfolio’s annual operating expense ratios to 0.80%, 1.55% and 1.55% for Class A, Class B and Class C shares, respectively. These waivers/reimbursements may not be terminated before September 29, 2018 and may be extended by the Adviser for additional one-year terms. Absent reimbursements or waivers, performance would have been lower. The Financial Highlights section of this report sets forth expense ratio data for the current reporting period; the expense ratios shown above may differ from the expense ratios in the Financial Highlights section since they are based on different time periods.
| 1 | SEC yields are calculated based on SEC guidelines for the 30-day period ended May 31, 2018. |
| 2 | Taxable equivalent yields are based on SEC yields and a 35% marginal federal income tax rate and maximum state taxes where applicable. |
| 3 | Assumes conversion of Class B shares into Class A shares after six years. |
| | |
| abfunds.com | | AB MUNICIPAL INCOME FUND II | 25 |
HISTORICAL PERFORMANCE (continued)
AB OHIO PORTFOLIO
SEC AVERAGE ANNUAL RETURNS
AS OF THE MOST RECENT CALENDAR QUARTER-END
JUNE 30, 2018 (unaudited)
| | | | |
| | | SEC Returns
(reflects applicable
sales charges) | |
| CLASS A SHARES | | | | |
| 1 Year | | | -1.95% | |
| 5 Years | | | 2.16% | |
| 10 Years | | | 3.20% | |
| CLASS B SHARES | | | | |
| 1 Year | | | -2.61% | |
| 5 Years | | | 2.04% | |
| 10 Years1 | | | 3.08% | |
| CLASS C SHARES | | | | |
| 1 Year | | | -0.54% | |
| 5 Years | | | 2.04% | |
| 10 Years | | | 2.78% | |
| 1 | Assumes conversion of Class B shares into Class A shares after six years. |
| | |
| 26 | AB MUNICIPAL INCOME FUND II | | abfunds.com |
HISTORICAL PERFORMANCE
AB PENNSYLVANIA PORTFOLIO
GROWTH OF A $10,000 INVESTMENT IN THE PORTFOLIO (unaudited)
5/31/2008 TO 5/31/2018

This chart illustrates the total value of an assumed $10,000 investment in AB Pennsylvania Portfolio Class A shares (from 5/31/2008 to 5/31/2018) as compared to the performance of the Portfolio’s benchmark. Class A at Offering reflects the deduction of the maximum 3% sales charge from the initial $10,000 investment in the Portfolio and assumes the reinvestment of dividends and capital gains distributions.
| | |
| abfunds.com | | AB MUNICIPAL INCOME FUND II | 27 |
HISTORICAL PERFORMANCE (continued)
AB PENNSYLVANIA PORTFOLIO
AVERAGE ANNUAL RETURNS AS OF MAY 31, 2018 (unaudited)
| | | | | | | | | | | | | | | | |
| | | NAV Returns | | | SEC Returns
(reflects applicable
sales charges) | | | SEC Yields1 | | | Taxable
Equivalent Yields2 | |
| CLASS A SHARES | | | | | | | | | | | 1.75% | | | | 2.78% | |
| 1 Year | | | 1.10% | | | | -1.97% | | | | | | | | | |
| 5 Years | | | 2.70% | | | | 2.07% | | | | | | | | | |
| 10 Years | | | 3.74% | | | | 3.43% | | | | | | | | | |
| CLASS B SHARES | | | | | | | | | | | 1.02% | | | | 1.62% | |
| 1 Year | | | 0.35% | | | | -2.60% | | | | | | | | | |
| 5 Years | | | 1.95% | | | | 1.95% | | | | | | | | | |
| 10 Years3 | | | 3.31% | | | | 3.31% | | | | | | | | | |
| CLASS C SHARES | | | | | | | | | | | 1.06% | | | | 1.68% | |
| 1 Year | | | 0.35% | | | | -0.64% | | | | | | | | | |
| 5 Years | | | 1.97% | | | | 1.97% | | | | | | | | | |
| 10 Years | | | 3.01% | | | | 3.01% | | | | | | | | | |
The Portfolio’s current prospectus fee table shows the Portfolio’s total annual operating expense ratios as 1.05%, 1.79% and 1.79% for Class A, Class B and Class C shares, respectively, gross of any fee waivers or expense reimbursements. Contractual fee waivers and/or expense reimbursements limit the Portfolio’s annual operating expense ratios to 0.85%, 1.60% and 1.60% for Class A, Class B and Class C shares, respectively. These waivers/reimbursements may not be terminated before September 29, 2018 and may be extended by the Adviser for additional one-year terms. Absent reimbursements or waivers, performance would have been lower. The Financial Highlights section of this report sets forth expense ratio data for the current reporting period; the expense ratios shown above may differ from the expense ratios in the Financial Highlights section since they are based on different time periods.
| 1 | SEC yields are calculated based on SEC guidelines for the 30-day period ended May 31, 2018. |
| 2 | Taxable equivalent yields are based on SEC yields and a 35% marginal federal income tax rate and maximum state taxes where applicable. |
| 3 | Assumes conversion of Class B shares into Class A shares after six years. |
| | |
| 28 | AB MUNICIPAL INCOME FUND II | | abfunds.com |
HISTORICAL PERFORMANCE (continued)
AB PENNSYLVANIA PORTFOLIO
SEC AVERAGE ANNUAL RETURNS
AS OF THE MOST RECENT CALENDAR QUARTER-END
JUNE 30, 2018 (unaudited)
| | | | |
| | | SEC Returns
(reflects applicable
sales charges) | |
| CLASS A SHARES | | | | |
| 1 Year | | | -1.42% | |
| 5 Years | | | 2.70% | |
| 10 Years | | | 3.52% | |
| CLASS B SHARES | | | | |
| 1 Year | | | -2.13% | |
| 5 Years | | | 2.57% | |
| 10 Years1 | | | 3.41% | |
| CLASS C SHARES | | | | |
| 1 Year | | | -0.25% | |
| 5 Years | | | 2.57% | |
| 10 Years | | | 3.09% | |
| 1 | Assumes conversion of Class B shares into Class A shares after six years. |
| | |
| abfunds.com | | AB MUNICIPAL INCOME FUND II | 29 |
HISTORICAL PERFORMANCE
AB VIRGINIA PORTFOLIO
GROWTH OF A $10,000 INVESTMENT IN THE PORTFOLIO (unaudited)
5/31/2008 TO 5/31/2018
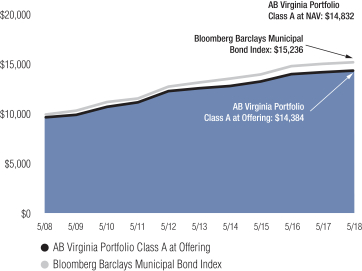
This chart illustrates the total value of an assumed $10,000 investment in AB Virginia Portfolio Class A shares (from 5/31/2008 to 5/31/2018) as compared to the performance of the Portfolio’s benchmark. Class A at Offering reflects the deduction of the maximum 3% sales charge from the initial $10,000 investment in the Portfolio and assumes the reinvestment of dividends and capital gains distributions.
| | |
| 30 | AB MUNICIPAL INCOME FUND II | | abfunds.com |
HISTORICAL PERFORMANCE (continued)
AB VIRGINIA PORTFOLIO
AVERAGE ANNUAL RETURNS AS OF MAY 31, 2018 (unaudited)
| | | | | | | | | | | | | | | | |
| | | NAV Returns | | | SEC Returns
(reflects applicable
sales charges) | | | SEC Yields1 | | | Taxable
Equivalent Yields2 | |
| CLASS A SHARES | | | | | | | | | | | 2.01% | | | | 3.28% | |
| 1 Year | | | 1.10% | | | | -1.97% | | | | | | | | | |
| 5 Years | | | 2.62% | | | | 1.99% | | | | | | | | | |
| 10 Years | | | 4.02% | | | | 3.70% | | | | | | | | | |
| CLASS B SHARES | | | | | | | | | | | 1.27% | | | | 2.07% | |
| 1 Year | | | 0.34% | | | | -2.61% | | | | | | | | | |
| 5 Years | | | 1.87% | | | | 1.87% | | | | | | | | | |
| 10 Years3 | | | 3.59% | | | | 3.59% | | | | | | | | | |
| CLASS C SHARES | | | | | | | | | | | 1.33% | | | | 2.17% | |
| 1 Year | | | 0.35% | | | | -0.63% | | | | | | | | | |
| 5 Years | | | 1.88% | | | | 1.88% | | | | | | | | | |
| 10 Years | | | 3.29% | | | | 3.29% | | | | | | | | | |
| ADVISOR CLASS SHARES4 | | | | | | | | | | | 2.33% | | | | 3.80% | |
| 1 Year | | | 1.35% | | | | 1.35% | | | | | | | | | |
| Since Inception5 | | | 0.80% | | | | 0.80% | | | | | | | | | |
The Portfolio’s current prospectus fee table shows the Portfolio’s total annual operating expense ratios as 0.88%, 1.64%, 1.63% and 0.66% for Class A, Class B, Class C and Advisor Class shares, respectively, gross of any fee waivers or expense reimbursements. Contractual fee waivers and/or expense reimbursements limit the Portfolio’s annual operating expense ratios to 0.80%, 1.55%, 1.55% and 0.55% for Class A, Class B, Class C and Advisor Class shares, respectively. These waivers/reimbursements may not be terminated before September 29, 2018 and may be extended by the Adviser for additional one-year terms. Absent reimbursements or waivers, performance would have been lower. The Financial Highlights section of this report sets forth expense ratio data for the current reporting period; the expense ratios shown above may differ from the expense ratios in the Financial Highlights section since they are based on different time periods.
| 1 | SEC yields are calculated based on SEC guidelines for the 30-day period ended May 31, 2018. |
| 2 | Taxable equivalent yields are based on SEC yields and a 35% marginal federal income tax rate and maximum state taxes where applicable. |
| 3 | Assumes conversion of Class B shares into Class A shares after six years. |
| 4 | This share class is offered at NAV to eligible investors and the SEC returns are the same as the NAV returns. Please note that this share class is for investors purchasing shares through accounts established under certain fee-based programs sponsored and maintained by certain broker-dealers and financial intermediaries, institutional pension plans and/or investment advisory clients of, and certain other persons associated with, the Adviser and its affiliates or the Portfolios. |
| 5 | Inception date: 7/25/2016. |
| | |
| abfunds.com | | AB MUNICIPAL INCOME FUND II | 31 |
HISTORICAL PERFORMANCE (continued)
AB VIRGINIA PORTFOLIO
SEC AVERAGE ANNUAL RETURNS
AS OF THE MOST RECENT CALENDAR QUARTER-END
JUNE 30, 2018 (unaudited)
| | | | |
| | | SEC Returns
(reflects applicable
sales charges) | |
| CLASS A SHARES | | | | |
| 1 Year | | | -1.65% | |
| 5 Years | | | 2.77% | |
| 10 Years | | | 3.79% | |
| CLASS B SHARES | | | | |
| 1 Year | | | -2.36% | |
| 5 Years | | | 2.66% | |
| 10 Years1 | | | 3.67% | |
| CLASS C SHARES | | | | |
| 1 Year | | | -0.38% | |
| 5 Years | | | 2.67% | |
| 10 Years | | | 3.37% | |
| ADVISOR CLASS SHARES2 | | | | |
| 1 Year | | | 1.61% | |
| Since Inception3 | | | 0.86% | |
| 1 | Assumes conversion of Class B shares into Class A shares after six years. |
| 2 | Please note that this share class is for investors purchasing shares through accounts established under certain fee-based programs sponsored and maintained by certain broker-dealers and financial intermediaries, institutional pension plans and/or investment advisory clients of, and certain other persons associated with, the Adviser and its affiliates or the Portfolios. |
| 3 | Inception date: 7/25/2016. |
| | |
| 32 | AB MUNICIPAL INCOME FUND II | | abfunds.com |
FUND EXPENSES
(unaudited)
As a shareholder of a Fund, you incur two types of costs: (1) transaction costs, including sales charges (loads) on purchase payments, contingent deferred sales charges on redemptions and (2) ongoing costs, including management fees; distribution (12b-1) fees; and other Fund expenses. This example is intended to help you understand your ongoing costs (in dollars) of investing in the Fund and to compare these costs with the ongoing costs of investing in other mutual funds.
The Example is based on an investment of $1,000 invested at the beginning of the period and held for the entire period as indicated below.
Actual Expenses
The first line of the table below provides information about actual account values and actual expenses. You may use the information in this line, together with the amount you invested, to estimate the expenses that you paid over the period. Simply divide your account value by $1,000 (for example, an $8,600 account value divided by $1,000 = 8.6), then multiply the result by the number in the first line under the heading entitled “Expenses Paid During Period” to estimate the expenses you paid on your account during this period.
Hypothetical Example for Comparison Purposes
The second line of the table below provides information about hypothetical account values and hypothetical expenses based on a Fund’s actual expense ratio and an assumed annual rate of return of 5% before expenses, which is not the Fund’s actual return. The hypothetical account values and expenses may not be used to estimate the actual ending account balance or expenses you paid for the period. You may use this information to compare the ongoing costs of investing in the Fund and other funds by comparing this 5% hypothetical example with the 5% hypothetical examples that appear in the shareholder reports of other funds.
Please note that the expenses shown in the table are meant to highlight your ongoing costs only and do not reflect any transactional costs, such as sales charges (loads), or contingent deferred sales charges on redemptions. Therefore, the second line of the table is useful in comparing ongoing costs only, and will not help you determine the relative total costs of owning different funds. In addition, if these transactional costs were included, your costs would have been higher.
| | |
| abfunds.com | | AB MUNICIPAL INCOME FUND II | 33 |
FUND EXPENSES (continued)
(unaudited)
AB Arizona Portfolio
| | | | | | | | | | | | | | | | |
| | | Beginning
Account Value
December 1, 2017 | | | Ending
Account Value
May 31, 2018 | | | Expenses
Paid During
Period* | | | Annualized
Expense
Ratio* | |
| Class A | | | | | | | | | | | | | | | | |
Actual | | $ | 1,000 | | | $ | 1,006.40 | | | $ | 4.00 | | | | 0.80 | % |
Hypothetical** | | $ | 1,000 | | | $ | 1,020.94 | | | $ | 4.03 | | | | 0.80 | % |
| Class B | | | | | | | | | | | | | | | | |
Actual | | $ | 1,000 | | | $ | 1,001.70 | | | $ | 7.69 | | | | 1.54 | % |
Hypothetical** | | $ | 1,000 | | | $ | 1,017.25 | | | $ | 7.75 | | | | 1.54 | % |
| Class C | | | | | | | | | | | | | | | | |
Actual | | $ | 1,000 | | | $ | 1,001.80 | | | $ | 7.74 | | | | 1.55 | % |
Hypothetical** | | $ | 1,000 | | | $ | 1,017.20 | | | $ | 7.80 | | | | 1.55 | % |
AB Massachusetts Portfolio
| | | | | | | | | | | | | | | | |
| | | Beginning
Account Value
December 1, 2017 | | | Ending
Account Value
May 31, 2018 | | | Expenses
Paid During
Period* | | | Annualized
Expense
Ratio* | |
| Class A | | | | | | | | | | | | | | | | |
Actual | | $ | 1,000 | | | $ | 1,002.10 | | | $ | 3.99 | | | | 0.80 | % |
Hypothetical** | | $ | 1,000 | | | $ | 1,020.94 | | | $ | 4.03 | | | | 0.80 | % |
| Class B | | | | | | | | | | | | | | | | |
Actual | | $ | 1,000 | | | $ | 998.30 | | | $ | 7.72 | | | | 1.55 | % |
Hypothetical** | | $ | 1,000 | | | $ | 1,017.20 | | | $ | 7.80 | | | | 1.55 | % |
| Class C | | | | | | | | | | | | | | | | |
Actual | | $ | 1,000 | | | $ | 998.30 | | | $ | 7.72 | | | | 1.55 | % |
Hypothetical** | | $ | 1,000 | | | $ | 1,017.20 | | | $ | 7.80 | | | | 1.55 | % |
| Advisor Class | | | | | | | | | | | | | | | | |
Actual | | $ | 1,000 | | | $ | 1,003.30 | | | $ | 2.75 | | | | 0.55 | % |
Hypothetical** | | $ | 1,000 | | | $ | 1,022.19 | | | $ | 2.77 | | | | 0.55 | % |
AB Minnesota Portfolio
| | | | | | | | | | | | | | | | |
| | | Beginning
Account Value
December 1, 2017 | | | Ending
Account Value
May 31, 2018 | | | Expenses
Paid During
Period* | | | Annualized
Expense
Ratio* | |
| Class A | | | | | | | | | | | | | | | | |
Actual | | $ | 1,000 | | | $ | 1,002.60 | | | $ | 4.34 | | | | 0.87 | % |
Hypothetical** | | $ | 1,000 | | | $ | 1,020.59 | | | $ | 4.38 | | | | 0.87 | % |
| Class B | | | | | | | | | | | | | | | | |
Actual | | $ | 1,000 | | | $ | 999.90 | | | $ | 8.08 | | | | 1.62 | % |
Hypothetical** | | $ | 1,000 | | | $ | 1,016.85 | | | $ | 8.15 | | | | 1.62 | % |
| Class C | | | | | | | | | | | | | | | | |
Actual | | $ | 1,000 | | | $ | 998.90 | | | $ | 8.07 | | | | 1.62 | % |
Hypothetical** | | $ | 1,000 | | | $ | 1,016.85 | | | $ | 8.15 | | | | 1.62 | % |
| | |
| 34 | AB MUNICIPAL INCOME FUND II | | abfunds.com |
FUND EXPENSES (continued)
(unaudited)
AB New Jersey Portfolio
| | | | | | | | | | | | | | | | |
| | | Beginning
Account Value
December 1, 2017 | | | Ending
Account Value
May 31, 2018 | | | Expenses
Paid During
Period* | | | Annualized
Expense
Ratio* | |
| Class A | | | | | | | | | | | | | | | | |
Actual | | $ | 1,000 | | | $ | 1,003.40 | | | $ | 4.20 | | | | 0.84 | % |
Hypothetical** | | $ | 1,000 | | | $ | 1,020.74 | | | $ | 4.23 | | | | 0.84 | % |
| Class B | | | | | | | | | | | | | | | | |
Actual | | $ | 1,000 | | | $ | 999.60 | | | $ | 7.93 | | | | 1.59 | % |
Hypothetical** | | $ | 1,000 | | | $ | 1,017.00 | | | $ | 8.00 | | | | 1.59 | % |
| Class C | | | | | | | | | | | | | | | | |
Actual | | $ | 1,000 | | | $ | 1,000.70 | | | $ | 7.93 | | | | 1.59 | % |
Hypothetical** | | $ | 1,000 | | | $ | 1,017.00 | | | $ | 8.00 | | | | 1.59 | % |
AB Ohio Portfolio
| | | | | | | | | | | | | | | | |
| | | Beginning
Account Value
December 1, 2017 | | | Ending
Account Value
May 31, 2018 | | | Expenses
Paid During
Period* | | | Annualized
Expense
Ratio* | |
| Class A | | | | | | | | | | | | | | | | |
Actual | | $ | 1,000 | | | $ | 1,002.00 | | | $ | 4.04 | | | | 0.81 | % |
Hypothetical** | | $ | 1,000 | | | $ | 1,020.89 | | | $ | 4.08 | | | | 0.81 | % |
| Class B | | | | | | | | | | | | | | | | |
Actual | | $ | 1,000 | | | $ | 998.30 | | | $ | 7.77 | | | | 1.56 | % |
Hypothetical** | | $ | 1,000 | | | $ | 1,017.15 | | | $ | 7.85 | | | | 1.56 | % |
| Class C | | | | | | | | | | | | | | | | |
Actual | | $ | 1,000 | | | $ | 999.30 | | | $ | 7.78 | | | | 1.56 | % |
Hypothetical** | | $ | 1,000 | | | $ | 1,017.15 | | | $ | 7.85 | | | | 1.56 | % |
AB Pennsylvania Portfolio
| | | | | | | | | | | | | | | | |
| | | Beginning
Account Value
December 1, 2017 | | | Ending
Account Value
May 31, 2018 | | | Expenses
Paid During
Period* | | | Annualized
Expense
Ratio* | |
| Class A | | | | | | | | | | | | | | | | |
Actual | | $ | 1,000 | | | $ | 1,006.00 | | | $ | 4.40 | | | | 0.88 | % |
Hypothetical** | | $ | 1,000 | | | $ | 1,020.54 | | | $ | 4.43 | | | | 0.88 | % |
| Class B | | | | | | | | | | | | | | | | |
Actual | | $ | 1,000 | | | $ | 1,001.30 | | | $ | 8.08 | | | | 1.62 | % |
Hypothetical** | | $ | 1,000 | | | $ | 1,016.85 | | | $ | 8.15 | | | | 1.62 | % |
| Class C | | | | | | | | | | | | | | | | |
Actual | | $ | 1,000 | | | $ | 1,002.30 | | | $ | 8.14 | | | | 1.63 | % |
Hypothetical** | | $ | 1,000 | | | $ | 1,016.80 | | | $ | 8.20 | | | | 1.63 | % |
| | |
| abfunds.com | | AB MUNICIPAL INCOME FUND II | 35 |
FUND EXPENSES (continued)
(unaudited)
AB Virginia Portfolio
| | | | | | | | | | | | | | | | |
| | | Beginning
Account Value
December 1, 2017 | | | Ending
Account Value
May 31, 2018 | | | Expenses
Paid During
Period* | | | Annualized
Expense
Ratio* | |
| Class A | | | | | | | | | | | | | | | | |
Actual | | $ | 1,000 | | | $ | 1,005.10 | | | $ | 4.10 | | | | 0.82 | % |
Hypothetical** | | $ | 1,000 | | | $ | 1,020.84 | | | $ | 4.13 | | | | 0.82 | % |
| Class B | | | | | | | | | | | | | | | | |
Actual | | $ | 1,000 | | | $ | 1,000.40 | | | $ | 7.83 | | | | 1.57 | % |
Hypothetical** | | $ | 1,000 | | | $ | 1,017.10 | | | $ | 7.90 | | | | 1.57 | % |
| Class C | | | | | | | | | | | | | | | | |
Actual | | $ | 1,000 | | | $ | 1,001.40 | | | $ | 7.83 | | | | 1.57 | % |
Hypothetical** | | $ | 1,000 | | | $ | 1,017.10 | | | $ | 7.90 | | | | 1.57 | % |
| Advisor Class | | | | | | | | | | | | | | | | |
Actual | | $ | 1,000 | | | $ | 1,005.50 | | | $ | 2.85 | | | | 0.57 | % |
Hypothetical** | | $ | 1,000 | | | $ | 1,022.09 | | | $ | 2.87 | | | | 0.57 | % |
| * | Expenses are equal to the classes’ annualized expense ratios multiplied by the average account value over the period, multiplied by 182/365 (to reflect the one-half year period). |
| ** | Assumes 5% annual return before expenses. |
| | |
| 36 | AB MUNICIPAL INCOME FUND II | | abfunds.com |
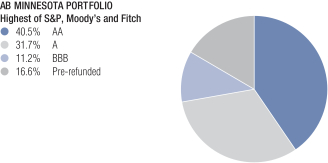
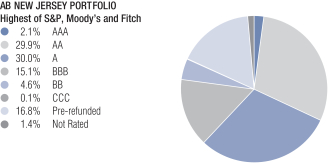
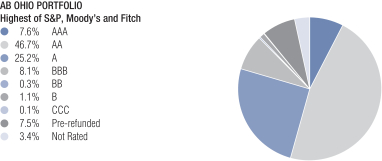
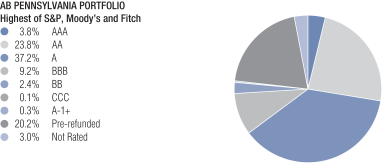
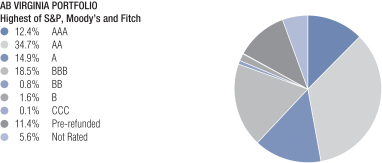
BOND RATING SUMMARY1
May 31, 2018 (unaudited)
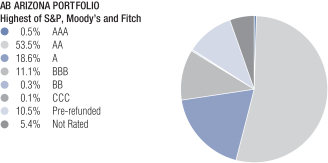

| 1 | All data are as of May 31, 2018. The Portfolio’s quality rating breakdown is expressed as a percentage of the Portfolio’s total investments in municipal securities and may vary over time. The Portfolio also enters into derivative transactions, which may be used for hedging or investment purposes (see “Portfolio of Investments” section of the report for additional details). The quality ratings are determined by using the S&P Global Ratings (“S&P”), Moody’s Investors Services, Inc. (“Moody’s”) and Fitch Ratings, Ltd. (“Fitch”). The Portfolio considers the credit ratings issued by S&P, Moody’s and Fitch and uses the highest rating issued by the agencies. These ratings are a measure of the quality and safety of a bond or portfolio, based on the issuer’s financial condition. AAA is the highest (best) and D is the lowest (worst). If applicable, the Pre-refunded category includes bonds which are secured by U.S. Government securities and therefore are deemed high-quality investment grade by the Adviser. If applicable, Not Applicable (N/A) includes non-creditworthy investments, such as equities, currency contracts, futures and options. If applicable, the Not Rated category includes bonds that are not rated by a nationally recognized statistical rating organization. The Adviser evaluates the creditworthiness of non-rated securities based on a number of factors including, but not limited to, cash flows, enterprise value and economic environment. |
| | |
| abfunds.com | | AB MUNICIPAL INCOME FUND II | 37 |
BOND RATING SUMMARY1
May 31, 2018 (unaudited)
| 1 | All data are as of May 31, 2018. The Portfolio’s quality rating breakdown is expressed as a percentage of the Portfolio’s total investments in municipal securities and may vary over time. The Portfolio also enters into derivative transactions, which may be used for hedging or investment purposes (see “Portfolio of Investments” section of the report for additional details). The quality ratings are determined by using the S&P Global Ratings (“S&P”), Moody’s Investors Services, Inc. (“Moody’s”) and Fitch Ratings, Ltd. (“Fitch”). The Portfolio considers the credit ratings issued by S&P, Moody’s and Fitch and uses the highest rating issued by the agencies. These ratings are a measure of the quality and safety of a bond or portfolio, based on the issuer’s financial condition. AAA is the highest (best) and D is the lowest (worst). If applicable, the Pre-refunded category includes bonds which are secured by U.S. Government securities and therefore are deemed high-quality investment grade by the Adviser. If applicable, Not Applicable (N/A) includes non-creditworthy investments, such as equities, currency contracts, futures and options. If applicable, the Not Rated category includes bonds that are not rated by a nationally recognized statistical rating organization. The Adviser evaluates the creditworthiness of non-rated securities based on a number of factors including, but not limited to, cash flows, enterprise value and economic environment. |
| | |
| 38 | AB MUNICIPAL INCOME FUND II | | abfunds.com |
BOND RATING SUMMARY1
May 31, 2018 (unaudited)
| 1 | All data are as of May 31, 2018. The Portfolio’s quality rating breakdown is expressed as a percentage of the Portfolio’s total investments in municipal securities and may vary over time. The Portfolio also enters into derivative transactions, which may be used for hedging or investment purposes (see “Portfolio of Investments” section of the report for additional details). The quality ratings are determined by using the S&P Global Ratings (“S&P”), Moody’s Investors Services, Inc. (“Moody’s”) and Fitch Ratings, Ltd. (“Fitch”). The Portfolio considers the credit ratings issued by S&P, Moody’s and Fitch and uses the highest rating issued by the agencies. These ratings are a measure of the quality and safety of a bond or portfolio, based on the issuer’s financial condition. AAA is the highest (best) and D is the lowest (worst). If applicable, the Pre-refunded category includes bonds which are secured by U.S. Government securities and therefore are deemed high-quality investment grade by the Adviser. If applicable, Not Applicable (N/A) includes non-creditworthy investments, such as equities, currency contracts, futures and options. If applicable, the Not Rated category includes bonds that are not rated by a nationally recognized statistical rating organization. The Adviser evaluates the creditworthiness of non-rated securities based on a number of factors including, but not limited to, cash flows, enterprise value and economic environment. |
| | |
| abfunds.com | | AB MUNICIPAL INCOME FUND II | 39 |
BOND RATING SUMMARY1
May 31, 2018 (unaudited)
| 1 | All data are as of May 31, 2018. The Portfolio’s quality rating breakdown is expressed as a percentage of the Portfolio’s total investments in municipal securities and may vary over time. The Portfolio also enters into derivative transactions, which may be used for hedging or investment purposes (see “Portfolio of Investments” section of the report for additional details). The quality ratings are determined by using the S&P Global Ratings (“S&P”), Moody’s Investors Services, Inc. (“Moody’s”) and Fitch Ratings, Ltd. (“Fitch”). The Portfolio considers the credit ratings issued by S&P, Moody’s and Fitch and uses the highest rating issued by the agencies. These ratings are a measure of the quality and safety of a bond or portfolio, based on the issuer’s financial condition. AAA is the highest (best) and D is the lowest (worst). If applicable, the Pre-refunded category includes bonds which are secured by U.S. Government securities and therefore are deemed high-quality investment grade by the Adviser. If applicable, Not Applicable (N/A) includes non-creditworthy investments, such as equities, currency contracts, futures and options. If applicable, the Not Rated category includes bonds that are not rated by a nationally recognized statistical rating organization. The Adviser evaluates the creditworthiness of non-rated securities based on a number of factors including, but not limited to, cash flows, enterprise value and economic environment. |
| | |
| 40 | AB MUNICIPAL INCOME FUND II | | abfunds.com |
PORTFOLIO OF INVESTMENTS
AB ARIZONA PORTFOLIO
May 31, 2018
| | | | | | | | |
| | | Principal
Amount
(000) | | | U.S. $ Value | |
| |
MUNICIPAL OBLIGATIONS – 98.5% | | | | | | | | |
Long-Term Municipal Bonds – 98.5% | | | | | | | | |
Arizona – 81.8% | | | | | | | | |
Arizona Department of Transportation State
Highway Fund Revenue
Series 2011A
5.25%, 7/01/29 (Pre-refunded/ETM) | | $ | 1,500 | | | $ | 1,646,070 | |
Series 2013A
5.00%, 7/01/37 | | | 3,000 | | | | 3,283,920 | |
Arizona Game & Fish Department & Commission
(Arizona Game & Fish Department & Commission State Lease)
Series 2006
5.00%, 7/01/26 | | | 1,000 | | | | 1,002,540 | |
Arizona Health Facilities Authority
(Dignity Health Obligated Group)
Series 2009D
5.00%, 7/01/28 | | | 1,000 | | | | 1,027,730 | |
Arizona Health Facilities Authority
(HonorHealth)
Series 2014A
5.00%, 12/01/34 | | | 3,000 | | | | 3,351,540 | |
Arizona State University
Series 2014
5.00%, 8/01/33 | | | 2,050 | | | | 2,314,552 | |
City of Glendale AZ Water & Sewer Revenue
Series 2012
5.00%, 7/01/28 | | | 2,000 | | | | 2,208,880 | |
City of Mesa AZ (City of Mesa AZ Excise Tax)
Series 2013
5.00%, 7/01/32 | | | 5,000 | | | | 5,487,450 | |
City of Mesa AZ Utility System Revenue
Series 2016
4.00%, 7/01/32 | | | 1,000 | | | | 1,073,450 | |
City of Phoenix Civic Improvement Corp.
(Phoenix Sky Harbor International Airport)
Series 2017A
5.00%, 7/01/33 | | | 750 | | | | 861,315 | |
City of Tempe AZ
(City of Tempe AZ Excise Tax)
Series 2016
5.00%, 7/01/30 | | | 520 | | | | 606,242 | |
City of Tucson AZ Water System Revenue
Series 2012
5.00%, 7/01/28 (Pre-refunded/ETM) | | | 500 | | | | 558,830 | |
5.00%, 7/01/29 (Pre-refunded/ETM) | | | 1,860 | | | | 2,078,848 | |
| | |
| abfunds.com | | AB MUNICIPAL INCOME FUND II | 41 |
PORTFOLIO OF INVESTMENTS (continued)
AB ARIZONA PORTFOLIO
| | | | | | | | |
| | | Principal
Amount
(000) | | | U.S. $ Value | |
| |
County of Pima AZ Sewer System Revenue
Series 2011B
5.00%, 7/01/26 (Pre-refunded/ETM) | | $ | 1,000 | | | $ | 1,089,960 | |
AGM Series 2010
5.00%, 7/01/25 (Pre-refunded/ETM) | | | 1,000 | | | | 1,063,400 | |
County of Pinal AZ
Series 2014
5.00%, 8/01/32 | | | 2,840 | | | | 3,215,107 | |
Glendale Industrial Development Authority
(Beatitudes Campus (The))
Series 2017
5.00%, 11/15/36(a) | | | 1,000 | | | | 1,036,550 | |
Glendale Industrial Development Authority
(Glencroft Retirement Community Obligated Group)
Series 2016
5.00%, 11/15/36(a) | | | 600 | | | | 609,486 | |
Glendale Industrial Development Authority
(Royal Oaks Life Care Community)
Series 2016
5.00%, 5/15/39 | | | 1,000 | | | | 1,098,430 | |
Glendale Municipal Property Corp.
(Glendale Municipal Property Corp. Excise Tax)
Series 2012C
5.00%, 7/01/38 | | | 2,500 | | | | 2,721,125 | |
Industrial Development Authority of the City of Phoenix (The)
Series 2012
6.00%, 7/01/32 (Pre-refunded/ETM)(a) | | | 250 | | | | 279,518 | |
Industrial Development Authority of the City of Phoenix (The)
(Deer Valley Assisted Living Facility LLC)
Series 2016A
5.125%, 7/01/36(a) | | | 1,000 | | | | 986,630 | |
Industrial Development Authority of the City of Phoenix (The)
(Downtown Phoenix Student Housing LLC)
Series 2018A
5.00%, 7/01/37-7/01/42 | | | 2,250 | | | | 2,497,417 | |
Industrial Development Authority of the City of Phoenix (The)
(JMF-Higley 2012 LLC)
Series 2012
5.00%, 12/01/32 | | | 2,500 | | | | 2,727,300 | |
| | |
| 42 | AB MUNICIPAL INCOME FUND II | | abfunds.com |
PORTFOLIO OF INVESTMENTS (continued)
AB ARIZONA PORTFOLIO
| | | | | | | | |
| | | Principal
Amount
(000) | | | U.S. $ Value | |
| |
Maricopa County Industrial Development Authority
(Banner Health Obligated Group)
Series 2016A
5.00%, 1/01/33-1/01/35 | | $ | 3,400 | | | $ | 3,898,828 | |
Maricopa County Industrial Development Authority
(GreatHearts Arizona Obligated Group)
Series 2017A
5.00%, 7/01/37 | | | 750 | | | | 851,790 | |
Maricopa County Industrial Development Authority
(Reid Traditional Schools Painted Rock Academy)
Series 2016
5.00%, 7/01/36-7/01/47 | | | 2,450 | | | | 2,569,633 | |
McAllister Academic Village LLC
(Arizona State University)
Series 2016
5.00%, 7/01/37 | | | 2,500 | | | | 2,861,925 | |
Northern Arizona University
BAM Series 2015
5.00%, 6/01/34 | | | 1,000 | | | | 1,134,060 | |
Pima County Regional Transportation Authority
Series 2011
5.00%, 6/01/26 (Pre-refunded/ETM) | | | 3,000 | | | | 3,259,170 | |
Pinal County Industrial Development Authority
(Florence West Prison Expansion LLC)
ACA Series 2006A
5.25%, 10/01/22 | | | 1,400 | | | | 1,401,036 | |
Salt River Project Agricultural Improvement & Power District
Series 2012A
5.00%, 12/01/29 | | | 1,500 | | | | 1,657,245 | |
Series 2015A
5.00%, 12/01/35 | | | 2,000 | | | | 2,285,820 | |
Series 2017A
5.00%, 1/01/33 | | | 1,100 | | | | 1,315,270 | |
Salt Verde Financial Corp.
(Citigroup, Inc.)
Series 2007
5.00%, 12/01/37 | | | 1,000 | | | | 1,194,890 | |
5.25%, 12/01/22-12/01/23 | | | 1,165 | | | | 1,309,967 | |
State of Arizona Lottery Revenue
AGM Series 2010A
5.00%, 7/01/28 | | | 6,000 | | | | 6,273,780 | |
| | |
| abfunds.com | | AB MUNICIPAL INCOME FUND II | 43 |
PORTFOLIO OF INVESTMENTS (continued)
AB ARIZONA PORTFOLIO
| | | | | | | | |
| | | Principal
Amount
(000) | | | U.S. $ Value | |
| |
Student & Academic Services LLC
(Northern Arizona Capital Facilities Finance Corp.)
BAM Series 2014
5.00%, 6/01/44 | | $ | 1,200 | | | $ | 1,308,036 | |
Tempe Industrial Development Authority
(Mirabella at ASU, Inc.)
Series 2017A
6.125%, 10/01/47(a)(b) | | | 400 | | | | 417,716 | |
Town of Buckeye AZ
(Town of Buckeye AZ Excise Tax)
Series 2015
5.00%, 7/01/35 | | | 3,450 | | | | 3,889,185 | |
Town of Queen Creek AZ Excise Tax Revenue
Series 2018A
5.00%, 8/01/47 | | | 2,000 | | | | 2,325,100 | |
Tucson Airport Authority, Inc. AMBAC
Series 2001
5.35%, 6/01/31 | | | 6,475 | | | | 6,492,741 | |
Tucson Industrial Development Authority
(University of Arizona)
AMBAC Series 2002A
5.00%, 7/15/32(a) | | | 985 | | | | 986,202 | |
University of Arizona
Series 2014
5.00%, 8/01/33 | | | 3,765 | | | | 4,216,838 | |
Western Maricopa Education Center District No. 402
Series 2014B
4.50%, 7/01/33-7/01/34 | | | 3,940 | | | | 4,277,852 | |
| | | | | | | | |
| | | | | | | 96,753,374 | |
| | | | | | | | |
Delaware – 0.5% | | | | | | | | |
Delaware State Economic Development Authority
(Newark Charter School, Inc.)
Series 2016
5.00%, 9/01/36 | | | 520 | | | | 564,153 | |
| | | | | | | | |
| | |
Florida – 2.7% | | | | | | | | |
City of Orlando FL
Series 2014A
5.25%, 11/01/33 (Pre-refunded/ETM) | | | 1,820 | | | | 2,125,942 | |
Halifax Hospital Medical Center
(Halifax Hospital Medical Center Obligated Group)
Series 2015
5.00%, 6/01/35 | | | 1,000 | | | | 1,099,470 | |
| | | | | | | | |
| | | | | | | 3,225,412 | |
| | | | | | | | |
| | |
| 44 | AB MUNICIPAL INCOME FUND II | | abfunds.com |
PORTFOLIO OF INVESTMENTS (continued)
AB ARIZONA PORTFOLIO
| | | | | | | | |
| | | Principal
Amount
(000) | | | U.S. $ Value | |
| |
Guam – 1.5% | | | | | | | | |
Guam Government Waterworks Authority
Series 2016
5.00%, 1/01/46 | | $ | 775 | | | $ | 820,027 | |
Guam Power Authority
Series 2017A
5.00%, 10/01/36-10/01/40 | | | 875 | | | | 944,046 | |
| | | | | | | | |
| | | | | | | 1,764,073 | |
| | | | | | | | |
Illinois – 2.4% | | | | | | | | |
Chicago Board of Education
Series 2018A
5.00%, 12/01/31(c) | | | 335 | | | | 345,770 | |
Cook County Forest Preserve District
Series 2012C
5.00%, 12/15/32 | | | 2,360 | | | | 2,492,892 | |
| | | | | | | | |
| | | | | | | 2,838,662 | |
| | | | | | | | |
Kentucky – 0.9% | | | | | | | | |
Kentucky Economic Development Finance Authority
(Owensboro Health, Inc. Obligated Group)
Series 2017A
5.25%, 6/01/41 | | | 1,000 | | | | 1,100,760 | |
| | | | | | | | |
| | |
Louisiana – 0.5% | | | | | | | | |
Louisiana Local Government Environmental Facilities & Community Development Auth
(St. James Place of Baton Rouge)
Series 2015A
6.25%, 11/15/45(a) | | | 500 | | | | 555,835 | |
| | | | | | | | |
| | |
Minnesota – 1.1% | | | | | | | | |
Western Minnesota Municipal Power Agency
Series 2015A
5.00%, 1/01/34 | | | 1,130 | | | | 1,285,375 | |
| | | | | | | | |
| | |
New York – 0.7% | | | | | | | | |
Suffolk County Economic Development Corp.
Series 2011
5.00%, 7/01/28 (Pre-refunded/ETM)(a) | | | 120 | | | | 130,908 | |
Suffolk County Economic Development Corp.
(Catholic Health Services of Long Island Obligated Group)
Series 2011
5.00%, 7/01/28 | | | 700 | | | | 756,441 | |
| | | | | | | | |
| | | | | | | 887,349 | |
| | | | | | | | |
| | |
| abfunds.com | | AB MUNICIPAL INCOME FUND II | 45 |
PORTFOLIO OF INVESTMENTS (continued)
AB ARIZONA PORTFOLIO
| | | | | | | | |
| | | Principal
Amount
(000) | | | U.S. $ Value | |
| |
North Carolina – 1.0% | | | | | | | | |
North Carolina Medical Care Commission
(Aldersgate United Methodist Retirement Community, Inc.)
Series 2015
4.70%, 7/01/37(a) | | $ | 600 | | | $ | 626,394 | |
North Carolina Medical Care Commission
(Pennybyrn at Maryfield)
Series 2015
5.00%, 10/01/35(a) | | | 500 | | | | 528,530 | |
| | | | | | | | |
| | | | | | | 1,154,924 | |
| | | | | | | | |
Ohio – 0.3% | |
Ohio Water Development Authority Water Pollution Control Loan Fund
(FirstEnergy Nuclear Generation LLC)
Series 2016A
4.375%, 6/01/33(a) | | | 320 | | | | 307,200 | |
| | | | | | | | |
|
Puerto Rico – 0.1% | |
Puerto Rico Industrial Tourist Educational Medical & Envirml Ctl Facs Fing Auth
(AES Puerto Rico LP)
Series 2000
6.625%, 6/01/26 | | | 165 | | | | 147,675 | |
| | | | | | | | |
|
South Carolina – 0.6% | |
South Carolina Public Service Authority
Series 2016B
5.00%, 12/01/41 | | | 620 | | | | 676,860 | |
| | | | | | | | |
|
Texas – 3.3% | |
North Texas Tollway Authority | | | | | | | | |
Series 2015A
5.00%, 1/01/34 | | | 1,000 | | | | 1,113,470 | |
Series 2015B
5.00%, 1/01/34 | | | 1,300 | | | | 1,461,499 | |
Texas Private Activity Bond Surface Transportation Corp.
(LBJ Infrastructure Group LLC)
Series 2010
7.00%, 6/30/40 | | | 840 | | | | 917,457 | |
Texas Private Activity Bond Surface Transportation Corp.
(NTE Mobility Partners LLC)
Series 2009
6.875%, 12/31/39 | | | 420 | | | | 448,665 | |
| | | | | | | | |
| | | | | | | 3,941,091 | |
| | | | | | | | |
| | |
| 46 | AB MUNICIPAL INCOME FUND II | | abfunds.com |
PORTFOLIO OF INVESTMENTS (continued)
AB ARIZONA PORTFOLIO
| | | | | | | | |
| | | Principal
Amount
(000) | | | U.S. $ Value | |
| |
Washington – 1.1% | |
Kalispel Tribe of Indians
Series 2018B
5.25%, 1/01/38(a)(c) | | $ | 225 | | | $ | 230,780 | |
Port of Seattle WA
Series 2015A
5.00%, 4/01/40 | | | 1,000 | | | | 1,109,540 | |
| | | | | | | | |
| | | | | | | 1,340,320 | |
| | | | | | | | |
Total Municipal Obligations
(cost $113,390,568) | | | | | | | 116,543,063 | |
| | | | | | | | |
| | |
| | | Shares | | | | |
SHORT-TERM INVESTMENTS – 0.2% | |
Investment Companies – 0.2% | |
AB Fixed Income Shares, Inc. – Government Money Market Portfolio – Class AB, 1.57%(d)(e)(f)
(cost $237,390) | | | 237,390 | | | | 237,390 | |
| | | | | | | | |
| | |
Total Investments – 98.7%
(cost $113,627,958) | | | | | | | 116,780,453 | |
Other assets less liabilities – 1.3% | | | | | | | 1,501,005 | |
| | | | | | | | |
| | |
Net Assets – 100.0% | | | | | | $ | 118,281,458 | |
| | | | | | | | |
| (a) | Security in which significant unobservable inputs (Level 3) were used in determining fair value. |
| (b) | Security is exempt from registration under Rule 144A of the Securities Act of 1933. This security is considered restricted, but liquid and may be resold in transactions exempt from registration, normally to qualified institutional buyers. At May 31, 2018, the market value of this security amounted to $417,716 or 0.4% of net assets. |
| (c) | When-Issued or delayed delivery security. |
| (d) | Affiliated investments. |
| (e) | The rate shown represents the 7-day yield as of period end. |
| (f) | To obtain a copy of the fund’s shareholder report, please go to the Securities and Exchange Commission’s website at www.sec.gov, or call AB at (800) 227-4618. |
As of May 31, 2018, the Portfolio’s percentages of investments in municipal bonds that are insured and in insured municipal bonds that have been pre-refunded or escrowed to maturity are 16.0% and 0.9%, respectively.
Glossary:
ACA – ACA Financial Guaranty Corporation
AGM – Assured Guaranty Municipal
AMBAC – Ambac Assurance Corporation
BAM – Build American Mutual
ETM – Escrowed to Maturity
See notes to financial statements.
| | |
| abfunds.com | | AB MUNICIPAL INCOME FUND II | 47 |
PORTFOLIO OF INVESTMENTS
AB MASSACHUSETTS PORTFOLIO
May 31, 2018
| | | | | | | | |
| | | Principal
Amount
(000) | | | U.S. $ Value | |
| |
MUNICIPAL OBLIGATIONS – 98.6% | | | | | | | | |
Long-Term Municipal Bonds – 98.6% | | | | | | | | |
Massachusetts – 82.2% | | | | | | | | |
Commonwealth of Massachusetts
Series 2013
5.00%, 6/01/31 (Pre-refunded/ETM) | | $ | 2,500 | | | $ | 2,723,575 | |
Series 2015A
5.00%, 7/01/35 | | | 10,000 | | | | 11,492,900 | |
Series 2018A
5.00%, 1/01/42 | | | 5,000 | | | | 5,808,700 | |
NATL Series 2000F
2.611%, 12/01/30(a) | | | 600 | | | | 600,000 | |
Commonwealth of Massachusetts
(Commonwealth of Massachusetts Fuel Tax)
AGM Series 2005A
3.881% (CPIYOYX + 1.67%), 6/01/20(b) | | | 2,000 | | | | 2,045,920 | |
Marthas Vineyard Land Bank
BAM Series 2014
5.00%, 5/01/31-5/01/32 | | | 2,830 | | | | 3,253,816 | |
Massachusetts Bay Transportation Authority
(Massachusetts Bay Transportation Authority Sales Tax)
Series 2010B
5.00%, 7/01/28-7/01/29 | | | 1,670 | | | | 1,774,419 | |
Massachusetts Clean Water Trust (The)
(Massachusetts Water Pollution Abatement Trust (The) SRF)
Series 2009
5.00%, 8/01/25 | | | 3,000 | | | | 3,110,550 | |
Massachusetts Development Finance Agency
Series 2010
5.00%, 7/01/28 (Pre-refunded/ETM) | | | 4,500 | | | | 4,790,025 | |
Series 2011
5.00%, 7/01/31 (Pre-refunded/ETM) | | | 7,000 | | | | 7,640,710 | |
Massachusetts Development Finance Agency
(Baystate Medical Obligated Group)
Series 2014N
5.00%, 7/01/44 | | | 7,000 | | | | 7,637,980 | |
Massachusetts Development Finance Agency
(Berkshire Health Systems, Inc. Obligated Group)
Series 2012G
5.00%, 10/01/30-10/01/31 | | | 3,970 | | | | 4,320,590 | |
| | |
| 48 | AB MUNICIPAL INCOME FUND II | | abfunds.com |
PORTFOLIO OF INVESTMENTS (continued)
AB MASSACHUSETTS PORTFOLIO
| | | | | | | | |
| | | Principal
Amount
(000) | | | U.S. $ Value | |
| |
Massachusetts Development Finance Agency
(Boston College)
Series 2010R-1
5.00%, 7/01/31 | | $ | 3,250 | | | $ | 3,443,732 | |
Series 2017T
5.00%, 7/01/37 | | | 1,000 | | | | 1,163,880 | |
Massachusetts Development Finance Agency
(Boston Medical Center Corp.)
Series 2015D
5.00%, 7/01/44 | | | 3,755 | | | | 4,073,349 | |
Massachusetts Development Finance Agency
(Brandeis University)
Series 2008N
5.00%, 10/01/26-10/01/27 | | | 3,300 | | | | 3,334,429 | |
Series 2010O-2
5.00%, 10/01/28 | | | 3,500 | | | | 3,648,260 | |
Massachusetts Development Finance Agency
(Broad Institute, Inc. (The))
Series 2017
5.00%, 4/01/34-4/01/35 | | | 5,980 | | | | 7,019,960 | |
Massachusetts Development Finance Agency
(Children’s Hospital Corp. (The))
Series 2014P
5.00%, 10/01/34 | | | 1,055 | | | | 1,193,870 | |
Massachusetts Development Finance Agency
(Emerson College)
Series 2016A
5.00%, 1/01/34-1/01/36 | | | 2,435 | | | | 2,694,960 | |
5.25%, 1/01/42 | | | 1,000 | | | | 1,114,530 | |
Massachusetts Development Finance Agency
(Emmanuel College/MA)
Series 2016A
5.00%, 10/01/31 | | | 2,000 | | | | 2,211,900 | |
Massachusetts Development Finance Agency
(Franklin W Olin College of Engineering, Inc.)
Series 2013E
5.00%, 11/01/38 | | | 5,000 | | | | 5,540,450 | |
Massachusetts Development Finance Agency
(Lawrence General Hospital Obligated Group)
Series 2017
5.00%, 7/01/37 | | | 1,150 | | | | 1,234,951 | |
Massachusetts Development Finance Agency
(Lesley University)
Series 2016
5.00%, 7/01/39 | | | 2,055 | | | | 2,310,128 | |
| | |
| abfunds.com | | AB MUNICIPAL INCOME FUND II | 49 |
PORTFOLIO OF INVESTMENTS (continued)
AB MASSACHUSETTS PORTFOLIO
| | | | | | | | |
| | | Principal
Amount
(000) | | | U.S. $ Value | |
| |
Massachusetts Development Finance Agency
(MCPHS University)
Series 2013F
4.00%, 7/01/32 | | $ | 1,000 | | | $ | 1,041,470 | |
Massachusetts Development Finance Agency
(Merrimack College)
Series 2012A
5.00%, 7/01/27-7/01/32 | | | 3,980 | | | | 4,266,360 | |
5.25%, 7/01/42 | | | 1,330 | | | | 1,416,596 | |
Massachusetts Development Finance Agency
(NewBridge on the Charles, Inc.)
Series 2017
5.00%, 10/01/47(c) | | | 2,000 | | | | 2,135,020 | |
Massachusetts Development Finance Agency
(South Shore Hospital, Inc.)
Series 2016I
4.00%, 7/01/36 | | | 2,000 | | | | 2,017,840 | |
5.00%, 7/01/41 | | | 2,500 | | | | 2,750,650 | |
Massachusetts Development Finance Agency
(Suffolk University)
Series 2009A
6.00%, 7/01/24 | | | 715 | | | | 747,132 | |
Series 2017
5.00%, 7/01/33 | | | 1,250 | | | | 1,405,013 | |
Massachusetts Development Finance Agency
(Trustees of The Deerfield Academy (The))
Series 2010
5.00%, 10/01/30 | | | 5,000 | | | | 5,348,400 | |
Massachusetts Development Finance Agency
(UMass Memorial Health Care Obligated Group)
Series 2016
5.00%, 7/01/36 | | | 1,500 | | | | 1,660,380 | |
Massachusetts Development Finance Agency
(Whitehead Institute for Biomedical Research)
Series 2011
5.00%, 6/01/26 | | | 1,460 | | | | 1,584,363 | |
Series 2011A
5.00%, 6/01/27-6/01/28 | | | 3,225 | | | | 3,497,197 | |
Massachusetts Development Finance Agency
(Woods Hole Oceanographic Institution)
Series 2018
5.00%, 6/01/48 | | | 3,000 | | | | 3,458,670 | |
Massachusetts Health & Educational Facilities Authority
Series 2010B
5.00%, 7/01/30 (Pre-refunded/ETM) | | | 3,860 | | | | 4,108,777 | |
| | |
| 50 | AB MUNICIPAL INCOME FUND II | | abfunds.com |
PORTFOLIO OF INVESTMENTS (continued)
AB MASSACHUSETTS PORTFOLIO
| | | | | | | | |
| | | Principal
Amount
(000) | | | U.S. $ Value | |
| |
Massachusetts Health & Educational Facilities Authority
(Berklee College of Music, Inc.)
Series 2007A
5.00%, 10/01/32 | | $ | 210 | | | $ | 210,565 | |
Massachusetts Health & Educational Facilities Authority
(Foundation of Massachusetts Eye & Ear Obligated Group)
Series 2010C
5.375%, 7/01/35 | | | 1,005 | | | | 1,048,929 | |
Massachusetts Health & Educational Facilities Authority
(Northeastern University)
Series 2010A
5.00%, 10/01/28-10/01/29 | | | 7,025 | | | | 7,483,100 | |
Massachusetts Health & Educational Facilities Authority
(Winchester Hospital)
Series 2010
5.25%, 7/01/38 | | | 2,500 | | | | 2,648,025 | |
Massachusetts Health & Educational Facilities Authority
(Woods Hole Oceanographic Institution)
Series 2008B
5.25%, 6/01/26 | | | 1,905 | | | | 1,905,800 | |
Massachusetts Port Authority
Series 2010B
5.00%, 7/01/34 | | | 2,750 | | | | 2,915,660 | |
Series 2012B
5.00%, 7/01/32 | | | 1,430 | | | | 1,575,831 | |
Series 2017A
5.00%, 7/01/35-7/01/37 | | | 2,600 | | | | 2,968,048 | |
Massachusetts School Building Authority
Series 2015B
5.00%, 1/15/30 (Pre-refunded/ETM) | | | 3,770 | | | | 4,401,211 | |
Massachusetts School Building Authority
(Massachusetts School Building Authority Sales Tax)
Series 2011B
5.00%, 10/15/32 | | | 3,720 | | | | 4,043,231 | |
Series 2013A
5.00%, 5/15/32 | | | 2,500 | | | | 2,794,050 | |
Massachusetts Water Resources Authority
Series 2011B
5.00%, 8/01/26 (Pre-refunded/ETM) | | | 2,425 | | | | 2,644,196 | |
| | |
| abfunds.com | | AB MUNICIPAL INCOME FUND II | 51 |
PORTFOLIO OF INVESTMENTS (continued)
AB MASSACHUSETTS PORTFOLIO
| | | | | | | | |
| | | Principal
Amount
(000) | | | U.S. $ Value | |
| |
5.00%, 8/01/29 (Pre-refunded/ETM) | | $ | 2,000 | | | $ | 2,180,780 | |
Series 2016C
5.00%, 8/01/33 | | | 8,500 | | | | 9,902,330 | |
Metropolitan Boston Transit Parking Corp.
Series 2011
5.00%, 7/01/27 | | | 6,000 | | | | 6,496,800 | |
University of Massachusetts Building Authority
(University of Massachusetts Boston)
Series 20141
5.00%, 11/01/44 | | | 2,000 | | | | 2,261,440 | |
Series 20173
5.00%, 11/01/34 | | | 2,500 | | | | 2,947,550 | |
| | | | | | | | |
| | | | | | | 188,048,998 | |
| | | | | | | | |
Arizona – 2.2% | |
Arizona Sports & Tourism Authority
Series 2012A
5.00%, 7/01/29 | | | 4,065 | | | | 4,334,347 | |
Salt Verde Financial Corp.
(Citigroup, Inc.)
Series 2007
5.00%, 12/01/37 | | | 660 | | | | 788,627 | |
| | | | | | | | |
| | | | | | | 5,122,974 | |
| | | | | | | | |
California – 0.2% | |
California Statewide Communities Development Authority
(Enloe Medical Center)
Series 2008A
5.50%, 8/15/23 | | | 360 | | | | 362,808 | |
| | | | | | | | |
|
Colorado – 0.5% | |
City & County of Denver CO
(United Airlines, Inc.)
Series 2017
5.00%, 10/01/32 | | | 1,000 | | | | 1,079,310 | |
| | | | | | | | |
|
Connecticut – 0.5% | |
State of Connecticut
Series 2015F
5.00%, 11/15/32 | | | 1,000 | | | | 1,104,470 | |
| | | | | | | | |
|
Florida – 1.5% | |
County of Miami-Dade FL Aviation Revenue
Series 2014
5.00%, 10/01/27 | | | 3,000 | | | | 3,398,610 | |
| | | | | | | | |
| | |
| 52 | AB MUNICIPAL INCOME FUND II | | abfunds.com |
PORTFOLIO OF INVESTMENTS (continued)
AB MASSACHUSETTS PORTFOLIO
| | | | | | | | |
| | | Principal
Amount
(000) | | | U.S. $ Value | |
| |
Guam – 1.5% | |
Guam Government Waterworks Authority
Series 2017
5.00%, 7/01/40 | | $ | 1,525 | | | $ | 1,630,240 | |
Guam Power Authority
Series 2017A
5.00%, 10/01/36-10/01/40 | | | 1,770 | | | | 1,909,694 | |
| | | | | | | | |
| | | | | | | 3,539,934 | |
| | | | | | | | |
Illinois – 0.9% | | | | | | | | |
Chicago Board of Education
Series 2018A
5.00%, 12/01/31(d) | | | 650 | | | | 670,898 | |
Illinois Finance Authority
(Plymouth Place, Inc.)
Series 2015
5.00%, 5/15/37 | | | 1,050 | | | | 1,088,608 | |
Village of Bolingbrook IL
(Village of Bolingbrook IL Sales Tax)
Series 2005
6.25%, 1/01/24(e) | | | 360 | | | | 357,397 | |
| | | | | | | | |
| | | | | | | 2,116,903 | |
| | | | | | | | |
Michigan – 0.7% | | | | | | | | |
Michigan Public Power Agency
Series 2012A
5.00%, 1/01/32 | | | 1,605 | | | | 1,696,260 | |
| | | | | | | | |
| | |
New Jersey – 0.6% | | | | | | | | |
New Jersey Transportation Trust Fund Authority
(New Jersey Transportation Fed Hwy Grant)
Series 2016
5.00%, 6/15/29 | | | 1,170 | | | | 1,286,766 | |
| | | | | | | | |
| | |
New York – 2.4% | | | | | | | | |
Metropolitan Transportation Authority
Series 2011D
5.00%, 11/15/28 (Pre-refunded/ETM) | | | 5,065 | | | | 5,593,634 | |
| | | | | | | | |
| | |
North Carolina – 1.0% | | | | | | | | |
North Carolina Medical Care Commission
(Aldersgate United Methodist Retirement Community, Inc.)
Series 2015
4.70%, 7/01/37(e) | | | 1,000 | | | | 1,043,990 | |
North Carolina Turnpike Authority
Series 2017
5.00%, 1/01/32 | | | 1,000 | | | | 1,130,830 | |
| | | | | | | | |
| | | | | | | 2,174,820 | |
| | | | | | | | |
| | |
| abfunds.com | | AB MUNICIPAL INCOME FUND II | 53 |
PORTFOLIO OF INVESTMENTS (continued)
AB MASSACHUSETTS PORTFOLIO
| | | | | | | | |
| | | Principal
Amount
(000) | | | U.S. $ Value | |
| |
Ohio – 0.8% | | | | | | | | |
County of Hamilton OH
(Life Enriching Communities Obligated Group)
Series 2016
5.00%, 1/01/36 | | $ | 1,100 | | | $ | 1,183,149 | |
Ohio Water Development Authority Water Pollution Control Loan Fund
(FirstEnergy Nuclear Generation LLC)
Series 2016A
4.375%, 6/01/33(e) | | | 600 | | | | 576,000 | |
| | | | | | | | |
| | | | | | | 1,759,149 | |
| | | | | | | | |
Pennsylvania – 1.1% | | | | | | | | |
City of Philadelphia PA
AGM Series 2017A
5.00%, 8/01/33 | | | 1,000 | | | | 1,137,620 | |
Pennsylvania Economic Development Financing Authority
(PA Bridges Finco LP)
Series 2015
5.00%, 12/31/34 | | | 1,140 | | | | 1,259,312 | |
| | | | | | | | |
| | | | | | | 2,396,932 | |
| | | | | | | | |
Puerto Rico – 0.4% | | | | | | | | |
Puerto Rico Housing Finance Authority
(Puerto Rico Housing Finance Authority Cap Fd Prog)
Series 2003
5.00%, 12/01/20 | | | 695 | | | | 724,461 | |
Puerto Rico Industrial Tourist Educational Medical & Envirml Ctl Facs Fing Auth
(AES Puerto Rico LP)
Series 2000
6.625%, 6/01/26 | | | 315 | | | | 281,925 | |
| | | | | | | | |
| | | | | | | 1,006,386 | |
| | | | | | | | |
Texas – 1.3% | | | | | | | | |
North Texas Tollway Authority
Series 2015A
5.00%, 1/01/34 | | | 1,000 | | | | 1,113,470 | |
Texas Private Activity Bond Surface Transportation Corp.
(LBJ Infrastructure Group LLC)
Series 2010
7.00%, 6/30/40 | | | 1,090 | | | | 1,190,509 | |
| | |
| 54 | AB MUNICIPAL INCOME FUND II | | abfunds.com |
PORTFOLIO OF INVESTMENTS (continued)
AB MASSACHUSETTS PORTFOLIO
| | | | | | | | |
| | | Principal
Amount
(000) | | | U.S. $ Value | |
| |
Texas Private Activity Bond Surface Transportation Corp.
(NTE Mobility Partners LLC)
Series 2009
6.875%, 12/31/39 | | $ | 545 | | | $ | 582,196 | |
| | | | | | | | |
| | | | | | | 2,886,175 | |
| | | | | | | | |
Wisconsin – 0.8% | | | | | | | | |
Oneida Tribe of Indians of Wisconsin
(Oneida Tribe of Indians of Wisconsin Sales Tax)
Series 2011
6.50%, 2/01/31(c) | | | 750 | | | | 784,088 | |
Wisconsin Public Finance Authority
(Celanese US Holdings LLC)
Series 2016B
5.00%, 12/01/25(c) | | | 1,000 | | | | 1,129,720 | |
| | | | | | | | |
| | | | | | | 1,913,808 | |
| | | | | | | | |
Total Municipal Obligations
(cost $217,995,281) | | | | | | | 225,487,937 | |
| | | | | | | | |
| | |
| | | Shares | | | | |
SHORT-TERM INVESTMENTS – 0.4% | | | | | | | | |
Investment Companies – 0.4% | | | | | | | | |
AB Fixed Income Shares, Inc. – Government Money Market Portfolio – Class AB, 1.57%(f)(g)(h)
(cost $862,514) | | | 862,514 | | | | 862,514 | |
| | | | | | | | |
| | |
Total Investments – 99.0%
(cost $218,857,795) | | | | | | | 226,350,451 | |
Other assets less liabilities – 1.0% | | | | | | | 2,350,963 | |
| | | | | | | | |
| | |
Net Assets – 100.0% | | | | | | $ | 228,701,414 | |
| | | | | | | | |
CENTRALLY CLEARED INTEREST RATE SWAPS (see Note D)
| | | | | | | | | | | | | | | | | | |
| | | | | | | | | Rate Type | | | | | |
Notional Amount (000) | | | Termination
Date | | | Payments
made
by the
Fund | | Payments
received
by the
Fund | | Payment
Frequency
Paid/Received | | Unrealized
Appreciation/
(Depreciation) | |
USD | | | 6,080 | | | | 6/01/23 | | | 3 Month LIBOR | | 3.121% | | Quarterly/
Semi-Annual | | $ | 48,464 | |
USD | | | 10,900 | | | | 4/03/34 | | | 3 Month LIBOR | | 3.276% | | Quarterly/
Semi-Annual | | | 371,702 | |
| | |
| abfunds.com | | AB MUNICIPAL INCOME FUND II | 55 |
PORTFOLIO OF INVESTMENTS (continued)
AB MASSACHUSETTS PORTFOLIO
| | | | | | | | | | | | | | | | | | | | | | | | |
| | | | | | | | | Rate Type | | | | | | | |
Notional Amount (000) | | | Termination
Date | | | Payments
made
by the
Fund | | | Payments
received
by the
Fund | | | Payment
Frequency
Paid/Received | | | Unrealized
Appreciation/
(Depreciation) | |
USD | | | 35,600 | | | | 4/01/39 | | | | 3.022% | | | | 3 Month LIBOR | | |
| Semi-Annual/
Quarterly |
| | $ | (115,993 | ) |
USD | | | 22,500 | | | | 4/01/44 | | | | 3 Month LIBOR | | | | 3.081% | | |
| Quarterly/
Semi-Annual |
| | | 412,130 | |
| | | | | | | | | | | | | | | | | | | | | | | | |
| | | | | | | | | | | | | | | | | | | | | | $ | 716,303 | |
| | | | | | | | | | | | | | | | | | | | | | | | |
| (a) | An auction rate security whose interest rate resets at each auction date. Auctions are typically held every week or month. The rate shown is as of May 31, 2018 and the aggregate market value of this security amounted to $600,000 or 0.26% of net assets. |
| (b) | Floating Rate Security. Stated interest/floor/ceiling rate was in effect at May 31, 2018. |
| (c) | Security is exempt from registration under Rule 144A of the Securities Act of 1933. These securities are considered restricted, but liquid and may be resold in transactions exempt from registration, normally to qualified institutional buyers. At May 31, 2018, the aggregate market value of these securities amounted to $4,048,828 or 1.8% of net assets. |
| (d) | When-Issued or delayed delivery security. |
| (e) | Security in which significant unobservable inputs (Level 3) were used in determining fair value. |
| (f) | Affiliated investments. |
| (g) | The rate shown represents the 7-day yield as of period end. |
| (h) | To obtain a copy of the fund’s shareholder report, please go to the Securities and Exchange Commission’s website at www.sec.gov, or call AB at (800) 227-4618. |
As of May 31, 2018, the Portfolio’s percentages of investments in municipal bonds that are insured and in insured municipal bonds that have been pre-refunded or escrowed to maturity are 3.1% and 0.0%, respectively.
Glossary:
AGM – Assured Guaranty Municipal
BAM – Build American Mutual
CPIYOYX – Consumer Price Index Year Over Year Change
ETM – Escrowed to Maturity
LIBOR – London Interbank Offered Rates
NATL – National Interstate Corporation
SRF – State Revolving Fund
See notes to financial statements.
| | |
| 56 | AB MUNICIPAL INCOME FUND II | | abfunds.com |
PORTFOLIO OF INVESTMENTS
AB MINNESOTA PORTFOLIO
May 31, 2018
| | | | | | | | |
| | | Principal
Amount
(000) | | | U.S. $ Value | |
| |
MUNICIPAL OBLIGATIONS – 99.2% | | | | | | | | |
Long-Term Municipal Bonds – 99.2% | | | | | | | | |
Minnesota – 99.2% | | | | | | | | |
Anoka-Hennepin Independent School District No. 11 COP
Series 2014A
5.00%, 2/01/34 | | $ | 1,695 | | | $ | 1,901,078 | |
Brainerd Independent School District No. 181
Series 2018A
4.00%, 2/01/43(a) | | | 1,000 | | | | 1,043,610 | |
Central Minnesota Municipal Power Agency
Series 2012
5.00%, 1/01/32 | | | 2,200 | | | | 2,374,416 | |
City of Center City MN
(Hazelden Betty Ford Foundation)
Series 2014
5.00%, 11/01/29-11/01/44 | | | 800 | | | | 888,305 | |
City of Duluth MN
Series 2016A
5.00%, 2/01/34 | | | 1,000 | | | | 1,152,150 | |
City of Maple Grove MN
(Maple Grove Hospital Corp.)
Series 2017
5.00%, 5/01/31 | | | 1,000 | | | | 1,144,370 | |
City of Minneapolis MN
(Fairview Health Services Obligated Group)
Series 2015A
5.00%, 11/15/33 | | | 1,000 | | | | 1,141,170 | |
City of Minneapolis MN
(Minneapolis Common Bond Fund)
Series 20102A
6.25%, 12/01/30 | | | 1,000 | | | | 1,100,230 | |
City of Minneapolis MN/St. Paul Housing & Redevelopment Authority
(Allina Health Obligated Group)
Series 2017A
5.00%, 11/15/28 | | | 1,355 | | | | 1,597,694 | |
City of Minneapolis MN/St. Paul Housing & Redevelopment Authority
(Children’s Health Care)
Series 2010A
5.25%, 8/15/25-8/15/35 | | | 1,500 | | | | 1,599,335 | |
City of Rochester MN
(Mayo Clinic)
Series 2010D
5.00%, 11/15/38 | | | 1,000 | | | | 1,060,360 | |
| | |
| abfunds.com | | AB MUNICIPAL INCOME FUND II | 57 |
PORTFOLIO OF INVESTMENTS (continued)
AB MINNESOTA PORTFOLIO
| | | | | | | | |
| | | Principal
Amount
(000) | | | U.S. $ Value | |
| |
City of St. Cloud MN
Series 2010A
5.125%, 5/01/30 (Pre-refunded/ETM) | | $ | 1,405 | | | $ | 1,489,230 | |
City of St. Cloud MN
(CentraCare Health System Obligated Group)
Series 2010A
5.125%, 5/01/30 | | | 95 | | | | 100,493 | |
City of St. Louis Park MN
Series 2009
5.50%, 7/01/29 (Pre-refunded/ETM) | | | 1,150 | | | | 1,195,080 | |
City of St. Paul MN
(City of St. Paul MN Sales Tax)
Series 2014G
5.00%, 11/01/30-11/01/32 | | | 2,900 | | | | 3,305,358 | |
Cloquet Independent School District No. 94
Series 2015B
5.00%, 2/01/31 | | | 2,200 | | | | 2,522,278 | |
Housing & Redevelopment Authority of The City of St. Paul Minnesota
Series 2009A-2
5.25%, 11/15/28 (Pre-refunded/ETM)(b) | | | 610 | | | | 639,475 | |
Series 2015A
5.00%, 11/15/40 (Pre-refunded/ETM) | | | 600 | | | | 706,248 | |
Housing & Redevelopment Authority of The City of St. Paul Minnesota
(Allina Health Obligated Group)
Series 2009
5.25%, 11/15/28 | | | 590 | | | | 619,465 | |
Housing & Redevelopment Authority of The City of St. Paul Minnesota
(Fairview Health Services Obligated Group)
Series 2017
5.00%, 11/15/47 | | | 2,000 | | | | 2,265,320 | |
Housing & Redevelopment Authority of The City of St. Paul Minnesota
(HealthPartners Obligated Group)
Series 2015A
5.00%, 7/01/32 | | | 1,000 | | | | 1,124,580 | |
Hutchinson Utilities Commission
Series 2012A
5.00%, 12/01/25 | | | 420 | | | | 464,915 | |
Minneapolis Special School District No. 1
Series 2016
5.00%, 2/01/31 | | | 3,000 | | | | 3,544,710 | |
| | |
| 58 | AB MUNICIPAL INCOME FUND II | | abfunds.com |
PORTFOLIO OF INVESTMENTS (continued)
AB MINNESOTA PORTFOLIO
| | | | | | | | |
| | | Principal
Amount
(000) | | | U.S. $ Value | |
| |
Minneapolis-St. Paul Metropolitan Airports Commission
Series 2010A
5.00%, 1/01/30 | | $ | 1,250 | | | $ | 1,308,438 | |
Series 2012B
5.00%, 1/01/29 | | | 1,250 | | | | 1,363,825 | |
Minnesota Agricultural & Economic Development Board
(Essentia Health)
AGC Series 2008C-1
5.50%, 2/15/25 | | | 1,000 | | | | 1,059,820 | |
Minnesota Higher Education Facilities Authority
Series 2009 7-A
5.00%, 10/01/29 (Pre-refunded/ETM) | | | 500 | | | | 520,575 | |
Series 2010B
5.00%, 10/01/31 (Pre-refunded/ETM) | | | 2,270 | | | | 2,363,410 | |
Minnesota Higher Education Facilities Authority
(College of St. Scholastica, Inc.)
Series 2010H
5.125%, 12/01/30 | | | 1,000 | | | | 1,040,890 | |
Minnesota Higher Education Facilities Authority
(Hamline University)
Series 2017B
5.00%, 10/01/36 | | | 500 | | | | 547,305 | |
Minnesota Higher Education Facilities Authority
(St. Catherine University)
Series 2012S
5.00%, 10/01/32 | | | 1,400 | | | | 1,529,962 | |
Minnesota Higher Education Facilities Authority
(St. Olaf College)
Series 20107
5.00%, 10/01/20 | | | 255 | | | | 265,050 | |
Series 20158
5.00%, 12/01/32 | | | 1,000 | | | | 1,149,930 | |
Minnesota Higher Education Facilities Authority
(University of St. Thomas)
Series 2017A
4.00%, 10/01/34 | | | 800 | | | | 844,608 | |
Minnesota Municipal Power Agency
Series 2014
5.00%, 10/01/32 | | | 750 | | | | 859,035 | |
New Prague Independent School District No. 721
Series 2015A
4.00%, 2/01/32 | | | 1,000 | | | | 1,063,020 | |
| | |
| abfunds.com | | AB MUNICIPAL INCOME FUND II | 59 |
PORTFOLIO OF INVESTMENTS (continued)
AB MINNESOTA PORTFOLIO
| | | | | | | | |
| | | Principal
Amount
(000) | | | U.S. $ Value | |
| |
Northern Municipal Power Agency
Series 2010A-2
5.00%, 1/01/23 (Pre-refunded/ETM) | | $ | 2,260 | | | $ | 2,428,709 | |
5.00%, 1/01/24 (Pre-refunded/ETM) | | | 1,875 | | | | 2,014,969 | |
Series 2017
5.00%, 1/01/33-1/01/41 | | | 1,150 | | | | 1,298,182 | |
Southern Minnesota Municipal Power Agency
Series 2017A
5.00%, 1/01/47 | | | 2,000 | | | | 2,294,840 | |
St. Paul Port Authority
(Amherst H Wilder Foundation/MN)
Series 2010-3
5.00%, 12/01/29 | | | 2,445 | | | | 2,569,377 | |
St. Paul Port Authority
(St. Paul Port Authority State Lease)
Series 2013-3
5.00%, 12/01/24 | | | 3,945 | | | | 4,500,298 | |
University of Minnesota
Series 2014B
4.00%, 1/01/32 | | | 2,000 | | | | 2,125,180 | |
5.00%, 1/01/39 | | | 1,500 | | | | 1,677,420 | |
Western Minnesota Municipal Power Agency
Series 2014A
5.00%, 1/01/40 | | | 2,500 | | | | 2,802,575 | |
| | | | | | | | |
| | |
Total Municipal Obligations
(cost $66,266,160) | | | | | | | 68,607,288 | |
| | | | | | | | |
| | |
| | | Shares | | | | |
SHORT-TERM INVESTMENTS – 1.0% | |
Investment Companies – 1.0% | |
AB Fixed Income Shares, Inc. – Government Money Market Portfolio – Class AB, 1.57%(c)(d)(e)
(cost $719,937) | | | 719,937 | | | | 719,937 | |
| | | | | | | | |
| | |
Total Investments – 100.2%
(cost $66,986,097) | | | | | | | 69,327,225 | |
Other assets less liabilities – (0.2)% | | | | | | | (136,477 | ) |
| | | | | | | | |
| | |
Net Assets – 100.0% | | | | | | $ | 69,190,748 | |
| | | | | | | | |
| | |
| 60 | AB MUNICIPAL INCOME FUND II | | abfunds.com |
PORTFOLIO OF INVESTMENTS (continued)
AB MINNESOTA PORTFOLIO
CENTRALLY CLEARED INTEREST RATE SWAPS (see Note D)
| | | | | | | | | | | | | | | | | | |
| | | | | | | | Rate Type | | | | | | |
Notional
Amount
(000) | | Termination
Date | | | Payments
made
by the
Fund | | Payments
received
by the
Fund | | | Payment
Frequency
Paid/Received | | Unrealized
Appreciation/
(Depreciation) | |
USD | | 3,260 | | | 6/01/23 | | | 3 Month LIBOR | | | 3.121 | % | | Quarterly/
Semi-Annual | | $ | 25,986 | |
| (a) | When-Issued or delayed delivery security. |
| (b) | Security in which significant unobservable inputs (Level 3) were used in determining fair value. |
| (c) | Affiliated investments. |
| (d) | The rate shown represents the 7-day yield as of period end. |
| (e) | To obtain a copy of the fund’s shareholder report, please go to the Securities and Exchange Commission’s website at www.sec.gov, or call AB at (800) 227-4618. |
As of May 31, 2018, the Portfolio’s percentages of investments in municipal bonds that are insured and in insured municipal bonds that have been pre-refunded or escrowed to maturity are 1.5% and 0.0%, respectively.
Glossary:
AGC – Assured Guaranty Corporation
COP – Certificate of Participation
ETM – Escrowed to Maturity
LIBOR – London Interbank Offered Rates
See notes to financial statements.
| | |
| abfunds.com | | AB MUNICIPAL INCOME FUND II | 61 |
PORTFOLIO OF INVESTMENTS
AB NEW JERSEY PORTFOLIO
May 31, 2018
| | | | | | | | |
| | | Principal
Amount
(000) | | | U.S. $ Value | |
| |
MUNICIPAL OBLIGATIONS – 99.2% | |
Long-Term Municipal Bonds – 99.2% | |
New Jersey – 75.2% | |
City of Jersey City NJ
Series 2017A
5.00%, 11/01/31-11/01/37 | | $ | 1,500 | | | $ | 1,743,885 | |
Hudson County Improvement Authority
(County of Hudson NJ)
Series 2016
5.00%, 5/01/36 | | | 3,500 | | | | 3,986,815 | |
Landis Sewage Authority
NATL Series 1993
5.98%, 9/19/19(a) | | | 600 | | | | 617,616 | |
Morris-Union Jointure Commission COP
AGM Series 2013
5.00%, 8/01/26 | | | 3,320 | | | | 3,660,034 | |
New Jersey Economic Development Authority
Series 2012
5.00%, 6/01/32 (Pre-refunded/ETM) | | | 2,000 | | | | 2,223,400 | |
New Jersey Economic Development Authority
(Bancroft Neurohealth/Bancroft Rehabilitation Services Obligated Group)
Series 2016A
5.00%, 6/01/41(b) | | | 1,000 | | | | 1,029,860 | |
New Jersey Economic Development Authority
(New Jersey Economic Development Authority State Lease)
Series 2013
5.00%, 3/01/30 | | | 4,000 | | | | 4,227,600 | |
New Jersey Economic Development Authority
(NJ Metromall Urban Renewal, Inc.)
Series 2002
6.50%, 4/01/28 | | | 1,000 | | | | 1,171,650 | |
New Jersey Economic Development Authority
(North Star Academy Charter School of Newark, Inc.)
Series 2017
5.00%, 7/15/32 | | | 1,000 | | | | 1,102,200 | |
New Jersey Economic Development Authority
(NYNJ Link Borrower LLC)
Series 2013
5.00%, 1/01/28 | | | 1,000 | | | | 1,100,870 | |
5.50%, 1/01/27 | | | 1,000 | | | | 1,133,480 | |
New Jersey Economic Development Authority
(Port Newark Container Terminal LLC)
Series 2017
5.00%, 10/01/47 | | | 2,000 | | | | 2,167,240 | |
| | |
| 62 | AB MUNICIPAL INCOME FUND II | | abfunds.com |
PORTFOLIO OF INVESTMENTS (continued)
AB NEW JERSEY PORTFOLIO
| | | | | | | | |
| | | Principal
Amount
(000) | | | U.S. $ Value | |
| |
New Jersey Economic Development Authority
(Seeing Eye, Inc. (The))
Series 2017
5.00%, 6/01/32 | | $ | 1,765 | | | $ | 2,059,455 | |
New Jersey Economic Development Authority
(United Airlines, Inc.)
Series 1999
5.25%, 9/15/29 | | | 1,165 | | | | 1,269,489 | |
New Jersey Educational Facilities Authority
(Kean University)
AGM Series 2015H
5.00%, 7/01/34 | | | 2,500 | | | | 2,808,075 | |
New Jersey Educational Facilities Authority
(Princeton University)
Series 2017C
5.00%, 7/01/42 | | | 1,000 | | | | 1,173,460 | |
New Jersey Health Care Facilities Financing Authority
Series 2013
5.25%, 7/01/31 (Pre-refunded/ETM)(b) | | | 1,800 | | | | 2,066,058 | |
AGC Series 2004A
5.25%, 7/01/23 (Pre-refunded/ETM) | | | 2,085 | | | | 2,399,564 | |
New Jersey Health Care Facilities Financing Authority
(AHS Hospital Corp.)
Series 2008A
5.125%, 7/01/22 | | | 45 | | | | 45,133 | |
New Jersey Health Care Facilities Financing Authority
(Hackensack Meridian Health Obligated Group)
Series 2017A
5.00%, 7/01/35 | | | 1,950 | | | | 2,251,080 | |
New Jersey Health Care Facilities Financing Authority
(Holy Name Medical Center, Inc.)
Series 2010
5.00%, 7/01/25 | | | 2,100 | | | | 2,204,181 | |
New Jersey Health Care Facilities Financing Authority
(Inspira Health Obligated Group)
Series 2017A
5.00%, 7/01/35 | | | 1,835 | | | | 2,082,505 | |
New Jersey Health Care Facilities Financing Authority
(RWJ Barnabas Health Obligated Group)
Series 2014
5.00%, 7/01/44 | | | 2,000 | | | | 2,183,420 | |
Series 2016A
5.00%, 7/01/33 | | | 1,000 | | | | 1,130,970 | |
| | |
| abfunds.com | | AB MUNICIPAL INCOME FUND II | 63 |
PORTFOLIO OF INVESTMENTS (continued)
AB NEW JERSEY PORTFOLIO
| | | | | | | | |
| | | Principal
Amount
(000) | | | U.S. $ Value | |
| |
New Jersey Transportation Trust Fund Authority
(New Jersey Transportation Fed Hwy Grant)
Series 2016
5.00%, 6/15/28-6/15/29 | | $ | 2,750 | | | $ | 3,028,120 | |
NATL Series 2006A
5.00%, 6/15/18 | | | 3,400 | | | | 3,426,452 | |
New Jersey Transportation Trust Fund Authority
(New Jersey Transportation Trust Fund Authority State Lease)
Series 2015A
5.25%, 6/15/41 | | | 1,250 | | | | 1,344,125 | |
New Jersey Turnpike Authority
Series 2013A
5.00%, 1/01/43 (Pre-refunded/ETM)(b) | | | 3,265 | | | | 3,649,160 | |
5.00%, 1/01/43 | | | 1,935 | | | | 2,105,609 | |
North Hudson Sewerage Authority/NJ
NATL Series 2001A
Zero Coupon, 8/01/24 (Pre-refunded/ETM) | | | 8,875 | | | | 7,611,200 | |
Rutgers The State University of New Jersey
Series 2013L
5.00%, 5/01/30 | | | 4,500 | | | | 5,020,920 | |
Tobacco Settlement Financing Corp./NJ
Series 2018B
5.00%, 6/01/46 | | | 1,540 | | | | 1,652,682 | |
Union County Improvement Authority
(Township of Union NJ/Union County Lease)
NATL Series 2003A
5.25%, 8/15/23 | | | 2,270 | | | | 2,276,333 | |
Union County Utilities Authority
(County of Union NJ Lease)
Series 2011A
5.25%, 12/01/31 | | | 4,560 | | | | 4,995,981 | |
| | | | | | | | |
| | | | | | | 80,948,622 | |
| | | | | | | | |
California – 0.4% | |
California Statewide Communities Development Authority
(Enloe Medical Center)
Series 2008A
5.50%, 8/15/23 | | | 400 | | | | 403,120 | |
| | | | | | | | |
|
Guam – 1.5% | |
Guam Power Authority
Series 2017A
5.00%, 10/01/36-10/01/40 | | | 805 | | | | 868,495 | |
Territory of Guam
(Guam Section 30 Income Tax)
Series 2016A
5.00%, 12/01/46 | | | 720 | | | | 762,149 | |
| | | | | | | | |
| | | | | | | 1,630,644 | |
| | | | | | | | |
| | |
| 64 | AB MUNICIPAL INCOME FUND II | | abfunds.com |
PORTFOLIO OF INVESTMENTS (continued)
AB NEW JERSEY PORTFOLIO
| | | | | | | | |
| | | Principal
Amount
(000) | | | U.S. $ Value | |
| |
Idaho – 3.7% | |
Idaho Housing & Finance Association
(State of Idaho Fed Hwy Grant)
Series 2014
5.00%, 7/15/31 | | $ | 3,600 | | | $ | 3,985,668 | |
| | | | | | | | |
|
Illinois – 2.3% | |
Chicago Board of Education
Series 2018A
5.00%, 12/01/31(c) | | | 305 | | | | 314,806 | |
Kane Cook & DuPage Counties School District No U-46 Elgin
Series 2015D
5.00%, 1/01/34 | | | 1,000 | | | | 1,105,190 | |
Metropolitan Pier & Exposition Authority
Series 2015B
5.00%, 12/15/45 | | | 1,000 | | | | 1,047,230 | |
| | | | | | | | |
| | | | | | | 2,467,226 | |
| | | | | | | | |
Nevada – 1.1% | |
Clark County School District
Series 2017C
5.00%, 6/15/35 | | | 1,000 | | | | 1,141,550 | |
| | | | | | | | |
|
New York – 8.5% | |
Port Authority of New York & New Jersey
Series 2012
5.00%, 7/15/30 | | | 4,250 | | | | 4,644,102 | |
Series 2014
5.00%, 9/01/31 | | | 1,100 | | | | 1,228,975 | |
Port Authority of New York & New Jersey
(JFK International Air Terminal LLC)
NATL Series 1997
5.75%, 12/01/22 | | | 3,175 | | | | 3,322,574 | |
| | | | | | | | |
| | | | | | | 9,195,651 | |
| | | | | | | | |
|
Ohio – 0.2% | |
Ohio Water Development Authority Water Pollution Control Loan Fund
(FirstEnergy Nuclear Generation LLC)
Series 2016A
4.375%, 6/01/33(b) | | | 280 | | | | 268,800 | |
| | | | | | | | |
|
Pennsylvania – 4.4% | |
Delaware River Port Authority
Series 2010D
5.00%, 1/01/28-1/01/29 | | | 4,530 | | | | 4,739,264 | |
| | | | | | | | |
| | |
| abfunds.com | | AB MUNICIPAL INCOME FUND II | 65 |
PORTFOLIO OF INVESTMENTS (continued)
AB NEW JERSEY PORTFOLIO
| | | | | | | | |
| | | Principal
Amount
(000) | | | U.S. $ Value | |
| |
Puerto Rico – 0.1% | |
Puerto Rico Industrial Tourist Educational Medical & Envirml Ctl Facs Fing Auth
(AES Puerto Rico LP)
Series 2000
6.625%, 6/01/26 | | $ | 150 | | | $ | 134,250 | |
| | | | | | | | |
|
South Carolina – 0.6% | |
South Carolina Public Service Authority
Series 2016B
5.00%, 12/01/41 | | | 570 | | | | 622,275 | |
| | | | | | | | |
|
Texas – 1.0% | |
Texas State Public Finance Authority Charter School Finance Corp.
(KIPP Austin Public Schools, Inc.)
Series 2014A
5.00%, 8/15/34 | | | 1,000 | | | | 1,111,100 | |
| | | | | | | | |
|
Washington – 0.2% | |
Kalispel Tribe of Indians
Series 2018B
5.25%, 1/01/38(b)(c) | | | 210 | | | | 215,395 | |
| | | | | | | | |
| | |
Total Municipal Obligations
(cost $101,634,894) | | | | | | | 106,863,565 | |
| | | | | | | | |
| | |
| | | Shares | | | | |
SHORT-TERM INVESTMENTS – 0.1% | |
Investment Companies – 0.1% | |
AB Fixed Income Shares, Inc. – Government
Money Market Portfolio – Class AB, 1.57%(d)(e)(f)
(cost $112,518) | | | 112,518 | | | | 112,518 | |
| | | | | | | | |
| | |
Total Investments – 99.3%
(cost $101,747,412) | | | | | | | 106,976,083 | |
Other assets less liabilities – 0.7% | | | | | | | 726,920 | |
| | | | | | | | |
| | |
Net Assets – 100.0% | | | | | | $ | 107,703,003 | |
| | | | | | | | |
| | |
| 66 | AB MUNICIPAL INCOME FUND II | | abfunds.com |
PORTFOLIO OF INVESTMENTS (continued)
AB NEW JERSEY PORTFOLIO
CENTRALLY CLEARED INTEREST RATE SWAPS (see Note D)
| | | | | | | | | | | | | | | | | | | | | | |
| |
| | | | | | | Rate Type | | | | |
Notional
Amount
(000) | | | Termination
Date | | | Payments
made
by the
Fund | | | Payments
received
by the
Fund | | | Payment
Frequency
Paid/Received | | Unrealized
Appreciation/
(Depreciation) | |
| USD | | | 8,400 | | | | 7/01/20 | | | | 3 Month LIBOR | | | | 3.060 | % | | Quarterly/ Semi-Annual | | $ | 15,212 | |
| USD | | | 1,000 | | | | 6/01/28 | | | | 3 Month LIBOR | | | | 3.212 | % | | Quarterly/ Semi-Annual | | | 19,246 | |
| | | | | | | | | | | | | | | | | | | | | | |
| | | | | | | | | | | | | | | | | | | | $ | 34,458 | |
| | | | | | | | | | | | | | | | | | | | | | |
| (a) | Inverse floater security. |
| (b) | Security in which significant unobservable inputs (Level 3) were used in determining fair value. |
| (c) | When-Issued or delayed delivery security. |
| (d) | Affiliated investments. |
| (e) | The rate shown represents the 7-day yield as of period end. |
| (f) | To obtain a copy of the fund’s shareholder report, please go to the Securities and Exchange Commission’s website at www.sec.gov, or call AB at (800) 227-4618. |
As of May 31, 2018, the Portfolio’s percentages of investments in municipal bonds that are insured and in insured municipal bonds that have been pre-refunded or escrowed to maturity are 24.4% and 9.4%, respectively.
Glossary:
AGC – Assured Guaranty Corporation
AGM – Assured Guaranty Municipal
COP – Certificate of Participation
ETM – Escrowed to Maturity
LIBOR – London Interbank Offered Rates
NATL – National Interstate Corporation
See notes to financial statements.
| | |
| abfunds.com | | AB MUNICIPAL INCOME FUND II | 67 |
PORTFOLIO OF INVESTMENTS
AB OHIO PORTFOLIO
May 31, 2018
| | | | | | | | |
| | | Principal
Amount
(000) | | | U.S. $ Value | |
| |
MUNICIPAL OBLIGATIONS – 98.3% | |
Long-Term Municipal Bonds – 98.3% | |
Ohio – 83.3% | |
American Municipal Power, Inc.
Series 2016A
5.00%, 2/15/34 | | $ | 2,000 | | | $ | 2,258,360 | |
Buckeye Tobacco Settlement Financing Authority
Series 2007A-2
5.875%, 6/01/47 | | | 1,000 | | | | 999,970 | |
Central Ohio Solid Waste Authority
Series 2012
5.00%, 12/01/29 (Pre-refunded/ETM)(a) | | | 155 | | | | 172,314 | |
City of Akron OH
(City of Akron OH Income Tax)
Series 2012A
5.00%, 12/01/31 | | | 3,500 | | | | 3,836,035 | |
City of Chillicothe OH
(Adena Health System Obligated Group)
Series 2017
5.00%, 12/01/37 | | | 1,700 | | | | 1,892,814 | |
City of Cleveland OH
Series 2012
5.00%, 12/01/28 | | | 2,215 | | | | 2,472,848 | |
City of Columbus OH
Series 2014A
4.00%, 2/15/28 | | | 3,510 | | | | 3,805,331 | |
Cleveland Municipal School District
Series 2015A
5.00%, 12/01/33 | | | 3,000 | | | | 3,320,190 | |
Cleveland State University
Series 2012
5.00%, 6/01/30 | | | 3,000 | | | | 3,251,370 | |
County of Allen OH
Series 2010B
5.25%, 9/01/27 (Pre-refunded/ETM) | | | 2,350 | | | | 2,519,223 | |
County of Allen/OH Hospital Facilities Revenue
(Mercy Health/OH)
Series 2017A
5.00%, 8/01/42 | | | 1,650 | | | | 1,846,977 | |
County of Cuyahoga OH
(County of Cuyahoga OH Lease)
Series 2010F
5.25%, 12/01/25 | | | 3,200 | | | | 3,457,248 | |
County of Cuyahoga OH
(MetroHealth System (The))
Series 2017
5.00%, 2/15/37 | | | 1,400 | | | | 1,496,600 | |
| | |
| 68 | AB MUNICIPAL INCOME FUND II | | abfunds.com |
PORTFOLIO OF INVESTMENTS (continued)
AB OHIO PORTFOLIO
| | | | | | | | |
| | | Principal
Amount
(000) | | | U.S. $ Value | |
| |
County of Franklin OH
(Agler Green LP)
Series 2002A
5.65%, 5/20/32 | | $ | 770 | | | $ | 771,502 | |
5.80%, 5/20/44 | | | 1,150 | | | | 1,151,691 | |
County of Franklin/OH
(First Community Village Obligated Group)
Series 2013
5.625%, 7/01/47(a) | | | 865 | | | | 873,884 | |
County of Franklin/OH
(Trinity Health Corp Obligated Group)
Series 2017
5.00%, 12/01/47 | | | 1,150 | | | | 1,307,193 | |
County of Hamilton OH Sewer System Revenue
Series 2013A
5.00%, 12/01/31 | | | 4,305 | | | | 4,868,223 | |
County of Hamilton/OH
(Life Enriching Communities Obligated Group)
Series 2012
5.00%, 1/01/42 | | | 1,625 | | | | 1,709,614 | |
County of Scioto OH
(Southern Ohio Medical Center Obligated Group)
Series 2016
5.00%, 2/15/33 | | | 1,000 | | | | 1,115,400 | |
Cuyahoga Community College District
Series 2009C
5.00%, 8/01/24 (Pre-refunded/ETM) | | | 545 | | | | 573,356 | |
Dayton-Montgomery County Port Authority
(StoryPoint Troy Project)
Series 20151
7.00%, 1/15/40(a) | | | 575 | | | | 602,767 | |
Franklin County Convention Facilities Authority
(City of Columbus OH/Franklin County Lease)
Series 2014
5.00%, 12/01/31 | | | 1,300 | | | | 1,479,439 | |
Gallia County Local School District
Series 2014
5.00%, 11/01/29 | | | 2,000 | | | | 2,262,700 | |
Kent State University
Series 2012A
5.00%, 5/01/30-5/01/31 | | | 4,005 | | | | 4,372,206 | |
Miami University/Oxford OH
Series 2011
5.00%, 9/01/31 | | | 1,000 | | | | 1,084,170 | |
| | |
| abfunds.com | | AB MUNICIPAL INCOME FUND II | 69 |
PORTFOLIO OF INVESTMENTS (continued)
AB OHIO PORTFOLIO
| | | | | | | | |
| | | Principal
Amount
(000) | | | U.S. $ Value | |
| |
Northeast Ohio Regional Sewer District
Series 2013
5.00%, 11/15/43 (Pre-refunded/ETM) | | $ | 3,000 | | | $ | 3,408,270 | |
Ohio Air Quality Development Authority
(FirstEnergy Generation LLC)
Series 2009D
4.25%, 8/01/29(a) | | | 385 | | | | 369,600 | |
Ohio Air Quality Development Authority
(FirstEnergy Nuclear Generation LLC)
Series 2009A
4.375%, 6/01/33(a) | | | 105 | | | | 100,800 | |
Ohio Air Quality Development Authority
(Pratt Paper/OH, Inc.)
Series 2017
4.50%, 1/15/48(a)(b) | | | 700 | | | | 726,544 | |
Ohio Higher Educational Facility Commission
(Denison University)
Series 2012
5.00%, 11/01/32 | | | 590 | | | | 642,976 | |
Ohio Higher Educational Facility Commission
(Kenyon College)
Series 2017
5.00%, 7/01/34-7/01/42 | | | 2,070 | | | | 2,346,812 | |
Ohio Higher Educational Facility Commission
(University of Dayton)
Series 2011A
5.375%, 12/01/30 | | | 750 | | | | 808,943 | |
Ohio University
Series 2013
5.00%, 12/01/32 | | | 3,120 | | | | 3,435,494 | |
Princeton City School District
Series 2014
5.00%, 12/01/39 | | | 750 | | | | 842,115 | |
Summit County Development Finance Authority
Series 2012
5.00%, 12/01/25 | | | 3,760 | | | | 4,195,972 | |
Toledo-Lucas County Port Authority
(CSX Transportation, Inc.)
Series 1992
6.45%, 12/15/21 | | | 1,270 | | | | 1,449,591 | |
University of Akron (The)
Series 2014A
5.00%, 1/01/32 | | | 4,080 | | | | 4,562,582 | |
| | | | | | | | |
| | | | | | | 76,391,124 | |
| | | | | | | | |
| | |
| 70 | AB MUNICIPAL INCOME FUND II | | abfunds.com |
PORTFOLIO OF INVESTMENTS (continued)
AB OHIO PORTFOLIO
| | | | | | | | |
| | | Principal
Amount
(000) | | | U.S. $ Value | |
| |
California – 0.3% | | | | | | | | |
California Pollution Control Financing Authority
(Poseidon Resources Channelside LP)
Series 2012
5.00%, 7/01/37(b) | | $ | 220 | | | $ | 235,011 | |
State of California
Series 2004
5.25%, 4/01/29 | | | 5 | | | | 5,014 | |
| | | | | | | | |
| | | | | | | 240,025 | |
| | | | | | | | |
Connecticut – 0.5% | | | | | | | | |
Connecticut State Health & Educational Facilities Authority
(University of New Haven, Inc.)
Series 2018K-1
5.00%, 7/01/37 | | | 415 | | | | 460,389 | |
| | | | | | | | |
| | |
Florida – 2.8% | | | | | | | | |
Brevard County Health Facilities Authority
(Health First, Inc. Obligated Group)
Series 2014
5.00%, 4/01/33 | | | 1,000 | | | | 1,098,270 | |
County of Miami-Dade FL Aviation Revenue
Series 2014A
5.00%, 10/01/33 | | | 1,300 | | | | 1,451,099 | |
| | | | | | | | |
| | | | | | | 2,549,369 | |
| | | | | | | | |
Guam – 1.5% | | | | | | | | |
Guam Government Waterworks Authority
Series 2016
5.00%, 1/01/46 | | | 615 | | | | 650,731 | |
Guam Power Authority
Series 2017A
5.00%, 10/01/36-10/01/38 | | | 690 | | | | 745,387 | |
| | | | | | | | |
| | | | | | | 1,396,118 | |
| | | | | | | | |
Illinois – 1.5% | | | | | | | | |
Illinois State Toll Highway Authority
Series 2013A
5.00%, 1/01/32 | | | 1,250 | | | | 1,381,437 | |
| | | | | | | | |
| | |
Massachusetts – 0.8% | | | | | | | | |
Commonwealth of Massachusetts
NATL Series 2000G
2.596%, 12/01/30(c) | | | 700 | | | | 700,000 | |
| | | | | | | | |
| | |
New York – 0.9% | | | | | | | | |
Suffolk County Economic Development Corp.
Series 2011
5.00%, 7/01/28 (Pre-refunded/ETM)(a) | | | 110 | | | | 119,999 | |
| | |
| abfunds.com | | AB MUNICIPAL INCOME FUND II | 71 |
PORTFOLIO OF INVESTMENTS (continued)
AB OHIO PORTFOLIO
| | | | | | | | |
| | | Principal
Amount
(000) | | | U.S. $ Value | |
| |
Suffolk County Economic Development Corp.
(Catholic Health Services of Long Island Obligated Group)
Series 2011
5.00%, 7/01/28 | | $ | 635 | | | $ | 686,200 | |
| | | | | | | | |
| | | | | | | 806,199 | |
| | | | | | | | |
North Carolina – 0.4% | | | | | | | | |
North Carolina Medical Care Commission
(Pennybyrn at Maryfield)
Series 2015
5.00%, 10/01/35(a) | | | 375 | | | | 396,398 | |
| | | | | | | | |
| | |
Puerto Rico – 0.1% | | | | | | | | |
Puerto Rico Industrial Tourist Educational Medical & Envirml Ctl Facs Fing Auth
(AES Puerto Rico LP)
Series 2000
6.625%, 6/01/26 | | | 130 | | | | 116,350 | |
| | | | | | | | |
| | |
Tennessee – 0.7% | | | | | | | | |
Metropolitan Government Nashville & Davidson County Health & Educational Facs Bd
(Belmont University)
Series 2012
5.00%, 11/01/29 | | | 630 | | | | 677,716 | |
| | | | | | | | |
| | |
Texas – 4.9% | | | | | | | | |
Arlington Higher Education Finance Corp.
(Lifeschool of Dallas)
Series 2014A
5.00%, 8/15/39 | | | 1,000 | | | | 1,108,120 | |
City of Houston TX
(City of Houston TX Hotel Occupancy Tax)
Series 2014
5.00%, 9/01/31 | | | 1,025 | | | | 1,141,471 | |
City of Houston TX Airport System Revenue
(United Airlines, Inc.)
Series 2018
5.00%, 7/15/28 | | | 215 | | | | 241,484 | |
North Texas Tollway Authority
Series 2015B
5.00%, 1/01/34 | | | 700 | | | | 786,961 | |
Texas Private Activity Bond Surface
Transportation Corp.
(LBJ Infrastructure Group LLC)
Series 2010
7.00%, 6/30/40 | | | 740 | | | | 808,235 | |
| | |
| 72 | AB MUNICIPAL INCOME FUND II | | abfunds.com |
PORTFOLIO OF INVESTMENTS (continued)
AB OHIO PORTFOLIO
| | | | | | | | |
| | | Principal
Amount
(000) | | | U.S. $ Value | |
| |
Texas Private Activity Bond Surface
Transportation Corp.
(NTE Mobility Partners LLC)
Series 2009
6.875%, 12/31/39 | | $ | 370 | | | $ | 395,252 | |
| | | | | | | | |
| | | | | | | 4,481,523 | |
| | | | | | | | |
West Virginia – 0.6% | | | | | | | | |
West Virginia Hospital Finance Authority
(West Virginia University Health System Obligated Group)
AGM Series 2004C
2.478%, 2/15/34(c) | | | 600 | | | | 574,248 | |
| | | | | | | | |
| | |
Total Municipal Obligations
(cost $86,942,790) | | | | | | | 90,170,896 | |
| | | | | | | | |
| | |
| | | Shares | | | | |
SHORT-TERM INVESTMENTS – 0.3% | | | | | | | | |
Investment Companies – 0.3% | | | | | | | | |
AB Fixed Income Shares, Inc. – Government Money Market Portfolio – Class AB, 1.57%(d)(e)(f)
(cost $287,653) | | | 287,653 | | | | 287,653 | |
| | | | | | | | |
| | |
Total Investments – 98.6%
(cost $87,230,443) | | | | | | | 90,458,549 | |
Other assets less liabilities – 1.4% | | | | | | | 1,301,394 | |
| | | | | | | | |
| | |
Net Assets – 100.0% | | | | | | $ | 91,759,943 | |
| | | | | | | | |
| (a) | Security in which significant unobservable inputs (Level 3) were used in determining fair value. |
| (b) | Security is exempt from registration under Rule 144A of the Securities Act of 1933. These securities are considered restricted, but liquid and may be resold in transactions exempt from registration, normally to qualified institutional buyers. At May 31, 2018, the aggregate market value of these securities amounted to $961,555 or 1.0% of net assets. |
| (c) | An auction rate security whose interest rate resets at each auction date. Auctions are typically held every week or month. The rate shown is as of May 31, 2018 and the aggregate market value of these securities amounted to $1,274,248 or 1.39% of net assets. |
| (d) | Affiliated investments. |
| (e) | The rate shown represents the 7-day yield as of period end. |
| (f) | To obtain a copy of the fund’s shareholder report, please go to the Securities and Exchange Commission’s website at www.sec.gov, or call AB at (800) 227-4618. |
As of May 31, 2018, the Portfolio’s percentages of investments in municipal bonds that are insured and in insured municipal bonds that have been pre-refunded or escrowed to maturity are 1.4% and 0.0%, respectively.
Glossary:
AGM – Assured Guaranty Municipal
ETM – Escrowed to Maturity
NATL – National Interstate Corporation
See notes to financial statements.
| | |
| abfunds.com | | AB MUNICIPAL INCOME FUND II | 73 |
PORTFOLIO OF INVESTMENTS
AB PENNSYLVANIA PORTFOLIO
May 31, 2018
| | | | | | | | |
| | | Principal
Amount
(000) | | | U.S. $ Value | |
| |
MUNICIPAL OBLIGATIONS – 97.4% | | | | | | | | |
Long-Term Municipal Bonds – 97.1% | | | | | | | | |
Pennsylvania – 89.0% | | | | | | | | |
Adams County Industrial Development Authority
(Gettysburg College)
Series 2010
5.00%, 8/15/25 | | $ | 1,090 | | | $ | 1,153,394 | |
Allegheny County Industrial Development Authority
(Residential Resources, Inc./PA)
Series 2006
5.00%, 9/01/21 | | | 410 | | | | 410,824 | |
Allentown Neighborhood Improvement Zone Development Authority
Series 2017
5.00%, 5/01/42(a) | | | 700 | | | | 751,457 | |
Altoona Area School District
BAM
5.00%, 12/01/39(b) | | | 2,000 | | | | 2,233,640 | |
Beaver County Industrial Development Authority
(FirstEnergy Nuclear Generation LLC)
Series 2016A
4.375%, 1/01/35(c) | | | 415 | | | | 398,400 | |
Bensalem Township School District
Series 2013
5.00%, 6/01/30 | | | 3,345 | | | | 3,773,461 | |
Berks County Industrial Development Authority
(Highlands at Wyomissing (The))
Series 2018
5.00%, 5/15/43 | | | 500 | | | | 543,380 | |
Bucks County Water & Sewer Authority
AGM Series 2011
5.00%, 12/01/29 (Pre-refunded/ETM) | | | 1,255 | | | | 1,383,600 | |
AGM Series 2015A
5.00%, 12/01/37 | | | 780 | | | | 879,731 | |
Carlisle Area School District
Series 2011
5.00%, 9/01/25 (Pre-refunded/ETM) | | | 2,000 | | | | 2,218,260 | |
Centre County Hospital Authority
(Mount Nittany Medical Center Obligated Group)
Series 2018A
5.00%, 11/15/42 | | | 1,000 | | | | 1,127,480 | |
City of Philadelphia PA
Series 2014A
5.25%, 7/15/31 | | | 2,500 | | | | 2,796,775 | |
Series 2017
5.00%, 8/01/31 | | | 1,000 | | | | 1,144,440 | |
| | |
| 74 | AB MUNICIPAL INCOME FUND II | | abfunds.com |
PORTFOLIO OF INVESTMENTS (continued)
AB PENNSYLVANIA PORTFOLIO
| | | | | | | | |
| | | Principal
Amount
(000) | | | U.S. $ Value | |
| |
City of Philadelphia PA Water & Wastewater Revenue
Series 2017A
5.00%, 10/01/36 | | $ | 1,700 | | | $ | 1,955,306 | |
Commonwealth Financing Authority State Lease
Series 2018
5.00%, 6/01/31 | | | 2,500 | | | | 2,852,375 | |
Commonwealth of Pennsylvania
Series 2013
5.00%, 4/01/28 (Pre-refunded/ETM) | | | 1,800 | | | | 2,044,476 | |
Commonwealth of Pennsylvania COP
Series 2018A
5.00%, 7/01/34-7/01/36 | | | 2,200 | | | | 2,468,713 | |
County of York PA
Series 2017
5.00%, 3/01/36 | | | 1,000 | | | | 1,168,740 | |
Crawford County Hospital Authority
(Meadville Medical Center Obligated Group)
Series 2016A
6.00%, 6/01/46(c) | | | 635 | | | | 661,137 | |
Cumberland County Municipal Authority
(Asbury Pennsylvania Obligated Group)
Series 2010
6.125%, 1/01/45(c) | | | 300 | | | | 312,096 | |
Delaware County Authority
(Elwyn Obligated Group)
Series 2017
5.00%, 6/01/32 | | | 1,625 | | | | 1,775,020 | |
Delaware County Regional Water Quality Control Authority
Series 2013
5.00%, 5/01/30 (Pre-refunded/ETM) | | | 2,070 | | | | 2,349,574 | |
Delaware River Joint Toll Bridge Commission
Series 2017
5.00%, 7/01/37 | | | 2,000 | | | | 2,312,240 | |
Delaware River Port Authority
Series 2010D
5.00%, 1/01/29 | | | 4,470 | | | | 4,673,966 | |
Hospitals & Higher Education Facilities Authority of Philadelphia (The)
(Temple University Health System Obligated Group)
Series 2017
5.00%, 7/01/33 | | | 660 | | | | 728,290 | |
| | |
| abfunds.com | | AB MUNICIPAL INCOME FUND II | 75 |
PORTFOLIO OF INVESTMENTS (continued)
AB PENNSYLVANIA PORTFOLIO
| | | | | | | | |
| | | Principal
Amount
(000) | | | U.S. $ Value | |
| |
Montgomery County Higher Education & Health Authority
(Philadelphia Presbytery Homes Obligated Group)
Series 2017
5.00%, 12/01/37 | | $ | 1,100 | | | $ | 1,217,337 | |
Montgomery County Industrial Development Authority/PA
Series 2010
5.25%, 8/01/33 (Pre-refunded/ETM)(c) | | | 735 | | | | 786,163 | |
Moon Industrial Development Authority
(Baptist Home Society Obligated Group)
Series 2015
5.75%, 7/01/35(c) | | | 765 | | | | 817,586 | |
Northampton County General Purpose Authority
(Lafayette College)
Series 2013A
5.00%, 11/01/32 | | | 2,000 | | | | 2,233,180 | |
Pennsylvania Economic Development Financing Authority
(National Railroad Passenger Corp. (The))
Series 2012A
5.00%, 11/01/32 | | | 2,000 | | | | 2,139,220 | |
Pennsylvania Higher Educational Facilities Authority
Series 2010
5.00%, 3/01/27 (Pre-refunded/ETM) | | | 1,460 | | | | 1,535,584 | |
Pennsylvania Industrial Development Authority
Series 2008
5.50%, 7/01/23 (Pre-refunded/ETM)(c) | | | 130 | | | | 130,380 | |
Pennsylvania Turnpike Commission
Series 2010B-2
5.00%, 12/01/30 (Pre-refunded/ETM)(c) | | | 1,245 | | | | 1,335,892 | |
5.00%, 12/01/30 (Pre-refunded/ETM) | | | 940 | | | | 1,009,870 | |
Series 2017A
5.00%, 12/01/37 | | | 1,250 | | | | 1,418,688 | |
Series 2017B
5.00%, 6/01/36 | | | 1,000 | | | | 1,112,410 | |
Pennsylvania Turnpike Commission
(Pennsylvania Turnpike Commission Oil Franchise Tax)
Series 2018B
5.00%, 12/01/38-12/01/43(b) | | | 2,000 | | | | 2,271,840 | |
Philadelphia Authority for Industrial Development
(Evangelical Services for the Aging Obligated Group)
Series 2017A
5.00%, 7/01/37 | | | 675 | | | | 722,216 | |
| | |
| 76 | AB MUNICIPAL INCOME FUND II | | abfunds.com |
PORTFOLIO OF INVESTMENTS (continued)
AB PENNSYLVANIA PORTFOLIO
| | | | | | | | |
| | | Principal
Amount
(000) | | | U.S. $ Value | |
| |
Philadelphia Authority for Industrial Development
(Greater Philadelphia Health Action, Inc.)
Series 2015A
6.375%, 6/01/40(c) | | $ | 400 | | | $ | 414,224 | |
Philadelphia Authority for Industrial Development
(LLPCS Foundation)
Series 2005A
5.25%, 7/01/24(c)(d)(e)(f) | | | 350 | | | | 3,500 | |
Philadelphia Authority for Industrial Development
(Temple University-of The Commonwealth System of Higher Education)
Series 2016-2
5.00%, 4/01/29 | | | 1,000 | | | | 1,143,790 | |
Philadelphia Gas Works Co.
Series 2010-9
5.00%, 8/01/30 (Pre-refunded/ETM) | | | 2,000 | | | | 2,126,520 | |
Philadelphia Parking Authority (The)
(Philadelphia Airport Parking)
Series 2009
5.00%, 9/01/26 | | | 2,725 | | | | 2,885,366 | |
School District of Philadelphia (The)
Series 2011E
5.25%, 9/01/23 | | | 1,500 | | | | 1,590,330 | |
Scranton School District/PA
BAM Series 2017E
5.00%, 12/01/33-12/01/35 | | | 1,800 | | | | 2,013,807 | |
Sports & Exhibition Authority of Pittsburgh and
Allegheny County
(Sports & Exhibition Authority of Pittsburgh and
Allegheny County Sales Tax)
AGM Series 2010
5.00%, 2/01/31 | | | 1,075 | | | | 1,135,738 | |
State Public School Building Authority
(Harrisburg School District)
AGM Series 2016A
5.00%, 12/01/29-12/01/33 | | | 2,000 | | | | 2,285,840 | |
Susquehanna Area Regional Airport Authority
Series 2017
5.00%, 1/01/35-1/01/38 | | | 2,000 | | | | 2,219,910 | |
Township of Lower Paxton PA
Series 2014
5.00%, 4/01/44 | | | 2,000 | | | | 2,219,000 | |
Wilkes-Barre Finance Authority
Series 2010
5.00%, 11/01/30 (Pre-refunded/ETM) | | | 2,500 | | | | 2,677,275 | |
| | | | | | | | |
| | | | | | | 79,562,441 | |
| | | | | | | | |
| | |
| abfunds.com | | AB MUNICIPAL INCOME FUND II | 77 |
PORTFOLIO OF INVESTMENTS (continued)
AB PENNSYLVANIA PORTFOLIO
| | | | | | | | |
| | | Principal
Amount
(000) | | | U.S. $ Value | |
| |
Colorado – 0.3% | |
City & County of Denver CO
(United Airlines, Inc.)
Series 2017
5.00%, 10/01/32 | | $ | 215 | | | $ | 232,052 | |
| | | | | | | | |
|
Guam – 1.5% | |
Guam Power Authority
Series 2017A
5.00%, 10/01/36-10/01/40 | | | 645 | | | | 695,875 | |
Territory of Guam
(Territory of Guam Business Privilege Tax)
Series 2011A
5.125%, 1/01/42 | | | 620 | | | | 642,580 | |
| | | | | | | | |
| | | | | | | 1,338,455 | |
| | | | | | | | |
Kentucky – 0.4% | |
Kentucky Economic Development Finance Authority
(Owensboro Health, Inc. Obligated Group)
Series 2017A
5.00%, 6/01/41 | | | 315 | | | | 338,594 | |
| | | | | | | | |
|
New Jersey – 0.5% | |
Tobacco Settlement Financing Corp./NJ
Series 2018B
5.00%, 6/01/46 | | | 425 | | | | 456,097 | |
| | | | | | | | |
|
New York – 2.2% | |
New York City Transitional Finance Authority Future Tax Secured Revenue
Series 2012B
5.00%, 11/01/30 | | | 1,735 | | | | 1,935,687 | |
| | | | | | | | |
|
Puerto Rico – 0.1% | |
Puerto Rico Industrial Tourist Educational Medical & Envirml Ctl Facs Fing Auth
(AES Puerto Rico LP)
Series 2000
6.625%, 6/01/26 | | | 125 | | | | 111,875 | |
| | | | | | | | |
|
South Carolina – 0.6% | |
South Carolina Public Service Authority
Series 2016B
5.00%, 12/01/41 | | | 470 | | | | 513,104 | |
| | | | | | | | |
| | |
| 78 | AB MUNICIPAL INCOME FUND II | | abfunds.com |
PORTFOLIO OF INVESTMENTS (continued)
AB PENNSYLVANIA PORTFOLIO
| | | | | | | | |
| | | Principal
Amount
(000) | | | U.S. $ Value | |
| |
Texas – 2.5% | |
Arlington Higher Education Finance Corp.
(Lifeschool of Dallas)
Series 2014A
5.00%, 8/15/39 | | $ | 1,200 | | | $ | 1,329,744 | |
City of Houston TX Airport System Revenue
AGM Series 2000P
3.521%, 7/01/30(g) | | | 475 | | | | 475,000 | |
XLCA Series 2002D
3.91%, 7/01/32(g) | | | 475 | | | | 475,000 | |
| | | | | | | | |
| | | | | | | 2,279,744 | |
| | | | | | | | |
Total Long-Term Municipal Bonds
(cost $83,760,985) | | | | | | | 86,768,049 | |
| | | | | | | | |
| | | | | | | | |
Short-Term Municipal Notes – 0.3% | |
Pennsylvania – 0.3% | |
Lancaster County Hospital Authority/PA
(Masonic Villages of the Grand Lodge of Pennsylvania)
Series 2008D
0.91%, 7/01/34(h)
(cost $300,000) | | | 300 | | | | 300,000 | |
| | | | | | | | |
| | |
Total Municipal Obligations
(cost $84,060,985) | | | | | | | 87,068,049 | |
| | | | | | | | |
| | |
| | | Shares | | | | |
SHORT-TERM INVESTMENTS – 5.2% | |
Investment Companies – 5.2% | |
AB Fixed Income Shares, Inc. – Government Money Market Portfolio – Class AB, 1.57%(i)(j)(k)
(cost $4,663,527) | | | 4,663,527 | | | | 4,663,527 | |
| | | | | | | | |
| | |
Total Investments – 102.6%
(cost $88,724,512) | | | | | | | 91,731,576 | |
Other assets less liabilities – (2.6)% | | | | | | | (2,344,550 | ) |
| | | | | | | | |
| | |
Net Assets – 100.0% | | | | | | $ | 89,387,026 | |
| | | | | | | | |
| (a) | Security is exempt from registration under Rule 144A of the Securities Act of 1933. This security is considered restricted, but liquid and may be resold in transactions exempt from registration, normally to qualified institutional buyers. At May 31, 2018, the market value of this security amounted to $751,457 or 0.8% of net assets. |
| (b) | When-Issued or delayed delivery security. |
| (c) | Security in which significant unobservable inputs (Level 3) were used in determining fair value. |
| (d) | Non-income producing security. |
| | |
| abfunds.com | | AB MUNICIPAL INCOME FUND II | 79 |
PORTFOLIO OF INVESTMENTS (continued)
AB PENNSYLVANIA PORTFOLIO
| (g) | An auction rate security whose interest rate resets at each auction date. Auctions are typically held every week or month. The rate shown is as of May 31, 2018 and the aggregate market value of these securities amounted to $950,000 or 1.06% of net assets. |
| (h) | Variable Rate Demand Notes are instruments whose interest rates change on a specific date (such as coupon date or interest payment date) or whose interest rates vary with changes in a designated base rate (such as the prime interest rate). This instrument is payable on demand and is secured by letters of credit or other credit support agreements from major banks. |
| (i) | Affiliated investments. |
| (j) | The rate shown represents the 7-day yield as of period end. |
| (k) | To obtain a copy of the fund’s shareholder report, please go to the Securities and Exchange Commission’s website at www.sec.gov, or call AB at (800) 227-4618. |
As of May 31, 2018, the Portfolio’s percentages of investments in municipal bonds that are insured and in insured municipal bonds that have been pre-refunded or escrowed to maturity are 12.5% and 1.6%, respectively.
Glossary:
AGM – Assured Guaranty Municipal
BAM – Build American Mutual
COP – Certificate of Participation
ETM – Escrowed to Maturity
XLCA – XL Capital Assurance Inc.
See notes to financial statements.
| | |
| 80 | AB MUNICIPAL INCOME FUND II | | abfunds.com |
PORTFOLIO OF INVESTMENTS
AB VIRGINIA PORTFOLIO
May 31, 2018
| | | | | | | | |
| | | Principal
Amount
(000) | | | U.S. $ Value | |
| |
MUNICIPAL OBLIGATIONS – 99.2% | |
Long-Term Municipal Bonds – 99.2% | |
Virginia – 73.3% | |
Arlington County Industrial Development Authority
(AHC LP-3/VA)
Series 2001
5.15%, 11/01/31 | | $ | 1,240 | | | $ | 1,243,881 | |
Cherry Hill Community Development Authority
(Potomac Shores Project)
Series 2015
5.40%, 3/01/45(a)(b) | | | 585 | | | | 601,912 | |
Chesapeake Bay Bridge & Tunnel District
Series 2016
5.00%, 7/01/46 | | | 4,000 | | | | 4,424,720 | |
Chesterfield County Economic Development Authority
(Brandermill Woods)
Series 2012
5.125%, 1/01/43(a) | | | 1,600 | | | | 1,652,896 | |
City of Hampton VA
Series 2010A
5.00%, 1/15/21 | | | 1,750 | | | | 1,785,840 | |
City of Newport News VA
Series 2014A
5.00%, 7/15/30-7/15/32 | | | 2,000 | | | | 2,276,940 | |
City of Richmond VA
Series 2016
5.00%, 1/15/34 | | | 5,000 | | | | 5,771,650 | |
City of Richmond VA
(City of Richmond VA Public Utility Revenue)
Series 2013A
5.00%, 1/15/29 | | | 1,970 | | | | 2,206,105 | |
City of Richmond VA Public Utility Revenue
Series 2016
5.00%, 1/15/30 | | | 4,000 | | | | 4,674,200 | |
City of Suffolk VA
Series 2010
5.00%, 8/01/22 | | | 1,870 | | | | 1,991,980 | |
Series 2010A
5.00%, 8/01/22 (Pre-refunded/ETM)(a) | | | 210 | | | | 223,514 | |
Series 2011
5.00%, 2/01/26 (Pre-refunded/ETM)(a) | | | 4,110 | | | | 4,426,429 | |
5.00%, 2/01/26 (Pre-refunded/ETM) | | | 950 | | | | 1,025,715 | |
County of Henrico VA
Series 2010
5.00%, 7/15/24 | | | 6,600 | | | | 7,020,420 | |
| | |
| abfunds.com | | AB MUNICIPAL INCOME FUND II | 81 |
PORTFOLIO OF INVESTMENTS (continued)
AB VIRGINIA PORTFOLIO
| | | | | | | | |
| | | Principal
Amount
(000) | | | U.S. $ Value | |
| |
Culpeper County Economic Development Authority
Series 2014
4.00%, 6/01/29 | | $ | 2,955 | | | $ | 3,120,923 | |
Dullles Town Center Community Development Authority
Series 2012
4.25%, 3/01/26(a) | | | 1,000 | | | | 1,001,660 | |
Fairfax County Economic Development Authority
Series 2011
5.00%, 4/01/28 (Pre-refunded/ETM) | | | 1,135 | | | | 1,199,684 | |
Fairfax County Economic Development Authority
(County of Fairfax VA Lease)
Series 2014A
5.00%, 10/01/34 | | | 1,000 | | | | 1,136,610 | |
Fairfax County Economic Development Authority
(Fairfax County EDA Transportation Impt Dist)
Series 2016
4.00%, 4/01/35 | | | 2,000 | | | | 2,121,300 | |
Fairfax County Economic Development Authority
(Goodwin House, Inc.)
Series 2016
5.00%, 10/01/36-10/01/42 | | | 3,200 | | | | 3,555,780 | |
Fairfax County Industrial Development Authority
(Inova Health System Obligated Group)
Series 2012
5.00%, 5/15/35 | | | 1,800 | | | | 1,975,230 | |
Series 2014A
5.00%, 5/15/44 | | | 2,000 | | | | 2,220,960 | |
Greater Richmond Convention Center Authority
(Greater Richmond Convention Center Authority Hotel Occupancy Tax)
Series 2015
5.00%, 6/15/30-6/15/31 | | | 5,000 | | | | 5,698,920 | |
Hampton Roads Sanitation District
Series 2017A
5.00%, 10/01/33 | | | 3,550 | | | | 4,186,941 | |
Hampton Roads Transportation Accountability Commission
Series 2018A
5.00%, 7/01/35 | | | 4,000 | | | | 4,723,480 | |
Hanover County Economic Development Authority
(Covenant Woods)
Series 2012A
5.00%, 7/01/42(a) | | | 2,000 | | | | 2,068,380 | |
| | |
| 82 | AB MUNICIPAL INCOME FUND II | | abfunds.com |
PORTFOLIO OF INVESTMENTS (continued)
AB VIRGINIA PORTFOLIO
| | | | | | | | |
| | | Principal
Amount
(000) | | | U.S. $ Value | |
| |
Henrico County Economic Development Authority
(Bon Secours Health System, Inc. Obligated Group)
Series 2013
5.00%, 11/01/30 | | $ | 2,000 | | | $ | 2,210,960 | |
Henrico County Economic Development Authority
(LifeSpire of Virginia Obligated Group)
Series 2017C
5.00%, 12/01/37(a) | | | 765 | | | | 816,201 | |
Lexington Industrial Development Authority
(Kendal at Lexington)
Series 2016
4.00%, 1/01/31 | | | 1,500 | | | | 1,547,250 | |
Loudoun County Sanitation Authority
Series 2010
5.00%, 1/01/29 | | | 3,820 | | | | 4,002,825 | |
Lynchburg Economic Development Authority
(Centra Health Obligated Group)
Series 2017A
5.00%, 1/01/47 | | | 1,750 | | | | 1,956,710 | |
Mosaic District Community Development Authority
Series 2011A
6.875%, 3/01/36(a) | | | 250 | | | | 272,268 | |
Newport News Redevelopment & Housing Authority
(Walker-Newport News LP)
Series 2002A
5.55%, 9/20/34 | | | 1,880 | | | | 1,882,820 | |
5.65%, 3/20/44 | | | 1,660 | | | | 1,661,959 | |
Norfolk Economic Development Authority
(Bon Secours Health System, Inc. Obligated Group)
Series 2013
5.00%, 11/01/29 | | | 2,200 | | | | 2,432,056 | |
Prince William County Industrial Development Authority
Series 2011
5.50%, 9/01/31 (Pre-refunded/ETM) | | | 3,750 | | | | 4,143,675 | |
Prince William County Industrial Development Authority
(Westminster at Lake Ridge)
Series 2016
5.00%, 1/01/31(a) | | | 1,700 | | | | 1,849,396 | |
Richmond Redevelopment & Housing Authority
(American Tobacco Holdings LLC)
Series 2017
5.55%, 1/01/37(a)(b) | | | 1,000 | | | | 1,022,200 | |
| | |
| abfunds.com | | AB MUNICIPAL INCOME FUND II | 83 |
PORTFOLIO OF INVESTMENTS (continued)
AB VIRGINIA PORTFOLIO
| | | | | | | | |
| | | Principal
Amount
(000) | | | U.S. $ Value | |
| |
Roanoke County Economic Development Authority
(City of Roanoke VA Lease)
Series 2015
5.00%, 10/15/35 | | $ | 1,750 | | | $ | 2,008,300 | |
Roanoke Economic Development Authority
(Carilion Clinic Obligated Group)
AGM Series 2005C
5.00%, 7/01/27 | | | 3,000 | | | | 3,160,650 | |
Roanoke Economic Development Authority
(Lynchburg College)
Series 2018A
5.00%, 9/01/33-9/01/43 | | | 3,660 | | | | 4,100,756 | |
Suffolk Economic Development Authority
(United Church Homes & Services Obligated Group)
Series 2016
5.00%, 9/01/31(a) | | | 1,000 | | | | 1,078,970 | |
Tobacco Settlement Financing Corp./VA
Series 2007B-1
5.00%, 6/01/47 | | | 2,400 | | | | 2,399,952 | |
Town of Leesburg VA
Series 2011A
5.00%, 1/15/24 (Pre-refunded/ETM)(a) | | | 395 | | | | 424,921 | |
5.00%, 1/15/24 | | | 1,645 | | | | 1,772,652 | |
Virginia College Building Authority
(Liberty University, Inc.)
Series 2010
5.25%, 3/01/29 | | | 5,000 | | | | 5,284,600 | |
Virginia College Building Authority
(Marymount University)
Series 2015A
5.00%, 7/01/30(b) | | | 1,615 | | | | 1,740,421 | |
Virginia College Building Authority
(Roanoke College)
Series 2007
5.00%, 4/01/23 | | | 1,000 | | | | 1,002,280 | |
Virginia Commonwealth University Health System Authority
Series 2011
5.00%, 7/01/27 (Pre-refunded/ETM) | | | 1,000 | | | | 1,091,530 | |
Series 2017B
5.00%, 7/01/46 | | | 2,000 | | | | 2,273,120 | |
Virginia Port Authority
Series 2016B
5.00%, 7/01/35-7/01/36 | | | 6,160 | | | | 6,930,804 | |
| | |
| 84 | AB MUNICIPAL INCOME FUND II | | abfunds.com |
PORTFOLIO OF INVESTMENTS (continued)
AB VIRGINIA PORTFOLIO
| | | | | | | | |
| | | Principal
Amount
(000) | | | U.S. $ Value | |
| |
Virginia Resources Authority
Series 2011B
5.00%, 11/01/26 (Pre-refunded/ETM)(a) | | $ | 2,260 | | | $ | 2,483,062 | |
5.00%, 11/01/26 | | | 2,740 | | | | 3,010,438 | |
Series 2016C
4.00%, 11/01/34 | | | 2,000 | | | | 2,149,160 | |
Virginia Resources Authority
(Virginia Resources Authority SRF)
Series 2013
5.00%, 10/01/25 | | | 4,000 | | | | 4,594,480 | |
Virginia Small Business Financing Authority
(Covanta Holding Corp.)
5.00%, 1/01/48(b)(c) | | | 1,000 | | | | 1,018,320 | |
Virginia Small Business Financing Authority
(Elizabeth River Crossings OpCo LLC)
Series 2012
5.25%, 1/01/32 | | | 2,500 | | | | 2,721,200 | |
5.50%, 1/01/42 | | | 1,000 | | | | 1,089,190 | |
Virginia Small Business Financing Authority
(Hampton University)
Series 2014
5.25%, 10/01/29 | | | 4,125 | | | | 4,727,539 | |
Virginia Small Business Financing Authority
(I-66 Express Mobility Partners LLC)
Series 2017
5.00%, 12/31/52 | | | 3,350 | | | | 3,672,102 | |
Winchester Economic Development Authority
(Valley Health Obligated Group)
Series 2015
5.00%, 1/01/34-1/01/35 | | | 3,500 | | | | 3,935,045 | |
| | | | | | | | |
| | | | | | | 158,803,882 | |
| | | | | | | | |
Arizona – 2.3% | |
Arizona Sports & Tourism Authority
Series 2012A
5.00%, 7/01/29 | | | 3,945 | | | | 4,206,396 | |
Salt Verde Financial Corp.
(Citigroup, Inc.)
Series 2007
5.00%, 12/01/37 | | | 705 | | | | 842,397 | |
| | | | | | | | |
| | | | | | | 5,048,793 | |
| | | | | | | | |
California – 0.3% | | | | | | | | |
California Statewide Communities Development Authority
(Enloe Medical Center)
Series 2008A
5.50%, 8/15/23 | | | 660 | | | | 665,148 | |
| | | | | | | | |
| | |
| abfunds.com | | AB MUNICIPAL INCOME FUND II | 85 |
PORTFOLIO OF INVESTMENTS (continued)
AB VIRGINIA PORTFOLIO
| | | | | | | | |
| | | Principal
Amount
(000) | | | U.S. $ Value | |
| |
Colorado – 0.6% | | | | | | | | |
City & County of Denver CO Airport System Revenue
(Denver Intl Airport)
Series 2012A
5.00%, 11/15/28 | | $ | 1,220 | | | $ | 1,345,440 | |
| | | | | | | | |
| | |
District of Columbia – 8.3% | | | | | | | | |
Metropolitan Washington Airports Authority
Series 2009C
5.125%, 10/01/34 | | | 2,380 | | | | 2,406,156 | |
Series 2012A
5.00%, 10/01/30 | | | 2,480 | | | | 2,709,152 | |
Series 2016A
5.00%, 10/01/35 | | | 1,200 | | | | 1,362,348 | |
Metropolitan Washington Airports Authority
(Dulles Toll Road)
Series 2010B
6.50%, 10/01/44(d) | | | 4,300 | | | | 5,427,675 | |
Washington Metropolitan Area Transit Authority
Series 2017A
5.00%, 7/01/31-7/01/32 | | | 5,095 | | | | 6,009,609 | |
| | | | | | | | |
| | | | | | | 17,914,940 | |
| | | | | | | | |
Florida – 0.7% | | | | | | | | |
Pinellas County Educational Facilities Authority
(Barry University, Inc.)
Series 2012
5.00%, 10/01/27 | | | 400 | | | | 420,260 | |
5.25%, 10/01/30 | | | 1,000 | | | | 1,051,980 | |
| | | | | | | | |
| | | | | | | 1,472,240 | |
| | | | | | | | |
Guam – 0.8% | | | | | | | | |
Guam Power Authority
Series 2017A
5.00%, 10/01/36 | | | 1,630 | | | | 1,763,953 | |
| | | | | | | | |
| | |
Illinois – 1.0% | | | | | | | | |
Metropolitan Pier & Exposition Authority
Series 2015B
5.00%, 12/15/45 | | | 2,200 | | | | 2,303,906 | |
| | | | | | | | |
| | |
Massachusetts – 0.6% | | | | | | | | |
Commonwealth of Massachusetts
NATL Series 2000G
2.596%, 12/01/30(e) | | | 1,250 | | | | 1,250,000 | |
| | | | | | | | |
| | |
Michigan – 0.8% | | | | | | | | |
Michigan Public Power Agency
Series 2012A
5.00%, 1/01/32 | | | 1,575 | | | | 1,664,555 | |
| | | | | | | | |
| | |
| 86 | AB MUNICIPAL INCOME FUND II | | abfunds.com |
PORTFOLIO OF INVESTMENTS (continued)
AB VIRGINIA PORTFOLIO
| | | | | | | | |
| | | Principal
Amount
(000) | | | U.S. $ Value | |
| |
Minnesota – 0.5% | |
Western Minnesota Municipal Power Agency
Series 2015A
5.00%, 1/01/34 | | $ | 1,000 | | | $ | 1,137,500 | |
| | | | | | | | |
|
New York – 3.6% | |
Metropolitan Transportation Authority
Series 2011D
5.00%, 11/15/28 (Pre-refunded/ETM) | | | 2,735 | | | | 3,020,452 | |
5.00%, 11/15/29 (Pre-refunded/ETM) | | | 3,010 | | | | 3,324,154 | |
Suffolk County Economic Development Corp.
Series 2011
5.00%, 7/01/28 (Pre-refunded/ETM)(a) | | | 185 | | | | 201,816 | |
Suffolk County Economic Development Corp.
(Catholic Health Services of Long Island Obligated Group)
Series 2011
5.00%, 7/01/28 | | | 1,090 | | | | 1,177,887 | |
| | | | | | | | |
| | | | | | | 7,724,309 | |
| | | | | | | | |
North Carolina – 0.5% | |
North Carolina Medical Care Commission
(Aldersgate United Methodist Retirement Community, Inc.)
Series 2015
4.70%, 7/01/37(a) | | | 1,000 | | | | 1,043,990 | |
| | | | | | | | |
|
Ohio – 0.3% | |
Ohio Water Development Authority Water Pollution Control Loan Fund
(FirstEnergy Nuclear Generation LLC)
Series 2016A
4.375%, 6/01/33(a) | | | 600 | | | | 576,000 | |
| | | | | | | | |
|
Puerto Rico – 0.9% | |
Puerto Rico Housing Finance Authority
(Puerto Rico Housing Finance Authority Cap Fd Prog)
Series 2003
5.00%, 12/01/20 | | | 1,580 | | | | 1,646,976 | |
Puerto Rico Industrial Tourist Educational Medical & Envirml Ctl Facs Fing Auth
(AES Puerto Rico LP)
Series 2000
6.625%, 6/01/26 | | | 305 | | | | 272,975 | |
| | | | | | | | |
| | | | | | | 1,919,951 | |
| | | | | | | | |
| | |
| abfunds.com | | AB MUNICIPAL INCOME FUND II | 87 |
PORTFOLIO OF INVESTMENTS (continued)
AB VIRGINIA PORTFOLIO
| | | | | | | | |
| | | Principal
Amount
(000) | | | U.S. $ Value | |
| |
Texas – 2.6% | |
North Texas Tollway Authority
Series 2015B
5.00%, 1/01/34 | | $ | 1,300 | | | $ | 1,461,499 | |
Tarrant County Cultural Education Facilities Finance Corp.
(Edgemere Retirement Senior Quality Lifestyles Corp.)
Series 2015B
5.00%, 11/15/36 | | | 1,150 | | | | 1,209,041 | |
Texas Private Activity Bond Surface Transportation Corp.
(LBJ Infrastructure Group LLC)
Series 2010
7.00%, 6/30/40 | | | 1,110 | | | | 1,212,353 | |
Texas Private Activity Bond Surface Transportation Corp.
(NTE Mobility Partners LLC)
Series 2009
6.875%, 12/31/39 | | | 555 | | | | 592,879 | |
Texas Private Activity Bond Surface Transportation Corp.
(NTE Mobility Partners Segments 3 LLC)
Series 2013
6.75%, 6/30/43 | | | 1,000 | | | | 1,155,380 | |
| | | | | | | | |
| | | | | | | 5,631,152 | |
| | | | | | | | |
Washington – 0.2% | | | | | | | | |
Washington Higher Education Facilities Authority
(Whitworth University)
Series 2012
5.00%, 10/01/32 | | | 400 | | | | 426,008 | |
| | | | | | | | |
| | |
Wisconsin – 1.9% | | | | | | | | |
Wisconsin Health & Educational Facilities Authority
Series 2012C
5.00%, 8/15/32 (Pre-refunded/ETM)(a) | | | 2,700 | | | | 3,002,589 | |
Wisconsin Public Finance Authority
(Celanese US Holdings LLC)
Series 2016A
5.00%, 1/01/24 | | | 1,000 | | | | 1,104,110 | |
| | | | | | | | |
| | | | | | | 4,106,699 | |
| | | | | | | | |
Total Municipal Obligations
(cost $207,394,800) | | | | | | | 214,798,466 | |
| | | | | | | | |
| | |
| 88 | AB MUNICIPAL INCOME FUND II | | abfunds.com |
PORTFOLIO OF INVESTMENTS (continued)
AB VIRGINIA PORTFOLIO
| | | | | | | | |
| Company | | Shares | | | U.S. $ Value | |
| |
SHORT-TERM INVESTMENTS – 0.1% | | | | | | | | |
Investment Companies – 0.1% | | | | | | | | |
AB Fixed Income Shares, Inc. – Government
Money Market Portfolio – Class AB, 1.57%(f)(g)(h)
(cost $278,976) | | | 278,976 | | | $ | 278,976 | |
| | | | | | | | |
| | |
Total Investments – 99.3%
(cost $207,673,776) | | | | | | | 215,077,442 | |
Other assets less liabilities – 0.7% | | | | | | | 1,418,993 | |
| | | | | | | | |
| | |
Net Assets – 100.0% | | | | | | $ | 216,496,435 | |
| | | | | | | | |
| (a) | Security in which significant unobservable inputs (Level 3) were used in determining fair value. |
| (b) | Security is exempt from registration under Rule 144A of the Securities Act of 1933. These securities are considered restricted, but liquid and may be resold in transactions exempt from registration, normally to qualified institutional buyers. At May 31, 2018, the aggregate market value of these securities amounted to $4,382,853 or 2.0% of net assets. |
| (c) | When-Issued or delayed delivery security. |
| (d) | Indicates a security that has a zero coupon that remains in effect until a predetermined date at which time the stated coupon rate becomes effective until final maturity. |
| (e) | An auction rate security whose interest rate resets at each auction date. Auctions are typically held every week or month. The rate shown is as of May 31, 2018 and the aggregate market value of this security amounted to $1,250,000 or 0.6% of net assets. |
| (f) | Affiliated investments. |
| (g) | The rate shown represents the 7-day yield as of period end. |
| (h) | To obtain a copy of the fund’s shareholder report, please go to the Securities and Exchange Commission’s website at www.sec.gov, or call AB at (800) 227-4618. |
As of May 31, 2018, the Portfolio’s percentages of investments in municipal bonds that are insured and in insured municipal bonds that have been pre-refunded or escrowed to maturity are 2.1% and 0.0%, respectively.
Glossary:
AGM – Assured Guaranty Municipal
EDA – Economic Development Agency
ETM – Escrowed to Maturity
NATL – National Interstate Corporation
SRF – State Revolving Fund
See notes to financial statements.
| | |
| abfunds.com | | AB MUNICIPAL INCOME FUND II | 89 |
STATEMENT OF ASSETS & LIABILITIES
May 31, 2018
| | | | | | | | |
| | | AB Arizona | | | AB Massachusetts | |
| Assets | | | | | | | | |
Investments in securities, at value | | | | | | | | |
Unaffiliated issuers (cost $113,390,568 and $217,995,281, respectively) | | $ | 116,543,063 | | | $ | 225,487,937 | |
Affiliated issuers (cost $237,390 and $862,514, respectively) | | | 237,390 | | | | 862,514 | |
Cash collateral due from broker | | | – 0 | – | | | 109,990 | |
Interest receivable | | | 2,105,144 | | | | 3,251,553 | |
Receivable for investment securities sold | | | 1,000,576 | | | | – 0 | – |
Receivable for shares of beneficial interest sold | | | 11,884 | | | | 182,450 | |
Affiliated dividends receivable | | | 1,279 | | | | 584 | |
Receivable for variation margin on centrally cleared swaps | | | – 0 | – | | | 27,946 | |
| | | | | | | | |
Total assets | | | 119,899,336 | | | | 229,922,974 | |
| | | | | | | | |
| Liabilities | | | | | | | | |
Due to custodian | | | 699,866 | | | | – 0 | – |
Payable for investment securities purchased | | | 638,270 | | | | 656,344 | |
Payable for shares of beneficial interest redeemed | | | 121,015 | | | | 219,445 | |
Distribution fee payable | | | 35,491 | | | | 61,017 | |
Dividends payable | | | 31,665 | | | | 139,625 | |
Advisory fee payable | | | 20,602 | | | | 62,769 | |
Administrative fee payable | | | 11,768 | | | | 11,327 | |
Transfer Agent fee payable | | | 1,536 | | | | 3,533 | |
Accrued expenses | | | 57,665 | | | | 67,500 | |
| | | | | | | | |
Total liabilities | | | 1,617,878 | | | | 1,221,560 | |
| | | | | | | | |
Net Assets | | $ | 118,281,458 | | | $ | 228,701,414 | |
| | | | | | | | |
| Composition of Net Assets | | | | | | | | |
Shares of beneficial interest, at par | | $ | 107,755 | | | $ | 206,369 | |
Additional paid-in capital | | | 115,872,469 | | | | 220,532,923 | |
Distributions in excess of net investment income | | | (31,665 | ) | | | (103,966 | ) |
Accumulated net realized (loss) on investment transactions | | | (819,596 | ) | | | (142,871 | ) |
Net unrealized appreciation on investments | | | 3,152,495 | | | | 8,208,959 | |
| | | | | | | | |
| | $ | 118,281,458 | | | $ | 228,701,414 | |
| | | | | | | | |
See notes to financial statements.
| | |
| 90 | AB MUNICIPAL INCOME FUND II | | abfunds.com |
STATEMENT OF ASSETS & LIABILITIES (continued)
Net Asset Value Per Share—unlimited shares authorized, $.01 par value
| | | | | | | | | | | | |
| AB Arizona Portfolio | | Net Assets | | | Shares
Outstanding | | | Net Asset
Value | |
| |
| Class A | | $ | 102,019,936 | | | | 9,292,177 | | | $ | 10.98 | * |
| |
| Class B | | $ | 7,250 | | | | 661.37 | | | $ | 10.96 | |
| |
| Class C | | $ | 16,254,272 | | | | 1,482,671 | | | $ | 10.96 | |
| |
| | |
| AB Massachusetts Portfolio | | | | | | | |
| |
| Class A | | $ | 141,077,978 | | | | 12,724,780 | | | $ | 11.09 | * |
| |
| Class B | | $ | 63,072 | | | | 5,698 | | | $ | 11.07 | |
| |
| Class C | | $ | 36,735,454 | | | | 3,319,326 | | | $ | 11.07 | |
| |
| Advisor Class | | $ | 50,824,910 | | | | 4,587,118 | | | $ | 11.08 | |
| |
| * | The maximum offering price per share for Class A of AB Arizona Portfolio and AB Massachusetts Portfolio were $11.32 and $11.43, respectively, which reflects a sales charge of 3.00%. |
See notes to financial statements.
| | |
| abfunds.com | | AB MUNICIPAL INCOME FUND II | 91 |
STATEMENT OF ASSETS & LIABILITIES (continued)
| | | | | | | | |
| | | AB Minnesota | | | AB New Jersey | |
| Assets | |
Investments in securities, at value | |
Unaffiliated issuers (cost $66,266,160 and $101,634,894, respectively) | | $ | 68,607,288 | | | $ | 106,863,565 | |
Affiliated issuers (cost $719,937 and $112,518, respectively) | | | 719,937 | | | | 112,518 | |
Cash collateral due from broker | | | 61,008 | | | | 78,174 | |
Interest receivable | | | 945,051 | | | | 1,645,592 | |
Receivable for shares of beneficial interest sold | | | 73,778 | | | | 22,541 | |
Affiliated dividends receivable | | | 210 | | | | 603 | |
| | | | | | | | |
Total assets | | | 70,407,272 | | | | 108,722,993 | |
| | | | | | | | |
| Liabilities | |
Due to custodian | | | – 0 | – | | | 52 | |
Payable for investment securities purchased | | | 1,042,840 | | | | 307,977 | |
Payable for shares of beneficial interest redeemed | | | 56,897 | | | | 532,999 | |
Distribution fee payable | | | 19,931 | | | | 31,976 | |
Dividends payable | | | 17,572 | | | | 55,180 | |
Administrative fee payable | | | 11,502 | | | | 12,325 | |
Advisory fee payable | | | 3,777 | | | | 16,526 | |
Transfer Agent fee payable | | | 1,578 | | | | 1,593 | |
Payable for variation margin on centrally cleared swaps | | | 972 | | | | 446 | |
Accrued expenses | | | 61,455 | | | | 60,916 | |
| | | | | | | | |
Total liabilities | | | 1,216,524 | | | | 1,019,990 | |
| | | | | | | | |
Net Assets | | $ | 69,190,748 | | | $ | 107,703,003 | |
| | | | | | | | |
| Composition of Net Assets | |
Shares of beneficial interest, at par | | $ | 68,426 | | | $ | 111,830 | |
Additional paid-in capital | | | 66,807,179 | | | | 104,804,010 | |
Distributions in excess of net investment income | | | (17,572 | ) | | | (55,180 | ) |
Accumulated net realized gain (loss) on investment transactions | | | (34,399 | ) | | | (2,420,786 | ) |
Net unrealized appreciation on investments | | | 2,367,114 | | | | 5,263,129 | |
| | | | | | | | |
| | $ | 69,190,748 | | | $ | 107,703,003 | |
| | | | | | | | |
See notes to financial statements.
| | |
| 92 | AB MUNICIPAL INCOME FUND II | | abfunds.com |
STATEMENT OF ASSETS & LIABILITIES (continued)
Net Asset Value Per Share—unlimited shares authorized, $.01 par value
| | | | | | | | | | | | |
| AB Minnesota Portfolio | | Net Assets | | | Shares
Outstanding | | | Net Asset
Value | |
| |
| Class A | | $ | 60,996,227 | | | | 6,032,964 | | | $ | 10.11 | * |
| |
| Class B | | $ | 30,392 | | | | 3,003 | | | $ | 10.12 | |
| |
| Class C | | $ | 8,164,129 | | | | 806,613 | | | $ | 10.12 | |
| |
| | |
| AB New Jersey Portfolio | | | | | | | |
| |
| Class A | | $ | 93,551,532 | | | | 9,714,376 | | | $ | 9.63 | * |
| |
| Class B | | $ | 144,406 | | | | 14,994 | | | $ | 9.63 | |
| |
| Class C | | $ | 14,007,065 | | | | 1,453,621 | | | $ | 9.64 | |
| |
| * | The maximum offering price per share for Class A of AB Minnesota Portfolio and AB New Jersey Portfolio were $10.42 and $9.93, respectively, which reflects a sales charge of 3.00%. |
See notes to financial statements.
| | |
| abfunds.com | | AB MUNICIPAL INCOME FUND II | 93 |
STATEMENT OF ASSETS & LIABILITIES (continued)
| | | | | | | | |
| | | AB Ohio | | | AB Pennsylvania | |
| Assets | |
Investments in securities, at value | |
Unaffiliated issuers (cost $86,942,790 and $84,060,985, respectively) | | $ | 90,170,896 | | | $ | 87,068,049 | |
Affiliated issuers (cost $287,653 and $4,663,527, respectively) | | | 287,653 | | | | 4,663,527 | |
Cash | | | – 0 | – | | | 342 | |
Interest receivable | | | 1,482,018 | | | | 1,155,891 | |
Receivable for shares of beneficial interest sold | | | 35,951 | | | | 57,626 | |
Affiliated dividends receivable | | | 14 | | | | 4,205 | |
Receivable for investment securities sold | | | – 0 | – | | | 1,158,857 | |
| | | | | | | | |
Total assets | | | 91,976,532 | | | | 94,108,497 | |
| | | | | | | | |
| Liabilities | |
Payable for shares of beneficial interest redeemed | | | 66,057 | | | | 128,354 | |
Dividends payable | | | 37,962 | | | | 24,908 | |
Audit and tax fee payable | | | 29,914 | | | | 29,395 | |
Distribution fee payable | | | 27,180 | | | | 24,582 | |
Legal fee payable | | | 12,783 | | | | 12,783 | |
Administrative fee payable | | | 12,325 | | | | 10,766 | |
Advisory fee payable | | | 11,597 | | | | 12,857 | |
Transfer Agent fee payable | | | 1,543 | | | | 1,717 | |
Payable for investment securities purchased | | | – 0 | – | | | 4,458,750 | |
Accrued expenses | | | 17,228 | | | | 17,359 | |
| | | | | | | | |
Total liabilities | | | 216,589 | | | | 4,721,471 | |
| | | | | | | | |
Net Assets | | $ | 91,759,943 | | | $ | 89,387,026 | |
| | | | | | | | |
| Composition of Net Assets | |
Shares of beneficial interest, at par | | $ | 93,342 | | | $ | 86,334 | |
Additional paid-in capital | | | 93,186,868 | | | | 86,919,298 | |
Distributions in excess of net investment income | | | (32,156 | ) | | | (44,266 | ) |
Accumulated net realized loss on investment transactions | | | (4,716,217 | ) | | | (581,404 | ) |
Net unrealized appreciation on investments | | | 3,228,106 | | | | 3,007,064 | |
| | | | | | | | |
| | $ | 91,759,943 | | | $ | 89,387,026 | |
| | | | | | | | |
See notes to financial statements.
| | |
| 94 | AB MUNICIPAL INCOME FUND II | | abfunds.com |
STATEMENT OF ASSETS & LIABILITIES (continued)
Net Asset Value Per Share—unlimited shares authorized, $.01 par value
| | | | | | | | | | | | |
| AB Ohio Portfolio | | Net Assets | | | Shares
Outstanding | | | Net Asset
Value | |
| |
| Class A | | $ | 79,767,586 | | | | 8,113,797 | | | $ | 9.83 | * |
| |
| Class B | | $ | 25,560 | | | | 2,602 | | | $ | 9.82 | |
| |
| Class C | | $ | 11,966,797 | | | | 1,217,817 | | | $ | 9.83 | |
| |
| | |
| AB Pennsylvania Portfolio | | | | | | | |
| |
| Class A | | $ | 80,665,776 | | | | 7,791,365 | | | $ | 10.35 | * |
| |
| Class B | | $ | 35,326 | | | | 3,412 | | | $ | 10.35 | |
| |
| Class C | | $ | 8,685,924 | | | | 838,648 | | | $ | 10.36 | |
| |
| * | The maximum offering price per share for Class A of AB Ohio Portfolio and AB Pennsylvania Portfolio were $10.13 and $10.67, respectively, which reflects a sales charge of 3.00%. |
See notes to financial statements.
| | |
| abfunds.com | | AB MUNICIPAL INCOME FUND II | 95 |
STATEMENT OF ASSETS & LIABILITIES (continued)
| | | | |
| | | AB Virginia | |
| Assets | |
Investments in securities, at value | |
Unaffiliated issuers (cost $207,394,800, respectively) | | $ | 214,798,466 | |
Affiliated issuers (cost $278,976, respectively) | | | 278,976 | |
Interest receivable | | | 2,872,552 | |
Receivable for shares of beneficial interest sold | | | 93,189 | |
Affiliated dividends receivable | | | 1,073 | |
| | | | |
Total assets | | | 218,044,256 | |
| | | | |
| Liabilities | |
Payable for investment securities purchased | | | 1,000,000 | |
Payable for shares of beneficial interest redeemed | | | 222,835 | |
Dividends payable | | | 120,991 | |
Advisory fee payable | | | 62,072 | |
Distribution fee payable | | | 60,193 | |
Administrative fee payable | | | 10,765 | |
Transfer Agent fee payable | | | 2,573 | |
Accrued expenses | | | 68,392 | |
| | | | |
Total liabilities | | | 1,547,821 | |
| | | | |
Net Assets | | $ | 216,496,435 | |
| | | | |
| Composition of Net Assets | |
Shares of beneficial interest, at par | | $ | 197,151 | |
Additional paid-in capital | | | 210,896,083 | |
Distributions in excess of net investment income | | | (120,990 | ) |
Accumulated net realized loss on investment transactions | | | (1,879,475 | ) |
Net unrealized appreciation on investments | | | 7,403,666 | |
| | | | |
| | $ | 216,496,435 | |
| | | | |
Net Asset Value Per Share—unlimited shares authorized, $.01 par value
| | | | | | | | | | | | |
| AB Virginia Portfolio | | Net Assets | | | Shares
Outstanding | | | Net Asset
Value | |
| |
| Class A | | $ | 139,827,027 | | | | 12,728,731 | | | $ | 10.99 | * |
| |
| Class B | | $ | 46,236 | | | | 4,216 | | | $ | 10.97 | |
| |
| Class C | | $ | 35,435,121 | | | | 3,234,332 | | | $ | 10.96 | |
| |
| Advisor Class | | $ | 41,188,051 | | | | 3,747,851 | | | $ | 10.99 | |
| |
| * | The maximum offering price per share for Class A of AB Virginia Portfolio was $11.33, which reflects a sales charge of 3.00%. |
See notes to financial statements.
| | |
| 96 | AB MUNICIPAL INCOME FUND II | | abfunds.com |
STATEMENT OF OPERATIONS
Year Ended May 31, 2018
| | | | | | | | |
| | | AB Arizona | | | AB Massachusetts | |
| Investment Income | | | | | | | | |
Interest | | $ | 4,507,947 | | | $ | 8,907,690 | |
Dividends – Affiliated issuers | | | 10,616 | | | | 5,830 | |
| | | | | | | | |
Total income | | | 4,518,563 | | | | 8,913,520 | |
| | | | | | | | |
| Expenses | | | | | | | | |
Advisory fee (see Note B) | | | 547,439 | | | | 1,091,389 | |
Distribution fee – Class A | | | 257,527 | | | | 380,948 | |
Distribution fee – Class B | | | 1,049 | | | | 820 | |
Distribution fee – Class C | | | 185,373 | | | | 411,999 | |
Transfer agency – Class A | | | 38,152 | | | | 53,024 | |
Transfer agency – Class B | | | 54 | | | | 46 | |
Transfer agency – Class C | | | 6,972 | | | | 14,376 | |
Transfer agency – Advisor Class | | | – 0 | – | | | 17,035 | |
Custodian | | | 83,239 | | | | 105,390 | |
Administrative | | | 74,256 | | | | 73,209 | |
Audit and tax | | | 48,673 | | | | 49,215 | |
Legal | | | 39,561 | | | | 40,793 | |
Trustees’ fees | | | 26,886 | | | | 26,886 | |
Printing | | | 12,195 | | | | 14,670 | |
Registration fees | | | 10,170 | | | | 17,424 | |
Miscellaneous | | | 7,509 | | | | 13,926 | |
| | | | | | | | |
Total expenses before interest expense | | | 1,339,055 | | | | 2,311,150 | |
Interest expense(a) | | | 14,726 | | | | 37,697 | |
| | | | | | | | |
Total expenses | | | 1,353,781 | | | | 2,348,847 | |
Less: expenses waived and reimbursed by the Adviser (see Note B) | | | (252,508 | ) | | | (257,301 | ) |
| | | | | | | | |
Net expenses | | | 1,101,273 | | | | 2,091,546 | |
| | | | | | | | |
Net investment income | | | 3,417,290 | | | | 6,821,974 | |
| | | | | | | | |
| Realized and Unrealized Gain (Loss) on Investment Transactions | | | | | | | | |
Net realized gain (loss) on: | | | | | | | | |
Investment transactions | | | 391,816 | | | | 1,055,916 | |
Swaps | | | (165,231 | ) | | | (773,339 | ) |
Net change in unrealized appreciation/depreciation of: | | | | | | | | |
Investments | | | (2,242,961 | ) | | | (6,009,906 | ) |
Swaps | | | 19,218 | | | | 526,924 | |
| | | | | | | | |
Net loss on investment transactions | | | (1,997,158 | ) | | | (5,200,405 | ) |
| | | | | | | | |
Net Increase in Net Assets from Operations | | $ | 1,420,132 | | | $ | 1,621,569 | |
| | | | | | | | |
| (a) | Non-financing expense. |
See notes to financial statements.
| | |
| abfunds.com | | AB MUNICIPAL INCOME FUND II | 97 |
STATEMENT OF OPERATIONS (continued)
| | | | | | | | |
| | | AB Minnesota | | | AB New Jersey | |
| Investment Income | | | | | | | | |
Interest | | $ | 2,738,441 | | | $ | 4,416,718 | |
Dividends – Affiliated issuers | | | 3,560 | | | | 5,677 | |
| | | | | | | | |
Total income | | | 2,742,001 | | | | 4,422,395 | |
| | | | | | | | |
| Expenses | | | | | | | | |
Advisory fee (see Note B) | | | 340,015 | | | | 496,865 | |
Distribution fee – Class A | | | 164,220 | | | | 236,649 | |
Distribution fee – Class B | | | 297 | | | | 1,887 | |
Distribution fee – Class C | | | 98,411 | | | | 155,661 | |
Transfer agency – Class A | | | 38,021 | | | | 43,374 | |
Transfer agency – Class B | | | 34 | | | | 95 | |
Transfer agency – Class C | | | 6,041 | | | | 7,231 | |
Custodian | | | 77,381 | | | | 80,581 | |
Administrative | | | 72,875 | | | | 74,620 | |
Audit and tax | | | 49,486 | | | | 49,191 | |
Legal | | | 39,548 | | | | 39,557 | |
Trustees’ fees | | | 26,884 | | | | 26,884 | |
Printing | | | 16,136 | | | | 17,125 | |
Registration fees | | | 14,055 | | | | 4,376 | |
Miscellaneous | | | 5,416 | | | | 6,304 | |
| | | | | | | | |
Total expenses before interest expense | | | 948,820 | | | | 1,240,400 | |
Interest expense(a) | | | 8,051 | | | | 10,305 | |
| | | | | | | | |
Total expenses | | | 956,871 | | | | 1,250,705 | |
Less: expenses waived and reimbursed by the Adviser (see Note B) | | | (233,238 | ) | | | (217,938 | ) |
| | | | | | | | |
Net expenses | | | 723,633 | | | | 1,032,767 | |
| | | | | | | | |
Net investment income | | | 2,018,368 | | | | 3,389,628 | |
| | | | | | | | |
| Realized and Unrealized Gain (Loss) on Investment Transactions | | | | | | | | |
Net realized gain (loss) on: | | | | | | | | |
Investment transactions | | | 279,520 | | | | 1,038,970 | |
Swaps | | | (53,813 | ) | | | (195,230 | ) |
Net change in unrealized appreciation/depreciation of: | | | | | | | | |
Investments | | | (1,749,578 | ) | | | (2,660,156 | ) |
Swaps | | | (54,478 | ) | | | 85,587 | |
| | | | | | | | |
Net loss on investment transactions | | | (1,578,349 | ) | | | (1,730,829 | ) |
| | | | | | | | |
Net Increase in Net Assets from Operations | | $ | 440,019 | | | $ | 1,658,799 | |
| | | | | | | | |
| (a) | Non-financing expense. |
See notes to financial statements.
| | |
| 98 | AB MUNICIPAL INCOME FUND II | | abfunds.com |
STATEMENT OF OPERATIONS (continued)
| | | | | | | | |
| | | AB Ohio | | | AB Pennsylvania | |
| Investment Income | | | | | | | | |
Interest | | $ | 3,409,912 | | | $ | 3,433,211 | |
Dividends – Affiliated issuers | | | 6,335 | | | | 11,578 | |
| | | | | | | | |
Total income | | | 3,416,247 | | | | 3,444,789 | |
| | | | | | | | |
| Expenses | | | | | | | | |
Advisory fee (see Note B) | | | 425,511 | | | | 410,798 | |
Distribution fee – Class A | | | 204,504 | | | | 202,446 | |
Distribution fee – Class B | | | 259 | | | | 475 | |
Distribution fee – Class C | | | 127,304 | | | | 102,625 | |
Transfer agency – Class A | | | 41,748 | | | | 46,994 | |
Transfer agency – Class B | | | 27 | | | | 63 | |
Transfer agency – Class C | | | 6,690 | | | | 6,122 | |
Custodian | | | 77,954 | | | | 79,051 | |
Administrative | | | 74,915 | | | | 73,786 | |
Audit and tax | | | 49,488 | | | | 45,095 | |
Legal | | | 39,552 | | | | 39,552 | |
Trustees’ fees | | | 26,886 | | | | 26,884 | |
Printing | | | 17,267 | | | | 17,283 | |
Registration fees | | | 4,430 | | | | 4,393 | |
Miscellaneous | | | 6,018 | | | | 5,679 | |
| | | | | | | | |
Total expenses before interest expense | | | 1,102,553 | | | | 1,061,246 | |
Interest expense(a) | | | 5,844 | | | | 14,301 | |
| | | | | | | | |
Total expenses | | | 1,108,397 | | | | 1,075,547 | |
Less: expenses waived and reimbursed by the Adviser (see Note B) | | | (251,700 | ) | | | (209,833 | ) |
| | | | | | | | |
Net expenses | | | 856,697 | | | | 865,714 | |
| | | | | | | | |
Net investment income | | | 2,559,550 | | | | 2,579,075 | |
| | | | | | | | |
| Realized and Unrealized Gain (Loss) on Investment Transactions | | | | | | | | |
Net realized gain (loss) on: | | | | | | | | |
Investment transactions | | | 646,224 | | | | 924,989 | |
Swaps | | | (94,690 | ) | | | 24,519 | |
Net change in unrealized appreciation/depreciation of: | | | | | | | | |
Investments | | | (2,746,069 | ) | | | (2,555,875 | ) |
Swaps | | | 91,140 | | | | (15,738 | ) |
| | | | | | | | |
Net loss on investment transactions | | | (2,103,395 | ) | | | (1,622,105 | ) |
| | | | | | | | |
Net Increase in Net Assets from Operations | | $ | 456,155 | | | $ | 956,970 | |
| | | | | | | | |
| (a) | Non-financing expense. |
See notes to financial statements.
| | |
| abfunds.com | | AB MUNICIPAL INCOME FUND II | 99 |
STATEMENT OF OPERATIONS (continued)
| | | | |
| | | AB Virginia | |
| Investment Income | | | | |
Interest | | $ | 8,251,074 | |
Dividends – Affiliated issuers | | | 6,412 | |
| | | | |
Total income | | | 8,257,486 | |
| | | | |
| Expenses | | | | |
Advisory fee (see Note B) | | | 1,015,382 | |
Distribution fee – Class A | | | 370,428 | |
Distribution fee – Class B | | | 747 | |
Distribution fee – Class C | | | 399,326 | |
Transfer agency – Class A | | | 52,596 | |
Transfer agency – Class B | | | 57 | |
Transfer agency – Class C | | | 14,585 | |
Transfer agency – Advisor Class | | | 13,241 | |
Custodian | | | 101,813 | |
Administrative | | | 73,877 | |
Audit and tax | | | 50,577 | |
Legal | | | 40,787 | |
Trustees’ fees | | | 26,886 | |
Printing | | | 20,887 | |
Registration fees | | | 7,352 | |
Miscellaneous | | | 13,080 | |
| | | | |
Total expenses before interest expense | | | 2,201,621 | |
Interest expense(a) | | | 21,497 | |
| | | | |
Total expenses | | | 2,223,118 | |
Less: expenses waived and reimbursed by the Adviser (see Note B) | | | (191,325 | ) |
| | | | |
Net expenses | | | 2,031,793 | |
| | | | |
Net investment income | | | 6,225,693 | |
| | | | |
| Realized and Unrealized Gain (Loss) on Investment Transactions | | | | |
Net realized gain (loss) on: | | | | |
Investment transactions | | | 1,502,794 | |
Swaps | | | (74,917 | ) |
Net change in unrealized appreciation/depreciation of: | | | | |
Investments | | | (5,482,122 | ) |
Swaps | | | (48,550 | ) |
| | | | |
Net loss on investment transactions | | | (4,102,795 | ) |
| | | | |
Net Increase in Net Assets from Operations | | $ | 2,122,898 | |
| | | | |
| (a) | Non-financing expense. |
See notes to financial statements.
| | |
| 100 | AB MUNICIPAL INCOME FUND II | | abfunds.com |
STATEMENT OF CHANGES IN NET ASSETS
| | | | | | | | |
| | | AB Arizona | |
| | | Year Ended
May 31,
2018 | | | Year Ended
May 31,
2017 | |
| Increase (Decrease) in Net Assets from Operations | | | | | | | | |
Net investment income | | $ | 3,417,290 | | | $ | 3,742,411 | |
Net realized gain on investment transactions | | | 226,585 | | | | 375,648 | |
Net change in unrealized appreciation/depreciation of investments | | | (2,223,743 | ) | | | (2,852,622 | ) |
| | | | | | | | |
Net increase in net assets from operations | | | 1,420,132 | | | | 1,265,437 | |
| Dividends to Shareholders from | | | | | | | | |
Net investment income | | | | | | | | |
Class A | | | (3,004,774 | ) | | | (3,183,783 | ) |
Class B | | | (2,262 | ) | | | (8,658 | ) |
Class C | | | (402,076 | ) | | | (561,339 | ) |
| Transactions in Shares of Beneficial Interest | | | | | | | | |
Net decrease | | | (5,095,592 | ) | | | (4,119,215 | ) |
| | | | | | | | |
Total decrease | | | (7,084,572 | ) | | | (6,607,558 | ) |
| Net Assets | | | | | | | | |
Beginning of period | | | 125,366,030 | | | | 131,973,588 | |
| | | | | | | | |
End of period (including distributions in excess of net investment income of ($31,665) and ($46,202), respectively) | | $ | 118,281,458 | | | $ | 125,366,030 | |
| | | | | | | | |
See notes to financial statements.
| | |
| abfunds.com | | AB MUNICIPAL INCOME FUND II | 101 |
STATEMENT OF CHANGES IN NET ASSETS (continued)
| | | | | | | | |
| | | AB Massachusetts | |
| | | Year Ended
May 31,
2018 | | | Year Ended
May 31,
2017 | |
| Increase (Decrease) in Net Assets from Operations | | | | | | | | |
Net investment income | | $ | 6,821,974 | | | $ | 6,924,779 | |
Net realized gain on investment transactions | | | 282,577 | | | | 762,502 | |
Net change in unrealized appreciation/depreciation of investments | | | (5,482,982 | ) | | | (6,351,370 | ) |
| | | | | | | | |
Net increase in net assets from operations | | | 1,621,569 | | | | 1,335,911 | |
| Dividends and Distributions to Shareholders from | | | | | | | | |
Net investment income | | | | | | | | |
Class A | | | (4,505,761 | ) | | | (5,441,060 | ) |
Class B | | | (1,816 | ) | | | (2,732 | ) |
Class C | | | (912,784 | ) | | | (1,226,343 | ) |
Advisor Class | | | (1,566,737 | ) | | | (557,378 | ) |
Net realized gain on investment transactions | | | | | | | | |
Class A | | | (161,241 | ) | | | – 0 | – |
Class B | | | (89 | ) | | | – 0 | – |
Class C | | | (42,281 | ) | | | – 0 | – |
Advisor Class | | | (51,673 | ) | | | – 0 | – |
| Transactions in Shares of Beneficial Interest | | | | | | | | |
Net increase (decrease) | | | (17,465,735 | ) | | | 13,778,541 | |
| | | | | | | | |
Total increase (decrease) | | | (23,086,548 | ) | | | 7,886,939 | |
| Net Assets | | | | | | | | |
Beginning of period | | | 251,787,962 | | | | 243,901,023 | |
| | | | | | | | |
End of period (including distributions in excess of net investment income of ($103,966) and ($171,510), respectively) | | $ | 228,701,414 | | | $ | 251,787,962 | |
| | | | | | | | |
See notes to financial statements.
| | |
| 102 | AB MUNICIPAL INCOME FUND II | | abfunds.com |
STATEMENT OF CHANGES IN NET ASSETS (continued)
| | | | | | | | |
| | | AB Minnesota | |
| | | Year Ended
May 31,
2018 | | | Year Ended
May 31,
2017 | |
| Increase (Decrease) in Net Assets from Operations | | | | | | | | |
Net investment income | | $ | 2,018,368 | | | $ | 2,167,020 | |
Net realized gain (loss) on investment transactions | | | 225,707 | | | | (128,351 | ) |
Net change in unrealized appreciation/depreciation of investments | | | (1,804,056 | ) | | | (1,551,227 | ) |
| | | | | | | | |
Net increase in net assets from operations | | | 440,019 | | | | 487,442 | |
| Dividends and Distributions to Shareholders from | | | | | | | | |
Net investment income | | | | | | | | |
Class A | | | (1,824,478 | ) | | | (1,887,191 | ) |
Class B | | | (602 | ) | | | (764 | ) |
Class C | | | (199,374 | ) | | | (316,509 | ) |
Net realized gain on investment transactions | | | | | | | | |
Class A | | | (42,455 | ) | | | (146,776 | ) |
Class B | | | (19 | ) | | | (83 | ) |
Class C | | | (6,268 | ) | | | (33,548 | ) |
| Transactions in Shares of Beneficial Interest | | | | | | | | |
Net decrease | | | (7,811,828 | ) | | | (3,039,798 | ) |
| | | | | | | | |
Total decrease | | | (9,445,005 | ) | | | (4,937,227 | ) |
| Net Assets | | | | | | | | |
Beginning of period | | | 78,635,753 | | | | 83,572,980 | |
| | | | | | | | |
End of period (including distributions in excess of net investment income of ($17,572) and ($47,663), respectively) | | $ | 69,190,748 | | | $ | 78,635,753 | |
| | | | | | | | |
See notes to financial statements.
| | |
| abfunds.com | | AB MUNICIPAL INCOME FUND II | 103 |
STATEMENT OF CHANGES IN NET ASSETS (continued)
| | | | | | | | |
| | | AB New Jersey | |
| | | Year Ended
May 31,
2018 | | | Year Ended
May 31,
2017 | |
| Increase (Decrease) in Net Assets from Operations | | | | | | | | |
Net investment income | | $ | 3,389,628 | | | $ | 3,516,388 | |
Net realized gain on investment transactions | | | 843,740 | | | | 962,805 | |
Net change in unrealized appreciation/depreciation of investments | | | (2,574,569 | ) | | | (2,718,058 | ) |
| | | | | | | | |
Net increase in net assets from operations | | | 1,658,799 | | | | 1,761,135 | |
| Dividends to Shareholders from | | | | | | | | |
Net investment income | | | | | | | | |
Class A | | | (3,007,796 | ) | | | (2,837,102 | ) |
Class B | | | (4,567 | ) | | | (6,197 | ) |
Class C | | | (377,279 | ) | | | (714,715 | ) |
| Transactions in Shares of Beneficial Interest | | | | | | | | |
Net decrease | | | (542,917 | ) | | | (5,967,060 | ) |
| | | | | | | | |
Total decrease | | | (2,273,760 | ) | | | (7,763,939 | ) |
| Net Assets | | | | | | | | |
Beginning of period | | | 109,976,763 | | | | 117,740,702 | |
| | | | | | | | |
End of period (including distributions in excess of net investment income of ($55,180) and ($59,911), respectively) | | $ | 107,703,003 | | | $ | 109,976,763 | |
| | | | | | | | |
See notes to financial statements.
| | |
| 104 | AB MUNICIPAL INCOME FUND II | | abfunds.com |
STATEMENT OF CHANGES IN NET ASSETS (continued)
| | | | | | | | |
| | | AB Ohio | |
| | | Year Ended
May 31,
2018 | | | Year Ended
May 31,
2017 | |
| Increase (Decrease) in Net Assets from Operations | | | | | | | | |
Net investment income | | $ | 2,559,550 | �� | | $ | 2,730,090 | |
Net realized gain on investment transactions | | | 551,534 | | | | 342,263 | |
Net change in unrealized appreciation/depreciation of investments | | | (2,654,929 | ) | | | (2,290,103 | ) |
Contributions from Affiliates (see Note B) | | | – 0 | – | | | 249 | |
| | | | | | | | |
Net increase in net assets from operations | | | 456,155 | | | | 782,499 | |
| Dividends to Shareholders from | | | | | | | | |
Net investment income | | | | | | | | |
Class A | | | (2,280,176 | ) | | | (2,242,271 | ) |
Class B | | | (528 | ) | | | (768 | ) |
Class C | | | (259,209 | ) | | | (498,664 | ) |
| Transactions in Shares of Beneficial Interest | | | | | | | | |
Net decrease | | | (3,299,860 | ) | | | (15,474,468 | ) |
| | | | | | | | |
Total decrease | | | (5,383,618 | ) | | | (17,433,672 | ) |
| Net Assets | | | | | | | | |
Beginning of period | | | 97,143,561 | | | | 114,577,233 | |
| | | | | | | | |
End of period (including distributions in excess of net investment income of ($32,156) and ($32,155), respectively) | | $ | 91,759,943 | | | $ | 97,143,561 | |
| | | | | | | | |
See notes to financial statements.
| | |
| abfunds.com | | AB MUNICIPAL INCOME FUND II | 105 |
STATEMENT OF CHANGES IN NET ASSETS (continued)
| | | | | | | | |
| | | AB Pennsylvania | |
| | | Year Ended
May 31,
2018 | | | Year Ended
May 31,
2017 | |
| Increase (Decrease) in Net Assets from Operations | | | | | | | | |
Net investment income | | $ | 2,579,075 | | | $ | 2,655,492 | |
Net realized gain on investment transactions | | | 949,508 | | | | 1,170,224 | |
Net change in unrealized appreciation/depreciation of investments | | | (2,571,613 | ) | | | (2,576,288 | ) |
| | | | | | | | |
Net increase in net assets from operations | | | 956,970 | | | | 1,249,428 | |
| Dividends to Shareholders from | | | | | | | | |
Net investment income | | | | | | | | |
Class A | | | (2,357,900 | ) | | | (2,207,696 | ) |
Class B | | | (1,024 | ) | | | (1,436 | ) |
Class C | | | (221,493 | ) | | | (446,407 | ) |
| Transactions in Shares of Beneficial Interest | | | | | | | | |
Net decrease | | | (3,908,101 | ) | | | (839,189 | ) |
| | | | | | | | |
Total decrease | | | (5,531,548 | ) | | | (2,245,300 | ) |
| Net Assets | | | | | | | | |
Beginning of period | | | 94,918,574 | | | | 97,163,874 | |
| | | | | | | | |
End of period (including distributions in excess of net investment income of ($44,266) and ($44,269), respectively) | | $ | 89,387,026 | | | $ | 94,918,574 | |
| | | | | | | | |
See notes to financial statements.
| | |
| 106 | AB MUNICIPAL INCOME FUND II | | abfunds.com |
STATEMENT OF CHANGES IN NET ASSETS (continued)
| | | | | | | | |
| | | AB Virginia | |
| | | Year Ended
May 31,
2018 | | | Year Ended
May 31,
2017 | |
| Increase (Decrease) in Net Assets from Operations | | | | | | | | |
Net investment income | | $ | 6,225,693 | | | $ | 6,542,651 | |
Net realized gain on investment transactions | | | 1,427,877 | | | | 2,055,509 | |
Net change in unrealized appreciation/depreciation of investments | | | (5,530,672 | ) | | | (6,519,297 | ) |
| | | | | | | | |
Net increase in net assets from operations | | | 2,122,898 | | | | 2,078,863 | |
| Dividends to Shareholders from | | | | | | | | |
Net investment income | | | | | | | | |
Class A | | | (4,288,994 | ) | | | (5,248,781 | ) |
Class B | | | (1,618 | ) | | | (2,612 | ) |
Class C | | | (860,696 | ) | | | (1,206,472 | ) |
Advisor Class(a) | | | (1,176,991 | ) | | | (316,528 | ) |
| Transactions in Shares of Beneficial Interest | | | | | | | | |
Net decrease | | | (9,199,000 | ) | | | (11,562,507 | ) |
| | | | | | | | |
Total decrease | | | (13,404,401 | ) | | | (16,258,037 | ) |
| Net Assets | | | | | | | | |
Beginning of period | | | 229,900,836 | | | | 246,158,873 | |
| | | | | | | | |
End of period (including distributions in excess of net investment income of ($120,990) and ($195,555), respectively) | | $ | 216,496,435 | | | $ | 229,900,836 | |
| | | | | | | | |
| (a) | Commenced distribution on July 25, 2016. |
See notes to financial statements.
| | |
| abfunds.com | | AB MUNICIPAL INCOME FUND II | 107 |
NOTES TO FINANCIAL STATEMENTS
May 31, 2018
NOTE A
Significant Accounting Policies
AB Municipal Income Fund II (the “Fund”) which is a Massachusetts Business Trust, is registered under the Investment Company Act of 1940, as a diversified, open-end management investment company. The Fund operates as a series company currently comprised of seven portfolios: AB Arizona Portfolio, AB Massachusetts Portfolio, AB Minnesota Portfolio, AB New Jersey Portfolio, AB Ohio Portfolio, AB Pennsylvania Portfolio and AB Virginia Portfolio (the “Portfolios”). Each series is considered to be a separate entity for financial reporting and tax purposes. Each Portfolio offers Class A, Class B and Class C shares. Class T shares have been authorized but currently are not offered. Effective July 25, 2016, AB Massachusetts Portfolio and AB Virginia Portfolio commenced offering of Advisor Class shares. Advisor Class shares for AB Arizona Portfolio, AB Minnesota Portfolio, AB New Jersey Portfolio, AB Ohio Portfolio and AB Pennsylvania Portfolio have been authorized but currently are not offered. Class A shares are sold with a front-end sales charge of up to 3% for purchases up to $500,000; purchases of $500,000 or more are not subject to a sales charge. With respect to purchases of $500,000 or more, Class A shares redeemed within one year of purchase may be subject to a contingent deferred sales charge of 1%. Class B shares are currently sold with a contingent deferred sales charge which declines from 3% to 0% depending on the period of time the shares are held. Effective January 31, 2009, sales of Class B shares of the Portfolios to new investors were suspended. Class B shares will only be issued (i) upon the exchange of Class B shares from another AB mutual fund, (ii) for purposes of dividend reinvestment, (iii) through the Portfolio’s Automatic Investment Program (the “Program”) for accounts that established the Program prior to January 31, 2009, and (iv) for purchases of additional shares by Class B shareholders as of January 31, 2009. The ability to establish a new Program for accounts containing Class B shares was suspended as of January 31, 2009. Class B shares will automatically convert to Class A shares six years after the end of the calendar month of purchase. Class C shares are subject to a contingent deferred sales charge of 1% on redemptions made within the first year after purchase, and 0% after the first year of purchase. Effective April 10, 2017, Class C shares will automatically convert to Class A shares ten years after the end of the calendar month of purchase. All five classes of shares have identical voting, dividend, liquidation and other rights, except that the classes bear different distribution and transfer agency expenses. Each class has exclusive voting rights with respect to its distribution plan. The financial statements have been prepared in conformity with U.S. generally accepted accounting principles (“U.S. GAAP”) which require management to make certain estimates and assumptions that affect the reported amounts of assets and
| | |
| 108 | AB MUNICIPAL INCOME FUND II | | abfunds.com |
NOTES TO FINANCIAL STATEMENTS (continued)
liabilities in the financial statements and amounts of income and expenses during the reporting period. Actual results could differ from those estimates. Each Portfolio is an investment company under U.S. GAAP and follows the accounting and reporting guidance applicable to investment companies. The following is a summary of significant accounting policies followed by the Portfolios.
1. Security Valuation
Portfolio securities are valued at their current market value determined on the basis of market quotations or, if market quotations are not readily available or are deemed unreliable, at “fair value” as determined in accordance with procedures established by and under the general supervision of the Fund’s Board of Trustees (the “Board”).
In general, the market values of securities which are readily available and deemed reliable are determined as follows: securities listed on a national securities exchange (other than securities listed on the NASDAQ Stock Market, Inc. (“NASDAQ”)) or on a foreign securities exchange are valued at the last sale price at the close of the exchange or foreign securities exchange. If there has been no sale on such day, the securities are valued at the last traded price from the previous day. Securities listed on more than one exchange are valued by reference to the principal exchange on which the securities are traded; securities listed only on NASDAQ are valued in accordance with the NASDAQ Official Closing Price; listed or over the counter (“OTC”) market put or call options are valued at the mid level between the current bid and ask prices. If either a current bid or current ask price is unavailable, AllianceBernstein L.P. (the “Adviser”) will have discretion to determine the best valuation (e.g., last trade price in the case of listed options); open futures are valued using the closing settlement price or, in the absence of such a price, the most recent quoted bid price. If there are no quotations available for the day of valuation, the last available closing settlement price is used; U.S. Government securities and any other debt instruments having 60 days or less remaining until maturity are generally valued at market by an independent pricing vendor, if a market price is available. If a market price is not available, the securities are valued at amortized cost. This methodology is commonly used for short term securities that have an original maturity of 60 days or less, as well as short term securities that had an original term to maturity that exceeded 60 days. In instances when amortized cost is utilized, the Valuation Committee (the “Committee”) must reasonably conclude that the utilization of amortized cost is approximately the same as the fair value of the security. Such factors the Committee will consider include, but are not limited to, an impairment of the creditworthiness of the issuer or material changes in interest rates. Fixed-income securities, including mortgage-backed and asset-backed securities, may be valued on the basis of prices provided by a pricing service or at a
| | |
| abfunds.com | | AB MUNICIPAL INCOME FUND II | 109 |
NOTES TO FINANCIAL STATEMENTS (continued)
price obtained from one or more of the major broker-dealers. In cases where broker-dealer quotes are obtained, the Adviser may establish procedures whereby changes in market yields or spreads are used to adjust, on a daily basis, a recently obtained quoted price on a security. Swaps and other derivatives are valued daily, primarily using independent pricing services, independent pricing models using market inputs, as well as third party broker-dealers or counterparties. Open-end mutual funds are valued at the closing net asset value per share, while exchange traded funds are valued at the closing market price per share.
Securities for which market quotations are not readily available (including restricted securities) or are deemed unreliable are valued at fair value as deemed appropriate by the Adviser. Factors considered in making this determination may include, but are not limited to, information obtained by contacting the issuer, analysts, analysis of the issuer’s financial statements or other available documents. In addition, the Portfolios may use fair value pricing for securities primarily traded in non-U.S. markets because most foreign markets close well before the Portfolios value their securities at 4:00 p.m., Eastern Time. The earlier close of these foreign markets gives rise to the possibility that significant events, including broad market moves, may have occurred in the interim and may materially affect the value of those securities. To account for this, the Portfolios generally value many of their foreign equity securities using fair value prices based on third party vendor modeling tools to the extent available.
2. Fair Value Measurements
In accordance with U.S. GAAP regarding fair value measurements, fair value is defined as the price that the Portfolios would receive to sell an asset or pay to transfer a liability in an orderly transaction between market participants at the measurement date. U.S. GAAP establishes a framework for measuring fair value, and a three-level hierarchy for fair value measurements based upon the transparency of inputs to the valuation of an asset or liability (including those valued based on their market values as described in Note A.1 above). Inputs may be observable or unobservable and refer broadly to the assumptions that market participants would use in pricing the asset or liability. Observable inputs reflect the assumptions market participants would use in pricing the asset or liability based on market data obtained from sources independent of the Portfolios. Unobservable inputs reflect the Portfolio’s own assumptions about the assumptions that market participants would use in pricing the asset or liability based on the best information available in the circumstances. Each investment is assigned a level based upon the observability of the inputs which are significant to the overall valuation. The three-tier hierarchy of inputs is summarized below.
| | • | | Level 1—quoted prices in active markets for identical investments |
| | |
| 110 | AB MUNICIPAL INCOME FUND II | | abfunds.com |
NOTES TO FINANCIAL STATEMENTS (continued)
| | • | | Level 2—other significant observable inputs (including quoted prices for similar investments, interest rates, prepayment speeds, credit risk, etc.) |
| | • | | Level 3—significant unobservable inputs (including the Portfolio’s own assumptions in determining the fair value of investments) |
The fair value of debt instruments, such as bonds, and over-the-counter derivatives is generally based on market price quotations, recently executed market transactions (where observable) or industry recognized modeling techniques and are generally classified as Level 2. Pricing vendor inputs to Level 2 valuations may include quoted prices for similar investments in active markets, interest rate curves, coupon rates, currency rates, yield curves, option adjusted spreads, default rates, credit spreads and other unique security features in order to estimate the relevant cash flows which are then discounted to calculate fair values. If these inputs are unobservable and significant to the fair value, these investments will be classified as Level 3. In addition, non-agency rated investments are classified as Level 3.
Other fixed income investments, including non-U.S. government and corporate debt, are generally valued using quoted market prices, if available, which are typically impacted by current interest rates, maturity dates and any perceived credit risk of the issuer. Additionally, in the absence of quoted market prices, these inputs are used by pricing vendors to derive a valuation based upon industry or proprietary models which incorporate issuer specific data with relevant yield/spread comparisons with more widely quoted bonds with similar key characteristics. Those investments for which there are observable inputs are classified as Level 2. Where the inputs are not observable, the investments are classified as Level 3.
The following tables summarize the valuation of the Portfolio’s investments by the above fair value hierarchy levels as of May 31, 2018:
| | | | | | | | | | | | | | | | |
| AB Arizona Portfolio | | | | |
Investments in
Securities: | | Level 1 | | | Level 2 | | | Level 3 | | | Total | |
Assets: | | | | | | | | | | | | | | | | |
Long-Term Municipal Bonds | | $ | – 0 | – | | $ | 109,847,314 | | | $ | 6,695,749 | | | $ | 116,543,063 | |
Short-Term Investments | | | 237,390 | | | | – 0 | – | | | – 0 | – | | | 237,390 | |
| | | | | | | | | | | | | | | | |
Total Investments in Securities | | | 237,390 | | | | 109,847,314 | | | | 6,695,749 | | | | 116,780,453 | |
Other Financial Instruments(a) | | | – 0 | – | | | – 0 | – | | | – 0 | – | | | – 0 | – |
| | | | | | | | | | | | | | | | |
Total(b) | | $ | 237,390 | | | $ | 109,847,314 | | | $ | 6,695,749 | | | $ | 116,780,453 | |
| | | | | | | | | | | | | | | | |
| | |
| abfunds.com | | AB MUNICIPAL INCOME FUND II | 111 |
NOTES TO FINANCIAL STATEMENTS (continued)
| | | | | | | | | | | | | | | | |
| AB Massachusetts Portfolio | | | | |
Investments in
Securities: | | Level 1 | | | Level 2 | | | Level 3 | | | Total | |
Assets: | | | | | | | | | | | | | | | | |
Long-Term Municipal Bonds | | $ | – 0 | – | | $ | 223,510,550 | | | $ | 1,977,387 | | | $ | 225,487,937 | |
Short-Term Investments | | | 862,514 | | | | – 0 | – | | | – 0 | – | | | 862,514 | |
| | | | | | | | | | | | | | | | |
Total Investments in Securities | | | 862,514 | | | | 223,510,550 | | | | 1,977,387 | | | | 226,350,451 | |
Other Financial Instruments(a): | | | | | | | | | | | | | | | | |
Assets: | | | | | | | | | | | | | | | | |
Centrally Cleared Interest Rate Swaps | | | – 0 | – | | | 832,296 | | | | – 0 | – | | | 832,296 | (c) |
Liabilities: | | | | | | | | | | | | | | | | |
Centrally Cleared Interest Rate Swaps | | | – 0 | – | | | (115,993 | ) | | | – 0 | – | | | (115,993 | )(c) |
| | | | | | | | | | | | | | | | |
Total(b) | | $ | 862,514 | | | $ | 224,226,853 | | | $ | 1,977,387 | | | $ | 227,066,754 | |
| | | | | | | | | | | | | | | | |
| | | | | | | | | | | | | | | | |
| AB Minnesota Portfolio | | | | |
Investments in
Securities: | | Level 1 | | | Level 2 | | | Level 3 | | | Total | |
Assets: | | | | | | | | | | | | | | | | |
Long-Term Municipal Bonds | | $ | – 0 | – | | $ | 67,967,813 | | | $ | 639,475 | | | $ | 68,607,288 | |
Short-Term Investments | | | 719,937 | | | | – 0 | – | | | – 0 | – | | | 719,937 | |
| | | | | | | | | | | | | | | | |
Total Investments in Securities | | | 719,937 | | | | 67,967,813 | | | | 639,475 | | | | 69,327,225 | |
Other Financial Instruments(a): | | | | | | | | | | | | | | | | |
Assets: | | | | | | | | | | | | | | | | |
Centrally Cleared Interest Rate Swaps | | | – 0 | – | | | 25,986 | | | | – 0 | – | | | 25,986 | (c) |
Liabilities | | | – 0 | – | | | – 0 | – | | | – 0 | – | | | – 0 | – |
| | | | | | | | | | | | | | | | |
Total(d) | | $ | 719,937 | | | $ | 67,993,799 | | | $ | 639,475 | | | $ | 69,353,211 | |
| | | | | | | | | | | | | | | | |
| | | | | | | | | | | | | | | | |
| AB New Jersey Portfolio | | | | |
Investments in
Securities: | | Level 1 | | | Level 2 | | | Level 3 | | | Total | |
Assets: | | | | | | | | | | | | | | | | |
Long-Term Municipal Bonds | | $ | – 0 | – | | $ | 99,634,292 | | | $ | 7,229,273 | | | $ | 106,863,565 | |
Short-Term Investments | | | 112,518 | | | | – 0 | – | | | – 0 | – | | | 112,518 | |
| | | | | | | | | | | | | | | | |
Total Investments in Securities | | | 112,518 | | | | 99,634,292 | | | | 7,229,273 | | | | 106,976,083 | |
| | |
| 112 | AB MUNICIPAL INCOME FUND II | | abfunds.com |
NOTES TO FINANCIAL STATEMENTS (continued)
| | | | | | | | | | | | | | | | |
Investments in
Securities: | | Level 1 | | | Level 2 | | | Level 3 | | | Total | |
Other Financial Instruments(a): | | | | | | | | | | | | | | | | |
Assets: | | | | | | | | | | | | | | | | |
Centrally Cleared Interest Rate Swaps | | $ | – 0 | – | | $ | 34,458 | | | $ | – 0 | – | | $ | 34,458 | (c) |
Liabilities | | | – 0 | – | | | – 0 | – | | | – 0 | – | | | – 0 | – |
| | | | | | | | | | | | | | | | |
Total(b) | | $ | 112,518 | | | $ | 99,668,750 | | | $ | 7,229,273 | | | $ | 107,010,541 | |
| | | | | | | | | | | | | | | | |
| | | | | | | | | | | | | | | | |
| AB Ohio Portfolio | | | | |
Investments in
Securities: | | Level 1 | | | Level 2 | | | Level 3 | | | Total | |
Assets: | | | | | | | | | | | | | | | | |
Long-Term Municipal Bonds | | $ | – 0 | – | | $ | 86,808,590 | | | $ | 3,362,306 | | | $ | 90,170,896 | |
Short-Term Investments | | | 287,653 | | | | – 0 | – | | | – 0 | – | | | 287,653 | |
| | | | | | | | | | | | | | | | |
Total Investments in Securities | | | 287,653 | | | | 86,808,590 | | | | 3,362,306 | | | | 90,458,549 | |
Other Financial Instruments(a) | | | – 0 | – | | | – 0 | – | | | – 0 | – | | | – 0 | – |
| | | | | | | | | | | | | | | | |
Total(b) | | $ | 287,653 | | | $ | 86,808,590 | | | $ | 3,362,306 | | | $ | 90,458,549 | |
| | | | | | | | | | | | | | | | |
| | | | | | | | | | | | | | | | |
| AB Pennsylvania Portfolio | | | | |
Investments in
Securities: | | Level 1 | | | Level 2 | | | Level 3 | | | Total | |
Assets: | | | | | | | | | | | | | | | | |
Long-Term Municipal Bonds | | $ | – 0 | – | | $ | 81,908,671 | | | $ | 4,859,378 | | | $ | 86,768,049 | |
Short-Term Municipal Notes | | | – 0 | – | | | 300,000 | | | | – 0 | – | | | 300,000 | |
Short-Term Investments | | | 4,663,527 | | | | – 0 | – | | | – 0 | – | | | 4,663,527 | |
| | | | | | | | | | | | | | | | |
Total Investments in Securities | | | 4,663,527 | | | | 82,208,671 | | | | 4,859,378 | | | | 91,731,576 | |
Other Financial Instruments(a) | | | – 0 | – | | | – 0 | – | | | – 0 | – | | | – 0 | – |
| | | | | | | | | | | | | | | | |
Total(b) | | $ | 4,663,527 | | | $ | 82,208,671 | | | $ | 4,859,378 | | | $ | 91,731,576 | |
| | | | | | | | | | | | | | | | |
| | |
| abfunds.com | | AB MUNICIPAL INCOME FUND II | 113 |
NOTES TO FINANCIAL STATEMENTS (continued)
| | | | | | | | | | | | | | | | |
| AB Virginia Portfolio | | | | |
Investments in
Securities: | | Level 1 | | | Level 2 | | | Level 3 | | | Total | |
Assets: | | | | | | | | | | | | | | | | |
Long-Term Municipal Bonds: | | | | | | | | | | | | | | | | |
Virginia | | $ | – 0 | – | | $ | 140,882,073 | | | $ | 17,921,809 | | | $ | 158,803,882 | |
New York | | | – 0 | – | | | 7,522,493 | | | | 201,816 | | | | 7,724,309 | |
North Carolina | | | – 0 | – | | | – 0 | – | | | 1,043,990 | | | | 1,043,990 | |
Ohio | | | – 0 | – | | | – 0 | – | | | 576,000 | | | | 576,000 | |
Wisconsin | | | – 0 | – | | | 1,104,110 | | | | 3,002,589 | | | | 4,106,699 | |
Other | | | – 0 | – | | | 42,543,586 | | | | – 0 | – | | | 42,543,586 | |
Short-Term Investments | | | 278,976 | | | | – 0 | – | | | – 0 | – | | | 278,976 | |
| | | | | | | | | | | | | | | | |
Total Investments in Securities | | | 278,976 | | | | 192,052,262 | | | | 22,746,204 | | | | 215,077,442 | |
Other Financial Instruments(a) | | | – 0 | – | | | – 0 | – | | | – 0 | – | | | – 0 | – |
| | | | | | | | | | | | | | | | |
Total(b) | | $ | 278,976 | | | $ | 192,052,262 | | | $ | 22,746,204 | | | $ | 215,077,442 | |
| | | | | | | | | | | | | | | | |
| (a) | Other financial instruments are derivative instruments, such as futures, forwards and swaps, which are valued at the unrealized appreciation/(depreciation) on the instrument. Other financial instruments may also include swaps with upfront premiums, options written and swaptions written which are valued at market value. |
| (b) | There were no transfers between Level 1 and Level 2 during the reporting period. |
| (c) | Only variation margin receivable/(payable) at period end is reported within the statement of assets and liabilities. This amount reflects cumulative unrealized appreciation/(depreciation) of exchange-traded derivatives as reported in the portfolio of investments. Centrally cleared swaps with upfront premiums are presented here at market value. |
| (d) | There were no transfers between any levels during the reporting period. |
The Portfolios recognize all transfers between levels of the fair value hierarchy assuming the financial instruments were transferred at the beginning of the reporting period.
The following is a reconciliation of investments in which significant unobservable inputs (Level 3) were used in determining fair value.
| | | | | | | | |
AB Arizona Portfolio | | Long-Term
Municipal Bonds | | | Total | |
Balance as of 5/31/17 | | $ | 7,781,556 | | | $ | 7,781,556 | |
Accrued discounts/(premiums) | | | (2,342 | ) | | | (2,342 | ) |
Realized gain (loss) | | | 6,297 | | | | 6,297 | |
Change in unrealized appreciation/depreciation | | | 156,548 | | | | 156,548 | |
Purchases | | | 1,651,700 | | | | 1,651,700 | |
Sales | | | (3,469,817 | ) | | | (3,469,817 | ) |
Transfers in to Level 3 | | | 571,807 | | | | 571,807 | (a) |
Transfers out of Level 3 | | | – 0 | – | | | – 0 | – |
| | | | | | | | |
Balance as of 5/31/18 | | $ | 6,695,749 | | | $ | 6,695,749 | |
| | | | | | | | |
Net change in unrealized appreciation/depreciation from investments held as of 5/31/18(b) | | $ | 165,817 | | | $ | 165,817 | |
| | | | | | | | |
| | |
| 114 | AB MUNICIPAL INCOME FUND II | | abfunds.com |
NOTES TO FINANCIAL STATEMENTS (continued)
| | | | | | | | |
AB Massachusetts Portfolio | | Long-Term
Municipal Bonds | | | Total | |
Balance as of 5/31/17 | | $ | 3,381,185 | | | $ | 3,381,185 | |
Accrued discounts/(premiums) | | | (4,046 | ) | | | (4,046 | ) |
Realized gain (loss) | | | 94,127 | | | | 94,127 | |
Change in unrealized appreciation/depreciation | | | (120,814 | ) | | | (120,814 | ) |
Purchases | | | – 0 | – | | | – 0 | – |
Sales | | | (1,934,791 | ) | | | (1,934,791 | ) |
Transfers in to Level 3 | | | 561,726 | | | | 561,726 | (a) |
Transfers out of Level 3 | | | – 0 | – | | | – 0 | – |
| | | | | | | | |
Balance as of 5/31/18 | | $ | 1,977,387 | | | $ | 1,977,387 | |
| | | | | | | | |
Net change in unrealized appreciation/depreciation from investments held as of 5/31/18(b) | | $ | 28,394 | | | $ | 28,394 | |
| | | | | | | | |
| | |
AB Minnesota Portfolio | | Long-Term
Municipal Bonds | | | Total | |
Balance as of 5/31/17 | | $ | 1,157,145 | | | $ | 1,157,145 | |
Accrued discounts/(premiums) | | | (4,248 | ) | | | (4,248 | ) |
Realized gain (loss) | | | 9,895 | | | | 9,895 | |
Change in unrealized appreciation/depreciation | | | (53,482 | ) | | | (53,482 | ) |
Purchases | | | – 0 | – | | | – 0 | – |
Sales | | | (469,835 | ) | | | (469,835 | ) |
Transfers in to Level 3 | | | – 0 | – | | | – 0 | – |
Transfers out of Level 3 | | | – 0 | – | | | – 0 | – |
| | | | | | | | |
Balance as of 5/31/18 | | $ | 639,475 | | | $ | 639,475 | |
| | | | | | | | |
Net change in unrealized appreciation/depreciation from investments held as of 5/31/18(b) | | $ | (32,853 | ) | | $ | (32,853 | ) |
| | | | | | | | |
| | |
AB New Jersey Portfolio | | Long-Term
Municipal Bonds | | | Total | |
Balance as of 5/31/17 | | $ | 2,222,132 | | | $ | 2,222,132 | |
Accrued discounts/(premiums) | | | (14,276 | ) | | | (14,276 | ) |
Realized gain (loss) | | | 52,643 | | | | 52,643 | |
Change in unrealized appreciation/depreciation | | | 116,030 | | | | 116,030 | |
Purchases | | | 3,588,112 | | | | 3,588,112 | |
Sales | | | (805,179 | ) | | | (805,179 | ) |
Transfers in to Level 3 | | | 2,069,811 | | | | 2,069,811 | (c) |
Transfers out of Level 3 | | | – 0 | – | | | – 0 | – |
| | | | | | | | |
Balance as of 5/31/18 | | $ | 7,229,273 | | | $ | 7,229,273 | |
| | | | | | | | |
Net change in unrealized appreciation/depreciation from investments held as of 5/31/18(b) | | $ | 179,177 | | | $ | 179,177 | |
| | | | | | | | |
| | |
| abfunds.com | | AB MUNICIPAL INCOME FUND II | 115 |
NOTES TO FINANCIAL STATEMENTS (continued)
| | | | | | | | |
AB Ohio Portfolio | | Long-Term
Municipal Bonds | | | Total | |
Balance as of 5/31/17 | | $ | 2,156,355 | | | $ | 2,156,355 | |
Accrued discounts/(premiums) | | | (3,991 | ) | | | (3,991 | ) |
Realized gain (loss) | | | 11,552 | | | | 11,552 | |
Change in unrealized appreciation/depreciation | | | 58,864 | | | | 58,864 | |
Purchases | | | 856,188 | | | | 856,188 | |
Sales | | | (11,552 | ) | | | (11,552 | ) |
Transfers in to Level 3 | | | 294,890 | | | | 294,890 | (a) |
Transfers out of Level 3 | | | – 0 | – | | | – 0 | – |
| | | | | | | | |
Balance as of 5/31/18 | | $ | 3,362,306 | | | $ | 3,362,306 | |
| | | | | | | | |
Net change in unrealized appreciation/depreciation from investments held as of 5/31/18(b) | | $ | 64,253 | | | $ | 64,253 | |
| | | | | | | | |
| | |
AB Pennsylvania Portfolio | | Long-Term
Municipal Bonds | | | Total | |
Balance as of 5/31/17 | | $ | 3,933,758 | | | $ | 3,933,758 | |
Accrued discounts/(premiums) | | | (455 | ) | | | (455 | ) |
Realized gain (loss) | | | – 0 | – | | | – 0 | – |
Change in unrealized appreciation/depreciation | | | (40,768 | ) | | | (40,768 | ) |
Purchases | | | 578,312 | | | | 578,312 | |
Sales | | | – 0 | – | | | – 0 | – |
Transfers in to Level 3 | | | 388,531 | | | | 388,531 | (a) |
Transfers out of Level 3 | | | – 0 | – | | | – 0 | – |
| | | | | | | | |
Balance as of 5/31/18 | | $ | 4,859,378 | | | $ | 4,859,378 | |
| | | | | | | | |
Net change in unrealized appreciation/depreciation from investments held as of 5/31/18(b) | | $ | (40,768 | ) | | $ | (40,768 | ) |
| | | | | | | | |
| | |
AB Virginia Portfolio | | Long-Term
Municipal Bonds | | | Total | |
Balance as of 5/31/17 | | $ | 18,884,085 | | | $ | 18,884,085 | |
Accrued discounts/(premiums) | | | (148,453 | ) | | | (148,453 | ) |
Realized gain (loss) | | | – 0 | – | | | – 0 | – |
Change in unrealized appreciation/depreciation | | | (216,842 | ) | | | (216,842 | ) |
Purchases | | | 3,665,688 | | | | 3,665,688 | |
Sales | | | – 0 | – | | | – 0 | – |
Transfers in to Level 3 | | | 561,726 | | | | 561,726 | (a) |
Transfers out of Level 3 | | | – 0 | – | | | – 0 | – |
| | | | | | | | |
Balance as of 5/31/18 | | $ | 22,746,204 | | | $ | 22,746,204 | |
| | | | | | | | |
Net change in unrealized appreciation/depreciation from investments held as of 5/31/18(b) | | $ | (216,842 | ) | | $ | (216,842 | ) |
| | | | | | | | |
| (a) | There were de minimis transfers under 1% of net assets during the reporting period. |
| (b) | The unrealized appreciation/depreciation is included in net change in unrealized appreciation/depreciation on investments and other financial instruments in the accompanying statement of operations. |
| (c) | An amount of $2,069,811 was transferred out of Level 2 into Level 3 as these securities were not rated by third party vendor during the reporting period. |
| | |
| 116 | AB MUNICIPAL INCOME FUND II | | abfunds.com |
NOTES TO FINANCIAL STATEMENTS (continued)
As of May 31, 2018, all Level 3 securities were priced by third party vendors.
The Adviser established the Committee to oversee the pricing and valuation of all securities held in the Portfolios. The Committee operates under pricing and valuation policies and procedures established by the Adviser and approved by the Board, including pricing policies which set forth the mechanisms and processes to be employed on a daily basis to implement these policies and procedures. In particular, the pricing policies describe how to determine market quotations for securities and other instruments. The Committee’s responsibilities include: 1) fair value and liquidity determinations (and oversight of any third parties to whom any responsibility for fair value and liquidity determinations is delegated), and 2) regular monitoring of the Adviser’s pricing and valuation policies and procedures and modification or enhancement of these policies and procedures (or recommendation of the modification of these policies and procedures) as the Committee believes appropriate.
The Committee is also responsible for monitoring the implementation of the pricing policies by the Adviser’s Pricing Group (the “Pricing Group”) and any third party which performs certain pricing functions in accordance with the pricing policies. The Pricing Group is responsible for the oversight of the third party on a day-to-day basis. The Committee and the Pricing Group perform a series of activities to provide reasonable assurance of the accuracy of prices including: 1) periodic vendor due diligence meetings, review of methodologies, new developments and processes at vendors, 2) daily comparison of security valuation versus prior day for all securities that exceeded established thresholds, and 3) daily review of unpriced, stale, and variance reports with exceptions reviewed by senior management and the Committee.
In addition, several processes outside of the pricing process are used to monitor valuation issues including: 1) performance and performance attribution reports are monitored for anomalous impacts based upon benchmark performance, and 2) portfolio managers review all portfolios for performance and analytics (which are generated using the Adviser’s prices).
3. Taxes
It is each Portfolio’s policy to meet the requirements of the Internal Revenue Code applicable to regulated investment companies and to distribute all of its investment company taxable income and net realized gains, if any, to shareholders. Therefore, no provisions for federal income or excise taxes are required.
In accordance with U.S. GAAP requirements regarding accounting for uncertainties in income taxes, management has analyzed the Portfolio’s
| | |
| abfunds.com | | AB MUNICIPAL INCOME FUND II | 117 |
NOTES TO FINANCIAL STATEMENTS (continued)
tax positions taken or expected to be taken on federal and state income tax returns for all open tax years (the current and the prior three tax years) and has concluded that no provision for income tax is required in the Portfolio’s financial statements.
4. Investment Income and Investment Transactions
Dividend income is recorded on the ex-dividend date or as soon as the Portfolio is informed of the dividend. Interest income is accrued daily. Investment transactions are accounted for on the date the securities are purchased or sold. Each Portfolio may buy and sell securities from other affiliated funds in accordance with the requirements of Rule 17a-7 of the Investment Company Act of 1940. Each Portfolio has adopted procedures to ensure that all such transactions are done in accordance with the requirements of Rule 17a-7. During the year ended May 31, 2018, the Portfolios did not engage in such transactions. Investment gains or losses are determined on the identified cost basis. The Portfolios amortize premiums and accrete original issue and market discounts as adjustments to interest income.
5. Class Allocations
All income earned and expenses incurred by the Portfolios are borne on a pro-rata basis by each settled class of shares, based on the proportionate interest in each Portfolio represented by the net assets of such class, except for class specific expenses which are allocated to the respective class. Expenses of the Fund are charged proportionately to the portfolio or based on other appropriate methods. Realized and unrealized gains and losses are allocated among the various share classes based on respective net assets.
6. Dividends and Distributions
Dividends and distributions to shareholders, if any, are recorded on the ex-dividend date. Income dividends and capital gains distributions are determined in accordance with federal tax regulations and may differ from those determined in accordance with U.S. GAAP. To the extent these differences are permanent, such amounts are reclassified within the capital accounts based on their federal tax basis treatment; temporary differences do not require such reclassification.
NOTE B
Advisory Fee and Other Transactions with Affiliates
Under the terms of the investment advisory agreement, each Portfolio pays the Adviser an advisory fee at an annual rate of .45% of the first $2.5 billion, .40% of the next $2.5 billion and .35% in excess of $5 billion, of each Portfolio’s average daily net assets. Such fee is accrued daily and paid monthly.
| | |
| 118 | AB MUNICIPAL INCOME FUND II | | abfunds.com |
NOTES TO FINANCIAL STATEMENTS (continued)
The Adviser has agreed to waive its fees and bear certain expenses to the extent necessary to limit the total portfolio operating expenses as a percentage of daily average net assets on an annual basis (the “Expense Caps”) as follows:
| | | | | | | | | | | | |
| | | Effective January 30, 2015 | |
| Portfolio | | Class A | | | Class B | | | Class C | |
AB Arizona | | | .78 | % | | | 1.53 | % | | | 1.53 | % |
AB Massachusetts | | | .77 | % | | | 1.52 | % | | | 1.52 | % |
AB Minnesota | | | .85 | % | | | 1.60 | % | | | 1.60 | % |
AB New Jersey | | | .82 | % | | | 1.57 | % | | | 1.57 | % |
AB Ohio | | | .80 | % | | | 1.55 | % | | | 1.55 | % |
AB Pennsylvania | | | .85 | % | | | 1.60 | % | | | 1.60 | % |
AB Virginia | | | .80 | % | | | 1.55 | % | | | 1.55 | % |
| | | | |
| | | Effective July 25, 2016 | |
| Portfolio | | Advisor Class | |
AB Massachusetts | | | .52 | % |
AB Virginia | | | .55 | % |
The Expense Caps will extend through September 29, 2018 and then may be extended by the Adviser for additional one year terms. For the year ended May 31, 2018, such reimbursements/waivers amounted to $250,345, $256,222, $232,539, $216,840, $250,418, $207,968 and $190,098 for AB Arizona Portfolio, AB Massachusetts Portfolio, AB Minnesota Portfolio, AB New Jersey Portfolio, AB Ohio Portfolio, AB Pennsylvania Portfolio and AB Virginia Portfolio, respectively.
Pursuant to the investment advisory agreement, each Portfolio may reimburse the Adviser for certain legal and accounting services provided to each Portfolio by the Adviser. For the year ended May 31, 2018, the reimbursement for such services amounted to $74,256, $73,209, $72,875, $74,620, $74,915, $73,786 and $73,877 for AB Arizona Portfolio, AB Massachusetts Portfolio, AB Minnesota Portfolio, AB New Jersey Portfolio, AB Ohio Portfolio, AB Pennsylvania Portfolio and AB Virginia Portfolio, respectively.
During the year ended May 31, 2017, the Adviser reimbursed the AB Ohio Portfolio $249 for trading losses incurred due to a trade entry error.
The Portfolios compensate AllianceBernstein Investor Services, Inc. (“ABIS”), a wholly-owned subsidiary of the Adviser, under a Transfer Agency Agreement for providing personnel and facilities to perform transfer agency services for the Portfolios. ABIS may make payments to intermediaries that provide omnibus account services, sub-accounting services and/or networking services. For the year ended May 31, 2018, such compensation
| | |
| abfunds.com | | AB MUNICIPAL INCOME FUND II | 119 |
NOTES TO FINANCIAL STATEMENTS (continued)
retained by ABIS amounted to: $18,018, $29,342, $18,083, $18,367, $17,981, $18,948 and $27,656 for AB Arizona Portfolio, AB Massachusetts Portfolio, AB Minnesota Portfolio, AB New Jersey Portfolio, AB Ohio Portfolio, AB Pennsylvania Portfolio and AB Virginia Portfolio, respectively.
AllianceBernstein Investments, Inc. (the “Distributor”), a wholly-owned subsidiary of the Adviser, serves as the distributor of the Portfolio’s shares. The Distributor has advised the Portfolios that it has retained front-end sales charges from the sale of Class A shares and received contingent deferred sales charges imposed upon redemptions by shareholders of Class A, Class B and Class C shares for each Portfolio for the year ended May 31, 2018 as follows:
| | | | | | | | | | | | | | | | |
| | | Front-End Sales
Charges | | | Contingent Deferred Sales
Charges | |
| Portfolio | | Class A | | | Class A | | | Class B | | | Class C | |
AB Arizona | | $ | 66 | | | $ | – 0 | – | | $ | – 0 | – | | $ | 1,060 | |
AB Massachusetts | | | – 0 | – | | | 2,904 | | | | – 0 | – | | | 1,719 | |
AB Minnesota | | | – 0 | – | | | – 0 | – | | | 15 | | | | 603 | |
AB New Jersey | | | 160 | | | | 103 | | | | – 0 | – | | | 259 | |
AB Ohio | | | – 0 | – | | | – 0 | – | | | – 0 | – | | | 329 | |
AB Pennsylvania | | | 77 | | | | – 0 | – | | | – 0 | – | | | 278 | |
AB Virginia | | | – 0 | – | | | – 0 | – | | | – 0 | – | | | 1,883 | |
The Portfolios may invest in AB Government Money Market Portfolio (the “Government Money Market Portfolio”) which has a contractual annual advisory fee rate of .20% of the portfolio’s average daily net assets and bears its own expenses. In connection with the investment by the Portfolios in the Government Money Market Portfolio, the Adviser has contractually agreed to waive its advisory fee from the Portfolios in an amount equal to each Portfolio’s pro rata share of the effective advisory fee of Government Money Market Portfolio, as borne indirectly by the Portfolios as an acquired fund fee and expense. For the year ended May 31, 2018 such waiver amounted to:
| | | | | | | | | | |
| Portfolio | | Amount | | | Portfolio | | Amount | |
AB Arizona | | $ | 2,163 | | | AB Ohio | | $ | 1,282 | |
AB Massachusetts | | | 1,079 | | | AB Pennsylvania | | | 1,865 | |
AB Minnesota | | | 699 | | | AB Virginia | | | 1,227 | |
AB New Jersey | | | 1,098 | | | | | | | |
| | |
| 120 | AB MUNICIPAL INCOME FUND II | | abfunds.com |
NOTES TO FINANCIAL STATEMENTS (continued)
A summary of the Portfolio’s transactions in the Government Money Market Portfolio for the year ended May 31, 2018 is as follows:
| | | | | | | | | | | | | | | | | | | | |
| Portfolio | | Market
Value
5/31/17
(000) | | | Purchases at Cost
(000) | | | Sales
Proceeds
(000) | | | Market
Value
5/31/18
(000) | | | Dividend Income
(000) | |
AB Arizona | | $ | 803 | | | $ | 21,956 | | | $ | 22,522 | | | $ | 237 | | | $ | 11 | |
AB Massachusetts | | | – 0 | – | | | 22,825 | | | | 21,962 | | | | 863 | | | | 6 | |
AB Minnesota | | | – 0 | – | | | 13,398 | | | | 12,678 | | | | 720 | | | | 4 | |
AB New Jersey | | | – 0 | – | | | 22,136 | | | | 22,023 | | | | 113 | | | | 6 | |
AB Ohio | | | 793 | | | | 17,604 | | | | 18,109 | | | | 288 | | | | 6 | |
AB Pennsylvania | | | – 0 | – | | | 30,217 | | | | 25,553 | | | | 4,664 | | | | 12 | |
AB Virginia | | | 539 | | | | 27,055 | | | | 27,315 | | | | 279 | | | | 6 | |
NOTE C
Distribution Services Agreement
The Portfolios have adopted a Distribution Services Agreement (the “Agreement”) pursuant to Rule 12b-1 under the Investment Company Act of 1940. Under the Agreement, the Portfolios pay distribution and servicing fees to the Distributor at an annual rate of up to .30% of the Portfolio’s average daily net assets attributable to Class A shares and 1% of the Portfolio’s average daily net assets attributable to both Class B and Class C shares. Effective January 30, 2015, payments under the Agreement in respect of Class A shares are limited to an annual rate of .25% of Class A shares’ average daily net assets. There are no distribution and servicing fees on the Advisor Class shares. The fees are accrued daily and paid monthly. The Agreement provides that the Distributor will use such payments in their entirety for distribution assistance and promotional activities. Since the commencement of the Portfolio’s operations, the distributor has incurred expenses in excess of the distribution costs reimbursed by each Portfolio as follows:
| | | | | | | | |
| Portfolio | | Class B | | | Class C | |
AB Arizona | | $ | 3,375,435 | | | $ | 2,266,443 | |
AB Massachusetts | | | 3,327,716 | | | | 4,110,446 | |
AB Minnesota | | | 2,638,787 | | | | 2,873,666 | |
AB New Jersey | | | 5,234,790 | | | | 3,823,799 | |
AB Ohio | | | 4,270,908 | | | | 4,086,688 | |
AB Pennsylvania | | | 3,518,632 | | | | 3,598,674 | |
AB Virginia | | | 3,533,946 | | | | 3,477,129 | |
While such costs may be recovered from the Portfolios in future periods so long as the Agreement is in effect, the rate of the distribution and servicing fees payable under the Agreement may not be increased without a shareholder vote. In accordance with the Agreement, there is no provision for recovery of unreimbursed distribution costs incurred by the Distributor beyond the current fiscal year for Class A shares. The Agreement also provides that the Adviser may use its own resources to finance the distribution of the Portfolio’s shares.
| | |
| abfunds.com | | AB MUNICIPAL INCOME FUND II | 121 |
NOTES TO FINANCIAL STATEMENTS (continued)
NOTE D
Investment Transactions
Purchases and sales of investment securities (excluding short-term investments) for the year ended May 31, 2018, were as follows:
| | | | | | | | | | | | | | | | |
| | | Purchases | | | Sales | |
| Portfolio | | Investments | | | Government
Securities | | | Investments | | | Government
Securities | |
AB Arizona | | $ | 13,902,722 | | | $ | – 0 | – | | $ | 16,729,936 | | | $ | – 0 | – |
AB Massachusetts | | | 44,723,803 | | | | – 0 | – | | | 58,824,646 | | | | – 0 | – |
AB Minnesota | | | 11,814,633 | | | | – 0 | – | | | 19,458,814 | | | | – 0 | – |
AB New Jersey | | | 28,041,179 | | | | – 0 | – | | | 27,906,447 | | | | – 0 | – |
AB Ohio | | | 10,654,404 | | | | – 0 | – | | | 12,275,874 | | | | – 0 | – |
AB Pennsylvania | | | 33,766,039 | | | | – 0 | – | | | 37,660,055 | | | | – 0 | – |
AB Virginia | | | 40,874,397 | | | | – 0 | – | | | 47,043,442 | | | | – 0 | – |
The cost of investments for federal income tax purposes, gross unrealized appreciation and unrealized depreciation are as follows:
| | | | | | | | | | | | | | | | |
| | | | | | Gross Unrealized | | | Net
Unrealized
Appreciation | |
Portfolio | | Cost | | | Appreciation | | | (Depreciation) | |
AB Arizona | | $ | 113,627,958 | | | $ | 3,443,972 | | | $ | (291,477 | ) | | $ | 3,152,495 | |
AB Massachusetts | | | 218,857,795 | | | | 8,688,492 | | | | (479,533 | ) | | | 8,208,959 | |
AB Minnesota | | | 66,986,097 | | | | 2,430,171 | | | | (63,057 | ) | | | 2,367,114 | |
AB New Jersey | | | 101,753,496 | | | | 5,411,253 | | | | (154,208 | ) | | | 5,257,045 | |
AB Ohio | | | 87,230,443 | | | | 3,483,752 | | | | (255,646 | ) | | | 3,228,106 | |
AB Pennsylvania | | | 88,724,512 | | | | 3,337,273 | | | | (330,209 | ) | | | 3,007,064 | |
AB Virginia | | | 207,673,776 | | | | 7,930,039 | | | | (526,373 | ) | | | 7,403,666 | |
1. Derivative Financial Instruments
Each Portfolio may use derivatives in an effort to earn income and enhance returns, to replace more traditional direct investments, to obtain exposure to otherwise inaccessible markets (collectively, “investment purposes”), or to hedge or adjust the risk profile of its portfolio.
The principal type of derivative utilized by the Portfolios, as well as the methods in which they may be used are:
Each Portfolio may enter into swaps to hedge its exposure to interest rates or credit risk. A swap is an agreement that obligates two parties to exchange a series of cash flows at specified intervals based upon or calculated by reference to changes in specified prices or rates for a specified amount of an underlying asset. The payment flows are usually netted against each other, with the difference being paid by one party to the other. In addition, collateral may be pledged or received by the Portfolios in accordance with the terms of the respective swaps to provide value and recourse to the Portfolios or their counterparties in the event of default, bankruptcy or insolvency by one of the parties to the swap.
| | |
| 122 | AB MUNICIPAL INCOME FUND II | | abfunds.com |
NOTES TO FINANCIAL STATEMENTS (continued)
Risks may arise as a result of the failure of the counterparty to the swap to comply with the terms of the swap. The loss incurred by the failure of a counterparty is generally limited to the net interim payment to be received by the Portfolio, and/or the termination value at the end of the contract. Therefore, the Portfolio considers the creditworthiness of each counterparty to a swap in evaluating potential counterparty risk. This risk is mitigated by having a netting arrangement between the Portfolio and the counterparty and by the posting of collateral by the counterparty to the Portfolio to cover the Portfolio’s exposure to the counterparty. Additionally, risks may arise from unanticipated movements in interest rates or in the value of the underlying securities. The Portfolio accrues for the interim payments on swaps on a daily basis, with the net amount recorded within unrealized appreciation/depreciation of swaps on the statement of assets and liabilities, where applicable. Once the interim payments are settled in cash, the net amount is recorded as realized gain/(loss) on swaps on the statement of operations, in addition to any realized gain/(loss) recorded upon the termination of swaps. Upfront premiums paid or received are recognized as cost or proceeds on the statement of assets and liabilities and are amortized on a straight line basis over the life of the contract. Amortized upfront premiums are included in net realized gain/(loss) from swaps on the statement of operations. Fluctuations in the value of swaps are recorded as a component of net change in unrealized appreciation/depreciation of swaps on the statement of operations.
Certain standardized swaps, including certain interest rate swaps and credit default swaps, are (or soon will be) subject to mandatory central clearing. Cleared swaps are transacted through futures commission merchants (“FCMs”) that are members of central clearinghouses, with the clearinghouse serving as central counterparty, similar to transactions in futures contracts. Centralized clearing will be required for additional categories of swaps on a phased-in basis based on requirements published by the Securities and Exchange Commission and Commodity Futures Trading Commission.
At the time the Portfolios enters into a centrally cleared swap, each Portfolio deposits and maintains as collateral an initial margin with the broker, as required by the clearinghouse on which the transaction is effected. Such amount is shown as cash collateral due from broker on the statement of assets and liabilities. Pursuant to the contract, the Portfolios agree to receive from or pay to the broker an amount of cash equal to the daily fluctuation in the value of the contract. Such receipts or payments are known as variation margin and are recorded by the Portfolios as unrealized gains or losses. Risks may arise from the potential inability of a counterparty to meet the terms of the
| | |
| abfunds.com | | AB MUNICIPAL INCOME FUND II | 123 |
NOTES TO FINANCIAL STATEMENTS (continued)
contract. The credit/counterparty risk for centrally cleared swaps is generally less than non-centrally cleared swaps, since the clearinghouse, which is the issuer or counterparty to each centrally cleared swap, has robust risk mitigation standards, including the requirement to provide initial and variation margin. When the contract is closed, the Portfolios record a realized gain or loss equal to the difference between the value of the contract at the time it was opened and the time it was closed.
Interest Rate Swaps:
Each Portfolio is subject to interest rate risk exposure in the normal course of pursuing its investment objectives. Because the Portfolios hold fixed rate bonds, the value of these bonds may decrease if interest rates rise. To help hedge against this risk and to maintain its ability to generate income at prevailing market rates, the Portfolios may enter into interest rate swaps. Interest rate swaps are agreements between two parties to exchange cash flows based on a notional amount. The Portfolios may elect to pay a fixed rate and receive a floating rate, or, receive a fixed rate and pay a floating rate on a notional amount.
In addition, the Portfolios may also enter into interest rate swap transactions to preserve a return or spread on a particular investment or portion of its portfolio, or protecting against an increase in the price of securities the Portfolios anticipate purchasing at a later date. Interest rate swaps involve the exchange by a Portfolio with another party of their respective commitments to pay or receive interest (e.g., an exchange of floating rate payments for fixed rate payments) computed based on a contractually-based principal (or “notional”) amount. Interest rate swaps are entered into on a net basis (i.e., the two payment streams are netted out, with the Portfolios receiving or paying, as the case may be, only the net amount of the two payments).
During the year ended May 31, 2018, AB Massachusetts Portfolio held interest rate swaps for hedging and non-hedging purposes, the other Portfolios held interest rate swaps for hedging purposes.
The Portfolios typically enter into International Swaps and Derivatives Association, Inc. Master Agreements (“ISDA Master Agreement”) with its OTC derivative contract counterparties in order to, among other things, reduce its credit risk to OTC counterparties. ISDA Master Agreements include provisions for general obligations, representations, collateral and events of default or termination. Under an ISDA Master Agreement, the Portfolios typically may offset with the OTC counterparty certain derivative financial instruments’ payables and/or receivables with collateral held and/or posted and create one single net payment (close-out netting) in the
| | |
| 124 | AB MUNICIPAL INCOME FUND II | | abfunds.com |
NOTES TO FINANCIAL STATEMENTS (continued)
event of default or termination. In the event of a default by an OTC counterparty, the return of collateral with market value in excess of the Portfolio’s net liability, held by the defaulting party, may be delayed or denied.
The Portfolio’s ISDA Master Agreements may contain provisions for early termination of OTC derivative transactions in the event the net assets of the Portfolios decline below specific levels (“net asset contingent features”). If these levels are triggered, the Portfolio’s OTC counterparty has the right to terminate such transaction and require the Portfolios to pay or receive a settlement amount in connection with the terminated transaction. If OTC derivatives were held at period end, please refer to netting arrangements by the OTC counterparty table below for additional details.
During the year ended May 31, 2018, the Portfolios had entered into the following derivatives:
| | | | | | | | | | |
| AB Arizona Portfolio | | | | | | | | |
Derivative Type | | Location of Gain or (Loss) on Derivatives Within Statement of Operations | | Realized Gain
or (Loss) on
Derivatives | | | Change in
Unrealized
Appreciation or
(Depreciation) | |
Interest rate contracts | | Net realized gain (loss) on swaps; Net change in unrealized appreciation/depreciation of swaps | | $ | (165,231 | ) | | $ | 19,218 | |
| | | | | | | | | | |
Total | | | | $ | (165,231 | ) | | $ | 19,218 | |
| | | | | | | | | | |
| | | | | | | | | | | | |
| AB Massachusetts Portfolio | | | | | | | | |
| | | Asset Derivatives | | | Liability Derivatives | |
| Derivative Type | | Statement of Assets and Liabilities Location | | Fair Value | | | Statement of Assets and Liabilities Location | | Fair Value | |
Interest rate contracts | | Receivable/Payable for variation margin on centrally cleared swaps | | $ | 832,296 | * | | Receivable/Payable for variation margin on centrally cleared swaps | | $ | 115,993 | * |
| | | | | | | | | | | | |
Total | | | | $ | 832,296 | | | | | $ | 115,993 | |
| | | | | | | | | | | | |
| * | Only variation margin receivable/payable at period end is reported within the statement of assets and liabilities. This amount reflects cumulative unrealized appreciation/(depreciation) on futures and centrally cleared swaps as reported in the portfolio of investments. |
| | |
| abfunds.com | | AB MUNICIPAL INCOME FUND II | 125 |
NOTES TO FINANCIAL STATEMENTS (continued)
| | | | | | | | | | |
Derivative Type | | Location of Gain or (Loss) on Derivatives Within Statement of Operations | | Realized Gain
or (Loss) on
Derivatives | | | Change in
Unrealized
Appreciation or
(Depreciation) | |
Interest rate contracts | | Net realized gain (loss) on swaps; Net change in unrealized appreciation/depreciation of swaps | | $ | (773,339 | ) | | $ | 526,924 | |
| | | | | | | | | | |
Total | | | | $ | (773,339 | ) | | $ | 526,924 | |
| | | | | | | | | | |
| | | | | | | | | | | | |
| AB Minnesota Portfolio | | | | | | | | |
| | | Asset Derivatives | | | Liability Derivatives | |
| Derivative Type | | Statement of Assets and Liabilities Location | | Fair Value | | | Statement of Assets and Liabilities Location | | Fair Value | |
Interest rate contracts | | Receivable/Payable for variation margin on centrally cleared swaps | | $ | 25,986 | * | | | | | | |
| | | | | | | | | | | | |
Total | | | | $ | 25,986 | | | | | | | |
| | | | | | | | | | | | |
| * | Only variation margin receivable/payable at period end is reported within the statement of assets and liabilities. This amount reflects cumulative unrealized appreciation/(depreciation) on futures and centrally cleared swaps as reported in the portfolio of investments. |
| | | | | | | | | | |
Derivative Type | | Location of Gain or (Loss) on Derivatives Within Statement of Operations | | Realized Gain
or (Loss) on
Derivatives | | | Change in
Unrealized
Appreciation or
(Depreciation) | |
Interest rate contracts | | Net realized gain (loss) on swaps; Net change in unrealized appreciation/depreciation of swaps | | $ | (53,813 | ) | | $ | (54,478 | ) |
| | | | | | | | | | |
Total | | | | $ | (53,813 | ) | | $ | (54,478 | ) |
| | | | | | | | | | |
| | |
| 126 | AB MUNICIPAL INCOME FUND II | | abfunds.com |
NOTES TO FINANCIAL STATEMENTS (continued)
| | | | | | | | | | | | |
| AB New Jersey Portfolio | | | | | | | | |
| | | Asset Derivatives | | | Liability Derivatives | |
| Derivative Type | | Statement of Assets and Liabilities Location | | Fair Value | | | Statement of Assets and Liabilities
Location | | Fair Value | |
Interest rate contracts | | Receivable/Payable for variation margin on centrally cleared swaps | | $ | 34,458 | * | | | | | | |
| | | | | | | | | | | | |
Total | | | | $ | 34,458 | | | | | | | |
| | | | | | | | | | | | |
| * | Only variation margin receivable/payable at period end is reported within the statement of assets and liabilities. This amount reflects cumulative unrealized appreciation/(depreciation) on futures and centrally cleared swaps as reported in the portfolio of investments. |
| | | | | | | | | | |
Derivative Type | | Location of Gain or (Loss) on Derivatives Within Statement of Operations | | Realized Gain
or (Loss) on
Derivatives | | | Change in
Unrealized
Appreciation or
(Depreciation) | |
Interest rate contracts | | Net realized gain (loss) on swaps; Net change in unrealized appreciation/depreciation of swaps | | $ | (195,230 | ) | | $ | 85,587 | |
| | | | | | | | | | |
Total | | | | $ | (195,230 | ) | | $ | 85,587 | |
| | | | | | | | | | |
| | |
| AB Ohio Portfolio | | | | | | |
Derivative Type | | Location of Gain or (Loss) on Derivatives Within Statement of Operations | | Realized Gain
or (Loss) on
Derivatives | | | Change in
Unrealized
Appreciation or
(Depreciation) | |
Interest rate contracts | | Net realized gain (loss) on swaps; Net change in unrealized appreciation/depreciation of swaps | | $ | (94,690 | ) | | $ | 91,140 | |
| | | | | | | | | | |
Total | | | | $ | (94,690 | ) | | $ | 91,140 | |
| | | | | | | | | | |
| | |
| abfunds.com | | AB MUNICIPAL INCOME FUND II | 127 |
NOTES TO FINANCIAL STATEMENTS (continued)
| | | | | | | | | | |
| AB Pennsylvania Portfolio | | | | | | |
Derivative Type | | Location of Gain or (Loss) on Derivatives Within Statement of Operations | | Realized Gain
or (Loss) on
Derivatives | | | Change in
Unrealized
Appreciation or
(Depreciation) | |
Interest rate contracts | | Net realized gain (loss) on swaps; Net change in unrealized appreciation/depreciation of swaps | | $ | 24,519 | | | $ | (15,738 | ) |
| | | | | | | | | | |
Total | | | | $ | 24,519 | | | $ | (15,738 | ) |
| | | | | | | | | | |
| | |
| AB Virginia Portfolio | | | | | | |
Derivative Type | | Location of Gain or (Loss) on Derivatives Within Statement of Operations | | Realized Gain
or (Loss) on
Derivatives | | | Change in
Unrealized
Appreciation or
(Depreciation) | |
Interest rate contracts | | Net realized gain (loss) on swaps; Net change in unrealized appreciation/depreciation of swaps | | $ | (74,917 | ) | | $ | (48,550 | ) |
| | | | | | | | | | |
Total | | | | $ | (74,917 | ) | | $ | (48,550 | ) |
| | | | | | | | | | |
The following tables represent the average monthly volume of the Portfolio’s derivative transactions during the year ended May 31, 2018:
| | | | |
AB Arizona Portfolio | | | | |
Centrally Cleared Interest Rate Swaps: | | | | |
Average notional amount | | $ | 5,066,667 | (a) |
| (a) | Positions were open for eight months during the year. |
| | | | |
AB Massachusetts Portfolio | | | | |
Interest Rate Swaps: | | | | |
Average notional amount | | $ | 8,000,000 | (a) |
Centrally Cleared Interest Rate Swaps: | | | | |
Average notional amount | | $ | 30,170,769 | |
| (a) | Positions were open for six months during the year. |
| | | | |
AB Minnesota Portfolio | | | | |
Centrally Cleared Interest Rate Swaps: | | | | |
Average notional amount | | $ | 6,033,333 | (a) |
| (a) | Positions were open for eleven months during the year. |
| | | | |
AB New Jersey Portfolio | | | | |
Centrally Cleared Interest Rate Swaps: | | | | |
Average notional amount | | $ | 4,952,500 | (a) |
| (a) | Positions were open for eleven months during the year. |
| | |
| 128 | AB MUNICIPAL INCOME FUND II | | abfunds.com |
NOTES TO FINANCIAL STATEMENTS (continued)
| | | | |
AB Ohio Portfolio | | | | |
Centrally Cleared Interest Rate Swaps: | | | | |
Average notional amount | | $ | 7,763,333 | (a) |
| (a) | Positions were open for eight months during the year. |
| | | | |
AB Pennsylvania Portfolio | | | | |
Centrally Cleared Interest Rate Swaps: | | | | |
Average notional amount | | $ | 6,177,500 | (a) |
| (a) | Positions were open for three months during the year. |
| | | | |
AB Virginia Portfolio | | | | |
Interest Rate Swaps: | | | | |
Average notional amount | | $ | 7,000,000 | (a) |
Centrally Cleared Interest Rate Swaps: | | | | |
Average notional amount | | $ | 4,838,889 | (b) |
| (a) | Positions were open for six months during the year. |
| (b) | Positions were open for eight months during the year. |
NOTE E
Shares of Beneficial Interest
Transactions in shares of beneficial interest for each Portfolio were as follows:
| | | | | | | | | | | | | | | | | | | | | | | | |
| | | | | | | | | | | | | | | | | | | | | | | | |
| | | AB Arizona Portfolio | | | | |
| | | Shares | | | | | | Amount | | | | |
| | | Year Ended
May 31,
2018 | | | Year Ended
May 31, 2017 | | | | | | Year Ended
May 31, 2018 | | | Year Ended
May 31, 2017 | | | | |
| | | | | | | | |
| Class A | | | | | | | | | | | | | | | | | | | | | | | | |
Shares sold | | | 1,562,317 | | | | 1,100,025 | | | | | | | $ | 17,310,722 | | | $ | 12,311,299 | | | | | |
| | | | | |
Shares issued in reinvestment of dividends | | | 151,382 | | | | 160,453 | | | | | | | | 1,675,404 | | | | 1,792,410 | | | | | |
| | | | | |
Shares converted from Class B | | | 32,820 | | | | 700 | | | | | | | | 368,534 | | | | 7,935 | | | | | |
| | | | | |
Shares converted from Class C | | | 126,459 | | | | 307,025 | | | | | | | | 1,390,149 | | | | 3,392,629 | | | | | |
| | | | | |
Shares redeemed | | | (2,037,502 | ) | | | (1,443,203 | ) | | | | | | | (22,581,761 | ) | | | (16,046,439 | ) | | | | |
| | | | | |
Net increase (decrease) | | | (164,524 | ) | | | 125,000 | | | | | | | $ | (1,836,952 | ) | | $ | 1,457,834 | | | | | |
| | | | | |
| | | | | | | | | | | | | | | | | | | | | | | | |
| Class B | | | | | |
Shares sold | | | 54 | | | | 54 | | | | | | | $ | 600 | | | $ | 600 | | | | | |
| | | | | |
Shares issued in reinvestment of dividends | | | 28 | | | | 24 | | | | | | | | 314 | | | | 266 | | | | | |
| | | | | |
Shares converted to Class A | | | (32,850 | ) | | | (701 | ) | | | | | | | (368,534 | ) | | | (7,935 | ) | | | | |
| | | | | |
Shares redeemed | | | (13 | ) | | | (1 | ) | | | | | | | (141 | ) | | | (12 | ) | | | | |
| | | | | |
Net decrease | | | (32,781 | ) | | | (624 | ) | | | | | | $ | (367,761 | ) | | $ | (7,081 | ) | | | | |
| | | | | |
| | |
| abfunds.com | | AB MUNICIPAL INCOME FUND II | 129 |
NOTES TO FINANCIAL STATEMENTS (continued)
| | | | | | | | | | | | | | | | | | | | | | | | |
| | | | | | | | | | | | | | | | | | | | | | | | |
| | | AB Arizona Portfolio | | | | |
| | | Shares | | | | | | Amount | | | | |
| | | Year Ended
May 31,
2018 | | | Year Ended
May 31, 2017 | | | | | | Year Ended
May 31, 2018 | | | Year Ended
May 31, 2017 | | | | |
| | | | | | | | |
| Class C | | | | | | | | | | | | | | | | | | | | | | | | |
Shares sold | | | 142,487 | | | | 219,265 | | | | | | | $ | 1,580,975 | | | $ | 2,472,980 | | | | | |
| | | | | |
Shares issued in reinvestment of dividends | | | 22,086 | | | | 30,841 | | | | | | | | 244,109 | | | | 344,069 | | | | | |
| | | | | |
Shares converted to Class A | | | (126,686 | ) | | | (307,582 | ) | | | | | | | (1,390,149 | ) | | | (3,392,629 | ) | | | | |
| | | | | |
Shares redeemed | | | (301,041 | ) | | | (448,669 | ) | | | | | | | (3,325,814 | ) | | | (4,994,388 | ) | | | | |
| | | | | |
Net decrease | | | (263,154 | ) | | | (506,145 | ) | | | | | | $ | (2,890,879 | ) | | $ | (5,569,968 | ) | | | | |
| | | | | |
| | | | | | | | | | | | | | | | | | | | | | | | |
| | | | | | | | | | | | | | | | | | | | | | | | |
| | | AB Massachusetts Portfolio | | | | |
| | | Shares | | | | | | Amount | | | | |
| | | Year Ended
May 31,
2018 | | | Year Ended
May 31, 2017 | | | | | | Year Ended
May 31, 2018 | | | Year Ended
May 31, 2017 | | | | |
| | | | | | | | |
| Class A | | | | | | | | | | | | | | | | | | | | | | | | |
Shares sold | | | 1,271,728 | | | | 2,795,470 | | | | | | | $ | 14,346,720 | | | $ | 31,895,218 | | | | | |
| | | | | |
Shares issued in reinvestment of dividends and distributions | | | 243,956 | | | | 276,039 | | | | | | | | 2,738,331 | | | | 3,146,808 | | | | | |
| | | | | |
Shares converted from Class B | | | 2,622 | | | | 6,542 | | | | | | | | 29,252 | | | | 75,026 | | | | | |
| | | | | |
Shares converted from Class C | | | 303,472 | | | | 450,716 | | | | | | | | 3,418,677 | | | | 5,066,052 | | | | | |
| | | | | |
Shares redeemed | | | (3,550,971 | ) | | | (5,378,918 | ) | | | | | | | (39,914,181 | ) | | | (60,747,306 | ) | | | | |
| | | | | |
Net decrease | | | (1,729,193 | ) | | | (1,850,151 | ) | | | | | | $ | (19,381,201 | ) | | $ | (20,564,202 | ) | | | | |
| | | | | |
| | | | | | | | | | | | | | | | | | | | | | | | |
| Class B | | | | | | | | | | | | | | | | | | | | | | | | |
Shares sold | | | – 0 | – | | | 677 | | | | | | | $ | – 0 | – | | $ | 7,895 | | | | | |
| | | | | |
Shares issued in reinvestment of dividends and distributions | | | 169 | | | | 238 | | | | | | | | 1,897 | | | | 2,718 | | | | | |
| | | | | |
Shares converted to Class A | | | (2,627 | ) | | | (6,553 | ) | | | | | | | (29,252 | ) | | | (75,026 | ) | | | | |
| | | | | |
Shares redeemed | | | (1 | ) | | | 0 | (a) | | | | | | | (9 | ) | | | (3 | ) | | | | |
| | | | | |
Net decrease | | | (2,459 | ) | | | (5,638 | ) | | | | | | $ | (27,364 | ) | | $ | (64,416 | ) | | | | |
| | | | | |
| | |
| 130 | AB MUNICIPAL INCOME FUND II | | abfunds.com |
NOTES TO FINANCIAL STATEMENTS (continued)
| | | | | | | | | | | | | | | | | | | | | | | | |
| | | | | | | | | | | | | | | | | | | | | | | | |
| | | AB Massachusetts Portfolio | | | | |
| | | Shares | | | | | | Amount | | | | |
| | | Year Ended
May 31,
2018 | | | Year Ended
May 31, 2017 | | | | | | Year Ended
May 31, 2018 | | | Year Ended
May 31, 2017 | | | | |
| | | | | | | | |
| Class C | | | | | | | | | | | | | | | | | | | | | | | | |
Shares sold | | | 177,920 | | | | 440,216 | | | | | | | $ | 1,996,464 | | | $ | 5,056,751 | | | | | |
| | | | | |
Shares issued in reinvestment of dividends and distributions | | | 66,057 | | | | 81,587 | | | | | | | | 740,516 | | | | 927,854 | | | | | |
| | | | | |
Shares converted to Class A | | | (304,012 | ) | | | (451,520 | ) | | | | | | | (3,418,677 | ) | | | (5,066,052 | ) | | | | |
| | | | | |
Shares redeemed | | | (640,859 | ) | | | (751,748 | ) | | | | | | | (7,183,766 | ) | | | (8,494,892 | ) | | | | |
| | | | | |
Net decrease | | | (700,894 | ) | | | (681,465 | ) | | | | | | $ | (7,865,463 | ) | | $ | (7,576,339 | ) | | | | |
| | | | | |
| | | | | | | | | | | | | | | | | | | | | | | | |
| Advisor Class(b) | | | | | |
Shares sold | | | 2,431,044 | | | | 4,135,112 | | | | | | | $ | 27,387,756 | | | $ | 46,633,149 | | | | | |
| | | | | |
Shares issued in reinvestment of dividends and distributions | | | 68,266 | | | | 17,543 | | | | | | | | 765,470 | | | | 197,304 | | | | | |
| | | | | |
Shares redeemed | | | (1,632,050 | ) | | | (432,797 | ) | | | | | | | (18,344,933 | ) | | | (4,846,955 | ) | | | | |
| | | | | |
Net increase | | | 867,260 | | | | 3,719,858 | | | | | | | $ | 9,808,293 | | | $ | 41,983,498 | | | | | |
| | | | | |
| (a) | Amount is less than one share. |
| (b) | Commenced distribution on July 25, 2016. |
| | | | | | | | | | | | | | | | | | | | | | | | |
| | | | | | | | | | | | | | | | | | | | | | | | |
| | | AB Minnesota Portfolio | | | | |
| | | Shares | | | | | | Amount | | | | |
| | | Year Ended
May 31,
2018 | | | Year Ended
May 31, 2017 | | | | | | Year Ended
May 31, 2018 | | | Year Ended
May 31, 2017 | | | | |
| | | | | | | | |
| Class A | | | | | |
Shares sold | | | 843,369 | | | | 1,071,113 | | | | | | | $ | 8,645,246 | | | $ | 11,103,795 | | | | | |
| | | | | |
Shares issued in reinvestment of dividends | | | 124,322 | | | | 135,538 | | | | | | | | 1,269,815 | | | | 1,401,490 | | | | | |
| | | | | |
Shares converted from Class B | | | 1,307 | | | | 35 | | | | | | | | 13,398 | | | | 365 | | | | | |
| | | | | |
Shares converted from Class C | | | 53,150 | | | | 335,264 | | | | | | | | 540,956 | | | | 3,426,395 | | | | | |
| | | | | |
Shares redeemed | | | (1,537,117 | ) | | | (1,387,689 | ) | | | | | | | (15,661,932 | ) | | | (14,183,034 | ) | | | | |
| | | | | |
Net increase (decrease) | | | (514,969 | ) | | | 154,261 | | | | | | | $ | (5,192,517 | ) | | $ | 1,749,011 | | | | | |
| | | | | |
| | |
| abfunds.com | | AB MUNICIPAL INCOME FUND II | 131 |
NOTES TO FINANCIAL STATEMENTS (continued)
| | | | | | | | | | | | | | | | | | | | | | | | |
| | | | | | | | | | | | | | | | | | | | | | | | |
| | | AB Minnesota Portfolio | | | | |
| | | Shares | | | | | | Amount | | | | |
| | | Year Ended
May 31,
2018 | | | Year Ended
May 31, 2017 | | | | | | Year Ended
May 31, 2018 | | | Year Ended
May 31, 2017 | | | | |
| | | | | | | | |
| Class B | | | | | |
Shares sold | | | 466 | | | | 2,878 | | | | | | | $ | 4,710 | | | $ | 30,573 | | | | | |
| | | | | |
Shares issued in reinvestment of dividends and distributions | | | 61 | | | | 82 | | | | | | | | 619 | | | | 846 | | | | | |
| | | | | |
Shares converted to Class A | | | (1,306 | ) | | | (35 | ) | | | | | | | (13,398 | ) | | | (365 | ) | | | | |
| | | | | |
Shares redeemed | | | (206 | ) | | | (337 | ) | | | | | | | (2,100 | ) | | | (3,546 | ) | | | | |
| | | | | |
Net increase (decrease) | | | (985 | ) | | | 2,588 | | | | | | | $ | (10,169 | ) | | $ | 27,508 | | | | | |
| | | | | |
| | | | | | | | | | | | | | | | | | | | | | | | |
| Class C | | | | | |
Shares sold | | | 55,547 | | | | 111,276 | | | | | | | $ | 569,405 | | | $ | 1,150,730 | | | | | |
| | | | | |
Shares issued in reinvestment of dividends | | | 16,030 | | | | 26,206 | | | | | | | | 163,988 | | | | 271,125 | | | | | |
| | | | | |
Shares converted to Class A | | | (53,098 | ) | | | (334,936 | ) | | | | | | | (540,956 | ) | | | (3,426,395 | ) | | | | |
| | | | | |
Shares redeemed | | | (274,522 | ) | | | (273,470 | ) | | | | | | | (2,801,579 | ) | | | (2,811,777 | ) | | | | |
| | | | | |
Net decrease | | | (256,043 | ) | | | (470,924 | ) | | | | | | $ | (2,609,142 | ) | | $ | (4,816,317 | ) | | | | |
| | | | | |
| | | | | | | | | | | | | | | | | | | | | | | | |
| | | | | | | | | | | | | | | | | | | | | | | | |
| | | AB New Jersey Portfolio | | | | |
| | | Shares | | | | | | Amount | | | | |
| | | Year Ended
May 31,
2018 | | | Year Ended
May 31, 2017 | | | | | | Year Ended
May 31, 2018 | | | Year Ended
May 31, 2017 | | | | |
| | | | | | | | |
| Class A | | | | | |
Shares sold | | | 1,305,429 | | | | 1,080,629 | | | | | | | $ | 12,734,348 | | | $ | 10,498,136 | | | | | |
| | | | | |
Shares issued in reinvestment of dividends | | | 162,955 | | | | 151,049 | | | | | | | | 1,582,799 | | | | 1,475,050 | | | | | |
| | | | | |
Shares converted from Class B | | | 7,179 | | | | 5,871 | | | | | | | | 69,484 | | | | 57,688 | | | | | |
| | | | | |
Shares converted from Class C | | | 220,476 | | | | 888,253 | | | | | | | | 2,145,933 | | | | 8,589,410 | | | | | |
| | | | | |
Shares redeemed | | | (1,437,351 | ) | | | (1,471,390 | ) | | | | | | | (13,989,885 | ) | | | (14,294,640 | ) | | | | |
| | | | | |
Net increase | | | 258,688 | | | | 654,412 | | | | | | | $ | 2,542,679 | | | $ | 6,325,644 | | | | | |
| | | | | |
| | |
| 132 | AB MUNICIPAL INCOME FUND II | | abfunds.com |
NOTES TO FINANCIAL STATEMENTS (continued)
| | | | | | | | | | | | | | | | | | | | | | | | |
| | | | | | | | | | | | | | | | | | | | | | | | |
| | | AB New Jersey Portfolio | | | | |
| | | Shares | | | | | | Amount | | | | |
| | | Year Ended
May 31,
2018 | | | Year Ended
May 31, 2017 | | | | | | Year Ended
May 31, 2018 | | | Year Ended
May 31, 2017 | | | | |
| | | | | | | | |
| Class B | | | | | |
Shares sold | | | 167 | | | | 7,026 | | | | | | | $ | 1,625 | | | $ | 66,994 | | | | | |
| | | | | |
Shares issued in reinvestment of dividends | | | 116 | | | | 632 | | | | | | | | 1,135 | | | | 6,181 | | | | | |
| | | | | |
Shares converted to Class A | | | (7,179 | ) | | | (5,871 | ) | | | | | | | (69,484 | ) | | | (57,688 | ) | | | | |
| | | | | |
Shares redeemed | | | (1 | ) | | | (8,257 | ) | | | | | | | (10 | ) | | | (79,399 | ) | | | | |
| | | | | |
Net decrease | | | (6,897 | ) | | | (6,470 | ) | | | | | | $ | (66,734 | ) | | $ | (63,912 | ) | | | | |
| | | | | |
| | | | | | | | | | | | | | | | | | | | | | | | |
| Class C | | | | | |
Shares sold | | | 106,488 | | | | 128,727 | | | | | | | $ | 1,041,286 | | | $ | 1,264,018 | | | | | |
| | | | | |
Shares issued in reinvestment of dividends | | | 26,983 | | | | 48,451 | | | | | | | | 262,347 | | | | 473,329 | | | | | |
| | | | | |
Shares converted to Class A | | | (220,330 | ) | | | (887,336 | ) | | | | | | | (2,145,933 | ) | | | (8,589,410 | ) | | | | |
| | | | | |
Shares redeemed | | | (223,741 | ) | | | (555,556 | ) | | | | | | | (2,176,562 | ) | | | (5,376,729 | ) | | | | |
| | | | | |
Net decrease | | | (310,600 | ) | | | (1,265,714 | ) | | | | | | $ | (3,018,862 | ) | | $ | (12,228,792 | ) | | | | |
| | | | | |
| | | | | | | | | | | | | | | | | | | | | | | | |
| | | | | | | | | | | | | | | | | | | | | | | | |
| | | AB Ohio Portfolio | | | | |
| | | Shares | | | | | | Amount | | | | |
| | | Year Ended
May 31,
2018 | | | Year Ended
May 31, 2017 | | | | | | Year Ended
May 31, 2018 | | | Year Ended
May 31, 2017 | | | | |
| | | | | | | | |
| Class A | | | | | |
Shares sold | | | 748,065 | | | | 739,282 | | | | | | | $ | 7,468,662 | | | $ | 7,419,537 | | | | | |
| | | | | |
Shares issued in reinvestment of dividends | | | 139,157 | | | | 137,228 | | | | | | | | 1,382,691 | | | | 1,377,207 | | | | | |
| | | | | |
Shares converted from Class B | | | 423 | | | | 1,011 | | | | | | | | 4,212 | | | | 10,220 | | | | | |
| | | | | |
Shares converted from Class C | | | 74,323 | | | | 1,009,140 | | | | | | | | 735,504 | | | | 10,030,848 | | | | | |
| | | | | |
Shares redeemed | | | (1,150,117 | ) | | | (2,163,901 | ) | | | | | | | (11,432,391 | ) | | | (21,470,790 | ) | | | | |
| | | | | |
Net decrease | | | (188,149 | ) | | | (277,240 | ) | | | | | | $ | (1,841,322 | ) | | $ | (2,632,978 | ) | | | | |
| | | | | |
| | |
| abfunds.com | | AB MUNICIPAL INCOME FUND II | 133 |
NOTES TO FINANCIAL STATEMENTS (continued)
| | | | | | | | | | | | | | | | | | | | | | | | |
| | | | | | | | | | | | | | | | | | | | | | | | |
| | | AB Ohio Portfolio | | | | |
| | | Shares | | | | | | Amount | | | | |
| | | Year Ended
May 31,
2018 | | | Year Ended
May 31, 2017 | | | | | | Year Ended
May 31, 2018 | | | Year Ended
May 31, 2017 | | | | |
| | | | | | | | |
| Class B | | | | | |
Shares sold | | | 362 | | | | 371 | | | | | | | $ | 3,600 | | | $ | 3,720 | | | | | |
| | | | | |
Shares issued in reinvestment of dividends | | | 53 | | | | 73 | | | | | | | | 527 | | | | 733 | | | | | |
| | | | | |
Shares converted to Class A | | | (423 | ) | | | (1,012 | ) | | | | | | | (4,212 | ) | | | (10,220 | ) | | | | |
| | | | | |
Shares redeemed | | | 0 | (a) | | | (1,945 | ) | | | | | | | 0 | (b) | | | (19,256 | ) | | | | |
| | | | | |
Net decrease | | | (8 | ) | | | (2,513 | ) | | | | | | $ | (85 | ) | | $ | (25,023 | ) | | | | |
| | | | | |
| | | | | | | | | | | | | | | | | | | | | | | | |
| Class C | | | | | |
Shares sold | | | 80,222 | | | | 101,274 | | | | | | | $ | 798,596 | | | $ | 1,019,011 | | | | | |
| | | | | |
Shares issued in reinvestment of dividends | | | 19,027 | | | | 34,774 | | | | | | | | 188,946 | | | | 348,688 | | | | | |
| | | | | |
Shares converted to Class A | | | (74,352 | ) | | | (1,009,140 | ) | | | | | | | (735,504 | ) | | | (10,030,848 | ) | | | | |
| | | | | |
Shares redeemed | | | (171,282 | ) | | | (416,302 | ) | | | | | | | (1,710,491 | ) | | | (4,153,318 | ) | | | | |
| | | | | |
Net decrease | | | (146,385 | ) | | | (1,289,394 | ) | | | | | | $ | (1,458,453 | ) | | $ | (12,816,467 | ) | | | | |
| | | | | |
| (a) | Amount is less than one share. |
| (b) | Amount is less than $.50. |
| | | | | | | | | | | | | | | | | | | | | | | | |
| | | | | | | | | | | | | | | | | | | | | | | | |
| | | AB Pennsylvania Portfolio | | | | |
| | | Shares | | | | | | Amount | | | | |
| | | Year Ended
May 31,
2018 | | | Year Ended
May 31, 2017 | | | | | | Year Ended
May 31, 2018 | | | Year Ended
May 31, 2017 | | | | |
| | | | | | | | |
| Class A | | | | | |
Shares sold | | | 799,412 | | | | 883,934 | | | | | | | $ | 8,295,747 | | | $ | 9,182,275 | | | | | |
| | | | | |
Shares issued in reinvestment of dividends | | | 131,598 | | | | 122,547 | | | | | | | | 1,373,474 | | | | 1,290,087 | | | | | |
| | | | | |
Shares converted from Class B | | | 1,772 | | | | 1,547 | | | | | | | | 18,466 | | | | 16,307 | | | | | |
| | | | | |
Shares converted from Class C | | | 110,459 | | | | 802,935 | | | | | | | | 1,150,296 | | | | 8,366,586 | | | | | |
| | | | | |
Shares redeemed | | | (1,183,128 | ) | | | (864,472 | ) | | | | | | | (12,358,616 | ) | | | (9,041,367 | ) | | | | |
| | | | | |
Net increase (decrease) | | | (139,887 | ) | | | 946,491 | | | | | | | $ | (1,520,633 | ) | | $ | 9,813,888 | | | | | |
| | | | | |
| | |
| 134 | AB MUNICIPAL INCOME FUND II | | abfunds.com |
NOTES TO FINANCIAL STATEMENTS (continued)
| | | | | | | | | | | | | | | | | | | | | | | | |
| | | | | | | | | | | | | | | | | | | | | | | | |
| | | AB Pennsylvania Portfolio | | | | |
| | | Shares | | | | | | Amount | | | | |
| | | Year Ended
May 31,
2018 | | | Year Ended
May 31, 2017 | | | | | | Year Ended
May 31, 2018 | | | Year Ended
May 31, 2017 | | | | |
| | | | | | | | |
| Class B | | | | | |
Shares sold | | | 315 | | | | 317 | | | | | | | $ | 3,290 | | | $ | 3,340 | | | | | |
| | | | | |
Shares issued in reinvestment of dividends | | | 91 | | | | 117 | | | | | | | | 949 | | | | 1,237 | | | | | |
| | | | | |
Shares converted to Class A | | | (1,771 | ) | | | (1,547 | ) | | | | | | | (18,466 | ) | | | (16,307 | ) | | | | |
| | | | | |
Shares redeemed | | | (1,060 | ) | | | 1 | | | | | | | | (11,123 | ) | | | (7 | ) | | | | |
| | | | | |
Net decrease | | | (2,425 | ) | | | (1,112 | ) | | | | | | $ | (25,350 | ) | | $ | (11,737 | ) | | | | |
| | | | | |
| | | | | | | | | | | | | | | | | | | | | | | | |
| Class C | | | | | |
Shares sold | | | 18,484 | | | | 115,785 | | | | | | | $ | 193,626 | | | $ | 1,232,989 | | | | | |
| | | | | |
Shares issued in reinvestment of dividends | | | 16,306 | | | | 31,897 | | | | | | | | 170,366 | | | | 335,821 | | | | | |
| | | | | |
Shares converted to Class A | | | (110,407 | ) | | | (802,935 | ) | | | | | | | (1,150,296 | ) | | | (8,366,586 | ) | | | | |
| | | | | |
Shares redeemed | | | (151,167 | ) | | | (368,614 | ) | | | | | | | (1,575,814 | ) | | | (3,843,564 | ) | | | | |
| | | | | |
Net decrease | | | (226,784 | ) | | | (1,023,867 | ) | | | | | | $ | (2,362,118 | ) | | $ | (10,641,340 | ) | | | | |
| | | | | |
| | | | | | | | | | | | | | | | | | | | | | | | |
| | | | | | | | | | | | | | | | | | | | | | | | |
| | | AB Virginia Portfolio | | | | |
| | | Shares | | | | | | Amount | | | | |
| | | Year Ended
May 31,
2018 | | | Year Ended
May 31,
2017 | | | | | | Year Ended
May 31,
2018 | | | Year Ended
May 31,
2017 | | | | |
| | | | | | | | |
| Class A | | | | | | | | | | | | | | | | | | | | | | | | |
Shares sold | | | 763,375 | | | | 1,554,345 | | | | | | | $ | 8,491,180 | | | $ | 17,443,300 | | | | | |
| | | | | |
Shares issued in reinvestment of dividends | | | 206,126 | | | | 249,634 | | | | | | | | 2,285,263 | | | | 2,797,677 | | | | | |
| | | | | |
Shares converted from Class B | | | 3,875 | | | | 1,670 | | | | | | | | 42,918 | | | | 18,786 | | | | | |
| | | | | |
Shares converted from Class C | | | 124,727 | | | | 841,423 | | | | | | | | 1,372,367 | | | | 9,314,552 | | | | | |
| | | | | |
Shares redeemed | | | (2,640,768 | ) | | | (5,050,725 | ) | | | | | | | (29,307,829 | ) | | | (56,085,933 | ) | | | | |
| | | | | |
Net decrease | | | (1,542,665 | ) | | | (2,403,653 | ) | | | | | | $ | (17,116,101 | ) | | $ | (26,511,618 | ) | | | | |
| | | | | |
| | |
| abfunds.com | | AB MUNICIPAL INCOME FUND II | 135 |
NOTES TO FINANCIAL STATEMENTS (continued)
| | | | | | | | | | | | | | | | | | | | | | | | |
| | | | | | | | | | | | | | | | | | | | | | | | |
| | | AB Virginia Portfolio | | | | |
| | | Shares | | | | | | Amount | | | | |
| | | Year Ended
May 31,
2018 | | | Year Ended
May 31,
2017 | | | | | | Year Ended
May 31,
2018 | | | Year Ended
May 31,
2017 | | | | |
| | | | | | | | |
| Class B | | | | | | | | | | | | | | | | | | | | | | | | |
Shares sold | | | 144 | | | | 299 | | | | | | | $ | 1,600 | | | $ | 3,350 | | | | | |
| | | | | |
Shares issued in reinvestment of dividends | | | 124 | | | | 208 | | | | | | | | 1,371 | | | | 2,328 | | | | | |
| | | | | |
Shares converted to Class A | | | (3,880 | ) | | | (1,673 | ) | | | | | | | (42,918 | ) | | | (18,786 | ) | | | | |
| | | | | |
Shares redeemed | | | (2,078 | ) | | | (11 | ) | | | | | | | (23,203 | ) | | | (128 | ) | | | | |
| | | | | |
Net decrease | | | (5,690 | ) | | | (1,177 | ) | | | | | | $ | (63,150 | ) | | $ | (13,236 | ) | | | | |
| | | | | |
| | | | | | | | | | | | | | | | | | | | | | | | |
| Class C | | | | | | | | | | | | | | | | | | | | | | | | |
Shares sold | | | 200,237 | | | | 269,384 | | | | | | | $ | 2,223,249 | | | $ | 3,028,595 | | | | | |
| | | | | |
Shares issued in reinvestment of dividends | | | 58,555 | | | | 81,253 | | | | | | | | 647,613 | | | | 907,301 | | | | | |
| | | | | |
Shares converted to Class A | | | (125,014 | ) | | | (843,709 | ) | | | | | | | (1,372,367 | ) | | | (9,314,552 | ) | | | | |
| | | | | |
Shares redeemed | | | (647,032 | ) | | | (695,233 | ) | | | | | | | (7,138,277 | ) | | | (7,707,330 | ) | | | | |
| | | | | |
Net decrease | | | (513,254 | ) | | | (1,188,305 | ) | | | | | | $ | (5,639,782 | ) | | $ | (13,085,986 | ) | | | | |
| | | | | |
| | | | | | | | | | | | | | | | | | | | | | | | |
| Advisor Class(a) | | | | | | | | | | | | | | | | | | | | | | | | |
Shares sold | | | 1,707,005 | | | | 2,826,630 | | | | | | | $ | 18,988,391 | | | $ | 31,347,927 | | | | | |
| | | | | |
Shares issued in reinvestment of dividends | | | 60,533 | | | | 14,808 | | | | | | | | 670,987 | | | | 164,105 | | | | | |
| | | | | |
Shares redeemed | | | (545,888 | ) | | | (315,237 | ) | | | | | | | (6,039,345 | ) | | | (3,463,699 | ) | | | | |
| | | | | |
Net increase | | | 1,221,650 | | | | 2,526,201 | | | | | | | $ | 13,620,033 | | | $ | 28,048,333 | | | | | |
| | | | | |
| (a) | Commenced distribution on July 25, 2016. |
NOTE F
Risks Involved in Investing in the Portfolios
Credit Risk—An issuer or guarantor of a fixed-income security, or the counterparty to a derivatives or other contract, may be unable or unwilling to make timely payments of interest or principal, or to otherwise honor its obligations. The issuer or guarantor may default, causing a loss of the full principal amount of a security and accrued interest. The degree of risk for a particular security may be reflected in its credit rating. There is the possibility that the credit rating of a fixed-income security may be downgraded after purchase, which may adversely affect the value of the security. Investments in fixed income securities with lower ratings tend to have a higher probability that an issuer will default or fail to meet its payment obligations.
| | |
| 136 | AB MUNICIPAL INCOME FUND II | | abfunds.com |
NOTES TO FINANCIAL STATEMENTS (continued)
Municipal Market Risk: This is the risk that special factors may adversely affect the value of municipal securities and have a significant effect on the yield or value of the Portfolios’ investments in municipal securities. These factors include economic conditions, political or legislative changes, uncertainties related to the tax status of municipal securities, or the rights of investors in these securities. To the extent that the Portfolios invest more of their assets in a particular state’s municipal securities, the Portfolios may be vulnerable to events adversely affecting that state, including economic, political and regulatory occurrences, court decisions, terrorism and catastrophic natural disasters, such as hurricanes or earthquakes. The Portfolios’ investments in certain municipal securities with principal and interest payments that are made from the revenues of a specific project or facility, and not general tax revenues, may have increased risks. Factors affecting the project or facility, such as local business or economic conditions, could have a significant effect on the project’s ability to make payments of principal and interest on these securities.
In addition, recent tax law changes could have a material impact on the value of municipal securities. Changes in tax rates or the treatment of income from municipal securities, among other things, could negatively affect the municipal securities markets.
The Portfolios may invest in municipal securities of issuers in Puerto Rico or other US territories and their governmental agencies and municipalities, which are exempt from federal, state, and, where applicable, local income taxes. These municipal securities may have more risks than those of other US issuers of municipal securities. Like many US states and municipalities, Puerto Rico experienced a significant downturn during the recent recession. Puerto Rico’s downturn was particularly severe, and Puerto Rico continues to face a very challenging economic and fiscal environment. If the general economic situation in Puerto Rico continues to persist or worsens, the volatility and credit quality of Puerto Rican municipal securities could continue to be adversely affected, and the market for such securities may experience continued volatility.
Interest Rate Risk—Changes in interest rates will affect the value of investments in fixed-income securities. When interest rates rise, the value of existing investments in fixed-income securities tends to fall and this decrease in value may not be offset by higher income from new investments. The Portfolios may be subject to heightened interest rate risk due to rising rates as the current period of historically low interest rates may be ending. Interest rate risk is generally greater for fixed-income securities with longer maturities or durations.
| | |
| abfunds.com | | AB MUNICIPAL INCOME FUND II | 137 |
NOTES TO FINANCIAL STATEMENTS (continued)
Tax Risk: There is no guarantee that the income on the Portfolios’ municipal securities will be exempt from regular federal income and state income taxes. Unfavorable legislation, adverse interpretations by federal or state authorities, litigation or noncompliant conduct by the issuer of a municipal security could affect the tax-exempt status of municipal securities. If the Internal Revenue Service or a state authority determines that an issuer of a municipal security has not complied with applicable requirements, interest from the security could become subject to regular federal income tax and/or state personal income tax, possibly retroactively to the date the security was issued, the value of the security could decline significantly, and a portion of the distributions to Portfolio shareholders could be recharacterized as taxable. Recent federal legislation included reductions in tax rates for individuals, with relatively larger reductions in tax rates for corporations. These tax rate reductions may reduce the demand for municipal bonds which could reduce the value of municipal bonds held by the Portfolios.
Duration Risk—Duration is a measure that relates the expected price volatility of a fixed-income security to changes in interest rates. The duration of a fixed-income security may be shorter than or equal to the full maturity of a fixed-income security. Fixed-income securities with longer durations have more risk and will decrease in price as interest rates rise. For example, generally a fixed-income security with a duration of three years will decrease in value by approximately 3% if interest rates increase by 1%.
Inflation Risk—This is the risk that the value of assets or income from investments will be less in the future as inflation decreases the value of money. As inflation increases, the value of the Portfolio’s assets can decline as can the value of the Portfolio’s distributions. This risk is significantly greater for fixed-income securities with longer maturities.
Liquidity Risk—Liquidity risk occurs when certain investments become difficult to purchase or sell. Difficulty in selling less liquid securities may result in sales at disadvantageous prices affecting the value of your investment in the Portfolios. Causes of liquidity risk may include low trading volumes, large positions and heavy redemptions of portfolio shares. Over recent years, liquidity risk has also increased because the capacity of dealers in the secondary market for fixed-income securities to make markets in these securities has decreased, even as the overall bond market has grown significantly, due to, among other things, structural changes, additional regulatory requirements and capital and risk restraints that have led to reduced inventories. Liquidity risk may be higher in a rising interest rate environment, when the value and liquidity of fixed-income securities generally decline. Municipal securities may have more liquidity risk than other fixed-income securities because they trade less frequently and the market for municipal securities is generally smaller than many other markets.
| | |
| 138 | AB MUNICIPAL INCOME FUND II | | abfunds.com |
NOTES TO FINANCIAL STATEMENTS (continued)
Derivatives Risk—The Portfolios may enter into derivative transactions such as forwards, options, futures and swaps. Derivatives may be illiquid, difficult to price, and leveraged so that small changes may produce disproportionate losses for the Portfolios, and subject to counterparty risk to a greater degree than more traditional investments. Derivatives may result in significant losses, including losses that are far greater than the value of the derivatives reflected on the statement of assets and liabilities.
Indemnification Risk—In the ordinary course of business, the Portfolios enter into contracts that contain a variety of indemnifications. The Portfolio’s maximum exposure under these arrangements is unknown. However, the Portfolios have not had prior claims or losses pursuant to these indemnification provisions and expect the risk of loss thereunder to be remote. Therefore, the Portfolios have not accrued any liability in connection with these indemnification provisions.
NOTE G
Joint Credit Facility
A number of open-end mutual funds managed by the Adviser, including the Portfolios, participate in a $280 million revolving credit facility (the “Facility”) intended to provide short-term financing, if necessary, subject to certain restrictions in connection with abnormal redemption activity. Commitment fees related to the Facility are paid by the participating funds and are included in miscellaneous expenses in the statement of operations. The Portfolios did not utilize the Facility during the year ended May 31, 2018. Effective July 5, 2018, the Facility will be increased to $325 million.
NOTE H
Distributions to Shareholders
The tax character of distributions paid during the fiscal years ended May 31, 2018 and May 31, 2017 were as follows:
| | | | | | | | |
| AB Arizona Portfolio | | 2018 | | | 2017 | |
Distributions paid from: | | | | | | | | |
Ordinary income | | $ | 14,347 | | | $ | 16,896 | |
| | | | | | | | |
Total taxable distributions | | | 14,347 | | | | 16,896 | |
Tax exempt distributions | | | 3,394,765 | | | | 3,736,884 | |
| | | | | | | | |
Total distributions paid | | $ | 3,409,112 | | | $ | 3,753,780 | |
| | | | | | | | |
| | | | | | | | |
| AB Massachusetts Portfolio | | 2018 | | | 2017 | |
Distributions paid from: | | | | | | | | |
Ordinary income | | $ | 173,558 | | | $ | 267,815 | |
Long-term capital gains | | | 240,989 | | | | 9,793 | |
| | | | | | | | |
Total taxable distributions | | | 414,547 | | | | 277,608 | |
Tax exempt distributions | | | 6,827,835 | | | | 6,949,905 | |
| | | | | | | | |
Total distributions paid | | $ | 7,242,382 | | | $ | 7,227,513 | |
| | | | | | | | |
| | |
| abfunds.com | | AB MUNICIPAL INCOME FUND II | 139 |
NOTES TO FINANCIAL STATEMENTS (continued)
| | | | | | | | |
| AB Minnesota Portfolio | | 2018 | | | 2017 | |
Distributions paid from: | | | | | | | | |
Ordinary income | | $ | 13,634 | | | $ | 41,050 | |
Long-term capital gains | | | 48,742 | | | | 179,048 | |
| | | | | | | | |
Total taxable distributions | | | 62,376 | | | | 220,098 | |
Tax exempt distributions | | | 2,010,820 | | | | 2,164,773 | |
| | | | | | | | |
Total distributions paid | | $ | 2,073,196 | | | $ | 2,384,871 | |
| | | | | | | | |
| | | | | | | | |
| AB New Jersey Portfolio | | 2018 | | | 2017 | |
Distributions paid from: | | | | | | | | |
Ordinary income | | $ | 17,189 | | | $ | 50,312 | |
| | | | | | | | |
Total taxable distributions | | | 17,189 | | | | 50,312 | |
Tax exempt distributions | | | 3,372,453 | | | | 3,507,702 | |
| | | | | | | | |
Total distributions paid | | $ | 3,389,642 | | | $ | 3,558,014 | |
| | | | | | | | |
| | | | | | | | |
| AB Ohio Portfolio | | 2018 | | | 2017 | |
Distributions paid from: | | | | | | | | |
Ordinary income | | $ | 15,262 | | | $ | 20,424 | |
| | | | | | | | |
Total taxable distributions | | | 15,262 | | | | 20,424 | |
Tax exempt distributions | | | 2,524,651 | | | | 2,721,279 | |
| | | | | | | | |
Total distributions paid | | $ | 2,539,913 | | | $ | 2,741,703 | |
| | | | | | | | |
| | | | | | | | |
| AB Pennsylvania Portfolio | | 2018 | | | 2017 | |
Distributions paid from: | | | | | | | | |
Ordinary income | | $ | 13,038 | | | $ | 4,643 | |
| | | | | | | | |
Total taxable distributions | | | 13,038 | | | | 4,643 | |
Tax exempt distributions | | | 2,567,379 | | | | 2,650,896 | |
| | | | | | | | |
Total distributions paid | | $ | 2,580,417 | | | $ | 2,655,539 | |
| | | | | | | | |
| | | | | | | | |
| AB Virginia Portfolio | | 2018 | | | 2017 | |
Distributions paid from: | | | | | | | | |
Ordinary income | | $ | 152,094 | | | $ | 222,332 | |
| | | | | | | | |
Total taxable distributions | | | 152,094 | | | | 222,332 | |
Tax exempt distributions | | | 6,176,205 | | | | 6,552,061 | |
| | | | | | | | |
Total distributions paid | | $ | 6,328,299 | | | $ | 6,774,393 | |
| | | | | | | | |
As of May 31, 2018, the components of accumulated earnings/(deficit) on a tax basis were as follows:
| | | | | | | | | | | | | | | | |
| Portfolio | | Undistributed Ordinary Income(a) | | | Accumulated Capital and
Other Losses(b) | | | Unrealized Appreciation/ (Depreciation)(c) | | | Total Accumulated Earnings/ (Deficit)(d) | |
AB Arizona | | $ | – 0 | – | | $ | (819,595 | ) | | $ | 3,152,495 | | | $ | 2,332,900 | |
AB Massachusetts | | | 35,659 | | | | (142,871 | ) | | | 8,208,959 | | | | 8,101,747 | |
AB Minnesota | | | – 0 | – | | | (34,399 | ) | | | 2,367,114 | | | | 2,332,715 | |
AB New Jersey | | | – 0 | – | | | (2,414,702 | ) | | | 5,257,045 | | | | 2,842,343 | |
| | |
| 140 | AB MUNICIPAL INCOME FUND II | | abfunds.com |
NOTES TO FINANCIAL STATEMENTS (continued)
| | | | | | | | | | | | | | | | | | | | |
| Portfolio | | Undistributed Ordinary Income(a) | | | Undistributed Long-Term Gains | | | Accumulated Capital and
Other Losses(b) | | | Unrealized Appreciation/ (Depreciation)(c) | | | Total Accumulated Earnings/ (Deficit)(d) | |
AB Ohio | | $ | 5,806 | | | $ | – 0 – | | | $ | (4,716,217 | ) | | $ | 3,228,106 | | | $ | (1,482,305 | ) |
AB Pennsylvania | | | 25,630 | | | | – 0 – | | | | (581,404 | ) | | | 3,007,064 | | | | 2,451,290 | |
AB Virginia | | | – 0 | – | | | – 0 – | | | | (1,879,475 | ) | | | 7,403,666 | | | | 5,524,191 | |
| (a) | These amounts represent 100% tax exempt income. |
| (b) | At May 31, 2018, AB Arizona Portfolio, AB New Jersey Portfolio, AB Ohio Portfolio, AB Pennsylvania, Portfolio and AB Virginia Portfolio had capital loss carryforwards for federal income tax purposes. During the fiscal period, AB Arizona Portfolio, AB New Jersey Portfolio, AB Ohio Portfolio, AB Pennsylvania Portfolio and AB Virginia Portfolio utilized capital loss carryforwards of $223,423, $843,740, $571,172, $948,163 and $1,272,026, respectively, to offset current year net realized gains. AB New Jersey Portfolio also had $236,173 of capital loss carryforwards expire during the fiscal year. AB Massachusetts Portfolio and AB Minnesota Portfolio had a post October short-term capital loss deferral of $142,871 and $34,399, respectively. These losses are deemed to arise on June 1, 2018. |
| (c) | The difference between book-basis and tax-basis unrealized appreciation/(depreciation) is attributable primarily to the tax deferral of losses on wash sales. |
| (d) | The differences between book-basis and tax-basis components of accumulated earnings/(deficit) are attributable primarily to the tax treatment of defaulted securities and dividends payable to shareholders. |
For tax purposes, net realized capital losses may be carried over to offset future capital gains, if any. Funds are permitted to carry forward capital losses incurred in taxable years beginning after December 22, 2010 for an indefinite period. These post-December 22, 2010 capital losses must be utilized prior to the earlier capital losses, which are subject to expiration. Post-December 22, 2010 capital loss carryforwards will retain their character as either short-term or long-term capital losses rather than being considered short-term as under previous regulation.
As of May 31, 2018, certain Portfolios had net capital loss carryforwards which will expire as follows:
| | | | | | | | | | |
| Portfolio | | Short-Term
Amount | | | Long-Term
Amount | | | Expiration |
AB Arizona | | $ | 681,440 | | | $ | 138,155 | | | No Expiration |
AB New Jersey | | | 95,620 | | | | N/A | | | 2019 |
AB New Jersey | | | 2,319,082 | | | | – 0 | – | | No Expiration |
AB Ohio | | | 1,641,024 | | | | 3,075,193 | | | No Expiration |
AB Pennsylvania | | | – 0 | – | | | 581,404 | | | No Expiration |
AB Virginia | | | 1,879,475 | | | | – 0 | – | | No Expiration |
| | |
| abfunds.com | | AB MUNICIPAL INCOME FUND II | 141 |
NOTES TO FINANCIAL STATEMENTS (continued)
During the current fiscal year, the Portfolios had adjustments due to permanent differences. Permanent differences have no effect on net assets. The effect of such permanent differences on each Portfolio—primarily due to the tax treatment of swaps, the expiration of capital loss carryforwards, and the redesignation of dividends—is reflected as an adjustment to the components of capital as of May 31, 2018 as shown below:
| | | | | | | | | | | | |
| Portfolio | | Increase (Decrease) to Additional Paid-In Capital | | | Increase (Decrease) to Undistributed/ (Distributions in Excess of) Net Investment Income | | | Increase (Decrease) to Accumulated Net Realized Gain (Loss) on Investment Transactions | |
AB Arizona | | $ | (3,197 | ) | | $ | 6,359 | | | $ | (3,162 | ) |
AB Massachusetts | | | – 0 | – | | | 232,668 | | | | (232,668 | ) |
AB Minnesota | | | (1,141 | ) | | | 36,177 | | | | (35,036 | ) |
AB New Jersey | | | (240,918 | ) | | | 4,745 | | | | 236,173 | |
AB Ohio | | | – 0 | – | | | (19,638 | ) | | | 19,638 | |
AB Pennsylvania | | | – 0 | – | | | 1,345 | | | | (1,345 | ) |
AB Virginia | | | (21,320 | ) | | | 177,171 | | | | (155,851 | ) |
NOTE I
Recent Accounting Pronouncements
In March 2017, the Financial Accounting Standards Board issued an Accounting Standards Update, ASU 2017-08, Receivables—Nonrefundable Fees and Other Costs (Subtopic 310-20), Premium Amortization on Purchased Callable Debt Securities (the “ASU”) which amends the amortization period for certain purchased callable debt securities held at a premium, shortening such period to the earliest call date. The ASU does not require any accounting change for debt securities held at a discount; the discount continues to be amortized to maturity. The ASU is effective for fiscal years, and interim periods within those fiscal years, beginning after December 15, 2018. At this time, management is evaluating the implications of these changes on the financial statements.
NOTE J
Subsequent Events
Management has evaluated subsequent events for possible recognition or disclosure in the financial statements through the date the financial statements are issued. Management has determined that there are no material events that would require disclosure in the Portfolios’ financial statements through this date.
| | |
| 142 | AB MUNICIPAL INCOME FUND II | | abfunds.com |
FINANCIAL HIGHLIGHTS
Selected Data For A Share Of Beneficial Interest Outstanding Throughout Each Period
| | | | | | | | | | | | | | | | | | | | | | | | |
| | | AB Arizona Portfolio | |
| | | Class A | |
| | | Year Ended May 31, | | | October 1,
2014 to
May 31, 2015(a) | | | Year Ended September 30, | |
| | | 2018 | | | 2017 | | | 2016 | | | | 2014 | | | 2013 | |
| | | | |
| | | | | | | | | | | | | | | | | | | | | | | | |
Net asset value, beginning of period | | | $ 11.16 | | | | $ 11.36 | | | | $ 11.01 | | | | $ 11.05 | | | | $ 10.72 | | | | $ 11.41 | |
| | | | |
Income From Investment Operations | | | | | | | | | | | | | | | | | | | | | | | | |
Net investment income(b)(c) | | | .32 | | | | .34 | | | | .35 | | | | .25 | | | | .40 | | | | .40 | |
Net realized and unrealized gain (loss) on investment transactions | | | (.18 | ) | | | (.20 | ) | | | .35 | | | | (.04 | ) | | | .33 | | | | (.69 | ) |
| | | | |
Net increase (decrease) in net asset value from operations | | | .14 | | | | .14 | | | | .70 | | | | .21 | | | | .73 | | | | (.29 | ) |
| | | | |
Less: Dividends | | | | | | | | | | | | | | | | | | | | | | | | |
Dividends from net investment income | | | (.32 | ) | | | (.34 | ) | | | (.35 | ) | | | (.25 | ) | | | (.40 | ) | | | (.40 | ) |
| | | | |
Net asset value, end of period | | | $ 10.98 | | | | $ 11.16 | | | | $ 11.36 | | | | $ 11.01 | | | | $ 11.05 | | | | $ 10.72 | |
| | | | |
Total Return | | | | | | | | | | | | | | | | | | | | | | | | |
Total investment return based on net asset value(d) | | | 1.30 | % | | | 1.28 | % | | | 6.50 | % | | | 1.94 | % | | | 6.90 | % | | | (2.65 | )% |
Ratios/Supplemental Data | | | | | | | | | | | | | | | | | | | | | | | | |
Net assets, end of period (000’s omitted) | | | $102,020 | | | | $105,539 | | | | $106,037 | | | | $104,489 | | | | $107,843 | | | | $117,342 | |
Ratio to average net assets of: | | | | | | | | | | | | | | | | | | | | | | | | |
Expenses, net of waivers/reimbursements(e) | | | .79 | % | | | .78 | % | | | .78 | % | | | .80 | %^ | | | .79 | % | | | .79 | % |
Expenses, before waivers/reimbursements(e) | | | 1.00 | % | | | .97 | % | | | .96 | % | | | 1.00 | %^ | | | .99 | % | | | .93 | % |
Net investment income(b) | | | 2.92 | % | | | 3.04 | % | | | 3.17 | % | | | 3.43 | %^ | | | 3.65 | % | | | 3.54 | % |
Portfolio turnover rate | | | 12 | % | | | 12 | % | | | 11 | % | | | 21 | % | | | 15 | % | | | 24 | % |
See footnote summary on pages 165-167.
| | |
| abfunds.com | | AB MUNICIPAL INCOME FUND II | 143 |
FINANCIAL HIGHLIGHTS (continued)
Selected Data For A Share Of Beneficial Interest Outstanding Throughout Each Period
| | | | | | | | | | | | | | | | | | | | | | | | |
| | | AB Arizona Portfolio | |
| | | Class B | |
| | | Year Ended May 31, | | | October 1,
2014 to
May 31, 2015(a) | | | Year Ended September 30, | |
| | | 2018 | | | 2017 | | | 2016 | | | | 2014 | | | 2013 | |
| | | | |
| | | | | | | | | | | | | | | | | | | | | | | | |
Net asset value, beginning of period | | | $ 11.14 | | | | $ 11.35 | | | | $ 10.99 | | | | $ 11.03 | | | | $ 10.70 | | | | $ 11.39 | |
| | | | |
Income From Investment Operations | | | | | | | | | | | | | | | | | | | | | | | | |
Net investment income(b)(c) | | | .24 | | | | .26 | | | | .27 | | | | .20 | | | | .32 | | | | .32 | |
Net realized and unrealized gain (loss) on investment transactions | | | (.18 | ) | | | (.21 | ) | | | .36 | | | | (.04 | ) | | | .33 | | | | (.69 | ) |
| | | | |
Net increase (decrease) in net asset value from operations | | | .06 | | | | .05 | | | | .63 | | | | .16 | | | | .65 | | | | (.37 | ) |
| | | | |
Less: Dividends | | | | | | | | | | | | | | | | | | | | | | | | |
Dividends from net investment income | | | (.24 | ) | | | (.26 | ) | | | (.27 | ) | | | (.20 | ) | | | (.32 | ) | | | (.32 | ) |
| | | | |
Net asset value, end of period | | | $ 10.96 | | | | $ 11.14 | | | | $ 11.35 | | | | $ 10.99 | | | | $ 11.03 | | | | $ 10.70 | |
| | | | |
Total Return | | | | | | | | | | | | | | | | | | | | | | | | |
Total investment return based on net asset value(d) | | | .54 | % | | | .44 | % | | | 5.81 | % | | | 1.45 | % | | | 6.17 | % | | | (3.34 | )% |
Ratios/Supplemental Data | | | | | | | | | | | | | | | | | | | | | | | | |
Net assets, end of period (000’s omitted) | | | $7 | | | | $373 | | | | $387 | | | | $412 | | | | $546 | | | | $769 | |
Ratio to average net assets of: | | | | | | | | | | | | | | | | | | | | | | | | |
Expenses, net of waivers/reimbursements(e) | | | 1.51 | % | | | 1.53 | % | | | 1.53 | % | | | 1.53 | %^ | | | 1.49 | % | | | 1.49 | % |
Expenses, before waivers/reimbursements(e) | | | 1.72 | % | | | 1.73 | % | | | 1.71 | % | | | 1.72 | %^ | | | 1.70 | % | | | 1.63 | % |
Net investment income(b) | | | 2.16 | % | | | 2.30 | % | | | 2.43 | % | | | 2.72 | %^ | | | 2.96 | % | | | 2.83 | % |
Portfolio turnover rate | | | 12 | % | | | 12 | % | | | 11 | % | | | 21 | % | | | 15 | % | | | 24 | % |
See footnote summary on pages 165-167.
| | |
| 144 | AB MUNICIPAL INCOME FUND II | | abfunds.com |
FINANCIAL HIGHLIGHTS (continued)
Selected Data For A Share Of Beneficial Interest Outstanding Throughout Each Period
| | | | | | | | | | | | | | | | | | | | | | | | |
| | | AB Arizona Portfolio | |
| | | Class C | |
| | | Year Ended May 31, | | | October 1,
2014 to
May 31, 2015(a) | | | Year Ended September 30, | |
| | | 2018 | | | 2017 | | | 2016 | | | | 2014 | | | 2013 | |
| | | | |
| | | | | | | | | | | | | | | | | | | | | | | | |
Net asset value, beginning of period | | | $ 11.14 | | | | $ 11.35 | | | | $ 10.99 | | | | $ 11.03 | | | | $ 10.70 | | | | $ 11.39 | |
| | | | |
Income From Investment Operations | | | | | | | | | | | | | | | | | | | | | | | | |
Net investment income(b)(c) | | | .24 | | | | .26 | | | | .27 | | | | .20 | | | | .32 | | | | .32 | |
Net realized and unrealized gain (loss) on investment transactions | | | (.18 | ) | | | (.21 | ) | | | .36 | | | | (.04 | ) | | | .33 | | | | (.69 | ) |
| | | | |
Net increase (decrease) in net asset value from operations | | | .06 | | | | .05 | | | | .63 | | | | .16 | | | | .65 | | | | (.37 | ) |
| | | | |
Less: Dividends | | | | | | | | | | | | | | | | | | | | | | | | |
Dividends from net investment income | | | (.24 | ) | | | (.26 | ) | | | (.27 | ) | | | (.20 | ) | | | (.32 | ) | | | (.32 | ) |
| | | | |
Net asset value, end of period | | | $ 10.96 | | | | $ 11.14 | | | | $ 11.35 | | | | $ 10.99 | | | | $ 11.03 | | | | $ 10.70 | |
| | | | |
Total Return | | | | | | | | | | | | | | | | | | | | | | | | |
Total investment return based on net asset value(d) | | | .55 | % | | | .44 | % | | | 5.81 | % | | | 1.45 | % | | | 6.17 | % | | | (3.34 | )% |
Ratios/Supplemental Data | | | | | | | | | | | | | | | | | | | | | | | | |
Net assets, end of period (000’s omitted) | | | $16,254 | | | | $19,454 | | | | $25,550 | | | | $24,900 | | | | $25,203 | | | | $30,060 | |
Ratio to average net assets of: | | | | | | | | | | | | | | | | | | | | | | | | |
Expenses, net of waivers/reimbursements(e) | | | 1.54 | % | | | 1.53 | % | | | 1.53 | % | | | 1.53 | %^ | | | 1.49 | % | | | 1.49 | % |
Expenses, before waivers/reimbursements(e) | | | 1.75 | % | | | 1.72 | % | | | 1.71 | % | | | 1.72 | %^ | | | 1.70 | % | | | 1.63 | % |
Net investment income(b) | | | 2.18 | % | | | 2.29 | % | | | 2.43 | % | | | 2.71 | %^ | | | 2.96 | % | | | 2.84 | % |
Portfolio turnover rate | | | 12 | % | | | 12 | % | | | 11 | % | | | 21 | % | | | 15 | % | | | 24 | % |
See footnote summary on pages 165-167.
| | |
| abfunds.com | | AB MUNICIPAL INCOME FUND II | 145 |
FINANCIAL HIGHLIGHTS (continued)
Selected Data For A Share Of Beneficial Interest Outstanding Throughout Each Period
| | | | | | | | | | | | | | | | | | | | | | | | |
| | | AB Massachusetts Portfolio | |
| | | Class A | |
| | | Year Ended May 31, | | | October 1,
2014 to
May 31, 2015(a) | | | Year Ended September 30, | |
| | | 2018 | | | 2017 | | | 2016 | | | | 2014 | | | 2013 | |
| | | | |
| | | | | | | | | | | | | | | | | | | | | | | | |
Net asset value, beginning of period | | | $ 11.35 | | | | $ 11.61 | | | | $ 11.37 | | | | $ 11.36 | | | | $ 11.05 | | | | $ 11.87 | |
| | | | |
Income From Investment Operations | | | | | | | | | | | | | | | | | | | | | | | | |
Net investment income(b)(c) | | | .32 | | | | .33 | | | | .35 | | | | .24 | | | | .37 | | | | .37 | |
Net realized and unrealized gain (loss) on investment transactions | | | (.24 | ) | | | (.24 | ) | | | .25 | | | | .02 | | | | .33 | | | | (.76 | ) |
| | | | |
Net increase (decrease) in net asset value from operations | | | .08 | | | | .09 | | | | .60 | | | | .26 | | | | .70 | | | | (.39 | ) |
| | | | |
Less: Dividends and Distributions | | | | | | | | | | | | | | | | | | | | | | | | |
Dividends from net investment income | | | (.33 | ) | | | (.35 | ) | | | (.36 | ) | | | (.25 | ) | | | (.39 | ) | | | (.39 | ) |
Distributions from net realized gain on investment transactions | | | (.01 | ) | | | – 0 | – | | | – 0 | – | | | – 0 | – | | | – 0 | – | | | (.04 | ) |
| | | | |
Total dividends and distributions | | | (.34 | ) | | | (.35 | ) | | | (.36 | ) | | | (.25 | ) | | | (.39 | ) | | | (.43 | ) |
| | | | |
Net asset value, end of period | | | $ 11.09 | | | | $ 11.35 | | | | $ 11.61 | | | | $ 11.37 | | | | $ 11.36 | | | | $ 11.05 | |
| | | | |
Total Return | | | | | | | | | | | | | | | | | | | | | | | | |
Total investment return based on net asset value(d) | | | .75 | % | | | .78 | % | | | 5.38 | % | | | 2.26 | % | | | 6.42 | % | | | (3.38 | )% |
Ratios/Supplemental Data | | | | | | | | | | | | | | | | | | | | | | | | |
Net assets, end of period (000’s omitted) | | | $141,078 | | | | $163,988 | | | | $189,259 | | | | $188,934 | | | | $194,274 | | | | $202,230 | |
Ratio to average net assets of: | | | | | | | | | | | | | | | | | | | | | | | | |
Expenses, net of waivers/reimbursements(e) | | | .78 | % | | | .77 | % | | | .77 | % | | | .80 | %^ | | | .82 | % | | | .82 | % |
Expenses, before waivers/reimbursements(e) | | | .89 | % | | | .88 | % | | | .87 | % | | | .90 | %^ | | | .91 | % | | | .88 | % |
Net investment income(b) | | | 2.89 | % | | | 2.92 | % | | | 3.04 | % | | | 3.10 | %^ | | | 3.35 | % | | | 3.18 | % |
Portfolio turnover rate | | | 19 | % | | | 13 | % | | | 15 | % | | | 12 | % | | | 9 | % | | | 19 | % |
See footnote summary on pages 165-167.
| | |
| 146 | AB MUNICIPAL INCOME FUND II | | abfunds.com |
FINANCIAL HIGHLIGHTS (continued)
Selected Data For A Share Of Beneficial Interest Outstanding Throughout Each Period
| | | | | | | | | | | | | | | | | | | | | | | | |
| | | AB Massachusetts Portfolio | |
| | | Class B | |
| | | Year Ended May 31, | | | October 1,
2014 to
May 31, 2015(a) | | | Year Ended September 30, | |
| | | 2018 | | | 2017 | | | 2016 | | | | 2014 | | | 2013 | |
| | | | |
| | | | | | | | | | | | | | | | | | | | | | | | |
Net asset value, beginning of period | | | $ 11.33 | | | | $ 11.59 | | | | $ 11.35 | | | | $ 11.34 | | | | $ 11.03 | | | | $ 11.85 | |
| | | | |
Income From Investment Operations | | | | | | | | | | | | | | | | | | | | | | | | |
Net investment income(b)(c) | | | .24 | | | | .25 | | | | .27 | | | | .18 | | | | .30 | | | | .29 | |
Net realized and unrealized gain (loss) on investment transactions | | | (.24 | ) | | | (.25 | ) | | | .25 | | | | .02 | | | | .32 | | | | (.76 | ) |
| | | | |
Net increase (decrease) in net asset value from operations | | | .00 | (f) | | | .00 | (f) | | | .52 | | | | .20 | | | | .62 | | | | (.47 | ) |
| | | | |
Less: Dividends and Distributions | | | | | | | | | | | | | | | | | | | | | | | | |
Dividends from net investment income | | | (.25 | ) | | | (.26 | ) | | | (.28 | ) | | | (.19 | ) | | | (.31 | ) | | | (.31 | ) |
Distributions from net realized gain on investment transactions | | | (.01 | ) | | | – 0 | – | | | – 0 | – | | | – 0 | – | | | – 0 | – | | | (.04 | ) |
| | | | |
Total dividends and distributions | | | (.26 | ) | | | (.26 | ) | | | (.28 | ) | | | (.19 | ) | | | (.31 | ) | | | (.35 | ) |
| | | | |
Net asset value, end of period | | | $ 11.07 | | | | $ 11.33 | | | | $ 11.59 | | | | $ 11.35 | | | | $ 11.34 | | | | $ 11.03 | |
| | | | |
Total Return | | | | | | | | | | | | | | | | | | | | | | | | |
Total investment return based on net asset value(d) | | | (.01 | )% | | | .03 | % | | | 4.61 | % | | | 1.77 | % | | | 5.70 | % | | | (4.05 | )% |
Ratios/Supplemental Data | | | | | | | | | | | | | | | | | | | | | | | | |
Net assets, end of period (000’s omitted) | | | $63 | | | | $93 | | | | $160 | | | | $399 | | | | $656 | | | | $1,426 | |
Ratio to average net assets of: | | | | | | | | | | | | | | | | | | | | | | | | |
Expenses, net of waivers/reimbursements(e) | | | 1.53 | % | | | 1.52 | % | | | 1.52 | % | | | 1.52 | %^ | | | 1.52 | % | | | 1.52 | % |
Expenses, before waivers/reimbursements(e) | | | 1.66 | % | | | 1.63 | % | | | 1.64 | % | | | 1.63 | %^ | | | 1.61 | % | | | 1.58 | % |
Net investment income(b) | | | 2.14 | % | | | 2.17 | % | | | 2.32 | % | | | 2.39 | %^ | | | 2.69 | % | | | 2.49 | % |
Portfolio turnover rate | | | 19 | % | | | 13 | % | | | 15 | % | | | 12 | % | | | 9 | % | | | 19 | % |
See footnote summary on pages 165-167.
| | |
| abfunds.com | | AB MUNICIPAL INCOME FUND II | 147 |
FINANCIAL HIGHLIGHTS (continued)
Selected Data For A Share Of Beneficial Interest Outstanding Throughout Each Period
| | | | | | | | | | | | | | | | | | | | | | | | |
| | | AB Massachusetts Portfolio | |
| | | Class C | |
| | | Year Ended May 31, | | | October 1,
2014 to
May 31, 2015(a) | | | Year Ended September 30, | |
| | | 2018 | | | 2017 | | | 2016 | | | | 2014 | | | 2013 | |
| | | | |
| | | | | | | | | | | | | | | | | | | | | | | | |
Net asset value, beginning of period | | | $ 11.33 | | | | $ 11.59 | | | | $ 11.35 | | | | $ 11.34 | | | | $ 11.03 | | | | $ 11.85 | |
| | | | |
Income From Investment Operations | | | | | | | | | | | | | | | | | | | | | | | | |
Net investment income(b)(c) | | | .24 | | | | .25 | | | | .26 | | | | .18 | | | | .30 | | | | .29 | |
Net realized and unrealized gain (loss) on investment transactions | | | (.24 | ) | | | (.25 | ) | | | .26 | | | | .02 | | | | .32 | | | | (.76 | ) |
| | | | |
Net increase (decrease) in net asset value from operations | | | .00 | (f) | | | .00 | (f) | | | .52 | | | | .20 | | | | .62 | | | | (.47 | ) |
| | | | |
Less: Dividends and Distributions | | | | | | | | | | | | | | | | | | | | | | | | |
Dividends from net investment income | | | (.25 | ) | | | (.26 | ) | | | (.28 | ) | | | (.19 | ) | | | (.31 | ) | | | (.31 | ) |
Distributions from net realized gain on investment transactions | | | (.01 | ) | | | – 0 | – | | | – 0 | – | | | – 0 | – | | | – 0 | – | | | (.04 | ) |
| | | | |
Total dividends and distributions | | | (.26 | ) | | | (.26 | ) | | | (.28 | ) | | | (.19 | ) | | | (.31 | ) | | | (.35 | ) |
| | | | |
Net asset value, end of period | | | $ 11.07 | | | | $ 11.33 | | | | $ 11.59 | | | | $ 11.35 | | | | $ 11.34 | | | | $ 11.03 | |
| | | | |
Total Return | | | | | | | | | | | | | | | | | | | | | | | | |
Total investment return based on net asset value(d) | | | (.01 | )% | | | .03 | % | | | 4.61 | % | | | 1.77 | % | | | 5.70 | % | | | (4.06 | )% |
Ratios/Supplemental Data | | | | | | | | | | | | | | | | | | | | | | | | |
Net assets, end of period (000’s omitted) | | | $36,735 | | | | $45,530 | | | | $54,482 | | | | $53,570 | | | | $54,108 | | | | $64,298 | |
Ratio to average net assets of: | | | | | | | | | | | | | | | | | | | | | | | | |
Expenses, net of waivers/reimbursements(e) | | | 1.53 | % | | | 1.52 | % | | | 1.52 | % | | | 1.52 | %^ | | | 1.52 | % | | | 1.52 | % |
Expenses, before waivers/reimbursements(e) | | | 1.64 | % | | | 1.63 | % | | | 1.63 | % | | | 1.63 | %^ | | | 1.61 | % | | | 1.59 | % |
Net investment income(b) | | | 2.14 | % | | | 2.17 | % | | | 2.29 | % | | | 2.39 | %^ | | | 2.67 | % | | | 2.49 | % |
Portfolio turnover rate | | | 19 | % | | | 13 | % | | | 15 | % | | | 12 | % | | | 9 | % | | | 19 | % |
See footnote summary on pages 165-167.
| | |
| 148 | AB MUNICIPAL INCOME FUND II | | abfunds.com |
FINANCIAL HIGHLIGHTS (continued)
Selected Data For A Share Of Beneficial Interest Outstanding Throughout Each Period
| | | | | | | | |
| | | AB Massachusetts Portfolio | |
| | | Advisor Class | |
| | | Year Ended
May 31,
2018 | | | July 25,
2016(g) to
May 31,
2017 | |
| | | | |
| | | | | | | | |
Net asset value, beginning of period | | | $ 11.34 | | | | $ 11.72 | |
| | | | |
Income From Investment Operations | | | | | | | | |
Net investment income(b)(c) | | | .35 | | | | .30 | |
Net realized and unrealized loss on investment transactions | | | (.24 | ) | | | (.36 | ) |
| | | | |
Net increase (decrease) in net asset value from operations | | | .11 | | | | (.06 | ) |
| | | | |
Less: Dividends and Distributions | | | | | | | | |
Dividends from net investment income | | | (.36 | ) | | | (.32 | ) |
Distributions from net realized gain on investment transactions | | | (.01 | ) | | | – 0 | – |
| | | | |
Total dividends and distributions | | | (.37 | ) | | | (.32 | ) |
| | | | |
Net asset value, end of period | | | $ 11.08 | | | | $ 11.34 | |
| | | | |
Total Return | | | | | | | | |
Total investment return based on net asset value(d) | | | 1.00 | % | | | (.48 | )% |
Ratios/Supplemental Data | | | | | | | | |
Net assets, end of period (000’s omitted) | | | $50,825 | | | | $42,177 | |
Ratio to average net assets of: | | | | | | | | |
Expenses, net of waivers/reimbursements(e) | | | .54 | % | | | .52 | %^ |
Expenses, before waivers/reimbursements(e) | | | .64 | % | | | .65 | %^ |
Net investment income(b) | | | 3.14 | % | | | 3.22 | %^ |
Portfolio turnover rate | | | 19 | % | | | 13 | % |
See footnote summary on pages 165-167.
| | |
| abfunds.com | | AB MUNICIPAL INCOME FUND II | 149 |
FINANCIAL HIGHLIGHTS (continued)
Selected Data For A Share Of Beneficial Interest Outstanding Throughout Each Period
| | | | | | | | | | | | | | | | | | | | | | | | |
| | | AB Minnesota Portfolio | |
| | | Class A | |
| | | Year Ended May 31, | | | October 1,
2014 to
May 31, 2015(a) | | | Year Ended September 30, | |
| | | 2018 | | | 2017 | | | 2016 | | | | 2014 | | | 2013 | |
| | | | |
| | | | | | | | | | | | | | | | | | | | | | | | |
Net asset value, beginning of period | | | $ 10.33 | | | | $ 10.54 | | | | $ 10.33 | | | | $ 10.46 | | | | $ 10.13 | | | | $ 10.72 | |
| | | | |
Income From Investment Operations | | | | | | | | | | | | | | | | | | | | | | | | |
Net investment income(b)(c) | | | .28 | | | | .29 | | | | .31 | | | | .20 | | | | .31 | | | | .31 | |
Net realized and unrealized gain (loss) on investment transactions | | | (.21 | ) | | | (.19 | ) | | | .22 | | | | (.06 | ) | | | .35 | | | | (.54 | ) |
| | | | |
Net increase (decrease) in net asset value from operations | | | .07 | | | | .10 | | | | .53 | | | | .14 | | | | .66 | | | | (.23 | ) |
| | | | |
Less: Dividends and Distributions | | | | | | | | | | | | | | | | | | | | | | | | |
Dividends from net investment income | | | (.28 | ) | | | (.29 | ) | | | (.32 | ) | | | (.21 | ) | | | (.33 | ) | | | (.32 | ) |
Distributions from net realized gain on investment transactions | | | (.01 | ) | | | (.02 | ) | | | – 0 | – | | | (.06 | ) | | | – 0 | – | | | (.04 | ) |
| | | | |
Total dividends and distributions | | | (.29 | ) | | | (.31 | ) | | | (.32 | ) | | | (.27 | ) | | | (.33 | ) | | | (.36 | ) |
| | | | |
Net asset value, end of period | | | $ 10.11 | | | | $ 10.33 | | | | $ 10.54 | | | | $ 10.33 | | | | $ 10.46 | | | | $ 10.13 | |
| | | | |
Total Return | | | | | | | | | | | | | | | | | | | | | | | | |
Total investment return based on net asset value(d) | | | .69 | % | | | 1.03 | % | | | 5.24 | % | | | 1.37 | % | | | 6.60 | % | | | (2.24 | )% |
Ratios/Supplemental Data | | | | | | | | | | | | | | | | | | | | | | | | |
Net assets, end of period (000’s omitted) | | | $60,997 | | | | $67,611 | | | | $67,380 | | | | $70,197 | | | | $69,595 | | | | $72,221 | |
Ratio to average net assets of: | | | | | | | | | | | | | | | | | | | | | | | | |
Expenses, net of waivers/reimbursements(e) | | | .86 | % | | | .85 | % | | | .86 | % | | | .88 | %^ | | | .90 | % | | | .90 | % |
Expenses, before waivers/reimbursements(e) | | | 1.17 | % | | | 1.11 | % | | | 1.08 | % | | | 1.08 | %^ | | | 1.09 | % | | | 1.02 | % |
Net investment income(b) | | | 2.77 | % | | | 2.77 | % | | | 2.94 | % | | | 2.90 | %^ | | | 3.04 | % | | | 2.93 | % |
Portfolio turnover rate | | | 16 | % | | | 12 | % | | | 10 | % | | | 11 | % | | | 19 | % | | | 17 | % |
See footnote summary on pages 165-167.
| | |
| 150 | AB MUNICIPAL INCOME FUND II | | abfunds.com |
FINANCIAL HIGHLIGHTS (continued)
Selected Data For A Share Of Beneficial Interest Outstanding Throughout Each Period
| | | | | | | | | | | | | | | | | | | | | | | | |
| | | AB Minnesota Portfolio | |
| | | Class B | |
| | | Year Ended May 31, | | | October 1, 2014 to May 31, 2015(a) | | | Year Ended September 30, | |
| | | 2018 | | | 2017 | | | 2016 | | | | 2014 | | | 2013 | |
| | | | |
| | | | | | | | | | | | | | | | | | | | | | | | |
Net asset value, beginning of period | | | $ 10.33 | | | | $ 10.55 | | | | $ 10.33 | | | | $ 10.45 | | | | $ 10.12 | | | | $ 10.71 | |
| | | | |
Income From Investment Operations | | | | | | | | | | | | | | | | | | | | | | | | |
Net investment income(b)(c) | | | .21 | | | | .21 | | | | .23 | | | | .15 | | | | .24 | | | | .24 | |
Net realized and unrealized gain (loss) on investment transactions | | | (.21 | ) | | | (.19 | ) | | | .23 | | | | (.05 | ) | | | .35 | | | | (.54 | ) |
| | | | |
Net increase (decrease) in net asset value from operations | | | .00 | (f) | | | .02 | | | | .46 | | | | .10 | | | | .59 | | | | (.30 | ) |
| | | | |
Less: Dividends and Distributions | | | | | | | | | | | | | | | | | | | | | | | | |
Dividends from net investment income | | | (.20 | ) | | | (.22 | ) | | | (.24 | ) | | | (.16 | ) | | | (.26 | ) | | | (.25 | ) |
Distributions from net realized gain on investment transactions | | | (.01 | ) | | | (.02 | ) | | | – 0 | – | | | (.06 | ) | | | – 0 | – | | | (.04 | ) |
| | | | |
Total dividends and distributions | | | (.21 | ) | | | (.24 | ) | | | (.24 | ) | | | (.22 | ) | | | (.26 | ) | | | (.29 | ) |
| | | | |
Net asset value, end of period | | | $ 10.12 | | | | $ 10.33 | | | | $ 10.55 | | | | $ 10.33 | | | | $ 10.45 | | | | $ 10.12 | |
| | | | |
Total Return | | | | | | | | | | | | | | | | | | | | | | | | |
Total investment return based on net asset value(d) | | | .04 | % | | | .18 | % | | | 4.55 | % | | | .98 | % | | | 5.86 | % | | | (2.92 | )% |
Ratios/Supplemental Data | | | | | | | | | | | | | | | | | | | | | | | | |
Net assets, end of period (000’s omitted) | | | $30 | | | | $41 | | | | $15 | | | | $34 | | | | $91 | | | | $128 | |
Ratio to average net assets of: | | | | | | | | | | | | | | | | | | | | | | | | |
Expenses, net of waivers/reimbursements(e) | | | 1.61 | % | | | 1.60 | % | | | 1.60 | % | | | 1.60 | %^ | | | 1.60 | % | | | 1.60 | % |
Expenses, before waivers/reimbursements(e) | | | 1.98 | % | | | 1.92 | % | | | 1.84 | % | | | 1.82 | %^ | | | 1.81 | % | | | 1.73 | % |
Net investment income(b) | | | 2.02 | % | | | 2.03 | % | | | 2.20 | % | | | 2.18 | %^ | | | 2.34 | % | | | 2.23 | % |
Portfolio turnover rate | | | 16 | % | | | 12 | % | | | 10 | % | | | 11 | % | | | 19 | % | | | 17 | % |
See footnote summary on pages 165-167.
| | |
| abfunds.com | | AB MUNICIPAL INCOME FUND II | 151 |
FINANCIAL HIGHLIGHTS (continued)
Selected Data For A Share Of Beneficial Interest Outstanding Throughout Each Period
| | | | | | | | | | | | | | | | | | | | | | | | |
| | | AB Minnesota Portfolio | |
| | | Class C | |
| | | Year Ended May 31, | | | October 1, 2014 to May 31, 2015(a) | | | Year Ended September 30, | |
| | | 2018 | | | 2017 | | | 2016 | | | | 2014 | | | 2013 | |
| | | | |
| | | | | | | | | | | | | | | | | | | | | | | | |
Net asset value, beginning of period | | | $ 10.34 | | | | $ 10.55 | | | | $ 10.34 | | | | $ 10.47 | | | | $ 10.14 | | | | $ 10.73 | |
| | | | |
Income From Investment Operations | | | | | | | | | | | | | | | | | | | | | | | | |
Net investment income(b)(c) | | | .21 | | | | .21 | | | | .23 | | | | .15 | | | | .24 | | | | .24 | |
Net realized and unrealized gain (loss) on investment transactions | | | (.22 | ) | | | (.18 | ) | | | .23 | | | | (.06 | ) | | | .35 | | | | (.54 | ) |
| | | | |
Net increase (decrease) in net asset value from operations | | | (.01 | ) | | | .03 | | | | .46 | | | | .09 | | | | .59 | | | | (.30 | ) |
| | | | |
Less: Dividends and Distributions | | | | | | | | | | | | | | | | | | | | | | | | |
Dividends from net investment income | | | (.20 | ) | | | (.22 | ) | | | (.25 | ) | | | (.16 | ) | | | (.26 | ) | | | (.25 | ) |
Distributions from net realized gain on investment transactions | | | (.01 | ) | | | (.02 | ) | | | – 0 | – | | | (.06 | ) | | | – 0 | – | | | (.04 | ) |
| | | | |
Total dividends and distributions | | | (.21 | ) | | | (.24 | ) | | | (.25 | ) | | | (.22 | ) | | | (.26 | ) | | | (.29 | ) |
| | | | |
Net asset value, end of period | | | $ 10.12 | | | | $ 10.34 | | | | $ 10.55 | | | | $ 10.34 | | | | $ 10.47 | | | | $ 10.14 | |
| | | | |
Total Return | | | | | | | | | | | | | | | | | | | | | | | | |
Total investment return based on net asset value(d) | | | (.06 | )% | | | .27 | % | | | 4.45 | % | | | .88 | % | | | 5.86 | % | | | (2.92 | )% |
Ratios/Supplemental Data | | | | | | | | | | | | | | | | | | | | | | | | |
Net assets, end of period (000’s omitted) | | | $8,164 | | | | $10,984 | | | | $16,178 | | | | $15,680 | | | | $16,126 | | | | $19,064 | |
Ratio to average net assets of: | | | | | | | | | | | | | | | | | | | | | | | | |
Expenses, net of waivers/reimbursements(e) | | | 1.61 | % | | | 1.60 | % | | | 1.61 | % | | | 1.60 | %^ | | | 1.60 | % | | | 1.60 | % |
Expenses, before waivers/reimbursements(e) | | | 1.92 | % | | | 1.85 | % | | | 1.84 | % | | | 1.81 | %^ | | | 1.79 | % | | | 1.72 | % |
Net investment income(b) | | | 2.02 | % | | | 2.01 | % | | | 2.18 | % | | | 2.17 | %^ | | | 2.34 | % | | | 2.23 | % |
Portfolio turnover rate | | | 16 | % | | | 12 | % | | | 10 | % | | | 11 | % | | | 19 | % | | | 17 | % |
See footnote summary on pages 165-167.
| | |
| 152 | AB MUNICIPAL INCOME FUND II | | abfunds.com |
FINANCIAL HIGHLIGHTS (continued)
Selected Data For A Share Of Beneficial Interest Outstanding Throughout Each Period
| | | | | | | | | | | | | | | | | | | | | | | | |
| | | AB New Jersey Portfolio | |
| | | Class A | |
| | | Year Ended May 31, | | | October 1, 2014 to May 31,
2015(a) | | | Year Ended September 30, | |
| | | 2018 | | | 2017 | | | 2016 | | | | 2014 | | | 2013 | |
| | | | |
| | | | | | | | | | | | | | | | | | | | | | | | |
Net asset value, beginning of period | | | $ 9.78 | | | | $ 9.93 | | | | $ 9.67 | | | | $ 9.76 | | | | $ 9.55 | | | | $ 10.22 | |
| | | | |
Income From Investment Operations | | | | | | | | | | | | | | | | | | | | | | | | |
Net investment income(b)(c) | | | .31 | | | | .32 | | | | .32 | | | | .22 | | | | .35 | | | | .33 | |
Net realized and unrealized gain (loss) on investment transactions | | | (.15 | ) | | | (.14 | ) | | | .28 | | | | (.08 | ) | | | .22 | | | | (.66 | ) |
| | | | |
Net increase (decrease) in net asset value from operations | | | .16 | | | | .18 | | | | .60 | | | | .14 | | | | .57 | | | | (.33 | ) |
| | | | |
Less: Dividends | | | | | | | | | | | | | | | | | | | | | | | | |
Dividends from net investment income | | | (.31 | ) | | | (.33 | ) | | | (.34 | ) | | | (.23 | ) | | | (.36 | ) | | | (.34 | ) |
| | | | |
Net asset value, end of period | | | $ 9.63 | | | | $ 9.78 | | | | $ 9.93 | | | | $ 9.67 | | | | $ 9.76 | | | | $ 9.55 | |
| | | | |
Total Return | | | | | | | | | | | | | | | | | | | | | | | | |
Total investment return based on net asset value(d) | | | 1.65 | % | | | 1.82 | % | | | 6.27 | % | | | 1.43 | % | | | 6.04 | % | | | (3.30 | )% |
Ratios/Supplemental Data | | | | | | | | | | | | | | | | | | | | | | | | |
Net assets, end of period (000’s omitted) | | | $93,552 | | | | $92,494 | | | | $87,365 | | | | $90,559 | | | | $100,039 | | | | $113,048 | |
Ratio to average net assets of: | | | | | | | | | | | | | | | | | | | | | | | | |
Expenses, net of waivers/reimbursements(e) | | | .83 | % | | | .82 | % | | | .82 | % | | | .85 | %^ | | | .87 | % | | | .87 | % |
Expenses, before waivers/reimbursements(e) | | | 1.03 | % | | | 1.01 | % | | | .99 | % | | | 1.00 | %^ | | | 1.00 | % | | | .95 | % |
Net investment income(b) | | | 3.18 | % | | | 3.29 | % | | | 3.33 | % | | | 3.42 | %^ | | | 3.62 | % | | | 3.34 | % |
Portfolio turnover rate | | | 26 | % | | | 8 | % | | | 14 | % | | | 2 | % | | | 16 | % | | | 30 | % |
See footnote summary on pages 165-167.
| | |
| abfunds.com | | AB MUNICIPAL INCOME FUND II | 153 |
FINANCIAL HIGHLIGHTS (continued)
Selected Data For A Share Of Beneficial Interest Outstanding Throughout Each Period
| | | | | | | | | | | | | | | | | | | | | | | | |
| | | AB New Jersey Portfolio | |
| | | Class B | |
| | | Year Ended May 31, | | | October 1, 2014 to May 31,
2015(a) | | | Year Ended September 30, | |
| | | 2018 | | | 2017 | | | 2016 | | | | 2014 | | | 2013 | |
| | | | |
| | | | | | | | | | | | | | | | | | | | | | | | |
Net asset value, beginning of period | | | $ 9.78 | | | | $ 9.93 | | | | $ 9.67 | | | | $ 9.76 | | | | $ 9.55 | | | | $ 10.22 | |
| | | | |
Income From Investment Operations | | | | | | | | | | | | | | | | | | | | | | | | |
Net investment income(b)(c) | | | .24 | | | | .25 | | | | .25 | | | | .18 | | | | .28 | | | | .26 | |
Net realized and unrealized gain (loss) on investment transactions | | | (.15 | ) | | | (.14 | ) | | | .27 | | | | (.09 | ) | | | .22 | | | | (.66 | ) |
| | | | |
Net increase (decrease) in net asset value from operations | | | .09 | | | | .11 | | | | .52 | | | | .09 | | | | .50 | | | | (.40 | ) |
| | | | |
Less: Dividends | | | | | | | | | | | | | | | | | | | | | | | | |
Dividends from net investment income | | | (.24 | ) | | | (.26 | ) | | | (.26 | ) | | | (.18 | ) | | | (.29 | ) | | | (.27 | ) |
| | | | |
Net asset value, end of period | | | $ 9.63 | | | | $ 9.78 | | | | $ 9.93 | | | | $ 9.67 | | | | $ 9.76 | | | | $ 9.55 | |
| | | | |
Total Return | | | | | | | | | | | | | | | | | | | | | | | | |
Total investment return based on net asset value(d) | | | .88 | % | | | 1.10 | % | | | 5.48 | % | | | .95 | % | | | 5.32 | % | | | (3.97 | )% |
Ratios/Supplemental Data | | | | | | | | | | | | | | | | | | | | | | | | |
Net assets, end of period (000’s omitted) | | | $144 | | | | $214 | | | | $282 | | | | $365 | | | | $466 | | | | $978 | |
Ratio to average net assets of: | | | | | | | | | | | | | | | | | | | | | | | | |
Expenses, net of waivers/reimbursements(e) | | | 1.58 | % | | | 1.57 | % | | | 1.57 | % | | | 1.57 | %^ | | | 1.57 | % | | | 1.57 | % |
Expenses, before waivers/reimbursements(e) | | | 1.78 | % | | | 1.76 | % | | | 1.78 | % | | | 1.73 | %^ | | | 1.71 | % | | | 1.65 | % |
Net investment income(b) | | | 2.42 | % | | | 2.53 | % | | | 2.58 | % | | | 2.70 | %^ | | | 2.94 | % | | | 2.62 | % |
Portfolio turnover rate | | | 26 | % | | | 8 | % | | | 14 | % | | | 2 | % | | | 16 | % | | | 30 | % |
See footnote summary on pages 165-167.
| | |
| 154 | AB MUNICIPAL INCOME FUND II | | abfunds.com |
FINANCIAL HIGHLIGHTS (continued)
Selected Data For A Share Of Beneficial Interest Outstanding Throughout Each Period
| | | | | | | | | | | | | | | | | | | | | | | | |
| | | AB New Jersey Portfolio | |
| | | Class C | |
| | | Year Ended May 31, | | | October 1,
2014 to
May 31, 2015(a) | | | Year Ended September 30, | |
| | | 2018 | | | 2017 | | | 2016 | | | | 2014 | | | 2013 | |
| | | | |
| | | | | | | | | | | | | | | | | | | | | | | | |
Net asset value, beginning of period | | | $ 9.79 | | | | $ 9.93 | | | | $ 9.67 | | | | $ 9.77 | | | | $ 9.55 | | | | $ 10.23 | |
| | | | |
Income From Investment Operations | | | | | | | | | | | | | | | | | | | | | | | | |
Net investment income(b)(c) | | | .24 | | | | .25 | | | | .25 | | | | .18 | | | | .28 | | | | .26 | |
Net realized and unrealized gain (loss) on investment transactions | | | (.15 | ) | | | (.14 | ) | | | .27 | | | | (.10 | ) | | | .23 | | | | (.67 | ) |
| | | | |
Net increase (decrease) in net asset value from operations | | | .09 | | | | .11 | | | | .52 | | | | .08 | | | | .51 | | | | (.41 | ) |
| | | | |
Less: Dividends | | | | | | | | | | | | | | | | | | | | | | | | |
Dividends from net investment income | | | (.24 | ) | | | (.25 | ) | | | (.26 | ) | | | (.18 | ) | | | (.29 | ) | | | (.27 | ) |
| | | | |
Net asset value, end of period | | | $ 9.64 | | | | $ 9.79 | | | | $ 9.93 | | | | $ 9.67 | | | | $ 9.77 | | | | $ 9.55 | |
| | | | |
Total Return | | | | | | | | | | | | | | | | | | | | | | | | |
Total investment return based on net asset value(d) | | | .89 | % | | | 1.15 | % | | | 5.47 | % | | | .84 | % | | | 5.41 | % | | | (4.07 | )% |
Ratios/Supplemental Data | | | | | | | | | | | | | | | | | | | | | | | | |
Net assets, end of period (000’s omitted) | | | $14,007 | | | | $17,269 | | | | $30,094 | | | | $28,419 | | | | $29,694 | | | | $32,846 | |
Ratio to average net assets of: | | | | | | | | | | | | | | | | | | | | | | | | |
Expenses, net of waivers/reimbursements(e) | | | 1.58 | % | | | 1.57 | % | | | 1.57 | % | | | 1.57 | %^ | | | 1.57 | % | | | 1.57 | % |
Expenses, before waivers/reimbursements(e) | | | 1.77 | % | | | 1.76 | % | | | 1.74 | % | | | 1.72 | %^ | | | 1.70 | % | | | 1.65 | % |
Net investment income(b) | | | 2.42 | % | | | 2.53 | % | | | 2.58 | % | | | 2.70 | %^ | | | 2.91 | % | | | 2.64 | % |
Portfolio turnover rate | | | 26 | % | | | 8 | % | | | 14 | % | | | 2 | % | | | 16 | % | | | 30 | % |
See footnote summary on pages 165-167.
| | |
| abfunds.com | | AB MUNICIPAL INCOME FUND II | 155 |
FINANCIAL HIGHLIGHTS (continued)
Selected Data For A Share Of Beneficial Interest Outstanding Throughout Each Period
| | | | | | | | | | | | | | | | | | | | | | | | |
| | | AB Ohio Portfolio | |
| | | Class A | |
| | | Year Ended May 31, | | | October 1,
2014 to
May 31, 2015(a) | | | Year Ended September 30, | |
| | | 2018 | | | 2017 | | | 2016 | | | | 2014 | | | 2013 | |
| | | | |
| | | | | | | | | | | | | | | | | | | | | | | | |
Net asset value, beginning of period | | | $ 10.05 | | | | $ 10.20 | | | | $ 9.89 | | | | $ 9.93 | | | | $ 9.80 | | | | $ 10.58 | |
| | | | |
Income From Investment Operations | | | | | | | | | | | | | | | | | | | | | | | | |
Net investment income(b)(c) | | | .28 | | | | .28 | | | | .29 | | | | .21 | | | | .34 | | | | .34 | |
Net realized and unrealized gain (loss) on investment transactions | | | (.22 | ) | | | (.15 | ) | | | .32 | | | | (.03 | ) | | | .14 | | | | (.72 | ) |
Contributions from Affiliates | | | – 0 | – | | | .00 | (f) | | | – 0 | – | | | – 0 | – | | | – 0 | – | | | – 0 | – |
| | | | | | | | | | | | | | | | | | | | | | | | |
Net increase (decrease) in net asset value from operations | | | .06 | | | | .13 | | | | .61 | | | | .18 | | | | .48 | | | | (.38 | ) |
| | | | | | | | | | | | | | | | | | | | | | | | |
Less: Dividends and Distributions | | | | | | | | | | | | | | | | | | | | | | | | |
Dividends from net investment income | | | (.28 | ) | | | (.28 | ) | | | (.30 | ) | | | (.22 | ) | | | (.35 | ) | | | (.35 | ) |
Distributions from net realized gain on investment transactions | | | – 0 | – | | | – 0 | – | | | – 0 | – | | | – 0 | – | | | – 0 | – | | | (.05 | ) |
| | | | |
Total dividends and distributions | | | (.28 | ) | | | (.28 | ) | | | (.30 | ) | | | (.22 | ) | | | (.35 | ) | | | (.40 | ) |
| | | | |
Net asset value, end of period | | | $ 9.83 | | | | $ 10.05 | | | | $ 10.20 | | | | $ 9.89 | | | | $ 9.93 | | | | $ 9.80 | |
| | | | |
Total Return | | | | | | | | | | | | | | | | | | | | | | | | |
Total investment return based on net asset value(d) | | | .58 | % | | | 1.29 | % | | | 6.29 | % | | | 1.76 | % | | | 5.04 | % | | | (3.77 | )% |
Ratios/Supplemental Data | | | | | | | | | | | | | | | | | | | | | | | | |
Net assets, end of period (000’s omitted) | | | $79,767 | | | | $83,417 | | | | $87,480 | | | | $86,775 | | | | $87,685 | | | | $103,466 | |
Ratio to average net assets of: | | | | | | | | | | | | | | | | | | | | | | | | |
Expenses, net of waivers/reimbursements(e) | | | .80 | % | | | .80 | % | | | .80 | % | | | .83 | %^ | | | .85 | % | | | .86 | % |
Expenses, before waivers/reimbursements(e) | | | 1.07 | % | | | 1.03 | % | | | .99 | % | | | 1.01 | %^ | | | 1.02 | % | | | .96 | % |
Net investment income(b) | | | 2.81 | % | | | 2.76 | % | | | 2.90 | % | | | 3.11 | %^ | | | 3.50 | % | | | 3.27 | % |
Portfolio turnover rate | | | 12 | % | | | 5 | % | | | 13 | % | | | 14 | % | | | 17 | % | | | 26 | % |
See footnote summary on pages 165-167.
| | |
| 156 | AB MUNICIPAL INCOME FUND II | | abfunds.com |
FINANCIAL HIGHLIGHTS (continued)
Selected Data For A Share Of Beneficial Interest Outstanding Throughout Each Period
| | | | | | | | | | | | | | | | | | | | | | | | |
| | | AB Ohio Portfolio | |
| | | Class B | |
| | | Year Ended May 31, | | | October 1, 2014 to May 31, 2015(a) | | | Year Ended September 30, | |
| | | 2018 | | | 2017 | | | 2016 | | | | 2014 | | | 2013 | |
| | | | |
| | | | | | | | | | | | | | | | | | | | | | | | |
Net asset value, beginning of period | | | $ 10.04 | | | | $ 10.18 | | | | $ 9.88 | | | | $ 9.92 | | | | $ 9.79 | | | | $ 10.57 | |
| | | | |
Income From Investment Operations | | | | | | | | | | | | | | | | | | | | | | | | |
Net investment income(b)(c) | | | .21 | | | | .20 | | | | .22 | | | | .16 | | | | .28 | | | | .26 | |
Net realized and unrealized gain (loss) on investment transactions | | | (.23 | ) | | | (.14 | ) | | | .31 | | | | (.03 | ) | | | .14 | | | | (.71 | ) |
| | | | |
Net increase (decrease) in net asset value from operations | | | (.02 | ) | | | .06 | | | | .53 | | | | .13 | | | | .42 | | | | (.45 | ) |
| | | | |
Less: Dividends and Distributions | | | | | | | | | | | | | | | | | | | | | | | | |
Dividends from net investment income | | | (.20 | ) | | | (.20 | ) | | | (.23 | ) | | | (.17 | ) | | | (.29 | ) | | | (.28 | ) |
Distributions from net realized gain on investment transactions | | | – 0 | – | | | – 0 | – | | | – 0 | – | | | – 0 | – | | | – 0 | – | | | (.05 | ) |
| | | | |
Total dividends and distributions | | | (.20 | ) | | | (.20 | ) | | | (.23 | ) | | | (.17 | ) | | | (.29 | ) | | | (.33 | ) |
| | | | |
Net asset value, end of period | | | $ 9.82 | | | | $ 10.04 | | | | $ 10.18 | | | | $ 9.88 | | | | $ 9.92 | | | | $ 9.79 | |
| | | | |
Total Return | | | | | | | | | | | | | | | | | | | | | | | | |
Total investment return based on net asset value(d) | | | (.17 | )% | | | .65 | % | | | 5.40 | % | | | 1.28 | % | | | 4.32 | % | | | (4.43 | )% |
Ratios/Supplemental Data | | | | | | | | | | | | | | | | | | | | | | | | |
Net assets, end of period (000’s omitted) | | | $26 | | | | $26 | | | | $52 | | | | $144 | | | | $209 | | | | $810 | |
Ratio to average net assets of: | | | | | | | | | | | | | | | | | | | | | | | | |
Expenses, net of waivers/reimbursements(e) | | | 1.55 | % | | | 1.55 | % | | | 1.55 | % | | | 1.55 | %^ | | | 1.55 | % | | | 1.56 | % |
Expenses, before waivers/reimbursements(e) | | | 1.86 | % | | | 1.85 | % | | | 1.75 | % | | | 1.75 | %^ | | | 1.72 | % | | | 1.66 | % |
Net investment income(b) | | | 2.07 | % | | | 2.00 | % | | | 2.18 | % | | | 2.39 | %^ | | | 2.85 | % | | | 2.57 | % |
Portfolio turnover rate | | | 12 | % | | | 5 | % | | | 13 | % | | | 14 | % | | | 17 | % | | | 26 | % |
See footnote summary on pages 165-167.
| | |
| abfunds.com | | AB MUNICIPAL INCOME FUND II | 157 |
FINANCIAL HIGHLIGHTS (continued)
Selected Data For A Share Of Beneficial Interest Outstanding Throughout Each Period
| | | | | | | | | | | | | | | | | | | | | | | | |
| | | AB Ohio Portfolio | |
| | | Class C | |
| | | Year Ended May 31, | | | October 1,
2014 to
May 31, 2015(a) | | | Year Ended September 30, | |
| | | 2018 | | | 2017 | | | 2016 | | | | 2014 | | | 2013 | |
| | | | |
| | | | | | | | | | | | | | | | | | | | | | | | |
Net asset value, beginning of period | | | $ 10.04 | | | | $ 10.19 | | | | $ 9.88 | | | | $ 9.92 | | | | $ 9.80 | | | | $ 10.58 | |
| | | | |
Income From Investment Operations | | | | | | | | | | | | | | | | | | | | | | | | |
Net investment income(b)(c) | | | .20 | | | | .20 | | | | .22 | | | | .16 | | | | .27 | | | | .27 | |
Net realized and unrealized gain (loss) on investment transactions | | | (.21 | ) | | | (.15 | ) | | | .32 | | | | (.03 | ) | | | .14 | | | | (.73 | ) |
| | | | |
Net increase (decrease) in net asset value from operations | | | (.01 | ) | | | .05 | | | | .54 | | | | .13 | | | | .41 | | | | (.46 | ) |
| | | | |
Less: Dividends and Distributions | | | | | | | | | | | | | | | | | | | | | | | | |
Dividends from net investment income | | | (.20 | ) | | | (.20 | ) | | | (.23 | ) | | | (.17 | ) | | | (.29 | ) | | | (.27 | ) |
Distributions from net realized gain on investment transactions | | | – 0 | – | | | – 0 | – | | | – 0 | – | | | – 0 | – | | | – 0 | – | | | (.05 | ) |
| | | | |
Total dividends and distributions | | | (.20 | ) | | | (.20 | ) | | | (.23 | ) | | | (.17 | ) | | | (.29 | ) | | | (.32 | ) |
| | | | |
Net asset value, end of period | | | $ 9.83 | | | | $ 10.04 | | | | $ 10.19 | | | | $ 9.88 | | | | $ 9.92 | | | | $ 9.80 | |
| | | | |
Total Return | | | | | | | | | | | | | | | | | | | | | | | | |
Total investment return based on net asset value(d) | | | (.07 | )% | | | .53 | % | | | 5.50 | % | | | 1.28 | % | | | 4.21 | % | | | (4.44 | )% |
Ratios/Supplemental Data | | | | | | | | | | | | | | | | | | | | | | | | |
Net assets, end of period (000’s omitted) | | | $11,967 | | | | $13,701 | | | | $27,045 | | | | $29,673 | | | | $31,409 | | | | $37,947 | |
Ratio to average net assets of: | | | | | | | | | | | | | | | | | | | | | | | | |
Expenses, net of waivers/reimbursements(e) | | | 1.55 | % | | | 1.55 | % | | | 1.55 | % | | | 1.55 | %^ | | | 1.55 | % | | | 1.56 | % |
Expenses, before waivers/reimbursements(e) | | | 1.82 | % | | | 1.78 | % | | | 1.74 | % | | | 1.74 | %^ | | | 1.72 | % | | | 1.66 | % |
Net investment income(b) | | | 2.06 | % | | | 2.00 | % | | | 2.15 | % | | | 2.39 | %^ | | | 2.81 | % | | | 2.58 | % |
Portfolio turnover rate | | | 12 | % | | | 5 | % | | | 13 | % | | | 14 | % | | | 17 | % | | | 26 | % |
See footnote summary on pages 165-167.
| | |
| 158 | AB MUNICIPAL INCOME FUND II | | abfunds.com |
FINANCIAL HIGHLIGHTS (continued)
Selected Data For A Share Of Beneficial Interest Outstanding Throughout Each Period
| | | | | | | | | | | | | | | | | | | | | | | | |
| | | AB Pennsylvania Portfolio | |
| | | Class A | |
| | | Year Ended May 31, | | | October 1,
2014 to
May 31, 2015(a) | | | Year Ended September 30, | |
| | | 2018 | | | 2017 | | | 2016 | | | | 2014 | | | 2013 | |
| | | | |
| | | | | | | | | | | | | | | | | | | | | | | | |
Net asset value, beginning of period | | | $ 10.54 | | | | $ 10.70 | | | | $ 10.42 | | | | $ 10.43 | | | | $ 10.11 | | | | $ 10.95 | |
| | | | |
Income From Investment Operations | | | | | | | | | | | | | | | | | | | | | | | | |
Net investment income(b)(c) | | | .30 | | | | .31 | | | | .32 | | | | .22 | | | | .34 | | | | .34 | |
Net realized and unrealized gain (loss) on investment transactions | | | (.19 | ) | | | (.16 | ) | | | .28 | | | | (.01 | ) | | | .35 | | | | (.75 | ) |
| | | | |
Net increase (decrease) in net asset value from operations | | | .11 | | | | .15 | | | | .60 | | | | .21 | | | | .69 | | | | (.41 | ) |
| | | | |
Less: Dividends and Distributions | | | | | | | | | | | | | | | | | | | | | | | | |
Dividends from net investment income | | | (.30 | ) | | | (.31 | ) | | | (.32 | ) | | | (.22 | ) | | | (.34 | ) | | | (.34 | ) |
Distributions from net realized gain on investment transactions | | | – 0 | – | | | – 0 | – | | | – 0 | – | | | – 0 | – | | | (.03 | ) | | | (.09 | ) |
| | | | |
Total dividends and distributions | | | (.30 | ) | | | (.31 | ) | | | (.32 | ) | | | (.22 | ) | | | (.37 | ) | | | (.43 | ) |
| | | | |
Net asset value, end of period | | | $ 10.35 | | | | $ 10.54 | | | | $ 10.70 | | | | $ 10.42 | | | | $ 10.43 | | | | $ 10.11 | |
| | | | |
Total Return | | | | | | | | | | | | | | | | | | | | | | | | |
Total investment return based on net asset value(d) | | | 1.10 | % | | | 1.41 | % | | | 5.83 | % | | | 1.99 | % | | | 6.93 | % | | | (3.82 | )% |
Ratios/Supplemental Data | | | | | | | | | | | | | | | | | | | | | | | | |
Net assets, end of period (000’s omitted) | | | $80,666 | | | | $83,620 | | | | $74,734 | | | | $78,907 | | | | $82,402 | | | | $88,199 | |
Ratio to average net assets of: | | | | | | | | | | | | | | | | | | | | | | | | |
Expenses, net of waivers/reimbursements(e) | | | .86 | % | | | .85 | % | | | .85 | % | | | .88 | %^ | | | .90 | % | | | .92 | % |
Expenses, before waivers/reimbursements(e) | | | 1.09 | % | | | 1.05 | % | | | 1.03 | % | | | 1.04 | %^ | | | 1.07 | % | | | 1.01 | % |
Net investment income(b) | | | 2.91 | % | | | 2.91 | % | | | 3.02 | % | | | 3.10 | %^ | | | 3.29 | % | | | 3.23 | % |
Portfolio turnover rate | | | 38 | % | | | 24 | % | | | 11 | % | | | 2 | % | | | 25 | % | | | 17 | % |
See footnote summary on pages 165-167.
| | |
| abfunds.com | | AB MUNICIPAL INCOME FUND II | 159 |
FINANCIAL HIGHLIGHTS (continued)
Selected Data For A Share Of Beneficial Interest Outstanding Throughout Each Period
| | | | | | | | | | | | | | | | | | | | | | | | |
| | | AB Pennsylvania Portfolio | |
| | | Class B | |
| | | Year Ended May 31, | | | October 1, 2014 to May 31, 2015(a) | | | Year Ended September 30, | |
| | | 2018 | | | 2017 | | | 2016 | | | | 2014 | | | 2013 | |
| | | | |
| | | | | | | | | | | | | | | | | | | | | | | | |
Net asset value, beginning of period | | | $ 10.54 | | | | $ 10.70 | | | | $ 10.42 | | | | $ 10.43 | | | | $ 10.11 | | | | $ 10.95 | |
| | | | |
Income From Investment Operations | | | | | | | | | | | | | | | | | | | | | | | | |
Net investment income(b)(c) | | | .23 | | | | .23 | | | | .24 | | | | .17 | | | | .27 | | | | .27 | |
Net realized and unrealized gain (loss) on investment transactions | | | (.19 | ) | | | (.16 | ) | | | .28 | | | | (.01 | ) | | | .34 | | | | (.75 | ) |
| | | | |
Net increase (decrease) in net asset value from operations | | | .04 | | | | .07 | | | | .52 | | | | .16 | | | | .61 | | | | (.48 | ) |
| | | | |
Less: Dividends and Distributions | | | | | | | | | | | | | | | | | | | | | | | | |
Dividends from net investment income | | | (.23 | ) | | | (.23 | ) | | | (.24 | ) | | | (.17 | ) | | | (.26 | ) | | | (.27 | ) |
Distributions from net realized gain on investment transactions | | | – 0 | – | | | – 0 | – | | | – 0 | – | | | – 0 | – | | | (.03 | ) | | | (.09 | ) |
| | | | |
Total dividends and distributions | | | (.23 | ) | | | (.23 | ) | | | (.24 | ) | | | (.17 | ) | | | (.29 | ) | | | (.36 | ) |
| | | | |
Net asset value, end of period | | | $ 10.35 | | | | $ 10.54 | | | | $ 10.70 | | | | $ 10.42 | | | | $ 10.43 | | | | $ 10.11 | |
| | | | |
Total Return | | | | | | | | | | | | | | | | | | | | | | | | |
Total investment return based on net asset value(d) | | | .35 | % | | | .65 | % | | | 5.04 | % | | | 1.50 | % | | | 6.19 | % | | | (4.49 | )% |
Ratios/Supplemental Data | | | | | | | | | | | | | | | | | | | | | | | | |
Net assets, end of period
(000’s omitted) | | | $35 | | | | $62 | | | | $74 | | | | $168 | | | | $340 | | | | $901 | |
Ratio to average net assets of: | | | | | | | | | | | | | | | | | | | | | | | | |
Expenses, net of waivers/reimbursements(e) | | | 1.61 | % | | | 1.60 | % | | | 1.60 | % | | | 1.60 | %^ | | | 1.60 | % | | | 1.62 | % |
Expenses, before waivers/reimbursements(e) | | | 1.91 | % | | | 1.79 | % | | | 1.88 | % | | | 1.79 | %^ | | | 1.78 | % | | | 1.72 | % |
Net investment income(b) | | | 2.15 | % | | | 2.15 | % | | | 2.28 | % | | | 2.38 | %^ | | | 2.62 | % | | | 2.51 | % |
Portfolio turnover rate | | | 38 | % | | | 24 | % | | | 11 | % | | | 2 | % | | | 25 | % | | | 17 | % |
See footnote summary on pages 165-167.
| | |
| 160 | AB MUNICIPAL INCOME FUND II | | abfunds.com |
FINANCIAL HIGHLIGHTS (continued)
Selected Data For A Share Of Beneficial Interest Outstanding Throughout Each Period
| | | | | | | | | | | | | | | | | | | | | | | | |
| | | AB Pennsylvania Portfolio | |
| | | Class C | |
| | | Year Ended May 31, | | | October 1,
2014 to
May 31, 2015(a) | | | Year Ended September 30, | |
| | | 2018 | | | 2017 | | | 2016 | | | | 2014 | | | 2013 | |
| | | | |
| | | | | | | | | | | | | | | | | | | | | | | | |
Net asset value, beginning of period | | | $ 10.55 | | | | $ 10.70 | | | | $ 10.42 | | | | $ 10.43 | | | | $ 10.11 | | | | $ 10.95 | |
| | | | |
Income From Investment Operations | | | | | | | | | | | | | | | | | | | | | | | | |
Net investment income(b)(c) | | | .23 | | | | .23 | | | | .24 | | | | .17 | | | | .26 | | | | .27 | |
Net realized and unrealized gain (loss) on investment transactions | | | (.19 | ) | | | (.15 | ) | | | .28 | | | | (.01 | ) | | | .35 | | | | (.75 | ) |
| | | | |
Net increase (decrease) in net asset value from operations | | | .04 | | | | .08 | | | | .52 | | | | .16 | | | | .61 | | | | (.48 | ) |
| | | | |
Less: Dividends and Distributions | | | | | | | | | | | | | | | | | | | | | | | | |
Dividends from net investment income | | | (.23 | ) | | | (.23 | ) | | | (.24 | ) | | | (.17 | ) | | | (.26 | ) | | | (.27 | ) |
Distributions from net realized gain on investment transactions | | | – 0 | – | | | – 0 | – | | | – 0 | – | | | – 0 | – | | | (.03 | ) | | | (.09 | ) |
| | | | |
Total dividends and distributions | | | (.23 | ) | | | (.23 | ) | | | (.24 | ) | | | (.17 | ) | | | (.29 | ) | | | (.36 | ) |
| | | | |
Net asset value, end of period | | | $ 10.36 | | | | $ 10.55 | | | | $ 10.70 | | | | $ 10.42 | | | | $ 10.43 | | | | $ 10.11 | |
| | | | |
Total Return | | | | | | | | | | | | | | | | | | | | | | | | |
Total investment return based on net asset value(d) | | | .35 | % | | | .74 | % | | | 5.04 | % | | | 1.49 | % | | | 6.19 | % | | | (4.49 | )% |
Ratios/Supplemental Data | | | | | | | | | | | | | | | | | | | | | | | | |
Net assets, end of period
(000’s omitted) | | | $8,686 | | | | $11,237 | | | | $22,356 | | | | $21,635 | | | | $22,057 | | | | $23,789 | |
Ratio to average net assets of: | | | | | | | | | | | | | | | | | | | | | | | | |
Expenses, net of waivers/reimbursements(e) | | | 1.61 | % | | | 1.60 | % | | | 1.60 | % | | | 1.60 | %^ | | | 1.60 | % | | | 1.62 | % |
Expenses, before waivers/reimbursements(e) | | | 1.84 | % | | | 1.79 | % | | | 1.78 | % | | | 1.77 | %^ | | | 1.77 | % | | | 1.71 | % |
Net investment income(b) | | | 2.16 | % | | | 2.15 | % | | | 2.27 | % | | | 2.38 | %^ | | | 2.59 | % | | | 2.53 | % |
Portfolio turnover rate | | | 38 | % | | | 24 | % | | | 11 | % | | | 2 | % | | | 25 | % | | | 17 | % |
See footnote summary on pages 165-167.
| | |
| abfunds.com | | AB MUNICIPAL INCOME FUND II | 161 |
FINANCIAL HIGHLIGHTS (continued)
Selected Data For A Share Of Beneficial Interest Outstanding Throughout Each Period
| | | | | | | | | | | | | | | | | | | | | | | | |
| | | AB Virginia Portfolio | |
| | | Class A | |
| | | Year Ended May 31, | | | October 1, 2014 to May 31, 2015(a) | | | Year Ended September 30, | |
| | | 2018 | | | 2017 | | | 2016 | | | | 2014 | | | 2013 | |
| | | | |
| | | | | | | | | | | | | | | | | | | | | | | | |
Net asset value, beginning of period | | | $ 11.19 | | | | $ 11.39 | | | | $ 11.11 | | | | $ 11.13 | | | | $ 10.70 | | | | $ 11.61 | |
| | | | |
Income From Investment Operations | | | | | | | | | | | | | | | | | | | | | | | | |
Net investment income(b)(c) | | | .32 | | | | .32 | | | | .34 | | | | .23 | | | | .36 | | | | .34 | |
Net realized and unrealized gain (loss) on investment transactions | | | (.20 | ) | | | (.18 | ) | | | .29 | | | | (.01 | ) | | | .44 | | | | (.81 | ) |
| | | | |
Net increase (decrease) in net asset value from operations | | | .12 | | | | .14 | | | | .63 | | | | .22 | | | | .80 | | | | (.47 | ) |
| | | | |
Less: Dividends and Distributions | | | | | | | | | | | | | | | | | | | | | | | | |
Dividends from net investment income | | | (.32 | ) | | | (.34 | ) | | | (.35 | ) | | | (.24 | ) | | | (.37 | ) | | | (.35 | ) |
Distributions from net realized gain on investment transactions | | | – 0 | – | | | – 0 | – | | | – 0 | – | | | – 0 | – | | | – 0 | – | | | (.09 | ) |
| | | | |
Total dividends and distributions | | | (.32 | ) | | | (.34 | ) | | | (.35 | ) | | | (.24 | ) | | | (.37 | ) | | | (.44 | ) |
| | | | |
Net asset value, end of period | | | $ 10.99 | | | | $ 11.19 | | | | $ 11.39 | | | | $ 11.11 | | | | $ 11.13 | | | | $ 10.70 | |
| | | | |
Total Return | | | | | | | | | | | | | | | | | | | | | | | | |
Total investment return based on net asset value(d) | | | 1.10 | % | | | 1.23 | % | | | 5.77 | % | | | 1.94 | % | | | 7.60 | % | | | (4.21 | )% |
Ratios/Supplemental Data | | | | | | | | | | | | | | | | | | | | | | | | |
Net assets, end of period (000’s omitted) | | | $139,827 | | | | $159,689 | | | | $189,953 | | | | $181,642 | | | | $173,381 | | | | $186,429 | |
Ratio to average net assets of: | | | | | | | | | | | | | | | | | | | | | | | | |
Expenses, net of waivers/reimbursements(e) | | | .81 | % | | | .80 | % | | | .80 | % | | | .80 | %^ | | | .80 | % | | | .77 | % |
Expenses, before waivers/reimbursements(e) | | | .89 | % | | | .88 | % | | | .87 | % | | | .90 | %^ | | | .92 | % | | | .88 | % |
Net investment income(b) | | | 2.85 | % | | | 2.89 | % | | | 3.02 | % | | | 3.05 | %^ | | | 3.29 | % | | | 2.98 | % |
Portfolio turnover rate | | | 18 | % | | | 16 | % | | | 7 | % | | | 5 | % | | | 8 | % | | | 16 | % |
See footnote summary on pages 165-167.
| | |
| 162 | AB MUNICIPAL INCOME FUND II | | abfunds.com |
FINANCIAL HIGHLIGHTS (continued)
Selected Data For A Share Of Beneficial Interest Outstanding Throughout Each Period
| | | | | | | | | | | | | | | | | | | | | | | | |
| | | AB Virginia Portfolio | |
| | | Class B | |
| | | Year Ended May 31, | | | October 1,
2014 to
May 31, 2015(a) | | | Year Ended September 30, | |
| | | 2018 | | | 2017 | | | 2016 | | | | 2014 | | | 2013 | |
| | | | |
| | | | | | | | | | | | | | | | | | | | | | | | |
Net asset value, beginning of period | | | $ 11.17 | | | | $ 11.37 | | | | $ 11.09 | | | | $ 11.11 | | | | $ 10.68 | | | | $ 11.59 | |
| | | | |
Income From Investment Operations | | | | | | | | | | | | | | | | | | | | | | | | |
Net investment income(b)(c) | | | .24 | | | | .24 | | | | .26 | | | | .17 | | | | .29 | | | | .26 | |
Net realized and unrealized gain (loss) on investment transactions | | | (.20 | ) | | | (.19 | ) | | | .29 | | | | (.01 | ) | | | .43 | | | | (.81 | ) |
| | | | |
Net increase (decrease) in net asset value from operations | | | .04 | | | | .05 | | | | .55 | | | | .16 | | | | .72 | | | | (.55 | ) |
| | | | |
Less: Dividends and Distributions | | | | | | | | | | | | | | | | | | | | | | | | |
Dividends from net investment income | | | (.24 | ) | | | (.25 | ) | | | (.27 | ) | | | (.18 | ) | | | (.29 | ) | | | (.27 | ) |
Distributions from net realized gain on investment transactions | | | – 0 | – | | | – 0 | – | | | – 0 | – | | | – 0 | – | | | – 0 | – | | | (.09 | ) |
| | | | |
Total dividends and distributions | | | (.24 | ) | | | (.25 | ) | | | (.27 | ) | | | (.18 | ) | | | (.29 | ) | | | (.36 | ) |
| | | | |
Net asset value, end of period | | | $ 10.97 | | | | $ 11.17 | | | | $ 11.37 | | | | $ 11.09 | | | | $ 11.11 | | | | $ 10.68 | |
| | | | |
Total Return | | | | | | | | | | | | | | | | | | | | | | | | |
Total investment return based on net asset value(d) | | | .34 | % | | | .48 | % | | | 4.99 | % | | | 1.46 | % | | | 6.87 | % | | | (4.88 | )% |
Ratios/Supplemental Data | | | | | | | | | | | | | | | | | | | | | | | | |
Net assets, end of period (000’s omitted) | | | $46 | | | | $111 | | | | $126 | | | | $340 | | | | $668 | | | | $1,267 | |
Ratio to average net assets of: | | | | | | | | | | | | | | | | | | | | | | | | |
Expenses, net of waivers/reimbursements(e) | | | 1.56 | % | | | 1.55 | % | | | 1.55 | % | | | 1.52 | %^ | | | 1.50 | % | | | 1.47 | % |
Expenses, before waivers/reimbursements(e) | | | 1.68 | % | | | 1.64 | % | | | 1.65 | % | | | 1.63 | %^ | | | 1.62 | % | | | 1.59 | % |
Net investment income(b) | | | 2.11 | % | | | 2.15 | % | | | 2.28 | % | | | 2.34 | %^ | | | 2.63 | % | | | 2.28 | % |
Portfolio turnover rate | | | 18 | % | | | 16 | % | | | 7 | % | | | 5 | % | | | 8 | % | | | 16 | % |
See footnote summary on pages 165-167.
| | |
| abfunds.com | | AB MUNICIPAL INCOME FUND II | 163 |
FINANCIAL HIGHLIGHTS (continued)
Selected Data For A Share Of Beneficial Interest Outstanding Throughout Each Period
| | | | | | | | | | | | | | | | | | | | | | | | |
| | | AB Virginia Portfolio | |
| | | Class C | |
| | | Year Ended May 31, | | | October 1,
2014 to
May 31, 2015(a) | | | Year Ended September 30, | |
| | | 2018 | | | 2017 | | | 2016 | | | | 2014 | | | 2013 | |
| | | | |
| | | | | | | | | | | | | | | | | | | | | | | | |
Net asset value, beginning of period | | | $ 11.16 | | | | $ 11.36 | | | | $ 11.08 | | | | $ 11.10 | | | | $ 10.67 | | | | $ 11.59 | |
| | | | |
Income From Investment Operations | | | | | | | | | | | | | | | | | | | | | | | | |
Net investment income(b)(c) | | | .23 | | | | .24 | | | | .25 | | | | .17 | | | | .28 | | | | .26 | |
Net realized and unrealized gain (loss) on investment transactions | | | (.19 | ) | | | (.19 | ) | | | .30 | �� | | | (.01 | ) | | | .44 | | | | (.82 | ) |
| | | | |
Net increase (decrease) in net asset value from operations | | | .04 | | | | .05 | | | | .55 | | | | .16 | | | | .72 | | | | (.56 | ) |
| | | | |
Less: Dividends and Distributions | | | | | | | | | | | | | | | | | | | | | | | | |
Dividends from net investment income | | | (.24 | ) | | | (.25 | ) | | | (.27 | ) | | | (.18 | ) | | | (.29 | ) | | | (.27 | ) |
Distributions from net realized gain on investment transactions | | | – 0 | – | | | – 0 | – | | | – 0 | – | | | – 0 | – | | | – 0 | – | | | (.09 | ) |
| | | | |
Total dividends and distributions | | | (.24 | ) | | | (.25 | ) | | | (.27 | ) | | | (.18 | ) | | | (.29 | ) | | | (.36 | ) |
| | | | |
Net asset value, end of period | | | $ 10.96 | | | | $ 11.16 | | | | $ 11.36 | | | | $ 11.08 | | | | $ 11.10 | | | | $ 10.67 | |
| | | | |
Total Return | | | | | | | | | | | | | | | | | | | | | | | | |
Total investment return based on net asset value(d) | | | .35 | % | | | .48 | % | | | 5.00 | % | | | 1.46 | % | | | 6.88 | % | | | (4.97 | )% |
Ratios/Supplemental Data | | | | | | | | | | | | | | | | | | | | | | | | |
Net assets, end of period (000’s omitted) | | | $35,435 | | | | $41,823 | | | | $56,080 | | | | $54,359 | | | | $55,038 | | | | $59,194 | |
Ratio to average net assets of: | | | | | | | | | | | | | | | | | | | | | | | | |
Expenses, net of waivers/reimbursements(e) | | | 1.56 | % | | | 1.55 | % | | | 1.55 | % | | | 1.53 | %^ | | | 1.50 | % | | | 1.47 | % |
Expenses, before waivers/reimbursements(e) | | | 1.65 | % | | | 1.63 | % | | | 1.62 | % | | | 1.63 | %^ | | | 1.62 | % | | | 1.59 | % |
Net investment income(b) | | | 2.11 | % | | | 2.15 | % | | | 2.28 | % | | | 2.34 | %^ | | | 2.60 | % | | | 2.29 | % |
Portfolio turnover rate | | | 18 | % | | | 16 | % | | | 7 | % | | | 5 | % | | | 8 | % | | | 16 | % |
See footnote summary on pages 165-167.
| | |
| 164 | AB MUNICIPAL INCOME FUND II | | abfunds.com |
FINANCIAL HIGHLIGHTS (continued)
Selected Data For A Share Of Beneficial Interest Outstanding Throughout Each Period
| | | | | | | | |
| | | AB Virginia Portfolio | |
| | | Advisor Class | |
| | | Year Ended
May 31,
2018 | | | July 25,
2016(g) to
May 31,
2017 | |
| | | | |
| | | | | | | | |
Net asset value, beginning of period | | | $ 11.19 | | | | $ 11.49 | |
| | | | |
Income From Investment Operations | | | | | | | | |
Net investment income(b)(c) | | | .34 | | | | .30 | |
Net realized and unrealized loss on investment transactions | | | (.19 | ) | | | (.29 | ) |
| | | | |
Net increase in net asset value from operations | | | .15 | | | | .01 | |
| | | | |
Less: Dividends | | | | | | | | |
Dividends from net investment income | | | (.35 | ) | | | (.31 | ) |
| | | | |
Net asset value, end of period | | | $ 10.99 | | | | $ 11.19 | |
| | | | |
Total Return | | | | | | | | |
Total investment return based on net asset value(d) | | | 1.35 | % | | | .14 | % |
Ratios/Supplemental Data | | | | | | | | |
Net assets, end of period (000’s omitted) | | | $41,188 | | | | $28,278 | |
Ratio to average net assets of: | | | | | | | | |
Expenses, net of waivers/reimbursements(e) | | | .56 | % | | | .55 | %^ |
Expenses, before waivers/reimbursements(e) | | | .64 | % | | | .66 | %^ |
Net investment income(b) | | | 3.10 | % | | | 3.24 | %^ |
Portfolio turnover rate | | | 18 | % | | | 16 | % |
| (a) | The Portfolio changed its fiscal year end from September 30 to May 31. |
| (b) | Net of fees waived and expenses reimbursed by the Adviser. |
| (c) | Based on average shares outstanding. |
| (d) | Total investment return is calculated assuming an initial investment made at the net asset value at the beginning of the period, reinvestment of all dividends and distributions at net asset value during the period, and redemption on the last day of the period. Initial sales charges or contingent deferred sales charges are not reflected in the calculation of total investment return. Total return does not reflect the deduction of taxes that a shareholder would pay on fund distributions or the redemption of fund shares. Total investment return calculated for a period of less than one year is not annualized. |
| (e) | The expense ratios presented below exclude interest expense: |
| | | | | | | | | | | | | | | | | | | | | | | | |
| | | Year Ended May 31, | | | October 1,
2014 to
May 31,
2015(a) | | | Year Ended
September 30, | |
| | | 2018 | | | 2017 | | | 2016 | | | | 2014 | | | 2013 | |
| | | | |
AB Arizona Portfolio | | | | | | | | | | | | | | | | | | | | | | | | |
Class A | | | | | | | | | | | | | | | | | | | | | | | | |
Net of waivers | | | .78 | % | | | .78 | % | | | .78 | % | | | .78 | %^ | | | .78 | % | | | .78 | % |
Before waivers | | | .99 | % | | | .97 | % | | | .96 | % | | | .97 | %^ | | | .98 | % | | | .92 | % |
Class B | | | | | | | | | | | | | | | | | | | | | | | | |
Net of waivers | | | 1.51 | % | | | 1.53 | % | | | 1.53 | % | | | 1.50 | %^ | | | 1.48 | % | | | 1.48 | % |
Before waivers | | | 1.72 | % | | | 1.73 | % | | | 1.71 | % | | | 1.70 | %^ | | | 1.68 | % | | | 1.63 | % |
Class C | | | | | | | | | | | | | | | | | | | | | | | | |
Net of waivers | | | 1.53 | % | | | 1.53 | % | | | 1.53 | % | | | 1.50 | %^ | | | 1.48 | % | | | 1.48 | % |
Before waivers | | | 1.74 | % | | | 1.72 | % | | | 1.71 | % | | | 1.70 | %^ | | | 1.68 | % | | | 1.63 | % |
| | |
| abfunds.com | | AB MUNICIPAL INCOME FUND II | 165 |
FINANCIAL HIGHLIGHTS (continued)
Selected Data For A Share Of Beneficial Interest Outstanding Throughout Each Period
| | | | | | | | | | | | | | | | | | | | | | | | |
| | | Year Ended May 31, | | | October 1,
2014 to
May 31,
2015(a) | | | Year Ended
September 30, | |
| | | 2018 | | | 2017 | | | 2016 | | | | 2014 | | | 2013 | |
| | | | |
AB Massachusetts Portfolio | | | | | | | | | | | | | | | | | | | | | |
Class A | | | | | | | | | | | | | | | | | | | | | | | | |
Net of waivers | | | .77 | % | | | N/A | | | | N/A | | | | N/A | | | | N/A | | | | N/A | |
Before waivers | | | .88 | % | | | N/A | | | | N/A | | | | N/A | | | | N/A | | | | N/A | |
Class B | | | | | | | | | | | | | | | | | | | | | | | | |
Net of waivers | | | 1.52 | % | | | N/A | | | | N/A | | | | N/A | | | | N/A | | | | N/A | |
Before waivers | | | 1.65 | % | | | N/A | | | | N/A | | | | N/A | | | | N/A | | | | N/A | |
Class C | | | | | | | | | | | | | | | | | | | | | | | | |
Net of waivers | | | 1.52 | % | | | N/A | | | | N/A | | | | N/A | | | | N/A | | | | N/A | |
Before waivers | | | 1.63 | % | | | N/A | | | | N/A | | | | N/A | | | | N/A | | | | N/A | |
Advisor Class | | | | | | | | | | | | | | | | | | | | | | | | |
Net of waivers | | | .52 | % | | | N/A | | | | N/A | | | | N/A | | | | N/A | | | | N/A | |
Before waivers | | | .63 | % | | | N/A | | | | N/A | | | | N/A | | | | N/A | | | | N/A | |
| | | | | | |
AB Minnesota Portfolio | | | | | | | | | | | | | | | | | | | | | | | | |
Class A | | | | | | | | | | | | | | | | | | | | | | | | |
Net of waivers | | | .85 | % | | | .85 | % | | | .85 | % | | | .88 | %^ | | | .90 | % | | | .90 | % |
Before waivers | | | 1.16 | % | | | 1.11 | % | | | 1.08 | % | | | 1.08 | %^ | | | 1.09 | % | | | 1.02 | % |
Class B | | | | | | | | | | | | | | | | | | | | | | | | |
Net of waivers | | | 1.60 | % | | | 1.60 | % | | | 1.60 | % | | | 1.60 | %^ | | | 1.60 | % | | | 1.60 | % |
Before waivers | | | 1.97 | % | | | 1.92 | % | | | 1.84 | % | | | 1.82 | %^ | | | 1.81 | % | | | 1.73 | % |
Class C | | | | | | | | | | | | | | | | | | | | | | | | |
Net of waivers | | | 1.60 | % | | | 1.60 | % | | | 1.60 | % | | | 1.60 | %^ | | | 1.60 | % | | | 1.60 | % |
Before waivers | | | 1.91 | % | | | 1.85 | % | | | 1.83 | % | | | 1.81 | %^ | | | 1.79 | % | | | 1.72 | % |
| | | | | | |
AB New Jersey Portfolio | | | | | | | | | | | | | | | | | | | | | | | | |
Class A | | | | | | | | | | | | | | | | | | | | | | | | |
Net of waivers | | | .82 | % | | | N/A | | | | N/A | | | | N/A | | | | N/A | | | | N/A | |
Before waivers | | | 1.02 | % | | | N/A | | | | N/A | | | | N/A | | | | N/A | | | | N/A | |
Class B | | | | | | | | | | | | | | | | | | | | | | | | |
Net of waivers | | | 1.57 | % | | | N/A | | | | N/A | | | | N/A | | | | N/A | | | | N/A | |
Before waivers | | | 1.77 | % | | | N/A | | | | N/A | | | | N/A | | | | N/A | | | | N/A | |
Class C | | | | | | | | | | | | | | | | | | | | | | | | |
Net of waivers | | | 1.57 | % | | | N/A | | | | N/A | | | | N/A | | | | N/A | | | | N/A | |
Before waivers | | | 1.77 | % | | | N/A | | | | N/A | | | | N/A | | | | N/A | | | | N/A | |
| | | | | | |
AB Ohio Portfolio | | | | | | | | | | | | | | | | | | | | | | | | |
Class A | | | | | | | | | | | | | | | | | | | | | | | | |
Net of waivers | | | .80 | % | | | .80 | % | | | .80 | % | | | .83 | %^ | | | .85 | % | | | .85 | % |
Before waivers | | | 1.06 | % | | | 1.03 | % | | | .99 | % | | | 1.01 | %^ | | | 1.01 | % | | | .96 | % |
Class B | | | | | | | | | | | | | | | | | | | | | | | | |
Net of waivers | | | 1.55 | % | | | 1.55 | % | | | 1.55 | % | | | 1.55 | %^ | | | 1.55 | % | | | 1.55 | % |
Before waivers | | | 1.86 | % | | | 1.85 | % | | | 1.75 | % | | | 1.75 | %^ | | | 1.72 | % | | | 1.66 | % |
Class C | | | | | | | | | | | | | | | | | | | | | | | | |
Net of waivers | | | 1.55 | % | | | 1.55 | % | | | 1.55 | % | | | 1.55 | %^ | | | 1.55 | % | | | 1.55 | % |
Before waivers | | | 1.82 | % | | | 1.78 | % | | | 1.74 | % | | | 1.74 | %^ | | | 1.72 | % | | | 1.66 | % |
| | |
| 166 | AB MUNICIPAL INCOME FUND II | | abfunds.com |
FINANCIAL HIGHLIGHTS (continued)
Selected Data For A Share Of Beneficial Interest Outstanding Throughout Each Period
| | | | | | | | | | | | | | | | | | | | | | | | |
| | | Year Ended May 31, | | | October 1,
2014 to
May 31,
2015(a) | | | Year Ended
September 30, | |
| | | 2018 | | | 2017 | | | 2016 | | | | 2014 | | | 2013 | |
| | | | |
AB Pennsylvania Portfolio | | | | | | | | | | | | | | | | | | | | | | | | |
Class A | | | | | | | | | | | | | | | | | | | | | | | | |
Net of waivers | | | .85 | % | | | N/A | | | | N/A | | | | N/A | | | | N/A | | | | N/A | |
Before waivers | | | 1.08 | % | | | N/A | | | | N/A | | | | N/A | | | | N/A | | | | N/A | |
Class B | | | | | | | | | | | | | | | | | | | | | | | | |
Net of waivers | | | 1.60 | % | | | N/A | | | | N/A | | | | N/A | | | | N/A | | | | N/A | |
Before waivers | | | 1.90 | % | | | N/A | | | | N/A | | | | N/A | | | | N/A | | | | N/A | |
Class C | | | | | | | | | | | | | | | | | | | | | | | | |
Net of waivers | | | 1.60 | % | | | N/A | | | | N/A | | | | N/A | | | | N/A | | | | N/A | |
Before waivers | | | 1.83 | % | | | N/A | | | | N/A | | | | N/A | | | | N/A | | | | N/A | |
| | | | | | |
AB Virginia Portfolio | | | | | | | | | | | | | | | | | | | | | | | | |
Class A | | | | | | | | | | | | | | | | | | | | | | | | |
Net of waivers | | | .80 | % | | | N/A | | | | N/A | | | | N/A | | | | N/A | | | | N/A | |
Before waivers | | | .88 | % | | | N/A | | | | N/A | | | | N/A | | | | N/A | | | | N/A | |
Class B | | | | | | | | | | | | | | | | | | | | | | | | |
Net of waivers | | | 1.55 | % | | | N/A | | | | N/A | | | | N/A | | | | N/A | | | | N/A | |
Before waivers | | | 1.67 | % | | | N/A | | | | N/A | | | | N/A | | | | N/A | | | | N/A | |
Class C | | | | | | | | | | | | | | | | | | | | | | | | |
Net of waivers | | | 1.55 | % | | | N/A | | | | N/A | | | | N/A | | | | N/A | | | | N/A | |
Before waivers | | | 1.64 | % | | | N/A | | | | N/A | | | | N/A | | | | N/A | | | | N/A | |
Advisor Class | | | | | | | | | | | | | | | | | | | | | | | | |
Net of waivers | | | .55 | % | | | N/A | | | | N/A | | | | N/A | | | | N/A | | | | N/A | |
Before waivers | | | .63 | % | | | N/A | | | | N/A | | | | N/A | | | | N/A | | | | N/A | |
| (f) | Amount is less than $.005. |
| (g) | Commencement of distributions. |
See notes to financial statements.
| | |
| abfunds.com | | AB MUNICIPAL INCOME FUND II | 167 |
REPORT OF INDEPENDENT REGISTERED
PUBLIC ACCOUNTING FIRM
To the Board of Trustees and Shareholders of
AB Municipal Income Fund II:
Opinion on the Financial Statements
We have audited the accompanying statements of assets and liabilities of AB Municipal Income Fund II (the “Fund”) (comprising the AB Arizona Portfolio, AB Massachusetts Portfolio, AB Minnesota Portfolio, AB New Jersey Portfolio, AB Ohio Portfolio, AB Pennsylvania Portfolio and AB Virginia Portfolio (collectively referred to as the “Portfolios”)), including the portfolios of investments, as of May 31, 2018, and the related statements of operations for the year then ended, the statements of changes in net assets for each of the two years in the period then ended, and the financial highlights for each of the five years in the period then ended and the related notes (collectively referred to as the “financial statements”). In our opinion, the financial statements present fairly, in all material respects, the financial position of each of the Portfolios comprising AB Municipal Income Fund II at May 31, 2018, the results of their operations for the year then ended, the changes in their net assets for each of the two years in the period then ended and their financial highlights for each of the five years in the period then ended, in conformity with U.S. generally accepted accounting principles.
Basis for Opinion
These financial statements are the responsibility of the Fund’s management. Our responsibility is to express an opinion on each of the Portfolios’ financial statements based on our audits. We are a public accounting firm registered with the Public Company Accounting Oversight Board (United States) (“PCAOB”) and are required to be independent with respect to the Fund in accordance with the U.S. federal securities laws and the applicable rules and regulations of the Securities and Exchange Commission and the PCAOB.
We conducted our audits in accordance with the standards of the PCAOB. Those standards require that we plan and perform the audit to obtain reasonable assurance about whether the financial statements are free of material misstatement, whether due to error or fraud. The Fund is not required to have, nor were we engaged to perform, an audit of the Fund’s internal control over financial reporting. As part of our audits, we are required to obtain an understanding of internal control over financial reporting, but not for the purpose of expressing an opinion on the effectiveness of the Fund’s internal control over financial reporting. Accordingly, we express no such opinion.
Our audits included performing procedures to assess the risks of material misstatement of the financial statements, whether due to error or fraud,
| | |
| 168 | AB MUNICIPAL INCOME FUND II | | abfunds.com |
REPORT OF INDEPENDENT REGISTERED
PUBLIC ACCOUNTING FIRM (continued)
and performing procedures that respond to those risks. Such procedures included examining, on a test basis, evidence regarding the amounts and disclosures in the financial statements. Our procedures included confirmation of securities owned as of May 31, 2018, by correspondence with the custodian and others or by other appropriate auditing procedures where replies from others were not received. Our audits also included evaluating the accounting principles used and significant estimates made by management, as well as evaluating the overall presentation of the financial statements. We believe that our audits provide a reasonable basis for our opinion.

We have served as the auditor of one or more of the AB investment companies since 1968.
New York, New York
July 26, 2018
| | |
| abfunds.com | | AB MUNICIPAL INCOME FUND II | 169 |
BOARD OF TRUSTEES
Marshall C. Turner, Jr.(1) , Chairman
Michael J. Downey(1)
William H. Foulk, Jr.(1)
Nancy P. Jacklin(1)
Robert M. Keith, President and Chief Executive Officer
Carol C. McMullen(1)
Garry L. Moody(1)
Earl D. Weiner(1)
OFFICERS
Robert (“Guy”) B. Davidson III(2), Senior Vice President
Fred S. Cohen(2), Vice President
Terrance T. Hults(2), Vice President
Matthew J. Norton(2), Vice President
Andrew Potter(2), Vice President
Emilie D. Wrapp, Secretary
Joseph J. Mantineo, Treasurer and Chief Financial Officer
Phyllis J. Clarke, Controller
Vincent S. Noto, Chief Compliance Officer
| | |
Custodian and Accounting Agent State Street Bank and Trust Company
State Street Corporation CCB/5
1 Iron Street
Boston, MA 02210 Principal Underwriter AllianceBernstein Investments, Inc.
1345 Avenue of the Americas
New York, NY 10105 Legal Counsel Seward & Kissel LLP
One Battery Park Plaza
New York, NY 10004 | | Independent Registered Public Accounting Firm Ernst & Young LLP
5 Times Square
New York, NY 10036 Transfer Agent AllianceBernstein Investor
Services, Inc.
P.O. Box 786003
San Antonio, TX 78278-6003
Toll-free (800) 221-5672 |
| 1 | Member of the Audit Committee, the Governance and Nominating Committee and the Independent Directors Committee. |
| 2 | The day-to-day management of, and investment decisions for, the Portfolios’ portfolios are made by the Municipal Bond Investment Team. Messrs. Cohen, Davidson, Hults, Norton and Potter are the investment professionals with the most significant responsibility for the day-to-day management of the Portfolios’ portfolios. |
| | |
| 170 | AB MUNICIPAL INCOME FUND II | | abfunds.com |
MANAGEMENT OF THE FUND
Board of Trustees Information
The business and affairs of the Fund are managed under the direction of the Board of Trustees. Certain information concerning the Fund’s Trustees is set forth below.
| | | | | | | | |
NAME, ADDRESS, AGE AND (YEAR FIRST ELECTED) | | PRINCIPAL OCCUPATION(S), DURING PAST FIVE YEARS AND OTHER INFORMATION | | PORTFOLIOS
IN AB FUND
COMPLEX
OVERSEEN BY
TRUSTEE | | | OTHER
PUBLIC COMPANY
DIRECTORSHIPS
CURRENTLY HELD BY TRUSTEE
|
| INTERESTED TRUSTEE | | | | | | |
Robert M. Keith#
58 (2010) | | Senior Vice President of AllianceBernstein L.P. (the “Adviser”) and the head of AllianceBernstein Investments, Inc. (“ABI”) since July 2008; Director of ABI and President of the AB Mutual Funds. Previously, he served as Executive Managing Director of ABI from December 2006 to June 2008. Prior to joining ABI in 2006, Executive Managing Director of Bernstein Global Wealth Management, and prior thereto, Senior Managing Director and Global Head of Client Service and Sales of the Adviser’s institutional investment management business since 2004. Prior thereto, he was Managing Director and Head of North American Client Service and Sales in the Adviser’s institutional investment management business with which he had been associated since prior to 2004. | | | 94 | | | None |
| | |
| abfunds.com | | AB MUNICIPAL INCOME FUND II | 171 |
MANAGEMENT OF THE FUND (continued)
| | | | | | | | |
NAME, ADDRESS, AGE AND (YEAR FIRST ELECTED) | | PRINCIPAL OCCUPATION(S), DURING PAST FIVE YEARS AND OTHER INFORMATION | | PORTFOLIOS
IN AB FUND
COMPLEX
OVERSEEN BY
TRUSTEE | | | OTHER
PUBLIC COMPANY
DIRECTORSHIPS
CURRENTLY HELD BY TRUSTEE
|
| INDEPENDENT TRUSTEES | | | | | | |
Marshall C. Turner, Jr.##
Chairman of the Board
76
(2005) | | Private Investor since prior to 2013. Former Chairman and CEO of Dupont Photomasks, Inc. (components of semi-conductor manufacturing). He has extensive operating leadership, and venture capital investing experience, including five interim or full-time CEO roles, and prior service as general partner of institutional venture capital partnerships. He also has extensive non-profit board leadership experience, and currently serves on the boards of two education and science-related non-profit organizations. He has served as a director of one AB Fund since 1992, and director or trustee of multiple AB Funds since 2005. He has been Chairman of the AB Funds since January 2014, and the Chairman of the Independent Directors Committees of such AB Funds since February 2014. | | | 94 | | | Xilinx, Inc. (programmable logic semi-conductors) since 2007 |
| | | | | | | | |
Michael J. Downey##
74
(2005) | | Private Investor since prior to 2013. Formerly, managing partner of Lexington Capital, LLC (investment advisory firm) from December 1997 until December 2003. He served as a Director of Prospect Acquisition Corp. (financial services) from 2007 until 2009. From 1987 until 1993, Chairman and CEO of Prudential Mutual Fund Management, director of the Prudential mutual funds, and member of the Executive Committee of Prudential Securities, Inc. He has served as a director or trustee of the AB Funds since 2005 and is a director and Chairman of one other registered investment company. | | | 94 | | | The Asia Pacific Fund, Inc. (registered investment company) since prior to 2013 |
| | |
| 172 | AB MUNICIPAL INCOME FUND II | | abfunds.com |
MANAGEMENT OF THE FUND (continued)
| | | | | | | | |
NAME, ADDRESS, AGE AND (YEAR FIRST ELECTED) | | PRINCIPAL OCCUPATION(S), DURING PAST FIVE YEARS AND OTHER INFORMATION | | PORTFOLIOS
IN AB FUND
COMPLEX
OVERSEEN BY
TRUSTEE | | | OTHER
PUBLIC COMPANY
DIRECTORSHIPS
CURRENTLY HELD BY TRUSTEE
|
INDEPENDENT TRUSTEES (continued) | | | | | | |
William H. Foulk, Jr.##
85
(2004) | | Investment Adviser and an Independent Consultant since prior to 2013. Previously, he was Senior Manager of Barrett Associates, Inc., a registered investment adviser. He was formerly Deputy Comptroller and Chief Investment Officer of the State of New York and, prior thereto, Chief Investment Officer of the New York Bank for Savings. He has served as a director or trustee of various AB Funds since 1983, and was Chairman of the Independent Directors Committees of the AB Funds from 2003 until early February 2014. He served as Chairman of such AB Funds from 2003 through December 2013. He is also active in a number of mutual fund related organizations and committees. | | | 94 | | | None |
| | |
| abfunds.com | | AB MUNICIPAL INCOME FUND II | 173 |
MANAGEMENT OF THE FUND (continued)
| | | | | | | | |
NAME, ADDRESS, AGE AND (YEAR FIRST ELECTED) | | PRINCIPAL OCCUPATION(S), DURING PAST FIVE YEARS AND OTHER INFORMATION | | PORTFOLIOS
IN AB FUND
COMPLEX
OVERSEEN BY
TRUSTEE | | | OTHER
PUBLIC COMPANY
DIRECTORSHIPS
CURRENTLY HELD BY TRUSTEE
|
INDEPENDENT TRUSTEES (continued) | | | | | | |
Nancy P. Jacklin##
70
(2006) | | Private Investor since prior to 2013. Professorial Lecturer at the Johns Hopkins School of Advanced International Studies (2008-2015). U.S. Executive Director of the International Monetary Fund (which is responsible for ensuring the stability of the international monetary system), (December 2002-May 2006); Partner, Clifford Chance (1992-2002); Sector Counsel, International Banking and Finance, and Associate General Counsel, Citicorp (1985-1992); Assistant General Counsel (International), Federal Reserve Board of Governors (1982-1985); and Attorney Advisor, U.S. Department of the Treasury (1973-1982). Member of the Bar of the District of Columbia and of New York; and member of the Council on Foreign Relations. She has served as a director or trustee of the AB Funds since 2006 and has been Chairman of the Governance and Nominating Committees of the AB Funds since August 2014. | | | 94 | | | None |
| | |
| 174 | AB MUNICIPAL INCOME FUND II | | abfunds.com |
MANAGEMENT OF THE FUND (continued)
| | | | | | | | |
NAME, ADDRESS, AGE AND (YEAR FIRST ELECTED) | | PRINCIPAL OCCUPATION(S), DURING PAST FIVE YEARS AND OTHER INFORMATION | | PORTFOLIOS
IN AB FUND
COMPLEX
OVERSEEN BY
TRUSTEE | | | OTHER
PUBLIC COMPANY
DIRECTORSHIPS
CURRENTLY HELD BY TRUSTEE
|
INDEPENDENT TRUSTEES (continued) | | | | | | |
Carol C. McMullen##
62
(2016) | | Managing Director of Slalom Consulting (consulting) since 2014, private investor and member of the Partners Healthcare Investment Committee. Formerly, Director of Norfolk & Dedham Group (mutual property and casualty insurance) from 2011 until November 2016; Director of Partners Community Physicians Organization (healthcare) from 2014 until December 2016; and Managing Director of The Crossland Group (consulting) from 2012 until 2013. She has held a number of senior positions in the asset and wealth management industries, including at Eastern Bank (where her roles included President of Eastern Wealth Management), Thomson Financial (Global Head of Sales for Investment Management), and Putnam Investments (where her roles included Head of Global Investment Research). She has served on a number of private company and non-profit boards, and as a director or trustee of the AB Funds since June 2016. | | | 94 | | | None |
| | |
| abfunds.com | | AB MUNICIPAL INCOME FUND II | 175 |
MANAGEMENT OF THE FUND (continued)
| | | | | | | | |
NAME, ADDRESS, AGE AND (YEAR FIRST ELECTED) | | PRINCIPAL OCCUPATION(S), DURING PAST FIVE YEARS AND OTHER INFORMATION | | PORTFOLIOS
IN AB FUND
COMPLEX
OVERSEEN BY
TRUSTEE | | | OTHER
PUBLIC COMPANY
DIRECTORSHIPS
CURRENTLY HELD BY TRUSTEE
|
INDEPENDENT TRUSTEES (continued) | | | | | | |
Garry L. Moody##
66
(2008) | | Independent Consultant. Formerly, Partner, Deloitte & Touche LLP (1995-2008) where he held a number of senior positions, including Vice Chairman, and U.S. and Global Investment Management Practice Managing Partner; President, Fidelity Accounting and Custody Services Company (1993-1995), where he was responsible for accounting, pricing, custody and reporting for the Fidelity mutual funds; and Partner, Ernst & Young LLP (1975-1993), where he served as the National Director of Mutual Fund Tax Services and Managing Partner of its Chicago Office Tax department. He is a member of the Trustee Advisory Board of BoardIQ, a biweekly publication focused on issues and news affecting directors of mutual funds. He has served as a director or trustee, and as Chairman of the Audit Committees, of the AB Funds since 2008. | | | 94 | | | None |
| | | | | | | | |
Earl D. Weiner##
78
(2007)
| | Of Counsel, and Partner prior to January 2007, of the law firm Sullivan & Cromwell LLP and is a former member of the ABA Federal Regulation of Securities Committee Task Force to draft editions of the Fund Director’s Guidebook. He also serves as a director or trustee of various non-profit organizations and has served as Chairman or Vice Chairman of a number of them. He has served as a director or trustee of the AB Funds since 2007 and served as Chairman of the Governance and Nominating Committees of the AB Funds from 2007 until August 2014. | | | 94 | | | None |
| | |
| 176 | AB MUNICIPAL INCOME FUND II | | abfunds.com |
MANAGEMENT OF THE FUND (continued)
| * | The address for each of the Fund’s disinterested Trustees is c/o AllianceBernstein L.P., Attention: Philip L. Kirstein, 1345 Avenue of the Americas, New York, NY 10105. |
| ** | There is no stated term of office for the Fund’s Trustees. |
| *** | The information above includes each Trustee’s principal occupation during the last five years and other information relating to the experience, attributes and skills relevant to each Trustee’s qualifications to serve as a Trustee, which led to the conclusion that each Trustee should serve as a Trustee for the Fund. |
| # | Mr. Keith is an “interested person” of the Fund, as defined in the 1940 Act, due to his position as a Senior Vice President of the Adviser. |
| ## | Member of the Audit Committee, the Governance and Nominating Committee and the Independent Directors Committee. |
| | |
| abfunds.com | | AB MUNICIPAL INCOME FUND II | 177 |
MANAGEMENT OF THE FUND (continued)
Officer Information
Certain information concerning the Fund’s Officers is listed below.
| | | | |
NAME, ADDRESS*
AND AGE | | POSITION(S)
HELD WITH FUND | | PRINCIPAL OCCUPATION
DURING PAST FIVE YEARS** |
Robert M. Keith
58 | | President and Chief Executive Officer | | See biography above. |
| | | | |
(Guy) Robert B. Davidson III
57 | | Senior Vice President | | Senior Vice President of the Adviser,** with which he has been associated since prior to 2013. |
| | | | |
Fred S. Cohen
60 | | Vice President | | Senior Vice President of the Adviser,** with which he has been associated since prior to 2013. |
| | | | |
Terrance T. Hults
52 | | Vice President | | Senior Vice President of the Adviser,** with which he has been associated since prior to 2013. |
| | | | |
Matthew J. Norton
35 | | Vice President | | Vice President of the Adviser,** with which he has been associated since prior to 2013. |
| | | | |
Andrew D. Potter
33 | | Vice President | | Vice President of the Adviser,** with which he has been associated since prior to 2013. |
| | | | |
Emilie D. Wrapp
62 | | Secretary | | Senior Vice President, Assistant General Counsel and Assistant Secretary of ABI,** with which she has been associated since prior to 2013. |
| | | | |
Joseph J. Mantineo
59 | | Treasurer and Chief Financial Officer | | Senior Vice President of AllianceBernstein Investor Services, Inc. (“ABIS”),** with which he has been associated since prior to 2013. |
| | | | |
Phyllis J. Clarke
57 | | Controller | | Vice President of the ABIS,** with which she has been associated since prior to 2013. |
| | | | |
Vincent S. Noto 53 | | Chief Compliance Officer | | Senior Vice President since 2015 and Mutual Fund Chief Compliance Officer of the Adviser** since 2014. Prior thereto, he was Vice President and Director of Mutual Fund Compliance of the Adviser** since prior to 2013. |
| * | The address for each of the Fund’s Officers is 1345 Avenue of the Americas, New York, NY 10105. |
| ** | The Adviser, ABI and ABIS are affiliates of the Fund. |
| | The Fund’s Statement of Additional Information (“SAI”) has additional information about the Fund’s Trustees and Officers and is available without charge upon request. Contact your financial representative or AB at 1-800-227-4618, or visit www.abfunds.com, for a free prospectus or SAI. |
| | |
| 178 | AB MUNICIPAL INCOME FUND II | | abfunds.com |
Information Regarding the Review and Approval of the Advisory Agreement in Respect of Each Fund
The disinterested trustees (the “directors”) of AB Municipal Income Fund II (the “Fund”) unanimously approved the continuance of the Fund’s Advisory Agreement with the Adviser in respect of each of the portfolios listed below (each, a “Fund” and collectively, the “Funds”) at a meeting held on October 31-November 2, 2017 (the “Meeting”):
| | • | | AB Massachusetts Portfolio |
| | • | | AB New Jersey Portfolio |
| | • | | AB Pennsylvania Portfolio |
Prior to approval of the continuance of the Advisory Agreement in respect of each Fund, the directors had requested from the Adviser, and received and evaluated, extensive materials. They reviewed the proposed continuance of the Advisory Agreement with the Adviser and with experienced counsel who are independent of the Adviser, who advised on the relevant legal standards. The directors also reviewed an independent evaluation prepared by the Company’s Senior Officer (who is also the Company’s Independent Compliance Officer), who acted as their independent fee consultant, of the reasonableness of the advisory fee in respect of each Fund, in which the Senior Officer concluded that the contractual fee for each Fund was reasonable. The directors also discussed the proposed continuances in private sessions with counsel and the Company’s Senior Officer.
The directors considered their knowledge of the nature and quality of the services provided by the Adviser to the Funds gained from their experience as directors or trustees of most of the registered investment companies advised by the Adviser, their overall confidence in the Adviser’s integrity and competence they have gained from that experience, the Adviser’s initiative in identifying and raising potential issues with the directors and its responsiveness, frankness and attention to concerns raised by the directors in the past, including the Adviser’s willingness to consider and implement organizational and operational changes designed to improve investment results and the services provided to the AB Funds. The directors noted that they have four regular meetings each year, at each of which they review extensive materials and information from the Adviser, including information on the investment performance of the Funds.
The directors also considered all factors they believed relevant, including the specific matters discussed below. During the course of their deliberations, the directors evaluated, among other things, the reasonableness of
| | |
| abfunds.com | | AB MUNICIPAL INCOME FUND II | 179 |
the advisory fee in respect of each Fund. The directors did not identify any particular information that was all-important or controlling, and different directors may have attributed different weights to the various factors. The directors determined that the selection of the Adviser to manage each Fund and the overall arrangements between each Fund and the Adviser, as provided in the Advisory Agreement, including the advisory fee, were fair and reasonable in light of the services performed, expenses incurred and such other matters as the directors considered relevant in the exercise of their business judgment. The material factors and conclusions that formed the basis for the directors’ determinations included the following:
Nature, Extent and Quality of Services Provided
The directors considered the scope and quality of services provided by the Adviser under the Advisory Agreement, including the quality of the investment research capabilities of the Adviser and the other resources it has dedicated to performing services for each Fund. The directors noted that the Adviser from time to time reviews each Fund’s investment strategies and from time to time proposes changes intended to improve a Fund’s relative or absolute performance for the directors’ consideration. They also noted the professional experience and qualifications of each Fund’s portfolio management team and other senior personnel of the Adviser. The directors also considered that the Advisory Agreement provides that each Fund will reimburse the Adviser for the cost to it of providing certain clerical, accounting, administrative and other services to such Fund by employees of the Adviser or its affiliates. Requests for these reimbursements are made on a quarterly basis and subject to approval by the directors. Reimbursements, to the extent requested and paid in respect of a Fund, result in a higher rate of total compensation from such Fund to the Adviser than the fee rate stated in the Advisory Agreement. The directors noted that the methodology used to determine the reimbursement amounts had been reviewed by an independent consultant retained by the Company’s Senior Officer. The quality of administrative and other services, including the Adviser’s role in coordinating the activities of each Fund’s other service providers, also was considered. The directors concluded that, overall, they were satisfied with the nature, extent and quality of services provided to each of the Funds under the Advisory Agreement.
Costs of Services Provided and Profitability
The directors reviewed a schedule of the revenues and expenses and related notes indicating the profitability of each Fund to the Adviser for calendar years 2015 and 2016 that had been prepared with an expense allocation methodology arrived at in consultation with an independent consultant retained by the Company’s Senior Officer. The directors noted the assumptions and methods of allocation used by the Adviser in preparing fund-specific profitability data and understood that there are a number of potentially acceptable allocation methodologies for information of this type. The directors noted that the profitability information reflected all
| | |
| 180 | AB MUNICIPAL INCOME FUND II | | abfunds.com |
revenues and expenses of the Adviser’s relationships with the Funds, including those relating to its subsidiaries that provide transfer agency and distribution services to the Funds. The directors recognized that it is difficult to make comparisons of the profitability of the Advisory Agreement with the profitability of fund advisory contracts for unaffiliated funds because comparative information is not generally publicly available and is affected by numerous factors. The directors focused on the profitability of the Adviser’s relationships with the Funds before taxes and distribution expenses. The directors concluded that the Adviser’s level of profitability from its relationship with each Fund was not unreasonable.
Fall-Out Benefits
The directors considered the other benefits to the Adviser and its affiliates from their relationships with the Funds, including, but not limited to, benefits relating to 12b-1 fees and sales charges received by the Funds’ principal underwriter (which is a wholly owned subsidiary of the Adviser) in respect of certain classes of the Funds’ shares; and transfer agency fees paid by the Funds to a wholly owned subsidiary of the Adviser. The directors recognized that the Adviser’s profitability would be somewhat lower without these benefits. The directors understood that the Adviser also might derive reputational and other benefits from its association with the Funds.
Investment Results
In addition to the information reviewed by the directors in connection with the meeting, the directors receive detailed performance information for each Fund at each regular Board meeting during the year.
At the Meeting, the directors reviewed performance information prepared by an analytical service that is not affiliated with the Adviser (the “15(c) service provider”), showing the performance of the Class A Shares of each Fund against a group of similar funds (“peer group”) and a larger group of similar funds (“peer universe”), each selected by the 15(c) service provider, and information prepared by the Adviser showing performance of the Class A Shares of each Fund against a broad-based securities market index, in each case for the 1-, 3-, 5- and 10-year periods ended July 31, 2017 and (in the case of comparisons with the broad-based securities market index) for the period from inception. Based on their review, the directors concluded that each Fund’s investment performance was acceptable.
Advisory Fees and Other Expenses
The directors considered the advisory fee rate paid by each Fund to the Adviser and information prepared by the 15(c) service provider concerning advisory fee rates paid by other funds in the same category as such Fund. The directors recognized that it is difficult to make comparisons of advisory fees because there are variations in the services that are included in the fees paid by other funds. The directors compared each Fund’s contractual effective advisory fee rate with a peer group median and took into account the impact on the advisory fee rate of the administrative expense reimbursement paid to the Adviser in the latest fiscal year.
| | |
| abfunds.com | | AB MUNICIPAL INCOME FUND II | 181 |
The Adviser informed the directors that there were no institutional products managed by it that have a substantially similar investment style to any of the Funds.
The directors also considered the total expense ratio of the Class A shares of each Fund in comparison to a peer group and a peer universe selected by the 15(c) service provider. The expense ratio of each Fund was based on the Fund’s latest fiscal year and the directors considered the effects of any fee waivers and/or expense reimbursements as a result of the Adviser’s expense cap. The directors noted that it was likely that the expense ratios of some of the other funds in each Fund’s category were lowered by waivers or reimbursements by those funds’ investment advisers, which in some cases might be voluntary or temporary. The directors view expense ratio information as relevant to their evaluation of the Adviser’s services because the Adviser is responsible for coordinating services provided to the Funds by others. Based on their review, the directors concluded that the expense ratios for AB Arizona Portfolio, AB Massachusetts Portfolio, AB New Jersey Portfolio, AB Ohio Portfolio and AB Virginia Portfolio were acceptable. The directors noted that the expense ratio for each of AB Minnesota Portfolio and AB Pennsylvania Portfolio was above the median. After reviewing and discussing the Adviser’s explanations of the reasons for this, the directors concluded that each Fund’s expense ratio was acceptable.
Economies of Scale
The directors noted that the advisory fee schedule for the Funds contains breakpoints that reduce the fee rates on assets above specified levels. The directors took into consideration prior presentations by an independent consultant on economies of scale in the mutual fund industry and for the AB Funds, and by the Adviser concerning certain of its views on economies of scale. The directors also had requested and received from the Adviser certain updates on economies of scale in advance of the Meeting. The directors believe that economies of scale may be realized (if at all) by the Adviser across a variety of products and services, and not only in respect of a single fund. The directors noted that there is no established methodology for setting breakpoints that give effect to the fund-specific services provided by a fund’s adviser and to the economies of scale that an adviser may realize in its overall mutual fund business or those components of it which directly or indirectly affect a fund’s operations. The directors observed that in the mutual fund industry as a whole, as well as among funds similar to the Funds, there is no uniformity or pattern in the fees and asset levels at which breakpoints (if any) apply. The directors also noted that the advisory agreements for many funds do not have breakpoints at all. Having taken these factors into account, the directors concluded that the Funds’ shareholders would benefit from a sharing of economies of scale in the event a Fund’s net assets exceed a breakpoint in the future.
| | |
| 182 | AB MUNICIPAL INCOME FUND II | | abfunds.com |
This page is not part of the Shareholder Report or the Financial Statements.
AB FAMILY OF FUNDS
US EQUITY
US CORE
Core Opportunities Fund
FlexFee™ US Thematic Portfolio
Select US Equity Portfolio
US GROWTH
Concentrated Growth Fund
Discovery Growth Fund
FlexFee™ Large Cap Growth Portfolio
Growth Fund
Large Cap Growth Fund
Small Cap Growth Portfolio
US VALUE
Discovery Value Fund
Equity Income Fund
Relative Value Fund
Small Cap Value Portfolio
Value Fund
INTERNATIONAL/ GLOBAL EQUITY
INTERNATIONAL/ GLOBAL CORE
FlexFee™ International Strategic Core Portfolio
Global Core Equity Portfolio
International Portfolio
International Strategic Core Portfolio
Sustainable Global Thematic Fund
Tax-Managed International Portfolio
Tax-Managed Wealth Appreciation Strategy
Wealth Appreciation Strategy
INTERNATIONAL/ GLOBAL GROWTH
Concentrated International Growth Portfolio
FlexFee™ Emerging Markets Growth Portfolio
INTERNATIONAL/ GLOBAL EQUITY (continued)
Sustainable International Thematic Fund1
INTERNATIONAL/ GLOBAL VALUE
International Value Fund
FIXED INCOME
MUNICIPAL
High Income Municipal Portfolio
Intermediate California Municipal Portfolio
Intermediate Diversified Municipal Portfolio
Intermediate New York Municipal Portfolio
Municipal Bond Inflation Strategy
Tax-Aware Fixed Income Portfolio
National Portfolio
Arizona Portfolio
California Portfolio
Massachusetts Portfolio
Minnesota Portfolio
New Jersey Portfolio
New York Portfolio
Ohio Portfolio
Pennsylvania Portfolio
Virginia Portfolio
TAXABLE
Bond Inflation Strategy
FlexFee™ High Yield Portfolio1
FlexFee™ International Bond Portfolio
Global Bond Fund
High Income Fund
Income Fund
Intermediate Bond Portfolio
Limited Duration High Income Portfolio
Short Duration Portfolio
ALTERNATIVES
All Market Real Return Portfolio
Global Real Estate Investment Fund
Select US Long/Short Portfolio
Unconstrained Bond Fund
MULTI-ASSET
All Market Income Portfolio
All Market Total Return Portfolio
Conservative Wealth Strategy
Emerging Markets Multi-Asset Portfolio
Global Risk Allocation Fund
Tax-Managed All Market Income Portfolio
TARGET-DATE
Multi-Manager Select Retirement Allocation Fund
Multi-Manager Select 2010 Fund
Multi-Manager Select 2015 Fund
Multi-Manager Select 2020 Fund
Multi-Manager Select 2025 Fund
Multi-Manager Select 2030 Fund
Multi-Manager Select 2035 Fund
Multi-Manager Select 2040 Fund
Multi-Manager Select 2045 Fund
Multi-Manager Select 2050 Fund
Multi-Manager Select 2055 Fund
CLOSED-END FUNDS
Alliance California Municipal Income Fund
AllianceBernstein Global High Income Fund
AllianceBernstein National Municipal Income Fund
We also offer Government Money Market Portfolio1, which serves as the money market fund exchange vehicle for the AB mutual funds. An investment in Government Money Market Portfolio is not a deposit in a bank and is not insured or guaranteed by the Federal Deposit Insurance Corporation or any other government agency. Although the Fund seeks to preserve the value of your investment at $1.00 per share, it is possible to lose money by investing in the Fund.
Investors should consider the investment objectives, risks, charges and expenses of the Fund carefully before investing. For copies of our prospectus or summary prospectus, which contain this and other information, visit us online at www.abfunds.com or contact your AB representative. Please read the prospectus and/or summary prospectus carefully before investing.
| 1 | Prior to November 10, 2017, Government Money Market Portfolio was named Government Exchange Reserves; prior to January 8, 2018, Sustainable International Thematic Fund was named International Growth Fund; prior to February 23, 2018, FlexFee High Yield Portfolio was named High Yield Portfolio. |
| | |
| abfunds.com | | AB MUNICIPAL INCOME FUND II | 183 |
NOTES
| | |
| 184 | AB MUNICIPAL INCOME FUND II | | abfunds.com |

AB MUNICIPAL INCOME FUND II
1345 Avenue of the Americas
New York, NY 10105
800 221 5672
MIFII-0151-0518 
ITEM 2. CODE OF ETHICS.
(a) The registrant has adopted a code of ethics that applies to its principal executive officer, principal financial officer and principal accounting officer. A copy of the registrant’s code of ethics is filed herewith as Exhibit 12(a)(1).
(b) During the period covered by this report, no material amendments were made to the provisions of the code of ethics adopted in 2(a) above.
(c) During the period covered by this report, no implicit or explicit waivers to the provisions of the code of ethics adopted in 2(a) above were granted.
ITEM 3. AUDIT COMMITTEE FINANCIAL EXPERT.
The registrant’s Board of Directors has determined that independent directors Garry L. Moody, William H. Foulk, Jr. and Marshall C. Turner, Jr. qualify as audit committee financial experts.
ITEM 4. PRINCIPAL ACCOUNTANT FEES AND SERVICES.
(a) - (c) The following table sets forth the aggregate fees billed by the independent registered public accounting firm Ernst & Young LLP, for the Fund’s last two fiscal years for professional services rendered for: (i) the audit of the Fund’s annual financial statements included in the Fund’s annual report to stockholders; (ii) assurance and related services that are reasonably related to the performance of the audit of the Fund’s financial statements and are not reported under (i), which include advice and education related to accounting and auditing issues and quarterly press release review (for those Funds which issue press releases), and preferred stock maintenance testing (for those Funds that issue preferred stock); and (iii) tax compliance, tax advice and tax return preparation.
| | | | | | | | | | | | | | | | |
| | | | | | Audit Fees | | | Audit-Related
Fees | | | Tax Fees | |
Arizona Portfolio | | | 2017 | | | $ | 28,895 | | | $ | 7 | | | $ | 21,696 | |
| | | 2018 | | | $ | 28,895 | | | $ | 18 | | | $ | 18,763 | |
| | | | |
Massachusetts Portfolio | | | 2017 | | | $ | 30,781 | | | $ | 12 | | | $ | 21,696 | |
| | | 2018 | | | $ | 30,781 | | | $ | 38 | | | $ | 18,763 | |
| | | | |
Minnesota Portfolio | | | 2017 | | | $ | 30,781 | | | $ | — | | | $ | 21,696 | |
| | | 2018 | | | $ | 30,781 | | | $ | 11 | | | $ | 18,763 | |
| | | | |
New Jersey Portfolio | | | 2017 | | | $ | 30,781 | | | $ | 6 | | | $ | 21,696 | |
| | | 2018 | | | $ | 30,781 | | | $ | 16 | | | $ | 18,763 | |
| | | | |
Ohio Portfolio | | | 2017 | | | $ | 30,781 | | | $ | 6 | | | $ | 21,696 | |
| | | 2018 | | | $ | 30,781 | | | $ | 13 | | | $ | 18,763 | |
| | | | |
Pennsylvania Portfolio | | | 2017 | | | $ | 28,895 | | | $ | — | | | $ | 21,696 | |
| | | 2018 | | | $ | 28,895 | | | $ | 19 | | | $ | 18,763 | |
| | | | |
Virginia Portfolio | | | 2017 | | | $ | 30,781 | | | $ | 12 | | | $ | 21,696 | |
| | | 2018 | | | $ | 30,781 | | | $ | 33 | | | $ | 18,763 | |
(d) Not applicable.
(e) (1) Beginning with audit and non-audit service contracts entered into on or after May 6, 2003, the Fund’s Audit Committee policies and procedures require the pre-approval of all audit and non-audit services provided to the Fund by the Fund’s independent registered public accounting firm. The Fund’s Audit Committee policies and procedures also require pre-approval of all audit and non-audit services provided to the Adviser and Service Affiliates to the extent that these services are directly related to the operations or financial reporting of the Fund.
(e) (2) All of the amounts for Audit Fees, Audit-Related Fees and Tax Fees in the table under Item 4 (a)–(c) are for services pre-approved by the Fund’s Audit Committee.
(f) Not applicable.
(g) The following table sets forth the aggregate non-audit services provided to the Fund, the Fund’s Adviser and entities that control, are controlled by or under common control with the Adviser that provide ongoing services to the Fund:
| | | | | | | | | | | | |
| | | | | | All Fees for
Non-Audit Services
Provided to the
Portfolio, the Adviser
and Service Affiliates | | | Total Amount of
Foregoing Column Pre-
approved by the Audit
Committee
(Portion Comprised of
Audit Related Fees)
(Portion Comprised of
Tax Fees) | |
Arizona Portfolio | | | 2017 | | | $ | 616,993 | | | $ | 21,703 | |
| | | | | | | | | | $ | (7 | ) |
| | | | | | | | | | $ | (21,696 | ) |
| | | 2018 | | | $ | 845,471 | | | $ | 18,781 | |
| | | | | | | | | | $ | (18 | ) |
| | | | | | | | | | $ | (18,763 | ) |
| | | |
Massachusetts Portfolio | | | 2017 | | | $ | 616,998 | | | $ | 21,708 | |
| | | | | | | | | | $ | (12 | ) |
| | | | | | | | | | $ | (21,696 | ) |
| | | 2018 | | | $ | 845,491 | | | $ | 18,801 | |
| | | | | | | | | | $ | (38 | ) |
| | | | | | | | | | $ | (18,763 | ) |
| | | |
Minnesota Portfolio | | | 2017 | | | $ | 616,986 | | | $ | 21,696 | |
| | | | | | | | | | $ | — | |
| | | | | | | | | | $ | (21,696 | ) |
| | | 2018 | | | $ | 845,464 | | | $ | 18,774 | |
| | | | | | | | | | $ | (11 | ) |
| | | | | | | | | | $ | (18,763 | ) |
| | | |
New Jersey Portfolio | | | 2017 | | | $ | 616,992 | | | $ | 21,702 | |
| | | | | | | | | | $ | (6 | ) |
| | | | | | | | | | $ | (21,696 | ) |
| | | 2018 | | | $ | 845,469 | | | $ | 18,779 | |
| | | | | | | | | | $ | (16 | ) |
| | | | | | | | | | $ | (18,763 | ) |
| | | |
Ohio Portfolio | | | 2017 | | | $ | 616,992 | | | $ | 21,702 | |
| | | | | | | | | | $ | (6 | ) |
| | | | | | | | | | $ | (21,696 | ) |
| | | 2018 | | | $ | 845,466 | | | $ | 18,776 | |
| | | | | | | | | | $ | (13 | ) |
| | | | | | | | | | $ | (18,763 | ) |
| | | |
Pennsylvania Portfolio | | | 2017 | | | $ | 616,986 | | | $ | 21,696 | |
| | | | | | | | | | $ | — | |
| | | | | | | | | | $ | (21,696 | ) |
| | | 2018 | | | $ | 845,472 | | | $ | 18,782 | |
| | | | | | | | | | $ | (19 | ) |
| | | | | | | | | | $ | (18,763 | ) |
| | | |
Virginia Portfolio | | | 2017 | | | $ | 616,998 | | | $ | 21,708 | |
| | | | | | | | | | $ | (12 | ) |
| | | | | | | | | | $ | (21,696 | ) |
| | | 2018 | | | $ | 845,486 | | | $ | 18,796 | |
| | | | | | | | | | $ | (33 | ) |
| | | | | | | | | | $ | (18,763 | ) |
(h) The Audit Committee of the Fund has considered whether the provision of any non-audit services not pre-approved by the Audit Committee provided by the Fund’s independent registered public accounting firm to the Adviser and Service Affiliates is compatible with maintaining the auditor’s independence.
ITEM 5. AUDIT COMMITTEE OF LISTED REGISTRANTS.
Not applicable to the registrant.
ITEM 6. SCHEDULE OF INVESTMENTS.
Please see Schedule of Investments contained in the Report to Shareholders included under Item 1 of this Form N-CSR.
ITEM 7. DISCLOSURE OF PROXY VOTING POLICIES AND PROCEDURES FOR CLOSED-END MANAGEMENT INVESTMENT COMPANIES.
Not applicable to the registrant.
ITEM 8. PORTFOLIO MANAGERS OF CLOSED-END MANAGEMENT INVESTMENT COMPANIES.
Not applicable to the registrant.
ITEM 9. PURCHASES OF EQUITY SECURITIES BY CLOSED-END MANAGEMENT INVESTMENT COMPANY AND AFFILIATED PURCHASERS.
Not applicable to the registrant.
ITEM 10. SUBMISSION OF MATTERS TO A VOTE OF SECURITY HOLDERS.
There have been no material changes to the procedures by which shareholders may recommend nominees to the Fund’s Board of Directors since the Fund last provided disclosure in response to this item.
ITEM 11. CONTROLS AND PROCEDURES.
(a) The registrant’s principal executive officer and principal financial officer have concluded that the registrant’s disclosure controls and procedures (as defined in Rule 30a-2(c) under the Investment Company Act of 1940, as amended) are effective at the reasonable assurance level based on their evaluation of these controls and procedures as of a date within 90 days of the filing date of this document.
(b) There were no changes in the registrant’s internal controls over financial reporting that occurred during the second fiscal quarter of the period that has materially affected, or is reasonably likely to materially affect, the registrant’s internal control over financial reporting.
ITEM 12. EXHIBITS.
The following exhibits are attached to this Form N-CSR:
| | |
EXHIBIT NO. | | DESCRIPTION OF EXHIBIT |
| |
| 12 (a) (1) | | Code of Ethics that is subject to the disclosure of Item 2 hereof |
| |
| 12 (b) (1) | | Certification of Principal Executive Officer Pursuant to Section 302 of the Sarbanes-Oxley Act of 2002 |
| |
| 12 (b) (2) | | Certification of Principal Financial Officer Pursuant to Section 302 of the Sarbanes-Oxley Act of 2002 |
| |
| 12 (c) | | Certification of Principal Executive Officer and Principal Financial Officer Pursuant to Section 906 of the Sarbanes-Oxley Act of 2002 |
SIGNATURES
Pursuant to the requirements of the Securities Exchange Act of 1934 and the Investment Company Act of 1940, the registrant has duly caused this report to be signed on its behalf by the undersigned, thereunto duly authorized.
(Registrant): AB Municipal Income Fund II
| | |
| By: | | /s/ Robert M. Keith |
| | Robert M. Keith |
| | President |
| |
| Date: | | July 30, 2018 |
Pursuant to the requirements of the Securities Exchange Act of 1934 and the Investment Company Act of 1940, this report has been signed below by the following persons on behalf of the registrant and in the capacities and on the dates indicated.
| | |
| By: | | /s/ Robert M. Keith |
| | Robert M. Keith |
| | President |
| |
| Date: | | July 30, 2018 |
| |
| By: | | /s/ Joseph J. Mantineo |
| | Joseph J. Mantineo |
| | Treasurer and Chief Financial Officer |
| |
| Date: | | July 30, 2018 |