UNITED STATES
SECURITIES AND EXCHANGE COMMISSION
Washington, D.C. 20549
FORM N-CSR
CERTIFIED SHAREHOLDER REPORT OF REGISTERED MANAGEMENT
INVESTMENT COMPANIES
Investment Company Act file number 811-07644
Gabelli Capital Series Funds, Inc.
(Exact name of registrant as specified in charter)
One Corporate Center
Rye, New York 10580-1422
(Address of principal executive offices) (Zip code)
Bruce N. Alpert
Gabelli Funds, LLC
One Corporate Center
Rye, New York 10580-1422
(Name and address of agent for service)
Registrant’s telephone number, including area code: 1-800-422-3554
Date of fiscal year end: December 31
Date of reporting period: December 31, 2017
Form N-CSR is to be used by management investment companies to file reports with the Commission not later than 10 days after the transmission to stockholders of any report that is required to be transmitted to stockholders under Rule 30e-1 under the Investment Company Act of 1940 (17 CFR 270.30e-1). The Commission may use the information provided on Form N-CSR in its regulatory, disclosure review, inspection, and policymaking roles.
A registrant is required to disclose the information specified by Form N-CSR, and the Commission will make this information public. A registrant is not required to respond to the collection of information contained in Form N-CSR unless the Form displays a currently valid Office of Management and Budget (“OMB”) control number. Please direct comments concerning the accuracy of the information collection burden estimate and any suggestions for reducing the burden to Secretary, Securities and Exchange Commission, 450 Fifth Street, NW, Washington, DC 20549-0609. The OMB has reviewed this collection of information under the clearance requirements of 44 U.S.C. § 3507.
Item 1. Reports to Stockholders.
The Report to Shareholders is attached herewith.
∎ Gabelli Capital Asset Fund | | Annual Report To Contractowners | |
Objective: Growth of capital. Current income is a secondary objective
Portfolio: At least 80% common stocks and securities convertible into common stocks
Inception Date: May 1, 1995
Net Assets at December 31, 2017: $104,421,887
| An Update from Fund Management
For the year ended December 31, 2017, the net asset value (“NAV”) of the Gabelli Capital Asset Fund increased 20.5% compared with an increase of 21.8% for the Standard & Poor’s (S&P) 500 Index.
The Fund’s investment objective is growth of capital. The Fund’s secondary objective is to produce current income.
The Fund’s investment strategies are to invest primarily in equity securities of companies stock that are selling in the public market at a significant discount to their “private market value.” Private market value is the value that Gabelli Funds, LLC (the Adviser), believes informed investors would be willing to pay for a company. The Adviser considers factors such as price, earnings expectations, earnings and price histories, balance sheet characteristics, and perceived management skills. The Adviser also considers changes in economic and political outlooks as well as individual corporate developments. The Fund may invest in companies of any size and from time to time may invest primarily in companies with large, medium, or small market capitalizations.
After a sluggish start to the year, the U.S. economy grew at a faster rate than anticipated 3.1% and 3.3% in the second and third quarters, respectively. At 4.1%, unemployment stands at a ten-year low while consumers’ wealth of nearly $97 trillion is at an all-time high. Housing starts of 1.3 million units continue their steady increase, but remain comfortably below the prior peak of 2.2 million units. The U.S. is in its ninth year of economic expansion, making this the third longest expansion at 101 months, trailing only 1961-1969 and 1991-2001 (those expansions were 106 and 120 months, respectively). Perhaps as important, the global economy is in synchronized expansion. For all of 2017, the Eurozone is set to grow 2.2%, its fastest since 2007, while Japan has accelerated to 1.5%.
The largest contributor to performance in 2017 was Brown-Forman (3.9% of net assets as of December 31, 2017), a leading global distilled spirits producer. Spirits is an advantaged category that enjoys high margins, low capital requirements, strong free cash flow generation and good pricing power. The company’s global brands include Jack Daniel’s Tennessee whiskey, Finlandia vodka, and el Jimador and Herradura tequilas. Additional contributors were Diageo (4.1%), a global producer of alcoholic beverages, with brands including Smirnoff, Johnny Walker, Ketel One, Captain Morgan, Crown Royal, J&B, Baileys, Tanqueray, and Guinness. The company has a balanced geographic presence in both mature and emerging markets, and it benefits from the trend of consumers around the world trading up to premium products. Over the past several years, Diageo made acquisitions that enhanced its presence in emerging markets; and Aerojet Rocketdyne (2.5%), a world recognized aerospace and defense leader providing propulsion and energetics to its space, missile defense, strategic, and tactical missile and armaments customers throughout the world. Increased defense spending has helped support strong performance.
Detractors from performance included: US Cellular (1.6%), a regional carrier which owns and operates the fifth-largest wireless telecommunications network in the United States, serving 5 million customers in 426 markets in 23 U.S. states, struggled against the current pricing environment and investments made to expand their customer base impacted short term profitability; Circor International (0.7%), which designs, manufactures and markets engineered products and sub-systems for markets, including oil and gas, aerospace, power and process, and industrial solutions. 2017 financial results highlighted the prolonged weakness in the energy markets; and Grupo Televisa (1.8%), a media company in the international entertainment business. The company operates in four business segments: Content, Sky, Telecommunications, and Other Businesses. It operates four broadcast channels in Mexico City and has affiliated stations throughout the country. Grupo’s margins and earnings were low for the industry and were reflected in the stock’s weak performance.
We appreciate your confidence and trust.
|
The views expressed above are those of the Gabelli Capital Asset Fund’s portfolio manager as of December 31, 2017 and are subject to change without notice. They do not necessarily represent the current views of Gabelli Funds, LLC (the “Adviser”). The views expressed herein are based on current market conditions and are not intended to predict or guarantee the future performance of any Fund, any individual security, any market, or market segment. The composition of the Fund’s portfolio is subject to change. No recommendation is made with respect to any security discussed herein. About information in this report: • It is important to consider carefully the Fund’s investment objectives, risks, fees, and expenses before investing. All funds involve some risk, including possible loss of the principal amount invested. |
| GABELLI CAPITAL ASSET FUND | 1 | |
∎ Gabelli Capital Asset Fund | | Annual Report To Contractowners | |
Top Ten Holdings (As of 12/31/2017) (Unaudited)
| Percentage of | ||
| Company | Total Net Assets | |
Diageo plc | 4.1% | |
Brown-Forman Corp. | 3.9% | |
Honeywell International Inc. | 3.4% | |
Aerojet Rocketdyne Holdings Inc. | 2.5% | |
Wells Fargo & Co. | 2.3% | |
Waste Management Inc. | 2.3% | |
CBS Corp. | 2.3% | |
American Express Co. | 2.2% | |
The Bank of New York Mellon Corp. | 2.1% | |
Viacom Inc. | 2.1% |
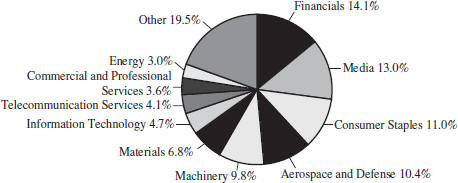
Sector Weightings (Percentage of Net Assets as of 12/31/2017) (Unaudited)
Average Annual Returns (For periods ended 12/31/2017) (Unaudited)
| 1 Year | 5 Year | 10 Year | 15 Year | Since Inception (5/1/1995) | ||||||
Gabelli Capital Asset Fund | 20.49% | 11.67% | 7.79% | 10.55% | 10.48% | |||||
S&P 500 Index | 21.83 | 15.79 | 8.50 | 9.92 | 9.62(a) | |||||
Russell 3000 Index | 21.13 | 15.58 | 8.60 | 10.25 | 9.72(a) |
The S&P 500 Index is an index of 500 primarily large cap U.S. stocks, which is generally considered to be representative of U.S. stock market activity. The Russell 3000 Index is an unmanaged indicator which measures the performance of the 3,000 largest U.S. traded stocks, in which the underlying companies are incorporated in the U.S. Index returns are provided for comparative purposes. Please note that the indicies are unmanaged and not available for direct investment and their returns do not reflect the fees and expenses that have been deducted from the Fund.
(a) The S&P 500 Index and the Russell 3000 Index since inception performance results are as of April 30, 1995.
About information in this report:
All performance data quoted are historical and the results represent past performance and neither guarantee nor predict future investment results. To obtain performance data current to the most recent month (availability within seven business days of the most recent month end), please call us at (800) 221-3253 or visit our website at www.guardianlife.com. Current performance may be higher or lower than the performance quoted here. Investment returns and the principal value will fluctuate so that a contractowner’s shares, when redeemed, may be worth more or less than the original cost.
Total return figures are historical and assume the reinvestment of distributions and the deduction of all Fund expenses. The actual total returns for owners of variable annuity contracts or variable life insurance policies that provide for investment in the Fund will be lower to reflect separate account and contract/policy charges. The return figures shown do not reflect the deduction of taxes that a contract owner may pay on distributions or redemption of units.
| 2 | GABELLI CAPITAL ASSET FUND
| |
∎ Gabelli Capital Asset Fund | | Annual Report To Contractowners | |
Growth of a Hypothetical $10,000 Investment (Unaudited)
To give you a comparison, this chart shows you the performance of a hypothetical $10,000 investment made in the Fund and in the S&P 500 and Russell 3000 Indicies. Index returns do not include the fees and expenses of the Fund, but do include the reinvestment of distributions.
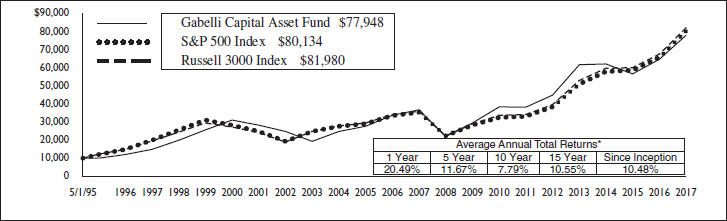
* Past performance is not predictive of future results. The S&P 500 and Russell 3000 Indicies are unmanaged indicators of stock market performance.
The Fund files a complete schedule of portfolio holdings with the Securities and Exchange Commission (the “SEC”) for the first and third quarters of each fiscal year on Form N-Q. The Fund’s Form N-Q is available on the SEC’s website at www.sec.gov and may also be reviewed and copied at the SEC’s Public Reference Room in Washington, DC. Information on the operation of the Public Reference Room may be obtained by calling 1-800-SEC-0330.
Proxy Voting
The Fund files Form N-PX with its complete proxy voting record for the twelve months ended June 30, no later than August 31 of each year. A description of the Fund’s proxy voting policies, procedures, and how the Fund voted proxies relating to portfolio securities is available without charge, upon request, by (i) calling 800-GABELLI (800-422-3554); (ii) writing to The Gabelli Funds at One Corporate Center, Rye, NY 10580-1422; or (iii) visiting the SEC’s website at www.sec.gov.
| GABELLI CAPITAL ASSET FUND | 3 | |
∎ Gabelli Capital Asset Fund | | Annual Report To Contractowners | |
Disclosure of Fund Expenses (Unaudited)
For the Six Month Period from July 1, 2017 through December 31, 2017
Expense Table
We believe it is important for you to understand the impact of fees and expenses regarding your investment. All mutual funds have operating expenses. As a shareholder of a fund, you incur ongoing costs, which include costs for portfolio management, administrative services, and shareholder reports (like this one), among others. Operating expenses, which are deducted from a fund’s gross income, directly reduce the investment return of a fund. When a fund’s expenses are expressed as a percentage of its average net assets, this figure is known as the expense ratio. The following examples are intended to help you understand the ongoing costs (in dollars) of investing in your Fund and to compare these costs with those of other mutual funds. The examples are based on an investment of $1,000 made at the beginning of the period shown and held for the entire period.
The Expense Table below illustrates your Fund’s costs in two ways:
Actual Fund Return: This section provides information about actual account values and actual expenses. You may use this section to help you to estimate the actual expenses that you paid over the period after any fee waivers and expense reimbursements. The “Ending Account Value” shown is derived from the Fund’s actual return during the past six months, and the “Expenses Paid During Period” shows the dollar amount that would have been paid by an investor who started with $1,000 in the Fund. You may use this information, together with the amount you invested, to estimate the expenses that you paid over the period.
To do so, simply divide your account value by $1,000 (for example, an $8,600 account value divided by $1,000 = 8.6), then multiply the result by the number given for your Fund under the heading “Expenses Paid During Period” to estimate the expenses you paid during this period.
Hypothetical 5% Return: This section provides information about hypothetical account values and hypothetical expenses based on the Fund’s actual expense ratio. It assumes a hypothetical annualized return of 5% before expenses during the period shown. In this case – because the hypothetical return used is not the Fund’s actual return – the results do not apply to your investment and you cannot use the hypothetical account value and expense to estimate the actual ending account balance or expenses you paid for the period. This example is useful in making comparisons of the ongoing costs of investing in the Fund and other funds. To do so, compare this 5% hypothetical example with the 5% hypothetical examples that appear in shareholder reports of other funds.
Please note that the expenses shown in the table are meant to highlight your ongoing costs only and do not reflect any transactional costs such as sales charges (loads), redemption fees, or exchange fees, if any, which would be described in the Prospectus. If these costs were applied to your account, your costs would be higher. Therefore, the 5% hypothetical return is useful in comparing ongoing costs only, and will not help you determine the relative total costs of owning different funds. The “Annualized Expense Ratio” represents the actual expenses for the last six months and may be different from the expense ratio in the Financial Highlights which is for the year ended December 31, 2017.
| Beginning Account Value July 1, 2017 | Ending Account Value December 31, 2017 | Annualized Expense Ratio | Expenses Paid During Period* | |||||
Gabelli Capital Asset Fund | ||||||||
Actual Fund Return | $1,000.00 | $1,113.70 | 1.24% | $6.61 | ||||
Hypothetical 5% Return | $1,000.00 | $1,018.95 | 1.24% | $6.31 |
| * | Expenses are equal to the Fund’s annualized expense ratio for the last six months multiplied by the average account value over the period, multiplied by the number of days in the most recent fiscal half year (184), then divided by 365. |
| 4 | GABELLI CAPITAL ASSET FUND | |
∎ Gabelli Capital Asset Fund
|
Schedule of Investments |
| December 31, 2017 | ||||||||||||
| Shares | Cost | | Market Value |
| ||||||||
|
Common Stocks — 99.0%
|
| ||||||||||
Aerospace and Defense — 10.4% | ||||||||||||
| 82,000 | Aerojet Rocketdyne Holdings Inc.† | $ | 520,116 | $ | 2,558,400 | |||||||
| 1,600 | Curtiss-Wright Corp. | 29,270 | 194,960 | |||||||||
| 7,500 | HEICO Corp. | 56,169 | 707,625 | |||||||||
| 23,200 | Honeywell International Inc. | 661,508 | 3,557,952 | |||||||||
| 35,500 | Kaman Corp. | 435,941 | 2,088,820 | |||||||||
| 150,000 | Rolls-Royce Holdings plc | 1,144,957 | 1,715,362 | |||||||||
| 7,360,000 | Rolls-Royce Holdings plc, Cl. C†(a) | 9,752 | 9,937 | |||||||||
|
|
|
| |||||||||
| 2,857,713 | 10,833,056 | |||||||||||
Automobiles and Components — 0.5% | ||||||||||||
| 1,500 | BorgWarner Inc. | 16,114 | 76,635 | |||||||||
| 9,500 | Dana Inc. | 182,328 | 304,095 | |||||||||
| 7,000 | Superior Industries International Inc. | 126,914 | 103,950 | |||||||||
|
|
|
| |||||||||
| 325,356 | 484,680 | |||||||||||
Building and Construction — 1.0% | ||||||||||||
| 16,500 | Herc Holdings Inc.† | 569,757 | 1,033,065 | |||||||||
| Building Products — 0.5% | |||||||||||
| 25,000 | Griffon Corp. | 292,772 | 508,750 | |||||||||
Commercial and Professional Services — 3.6% | ||||||||||||
| 29,000 | Rollins Inc. | 64,873 | 1,349,370 | |||||||||
| 28,000 | Waste Management Inc. | 1,035,278 | 2,416,400 | |||||||||
|
|
|
| |||||||||
| 1,100,151 | 3,765,770 | |||||||||||
Consumer Durables — 2.3% | ||||||||||||
| 4,000 | Cavco Industries Inc.† | 113,920 | 610,400 | |||||||||
| 10,000 | Skyline Corp.† | 47,937 | 128,500 | |||||||||
| 38,000 | Sony Corp., ADR | 690,765 | 1,708,100 | |||||||||
|
|
|
| |||||||||
| 852,622 | 2,447,000 | |||||||||||
Consumer Services — 2.1% | ||||||||||||
| 28,000 | Boyd Gaming Corp. | 181,549 | 981,400 | |||||||||
| 12,000 | Canterbury Park Holding Corp. | 133,016 | 197,400 | |||||||||
| 900 | Churchill Downs Inc. | 59,012 | 209,430 | |||||||||
| 57,000 | Dover Motorsports Inc. | 243,790 | 111,150 | |||||||||
| 9,500 | Las Vegas Sands Corp. | 51,835 | 660,155 | |||||||||
|
|
|
| |||||||||
| 669,202 | 2,159,535 | |||||||||||
Consumer Staples — 11.0% | ||||||||||||
| 3,000 | Archer-Daniels-Midland Co. | 63,720 | 120,240 | |||||||||
| 60,000 | Brown-Forman Corp., Cl. A | 587,041 | 4,034,400 | |||||||||
| 1,000 | Bunge Ltd. | 50,230 | 67,080 | |||||||||
| 50,000 | Danone SA, ADR | 537,479 | 838,500 | |||||||||
| 29,000 | Diageo plc, ADR | 1,209,602 | 4,234,870 | |||||||||
| 12,000 | Fomento Economico Mexicano SAB de CV, ADR | 395,223 | 1,126,800 | |||||||||
| 400 | National Beverage Corp. | 20,216 | 38,976 | |||||||||
| 5,000 | The Coca-Cola Co. | 122,470 | 229,400 | |||||||||
| 23,000 | Tootsie Roll Industries Inc. | 382,017 | 837,200 | |||||||||
|
|
|
| |||||||||
| 3,367,998 | 11,527,466 | |||||||||||
| Shares | Cost | Market Value | ||||||||||
|
Diversified Industrial — 0.8% | |||||||||||
| 15,000 | ITT Inc. | $ | 281,248 | $ | 800,550 | |||||||
Electrical Equipment — 2.8% | ||||||||||||
| 24,000 | AMETEK Inc. | 95,649 | 1,739,280 | |||||||||
| 23,500 | Franklin Electric Co. Inc. | 121,446 | 1,078,650 | |||||||||
| 500 | Rockwell Automation Inc. | 23,746 | 98,175 | |||||||||
|
|
|
| |||||||||
| 240,841 | 2,916,105 | |||||||||||
Energy — 3.0% | ||||||||||||
| 3,000 | Anadarko Petroleum Corp. | 204,039 | 160,920 | |||||||||
| 2,500 | Chevron Corp. | 156,200 | 312,975 | |||||||||
| 7,000 | ConocoPhillips | 147,012 | 384,230 | |||||||||
| 7,000 | Devon Energy Corp. | 247,910 | 289,800 | |||||||||
| 4,800 | Exxon Mobil Corp. | 197,982 | 401,472 | |||||||||
| 24,000 | RPC Inc. | 116,480 | 612,720 | |||||||||
| 1,000 | Schlumberger Ltd. | 72,440 | 67,390 | |||||||||
| 220,000 | Weatherford International plc† | 1,394,966 | 917,400 | |||||||||
|
|
|
| |||||||||
| 2,537,029 | 3,146,907 | |||||||||||
Financials — 14.1% | ||||||||||||
| 23,500 | American Express Co. | 584,140 | 2,333,785 | |||||||||
| 3,000 | Argo Group International Holdings Ltd. | 66,278 | 184,950 | |||||||||
| 2,100 | BKF Capital Group Inc.† | 53,179 | 35,175 | |||||||||
| 44,000 | Griffin Industrial Realty Inc. | 616,048 | 1,614,800 | |||||||||
| 12,000 | JPMorgan Chase & Co. | 370,832 | 1,283,280 | |||||||||
| 23,000 | Legg Mason Inc. | 715,574 | 965,540 | |||||||||
| 4,000 | Marsh &McLennan Companies Inc. | 104,159 | 325,560 | |||||||||
| 26,000 | Morgan Stanley | 730,610 | 1,364,220 | |||||||||
| 1,500 | Northern Trust Corp. | 63,632 | 149,835 | |||||||||
| 17,000 | Ryman Hospitality Properties Inc. | 407,480 | 1,173,340 | |||||||||
| 7,000 | State Street Corp. | 356,106 | 683,270 | |||||||||
| 41,000 | The Bank of New York Mellon Corp. | 1,133,543 | 2,208,260 | |||||||||
| 40,000 | Wells Fargo & Co. | 1,199,988 | 2,426,800 | |||||||||
|
|
|
| |||||||||
| 6,401,569 | 14,748,815 | |||||||||||
Health Care — 1.4% | ||||||||||||
| 14,000 | Boston Scientific Corp.† | 97,624 | 347,060 | |||||||||
| 12,400 | Henry Schein Inc.† | 306,606 | 866,512 | |||||||||
| 8,000 | Patterson Cos., Inc. | 238,344 | 289,040 | |||||||||
|
|
|
| |||||||||
| 642,574 | 1,502,612 | |||||||||||
Information Technology — 4.7% | ||||||||||||
| 20,000 | Corning Inc. | 227,320 | 639,800 | |||||||||
| 65,000 | CTS Corp. | 623,814 | 1,673,750 | |||||||||
| 19,000 | Diebold Nixdorf Inc. | 561,438 | 310,650 | |||||||||
| 4,000 | EchoStar Corp., Cl. A† | 85,763 | 239,600 | |||||||||
| 2,800 | Harris Corp. | 221,724 | 396,620 | |||||||||
| 5,000 | Internap Corp.† | 71,947 | 78,550 | |||||||||
| 15,000 | Texas Instruments Inc. | 305,450 | 1,566,600 | |||||||||
|
|
|
| |||||||||
| 2,097,456 | 4,905,570 | |||||||||||
Machinery — 9.8% | ||||||||||||
| 16,000 | CIRCOR International Inc. | 519,406 | 778,880 | |||||||||
| 140,000 | CNH Industrial NV | 914,479 | 1,876,000 | |||||||||
See accompanying notes to financial statements. |
5 |
∎ Gabelli Capital Asset Fund
|
Schedule of Investments (Continued) |
| December 31, 2017 | ||||||||||||
| Shares | Cost |
|
Market Value |
| ||||||||
|
Common Stocks (Continued)
|
| ||||||||||
Machinery (Continued) | ||||||||||||
| 11,500 | Crane Co. | $ | 339,991 | $ | 1,026,030 | |||||||
| 2,000 | Deere & Co. | 57,800 | 313,020 | |||||||||
| 9,500 | Flowserve Corp. | 163,764 | 400,235 | |||||||||
| 33,000 | Graco Inc. | 653,847 | 1,492,260 | |||||||||
| 6,000 | IDEX Corp. | 208,726 | 791,820 | |||||||||
| 34,000 | Navistar International Corp.† | 789,722 | 1,457,920 | |||||||||
| 8,800 | The Eastern Co. | 94,373 | 230,120 | |||||||||
| 43,000 | The L.S. Starrett Co., Cl. A | 559,757 | 369,800 | |||||||||
| 2,000 | Watts Water Technologies Inc., Cl. A | 32,206 | 151,900 | |||||||||
| 20,000 | Xylem Inc. | 573,381 | 1,364,000 | |||||||||
|
|
|
| |||||||||
| 4,907,452 | 10,251,985 | |||||||||||
Materials — 6.8% | ||||||||||||
| 500 | AdvanSix Inc.† | 3,671 | 21,035 | |||||||||
| 19,500 | Ampco-Pittsburgh Corp. | 289,121 | 241,800 | |||||||||
| 56,000 | Ferro Corp.† | 117,622 | 1,321,040 | |||||||||
| 50,000 | Freeport-McMoRan Inc.† | 819,000 | 948,000 | |||||||||
| 10,300 | International Flavors & | 460,359 | 1,571,883 | |||||||||
| 70,000 | Myers Industries Inc. | 804,903 | 1,365,000 | |||||||||
| 40,000 | Newmont Mining Corp. | 1,368,979 | 1,500,800 | |||||||||
| 1,000 | Sensient Technologies Corp. | 20,129 | 73,150 | |||||||||
|
|
|
| |||||||||
| 3,883,784 | 7,042,708 | |||||||||||
Media — 13.0% | ||||||||||||
| 3,000 | AMC Networks Inc., Cl. A† | 48,772 | 162,240 | |||||||||
| 40,000 | CBS Corp., Cl. A, Voting | 657,673 | 2,373,600 | |||||||||
| 10,000 | Cogeco Inc. | 195,072 | 720,048 | |||||||||
| 6,000 | Discovery Communications Inc., Cl. A† | 97,267 | 134,280 | |||||||||
| 12,000 | Discovery Communications Inc., Cl. C† | 108,025 | 254,040 | |||||||||
| 11,500 | DISH Network Corp., Cl. A† | 177,640 | 549,125 | |||||||||
| 98,000 | Grupo Televisa SAB, ADR | 1,535,440 | 1,829,660 | |||||||||
| 1,750 | Liberty Broadband Corp., Cl. A† | 11,466 | 148,838 | |||||||||
| 3,050 | Liberty Broadband Corp., Cl. C† | 46,024 | 259,738 | |||||||||
| 5,000 | Liberty Global plc, Cl. A† | 30,677 | 179,200 | |||||||||
| 12,000 | Liberty Global plc, Cl. C† | 87,458 | 406,080 | |||||||||
| 623 | Liberty Global plc LiLAC, Cl. A† | 4,578 | 12,553 | |||||||||
| 1,497 | Liberty Global plc LiLAC, Cl. C† | 13,067 | 29,775 | |||||||||
| 1,600 | Liberty Media Corp.- Liberty Braves, Cl. A† | 19,320 | 35,280 | |||||||||
| 1,600 | Liberty Media Corp.- Liberty Braves, Cl. C† | 16,260 | 35,552 | |||||||||
| 1,500 | Liberty Media Corp.- Liberty Formula One, Cl. A† | 5,307 | 49,080 | |||||||||
| 1,500 | Liberty Media Corp.- Liberty Formula One, Cl. C† | 5,510 | 51,240 | |||||||||
| Shares | Cost |
|
Market Value |
| ||||||||
| 1,400 | Liberty Media Corp.- Liberty SiriusXM, Cl. A† | $ | 5,022 | $ | 55,524 | |||||||
| 1,400 | Liberty Media Corp.- Liberty SiriusXM, Cl. C† | 5,007 | 55,524 | |||||||||
| 4,500 | Meredith Corp. | 148,105 | 297,225 | |||||||||
| 27,000 | MSG Networks Inc., Cl. A† | 47,993 | 546,750 | |||||||||
| 4,000 | Scripps Networks Interactive Inc., Cl. A | 157,339 | 341,520 | |||||||||
| 7,600 | Sinclair Broadcast Group Inc., Cl. A | 52,925 | 287,660 | |||||||||
| 9,000 | The Madison Square Garden Co, Cl. A† | 123,410 | 1,897,650 | |||||||||
| 20,000 | Twenty-First Century Fox Inc., Cl. A | 159,632 | 690,600 | |||||||||
| 63,000 | Viacom Inc., Cl. A | 2,709,124 | 2,198,700 | |||||||||
|
|
|
| |||||||||
| 6,468,113 | 13,601,482 | |||||||||||
Publishing — 0.7% | ||||||||||||
| 48,000 | The E.W. Scripps Co., Cl. A† | 489,248 | 750,240 | |||||||||
Retailing — 2.6% | ||||||||||||
| 20,000 | Aaron’s Inc. | 99,963 | 797,000 | |||||||||
| 20,000 | CVS Health Corp. | 619,913 | 1,450,000 | |||||||||
| 10,000 | Hertz Global Holdings Inc.† | 185,061 | 221,000 | |||||||||
| 3,400 | Ingles Markets Inc., Cl. A | 45,936 | 117,640 | |||||||||
| 22,000 | J.C. Penney Co. Inc.† | 169,149 | 69,520 | |||||||||
| 1,000 | The Cheesecake Factory Inc. | 34,814 | 48,180 | |||||||||
|
|
|
| |||||||||
| 1,154,836 | 2,703,340 | |||||||||||
Telecommunication Services — 4.1% | ||||||||||||
| 22,000 | Millicom International Cellular SA, SDR | 1,421,905 | 1,485,780 | |||||||||
| 10,000 | Rogers Communications Inc., Cl. B | 136,845 | 509,300 | |||||||||
| 20,000 | Telephone & Data Systems Inc. | 560,529 | 556,000 | |||||||||
| 45,000 | United States Cellular Corp.† | 1,765,535 | 1,693,350 | |||||||||
|
|
|
| |||||||||
| 3,884,814 | 4,244,430 | |||||||||||
Transportation — 1.3% | ||||||||||||
| 22,000 | GATX Corp. | 771,947 | 1,367,520 | |||||||||
Utilities — 2.5% | ||||||||||||
| 20,000 | El Paso Electric Co. | 179,651 | 1,107,000 | |||||||||
| 20,000 | GenOn Energy Inc., Escrow†(a) | 0 | 0 | |||||||||
| 27,899 | National Fuel Gas Co. | 1,497,415 | 1,531,934 | |||||||||
|
|
|
| |||||||||
| 1,677,066 | 2,638,934 | |||||||||||
| Total Common Stocks | $ | 45,473,548 | $ | 103,380,520 | ||||||||
6 | See accompanying notes to financial statements. |
∎ Gabelli Capital Asset Fund
|
Schedule of Investments (Continued) |
| December 31, 2017 | ||||||||||||
| Shares | Cost |
|
Market |
| ||||||||
Closed-End Funds — 0.6% | ||||||||||||
|
8,500 |
| Altaba Inc.† | $ | 132,031 | $ | 593,725 | |||||
|
|
|
| |||||||||
Rights — 0.0% | ||||||||||||
|
Entertainment — 0.0% | |||||||||||
| 43,000 | Media General Inc., CVR†(a) | 0 | 0 | |||||||||
|
Principal |
| ||||||||||
U.S. Government Obligations — 0.4% | ||||||||||||
|
$490,000 |
|
U.S. Treasury Bills, 1.306%††, 03/22/18 | 488,582 | 488,548 | |||||||
| TOTAL INVESTMENTS — 100.0% | $ | 46,094,161 | 104,462,793 | |||||||||
| Other Assets and Liabilities (Net) — 0.0% | (40,906) | |||||||||||
| NET ASSETS — 100.0% | $ | 104,421,887 | ||||||||||
| (a) | Security is valued using significant unobservable inputs and is classified as Level 3 in the fair value hierarchy. |
| † | Non-income producing security. |
| †† | Represents annualized yield at date of purchase. |
| ADR | American Depositary Receipt |
| CVR | Contingent Value Right |
| SDR | Swedish Depositary Receipt |
See accompanying notes to financial statements. |
7 |
∎ Gabelli Capital Asset Fund |
��
Statement of Assets and Liabilities
| ||||
December 31, 2017 | ||||
ASSETS: | ||||
Investments, at value (cost $46,094,161) | $ | 104,462,793 | ||
Receivable for Fund shares sold | 10,569 | |||
Dividends receivable | 114,913 | |||
Prepaid expense | 932 | |||
|
| |||
Total Assets | 104,589,207 | |||
|
| |||
LIABILITIES: | ||||
Payable for investment advisory fees | 66,265 | |||
Payable to custodian | 14,320 | |||
Payable for legal and audit fees | 39,305 | |||
Payable for administrative services | 22,088 | |||
Payable for Fund shares redeemed | 1,469 | |||
Payable for accounting fees | 3,750 | |||
Payable for payroll expenses | 1,083 | |||
Payable for shareholder communications expenses | 8,035 | |||
Other accrued expenses | 11,005 | |||
|
| |||
Total Liabilities | 167,320 | |||
|
| |||
Net Assets (applicable to 5,012,216 shares outstanding) | $ | 104,421,887 | ||
|
| |||
NET ASSETS CONSIST OF: | ||||
Paid-in capital | $ | 47,099,151 | ||
Accumulated distributions in excess of net realized gain on investments and foreign currency transactions | (1,045,896 | ) | ||
Net unrealized appreciation on investments | 58,368,632 | |||
|
| |||
Net Assets | $ | 104,421,887 | ||
|
| |||
Shares of Capital Stock, each at $0.001 par value; 500,000,000 shares authorized: | ||||
Net Asset Value, offering, and redemption price per share ($104,421,887 ÷ 5,012,216 shares outstanding) | $20.83 | |||
|
|
Statement of Operations
| ||||
For the Year Ended December 31, 2017 | ||||
INVESTMENT INCOME: | ||||
Dividends (net of foreign withholding taxes of $15,234) | $ | 1,540,662 | ||
Interest | 4,054 | |||
Other Income* | 134 | |||
|
| |||
Total Investment Income | 1,544,850 | |||
|
| |||
EXPENSES: | ||||
Advisory fees | 779,055 | |||
Administrative services fees | 259,685 | |||
Directors’ fees | 70,500 | |||
Legal and audit fees | 57,543 | |||
Accounting fees | 45,000 | |||
Shareholder communications expenses | 16,286 | |||
Custodian fees | 10,153 | |||
Shareholder services fees | 9,507 | |||
Payroll expenses | 3,278 | |||
Interest expense | 3,178 | |||
Miscellaneous expenses | 21,557 | |||
|
| |||
Total Expenses | 1,275,742 | |||
|
| |||
Net Investment Income | 269,108 | |||
|
| |||
NET REALIZED AND UNREALIZED GAIN/(LOSS) ON INVESTMENTS AND FOREIGN CURRENCY: | ||||
Net realized gain on investments | 12,028,951 | |||
Net realized loss on foreign currency transactions | (451 | ) | ||
|
| |||
Net realized gain on investments and foreign currency transactions | 12,028,500 | |||
|
| |||
Net change in unrealized appreciation on investments | 7,100,615 | |||
|
| |||
Net Realized and Unrealized Gain/(Loss) on Investments and Foreign Currency | 19,129,115 | |||
|
| |||
NET INCREASE IN NET ASSETS RESULTING FROM OPERATIONS | $ | 19,398,223 | ||
|
| |||
| * | The Fund received a reimbursement of custody expenses paid in prior years. |
8 | See accompanying notes to financial statements. |
∎ Gabelli Capital Asset Fund
| ||
Statement of Changes in Net Assets | ||
| Year Ended December 31, 2017 | Year Ended December 31, 2016 | |||||||||
OPERATIONS: | ||||||||||
Net investment income | $ | 269,108 | $ | 606,729 | ||||||
Net realized gain on investments and foreign currency transactions | 12,028,500 | 7,489,939 | ||||||||
Net change in unrealized appreciation on investments and foreign currency translations | 7,100,615 | 5,289,322 | ||||||||
|
|
|
| |||||||
Net Increase in Net Assets Resulting from Operations | 19,398,223 | 13,385,990 | ||||||||
|
|
|
| |||||||
DISTRIBUTIONS TO SHAREHOLDERS: | ||||||||||
Net investment income | (271,592 | ) | (603,194 | ) | ||||||
Net realized gain | (11,837,827 | ) | (7,754,299 | ) | ||||||
Return of capital | (16,886 | ) | — | |||||||
|
|
|
| |||||||
Total Distributions to Shareholders | (12,126,305 | ) | (8,357,493 | ) | ||||||
|
|
|
| |||||||
| Net Decrease in Net Assets from Capital Share Transactions | (7,348,155 | ) | (2,363,746 | ) | ||||||
|
|
|
| |||||||
Net Increase/(Decrease) in Net Assets | (76,237 | ) | 2,664,751 | |||||||
NET ASSETS: | ||||||||||
Beginning of year | 104,498,124 | 101,833,373 | ||||||||
|
|
|
| |||||||
End of year (including undistributed net investment income of $0 and $0, respectively) | $ | 104,421,887 | $ | 104,498,124 | ||||||
|
|
|
| |||||||
See accompanying notes to financial statements. |
9 |
∎ Gabelli Capital Asset Fund
| ||
Financial Highlights | ||
| Selected data for a share of capital stock outstanding throughout each year: | ||||||||||||||||||||
| Year Ended December 31, | ||||||||||||||||||||
2017 | 2016 | 2015 | 2014 | 2013 | ||||||||||||||||
Operating Performance: | ||||||||||||||||||||
Net asset value, beginning of year | $ | 19.55 | $ | 18.59 | $ | 23.09 | $ | 25.08 | $ | 19.86 | ||||||||||
Net investment income(a) | 0.06 | 0.12 | 0.09 | 0.10 | 0.16 | |||||||||||||||
Net realized and unrealized gain/(loss) on investments and foreign currency transactions | 3.95 | 2.53 | (2.08 | ) | 0.08 | 7.26 | ||||||||||||||
Total from investment operations | 4.01 | 2.65 | (1.99 | ) | 0.18 | 7.42 | ||||||||||||||
Distributions to Shareholders: | ||||||||||||||||||||
Net investment income | (0.06 | ) | (0.12 | ) | (0.10 | ) | (0.12 | ) | (0.16 | ) | ||||||||||
Net realized gain on investments | (2.67 | ) | (1.57 | ) | (2.40 | ) | (2.04 | ) | (2.03 | ) | ||||||||||
Return of capital | (0.00 | )(b) | — | (0.01 | ) | (0.01 | ) | (0.01 | ) | |||||||||||
Total distributions | (2.73 | ) | (1.69 | ) | (2.51 | ) | (2.17 | ) | (2.20 | ) | ||||||||||
Net Asset Value, End of Year | $ | 20.83 | $ | 19.55 | $ | 18.59 | $ | 23.09 | $ | 25.08 | ||||||||||
Total Return † | 20.5 | % | 14.3 | % | (8.8 | )% | 0.6 | % | 37.5 | % | ||||||||||
Ratios to Average Net Assets and Supplemental Data: | ||||||||||||||||||||
Net assets, end of year (in 000’s) | $ | 104,422 | $ | 104,498 | $ | 101,833 | $ | 130,614 | $ | 149,398 | ||||||||||
Ratio of net investment income to average net assets | 0.26 | % | 0.60 | % | 0.39 | % | 0.41 | % | 0.67 | % | ||||||||||
Ratio of operating expenses to average net assets | 1.23 | % | 1.22 | %(c) | 1.20 | % | 1.15 | % | 1.13 | % | ||||||||||
Portfolio turnover rate | 2 | % | 3 | % | 1 | % | 3 | % | 10 | % | ||||||||||
| † | Total return represents aggregate total return of a hypothetical $1,000 investment at the beginning of the year and sold at the end of the year including reinvestment of distributions and does not reflect the applicable sales charges. |
| (a) | Per share data are calculated using the average shares outstanding method. |
| (b) | Amount represents less than $0.005 per share. |
| (c) | During the year ended December 31, 2017 and 2016, the Fund received reimbursements of custody expenses paid in prior years. Had such reimbursement been included in the 2016 calculation, the expense ratio would have been 1.04%. The 2017 reimbursement had no effect on the expense ratio. |
10 | See accompanying notes to financial statements. |
∎ Gabelli Capital Asset Fund
| ||
Notes to Financial Statements | ||
December 31, 2017
| 1. | Organization |
The Gabelli Capital Asset Fund is a series of Gabelli Capital Series Funds, Inc. that was incorporated on April 8, 1993 in Maryland and commenced investment operations on May 1, 1995. The Fund is a diversified open-end management investment company registered under the Investment Company Act of 1940, as amended (the “1940 Act”). The Fund’s primary objective is growth of capital. Current income is a secondary objective. Shares of the Fund are available to the public only through the purchase of certain variable annuity and variable life insurance contracts issued by The Guardian Insurance & Annuity Company, Inc. (“Guardian”) and other selected insurance companies.
| 2. | Significant Accounting Policies |
As an investment company, the Fund follows the investment company accounting and reporting guidance, which is part of U.S. generally accepted accounting principles (“GAAP”) that may require the use of management estimates and assumptions in the preparation of its financial statements. Actual results could differ from those estimates. The following is a summary of significant accounting policies followed by the Fund in the preparation of its financial statements.
Security Valuation
Portfolio securities listed or traded on a nationally recognized securities exchange or traded in the U.S. over-the-counter market for which market quotations are readily available are valued at the last quoted sale price or a market’s official closing price as of the close of business on the day the securities are being valued. If there were no sales that day, the security is valued at the average of the closing bid and ask prices or, if there were no ask prices quoted on that day, then the security is valued at the closing bid price on that day. If no bid or ask prices are quoted on such day, the security is valued at the most recently available price or, if the Board of Directors (the “Board”) so determines, by such other method as the Board shall determine in good faith to reflect its fair market value. Portfolio securities traded on more than one national securities exchange or market are valued according to the broadest and most representative market, as determined by Gabelli Funds, LLC (the “Adviser”).
Portfolio securities primarily traded on a foreign market are generally valued at the preceding closing values of such securities on the relevant market, but may be fair valued pursuant to procedures established by the Board if market conditions change significantly after the close of the foreign market, but prior to the close of business on the day the securities are being valued. Debt instruments for which market quotations are readily available are valued at the average of the latest bid and ask prices. If there were no ask prices quoted on such day, the security is valued using the closing bid price, unless the Board determines such amount does not reflect the securities’ fair value, in which case these securities will be fair valued by the Board. Certain securities are valued principally using dealer quotations. Futures contracts are valued at the closing settlement price of the exchange or board of trade on which the applicable contract is traded. OTC futures and options on futures for which market quotations are readily available will be valued by quotations received from a pricing service or, if no quotations are available from a pricing service, by quotations obtained from one or more dealers in the instrument in question by the Adviser.
Securities and assets for which market quotations are not readily available are fair valued as determined by the Board. Fair valuation methodologies and procedures may include, but are not limited to: analysis and review of available financial and non-financial information about the company; comparisons with the valuation and changes in valuation of similar securities, including a comparison of foreign securities with the equivalent U.S. dollar value American Depositary Receipt securities at the close of the U.S. exchange; and evaluation of any other information that could be indicative of the value of the security.
The inputs and valuation techniques used to measure fair value of the Fund’s investments are summarized into three levels as described in the hierarchy below:
| • | Level 1 — quoted prices in active markets for identical securities; |
| • | Level 2 — other significant observable inputs (including quoted prices for similar securities, interest rates, prepayment speeds, credit risk, etc.); and |
| • | Level 3 — significant unobservable inputs (including the Board’s determinations as to the fair value of investments). |
| 11 |
∎ Gabelli Capital Asset Fund
| ||
Notes to Financial Statements (Continued) | ||
December 31, 2017
A financial instrument’s level within the fair value hierarchy is based on the lowest level of any input both individually and in the aggregate that is significant to the fair value measurement. The inputs or methodology used for valuing securities are not necessarily an indication of the risk associated with investing in those securities. The summary of the Fund’s investments in securities by inputs used to value the Fund’s investments as of December 31, 2017 is as follows:
| Valuation Inputs |
| |||||||||||||||||||
| Level 1 Quoted Prices | Level 2 Other Significant Observable Inputs | Level 3 Significant Unobservable Inputs | Total Market Value at 12/31/17 | |||||||||||||||||
INVESTMENTS IN SECURITIES: | ||||||||||||||||||||
(Market Value): | ||||||||||||||||||||
Common Stocks: | ||||||||||||||||||||
Aerospace and Defense | $ | 10,823,119 | — | $ | 9,937 | $ | 10,833,056 | |||||||||||||
Financials | 14,713,640 | $ | 35,175 | — | 14,748,815 | |||||||||||||||
Utilities | 2,638,934 | — | 0 | 2,638,934 | ||||||||||||||||
Other Industries (a) | 75,159,715 | — | — | 75,159,715 | ||||||||||||||||
Total Common Stocks | 103,335,408 | 35,175 | 9,937 | 103,380,520 | ||||||||||||||||
Closed-End Funds | 593,725 | — | — | 593,725 | ||||||||||||||||
Rights (a) | — | — | 0 | 0 | ||||||||||||||||
U.S. Government Obligations | — | 488,548 | — | 488,548 | ||||||||||||||||
TOTAL INVESTMENTS IN SECURITIES - ASSETS | $ | 103,929,133 | $ | 523,723 | $ | 9,937 | $ | 104,462,793 | ||||||||||||
(a) Please refer to the Schedule of Investments for the industry classifications of these portfolio holdings.
The Fund did not have material transfers among Level 1, Level 2, and Level 3 during the year ended December 31, 2017. The Fund’s policy is to recognize transfers among Levels as of the beginning of the reporting period.
Additional Information to Evaluate Qualitative Information
General. The Fund uses recognized industry pricing services – approved by the Board and unaffiliated with the Adviser –to value most of its securities, and uses broker quotes provided by market makers of securities not valued by these and other recognized pricing sources. Several different pricing feeds are received to value domestic equity securities, international equity securities, preferred equity securities, and fixed income securities. The data within these feeds are ultimately sourced from major stock exchanges and trading systems where these securities trade. The prices supplied by external sources are checked by obtaining quotations or actual transaction prices from market participants. If a price obtained from the pricing source is deemed unreliable, prices will be sought from another pricing service or from a broker/dealer that trades that security or similar securities.
Fair Valuation. Fair valued securities may be common and preferred equities, warrants, options, rights, and fixed income obligations. Where appropriate, Level 3 securities are those for which market quotations are not available, such as securities not traded for several days, or for which current bids are not available, or which are restricted as to transfer. Among the factors to be considered to fair value a security are recent prices of comparable securities that are publicly traded, reliable prices of securities not publicly traded, the use of valuation models, current analyst reports, valuing the income or cash flow of the issuer, or cost if the preceding factors do not apply. A significant change in the unobservable inputs could result in a lower or higher value in Level 3 securities. The circumstances of Level 3 securities are frequently monitored to determine if fair valuation measures continue to apply.
The Adviser reports quarterly to the Board the results of the application of fair valuation policies and procedures. These may include back testing the prices realized in subsequent trades of these fair valued securities to fair values previously recognized.
Foreign Currency Translations
The books and records of the Fund are maintained in U.S. dollars. Foreign currencies, investments, and other assets and liabilities are translated into U.S. dollars at current exchange rates. Purchases and sales of investment securities, income, and expenses are translated at the exchange rate prevailing on the respective dates of such transactions. Unrealized gains and losses that result from changes in foreign exchange rates and/or changes in market prices of securities have been included in unrealized appreciation/depreciation on investments and foreign currency translations. Net realized foreign currency gains and losses resulting
12 | . |
∎ Gabelli Capital Asset Fund
| ||
Notes to Financial Statements (Continued) | ||
December 31, 2017
from changes in exchange rates include foreign currency gains and losses between trade date and settlement date on investment securities transactions, foreign currency transactions, and the difference between the amounts of interest and dividends recorded on the books of the Fund and the amounts actually received. The portion of foreign currency gains and losses related to fluctuation in exchange rates between the initial purchase trade date and subsequent sale trade date is included in realized gain/(loss) on investments.
Foreign Securities
The Fund may directly purchase securities of foreign issuers. Investing in securities of foreign issuers involves special risks not typically associated with investing in securities of U.S. issuers. The risks include possible revaluation of currencies, the inability to repatriate funds, less complete financial information about companies, and possible future adverse political and economic developments. Moreover, securities of many foreign issuers and their markets may be less liquid and their prices more volatile than securities of comparable U.S. issuers.
Foreign Taxes
The Fund may be subject to foreign taxes on income, gains on investments, or currency repatriation, a portion of which may be recoverable. The Fund will accrue such taxes and recoveries as applicable, based upon its current interpretation of tax rules and regulations that exist in the markets in which it invests.
Securities Transactions and Investment Income
Securities transactions are accounted for on the trade date with realized gain or loss on investments determined by using the identified cost method. Interest income (including amortization of premium and accretion of discount) is recorded on an accrual basis. Premiums and discounts on debt securities are amortized using the effective yield to maturity method. Dividend income is recorded on the ex-dividend date, except for certain dividends from foreign securities that are recorded as soon after the ex-dividend date as the Fund becomes aware of such dividends.
Expenses
Certain administrative expenses are common to, and allocated among, various affiliated funds. Such allocations are made on the basis of each fund’s average net assets or other criteria directly affecting the expenses as determined by the Adviser pursuant to procedures established by the Board.
Distributions to Shareholders
Distributions to shareholders are recorded on the ex-dividend date. Distributions to shareholders are based on income and capital gains as determined in accordance with federal income tax regulations, which may differ from income and capital gains as determined under GAAP. These differences are primarily due to differing treatments of income and gains on various investment securities and foreign currency transactions held by the Fund, timing differences, and differing characterizations of distributions made by the Fund. Distributions from net investment income for federal income tax purposes include net realized gains on foreign currency transactions. These book/tax differences are either temporary or permanent in nature. To the extent these differences are permanent, adjustments are made to the appropriate capital accounts in the period when the differences arise. Permanent differences were primarily due to reversal of prior year long term capital gain of real estate investment trusts. These reclassifications have no impact on the net asset value (“NAV”) per share of the Fund. For the year ended December 31, 2017, reclassifications were made to decrease distributions in excess of net investment income by $2,484 and increase accumulated distributions in excess of net realized gain on investments and foreign currency transactions by $2,484.
| 13 |
∎ Gabelli Capital Asset Fund
| ||
Notes to Financial Statements (Continued) | ||
December 31, 2017
The tax character of distributions paid during the years ended December 31, 2017 and 2016 was as follows:
| Year Ended December 31, 2017 | Year Ended December 31, 2016 | |||||||||
Distributions paid from: | ||||||||||
Ordinary income (inclusive of short term capital gains) | $ | 271,592 | $ | 610,515 | ||||||
Net long term capital gains | 11,837,827 | 7,746,978 | ||||||||
Return of capital | 16,886 | — | ||||||||
|
|
|
| |||||||
Total distributions paid | $ | 12,126,305 | $ | 8,357,493 | ||||||
Provision for Income Taxes
The Fund intends to continue to qualify as a regulated investment company under Subchapter M of the Internal Revenue Code of 1986, as amended (the “Code”). It is the policy of the Fund to comply with the requirements of the Code applicable to regulated investment companies and to distribute substantially all of its net investment company taxable income and net capital gains. Therefore, no provision for federal income taxes is required.
At December 31, 2017, the components of accumulated earnings/losses on a tax basis were as follows:
Net unrealized appreciation on investments and foreign currency translations | $ | 57,322,736 |
Under the Regulated Investment Company Modernization Act of 2010, the Fund is permitted to carry forward for an unlimited period capital losses incurred. As a result of the rule, post-enactment capital losses that are carried forward will retain their character as either short term or long term capital losses.
At December 31, 2017, the difference between book basis and tax basis unrealized appreciation was primarily due to deferral of losses from wash sales for tax purposes.
The following summarizes the tax cost of investments and the related net unrealized appreciation at December 31, 2017:
| Cost | Gross Unrealized Appreciation | Gross Unrealized Depreciation | Net Unrealized Appreciation | |||||||||||||||||
Investments | $ | 47,140,057 | $60,950,456 | $ | (3,627,720) | $57,322,736 | ||||||||||||||
The Fund is required to evaluate tax positions taken or expected to be taken in the course of preparing the Fund’s tax returns to determine whether the tax positions are “more-likely-than-not” of being sustained by the applicable tax authority. Income tax and related interest and penalties would be recognized by the Fund as tax expense in the Statement of Operations if the tax positions were deemed not to meet the more-likely-than-not threshold. During the year ended December 31, 2017, the Fund did not incur any income tax, interest, or penalties. As of December 31, 2017, the Adviser has reviewed all open tax years and concluded that there was no impact to the Fund’s net assets or results of operations. The Fund’s federal and state tax returns for the prior three fiscal years remain open, subject to examination. On an ongoing basis, the Adviser will monitor the Fund’s tax positions to determine if adjustments to this conclusion are necessary.
| 3. | Agreements with Affiliated Parties |
The Fund has entered into an investment advisory agreement (the “Advisory Agreement”) with the Adviser which provides that the Fund will pay the Adviser a fee, computed daily and paid monthly, at the annual rate of 0.75% of the value of its average daily net assets. In accordance with the Advisory Agreement, the Adviser provides a continuous investment program for the Fund’s portfolio, oversees the administration of certain aspects of the Fund’s business and affairs, and pays the compensation of all Officers and Directors of the Fund who are affiliated persons of the Adviser. The Fund entered into a shareholder services agreement with The Guardian Insurance & Annuity Company, Inc. (“Guardian”), whereby Guardian provides various administrative services, including maintenance of books and records, reconciliations with respect to Fund purchase and redemption orders, and telephone support for contract owners, as well as providing advice to the Adviser with respect to relevant insurance laws,
14 |
∎ Gabelli Capital Asset Fund
| ||
Notes to Financial Statements (Continued) | ||
December 31, 2017
regulations, and related matters and IRS regulations with respect to variable contracts. As compensation for its services, the Fund pays Guardian a fee, computed daily and paid monthly, at the annual rate of 0.25% of the value of its average daily net assets.
The Fund pays each Director who is not considered an affiliated person an annual retainer of $3,000 plus $1,000 for each Board meeting attended, and they are reimbursed for any out of pocket expenses incurred in attending meetings. All Board committee members receive $500 per meeting attended and the Chairman of the Audit Committee and the Lead Director each receives an annual fee of $1,000. A Director may receive a single meeting fee, allocated among the participating funds, for attending certain meetings held on behalf of multiple funds. Directors who are directors or employees of the Adviser or an affiliated company receive no compensation or expense reimbursement from the Fund.
| 4. | Portfolio Securities |
Purchases and sales of securities during the year ended December 31, 2017, other than short term securities and U.S. Government obligations, aggregated $1,577,789 and $20,299,217, respectively.
| 5. | Transactions with Affiliates |
During the year ended December 31, 2017, the Fund paid $10,883 in brokerage commissions on security trades to G.research, LLC, an affiliate of the adviser.
The cost of calculating the Fund’s NAV per share is a Fund expense pursuant to the Investment Advisory Agreement. During the year ended December 31, 2017, the Fund paid or accrued $45,000 to the Adviser in connection with the cost of computing the Fund’s NAV.
| 6. | Line of Credit |
The Fund participates in an unsecured line of credit, which expires on March 8, 2018 and may be renewed annually, of up to $75,000,000 under which it may borrow up to 10% of its net assets from the custodian for temporary borrowing purposes. Borrowings under this arrangement bear interest at a floating rate equal to the higher of the overnight Federal Funds rate plus 125 basis points or the 30-day LIBOR plus 125 basis points in effect on that day. This amount, if any, would be included in Interest expense in the Statement of Operations. At December 31, 2017, there were no borrowings outstanding under the line of credit.
The average daily amount of borrowings outstanding under the line of credit during the year ended December 31, 2017 was $139,381 with a weighted average interest rate of 2.35%. The maximum amount borrowed at any time during the year ended December 31, 2017 was $1,090,000.
| 7. | Capital Stock |
Transactions in shares of capital stock were as follows:
Year Ended December 31, 2017 | Year Ended December 31, 2016 | |||||||||||||||
| Shares | Amount | Shares | Amount | |||||||||||||
Shares sold | 58,434 | $ | 1,251,672 | 193,177 | $ | 3,815,927 | ||||||||||
Shares issued upon reinvestment of distributions | 581,040 | 12,126,305 | 425,752 | 8,357,494 | ||||||||||||
Shares redeemed | (972,078 | ) | (20,726,132 | ) | (750,607 | ) | (14,537,167 | ) | ||||||||
Net decrease | (332,604 | ) | $ | (7,348,155 | ) | (131,678 | ) | $ | (2,363,746 | ) | ||||||
| 8. | Indemnifications |
The Fund enters into contracts that contain a variety of indemnifications. The Fund’s maximum exposure under these arrangements is unknown. However, the Fund has not had prior claims or losses pursuant to these contracts. Management has reviewed the Fund’s existing contracts and expects the risk of loss to be remote.
15 |
∎ Gabelli Capital Asset Fund
| ||
Notes to Financial Statements (Continued) | ||
December 31, 2017
| 9. | Subsequent Events |
Management has evaluated the impact on the Fund of all subsequent events occurring through the date the financial statements were issued and has determined that there were no subsequent events requiring recognition or disclosure in the financial statements.
16 |
Gabelli Capital Asset Fund
Report of Independent Registered Public Accounting Firm
To the Shareholders and Board of Directors of
Gabelli Capital Asset Fund
Opinion on the Financial Statements
We have audited the accompanying statement of assets and liabilities of Gabelli Capital Asset Fund (the “Fund”) (one of the funds constituting Gabelli Capital Series Funds, Inc. (the “Corporation”)), including the schedule of investments, as of December 31, 2017, and the related statement of operations for the year then ended, the statements of changes in net assets for each of the two years in the period then ended, the financial highlights for each of the five years in the period then ended and the related notes (collectively referred to as the “financial statements”). In our opinion, the financial statements present fairly, in all material respects, the financial position of the Fund (one of the funds constituting Gabelli Capital Series Funds, Inc.) at December 31, 2017, the results of its operations for the year then ended, the changes in its net assets for each of the two years in the period then ended and its financial highlights for each of the five years in the period then ended, in conformity with U.S. generally accepted accounting principles.
Basis for Opinion
These financial statements are the responsibility of the Corporation’s management. Our responsibility is to express an opinion on the Fund’s financial statements based on our audits. We are a public accounting firm registered with the Public Company Accounting Oversight Board (United States) (“PCAOB”) and are required to be independent with respect to the Corporation in accordance with the U.S. federal securities laws and the applicable rules and regulations of the Securities and Exchange Commission and the PCAOB.
We conducted our audits in accordance with the standards of the PCAOB. Those standards require that we plan and perform the audit to obtain reasonable assurance about whether the financial statements and financial highlights are free of material misstatement, whether due to error or fraud. The Corporation is not required to have, nor were we engaged to perform, an audit of the Corporation’s internal control over financial reporting. As part of our audits, we are required to obtain an understanding of internal control over financial reporting, but not for the purpose of expressing an opinion on the effectiveness of the Corporation’s internal control over financial reporting. Accordingly, we express no such opinion.
Our audits included performing procedures to assess the risks of material misstatement of the financial statements, whether due to error or fraud, and performing procedures that respond to those risks. Such procedures included examining, on a test basis, evidence regarding the amounts and disclosures in the financial statements. Our procedures included confirmation of securities owned as of December 31, 2017, by correspondence with the custodians. Our audits also included evaluating the accounting principles used and significant estimates made by management, as well as evaluating the overall presentation of the financial statements. We believe that our audits provide a reasonable basis for our opinion.

We have served as the auditor of one or more Gabelli/GAMCO Funds investment companies since 1992.
Philadelphia, Pennsylvania
February 28, 2018
17 |
∎ Gabelli Capital Asset Fund
| ||
Additional Information (Unaudited) | ||
The business and affairs of the Fund are managed under the direction of the Company’s Board of Directors. Information pertaining to the Directors and officers of the Fund is set forth below. The Fund’s Statement of Additional Information includes additional information about the Fund’s Directors and officers and is available without charge, upon request, by writing to Gabelli Capital Series Funds, Inc. at One Corporate Center, Rye, NY 10580-1422.
| Name, Position(s) Address1 and Age | Term of Office and Length of Time Served2 | Number of Funds in Fund Complex Overseen by Director | Principal Occupation(s) During Past Five Years | Other Directorships Held by Director4 | ||||
| Interested Directors3 | ||||||||
Mario J. Gabelli, CFA Director and Chief Investment Officer Age: 75 | Since 1995 | 32 | Chairman, Chief Executive Officer, and Chief Investment Officer– Value Portfolios of GAMCO Investors, Inc. and Chief Investment Officer– Value Portfolios of Gabelli Funds, LLC and GAMCO Asset Management Inc.; Director/ Trustee or Chief Investment Officer of other registered investment companies within the Gabelli/GAMCO Fund Complex; Chief Executive Officer of GGCP, Inc.; Executive Chairman of Associated Capital Group, Inc. | Director of Morgan Group Holdings, Inc. (holding company); Chairman of the Board and Chief Executive Officer of LICT Corp. (multimedia and communication services company); Director of CIBL, Inc. (broadcasting and wireless communications); Director of ICTC Group Inc. (communications) | ||||
| Independent Directors5 | ||||||||
Anthony J. Colavita Director Age: 82 | Since 1995 | 28 | President of the law firm of Anthony J. Colavita, P.C. | — | ||||
Clarence A. Davis Director Age: 76 | Since 2015 | 3 | Former Chief Executive Officer of Nestor, Inc. (2007-2009); Former Chief Operating Officer (2000-2005) and Chief Financial Officer (1999-2000) of the American Institute of Certified Public Accountants | Director of Telephone & Data Systems, Inc. (telephone services); Director of Pennichuck Corp. (water supply) (2009- 2012) | ||||
Arthur V. Ferrara Director Age: 87 | Since 1995 | 8 | Former Chairman of the Board and Chief Executive Officer of The Guardian Life Insurance Company of America (1993-1995) | — | ||||
Mary E. Hauck Director Age: 75 | Since 2014 | 11 | Retired Senior Manager of the Gabelli- O’Connor Fixed Income Mutual Funds Management Company | — | ||||
William F. Heitmann Director Age: 68 | Since 2015 | 4 | Managing Director and Senior Advisor of Perlmutter Investment Company (real estate); Senior Vice President of Finance, Verizon Communications, and President, Verizon Investment Management (1971-2011) | Director and Audit Committee Chair of DRS Technologies (defense electronic systems) | ||||
Kuni Nakamura Director Age: 49 | Since 2015 | 33 | President of Advanced Polymer, Inc. (chemical manufacturing company); President of KEN Enterprises, Inc. (real estate) | — | ||||
Anthony R. Pustorino Director Age: 92 | Since 1995 | 10 | Certified Public Accountant; Professor Emeritus, Pace University | Director of The LGL Group, Inc. (diversified manufacturing) (2004-2011) | ||||
18 |
∎ Gabelli Capital Asset Fund
| ||
Additional Information (Unaudited) (Continued) | ||
Name, Position(s) Address1 and Age | Term of Office and Length of Time Served2 | Number of Funds in Fund Complex Overseen by Director | Principal Occupation(s) During Past Five Years | Other Directorships Held by Director4 | ||||
Werner J. Roeder Director Age: 77 | Since 1995 | 23 | Retired physician; Former Vice President of Medical Affairs (Medical Director) of New York Presbyterian/Lawrence Hospital (1999-2014) | — | ||||
Anthonie C. van Ekris Director Age: 83 | Since 1995 | 22 | Chairman and Chief Executive Officer of BALMAC International, Inc. (global import/ export company) | — | ||||
Daniel E. Zucchi Director Age: 77 | Since 1994 | 2 | President of Zucchi & Associates (general business consulting); Senior Vice President of Hearst Corp. (1984-1995) | Cypress Care LLC (health care) (2001-2009); Anduro Holdings Inc. (consumer packaging) | ||||
19 |
∎ Gabelli Capital Asset Fund
| ||
Additional Information (Unaudited) (Continued) | ||
| Name, Position(s) Address1 and Age | Term of Office and Length of Time Served2 | Principal Occupation(s) During Past Five Years | ||
| Officers | ||||
Bruce N. Alpert President Age: 66 | Since 1995 | Executive Vice President and Chief Operating Officer of Gabelli Funds, LLC since 1988; Officer of registered investment companies within the Gabelli/GAMCO Fund Complex; Senior Vice President of GAMCO Investors, Inc. since 2008 | ||
John C. Ball Treasurer Age: 41 | Since 2017 | Treasurer of all the registered investment companies within the Gabelli/GAMCO Fund Complex since 2017; Vice President and Assistant Treasurer of AMG Funds, 2014-2017; Vice President of State Street Corporation, 2007-2014 | ||
Agnes Mullady Vice President Age: 59 | Since 2006 | Officer of all of the registered investment companies within the Gabelli/GAMCO Fund Complex since 2006; President and Chief Operating Officer of the Fund Division of Gabelli Funds, LLC since 2015; Chief Executive Officer of G.distributors, LLC since 2010; Senior Vice President of GAMCO Investors, Inc. since 2009; Vice President of Gabelli Funds, LLC since 2007; Executive Vice President of Associated Capital Group, Inc. since 2016 | ||
Andrea R. Mango Secretary Age: 45 | Since 2013 | Vice President of GAMCO Investors, Inc. since 2016; Counsel of Gabelli Funds, LLC since 2013; Secretary of all registered investment companies within the Gabelli/GAMCO Fund Complex since 2013; Vice President of all closed-end funds within the Gabelli/GAMCO Fund Complex since 2014; Corporate Vice President within the Corporate Compliance Department of New York Life Insurance Company, 2011-2013 | ||
Richard J. Walz Chief Compliance Officer Age: 58 | Since 2013 | Chief Compliance Officer of all of the registered investment companies within the Gabelli/GAMCO Fund Complex since 2013; Chief Compliance Officer of AEGON USA Investment Management, 2011-2013 | ||
| 1. | Address: One Corporate Center, Rye, NY 10580-1422, unless otherwise noted. |
| 2. | Each Director will hold office for an indefinite term until the earliest of (i) the next meeting of shareholders, if any, called for the purpose of considering the election or re-election of such Director and until the election and qualification of his or her successor, if any, elected at such meeting, or (ii) the date a Director resigns or retires, or a Director is removed by the Board of Directors or shareholders, in accordance with the Fund’s By-Laws and Articles of Incorporation. Each officer will hold office for an indefinite term until the date he or she resigns or retires or until his or her successor is elected and qualified. |
| 3. | “Interested person” of the Fund as defined in the 1940 Act. Mr. Gabelli is considered an “interested person” because of his affiliation with Gabelli Funds, LLC which acts as the Fund’s investment adviser. |
| 4. | This column includes directorships of companies required to report to the SEC under the Securities Exchange Act of 1934, as amended, i.e., public companies, other investment companies registered under the 1940 Act, and other noteworthy directorships. |
| 5. | Directors who are not interested persons are considered “Independent” Directors. |
20 |
∎ Gabelli Capital Asset Fund
| ||
2017 Tax Notice to Shareholders (Unaudited) | ||
For the year ended December 31, 2017, the Fund paid to shareholders ordinary income distributions (comprised of net investment income) totaling $0.060 per share, and long term capital gains totaling $11,837,827 or the maximum allowable. The distributions of long term capital gains have been designated as a capital gain dividend by the Fund’s Board of Directors. For the year ended December 31, 2017, 100% of the ordinary income distribution qualifies for the dividends received deduction available to corporations. The Fund designates 100% of the ordinary income distribution as qualified dividend income pursuant to the Jobs and Growth Tax Relief Reconciliation Act of 2003. The Fund designates 0.26% of the ordinary income distribution as qualified interest income pursuant to the Tax Relief, Unemployment Reauthorization, and Job Creation Act of 2010.
U.S. Government Income:
The percentage of the ordinary income distribution paid by the Fund during the year ended December 31, 2017 which was derived from U.S. Treasury securities was 0.25%. Due to the diversity in state and local tax law, it is recommended that you consult your personal tax adviser as to the applicability of the information provided to your specific situation.
All designations are based on financial information available as of the date of this annual report and, accordingly, are subject to change. For each item, it is the intention of the Fund to designate the maximum amount permitted under the Internal Revenue Code and the regulations thereunder.
21 |
Item 2. Code of Ethics.
| (a) | The registrant, as of the end of the period covered by this report, has adopted a code of ethics that applies to the registrant’s principal executive officer, principal financial officer, principal accounting officer or controller, or persons performing similar functions, regardless of whether these individuals are employed by the registrant or a third party. |
| (c) | There have been no amendments, during the period covered by this report, to a provision of the code of ethics that applies to the registrant’s principal executive officer, principal financial officer, principal accounting officer or controller, or persons performing similar functions, regardless of whether these individuals are employed by the registrant or a third party, and that relates to any element of the code of ethics description. |
| (d) | The registrant has not granted any waivers, including an implicit waiver, from a provision of the code of ethics that applies to the registrant’s principal executive officer, principal financial officer, principal accounting officer or controller, or persons performing similar functions, regardless of whether these individuals are employed by the registrant or a third party, that relates to one or more of the items set forth in paragraph (b) of this item’s instructions. |
Item 3. Audit Committee Financial Expert.
As of the end of the period covered by the report, the registrant’s Board of Directors has determined that Anthony R. Pustorino is qualified to serve as an audit committee financial expert serving on its audit committee and that he is “independent,” as defined by Item 3 of Form N-CSR.
Item 4. Principal Accountant Fees and Services.
Audit Fees
| (a) | The aggregate fees billed for each of the last two fiscal years for professional services rendered by the principal accountant for the audit of the registrant’s annual financial statements or services that are normally provided by the accountant in connection with statutory and regulatory filings or engagements for those fiscal years are $34,300 for 2016 and $34,300 for 2017. |
Audit-Related Fees
| (b) | The aggregate fees billed in each of the last two fiscal years for assurance and related services by the principal accountant that are reasonably related to the performance of the audit of the registrant’s financial statements and are not reported under paragraph (a) of this Item are $0 for 2016 and $0 for 2017. |
Tax Fees
| (c) | The aggregate fees billed in each of the last two fiscal years for professional services rendered by the principal accountant for tax compliance, tax advice, and tax planning are $3,700 for 2016 and $3,700 for 2017. Tax fees represent tax compliance services provided in connection with the review of the Registrant’s tax returns. |
All Other Fees
| (d) | The aggregate fees billed in each of the last two fiscal years for products and services provided by the principal accountant, other than the services reported in paragraphs (a) through (c) of this Item are $74 for 2016 and $78 for 2017. The fees relate to Passive Foreign Investment Company identification database subscription fees billed on an annual basis. |
| (e)(1) | Disclose the audit committee’s pre-approval policies and procedures described in paragraph (c)(7) of Rule 2-01 of Regulation S-X. |
Pre-Approval Policies and Procedures. The Audit Committee (“Committee”) of the registrant is responsible for pre-approving (i) all audit and permissible non-audit services to be provided by the independent registered public accounting firm to the registrant and (ii) all permissible non-audit services to be provided by the independent registered public accounting firm to the Adviser, Gabelli Funds, LLC, and any affiliate of Gabelli Funds, LLC (“Gabelli”) that provides services to the registrant (a “Covered Services Provider”) if the independent registered public accounting firm’s engagement related directly to the operations and financial reporting of the registrant. The Committee may delegate its responsibility to pre-approve any such audit and permissible non-audit services to the Chairperson of the Committee, and the Chairperson must report to the Committee, at its next regularly scheduled meeting after the Chairperson’s pre-approval of such services, his or her decision(s). The Committee may also establish detailed pre-approval policies and procedures for pre-approval of such services in accordance with applicable laws, including the delegation of some or all of the Committee’s pre-approval responsibilities to the other persons (other than Gabelli or the registrant’s officers). Pre-approval by the Committee of any permissible non-audit services is not required so long as: (i) the permissible non-audit services were not recognized by the registrant at the time of the engagement to be non-audit services; and (ii) such services are promptly brought to the attention of the Committee and approved by the Committee or Chairperson prior to the completion of the audit.
| (e)(2) | The percentage of services described in each of paragraphs (b) through (d) of this Item that were approved by the audit committee pursuant to paragraph (c)(7)(i)(C) of Rule 2-01 of Regulation S-X are as follows: |
(b) N/A
(c) 100%
(d) 100%
| (f) | The percentage of hours expended on the principal accountant’s engagement to audit the registrant’s financial statements for the most recent fiscal year that were attributed to work performed by persons other than the principal accountant’s full-time, permanent employees was less than fifty percent. |
| (g) | The aggregate non-audit fees billed by the registrant’s accountant for services rendered to the registrant, and rendered to the registrant’s investment adviser (not including any sub-adviser whose role is primarily portfolio management and is subcontracted with or overseen by another investment adviser), and any entity controlling, controlled by, or under common control with the adviser that provides ongoing services to the registrant for each of the last two fiscal years of the registrant was $35,321 for 2016 and $36,986 for 2017. |
| (h) | The registrant’s audit committee of the board of directors has considered whether the provision of non-audit services that were rendered to the registrant’s investment adviser (not including any sub-adviser whose role is primarily portfolio management and is subcontracted with or overseen by another investment adviser), and any entity controlling, controlled by, or under common control with the investment adviser that provides ongoing services to the registrant that were not pre-approved pursuant to paragraph (c)(7)(ii) of Rule 2-01 of Regulation S-X is compatible with maintaining the principal accountant’s independence. |
Item 5. Audit Committee of Listed Registrants.
Not applicable.
Item 6. Investments.
| (a) | Schedule of Investments in securities of unaffiliated issuers as of the close of the reporting period is included as part of the report to shareholders filed under Item 1 of this form. |
| (b) | Not applicable. |
Item 7. Disclosure of Proxy Voting Policies and Procedures for Closed-End Management Investment Companies.
Not applicable.
Item 8. Portfolio Managers of Closed-End Management Investment Companies.
Not applicable.
Item 9. Purchases of Equity Securities by Closed-End Management Investment Company and Affiliated Purchasers.
Not applicable.
Item 10. Submission of Matters to a Vote of Security Holders.
There have been no material changes to the procedures by which the shareholders may recommend nominees to the registrant’s Board of Directors, where those changes were implemented after the
registrant last provided disclosure in response to the requirements of Item 407(c)(2)(iv) of Regulation S-K (17 CFR 229.407) (as required by Item 22(b)(15) of Schedule 14A (17 CFR 240.14a-101)), or this Item.
Item 11. Controls and Procedures.
| (a) | The registrant’s principal executive and principal financial officers, or persons performing similar functions, have concluded that the registrant’s disclosure controls and procedures (as defined in Rule 30a-3(c) under the Investment Company Act of 1940, as amended (the “1940 Act”) (17 CFR 270.30a-3(c))) are effective, as of a date within 90 days of the filing date of the report that includes the disclosure required by this paragraph, based on their evaluation of these controls and procedures required by Rule 30a-3(b) under the 1940 Act (17 CFR 270.30a-3(b)) and Rules 13a-15(b) or 15d-15(b) under the Securities Exchange Act of 1934, as amended (17 CFR 240.13a-15(b) or 240.15d-15(b)). |
| (b) | There were no changes in the registrant’s internal control over financial reporting (as defined in Rule 30a-3(d) under the 1940 Act (17 CFR 270.30a-3(d))) that occurred during the registrant’s last fiscal quarter that has materially affected, or is reasonably likely to materially affect, the registrant’s internal control over financial reporting. |
Item 12. Disclosure of Securities Lending Activities for Closed-End Management Investment Companies.
Not applicable.
Item 13. Exhibits.
| (a)(1) | Code of ethics, or any amendment thereto, that is the subject of disclosure required by Item 2 is attached hereto. |
| (a)(2) | Certifications pursuant to Rule 30a-2(a) under the 1940 Act and Section 302 of the Sarbanes-Oxley Act of 2002 are attached hereto. |
| (a)(3) | Not applicable. |
| (a)(4) | Not applicable. |
| (b) | Certifications pursuant to Rule 30a-2(b) under the 1940 Act and Section 906 of the Sarbanes- Oxley Act of 2002 are attached hereto. |
SIGNATURES
Pursuant to the requirements of the Securities Exchange Act of 1934 and the Investment Company Act of 1940, the registrant has duly caused this report to be signed on its behalf by the undersigned, thereunto duly authorized.
(Registrant) Gabelli Capital Series Funds, Inc. | ||
By (Signature and Title)* /s/ Bruce N. Alpert | ||
Bruce N. Alpert, Principal Executive Officer | ||
Date 3/09/2018 | ||
Pursuant to the requirements of the Securities Exchange Act of 1934 and the Investment Company Act of 1940, this report has been signed below by the following persons on behalf of the registrant and in the capacities and on the dates indicated.
By (Signature and Title)* /s/ Bruce N. Alpert | ||
Bruce N. Alpert, Principal Executive Officer | ||
Date 3/09/2018 | ||
By (Signature and Title)* /s/ John C. Ball | ||
John C. Ball, Principal Financial Officer and Treasurer | ||
Date 3/09/2018 | ||
* Print the name and title of each signing officer under his or her signature.