Exhibit 15.6
[IMS HEALTH HQ LIMITED LETTERHEAD]
AstraZeneca PLC
Legal & Secretary’s Department
1 Francis Crick Avenue
Cambridge Biomedical Campus
Cambridge CB2 0AA
For the attention of Adrian Kemp
By email & by post
7, March 2017
Dear Ladies and Gentlemen
IMS DATA DISCLOSURE FOR ANNUAL REPORT AND FORM 20-F INFORMATION 2016
In connection with the anticipated filing by AstraZeneca PLC (“AstraZeneca”) of a Form 20-F with the US Securities and Exchange Commission, IMS Health HQ Limited hereby authorizes AstraZeneca to refer to IMS Health and certain pharmaceutical industry data derived by IMS Health, as identified (highlighted in yellow) on the pages annexed hereto as Annex A, a selection of pages from AstraZeneca’s Annual Report and Form 20-F Information for the fiscal year ended December 31, 2016 (the “Annual Report”), which is incorporated by reference in the registration statement No. 333-214756 for AstraZeneca on Form F-3, and in the registration statements No. 333-09060, No. 333-09062, No. 33-65362, No. 33-65366, No. 333-12310, No. 333-12426, No. 333-12428, No. 333-13328, No. 333-13918, No. 333-124689, No. 333-152767 and No. 333-170381 on Form S-8 for AstraZeneca.
IMS Health’s authorization is subject to AstraZeneca’s acknowledgement and agreement that:
| | 1) | IMS Health has not been provided with a full copy of the draft Annual Report but only a very limited number of pages from the documents as indicated above; |
| | 2) | IMS Health has not undertaken an independent review of the information disclosed in the Annual Report other than to discuss our observations as to the accuracy of the information relating to IMS Health and certain pharmaceutical industry data derived by IMS Health; |
| | 3) | AstraZeneca acknowledges and agrees that IMS Health shall not be deemed an “Expert” in respect of AstraZeneca’s securities filings, and AstraZeneca agrees that it shall not characterize IMS Health as such; and |
| | 4) | AstraZeneca accepts full responsibility for the disclosure of all information and data, including that relating to IMS Health, set forth in the Annual Report as filed with the SEC and agrees to indemnify IMS Health from any third party claims that may arise therefrom. |
Please indicate your agreement to the foregoing by signing in the space indicated below. Our authorization will not become effective until accepted and agreed by AstraZeneca.
Very truly yours,
/s/ James E. Salitan
James E. Salitan
Vice President and Associate General Counsel, EMEA Region
For and on behalf of IMS Health HQ Limited
ACCEPTED AND AGREED
This 7th day of March 2017
AstraZeneca PLC
/s/ A C N Kemp
Name: Adrian Kemp
Title: Company Secretary
2
Strategic Report
Chief Executive Officer’s Review
| | | | |
 | |  2017 should be 2017 should be
a turning point in our journey as we bring new medicines to patients across the globe.” year with $423 million in Product Sales in its first full year.In diabetes,Farxiga/Forxiga is a global leader in the SGLT2 class of diabetes treatments with a 35% volume share. Product Sales ofBrilinta/Briliquereached $839 million and in many countries it is the leading medicine for patients discharged with acute coronary syndrome. While AstraZeneca benefits from realising the potential of the new medicines emerging from our pipeline, we never forget that the main beneficiaries of our life-changing medicines are patients. For instance, since its launch at the end of 2014, we have treated nearly 5,000 cancer patients withLynparza and launched it in 31 countries with seven ongoing reviews. Investing for the future As we look ahead to 2017 and beyond, continued investment in our pipeline keeps us on track to return to sustainable growth in line with our targets. Examples of how we are investing for the future for the benefit of patients appear throughout this Annual Report. However, none is more significant than our investment in Cambridge, UK, as illustrated on page 7. Cambridge, along with Gaithersburg, MD, US and Gothenburg in Sweden, is one of our three strategic R&D centres and it also became our global corporate headquarters in May 2016. Our activities there demonstrate our focus on science, collaborative way of working and commitment to sustainability. Achieve scientific leadership The panel to the right provides an overview of how we performed against each of our three strategic priorities in 2016. At the heart of our plans to achieve scientific leadership is our focus on three therapy areas. |
| | A transitional phase The first phase in our journey ended in 2015 and was focused on rebuilding our pipeline. 2016 was a crucial year in the second stage of our journey, as we manage a transitional period of patent expiries, drive our Growth Platforms and roll out our new medicines. While now largely behind us, the impact of the loss of exclusivity on some of our most important medicines has been significant and will continue in 2017. Between 2011 and 2016, Product Sales in Established Markets of brands that have lost exclusivity, includingCrestor, a statin,Nexium, a proton pump inhibitor andSeroquel, an anti-psychotic, have reduced from $20 billion to $6 billion. Unfavourable currency movements account for $2 billion of this $14 billion reduction. This decline represents a significant ‘headwind’, but we have made significant progress rebuilding our Company for the future and preparing for a new period of growth driven by our pipeline delivery. In parallel to managing our legacy brands decline, we have launched a significant number of new medicines and increased revenues from our recently launched medicines. For example,Tagrisso was only launched in November 2015 and became our biggest lung cancer medicine during the | |
| | |
| 4 | | AstraZenecaAnnual Report and Form 20-F Information 2016 |
Marketplace
| | |
| 2bn | |  |
By 2050, the world’s population aged 60 years and older is expected to total some 2 billion.
Global investment in pharmaceutical R&D expected to reach an estimated $154 billion in 2016, an 11% increase from $139 billion in 2012.
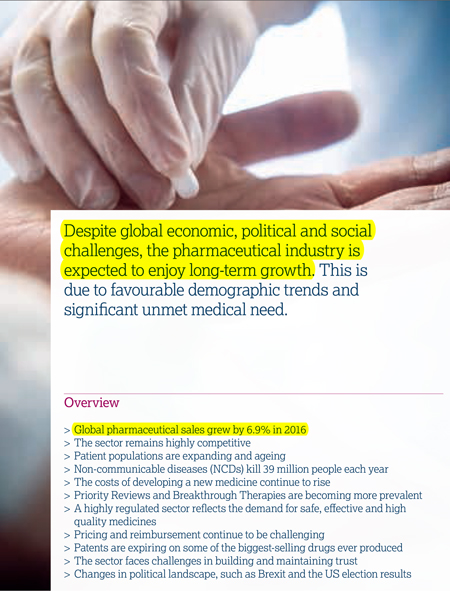
The global context
The October 2016 World Economic Outlook of the International Monetary Fund (IMF) highlighted the precarious nature of the recovery eight years after the global financial crisis. It raised the spectre that persistent stagnation, particularly in advanced economies, could further fuel populist calls for restrictions on trade and immigration. The IMF went on to observe that such restrictions would hamper productivity, growth and innovation. In China, a shift from investment and industry towards consumption and services was expected to slow growth in the short term while building the foundations for a more sustainable long-term expansion. Japan’s economy would be hampered by a shrinking population.
More generally, both political and economic uncertainty followed the Brexit vote in the UK and the election of Donald Trump to president of the US. Instability in a number of other European countries has been exacerbated by refugees fleeing civil war and unrest in the Middle East and from further afield.
Against this uncertain background, however, the demand for healthcare continues to increase. While this is a favourable trend for long-term industry growth, challenges remain. These include expiring patents, competition from and growing use of generic medicines, obtaining regulatory approval, securing reimbursement for new medicines, improving R&D productivity and attaining pricing and sales sufficient to generate revenue and sustain the cycle of innovation.

| | |
| AstraZenecaAnnual Report and Form 20-F Information 2016 | | 11 |
Strategic Report | Strategy
Marketplacecontinued
| | | | |
Global pharmaceutical sales | | | |
World$bn 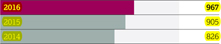
| | | | |
$967bn(6.9%) | | | | |
US$bn 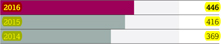
| | | | |
$446bn (7.1%) | | | | |
Europe$bn 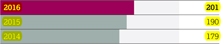
| | | | |
$201bn (5.6%) | | | | |
Established ROW$bn 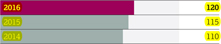
| | | | |
$120bn (5.1%) | | | | |
Emerging Markets$bn 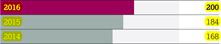
| | | | |
| $200bn(9.1%) | | | | |
Data based on world market sales using AstraZeneca market definitions as set out in the Market definitions on page 239. Source: IMS Health, IMS Midas Quantum Q3 2016 (including US data). Reported values and growth are based at CER. Value figures are rounded to the nearest billion and growth percentages are rounded to the nearest tenth.
Expanding patient populations
The number of people accessing healthcare is increasing, as is healthcare spending, particularly by the elderly. For example, WHO estimates that, by 2050, the world’s population aged 60 years and older is expected to total some two billion, up from 900 million in 2015 and that, by then, 80% of all older people will live in low-and middle-income countries. As the diagram on page 14 shows,we expect developing markets to continue to fuel pharmaceutical growth.
Unmet medical need
The prevalence of NCDs, such as cancer and cardiovascular, metabolic and respiratory diseases, is increasing worldwide. NCDs are often associated with ageing populations and lifestyle choices, including smoking, diet and lack of exercise. Many NCDs require long-term management. WHO estimates that NCDs kill 39 million people each year and disproportionately affect low- and middle-income countries where nearly three-quarters of these deaths occur. For example, more than 60% of the world’s total new annual cancer cases occur in Africa, Asia, and Central and South America. These regions account for 70% of the world’s cancer deaths.
The pharmaceutical sector: opportunities and challenges
As shown in the table on the left,global pharmaceutical sales grew by 6.9% in 2016. Established Markets saw average revenue growth of 6.4% and Emerging Markets revenue grew at 9.1%. The US, Japan, China, Germany and France are the world’s top five pharmaceutical markets. In 2016, the US had 44.7% of global sales (2015: 46.0%; 2014: 44.7%).
Science and technology
Innovation is critical to addressing unmet medical need. The delivery of new medicines will rely on a more advanced understanding of disease and the use of new technology and approaches, including personalised healthcare (PHC) and predictive science.
Technological breakthroughs in the design and testing of novel compounds present fresh opportunities for using small molecules as the basis for new medicines. The use of large molecules, or biologics, has also become an important source of innovation. Biologics are among the most commercially successful new products. By 2020, biologics, excluding vaccines, are expected to account for 27% of the global pharmaceutical market, having risen from 14% in 2006. As such, most pharmaceutical companies now pursue R&D in both small molecules and biologics.
Priority Reviews and Breakthrough Therapies are becoming more prevalent. Between the inception of the Breakthrough Therapy Designation programme in October 2012 and the end of 2016, the FDA granted more than 150 such requests (out of more than 450 applications), and one-third of these have already resulted in product approvals.
The cost of developing new medicines continues to rise. Global R&D investment is expected to reach $154 billion in 2016. While the growth rate of R&D spend has slowed in recent years, pharmaceutical companies continue to deliver new medicines. In 2016, the FDA approved 22 novel drugs compared with 45 in 2015 and 41 in 2014.
To ensure sustainable returns on R&D investment, the industry is working to increase its success rate in developing commercially viable new drugs while achieving a lower, more flexible cost base. Regulators and payers, however, are demanding greater evidence of comparative effectiveness of medicines. This increases development times and costs.
Fortunately, innovative technology is helping accelerate product approvals. A greater emphasis on Proof of Concept is also helping to improve productivity and reduce costs by showing the potential efficacy of drugs earlier in the development process.
| | |
| 12 | | AstraZenecaAnnual Report and Form 20-F Information 2016 |
Strategic Report | Strategy
Marketplacecontinued
We expect developing markets to continue to boost pharmaceutical growth.”
| | |
| 84.7% | |  |
| Generics constituted 84.7% of prescriptions dispensed in the US. | |
Political leadership in the US has also continued to focus on drug pricing. Various drug pricing proposals have included measures relating to the repeal of the Medicare Part D non-interference clause that currently prohibits the government from negotiating directly with manufacturers on drug prices and US drug importation policies. In addition, lawmakers and policymakers at both the federal and state level have developed drug pricing transparency proposals that include measures relating to the submission of proprietary manufacturer data, establishment of price parameters that are indexed to certain federal programmes, and reporting of changes in pricing beyond certain thresholds. While the implementation timeline and details of such proposals are not clear, significant changes to laws and regulations regarding drug pricing could have a significant impact on the pharmaceutical industry.
In Europe, governments continue to implement and expand price control measures for medicines, including mandatory discounts, clawbacks and price referencing rules. These measures are decreasing drug prices, particularly in the challenged economies of Greece,
Romania and Italy. In France, price negotiations are particularly challenging due to budgetary pressures.In Germany, Europe’s largest pharmaceutical market, manufacturers must now prove the added benefit of their drug over existing alternatives if they are to avoid relegation to an unfavourable price reference or face non-pricing barriers to market access.
In China, pricing practices remain a priority for regulators. New national regulations and provincial and hospital tenders continue to put increasing pricing pressures on pharmaceutical companies. In Russia and selected Middle East markets, governments are encouraging local manufacturing by offering more favourable pricing legislation. In Japan, mandated biennial cuts are likely to continue as are experimental decisions by regulators based on cost effectiveness assessments. In Latin America, pricing is increasingly controlled by governments as, for example, in Colombia and Brazil with price referencing regulations.
| | |
 | | For more information about price controls, reductions and US healthcare reform, and price regulation, please see the Business Review, Return to growth from page 48 and Risk from page 214 |
Estimated pharmaceutical sales and market growth – 2020
| | | | | | | | | | | | |
North America 
| | | | EU 
| | | | Other Europe(Non-EU countries) 
| | | | Japan 
|
| | | | | | |
| | | | | | | | | | | | |
Oceania 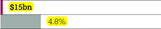
| | | | South East and East Asia 
| | | | Latin America 
| | | | Africa 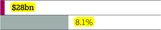
|
| | | | | | |
| | | | | | | | | | | | |
CIS 
| | | | Middle East 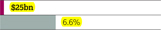
| | | | Indian subcontinent 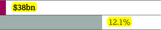
| | | | · Estimated pharmaceutical sales – 2020. Ex-manufacturer prices at CER. Source: IMS Health. · Estimated pharmaceutical market growth – 2015 to 2020. Compound annual growth rate. Source: IMS Health. |
| | |
| 14 | | AstraZenecaAnnual Report and Form 20-F Information 2016 |
Patent expiries and genericisation
Patent protection for pharmaceutical products is finite. Patents are expiring on some of the biggest-selling drugs ever produced and this means that payers, physicians and patients are gaining greater access to generic alternatives (both substitutable and analogue) in many important drug classes. These generic alternatives are primarily lower priced because generic manufacturers are largely spared the costs of R&D and market development. As a result, demand for generics is high. For prescriptions dispensedin the US in 2016, generics constituted 84.7% of the market by volume (2015: 84.0%).
Generic competition can also result from patent disputes or challenges before patent expiry. Increasingly, generics companies are launching products ‘at risk’, for example, before resolution of the relevant patent litigation. This trend, which is likely to continue, creates significant market presence for the generic version while the litigation remains unresolved. Given the unpredictable nature of patent litigation, some companies have settled such challenges on terms acceptable to the innovator and generic manufacturer. While competition authorities generally accept such agreements as a legitimate way to settle these disputes, they have questioned some settlements as being anti-competitive.
Biologics typically retain exclusivity for longer than traditional small molecule pharmaceuticals, with less generic competition. With limited experience to date, the substitution of biosimilars for the original branded product has not followed the same pattern as generic substitution in small molecule products and, as a result, erosion of the original biologic’s branded market share has not been as rapid. This is due to biologics’ complex manufacturing processes and the inherent difficulties in producing a biosimilar, which could require additional clinical trials. However, with regulatory authorities in Europe and the US continuing to implement abbreviated approval pathways for biosimilar versions, innovative biologics are likely to face increased competition. Similar to biologics, some small molecule
pharmaceutical products are in complex formulations and/or require technically challenging manufacturing and thus may not follow the pattern of generic market erosion seen with traditional, tableted pharmaceuticals. For those products, the introduction of generic alternatives (both substitutable and analogue) can be slower.
Building trust
The pharmaceutical industry faces challenges in building and maintaining trust, particularly with governments and regulators. This reflects the past decade’s legal disputes between pharmaceutical companies and governmental and regulatory authorities. To address this challenge, companies are strengthening a culture of ethics and integrity, adopting higher governance standards and improving relationships with employees, shareholders and other stakeholders.
During 2016, there were also pharmaceutical industry investigations and Congressional hearings in the US related to pricing while, in the UK, the Competition and Markets Authority has been investigating allegations of excessive charging and fining companies for unfair prices.
Numerous companies, including those in the pharmaceutical industry, have been investigated by the China Public Security Bureau following allegations of bribery, and criminal and financial penalties have been imposed. Investigations by the DOJ and SEC under the Foreign Corrupt Practices Act are continuing as are investigations by the UK Serious Fraud Office under the UK Bribery Act. Information about material legal proceedings can be found in Note 28 to the Financial Statements from page 185.
Strategic responses
Our industry remains highly competitive. It includes large, research-based pharmaceutical companies (such as AstraZeneca) that discover, develop and sell innovative, patent-protected prescription medicines and vaccines, smaller biotechnology and vaccine
businesses, and companies that produce generic medicines. However, the pharmaceutical market is highly competitive. For example, our Diabetes franchise continues to see pricing pressure. In immuno-oncology, the large number of clinical trials that are being carried out highlight the competitive nature of this area and renders speed to market critical.
While many of our peers face similar challenges, they tackle them in different ways. Some companies have pursued a strategy focused on branded prescription pharmaceuticals. Others have diversified by acquiring or building branded generics businesses or consumer portfolios. A number of companies are focused on improving R&D productivity and operational efficiency. Other companies have looked to geographic expansion, especially in Emerging Markets and Japan.
Across the industry, business development deals (including licensing and collaborations), and competition for business development opportunities, while down over 2015, continued in 2016. For example, one report estimates that the value of mergers and acquisitions announced in the healthcare sector during the year amounted to more than $270 million, compared with almost $400 million in 2015.
As outlined in AstraZeneca at a glance from page 2 and our Business model from page 8, our strategic response to the pharmaceutical marketplace is to be a ‘pure-play’, global, science-led biopharmaceutical company that focuses on the discovery, development and commercialisation of prescription medicines, primarily for the treatment of diseases in three main therapy areas. The strategic priorities that follow on from this response are outlined in the next section.
| | |
| AstraZenecaAnnual Report and Form 20-F Information 2016 | | 15 |

Oncologycontinued
Following the science of oncology
More than eight million lives are lost every year to cancer. Even as R&D continues to push boundaries in how we understand and fight cancer, there is still more to do. At AstraZeneca, we are committed to advancing the science of oncology to deliver life-changing medicines to people most in need.
Our strategic priorities
In Oncology, our vision is to respond to unmet medical need by redefining the cancer treatment paradigm. We are doing this through scientific innovation, accelerated clinical programmes and collaboration. We have a strong heritage – more than 40 years – in developing cancer drugs. By the end of 2016, several submissions were underway and we aim to deliver at least four new cancer therapies, in addition toLynparza and Tagrisso, and 12 new line extensions by 2020. In 2015, we decided to consider all new Oncology launches, includingLynparza, Iressa (US) andTagrisso, as our sixth Growth Platform, under the designation of New Oncology.
Our broad pipeline of next-generation medicines is focused on four main disease areas: breast, ovarian, lung and haematological cancers, using four key scientific approaches: immunotherapy, tumour drivers and resistance mechanisms, DNA damage response, and antibody-drug conjugates.
| | | | |
Oncology – pipeline progressions |
Regional approvals | | | | Tagrisso – lung cancer (EU, JP) and ctDNA blood test (US, JP)* |
Expedited review | | | | Breakthrough Therapy Designation: durvalumab – bladder cancer (US) Orphan Drug Designation: acalabrutinib – blood cancers (EU); selumetinib – thyroid cancer (US) Fast Track Designation:Lynparza – ovarian cancer (2nd line) (US), prostate cancer (2nd line) (US) Priority Review Designation:Tagrisso (CN); durvalumab – bladder cancer (US) |
Regulatory submissions | | | | Faslodex – breast cancer (1st line) (US, EU, JP) Tagrisso – lung cancer (CN) Tagrisso – lung cancer (AURA3 study for full approval) (US, EU) Durvalumab – bladder cancer (US) |
Phase III investment decisions | | | | Savolitinib – papillary renal cell carcinoma Durvalumab+tremelimumab – hepatocellular carcinoma |
| Phase II starts/progressions | | | | In collaboration with Celgene, the combination ofVidaza and durvalumab for the treatment of acute myeloid leukaemia and CC486+durvalumab for myelodysplastic syndromes; MEDI0680+durvalumab for solid tumours; MEDI0562 (humanised OX40) for solid tumours; AZD6738+Lynparza for gastric cancer; AZD1775 (Wee1) for solid tumours; daratumumab+durvalumab for multiple myeloma; in collaboration with Incyte, epacadostat (IDO)+durvalumab for solid tumours |
Strategic transactions completed | | | | Acquisition of majority stake in Acerta Pharma providing access to acalabrutinib |
Setbacks and terminated projects | | | | FDA placed and subsequently lifted a partial clinical hold on the enrolment of new patients with head and neck squamous cell carcinoma (HNSCC) for clinical trials of durvalumab Tremelimumab DETERMINE,Lynparza GOLD, selumetinib SELECT-1 trials failed to meet primary endpoint; voluntarily withdrew the marketing authorisation application submitted to the EMA for cediranib in advanced ovarian cancer The following clinical programmes were discontinued: inebilizumab for diffuse large B-cell lymphoma; MEDI3617 for solid tumours; inebilizumab (MEDI-551) + rituximab for haematological malignancies; AZD5312 for solid tumours; AZD8835 for solid tumours;Tagrisso + durvalumab (CAURAL)>2nd-line advanced EGFRm T790M NSCLC; MEDI6383 for solid tumours; durvalumab+ MEDI6383 for solid tumours; MEDI0639 for solid tumours |
*Roche holds licence for ctDNA blood test; collaborative effort between Roche and AstraZeneca to secure approval. |
Therapy area world market
(MAT/Q3/16)
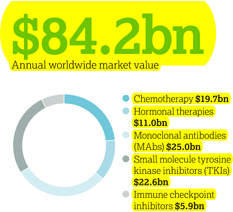
Four key scientific platforms are driving our efforts to discover new cancer treatments:
| > | Immunotherapy: Our ambition is to be a scientific leader in immunotherapy, a promising therapeutic approach that harnesses the patient’s own immune system to help fight cancer. We are working to understand how cancer evades the immune system and to identify approaches that enhance the immune system’s ability to fight cancer. |
| > | Tumour drivers and resistance mechanisms: Potent inhibition of genetic disease drivers is a clinically validated approach to shrink tumours and improve progression-free survival. Tumours, however, eventually develop resistance to these therapies. Our programmes seek to develop therapies that target resistance mechanisms and the mutations that cause cancer cells to proliferate. |
| > | DNA damage response: Exploiting mechanisms that selectively damage tumour cell DNA is another clinically validated approach to shrink tumours and improve progression-free survival. Our programmes focus on identifying and exploiting vulnerabilities unique to tumour cells to kill the tumour cells while minimising toxicity to the patient. |
| > | Antibody-drug conjugates: The use of antibody-drug conjugates (ADC) is a clinically validated, highly potent approach that selectively targets cancer cells. We seek to combine innovative antibody engineering capabilities with cytotoxic drug molecules to attack and kill the tumour while minimising toxicity to the patient. |
| | |
| 26 | | AstraZenecaAnnual Report and Form 20-F Information 2016 |

Our marketed products
| | > | Casodex/Cosudex (bicalutamide) |
| | > | Nolvadex (tamoxifen citrate) |
| | > | Zoladex (goserelin acetate implant) |
| |  | Full product information on page 211 |
We are also focused on identifying and developing combination therapies. Our immuno-oncology portfolio, which we believe is one of the most comprehensive in our industry, enables us to explore and exploit scientific and biological synergies to pursue combinations that improve outcomes and maximise patient benefit.
Our 2016 focus
In total, our marketed Oncology products generated sales of $3.4 billion worldwide in 2016. Sales from our New Oncology Growth Platform, totalled $0.7 billion in 2016, an increase of 458% at actual rate of exchange (450% at CER) over 2015 ($0.1 billion). We continue to explore ways to maximise the benefit of our medicines for patients.
Tagrisso is the first approved epidermal growth factor receptor tyrosine kinase inhibitor (EGFR-TKI) indicated for patients with metastatic EGFR T790M mutation-positive non-small cell lung cancer (NSCLC). This indication was approved in November 2015 under the FDA’s Accelerated Approval Programme based on tumour response rate and duration of response. Full approval for this indication is dependent on verification and description of clinical benefit in the confirmatory trial, AURA3, for which positive results were presented in December. The EMA and FDA accepted the AURA3 submission in October and November respectively, and the FDA has granted it a Priority Review.
In February 2016,Tagrisso was approved by the EMA for the treatment of adult patients with locally advanced or metastatic EGFR T790M mutation-positive NSCLC. In March 2016, it was approved in Japan and, by the end of 2016,Tagrisso had received regulatory approval in more than 40 countries. In September 2016, the FDA approved a blood-based companion diagnostic test for use withTagrisso. This clinically-validated companion diagnostic test uses either tissue or a blood sample to confirm the presence of a T790M mutation in patients. Japan approved the same test in December 2016.
Iressa was the first EGFR-TKI to be approved in advanced NSCLC and, as of 31 December 2016, had been approved in 90 countries.Indicated for the treatment of advanced EGFR mutation NSCLC, it is the leading EGFR-TKI outside the US. Iressareceived approval in the US in July 2015.
Lynparza is an oral poly ADP ribose polymerase (PARP) inhibitor available to patients in 31 countries for the treatment of adult patients with BRCA-mutated high-grade serous epithelial ovarian, fallopian tube or primary peritoneal cancer. In October 2016, AstraZeneca announced positive high level results of SOLO-2, a Phase III randomised, double-blind, placebo-controlled, multicentre study ofLynparza maintenance monotherapy in platinum sensitive relapsed BRCA gene-mutated ovarian cancer patients who are in complete or partial response following platinum-based chemotherapy. Data from SOLO-2 could form the core Phase III component for an FDA NDA submission, a Japan NDA submission and an EU variation to the MAA in 2017.
Faslodex 500mg is approved in more than 80 countries, including the EU, the US and Japan. In March 2016, the FDA approved a new indication expanding the use ofFaslodex, in combination with palbociclib (Pfizer), for the treatment of women with hormone receptor-positive (HR+), human epidermal growth factor receptor 2 negative (HER2-) advanced or metastatic breast cancer whose cancer has progressed after
endocrine therapy. In October 2016, at the European Society of Medical Oncology Congress, we presented positive results of the Phase III FALCON clinical trial comparing the efficacy and safety of Faslodex 500mg withArimidex in the 1st line advanced breast cancer setting (hormone-naïve patients). These positive outcomes will form the basis of a continuous expansion ofFaslodex in metastatic breast cancer.
Details of litigation relating toFaslodex are included in Note 28 to the Financial Statements from page 185.
Zoladex continues to be a significant asset in our on-market portfolio and a driver of our prostate cancer and breast cancer portfolios.
14m
Annual cancer cases are expected to rise from 14 million in 2012 to an estimated 22 million within the next two decades.
Source: WHO Factsheet February 2014 (data from 2012).
| | |
| AstraZenecaAnnual Report and Form 20-F Information 2016 | | 27 |

| | | | |
Following the science of cardiovascular and metabolic disease AstraZeneca is following the science to transform how cardiovascular disease (CVD), chronic kidney disease (CKD) and diabetes are understood, interact and impact one another – ensuring the focus of treatment is across cardiovascular and metabolic disease (CVMD) to slow progression and save more lives. Our strategic priorities Our strategic focus is on transformative medicines that address the high unmet medical need in CVMD, including thrombosis (blood clotting), atherosclerosis (hardening of the arteries), dyslipidaemia (abnormal levels of blood lipids), chronic heart failure (CHF), diabetes and CKD. Currently an estimated 17.5 million people die annually from CVD, representing 31% of all global deaths, and CVD is the leading cause of death in people with CKD and people with diabetes. Despite improvements in the diagnosis and treatment of CVMD, unmet medical need, as well as access and affordability challenges, remain high, while co-morbidity is common in patients living with CVMD. | | We are seeking to unlock the scientific potential of our CVMD therapy area by investigating disease causes and progression, supporting our larger objective of innovating to develop novel therapeutic approaches. Our efforts aim to reduce long-term morbidity and mortality, and to ultimately reduce the burden, as well as the human, social and economic costs, of these diseases. Our commitment is demonstrated in both our clinical development and life-cycle management programmes. More than 60,000 patients are participating in our R&D-led cardiovascular trials at more than 6,000 sites worldwide. Our focus on diabetes research includes almost 50 clinical trials worldwide with an enrolment target of 56,000 patients. Our scientific leadership is strengthened by developing cutting edge technologies with our strategic partners: > Participation in the RPC2 consortium (renal precompetitive consortium) formed with the University of Michigan and Lilly to identify new therapeutic targets for the treatment of CKD. > Alliance with Moderna and Professor Ken Chien at the Integrated Cardio Metabolic Centre (ICMC), Karolinska Institutet in Stockholm, Sweden, to identify targets and pathways involved in repairing damaged cardiac muscle. | | Therapy area world market (MAT/Q3/16) $186.8bn Annual worldwide market value 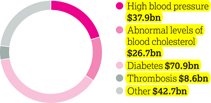
> Collaboration with the Harvard Stem Cell Institute to adapt a technique that creates human beta cells from stem cells in the search for new, transformative treatment options for diabetes. Cardiovascular disease Our 2016 focus Acute coronary syndromes (ACS) is an umbrella term for sudden chest pain and other symptoms due to ischaemia (insufficient blood supply) to the heart. ACS is associated with considerable mortality and morbidity. There is a significant need to improve patient outcomes and reduce treatment costs. Brilinta/Brilique is an oral antiplatelet treatment for ACS. It is approved in over 100 countries, including the US, Canada and Brazil under the trade nameBrilinta, and in the EU, Iceland and Norway under the trade nameBrilique. Since it was first launched in Europe in December 2010, it has been included in 12 major ACS treatment guidelines globally. |
| | | | |
| | | | In February 2016, the European Commission granted marketing authorisation forBrilique for long-term prevention of cardiovascular death, heart attack and stroke for patients with a history of heart attack. The EU approval was based on the results from the PEGASUS TIMI-54 trial, a large-scale outcomes trial involving more than 21,000 patients. |
Cardiovascular & Metabolic Disease – pipeline progressions | |
Regional approvals | | Brilinta/Brilique – post myocardial infarction (EU) and acute coronary syndromes and post myocardial infarction (JP) Qtern (saxagliptin/dapagliflozin) – Type 2 diabetes (EU) | |
| Expedited review | | None | |
| Regulatory submissions | | ZS-9 – hyperkalaemia in response to a CRL (US) | |
| | | DURATION-8 (exenatide+dapagliflozin) (EU) | |
| | | Two further submissions await regulatory acceptance | |
| Phase III investment decisions | | Forxiga– heart failure;Forxiga– chronic kidney disease | |
| Phase II starts/progressions | | MEDI4166 – diabetes/cardiovascular disease; MEDI0382 – diabetes/obesity; AZD4076 – non-alcoholic steatohepatitis | |
| Strategic transactions completed | | Partnering with 3SBio Inc. for commercialisation ofBydureonandByettain China | |
| Setbacks and terminated projects | | BrilintaSOCRATES and EUCLID trials failed to meet primary endpoint; CRL received from FDA for ZS-9 for treatment of hyperkalaemia;Epanova/Farxigacombination discontinued for non-alcoholic steatohepatitis (NASH) | |
| | |
| AstraZenecaAnnual Report and Form 20-F Information 2016 | | 31 |
Respiratorycontinued
Following the science
of respiratory disease
Our 40-year heritage in respiratory medicines is just the beginning of our story. The age of targeted biologics to address the unmet needs of specific patient populations has now arrived in asthma, and AstraZeneca has three biologics in mid- or late-stage development with each one targeting different biologic pathways that play important roles in this heterogeneous disease.
Our strategic priorities
Respiratory is one of AstraZeneca’s main therapy areas, and our medicines reached more than 18 million patients in 2016. We have a strong pipeline with about 22,000 patients involved in clinical trials, and we expect up to four launches of new medicines between 2016 and 2020.
Our work focuses on transforming the treatment of asthma and COPD in three areas: (i) inhaled combinations at the core of care, (ii) biologic medicines for the unmet needs of specific patient populations, and (iii) scientific advancements where our ambition is to achieve disease modification and durable remission. We have considerable capabilities in inhalation technologies, which span both pressurised metered-dose inhalers (pMDIs) and dry powder inhalers (DPIs), as well as our innovative particle Co-Suspension Delivery Technology. In our early development pipeline, we focus our research on three key areas: lung immunity, lung epithelium and lung regeneration.
Asthma is one of the most common and chronic lung diseases worldwide and a serious global health problem, affecting the lungs’ airways. Inflammation and narrowing of the airways may cause wheezing, breathlessness, chest tightness and coughing. Fixed-dose combinations (FDCs) of an inhaled corticosteroid (ICS) with a long-acting beta2-agonist (LABA) such asSymbicort are the cornerstone of treatment, helping to treat moderate-to-severe asthma. For patients with mild asthma, we are investigating the use ofSymbicort dosed ‘as needed’, recognising the variability and inflammatory nature of disease in these patients. For the approximately 10% of asthma patients who have severe, uncontrolled asthma despite standard-of-care medications, we are working to develop targeted biologics that address the underlying causes of disease. The FDA and EMA have accepted regulatory submissions for benralizumab, our first respiratory biologic, which is being developed for severe asthma.
COPD is a progressive and chronic disease. There are unmet needs in the treatment of COPD, such as exacerbation and symptom control, improving health status and slowing the decline of lung function and disease progression. We foresee physicians increasingly treating earlier and more actively with different strategies for inflammatory and non-inflammatory patients, and both our portfolio and development pipeline address these different needs in mild and severe disease.
| | |
Respiratory – pipeline progressions |
Regional approvals | | BevespiAerosphere (PT003) – COPD (US) |
Expedited review | | None |
Regulatory submissions | | Benralizumab – severe asthma (US, EU) One further submission awaits regulatory acceptance |
Phase III investment decisions | | None |
Phase II starts/progressions | | Abediterol (AZD0548) – for asthma/COPD; AZD1419 (inhaled TLR9) – asthma |
Strategic transactions completed | | Acquisition of Takeda’s core respiratory business |
Setbacks and terminated projects | | AZD8999 for COPD; MEDI7836 for asthma; AZD7624 for COPD |
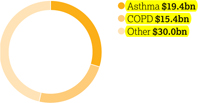
Therapy area world market
(MAT/Q3/16)
$64.8bn
Annual worldwide market value
Our 2016 focus
We continue to invest inSymbicort,which was the number one ICS/LABA combination globally in volume terms in 2016. In the US, the FDA approvedSymbicort Inhalation Aerosol 80/4.5 micrograms for the treatment of asthma in paediatric patients aged six to 12 years. The FDA approval is based on the CHASE (ChildHood Asthma Safety and Efficacy) clinical trial programme, which included the CHASE 3 Phase III trial. In addition, on 25 January 2017, the FDA granted six months of paediatric exclusivity forSymbicort Inhalation Aerosol. Budesonide/formoterol was already approved in the US to treat asthma in patients 12 years and older and for the maintenance treatment of airflow obstruction in COPD in adults.
In the EU, two new indications were approved during 2016 –Symbicort pMDI for the treatment of COPD andSymbicortSMART for adolescents with asthma. Also,Pulmicort continues to be a leading ICS therapy, with significant sales growth in 2016 driven by China and other Emerging Markets.
In April 2016, the FDA approvedBevespi Aerosphere inhalation for the long-term maintenance treatment of airflow obstruction in patients with COPD, including chronic bronchitis and/or emphysema.Bevespi Aerosphere is the first combination long-acting muscarinic antagonist (LAMA) and LABA medicine to be delivered in a pMDI and the first medicine using
| | |
| 36 | | AstraZenecaAnnual Report and Form 20-F Information 2016 |

| | | | |
 | | We are committed to ensuring that pain patients who need to manage the side effect of opioid induced constipation continue to get access toMovantik/ Moventig. In March 2016, AstraZeneca announced an agreement with ProStrakan Group, now Kyowa Kirin International plc, for the rights toMoventig (naloxegol) in the EU, Iceland, Norway, Switzerland and Liechtenstein. In December 2016, we completed a sub-licence to Knight Therapeutics Inc. to commercialiseMovantik/Moventig in Canada and Israel. This follows the 2015 co-commercialisation agreement with Daiichi Sankyo forMovantik in the US. These agreements are in line with delivering on our externalisation strategy to create value by partnering on pipeline assets that are outside our three main therapy areas. Gastrointestinal In 2016, use ofNexium continued to grow in markets including China and Japan.Demand forNexium in China is expected to continue to grow over the next several years, based on broader geographic expansion as well as anticipated label expansions,and has the potential to become a top-selling medicine in its class, as in Japan. Patent protection forNexium remains in Japan. For the rest of the world,Nexium is subject to generic competition. |
Alzheimer’s disease remains one of the largest areas of unmet medical need and continues to generate significant social and scientific interest. AZD3293, our BACE inhibitor in collaboration with Lilly received Fast Track Designation by the FDA in August 2016. | | Neuroscience Current commercialised AstraZeneca neuroscience molecules includeZomig (triptan) andSeroquel (atypical antipsychotics), which have lost exclusivity in all major markets. In November 2016, two licensed generics ofSeroquelXR were launched in the US. In June 2016, AstraZeneca announced an agreement with Aspen Global Incorporated, part of Aspen Group, for the rights to the global anaesthetics portfolio outside the US. The agreement covered seven established medicines –Diprivan (general anaesthesia),EMLA (topical anaesthetic) and five local anaesthetics (Xylocaine/ Xylocard/Xyloproct, Marcaine, Naropin, Carbocaine andCitanest). AZD3293 is our BACE inhibitor which we are progressing in collaboration with Lilly for the potential treatment of Alzheimer’s disease. It experienced several critical milestones throughout 2016, including continuation of the Phase II/III trial AMARANTH into Phase III and the initiation of DAYBREAK-ALZ, a new Phase III trial to evaluate the safety and efficacy of AZD3293 in people with mild Alzheimer’s dementia. The investigational treatment also received Fast Track Designation by the FDA in August 2016. Further underpinning AstraZeneca’s commitment to Alzheimer’s disease, in December 2016, we announced that MEDI1814, an investigational MAb selective for toxic proteins associated with Alzheimer’s disease, will be developed beyond Phase I, also in collaboration with Lilly. | |
| | |
| AstraZenecaAnnual Report and Form 20-F Information 2016 | | 41 |
Strategic Report | Business Review
Business Reviewcontinued
Research use of human biological samples
The use of human biological samples, such as solid tissue, biofluids and their derivatives, plays a vital role in developing a deeper understanding of human diseases and their underlying mechanisms, which helps us develop effective, new and personalised medicines.
When we conduct this important research, we maintain policies and processes to ensure that we comply with the law and meet regulatory concerns. We place an emphasis on informed consent that protects the rights and expectations of donors and families throughout the process of our acquisition, use, storage and disposal of the samples. Protecting the confidentiality of a donor’s identity is of the utmost importance, and a key part of our process includes the coding of biological samples and associated data (including genetic data).
In rare circumstances, we may use human fetal tissue (hFT) or human embryonic stem cells (hESC). In these circumstances, an internal review of the scientific validity of the research proposal will be conducted and permission to use the tissue will be granted only when no other scientifically reasonable alternative is available. We also insist our third party vendors adopt the highest ethical standards and we rigorously assess the ability of tissue suppliers to meet our quality and ethical expectations. We are committed to minimising the use of fetal tissue by exploring technological alternatives.
To date, seven research proposals that include use of cells derived from hFT have been received for consideration, but none of these has progressed so far, either for scientific or other reasons. We continue to review our processes for the supply of hFT but, at the end of 2016, had yet to approve a single source. Currently, four projects using three different hESC lines have been approved.
Animal research
We are committed to helping the public understand our use of animals in research and our methods for reducing, refining, or replacing this use (3R approach).
We share our transparency goals externally through presentations at conferences and workshops throughout the US and EU, and we also highlighted our latest refinement
techniques and approach to implementing the 3Rs in a recent blog for the UK National Council for the 3Rs. Internally we are working to refine our study designs by improving access to a refreshed training programme on the principles of good statistical practice. The objective of this training is to ensure that scientists are better able to appropriately power their studies, account for variability and control bias wherever possible.
Animal research use varies depending on numerous factors, including our amount of pre-clinical research, the complexity of the diseases under investigation and regulatory requirements. We believe that without our active commitment to reducing, refining, or replacing animals in research, our animal use would be much greater. In 2016, we used 193,451 animals in-house (2015: 182,055). In addition, 25,651 animals were used by CROs on our behalf (2015: 33,220).
| | |
| |
| 2. Return to growth | |  |
We seek to return to growth by focusing on our Growth Platforms and leveraging our strong global commercial presence, particularly in Emerging Markets, to ensure the right medicines are available and that patients have access to them.
Overview
| | > | Ongoing scrutiny of pharmaceutical pricing in US and Europe | |
| | > | Despite biennial price cuts, Japan remained an attractive market | |
| | > | Third fastest growing top 10 multinational pharmaceutical company in Emerging Markets | |
| | > | Growth rate in China expected to moderate due to increased price pressure and hospital cost containment | |
| | > | Pricing policy based on principles of value, sustainability, access and flexibility | |
| | > | Sought to make our medicines more affordable for self-pay patients based on ability to pay | |
| | > | Expanded Healthy Heart Africa programme from Kenya to Ethiopia and partnered with The US President’s Emergency Plan for AIDS Relief | |
Our plans for growth
Our Commercial teams, which comprised around 34,100 employees at the end of 2016, are active in more than 100 countries. In most countries, we sell our medicines through wholly-owned local marketing companies. We also sell through distributors and local representative offices and market our products largely to primary care and specialty care physicians.
Even as we continue to be impacted by the loss of exclusivity on some of our leading medicines, such asCrestor,Nexium andSeroquel, we have witnessed increasing revenues from our growth brands and launches. This return to growth is underpinned by our internal Growth Platforms which are our growth levers. As our strategy has progressed, so our Growth Platforms have evolved, as shown in Strategy and key performance indicators from page 16. Respiratory was joined by New Oncology from January 2015 and, from January 2017, New CVMD replaced Diabetes andBrilinta/Brilique. Our two remaining Growth Platforms, Emerging Markets and Japan, reflect the importance of these markets to growing future revenues. Overall, our Growth Platforms grew by 4% at actual exchange rates (5% at CER) in 2016 and now represent 63% of all revenues.
However, the pharmaceutical market is highly competitive. For example, our Diabetes franchise continues to see pricing pressure. In immuno-oncology, the large number of clinical trials that are being carried out highlight the competitive nature of this area and renders speed to market critical.
| | |
 | | More information on our performance around the world in 2016 can be found in the Geographical Review from page 226 |
US
As the eleventh largest prescription-based pharmaceutical company in the US, we have a 3.9% market share of US pharmaceuticals by sales value.
In 2016, sales in the US decreased by 22% to $7,365 million (2015: $9,474 million). Declines in revenue fromNexium,Crestor andSynagis were partially offset by the strong performance of our Growth Platforms, includingFarxiga,Bydureon andBrilinta, the launches ofLynparza and
| | |
| 48 | | AstraZenecaAnnual Report and Form 20-F Information 2016 |
| | | | |

| | Tagrisso, and the impact of completing the acquisition of Actavis’ rights toTudorza and Daliresp in the US. The US healthcare system is complex with multiple payers and intermediaries exerting pressure on patient access to branded medicines through regulatory and voluntary rebates. Regulatory rebates are statutorily mandated chargebacks and discounts paid on government-funded programmes such as Medicaid, Department of Defense (including TRICARE) and Department of Veteran’s Affairs. Voluntary rebates are paid to managed care organisations and pharmacy benefit managers for commercially insured patients, including Medicare Part D patients. In the Medicare Part D programme, in addition to voluntary negotiated rebates, branded pharmaceutical manufacturers are statutorily required to pay 50% of the patient’s out-of-pocket costs during the ‘coverage gap’ portion of their benefit design. As part of the ACA, we also pay a portion of an overall industry Patient Protection and Affordable Care Act Branded Prescription Drug Fee. In 2016, the overall measurable reduction in our profit before tax for the year due to discounts on branded pharmaceuticals and an industry-wide excise fee was $471 million (2015: $786 million; 2014: $714 million). In the US, there is significant pricing pressure driven by payer consolidation, restrictive reimbursement policies and cost control tools, such as exclusionary formularies and price protection clauses. Many formularies employ ‘generic first’ strategies and/or require physicians to obtain prior approval for the use of a branded medicine where a generic alternative exists. These mechanisms can be used by intermediaries to limit the use of branded products and put pressure on manufacturers to reduce net prices.In 2016, 84.7% of prescriptions dispensed in the US were generic, compared with 84.0% in 2015. In addition, patients are seeing changes in the design of their health plan benefits and may experience variation, including increases, in both premiums and out-of-pocket payments for their branded medications. The patient out-of-pocket spend is generally in the form of a co-payment or co-insurance, but there is a growing trend towards high deductible health plans which require patients to pay the full list price until they meet certain |
Healthy Heart Africa (HHA) was launched in Kenya in October 2014 in collaboration with the Ministry of Health in support of its commitment to combat NCDs. HHA aims to reach 10 million hypertensive patients across Sub-Saharan Africa by 2025 and, after two years, it has already: > conducted over two million hypertension screenings in the community and in health facilities > trained over 3,000 healthcare workers, including doctors, nurses, community health volunteers and pharmacists to provide education and awareness, screening and treatment services for hypertension across 31 counties > activated 403 health facilities to provide hypertension services, including the establishment of secure supply chains for low-cost, high-quality antihypertensive medicines. 3,000  Trained over 3,000 healthcare workers as part of Healthy Heart Africa. | | Following the success of HHA in Kenya, we developed a partnership with the Federal Ministry of Health in Ethiopia to integrate HHA programming into the Ethiopian healthcare system in support of the Government National Strategic Action Plan for NCDs. In September, we announced a $10 million, five-year global public-private partnership with The US President’s Emergency Plan for AIDS Relief (PEPFAR) that will expand access to HIV/AIDS and hypertension services by offering them in an integrated manner at existing PEPFAR-supported HIV/AIDS sites, beginning in Kenya. For example, working-age men are a difficult population to engage for HIV care, and HHA’s innovative way of working presents an opportunity for the partnership with PEPFAR to improve HIV care in this hard-to-reach population. | |
| | | |
| | | |
| | |
| AstraZenecaAnnual Report and Form 20-F Information 2016 | | 49 |
Strategic Report | Business Review
Business Reviewcontinued
out-of-pocket thresholds. We understand that our medicines will not benefit patients if they are unable to afford them, and that is why we offer a number of resources and programmes that can help patients afford their medications by reducing their out-of-pocket costs. We focus our formulary access on affordability for patients through rebate payments as well as savings cards for eligible patients when the out-of-pocket costs are not affordable.
Ongoing scrutiny of the US pharmaceutical industry, focused largely on pricing, is placing increased emphasis on the value of medicines. This scrutiny is likely to continue from many stakeholders, including policymakers and legislators. Proposed policy and legislative changes which are being considered, include different approaches to price controls on medicines (including price transparency), potential changes to government regulated programmes (such as Medicare Part B, Medicare Part D, Medicaid or other provisions under the ACA), and changes affecting the commercial importation of medicines into the US.
While widespread adoption of a broad national price-control scheme in the near future is unlikely, we expect the increased focus on pharmaceutical prices and their impact on healthcare costs to continue for the foreseeable future.
| | |
| | For more information on pricing pressure and the ACA, please see Marketplace from page 11 |
Europe
The total European pharmaceutical market was worth $201 billion in 2016. We are the twelfth largest prescription-based pharmaceutical company in Europe (see Market definitions on page 239) with a 2.4% market share of pharmaceutical sales by value.
In 2016, our sales in Europe decreased by 5% at actual rate of exchange (3% at CER) to $5,064 million (2015: $5,323 million). Key drivers of the decline, leaving aside the impact of divestments, such as the anaesthetics portfolio, were continued competition fromSymbicort analogues, ongoing volume erosion ofPulmicort,Seroquel XR andNexium following loss of exclusivity, and pricing and volume pressure forCrestor. The continued macroeconomic
environment, increased government interventions (for example, on price and volume) and parallel trade across markets also affected sales. Despite these conditions, we continue to launch innovative medicines across Europe and saw significant progress within our Growth Platforms, in particular withForxiga,Xigduo,Brilinta,Lynparza andTagrisso.
Established Rest of World (ROW)*
In 2016, sales in Japan increased by 8% at actual rate of exchange (decreased 3% at CER) to $2,184 million (2015: $2,020 million), as a result of the biennial National Health Insurance (NHI) price cuts effective from 1 April 2016. We experienced price cuts of approximately 5% on our 2016 revenue. Despite the NHI price cuts, across our Growth Platforms we saw strong volume growth. Particularly strong performance fromNexium andCrestor, and the Diabetes franchise helped to drive this volume growth, offsetting generic competition. In addition, in May 2016, we launchedTagrisso in Japan which generated $82 million of sales and we expect will continue to be a major driver of growth.We now hold ninth position in the ranking of pharmaceutical companies by sales of medicines in Japan. Despite the biennial government price cuts and increased intervention from the government to rapidly increase the volume share of generic products, Japan remains an attractive market for innovative pharmaceuticals.
Canada has a mixed public/private payer system for medicines that is funded by the provinces, insurers and individual patients. It has also now become common for public payers to negotiate lower non-transparent prices after they have gone through a review by the Canadian Agency for Drugs and Technology in Health, a health technology assessment body. Most private insurers pay full price although there is increasing pressure to achieve lower pricing. Overall, the split for AstraZeneca’s portfolio is 65% funded by private payers and 35% with public plans.
Our sales in Australia and New Zealand declined by 12% at actual rate of exchange (10% at CER) in 2016. This was primarily due to the continued erosion ofCrestor,Atacand andNexium by generic medicines. Sales declined less in 2016 than in 2015 as the pace of generic erosion has been
moderated while the sales growth from new products such asBrilinta and the Diabetes portfolio has started to pick up.Brilinta and the Diabetes portfolio grew by 18% (actual and CER) and 57% (actual and CER) respectively.
| * | Established ROW comprises Australia, Canada, New Zealand and Japan. |
Emerging Markets: expansion and collaboration
Emerging Markets, as defined in Market definitions on page 239, comprise various countries with dynamic, growing economies.As outlined in Marketplace from page 11, these countries represent a major growth opportunity for the pharmaceutical industry due to strong demand and sound economic fundamentals. Emerging Markets are not immune, however, to economic downturn. Market volatility is higher than in Established Markets and various political and economic challenges exist. These include regulatory and government interventions.
With revenues of $5,794 million,AstraZeneca was the fifth largest multinational pharmaceutical company, as measured by prescription sales, and the third fastest-growing top 10 multinational pharmaceutical company in Emerging Markets in 2016.
In China, AstraZeneca is the second largest pharmaceutical company in the hospital sector, as measured by sales. Sales in China in 2016 increased by 4% at actual rate of exchange (10% at CER) to $2,636 million (2015: $2,530 million).We delivered sales growth above the growth rate of the hospital market sector through strategic brands investment, systematic organisational capability improvements and long-term market expansion programmes in core therapy areas.The industry growth rate is expected to be moderated to high single digits, impacted by increased price pressure and hospital cost containment. Nevertheless, the healthcare environment in China remains dynamic. Opportunities are arising from incremental healthcare investment, strong underlying demand and the emergence of innovative medicines.
Growth drivers for Emerging Markets include our new medicines, notablyBrilinta andForxiga, and our Diabetes, Respiratory, Oncology and CV portfolios. To educate
| | |
| 50 | | AstraZenecaAnnual Report and Form 20-F Information 2016 |
Strategic Report | Financial Review
Financial Review
In 2016, continued growth in Emerging Markets and Diabetes, coupled with strong sales of our New Oncology medicines and further progress forBrilinta, resulted in a 4% increase (CER: 5% increase) in our Growth Platform Sales.
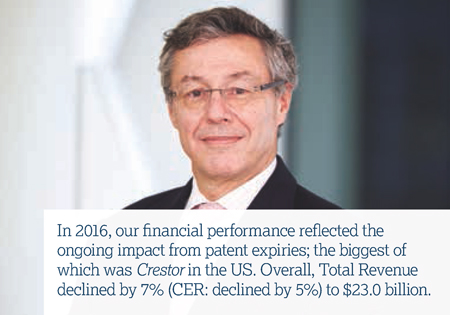
However, the continued effect of patent expiries, in particular the US entry of Crestor generic medicines, resulted in a decline in Total Revenue of 7% (CER: decline of 5%) in the year. Our continued focus on cost discipline delivered a decrease of 2% (CER: increase restricted to 2%) in Reported R&D costs and stable (CER: increase restricted to 5%) Core R&D costs, despite the absorption of Acerta Pharma and ZS Pharma costs. The decline of 15% (CER: decline of 12%) in Reported SG&A costs, which also benefited from fair value adjustments to long-term liabilities, and the decline of 12% (CER: decline of 9%) in Core SG&A costs, reflected the evolving shape of the business and efficiency savings. This, combined with a non-recurring benefit resulting from agreements on transfer pricing between various tax authorities, delivered Reported EPS of $2.77 and Core EPS of $4.31.
Product Sales in Emerging Markets were stable compared to 2015 (CER: grew by 6%) in the year at $5.8 billion, against a background of challenging macro-economic conditions in Latin America. We have reduced our activities in Venezuela and there were also cuts in healthcare spending
in Saudi Arabia. However, China maintained growth of 4% (CER: growth of 10%), ahead of the overall market, and Russia grew at 1% (CER: growth of 13%).
Our Diabetes franchise grew by 9% (CER: grew by 11%) to $2.4 billion and Farxiga became our largest-selling diabetes medicine,consolidating its position as global leader in the SGLT2 class.Brilinta sales increased by 36% (CER: increased by 39%) to $839 million, reflecting updated preferred guidelines from the American College of Cardiology and the American Heart Association. In addition, sales of our New Oncology medicines reached $664 million in the year, withTagrisso andLynparza growing strongly. Respiratory declined by 5% (CER: declined by 3%) in the year, impacted by US pricing pressure onSymbicort. Japan Product Sales increased by 8% (CER: declined by 3%).
Patent expiries continued to impact negatively in our Established Markets and more than offset the performance of the Growth Platforms. US sales fell by 22% to $7.4 billion and reflected the competition from genericCrestor medicines that entered the US market from July and the continued decline ofNexium sales following the loss of US exclusivity in 2015. Sales in Europe were down by 5% (CER: down 3%) and sales in other Established Markets grew by 2% (CER: fell by 4%).
Product Sales were supplemented by $1.7 billion of Externalisation Revenue arising from partnerships including the global agreement with Aspen for the commercial rights to the anaesthetics portfolio and local agreements in China forPlendil and in the US forToprol-XL. The level of sustainable and ongoing income from such partnerships and collaborations has continued to increase during 2016.
Excluding the impact of Externalisation Revenue, the Reported Gross Profit margin was broadly stable in the year, with lower restructuring and amortisation charges offset by the adverse impact from the mix of sales and a write-down ofFluMist inventory in the US. Excluding the lower restructuring and amortisation charges, Core Gross Profit margin declined by one percentage point to 82%.
Reported Other Operating Income was $1.7 billion in the year and included receipts from the divestments of the small molecule antibiotics business to Pfizer andRhinocortAqua to Cilag.
Reported Operating Profit increased by 19% (CER: increased by 9%) to $4.9 billion and Core Operating Profit declined by 3% (CER: declined by 7%) to $6.7 billion. Reported earnings per share increased by 24% (CER: increased by 9%) to $2.77 and Core earnings per share increased by 1% (CER: declined by 5%) to $4.31. Both Reported and Core EPS included a non-recurring benefit of $0.36, following agreements between the Canadian tax authority and the UK and Swedish tax authorities in respect of transfer pricing arrangements for the period from 2004 to 2016.
We generated a net cash inflow from operating activities of $4.1 billion in the year with a continued improvement in working capital investment. We maintain a strong, investment-grade credit rating and, in May, issued a total of $2.5 billion of loans for general corporate purposes. We ended the year with net debt of $10.7 billion.

Marc Dunoyer
Chief Financial Officer
| | |
62 | | AstraZenecaAnnual Report and Form 20-F Information 2016 |
Product Sales of our Respiratory medicines declined by 5% (CER: declined by 3%) reflecting pricing pressure in the US forSymbicort.
Sales ofBrilinta in the year were $839 million, an increase of 36% (CER: increase of 39%).Brilinta sales in the US were up 45% to $348 million,as it remained the branded oral anti-platelet market leader in the US.
Our Diabetes Product Sales were 9% higher than in 2015 (CER: 11% higher), driven primarily by growth of 70% (CER: growth of 72%) onFarxiga with global sales of $835 million as it became our largest-selling Diabetes medicine.
Product Sales in Emerging Markets were flat compared to 2015 (CER: increase of 6%). Product Sales in China increased by 4% in 2016 (CER: increased by 10%) representing 45% of Emerging Markets Product Sales in the year.
Japan Product Sales increased by 8% (CER: declined by 3%).
Product Sales of New Oncology medicines were up to $664 million in 2016 (2015: $119 million), $423 million of which came fromTagrisso (2015: $19 million) which became our leading medicine for the treatment of lung cancer in the year.
Externalisation Revenue
Externalisation Revenue, alongside Product Sales, is included in Total Revenue. Externalisation Revenue includes development, commercialisation and collaboration revenue, such as royalties and milestone receipts. Income is recorded as Externalisation Revenue when we have a significant ongoing interest in the product and/or it is repeatable business and there is no derecognition of an intangible asset. Disposals of assets and businesses, where we do not retain an interest, are recorded in other operating income.
Details of our significant business development transactions which give rise to Externalisation Revenue are given below:
| > | In October 2016, we announced an agreement with Aralez for the rights to the branded and authorised generic (marketed by Par Pharmaceuticals) forToprol-XL (metoprolol succinate) in the US. Aralez paid us $175 million upon completion of the transaction. Aralez will also pay us up to $48 million in milestone and sales-related payments, as well as mid-teen percentage royalties on sales. We will continue to manufacture and supplyToprol-XL and the authorised generic medicine to Aralez. We will retain a significant ongoing interest inToprol-XL in the rest of the world, and significant interest in the US through the ongoing manufacture and supply of the product. |
| > | In June 2016, we entered into a licence agreement with LEO Pharma for the global development and commercialisation of tralokinumab in dermatology indications. We will continue to develop tralokinumab in asthma, and will manufacture and supply tralokinumab to LEO Pharma at a mark-up of 10% on cost. LEO Pharma have been granted an exclusive licence to the global dermatology rights to tralokinumab, which has completed Phase IIb for atopic dermatitis. LEO Pharma paid an upfront payment to us of $115 million for the exclusive licence. LEO Pharma will also pay us up to $1 billion in commercially-related milestones and up to mid-teen tiered percentage royalties on Product Sales. |
| > | In June 2016, we announced that we had entered into a commercialisation agreement with Aspen for rights to its global anaesthetics portfolio outside the US. The agreement covers seven established medicines –Diprivan, EMLA and five local anaesthetics(Xylocaine, Marcaine, Naropin, Carbocaine andCitanest). Under the terms of the agreement, Aspen acquired the commercialisation rights for an upfront consideration of $520 million ($410 million paid on completion and $110 million to be paid in 2017). Additionally, Aspen will pay us up to $250 million on a Product Sales-related payment, as well as double digit percentage trade mark royalties on |
| | Product Sales. For an initial period of 10 years, we will manufacture and supply the products to Aspen at cost plus 20%. Aspen have assumed responsibility for all activities relating to the sale of the portfolio in all relevant markets. |
| > | In February 2016, we entered into a licensing agreement with China Medical System Holdings Ltd (CMS) for the commercialisation rights in China to our calcium channel blocker,Plendil (felodipine).Plendil achieved Product Sales in China of $189 million in 2015. Under the terms of the agreement, CMS paid us $155 million in 2016 for the licence to sellPlendil in China, and committed to pay us a further $155 million in 2017 (recognised as Externalisation Revenue in 2016 after applying a discount factor of 8%). We will manufacture and supply the medicine to CMS and retain the global rights toPlendil outside China. The transaction did not include the transfer of any of our employees or facilities. Over the term of the licence, we will supply finished product to CMS for a supply value equivalent to approximately 40% of the net sales value booked by CMS forPlendil in each given year and will sit on the Joint Steering Committee governing the commercialisation of the product in China. |
| > | In September 2015, we announced that we had entered into a collaboration agreement with Valeant under which we will grant an exclusive licence for Valeant to develop and commercialise brodalumab. Under the agreement, Valeant will hold the exclusive rights to develop and commercialise brodalumab globally, except in Japan and certain other Asian countries where rights are held by Kyowa Hakko Kirin under a prior arrangement with Amgen. Valeant will assume all development costs associated with the regulatory approval for brodalumab. Under the terms of the agreement, Valeant made an upfront payment to us of $100 million and may also pay pre-launch milestones of up to $170 million and further sales related milestone payments of up to $175 million. If approved, we will share profits with Valeant. |
| | |
| AstraZenecaAnnual Report and Form 20-F Information 2016 | | 67 |
| | | | | | | | | | | | | | | | | | | | | | | | | | | | | | | | | | | | | | | | | | | | | | | | | | | | | | | | | | | | | | | | | | | | | | | | |
| | | World | | | | | | US | | | | | | | | | | | | Europe | | | | | | Established ROW | | | | | | Emerging Markets | |
| 2015 | | Sales
$m | | | Actual
% | | | CER
% | | | | | | Sales
$m | | | Actual
% | | | | | | Sales
$m | | | Actual
% | | | CER
% | | | | | | Sales
$m | | | Actual
% | | | CER
% | | | | | | Sales
$m | | | Actual
% | | | CER
% | |
| Oncology: | | | | | | | | | | | | | | | | | | | | | | | | | | | | | | | | | | | | | | | | | | | | | | | | | | | | | | | | | | | | | | | | | | | | | | | | |
| Faslodex | | | 704 | | | | (2 | ) | | | 9 | | | | | | | | 356 | | | | 5 | | | | | | | | 207 | | | | (15 | ) | | | 2 | | | | | | | | 54 | | | | (8 | ) | | | 5 | | | | | | | | 87 | | | | 14 | | | | 49 | |
| Zoladex | | | 816 | | | | (12 | ) | | | 7 | | | | | | | | 28 | | | | 8 | | | | | | | | 171 | | | | (24 | ) | | | (12 | ) | | | | | | | 272 | | | | (16 | ) | | | (2 | ) | | | | | | | 345 | | | | (2 | ) | | | 27 | |
| Iressa | | | 543 | | | | (13 | ) | | | (2 | ) | | | | | | | 6 | | | | n/m | | | | | | | | 128 | | | | (22 | ) | | | (8 | ) | | | | | | | 137 | | | | (23 | ) | | | (10 | ) | | | | | | | 272 | | | | (3 | ) | | | 4 | |
| Tagrisso | | | 19 | | | | n/m | | | | n/m | | | | | | | | 15 | | | | n/m | | | | | | | | 4 | | | | n/m | | | | n/m | | | | | | | | – | | | | – | | | | – | | | | | | | | – | | | | – | | | | – | |
| Casodex | | | 267 | | | | (17 | ) | | | (6 | ) | | | | | | | 1 | | | | (80 | ) | | | | | | | 30 | | | | (29 | ) | | | (14 | ) | | | | | | | 131 | | | | (22 | ) | | | (11 | ) | | | | | | | 105 | | | | 1 | | | | 9 | |
| Arimidex | | | 250 | | | | (16 | ) | | | (5 | ) | | | | | | | 19 | | | | 27 | | | | | | | | 49 | | | | (36 | ) | | | (24 | ) | | | | | | | 79 | | | | (27 | ) | | | (17 | ) | | | | | | | 103 | | | | 4 | | | | 16 | |
| Lynparza | | | 94 | | | | n/m | | | | n/m | | | | | | | | 70 | | | | n/m | | | | | | | | 23 | | | | n/m | | | | n/m | | | | | | | | – | | | | – | | | | – | | | | | | | | 1 | | | | n/m | | | | n/m | |
| Others | | | 132 | | | | (7 | ) | | | 6 | | | | | | | | 19 | | | | (24 | ) | | | | | | | 23 | | | | (30 | ) | | | (18 | ) | | | | | | | 60 | | | | 25 | | | | 44 | | | | | | | | 30 | | | | (17 | ) | | | – | |
| Total Oncology | | | 2,825 | | | | (7 | ) | | | 7 | | | | | | | | 514 | | | | 25 | | | | | | | | 635 | | | | (19 | ) | | | (4 | ) | | | | | | | 733 | | | | (17 | ) | | | (4 | ) | | | | | | | 943 | | | | – | | | | 18 | |
| | | | | | | | | | | | | | | | | | | | | | | | | | | | | | | | | | | | | | | | | | | | | | | | | | | | | | | | | | | | | | | | | | | | | | | | | |
| Cardiovascular & Metabolic Disease: | | | | | | | | | | | | | | | | | | | | | | | | | | | | | | | | | | | | | | | | | | | | | | | | | | | | | | | | | | | | | | | | | | | | | | | | |
| Crestor | | | 5,017 | | | | (9 | ) | | | (3 | ) | | | | | | | 2,844 | | | | (3 | ) | | | | | | | 916 | | | | (24 | ) | | | (9 | ) | | | | | | | 571 | | | | (14 | ) | | | (1 | ) | | | | | | | 686 | | | | (6 | ) | | | 2 | |
| Brilinta | | | 619 | | | | 30 | | | | 44 | | | | | | | | 240 | | | | 64 | | | | | | | | 230 | | | | – | | | | 18 | | | | | | | | 37 | | | | 12 | | | | 33 | | | | | | | | 112 | | | | 70 | | | | 91 | |
| Farxiga | | | 492 | | | | 119 | | | | 137 | | | | | | | | 261 | | | | 114 | | | | | | | | 126 | | | | 91 | | | | 126 | | | | | | | | 32 | | | | 88 | | | | 124 | | | | | | | | 73 | | | | n/m | | | | n/m | |
| Seloken/Toprol-XL | | | 710 | | | | (6 | ) | | | 4 | | | | | | | | 89 | | | | (2 | ) | | | | | | | 97 | | | | (22 | ) | | | (6 | ) | | | | | | | 12 | | | | (37 | ) | | | (26 | ) | | | | | | | 512 | | | | (2 | ) | | | 9 | |
| Onglyza | | | 786 | | | | (4 | ) | | | 2 | | | | | | | | 420 | | | | (13 | ) | | | | | | | 141 | | | | (9 | ) | | | 8 | | | | | | | | 66 | | | | 12 | | | | 27 | | | | | | | | 159 | | | | 27 | | | | 41 | |
| Bydureon | | | 580 | | | | 32 | | | | 35 | | | | | | | | 482 | | | | 29 | | | | | | | | 81 | | | | 42 | | | | 65 | | | | | | | | 8 | | | | 60 | | | | 80 | | | | | | | | 9 | | | | 125 | | | | 150 | |
| Atacand | | | 358 | | | | (29 | ) | | | (15 | ) | | | | | | | 34 | | | | (23 | ) | | | | | | | 105 | | | | (38 | ) | | | (26 | ) | | | | | | | 26 | | | | (40 | ) | | | (30 | ) | | | | | | | 193 | | | | (21 | ) | | | (4 | ) |
| Byetta | | | 316 | | | | (3 | ) | | | 2 | | | | | | | | 209 | | | | 5 | | | | | | | | 62 | | | | (23 | ) | | | (11 | ) | | | | | | | 22 | | | | (19 | ) | | | (7 | ) | | | | | | | 23 | | | | 15 | | | | 30 | |
| Others | | | 611 | | | | (18 | ) | | | (10 | ) | | | | | | | 55 | | | | (28 | ) | | | | | | | 143 | | | | (29 | ) | | | (15 | ) | | | | | | | 60 | | | | (26 | ) | | | (15 | ) | | | | | | | 353 | | | | (9 | ) | | | (3 | ) |
| Total Cardiovascular & Metabolic Disease | | | 9,489 | | | | (3 | ) | | | 4 | | | | | | | | 4,634 | | | | 4 | | | | | | | | 1,901 | | | | (17 | ) | | | (1 | ) | | | | | | | 834 | | | | (12 | ) | | | 1 | | | | | | | | 2,120 | | | | – | | | | 11 | |
| | | | | | | | | | | | | | | | | | | | | | | | | | | | | | | | | | | | | | | | | | | | | | | | | | | | | | | | | | | | | | | | | | | | | | | | | |
| Respiratory: | | | | | | | | | | | | | | | | | | | | | | | | | | | | | | | | | | | | | | | | | | | | | | | | | | | | | | | | | | | | | | | | | | | | | | | | �� |
| Symbicort | | | 3,394 | | | | (11 | ) | | | (3 | ) | | | | | | | 1,520 | | | | 1 | | | | | | | | 1,076 | | | | (26 | ) | | | (14 | ) | | | | | | | 404 | | | | (12 | ) | | | 2 | | | | | | | | 394 | | | | 6 | | | | 22 | |
| Pulmicort | | | 1,014 | | | | 7 | | | | 15 | | | | | | | | 200 | | | | (5 | ) | | | | | | | 117 | | | | (28 | ) | | | (13 | ) | | | | | | | 88 | | | | (9 | ) | | | 4 | | | | | | | | 609 | | | | 28 | | | | 35 | |
| Tudorza/Eklira | | | 190 | | | | n/m | | | | n/m | | | | | | | | 103 | | | | n/m | | | | | | | | 76 | | | | n/m | | | | n/m | | | | | | | | 9 | | | | n/m | | | | n/m | | | | | | | | 2 | | | | n/m | | | | n/m | |
| Daliresp/Daxas | | | 104 | | | | n/m | | | | n/m | | | | | | | | 104 | | | | n/m | | | | | | | | – | | | | – | | | | – | | | | | | | | – | | | | – | | | | – | | | | | | | | – | | | | – | | | | – | |
| Duaklir | | | 27 | | | | n/m | | | | n/m | | | | | | | | – | | | | – | | | | | | | | 26 | | | | n/m | | | | n/m | | | | | | | | 1 | | | | n/m | | | | n/m | | | | | | | | – | | | | – | | | | – | |
| Others | | | 258 | | | | (15 | ) | | | (5 | ) | | | | | | | 18 | | | | (31 | ) | | | | | | | 88 | | | | (20 | ) | | | (6 | ) | | | | | | | 25 | | | | (7 | ) | | | 4 | | | | | | | | 127 | | | | (9 | ) | | | (1 | ) |
| Total Respiratory | | | 4,987 | | | | (2 | ) | | | 7 | | | | | | | | 1,945 | | | | 11 | | | | | | | | 1,383 | | | | (21 | ) | | | (7 | ) | | | | | | | 527 | | | | (9 | ) | | | 5 | | | | | | | | 1,132 | | | | 15 | | | | 25 | |
| | | | | | | | | | | | | | | | | | | | | | | | | | | | | | | | | | | | | | | | | | | | | | | | | | | | | | | | | | | | | | | | | | | | | | | | | |
| Other: | | | | | | | | | | | | | | | | | | | | | | | | | | | | | | | | | | | | | | | | | | | | | | | | | | | | | | | | | | | | | | | | | | | | | | | | |
| Nexium | | | 2,496 | | | | (32 | ) | | | (26 | ) | | | | | | | 902 | | | | (52 | ) | | | | | | | 284 | | | | (23 | ) | | | (7 | ) | | | | | | | 549 | | | | (9 | ) | | | 5 | | | | | | | | 761 | | | | (6 | ) | | | 3 | |
| Seroquel XR | | | 1,025 | | | | (16 | ) | | | (12 | ) | | | | | | | 716 | | | | (3 | ) | | | | | | | 202 | | | | (41 | ) | | | (30 | ) | | | | | | | 25 | | | | (43 | ) | | | (34 | ) | | | | | | | 82 | | | | (18 | ) | | | (1 | ) |
| Synagis | | | 662 | | | | (26 | ) | | | (26 | ) | | | | | | | 285 | | | | (43 | ) | | | | | | | 377 | | | | (6 | ) | | | (6 | ) | | | | | | | – | | | | – | | | | – | | | | | | | | – | | | | – | | | | – | |
| Losec/Prilosec | | | 340 | | | | (19 | ) | | | (10 | ) | | | | | | | 18 | | | | (32 | ) | | | | | | | 97 | | | | (25 | ) | | | (10 | ) | | | | | | | 74 | | | | (30 | ) | | | (19 | ) | | | | | | | 151 | | | | (5 | ) | | | (1 | ) |
| FluMist/Fluenz | | | 288 | | | | (2 | ) | | | – | | | | | | | | 206 | | | | (6 | ) | | | | | | | 76 | | | | 9 | | | | 16 | | | | | | | | 7 | | | | – | | | | 14 | | | | | | | | (1 | ) | | | (100 | ) | | | (100 | ) |
| Movantik/Moventig | | | 29 | | | | n/m | | | | n/m | | | | | | | | 28 | | | | n/m | | | | | | | | 1 | | | | n/m | | | | n/m | | | | | | | | – | | | | – | | | | – | | | | | | | | – | | | | – | | | | – | |
| Others | | | 1,500 | | | | (12 | ) | | | – | | | | | | | | 226 | | | | 50 | | | | | | | | 367 | | | | (28 | ) | | | (15 | ) | | | | | | | 273 | | | | (17 | ) | | | (3 | ) | | | | | | | 634 | | | | (12 | ) | | | 1 | |
| Total Other | | | 6,340 | | | | (23 | ) | | | (16 | ) | | | | | | | 2,381 | | | | (32 | ) | | | | | | | 1,404 | | | | (23 | ) | | | (13 | ) | | | | | | | 928 | | | | (15 | ) | | | (1 | ) | | | | | | | 1,627 | | | | (9 | ) | | | 2 | |
| Total Product Sales | | | 23,641 | | | | (9 | ) | | | (1 | ) | | | | | | | 9,474 | | | | (6 | ) | | | | | | | 5,323 | | | | (20 | ) | | | (6 | ) | | | | | | | 3,022 | | | | (14 | ) | | | – | | | | | | | | 5,822 | | | | – | | | | 12 | |
All commentary in this section relates to Product Sales. The market definitions used in the geographical areas review below are defined in the Glossary on page 239.
2016 in brief
Sales decreased 10% (CER: decreased 8%) in the year to $21,319 million (2015: $23,641 million; 2014: $26,095 million).
In 2016, sales in the US decreased 22% to $7,365 million (2015: $9,474 million; 2014: $10,120 million). The decline in US sales reflected the competition from genericCrestor medicines that entered the US market from July 2016. Unfavourable
managed-care pricing and continued competitive intensity also impacted the sales ofSymbicort.
Sales in Europe decreased 5% (CER: decreased 3%) to $5,064 million in the year (2015: $5,323 million; 2014: $6,638 million). Strong growth in sales ofForxiga, up 48% (CER: up 52%) to $187 million (2015: $126 million; 2014: $66 million), andBrilique, up 12% (CER: up 15%) to $258 million (2015: $230 million; 2014: $231 million), was more than offset by a 15% decrease inSymbicort sales (CER: 12% decrease) to $909 million (2015: $1,076 million; 2014: $1,462 million).However,Symbicort maintained its position
as the number one ICS/LABA medicine by volume, despite competition from analogue medicines.Lynparza andTagrisso sales increased to $81 million (2015: $23 million; 2014: $nil) and $76 million (2015: $4 million; 2014: $nil) respectively.
Sales in the Established Rest of World (ROW) in 2016 increased 2% (CER: decreased 4%) to $3,096 million (2015: $3,022 million; 2014: $3,510 million). Sales ofForxiga in Established ROW increased 81% (CER: increased 72%), to $58 million (2015: $32 million; 2014: $17 million).Nexium sales decreased 2% (CER: decreased 10%) to

| | |
| AstraZenecaAnnual Report and Form 20-F Information 2016 | | 227 |
Additional Information
Geographical Reviewcontinued
$537 million (2015: $549 million; 2014: $606 million). Japan sales increased 8% (CER: decreased 3%) to $2,184 million (2015: $2,020 million; 2014: $2,227 million), reflecting the biennial price reduction effective from April 2016 of around 6% after eliminating the exchange rate impact. The CER percentage decline in Japan was partly mitigated by stable sales ofCrestor of $521 million (2015: $468 million; 2014: $502 million) in the year. Since the launch ofTagrisso in Japan in March 2016, sales amounted to $82 million (2015 & 2014: $nil).
Sales growth for the year in Emerging Markets remained stable (CER: increased 6%) at $5,794 million (2015: $5,822 million; 2014: $5,827 million). Sales growth was impacted by challenging macro-economic conditions in Latin America, such as the current economic situation in Venezuela, where ex-Brazil sales decreased 20% (CER: decreased 7%) to $516 million (2015: $643 million; 2014: $730 million). The effects of significant reductions in Saudi Arabian governmental healthcare spending, as well as the reduction of AstraZeneca’s activities in Venezuela, also adversely impacted sales. China sales increased 4% (CER: increased 10%) to $2,636 million (2015: $2,530 million; 2014: $2,242 million), and represent 45% of the Group’s Emerging Markets sales. Sales in Brazil decreased 9% (CER: increased 2%) to $348 million (2015: $381 million; 2014: $451 million). The increase after eliminating exchange rate impacts reflects the strong performances ofForxiga, which increased 40% (CER: increased 50%) to $28 million (2015: $20 million; 2014: $5 million), Oncology medicines, which decreased 8% (CER: increased 1%) to $82 million (2015: $89 million; 2014: $99 million), andSeloken, which decreased 6% (CER: increased 6%) to $63 million (2015: $67 million; 2014: $84 million). Russia sales increased 1% (CER: increased 13%) to $233 million (2015: $231 million; 2014: $312 million), led by strong performances in Cardiovascular & Metabolic Disease medicine sales, which increased 23% (CER: increased 38%) to $80 million (2015: $65 million; 2014: $89 million).
2015 in brief
Product Sales decreased 9% (CER: decreased 1%) in the year to $23,641 million (2014: $26,095 million; 2013: $25,711 million).
In 2015, sales in the US decreased 6% to $9,474 million (2014: $10,120 million; 2013: $9,691 million). Declines in revenue fromNexium,Crestor andSynagis were partially offset by strong performance of our Growth Platforms, includingFarxiga, Bydureon and
Brilinta, the launches ofLynparza andTagrisso as well as the impact of completing the acquisition of Actavis’s rights toTudorza andDaliresp in the US.
Sales in Europe decreased 20% (CER: decreased 6%) to $5,323 million in the year (2014: $6,638 million; 2013: $6,658 million). Strong growth from the Diabetes portfolio was more than offset by pricing pressure and continued generic competition facingCrestor, Nexium andSeroquel XR. A 26% decrease (CER: decrease of 14%) inSymbicort sales to $1,076 million (2014: $1,462 million; 2013: $1,502 million) reflected adverse pricing movements driven by competition from analogues in key markets. Also,Lynparzawas launched in Europe in 2015.
Sales in the Established ROW decreased 14% (CER: stable) to $3,022 million (2014: $3,510 million; 2013: $3,973 million). Japan sales decreased 9% (CER: increased 4%) to $2,020 million (2014: $2,227 million; 2013: $2,485 million). After eliminating the exchange rate impact, sales were driven by strong growth ofCrestor andNexium, though there was a decline in the sales ofSymbicort. Canada sales decreased 10% (CER: increased 4%) to $533 million (2014: $590 million; 2013: $637 million) in the year, driven by increased sales ofOnglyza andSymbicort after exchange rate effects.
Emerging Markets sales in the year remained stable (CER: increased 12%) at $5,822 million (2014: $5,827 million; 2013: $5,389 million), with contributions to CER growth emanating from across the region. Around 60% of Emerging Markets sales were derived outside of China in the year. China sales in the year increased 13% (CER: increased 15%) to $2,530 million (2014: $2,242 million; 2013: $1,840 million), while Brazil sales decreased 16% (CER: increased 16%) to $381 million (2014: $451 million; 2013: $447 million) and Russia sales decreased 26% (CER: increased 21%) to $231 million (2014: $312 million; 2013: $310 million).
Sales by region
US
Sales in the US decreased 22% to $7,365 million (2015: $9,474 million; 2014: $10,120 million).
Oncology
Oncology sales in the US increased 74% to $893 million (2015: $514 million; 2014: $411 million). An increase inTagrisso andLynparza sales, which were launched in 2015, contributed to this.
Faslodex sales increased 23% to $438 million (2015: $356 million; 2014: $340 million), mainly driven by an expanded label in March 2016, in combination with palbociclib, for 2nd line advanced or metastatic breast cancer.
Sales ofTagrisso were $254 million (2015: $15 million; 2014: $nil). On 29 September 2016, a third party, blood-based companion-diagnostic test forTagrissowas approved in the US. The test is designed to confirm the presence of a T790M mutation in patients.
Lynparza sales increased 81% to $127 million (2015: $70 million; 2014: $nil), reflecting high market-penetration rates.
Zoladex sales increased 25% to $35 million (2015: $28 million; 2014: $26 million).
Cardiovascular & Metabolic Disease
Cardiovascular & Metabolic Disease sales in the US decreased 31% to $3,202 million (2015: $4,634 million; 2014: $4,451 million), primarily due to the decline inCrestor sales.
Crestor sales decreased 57% to $1,223 million (2015: $2,844 million; 2014: $2,918 million), reflecting the market entry ofCrestor generic medicines.
Brilinta sales increased 45% to $348 million (2015: $240 million; 2014: $146 million), reflecting updated preferred guidelines regarding acute coronary syndrome treatment from the American College of Cardiology and the American Heart Association;Brilinta remained the branded oral anti-platelet market leader in the US.
Sales ofFarxiga in the US increased 75% to $457 million (2015: $261 million; 2014: $122 million), primarily reflecting overall market growth and a higher net price. A stronger emphasis on promotional activity and improved levels of patient access resulted in market-share growth.
Onglyza sales decreased 10% to $376 million (2015: $420 million; 2014: $481 million), as the Company prioritised sales and marketing resources towardsFarxiga.Continued competitive pressures in the DPP-4 class led to lower market share but were partially offset by reduced levels of utilisation of patient-access programmes.
Combined sales forBydureon/Byetta were $627 million (2015: $691 million; 2014: $573 million).Bydureon sales decreased 4% to $463 million (2015: $482 million; 2014: $374 million), representing 74% of totalBydureon/ Byetta US sales. Approximately 75% of sales came from the new dual-chamber pen
| | |
| 228 | | AstraZenecaAnnual Report and Form 20-F Information 2016 |
compared to the prior tray presentation. The decrease inByetta sales of 22% to $164 million (2015: $209 million; 2014: $199 million) was attributed to the Company’s promotional focus onBydureon. The decline in bothBydureon andByetta US sales reflected lower net pricing.
Respiratory
Respiratory sales in the US decreased 16% to $1,638 million (2015: $1,945 million; 2014: $1,748 million). Declines inSymbicort andTudorza sales were offset by growth inDaliresp sales.
Symbicort sales decreased 18% to $1,242 million (2015: $1,520 million; 2014: $1,511 million). This primarily reflected the impact of the effects of pricing pressure from managed-care access within the ICS/LABA class. Competition also remained intense from other classes.
Sales ofTudorza decreased 25% to $77 million (2015: $103 million; 2014: $nil), reflecting adverse market demand, limited Medicare Part D access and the focus on the launch ofBevespi.
Daliresp sales increased 29% to $134 million (2015: $104 million; 2014: $nil) driven primarily by favourable market penetration. US sales represented 87% of global sales.
Other
Other sales in the US decreased 31% to $1,632 million (2015: $2,381 million; 2014: $3,510 million).
Nexium sales decreased 39% to $554 million (2015: $902 million; 2014: $1,876 million), reflecting lower demand and inventory de-stocking, which followed the loss of exclusivity in 2015.
Sales ofSeroquel XR decreased 28% to $515 million (2015: $716 million; 2014: $738 million) as since 1 November 2016, two companies have launched licensed generic medicines in the US.
Synagis sales increased 14% to $325 million (2015: $285 million; 2014: $499 million), due to greater market demand.
Sales ofFluMist decreased 84% to $33 million (2015: $206 million; 2014: $218 million). The Company confirmed on 23 June 2016 that the Advisory Committee on Immunization Practices (ACIP) of the US Centers for Disease Control and Prevention had provided its interim recommendation not to useFluMist Quadrivalent Live Attenuated Influenza Vaccine (FluMist Quadrivalent) in the US for the 2016 to 2017 influenza season.
Europe
Sales in Europe decreased 5% (CER: decreased 3%) to $5,064 million in the year (2015: $5,323 million; 2014: $6,638 million).
Oncology
Total Oncology sales in Europe increased 16% (CER: increased 18%) to $733 million (2015: $635 million; 2014: $788 million), driven by new product launches.
Sales ofFaslodex increased 10% (CER: increased 11%) to $228 million (2015: $207 million; 2014: $245 million) due to early line use with palbociclib.Tagrisso sales in Europe were $76 million (2015: $4 million; 2014: $nil), following regulatory approval in the EU during the year.
Sales ofZoladex decreased 8% (CER: decreased 4%) to $156 million (2015: $171 million; 2014: $226 million), andIressa sales decreased 7% (CER: decreased 5%) to $120 million (2015: $128 million; 2014: $166 million).
However,Lynparza sales increased to $81 million (2015: $23 million; 2014: $nil), following several successful launches.
Cardiovascular & Metabolic Disease
Cardiovascular & Metabolic Disease sales in Europe were $1,894 million (2015: $1,901 million; 2014: $2,283 million), consistent with prior year at actual rate of exchange but a 1% increase at CER. The decrease inCrestor sales was partly offset by an increase inBrilique andForxiga sales.
Crestor sales decreased 5% (CER: decreased 4%) to $866 million (2015: $916 million; 2014: $1,200 million), reflecting the increasing use of generic medicines.
Sales ofBrilique in Europe increased 12% (CER: increased 15%) to $258 million (2015: $230 million; 2014: $231 million), reflecting indication leadership across a number of markets. In the year, the German Institute for Quality and Efficiency in Healthcare (IQWiG) gave its assessment of the additional benefit fromBrilique at the 60mg dose as tested in the PEGASUS trial, as did the National Institute for Health and Clinical Excellence in England, UK.
Forxiga sales increased 48% (CER: increased 52%) to $187 million (2015: $126 million; 2014: $66 million),as the medicine continued to lead the growing class.
Onglyza sales decreased 6% (CER: decreased 5%) to $132 million (2015: $141 million; 2014: $155 million), reflecting the Company’s focus onForxiga.
Sales ofBydureon/Byetta increased 1% (CER: increased 3%) to $145 million (2015: $143 million; 2014: $138 million), reflecting the Company’s ongoing effort to expand its Diabetes presence.
Respiratory
Respiratory sales in Europe amounted to $1,284 million in 2016 (2015: $1,383 million; 2014: $1,747 million), a decrease of 7% (CER: decrease of 4%). The reduction was driven by reducedSymbicort sales, offset by newDaxas sales.
Symbicort sales decreased 15% (CER: decreased 12%) to $909 million (2015: $1,076 million; 2014: $1,462 million), primarily a result of competition from branded and analogue medicines. European rights toDaxas were added in May 2016; sales amounted to $15 million (2015 and 2014: $nil).
Other
Total Other sales in Europe amounted to $1,153 million (2015: $1,404 million; 2014: $1,820 million), a decrease of 18% (CER: decrease of 15%).
Sales ofNexium decreased 12% (CER: decreased 11%) to $251 million (2015: $284 million; 2014: $368 million) andSeroquel XR sales decreased 33% (CER: decreased 32%) to $134 million (2015: $202 million; 2014: $343 million);declines reflect the impact of generic competition.
Established Rest of World
Sales in the Established ROW increased 2% (CER: decreased 4%) to $3,096 million (2015: $3,022 million; 2014: $3,510 million).
Oncology
Oncology sales in Established ROW increased 11% (CER: increased 2%) to $814 million (2015: $733 million; 2014: $883 million). The negative impact of generic competition on our non-promoted legacy Oncology product was offset by new sales ofTagrisso.
On 27 December 2016, a third party, blood-based companion-diagnostic test forTagrisso was approved in Japan. The test is designed to confirm the presence of a T790M mutation in patients. Sales ofTagrisso in Japan were $82 million (2015 and 2014: $nil).
Sales ofFaslodex increased 26% (CER: increased 15%) to $68 million (2015: $54 million; 2014: $59 million). This was due to an increase in demand in Japan, where sales increased 24% (CER: increased 12%) to $63 million (2015: $51 million; 2014: $56 million).
| | |
| AstraZenecaAnnual Report and Form 20-F Information 2016 | | 229 |
Additional Information
Geographical Reviewcontinued
Cardiovascular & Metabolic Disease
Cardiovascular & Metabolic Disease sales in Established ROW increased 6% (CER: decreased 1%) to $881 million (2015: $834 million; 2014: $951 million). This primarily consists ofCrestor sales of $591 million (2015: $571 million; 2014: $667 million),Onglyza sales of $70 million (2015: $66 million; 2014: $59 million), andForxiga sales of $58 million (2015: $32 million; 2014: $17 million).
Crestor consolidated its position as the leading statin in Japan, with sales growth of 11% (CER: stable) to $521 million (2015: $468 million; 2014: $502 million), driven by an increase in volume.
Respiratory
Respiratory sales in Established ROW increased 12% (CER: increased 8%) to $588 million (2015: $527 million; 2014: $582 million).Symbicort sales increased 8% (CER: increased 5%) to $436 million (2015: $404 million; 2014: $458 million).
Other
Total Other sales in Established ROW decreased 13% (CER: decreased 17%) to $813 million (2015: $928 million; 2014: $1,094 million).
Notably, Japan sales ofNexium increased 8% (CER: decreased 4%) to $436 million (2015: $405 million; 2014: $358 million). After eliminating the exchange rate impact, the decrease in sales reflects the mandated biennial price reduction, effective from April 2016.
Emerging Markets
Sales in Emerging Markets remained stable (CER: increased 6%) at $5,794 million (2015: $5,822 million; 2014: $5,827 million).
Oncology
Oncology sales in Emerging Markets remained stable (CER: increased 6%) at $943 million (2015: $943 million; 2014: $945 million).
Sales ofFaslodex increased 10% (CER: increased 25%) to $96 million (2015: $87 million; 2014: $76 million), which was supported by China sales of $20 million (2015: $11 million; 2014: $7 million).
Sales ofIressa decreased 14% (CER: decreased 10%) to $233 million (2015: $272 million; 2014: $280 million). China sales ofIressa decreased 21% (CER: decreased 16%) to $116 million (2015: $146 million; 2014: $142 million), as a result of the price
reset following national reimbursement listing obtained in June 2016. Strong competition from branded medicines in Korea also contributed to the decline.
Regulatory approvals forTagrisso were granted in a number of markets, including Brazil, Hong Kong, Singapore, Taiwan and the United Arab Emirates.
Cardiovascular & Metabolic Disease
Cardiovascular & Metabolic Disease sales in Emerging Markets increased 1% (CER: increased 8%), to $2,139 million (2015: $2,120 million; 2014: $2,117 million).
Crestor sales in Emerging Markets increased 5% (CER: increased 12%) to $721 million (2015: $686 million; 2014: $727 million), reflecting growth in China of 21% (CER: growth of 27%) and growth in Russia of 16% (CER: growth of 28%).
Sales ofBrilique increased 69% (CER: increased 80%) to $189 million (2015: $112 million; 2014: $66 million), with China sales more than doubling. China represented 47% of Emerging Markets sales of the medicine at $89 million (2015: $38 million; 2014: $15 million), despite the medicine not being included on the National Reimbursement Drug List. Growth was underpinned by a combination of strong levels of hospital-listing expansion and increased use in existing hospitals.
Sales ofForxiga increased 82% (CER: increase 96%) to $133 million (2015: $73 million; 2014: $20 million), driven by ongoing launches and improved access. In particular, strong performances were seen in the Asia Pacific region, which increased 100% (CER: increased 108%) to $52 million (2015: $26 million; 2014: $5 million), Brazil, which increased 40% (CER: increased 50%), and the Middle East, Africa and Others region increased to $32 million (2015: $15 million; 2014: $2 million).
Sales ofByetta remained stable (CER: increased 13%) to $24 million (2015: $23 million; 2014: $20 million), and sales ofBydureon decreased 50% (CER: decreased 25%) to $4 million (2015: $9 million; 2014: $4 million). On 10 October 2016, AstraZeneca entered into a strategic collaboration with 3SBio Inc. (3SBio) for the rights to commercialiseBydureon and Byetta in the Chinese market. The agreement allowed the Company to benefit from 3SBio’s established local expertise in injectable medicines and focus on oral Type 2 diabetes medicines.
On 29 February 2016, the Company sold the commercialisation rights forPlendil in China; sales in Emerging Markets forPlendil amounted to $119 million (2015: $213 million; 2014: $221 million).
Respiratory
Respiratory sales in Emerging Markets increased 10% (CER: increased 17%) to $1,243 million (2015: $1,132 million; 2014: $986 million).
Sales ofSymbicort increased 2% (CER: increased 10%) to $402 million (2015: $394 million; 2014: $370 million). Sales in China increased 26% (CER: increased 32%) to $156 million (2015: $124 million; 2014: $91 million), which was offset by a 12% decrease (CER: increase of 12%) in Latin America (ex-Brazil), where sales were $37 million (2015: $42 million; 2014: $57 million).
Strong underlying volume growth ofPulmicort in Emerging Markets drove a 15% sales increase (CER: 21% sales increase) to $698 million (2015: $609 million; 2014: $476 million). China sales increased 18% (CER: increased 24%) to $570 million (2015: $485 million; 2014: $348 million), and represented 54% of sales ofPulmicort. Volume demand in China partly reflected the long-term increase of acute COPD and paediatric asthma. AstraZeneca continued its expansion of treatment centres and provided increased access to home-based patient-care systems.
Other
Other sales in Emerging Markets decreased 9% (CER: decreased 4%) to $1,469 million (2015: $1,627 million; 2014: $1,779 million), reflecting declines inNexium sales, which decreased 9% (CER: decreased 3%) to $690 million (2015: $761 million; 2014: $805 million), andSeroquel XR sales, which decreased 17% (CER: decreased 7%) to $69 million (2015: $82 million; 2014: $99 million).
Sales of other products within this therapy area decreased 9% (CER: decreased 4%) to $580 million (2015: $634 million; 2014: $717 million). This includes the anaesthetics portfolio sales of $258 million (2015: $261 million; 2014: $305 million), which was disposed of on 1 September 2016, andMerrem sales of $181 million (2015: $199 million; 2014: $211 million), which was disposed of along with other products on 23 December 2016.
| | |
| 230 | | AstraZenecaAnnual Report and Form 20-F Information 2016 |