Exhibit 15.1

What science can do
AstraZeneca Annual Report and Form 20-F Information 2016

Learn about our main therapy areas:
|

Oncology Our ambition is to eliminate cancer as a
cause of death through scientific discovery
and collaborations  See page 25 See page 25
|
|

Cardiovascular & Metabolic Disease We address multiple risk factors to reduce
cardiovascular morbidity, mortality and
organ damage.  See page 30 See page 30
|
|

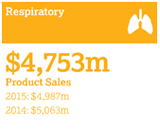
Respiratory We aim to transform the treatment of
respiratory disease with our growing
portfolio of medicines.  See page 35 See page 35
|
Front cover
Treatment for hyperkalaemia
Current treatments for hyperkalaemia, a potentially
life-threatening condition associated with chronic kidney
disease and chronic heart failure, are poorly tolerated by
patients. AstraZeneca is developing a treatment which traps
potassium in the gut and removes it from the body.
Financial highlights
| | |
| | |
| |
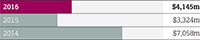
| Total Revenue* | | Net cash flow from operating activities |
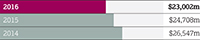
down 7% to $23,002 million at actual rate
of exchange (down 5% at CER) | | up 25% at actual rate of exchange
to $4,145 million |
| |
| |  |
| |
| $23bn | | $4.1bn |
| | |
| | |
| | |
| |
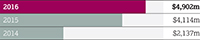
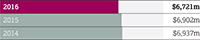
| Reported operating profit | | Core operating profit |
up 19% at actual rate of exchange
to $4,902 million (up 9% at CER) | | down 3% at actual rate of exchange
to $6,721 million (down 7% at CER) |
| |
 | |  |
| |
| $4.9bn | | $6.7bn |
| | |
| | |
| |
| Reported EPS | | Core EPS |
for the full year up 24% at actual rate of
exchange to $2.77 (up 9% at CER) | | for the full year up 1% at actual rate of
exchange to $4.31 (down 5% at CER) |
| |
 | |  |
| |
| $2.77 | | $4.31 |
 Financial Review from page 62
| * | As detailed on page 142, Total Revenue consists |
| | of Product Sales and Externalisation Revenue. |
| | | | | | |
 | | For more information within this Annual Report | |  | | For more information see www.astrazeneca.com |
This Annual Report is also available on our website,
www.astrazeneca.com/annualreport2016
| | |
| AstraZenecaAnnual Report and Form 20-F Information 2016 | | 1 |
Strategic Report
AstraZeneca at a glance
A global biopharmaceutical business delivering medicines to patients through innovative science and excellence in development and commercialisation.
Our strategic priorities reflect how we are working to achieve our Purpose of pushing the boundaries of science to deliver life-changing medicines:
| | | | | | | | | | |
 | | 1 Achieve scientific leadership | |  | | 2 Return to growth | |  | | 3 Be a great place to work |
| | | | | | |
A science-led, innovation strategy Distinctive R&D capabilities: small molecule and biologic medicine, including immunotherapies and protein engineering, as well as devices, biomarkers and translational science | | 12 new molecular entities (NMEs) in Phase III/pivotal Phase II or under regulatory review | | 12 | | |
| |  | | |
 Strategy and key performance indicators from page 16
Broad R&D platform in three main therapy areas

Portfolio of specialty and primary care products
| | | | | | | | | | | | |
 | | | |  | | | |  | | | |  |
|
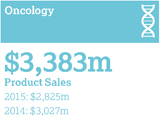
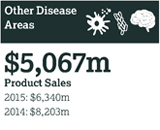
> Oncology sales represented 16% of Total Product Sales >Lynparza (sales of $218 million) available in 31 countries by end 2016 >Iressasales of $513 million, down 6% (5% at CER), as we prioritised Tagrisso | | | | > CVMD sales represented 38% of Total Product Sales > Sales ofOnglyza in US declined 10% to $376 million, as we prioritisedFarxiga > In the US,Crestor sales declined 57% to $1,223 million, reflecting entry of genericCrestor | | | | > Respiratory sales represented 22% of Total Product Sales >Pulmicort sales of $1,061 million, up 5% (8% at CER) >Bevespi Aerosphere inhalation aerosol launched in the US in January 2017 | | | | > Other sales represented 24% of Total Product Sales >Nexium sales of $2,032 million, down 19% (18% at CER) andSeroquel XR sales of $735 million, down 28% (27% at CER) following loss of exclusivity |
 Therapy Area Review from page 23 and Achieve Scientific Leadership from page 45
| | |
| 2 | | AstraZenecaAnnual Report and Form 20-F Information 2016 |
Global commercial presence, with strength in Emerging Markets
| | | | | | | | | | | | |
US | | | | Europe | | | | Established Rest of World | | | | Emerging Markets |
| | | | | | |
| | | | | | | | | | | | |
$7,365m Product Sales 2015: $9,474m 2014: $10,120m | | | | $5,064m Product Sales 2015: $5,323m 2014: $6,638m | | | | $3,096m Product Sales 2015: $3,022m 2014: $3,510m | | | | $5,794m Product Sales 2015: $5,822m 2014: $5,827m |
Commercial Highlights: Growth Platforms grew by 4% (5% at CER) in 2016
| | |
> Emerging Markets: Stable (growth of 6% at CER), supported by China, up 4% (10% at CER) to $2,636 million > Diabetes: Growth of 9% (11% at CER), asFarxiga/Forxiga became our largest-selling Diabetes medicine > Japan: Sales up 8% (decline of 3% at CER), reflecting exchange rate impact and a biennial price reduction | | >Brilinta/Brilique sales grew by 36% (39% at CER) > Respiratory: A decline of 5% (3% at CER), reflecting US pricing pressure forSymbicort > New Oncology: Strong sales with Tagrisso delivering sales of $423 million in its first full year |
Return to growth from page 48
Our talented employees are committed to achieving our Purpose in a sustainable way and our Values foster a strong AstraZeneca culture

| | | | | | | | | | | | | | | | | | |
Our capital-allocation priorities
strike a balance between the
interests of the business, our
financial creditors and
shareholders, and support
our progressive dividend policy | | Distributions to shareholders $m | | | | | | | | | |
| | | |
| | | | | | | 2016 | | | 2015 | | | 2014 | |
| | | |
| | Dividends | | | | | | | 3,561 | | | | 3,486 | | | | 3,521 | |
| | | |
| | Proceeds from issue of shares | | | | | | | (47) | | | | (43) | | | | (279) | |
| | | |
| | Total | | | | | | | 3,514 | | | | 3,443 | | | | 3,242 | |
| | | |
| | Dividend per Ordinary Share $ | | | | | | | | | |
| | | |
| | | | | | | 2016 | | | 2015 | | | 2014 | |
| | | |
| | Dividend per Ordinary Share | | | | | | | 2.80 | | | | 2.80 | | | | 2.80 | |
| | | |
| | Dividend per Ordinary Share for 2016 | | | | | | | | | |
| | | |
| | | | $ | | | Pence | | | SEK | | | Payment date | |
| | | |
| | First interim dividend | | | 0.90 | | | | 68.7 | | | | 7.81 | | | | 12 September 2016 | |
| | | |
| Financial Review from page 62 | | Second interim dividend | | | 1.90 | | | | 150.2 | | | | 16.57 | | | | 20 March 2017 | |
| | | |
| | Total | | | 2.80 | | | | 218.9 | | | | 24.38 | | | | | |
| | | |

| | |
| AstraZenecaAnnual Report and Form 20-F Information 2016 | | 3 |
Strategic Report
Chief Executive Officer’s Review
| | | | |
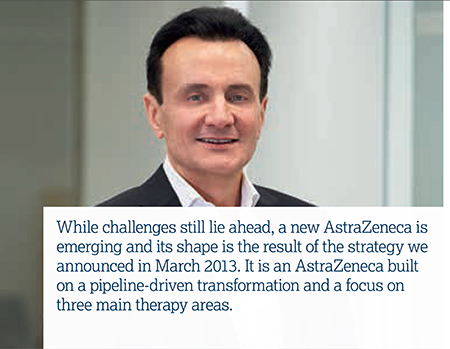 | |  2017 should be 2017 should be
a turning point in our journey as we bring new medicines to patients across the globe.” year with $423 million in Product Sales in its first full year. In diabetes,Farxiga/Forxiga is a global leader in the SGLT2 class of diabetes treatments with a 35% volume share. Product Sales ofBrilinta/Briliquereached $839 million and in many countries it is the leading medicine for patients discharged with acute coronary syndrome. While AstraZeneca benefits from realising the potential of the new medicines emerging from our pipeline, we never forget that the main beneficiaries of our life-changing medicines are patients. For instance, since its launch at the end of 2014, we have treated nearly 5,000 cancer patients withLynparza and launched it in 31 countries with seven ongoing reviews. Investing for the future As we look ahead to 2017 and beyond, continued investment in our pipeline keeps us on track to return to sustainable growth in line with our targets. Examples of how we are investing for the future for the benefit of patients appear throughout this Annual Report. However, none is more significant than our investment in Cambridge, UK, as illustrated on page 7. Cambridge, along with Gaithersburg, MD, US and Gothenburg in Sweden, is one of our three strategic R&D centres and it also became our global corporate headquarters in May 2016. Our activities there demonstrate our focus on science, collaborative way of working and commitment to sustainability. Achieve scientific leadership The panel to the right provides an overview of how we performed against each of our three strategic priorities in 2016. At the heart of our plans to achieve scientific leadership is our focus on three therapy areas. |
| | A transitional phase The first phase in our journey ended in 2015 and was focused on rebuilding our pipeline. 2016 was a crucial year in the second stage of our journey, as we manage a transitional period of patent expiries, drive our Growth Platforms and roll out our new medicines. While now largely behind us, the impact of the loss of exclusivity on some of our most important medicines has been significant and will continue in 2017. Between 2011 and 2016, Product Sales in Established Markets of brands that have lost exclusivity, includingCrestor, a statin,Nexium, a proton pump inhibitor andSeroquel, an anti-psychotic, have reduced from $20 billion to $6 billion. Unfavourable currency movements account for $2 billion of this $14 billion reduction. This decline represents a significant ‘headwind’, but we have made significant progress rebuilding our Company for the future and preparing for a new period of growth driven by our pipeline delivery. In parallel to managing our legacy brands decline, we have launched a significant number of new medicines and increased revenues from our recently launched medicines. For example,Tagrisso was only launched in November 2015 and became our biggest lung cancer medicine during the | |
| | |
| 4 | | AstraZenecaAnnual Report and Form 20-F Information 2016 |
2016 Strategic priorities overview
| | |
 | | Achieve scientific leadership |
| | > | 11 approvals of NMEs or major LCM projects in major markets |
| | – | Oncology:Tagrisso– lung cancer (EU, JP) and ctDNA blood test (US, JP) |
| | – | CVMD:Brilinta/Brilique– post myocardial infarction (EU) and acute coronary syndromes and post myocardial infarction (JP);Qtern – Type 2 diabetes (EU) |
| | – | Respiratory:Bevespi Aerosphere(PT003) – COPD (US) |
| | – | Other:Zurampic – gout (EU);Zavicefta – serious infections (EU); Pandemic Live Attenuated Influenza Vaccine – pandemic influenza (EU) |
| | > | 7 Phase III NME investment decisions |
| | > | 14 NME or major LCM regulatory submissions in major markets:Faslodex – breast cancer (US, EU, JP);Tagrisso– lung cancer (CN);Tagrisso– lung cancer (AURA3 study for full approval) (US, EU); durvalumab – bladder cancer (US); DURATION-8 (exenatide+dapagliflozin) (EU); benralizumab – severe asthma (US, EU); lesinurad+allopurinol FDC – gout (US); three further submissions made await regulatory acceptance |
| | > | 10 accelerated reviews included |
| | – | Breakthrough Therapy Designation: durvalumab – bladder cancer (US) |
| | – | Orphan Drug Designation: acalabrutinib – blood cancers (EU); selumetinib – thyroid cancer (US); inebilizumab (MEDI-551) – neuromyelitis optica (US) |
| | – | Fast Track Designation:Lynparza– ovarian cancer (2nd line) (US), prostate cancer (2nd line) (US); MEDI8852 – hospitalised influenza (US); AZD3293 – Alzheimer’s disease (US) |
| | – | Priority Review Designation:Tagrisso(CN); durvalumab – bladder cancer (US) |
| | > | 22 projects discontinued |
| | |
 | | Return to growth |
| | > | 7% decrease in Total Revenue to $23,002 million at actual rate of exchange; comprising Product Sales of $21,319 million (down 10%) and Externalisation Revenue of $1,683 million (up 58%) |
| | – | At CER, Total Revenue declined by 5% |
| | > | 4% increase in Growth Platforms revenue (5% at CER) contributing 63% of Total Revenue |
| | – | Emerging Markets: Stable (growth of 6% at CER) to $5,794 million, supported by China, up 4% (10% at CER) to $2,636 million |
| | – | Diabetes: Growth of 9% (11% at CER), asFarxiga/Forxigabecame our largest-selling Diabetes medicine |
| | – | Japan: Sales up 8% (down 3% at CER) to $2,184 million, reflecting exchange rate impact and a biennial price reduction |
| | – | Brilinta/Briliquesales grew by 36% (39% at CER) to $839 million |
| | – | Respiratory: A decline of 5% (3% at CER) to $4,753 million, reflecting US pricing pressure forSymbicort |
| | – | New Oncology: Strong sales of $664 million, withTagrissodelivering sales of $423 million in its first full year |
| | > | US revenue was down 22% to $7,365 million; Europe down 5% to $5,064 million; and Established ROW rose by 2% to $3,096 million (all at actual rate of exchange) |
| | |
 | | Be a great place to work |
| | > | Decline in scores in our employee survey (Pulse) reflects impact of reshaping the business |
| | > | Second in Pharmaceuticals, Biotechnology and Life Sciences industry group of Dow Jones Sustainability Index |
| | > | Biggest riser in the Access to Medicine Index since the last survey, moving to 7th place in 2016 from 15th in 2014 |
Some of the most exciting science being undertaken at the moment is in Oncology as we explore the potential for novel therapies. As you can see, 2016 was a significant year for our Oncology team: we had four regional approvals, seven expedited reviews and seven regulatory submissions for our medicines. Looking ahead, we have the potential to deliver our third Oncology medicine in 2017 – halfway to our 2020 target in just four years.
Of course, pushing the boundaries of science means we sometimes encounter setbacks. Thus, in 2016, for example, we voluntarily withdrew the marketing authorisation application submitted to the EMA for cediranib in advanced ovarian cancer. However, there remain ongoing studies to investigate cediranib as a combination partner withLynparza and other compounds. In addition, three of our Oncology trials failed to meet their primary endpoints. Another development showed our Values in action. In pushing the boundaries of science with clinical trials of durvalumab for head and neck squamous cell carcinoma, we observed bleeding events. Following the precautionary principle, we put patients first and placed a voluntary hold on the enrolment of new patients. This was followed by a partial clinical hold from the FDA. However, by following the science, we provided a comprehensive analysis about the events that had been observed and the FDA’s hold was subsequently lifted.
In 2016, our Cardiovascular & Metabolic Disease team saw three approvals, four regulatory submissions and twoBrilinta trials which failed to meet their primary endpoints. We received a complete response letter from the FDA for ZS-9 for the treatment of hyperkalaemia and subsequently made a resubmission. In diabetes, positive results from our DURATION-8 trials demonstrated the efficacy ofFarxiga andBydureon in combination for the treatment of Type 2 diabetes and should help us maximise the value of our Diabetes portfolio.
During the year,Bevespi Aerosphere was approved in the US and launched in early 2017. Our Respiratory team also made three regulatory submissions, including two in respect of benralizumab for treating severe, uncontrolled asthma. We believe benralizumab, which would be our first Respiratory biologic, will become an
| | |
| AstraZenecaAnnual Report and Form 20-F Information 2016 | | 5 |
Strategic Report
Chief Executive Officer’s Reviewcontinued
important medicine for patients with severe asthma and potentially COPD, as well as an important growth driver for our Company, broadening and deepening our offering in the Respiratory market.
Business development and collaboration are at the heart of the way AstraZeneca operates. It is particularly evident in our work in Other Disease Areas. For example, we enter into collaborations to maximise the potential of key products that fall outside our main therapy areas and bring them to patients quicker. Examples in 2016 include our development and commercialisation agreements with LEO Pharma for brodalumab for psoriasis and tralokinumab for dermatitis, and with Allergan for MEDI2070 for inflammatory diseases. In Alzheimer’s disease, together with our partner Lilly, we obtained a Fast Track Designation for the BACE inhibitor and have entered a second collaboration with them to co-develop MEDI1814. We are also partnering some of our in-line products that we believe still have growth potential but which cannot receive promotional support as we focus our resources on our main therapy areas. An example is the agreement we reached with China Medical System Holdings for the promotion of Plendil in China: our partner will manage the commercialisation and both companies will share the benefits. Finally, we have been divesting smaller non-core products that will be better managed by companies that can focus on them. The value unlocked through these deals is reinvested in our pipeline, creating more long-term value through our main therapy areas.
Prioritised and accelerated pipeline
Since we announced our science-led strategy in 2013, we set ourselves some ambitious pipeline targets for the end of 2016. For example, we aimed for nine to 10 new molecular entities (NMEs) in Phase III or registration: by the end of 2016, there were 12 such projects. We also set ourselves the target of eight to 10 new medicines and major line extension regulatory approvals in 2015 to 2016 and achieved a total of eight. This is a significant improvement compared to our historical pipeline performance.
We also made substantial progress in reshaping our research and early development efforts to help us to produce a steady stream of new products that will
support our long-term growth: we believed we had the potential for 12 to 16 Phase II starts in 2015 to 2016. In fact, we achieved 25. Looking ahead, we believe we have the potential for an unprecedented number of submissions in the next 24 months, with around half in our Oncology therapy area. To ensure we can deliver this potential, in April we announced plans to sharpen further the prioritisation of investments in our main therapy areas, particularly Oncology. We also want to increase partnering in relation to projects in our inflammation, infection and neuroscience disease areas. The 10 strategic transactions we undertook in 2016 bear witness to the progress we have made in that regard. We also took action to align costs to our changing business shape and streamline our operations.
Return to growth
Our Return to growth is underpinned by our Growth Platforms, shown in the panel. As our strategy has progressed, so our Growth Platforms have evolved – New Oncology (new products) was added and, from January 2017, New CVMD combined our Diabetes andBrilinta/BriliquePlatforms. As the treatment of diabetes becomes more focused on cardiovascular risk reduction based on recent data, we believe there are clear synergies managing diabetes andBrilinta/Brilique together.
The panel shows how our Growth Platforms performed in 2016. Despite increasing competition, pricing pressures and geopolitical instability, they grew by 4% at actual exchange rates (5% at CER) and now represent 63% of all revenues. Emerging Markets are particularly important in achieving our goals. This importance was recognised towards the end of the year with the appointment of Leon Wang, our Country President in China, as Executive Vice-President of Asia Pacific and a member of the Senior Executive Team.
Be a great place to work
None of the progress we are making in achieving our strategic objectives would be possible without our people; we want to ensure AstraZeneca is a great place to work and I am very grateful to each and every employee for all their efforts throughout the year.
Employee opinion surveys help us measure satisfaction and engagement and how we are doing in our aim to be a great place to work. Our most recent survey, carried out in December 2016, showed a decline compared to our very high 2015 score, although results are in line with the ‘global pharma norm’. This decline might not be unexpected given the challenges of the strategic journey on which we are embarked and the restructuring we undertook in 2016 as we continued losing sales to patent expiries. Nevertheless, we are focused on improving performance in those areas employees tell us are important drivers of employee engagement. These include people development and line manager communication.
One area in which we made significant progress during 2016, and which the Chairman reports on in more detail in his Statement on page 82, was external recognition for our commitment to sustainability – whether that be in the Dow Jones Sustainability Index or Access to Medicine Index, or in the recognition of our science-based environmental targets. During the year, the Executive team also reviewed and refreshed our sustainability strategy.
Looking ahead
Our financial results for 2016 were in line with expectations and reflected our ongoing transition. We brought a sharper strategic focus to our three main therapy areas, boosting pipeline productivity further. Our underlying business is growing as the new AstraZeneca emerges, driven by competitive franchises and Emerging Markets.
2017 should be a turning point in our journey as we bring new medicines to patients across the globe. It is an exciting time as we approach the inflection point for our anticipated return to long-term growth, built on the foundations of a science-led pipeline.

Pascal Soriot
Chief Executive Officer
| | |
| 6 | | AstraZenecaAnnual Report and Form 20-F Information 2016 |
| | | | | | | | |

| | Being committed to protecting the environment, we are: > working towards a Building Research Establishment ‘excellent’ rating for sustainability performance for our R&D centre in addition to delivering a low carbon emission facility > building the largest ground source heat pump system in Europe and a combined heat and power station to meet on-site energy needs. To inspire the next generation of scientists, we: > have three schemes to support more than 80 PhD scholarships and eight clinical lectureships > partner with the Cambridge Science Centre to ensure life science education activities reach underserved communities in the wider Cambridgeshire area > have an active community support scheme, involving more than 160 staff volunteers, focused around science-based educational events for young people. | | |
| | We announced our move to Cambridge in 2013. In doing so, we join MedImmune who have been in the city for 25 years. We begin the staged occupation of our new state-of-the-art building (illustrated above and right) in 2018 and already have some 2,000 staff actively engaged in Cambridge’s scientific, academic, clinical and business life. They are realising the value of being located at a world-leading academic and life science hub. As a global science-led business, we have: > provided new life science businesses with access to more than 60 mentors from across AstraZeneca, including support for the University of Cambridge Judge Business School’s ‘Accelerate’ programme 
| | > shaped the laboratory spaces at our R&D centre collaboratively, involving our scientists in the design and commissioning process, including an on-site teaching lab for science outreach As a scientific partner, we have: > initiated over 130 collaborations with Cambridge organisations, including over 100 with the University of Cambridge > collaborated with Microsoft to develop a new cancer treatment modelling system > established the CRUK MedImmune Alliance Laboratory to provide capabilities to discover novel biologics and diagnostics > established a world-class mass spectroscopy capability with the Laboratory of Molecular Biology and the University of Cambridge > developed the AstraZeneca Medical Research Council UK Centre for Lead Discovery. | | 
Key facts 130  Over 130 collaborations in Cambridge 2,000  Around 2,000 employees in Cambridge  Watch the video at Watch the video at
www.astrazeneca.com | | |

| | |
| AstraZenecaAnnual Report and Form 20-F Information 2016 | | 7 |
Strategic Report | Strategy
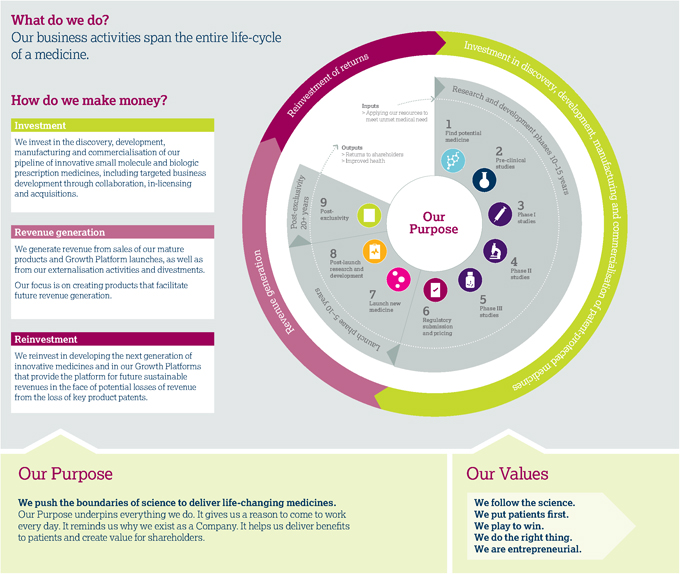
Business model and life-cycle of a medicine
AstraZeneca at a glance summarises our business. In this section, we review our business model – how we make money, the resources we need and how we add value across the entire life-cycle of a medicine.
Why AstraZeneca?
We are an integrated, science-led biopharmaceutical Company with a strategic focus on three main therapy areas built around our differentiated:
| | |
| 8 | | AstraZenecaAnnual Report and Form 20-F Information 2016 |
Life-cycle of a medicine
| | | | | | | | |
Research and development phases 10–15 years   |
| | | | | | | | | |
1 Find potential medicine > Identify unmet medical need aligned with our three therapy areas and undertake scientific research to identify potential new medicines > Initiate process of seeking patent protection 2 Pre-clinical studies > Conduct laboratory and animal studies to understand if the potential medicine is safe to introduce into humans and in what quantities > Determine likely efficacy, side effect profile and maximum dose estimates | | | | 3 Phase I studies > Begin clinical studies with small groups of healthy human volunteers (small molecules) or patients (biologics) to understand how the potential medicine is absorbed into the body, distributed around it and excreted > Determine approximate dosage and identify side effects 4 Phase II studies > Conduct studies on small- to medium-sized groups of patients to test effectiveness and tolerability of the medicine and determine optimal dose > Design Phase III studies to generate data needed for regulatory approvals and pricing/ reimbursement globally | | | | 5 Phase III studies > Engage in studies in a larger group of patients to gather information about effectiveness and safety of the medicine and evaluate the overall benefit/risk profile > Initiate branding for the new medicine in preparation for its launch 6 Regulatory submission and pricing > Seek regulatory approvals for manufacturing, marketing and selling the medicine > Submit clinical data to regulatory authorities (and, if requested, generate further data increasingly in real-world settings) to demonstrate the safety and efficacy of the medicine to enable them to decide on whether to grant regulatory approvals |
| | | | | | | | | |
Launch phase 5–10 years  | | | | Post-exclusivity 20+ years  |
| | | | | | | | | |
7 Launch new medicine > Raise awareness of patient benefit and appropriate use, market and sell medicine > Clinicians begin to prescribe medicines and patients begin to benefit > Continuously monitor, record and analyse reported side effects. Review need to update the side effect warnings to ensure that patients’ wellbeing is maintained > Assess real-world effectiveness, and opportunities to support patients and prescribers, to achieve maximum benefit from the medicine | | | | 8 Post-launch research and development > Conduct studies to further understand the benefit/risk profile of the medicine in larger and/ or additional patient populations > Life-cycle management activities to broaden understanding of a medicine’s full potential > Consider additional diseases or aspects of disease to be treated by or better ways of administering the medicine > Submit data packages with requests for life-cycle management to regulatory authorities for review and approval | | | | 9 Post-exclusivity > Patent expiry and generic entry > Reinvestment of returns |
| | | | | | | | | |
Note: This is a high-level overview of a medicine’s life-cycle and is illustrative only. It is neither intended to, nor does it, represent the life-cycle of any particular medicine or of every medicine discovered and/or developed by AstraZeneca, or the probability of success or approval of any AstraZeneca medicine.
| | | | | | |
Our Values determine how we work together and the behaviours that drive our success. Our Values guide our decision making, define our beliefs and foster a strong AstraZeneca culture. | | | | Sustainability We want to be valued and trusted by our stakeholders as a source of great medicines over the long term. Our sustainability commitments, which are driven by our Purpose and Values, underpin our business model and support the delivery of our business strategy.  Business Review from page 42 Business Review from page 42
| | 
|
| | |
| AstraZenecaAnnual Report and Form 20-F Information 2016 | | 9 |
Strategic Report | Strategy
Business model and life-cycle of a medicinecontinued
What does our business model require to be successful?
| | |
| | |
A talented and diverse workforce |
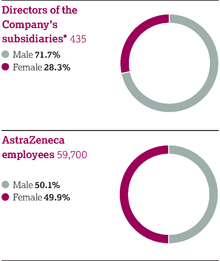
We need to acquire, retain and develop a talented and diverse workforce united in pursuit of our Purpose and Values and fostering a strong AstraZeneca culture. | | 59,700 employees See Employees from page 54 |
A leadership position in science |
We need to achieve scientific leadership if we are to deliver life-changing medicines. To that end, we need to focus on innovative science, prioritise and accelerate our pipeline and transform our innovation and culture model. | | $5.9bn invested in our science  See Achieve scientific leadership from page 45 and R&D resources on page 59 See Achieve scientific leadership from page 45 and R&D resources on page 59
|
Commercialisation skills |
We need a strong global commercial presence and skilled people to ensure that we can successfully launch our medicines, that they are available when needed and that patients have access to them. | | >100 countries in which we are active  See Return to growth from page 48 See Return to growth from page 48
|
Intellectual property |
We need to create and protect our IP rights. Developing a new medicine requires significant investment over many years, with no guarantee of success. For our investments to be viable, we seek to protect new medicines from being copied for a reasonable period of time through patent protection. | | >100 countries where we obtain patent protection See Intellectual Property from page 57 |
A robust supply chain |
We need a supply of high-quality medicines, whether from one of the 31 Operations sites in 18 countries in which we manufacture or the $13 billion we spend on the purchase of goods, services and active pharmaceutical ingredients (API). | | $13bn spent with suppliers See Manufacturing from page 58 and Working with suppliers from page 52 |
Effective partnerships |
We need business development, specifically partnering, which is an important element of our business model. It supplements and strengthens our pipeline and our efforts to achieve scientific leadership. | | 600 collaborations worldwide See Partnering from page 23 |
Financial strength |
We need strong financials, including access to equity and debt finance, to bear the financial risk of investing in the entire life-cycle of a medicine. | | $4.1bnnet cash flow from operating activities See Financial Review from page 62 |
| | | | |
| | How do we add value? Financial value  Revenue from the sale of our medicines generates cash flow, which helps us: > fund our investment in science and Growth Platforms to drive long-term value > meet our debt service obligations > follow our progressive dividend policy. This involves balancing the interests of our business, financial creditors and shareholders. See Financial Review from page 62 Improved health  Continuous scientific innovation is vital to achieving sustainable healthcare which as it creates value by: > improving health outcomes and transforming patients’ lives > enabling healthcare systems to reduce costs and increase efficiency > improving access to healthcare and healthcare infrastructure > helping develop the communities in which we operate through local employment and partnering. | | |
| | |
| 10 | | AstraZenecaAnnual Report and Form 20-F Information 2016 |
Marketplace
| | |
| 2bn | |  |
By 2050, the world’s population aged 60 years and older is expected to total some 2 billion.
Global investment in pharmaceutical R&D expected to reach an estimated $154 billion in 2016, an 11% increase from $139 billion in 2012.
The global context
The October 2016 World Economic Outlook of the International Monetary Fund (IMF) highlighted the precarious nature of the recovery eight years after the global financial crisis. It raised the spectre that persistent stagnation, particularly in advanced economies, could further fuel populist calls for restrictions on trade and immigration. The IMF went on to observe that such restrictions would hamper productivity, growth and innovation. In China, a shift from investment and industry towards consumption and services was expected to slow growth in the short term while building the foundations for a more sustainable long-term expansion. Japan’s economy would be hampered by a shrinking population.
More generally, both political and economic uncertainty followed the Brexit vote in the UK and the election of Donald Trump to president of the US. Instability in a number of other European countries has been exacerbated by refugees fleeing civil war and unrest in the Middle East and from further afield.
Against this uncertain background, however, the demand for healthcare continues to increase. While this is a favourable trend for long-term industry growth, challenges remain. These include expiring patents, competition from and growing use of generic medicines, obtaining regulatory approval, securing reimbursement for new medicines, improving R&D productivity and attaining pricing and sales sufficient to generate revenue and sustain the cycle of innovation.
| | |
| AstraZenecaAnnual Report and Form 20-F Information 2016 | | 11 |
Strategic Report | Strategy
Marketplacecontinued
| | | | |
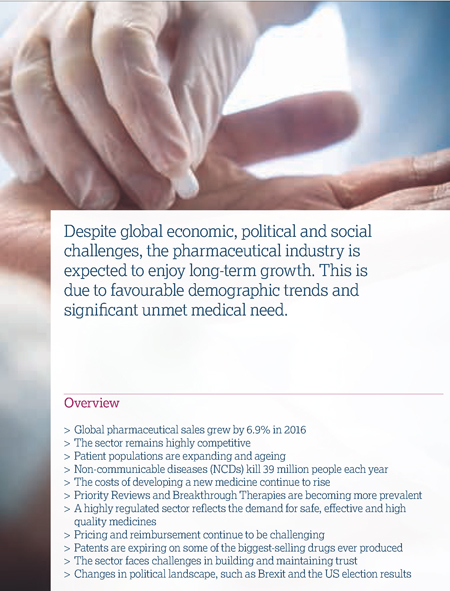
Global pharmaceutical sales | | | |
World$bn 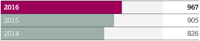
| | | | |
$967bn(6.9%) | | | | |
US$bn 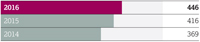
| | | | |
$446bn (7.1%) | | | | |
Europe$bn 
| | | | |
$201bn (5.6%) | | | | |
Established ROW$bn 
| | | | |
$120bn (5.1%) | | | | |
Emerging Markets$bn 
| | | | |
| $200bn(9.1%) | | | | |
Data based on world market sales using AstraZeneca market definitions as set out in the Market definitions on page 239. Source: IMS Health, IMS Midas Quantum Q3 2016 (including US data). Reported values and growth are based at CER. Value figures are rounded to the nearest billion and growth percentages are rounded to the nearest tenth.
Expanding patient populations
The number of people accessing healthcare is increasing, as is healthcare spending, particularly by the elderly. For example, WHO estimates that, by 2050, the world’s population aged 60 years and older is expected to total some two billion, up from 900 million in 2015 and that, by then, 80% of all older people will live in low-and middle-income countries. As the diagram on page 14 shows, we expect developing markets to continue to fuel pharmaceutical growth.
Unmet medical need
The prevalence of NCDs, such as cancer and cardiovascular, metabolic and respiratory diseases, is increasing worldwide. NCDs are often associated with ageing populations and lifestyle choices, including smoking, diet and lack of exercise. Many NCDs require long-term management. WHO estimates that NCDs kill 39 million people each year and disproportionately affect low- and middle-income countries where nearly three-quarters of these deaths occur. For example, more than 60% of the world’s total new annual cancer cases occur in Africa, Asia, and Central and South America. These regions account for 70% of the world’s cancer deaths.
The pharmaceutical sector: opportunities and challenges
As shown in the table on the left, global pharmaceutical sales grew by 6.9% in 2016. Established Markets saw average revenue growth of 6.4% and Emerging Markets revenue grew at 9.1%. The US, Japan, China, Germany and France are the world’s top five pharmaceutical markets. In 2016, the US had 44.7% of global sales (2015: 46.0%; 2014: 44.7%).
Science and technology
Innovation is critical to addressing unmet medical need. The delivery of new medicines will rely on a more advanced understanding of disease and the use of new technology and approaches, including personalised healthcare (PHC) and predictive science.
Technological breakthroughs in the design and testing of novel compounds present fresh opportunities for using small molecules as the basis for new medicines. The use of large molecules, or biologics, has also become an important source of innovation. Biologics are among the most commercially successful new products. By 2020, biologics, excluding vaccines, are expected to account for 27% of the global pharmaceutical market, having risen from 14% in 2006. As such, most pharmaceutical companies now pursue R&D in both small molecules and biologics.
Priority Reviews and Breakthrough Therapies are becoming more prevalent. Between the inception of the Breakthrough Therapy Designation programme in October 2012 and the end of 2016, the FDA granted more than 150 such requests (out of more than 450 applications), and one-third of these have already resulted in product approvals.
The cost of developing new medicines continues to rise. Global R&D investment is expected to reach $154 billion in 2016. While the growth rate of R&D spend has slowed in recent years, pharmaceutical companies continue to deliver new medicines. In 2016, the FDA approved 22 novel drugs compared with 45 in 2015 and 41 in 2014.
To ensure sustainable returns on R&D investment, the industry is working to increase its success rate in developing commercially viable new drugs while achieving a lower, more flexible cost base. Regulators and payers, however, are demanding greater evidence of comparative effectiveness of medicines. This increases development times and costs.
Fortunately, innovative technology is helping accelerate product approvals. A greater emphasis on Proof of Concept is also helping to improve productivity and reduce costs by showing the potential efficacy of drugs earlier in the development process.
| | |
| 12 | | AstraZenecaAnnual Report and Form 20-F Information 2016 |
Regulatory requirements
A highly regulated biopharmaceutical industry reflects the public’s expectation of safe, effective and high-quality medicines. Meeting this expectation requires responsible testing, manufacturing and marketing. It also relies on maintaining effective working relationships with health authorities worldwide, including the FDA in the US, the EMA in the EU, the PMDA in Japan, and the CFDA in China. Increasingly, regulation and governmental policy are being introduced to stimulate innovation in drug development. In the US, for example, the 21st Century Cures Act, signed into law on 13 December 2016, focuses on accelerating the discovery, development and delivery of promising new treatments for patients. Similarly, the Prescription Drug User Fee Act reauthorisation legislation that is required to be considered by the US Congress in 2017 is anticipated to contain proposals aimed at accelerating innovation and modernising the US regulatory environment. Additionally, the growing complexity and globalisation of clinical studies have led to an increase in public-private consortia. Such consortia, which include industry, academia and government bodies, aim to drive innovation, streamline regulatory processes, and define and clarify approval requirements for innovative drug and biologic products.
Regulatory health authorities continue to implement programmes intended to address unmet medical need and to speed up patient access to transformative medicines. This is demonstrated by the Breakthrough Therapy programme employed by the FDA and the EMA’s initiative to implement ‘adaptive pathways’ to improve timely patient access to new medicines. In Japan, the SAKIGAKE Designation System has been introduced to designate innovative medicines that hold the promise for a significant advance over currently available therapy. Once designated, the PMDA collaborates with sponsors to accelerate the development and approval of these promising unapproved medicines for serious and life-threatening diseases. The lengthy review process in China extends new medicine approval periods to as long as five years. This challenges the ability of pharmaceutical companies to deliver innovative medicines and treat unmet medical need in China. However, recent developments, including
the in-progress review of China’s Drug Administration Law and Drug Registration Regulation are likely to help address this issue over the next few years.
Greater transparency and public access to regulatory submissions that support approval of new medicines continue to be an area of interest. A recent example involves the EMA policy 0070 on publication of clinical data for medicinal products for human use, which provides guidance for the publication of clinical reports that underpin the EMA’s decision making. Paediatric development continues to present challenges to the industry as differences between study requirements and timeframes may vary significantly among health authorities. However, there have been efforts to provide incentives to stimulate paediatric research. An example is the EMA’s initiative offering free-of-charge meetings focused on paediatric studies early in drug development. In addition, the industry has appreciated the opportunity afforded by the US paediatric rare disease voucher programme to encourage paediatric drug development. International harmonisation is being advanced in this area through the revision of the ICH E11 paediatric guideline, which has facilitated discussion between regulators and the industry on topics of mutual interest.
Regulatory requirements for the registration of biosimilar products continue to develop and become better defined, as exemplified by the publication of a new pathway for China and the approvals of more biosimilar products in the US. However, significant areas of regulatory policy are still evolving. Among these are transparency of data regarding level of evidence to support approval of claims for biosimilarity in labelling, standards for interchangeability and pharmaceutical substitution, and traceability of pharmacovigilance reports through naming conventions that permit differentiation of products.
| | |
| | For more information about biosimilars, please see Patent expiries and genericisation on page 15 |
Pricing of medicines
Pricing and reimbursement remain challenging in many markets. We continue to see examples where healthcare services (including pharmaceuticals) are highly regulated by governments, insurers and other private payers through various controls on pricing and reimbursement. Implementation of cost containment reforms and shifting market dynamics are further constraining healthcare providers, while difficult economic conditions burden patients who have out-of-pocket expenses relating to their medicines. Pharmaceutical companies are now expending significant resources to demonstrate the economic as well as the therapeutic value of their medicines.
In the US, the Affordable Care Act (ACA) has directly affected the healthcare system by reshaping the market through various policies and approaches designed to expand insurance coverage, reduce costs, transform the delivery system, and improve healthcare and patient coverage. We, along with other pharmaceutical companies, have continued to work with policymakers and regulators to increase access, improve outcomes and to support an environment that fosters medical and scientific innovation and value.
The new political leadership in the US has proposed to repeal and replace the ACA and has taken initial steps to that end. While it is unclear if some or all of the ACA might be repealed or what the scope of replacement might entail if implemented, it is possible that proposals could require the healthcare industry to offset the cost of replacement. This may include changes to the pharmaceutical industry excise tax, Medicaid reform by, for example, granting the states greater flexibility in designing and funding their Medicaid programmes, including the choice of a block grant orper capita allotment of federal funds, and/or repeal the marketplace exchanges that were established under the ACA. These changes, whether directly or indirectly targeted at drugs or the pharmaceutical industry, could impact pharmaceutical coverage and patient access to healthcare under insurance plans and government programmes and could, accordingly, significantly affect the pharmaceutical industry.
| | |
| | Further details on the impact of the ACA on our business are contained in Return to growth on page 48 |
| | |
| AstraZenecaAnnual Report and Form 20-F Information 2016 | | 13 |
Strategic Report | Strategy
Marketplacecontinued
We expect developing markets to continue to boost pharmaceutical growth.”
| | |
| 84.7% | |  |
| Generics constituted 84.7% of prescriptions dispensed in the US. | |
Political leadership in the US has also continued to focus on drug pricing. Various drug pricing proposals have included measures relating to the repeal of the Medicare Part D non-interference clause that currently prohibits the government from negotiating directly with manufacturers on drug prices and US drug importation policies. In addition, lawmakers and policymakers at both the federal and state level have developed drug pricing transparency proposals that include measures relating to the submission of proprietary manufacturer data, establishment of price parameters that are indexed to certain federal programmes, and reporting of changes in pricing beyond certain thresholds. While the implementation timeline and details of such proposals are not clear, significant changes to laws and regulations regarding drug pricing could have a significant impact on the pharmaceutical industry.
In Europe, governments continue to implement and expand price control measures for medicines, including mandatory discounts, clawbacks and price referencing rules. These measures are decreasing drug prices, particularly in the challenged economies of Greece,
Romania and Italy. In France, price negotiations are particularly challenging due to budgetary pressures. In Germany, Europe’s largest pharmaceutical market, manufacturers must now prove the added benefit of their drug over existing alternatives if they are to avoid relegation to an unfavourable price reference or face non-pricing barriers to market access.
In China, pricing practices remain a priority for regulators. New national regulations and provincial and hospital tenders continue to put increasing pricing pressures on pharmaceutical companies. In Russia and selected Middle East markets, governments are encouraging local manufacturing by offering more favourable pricing legislation. In Japan, mandated biennial cuts are likely to continue as are experimental decisions by regulators based on cost effectiveness assessments. In Latin America, pricing is increasingly controlled by governments as, for example, in Colombia and Brazil with price referencing regulations.
| | |
| | For more information about price controls, reductions and US healthcare reform, and price regulation, please see the Business Review, Return to growth from page 48 and Risk from page 214 |
Estimated pharmaceutical sales and market growth – 2020
| | | | | | | | | | | | |
North America 
| | | | EU 
| | | | Other Europe(Non-EU countries) 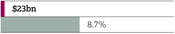
| | | | Japan 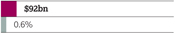
|
| | | | | | |
| | | | | | | | | | | | |
Oceania 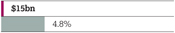
| | | | South East and East Asia 
| | | | Latin America 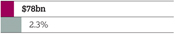
| | | | Africa 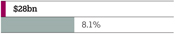
|
| | | | | | |
| | | | | | | | | | | | |
CIS 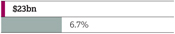
| | | | Middle East 
| | | | Indian subcontinent 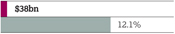
| | | | · Estimated pharmaceutical sales – 2020. Ex-manufacturer prices at CER. Source: IMS Health. · Estimated pharmaceutical market growth – 2015 to 2020. Compound annual growth rate. Source: IMS Health. |
| | |
| 14 | | AstraZenecaAnnual Report and Form 20-F Information 2016 |
Patent expiries and genericisation
Patent protection for pharmaceutical products is finite. Patents are expiring on some of the biggest-selling drugs ever produced and this means that payers, physicians and patients are gaining greater access to generic alternatives (both substitutable and analogue) in many important drug classes. These generic alternatives are primarily lower priced because generic manufacturers are largely spared the costs of R&D and market development. As a result, demand for generics is high. For prescriptions dispensed in the US in 2016, generics constituted 84.7% of the market by volume (2015: 84.0%).
Generic competition can also result from patent disputes or challenges before patent expiry. Increasingly, generics companies are launching products ‘at risk’, for example, before resolution of the relevant patent litigation. This trend, which is likely to continue, creates significant market presence for the generic version while the litigation remains unresolved. Given the unpredictable nature of patent litigation, some companies have settled such challenges on terms acceptable to the innovator and generic manufacturer. While competition authorities generally accept such agreements as a legitimate way to settle these disputes, they have questioned some settlements as being anti-competitive.
Biologics typically retain exclusivity for longer than traditional small molecule pharmaceuticals, with less generic competition. With limited experience to date, the substitution of biosimilars for the original branded product has not followed the same pattern as generic substitution in small molecule products and, as a result, erosion of the original biologic’s branded market share has not been as rapid. This is due to biologics’ complex manufacturing processes and the inherent difficulties in producing a biosimilar, which could require additional clinical trials. However, with regulatory authorities in Europe and the US continuing to implement abbreviated approval pathways for biosimilar versions, innovative biologics are likely to face increased competition. Similar to biologics, some small molecule
pharmaceutical products are in complex formulations and/or require technically challenging manufacturing and thus may not follow the pattern of generic market erosion seen with traditional, tableted pharmaceuticals. For those products, the introduction of generic alternatives (both substitutable and analogue) can be slower.
Building trust
The pharmaceutical industry faces challenges in building and maintaining trust, particularly with governments and regulators. This reflects the past decade’s legal disputes between pharmaceutical companies and governmental and regulatory authorities. To address this challenge, companies are strengthening a culture of ethics and integrity, adopting higher governance standards and improving relationships with employees, shareholders and other stakeholders.
During 2016, there were also pharmaceutical industry investigations and Congressional hearings in the US related to pricing while, in the UK, the Competition and Markets Authority has been investigating allegations of excessive charging and fining companies for unfair prices.
Numerous companies, including those in the pharmaceutical industry, have been investigated by the China Public Security Bureau following allegations of bribery, and criminal and financial penalties have been imposed. Investigations by the DOJ and SEC under the Foreign Corrupt Practices Act are continuing as are investigations by the UK Serious Fraud Office under the UK Bribery Act. Information about material legal proceedings can be found in Note 28 to the Financial Statements from page 185.
Strategic responses
Our industry remains highly competitive. It includes large, research-based pharmaceutical companies (such as AstraZeneca) that discover, develop and sell innovative, patent-protected prescription medicines and vaccines, smaller biotechnology and vaccine
businesses, and companies that produce generic medicines. However, the pharmaceutical market is highly competitive. For example, our Diabetes franchise continues to see pricing pressure. In immuno-oncology, the large number of clinical trials that are being carried out highlight the competitive nature of this area and renders speed to market critical.
While many of our peers face similar challenges, they tackle them in different ways. Some companies have pursued a strategy focused on branded prescription pharmaceuticals. Others have diversified by acquiring or building branded generics businesses or consumer portfolios. A number of companies are focused on improving R&D productivity and operational efficiency. Other companies have looked to geographic expansion, especially in Emerging Markets and Japan.
Across the industry, business development deals (including licensing and collaborations), and competition for business development opportunities, while down over 2015, continued in 2016. For example, one report estimates that the value of mergers and acquisitions announced in the healthcare sector during the year amounted to more than $270 million, compared with almost $400 million in 2015.
As outlined in AstraZeneca at a glance from page 2 and our Business model from page 8, our strategic response to the pharmaceutical marketplace is to be a ‘pure-play’, global, science-led biopharmaceutical company that focuses on the discovery, development and commercialisation of prescription medicines, primarily for the treatment of diseases in three main therapy areas. The strategic priorities that follow on from this response are outlined in the next section.
| | |
| AstraZenecaAnnual Report and Form 20-F Information 2016 | | 15 |
Strategic Report | Strategy
Strategy and key performance indicators
We are focused on returning to growth through a science-led innovation strategy. Our strategic priorities, and the indicators against which we measure our success, are based on investing in three therapy areas, building a strong and balanced portfolio of primary care and specialty care medicines, and accelerating key R&D programmes. They also include targeted business development and leveraging our global commercial presence.
| | |
| Achieve scientific leadership | | 
|
| | | | | | |
Strategic priorities | | Key performance indicators | | | | |
Focus on innovative science in three therapy areas Focus on Oncology, Cardiovascular & Metabolic Disease, and Respiratory. We are also selectively active in Autoimmunity, Infection and Neuroscience. Work across small molecules and biologics, including immunotherapies and protein engineering, as well as devices, biomarkers and translational science. Prioritise and accelerate our pipeline Accelerate and invest in key R&D programmes. At the end of 2016, 12 NMEs were in Phase III or under regulatory review compared with our March 2013 target of nine to 10. Against the targets we had set ourselves since 2013, by the end of 2016, we had made 25 Phase II starts (2015 to 2016 target: 12 to 16); 14 NME and major line extension regulatory submissions (2015 to 2016 target: 14 to 16); and eight NME and major line extension regulatory approvals (2015 to 2016 target: eight to 10). Strengthen our early-stage pipeline through novel science and technology. Transform our innovation and culture model Focus on novel science, such as immune-mediated therapy combinations and PHC. Co-location near bioscience clusters at three strategic centres in Cambridge, UK; Gaithersburg, Maryland US; and Gothenburg, Sweden helps to leverage our capabilities and foster collaboration with leading scientists and research organisations. Accelerate through business development Work to reinforce our therapy areas and strengthen our portfolio and pipeline through targeted business development, including collaborations, in-licensing and acquisitions. Collaborate strategically to broaden and accelerate the development of key pipeline assets (externalisation) and divest non-core assets to realise value. | | Phase III investment decisions 7 
savolitinib (papillary renal cell carcinoma); durvalumab+ tremelimumab (hepatocellular carcinoma);Forxiga(heart failure);Forxiga(chronic kidney disease); AZD3293 (BACE) Alzheimer’s disease; two further decisions made through strategic partnering. | | NME or LCM project regulatory submissions in major markets 14 
Faslodex– breast cancer (US, EU, JP);Tagrisso– lung cancer (CN);Tagrisso– lung cancer (AURA3 study for full approval) (US, EU); durvalumab – bladder cancer (US); DURATION-8 (exenatide+dapagliflozin) (EU); benralizumab – severe asthma (US, EU); lesinurad+allopurinol FDC – gout (US); three further submissions made await regulatory acceptance. 1 13 for determining Annual Bonus. See page 108 | | Clinical-stage strategic Transactions 10 
Includes alliances, collaborations and acquisitions to enhance our portfolio and pipeline in our main therapy areas; externalisation activity to maximise the value of our assets; and divestments of non-priority medicines. |
| | NME Phase II starts/progressions 16 
Vidazaand durvalumab for the treatment of acute myeloid leukaemia and CC486+durvalumab for myelodysplastic syndromes (with Celgene); MEDI0680+durvalumab for solid tumours; MEDI0562 (humanised OX40); AZD6738+Lynparzafor gastric cancer; AZD1775 (Wee1); daratumumab+durvalumab for multiple myeloma; in collaboration with Incyte, epacadostat (IDO)+ durvalumab for solid tumours; MEDI4166 (PCSK9/GLP-1); MEDI0382; AZD4076; abediterol (AZD0548) (LABA); AZD1419 (Inhaled TLR9); MEDI2070 (IL-23); MEDI3902 (pseudomonas bispecific (Psl-PcrV)); MEDI8897 (RSV). 1 15 for determining Annual Bonus. See page 108 | | NME and major LCM regional Approvals 11 
Tagrisso– lung cancer (EU, JP) and ctDNA blood test (US, JP);Brilinta/Brilique– post myocardial infarction (EU) and acute coronary syndromes and post myocardial infarction (JP);Qtern– Type 2 diabetes (EU);Bevespi Aerosphere(PT003) – COPD (US);Zurampic– gout (EU);Zavicefta– serious infections (EU); Pandemic Live Attenuated Influenza Vaccine – pandemic influenza (EU). | | |
| | | | | | |
 Therapy Area Review from page 23 Therapy Area Review from page 23 | | Achieve scientific leadership from page 45 | | Development Pipeline from page 204 | | |
| | |
| 16 | | AstraZenecaAnnual Report and Form 20-F Information 2016 |
| | |
| Return to growth | |  |
| | | | | | |
Strategic priorities | | Key performance indicators | | | | |
Focus on Growth Platforms Brilinta/Brilique – Work to deliverBrilinta/Brilique’s potential to reduce cardiovascular deaths through ongoing clinical studies. Diabetes – Work to maximise the potential of our broad and innovative non-insulin, anti-diabetic portfolio to transform patient care. From January 2017, New CVMD Growth Platform combines our Diabetes franchise,Brilinta/Brilique and any new launches. Respiratory – Work to maximise pipeline value, devices and medicines to fulfil unmet medical need and improve patient outcomes in asthma and COPD. New Oncology – Aim to deliver six new cancer medicines to patients by 2020. It became our sixth Growth Platform in January 2015 and includesLynparza, Iressa (US) and Tagrisso. Japan – Strengthen our Oncology franchise and work to maximise the success of our Diabetes medicines and established brands:Symbicort, Nexium andCrestor. Emerging Markets – Focus on delivering innovative medicines by investing in Emerging Markets capabilities, with a focus on China and other leading markets, such as Brazil and India. The ongoing transformation of our capabilities is supporting new products and improving access and affordability. Transform through specialty care, devices and biologics Biologics now account for about half of our NMEs in development, potentially enhancing asset longevity. A greater focus on innovative and differentiated delivery devices affords patients choice while ensuring product durability. Our new specialty care portfolio is expected to balance our strength in primary care medicines. | | Brilinta/Brilique $839m Product Sales 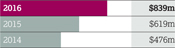
Actual growth CER growth 2016 +36% 2016 +39% 2015 +30% 2015 +44% 2014 +68% 2014 +70% | | Diabetes $2,427m Product Sales 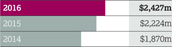
Actual growth CER growth 2016 +9% 2016 +11% 2015 +19% 2015 +26% 2014 +138% 2014 +139% | | Respiratory $4,753m Product Sales 
Actual growth CER growth 2016 -5% 2016 -3% 2015 -2% 2015 +7% 2014 +8% 2014 +10% |
| | Brilinta delivered Product Sales of $839 million. Continued progress was seen across the US and Europe with 45% and 12% growth (15% at CER) in the year respectively. | | Diabetes Product Sales grew by 9% (11% at CER) despite intense competition in this space with a positive contribution from all Regions. Our focus in diabetes remains on the fastest-growing SGLT2 and GLP-1 classes. | | 2016 was a challenging year. Respiratory Product Sales declined by 5% (3% at CER), the main driver of this beingSymbicort, which continued to grow volume share, however, Product Sales were down by 12% (10% at CER), reflecting developments in the US and Europe, offsetting the positive Emerging Markets and Established ROW growth. |
| | New Oncology $664m Product Sales 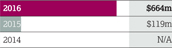
Actual growth CER growth 2016 n/m 2016 n/m 2015 N/A 2015 N/A 2014 N/A 2014 N/A | | Japan $2,184m Product Sales 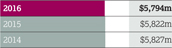
Actual growth CER growth 2016 +8% 2016 -3% 2015 -9% 2015 +4% 2014 -10% 2014 -3% | | Emerging Markets $5,794m Product Sales
Actual growth CER growth 2016 0% 2016 +6% 2015 0% 2015 +12% 2014 +8% 2014 +12% |
| | New Oncology Product Sales ofLynparza, Iressa (US) andTagrisso were $664 million. Tagrisso continued to demonstrate strong uptake in the US, Europe and Japan with global Product Sales of $423 million and 46 regulatory approvals.Lynparza Product Sales were $218 million. | | In Japan, Product Sales were up by 8% (down 3% at CER), reflecting exchange rate impact and the mandated biennial price cuts. We had volume growth of about 2%. Our three biggest medicines,Crestor, Nexium andSymbicort, continued to perform well, butCrestor Product Sales were impacted by inventory reductions at our local marketing partner. | | Emerging Markets growth mainly driven byBrilinta, Forxiga and our Respiratory franchise. China represented just under half of the total Emerging Markets Product Sales in 2016. |
| | | | | | |
| | | | | | |
| | | | | | |
| | | | | | |
Return to growth from page 48 | | Therapy Area Review from page 23 | | Geographical Review from page 226 | | |
| | |
| AstraZenecaAnnual Report and Form 20-F Information 2016 | | 17 |
Strategic Report | Strategy
Strategy and key performance indicatorscontinued
| | |
Be a great place to work | |  |
| | | | | | |
Strategic priorities | | Key performance indicators | | | | |
Evolve our culture Work to improve our employees’ identification with our Purpose and Values and promote greater understanding of and belief in our strategy. Invest in and implement tailored leadership development programmes. Simplify our business Develop simpler, more efficient processes and flatten our organisational structure to encourage accountability and improve decision making and communication. Attract and retain the best talent Accelerate efforts to attract diverse, top talent with new capabilities. | | Employee belief in our strategy 80% 
This is a key indicator of employee engagement. Decline reflects impact of reshaping the business. 1 Source: December 2016 Pulse survey across a sample of the organisation. 2 Source: January 2016 Pulse survey across a sample of the organisation. 3 Source: Global FOCUS all-employee survey. | | Organisational structure – percentage of employees within six management steps of the CEO 82% 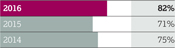
This is a key indicator of our progress in organisational efficiency, through improved decision making, driving accountability to the right level and improving communication flow. | | Employees who would recommend AstraZeneca as a great place to work 74% 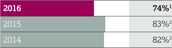
This is a key indicator of whether employees believe AstraZeneca is a great place to work. Decline reflects impact of reshaping the business. 1 Source: December 2016 Pulse survey across a sample of the organisation. 2 Source: January 2016 Pulse survey across a sample of the organisation. 3 Source: Global FOCUS all-employee survey. |
| |
 Be a great place to work from page 52 Employees from page 54 Be a great place to work from page 52 Employees from page 54 |
| | |
Do business sustainably | |  |
| | | | | | |
Strategic priorities | | Key performance indicators | | | | |
Deliver business success over the long term Deliver our business strategy in a way that delivers wider benefits to society and the planet. Focus on: > maintaining ethics and transparency in everything we do > increasing access to healthcare for more people > minimising the environmental impact of our products and processes. Align our work with the UN Sustainable Development Goals and work to integrate our commitments into day-to-day business activities. | | Dow Jones Sustainability Index ranking 86% 
Met the target of maintaining position in the Dow Jones Sustainability World and Europe Indexes comprising the top 10% of the largest 2,500 companies with a score of 86%. | | Screening, diagnosis and treatment of hypertension as part of Healthy Heart Africa programme 2 million Patients 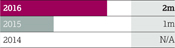
Healthy Heart Africa was launched in October 2014. By the end of 2016, we had conducted over two million hypertension screenings in the community and healthcare facilities. | | Operational carbon footprint1 1,657kt CO2e 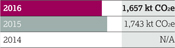
Our 2016 operational carbon footprint met our target emission of 1,708 kt CO2e and represents a 5% reduction from our 2015 baseline. ¹ Operational carbon footprint is emissions from all Scope 1, 2, and selected Scope 3 sources. See page 231. |
| | |
| Sustainability from page 43 | | Note: Confirmed breaches of external sales and marketing codes or regulations globally is no longer regarded as a KPI. However, this information is reported on page 52 of the Annual Report. |
| | |
| 18 | | AstraZenecaAnnual Report and Form 20-F Information 2016 |
| | |
| Achieve Group financial targets | |  |
| | | | | | |
Strategic priorities | | Key performance indicators | | | | |
Drive on-market value Invest in R&D and on-market Growth Platforms to return to growth. Our aim is to deliver industry-leading productivity by restructuring to create scope for investment and a flexible cost base. Maintain a progressive dividend Policy is to maintain or grow dividend per share. Maintain a strong balance sheet Target a strong, investment-grade credit rating, operational cash balance and periodic share repurchases. | | Total Revenue1 $23,002m 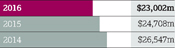
Actual growth CER growth 2016 -7% 2016 -5% 2015 -7% 2015 +1% 2014 +3% 2014 +5% | | Net cash flow from operating activities $4,145m 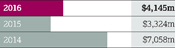
Actual growth 2016 +25% 2015 -53% 2014 -5% | | Dividend per share1 $2,80 
|
| | Total Revenue comprised Product Sales of $21,319 million (down by 10% at actual rate of exchange and 8% at CER) and Externalisation Revenue of $1,683 million (up by 57% at actual rate of exchange and 59% at CER). Decline in Total Revenue at actual exchange rates reflected the particular weakness of key trading currencies against the US dollar. 1 As detailed on page 142, Total Revenue consists of Product Sales and Externalisation Revenue. | | Cash generated from operating activities improved cash management performance and one-off tax refunds. | | Dividend is consistent with the progressive dividend policy pursuant to which the Board intends to maintain or grow the dividend each year. 1 First and second interim dividend for the year. |
| | Reported EPS $2.77 
Actual growth CER growth 2016 +24% 2016 +9% 2015 +128% 2015 +137% 2014 -52% 2014 -34% | | Core EPS $4.31 
Actual growth CER growth 2016 +1% 2016 -5% 2015 0% 2015 +7% 2014 -15% 2014 -8% | | |
| | | Reported EPS of $2.77 represented growth of 24% (9% at CER). This included a gain of $0.76 on the revaluation of acquisition-related liabilities. | | Core EPS increased by 1% (decreased 5% at CER), driven by the same rate of decline in Total Revenue at CER. . | | |
| | | | | | |
| | | | |
| Financial Review from page 62 | | | | | | |
| | |
| AstraZenecaAnnual Report and Form 20-F Information 2016 | | 19 |
Strategic Report | Strategy
Risk overview
Principal Risks
We face a diverse range of risks and uncertainties and this table provides insight into the Principal Risks that could have a materially adverse effect on the business or results of operations. We outline why effective management of these risks is important and relevant to the business, how we are managing them and which risks are rising, falling or have remained static during the past 12 months.
Our approach to risk management is designed to encourage clear decision making on which risks we take and how we manage these risks. Fundamental to this process is a sound understanding of every risk’s potential strategic, commercial, financial, compliance, legal and reputational implications.
| | | | | | |
| | | | |
Risk category and Principal Risks | | | | Context/potential impact | | |
| | | |
Product pipeline and intellectual property | | | | | | |
| | | |
| Delivery of pipeline and new products | |  | | The development of any pharmaceutical product candidate is a complex, risky and lengthy process involving significant financial, R&D and other resources. A project may fail or be delayed at any stage of the process due to a number of factors, which could reduce our long-term growth, revenue and profit | | |
| | | |
Meet quality, regulatory and ethical drug approval and disclosure requirements | |  | | Delays in regulatory reviews and approvals impact patients and market access, and can materially affect our business or financial results | | |
| | | |
| Secure and protect product IP | |  | | Discovering and developing medicines requires a significant investment of resources. For this to be a viable investment, through generation of sufficient revenues, new medicines must be safeguarded from being copied with a reasonable amount of certainty for a reasonable amount of time | | |
| | | |
Commercialisation | | | | | | |
| | | |
| Externally driven demand, pricing, access and competitive pressures | |  | | Operating in over 100 countries, we are subject to political, socio-economic and financial factors both globally and in individual countries. There can be additional pressure from governments and other healthcare payers on medicine prices and sales in response to recessionary pressures, reducing our revenue, profits and cash flow | | |
| | | |
| Quality and execution of commercial strategies | |  | | If commercialisation of a product does not succeed as anticipated, or its rate of sales growth is slower than anticipated, there is a risk that we may not be able to fully recoup the costs in launching it | | |
| | | |
Supply chain and business execution | | | | | | |
| | | |
| Maintain supply of compliant, quality product | |  | | Delays or interruptions in supply can lead to recalls, product shortages, regulatory action, reputational harm and lost sales | | |
| | | |
| Information technology and data security and privacy | |  | | Significant disruption to our IT systems, cybersecurity incidents including breaches of data security, or failure to integrate new systems, could harm our reputation and materially affect our financial condition or results of operations. This could lead to regulatory penalties or non-compliance with laws and regulations | | |
| | | |
| Delivery of gains from productivity initiatives | |  | | Inappropriately managed initiatives could lead to low employee engagement and reduced productivity, increased absence and attrition levels, or even industrial action. All could adversely impact the value of the initiative | | |
| | | |
Attract, develop, engage and retain talented and capable employees at all levels | |  | | Failure to attract and retain highly skilled personnel may weaken our succession plans for critical positions in the medium term. Failure to engage our employees could impact productivity and turnover. Both could adversely affect the achievement of our strategic objectives | | |
| | | |
Legal, regulatory and compliance | | | | | | |
| | | |
| Safety and efficacy of marketed products | |  | | Patient safety is very important to us and we strive to minimise the risks and maximise the benefits of our medicines. Failure to do this could adversely impact our reputation, our business and the results of operations, and could lead to product liability claims | | |
| | | |
| Defence of product, pricing and practices litigation | |  | | Investigations or legal proceedings could be costly, divert management attention or damage our reputation and demand for our products. Unfavourable resolutions could subject us to criminal liability, fines or penalties, adversely affecting our financial results | | |
| | | |
Meet regulatory and ethical expectations on commercial practices, including bribery and corruption, and scientific exchanges | |  | | Any failure to comply with applicable laws, rules and regulations, including bribery and corruption legislation, may result in civil and/or criminal legal proceedings and/or regulatory sanctions, fines or penalties, impacting financial results | | |
| | | |
Economic and financial | | | | | | |
| | | |
| Achieve strategic plans and meet targets and expectations | |  | | Failure to successfully implement our business strategy may frustrate the achievement of our financial or other targets or expectations. This failure could, in turn, damage our reputation and materially affect our business, financial position or results of operations | | |
| | |
| 20 | | AstraZenecaAnnual Report and Form 20-F Information 2016 |
| | | | | | | | | | | | | | |
| | Strategy key | | | | | | Trend key | |  Further information on our key risk management and assurance processes can be found in Risk from pages 214 to 225 which also includes a description of circumstances under which principal and other risks and uncertainties might arise in the course of our business and their potential impact Further information on our key risk management and assurance processes can be found in Risk from pages 214 to 225 which also includes a description of circumstances under which principal and other risks and uncertainties might arise in the course of our business and their potential impact
|
| | 
| | Achieve scientific leadership | | 
| | Be a great place to work | | 
| | Increasing risk | |
| | 
| | Return to growth | | 
| | Achieve Group financial targets | | 
| | Decreasing risk | |
| | | | | | | | | |  | | Unchanged | |
| | | | | | | | | | | | | |
| | | | | | | | | | | | | |
| | | | | | | | | | | | | |
| | | | | | | | | | | | | |
| | | | | | |
| | Management actions | | Trend versus prior year |
| | | | | | |
| | | |
| | | > Prioritise and accelerate our pipeline > Strengthen pipeline through acquisitions, licensing and collaborations > Focus on innovative science in three main therapy areas | | 
| | Increasing importance of pipeline contribution given loss of exclusivity on key brands |
| | | |
| | | > Quality management systems incorporating monitoring, training and assurance activities > Collaborating with regulatory bodies and advocacy groups to monitor and respond to changes in the regulatory environment, including revised process, timelines and guidance | | 
| | |
| | | |
| | > Active management of IP rights | |
| | |
| | | | | | |
| | | |
| | > Focus on Growth Platforms > Demonstrating value of medicines/health economics > Global footprint > Diversified portfolio | |
| | Global economic and political conditions placing downwards pressure on healthcare pricing and spending, and therefore on revenue |
| | | | |
| | | > Focus on Growth Platforms > Accelerate and risk share through business development and strategic collaborations and alliances | |
| | Loss of exclusivity on key brands increases challenge to achieve our short- to medium-term targets |
| | | | | | |
| | | |
| | > Business continuity and resilience initiatives, disaster and data recovery and emergency response plans > Establishment of new manufacturing facilities, creating capacity and technical capability to support new product launches, particularly biologics > Contingency plans including dual sourcing, multiple suppliers and stock levels > Quality management systems | |
| | Supply chain evolving to incorporate new supply chains and to support product launches |
| | | | |
| | > Disaster and data recovery plans > Strategies to secure critical systems and processes | |
| | Several key transformational programmes involving large IT-related aspects |
| | | | |
| | | > Appropriate project governance structure and oversight > Regular review of strategic initiatives by appropriate senior executive and Board level committees | |
| | Ongoing restructuring projects |
| | | |
| | | > Evolve our culture > Focus on simplification > Development of our employees | |
| | Ongoing restructuring projects |
| | | | | | |
| | | |
| | | > Robust processes and systems in place to manage patient safety and efficacy trends as well as externally reported risks through regulatory agencies and other parties. This includes a comprehensive pharmacovigilance programme supplemented by close monitoring and review of adverse events | |
| | The number of new products in our marketed portfolio is growing and is anticipated to increase further as our pipeline develops. Our ability to accurately assess the safety and efficacy of new products is inherently limited due to relatively short periods of product testing and relatively small clinical study patient samples |
| | | |
| | | > Combined internal and external counsel management | | | | |
| | | |
| | | > Strong ethical and compliance culture > Established compliance framework in place including annual Code of Conduct training for all employees > Focus on due diligence and oversight of third party engagements > Established new requirements on providing appropriate information about our products > Established sustainability framework in place including a refreshed sustainability strategy for 2016 | |
| | Increasing government and regulatory scrutiny and evolving compliance challenges as complexity of business relationships increases |
| | | | | | |
| | | |
| | | > Focus on Growth Platforms and innovative science in three main therapy areas > Strengthen pipeline through acquisitions, licensing and collaborations > Appropriate capital structure and balance sheet > Portfolio-driven decision making process governed by senior executive-led committees | |
| | Increasing challenge to balance long- and short-term investments as we navigate a period of loss of exclusivity on key brands |
| | |
| AstraZenecaAnnual Report and Form 20-F Information 2016 | | 21 |
Strategic Report | Strategy
Risk overviewcontinued
Managing risk
We work to ensure that we have effective risk management processes in place to support the delivery of our strategic priorities. This enables us to meet the expectations of our stakeholders and upholds our Values. We monitor our business activities and external and internal environments for new, emerging and changing risks to ensure that these are managed appropriately.
The Board believes that existing processes provide it with adequate information on the risks and uncertainties we face. Details of these risks and the potential impacts on our business are contained on pages 214 to 225. The Board defines those risks which have a potential to have a material impact on our business or results of operations as our Principal Risks.
Risk management embedded in business processes
We strive to embed sound risk management in our strategy, planning, budgeting and performance management processes.
The Board defines the Group’s risk appetite, enabling the Group, in both quantitative and qualitative terms, to judge the level of risk it is prepared to take in achieving its overall objectives. The Board expresses the acceptable levels of risk for the Group using three key dimensions. These are: (i) earnings and cash flow; (ii) return on investment; and (iii) ethics and reputation. Annually, the Group develops a detailed three-year bottom-up business plan and 10-year long-range projection to support the delivery of its strategy. The Board considers these in the context of the Group’s risk appetite. Adjustments are made to the plan or risk appetite to ensure they remain aligned. Our risk management approach is aligned to our strategy and business planning processes. We cross-check financial risks and opportunities identified through the business planning process and integrate our findings into the overall risk management reporting. Line managers are accountable for identifying and managing risks and for delivering business objectives in accordance with the Group’s risk appetite.
The Senior Executive Team (SET) is required by the Board to oversee and monitor the effectiveness of the risk management
processes implemented by management. Within each SET function, leadership teams discuss the risks the business faces. Every year, we map these risks to AstraZeneca’s risk ‘taxonomy’. This process provides a Group-wide assessment for the Board, Audit Committee and SET. Quarterly, each SET function assesses changes to these risks, new and emerging risks, and mitigation plans. These are assimilated into a Group Risk Report for the Board, Audit Committee and SET. Supporting tools are in place to assist risk leaders and managers in managing, monitoring and planning for risk and we continue to work on developing our risk management standards and guidelines. Global Compliance, Finance and Internal Audit Services support SET by advising on policy and standard setting, monitoring and auditing, communication and training, as well as reporting on the adequacy of line management processes as they apply to risk management.
We have a business resilience framework which governs our ability to prevent or quickly adapt to situations while maintaining continuous business operations and safeguarding our people, processes and reputation. Within this we have business continuity plans to address situations in which specific risks have the potential to severely impact our business. These plans include training and crisis simulation activities for business managers.
| | |
| | More information about our Global Compliance function and the Code of Conduct can be found in the Corporate Governance Report from page 90 |
Viability statement
In accordance with provision C.2.2 of the 2014 UK Corporate Governance Code, the Board has determined that a three-year period to 31 December 2019 constitutes an appropriate period over which to provide its viability statement.
The Board considers annually and on a rolling basis, a three-year bottom-up detailed business plan. The Board also considers a 10-year long-range projection but, given the inherent uncertainty involved, believes that the three-year statement presents readers of the Annual Report with a reasonable degree of assurance while still providing a longer-term perspective.
The three-year detailed business plan recognises the significant political uncertainty arising from Brexit, the US presidential election result and elections in other key markets. Risks to the sales and cost forecasts are identified at a market and SET function level. The plan is used to perform central net debt and headroom profile analysis. This analysis considers a severe but plausible downside scenario incorporating the Principal Risks such as market pricing and access, delivery of pipeline and loss of IP. The resilience of the Group to absorb further Principal Risk events such as regulatory/litigious fines and the need to meet pension fund obligations has also been analysed. The Group has adequate resilience against these and the other Principal Risks due to our diversified product portfolio; our global footprint; our robust supply infrastructure; our access to external financing, which includes committed facilities; and our ability to manage our cost base.
Based on the results of this analysis, the Directors have a reasonable expectation that the Company will be able to continue in operation and meet its liabilities as they fall due over the three-year period of their assessment.
Brexit
On 23 June 2016, the UK held a remain-or-leave referendum on the UK’s membership within the EU, the outcome of which was a decision for the UK to exit from the EU (Brexit). A process of negotiation will likely determine the future terms of the UK’s relationship with the EU, as well as whether the UK will be able to continue to benefit from the EU’s free trade and similar arrangements. Until the Brexit negotiation process is initiated and completed, it is difficult to anticipate the potential impact on AstraZeneca’s market share, sales, profitability and results of operations. The Group operates from a global footprint and retains flexibility to adapt to changing circumstances. The uncertainty before, during and after the period of negotiation is also expected to increase volatility and may have an economic impact, particularly in the UK and Eurozone. The Board reviews the potential impact of Brexit as an integral part of its Principal Risks (as outlined on page 20) rather than as a stand-alone risk. As the process of Brexit evolves, the Board will continue to assess its impact.
| | |
| 22 | | AstraZenecaAnnual Report and Form 20-F Information 2016 |
|
Therapy Area Overview and Pipeline |
Our Therapy Area teams are focused on maximising the value of our pipeline for patients and shareholders alike. We adopt a dynamic approach to portfolio management and use business development to supplement our pipeline and our own efforts.
Strategy
We have transformed our drugs portfolio by focusing on three main therapy areas: Oncology, Cardiovascular & Metabolic Disease (CVMD) and Respiratory, while selectively pursuing promising therapies in Autoimmunity, Infection and Neuroscience. Our sales in each of these areas in 2016 are shown in the table below.
We are building value by strengthening our in-line portfolios through commercial excellence, life-cycle management and expansion into new patient populations as well as by translating our late-stage pipeline into differentiated therapies for disease areas with high unmet medical need. We continue to pursue externalisation where it provides an opportunity to focus and enhance our portfolio as well as access capabilities we do not have internally.
We are seeking to expand our comprehensive Respiratory portfolio to meet the needs of asthma and COPD patients across the severity spectrum of these diseases. Building on an ICS/LABA foundation withSymbicort, we are evolving our mono- and fixed-dose combination therapies as well as optimising our delivery device platforms.
In CVMD, we are expanding our portfolio into the cardiovascular-renal area with late-stage assets such as ZS-9 and roxadustat, as well as investing to explore the potential benefits of our SGLT2 and GLP-1 franchises in chronic kidney disease (CKD) and heart failure (HF).
We have completed the transformation of our Oncology portfolio where we are balancing our efforts across four disease areas – lung, ovarian, breast and haematology – and investing in immuno-oncology (IO) which has the potential to benefit patients in multiple tumour types and different lines of therapy.
As we invest in our main therapy areas we continue to build upon our strong commercial and medical capabilities to ensure that our medicines reach the patients who need them most.
Development pipeline
As shown in the table overleaf, our pipeline includes 132 projects, of which 120 are in the clinical phase of development, and we are making significant progress in advancing our late-stage programmes through regulatory approval with 14 NME or major LCM regulatory submissions during 2016, and 11 major approvals. At the end of 2016, we had 12 NME projects in pivotal studies or under regulatory review compared with 15 at the end of 2015. 15 NMEs progressed to their next phase of development, 22 projects were discontinued in 2016, 17 for poorer than anticipated safety and efficacy results, four as a result of strategic shift in the environment or portfolio prioritisation, and one because of a change in regulatory requirements.
Our products
While this Therapy Area Review concentrates on our key marketed products, many of our other products are crucial to our business in certain countries in Emerging Markets.
For more information on our potential new products and product life-cycle developments, please see the Therapy Area pipeline tables on pages 26, 31, 36 and 38 and the Development Pipeline table from page 204. For information on Patent Expiries of our Key Marketed Products, please see from page 211.
Indications for each product described in this Therapy Area Review may vary among countries. Please see local prescribing information for country-specific indications for any particular product.
For those of our products subject to litigation, information about material legal proceedings can be found in Note 28 to the Financial Statements from page 185.
Details of relevant risks are set out in Risk from page 214.
Partnering
As outlined in Strategy and key performance indicators from page 16, business development, specifically partnering, is an important element of our business. It supplements and strengthens our pipeline and our efforts to achieve scientific leadership. We partner with others around the world, including academia, governments, industry, scientific organisations and patient groups to access the best science to stimulate innovation and accelerate the delivery of new medicines to target unmet medical need. We currently have more than 600 collaborations around the world.
Global Product Sales by therapy area
| | | | | | | | | | | | | | | | | | | | | | | | | | | | | | | | | | | | | | | | |
| | | | | | | | | 2016 | | | | | | | | | | | 2015 | | | | | | | | | | | 2014 | |
| | | Sales $m | | | Actual growth % | | | CER growth % | | | | | Sales $m | | | Actual growth % | | | CER growth % | | | | | Sales $m | | | Actual growth % | | | CER growth % | |
| Oncology | | | 3,383 | | | | 20 | | | | 20 | | | | | | 2,825 | | | | (7 | ) | | | 7 | | | | | | 3,027 | | | | (5 | ) | | | (2 | ) |
| Cardiovascular & Metabolic Disease | | | 8,116 | | | | (14 | ) | | | (13 | ) | | | | | 9,489 | | | | (3 | ) | | | 4 | | | | | | 9,802 | | | | 11 | | | | 12 | |
| Respiratory | | | 4,753 | | | | (5 | ) | | | (3 | ) | | | | | 4,987 | | | | (2 | ) | | | 17 | | | | | | 5,063 | | | | 8 | | | | 10 | |
| Other Disease Areas | | | 5,067 | | | | (20 | ) | | | (19 | ) | | | | | 6,340 | | | | (23 | ) | | | (16 | ) | | | | | 8,203 | | | | (9 | ) | | | (7 | ) |
| Total | | | 21,319 | | | | (10 | ) | | | (8 | ) | | | | | 23,641 | | | | (9 | ) | | | (1 | ) | | | | | 26,095 | | | | 1 | | | | 3 | |
| | |
| AstraZenecaAnnual Report and Form 20-F Information 2016 | | 23 |
Strategic Report | Therapy Area Review
Therapy Area Overview and Pipelinecontinued
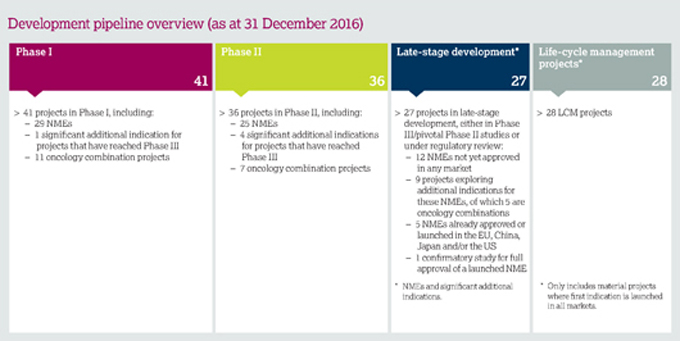
More generally, our business development activity takes many forms and can be broadly grouped into:
| > | | alliances, collaborations and acquisitions to enhance our portfolio and pipeline in our main therapy areas |
| > | | externalisation activity to maximise the value of our assets |
| > | | divestments of non-priority medicines. |
We continue to assess opportunities to make strategic, value-enhancing additions to our portfolio and pipeline in our main therapy areas, including through in-licensing and acquisitions. Acquisitions completed during 2016 included the acquisition of Takeda’s respiratory portfolio, in May, and the acquisition of a controlling equity position in Acerta Pharma, in February, both of which were signed in 2015.
Over the past three years, we have completed more than 270 major or strategically important business development transactions, including some 80 in 2016. Of these transactions, 55 were related to pre-clinical assets or programmes and 11 to PHC and biomarkers. 17 transactions helped expand our biologics capabilities.
Externalisation is a core component of our strategy and has an important role to play in the delivery of our ambition as we continue to sharpen our focus on developing key assets within our main therapy areas.
This activity creates additional value from our existing medicines as well as recurring Externalisation Revenue and falls broadly into two categories: (a) collaborations that help us access therapy area expertise and (b) collaborations that help us increase the number of patients and the reach of medicines in which we maintain an ongoing interest, but which sit outside our main therapy areas.
Examples of collaborations that help us access therapy area expertise include:
| > | | in Alzheimer’s disease through our partnership with Lilly for the BACE inhibitor |
| > | | in dermatology through our agreements with Valeant and LEO Pharma for brodalumab and LEO Pharma for tralokinumab |
| > | | in haematology through our collaboration with Celgene for durvalumab. |
In each case we are optimising the long-term value of each medicine through the collaboration.
Examples of collaborations that help us increase our reach to a greater number of patients includePlendil, an established cardiovascular medicine, and the anaesthetics portfolio. We partnered with Aspen on our anaesthetics portfolio, as a company with established expertise who can dedicate the right resources to
grow the business, while we retain a significant proportion of the value, which we also book as Externalisation Revenue.
Alongside these externalisation opportunities, we also divest medicines that sit outside our main therapy areas and that can be deployed better by a partner, in order to redirect investment and resource in our main areas of focus while ensuring continued or expanded patient access. For example, in 2016, we sold to Pfizer the commercialisation and development rights to our late-stage small molecule antibiotics business in most markets outside the US. The agreement reinforces our focus on developing transformational medicines in our three main therapy areas, while realising value through Pfizer’s dedicated commercialisation and development capabilities in anti-infectives.
The resulting revenue from these activities supports our R&D investments in our main therapy areas. Ten transactions that contribute to Externalisation Revenue and a further nine divestments or out-licences were completed in 2016.
| | |
 | | More information on our partnering activity in 2016 can be found in subsequent sections of this Therapy Area Review, Business Review from page 42, Financial Review from page 62 and Note 25 to the Financial Statements from page 173 |
| | |
| 24 | | AstraZenecaAnnual Report and Form 20-F Information 2016 |
| | |
| AstraZenecaAnnual Report and Form 20-F Information 2016 | | 25 |

Oncologycontinued
Following the science of oncology
More than eight million lives are lost every year to cancer. Even as R&D continues to push boundaries in how we understand and fight cancer, there is still more to do. At AstraZeneca, we are committed to advancing the science of oncology to deliver life-changing medicines to people most in need.
Our strategic priorities
In Oncology, our vision is to respond to unmet medical need by redefining the cancer treatment paradigm. We are doing this through scientific innovation, accelerated clinical programmes and collaboration. We have a strong heritage – more than 40 years – in developing cancer drugs. By the end of 2016, several submissions were underway and we aim to deliver at least four new cancer therapies, in addition toLynparza and Tagrisso, and 12 new line extensions by 2020. In 2015, we decided to consider all new Oncology launches, includingLynparza, Iressa (US) andTagrisso, as our sixth Growth Platform, under the designation of New Oncology.
Our broad pipeline of next-generation medicines is focused on four main disease areas: breast, ovarian, lung and haematological cancers, using four key scientific approaches: immunotherapy, tumour drivers and resistance mechanisms, DNA damage response, and antibody-drug conjugates.
| | | | |
Oncology – pipeline progressions |
Regional approvals | | | | Tagrisso – lung cancer (EU, JP) and ctDNA blood test (US, JP)* |
Expedited review | | | | Breakthrough Therapy Designation: durvalumab – bladder cancer (US) Orphan Drug Designation: acalabrutinib – blood cancers (EU); selumetinib – thyroid cancer (US) Fast Track Designation:Lynparza – ovarian cancer (2nd line) (US), prostate cancer (2nd line) (US) Priority Review Designation:Tagrisso (CN); durvalumab – bladder cancer (US) |
Regulatory submissions | | | | Faslodex – breast cancer (1st line) (US, EU, JP) Tagrisso – lung cancer (CN) Tagrisso – lung cancer (AURA3 study for full approval) (US, EU) Durvalumab – bladder cancer (US) |
Phase III investment decisions | | | | Savolitinib – papillary renal cell carcinoma Durvalumab+tremelimumab – hepatocellular carcinoma |
| Phase II starts/progressions | | | | In collaboration with Celgene, the combination ofVidaza and durvalumab for the treatment of acute myeloid leukaemia and CC486+durvalumab for myelodysplastic syndromes; MEDI0680+durvalumab for solid tumours; MEDI0562 (humanised OX40) for solid tumours; AZD6738+Lynparza for gastric cancer; AZD1775 (Wee1) for solid tumours; daratumumab+durvalumab for multiple myeloma; in collaboration with Incyte, epacadostat (IDO)+durvalumab for solid tumours |
Strategic transactions completed | | | | Acquisition of majority stake in Acerta Pharma providing access to acalabrutinib |
Setbacks and terminated projects | | | | FDA placed and subsequently lifted a partial clinical hold on the enrolment of new patients with head and neck squamous cell carcinoma (HNSCC) for clinical trials of durvalumab Tremelimumab DETERMINE,Lynparza GOLD, selumetinib SELECT-1 trials failed to meet primary endpoint; voluntarily withdrew the marketing authorisation application submitted to the EMA for cediranib in advanced ovarian cancer The following clinical programmes were discontinued: inebilizumab for diffuse large B-cell lymphoma; MEDI3617 for solid tumours; inebilizumab (MEDI-551) + rituximab for haematological malignancies; AZD5312 for solid tumours; AZD8835 for solid tumours;Tagrisso + durvalumab (CAURAL)>2nd-line advanced EGFRm T790M NSCLC; MEDI6383 for solid tumours; durvalumab+ MEDI6383 for solid tumours; MEDI0639 for solid tumours |
*Roche holds licence for ctDNA blood test; collaborative effort between Roche and AstraZeneca to secure approval. |
Therapy area world market
(MAT/Q3/16)
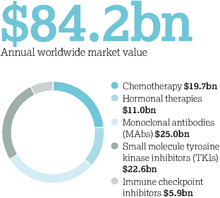
Four key scientific platforms are driving our efforts to discover new cancer treatments:
| > | Immunotherapy: Our ambition is to be a scientific leader in immunotherapy, a promising therapeutic approach that harnesses the patient’s own immune system to help fight cancer. We are working to understand how cancer evades the immune system and to identify approaches that enhance the immune system’s ability to fight cancer. |
| > | Tumour drivers and resistance mechanisms: Potent inhibition of genetic disease drivers is a clinically validated approach to shrink tumours and improve progression-free survival. Tumours, however, eventually develop resistance to these therapies. Our programmes seek to develop therapies that target resistance mechanisms and the mutations that cause cancer cells to proliferate. |
| > | DNA damage response: Exploiting mechanisms that selectively damage tumour cell DNA is another clinically validated approach to shrink tumours and improve progression-free survival. Our programmes focus on identifying and exploiting vulnerabilities unique to tumour cells to kill the tumour cells while minimising toxicity to the patient. |
| > | Antibody-drug conjugates: The use of antibody-drug conjugates (ADC) is a clinically validated, highly potent approach that selectively targets cancer cells. We seek to combine innovative antibody engineering capabilities with cytotoxic drug molecules to attack and kill the tumour while minimising toxicity to the patient. |
| | |
| 26 | | AstraZenecaAnnual Report and Form 20-F Information 2016 |

Our marketed products
| | > | Casodex/Cosudex (bicalutamide) |
| | > | Nolvadex (tamoxifen citrate) |
| | > | Zoladex (goserelin acetate implant) |
| |  | Full product information on page 211 |
We are also focused on identifying and developing combination therapies. Our immuno-oncology portfolio, which we believe is one of the most comprehensive in our industry, enables us to explore and exploit scientific and biological synergies to pursue combinations that improve outcomes and maximise patient benefit.
Our 2016 focus
In total, our marketed Oncology products generated sales of $3.4 billion worldwide in 2016. Sales from our New Oncology Growth Platform, totalled $0.7 billion in 2016, an increase of 458% at actual rate of exchange (450% at CER) over 2015 ($0.1 billion). We continue to explore ways to maximise the benefit of our medicines for patients.
Tagrisso is the first approved epidermal growth factor receptor tyrosine kinase inhibitor (EGFR-TKI) indicated for patients with metastatic EGFR T790M mutation-positive non-small cell lung cancer (NSCLC). This indication was approved in November 2015 under the FDA’s Accelerated Approval Programme based on tumour response rate and duration of response. Full approval for this indication is dependent on verification and description of clinical benefit in the confirmatory trial, AURA3, for which positive results were presented in December. The EMA and FDA accepted the AURA3 submission in October and November respectively, and the FDA has granted it a Priority Review.
In February 2016,Tagrisso was approved by the EMA for the treatment of adult patients with locally advanced or metastatic EGFR T790M mutation-positive NSCLC. In March 2016, it was approved in Japan and, by the end of 2016,Tagrisso had received regulatory approval in more than 40 countries. In September 2016, the FDA approved a blood-based companion diagnostic test for use withTagrisso. This clinically-validated companion diagnostic test uses either tissue or a blood sample to confirm the presence of a T790M mutation in patients. Japan approved the same test in December 2016.
Iressa was the first EGFR-TKI to be approved in advanced NSCLC and, as of 31 December 2016, had been approved in 90 countries. Indicated for the treatment of advanced EGFR mutation NSCLC, it is the leading EGFR-TKI outside the US. Iressareceived approval in the US in July 2015.
Lynparza is an oral poly ADP ribose polymerase (PARP) inhibitor available to patients in 31 countries for the treatment of adult patients with BRCA-mutated high-grade serous epithelial ovarian, fallopian tube or primary peritoneal cancer. In October 2016, AstraZeneca announced positive high level results of SOLO-2, a Phase III randomised, double-blind, placebo-controlled, multicentre study ofLynparza maintenance monotherapy in platinum sensitive relapsed BRCA gene-mutated ovarian cancer patients who are in complete or partial response following platinum-based chemotherapy. Data from SOLO-2 could form the core Phase III component for an FDA NDA submission, a Japan NDA submission and an EU variation to the MAA in 2017.
Faslodex 500mg is approved in more than 80 countries, including the EU, the US and Japan. In March 2016, the FDA approved a new indication expanding the use ofFaslodex, in combination with palbociclib (Pfizer), for the treatment of women with hormone receptor-positive (HR+), human epidermal growth factor receptor 2 negative (HER2-) advanced or metastatic breast cancer whose cancer has progressed after
endocrine therapy. In October 2016, at the European Society of Medical Oncology Congress, we presented positive results of the Phase III FALCON clinical trial comparing the efficacy and safety of Faslodex 500mg withArimidex in the 1st line advanced breast cancer setting (hormone-naïve patients). These positive outcomes will form the basis of a continuous expansion ofFaslodex in metastatic breast cancer.
Details of litigation relating toFaslodex are included in Note 28 to the Financial Statements from page 185.
Zoladex continues to be a significant asset in our on-market portfolio and a driver of our prostate cancer and breast cancer portfolios.
14m
Annual cancer cases are expected to rise from 14 million in 2012 to an estimated 22 million within the next two decades.
Source: WHO Factsheet February 2014 (data from 2012).
| | |
| AstraZenecaAnnual Report and Form 20-F Information 2016 | | 27 |

Oncologycontinued
In the pipeline
Our Oncology pipeline continued to progress in 2016. It now includes 32 NMEs in development. We also expanded several of our projects to incorporate novel combinations and various types of cancer. Some of our projects from each of our platforms are outlined below.
Immuno-oncology franchise
| > | Durvalumab (MEDI4736) is an anti-PD-L1 antibody in Phase III development for NSCLC as a monotherapy and in combination with tremelimumab, an anti-Cytotoxic T-Lymphocyte-Associated protein 4 antibody. The lung cancer programme includes studies in the 1st line, 2nd line and 3rd line setting. Additional registration studies are progressing in head and neck squamous cell carcinoma (1st and 2nd line), and bladder cancer (1st line). The development programme also includes additional Phase I and Phase II studies in a broad range of solid tumours and an extensive range of combination programmes. In February 2016, durvalumab was granted Breakthrough Therapy Designation by the FDA for the treatment of patients with PD-L1 positive inoperable or metastatic urothelial bladder cancer and, in December 2016, it was additionally granted Priority Review status with a Prescription Drug User Fee Act set for the second quarter of 2017. |
| > | MEDI0680 is an antiprogrammed cell death protein 1 (PD-1) MAb that may help promote an effective anti-tumour immune response by blocking the interactions between PD-1 and its ligands. It could also improve the intrinsic functionality of T-cells by triggering internalisation of PD-1, a mechanism that may be unique to MEDI0680. MEDI0680 is in Phase I development for solid tumours as a monotherapy and in combination with durvalumab. |
| > | Other immuno-oncology agents in early development include: MEDI6383, a human tumour necrosis factor receptor superfamily, member 4 (OX40) agonist; MEDI9447 targeting ecto-5’-nucleotidase (CD73); and MEDI1873 targeting glucocorticoid-induced tumour necrosis factor receptor-ligand (GITRL). These agents are in Phase I development for a range of solid tumours and have the potential for combination with other molecules in the portfolio. |
Tumour drivers and resistance mechanisms franchise
| > | Tagrisso is a highly selective, irreversible inhibitor of the activating sensitising EGFR mutation and the resistance mutation T790M. The product is being investigated in Phase III studies in the adjuvant setting for the treatment of patients with EGFRm NSCLC and in the advanced setting as a 1st line treatment of EGFRm NSCLC and as a>2nd line treatment of EGFRm T790M NSCLC. Additionally, studies in combination with small molecules are under investigation. |
| > | Selumetinib is a mitogen-activated protein kinase inhibitor in Phase III development for adjuvant differentiated thyroid cancer. In May 2016, selumetinib was granted Orphan Drug Designation by the FDA for differentiated thyroid cancer. In August 2016, the selumetinib Phase III study SELECT-1 in 2nd line KRAS mutant NSCLC failed to meet its primary endpoint of progression-free survival. |
| > | Cediranib is an orally administered multi-Vascular Endothelial Growth Factor receptor (VEGFR) inhibitor which is currently being tested in combination withLynparza in patients with platinum-sensitive relapsed (PSR) ovarian cancer and platinum-resistant/refractory (PRR) ovarian cancer. In September 2016, AstraZeneca made the decision to withdraw the MAA for cediranib in combination with platinum-based chemotherapy followed by maintenance monotherapy for the treatment of adult patients with platinum-sensitive relapsed ovarian cancer (ICON6). |
| > | AZD5363 is a protein kinase B (AKT) inhibitor in Phase II development for breast and prostate cancer. |
| > | Savolitinib (AZD6094) is a hepatocyte growth factor receptor (c-MET) inhibitor. It is in Phase II development for lung and renal cancer. |
| > | Vistusertib (AZD2014) is an inhibitor of the mammalian target of rapamycin serine/ threonine kinase (TORC1, TORC2) and is in Phase II development for the treatment of solid and haematological tumours. |
| > | AZD9496 is a selective oestrogen receptor down-regulator (SERD) in Phase I development for the treatment of breast cancer. |
| > | Acalabrutinib is a Bruton’s tyrosine kinase (BTK) inhibitor in Phase III development in B-cell malignancies and solid tumours. In April 2016, acalabrutinib was designated as an orphan medicinal product by the |
| | EMA for the treatment of chronic lymphocytic leukaemia (CLL)/small lymphocytic lymphoma (SLL), mantle cell lymphoma (MCL) and lymphoplasmacytic lymphoma (Waldenström’s macroglobulinaemia, WM). |
DNA damage response franchise
| > | Lynparza is being evaluated in a broad range of Phase III trials, including BRCAm adjuvant and metastatic breast cancer, gBRCAm pancreatic cancer, gBRCAm ovarian cancer and prostate cancer.Lynparza was granted Breakthrough Therapy Designation by the FDA for treatment of BRCA1/2 or ATM gene- mutated metastatic castration resistant prostate cancer. In May 2016, theLynparza GOLD study in 2nd line gastric cancer failed to meet its primary endpoint of overall survival. In October 2016, results from the Phase III SOLO-2 trial demonstrated a clinically meaningful and statistically significant improvement of progression-free survival (PFS) among patients treated withLynparza tablets (300mg twice daily) compared to placebo and provided additional evidence to support the potential use ofLynparza as a monotherapy for the maintenance treatment of platinum-sensitive relapsed, BRCA-mutated ovarian cancer. |
| > | AZD1775 is a Wee1 inhibitor in Phase II development for ovarian and other solid tumours in combination withLynparza. |
| > | Phase I clinical studies are progressing for the ATR inhibitor AZD6738 (2nd line gastric cancer withLynparza and also in combination with ionising radiation in solid tumours), the ATM inhibitor AZD0156 (for the treatment of gastric and colorectal cancers) and the aurora b kinase AZD2811 (in solid tumours). |
8.2m
Cancer is a leading cause of death worldwide and accounted for 8.2 million deaths in 2012.
Source: WHO Factsheet February 2014 (data from 2012).
| | |
| 28 | | AstraZenecaAnnual Report and Form 20-F Information 2016 |

| | | | |
 | | combination with Incyte’s oral indoleamine dioxygenase-1 (IDO1) inhibitor, epacadostat (INCB24360). We also extended our collaboration with Moderna to discover, co-develop and co-commercialise messenger RNA (mRNA) therapeutic candidates for the treatment of a range of cancers. In February 2016, we completed a transaction for a majority equity stake investment in Acerta Pharma. The transaction provides AstraZeneca with a potential best-in-class irreversible oral BTK inhibitor, acalabrutinib (ACP-196), currently in Phase III development for B-cell blood cancers and in Phase I/II clinical trials in multiple solid tumours. In June 2016, we signed a definitive agreement with Foundation Medicine, Inc. to develop a novel companion diagnostic assay forLynparza to support its global development programme. The companion diagnostic seeks to enable physicians to identify those patients most likely to benefit from AstraZeneca’s first-in-class PARP inhibitor. In November 2016, CancerLinQ, a non-profit subsidiary of the American Society of Clinical Oncology, announced a new non-exclusive partnership with AstraZeneca, which will use CancerLinQ Discovery, a groundbreaking offering that aims to provide insights through the analysis of real-world cancer care data. As a ‘Founding Enterprise Partner’, AstraZeneca will be able to gather insights on specific cancer care questions and provide critical input to maximise CancerLinQ Discovery’s utility and usability. 60% More than 60% of the world’s total new annual cancer cases occur in Africa, Asia and Central and South America. These regions account for 70% of the world’s cancer deaths. Source: WHO Factsheet February 2014 (data from 2012). |
| AstraZeneca has been at the forefront of PHC since its inception, with 80% of current investigative molecules using a PHC approach. This research includes investment in understanding the science of PD-L1 protein expression, which plays a role in suppressing the immune system. Testing for expression levels of PD-L1 may help to identify patients most likely to benefit from IO-based cancer therapies. However, choosing between the many PD-L1 diagnostic tests available can be challenging. We embarked on a series of studies to compare the currently available PD-L1 tests across various tumour types, and demonstrated a strong association – concordance – between most of them. This research suggests that the tests might one day be used interchangeably to enable identification of appropriate patients for IO therapies, thereby driving efficiencies in cancer care. | | Antibody-drug conjugates franchise > Moxetumomab pasudotox, an anti-CD22 recombinant immunotoxin, is being investigated in a Phase III study for adult patients with hairy cell leukaemia who have relapsed after, or not responded to, standard therapy. > MEDI4276 is a HER2 bispecific ADC, which entered clinical development for a range of solid tumours. Key Oncology collaborations and transactions Collaboration is key to accessing the best science and technology, achieving scientific leadership and delivering innovative, life-changing medicines. In 2016, we continued to strengthen our portfolio and accelerate clinical programmes through acquisitions and collaborations. In January 2016, we announced a new collaboration with Incyte to evaluate the efficacy and safety of Incyte’s Janus-associated kinase (JAK) 1 inhibitor, INCB39110, in combination withTagrisso. This builds on an existing collaboration between the two companies to explore AstraZeneca’s anti-PD-L1 immune checkpoint inhibitor, durvalumab, in | |
| | | |
| | | |
| | | |
| | | |
| | | |
| | |
| AstraZenecaAnnual Report and Form 20-F Information 2016 | | 29 |


| | | | |
Following the science of cardiovascular and metabolic disease AstraZeneca is following the science to transform how cardiovascular disease (CVD), chronic kidney disease (CKD) and diabetes are understood, interact and impact one another – ensuring the focus of treatment is across cardiovascular and metabolic disease (CVMD) to slow progression and save more lives. Our strategic priorities Our strategic focus is on transformative medicines that address the high unmet medical need in CVMD, including thrombosis (blood clotting), atherosclerosis (hardening of the arteries), dyslipidaemia (abnormal levels of blood lipids), chronic heart failure (CHF), diabetes and CKD. Currently an estimated 17.5 million people die annually from CVD, representing 31% of all global deaths, and CVD is the leading cause of death in people with CKD and people with diabetes. Despite improvements in the diagnosis and treatment of CVMD, unmet medical need, as well as access and affordability challenges, remain high, while co-morbidity is common in patients living with CVMD. | | We are seeking to unlock the scientific potential of our CVMD therapy area by investigating disease causes and progression, supporting our larger objective of innovating to develop novel therapeutic approaches. Our efforts aim to reduce long-term morbidity and mortality, and to ultimately reduce the burden, as well as the human, social and economic costs, of these diseases. Our commitment is demonstrated in both our clinical development and life-cycle management programmes. More than 60,000 patients are participating in our R&D-led cardiovascular trials at more than 6,000 sites worldwide. Our focus on diabetes research includes almost 50 clinical trials worldwide with an enrolment target of 56,000 patients. Our scientific leadership is strengthened by developing cutting edge technologies with our strategic partners: > Participation in the RPC2 consortium (renal precompetitive consortium) formed with the University of Michigan and Lilly to identify new therapeutic targets for the treatment of CKD. > Alliance with Moderna and Professor Ken Chien at the Integrated Cardio Metabolic Centre (ICMC), Karolinska Institutet in Stockholm, Sweden, to identify targets and pathways involved in repairing damaged cardiac muscle. | | Therapy area world market (MAT/Q3/16) $186.8bn Annual worldwide market value 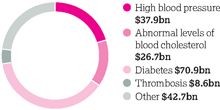
> Collaboration with the Harvard Stem Cell Institute to adapt a technique that creates human beta cells from stem cells in the search for new, transformative treatment options for diabetes. Cardiovascular disease Our 2016 focus Acute coronary syndromes (ACS) is an umbrella term for sudden chest pain and other symptoms due to ischaemia (insufficient blood supply) to the heart. ACS is associated with considerable mortality and morbidity. There is a significant need to improve patient outcomes and reduce treatment costs. Brilinta/Brilique is an oral antiplatelet treatment for ACS. It is approved in over 100 countries, including the US, Canada and Brazil under the trade nameBrilinta, and in the EU, Iceland and Norway under the trade nameBrilique. Since it was first launched in Europe in December 2010, it has been included in 12 major ACS treatment guidelines globally. |
| | | | |
| | | | In February 2016, the European Commission granted marketing authorisation forBrilique for long-term prevention of cardiovascular death, heart attack and stroke for patients with a history of heart attack. The EU approval was based on the results from the PEGASUS TIMI-54 trial, a large-scale outcomes trial involving more than 21,000 patients. |
Cardiovascular & Metabolic Disease – pipeline progressions | |
Regional approvals | | Brilinta/Brilique – post myocardial infarction (EU) and acute coronary syndromes and post myocardial infarction (JP) Qtern (saxagliptin/dapagliflozin) – Type 2 diabetes (EU) | |
| Expedited review | | None | |
| Regulatory submissions | | ZS-9 – hyperkalaemia in response to a CRL (US) | |
| | | DURATION-8 (exenatide+dapagliflozin) (EU) | |
| | | Two further submissions await regulatory acceptance | |
| Phase III investment decisions | | Forxiga– heart failure;Forxiga– chronic kidney disease | |
| Phase II starts/progressions | | MEDI4166 – diabetes/cardiovascular disease; MEDI0382 – diabetes/obesity; AZD4076 – non-alcoholic steatohepatitis | |
| Strategic transactions completed | | Partnering with 3SBio Inc. for commercialisation ofBydureonandByettain China | |
| Setbacks and terminated projects | | BrilintaSOCRATES and EUCLID trials failed to meet primary endpoint; CRL received from FDA for ZS-9 for treatment of hyperkalaemia;Epanova/Farxigacombination discontinued for non-alcoholic steatohepatitis (NASH) | |
| | |
| AstraZenecaAnnual Report and Form 20-F Information 2016 | | 31 |

Cardiovascular & Metabolic Diseasecontinued
Our marketed products
Cardiovascular disease
| | > | Atacand1/Atacand HCT/Atacand Plus(candesartan cilexetil) |
| | > | Brilinta/Brilique (ticagrelor) |
| | > | Crestor2 (rosuvastatin calcium) |
| | > | Imdur3 (isosorbide mononitrate) |
| | > | Seloken/Toprol-XL5 (metoprolol succinate) |
| | > | Zestril7 (lisinopril dihydrate) |
Metabolic disease
| | > | Bydureon (exenatide XR injectable suspension) |
| | > | Byetta (exenatide injection) |
| | > | Farxiga/Forxiga (dapagliflozin) |
| | > | Kombiglyze XR (saxagliptin and metformin HCl) |
| | > | Komboglyze (saxagliptin and metformin HCl) |
| | > | Qtern (saxagliptin/dapagliflozin) |
| | > | Symlin (pramlintide acetate) |
| | > | Xigduo (dapagliflozin and metformin HCI) |
| | > | Xigduo XR (dapagliflozin and metformin HCI) |
 Full product information on page 211
| 1 | Licensed from Takeda Chemicals Industries Ltd. |
| 2 | Licensed from Shionogi. The extension of the global licence agreement with Shionogi forCrestorand the modification of the royalty structure became effective 1 January 2014. |
| 3 | Divested China rights to China Medical Systems Holdings Ltd effective 10 October 2016. |
| 4 | Divested China rights to China Medical Systems Holdings Ltd effective 29 February 2016. |
| 5 | Divested US rights to Aralez Pharmaceuticals Trading DAC effective 4 October 2016. |
| 6 | Divested US rights toTenorminto Alvogen Pharma US Inc. effective 9 January 2015. |
| 7 | Licensed from Merck. Divested US rights toZestrilto Alvogen Pharma US Inc. effective 9 January 2015. |
In March 2016, the SOCRATES trial top-line results were announced. The trial assessed the efficacy ofBrilinta 90mg tablets twice daily when compared to aspirin 100mg once daily in patients with acute ischaemic stroke or transient ischaemic attack. Fewer events were observed onBrilinta versus the comparator in the overall trial population; the trend, however, did not reach statistical significance and the primary efficacy endpoint of time to first occurrence of any event from the composite of stroke (ischaemic or haemorrhagic), myocardial infarction (MI) and death was not met.
In March 2016, the American College of Cardiology (ACC) and American Heart Association (AHA) updated their treatment guidelines for ACS and the duration of dual antiplatelet therapy.Brilinta is now preferred over clopidogrel for the management of patients with ACS who have received a coronary stent and in non-ST Elevation ACS patients treated with medical therapy alone. This update was the first time that the ACC and AHA have recommendedBrilinta over clopidogrel for patients who have experienced an ST-elevation myocardial infarction (STEMI).
The update was also the first US guideline to provide the medical community with insights drawn from the PEGASUS TIMI-54 trial. The guideline supported continuation of P2Y12 platelet inhibitor therapy beyond 12 months in prior MI patients who are not at high bleeding risk.
There were three new treatment guidelines updated in China in the first half of 2016. The ACS Emergency Room Rapid Guideline, Chinese PCI Guideline and the Coronary Artery Bypass Graft Consensus (2016) Guideline. These recommendedBrilinta as ‘first-choice treatment’ over any other platelet inhibitor.
The Japanese Ministry of Health, Labour and Welfare approvedBrilinta 90mg for patients with ACS for whom the use of other antiplatelet medicines in combination with aspirin is difficult.Brilinta 60mg was also approved for patients who have suffered a heart attack at least one year prior and are at high risk of developing a further atherothrombotic event.
In October 2016, the EUCLID Phase III trial in peripheral artery disease (PAD) results were announced.Brilinta did not demonstrate benefit over clopidogrel in a symptomatic PAD patient population and did not meet the primary endpoint of the trial. However, the safety profile observed in both this trial and the SOCRATES trial was consistent with the known safety profile ofBrilinta. Based on the current expectations, it is unlikely that we will seek regulatory submission of an indication in PAD.
Crestor is approved in 109 countries for the treatment of dyslipidaemia and hypercholesterolaemia (elevated cholesterol). The medicine has been shown to effectively lower low-density lipoprotein cholesterol (LDL-C) and achieve LDL-C goals and to increase high-density lipoprotein cholesterol (HDL-C) and reduce atherosclerotic plaque.Crestor faces competition from atorvastatin (Lipitor) and other generic products. The substance patent protectingCrestor in the US expired on 8 January 2016 and the paediatric exclusivity period expired on 8 July 2016. Watson Laboratories, Inc. and Actavis, Inc. began selling generic rosuvastatin in the US in May 2016 as the result of a litigation settlement with AstraZeneca. Details of these matters are included in Note 28 to the Financial Statements, from page 185. Additional manufacturers have made generic rosuvastatin available in the US in 2016, in line with AstraZeneca’s business assumptions.
Epanova (omega-3-carboxylic acids) is the first FDA approved prescription omega-3 fatty acid in free fatty acid form. It has the potential to help patients with severe hypertriglyceridaemia by reducing high triglycerides (TG) levels.Epanova is approved in the US as an adjunct to diet to reduce TG levels in adult patients with severe hypertriglyceridaemia (TG levels³500mg/dL). We remain committed to the launch ofEpanova in the US and other key markets.
| | |
| 32 | | AstraZenecaAnnual Report and Form 20-F Information 2016 |

| | | | | | |
|
| | | | | | |
| | |

| | Our 2016 focus We are focused on redefining the Type 2 diabetes treatment approach and harnessing complementary mechanisms of action, as well as evaluating potential CV outcomes benefit. Our current portfolio is intended to enable combination treatment, and data from our Phase III programmes are expected to further support the outcomes benefit of this new class approach. In 2016, we saw ongoing approvals and launches forFarxiga/Forxiga for the treatment of Type 2 diabetes. Starting with the EU in 2012, it is now approved in over 85 countries. It is under regulatory review in 12 additional countries. Xigduo is approved in 55 countries, including the US withXigduo XR with ongoing approvals in 2017 expected. In 2016, we continued to receive approvals and launch theBydureon Pen in new markets, which is now either approved or launched in 30 countries, including the US, Japan and key European countries. TheBydureon Pen is a pre-filled, single-use pen injector. In the US, we are engaged in patent litigation against multiple generic companies challenging patents listed in the FDA Orange Book with reference toOnglyza, and are awaiting the outcome of a trial that took place in September 2016. 17.5m An estimated 17.5 million people die annually from CV disease, representing 31% of all global deaths. More than three-quarters of these deaths occur in low- to middle-income countries. Source: WHO Factsheet 2016 (data from 2012). |
| | Forxiga/Farxiga is an SGLT2 inhibitor indicated for the treatment of Type 2 diabetes. It is also being investigated in two Phase IIIb outcome trials for the management of CKD and HF in people with and without Type 2 diabetes. This marks the first time a major outcome trial will be conducted to evaluate the effect of an SGLT2 inhibitor in CKD, for which there are currently few treatment options and a significant unmet medical need. Clinical studies PARTHENON is AstraZeneca’s largest ever cardiovascular (CV) outcomes programme involving nearly 80,000 patients. It includes five key studies covering broad patient populations across varying timescales and aims to support four new indications forBrilinta/Brilique over the next four years. Following the SOCRATES and EUCLID trials, which failed to meet primary endpoint, THEMIS is the next major trial, studying the benefit of ticagrelor for the prevention of CV events among Type 2 diabetic patients. The whole programme continues to progress. To better understand the interplay between CKD, CVD and diabetes, AstraZeneca recently announced two Phase IIIb outcomes trials designed to evaluate the potential role of am SGLT2 inhibitor, which is currently indicated for the treatment of Type 2 diabetes, in the management of both CHD and CKD in people with and without Type 2 diabetes. This marks the first time a major outcome trial will evaluate the effect of an SGLT2 inhibitor on CKD. | | We are also committed to further evaluating the clinical profile ofEpanova and identifying other patient groups it may benefit. AstraZeneca continues to advance its large-scale CV outcomes trial, (STRENGTH), STatin Residual risk reduction with EpaNova in hiGh cardiovascular risk paTients with Hypertriglyceridaemia, to evaluate the safety and efficacy ofEpanova on CV outcomes in combination with statin therapy for the treatment of patients with mixed dyslipidaemia who are at increased risk of CV disease. Metabolic and renal diseases Type 2 diabetes is a chronic progressive disease that accounts for more than 90% of diabetes cases worldwide. Disease prevalence continues to grow, particularly among those at a younger age, and many patients require multiple medications. Various oral generic and branded treatments exist and newer classes of treatments continue to enter the market. There are more than 200 million people worldwide living with CKD and AstraZeneca is working to create an innovative standard of care to prevent, treat and manage CKD with a long-term ambition of modifying the disease itself. Complications of CKD, such as hyperkalaemia and anaemia, are associated with significant CV risk plus morbidity and mortality. | |
| | |
| AstraZenecaAnnual Report and Form 20-F Information 2016 | | 33 |
Strategic Report | Therapy Area Review
Cardiovascular & Metabolic Diseasecontinued
422m
The number of people with diabetes has risen from 108 million in 1980 to 422 million in 2014. Diabetes prevalence has been rising more rapidly in middle- and low-income countries.
Source: WHO Factsheet November 2016.
200m
CKD affects an estimated 200 million people worldwide.
Source: Ojo A. ‘Addressing the Global Burden of Chronic Kidney Disease Through Clinical and Translational Research.’ Transactions of the American Clinical and Climatological Association 2015; 125: 229-246.
In July 2016, we also saw the approval ofQtern (a fixed-dose combination of saxagliptin and dapagliflozin) by the European Commission for the treatment of Type 2 diabetes in European markets – the first DPP-4i/SGLT2i combination product to be approved in Europe. The resubmission forQtern in the US was completed and accepted by the FDA, and we anticipate a Prescription Drug User Fee Act date in early 2017.
In September, we saw positive results from the Phase III DURATION-8 trial, demonstrating thatBydureon (exenatide extended-release formulation) 2mg once- weekly in combination withForxiga (dapagliflozin) 10mg once-daily, significantly reduced blood sugar as measured by HbA1c, versus the individual medicines alone in patients with Type 2 diabetes inadequately controlled on metformin.
In the pipeline
The Phase III programme for a once-weekly suspension ofBydureon continues to progress and theBydureon auto-injector is due for submission to the FDA in 2017.
Through our strategic collaboration with FibroGen and Astellas, we continue to develop roxadustat, a potential first-in-class oral hypoxia-inducible factor prolyl hydroxylase inhibitor (HIF-PHI) in Phase III development for the treatment of anaemia in patients with CKD, including those who are dialysis dependent and non-dialysis dependent. Roxadustat is in Phase III in the US, Europe, Japan and China. The Phase III programme consists of 15 studies enrolling more than 7,000 patients worldwide. To date, roxadustat has been studied in over 1,100 subjects in completed Phase I and II studies.
We continue to progress ZS-9 (sodium zirconium cyclosilicate), a treatment for hyperkalaemia being developed by ZS Pharma, a wholly-owned subsidiary of AstraZeneca which was acquired in December 2015.
In May 2016, the FDA issued a complete response letter (CRL) regarding the NDA for ZS-9. The CRL referred to observations arising from a pre-approval inspection at the manufacturing facility and the FDA acknowledged the receipt of recently-
submitted data which it had yet to review. In October 2016, the FDA confirmed acceptance of the NDA resubmission. The resubmission did not require the generation of new data and a regulatory decision is expected in the first half of 2017. Interactions are ongoing with other health authorities in the EU and Australia, where ZS-9 is currently under separate regulatory review. Additional regulatory submissions in other markets are planned for 2017.
Verinurad (RDEA3170) is a potent selective uric acid reabsorption inhibitor that has been in Phase II development as a urate-lowering therapy. We will now progress development of verinurad for CKD in a Phase II trial, which is planned to start during 2017.
| | |
| | For more information please see Financial Review from page 62 |
Clinical studies
The Dapagliflozin Effect on CardiovascuLAR Events (DECLARE) study, a large CV outcomes trial to assess the impact ofFarxiga/Forxigaon CV risk/benefit, when added to a patient’s current diabetes therapy, continued in 2016. The trial was fully enrolled in 2015 with approximately 17,000 adult patients with Type 2 diabetes and is expected to be completed in 2019.
The Exenatide Study of Cardiovascular Event Lowering (EXSCEL) study also continued during 2016. This study, which began in 2010 and is expected to end in 2018, is evaluating the impact ofBydureon, in addition to standard of care, on CV outcomes in patients with Type 2 diabetes.
AstraZeneca and FibroGen continue to investigate roxadustat for the treatment of anaemia in patients with CKD. The OLYMPUS and ROCKIES pivotal studies evaluate roxadustat for the treatment of anaemia in patients with CKD not on dialysis and on dialysis, respectively. The initial data read-out for our sponsored trials is expected to align with the availability of pooled safety data in coordination with our partners, expected in early 2018, and we anticipate a 2018 regulatory filing in the US.
| | |
| 34 | | AstraZenecaAnnual Report and Form 20-F Information 2016 |
| | |
| AstraZenecaAnnual Report and Form 20-F Information 2016 | | 35 |
Respiratorycontinued
Following the science
of respiratory disease
Our 40-year heritage in respiratory medicines is just the beginning of our story. The age of targeted biologics to address the unmet needs of specific patient populations has now arrived in asthma, and AstraZeneca has three biologics in mid- or late-stage development with each one targeting different biologic pathways that play important roles in this heterogeneous disease.
Our strategic priorities
Respiratory is one of AstraZeneca’s main therapy areas, and our medicines reached more than 18 million patients in 2016. We have a strong pipeline with about 22,000 patients involved in clinical trials, and we expect up to four launches of new medicines between 2016 and 2020.
Our work focuses on transforming the treatment of asthma and COPD in three areas: (i) inhaled combinations at the core of care, (ii) biologic medicines for the unmet needs of specific patient populations, and (iii) scientific advancements where our ambition is to achieve disease modification and durable remission. We have considerable capabilities in inhalation technologies, which span both pressurised metered-dose inhalers (pMDIs) and dry powder inhalers (DPIs), as well as our innovative particle Co-Suspension Delivery Technology. In our early development pipeline, we focus our research on three key areas: lung immunity, lung epithelium and lung regeneration.
Asthma is one of the most common and chronic lung diseases worldwide and a serious global health problem, affecting the lungs’ airways. Inflammation and narrowing of the airways may cause wheezing, breathlessness, chest tightness and coughing. Fixed-dose combinations (FDCs) of an inhaled corticosteroid (ICS) with a long-acting beta2-agonist (LABA) such asSymbicort are the cornerstone of treatment, helping to treat moderate-to-severe asthma. For patients with mild asthma, we are investigating the use ofSymbicort dosed ‘as needed’, recognising the variability and inflammatory nature of disease in these patients. For the approximately 10% of asthma patients who have severe, uncontrolled asthma despite standard-of-care medications, we are working to develop targeted biologics that address the underlying causes of disease. The FDA and EMA have accepted regulatory submissions for benralizumab, our first respiratory biologic, which is being developed for severe asthma.
COPD is a progressive and chronic disease. There are unmet needs in the treatment of COPD, such as exacerbation and symptom control, improving health status and slowing the decline of lung function and disease progression. We foresee physicians increasingly treating earlier and more actively with different strategies for inflammatory and non-inflammatory patients, and both our portfolio and development pipeline address these different needs in mild and severe disease.
| | |
Respiratory – pipeline progressions |
Regional approvals | | BevespiAerosphere (PT003) – COPD (US) |
Expedited review | | None |
Regulatory submissions | | Benralizumab – severe asthma (US, EU) One further submission awaits regulatory acceptance |
Phase III investment decisions | | None |
Phase II starts/progressions | | Abediterol (AZD0548) – for asthma/COPD; AZD1419 (inhaled TLR9) – asthma |
Strategic transactions completed | | Acquisition of Takeda’s core respiratory business |
Setbacks and terminated projects | | AZD8999 for COPD; MEDI7836 for asthma; AZD7624 for COPD |
Therapy area world market
(MAT/Q3/16)
$64.8bn
Annual worldwide market value
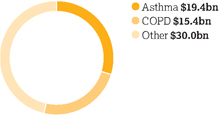
Our 2016 focus
We continue to invest inSymbicort, which was the number one ICS/LABA combination globally in volume terms in 2016. In the US, the FDA approvedSymbicort Inhalation Aerosol 80/4.5 micrograms for the treatment of asthma in paediatric patients aged six to 12 years. The FDA approval is based on the CHASE (ChildHood Asthma Safety and Efficacy) clinical trial programme, which included the CHASE 3 Phase III trial. In addition, on 25 January 2017, the FDA granted six months of paediatric exclusivity forSymbicort Inhalation Aerosol. Budesonide/formoterol was already approved in the US to treat asthma in patients 12 years and older and for the maintenance treatment of airflow obstruction in COPD in adults.
In the EU, two new indications were approved during 2016 –Symbicort pMDI for the treatment of COPD andSymbicortSMART for adolescents with asthma. Also,Pulmicort continues to be a leading ICS therapy, with significant sales growth in 2016 driven by China and other Emerging Markets.
In April 2016, the FDA approvedBevespi Aerosphere inhalation for the long-term maintenance treatment of airflow obstruction in patients with COPD, including chronic bronchitis and/or emphysema.Bevespi Aerosphere is the first combination long-acting muscarinic antagonist (LAMA) and LABA medicine to be delivered in a pMDI and the first medicine using
| | |
| 36 | | AstraZenecaAnnual Report and Form 20-F Information 2016 |

| | > | Bevespi Aerosphere (glycopyrrolate and formoterol fumarate) | |
| | > | Bricanyl Respules (terbutaline)1 | |
| | > | Bricanyl Turbuhaler (terbutaline)2 | |
| | > | Daliresp/Daxas (roflumilast) | |
| | > | Duaklir Genuair (aclidinium/formoterol)2 | |
| | > | Eklira Genuair/Tudorza Pressair (aclidinium)2 | |
| | > | Oxis Turbuhaler (formoterol)2 | |
| | > | Pulmicort Turbuhaler/Pulmicort Flexhaler(budesonide) | |
| | > | Pulmicort Respules (budesonide)1 | |
| | > | Symbicort pMDI (budesonide/formoterol) | |
| | > | Symbicort Turbuhaler (budesonide/formoterol)2 | |
 Full product information on page 211
| | 2 | In a dry powder inhaler. | |
AstraZeneca’s unique Co-Suspension Delivery Technology. The technology is designed to enable medicine crystals to be evenly distributed in the aerosol allowing for more consistent delivery of one or more different medicines from a single pMDI. The technology is also being applied to a range of AstraZeneca respiratory inhaled combination therapies currently in clinical development, such as the fixed-dose triple combination of LAMA/LABA/ICS (PT010).
We have launched the LAMA/LABA combinationDuaklir for the maintenance treatment of COPD symptoms in 25 countries across Europe, Asia and Latin America. Phase III development in the US and China is underway with anticipated regulatory filings in 2018 and 2019 respectively.
In May 2016, we completed our acquisition of Takeda’s core respiratory business. The deal included the acquisition of non-US rights toDaliresp, which is known asDaxas in certain countries. In December 2016, we completed the divestment of the non-US rights toRhinocortAqua, a nasal spray indicated for rhinitis nasal polyps, to Cilag GmbH International, an affiliate of Johnson & Johnson.

| | |
It is estimated that approximately 315 million people worldwide suffer from asthma. | |  |
Source: To T, Stanojevic S, Moores G et al. Global asthma prevalence in adults: findings from cross-sectional world health survey. BioMed Central Public Health. 2012: 12(204)
In the pipeline
In COPD, PT010 is a twice-daily triple inhaled medicine combination LAMA/ LABA/ICS composed of glycopyrrolate, formoterol and budesonide (key components ofSymbicort andBevespi Aerosphere) in late-stage development. PT010 is delivered in a pMDI using the Aerosphere Technology. Topline data from the KRONOS study will be available in 2017.
Benralizumab is an anti-eosinophil MAb that directly induces cellular apoptosis, which results in rapid and near-complete depletion of eosinophils. Eosinophils are the biological effector cells that drive inflammation and airway hyper-responsiveness in approximately 50% of asthma patients. The FDA and EMA have accepted regulatory submissions for benralizumab, based on our Phase III clinical trial programme. The SIROCCO and CALIMA studies demonstrated that adding benralizumab to standard-of-care medicine significantly reduced exacerbations and improved lung function and asthma symptoms in severe asthma patients with an eosinophilic phenotype compared to patients taking a placebo. These outcomes were demonstrated for the eight week dosing regimen, which may support less-frequent dosing than available medicines. An additional Phase III study showed benralizumab also reduced dependence on
oral corticosteroid use in this same patient population. Benralizumab is also in development for COPD. Phase III results and regulatory filings for COPD studies are expected in 2018.
Tralokinumab is an investigational MAb that binds to IL-13. Blocking IL-13 is a potentially important target in the treatment of certain types of severe asthma, estimated to affect around half the total severe asthma population. Analysis of the tralokinumab Phase II data suggests that IL-13 neutralisation may improve lung function and reduce asthma exacerbation rate in a subpopulation of moderate-to-severe asthma patients who are uncontrolled with standard-of-care therapy. In August 2014, we initiated a Phase III programme to evaluate the safety and efficacy of tralokinumab in reducing asthma exacerbations in adults and adolescents with severe, inadequately controlled asthma. The Phase III asthma programme is on track to deliver results in the second half of 2017.
329m
The global prevalence of COPD is estimated to be 329 million people1 and WHO predicts that COPD will become the third leading cause of death worldwide by 20302.
| 1 | Source: Bereza BG, Nielsen AT, Valgardsson S et al. Patient preferences in severe COPD and asthma: a comprehensive literature review. International Journal of COPD. 2015: 10: 739-744. |
| 2 | Source: WHO. Burden of COPD. http://www.who.int/ respiratory/copd/burden/en/. Accessed December 2016. |
| | |
| AstraZenecaAnnual Report and Form 20-F Information 2016 | | 37 |
Strategic Report | Therapy Area Review
Other Disease Areas
In addition to our focus on the treatment of diseases in our three main therapy areas, we are also selectively active in the areas of Autoimmunity, Infection and Neuroscience, as well as Gastroenterology, where we aim to develop best-in-class therapies and follow an opportunity-driven approach.
Our approach in our other disease areas looks to maximise revenue through externalisation and on-market products; advance the novel product pipeline with partnerships where appropriate; and preserve a company stake in the most promising assets.
Autoimmunity
Systemic lupus erythematosus (SLE), or lupus, is an autoimmune disease that occurs when the immune system produces antibodies that attack healthy tissue, including skin, joints, kidney, the brain and blood vessels. SLE can cause a wide range of symptoms. Among these are pain, rashes, fatigue, swelling in joints, and fevers. SLE is associated with a greater risk of death from causes such
as infection, nephritis and cardiovascular disease. Inflammation of the kidneys caused by SLE – known as lupus nephritis – can lead to significant morbidity and even death. Current treatment of SLE focuses on suppressing symptoms and controlling disease flares and, in the case of lupus nephritis, preventing renal failure.
Neuromyelitis optica (NMO) is a rare, life-threatening autoimmune disease of the central nervous system in which the body’s immune system attacks healthy cells, most commonly in the optic nerves and spinal cord, resulting in severe damage. NMO causes severe muscle weakness and paralysis, loss of vision, respiratory failure, problems with bowel and bladder function and neuropathic pain.
| | |
Other Disease Areas – pipeline progressions |
Regional approvals | | Zurampic – gout (EU) Zavicefta(previously CAZ AVI) – serious infections (EU) Pandemic Live Attenuated Influenza Vaccine – pandemic influenza (EU) |
Expedited review | | Orphan Drug Designation: inebilizumab (MEDI-551) – neuromyelitis optica (US) Fast Track Designation: MEDI8852 – hospitalised influenza (US); AZD3293 – Alzheimer’s disease (US) |
Regulatory submissions | | Lesinurad+allopurinol FDC – gout (US) |
Phase III investment decisions | | AZD3293 – Alzheimer’s disease; ATM-AVI* for serious bacterial infections; tralokinumab* for atopic dermatitis |
Phase II starts/progressions | | MEDI2070 for Crohn’s disease; MEDI3902 for the prevention of nosocomial pseudomonas pneumonia; MEDI8897 for RSV |
Strategic transactions completed | | Licensing agreements with Ironwood for the US rights toZurampicand with Grünenthal GmbH for rights in the EU and Latin America; two licensing agreements with LEO Pharma on our dermatology portfolio (brodalumab for EU, and tralokinumab for atopic dermatitis); sale of small molecule antibiotics portfolio to Pfizer; licensing MEDI2070 to Allergan; agreement with ProStrakan Group (now Kyowa Kirin International plc) for the rights toMoventig(naloxegol) in the EU, Iceland, Norway, Switzerland and Liechtenstein |
Setbacks and terminated projects | | Abrilumab for Crohn’s disease/ulcerative colitis; MEDI7510 for prevention of RSV disease in older patients |
* Achieved as a result of partnering; will not be progressed by AstraZeneca. |
Psoriasis is a chronic disease in which the immune system causes skin cells to grow rapidly. Instead of being shed, the skin cells pile up, causing painful and itchy, red, scaly patches that can bleed. Approximately 100 million people worldwide suffer from psoriasis. Despite available treatment options for moderate-to-severe plaque psoriasis, many patients do not experience a resolution of underlying inflammation, clearing of symptoms or an improved quality of life.
Gout is a serious, chronic, progressive and debilitating form of inflammatory arthritis that affects more than 15.8 million people in major markets. The underlying cause of gout is hyperuricemia (elevated serum uric acid), which leads to the deposition of crystals primarily in the joints and in other tissues. This can result in recurrent attacks of inflammatory arthritis and, if left uncontrolled, can lead to chronic, progressive arthritis and tophus (visible soft tissue deposits of urate crystals) formation.
Rheumatoid arthritis is an autoimmune disease that affects about 1% of the population and causes inflammation in the joints, with joint pain and swelling symptoms. There is a need for novel treatments, since only about a third of patients treated with biologics achieve their treatment goals.
In the pipeline
We are strengthening our pipeline and improving treatment options and clinical outcomes for patients with inflammatory and autoimmune diseases. Common molecular pathways are often shared across multiple autoimmune diseases, which provides opportunities to identify and work with approaches that could become treatments for more than one disease.
Anifrolumab is a developmental MAb that inhibits the activity of all type I interferon (IFN) receptors, which play a central role in lupus. A majority of patients with SLE show a high interferon gene signature, and increased levels of type I IFN have been shown to correlate with SLE disease activity and severity. Phase II trial results presented in November 2015 demonstrated that anifrolumab significantly reduced disease activity in moderate-to-severe SLE patients as measured by several SLE composite
| | |
| 38 | | AstraZenecaAnnual Report and Form 20-F Information 2016 |

| | | | |
 | | agreement entered into in July 2016. Valeant and LEO Pharma assume decision making on future development and all development costs associated with brodalumab. Zurampic inhibits the urate transporter, URAT1, which is responsible for the majority of the renal reabsorption of uric acid. By inhibiting URAT1,Zurampic increases uric acid excretion and thereby lowers serum uric acid levels. In combination with the current standard-of-care, xanthine oxidase inhibitors (XOIs) allopurinol or febuxostat,Zurampic provides a dual mechanism of action to increase excretion and decrease production of uric acid, enabling more patients with inadequately controlled gout to achieve target treatment goals. In April 2016, AstraZeneca entered into a licensing agreement with Ironwood for the exclusive US rights toZurampic.Zurampic was approved by the FDA in December 2015, in combination with an XOI, for the treatment of hyperuricemia associated with gout in patients who have not achieved target serum uric acid levels with an XOI alone. Ironwood launchedZurampic in the US in October 2016. In addition, Ironwood has exclusive US rights to the fixed-dose combination of lesinurad and allopurinol. In February 2016, the European Commission granted marketing authorisation forZurampic 200mg in combination with an XOI for the adjunctive treatment of hyperuricemia in gout patients (with or without tophi) who have not achieved target serum uric acid levels with an adequate dose of an XOI alone. In June 2016, we licensed out the exclusive rights toZurampic in the EU, Switzerland, Iceland, Norway and Liechtenstein, and in all Latin American countries to Grünenthal GmbH. The agreement includes rights to the fixed-dose combination of lesinurad and allopurinol in gout. Verinurad (RDEA3170) is a potent selective uric acid reabsorption inhibitor, also intended for use as a combination urate-lowering therapy with XOIs. Verinurad is in Phase II development. We have recently initiated plans to study verinurad for CKD in a Phase II study. |
| Recognition of the importance of the role played by the interferon pathway in lupus led to the development of anifrolumab, an investigational, potentially first-in-class, MAb that inhibits the activity of all type 1 interferons (IFN). Anifrolumab is being developed with an IFN gene signature diagnostic test designed to identify patients who may be more likely to benefit from treatment. The role of the interferon pathway may go beyond lupus; elevated type 1 IFN signature has been found in several other autoimmune diseases. | | endpoints. It also improved symptoms of lupus such as rash and arthritis. Anifrolumab is currently in Phase III development for SLE and Phase II for lupus nephritis. A Phase I subcutaneous administration study was completed in 2016 with plans for further studies ongoing. In March 2016, the FDA granted Orphan Drug Designation for inebilizumab (MEDI-551) for the treatment of patients with NMO as well as neuromyelitis optica spectrum disorders (NMOSD). Inebilizumab is an anti-CD19 MAb currently in Phase IIb clinical development. The FDA’s Orphan Drug Designation programme provides orphan status to potential medicines intended for the safe and effective treatment, diagnosis or prevention of rare diseases or disorders that affect fewer than 200,000 people in the US. Brodalumab is a human MAb that targets the interleukin-17 (IL-17) receptor. Brodalumab is currently under regulatory review in the US and Europe for adult patients with moderate-to-severe plaque psoriasis, with decisions anticipated in early 2017. Through a collaboration agreement, Valeant, an expert in dermatology, has an exclusive licence to develop and commercialise brodalumab globally, except in Japan and certain other Asian countries where rights are held by Kyowa Hakko Kirin, and in Europe, where LEO Pharma holds exclusive rights to develop and commercialise brodalumab based on an | |
| | | |
| | | |
| | |
| AstraZenecaAnnual Report and Form 20-F Information 2016 | | 39 |
Strategic Report | Therapy Area Review
Other Disease Areascontinued
Infection
| | > | Fluenz Tetra/FluMist Quadrivalent1,2 (influenza vaccine live) | |
 Full product information on page 211
| | 2 | Daiichi Sankyo holds rights toFluenz Tetra/FluMist Quadrivalent in Japan. | |
| | 3 | US rights only. AbbVie holds rights toSynagis outside the US. | |
Neuroscience
| | > | Movantik/Moventig (naloxegol) | |
| | > | Seroquel IR (quetiapine fumarate) | |
| | > | Seroquel XR (quetiapine fumarate) | |
| | > | Vimovo1 (naproxen and esomeprazole magnesium) | |
Full product information on page 211
| | 1 | Licensed from Pozen. Divested US rights to Horizon Pharma USA, Inc. effective 22 November 2013. | |
Gastrointestinal
| | > | Losec/Prilosec (omeprazole) | |
| | > | Nexium (esomeprazole magnesium) | |
Full product information on page 211
| | |
| 3-5m | |  |
Annual influenza epidemics are estimated to result in about three to five million cases of severe illness, and about 250,000 to 500,000 deaths.
Source: WHO Factsheet November 2016.
Mavrilimumab, an investigational MAb that inhibits a key pathway in the development of rheumatoid arthritis, achieved its primary and secondary endpoints in recently completed Phase IIb trials. Results showed that mavrilimumab improved signs and symptoms of rheumatoid arthritis, measures of disability and patient-reported outcomes.
Infection
Seasonal influenza is a serious public health problem that causes severe illness and death in high-risk populations. In 2016, the US Centers for Disease Control and Prevention (CDC) issued an interim recommendation thatFluMist Quadrivalent/Fluenz Tetra should not be used in the US for the 2016 to 2017 influenza season based on concerns regarding low effectiveness of the vaccine in the US during the last three influenza seasons (2013 to 2016). The vaccine remains licensed in the US and AstraZeneca/MedImmune remain committed toFluMist Quadrivalent and supporting it in the US and in the rest of the world. The FDA continues to find that the benefits ofFluMist Quadrivalent outweigh any potential risks. We are conducting non-clinical and clinical studies in order to provide data to help support a renewed recommendation for use in the US in future seasons. The vaccine continues to be recommended for use in many countries outside the US based on their respective public health authorities’ review of existing and recent vaccine effectiveness data. We also recently reached an agreement with the WHO to donate and supply at reduced prices a portion of vaccine production in the event of an influenza pandemic.
MEDI8852, an investigational human MAb for the treatment of patients hospitalised with Type A strain influenza, received Fast Track Designation from the FDA in March 2016.
Since its approval in 1998,Synagis has helped protect at risk babies globally against respiratory syncytial virus (RSV). RSV is a common seasonal virus and the most prevalent cause of lower respiratory tract infections among infants and young children, affecting approximately two-thirds of all infants in their first year of life (68% by 12 months of age and 97% by 24 months of age). It is the leading cause of
hospitalisations and admissions to paediatric intensive care units and leads to nearly 200,000 deaths globally in children under five years of age, with the majority of deaths occurring in developing countries.Synagis is approved in more than 80 countries and is the global standard of care for RSV prevention. We continue to work with our worldwide partner, AbbVie, to protect vulnerable infants.
MEDI8897 is a novel extended half-life MAb for the prevention of serious respiratory disease caused by RSV in infants. It requires dosing only once per RSV season – a potential breakthrough in RSV prophylaxis. In November 2016, the first patient was dosed in a Phase IIb trial. The FDA granted Fast Track status to MEDI8897 in April 2015.
Through a broad collaboration and significant funding, AstraZeneca joined in a public-private partnership with Vaccines Europe, the European Commission, the European Federation of Pharmaceutical Industries and Associations (EFPIA) and the Innovative Medicines Initiative (IMI) to further define the substantial unmet needs of RSV in paediatrics and older adults. Funding for the partnership, called RESCEU, will support the existing MEDI8897 programme and further strengthens our relationship with IMI.
In June 2016, the European Commission granted marketing authorisation forZavicefta (ceftazidime-avibactam, previously known as CAZ AVI), a new combination antibiotic for the treatment of patients with serious Gram-negative bacterial infections requiring hospitalisation.
Zavicefta has been developed in response to the urgent need for new antibiotics to treat serious infections that are becoming increasingly resistant, such as multi-drug resistantP. aeruginosa, carbapenem-resistant Gram-negative pathogens, and ESBL-producingEnterobacteriaceae.
In December 2016, we confirmed the completion of an agreement to sell the development and commercialisation rights of our late-stage, small molecule antibiotics business to Pfizer. The portfolio comprisedZinforo, Zavicefta, Merrem, ATM-AVI and CXL in all markets where we held the rights.
| | |
| 40 | | AstraZenecaAnnual Report and Form 20-F Information 2016 |

| | | | |
 | | We are committed to ensuring that pain patients who need to manage the side effect of opioid induced constipation continue to get access toMovantik/ Moventig. In March 2016, AstraZeneca announced an agreement with ProStrakan Group, now Kyowa Kirin International plc, for the rights toMoventig (naloxegol) in the EU, Iceland, Norway, Switzerland and Liechtenstein. In December 2016, we completed a sub-licence to Knight Therapeutics Inc. to commercialiseMovantik/Moventig in Canada and Israel. This follows the 2015 co-commercialisation agreement with Daiichi Sankyo forMovantik in the US. These agreements are in line with delivering on our externalisation strategy to create value by partnering on pipeline assets that are outside our three main therapy areas. Gastrointestinal In 2016, use ofNexium continued to grow in markets including China and Japan. Demand forNexium in China is expected to continue to grow over the next several years, based on broader geographic expansion as well as anticipated label expansions, and has the potential to become a top-selling medicine in its class, as in Japan. Patent protection forNexium remains in Japan. For the rest of the world,Nexium is subject to generic competition. |
Alzheimer’s disease remains one of the largest areas of unmet medical need and continues to generate significant social and scientific interest. AZD3293, our BACE inhibitor in collaboration with Lilly received Fast Track Designation by the FDA in August 2016. | | Neuroscience Current commercialised AstraZeneca neuroscience molecules includeZomig (triptan) andSeroquel (atypical antipsychotics), which have lost exclusivity in all major markets. In November 2016, two licensed generics ofSeroquelXR were launched in the US. In June 2016, AstraZeneca announced an agreement with Aspen Global Incorporated, part of Aspen Group, for the rights to the global anaesthetics portfolio outside the US. The agreement covered seven established medicines –Diprivan (general anaesthesia),EMLA (topical anaesthetic) and five local anaesthetics (Xylocaine/ Xylocard/Xyloproct, Marcaine, Naropin, Carbocaine andCitanest). AZD3293 is our BACE inhibitor which we are progressing in collaboration with Lilly for the potential treatment of Alzheimer’s disease. It experienced several critical milestones throughout 2016, including continuation of the Phase II/III trial AMARANTH into Phase III and the initiation of DAYBREAK-ALZ, a new Phase III trial to evaluate the safety and efficacy of AZD3293 in people with mild Alzheimer’s dementia. The investigational treatment also received Fast Track Designation by the FDA in August 2016. Further underpinning AstraZeneca’s commitment to Alzheimer’s disease, in December 2016, we announced that MEDI1814, an investigational MAb selective for toxic proteins associated with Alzheimer’s disease, will be developed beyond Phase I, also in collaboration with Lilly. | |
| | |
| AstraZenecaAnnual Report and Form 20-F Information 2016 | | 41 |
Strategic Report | Business Review
Business Review
| | |

Overview > Focused investment in accelerating late-stage programmes to ensure new treatments get to patients safely and as quickly as possible > Plans for achieving scientific leadership include researching new modalities, seeking out different kinds of collaboration and promoting personalised healthcare > Six Growth Platforms represented 63% of revenues in 2016, up 4% at actual exchange rates (5% at CER) over 2015 > In April, announced further focus on our main therapy areas to drive greater productivity across the organisation, sharpen the prioritization of investments, increase partnering and streamline our operations > Began to refresh our sustainability programme and embed it into our business practices, with focus on three areas: ethics and transparency; broadening access to healthcare; and environmental protection > Committed to delivering value in pricing our medicines with policy based on four principles > Continued to promote a safe and healthy work environment, coupled with our commitment to working only with those who share our ethical standards 
| | Organisation Our science is led by our two biotech units which conduct innovative discovery research and early-stage development from initial target selection to Phase II trial completion. The Innovative Medicines and Early Development (IMED) Biotech Unit focuses on scientific advances in small molecules, nucleotides and other emerging technologies and drug discovery platforms, while MedImmune is responsible for global biologics R&D. Both units are responsible for delivering projects to our Global Medicines Development (GMD) unit for late-stage development. We have three strategic R&D centres: Gaithersburg, Maryland US; Gothenburg, Sweden; and Cambridge, UK. For more information on our move to Cambridge, announced in 2013, see page 7. Our Global Product and Portfolio Strategy group (GPPS) leads our therapy area activities. GPPS also serves as the bridge between our R&D and Commercial functions and works to provide strategic direction from early-stage research to commercialisation. GPPS also works closely with healthcare providers, regulatory authorities and those who pay for our medicines, seeking to ensure those medicines help to fulfil unmet medical need and provide economic as well as therapeutic benefits. We group our Commercial functions into Regions: North America (US and Canada); Europe; International East (China, Hong Kong, Asia Area, Australia & New Zealand); and International West (Russia & Eurasia, Middle East & Africa, Latin America and Brazil). Japan is categorised separately and is one of our Growth Platforms. |
| | |
| 42 | | AstraZenecaAnnual Report and Form 20-F Information 2016 |
Our Operations function plays a key role in the development, manufacturing, testing and delivery of our medicines to our customers.
Restructuring
Since 2007, we have made significant efforts to restructure and reshape our business to improve long-term competitiveness. Full details are provided in the Financial Review from page 62. We have created a leaner and simpler organisation, focused on driving distinctive science in our main therapy areas. To advance our strategy, in April 2016, we announced plans to:
| > | sharpen prioritisation of investments and focus in our main therapy areas, particularly Oncology |
| > | increase partnering in relation to projects in our inflammation, infection and neuroscience disease areas, and to products in markets where there is a clear rationale |
| > | align costs to our changing business shape and to streamline our operations at a global, regional and country level; reshaping manufacturing as we build our biologics capacity; to drive simplification; and to implement small footprint changes. |
Restructuring charges of $1,107 million were incurred in the year and we remain on track to realise the benefits and incur the costs we announced.
Sustainability 
We want to be valued and trusted by our stakeholders as a source of great medicines over the long term. That is why we are committed to operating in a way that recognises the interconnection between business growth, the needs of society and the limitations of our planet. This means delivering our business strategy in a way
that broadens access to our medicines, minimises the environmental footprint of our products and processes, and ensures that ethics and transparency underpin everything we do. Our commitment to growing our business in a sustainable way also helps us protect our licence to operate, attract and retain talent, manage risk and, most importantly, deliver life-changing medicines to patients. The SET and Board regularly review our sustainability work as part of their risk management and business review activities.
Refreshed sustainability strategy In 2016, we embarked on a process to refresh and focus our sustainability programme and further embed it into our business practices and strategic priorities. We worked with an independent think-tank to complete a sustainability materiality assessment to help identify priorities.
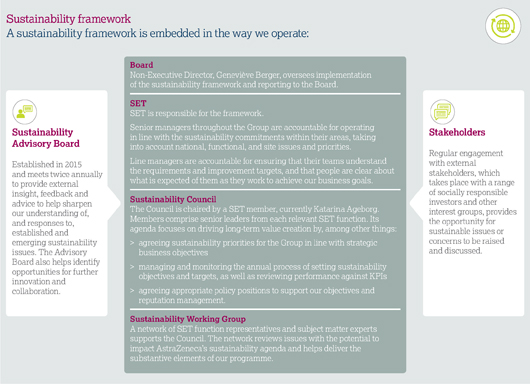
| | |
| AstraZenecaAnnual Report and Form 20-F Information 2016 | | 43 |
Strategic Report | Business Review
Business Reviewcontinued
The assessment process identified 27 sustainability issues relevant to us. These became the basis for benchmarking analysis, engagement with external and internal stakeholders, and an internal review that examined our areas of strength, weakness and opportunity, and our alignment with the UN Sustainable Development Goals.
Through this process, we have identified three priority areas that, given their alignment with our Purpose and business strategy, will allow us to have the most impact in benefiting our patients, our Company, broader society and the planet. We remain committed to managing and building our performance in the other areas within the scope of AstraZeneca’s sustainability programmes, such as human rights, diversity, and workplace health and safety. We will continue to work across our business to integrate these commitments into the way we work, engage with stakeholders and evaluate our performance. The three priority areas are as follows.
1. Broadening access to healthcare.
Through collaboration and innovation we strive to expand access to our medicines by:
| > | Exploring innovative ways of increasing access to healthcare for more people, tailored to meet differing patient needs and circumstances (see page 51 and Healthy Heart Africa on page 49). |
| > | Making a positive contribution to our local communities around the world, through community support programmes consistent with improving health and promoting science (see page 53). |
2. Ethics and transparency.
We will maintain integrity in everything we do by:
| > | Working to consistent global standards of ethical sales and marketing practices in all our markets (see page 52). |
| > | Working only with suppliers who have standards consistent with our own as we increase our outsourcing to drive business efficiency (see page 52). |
| > | Working on continued transparency with our data in clinical trials, enhancing the understanding of how our medicines work and benefit patients (see page 47). |
| > | Applying sound bioethics to all our work and maintaining a strong focus on patient safety (see pages 47 and 48). |
3. Environmental protection.
We follow the science to protect the planet by:
| > | Managing our impact on the environment, across all our activities, with a particular focus on carbon emissions, waste and water use. |
| > | Minimising the environmental impact of our products (see pages 60 and 61). |
Our focus on these three areas does not diminish our commitment to other areas of our sustainability agenda. For example:
| > | Ensuring that diversity in its broadest sense is reflected in our leadership and people strategies (see page 55). |
| > | Continuing to develop and embed a consistent approach to human rights across our worldwide activities (see page 56). |
| > | Promoting the safety, health and wellbeing of all our people worldwide (see page 53). |
| | |
| Benchmarking and assurance | | |
| Our work in sustainability has been recognised by a number of organisations in 2016: | |  |
| | | | | | | | | | | | |
 | | | |  | | | |  | | | |  |
| | | | | | |
DJSI > Second in Pharmaceuticals, Biotechnology and Life Sciences industry group. > Sector best scores attained for: Occupational Health and Safety, Code of Conduct, Marketing Practices, Climate Strategy and Health Outcomes Contribution. | | | | CDP > Climate A List – Among the top 9% of companies participating in CDP’s climate change programme in recognition of our actions to reduce emissions and mitigate climate change. > Water A List – Among the leading 25 companies for our commitment to transparency around environmental risks and demonstration of pursuing best practice. > Supplier Climate A List – Among the 3% of companies awarded an A grade for our efforts and actions to combat climate change by implementing programmes to reduce emissions in both direct operations and supply chain. | | | | Access to Medicine Index > Biggest riser in the Index since the last survey, moving to 7th place in 2016 from 15th in 2014. > Recognition for industry best practice in a number of areas, including transparent approach to intellectual property in relation to Index Countries: disclosing where we will not enforce patents, where we would consider granting a licence, and disclosing the status of our patents for products used to treat Index Diseases. | | | | Bureau Veritas has provided independent external assurance to a limited level on the sustainability information contained within this Annual Report. For more information on Bureau Veritas’ work and benchmarking, please see Sustainability: supplementary information on page 231 and the Sustainability pages on our website, www.astrazeneca.com. |
| | |
| 44 | | AstraZenecaAnnual Report and Form 20-F Information 2016 |
Safety, Health and Environment strategy
Throughout 2016, we worked to embed our 2016 to 2025 Safety, Health and Environment (SHE) strategy and deliver the targets we have set ourselves as regards:
| > | eliminating workplace accidents and illnesses (see page 53) |
| > | protecting natural resources (see pages 60 and 61) |
| > | ensuring the environmental safety of our products (see page 61). |
We have made good progress to date, attaining independent verification that our climate change targets are science-based, setting out our RE100 strategy to source 100% renewable power globally, and disclosing our climate information in public reports. We have also made a commitment to responsible water stewardship as part of The Business Alliance for Water and Climate partnership. We are working closely with our operating sites to agree on specific contributions to our 2025 strategy targets. More information on our performance in 2016 can be found in Safety, health and wellbeing on page 53 and Environment from page 60.
We are proud of the external recognition we are receiving for our work. As shown to the left, the Dow Jones Sustainability Index (DJSI) has scored our climate change strategy and occupational health and safety performance as best in our industry. Our submissions to investor benchmarking organisation, CDP achieved an A-list ranking for both climate change and water stewardship. During 2016, we committed approximately $25 million to natural resource projects at our sites. These projects are expected to accelerate our resource efficiency performance and include: solvent recovery to reduce hazardous waste; a novel heat pump system to reduce reliance on natural gas; and a number of resource efficiency minor works programmes. Site water stress assessments and natural resource audits continue to identify further opportunities for management and investment. We continue to hold third party suppliers accountable for protecting the environment across our supply chains and we are active members of the Pharmaceutical Supply Chain Initiative to promote a collaborative approach across our industry.
| | |
| |
| 1. Achieve scientific leadership | |  |
We are using our distinctive scientific capabilities in small molecules and biologics, including immunotherapies and protein engineering, as well as investing in key programmes and focused business development, to deliver life-changing medicines.
Overview
| | > | Launched six diagnostic tests linked to our products in line with our personalised healthcare (PHC) strategy | |
| | > | Delivered clinical trial data and submissions that resulted in 11 approvals for brand new medicines in the US, EU, China or Japan | |
| | > | Simplified programmes, processes and systems, and prioritised resources towards late-stage drug development | |
| | > | Published 75 manuscripts in ‘high-impact’ publications compared to seven in 2010 | |
| | > | Continued to strengthen early-stage portfolio with new drug modalities, allowing us to expand into novel scientific areas while maintaining a clear focus on disease mechanisms | |
| | > | Strive to access the best science, both internal and external, in our biotech units, and we are open to exploring new and different kinds of collaborations | |
| | > | Committed to working responsibly and in accordance with our global bioethics policy | |
Early science
We continued to strengthen our early-stage portfolio with new drug modalities such as modified RNA, anti-micro RNA, antisense oligonucleotides, bi-specific monoclonal antibodies (MAbs) and antibody-drug conjugates (ADC). This is allowing us to expand into novel scientific areas while maintaining a clear focus on disease mechanisms. In 2016, in partnership with Regulus Therapeutics Inc., we saw AZD4076, an anti-micro RNA targeting the miR103/107 gene, being dosed into patients. These patients had non-alcoholic steatohepatitis or ‘silent-liver disease’, for which there are no approved medicines. Also in 2016, in partnership with Moderna, we filed the clinical trials application for AZD8601, a modified RNA for VEGF-A for
cardiac regeneration. We also extended our partnership with Moderna to include immuno-oncology programmes, combining MedImmune’s protein engineering and cancer biology expertise with Moderna’s technology.
| | |
| | See Oncology from page 25 for more information |
Working collaboratively and fostering open innovation
Our biotech-style operating model gives us access to the best science, both internal and external, and we are open to exploring new and different kinds of collaborations. Our partnership models include in-licensing of new chemical modalities and platforms, disease understanding, technology advances, uncovering novel target opportunities, and clinical partnerships. For example, two key pieces of scientific research were published in high-impact journals by scientists at our joint centre for cardiometabolic diseases at the Karolinska Institutet. We also identify collaborations that allow us to out-license our technology platforms. For instance, we have expanded the utilisation of our ADC technology platform through an agreement with Regeneron Pharmaceuticals Inc., giving them access to MedImmune’s ADC technology.
In 2016, IMED continued to pioneer new approaches to open innovation, enabling our scientists more freely to share their ideas and collaborate on projects with external scientists. The IMED Open Innovation portal allows external researchers to access the full range of open innovation programmes. By the end of 2016, our teams had reviewed more than 500 proposals for new drug projects. Of these, 26 have progressed as far as clinical trials, while more than 150 are at pre-clinical trial stage.
During 2016, MedImmune continued to forge collaborations, including a research collaboration with the University of California, San Francisco US, with an emphasis on basic research and translational sciences. We also announced an innovative programme with Johns Hopkins University, providing a first-of-its-kind industry-academic PhD programme in the US. Furthermore, in late 2016, MedImmune and a consortium of UK universities – Cambridge, Leeds, Manchester and Sheffield – announced that they will be afforded a Collaborative
| | |
| AstraZenecaAnnual Report and Form 20-F Information 2016 | | 45 |
Strategic Report | Business Review
Business Reviewcontinued

Since 2015, we have introduced over 60,000 patients from the PatientsLikeMe network to our research teams to inform our R&D programmes. After simulating a clinical study visit with lupus patients, their feedback resulted in 16 changes to the way the study was conducted.
That study is now delivering ahead of time, demonstrating the value of working with patients to deliver more efficient research. We believe that this will improve our ability to bring more life-changing medicines, more quickly to more patients.
| | |
| 6 | |  |
In 2016, launched six diagnostic
tests linked to our products.
Training Partnership (CTP), structured as 12 PhD studentships, from the Biotechnology and Biological Sciences Research Council (BBSRC). These CTP studentships are designed to invest in the training of the next generation of scientists, providing access to facilities and expertise unavailable in an academic setting alone.
Our personalised healthcare strategy
Personalised healthcare (PHC) allows us to tailor both new and existing treatments to the needs of individual patients by means of diagnostic tests. It is an integral part of our plans to achieve scientific leadership and we are committed to bringing PHC to patients in all main disease areas. Three of our products (Iressa,Lynparza andTagrisso) are coupled with companion diagnostic tests that select patients based on their molecular profiles. In addition, 80% of our clinical pipeline is following our PHC approach and over 50 planned drug launches by 2023 require a diagnostic test.
In 2016, we worked with our partners to launch six diagnostic tests linked to our products increasing our total number of diagnostics launched since 2014 to 15. Our commitment to bring PHC to patients in all main disease areas has resulted in our first diagnostic test outside oncology: the Nova Biomedical Pro Uric Acid Test. It is a hand-held serum uric acid point of care test, aligned toZurampic, which can be used to measure a patient’s response to gout treatment. We are also developing diagnostic tests with Abbott for treating asthma and with Qiagen for treating lupus.
Also in 2016, we announced our integrated genomics initiative which focuses on the discovery of new targets and biomarkers
linked to molecular mechanisms of disease across our main therapy areas. The initiative includes new collaborations with Human Longevity, Inc., US, the Wellcome Trust Sanger Institute, UK, and The Institute for Molecular Medicine, Finland. We are also establishing an in-house Centre for Genomics Research led by Professor David Goldstein, a leader in genomics. This Centre aims to apply genomic insight across our entire R&D pipeline by developing a bespoke database comprising genome sequences from samples donated by patients in clinical trials together with associated clinical and drug response data.
Late-stage development
GMD designs and delivers clinical trials and makes regulatory submissions to seek approval for new drugs and line extensions. During 2016, we delivered clinical trial data and submissions that resulted in 11 approvals for brand new medicines in the US, EU, China or Japan. We also had some setbacks during the year, with some disappointing Phase III data results – for example,Brilinta for peripheral arterial disease, selumetinib for non-small cell lung cancer, and tremelimumab for mesothelioma – see Cardiovascular & Metabolic Disease and Oncology from pages 30 and 25 respectively for more information. However, this is to be expected when we are investigating treatments for diseases that are hard to treat.
In order to maintain a focus on our main therapy areas and enable us to maximise time and resources in accelerating certain programmes, we identified opportunities to collaborate on developing assets within our late-stage pipeline. For example, we made an agreement for the development of tralokinumab for patients with atopic dermatitis (allowing us to focus on its development for asthma) and an agreement for an accelerated global development programme for savolitinib for patients with papillary renal cell carcinoma.
Accelerating the pipeline
In 2016, we presented scientific rationale that resulted in 10 regulatory designations for Priority or Fast Track review for new medicines which offer the potential to address unmet medical need in certain diseases, and we also worked to secure Orphan Drug status for the development of medicines to treat very rare diseases. For example, in the US, we were granted Breakthrough Therapy Designation for our
| | |
| 46 | | AstraZenecaAnnual Report and Form 20-F Information 2016 |
immunotherapy treatment – durvalumab for bladder cancer. We also received Fast Track Designation forLynparza for 2nd line ovarian cancer and for MEDI8852 for patients hospitalised with Type A strain influenza. Orphan Drug Designations were granted for acalabrutinib for three haematological indications, for selumetinib for differentiated thyroid cancer, and for MEDI-551 for treating neuromyelitis optica. We are also working alongside regulatory authorities to drive change within the regulatory environment by ensuring that the clinical benefits of our medicines for patients are clearly understood. For example, using Patient Reported Outcomes data can help define how oncology medicines are used to treat patients with cancer.
With 132 drug projects in the pipeline, GMD is prioritising by focusing investment to accelerate specific programmes, so that new treatments get to patients more quickly but still safely. As a result, several immuno-oncology clinical trials, including some for lung cancer, head and neck cancer and bladder cancer, completed recruitment in 2016, with read-outs expected in 2017. Teams have also been quick to turn positive clinical trial data into regulatory submissions. In 2016, we made submissions in the US and EU for our first respiratory biologic treatment, benralizumab, for severe asthma and for our lung cancer treatment,Tagrisso, in China. We secured a priority review forTagrisso following its accelerated development programme and previous approvals in the US, EU, Japan and 13 other countries.
We also work in partnership to advance our clinical research – from strategic alliances with contract research organisations (CROs) for the delivery of clinical trials, to academic collaborations. These include new partnerships with the Department of Medical Statistics at the London School of Hygiene & Tropical Medicine and with the University of Manchester’s Health eResearch Centre. These partnerships aim to deploy statistical techniques in examining clinical and healthcare data to make medicines more personalised and effective for patients, and to drive smarter clinical trials.
Our scientific reputation
Demonstrating the quality of the research conducted in our laboratories, through publication in high-quality and ‘high-impact’ journals, is an essential element in building our scientific reputation and achieving
scientific leadership. It is also critical for recruiting and retaining the best scientists from around the world. Scientists from IMED, MedImmune and GMD have published 75 manuscripts (a record number) in ‘high-impact’ peer-reviewed journals, each with an impact factor exceeding 15 (Thomson Reuters 5yr IF score) and a score exceeding 1,050 in total. This represents an eleven-fold improvement since our drive to publish in ‘high-impact’ journals began in 2010.
Responsible research
Our commitment to working in a transparent and ethical manner is essential to achieving scientific leadership and delivering life-changing medicines. Our global standards of bioethics apply to all our research activity, whether conducted by us or third parties on our behalf. The following sections summarise our activities in this area – for more information, see our website, www.astrazeneca.com/
sustainability.html
Patient safety
Patient safety is very important and we strive to minimise the risks and maximise the benefits of our medicines. Through a pharmacovigilance programme, we monitor our medicines once they are in the marketplace to learn of any side effects not identified during the development process and provide information concerning the safety profile of our medicines to regulators, healthcare professionals and, where appropriate, patients.
We have a dedicated patient safety team to help us fulfil our commitment to patient safety. Each developing and marketed medicine is allocated a Global Safety Physician and a patient safety scientist. In addition, each market is supported by a dedicated patient safety manager. Our Chief Medical Officer is accountable for the benefit/risk profiles of our products in development and on the market. He provides medical oversight and enforces risk assessment processes to help us make efficient and informed decisions about patient safety.
Clinical trials and transparency
In 2016, we conducted a range of clinical trials at many sites as shown in the chart to the right. This broad span helps ensure that study participants reflect the diversity of patients for whom our medicines are intended and identifies the patients for whom the medicine may be most beneficial. Our global governance process provides
the framework for ensuring a consistent, high-quality approach worldwide. Protecting participants throughout the trial process is a priority and we have strict procedures to help ensure participants are not exposed to unnecessary risks.
All our clinical studies are designed and finally interpreted in-house but some are conducted by CROs on our behalf. In 2016, approximately 48% of patients in our small molecule studies and 44% of patients in our biologics studies were monitored by CROs. We require these organisations to comply with our global standards and we conduct risk-based audits to monitor compliance.
We believe that transparency enhances the understanding of how our medicines work and benefit patients. We publish information about our clinical research, as well as the registration and results of our clinical trials – regardless of whether they are favourable – for all products and all phases, including marketed medicines, drugs in development and drugs where development has been discontinued.
In 2016, we implemented new global standards which give patients and researchers more information about our research. Specifically:
| > | Every patient who participates in a study sponsored by us receives a note recognising their contribution as well as a copy of the study’s Trial Results Summary. |
| > | In 2016, we launched a portal (https:// astrazenecagroup-dt.pharmacm.com) for external researchers to allow them to request our clinical data and reports to support additional research. We have responded to over 50 requests so far. |
| | |
 | | For more information, please see our website, www.astrazeneca.com, or our clinical trials website, www.astrazenecaclinicaltrials.com |
Clinical trials by region
| | | | | | | | |
| Region | | Small molecule | | | Biologics | |
| Europe | | | 15% | | | | 23% | |
| US/Canada | | | 27% | | | | 26% | |
| Asia Pacific | | | 15% | | | | 11% | |
| Central/Eastern Europe | | | 28% | | | | 24% | |
| Japan | | | 2% | | | | 5% | |
| Latin America | | | 10% | | | | 10% | |
| Middle East and Africa | | | 3% | | | | 1% | |
| | |
| AstraZenecaAnnual Report and Form 20-F Information 2016 | | 47 |
Strategic Report | Business Review
Business Reviewcontinued
Research use of human biological samples
The use of human biological samples, such as solid tissue, biofluids and their derivatives, plays a vital role in developing a deeper understanding of human diseases and their underlying mechanisms, which helps us develop effective, new and personalised medicines.
When we conduct this important research, we maintain policies and processes to ensure that we comply with the law and meet regulatory concerns. We place an emphasis on informed consent that protects the rights and expectations of donors and families throughout the process of our acquisition, use, storage and disposal of the samples. Protecting the confidentiality of a donor’s identity is of the utmost importance, and a key part of our process includes the coding of biological samples and associated data (including genetic data).
In rare circumstances, we may use human fetal tissue (hFT) or human embryonic stem cells (hESC). In these circumstances, an internal review of the scientific validity of the research proposal will be conducted and permission to use the tissue will be granted only when no other scientifically reasonable alternative is available. We also insist our third party vendors adopt the highest ethical standards and we rigorously assess the ability of tissue suppliers to meet our quality and ethical expectations. We are committed to minimising the use of fetal tissue by exploring technological alternatives.
To date, seven research proposals that include use of cells derived from hFT have been received for consideration, but none of these has progressed so far, either for scientific or other reasons. We continue to review our processes for the supply of hFT but, at the end of 2016, had yet to approve a single source. Currently, four projects using three different hESC lines have been approved.
Animal research
We are committed to helping the public understand our use of animals in research and our methods for reducing, refining, or replacing this use (3R approach).
We share our transparency goals externally through presentations at conferences and workshops throughout the US and EU, and we also highlighted our latest refinement
techniques and approach to implementing the 3Rs in a recent blog for the UK National Council for the 3Rs. Internally we are working to refine our study designs by improving access to a refreshed training programme on the principles of good statistical practice. The objective of this training is to ensure that scientists are better able to appropriately power their studies, account for variability and control bias wherever possible.
Animal research use varies depending on numerous factors, including our amount of pre-clinical research, the complexity of the diseases under investigation and regulatory requirements. We believe that without our active commitment to reducing, refining, or replacing animals in research, our animal use would be much greater. In 2016, we used 193,451 animals in-house (2015: 182,055). In addition, 25,651 animals were used by CROs on our behalf (2015: 33,220).
| | |
| |
| 2. Return to growth | |  |
We seek to return to growth by focusing on our Growth Platforms and leveraging our strong global commercial presence, particularly in Emerging Markets, to ensure the right medicines are available and that patients have access to them.
Overview
| | > | Ongoing scrutiny of pharmaceutical pricing in US and Europe | |
| | > | Despite biennial price cuts, Japan remained an attractive market | |
| | > | Third fastest growing top 10 multinational pharmaceutical company in Emerging Markets | |
| | > | Growth rate in China expected to moderate due to increased price pressure and hospital cost containment | |
| | > | Pricing policy based on principles of value, sustainability, access and flexibility | |
| | > | Sought to make our medicines more affordable for self-pay patients based on ability to pay | |
| | > | Expanded Healthy Heart Africa programme from Kenya to Ethiopia and partnered with The US President’s Emergency Plan for AIDS Relief | |
Our plans for growth
Our Commercial teams, which comprised around 34,100 employees at the end of 2016, are active in more than 100 countries. In most countries, we sell our medicines through wholly-owned local marketing companies. We also sell through distributors and local representative offices and market our products largely to primary care and specialty care physicians.
Even as we continue to be impacted by the loss of exclusivity on some of our leading medicines, such asCrestor,Nexium andSeroquel, we have witnessed increasing revenues from our growth brands and launches. This return to growth is underpinned by our internal Growth Platforms which are our growth levers. As our strategy has progressed, so our Growth Platforms have evolved, as shown in Strategy and key performance indicators from page 16. Respiratory was joined by New Oncology from January 2015 and, from January 2017, New CVMD replaced Diabetes andBrilinta/Brilique. Our two remaining Growth Platforms, Emerging Markets and Japan, reflect the importance of these markets to growing future revenues. Overall, our Growth Platforms grew by 4% at actual exchange rates (5% at CER) in 2016 and now represent 63% of all revenues.
However, the pharmaceutical market is highly competitive. For example, our Diabetes franchise continues to see pricing pressure. In immuno-oncology, the large number of clinical trials that are being carried out highlight the competitive nature of this area and renders speed to market critical.
| | |
| | More information on our performance around the world in 2016 can be found in the Geographical Review from page 226 |
US
As the eleventh largest prescription-based pharmaceutical company in the US, we have a 3.9% market share of US pharmaceuticals by sales value.
In 2016, sales in the US decreased by 22% to $7,365 million (2015: $9,474 million). Declines in revenue fromNexium,Crestor andSynagis were partially offset by the strong performance of our Growth Platforms, includingFarxiga,Bydureon andBrilinta, the launches ofLynparza and
| | |
| 48 | | AstraZenecaAnnual Report and Form 20-F Information 2016 |
| | | | |
 | | Tagrisso, and the impact of completing the acquisition of Actavis’ rights toTudorza and Daliresp in the US. The US healthcare system is complex with multiple payers and intermediaries exerting pressure on patient access to branded medicines through regulatory and voluntary rebates. Regulatory rebates are statutorily mandated chargebacks and discounts paid on government-funded programmes such as Medicaid, Department of Defense (including TRICARE) and Department of Veteran’s Affairs. Voluntary rebates are paid to managed care organisations and pharmacy benefit managers for commercially insured patients, including Medicare Part D patients. In the Medicare Part D programme, in addition to voluntary negotiated rebates, branded pharmaceutical manufacturers are statutorily required to pay 50% of the patient’s out-of-pocket costs during the ‘coverage gap’ portion of their benefit design. As part of the ACA, we also pay a portion of an overall industry Patient Protection and Affordable Care Act Branded Prescription Drug Fee. In 2016, the overall measurable reduction in our profit before tax for the year due to discounts on branded pharmaceuticals and an industry-wide excise fee was $471 million (2015: $786 million; 2014: $714 million). In the US, there is significant pricing pressure driven by payer consolidation, restrictive reimbursement policies and cost control tools, such as exclusionary formularies and price protection clauses. Many formularies employ ‘generic first’ strategies and/or require physicians to obtain prior approval for the use of a branded medicine where a generic alternative exists. These mechanisms can be used by intermediaries to limit the use of branded products and put pressure on manufacturers to reduce net prices. In 2016, 84.7% of prescriptions dispensed in the US were generic, compared with 84.0% in 2015. In addition, patients are seeing changes in the design of their health plan benefits and may experience variation, including increases, in both premiums and out-of-pocket payments for their branded medications. The patient out-of-pocket spend is generally in the form of a co-payment or co-insurance, but there is a growing trend towards high deductible health plans which require patients to pay the full list price until they meet certain |
Healthy Heart Africa (HHA) was launched in Kenya in October 2014 in collaboration with the Ministry of Health in support of its commitment to combat NCDs. HHA aims to reach 10 million hypertensive patients across Sub-Saharan Africa by 2025 and, after two years, it has already: > conducted over two million hypertension screenings in the community and in health facilities > trained over 3,000 healthcare workers, including doctors, nurses, community health volunteers and pharmacists to provide education and awareness, screening and treatment services for hypertension across 31 counties > activated 403 health facilities to provide hypertension services, including the establishment of secure supply chains for low-cost, high-quality antihypertensive medicines. 3,000  Trained over 3,000 healthcare workers as part of Healthy Heart Africa. | | Following the success of HHA in Kenya, we developed a partnership with the Federal Ministry of Health in Ethiopia to integrate HHA programming into the Ethiopian healthcare system in support of the Government National Strategic Action Plan for NCDs. In September, we announced a $10 million, five-year global public-private partnership with The US President’s Emergency Plan for AIDS Relief (PEPFAR) that will expand access to HIV/AIDS and hypertension services by offering them in an integrated manner at existing PEPFAR-supported HIV/AIDS sites, beginning in Kenya. For example, working-age men are a difficult population to engage for HIV care, and HHA’s innovative way of working presents an opportunity for the partnership with PEPFAR to improve HIV care in this hard-to-reach population. | |
| | | |
| | | |
| | |
| AstraZenecaAnnual Report and Form 20-F Information 2016 | | 49 |
Strategic Report | Business Review
Business Reviewcontinued
out-of-pocket thresholds. We understand that our medicines will not benefit patients if they are unable to afford them, and that is why we offer a number of resources and programmes that can help patients afford their medications by reducing their out-of-pocket costs. We focus our formulary access on affordability for patients through rebate payments as well as savings cards for eligible patients when the out-of-pocket costs are not affordable.
Ongoing scrutiny of the US pharmaceutical industry, focused largely on pricing, is placing increased emphasis on the value of medicines. This scrutiny is likely to continue from many stakeholders, including policymakers and legislators. Proposed policy and legislative changes which are being considered, include different approaches to price controls on medicines (including price transparency), potential changes to government regulated programmes (such as Medicare Part B, Medicare Part D, Medicaid or other provisions under the ACA), and changes affecting the commercial importation of medicines into the US.
While widespread adoption of a broad national price-control scheme in the near future is unlikely, we expect the increased focus on pharmaceutical prices and their impact on healthcare costs to continue for the foreseeable future.
| | |
| | For more information on pricing pressure and the ACA, please see Marketplace from page 11 |
Europe
The total European pharmaceutical market was worth $201 billion in 2016. We are the twelfth largest prescription-based pharmaceutical company in Europe (see Market definitions on page 239) with a 2.4% market share of pharmaceutical sales by value.
In 2016, our sales in Europe decreased by 5% at actual rate of exchange (3% at CER) to $5,064 million (2015: $5,323 million). Key drivers of the decline, leaving aside the impact of divestments, such as the anaesthetics portfolio, were continued competition fromSymbicort analogues, ongoing volume erosion ofPulmicort,Seroquel XR andNexium following loss of exclusivity, and pricing and volume pressure forCrestor. The continued macroeconomic
environment, increased government interventions (for example, on price and volume) and parallel trade across markets also affected sales. Despite these conditions, we continue to launch innovative medicines across Europe and saw significant progress within our Growth Platforms, in particular withForxiga,Xigduo,Brilinta,Lynparza andTagrisso.
Established Rest of World (ROW)*
In 2016, sales in Japan increased by 8% at actual rate of exchange (decreased 3% at CER) to $2,184 million (2015: $2,020 million), as a result of the biennial National Health Insurance (NHI) price cuts effective from 1 April 2016. We experienced price cuts of approximately 5% on our 2016 revenue. Despite the NHI price cuts, across our Growth Platforms we saw strong volume growth. Particularly strong performance fromNexium andCrestor, and the Diabetes franchise helped to drive this volume growth, offsetting generic competition. In addition, in May 2016, we launchedTagrisso in Japan which generated $82 million of sales and we expect will continue to be a major driver of growth. We now hold ninth position in the ranking of pharmaceutical companies by sales of medicines in Japan. Despite the biennial government price cuts and increased intervention from the government to rapidly increase the volume share of generic products, Japan remains an attractive market for innovative pharmaceuticals.
Canada has a mixed public/private payer system for medicines that is funded by the provinces, insurers and individual patients. It has also now become common for public payers to negotiate lower non-transparent prices after they have gone through a review by the Canadian Agency for Drugs and Technology in Health, a health technology assessment body. Most private insurers pay full price although there is increasing pressure to achieve lower pricing. Overall, the split for AstraZeneca’s portfolio is 65% funded by private payers and 35% with public plans.
Our sales in Australia and New Zealand declined by 12% at actual rate of exchange (10% at CER) in 2016. This was primarily due to the continued erosion ofCrestor,Atacand andNexium by generic medicines. Sales declined less in 2016 than in 2015 as the pace of generic erosion has been
moderated while the sales growth from new products such asBrilinta and the Diabetes portfolio has started to pick up.Brilinta and the Diabetes portfolio grew by 18% (actual and CER) and 57% (actual and CER) respectively.
| * | Established ROW comprises Australia, Canada, New Zealand and Japan. |
Emerging Markets: expansion and collaboration
Emerging Markets, as defined in Market definitions on page 239, comprise various countries with dynamic, growing economies. As outlined in Marketplace from page 11, these countries represent a major growth opportunity for the pharmaceutical industry due to strong demand and sound economic fundamentals. Emerging Markets are not immune, however, to economic downturn. Market volatility is higher than in Established Markets and various political and economic challenges exist. These include regulatory and government interventions.
With revenues of $5,794 million, AstraZeneca was the fifth largest multinational pharmaceutical company, as measured by prescription sales, and the third fastest-growing top 10 multinational pharmaceutical company in Emerging Markets in 2016.
In China, AstraZeneca is the second largest pharmaceutical company in the hospital sector, as measured by sales. Sales in China in 2016 increased by 4% at actual rate of exchange (10% at CER) to $2,636 million (2015: $2,530 million). We delivered sales growth above the growth rate of the hospital market sector through strategic brands investment, systematic organisational capability improvements and long-term market expansion programmes in core therapy areas. The industry growth rate is expected to be moderated to high single digits, impacted by increased price pressure and hospital cost containment. Nevertheless, the healthcare environment in China remains dynamic. Opportunities are arising from incremental healthcare investment, strong underlying demand and the emergence of innovative medicines.
Growth drivers for Emerging Markets include our new medicines, notablyBrilinta andForxiga, and our Diabetes, Respiratory, Oncology and CV portfolios. To educate
| | |
| 50 | | AstraZenecaAnnual Report and Form 20-F Information 2016 |
| | | | |
 | | understand their priorities and requirements, and play a leading role in projects to align better the requirements of regulatory and health technology assessment (HTA) agencies or other organisations that provide value assessment of medicines. For example, we have a leading role in the European IMI ADAPT-SMART programme for exploring adaptive licensing. > We pursue aflexible pricing approach that reflects the wide variation in global healthcare systems. We have developed patient access programmes that are aligned with the ability to pay of patients and healthcare systems. We are committed to the appropriate use of managed entry schemes and the development of real world evidence and we are investigating innovative approaches to the pricing of medicines, such as payment for outcomes received by the patient and healthcare system. Pricing and access to healthcare  We continue to make our medicines affordable to more people on a commercially and socially sustainable basis. As, on average, almost half of medicine funding in emerging countries is paid for by the user or their families, we base our approach in these markets on an understanding of their economic circumstances and the burden placed on them by health costs. Our new pricing strategy addressing out-of-pocket funding, developed in 2016, focuses on two of our therapy areas, Respiratory and CVMD, and uses socio-economic evaluation on a country-by-country basis to determine affordable price points for self-pay patients based on ability to pay. Our efforts to price medicines affordably were seen by the Access to Medicine Foundation as an important step and, together with our approach to IP and our capacity building strategy in markets such as Brazil and China, contributed to our rise from 15th place in 2014 to 7th place in 2016 in the Foundation’s biennial Access to Medicine Index. For more information on our initiatives, see Healthy Heart Africa on page 49, affordability programme in Brazil on this page, and our Young Health Programme on page 53. We will continue to work with partners and patients to develop sustainable access initiatives for as many patients as possible. |
Brazil has large socio-economic disparities and, despite a universal healthcare system, the main source of funding for medicines remains the private sector, including individuals paying out-of-pocket. To improve access to our medicines, we have been exploring how we can use economic data to link an individual’s ability to pay with the price of our medicines, supporting our work with lifestyle and disease awareness advice. This latest approach builds on our Faz Bem programme, which has helped some 2.5 million patients since it was launched in 2008. 2.5m  Our Faz Bem programme in Brazil has helped some 2.5 million patients. | | physicians about our broad portfolio, we are selectively investing in sales capabilities where opportunities from unmet medical need exist. We are also expanding our reach through multi-channel marketing and external partnerships. Pricing and delivering value Our medicines help treat unmet medical need, improve health and create economic benefits. Effective treatments can lower healthcare costs by reducing the need for more expensive care, preventing more serious and costly diseases and increasing productivity. Nevertheless, and as outlined in Marketplace from page 11, we are acutely aware of the economic challenges faced by payers and remain committed to delivering value. We are committed to a pricing policy for our medicines based on four principles: > We determine the price of our medicines while considering their fullvalue for patients, payers and society. The agreement on price involves many national, regional and local stakeholders, reflecting factors such as clinical benefit, cost effectiveness, improvement to life expectancy and quality of life. > We aim to ensure thesustainability of both the healthcare system and our research-led business model. We believe we share a collective responsibility with healthcare providers and other stakeholders to work together to enable an efficient healthcare system for patients today and support a pipeline of new medicines for patients tomorrow. > We seek to ensure appropriate patientaccess to our medicines. We work closely with payers and providers to | |
| | | |
| | | |
| | |
| AstraZenecaAnnual Report and Form 20-F Information 2016 | | 51 |
Strategic Report | Business Review
Business Reviewcontinued
| | |
| |
| 3. Be a great place to work | |  |
Great people (see Employees from page 54) are central to our success and being a great place to work is at the heart of our efforts to release the talents of our people. We promote a culture, both for employees and those third parties with whom we work, that delivers sustainable good performance and long-term business success.
Overview
| | > | We continued to train employees on the ethical standards that govern the way we operate | |
| | > | We identified six confirmed breaches of external sales and marketing regulations or codes | |
| | > | We carried out 8,977 risk assessments on third parties as part of our risk management process | |
| | > | We are developing a health and wellbeing framework based on the WHO Healthy Workplace Model | |
| | > | Over 1.6 million young people across five continents were provided with skills and information to improve their health | |
Sales and marketing ethics 
We are committed to employing high ethical standards of sales and marketing practice worldwide, which are detailed in our Code of Conduct and supporting Global Policies on Ethical Interactions. Approximately 34,100 employees are engaged in our Commercial activities. We report publicly on the number of:
| > | confirmed breaches of external sales and marketing codes |
| > | breaches of our Code of Conduct, Global Policies or supporting requirements by employees and third parties in our Commercial Regions, and associated corrective actions. |
Alongside our Company Values, our Code of Conduct guides us on how we can make the best day-to-day choices on behalf of AstraZeneca and act in a consistent, responsible way, worldwide. There are two mandatory training courses dedicated to the
Code of Conduct; one is for new starters to introduce the Code, while the other is the annual training for all employees, which serves as an important reminder of our key commitments and principles.
During 2016, we continued to train employees on the ethical standards that govern the way we operate. We maintain a robust compliance programme in our efforts to ensure that there is compliance with all applicable laws, regulations and adopted industry codes, and that our business is operating with high ethical standards. Our compliance programme is delivered by dedicated compliance professionals who advise on and monitor adherence to our Code of Conduct, Global Policies and supporting requirements. These professionals also support our line managers locally, seeking to ensure that their staff meet our high ethical standards. A network of nominated signatories reviews our promotional materials and activities against applicable requirements. In 2016, audit professionals in Internal Audit Services also conducted compliance audits on selected marketing companies. When engaging third parties for sales and marketing activities or other services, we are committed to working with only those third parties who embrace high standards of ethical behaviour consistent with our own.
We identified six confirmed breaches of external sales and marketing regulations or codes in 2016 (2015: 11).
There were 1,729 instances, most of them minor, of non-compliance with our Code of Conduct, Global Policies or supporting requirements in our Commercial Regions, including instances by employees and third parties (2015: 1,749).
We removed a total of 222 employees and third parties from their roles as a result of these breaches (a single breach may involve more than one person). We also formally warned 429 others and provided further guidance or coaching on our policies to 1,283 more. The most serious breaches were raised with the Audit Committee.
The US Foreign Corrupt Practices Act investigation involving AstraZeneca was resolved in 2016 following a civil settlement agreed with the SEC; the DOJ closed its investigation without taking action against
the Company. More information about material legal proceedings can be found in Note 28 to the Financial Statements from page 185.
Transparency reporting
AstraZeneca is committed to the highest standards of conduct in all of our operations, including transparency in how we partner with physicians and medical institutions. In the US, our external transparency reporting meets the requirements of the Physician Payments Sunshine Act (Open Payments), as well as relevant state transparency laws. In Europe, AstraZeneca’s reporting meets the requirements of the European Federation of Pharmaceutical Industries and Associations (EFPIA) Disclosure Code, as well as applicable local transparency requirements.
Working with suppliers 
With most of our API manufacturing outsourced, we need an uninterrupted supply of high-quality raw materials. We therefore place great importance on our global procurement policies and integrated risk management processes. We purchase materials from a wide range of suppliers and work to mitigate supply risks, such as natural or man-made disasters that disrupt supply chains or the unavailability of raw materials. Contingency plans include using dual or multiple suppliers where appropriate, maintaining adequate stock levels and working to mitigate the effect of pricing fluctuations in raw materials.
We also seek to manage reputational risk. Our ethical standards are integral to our procurement and partnering activities and we continuously monitor compliance through assessments and improvement programmes. We work only with those suppliers whose standards of ethical behaviour are consistent with our own. We will not use suppliers who are unable to meet our standards.
To achieve this, we have an established process for third party risk management. This process assesses risk based upon defined criteria. These include risks related to bribery and corruption, data privacy, the environment and wages. Each step of the process provides an additional level of assessment, and we conduct more detailed assessments on those relationships identified as higher risk. Through this
| | |
| 52 | | AstraZenecaAnnual Report and Form 20-F Information 2016 |
risk-mitigation process, we seek to better understand the partner’s risk approach and seek to ensure the partner understands and can meet our standards. We conducted a total of 8,977 assessments in 2016, taking our total number of assessments to 21,622 since May 2014. Of these, 6,622 were in the Asia Pacific region, 6,488 in Europe and 5,712 in the Americas. The remaining 2,800 assessments relate to global suppliers and those based in the Middle East and Africa.
In 2016, we conducted 66 audits on high-risk suppliers, seeking to ensure that they employ appropriate practices and controls. Thirty two percent of suppliers met our expectations, with a further 42% implementing improvement plans to address minor instances of non-compliance. Through our due diligence process, we rejected 40 suppliers because of reputational concerns.
Safety, health and wellbeing 
We work to promote a safe, healthy and energising work environment for employees and partners. As outlined in our Safety, Health and Environment (SHE) strategy on page 45, we have established a set of safety, health and wellbeing targets aimed at supporting our people and keeping AstraZeneca among the sector leaders in SHE performance.
We made good progress against our new strategic targets in 2016, achieving a 16% reduction in the reportable injury rate and a 12% reduction in vehicle collision rate from 2015 baseline. Building on our previous success in establishing a culture of health and wellbeing, we are developing a health and wellbeing framework, based
| | |
| 21,000 | |  |
| Carried out more than 21,000 | |
supplier assessments since May 2014.
on the World Health Organization’s Healthy Workplace Model, which will give sites and marketing companies a blueprint for continuous improvement in this area.
In 2016, we carried out a number of activities and initiatives focused on delivery of improvements in key areas of concern, including driver safety, fall prevention, behavioural SHE, risk management, industrial hygiene and stress management. We also continued to focus on learning from incidents, using a dedicated website where all employees can access the learning to help ensure incidents are not repeated.
Vehicle collisions
| | | | | | | | |
| Year | | Collisions per million km | | | Target | |
| 2016 | | | 3.62 | | | | 4.00 | |
| 2015 | | | 4.13 | | | | 5.60 | |
|
Reportable injuries | |
| Year | | Reportable injury rate per million hours worked | | | Target | |
| 2016 | | | 1.45 | | | | 1.64 | |
| 2015 | | | 1.73 | | | | N/A | |
Community investment 
Our global community investment strategy focuses on healthcare in the community and science. For example, 2016 was the sixth year of our partnership with the UK educational charity Career Ready to support increased participation by 16- to 19-year-olds in science, technology, engineering and maths subjects.
In 2016, we spent a total of approximately $501 million (2015: approximately $680 million) on community investment sponsorships, partnerships and charitable donations worldwide, including our product donation and patient assistance programmes which make our medicines available free of charge or at reduced prices.
In 2016, we provided more than $466 million (2015: over $617 million) in savings to almost 200,000 patients in the US and Puerto Rico through our AZ&Me Prescription Savings
Program. Additionally, we donated over $20 million in products across multiple therapeutic areas to our NGO partners AmeriCares and Direct Relief International in support of public health needs and disaster relief.
Young Health Programme
We continued to develop the three strands of our Young Health Programme (YHP): on-the-ground programmes; advocacy; and research and evidence generation. Our on-the-ground programmes focus on the primary prevention of NCDs and associated adolescent risk behaviours. From 2010 to 2016, the programme has provided over 1.6 million young people in communities across five continents with the skills and information they need to improve their health. Over 47,000 of these young people have been trained to share this health information with their peers and the community. The programmes have also trained more than 12,600 frontline health workers in adolescent health. 2016 saw the launch of a programme in Kenya, the extension of the India programme to 2020 and a new programme in Canada. Further programmes are in development for 2017.
Further information on YHP can be found on its website, www.younghealthprogrammeyhp.com
Disaster relief
The British Red Cross continues to act as our global disaster relief partner, channelling the bulk of our disaster relief donations. In addition to the charitable donations referenced in Community investment above, in July 2016 we donated $200,000 via the British Red Cross to the Kuala Lumpur Emergency Response Unit, and $25,000 to replenish stocks of hygiene kits at the British Red Cross/Crescent Panama Warehouse following Hurricane Matthew.
| | |
| AstraZenecaAnnual Report and Form 20-F Information 2016 | | 53 |
Strategic Report | Resources Review
Resources Review

Overview
> 59,700 employees in more than 100 countries
> People strategy built around four key pillars: build and develop organisations and capabilities; develop a strong and diverse pipeline of leaders; drive a vibrant, high-performing culture; and generate a passion for people development
> Commit significant resources to establishing and defending our patent and related IP protections for inventions
> 31 sites in 18 countries where we are working on the development, manufacture and supply of our products
> Launched our Operations 2020 strategy to enhance supply capabilities in order to respond better to patient and market needs
> Three strategic R&D centres: in the US (Gaithersburg, MD); UK (Cambridge); and Sweden (Gothenburg). A total of nine R&D sites in five countries
> Our vision for IT focuses on areas that will enable competitive advantage for us
> Embedding our 2025 Safety, Health and Environment strategy into our business
To achieve our strategic priorities, we continue to acquire, retain and develop a talented and diverse workforce united in the pursuit of our Purpose and Values.
Overview
| | > | Hired 9,200 permanent employees to help us achieve our strategic priorities | |
| | > | Piloted an online Leading People development experience | |
| | > | Established a global target for all employees to have a development conversation with their manager and associated development plan | |
| | > | Increased the gender diversity of our leadership | |
| | > | Piloted a global Women as Leaders programme | |
We value the talents and skills of our employees and our people strategy supports our strategic priority of being a great place to work.
Build and develop organisations and capabilities
During 2016, we hired 9,200 permanent employees. An additional 200 employees joined us through acquisitions, most notably Takeda and Acerta Pharma. We are committed to hiring and promoting talent ethically and in compliance with applicable laws. Our policies and procedures are designed to help protect against discrimination on any grounds (including disability) and cover recruitment and selection, performance management, career development and promotion,
| | |
| 54 | | AstraZenecaAnnual Report and Form 20-F Information 2016 |
transfer, training, retraining (including retraining, if needed, for people who have become disabled), and reward. To help deliver our strategic priorities, we are identifying and recruiting emerging talent, as well as investing in internships and recruitment opportunities globally. For example, we conduct a global programme to hire recent graduates for our procurement, quality, engineering, IT and supply chain functions. We also have a graduate programme for IMED, which complements our established IMED Post Doctorate Programme for researcher recruitment. Additionally, we offer a 12-week internship opportunity for business school students to contribute to key initiatives in our Oncology therapeutic area.
Hiring over recent years means that employees with less than two years’ service now represent 30% of our global workforce (up from 20% in 2012). This provides a greater balance in terms of refreshing talent and retaining organisational experience. The composition of our international workforce has also changed with our business focus. This can be seen in the Sales and Marketing figures to the right, which shows a greater concentration in Emerging Markets.
Voluntary employee turnover increased marginally to 9.6% in 2016 from 8.6% in 2015 (restated 2015 number). The voluntary employee turnover rate among our high performers also increased in 2016 to 6.1%. We seek to reduce regretted turnover through more effective hiring and induction, high-level reviews of resignations, risk assessments and retention plans.
| | |
| Develop a strong and | | |
| diverse pipeline of leaders | |
To foster innovation, we seek to harness different perspectives, talents and ideas as well as ensuring that our employees reflect the diversity of the communities in which we operate.
During 2016, we implemented new talent management and succession planning processes. This focused on the deliberate identification, sourcing and accelerated development of our highest potential talent, seeking to ensure that we have credible successors with the capabilities and experiences necessary for our business critical roles.

We continue to focus on diversity and inclusion with a goal to increase the presence of women on our leadership teams. In 2016, we piloted a European Women as Leaders experience to support the accelerated development of high potential women in AstraZeneca. In 2017, this programme will be offered globally. As shown in the gender diversity figure on the next page, women comprise 49.9% of our global workforce. There are currently three women on our Board (30%). Below Board level, the representation of women in senior roles (ie roles at Career Level F or above which constitute the six highest bands of our employee population) increased to 43.2% in 2016, which exceeded our Scorecard target of 42.5% for this measure and compares favourably to external benchmarks.
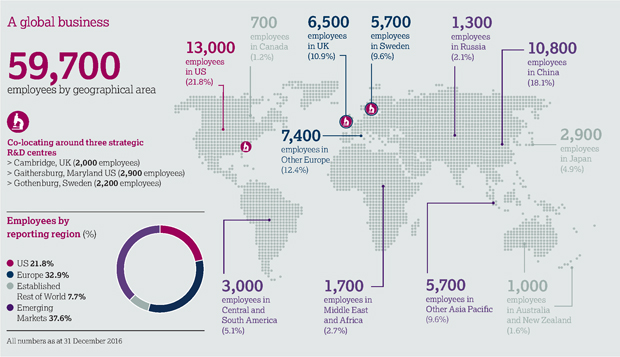
| | |
| AstraZenecaAnnual Report and Form 20-F Information 2016 | | 55 |
Strategic Report | Resources Review
Resources Reviewcontinued
We continue to develop high-quality leaders. In 2016, 15% of the approximately 130 leadership roles that report to our senior leadership team were either promoted into the leadership population, or moved roles within the leadership population. To ensure our senior leadership reflects our diverse geographic footprint, we track the country of origin of senior leaders and reflect this in our diversity targets. In 2016, 14.5% of leadership roles that report to our senior leadership team have a country of origin that is an Emerging Market or Japan (an increase from 5% in 2012).
Drive a vibrant, high-performing culture
Continuing our emphasis on high performance, in 2016, we extended our single global performance management framework and approach to cover 94% of the workforce. We also implemented a global annual salary and incentive review process which covers 60% of the workforce. We require every employee to have high quality objectives, aligned to our strategy, which we monitor closely. Managers are accountable for working with their employees to develop individual and team performance targets, and for ensuring employees understand how they contribute to our overall business objectives.
Equally important are our performance-related bonus and incentive plans. We encourage participation in various employee share plans, some of which are described in the Directors’ Remuneration Report from page 103, and also in Note 27 to the Financial Statements, from page 182.
Employee opinion surveys help us measure employee satisfaction and engagement and how we are doing in our aim of being a great place to work. Our most recent survey, carried out in December 2016, showed a decline compared to the survey at the start of the year in scores for all 10 items common to both surveys. Although this might not be unexpected given the action we are taking to reshape our business to improve long-term competitiveness, we are continuing to focus on improving areas identified in our surveys as being important drivers of employee engagement. For example, we are driving our agenda around people development, encouraging improved dialogue between colleagues and their line managers on development. We have also continued our efforts to simplify the work environment for colleagues, whether this be through simplifying business processes or improving the IT tools we use in the workplace.
Gender diversity
| * | For the purposes of section 414C(8)(c)(ii) of the Companies Act 2006, ‘Senior Managers’ are the SET, the directors of all of the subsidiaries of the Company and other individuals holding named positions within those subsidiaries. |
Generate a passion for
people development
We encourage employees to take ownership of their own development and encourage leaders to spend time supporting their employees’ development. To support this, in 2016 we implemented a global platform to increase the visibility and accessibility of job opportunities.
We strive to attract talent by offering rewarding careers that connect the potential of our people with the capabilities required by our business. We are focusing on ensuring development opportunities are available to all employees, alongside our investment in our highest potential talent. In 2016, we piloted a new best-practice technology-enabled leadership experience, rooted in social learning, with 180 supply and manufacturing leaders based in West Chester and Mount Vernon in the US, and Vorsino in Russia. This experience can be accessed on any device at any time, with the goal of implementing global technology enabled development programmes in 2017.
Human rights 
We are committed to respecting and promoting international human rights – not only in our own operations, but also in our wider spheres of influence (such as our third party providers). To that end, we integrate human rights considerations into our policies, processes and practices. We are also committed to ensuring that there is no modern slavery or human trafficking in our supply chains or any part of our business. Our full statement required under section 54 of the UK Modern Slavery Act will be published on our website, www.astrazeneca.com, later in 2017.
We support the principles set out in the United Nations Universal Declaration of Human Rights and the International Labour Organization’s (ILO) standards on child labour and minimum wages. We are also members of the United Nations Global Compact on Human Rights.
In 2016, we began conducting our third biennial Human Rights labour review in all countries where we have a presence. The review focuses on ILO core themes, including freedom of association and collective bargaining, child labour,
| | |
| 56 | | AstraZenecaAnnual Report and Form 20-F Information 2016 |
discrimination, working hours and wages, including questions on the Living Wage. Where a gap to ILO minimum standards is identified, we will put in place local plans to close those gaps. In 2016, AstraZeneca became accredited with the Living Wage Foundation in the UK and will treat this as an experience to be evaluated alongside all other associated evidence in respect of seeking a global solution, for example, monitoring impact on our cost base.
Managing change 
In 2013, we announced plans to invest in three strategic R&D centres as outlined in Organisation on page 42. This affected employees in the US and the UK. We encouraged and supported employees to relocate and have made good progress. For example, as at 31 December 2016, 2,000 employees were working in Cambridge and, of these employees, 500 have relocated from other sites in the UK. In addition to the 750 employees hired in 2015 and 2016, we expect to hire a further approximately 350 employees in Cambridge in 2017. We are using interim infrastructure in and around Cambridge to house these employees until our new site is ready. For employees who do not accept offers to relocate to Cambridge, we provide career support, outplacement support and competitive severance packages.
| | |
| | For more information on Cambridge, see page 7; on our restructuring programme, please see Restructuring from page 69 and Financial Review from page 62 |
Employee relations
We seek to follow a global approach to employee relations guided by global employment principles and standards, local laws and good practice. We work to develop and maintain good relations with local workforces and work closely with our recognised national trade unions. We also regularly consult with employee representatives or, where applicable, trade unions, who share our aim of retaining key skills and mitigating job losses.
Intellectual Property
Discovering and developing medicines requires a significant investment of resources by research-based pharmaceutical companies. The process can take a decade or more. For this to be a viable investment, new medicines must be safeguarded from being copied with a reasonable amount of certainty for a reasonable period of time.
Our industry’s principal economic safeguard is a well-functioning patent system that recognises our efforts and rewards innovation with appropriate protection – and allows time to generate the revenue we need to reinvest in pharmaceutical innovation. Patent rights are limited by territory and duration. A significant portion of a patent’s duration can be spent during R&D, before it is possible to launch the protected product. Therefore, we commit significant resources to establishing and defending our patent and related IP protections for inventions.
Patent process
We file patent protection applications for our inventions to safeguard the large investment required to obtain marketing approvals for potential new drugs. As we further develop a product and its uses, these new developments may necessitate new patent filings. We apply for patents through government patent offices around the world. These assess whether our inventions meet the strict legal requirements for a patent to be granted. Our competitors can challenge our patents in patent offices and/or courts. We may face challenges early in the patent application process and throughout a patent’s life. The grounds for these challenges could be the validity of a patent and/or its effective scope and are based on ever-evolving legal precedents. We are experiencing increased challenges in the US and elsewhere in the world (such as in Australia, Brazil, Canada, China, Europe and Japan) and there can be no guarantee of success for either party in
patent proceedings. For information about third party challenges to patents protecting our products, see Note 28 to the Financial Statements from page 185. For more information on the risks relating to patent litigation and early loss and expiry of patents, please see Risk from page 214.
The basic term of a patent is typically 20 years from the filing of the patent application with the relevant patent office. However, a product protected by a pharmaceutical patent may not be marketed for several years after filing, due to the duration of clinical trials and regulatory approval processes. Patent Term Extensions (PTE) are available in certain major markets, including the EU and the US, to compensate for these delays. The term of the PTE can vary from zero to five years, depending on the time taken to obtain any marketing approval. The maximum patent term, when including PTE, cannot exceed 15 years (EU) or 14 years (US) from the first marketing authorisation.
Patent expiries
The tables on pages 211 to 213 set out certain patent expiry dates and sales for our key marketed products.
Other exclusivities
In addition to patent protection, regulatory data protection (RDP or ‘data exclusivity’) is an important IP right, which arises in respect of data which is required to be submitted to regulatory authorities to obtain marketing approvals for our medicines. Significant investment is required to generate such data (for example, through conducting global clinical trials) and this proprietary data is protected from use by third parties (such as generic manufacturers) for a number of years in a limited number of countries. The period of such protection, and the extent to which it is respected, differs significantly among countries. RDP is an important protection for our products, and we strive to enforce our rights to it, particularly as patent rights are increasingly being challenged.
The RDP period starts from the date of the first marketing approval from the relevant regulatory authority and runs parallel to any patent protection. RDP generally expires prior to patent expiry in all major markets.
| | |
| AstraZenecaAnnual Report and Form 20-F Information 2016 | | 57 |
Strategic Report | Resources Review
Resources Reviewcontinued
If a product takes an unusually long time to secure marketing approval, or if patent protection has not been secured, has expired or has been lost, then RDP may be the sole IP right protecting a product from copying. Generic manufacturers should not be allowed to rely on AstraZeneca’s data to support the generic product’s approval or marketing until the RDP right has expired. In the EU, the RDP period is eight years followed by two years’ marketing exclusivity.
In the US, new chemical entities (NCEs) are entitled to a period of five years’ exclusivity under the Federal Food, Drug and Cosmetic Act. This period of exclusivity runs parallel to any pending or granted patent protection and starts at the approval of the new application. As with RDP, there are circumstances where this protection could be the sole IP right protecting a product from being copied. Further, under the Biologics License Application process, the FDA will grant 12 years’ data exclusivity for a new biologic to an innovator manufacturer.
Under Orphan Drug laws in the EU and US, exclusivity is granted to an innovator who gains approval for a pharmaceutical product developed to treat a rare disease. What qualifies as a rare condition differs between the EU and US. Qualifying Orphan Drugs are granted 10 years’ market exclusivity in the EU and seven years’ market exclusivity in the US.
Compulsory licensing
Compulsory licensing (where a Patent Authority imposes a licence on the Patentee) is on the increase in certain markets in which we operate. We recognise the right of developing countries to use the flexibilities in the World Trade Organization’s Agreement on Trade-Related Aspects of Intellectual Property Rights (including the Doha amendment) in certain circumstances, such as a public health emergency. We believe this should apply only when all other ways of meeting the emergency needs have been considered and where healthcare frameworks and safeguards exist to ensure the medicines reach those who need them.
Manufacturing
Our 2020 strategy provides a focus for our investments to help ensure we are able to respond to patient and market needs for our medicines.
Overview
| | > | Operations 2020 strategy started with a number of global initiatives in 2016 | |
| | > | Biologics manufacturing footprint increased in preparation for new product launches | |
| | > | The Pharmaceutical Technology & Development teams have been integrated into Operations to enhance the way we design, develop, manufacture and launch new products | |
Strategy
Operations 2020 strategy was launched in 2015 to enhance supply capabilities in order to respond better to patient and market needs. Our strategy focuses on supporting the delivery of our new product launches, strengthening our science and technology capabilities across the globe, creating a more agile and flexible supply chain, and embedding Lean principles throughout our network. Our objective is to be recognised as a leader in biopharmaceutical supply chain by the end of 2020.
Quality, regulation and compliance
We are committed to high product quality, which underpins the safety and efficacy of our medicines. We maintain a comprehensive quality management system to assure compliance and quality. Similarly, we set strict standards for safety, health and environment at each of our sites. Manufacturing facilities and processes are subject to rigorous and continuously evolving regulatory standards. They are subject to inspections by regulatory authorities, who are authorised to mandate improvements to facilities and processes, halt production and impose conditions for production to resume.
In 2016, we hosted 33 independent inspections from 18 regulatory authorities. We reviewed observations from these
inspections together with the outcomes of internal audits and, where necessary, implemented improvement actions.
We are committed to maintaining the highest ethical standards and compliance with internal policies, laws and regulations. We review and comment upon evolving national and international compliance regulations through our membership of industry associations including IFPMA, EFPIA and PhRMA.
Pharmaceutical Technology &
Development (PT&D)
In January 2016, the integration of PT&D into Global Operations commenced to support further and accelerate successive new product launches, new device platforms and manage an increase in the overall product portfolio complexity. The integration is also expected to enhance collaboration and alignment and our focus on late-stage development, adding substantial scientific expertise and leadership to Operations.
We are actively working on over 150 drug projects across our R&D and Commercial portfolios, supporting more than 300 AstraZeneca clinical studies worldwide and an additional 400 External Sponsored Research studies. We also support over 100 in-line brands and small molecule products.
Our continued science and technology innovation allows us to enable and differentiate products includingLynparza,Tagrisso, acalabrutinib,Brilinta and new respiratory products such as PT010 as they are introduced into the marketplace and ultimately into the hands of patients globally.
Manufacturing capabilities
Our principal tablet and capsule formulation sites are in the UK, Sweden, China, Puerto Rico and the US, with local/regional supply sites in Russia, Japan, Indonesia, Egypt, India, Germany, Mexico, Brazil, Argentina and Algeria. We also have major formulation sites for the global supply of parenteral and/or inhalation products in the US, Sweden, France, Australia and the UK. Most of the manufacture of API is delivered through the efficient use of external sourcing that is complemented by internal capability in Sweden.
| | |
| 58 | | AstraZenecaAnnual Report and Form 20-F Information 2016 |

We are investing in our supply network, with a focus on increasing production capacity to support the growing demand for biologics. The addition of three new high-tech biologics manufacturing facilities (Gärtuna in Sweden (above), and Boulder and Longmont, both in Colorado in the US) to our supply network will leave us well-positioned for the future.
| | |
| 8,400 | |  |
Around 8,400 employees in our R&D organisation. | |
For biologics, our principal commercial manufacturing facilities are in the US (Frederick, Maryland; Greater Philadelphia, Pennsylvania; Boulder and Longmont, Colorado), the UK (Speke), and the Netherlands (Nijmegen) with capabilities in process development, manufacturing and distribution of biologics, including global supply of MAbs and influenza vaccines.
We are developing our manufacturing capability in biologics and expect our bulk manufacturing facility in Boulder, Colorado US to be licensed for commercial production by the end of 2017. In Sweden, we expect our new $285 million biologics manufacturing facility to be available for clinical trial programmes by the end of 2018 and fully operational by 2019. These projects, in addition to an expansion plan at Frederick, Maryland US, will increase production capacity to support the growing demand for biologics, which represents about half of our development pipeline. We acquired our facility in Longmont, Colorado US, in 2016 which will both support our operations in Boulder and provide space for additional biologics expansion as required.
For small molecules we are constructing a new small scale development and launch facility alongside our existing manufacturing facility in Wuxi, China. In addition, regulatory validation work continues at Vorsino, Russia, which opened in 2015. First commercial production commenced in early 2016, improving our ability to supply local markets.
At the end of 2016, approximately 12,200 people were employed at 31 Operations sites in 18 countries.
R&D resources
We have approximately 8,400 employees in our R&D organisation, working in various sites around the world.
Our small molecule sites are located in the UK (Alderley Park, Cambridge and Macclesfield), Sweden (Gothenburg), the US (Gaithersburg, Maryland, Waltham, Massachusetts and California), Japan (Osaka) and China (Shanghai). Our biologics sites are located in the UK (Cambridge) and in the US (Gaithersburg, Maryland and California). Our Gaithersburg, Maryland US; Cambridge, UK; and Warsaw, Poland sites focus on late-stage development for small molecules and biologics across our entire portfolio.
In 2016, R&D expenditure was $5,890 million in our R&D organisation (2015: $5,997 million; 2014: $5,579 million), including core R&D costs of $5,631 million (2015: $5,603 million; 2014: $4,941 million). In addition, we spent $821 million on acquiring product rights (such as in-licensing) (2015: $1,341 million; 2014: $907 million). We also invested $178 million on the implementation of our R&D restructuring strategy (2015: $258 million; 2014: $497 million). The allocations of spend by early-stage and late-stage development are presented in the R&D spend analysis table below.
R&D spend analysis
| | | | | | | | | | | | |
| | | 2016 | | | 2015 | | | 2014 | |
| Discovery and early-stage development | | | 36% | | | | 39% | | | | 47% | |
| Late-stage development | | | 64% | | | | 61% | | | | 53% | |
| | |
| AstraZenecaAnnual Report and Form 20-F Information 2016 | | 59 |
Strategic Report | Resources Review
Resources Reviewcontinued
Information technology and information services resources
Our continuing vision for IT is to focus on areas that may provide a competitive advantage for AstraZeneca.
At the end of 2016, we successfully completed our three-year IT Transformation Programme. The wide-ranging programme has delivered improved productivity, efficiency, responsiveness and innovation allowing us to better support our business priorities while at the same time significantly reducing cost.
First, to implement our vision for IT, we seek to identify, prioritise and drive adoption of new technologies to support the business and enable our science. Second, we aim to make significant investments in data and analytics to allow the business to manage information more effectively in order to drive faster, more effective decision making. Finally, we seek to drive operational excellence and improvements in the performance, stability, security and cost of the underlying application landscape and infrastructure of our IT.
Protecting our IT systems, IP and confidential information against cyberattacks is a key concern. Our IT organisation seeks continuous improvement of our IT protection by developing and implementing robust, effective and agile risk-based approaches to protect our resources and keep pace with the rapidly evolving cybersecurity risk landscape. To help guard against cybercrime, we have adopted a comprehensive cybersecurity process and policy, which we regularly review and update. We monitor our systems and data with sophisticated technology to identify and address potential weaknesses in the management of cybersecurity risk.
At the end of 2016, our IT organisation comprised approximately 3,500 people across our sites in the UK, Sweden, the US, and our new technology centres in India (Chennai) and Mexico (Guadalajara).
Environment
We follow the science to protect the planet by managing our impact on the environment across all our operations.
Overview
| | > | Independent verification of science-based climate change targets and commitment to responsible water stewardship | |
| | > | 2016 greenhouse gas footprint reduced by 5% | |
| | > | 2016 waste management generation increased by 1% | |
| | > | 2016 water consumption performance reduced by 5% | |
Natural resource efficiency 
As outlined in Safety, Health and Environment strategy on page 45, we have begun work on delivering our 2016 to 2025 Safety, Health and Environment (SHE) targets. Our 2016 natural resource targets included reducing:
| > | operational greenhouse gas footprint by 2% to 1,708,335 tonnes CO2e |
| > | waste generation by 2% to 36,760 tonnes |
| > | water use by 2% to 4.13 million m3. |
The table to the right provides data on our global greenhouse gas emissions, waste production and water consumption for 2016. The data coverage includes 100% of our owned and controlled sites globally. 2015 data was recalculated to include acquired sites that form part of the 2016 to 2025 strategy baseline.
We continue to integrate environmental considerations across a medicine’s entire life-cycle, from discovery, R&D to manufacturing, commercialisation and disposal. This considers the natural resources used to manufacture our products and the environmental impact of our active pharmaceutical ingredients (APIs).
We are working to reduce our greenhouse gas emissions by, among other things, investment in improving energy and fuel efficiency and pursuing lower-carbon alternatives to fossil fuels, utilising a hierarchy approach of Avoid-Reduce-Substitute. During 2016, site energy use improved to reduce consumption by 0.2% and procurement of electricity from certified renewable sources increased to represent 58% of total electricity imports. Our travel and freight transport emissions decreased due to reduced business air travel, increased fuel efficiency of our commercial sales fleet and continued achievement in switching freighting of goods from air to sea.
Operational greenhouse gas footprint
emissions(tonnes CO2e)
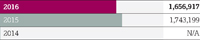
Waste production(tonnes)

Water use(million m3)

| | |
| 60 | | AstraZenecaAnnual Report and Form 20-F Information 2016 |
| | | | |
 | | We recognise the need to use water responsibly and, where possible, to minimise water use in our facilities. In 2016, we targeted a 2% reduction from our 2015 water use. In 2016, our water footprint was 3.99 million m3, a 5% reduction. This was achieved in part by investing in water efficiency projects such as the reclamation and reuse of water at a number of our manufacturing sites in Australia and the US. During 2016, our major sites completed Water Conservation Plans and we standardised the assessment of water stress across our network, enabling prioritisation of water efficiency in areas where water scarcity is of greatest concern. We are also working on measuring and reporting the environmental impact of our external manufacturing activity and work to set appropriate environmental targets with our suppliers. We capture data for more than 90% (based on spend) of the globally managed outsourced manufacture of key intermediates and APIs, formulation and packaging for our established brands. Understanding and management of our external supplier footprint will be a continued focus of our SHE commitment going forward. With regard to pharmaceuticals in the environment (PIE), we manage the manufacturing emissions of our APIs in a responsible manner to ensure that we do not exceed the safe discharge standards set for our own manufacturing sites and those of key suppliers. We review compliance with these safe discharge standards annually. Using a concept called ‘ecopharmacovigilance’, we review emerging science and literature for new information that might change the way we assess and manage any environmental risks associated with our products. Our proactive SHE research also addresses some of the key risks posed by PIE. In 2016, we signed an industry declaration presented to the United Nations General Assembly ensuring the responsible use, patient access and production of antibiotics to help combat the threat of antimicrobial resistance.  Further information, including environmental risk assessment data for our medicines, is available on our website, Further information, including environmental risk assessment data for our medicines, is available on our website,
www.astrazeneca. com/sustainability/environmental-sustainability.html
|
We were one of only four FTSE 350 companies to have had our climate change targets approved by the Science Based Targets initiative which is a partnership with CDP, the UN Global Compact, World Resources Institute, and World Wide Fund for Nature. The initiative seeks to create a systematic change in how targets are set, so that companies contribute their fair share of the challenging emissions reduction needed to limit global temperature increase to under two degrees centigrade. | | Our pMDI inhaler therapy relies on hydrofluoroalkane (HFA) propellants which affects our greenhouse gas footprint. While HFAs have no ozone depletion potential and a third or less of the global warming potential than the chlorofluorocarbons they replace, they are still potent greenhouse gases. During 2016, we continued to explore practical opportunities to reduce the climate impact of these devices while continuing to fulfil patient needs. Including emissions from patient use of our inhaler therapies, our aim by 2016 was to reduce our operational greenhouse gas footprint by 2% from our 2015 level. We achieved this, with our operational greenhouse gas footprint totalling 1,656,917 metric tonnes in 2016, a reduction of 5% from our 2015 baseline. For more information on carbon reporting, please see Sustainability: supplementary information from page 231 Waste management is another key aspect of our commitment to minimise environmental impact. In 2016, we targeted a 2% reduction in waste generation from our 2015 baseline. In 2016, our total waste was 37,923 metric tonnes, a 1% increase on 2015. Although we initiated waste reduction projects, such as major investment to enable solvent reuse at a Swedish manufacturing site, these were insufficient to offset the increase in activity across our network. While waste prevention is an essential goal, we seek to maximise treatment by material recycling and avoiding landfill disposal when prevention is impractical. | |
| | | |
| | | |
| | |
| AstraZenecaAnnual Report and Form 20-F Information 2016 | | 61 |
Strategic Report | Financial Review
Financial Review
In 2016, continued growth in Emerging Markets and Diabetes, coupled with strong sales of our New Oncology medicines and further progress forBrilinta, resulted in a 4% increase (CER: 5% increase) in our Growth Platform Sales.
However, the continued effect of patent expiries, in particular the US entry of Crestor generic medicines, resulted in a decline in Total Revenue of 7% (CER: decline of 5%) in the year. Our continued focus on cost discipline delivered a decrease of 2% (CER: increase restricted to 2%) in Reported R&D costs and stable (CER: increase restricted to 5%) Core R&D costs, despite the absorption of Acerta Pharma and ZS Pharma costs. The decline of 15% (CER: decline of 12%) in Reported SG&A costs, which also benefited from fair value adjustments to long-term liabilities, and the decline of 12% (CER: decline of 9%) in Core SG&A costs, reflected the evolving shape of the business and efficiency savings. This, combined with a non-recurring benefit resulting from agreements on transfer pricing between various tax authorities, delivered Reported EPS of $2.77 and Core EPS of $4.31.
Product Sales in Emerging Markets were stable compared to 2015 (CER: grew by 6%) in the year at $5.8 billion, against a background of challenging macro-economic conditions in Latin America. We have reduced our activities in Venezuela and there were also cuts in healthcare spending
in Saudi Arabia. However, China maintained growth of 4% (CER: growth of 10%), ahead of the overall market, and Russia grew at 1% (CER: growth of 13%).
Our Diabetes franchise grew by 9% (CER: grew by 11%) to $2.4 billion and Farxiga became our largest-selling diabetes medicine, consolidating its position as global leader in the SGLT2 class.Brilinta sales increased by 36% (CER: increased by 39%) to $839 million, reflecting updated preferred guidelines from the American College of Cardiology and the American Heart Association. In addition, sales of our New Oncology medicines reached $664 million in the year, withTagrisso andLynparza growing strongly. Respiratory declined by 5% (CER: declined by 3%) in the year, impacted by US pricing pressure onSymbicort. Japan Product Sales increased by 8% (CER: declined by 3%).
Patent expiries continued to impact negatively in our Established Markets and more than offset the performance of the Growth Platforms. US sales fell by 22% to $7.4 billion and reflected the competition from genericCrestor medicines that entered the US market from July and the continued decline ofNexium sales following the loss of US exclusivity in 2015. Sales in Europe were down by 5% (CER: down 3%) and sales in other Established Markets grew by 2% (CER: fell by 4%).
Product Sales were supplemented by $1.7 billion of Externalisation Revenue arising from partnerships including the global agreement with Aspen for the commercial rights to the anaesthetics portfolio and local agreements in China forPlendil and in the US forToprol-XL. The level of sustainable and ongoing income from such partnerships and collaborations has continued to increase during 2016.
Excluding the impact of Externalisation Revenue, the Reported Gross Profit margin was broadly stable in the year, with lower restructuring and amortisation charges offset by the adverse impact from the mix of sales and a write-down ofFluMist inventory in the US. Excluding the lower restructuring and amortisation charges, Core Gross Profit margin declined by one percentage point to 82%.
Reported Other Operating Income was $1.7 billion in the year and included receipts from the divestments of the small molecule antibiotics business to Pfizer andRhinocortAqua to Cilag.
Reported Operating Profit increased by 19% (CER: increased by 9%) to $4.9 billion and Core Operating Profit declined by 3% (CER: declined by 7%) to $6.7 billion. Reported earnings per share increased by 24% (CER: increased by 9%) to $2.77 and Core earnings per share increased by 1% (CER: declined by 5%) to $4.31. Both Reported and Core EPS included a non-recurring benefit of $0.36, following agreements between the Canadian tax authority and the UK and Swedish tax authorities in respect of transfer pricing arrangements for the period from 2004 to 2016.
We generated a net cash inflow from operating activities of $4.1 billion in the year with a continued improvement in working capital investment. We maintain a strong, investment-grade credit rating and, in May, issued a total of $2.5 billion of loans for general corporate purposes. We ended the year with net debt of $10.7 billion.

Marc Dunoyer
Chief Financial Officer
| | |
| 62 | | AstraZenecaAnnual Report and Form 20-F Information 2016 |
The purpose of this Financial Review is to provide a balanced and comprehensive analysis of the financial performance of the business during 2016, the cash flow and liquidity position of the business, the financial position as at the end of the year, and the main business factors and trends which could affect the future financial performance of the business.
Business background and results overview
The business background is covered in the Marketplace section from page 11, the Therapy Area Review from page 23 and the Geographical Review from page 226, and describes in detail the developments in both our products and the geographical regions in which we operate.
As described earlier in this Annual Report, sales of our products are directly influenced by medical need and are generally paid for by health insurance schemes or national healthcare budgets. Our operating results can be affected by a number of factors other than the delivery of operating plans and normal competition, such as:
| > | The risk of competition from generics following loss of patent protection or patent expiry of one of our products or an ‘at risk’ launch by a competitor or the launch of a generic competitor in the same class as one of our products, with the potential adverse effects on sales volumes and prices. Details of patent expiries for our key marketed products are included in Patent Expiries of Key Marketed Products from page 211. |
| > | The adverse impact on pharmaceutical prices as a result of the macroeconomic and regulatory environment. For instance, although there is no direct governmental control on prices in the US, action from federal and individual state programmes and health insurance bodies is leading to downward pressures on realised prices. In other parts of the world, there is a variety of price and volume control mechanisms and retrospective rebates based on sales levels that are imposed by governments. |
| > | The timings of new product launches, which can be influenced by national regulators, and the risk that such new products do not succeed as anticipated, together with the rate of sales growth and costs following new product launches. |
| > | Currency fluctuations. Our functional and reporting currency is the US dollar, but we have substantial exposures to other currencies, in particular the euro, Japanese yen, pounds sterling, Chinese renminbi and Swedish krona. |
| > | Macro factors such as greater demand from an ageing population and increasing requirements of Emerging Markets. |
Over the longer term, the success of our R&D is crucial and we devote substantial resources to this area. The benefits of this investment are expected to emerge over the long term and there is considerable inherent uncertainty as to whether and when it will generate future products.
The most significant features of our financial results in 2016 are:
| > | Total Revenue down 7% to $23,002 million (CER: down 5%). Product Sales were down 10% (CER: down 8%) reflecting the entry in the US of multipleCrestor generic medicines, as well as the reducing impact ofNexium generic medicines in the US and the impact of pricing pressure in the US onSymbicort. Product Sales ofCrestor,Nexium andSymbicort in the US declined by 57%, 39% and 18% respectively. |
| > | Revenues of our Growth Platforms increased 4% (CER: increased 5%) and constituted 63% of our Total Revenue, with |
| | – | Emerging Markets flat at actual exchange rates (CER: 6% growth) supported by China, up by 4% (CER: up by 10%) |
| | – | Diabetes up 9% (CER: up 11%), which included growth of 70% (CER: growth of 72%) onFarxiga which became our largest-selling diabetes medicine |
| | – | Japan up 8% (CER: down 3%) to $2,184 million |
| | – | Brilinta Product Sales up 36% (CER: up 39%) to $839 million |
| | – | Respiratory down 5% (CER: down 3%) reflecting an 18% fall in US Product Sales ofSymbicort |
| | – | New Oncology Product Sales of $664 million. |
| > | Reported operating profit was up 19% (CER: up 9%) to $4,902 million (2015: $4,114 million). The increase reflected the reduction in SG&A costs, largely due to fair value gains on contingent consideration and lower legal charges. This reduction in SG&A costs more than offset the decline in Product Sales, while we continued to invest in our pipeline and Growth Platforms. |
| > | Revaluations of contingent consideration resulted in a reduction of $1,158 million in SG&A costs in the year, and included a decrease of $999 million relating to the acquisition of BMS’s share of the Global Diabetes Alliance, based on revised milestone probabilities, and revenue and royalty forecasts. Total restructuring costs associated with the global programme to reshape the cost base of our business were $1,107 million in 2016. |
| > | Core operating profit was down 3% (CER: down 7%) to $6,721 million (2015: $6,902 million). |
| > | Reported operating margin of 21.3% of Total Revenue was up 4.6 percentage points (CER: 2.6 percentage points). Core operating margin was 29.2% of Total Revenue (2015: 27.9%). |
| > | Reported EPS was up 24% (CER: up 9%) to $2.77. Core EPS for the full year was $4.31, up 1% (CER: down 5%). |
| > | Dividends paid amounted to $3,561 million (2015: $3,486 million). |
| | |
| AstraZenecaAnnual Report and Form 20-F Information 2016 | | 63 |
Strategic Report | Financial Review
Financial Reviewcontinued
Measuring performance
The following measures are referred to in this Financial Review when reporting on our performance both in absolute terms, but more often in comparison to earlier years:
| > | Reported performance. Reported performance takes into account all the factors (including those which we cannot influence, such as currency exchange rates) that have affected the results of our business, as reflected in our Group Financial Statements prepared in accordance with IFRSs as adopted by the EU and as issued by the IASB (IFRS). |
| > | Core financial measures. These are non-GAAP measures because, unlike Reported performance, they cannot be derived directly from the information in the Group Financial Statements. These measures are adjusted to exclude certain significant items, such as |
| | – | amortisation and impairment of intangibles, including impairment reversals but excluding any charges relating to IT assets |
| | – | charges and provisions related to our global restructuring programmes (this includes such charges that relate to the impact of our global restructuring programmes on our capitalised IT assets) |
| | – | other specified items, principally comprising legal settlements and acquisition-related costs which include fair value adjustments and the imputed finance charge relating to contingent consideration. |
In determining the adjustments to arrive at the Core result, we use a set of established principles relating to the nature and materiality of individual items or groups of items, excluding, for example, events which (i) are outside the normal course of business, (ii) are incurred in a pattern that is unrelated to the trends in the underlying financial performance of our ongoing business, or (iii) are related to major acquisitions, to ensure that investors’ ability to evaluate and analyse the underlying financial performance of our ongoing business is enhanced. See the 2016 Reconciliation of Reported results to Core results table on the opposite page for a reconciliation of Reported to Core performance.
| > | Constant exchange rate (CER) growth rates. These are also non-GAAP measures. These measures remove the effects of currency movements |
| | (by retranslating the current year’s performance at previous year’s exchange rates and adjusting for other exchange effects, including hedging). A reconciliation of the Reported results adjusted for the impact of currency movements is provided in the 2016 Reported operating profit table on the page opposite. |
| > | Gross and operating margin percentages. These measures set out the progression of key performance margins and illustrate the overall quality of the business. |
| > | Prescription volumes and trends for key products. These measures can represent the real business growth and the progress of individual products better and more immediately than invoiced sales. |
| > | Net funds/debt. This represents our cash and cash equivalents, current investments and derivative financial instruments less interest-bearing loans and borrowings. |
We strongly encourage readers of the Annual Report not to rely on any single financial measure but to review our financial statements, including the notes thereto, and our other publicly filed reports, carefully and in their entirety.
CER measures allow us to focus on the changes in revenues and expenses driven by volume, prices and cost levels relative to the prior period. Revenues and cost growth expressed in CER allows management to understand the true local movement in revenues and costs, in order to compare recent trends and relative return on investment. CER growth rates can be used to analyse revenues in a number of ways but, most often, we consider CER growth by products and groups of products, and by countries and regions. CER revenues growth can be further analysed into the impact of revenues volumes and selling price. Similarly, CER cost growth helps us to focus on the real local change in costs so that we can manage the cost base effectively.
We believe that disclosing Core financial and growth measures, in addition to our Reported financial information, enhances investors’ ability to evaluate and analyse the underlying financial performance of our ongoing business and the related key business drivers. As detailed in our 2012 Annual Report, we revised our definition of Core financial measures in 2013, with consistent application thereafter. The adjustments are made to our Reported financial information in order to show Core
financial measures that illustrate clearly, on a year-on-year or period-by-period basis, the impact on our performance caused by factors such as changes in revenues and expenses driven by volume, prices and cost levels relative to such prior years or periods.
Readers of the Annual Report should note that Core results cannot be achieved without incurring the costs that the Core measures exclude such as:
| > | Amortisation of intangible assets which generally arise from business combinations and individual licence acquisitions. We adjust for these charges because their pattern of recognition is largely uncorrelated with the underlying performance of the business. However, a significant part of our revenues could not be generated without owning the associated acquired intangible assets. |
| > | Charges and provisions related to our global restructuring programmes which can take place over a significant period of time, given the long life-cycle of our business. We adjust for these charges and provisions because they primarily reflect the financial impact of change to legacy arrangements, rather than the underlying performance of our ongoing business. However, our Core results do reflect the benefits of such restructuring initiatives. |
It should also be noted that other costs excluded from our Core results, such as finance charges related to contingent consideration will recur in future years and other excluded items such as impairments and legal settlement costs, along with other acquisition-related costs, may recur in the future.
As shown in the 2016 Reconciliation of Reported results to Core results table on the page opposite, our reconciliation of Reported financial information to Core financial measures includes a breakdown of the items for which our Reported financial information is adjusted and a further breakdown by specific line item as such items are reflected in our Reported income statement. This illustrates the significant items that are excluded from Core financial measures and their impact on our Reported financial information, both as a whole and in respect of specific line items.
Management presents these results externally to meet investors’ requirements
| | |
| 64 | | AstraZenecaAnnual Report and Form 20-F Information 2016 |
for transparency and clarity. Core financial measures are also used internally in the management of our business performance, in our budgeting process and when determining compensation.
Core financial measures are non-GAAP measures. All items for which Core financial measures are adjusted are included in our Reported financial information as they represent actual costs of our business in the periods presented. As a result, Core financial measures merely allow investors
to differentiate between different kinds of costs and they should not be used in isolation. You should also refer to our Reported financial information in the 2016 Reported operating profit table below and our reconciliation of Core financial measures to Reported financial information in the Reconciliation of Reported results to Core results table below for our discussion of comparative Actual growth measures that reflect all factors that affect our business.
Our determination of non-GAAP measures, and our presentation of them within this
financial information, may differ from similarly titled non-GAAP measures of other companies.
The SET retains strategic management of the costs excluded from Reported financial information in arriving at Core financial measures, tracking their impact on Reported operating profit and EPS, with operational management being delegated on a case-by-case basis to ensure clear accountability and consistency for each cost category.
Results of operations – summary analysis of year ended 31 December 2016
2016 Reported operating profit
| | | | | | | | | | | | | | | | | | | | | | | | | | | | | | | | | | | | | | | | | | | | |
| | | 2016 | | | | | | 2015 | | | | | | Percentage of Total Revenue | | | | | | 2016 compared with 2015 | |
| | |
| Reported
$m |
| |
| CER
growth $m |
| |
| Growth
due to exchange effects $m |
| | | | | |
| Reported
$m |
| | | | | |
| Reported
2016 % |
| |
| Reported
2015 % |
| | | | | |
| Actual
growth % |
| |
| CER
growth % |
1 |
| Product Sales | | | 21,319 | | | | (1,990 | ) | | | (332 | ) | | | | | | | 23,641 | | | | | | | | | | | | | | | | | | | | (10 | ) | | | (8 | ) |
| Externalisation Revenue | | | 1,683 | | | | 634 | | | | (18 | ) | | | | | | | 1,067 | | | | | | | | | | | | | | | | | | | | 58 | | | | 59 | |
| Total Revenue | | | 23,002 | | | | (1,356 | ) | | | (350 | ) | | | | | | | 24,708 | | | | | | | | | | | | | | | | | | | | (7 | ) | | | (5 | ) |
| Cost of sales | | | (4,126 | ) | | | 332 | | | | 188 | | | | | | | | (4,646 | ) | | | | | | | (17.9 | ) | | | (18.8 | ) | | | | | | | (11 | ) | | | (7 | ) |
| Gross profit | | | 18,876 | | | | (1,024 | ) | | | (162 | ) | | | | | | | 20,062 | | | | | | | | 82.1 | | | | 81.2 | | | | | | | | (6 | ) | | | (5 | ) |
| Distribution costs | | | (326 | ) | | | (4 | ) | | | 17 | | | | | | | | (339 | ) | | | | | | | (1.5 | ) | | | (1.4 | ) | | | | | | | (4 | ) | | | 1 | |
| Research and development expense | | | (5,890 | ) | | | (150 | ) | | | 257 | | | | | | | | (5,997 | ) | | | | | | | (25.6 | ) | | | (24.3 | ) | | | | | | | (2 | ) | | | 2 | |
| Selling, general and administrative costs | | | (9,413 | ) | | | 1,373 | | | | 326 | | | | | | | | (11,112 | ) | | | | | | | (40.9 | ) | | | (44.9 | ) | | | | | | | (15 | ) | | | (12 | ) |
| Other operating income and expense | | | 1,655 | | | | 178 | | | | (23 | ) | | | | | | | 1,500 | | | | | | | | 7.2 | | | | 6.1 | | | | | | | | 10 | | | | 12 | |
| Operating profit | | | 4,902 | | | | 373 | | | | 415 | | | | | | | | 4,114 | | | | | | | | 21.3 | | | | 16.7 | | | | | | | | 19 | | | | 9 | |
| Net finance expense | | | (1,317 | ) | | | | | | | | | | | | | | | (1,029 | ) | | | | | | | | | | | | | | | | | | | | | | | | |
| Share of after tax losses of joint ventures and associates | | | (33 | ) | | | | | | | | | | | | | | | (16 | ) | | | | | | | | | | | | | | | | | | | | | | | | |
| Profit before tax | | | 3,552 | | | | | | | | | | | | | | | | 3,069 | | | | | | | | | | | | | | | | | | | | | | | | | |
| Taxation | | | (146 | ) | | | | | | | | | | | | | | | (243 | ) | | | | | | | | | | | | | | | | | | | | | | | | |
| Profit for the period | | | 3,406 | | | | | | | | | | | | | | | | 2,826 | | | | | | | | | | | | | | | | | | | | | | | | | |
| | | | | | | | | | | | | | | | | | | | | | | | | | | | | | | | | | | | | | | | | | | | | |
| Basic earnings per share ($) | | | 2.77 | | | | | | | | | | | | | | | | 2.23 | | | | | | | | | | | | | | | | | | | | | | | | | |
1 As detailed on page 64, CER growth is calculated using prior year actual results adjusted for certain exchange effects including hedging. 2016 Reconciliation of Reported results to Core results | |
| | | | | | | | | | |
| Intangible
amortisation |
| | | | | | | BMS’s share | | | | | | | | Legal | | | | | | | | | | | | Core1 2016 | |
| | |
| 2016
Reported
$m |
| |
| Restructuring
costs
$m |
| |
| and
impairments $m |
| | | | | |
| of diabetes
alliance
$m |
| | | | | |
| provisions
and other
$m |
| |
| 2016
Core$m |
1 | | | | | |
| Actual
growth
% |
| |
| CER
growth
% |
|
| Gross profit | | | 18,876 | | | | 130 | | | | 124 | | | | | | | | – | | | | | | | | – | | | | 19,130 | | | | | | | | (7 | ) | | | (6 | ) |
| Product Sales gross margin %2 | | | 80.8% | | | | | | | | | | | | | | | | | | | | | | | | | | | | 82.0% | | | | | | | | | | | | | |
| Total Revenue gross margin % | | | 82.1% | | | | | | | | | | | | | | | | | | | | | | | | | | | | 83.2% | | | | | | | | | | | | | |
| Distribution costs | | | (326 | ) | | | – | | | | – | | | | | | | | – | | | | | | | | – | | | | (326 | ) | | | | | | | (4 | ) | | | 1 | |
| Research and development expense | | | (5,890 | ) | | | 178 | | | | 81 | | | | | | | | – | | | | | | | | – | | | | (5,631 | ) | | | | | | | – | | | | 5 | |
| Selling, general and administrative costs | | | (9,413 | ) | | | 823 | | | | 1,000 | | | | | | | | (627 | ) | | | | | | | 48 | | | | (8,169 | ) | | | | | | | (12 | ) | | | (9 | ) |
| Other operating income and expense | | | 1,655 | | | | (24 | ) | | | 86 | | | | | | | | – | | | | | | | | – | | | | 1,717 | | | | | | | | 13 | | | | 14 | |
| Operating profit | | | 4,902 | | | | 1,107 | | | | 1,291 | | | | | | | | (627 | ) | | | | | | | 48 | | | | 6,721 | | | | | | | | (3 | ) | | | (7 | ) |
| Operating margin as a % of Total Revenue | | | 21.3% | | | | | | | | | | | | | | | | | | | | | | | | | | | | 29.2% | | | | | | | | | | | | | |
| Net finance expense | | | (1,317 | ) | | | – | | | | – | | | | | | | | 389 | | | | | | | | 267 | | | | (661 | ) | | | | | | | | | | | | |
| Taxation | | | (146 | ) | | | (232 | ) | | | (307 | ) | | | | | | | 23 | | | | | | | | 4 | | | | (658 | ) | | | | | | | | | | | | |
| Basic earnings per share ($) | | | 2.77 | | | | 0.69 | | | | 0.78 | | | | | | | | (0.17 | ) | | | | | | | 0.24 | | | | 4.31 | | | | | | | | | | | | | |
| 1 | Each of the measures in the Core column in the above table are non-GAAP measures. |
| 2 | Gross margin as a % of Product Sales reflects gross profit derived from Product Sales, divided by Product Sales. |
| | |
| AstraZenecaAnnual Report and Form 20-F Information 2016 | | 65 |
Strategic Report | Financial Review
Financial Reviewcontinued
Total Revenue
Total Revenue for the year was down 7% to $23,002 million, comprising Product Sales of $21,319 million (down 10%) and Externalisation Revenue of $1,683 million (up 58%). At CER, Total Revenue declined by 5% in the year.
Product Sales
The decline in Product Sales primarily reflected the entry in the US of multipleCrestor generic medicines.
By Geography
US Product Sales were down 22% to $7,365 million, reflecting the competition from multiple genericCrestor medicines that entered the US market from July 2016 as well as lower Product Sales ofNexium andSymbicort. In Europe, strong growth in Product Sales ofForxiga andBrilique were more than offset by a decline inSymbicort, leading to a decrease of 5% (CER: decrease of 3%) in the region in total to $5,064 million.
Established Markets were up 2% (CER: down 4%) at $3,096 million including an increase of 8% in Japan (CER: decrease of 3%) to $2,184 million, with Crestor Product Sales in Japan stable at $521 million. Product Sales in Emerging Markets were flat (CER: up 6%) at $5,794 million in 2016 despite growth in China of 4% (CER: growth of 10%) to $2,636 million, as we encountered challenging macro-economic conditions in Latin America, where full-year Product Sales declined by 20% (CER: declined by 7%) to $516 million.
By Product
Our largest selling products in 2016 wereCrestor ($3,401 million),Symbicort ($2,989 million),Nexium ($2,032 million) andPulmicort ($1,061 million). Global Product Sales ofCrestor declined in the year by 32% (CER: declined by 32%), which primarily reflected the market entry of multipleCrestor generic medicines.Symbicort global Product Sales declined by 12% (CER: down 10%) including
a reduction of 18% in the US due to the impact of a competitive environment on net pricing.Nexium Product Sales were down 19% (CER: down 18%), including a 39% decrease in the US, reflecting lower demand and inventory de-stocking as a result of the loss of exclusivity in 2015. Strong underlying volume growth in Emerging Markets drove a 5% Global Product Sales increase (CER: 8% increase) inPulmicort, with 66% of Product Sales of the medicine coming from that region in the year.
Growth Platforms
In the periods under review, our Growth Platforms included products in our three main therapy areas, and a focus on the Emerging Markets and Japan. Our Growth Platforms grew by 4% (CER: 5%), representing 63% of Total Revenue after removing the effect of certain Product Sales which are included in more than one Growth Platform.
Growth Platforms
| | | | | | | | | | | | | | | | |
| | | 2016 Product Sales $m | | | 2015 Product Sales $m | | | Actual growth % | | | CER growth % | |
| Respiratory | | | 4,753 | | | | 4,987 | | | | (5 | ) | | | (3 | ) |
| Brilinta | | | 839 | | | | 619 | | | | 36 | | | | 39 | |
| Diabetes | | | 2,427 | | | | 2,224 | | | | 9 | | | | 11 | |
| Emerging Markets | | | 5,794 | | | | 5,822 | | | | – | | | | 6 | |
| Japan | | | 2,184 | | | | 2,020 | | | | 8 | | | | (3 | ) |
| New Oncology1 | | | 664 | | | | 119 | | | | n/m | | | | n/m | |
| Total Growth Platform Product Sales2 | | | 14,491 | | | | 14,003 | | | | 4 | | | | 5 | |
| 1 | New Oncology comprisesLynparza, Iressa (US) andTagrisso. |
| 2 | Certain Product Sales are included in more than one Growth Platform. Total Growth Platform sales represents the net total sales for all Growth Platforms. |
Externalisation Revenue
| | | | | | | | |
| | | 2016 $m | | | 2015 $m | |
| Milestones | | | | | | | | |
| Global non-US anaesthetics portfolio (Aspen) – upfront | | | 520 | | | | – | |
| Plendil(China Medical System Holdings) – upfront | | | 298 | | | | – | |
| Toprol-XL (Aralez) – upfront | | | 175 | | | | – | |
| tralokinumab (LEO Pharma) – upfront | | | 115 | | | | – | |
| AZD3293 (Lilly) – milestone | | | 100 | | | | 50 | |
| durvalumab (Celgene) – upfront | | | – | | | | 450 | |
| Movantik (Daiichi Sankyo) – upfront | | | – | | | | 200 | |
| brodalumab (Valeant) – upfront | | | – | | | | 100 | |
| Nexium (Daiichi Sankyo) – milestone | | | – | | | | 123 | |
| Others | | | 356 | | | | 57 | |
| Total upfront/milestones | | | 1,564 | | | | 980 | |
| Royalties | | | 119 | | | | 87 | |
| Total Externalisation Revenue | | | 1,683 | | | | 1,067 | |
| | |
| 66 | | AstraZenecaAnnual Report and Form 20-F Information 2016 |
Product Sales of our Respiratory medicines declined by 5% (CER: declined by 3%) reflecting pricing pressure in the US forSymbicort.
Sales ofBrilinta in the year were $839 million, an increase of 36% (CER: increase of 39%).Brilinta sales in the US were up 45% to $348 million, as it remained the branded oral anti-platelet market leader in the US.
Our Diabetes Product Sales were 9% higher than in 2015 (CER: 11% higher), driven primarily by growth of 70% (CER: growth of 72%) onFarxiga with global sales of $835 million as it became our largest-selling Diabetes medicine.
Product Sales in Emerging Markets were flat compared to 2015 (CER: increase of 6%). Product Sales in China increased by 4% in 2016 (CER: increased by 10%) representing 45% of Emerging Markets Product Sales in the year.
Japan Product Sales increased by 8% (CER: declined by 3%).
Product Sales of New Oncology medicines were up to $664 million in 2016 (2015: $119 million), $423 million of which came fromTagrisso (2015: $19 million) which became our leading medicine for the treatment of lung cancer in the year.
Externalisation Revenue
Externalisation Revenue, alongside Product Sales, is included in Total Revenue. Externalisation Revenue includes development, commercialisation and collaboration revenue, such as royalties and milestone receipts. Income is recorded as Externalisation Revenue when we have a significant ongoing interest in the product and/or it is repeatable business and there is no derecognition of an intangible asset. Disposals of assets and businesses, where we do not retain an interest, are recorded in other operating income.
Details of our significant business development transactions which give rise to Externalisation Revenue are given below:
| > | In October 2016, we announced an agreement with Aralez for the rights to the branded and authorised generic (marketed by Par Pharmaceuticals) forToprol-XL (metoprolol succinate) in the US. Aralez paid us $175 million upon completion of the transaction. Aralez will also pay us up to $48 million in milestone and sales-related payments, as well as mid-teen percentage royalties on sales. We will continue to manufacture and supplyToprol-XL and the authorised generic medicine to Aralez. We will retain a significant ongoing interest inToprol-XL in the rest of the world, and significant interest in the US through the ongoing manufacture and supply of the product. |
| > | In June 2016, we entered into a licence agreement with LEO Pharma for the global development and commercialisation of tralokinumab in dermatology indications. We will continue to develop tralokinumab in asthma, and will manufacture and supply tralokinumab to LEO Pharma at a mark-up of 10% on cost. LEO Pharma have been granted an exclusive licence to the global dermatology rights to tralokinumab, which has completed Phase IIb for atopic dermatitis. LEO Pharma paid an upfront payment to us of $115 million for the exclusive licence. LEO Pharma will also pay us up to $1 billion in commercially-related milestones and up to mid-teen tiered percentage royalties on Product Sales. |
| > | In June 2016, we announced that we had entered into a commercialisation agreement with Aspen for rights to its global anaesthetics portfolio outside the US. The agreement covers seven established medicines –Diprivan, EMLA and five local anaesthetics(Xylocaine, Marcaine, Naropin, Carbocaine andCitanest). Under the terms of the agreement, Aspen acquired the commercialisation rights for an upfront consideration of $520 million ($410 million paid on completion and $110 million to be paid in 2017). Additionally, Aspen will pay us up to $250 million on a Product Sales-related payment, as well as double digit percentage trade mark royalties on |
| | Product Sales. For an initial period of 10 years, we will manufacture and supply the products to Aspen at cost plus 20%. Aspen have assumed responsibility for all activities relating to the sale of the portfolio in all relevant markets. |
| > | In February 2016, we entered into a licensing agreement with China Medical System Holdings Ltd (CMS) for the commercialisation rights in China to our calcium channel blocker,Plendil (felodipine).Plendil achieved Product Sales in China of $189 million in 2015. Under the terms of the agreement, CMS paid us $155 million in 2016 for the licence to sellPlendil in China, and committed to pay us a further $155 million in 2017 (recognised as Externalisation Revenue in 2016 after applying a discount factor of 8%). We will manufacture and supply the medicine to CMS and retain the global rights toPlendil outside China. The transaction did not include the transfer of any of our employees or facilities. Over the term of the licence, we will supply finished product to CMS for a supply value equivalent to approximately 40% of the net sales value booked by CMS forPlendil in each given year and will sit on the Joint Steering Committee governing the commercialisation of the product in China. |
| > | In September 2015, we announced that we had entered into a collaboration agreement with Valeant under which we will grant an exclusive licence for Valeant to develop and commercialise brodalumab. Under the agreement, Valeant will hold the exclusive rights to develop and commercialise brodalumab globally, except in Japan and certain other Asian countries where rights are held by Kyowa Hakko Kirin under a prior arrangement with Amgen. Valeant will assume all development costs associated with the regulatory approval for brodalumab. Under the terms of the agreement, Valeant made an upfront payment to us of $100 million and may also pay pre-launch milestones of up to $170 million and further sales related milestone payments of up to $175 million. If approved, we will share profits with Valeant. |
| | |
| AstraZenecaAnnual Report and Form 20-F Information 2016 | | 67 |
Strategic Report | Financial Review
Financial Reviewcontinued
| > | In April 2015, we signed a Collaboration and License Agreement with Celgene, a global leader in haematological cancers, to develop and commercialise durvalumab across a range of blood cancers including non-Hodgkin lymphoma, myelodysplastic syndromes and multiple myeloma. Under the terms of the agreement, Celgene made an upfront payment of $450 million to us in relation to durvalumab, which is recorded within Externalisation Revenue. Celgene will lead on development across all clinical trials within the collaboration and took on all R&D costs until the end of 2015, after which they now take on 75% of these costs. Celgene will also be responsible for global commercialisation of approved treatments. We will manufacture and record all sales of durvalumab and will pay a royalty to Celgene on worldwide sales in haematological indications. The royalty rate will start at 70% and will decrease to approximately half of the sales of durvalumab in haematological indications over a period of four years. |
| > | In March 2015, we announced a co-commercialisation agreement with Daiichi Sankyo, forMovantik in the US. The drug was launched on 31 March 2015. Under the terms of the agreement, Daiichi Sankyo paid a $200 million upfront fee and will pay subsequent sales-related payments of up to $625 million. $200 million was recorded in Externalisation Revenue in 2015. We will be responsible for manufacturing, will record all sales and will make sales-related commission payments to Daiichi Sankyo. Both companies will be jointly responsible for commercial activities. |
| > | In September 2014, we entered into an agreement with Lilly to jointly develop and commercialise AZD3293, an oral beta secretase cleaving enzyme (BACE) inhibitor currently in development as a potential treatment for Alzheimer’s disease. Under the terms of the agreement, Lilly will pay us up to $500 million in development and regulatory milestone payments. We received the first milestone payment of $50 million in 2015, and a further $100 million in 2016. The companies will equally share all future costs for the development and commercialisation of AZD3293, as well as net global revenues post-launch. Lilly lead the clinical development, working with researchers from our Innovative Medicines Unit for neuroscience, while |
| | we will be responsible for manufacturing. The companies are jointly responsible for the commercialisation of AZD3293. |
As detailed in Risk from page 214, the development of any pharmaceutical product candidate is a complex and risky process that may fail at any stage in the development process due to a number of factors (including items such as failure to obtain regulatory approval, unfavourable data from key studies, adverse reaction to the product candidate or indications of other safety concerns). The potential future milestones quoted above are subject to these risks.
Gross margin, operating margin and earnings per share
Reported gross margin as a percentage of Product Sales was 80.8% in the year, 0.5 percentage points higher than last year. Excluding the impact of Externalisation Revenue, the Reported gross margin was broadly flat compared to 2015 at CER, with lower restructuring and amortisation charges offset by an adverse impact from the mix of sales, the market entry of multipleCrestor generic medicines in the US and a write-down ofFluMist inventory in the US.
Reported R&D expense in the year was down 2% (CER: up 2%) to $5,890 million, as we continued our focused investment in the pipeline. Adjusting for exchange rate movements, the full-year increase at CER reflected the number of potential medicines in pivotal trials as well as the inclusion of the R&D costs of ZS Pharma and Acerta Pharma. These costs were partially offset by lower restructuring costs and impairment charges.
Reported SG&A costs declined by 15% (CER: declined by 12%) to $9,413 million reflecting the fair value adjustment to acquisition-related liabilities based on revised milestone probabilities and revenue and royalty forecasts relating to the acquisition of BMS’s share of the Global Diabetes Alliance and the acquisition of Almirall. The decline was also driven by the movement to a more even split between the sale of primary and specialty care medicines and efficiency savings in sales and marketing operations and further reductions in IT costs. These actions included a material reduction in the sales and head-office structure in the US marketing business.
Reported other operating income in the year was up 10% (CER: up 12%) at $1,655 million which, in addition to royalty income of $165 million forCrestor and $134 million for Human Papillomavirus (HPV) vaccine, includes $368 million on the sale of our small-molecule antibiotics business to Pfizer, $321 million on the sale of our non-US rights toRhinocort Aqua to Cilag, $183 million on the sale of our non-US rights toImdur and $148 million (after deduction of $83 million payable to Amgen) on the disposal of global rights to MEDI2070 to Allergan. As these elements of our income arose from product divestments, where we no longer retain a significant element of continued interest, in accordance with our Externalisation Revenue definition and the requirements of IFRS, proceeds from these divestments continue to be recorded as other operating income.
In 2015, Reported other operating income included $380 million for the divestment of rights to theEntocort business in the US to Elan Pharma International Limited, part of the Perrigo Group, $215 million for the divestment of the rights to sell and developEntocort capsules and enema formulations outside the US to Tillotts Pharma AG, $193 million gain on the divestment of the global rights to develop, manufacture and commercialiseMyalept subject to an existing distributor licence with Shionogi covering Japan, South Korea, and Taiwan with Aegerion and $165 million for the divestment ofCaprelsa in an agreement with Genzyme Corporation, part of Sanofi S.A.
Reported operating profit increased by 19% (CER: increased by 9%) to $4,902 million in the year. The Reported operating margin increased by 4.6 percentage points (CER: 2.6 percentage points) to 21.3% of Total Revenue. The increase reflected the reduction in SG&A costs which more than offset the decline in Product Sales and Externalisation Revenue, while we continued to invest in our pipeline and Growth Platforms.
Core operating profit declined by 3% (CER: declined by 7%) in the year to $6,721 million. Fair value adjustments to acquisition-related liabilities reduced SG&A costs and increased Reported operating profit by $1,158 million in the current year (2015: $432 million). These fair value movements reflected estimates for future liabilities that can change materially over time.
| | |
| 68 | | AstraZenecaAnnual Report and Form 20-F Information 2016 |
Reported net finance expense was $1,317 million (2015: $1,029 million). The increase of $288 million was largely due to an increase in Net Debt that was driven by the acquisition of ZS Pharma and the majority investment in Acerta Pharma. Excluding the discount unwind on acquisition-related liabilities and other adjustments, Core Net Finance Expense increased by 31% (CER: increased by 46%) in the year to $661 million.
Profit before tax amounted to $3,552 million in 2016 (2015: $3,069 million). Pre-tax adjustments to arrive at Core profit before tax amounted to $2,475 million in 2016 (2015: $3,312 million), comprising $1,819 million adjustments to operating profits (2015: $2,788 million) and $656 million to net finance expenses (2015: $524 million). Excluded from Core results were:
| > | Restructuring costs totalling $1,107 million (2015: $1,034 million), incurred as we continued to enhance productivity through the implementation of our restructuring initiatives. To continue the focus on cost discipline, in 2016 we announced plans to advance our strategy through sharper focus by streamlining operations, primarily in Commercial and Manufacturing, to redeploy investment to key therapy areas, particularly Oncology. We incurred restructuring costs totalling $555 million relating to this programme in 2016. We also disposed of our R&D facility in Bangalore, India in the period and announced plans to bring together five of our San Francisco Bay Area, US sites into one location. |
| > | Amortisation totalling $1,247 million (2015: $1,460 million) relating to intangible assets, except those related to IT and to our acquisition of BMS’s share of our Global Diabetes Alliance (which are separately detailed below). Further information on our intangible assets is contained in Note 9 to the Financial Statements from page 157. |
| > | Intangible impairment charges of $44 million (2015: $143 million) excluding those related to IT. Further details relating to intangible asset impairments are included in Note 9 to the Financial Statements from page 157. |
| > | Net credit associated with our acquisition of BMS’s share of our Global Diabetes Alliance in February 2015 amounting to $238 million (2015: net cost of $463 million). A contingent consideration fair |
| | value decrease of $999 million reflecting lower expected Diabetes portfolio revenues in line with latest forecasts was partially offset by $372 million of amortisation charges and $389 million of interest charges relating to a discount unwind on contingent consideration arising on the acquisition. |
| > | Net legal provisions and other charges of $315 million (2015: $211 million), including $267 million discount unwind charges, offset by $199 million of net fair value adjustments relating to contingent consideration arising on our other business combinations as detailed in Note 18 to the Financial Statements from page 164. The net charge of $315 million also included legal charges relating to the unsuccessful defence of the validity ofCrestor-related patents in Australia, damages claims in Europe relating toSeroquel XR and other matters. Further details of legal proceedings we are currently involved in are contained within Note 28 to the Financial Statements from page 185. |
Reported EPS of $2.77 in the year represented growth of 24% (CER: growth of 9%), partly reflecting the revaluation of acquisition-related liabilities described above. Core EPS in the year increased by 1% (CER: declined by 5%) to $4.31. The CER decline of 5% mirrored the rate of decline in Total Revenue. Both Reported and Core EPS in the year included a non-recurring benefit of $0.36, following agreements between the Canadian tax authority and the UK and Swedish tax authorities.
The Reported taxation charge for the year of $146 million (2015: $243 million) consisted of a current tax charge of $370 million (2015: $633 million) and a credit arising from movements on deferred tax of $224 million (2015: $390 million). The current tax charge included a prior period current tax credit of $14 million (2015: $404 million).
The Reported tax rate for the year was 4% (2015: 8%). The Reported tax rate of 4% benefited from a $453 million adjustment following agreements between the Canadian tax authority and the UK and Swedish tax authorities. Excluding these effects, the Reported tax rate for the year was 17%. The Core tax rate for the year was 11%. Excluding the benefit following agreements between the Canadian tax
authority and the UK and Swedish tax authorities in respect of transfer pricing arrangements for the 13-year period from 2004-2016, the Core tax rate was 18%.
The tax paid for the year was $412 million (12% of Reported profit and 7% of Core profit). The cash tax paid for the year was $266 million higher than the tax charge for the year as a result of certain items with no cash impact including a $453 million adjustment following the agreement between the Canadian tax authority and the UK and Swedish tax authorities referred to above, other net reductions in provisions for tax contingencies of $52 million, $244 million of deferred tax credits, net cash refunds received following agreement of prior period tax liabilities and audit settlements of $274 million and other cash tax timing differences.
Reported post-tax profit for the year was $3,406 million, an increase of 21% (CER: increase of 6%). Reported earnings per share was up 24% (CER: up 9%) to $2.77.
Total comprehensive income decreased by $860 million from the prior year, resulting in a net income of $1,628 million for 2016. This was driven by the increase in profit for the year of $580 million being more than offset by a reduction of $1,440 million in other comprehensive income. The decrease in other comprehensive income arose principally from losses recorded on the remeasurement of our defined benefit pension liability of $575 million (2015: gains of $652 million) due to a decrease in the discount rate applied to our pension liabilities reflecting an increase in corporate bond yields and other reference interest rate instruments, and foreign exchange losses arising on consolidation of the Group numbers of $1,050 million (2015: losses of $528 million) as a result of the strong performance of the US dollar against other major currencies in 2016.
Restructuring
Since 2007, we have undertaken significant efforts to restructure and reshape our business to improve long-term competitiveness, the first two phases of which were completed in 2011.
In 2013, we announced our Phase 4 restructuring programme, which was subsequently expanded in 2014. This consisted of centralisation of our global R&D footprint into three strategic centres,
| | |
| AstraZenecaAnnual Report and Form 20-F Information 2016 | | 69 |
Strategic Report | Financial Review
Financial Reviewcontinued
transformation of the IT organisation, closure of a number of manufacturing facilities and other activities to simplify and streamline the organisation. At the time of the announcement, the Phase 4 programme was estimated to incur $3.2 billion of costs and deliver $1.1 billion of annualised benefits by 2016. By the end of 2016, the Phase 4 programme had incurred costs of $3.3 billion and realised annual benefits of $0.9 billion, creating headroom for investment in our pipeline and launch capability. The Phase 4 programme is now expected to complete in 2018 with total programme costs estimated to be $3.6 billion and annualised benefits $1.2 billion. During the latter part of 2015, we implemented further targeted restructuring of our Commercial business.
This resulted in $102 million of restructuring costs in 2015, with a further $47 million incurred in 2016. Furthermore, as part of our ongoing commitment to improve productivity, we initiated multi-year transformation programmes within our G&A functions (principally Finance and HR) with anticipated costs by the end of 2018 of $258 million. Once complete, we expect these transformation programmes to deliver annualised benefits of $100 million by the end of 2018. By the end of 2016, these programmes had incurred costs of $124 million.
In 2016, we announced plans to advance our strategy through sharper focus by streamlining operations, primarily in Commercial and Manufacturing, to redeploy investment to key therapy areas,
particularly Oncology. Restructuring costs associated with this programme are expected to be $1.5 billion by the end of 2017 and generate net annualised benefits of $1.1 billion by 2018. We incurred restructuring costs totalling $555 million relating to this programme in 2016.
The aggregate restructuring charge incurred in 2016 across all our restructuring programmes was $1,107 million. Final estimates for programme costs, benefits and headcount impact in all functions are subject to completion of the requisite consultation in the various areas. Our priority as we undertake these restructuring initiatives is to work with our affected employees on the proposed changes, acting in accordance with relevant local consultation requirements and employment law.
Cash flow and liquidity – 2016
Summary cash flows
| | | | | | | | | | | | |
| | | 2016 $m | | | 2015 $m | | | 2014 $m | |
| Net (debt)/funds brought forward at 1 January | | | (7,762 | ) | | | (3,223 | ) | | | 39 | |
| Profit before tax | | | 3,552 | | | | 3,069 | | | | 1,246 | |
Sum of changes in interest, tax, depreciation, amortisation, impairment, and share of after tax losses
on joint ventures and associates | | | 3,707 | | | | 3,897 | | | | 4,173 | |
| Movement in working capital and short-term provisions | | | 926 | | | | (49 | ) | | | 2,508 | |
| Tax paid | | | (412 | ) | | | (1,354 | ) | | | (1,201 | ) |
| Interest paid | | | (677 | ) | | | (496 | ) | | | (533 | ) |
| Gains on disposal of intangible assets | | | (1,301 | ) | | | (961 | ) | | | – | |
| Fair value movements on contingent consideration arising from business combinations | | | (1,158 | ) | | | (432 | ) | | | 512 | |
| Non-cash and other movements | | | (492 | ) | | | (350 | ) | | | 353 | |
| Net cash available from operating activities | | | 4,145 | | | | 3,324 | | | | 7,058 | |
| Disposal/(purchase) of intangibles (net) | | | 559 | | | | (330 | ) | | | (1,740 | ) |
| Upfront payments on business acquisition | | | (2,564 | ) | | | (2,446 | ) | | | (3,804 | ) |
| Payment of contingent consideration from business combinations | | | (293 | ) | | | (579 | ) | | | (657 | ) |
| Other capital expenditure (net) | | | (1,405 | ) | | | (1,326 | ) | | | (924 | ) |
| Investments | | | (3,703 | ) | | | (4,681 | ) | | | (7,125 | ) |
| Dividends | | | (3,561 | ) | | | (3,486 | ) | | | (3,521 | ) |
| Share proceeds | | | 47 | | | | 43 | | | | 279 | |
| Distributions | | | (3,514 | ) | | | (3,443 | ) | | | (3,242 | ) |
| Other movements | | | 177 | | | | 261 | | | | 47 | |
| Net debt carried forward at 31 December | | | (10,657 | ) | | | (7,762 | ) | | | (3,223 | ) |
| | | |
Net debt/funds reconciliation | | | | | | | | | | | | |
| | | 2016 $m | | | 2015 $m | | | 2014 $m | |
| Cash and cash equivalents | | | 5,018 | | | | 6,240 | | | | 6,360 | |
| Other investments1 | | | 898 | | | | 613 | | | | 795 | |
| Net derivative financial instruments | | | 235 | | | | 438 | | | | 465 | |
| Cash, short-term investments and derivatives | | | 6,151 | | | | 7,291 | | | | 7,620 | |
| Overdraft and short-term borrowings | | | (451 | ) | | | (849 | ) | | | (1,486 | ) |
| Finance leases | | | (93 | ) | | | (95 | ) | | | (108 | ) |
| Current instalments of loans | | | (1,769 | ) | | | – | | | | (912 | ) |
| Loans due after one year | | | (14,495 | ) | | | (14,109 | ) | | | (8,337 | ) |
| Loans and borrowings | | | (16,808 | ) | | | (15,053 | ) | | | (10,843 | ) |
| Net debt | | | (10,657 | ) | | | (7,762 | ) | | | (3,223 | ) |
| 1 | Other investments in 2016 includes $14 million of non-current investments which is not separately disclosed on the Statement of Financial Position. |
| | |
| 70 | | AstraZenecaAnnual Report and Form 20-F Information 2016 |
Bonds issued in 2016 and 2015
| | | | | | | | | | | | |
| | | Repayment dates | | | Face value of bond $m | | | Net book
value of
bond at
31 December
2016 $m | |
| Bonds issued in 2016: | | | | | | | | | | | | |
| 0.25% Euro bond | | | 2021 | | | | 566 | | | | 522 | |
| 0.75% Euro bond | | | 2024 | | | | 1,016 | | | | 937 | |
| 1.25% Euro bond | | | 2028 | | | | 897 | | | | 827 | |
| Total 2016 | | | | | | | 2,479 | | | | 2,286 | |
| Bonds issued in 2015: | | | | | | | | | | | | |
| Floating rate notes | | | 2018 | | | | 400 | | | | 399 | |
| 1.750% Callable bond | | | 2018 | | | | 1,000 | | | | 998 | |
| 2.375% Callable bond | | | 2020 | | | | 1,600 | | | | 1,589 | |
| 3.375% Callable bond | | | 2025 | | | | 2,000 | | | | 1,976 | |
| 4.375% Callable bond | | | 2045 | | | | 1,000 | | | | 979 | |
| Total 2015 | | | | | | | 6,000 | | | | 5,941 | |
Net cash generated from operating activities was $4,145 million in the year ended 31 December 2016, compared with $3,324 million in 2015. The increase of $821 million reflected improved cash management performance and one-off tax refunds in 2016 compared to an increase of $49 million in working capital and short-term provisions in the prior year.
Gains on disposal of intangible assets of $1,301 million included $368 million on the disposal of our late-stage antibiotics business, $321 million on the sale of our rights toRhinocort Aquaoutside of the US, $231 million on the out-licence agreement for MEDI-2070, and $183 million for the divestment of the global rights toImdur outside the US. 2015 included $380 million on the disposal of US rights toEntocort, $215 million on the disposal of Rest of World rights toEntocort, $193 million on the disposal of global rights toMyalept and $165 million on the disposal of global rights toCaprelsa. Fair value adjustments on acquisition-related liabilities were a credit of $1,158 million in 2016 (2015: a credit of $432 million) including $999 million on our acquisition of BMS’s share of our Global Diabetes Alliance in February 2015. Other non-cash movements amounted to $492 million in 2016 (2015: $350 million).
Investment cash outflows of $3,703 million (2015: $4,681 million) included $2,383 million relating to the majority investment in Acerta Pharma. This compared to cash payments relating to business acquisitions in 2015
of $2,446 million, primarily related to the ZS Pharma acquisition. Further details of business combination acquisitions and their impact on our cash flows and balance sheet are given in the table on page 73. Investment cash outflows also include $293 million (2015: $579 million) of payments against contingent consideration arising on business combinations and $868 million (2015: $1,460 million) for the purchase of other intangible assets, which included $561 million on the purchase of the core respiratory assets of Takeda. The comparative period of 2015 included $684 million on the acquisition of the rights to Actavis’ branded respiratory portfolio in the US and Canada.
Investment cash inflows include $1,427 million (2015: $1,130 million) from the sale of intangible assets, including $552 million for the disposal of our late-stage antibiotics business, $330 million for the sale of our rights toRhinocort Aquaoutside of the US and $250 million on the out-licence agreement for MEDI-2070. The comparative period in 2015 included the divestments ofEntocort in the US for $380 million, and in the Rest of World for $215 million and ofMyalept for $325 million.
Net cash distributions to shareholders were $3,514 million (2015: $3,443 million) including dividends of $3,561 million (2015: $3,486 million). Proceeds from the issue of shares on the exercise of share options amounted to $47 million (2015: $43 million).
In May 2016, we issued€2.2 billion of bonds in the euro debt capital markets with maturities of 5, 8 and 12 years.
In November 2015, we issued bonds worth $6 billion to fund the acquisition of ZS Pharma, to repay certain of our outstanding commercial paper obligations and for general corporate purposes. The bonds are listed in the table above.
In 2015, we repaid a 5.125% non-callable euro bond which had a 31 December 2015 carrying value of $912 million.
At 31 December 2016, outstanding gross debt (interest-bearing loans and borrowings) was $16,808 million (2015: $15,053 million). Of the gross debt outstanding at 31 December 2016, $2,307 million is due within one year (2015: $916 million). Net debt at 31 December 2016 was $10,657 million, compared to $7,762 million at the beginning of the year, as a result of the net cash outflow as described above.
Off-balance sheet transactions and commitments
We have no off-balance sheet arrangements and our derivative activities are non-speculative. The following table on page 72 sets out our minimum contractual obligations at the year end.
| | |
| AstraZenecaAnnual Report and Form 20-F Information 2016 | | 71 |
Strategic Report | Financial Review
Financial Reviewcontinued
Payments due by period
| | | | | | | | | | | | | | | | | | | | | | | | |
| | | Less than 1 year $m | | | 1-3 years $m | | | 3-5 years $m | | | Over 5 years $m | | | 2016 Total $m | | | 2015 Total $m | |
| Bank loans and other borrowings1 | | | 2,829 | | | | 3,421 | | | | 3,843 | | | | 14,796 | | | | 24,889 | | | | 23,263 | |
| Finance leases | | | 42 | | | | 40 | | | | 13 | | | | – | | | | 95 | | | | 141 | |
| Operating leases | | | 98 | | | | 145 | | | | 102 | | | | 96 | | | | 441 | | | | 409 | |
| Contracted capital expenditure | | | 629 | | | | – | | | | – | | | | – | | | | 629 | | | | 518 | |
| Total | | | 3,598 | | | | 3,606 | | | | 3,958 | | | | 14,892 | | | | 26,054 | | | | 24,331 | |
| 1 | Bank loans and other borrowings include interest charges payable in the period, as detailed in Note 26 to the Financial Statements on page 178. |
In 2016, net assets decreased by $1,840 million to $16,669 million. The decrease in net assets is broadly as a result of dividends of $3,540 million and adverse movements on exchange taken to reserves of $1,641 million, partially offset by the Group profit of $3,406 million.
Business combinations
In 2016, we acquired a majority equity stake in Acerta Pharma. In 2015, we completed the acquisition of ZS Pharma. During 2016 we revised our assessment of the fair values of the assets and liabilities acquired with ZS Pharma, as a result of new information obtained about facts and circumstances that existed at the date of acquisition that impact the value of deferred tax. This has resulted in a reduction to both deferred tax liabilities and goodwill of $68 million. Further details of our business combinations are contained in Note 25 to the Financial Statements from page 173.
Fair values of assets and liabilities acquired, and consideration for the acquisitions in 2016 and 2015, as at the acquisition date, are summarised on the opposite page.
Contingent consideration
The majority of our acquisitions in recent years have included elements of consideration that are contingent on future development and/or sales milestones, with both the diabetes and respiratory acquisitions in 2014 also including royalty payments linked to future revenues. The acquisitions of ZS Pharma in 2015 and Acerta Pharma in 2016 had no contingent consideration element.
Our agreement with BMS provides for potential further payments of up to $0.7 billion for future regulatory, launch and sales-related milestones, and various sales-related royalty payments up until 2025. Our transaction with Almirall includes further payments of up to $1.0 billion for future development, launch, and sales-related milestones and various other sales-related
payments as detailed in Note 18 to the Financial Statements on page 164. All these future payments are treated as contingent consideration on our balance sheet, and are fair valued using decision-tree analyses, with key assumptions, including the probability of success, the potential for delays and the expected levels of future revenues. The fair value is updated at each balance sheet reporting date to reflect our latest estimate of the probabilities of these key assumptions. Given the long-term nature of our contingent consideration payments, the fair value calculation includes the discounting of future potential payments to their present value using discount rates appropriate to the period over which payments are likely to be made. Over time, as the target date of a consideration payment approaches, the discount in absolute terms of such future potential payment to its present value decreases. Therefore, in each period we take a corresponding charge reflecting the passage of time. We refer to this charge as ‘discount unwind’.
Financial position – 31 December 2016
All data in this section is on a Reported basis.
Summary statement of financial position
| | | | | | | | | | | | | | | | | | | | |
| | |
| 2016
$m |
| |
| Movement
$m |
| |
| 2015
As restated $m |
1 | |
| Movement
$m |
| |
| 2014
$m |
|
| Property, plant and equipment | | | 6,848 | | | | 435 | | | | 6,413 | | | | 403 | | | | 6,010 | |
| Goodwill and intangible assets | | | 39,244 | | | | 4,798 | | | | 34,446 | | | | 1,915 | | | | 32,531 | |
| Inventories | | | 2,334 | | | | 191 | | | | 2,143 | | | | 183 | | | | 1,960 | |
| Trade and other receivables | | | 5,474 | | | | (2,055 | ) | | | 7,529 | | | | (815 | ) | | | 8,344 | |
| Trade and other payables | | | (19,974 | ) | | | (854 | ) | | | (19,120 | ) | | | 757 | | | | (19,877 | ) |
| Provisions | | | (1,418 | ) | | | (176 | ) | | | (1,242 | ) | | | (135 | ) | | | (1,107 | ) |
| Net income tax payable | | | (954 | ) | | | 142 | | | | (1,096 | ) | | | 929 | | | | (2,025 | ) |
| Net deferred tax liabilities | | | (2,854 | ) | | | (1,483 | ) | | | (1,371 | ) | | | (794 | ) | | | (577 | ) |
| Retirement benefit obligations | | | (2,186 | ) | | | (212 | ) | | | (1,974 | ) | | | 977 | | | | (2,951 | ) |
| Non-current other investments (excluding Treasury investments of $14 million in 2016) | | | 713 | | | | 255 | | | | 458 | | | | (44 | ) | | | 502 | |
| Investment in associates and joint ventures | | | 99 | | | | 14 | | | | 85 | | | | 26 | | | | 59 | |
| Net debt | | | (10,657 | ) | | | (2,895 | ) | | | (7,762 | ) | | | (4,539 | ) | | | (3,223 | ) |
| Net assets | | | 16,669 | | | | (1,840 | ) | | | 18,509 | | | | (1,137 | ) | | | 19,646 | |
| 1 | 2015 comparatives have been restated to reflect an adjustment to the acquisition accounting for ZS Pharma. |
| | |
| 72 | | AstraZenecaAnnual Report and Form 20-F Information 2016 |
Business combinations
| | | | | | | | |
| | | 2016 Acerta Pharma $m | | | 2015 ZS Pharma As Restated $m | |
| Assets acquired: | | | | | | | | |
| Non-current assets | | | | | | | | |
| Property, plant and equipment | | | – | | | | 21 | |
| Goodwill | | | 19 | | | | 388 | |
| Intangible assets | | | 7,307 | | | | 3,162 | |
| Current assets | | | 253 | | | | 169 | |
| Current liabilities | | | (90 | ) | | | (50 | ) |
| Non-current liabilities | | | (1,777 | ) | | | (990 | ) |
| Non-controlling interests | | | (1,903 | ) | | | – | |
| Total assets | | | 3,809 | | | | 2,700 | |
| Consideration: | | | | | | | | |
| Upfront consideration | | | 2,477 | | | | 2,700 | |
| Deferred consideration | | | 1,332 | | | | – | |
| Total consideration | | | 3,809 | | | | 2,700 | |
Contingent consideration arising on business combinations
| | | | | | | | | | | | | | | | | | | | | | | | | | |
| | | 2016 | | | | | | | | | | | 2015 | |
| | | Acquisition of BMS’s share of Diabetes Alliance $m | | | Other business combinations $m | | | Total 2016 $m | | | | | Acquisition of
BMS’s share of Diabetes
Alliance $m | | | Other
business
combinations
$m | | | Total 2015 $m | |
| At 1 January | | | 5,092 | | | | 1,319 | | | | 6,411 | | | | | | 5,386 | | | | 1,513 | | | | 6,899 | |
| Settlements | | | (242 | ) | | | (51 | ) | | | (293 | ) | | | | | (325 | ) | | | (254 | ) | | | (579 | ) |
| Fair value adjustments | | | (999 | ) | | | (159 | ) | | | (1,158 | ) | | | | | (378 | ) | | | (54 | ) | | | (432 | ) |
| Discount unwind | | | 389 | | | | 108 | | | | 497 | | | | | | 409 | | | | 115 | | | | 524 | |
| Foreign exchange | | | – | | | | – | | | | – | | | | | | – | | | | (1 | ) | | | (1 | ) |
| At 31 December | | | 4,240 | | | | 1,217 | | | | 5,457 | | | | | | 5,092 | | | | 1,319 | | | | 6,411 | |
Both the discount unwind and any movements of the fair value of the underlying future payments can result in significant income statement movements. As detailed in the Results of operations section above, these movements are treated as non-Core items in our income statement analysis. In 2016, we recorded an interest charge of $497 million on the discount unwind on contingent consideration arising on our business combinations, and a net fair value decrease on contingent consideration of $1,158 million (which resulted in a credit to our income statement for the same amount) driven, principally, by revised forecasts for revenues for our Diabetes franchise reflecting the competitive marketplace. At 31 December 2016, our contingent consideration balance held on the balance sheet amounted to $5,457 million (2015: $6,411 million) with the movements of the balance detailed in the table above.
Further details of our business combinations in the past three years are contained in Note 25 to the Financial Statements from page 173. Further information on our business combinations can also be found in the Investments, divestments and capital expenditure section of the Financial Review from page 75.
Property, plant and equipment
Property, plant and equipment increased by $435 million to $6,848 million. Additions of $1,449 million (2015: $1,422 million) were offset by depreciation of $609 million (2015: $677 million), impairments of $2 million (2015: $28 million) and disposals of $74 million (2015: $70 million).
Goodwill and intangible assets
Our goodwill of $11,658 million (2015: $11,800 million) principally arose on the acquisition of MedImmune in 2007, the
restructuring of our US joint venture with Merck in 1998 and the acquisition of BMS’s share of the Global Diabetes Alliance. Goodwill of $19 million arising on the acquisition of Acerta Pharma was capitalised in 2016.
Intangible assets amounted to $27,586 million at 31 December 2016 (2015: $22,646 million). Intangible asset additions were $8,205 million in 2016 (2015: $4,640 million), including product rights acquired in the acquisition of Acerta Pharma of $7,307 million ($3,162 million on the acquisition of ZS Pharma in 2015). Amortisation in the year was $1,701 million (2015: $1,999 million). Impairment charges in the year amounted to $45 million (2015: $148 million), including $15 million for RDEA119. Disposals of intangible assets totalled $331 million in the year (2015: $169 million).
| | |
| AstraZenecaAnnual Report and Form 20-F Information 2016 | | 73 |
Strategic Report | Financial Review
Financial Reviewcontinued
Further details of our additions to intangible assets, and impairments recorded, are included in Note 9 to the Financial Statements from page 157.
Receivables, payables and provisions
Trade and other receivables decreased by $2,055 million with trade receivables reduced by $2,050 million to $2,583 million as a result of more factored invoices during the year and lower gross invoiced sales in the US. Non-current other receivables decreased by $6 million to $901 million, the majority of which is the Shionogi Crestor royalty prepayment as detailed in Note 13 to the Financial Statements on page 161.
Trade and other payables increased by $854 million in 2016 to $19,974 million, including a $1,901 million put option, and $1,332 million deferred consideration on the majority investment in Acerta Pharma, partially offset by reductions in contingent consideration of $954 million, a decrease in trade payables of $479 million, and a decrease of $495 million on rebates and chargebacks driven by reduced Product Sales in the US. Further details on the put option are included in Note 25 to the Financial Statements from page 173.
The increase in provisions of $176 million in 2016 included $988 million of additional charges recorded in the year, partially offset by $686 million of cash payments. Included within the $988 million of charges for the year were $578 million for our global restructuring initiatives and $223 million in respect of legal charges. Cash payments included $433 million for our global restructuring programmes. Further details of the charges made against provisions are contained in Notes 19 and 28 to the Financial Statements on page 165, and 185 to 191, respectively.
Tax payable and receivable
Net income tax payable has decreased by $142 million to $954 million, principally due to a $453 million adjustment following agreements between the Canadian tax authority and the UK and Swedish tax
authorities in respect of transfer pricing arrangements for the 13-year period from 2004-2016, partially offset by net cash refunds received following agreement of prior period tax liabilities and audit settlements of $274 million. The tax receivable balance of $426 million (2015: $387 million) comprises tax owing to us from certain governments expected to be received on settlements of transfer pricing audits and disputes of $161 million (see Note 28 to the Financial Statements from page 185) and cash tax timing differences of $265 million.
Net deferred tax liabilities increased by $1,483 million in the year mainly due to deferred tax liabilities arising from the acquisition of Acerta Pharma. Additional information on the movement in deferred tax balances is contained in Note 4 to the Financial Statements from page 150.
Retirement benefit obligations
Net retirement benefit obligations increased by $212 million in 2016 (2015: decrease of $977 million) to $2,186 million. Net remeasurement adjustments of $575 million in the UK, Sweden and Germany arising from reductions in discount rate assumptions were partially offset by a $312 million impact of exchange rate movements in the year as the US dollar strengthened against pound sterling, euro and Swedish krona and employer contributions to the pension scheme of $192 million. Benefits paid amounted to $500 million (2015: $580 million).
Approximately 92% of our obligations are concentrated in the UK, the US and Sweden. In recent years, we have undertaken several initiatives to reduce our net pension obligation exposure. For the UK defined benefit pension scheme, which is our largest defined benefit scheme, these initiatives have included agreeing funding principles for cash contributions to be paid into the UK pension scheme to target a level of assets in excess of the current expected cost of providing benefits, and, in 2010, amendments to the scheme to
freeze pensionable pay at 30 June 2010 levels. During 2016, we realised a credit of $74 million on our Pensions Increase Exchange (‘PIE’) exercise which offered certain pensioner members the option of taking a higher amount of pension right away, in exchange for giving up any potential future inflation linked increases on all or part of their pension.
From 2017, for our largest pension plans, we will move to a multiple discount rate approach. This will result in separate discount rates for defined benefit obligations, service cost and interest cost. This change had no effect on the 2016 expense, and will not affect the future measurement of the defined benefit obligations, but will impact the service cost and interest cost in future years.
Further details of our pension schemes are included in Note 20 to the Financial Statements from page 165.
Commitments and contingencies
We have commitments and contingencies which are accounted for in accordance with the accounting policies described in the Financial Statements in the Group Accounting Policies section from page 142. We also have taxation contingencies. These are described in the Taxation section in the Critical accounting policies and estimates section on page 81 and in Note 28 to the Financial Statements from page 185.
Research and development collaboration payments
Details of future potential R&D collaboration payments are also included in Note 28 to the Financial Statements on page 185.
As detailed in Note 28, payments to our collaboration partners may not become payable due to the inherent uncertainty in achieving the development and revenue milestones linked to the future payments. As part of our overall externalisation strategy, we may enter into further collaboration projects in the future that may include milestone payments and,
| | |
| 74 | | AstraZenecaAnnual Report and Form 20-F Information 2016 |
therefore, as certain milestone payments fail to crystallise due to, for example, development not proceeding, they may be replaced by potential payments under new collaborations.
Investments, divestments and capital expenditure
We have completed over 270 major or strategically important business development transactions over the past three years, five of which were accounted for as business acquisitions under IFRS 3 ‘Business Combinations’, being the majority investment in Acerta Pharma in 2016, the acquisition of ZS Pharma in 2015, the acquisition of BMS’s share of our Global Diabetes Alliance, the rights to Almirall’s respiratory franchise and the acquisition of Definiens in 2015.
In addition to the business development transactions detailed under Externalisation Revenue from page 67 of this Financial Review, the following significant collaborations remain in the development phase:
| > | In April 2015, we entered into two oncology agreements with Innate Pharma, firstly, a licence which provides us with exclusive global rights to co-develop and commercialise IPH2201 in combination with durvalumab, and secondly, an option to license exclusive global rights to co-develop and commercialise IPH2201 in monotherapy and other combinations in certain treatment areas. Under the terms of the combination licence, we assumed exclusive global rights to research, develop, and commercialise IPH2201 in combination with durvalumab. We jointly fund Phase II studies with Innate Pharma and we lead the execution of these studies. Under the terms of the agreements, we made an initial payment to Innate Pharma of $250 million, which included the consideration for exclusive global rights to co-develop and commercialise IPH2201 in combination with durvalumab, as well as access to IPH2201 in monotherapy and other combinations in certain treatment areas. The agreement includes |
| | a Phase III initiation milestone of $100 million, as well as additional regulatory and sales-related milestones. We record all sales and will pay Innate Pharma double digit royalties on net sales. The arrangement includes the right for Innate Pharma to co-promote in Europe for a 50% profit share in the territory. |
| > | In July 2013, we entered into a strategic collaboration with FibroGen to develop and commercialise roxadustat (FG-4592), a first-in-class oral compound in late-stage development for the treatment of anaemia associated with chronic kidney disease (CKD) and end-stage renal disease (ESRD). This broad collaboration focuses on the US, China and all major markets excluding Japan, Europe, the CIS, the Middle East and South Africa, which are covered by an existing agreement between FibroGen and Astellas. Under the arrangement, we agreed to pay FibroGen upfront and subsequent non-contingent payments totalling $350 million, as well as potential development-related milestone payments of up to $465 million, and potential future sales-related milestone payments, in addition to tiered royalty payments on future sales of roxadustat in the low 20% range. Additional development milestones will be payable for any subsequent indications which the companies choose to pursue. We will be responsible for the US commercialisation of roxadustat, with FibroGen undertaking specified promotional activities in the ESRD segment in this market. The companies will also co-commercialise roxadustat in China where FibroGen will be responsible for clinical trials, regulatory matters, manufacturing and medical affairs, and we will oversee promotional activities and commercial distribution. |
| > | In March 2013, we signed an exclusive agreement with Moderna to discover, develop and commercialise pioneering medicines based onmessenger RNA Therapeutics for the treatment of serious cardiovascular, metabolic and renal diseases, as well as cancer. Under the terms of the agreement, we made an upfront payment of $240 million. We will |
| | have exclusive access to select any target of our choice in cardiometabolic and renal diseases, as well as selected targets in oncology, over a period of up to five years for subsequent development ofmessenger RNA Therapeutics. In addition, Moderna is entitled to an additional $180 million for the achievement of three technical milestones. Through this agreement, we have the option to select up to 40 drug products for clinical development and Moderna will be entitled to development and commercial milestone payments as well as royalties on drug sales. We will lead the pre-clinical, clinical development and commercialisation of therapeutics resulting from the agreement and Moderna will be responsible for designing and manufacturing themessenger RNA Therapeutics against selected targets. We are currently progressing 19 projects across CVMD and Oncology. Utilising both companies’ expertise, significant progress has also been made to the technology platform, with the focus on formulation, safety, and drug metabolism and pharmacokinetics. |
We determine the above business development transactions to be significant using a range of factors. We look at the specific circumstances of the individual externalisation arrangement and apply several quantitative and qualitative criteria. Because we consider business development transactions to be an extension of our R&D strategy, the expected total value of development payments under the transaction and its proportion of our annual R&D spend, both of which are proxies for overall R&D effort and cost, are important elements of the significance determination. Other quantitative criteria we apply include, without limitation, expected levels of future sales, the possible value of milestone payments and the resources used for commercialisation activities (for example, the number of staff). Qualitative factors we consider include, without limitation, new market developments, new territories, new areas of research and strategic implications.
| | |
| AstraZenecaAnnual Report and Form 20-F Information 2016 | | 75 |
Strategic Report | Financial Review
Financial Reviewcontinued
Capitalisation and shareholder return
Dividends for 2016
| | | | | | | | | | | | | | | | |
| | | $ | | | Pence | | | SEK | | | Payment date | |
| First interim dividend | | | 0.90 | | | | 68.7 | | | | 7.81 | | | | 12 September 2016 | |
| Second interim dividend | | | 1.90 | | | | 150.2 | | | | 16.57 | | | | 20 March 2017 | |
| Total | | | 2.80 | | | | 218.9 | | | | 24.38 | | | | | |
Capitalisation
The total number of shares in issue at 31 December 2016 was 1,265 million (2015: 1,264 million). 1.1 million Ordinary Shares were issued upon share option exercises for a total of $47 million. Shareholders’ equity decreased by $3,636 million to $14,854 million at the year end. Non-controlling interests were $1,815 million (2015: $19 million), with the increase in the year as a result of the acquisition of a 55% equity stake in Acerta Pharma.
Dividend and share repurchases
The Board has recommended a second interim dividend of $1.90 (150.2 pence, 16.57 SEK) to be paid on 20 March 2017. This brings the full-year dividend to $2.80 (218.9 pence, 24.38 SEK). Against Core earnings per share the Group has a dividend cover ratio of 1.5 in 2016 (2015: 1.5).
This dividend is consistent with the progressive dividend policy, by which the Board intends to maintain or grow the dividend each year.
The Board regularly reviews its distribution policy and its overall financial strategy to continue to strike a balance between the interests of the business, our financial creditors and our shareholders. Having regard for business investment, funding the progressive dividend policy and meeting our debt service obligations, the Board currently believes it is appropriate to continue the suspension of the share repurchase programme which was announced in October 2012.
Future prospects
As outlined earlier in this Annual Report, our strategy is focused on innovation, returning to growth and building a sustainable, durable and more profitable business. In support of this, we made certain choices around our three strategic priorities.
As we experience a period of patent expiries:
| > | Our immediate priorities are to continue to drive Product Sales of our on-market medicines through investment in our Growth Platforms and our portfolio of legacy medicines outside of the Growth Platforms. The Growth Platforms include products in our three main therapy areas, and a focus on the Emerging Markets and Japan. We are also pursuing business development and investment in R&D. We have already accelerated a number of projects and progressed them into Phase III development. |
| > | Our late-stage pipeline is progressing ahead of plans. Our science-driven, collaborative culture is driving increased R&D productivity. |
| > | Our long-term aspiration, in line with our strategic ambition, is to achieve scientific leadership and sustainable growth. |
We expect 2017 Total Revenue to decline by low to mid single-digit percent at CER compared to 2016. Core R&D costs as a percentage of Total Revenue are expected to be broadly in line with 2016. We are also anticipating a further reduction in Core SG&A costs in 2017 versus 2016. Core earnings per share is expected to decrease in 2017 by low to mid teens percent at CER. This guidance reflects a significantly higher expected effective Core tax rate of 16 to 20% (2016: 11%).
Financial risk management
Financial risk management policies
Insurance
Our risk management processes are described in Risk overview from page 20. These processes enable us to identify risks that can be partly or entirely mitigated through the use of insurance. We negotiate the best available premium rates with insurance providers on the basis of our extensive risk management procedures.
We focus our insurance resources on the most critical areas, or where there is a legal requirement, and where we can get best value for money. Risks to which we pay particular attention include business interruption, directors’ and officers’ liability, and property damage. Insurance for product liability has not been available on commercially acceptable terms for several years and we have not purchased in the market product liability insurance since February 2006.
Taxation
Our approach to managing tax risk is integrated with our broader business risk management and compliance framework. Our approach is to manage tax risks and tax costs in a manner consistent with applicable regulatory requirements and with shareholders’ best long-term interests, taking into account operational, economic and reputational factors. We manage tax risks in the context of substantive business transactions.
Treasury
The principal financial risks to which we are exposed are those arising from liquidity, interest rate, foreign currency and credit. We have a centralised treasury function to manage these risks in accordance with Board-approved policies. Specifically, liquidity risk is managed through maintaining access to a number of sources of funding to meet anticipated funding requirements, including committed bank facilities and cash resources. Interest rate risk is managed through maintaining a debt portfolio that is weighted towards fixed rates of interest. Accordingly, our net interest charge is not significantly affected by movements in floating rates of interest. We monitor the impact of currency on a portfolio basis (to recognise correlation effect), and may hedge to protect against significant adverse impacts on cash flow over the short- to medium-term. We also hedge the currency
| | |
| 76 | | AstraZenecaAnnual Report and Form 20-F Information 2016 |
exposure that arises between the booking and settlement dates on non-local currency purchases and sales by subsidiaries and the external dividend.
Credit risk is managed through setting and monitoring credit limits appropriate for the assessed risk of the counterparty.
Our capital and risk management objectives and policies are described in further detail in Note 26 to the Financial Statements from page 177 and in Risk overview from page 20. Sensitivity analysis of the Group’s exposure to exchange rate and interest rate movements is also detailed in Note 26 to the Financial Statements from page 177.
Critical accounting policies and estimates
Our Financial Statements are prepared in accordance with IFRSs as adopted by the EU (adopted IFRS) and as issued by the IASB, and the accounting policies employed are set out in the Group Accounting Policies section in the Financial Statements from page 142. In applying these policies, we make estimates and assumptions that affect the Reported amounts of assets and liabilities and disclosure of contingent assets and liabilities. The actual outcome could differ from those estimates. Some of these policies require a high level of judgement because the areas are especially subjective or complex. We believe that the most critical accounting policies and significant areas of judgement and estimation are in:
| > | research and development |
| > | business combinations and contingent consideration |
| > | impairment testing of goodwill and intangible assets |
| > | post-retirement benefits |
Revenue recognition
Product Sales are recorded at the invoiced amount (excluding inter-company sales and value-added taxes) less movements in estimated accruals for rebates and chargebacks given to managed-care and other customers and product returns – a particular feature in the US. It is the Group’s policy to offer a credit note for all returns and to destroy all returned stock in all markets. Cash discounts for prompt payment are also deducted from sales. Revenue is recognised at the point of delivery, which is usually when title passes to the customer, either on shipment or on receipt of goods by the customer depending on local trading terms.
Rebates, chargebacks and returns in the US
When invoicing Product Sales in the US, we estimate the rebates and chargebacks that we expect to pay. These rebates typically arise from sales contracts with third party managed-care organisations, hospitals, long-term care facilities, group purchasing organisations and various federal or state programmes (Medicaid contracts, supplemental rebates etc). They can be classified as follows:
| > | Chargebacks, where we enter into arrangements under which certain parties, typically hospitals, long-term care facilities, group purchasing organisations, the Department of Veterans Affairs, Public Health Service Covered Entities and the Department of Defense, are able to buy products from wholesalers at the lower prices we have contracted with them. The chargeback is the difference between the price we invoice to the wholesaler and the contracted price charged by the wholesaler to the other party. Chargebacks are credited directly to the wholesalers. |
| > | Regulatory, including Medicaid and other federal and state programmes, where we |
| | pay rebates based on the specific terms of agreements with the US Department of Health and Human Services and with individual states, which include product usage and information on best prices and average market prices benchmarks. |
| > | Contractual, under which entities such as third party managed-care organisations are entitled to rebates depending on specified performance provisions, which vary from contract to contract. |
The effects of these deductions on our US pharmaceuticals revenue and the movements on US pharmaceuticals revenue provisions are set out overleaf.
Accrual assumptions are built up on a product-by-product and customer-by-customer basis, taking into account specific contract provisions coupled with expected performance, and are then aggregated into a weighted average rebate accrual rate for each of our products. Accrual rates are reviewed and adjusted on a monthly basis. There may be further adjustments when actual rebates are invoiced based on utilisation information submitted to us (in the case of contractual rebates) and claims/invoices are received (in the case of regulatory rebates and chargebacks). We believe that we have made reasonable estimates for future rebates using a similar methodology to that of previous years. Inevitably, however, such estimates involve judgements on aggregate future sales levels, segment mix and the customers’ contractual performance.
Overall adjustments between gross and net US Product Sales amounted to $12,275 million in 2016 (2015: $14,167 million) with the decrease driven by an overall reduction in our US Product Sales.
Cash discounts are offered to customers to encourage prompt payment. Accruals are calculated based on historical experience and are adjusted to reflect actual experience.
| | |
| AstraZenecaAnnual Report and Form 20-F Information 2016 | | 77 |
Strategic Report | Financial Review
Financial Reviewcontinued
Gross to net Product Sales – US pharmaceuticals
| | | | | | | | | | | | | | | | | | | | | | | | |
| | | | | | | | | | | | 2016 $m | | | 2015 $m | | | 2014 $m | |
| Gross Product Sales | | | | | | | | | | | | | | | 19,640 | | | | 23,641 | | | | 23,414 | |
| Chargebacks | | | | | | | | | | | | | | | (3,449 | ) | | | (2,985 | ) | | | (2,794 | ) |
| Regulatory – Medicaid and state programmes | | | | | | | | | | | | | | | (1,903 | ) | | | (1,714 | ) | | | (1,389 | ) |
| Contractual – Managed-care and Medicare | | | | | | | | | | | | | | | (5,219 | ) | | | (7,543 | ) | | | (7,730 | ) |
| Cash and other discounts | | | | | | | | | | | | | | | (358 | ) | | | (472 | ) | | | (436 | ) |
| Customer returns | | | | | | | | | | | | | | | (130 | ) | | | (333 | ) | | | (295 | ) |
| US Branded Pharmaceutical Fee | | | | | | | | | | | | | | | (145 | ) | | | (174 | ) | | | (113 | ) |
| Other | | | | | | | | | | | | | | | (1,071 | ) | | | (946 | ) | | | (537 | ) |
| Net Product Sales | | | | | | | | | | | | | | | 7,365 | | | | 9,474 | | | | 10,120 | |
Movement in provisions – US pharmaceuticals | |
| | | | | | Brought
forward at 1 January
2016 $m | | | Provision for
current year $m | | | Adjustment in
respect of
prior years
$m | | | Returns and
payments
$m | | | Carried
forward at
31 December
2016 $m | |
| Chargebacks | | | | | | | 324 | | | | 3,470 | | | | (21 | ) | | | (3,211 | ) | | | 562 | |
| Regulatory – Medicaid and state programmes | | | | | | | 777 | | | | 1,976 | | | | (73 | ) | | | (1,873 | ) | | | 807 | |
| Contractual – Managed-care and Medicare | | | | | | | 2,206 | | | | 5,517 | | | | (298 | ) | | | (5,982 | ) | | | 1,443 | |
| Cash and other discounts | | | | | | | 44 | | | | 358 | | | | – | | | | (396 | ) | | | 6 | |
| Customer returns | | | | | | | 467 | | | | 130 | | | | – | | | | (124 | ) | | | 473 | |
| US Branded Pharmaceutical Fee | | | | | | | 264 | | | | 195 | | | | (50 | ) | | | (149 | ) | | | 260 | |
| Other | | | | | | | 186 | | | | 1,071 | | | | – | | | | (1,096 | ) | | | 161 | |
| Total | | | | | | | 4,268 | | | | 12,717 | | | | (442 | ) | | | (12,831 | ) | | | 3,712 | |
| | | | | | | | | | | | | | | | | | | | | | | | |
| | | | | | Brought
forward at 1 January 2015 $m | | | Provision for
current year
$m | | | Adjustment in
respect of
prior years $m | | | Returns and
payments
$m | | | Carried
forward at 31 December
2015 $m | |
| Chargebacks | | | | | | | 457 | | | | 3,019 | | | | (34 | ) | | | (3,118 | ) | | | 324 | |
| Regulatory – Medicaid and state programmes | | | | | | | 707 | | | | 1,809 | | | | (95 | ) | | | (1,644 | ) | | | 777 | |
| Contractual – Managed-care and Medicare | | | | | | | 2,366 | | | | 7,666 | | | | (123 | ) | | | (7,703 | ) | | | 2,206 | |
| Cash and other discounts | | | | | | | 33 | | | | 464 | | | | 8 | | | | (461 | ) | | | 44 | |
| Customer returns | | | | | | | 318 | | | | 349 | | | | (16 | ) | | | (184 | ) | | | 467 | |
| US Branded Pharmaceutical Fee | | | | | | | 245 | | | | 206 | | | | (32 | ) | | | (155 | ) | | | 264 | |
| Other | | | | | | | 163 | | | | 947 | | | | (1 | ) | | | (923 | ) | | | 186 | |
| Total | | | | | | | 4,289 | | | | 14,460 | | | | (293 | ) | | | (14,188 | ) | | | 4,268 | |
| | | | | | | | | | | | | | | | | | | | | | | | |
| | | Brought
forward at
1 January
2014 $m | | | Recognition of
US Branded
Pharmaceutical
Fee as a
revenue
deduction $m | | | Provision for
current year
$m | | | Adjustment in
respect of
prior years $m | | | Returns and
payments
$m | | | Carried
forward at
31 December
2014 $m | |
| Chargebacks | | | 355 | | | | – | | | | 2,838 | | | | (44 | ) | | | (2,692 | ) | | | 457 | |
| Regulatory – Medicaid and state programmes | | | 784 | | | | – | | | | 1,544 | | | | (155 | ) | | | (1,466 | ) | | | 707 | |
| Contractual – Managed-care and Medicare | | | 1,714 | | | | – | | | | 7,703 | | | | 27 | | | | (7,078 | ) | | | 2,366 | |
| Cash and other discounts | | | 32 | | | | – | | | | 436 | | | | – | | | | (435 | ) | | | 33 | |
| Customer returns | | | 222 | | | | – | | | | 295 | | | | – | | | | (199 | ) | | | 318 | |
| US Branded Pharmaceutical Fee | | | – | | | | 132 | | | | 113 | | | | – | | | | – | | | | 245 | |
| Other | | | 74 | | | | – | | | | 537 | | | | – | | | | (448 | ) | | | 163 | |
| Total | | | 3,181 | | | | 132 | | | | 13,466 | | | | (172 | ) | | | (12,318 | ) | | | 4,289 | |
| | |
| 78 | | AstraZenecaAnnual Report and Form 20-F Information 2016 |
Industry practice in the US allows wholesalers and pharmacies to return unused stocks within six months of, and up to 12 months after, shelf-life expiry. The customer is credited for the returned product by the issuance of a credit note. Returned products are not exchanged for products from inventory and once a return claim has been determined to be valid and a credit note has been issued to the customer, the returned products are destroyed. At the point of sale in the US, we estimate the quantity and value of products which may ultimately be returned. Our returns accruals in the US are based on actual experience. Our estimate is based on the preceding 12 months for established products together with market-related information, such as estimated stock levels at wholesalers and competitor activity, which we receive via third party information services. For newly launched products, we use rates based on our experience with similar products or a pre-determined percentage.
For products facing generic competition, we may lose the ability to estimate the levels of returns from wholesalers with the same degree of precision that we can for products still subject to patent protection. This is because we may have limited or no insight into a number of areas: the actual timing of the generic launch (for example, a generic manufacturer may or may not have produced adequate pre-launch inventory); the pricing and marketing strategy of the competitor; the take-up of the generic; and (in cases where a generic manufacturer has approval to launch only one dose size in a market of several dose sizes) the likely level of switching from one dose to another. Under our accounting policy, revenue is recognised only when the amount of the revenue can be measured reliably. Our approach in meeting this condition for products facing generic competition will vary from product to product depending on the specific circumstances.
The adjustment in respect of prior years increased 2016 net US pharmaceuticals revenue by 6.0% (2015: 3.1%; 2014: 1.7%). However, taking into account the adjustments affecting both the current and the prior year, 2015 revenue would have been increased by 1.6% and 2014 revenue would have been increased by 1.2%, by adjustments between years.
We have distribution service agreements with major wholesaler buyers which serve to reduce the speculative purchasing behaviour of the wholesalers and reduce short-term fluctuations in the level of inventory they hold. We do not offer any incentives to encourage wholesaler speculative buying and attempt, where possible, to restrict shipments to underlying demand when such speculation occurs.
Component revenue accounting
A consequence of charging all internal R&D expenditure to the income statement in the year in which it is incurred (which is normal practice in the pharmaceutical industry) is that we own valuable intangible assets which are not recorded on the balance sheet. We also own acquired intangible assets which are included on the balance sheet. As detailed on page 67, our externalisation business model means that, from time to time, we sell such assets and generate income. Sales of product lines are often accompanied by an agreement on our part to continue manufacturing the relevant product for a reasonable period (often about two years) while the purchaser constructs its own manufacturing facilities. The contracts typically involve the receipt of an upfront payment, which the contract attributes to the sale of the intangible assets, and ongoing receipts, which the contract attributes to the sale of the product we manufacture. In cases where the transaction has two or more components, we account for the delivered item (for example, the transfer of title to the intangible asset) as a separate unit of accounting and record revenue on delivery of that component, provided that we can make a reasonable estimate of the fair value of the undelivered component. Where the fair market value of the undelivered component (for example, a manufacturing agreement) exceeds the contracted price for that component, we defer an appropriate element of the upfront consideration and amortise this over the performance period. However, where the fair market value of the undelivered component is equal to or lower than the contracted price for that component, we treat the whole of the upfront amount as being attributable to the delivered intangible assets and recognise that part of the revenue upon delivery. No element of the contracted revenue related to the undelivered component is allocated to the sale of the intangible asset. This is because the contracted revenue relating to the
undelivered component is contingent on future events (such as sales) and so cannot be anticipated.
Research and development
Our business model includes investment in targeted business developments to strengthen our portfolio, pipeline and capabilities. These business development transactions include collaborations, asset in-licences and business acquisitions.
Each transaction is considered to establish whether it qualifies as a business combination by applying the criteria assessment detailed in IFRS 3 ‘Business Combinations’.
On the acquisition of a business, fair values are attributed to the identifiable assets and liabilities and contingent liabilities unless the fair value cannot be measured reliably, in which case the value is subsumed into goodwill. Goodwill is the difference between the fair value of the consideration and the fair value of net assets acquired. Fair value is the price that would be received to sell an asset or pay for a liability in an orderly transaction at the date of acquisition. The price may be directly observable but in most cases is estimated using valuation techniques which normally involve predicting future cash flows and applying a market participant discount rate. Further details of our recent business acquisitions are included in Note 25 to the Financial Statements from page 173.
Future contingent elements of consideration, which may include development and launch milestones, revenue threshold milestones and revenue-based royalties, are fair valued at the date of acquisition using decision-tree analysis with key inputs including probability of success, consideration of potential delays and revenue projections based on the Group’s internal forecasts. Unsettled amounts of consideration are held at fair value within payables with changes in fair value recognised immediately in profit. Several of our recent business combinations have included significant amounts of contingent consideration. Details of the movements in the fair value of the contingent consideration in the year, and the range of possible contingent consideration amounts that may eventually become payable are contained in Note 18 to the Financial Statements on page 164.
| | |
| AstraZenecaAnnual Report and Form 20-F Information 2016 | | 79 |
Strategic Report | Financial Review
Financial Reviewcontinued
Where not all of the equity of a subsidiary is acquired, the non-controlling interest is recognised either at fair value or at the non-controlling interest’s proportionate share of the net assets of the subsidiary, on a case-by-case basis. Put options over non-controlling interests are recognised as a financial liability measured at amortised cost, with a corresponding entry in either retained earnings or against non-controlling interest reserves on a case-by-case basis.
Impairment testing of goodwill and intangible assets
As detailed above, we have significant investments in goodwill and intangible assets as a result of acquisitions of businesses and purchases of assets, such as product development and marketing rights.
Details of the estimates and assumptions we make in our annual impairment testing of goodwill are included in Note 8 to the Financial Statements on page 156. The Group, including acquisitions, is considered a single cash-generating unit for impairment purposes. No impairment of goodwill was identified.
Impairment reviews have been carried out on all intangible assets that are in development (and not being amortised), all major intangible assets acquired during the year and all intangible assets that have had indications of impairment during the year. Sales forecasts and specific allocated costs (which have both been subject to appropriate senior management sign-off) are discounted using appropriate rates based on our risk-adjusted, pre-tax weighted average cost of capital. Our weighted average cost of capital reflects factors such as our capital structure and our costs of debt and equity. In building to the range of rates used in our internal investment appraisal of future projects and capital investment decisions, we adjust our weighted average cost of capital for other factors which reflect, without limitation, local matters such as risk on a case-by-case basis.
A significant portion of our investments in intangible assets and goodwill arose from the restructuring of the joint venture with Merck in 1998, the acquisition of MedImmune in 2007, and the payments arising from the restructuring of the joint venture with Merck in the US. In addition,
our recent business combinations, as detailed in Note 25 to the Financial Statements from page 173, have added significant product, marketing and distribution intangible rights to our intangible asset portfolio. We are satisfied that the carrying values of our intangible assets as at 31 December 2016 are fully justified by estimated future cash flows. The accounting for our intangible assets is fully explained in Note 9 to the Financial Statements from page 157.
Further details of the estimates and assumptions we make in impairment testing of intangible assets are included in Note 9 to the Financial Statements.
Litigation
In the normal course of business, contingent liabilities may arise from product-specific and general legal proceedings, from guarantees or from environmental liabilities connected with our current or former sites. Where we believe that potential liabilities have a less than 50% probability of crystallising, or where we are unable to make a reasonable estimate of the liability, we treat them as contingent liabilities. These are not provided for but are disclosed in Note 28 to the Financial Statements from page 185.
In cases that have been settled or adjudicated, or where quantifiable fines and penalties have been assessed and which are not subject to appeal (or other similar forms of relief), or where a loss is probable (more than 50% assessed probability) and we are able to make a reasonable estimate of the loss, we indicate the loss absorbed or the amount of the provision accrued.
Where it is considered that the Group is more likely than not to prevail, or in the rare circumstances where the amount of the legal liability cannot be estimated reliably, legal costs involved in defending the claim are charged to profit as they are incurred. Where it is considered that we have a valid contract which provides the right to reimbursement (from insurance or otherwise) of legal costs and/or all or part of any loss incurred or for which a provision has been established and we consider recovery to be virtually certain, then the best estimate of the amount expected to be received is recognised as an asset.
Assessments as to whether or not to recognise provisions or assets and of the amounts concerned usually involve a series of complex judgements about future events and can rely heavily on estimates and assumptions. We believe that the provisions recorded are adequate based on currently available information and that the insurance recoveries recorded will be received. However, given the inherent uncertainties involved in assessing the outcomes of these cases and in estimating the amount of the potential losses and the associated insurance recoveries, we could in future periods incur judgments or insurance settlements that could have a material adverse effect on our results in any particular period.
The position could change over time, and there can, therefore, be no assurance that any losses that result from the outcome of any legal proceedings will not exceed the amount of the provisions that have been booked in the accounts.
Although there can be no assurance regarding the outcome of legal proceedings, we do not currently expect them to have a material adverse effect on our financial position, but they could significantly affect our financial results in any particular period.
Post-retirement benefits
We offer post-retirement benefit plans which cover many of our employees around the world. In keeping with local terms and conditions, most of these plans are defined contribution in nature, where the resulting income statement charge is fixed at a set level or is a set percentage of employees’ pay. However, several plans, mainly in the UK (which has by far the largest single scheme), the US, Sweden and Germany are defined benefit plans where benefits are based on employees’ length of service and final salary (typically averaged over one, three or five years). The UK and US defined benefit schemes were closed to new entrants in 2000. All new employees in these countries are offered defined contribution schemes.
In applying IAS 19 ‘Employee Benefits’, we recognise all actuarial gains and losses immediately through Other Comprehensive Income. Investment decisions in respect of defined benefit schemes are based on underlying actuarial and economic circumstances with the intention of ensuring
| | |
| 80 | | AstraZenecaAnnual Report and Form 20-F Information 2016 |
that the schemes have sufficient assets to meet liabilities as they fall due, rather than meeting accounting requirements. The trustees follow a strategy of awarding mandates to specialist, active investment managers, which results in a broad diversification of investment styles and asset classes. The investment approach is intended to produce less volatility in the plan asset returns.
In assessing the discount rate applied to the obligations, we have used rates on AA corporate bonds with durations corresponding to the maturities of those obligations, except in Sweden where we have used rates on mortgage bonds as the market in high quality corporate bonds is insufficiently deep.
In all cases, the pension costs recorded in the Financial Statements are assessed in accordance with the advice of independent qualified actuaries, but require the exercise of significant judgement in relation to assumptions for long-term price inflation, and future salary and pension increases.
Further details of our accounting for post-retirement benefit plans are included in Note 20 to the Financial Statements from page 165.
Taxation
Accruals for tax contingencies require management to make judgements and estimates of exposures in relation to tax audit issues. Tax benefits are not recognised unless the tax positions will probably be sustained based upon management’s interpretation of applicable laws and regulations and the likelihood of settlement. Once considered to be probable, management reviews each material tax benefit to assess whether a provision should be taken against full recognition of the benefit on the basis of potential settlement through negotiation and/or litigation. Accruals for tax contingencies are measured using the single best estimate of likely outcome approach. Any liability to interest on tax liabilities is provided for in the tax charge.
We face a number of audits in jurisdictions around the world and, in some cases, are in dispute with the tax authorities. The issues under discussion are often complex and can require many years to resolve.
Further details of the estimates and assumptions we make in determining our recorded liability for transfer pricing contingencies and other tax contingencies are included in the Tax section of Note 28 to the Financial Statements from page 185.
Sarbanes-Oxley Act Section 404
As a consequence of our NYSE listing, we are required to comply with those provisions of the Sarbanes-Oxley Act applicable to foreign issuers. Section 404 of the Sarbanes-Oxley Act requires companies annually to assess and make public statements about the quality and effectiveness of their internal control over financial reporting. As regards Sarbanes-Oxley Act Section 404, our approach is based on the Committee of Sponsoring Organizations (COSO) 2013 framework.
Our approach to the assessment has been to select key transaction and financial reporting processes in our largest operating units and a number of specialist areas, (eg financial consolidation and reporting, treasury operations and taxation etc), so that, in aggregate, we have covered a significant proportion of the key lines in our Financial Statements. Each of these operating units and specialist areas has ensured that its relevant processes and controls are documented to appropriate standards, taking into account, in particular, the guidance provided by the SEC. We have also reviewed the structure and operation of our ‘entity level’ control environment. This refers to the overarching control environment, including structure of reviews, checks and balances that are essential to the management of a well-controlled business.
The Directors have concluded that our internal control over financial reporting is effective at 31 December 2016 and the assessment is set out in the Directors’ Responsibilities for, and Report on, Internal Control over Financial Reporting on page 133. KPMG LLP has audited the effectiveness of our internal control over financial reporting at 31 December 2016 and, as noted in the Auditor’s Reports on the Financial Statements and on Internal Control over Financial Reporting (Sarbanes-Oxley Act Section 404) on page 134, their report is unqualified.
Strategic Report
The Strategic Report, which has been prepared in accordance with the requirements of the Companies Act 2006, comprises the following sections:
| | > | Chief Executive Officer’s Review |
| | > | Strategy, including Risk overview |
and has been approved and signed on behalf of the Board.
A C N Kemp
Company Secretary
2 February 2017
| | |
| AstraZenecaAnnual Report and Form 20-F Information 2016 | | 81 |
Corporate Governance
Chairman’s Statement
| | | | |
| | |
| | | | |
 | | AstraZeneca’s Directors take very seriously their responsibility to have a robust governance structure in place.” the cycle of innovation. We need to work hard to continue to improve R&D productivity by carefully selecting those therapy areas and projects in which we invest, as well as controlling costs. Returns to shareholders and outlook In 2016, Reported earnings per share (EPS) of $2.77 for the year represented an increase of 9%, including a gain of $0.76 on the revaluation of acquisition-related liabilities. Core EPS in the year declined by 5% to $4.31, driven by the decline in Total Revenue. Both Reported and Core EPS for the year included a non-recurring benefit of $0.36, following agreements between the Canadian tax authority and the UK and Swedish tax authorities. Given this performance, the Board was able to declare a second interim dividend of $1.90 per share (150.2 pence, 16.57 SEK) bringing the dividend per share for the full year to $2.80 (218.9 pence, 24.38 SEK). At the same time, the Board reaffirmed its commitment to the Company’s progressive dividend policy. Sound governance AstraZeneca’s Directors take very seriously their responsibility to have a robust governance structure in place to ensure that we are able properly to discharge our responsibilities in setting our strategy, as well as monitoring and reviewing progress as it is implemented, and ensuring that we manage our risks and carry out business responsibly. We are also very conscious that, as Directors, we are accountable to our shareholders and must have regard to |
Strategic progress As reported by Pascal Soriot, our Chief Executive Officer, we made good progress in delivering our strategic priorities in 2016. During the year, we brought a sharper focus to our three main therapy areas and boosted pipeline productivity further. As is to be expected, we encountered some setbacks on the way but our underlying business is growing and a new AstraZeneca is emerging, driven by our competitive franchises and our businesses in Emerging Markets. As Marc Dunoyer, our Chief Financial Officer, outlines, our financial results for 2016 were in line with expectations and reflected the ongoing transition of our Company. The fall in Product Sales revenue was primarily due to the entry of generic competition to Crestor in the US. We now look ahead to the impact of our recent launches as well as the future launches that are to come from our late-stage pipeline. Each year the Board reviews our strategy. Our review in 2016 confirmed our belief that 2017 has the potential to be a defining year for AstraZeneca as we bring new medicines to patients across the globe. We have the opportunity to launch several life-changing medicines for cancer, respiratory and metabolic diseases. | | An uncertain world Our performance in 2016 and in the year ahead takes place in an uncertain world. The economic recovery following the global financial crisis is still precarious and is fuelling calls for restrictions on trade and immigration. In the UK, following the vote for ‘Brexit’, we expect increased uncertainty both in the UK and the Eurozone. In the US, we expect the increased focus on pharmaceutical prices and their impact on healthcare costs to continue, while there remains uncertainty over the future of the Affordable Care Act and what might replace it. On the other hand, and against this uncertain background, we believe the demand for healthcare will continue to increase with a growing and ageing world population. Access to our range of innovative medicines also continues to improve. Of course, challenges will always remain in what is a very competitive marketplace. These include the continuing, and planned for, cycle of expiring patents that lie at the heart of our business model, as well as competition from and the growing use of generic medicines. We need to obtain regulatory approval for new medicines, secure reimbursement for those medicines, and achieve pricing and sales sufficient to generate revenue and sustain | |
| | |
| 82 | | AstraZenecaAnnual Report and Form 20-F Information 2016 |
| | | | | | | | |
| | | | | |
| | | | | | | | |
| | | | Compliance with the UK Corporate Governance Code |
| | | | |
| | | | We have prepared this Annual Report with reference to the UK Corporate Governance Code published by the UK Financial Reporting Council (FRC) in September 2014. This Corporate Governance Report (together with other sections of this Annual Report) describes how we apply the main principles of good governance in the UK Corporate Governance Code. | | | | We have complied throughout the accounting period with the provisions of the UK Corporate Governance Code, which is available on the FRC’s website.  www.frc.org.uk www.frc.org.uk
|
| | | | |
| | | | | | | | | |
| | | | |
| | | | | | | | |
other stakeholders such as employees, customers, suppliers, the communities in which we do business and the environment. We welcome the opportunity at our Annual General Meeting to meet and answer shareholders’ questions. We also maintain an active dialogue with shareholders throughout the year and listen to views of representatives of investors and financial institutions. The views of other stakeholders are also important. We maintain an active dialogue with shareholders about executive remuneration. Our pay structure is intended to be sufficient to attract and retain high-calibre individuals in order to deliver the Company’s strategy. In setting individual pay levels, we consider the individual’s skills and experience, internal relativities and conditions in the local external market. Over the course of 2016, we have reviewed our Remuneration Policy and in his introduction to this year’s Directors’ Remuneration Report on page 103, Graham Chipchase, Chairman of the Remuneration Committee, gives more details about the changes we are proposing and why. We are grateful to those who contributed to the review and the Board commends the revised Remuneration Policy to shareholders for approval. Board changes I am grateful to Graham and all the Directors for their contribution during 2016, especially those of my other colleagues who have the added responsibility of chairing Board Committees: Rudy Markham, our Senior independent Non-Executive Director, who chairs the Audit Committee and Bruce Burlington who chairs the Science Committee. | | | | During the year we said farewell to two members of the Board. Jean-Philippe Courtois stood down from the Board on 1 December. He was approaching nine years’ tenure and had recently taken on new responsibilities at Microsoft. We will miss his business acumen, extensive experience of the global technology industry, common sense and collegiality. We wish him all the best for his future endeavours. Earlier in the year, Dr Cornelia (Cori) Bargmann, also stood down from the Board after accepting a new position as President of Chan Zuckerberg Science, part of the Chan Zuckerberg Initiative. We congratulate Cori on her new appointment and thank her for her contribution to AstraZeneca. Searches for new Non-Executive Directors are continuing and succession plans will be announced during 2017. A sustainable business As we look ahead and plan for the sustainable growth of AstraZeneca, how we operate is as important as what we do. It is therefore particularly gratifying to see increasing external recognition of our efforts to operate in a sustainable way and in a way that recognises the interconnection between business growth, the needs of society, and the limitations of our planet. This means delivering our business strategy so that access to our medicines is broadened, the environmental footprint of our products and processes is minimised, and ethics and transparency underpin everything we do. | | | | In the annual Dow Jones Sustainability Index, we improved our score compared with 2015 and came second in the ‘Pharmaceuticals, Biotechnology and Life Sciences’ industry group. We also achieved an A-list ranking for climate change, supplier climate change and water stewardship by investor benchmarking organisation CDP. In the biennial Access to Medicine Index, our efforts to improve access to our innovative medicines and to healthcare more generally was recognised in AstraZeneca being the biggest riser in the Index since the last survey. We moved to 7th place in 2016 from 15th in 2014 and were recognised for multiple best practices and innovations. Life-changing medicines In 2016, we made good progress pushing the boundaries of science to deliver medicines to patients. Your Board of Directors remains focused on ensuring that more patients are able to benefit from our expanding portfolio of innovative medicines that meet unmet medical need and change lives. 
Leif Johansson Chairman |

| | |
| AstraZenecaAnnual Report and Form 20-F Information 2016 | | 83 |
Corporate Governance
Corporate Governance Overview
How our governance supports the delivery of our strategy.
| | | | | | | | | | | | | | |
| | | | | | | | |
| Board | | | | | | Audit Committee | | | | | | Remuneration Committee | | |
| | | | | | | | |
Chairman: Leif Johansson Senior independent Non-Executive Director: Rudy Markham All Directors are collectively responsible for the success of the Group. The Non-Executive Directors exercise independent, objective judgement in respect of Board decisions, and scrutinise and challenge management. They also have various responsibilities concerning the integrity of financial information, internal controls and risk management. The Board is responsible for setting our strategy and policies, overseeing risk and corporate governance, and monitoring progress towards meeting our objectives and annual plans. It is accountable to our shareholders for the proper conduct of the business and our long-term success, and represents the interests of all stakeholders. The Board conducts an annual review of the Group’s overall strategy. The CEO, CFO and Senior Executive Team (SET) take the lead in developing our strategy, which is then reviewed, constructively challenged and approved by the Board. The Board has delegated some of its powers to the CEO and operates with the assistance of four Committees. Members of the Board and their biographies are shown on pages 86 and 87. | | | | | | Chairman: Rudy Markham The Audit Committee provides assurance to the Board in the following areas: the integrity of our financial reporting and internal controls over financial matters; our internal controls over non-financial matters; compliance with laws and our Code of Conduct; the quality of the Company’s relationship with its external auditor; the role, resources and effectiveness of the Company’s internal audit function; and the effectiveness of the Company’s risk management framework, in each case with the ultimate aim of protecting our shareholders’ interests. | | | | | | Chairman: Graham Chipchase The Remuneration Committee considers and sets, on behalf of the Board, the remuneration (including pension rights and compensation payments) of Executive Directors and other senior executives. No Director is involved in deciding his or her own remuneration. | | |
| | | | | | | | |
 Corporate Governance Report from page 90 Corporate Governance Report from page 90 | | | | | | Audit Committee Report from page 98 | | | | | | Directors’ Remuneration Report from page 103 | | |
| | | | | | | | |
| | | | | | | | | | | | | | | |
Board Committee membership and meeting attendance in 2016
| | | | | | | | | | | | | | | | | | | | | | | | |
| Name | | Board | | | Audit | | | Remuneration | | | Nomination and Governance | | | Science | | | Independent1 | |
| Cori Bargmann² | | | ✓ 8(9) | | | | | | | | | | | | | | | | ✓ 3(3) | | | | ✓ | |
| Geneviève Berger | | | ✓ 11(11) | | | | | | | | | | | | | | | | ✓ 4(4) | | | | ✓ | |
| Bruce Burlington | | | ✓ 10(11) | | | | ✓ 5(5) | | | | | | | | ✓ 4(4) | | | | Chairman 4(4) | | | | ✓ | |
| Ann Cairns | | | ✓ 8(11) | | | | ✓ 4(5) | | | | | | | | | | | | | | | | ✓ | |
| Graham Chipchase | | | ✓ 11(11) | | | | | | | | Chairman 5(5) | | | | ✓ 4(4) | | | | | | | | ✓ | |
| Jean-Philippe Courtois³ | | | ✓ 8(10) | | | | ✓ 4(4) | | | | | | | | | | | | | | | | ✓ | |
| Marc Dunoyer | | | ✓ 11(11) | | | | | | | | | | | | | | | | | | | | N/A | |
| Leif Johansson | | | Chairman 11(11) | | | | | | | | ✓ 4(5) | | | | Chairman 4(4) | | | | | | | | N/A4 | |
| Rudy Markham | | | ✓ 11(11) | | | | Chairman 5(5) | | | | ✓ 4(5) | | | | ✓ 4(4) | | | | | | | | ✓ | |
| Pascal Soriot | | | ✓ 11(11) | | | | | | | | | | | | | | | | | | | | N/A | |
| Shriti Vadera | | | ✓ 11(11) | | | | ✓ 5(5) | | | | ✓ 5(5) | | | | | | | | | | | | ✓ | |
| Marcus Wallenberg | | | ✓ 9(11) | | | | | | | | | | | | | | | | ✓ 4(4) | | | | | |
Note: number in brackets denotes number of meetings during the year that Board members were entitled to attend.
| 1 | As determined by the Board for the purposes of the UK Corporate Governance Code. |
| 2 | Cori Bargmann stepped down from the Board and as a member of the Science Committee with effect from 1 October 2016. |
| 3 | Jean-Philippe Courtois stepped down from the Board and as a member of the Audit Committee with effect from 1 December 2016. |
| 4 | Leif Johansson was considered by the Board to be independent upon his appointment as Chairman. In accordance with the UK Corporate Governance Code, the test of independence is not appropriate in relation to the Chairman after his appointment. |
| | |
| 84 | | AstraZenecaAnnual Report and Form 20-F Information 2016 |
| | | | | | | | | | | | | | | | | | |
| | | | | | | | | | |
Nomination and Governance Committee | | | | | | Science Committee | | | | | | Senior Executive Team | | | | | | Key governance roles |
Chairman: Leif Johansson The Nomination and Governance Committee recommends new Board appointments for decision by the Board and, more broadly, considers succession planning for senior executive management and Board positions. The Nomination and Governance Committee also advises the Board on significant developments in corporate governance. | | | | | | Chairman: Bruce Burlington The Science Committee provides assurance to the Board regarding the Group’s R&D activities by reviewing and assessing our approaches in our chosen therapy areas; the scientific technology and R&D capabilities we deploy; the quality and development of our scientists; and our decision making. | | | | | | The members of the SET are: > CEO > CFO > Nine Executive Vice-Presidents (EVPs) from across the organisation, representing the three science units, the five commercial units (including GPPS), Operations & IT and HR > General Counsel > Chief Compliance Officer. The SET is the body through which the CEO exercises the authority delegated to him by the Board. It usually meets monthly and considers major business issues and makes recommendations to the CEO, and typically reviews matters that are to be submitted to the Board for its consideration. The CEO is responsible for establishing and chairing the SET. | | | | | | Chairman: Leadership, operation and governance of the Board, ensuring Board effectiveness CEO: Responsible to the Board for the management, development and performance of the business Senior independent Non-Executive Director: Acts as a sounding board for the Chairman and an intermediary for other Directors and shareholders when necessary |
| | | | | | | | | | |
Nomination and Governance Committee from page 93 | | | | | | Science Committee from page 93 | | | | | | The biographies of SET members are shown on pages 88 and 89 | | | | | | |
| | | | | | | | | | |
| | | | | | | | | | | | | | | | | | | |
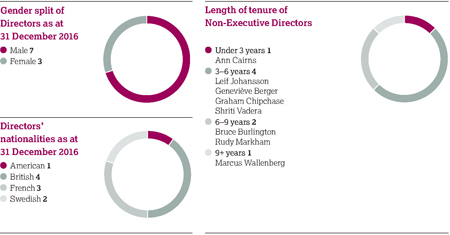
| | |
| AstraZenecaAnnual Report and Form 20-F Information 2016 | | 85 |
Corporate Governance
Board of Directors
as at 31 December 2016

1 Leif Johansson (65)
Non-Executive Chairman of the Board
(April 2012*)
Committee membership Chairman of the Nomination and Governance Committee and member of the Remuneration Committee
Skills and experience From 1997 to 2011, Leif was Chief Executive Officer of AB Volvo. Prior to that, he served at AB Electrolux, latterly as Chief Executive Officer from 1994 to 1997. He was a Non-Executive Director of BMS from 1998 to September 2011, serving on the Board’s Audit Committee, and Compensation and Management Development Committee. He holds an MSc in engineering from Chalmers University of Technology, Gothenburg.
Other appointments Leif is Chairman of global telecommunications company, LM Ericsson. He holds board positions at Autoliv, Inc and Ecolean AB. He has been a member of the Royal Swedish Academy of Engineering Sciences since 1994, serving as Chairman since 2012. Leif is also a member of the European Round Table of Industrialists and Chairman of the International Advisory Board of the Nobel Foundation.
2 Pascal Soriot (57)
Executive Director and CEO (October 2012)
Skills and experience Pascal brings a passion for science and medicine as well as significant experience in established and emerging markets, strength of strategic thinking, a successful track record of managing change and executing strategy, and the ability to lead a diverse organisation. He served as Chief Operating Officer of Roche’s pharmaceuticals division from 2010 to September 2012 and, prior to that, Chief Executive Officer of Genentech, a biologics business, where he led its successful merger with Roche. Pascal joined the pharmaceutical industry in 1986 and has worked in senior management roles in numerous major companies around the world. He is a doctor of veterinary medicine (École Nationale Vétérinaire d’Alfort, Maisons-Alfort) and holds an MBA from HEC, Paris.
3 Marc Dunoyer (64)
Executive Director and CFO (November 2013)
Skills and experience Marc’s career in pharmaceuticals, which has included periods with Roussel Uclaf, Hoechst Marion Roussel and GlaxoSmithKline (GSK), has given him extensive industry experience, including finance and accounting; corporate strategy and planning; research and development; sales and marketing; business reorganisation; and business development. Marc is a qualified accountant and joined AstraZeneca in 2013, serving as Executive Vice-President, GPPS from June to October 2013. Prior to that, he served as Global Head of Rare Diseases at GSK and (concurrently) Chairman, GSK Japan. He holds an MBA from HEC, Paris and a Bachelor of Law degree from Paris University.
| | |
| 86 | | AstraZenecaAnnual Report and Form 20-F Information 2016 |
4 Rudy Markham (70)
Senior independent Non-Executive Director (April 2015. Member of the Board since September 2008)
Committee membership Chairman of the Audit Committee and member of the Remuneration Committee and Nomination and Governance Committee
Skills and experience Rudy has significant international business and financial experience, having formerly held various senior commercial and financial positions with Unilever, culminating in his appointment as its Chief Financial Officer. He also served as a Non-Executive Director of the UK Financial Reporting Council from 2007 to 2012 and formerly as Chairman and a Non-Executive Director of Moorfields Eye Hospital NHS Foundation Trust.
Other appointments Rudy is a non-executive member of the Boards of United Parcel Services Inc. and Legal & General plc. He is also Vice Chairman of the Supervisory Board of Corbion NV (formerly CSM NV), a Fellow of the Chartered Institute of Management Accountants and a Fellow of the Association of Corporate Treasurers.
5Geneviève Berger (61)
Non-Executive Director (April 2012)
Committee membership Member of the Science Committee and oversees sustainability matters on behalf of the Board
Skills and experience Geneviève was Chief Science Officer at Unilever PLC and a member of the Unilever Leadership Executive from 2008 to April 2014. She holds three doctorates – in physics, human biology and medicine – and was appointed Professor of Medicine at l’Université Pierre et Marie Curie, Paris in 2006. Her previous positions include Professor and Hospital Practitioner at l’Hôpital de la Pitié-Salpêtrière in Paris; Director of the Biotech and Agri-Food Department; Head of the Technology Directorate at the French Ministry of Research and Technology; Director General, at the Centre National de la Recherche Scientifique; and Chairman of the Health Advisory Board of the EU Commission.
Other appointments In May 2015, Geneviève was appointed as a Director of Air Liquide S.A. for a term of four years. She is currently Chief Research Officer at Firmenich SA, Geneva, Switzerland.
6 Bruce Burlington (68)
Non-Executive Director (August 2010)
Committee membership Chairman of the Science Committee and member of the Audit Committee and the Nomination and Governance Committee
Skills and experience Bruce is a pharmaceutical product development and regulatory affairs consultant and brings extensive experience in these areas. He spent 17 years with the FDA, serving as Director of its Center for Devices and Radiological Health, as well as holding various senior roles in the Center for Drug Evaluation and Research. After leaving the FDA, he held various senior executive positions at Wyeth (now part of Pfizer).
Other appointmentsBruce is a Non-Executive Director of the International Partnership for Microbicides.
7 Ann Cairns (59)
Non-Executive Director (April 2014)
Committee membership Member of the Audit Committee
Skills and experience Ann has more than 20 years’ experience as a senior leader, having held management positions across Europe and the US, and has previously run global retail, commercial and investment banking operations. As president of International Markets at MasterCard, Ann is responsible for the management, growth and expansion of all markets and customer-related activities outside of North America. Prior to MasterCard, in 2011, Ann oversaw the European liquidation of Lehman Brothers Holdings International and was the Chief Executive, Transaction Banking at ABN AMRO. In 2017, Ann will join the board of directors of Intercontinental Exchange, Inc., a company listed on the New York Stock Exchange. Ann holds a Pure Mathematics degree from Sheffield University and an MSc from Newcastle University. Among her many accomplishments, Ann has been an award-winning research engineer and was the first woman qualified to go offshore in Britain. Ann is a champion of inclusion – digital, financial and gender – and is also a member of the World Food Programme investment committee.
8 Graham Chipchase (53)
Non-Executive Director (April 2012)
Committee membership Chairman of the Remuneration Committee and member of the Nomination and Governance Committee
Skills and experience Graham served as Chief Executive Officer of global consumer packaging company, Rexam PLC from 2010 to 2016 after serving at Rexam as Group Director, Plastic Packaging and Group Finance Director. Previously, he was Finance Director of Aerospace Services at the global engineering group GKN PLC from 2001 to 2003. After starting his career with Coopers & Lybrand Deloitte, he held various finance roles in the industrial gases company The BOC Group PLC (now part of The Linde Group). He is a Fellow of the Institute of Chartered Accountants in England and Wales and holds an MA (Hons) in chemistry from Oriel College, Oxford.
Other appointments In January 2017, Graham joined Brambles Limited, the Sydney-listed supply chain logistics company, as CEO designate, and will become CEO from 20 February 2017.
9 Shriti Vadera (54)
Non-Executive Director (January 2011)
Committee membership Member of the Audit Committee and the Remuneration Committee
Skills and experience Shriti has significant knowledge of global finance, emerging markets and public policy. She has advised governments, banks and investors on the Eurozone crisis, the banking sector, debt restructuring and markets. She has served as a G20 Adviser and a Minister in the UK Cabinet Office and Business Department and International Development Department. She has also served on the Council of Economic Advisers, HM Treasury, where she focused on business and international economic issues. Prior to that, Shriti spent 14 years in investment banking with SG Warburg/UBS.
Other appointments Shriti is Chairman of Santander UK plc and Senior Independent Director of BHP Billiton.
10 Marcus Wallenberg (60)
Non-Executive Director (April 1999)
Committee membership Member of the Science Committee
Skills and experience Marcus has international business experience across various industry sectors, including the pharmaceutical industry from his directorship with Astra prior to 1999.
Other appointments Marcus is Chairman of Skandinaviska Enskilda Banken AB, Saab AB and FAM AB. He is a member of the boards of Investor AB, Temasek Holdings Limited, and the Knut and Alice Wallenberg Foundation.
* Date of appointment.
| | |
| AstraZenecaAnnual Report and Form 20-F Information 2016 | | 87 |
Corporate Governance
Senior Executive Team
as at 31 December 2016

1 Pascal Soriot
CEO
See page 86.
2 Marc Dunoyer
CFO
See page 86.
3 Katarina Ageborg
Chief Compliance Officer
Katarina was appointed Chief Compliance Officer and a member of the SET on 1 July 2011. She has overall responsibility for the delivery, design and implementation of the Company’s compliance programme and since her appointment has driven increased efficiency and effectiveness in compliance. She has also assumed responsibility for Safety, Health & Environment, and most recently in 2015 for the Company’s sustainability programme. Katarina led the Global IP function from 2008 to 2011, during which time she streamlined the organisation and launched a new patent filing strategy. After joining AstraZeneca in 1998, she held a series of senior legal roles supporting Commercial,

Regulatory and IP. Prior to AstraZeneca, Katarina established her own law firm and worked as a lawyer on both civil and criminal cases. Katarina holds a Master of Law Degree from Uppsala University School of Law in Sweden.
4 Dr Sean Bohen
Executive Vice-President,
Global Medicines Development and Chief Medical Officer
Sean was appointed Executive Vice-President, GMD in September 2015 and leads our global late-stage development organisation for both small molecules and biologics. He is also the Company’s Chief Medical Officer and is responsible for patient safety across the entire AstraZeneca and MedImmune portfolio. He joined AstraZeneca from Genentech, where he held a number of senior leadership roles across various therapy areas and was most recently Senior Vice President of Early Development. Before joining Genentech, Sean was a Clinical Instructor in Oncology at Stanford University School of Medicine, a research associate at the Howard Hughes Medical Institute and a postdoctoral fellow at the National Cancer Institute.

He is a graduate of the University of Wisconsin and later earned his doctorate in biochemistry and his medical degree at the University of California, San Francisco.
5Pam Cheng
Executive Vice-President, Operations
and Information Technology
Pam joined AstraZeneca in June 2015 after having spent 14 years in Global Manufacturing and Supply Chain roles at Merck/MSD. Pam was the Head of Global Supply Chain Management & Logistics for Merck from 2006 to 2011 and led the transformation of Merck supply chains across the global supply network. More recently, Pam was President of MSD China, responsible for MSD’s entire business in China. Prior to joining Merck, Pam held various engineering and project management positions at Universal Oil Products, Union Carbide Corporation and GAF Chemicals. Pam holds Bachelor’s and Master’s degrees in chemical engineering from Stevens Institute of Technology in New Jersey and an MBA in marketing from Pace University in New York. She has been a member of the Board of Directors for Codexis Inc. (CDXS) since 2014.
| | |
| 88 | | AstraZenecaAnnual Report and Form 20-F Information 2016 |
6 Fiona Cicconi
Executive Vice-President, Human Resources
Fiona joined AstraZeneca in September 2014 as Executive Vice-President, Human Resources. She started her career at General Electric, where she held various human resources roles within the oil and gas business, which included experience in major global acquisitions and driving change. Subsequently, Fiona spent a number of years at Cisco, overseeing human resources in seven countries in Europe and latterly handling employee relations in Europe, Middle East and Africa, before joining Roche in 2006. There, she was most recently responsible for global human resources for Pharma Technical Operations, where her primary focus was to identify and develop a sustainable supply of leadership and talent from within the organisation.
7 Dr Ruud Dobber
Executive Vice-President, North America
Ruud was appointed Executive Vice-President, North America in August 2016 and is responsible for driving growth and maximising the contribution of the commercial operations in North America to AstraZeneca’s global business. Ruud joined AstraZeneca in 1997 and has held various senior commercial and leadership roles. Most recently, Ruud was Executive Vice-President, Europe and oversaw business functions in the 28 EU member states. Ruud was also responsible for the development of our late-stage, small molecule antibiotic pipeline as well as its global commercialisation. Prior to that, Ruud was Regional Vice-President of AstraZeneca’s European, Middle East and African division, Regional Vice-President for the Asia Pacific region and Interim Executive Vice-President, GPPS. Ruud was a member of the Board and Executive Committee of the European Federation of Pharmaceutical Industries and Associations (EFPIA) and was previously Chairman of the Asia division of Pharmaceutical Research and Manufacturers of America. Holding a doctorate in immunology from the University of Leiden in the Netherlands, Ruud began his career as a scientist, researching in the field of immunology and ageing.
8 Dr Bahija Jallal
Executive Vice-President, MedImmune
Bahija was appointed Executive Vice-President, MedImmune in January 2013 and is responsible for biologics research and development activities. Bahija is tasked with advancing the biologics pipeline of medicines. She joined MedImmune in 2006 as Vice-President, Translational Sciences and has held roles of increasing responsibility at AstraZeneca. Prior to joining AstraZeneca, Bahija worked with Chiron Corporation, where she served as Vice-President, Drug Assessment and Development. Bahija received a Master’s degree in biology from l’Université de Paris VII and her doctorate in physiology from l’Université Pierre et Marie Curie, Paris VI. She conducted her postdoctoral research at the Max-Planck Institute of Biochemistry in Martinsried, Germany. She is the President of the Board of Directors of the Association for Women in Science and she is also on the Board of Trustees of the Johns Hopkins University.
9 Mark Mallon
Executive Vice-President, Global Product and Portfolio Strategy, Global Medical Affairs & Corporate Affairs
Executive Vice-President, International West
Mark was appointed Executive Vice-President, Global Product and Portfolio Strategy, Global Medical Affairs & Corporate Affairs in August 2016, leading AstraZeneca’s global marketing and commercial portfolio strategy as well as the medical affairs and corporate affairs functions. Prior to this, Mark was EVP for the International region with responsibility for the growth and performance of AstraZeneca’s commercial businesses in various parts of the world, including Asia Pacific, Russia, Latin America, the Middle East and Africa. He retains responsibility for these International businesses excluding Asia Pacific for which a new SET position was created in early 2017. Since joining AstraZeneca in 1994, Mark has held a number of senior sales and marketing roles, including Regional Vice-President for Asia Pacific, President of AstraZeneca’s Chinese and Italian subsidiaries, Chief Operating Officer of AstraZeneca’s Japanese subsidiary and Vice-President of AstraZeneca’s US gastrointestinal and respiratory businesses. He has served as a member of the Board of Directors for Christiana Care, the largest hospital system in Delaware. He has also been an Executive Committee Member for R&D-based Pharmaceutical Association Committee, the China industry association for innovative pharmaceutical companies. Mark began his career in the pharmaceutical industry in management consulting. He holds a degree in chemical engineering from the University of Pennsylvania and an MBA in marketing and finance from the Wharton School of Business.
10 Dr Menelas Pangalos
Executive Vice-President, IMED Biotech Unit and Global Business Development
Menelas (Mene) was appointed Executive Vice-President, IMED Biotech Unit in January 2013 and leads AstraZeneca’s small molecule research and early development activities. In 2016, Mene was also made Global Head of Business Development. Mene joined AstraZeneca from Pfizer, where he was Senior Vice-President and Chief Scientific Officer of Neuroscience Research. Previously, he held senior discovery and neuroscience roles at Wyeth and GSK. He completed his undergraduate degree in biochemistry at the Imperial College of Science and Technology, London and earned a doctorate in neurochemistry from the University of London. He is a Visiting Professor of Neuroscience at King’s College London and is a Fellow of Clare Hall at the University of Cambridge. Mene is a Fellow of the Academy of Medical Sciences and the Royal Society of Biology. In the UK, Mene serves on the Medical Research Council, is on the Board of the British Pharmaceutical Group and a Non-Executive Director of the UK Precision Medicine Catapult.
11 Jeff Pott
General Counsel
Jeff was appointed General Counsel in January 2009 and has overall responsibility for all aspects of AstraZeneca’s Legal and IP function. He joined AstraZeneca in 1995 and has worked in various litigation roles, where he has had responsibility for IP, anti-trust and product liability litigation. Before joining AstraZeneca, he spent five years at the US legal firm Drinker Biddle and Reath LLP, where he specialised in pharmaceutical product liability litigation and anti-trust advice and litigation. He received his bachelor’s degree in political science from Wheaton College and his Juris Doctor Degree from Villanova University School of Law.
12 Leon Wang
Executive Vice-President, Asia Pacific
Leon was appointed Executive Vice-President, Asia Pacific in January 2017. This is a region of great importance for the future of the Group and Leon is responsible for the overall strategy and the promotion of the sustainable growth of our activities in China and Hong Kong, Asia Area, Australia and New Zealand. He joined AstraZeneca China in 2013 as a Vice-President and became President in 2014. Under his leadership China became AstraZeneca’s second-largest market worldwide. Leon has 20 years of experience in the pharmaceutical industry, including a series of positions of increasing responsibility in marketing and business leadership at Roche where he was a Business Unit Vice President before joining AstraZeneca. He is Council Vice Chairman of the Shanghai Association of Foreign Investment, Executive Committee Member responsible for Pricing of the R&D-based Pharmaceutical Association Committee under the China Association of Enterprises with Foreign Investment and Corporate Advisory Board Member of China Europe International Business School. He holds a Bachelor of Arts from Shanghai International Studies University and an EMBA from China Europe International Business School.
Note: The position of Executive Vice-President, Europe is vacant at the date of this report with recruitment activity underway. From September 2016 until January 2017, the position was held by Luke Miels (who prior to that led GPPS, AstraZeneca’s global marketing, business development and commercial portfolio strategy operations). It was announced in January 2017 that Mr Miels would leave AstraZeneca to take up a senior position with a main competitor. As a result, Mr Miels was placed on garden leave pending agreement of his start date.
| | |
| AstraZenecaAnnual Report and Form 20-F Information 2016 | | 89 |
Corporate Governance
Corporate Governance Report
Board composition
The membership of the Board at
31 December 2016 and information about individual Directors is contained in the Board of Directors section on pages 86 and 87.
Corporate governance
We have prepared this Annual Report with reference to the UK Corporate Governance Code published by the UK Financial Reporting Council (FRC) in September 2014.
This Corporate Governance Report (together with other sections of this Annual Report) describes how we apply the main principles of good governance in the UK Corporate Governance Code. We have complied throughout the accounting period with the provisions of the UK Corporate Governance Code, which is available on the FRC’s website, www.frc.org.uk.
Leadership and responsibilities
The roles of Chairman and CEO are split. Leif Johansson, our Non-Executive Chairman, is responsible for leadership of the Board. Our CEO, Pascal Soriot, leads the SET and has executive responsibility for running our business. The Board comprises 10 Non-Executive Directors, including the Chairman, and two Executive Directors – the CEO, Pascal Soriot, and the CFO, Marc Dunoyer. Its responsibilities are set out in the Corporate Governance Overview on pages 84 and 85. As at 31 December 2016, two Non-Executive Director positions were vacant and work is continuing to identify and secure the services of new Board members, as described in the Nomination and Governance Committee section on page 93.
Rudy Markham, who joined the Board as a Non-Executive Director in 2008, was appointed as our Senior independent Non-Executive Director in April 2015. The role of the Senior independent Non-Executive Director is to serve as a sounding board for the Chairman and as an intermediary for the other Directors when necessary. The Senior independent Non-Executive Director is also available to shareholders if they have concerns that contact through the normal channels of Chairman or Executive Directors has failed to resolve, or for which such contact is inappropriate.
As shown in the Corporate Governance Overview, there are four principal Board Committees. The membership and work of these Committees is described on the following pages. In addition, there may from time to time be constituted ad hoc Board Committees for specific projects or tasks.
In these cases, the scope and responsibilities of the Committee are documented. The Board provides adequate resources to enable each Committee to undertake its duties.
Reserved matters and delegation of authority
The Board maintains and periodically reviews a list of matters that are reserved to, and can only be approved by, the Board. These include: the appointment, termination and remuneration of any Director; approval of the annual budget; approval of any item of fixed capital expenditure or any proposal for the acquisition or disposal of an investment or business which exceeds $150 million; the raising of capital or loans by the Company (subject to certain exceptions); the giving of any guarantee in respect of any borrowing of the Company; and allotting shares of the Company. The matters that have not been expressly reserved to the Board are delegated by the Board to its Committees or the CEO.
The CEO is responsible to the Board for the management, development and performance of our business for those matters for which he has been delegated authority from the Board. Although the CEO retains full responsibility for the authority delegated to him by the Board, he has established, and chairs, the SET, which is the vehicle through which he exercises that authority in respect of our business.
The roles of the Board, Board Committees, Chairman and CEO are documented, as are the Board’s reserved powers and delegated authorities.
Operation of the Board
The Board discharges its responsibilities as set out in the Corporate Governance Overview on pages 84 and 85 through a programme of meetings that includes regular reviews of financial performance and critical business issues, and the formal annual strategy review day. The Board also aims to ensure that a good dialogue with
our shareholders is maintained and that their issues and concerns are understood and considered.
The Board held 11 meetings in 2016, including its usual annual strategy review. Five took place in London, UK; one in Cambridge, UK; one at the offices of AstraZeneca’s subsidiary in Japan; and four by telephone conference call. The Board is currently scheduled to meet six times in 2017 and will meet at such other times as may be required to conduct business.
As part of the business of each Board meeting, the CEO typically submits a progress report, giving details of business performance and progress against the goals the Board has approved. To ensure that the Board has good visibility of the key operating decisions of the business, members of the SET attend Board meetings regularly and Board members meet other senior executives throughout the year. The Board also receives accounting and other management information about our resources, and presentations from internal and external speakers on legal, governance and regulatory developments. At the end of Board meetings, the Non-Executive Directors meet without the Executive Directors present to review and discuss any matters that have arisen during the meeting and/or such other matters as may appear to the Non-Executive Directors to be relevant in properly discharging their duty to act independently.
Board effectiveness
Composition of the Board, succession planning and diversity
The Nomination and Governance
Committee and, where appropriate, the full Board, regularly review the composition of the Board and the status of succession to both senior executive management and Board level positions. Directors have regular contact with, and access to, succession candidates for senior executive management positions.
The Board aims to maintain a balance in terms of the range of experience and skills of individual Board members, which includes relevant international business, pharmaceutical industry and financial experience, as well as appropriate scientific and regulatory knowledge. The biographies of Board members set out on pages 86 and
| | |
| 90 | | AstraZenecaAnnual Report and Form 20-F Information 2016 |
87 give more information about current Directors in this respect. The Board views gender, nationality and cultural diversity among Board members as important considerations when reviewing the composition of the Board. The Board recognises, in particular, the importance of gender diversity. Currently, 37% of the Company’s Non-Executive Directors are women and women make up 30% of the full Board. Although it has not set any specific measurable objectives, the Board intends to continue with its current approach to diversity in all its aspects, while at the same time seeking Board members of the highest calibre, and with the necessary experience and skills to meet the needs of the Company and its shareholders. Information about our approach to diversity in the organisation below Board level can be found in Employees from page 54.
The following changes to the composition of the Board and its Committees have occurred during the period covered by this Annual Report:
| > | Cornelia (Cori) Bargmann stepped down from the Board and as a member of the Science Committee with effect from 1 October 2016 after she accepted a new position as President of Chan Zuckerberg Science, part of the Chan Zuckerberg Initiative. |
| > | Jean-Philippe Courtois stepped down from the Board and as a member of the Audit Committee with effect from 1 December 2016. Mr Courtois was appointed as a Non-Executive Director in 2008. The Nomination and Governance Committee started succession planning earlier in 2016 in anticipation of Mr Courtois reaching nine years’ tenure as a Board member in 2017. |
Independence of the Non-Executive Directors
During 2016, the Board considered the independence of each Non-Executive Director for the purposes of the UK Corporate Governance Code and the corporate governance listing standards of the NYSE (Listing Standards). With the exception of Marcus Wallenberg, the Board considers that all of the Non-Executive Directors are independent. Leif Johansson was considered by the Board to be independent upon his appointment as Chairman. In accordance with the UK
Corporate Governance Code, the test of independence is not appropriate in relation to the Chairman after his appointment.
Marcus Wallenberg was appointed as a Director of Astra in May 1989 and subsequently became a Director of the Company in 1999. He is a Non-Executive Director of Investor AB, which has a 4.1% interest in the issued share capital of the Company as at 2 February 2017. Mr Wallenberg, Investor AB and a number of Wallenberg charitable foundations are connected. For these reasons, the Board does not believe that he can be determined independent under the UK Corporate Governance Code. However, the Board believes that he has brought, and continues to bring, considerable business experience and makes a valuable contribution to the work of the Board. In April 2010, he was appointed as a member of the Science Committee, reflecting his interest in innovation and R&D, knowledge of the history of the Company and its scientific heritage and culture, and his broad experience of other industries and businesses in which innovation and R&D are important determinants of success.
Conflicts of interest
The Articles enable the Directors to authorise any situation in which a Director has an interest that conflicts or has the potential to conflict with the Company’s interests and which would otherwise be a breach of the Director’s duty, under Section 175 of the Companies Act 2006. The Board has a formal system in place for Directors to declare such situations to be considered for authorisation by those Directors who have no interest in the matter being considered. In deciding whether to authorise a situation, the non-conflicted Directors must act in the way they consider, in good faith, would be most likely to promote the success of the Company, and they may impose limits or conditions when giving the authorisation, or subsequently, if they think this is appropriate. Situations considered by the Board and authorisations given are recorded in the Board minutes and in a register of conflicts maintained by the Company Secretary, and are reviewed annually by the Board. The Board believes that this system operates effectively.
Appointments to the Board
The Nomination and Governance Committee section on page 93 provides information about the appointment process for new Directors.
Newly appointed Directors are provided comprehensive information about the Group and their role as Non-Executive Directors. They also typically participate in tailored induction programmes that take account of their individual skills and experience.
Time commitment
Our expectation is that Non-Executive Directors should be prepared to commit 15 days a year, as an absolute minimum, to the Group’s business. In practice, Board members’ time commitment exceeds this minimum expectation when all the work that they undertake for the Group is considered, particularly in the case of the Chairman of the Board and the Chairmen of the Board Committees. As well as their work in relation to formal Board and Board Committee meetings, the Non-Executive Directors also commit time throughout the year to meetings and telephone calls with various levels of executive management, visits to AstraZeneca’s sites throughout the world and, for new Non-Executive Directors, induction sessions and site visits.
On occasions when a Director is unavoidably absent from a Board or Board Committee meeting, for example where a meeting clashes with their existing commitments, they still receive and review the papers for the meeting and typically provide verbal or written input ahead of the meeting, usually through the Chairman of the Board or the Chairman of the relevant Board Committee, so that their views are made known and considered at the meeting. Given the nature of the business to be conducted, some Board meetings are convened at short notice, which can make it difficult for some Directors to attend due to prior commitments.
Information and support
The Company Secretary is responsible to the Chairman for ensuring that all Board and Board Committee meetings are properly conducted, that the Directors receive appropriate information prior to meetings to enable them to make an effective contribution, and that governance requirements are considered and implemented.
| | |
| AstraZenecaAnnual Report and Form 20-F Information 2016 | | 91 |
Corporate Governance
Corporate Governance Reportcontinued
The Company maintained Directors’ and Officers’ Liability Insurance cover throughout 2016. The Directors are also able to obtain independent legal advice at the expense of the Company, as necessary, in their capacity as Directors.
The Company has entered into a deed of indemnity in favour of each Board member since 2006. These deeds of indemnity are still in force and provide that the Company shall indemnify the Directors to the fullest extent permitted by law and the Articles, in respect of all losses arising out of, or in connection with, the execution of their powers, duties and responsibilities as Directors of the Company or any of its subsidiaries. This is in line with current market practice and helps us attract and retain high quality, skilled Directors.
Performance evaluation
During the year, the Board conducted the annual evaluation of its own performance and that of its Committees and individual Directors. The 2016 evaluation involved each Board member responding to a web-based questionnaire covering a wide range of topics prepared by Lintstock Ltd (Lintstock), a London-based corporate advisory firm that provides objective and independent counsel to leading European companies. Lintstock supplies software and services to the Company Secretary’s team for Board evaluation questionnaires and for the management of insider lists but has no other commercial relationship with the Company.
Feedback from the questionnaire was discussed by the Board at its meeting in January 2017 and was also used by the Chairman as the basis for individual conversations with each Board member prior to the full Board discussion. In respect of the 2016 evaluation, overall it was concluded that the Board continues to operate effectively and in an open manner and no significant problems were raised. The questionnaire feedback and both the individual and the full Board discussions included suggestions about providing more strategic, competitive and financial context for Board members in respect of their reviews of the Company’s very early-stage science and development programmes; maintaining and further improving the diversity of the Board; maintaining and
further improving full Board oversight of succession planning for Board-level roles; providing more opportunities for Board members to meet senior employees having the potential to progress to the most senior executive roles in the Company; and how best to maintain the right balance of Board time for R&D matters on the one hand, and commercial and operations matters on the other.
As part of each Director’s individual discussion with the Chairman, his or her contribution to the work of the Board and personal development needs were considered. Directors’ training needs are met by a combination of internal presentations and updates and external speaker presentations as part of Board and Board Committee meetings; specific training sessions on particular topics, where required; and the opportunity for Directors to attend external courses at the Company’s cost, should they wish to do so. In respect of the 2016 annual performance evaluation it was concluded that each Director continues to perform effectively and to demonstrate commitment to his or her role.
The 2016 evaluation also included a review of the performance of the Chairman by the other Directors, led by the Senior independent Non-Executive Director and absent the Chairman. The review covered how Board meetings were managed and chaired; the Chairman’s broader activities for the Company (for example, his interactions with employees in various parts of the business); his relationship with shareholders and other external stakeholders in various parts of the world, such as governments and senior regulatory authority officials; his relationship with executive management; and suggestions as to areas that the Board might prioritise for its work in 2017. It was concluded that overall the Chairman continues to perform very effectively, both in respect of Board matters and in relation to other aspects of his chairmanship role, and that he continues to devote significant time to promoting the interests of the Company for the long-term benefit of shareholders and other stakeholders.
The reviews of the Board’s Committees did not raise any significant problems and concluded that the Committees are operating effectively.
The Board intends to continue to comply with the UK Corporate Governance Code guidance that the evaluation should be externally facilitated at least every three years and expects to commission the next externally facilitated review in 2017.
Re-election of Directors
In accordance with Article 66 of the Articles, all Directors retire at each AGM and may offer themselves for re-election by shareholders. Accordingly, all of the Directors will retire at the AGM in April 2017. The Notice of AGM will give details of those Directors seeking re-election.
Accountability
Risk management and internal control
The Board has overall responsibility for our system of internal controls and risk management policies and has an ongoing responsibility for reviewing their effectiveness. During 2016, the Directors continued to review the effectiveness of our system of controls, risk management and high level internal control processes. These reviews included an assessment of internal controls and, in particular, financial, operational and compliance controls, and risk management and their effectiveness, supported by management assurance of the maintenance of controls reports from IA, as well as the external auditor on matters identified in the course of its statutory audit work. The system is designed to manage rather than eliminate the risk of failure to achieve business objectives and can only provide reasonable (not necessarily absolute) assurance of effective operation and compliance with laws and regulations.
The internal control framework was in operation throughout 2016 and continues to operate up to the date of the approval of this Annual Report. The Directors believe that the Group maintains an effective, embedded system of internal controls and complies with the FRC’s guidance entitled ‘Guidance on Risk Management, Internal Control and Related Financial and Business Reporting’ and, in the view of the Directors, no significant deficiencies have been identified in the system.
More information about the ways in which we manage our business risks and describe our principal risks and uncertainties is set out in the Risk overview from page 20 and Risk from page 214.
| | |
| 92 | | AstraZenecaAnnual Report and Form 20-F Information 2016 |
Remuneration
Information about our approach to remuneration and the role and work of the Remuneration Committee, including our policy on executive remuneration, is set out in the Directors’ Remuneration Report.
Policy on external appointments and retention of fees
Subject to specific Board approval in each case, Executive Directors and other SET members may accept external appointments as non-executive directors of other companies, and retain any related fees paid to them, provided that such appointments are not considered by the Board to prevent or reduce the ability of the executive to perform his or her role within the Group to the required standard.
Relations with shareholders
In our quarterly, half yearly and annual financial and business reporting to shareholders and other interested parties, we aim to present a balanced and understandable assessment of our strategy, financial position and prospects.
We make information about the Group available to shareholders through a range of media, including our corporate website, www.astrazeneca.com, which contains a wide range of data of interest to institutional and private investors. We consider our website to be an important means of communication with our shareholders.
The Company has been authorised by shareholders to place shareholder communications (such as the Notice of AGM and this Annual Report) on the corporate website in lieu of sending paper copies to shareholders (unless specifically requested). While recognising and respecting that some shareholders may have different preferences about how they receive information from us, we will continue to promote the benefits of electronic communication given the advantages that this has over traditional paper-based communications, both in terms of the configurability and accessibility of the information provided and the consequent cost savings and reduction in environmental impact.
We have frequent discussions with institutional shareholders on a range of issues. In addition to holding discussions with groups of shareholders, we also hold individual meetings with some of our largest institutional shareholders to seek their views. Board members are kept informed of any issues, and receive regular reports and presentations from executive management and our brokers to assist them to develop an understanding of major shareholders’ views about the Group. From time to time, we conduct an audit of institutional shareholders to ensure that we are communicating clearly with them and that a high quality dialogue is being maintained. The results of this audit are reported to, and discussed by, the full Board. We also respond to individual ad hoc requests for discussions from institutional shareholders and analysts. Our Investor Relations team acts as the main point of contact for investors throughout the year. As discussed above, the Senior independent Non-Executive Director, Rudy Markham, is also available to shareholders if they have concerns that contact through the normal channels of Chairman, CEO and/or CFO has failed to resolve, or in relation to which such contact is inappropriate. All shareholders, including private investors, have an opportunity at the AGM to put questions to members of the Board about our operation and performance. Formal notification of the AGM is sent to shareholders at least one month in advance. All Board members ordinarily attend the AGM to answer questions raised by shareholders. In line with the UK Corporate Governance Code, details of proxy voting by shareholders, including votes withheld, are given at the AGM and are posted on our website following the AGM.
Nomination and Governance Committee
The Nomination and Governance Committee’s role is to recommend to the Board any new Board appointments and to consider, more broadly, succession plans at Board level. It reviews the composition of the Board using a matrix that records the skills and experience of current Board members, comparing this with the skills and experience it believes are appropriate to the Company’s overall business and strategic needs, both now and in the future. Any decisions relating to the appointment of Directors are made by the entire Board
based on the merits of the candidates and the relevance of their background and experience, measured against objective criteria, with care taken to ensure that appointees have enough time to devote to our business.
The Nomination and Governance Committee also advises the Board periodically on significant developments in corporate governance and the Company’s compliance with the UK Corporate Governance Code.
During 2016, the members of the Nomination and Governance Committee were Leif Johansson (Chairman of the Committee), Rudy Markham, Bruce Burlington and Graham Chipchase. Each member is a Non-Executive Director and considered independent by the Board. The Company Secretary acts as secretary to the Nomination and Governance Committee.
The Nomination and Governance Committee considers both planned and unplanned (unanticipated) succession scenarios and met four times in 2016, spending the majority of its time on succession planning for Non-Executive Directors with the assistance of the search firms MWM Consulting, Spencer Stuart and Korn Ferry and continued routine succession planning (internal and external) for the roles of CEO and CFO, with the assistance of Spencer Stuart. Korn Ferry and Spencer Stuart periodically undertake executive search assignments for the Company.
The attendance record of the Nomination and Governance Committee’s members is set out on page 84.
The Nomination and Governance
Committee’s terms of reference are available on our website, www.astrazeneca.com.
Science Committee
The Science Committee’s core role is to provide assurance to the Board regarding the quality, competitiveness and integrity of the Group’s R&D activities by way of meetings and dialogue with our R&D leaders and other scientist employees; visits to our R&D sites throughout the world; and review and assessment of:
| | |
| AstraZenecaAnnual Report and Form 20-F Information 2016 | | 93 |
Corporate Governance
Corporate Governance Reportcontinued
| > | the approaches we adopt in respect of our chosen therapy areas |
| > | the scientific technology and R&D capabilities we deploy |
| > | the decision-making processes for R&D projects and programmes |
| > | the quality of our scientists and their career opportunities and talent development |
| > | benchmarking against industry and scientific best practice, where appropriate. |
The Science Committee periodically reviews important bioethical issues that we face, and assists in the formulation of, and agrees on behalf of the Board, appropriate policies in relation to such issues. It may also consider, from time to time, future trends in medical science and technology. The Science Committee does not review individual R&D projects but does review, on behalf of the Board, the R&D aspects of specific business development or acquisition proposals and advises the Board on its conclusions.
During 2016, the members of the Science Committee, all of whom have a knowledge of, or an interest in, life sciences, were Bruce Burlington (Chairman of the Committee), Cori Bargmann until she stepped down from the Board with effect from 1 October 2016, Geneviève Berger and Marcus Wallenberg. As usual, the EVP, GMD; the EVP, IMED; and the EVP, MedImmune, participated in meetings of the Science Committee as co-opted members in 2016. The Vice-President, IMED Operations acts as secretary to the Science Committee.
The Science Committee met twice in person in 2016, in Gothenburg, Sweden and Gaithersburg, US and held two other meetings, both of which were by telephone, to review specific business development or acquisition proposals and aspects of the Group scorecard in relation to ‘Achieve scientific leadership’ targets.
The Science Committee’s terms of reference are available on our website, www.astrazeneca.com.
US corporate governance requirements
Our ADSs are traded on the NYSE and, accordingly, we are subject to the reporting and other requirements of the SEC applicable to foreign private issuers. Section
404 of the Sarbanes-Oxley Act requires companies to include in their annual report on Form 20-F filed with the SEC, a report by management stating its responsibility for establishing internal control over financial reporting and to assess annually the effectiveness of such internal control. We have complied with those provisions of the Sarbanes-Oxley Act applicable to foreign private issuers. The Board continues to believe that the Group has a sound corporate governance framework, good processes for the accurate and timely reporting of its financial position and results of operations, and an effective and robust system of internal controls. We have established a Disclosure Committee, further details of which can be found in the Disclosure Committee section below.
The Directors’ assessment of the effectiveness of internal control over financial reporting is set out in Directors’ Responsibilities for, and Report on, Internal Control over Financial Reporting in the Financial Statements on page 133.
We are required to disclose any significant ways in which our corporate governance practices differ from those followed by US companies under the Listing Standards. In addition, we must comply fully with the provisions of the Listing Standards relating to the composition, responsibilities and operation of audit committees, applicable to foreign private issuers. These provisions incorporate the rules concerning audit committees implemented by the SEC under the Sarbanes-Oxley Act. We have reviewed the corporate governance practices required to be followed by US companies under the Listing Standards and our corporate governance practices are generally consistent with those standards.
Business organisation
Early Stage Product Committees (ESPCs)
The ESPCs are senior level, cross-functional governance bodies with accountability for oversight of our early-stage small molecule and biologics portfolio to Proof of Concept stage. The EVPs of our two science units, IMED and MedImmune, chair our ESPCs. The ESPCs seek to deliver a flow of products to GMD for Phase III development through to launch. The ESPCs also seek to maximise the value of our internal and external R&D investments through robust, transparent and well-informed decision
making that drives business performance and accountability.
Specifically, the ESPCs have responsibility for the following:
| > | approving early-stage investment decisions |
| > | prioritising the respective portfolios |
| > | licensing activity for products in Phase I and earlier |
| > | delivering internal and external opportunities |
| > | reviewing allocation of R&D resources. |
Late Stage Product Committee (LSPC)
The LSPC is also a senior level governance body, accountable for the quality of the portfolio post-Phase III investment decision. Jointly chaired by the EVPs of GMD and GPPS, members include, as appropriate, members of the SET, including the CEO and CFO, and members of the GMD and GPPS leadership teams.
The LSPC seeks to maximise the value of our investments in the late-stage portfolio, also ensuring well-informed and robust decision making. Specific accountabilities include:
| > | approval of the criteria supporting Proof of Concept |
| > | decision to invest in Phase III development based on agreement of commercial opportunity and our plans to develop the medicine |
| > | evaluation of the outcome of the development programme and decision to proceed to regulatory filing |
| > | decision to invest in life-cycle management activities for the late-stage assets |
| > | decision to invest in late-stage business development opportunities. |
Disclosure Committee
Our disclosure policy provides a framework for the handling and disclosure of inside information and other information of interest to shareholders and the investment community. It also defines the role of the Disclosure Committee. The members of the Disclosure Committee in 2016 were: the CFO, who chaired the Disclosure Committee; the EVP, GMD (who is also the Company’s Chief Medical Officer); the EVP, GPPS, Global Medical Affairs & Corporate Affairs; the General Counsel; the Vice-President, Corporate Affairs; the Vice-
| | |
| 94 | | AstraZenecaAnnual Report and Form 20-F Information 2016 |
President, Investor Relations; and the Vice-President Finance, Group Controller. Other senior executives attend its meetings on an agenda-driven basis. The Deputy Company Secretary acted as secretary to the Disclosure Committee. The Disclosure Committee meets regularly to assist and inform the decisions of the CEO concerning inside information and its disclosure. Periodically, it reviews our disclosure controls and procedures and its own operation as part of work carried out to enable management and the Board to assure themselves that appropriate processes are operating for both our planned disclosures, such as our quarterly results announcements and scheduled investor relations events, and our unplanned disclosures in response to unforeseen events or circumstances. During 2016, we implemented the requirements of the EU Market Abuse Regulation, which involved making some changes to our disclosure controls and procedures.
Disclosure of information to auditors
The Directors who held office at the date of approval of this Annual Report confirm that, so far as they are each aware, there is no relevant audit information of which the Company’s auditors are unaware; and each Director has taken all the steps that he or she ought to have taken as a Director to make himself or herself aware of any relevant audit information and to establish that the Company’s auditors are aware of that information.
Global Compliance and Internal Audit Services (IA)
The role of the Global Compliance function is to help the Group achieve its strategic priorities by doing business the right way, with integrity and high ethical standards. Global Compliance continues to focus on ensuring the delivery of an aligned approach to compliance that addresses key risk areas across the business, including risks relating to external parties and anti-bribery/ anti-corruption. Our priorities include improving compliance behaviours through effective training and communication; monitoring compliance with our Code of Conduct, Global Policies and supporting requirements; conducting appropriate risk assessments and due diligence on third parties whom we engage for services;
and ensuring that employees and external parties can raise any concerns. Global Compliance and IA work with various specialist compliance functions throughout our organisation to coordinate compliance activities.
We take all alleged compliance breaches and concerns extremely seriously, and investigate them and report the outcome of such investigations to the Audit Committee, as appropriate. Internal investigations are undertaken by staff from our Global Compliance, Human Resources and/or Legal functions. When necessary, external advisers are engaged to conduct and/or advise on investigations. Serious breaches are raised with the Audit Committee. Where a significant breach has occurred, management, in consultation with our Legal function, will consider whether the Group needs to disclose and/or report the findings to a regulatory or governmental authority.
| | |
 | | Risk from page 214 |
Global Compliance provides direct assurance to the Audit Committee on matters concerning compliance issues, including an analysis of compliance breaches. Complementing this, IA carries out a range of audits that include compliance-related audits and reviews of the assurance activities of other Group assurance functions. The results from these activities are reported to the Audit Committee.
IA is established by the Audit Committee on behalf of the Board and acts as an independent and objective assurance function guided by a philosophy of adding value to improve the operations of the Group. The scope of IA’s responsibilities encompasses, but is not limited to, the examination and evaluation of the adequacy and effectiveness of the Group’s governance, risk management, and internal control processes in relation to the Group’s defined goals and objectives.
Internal control objectives considered by IA include:
| > | consistency of operations or programmes with established objectives and goals and effective performance |
| > | effectiveness and efficiency of operations and employment of resources |
| > | compliance with significant policies, plans, procedures, laws, and regulations |
| > | reliability and integrity of management and financial information processes, including the means to identify, measure, classify, and report such information |
Based on its activity, IA is responsible for reporting significant risk exposures and control issues identified to the Board and to senior management, including fraud risks, governance issues, and other matters needed or requested by the Audit Committee. It may also evaluate specific operations at the request of the Audit Committee or management, as appropriate.
Code of Conduct
Our Code of Conduct (the Code),
which is available on our website, www.astrazeneca.com, applies to all full-time and part-time Directors, officers, employees and temporary staff, in all companies within our Group worldwide. A Finance Code complements the Code and applies to the CEO, the CFO, the Group’s principal accounting officers (including key Finance staff in major overseas subsidiaries) and all Finance function employees. This reinforces the importance of the integrity of the Group’s Financial Statements, the reliability of the accounting records on which they are based and the robustness of the relevant controls and processes.
The Code is at the core of our compliance programme. It has been translated into 40 languages and provides clear direction as to how our commitment to honesty and integrity is to be realised through consistent actions across all areas of the business.
Compliance with the Code is mandatory and every employee receives annual training on it which they are required to complete. The Code is reviewed periodically and updated to take account of changing legal and regulatory obligations. Our Global Policies, as well as local and functional procedures, support the Code and provide clear guidance in key risk areas.
The Code contains information on how to report possible violations through our Helpline, which includes the AZethics telephone lines, the AZethics website, and the Global Compliance email and postal
| | |
| AstraZenecaAnnual Report and Form 20-F Information 2016 | | 95 |
Corporate Governance
Corporate Governance Reportcontinued
addresses described in the Code. The externally-operated website is available in 38 languages, and the phone lines are operable in 96 countries, to facilitate reporting. Our reporting channels are available to both employees and to external parties to report any concerns. Reports can be made anonymously where desired and where permitted by local law. Anyone who raises a potential breach in good faith is fully supported by management.
In 2016, 320 reports of alleged compliance breaches or other ethical concerns were made through the Helpline, including reports made by any anonymous route that could be considered whistleblowing; in 2015 there were 326 reports. The majority of cases come to our attention through management and self-reporting, which can be seen as an indication that employees are comfortable in raising their concerns with line managers, local Human Resources, Legal or Compliance, as recommended in the Code and reinforced in the 2016 Code training.
Other matters
Corporate governance statement under the UK Disclosure Guidance and Transparency Rules (DTR)
The disclosures that fulfil the requirements of a corporate governance statement under the DTR can be found in this section and in other parts of this Annual Report as listed below, each of which is incorporated into this section by reference:
| | |
| | Shareholder Information from page 232 and Corporate Information on page 237 |
Subsidiaries and principal activities
The Company is the holding company for a group of subsidiaries whose principal activities are described in this Annual Report. The Group’s principal subsidiaries and their locations are given in Group Subsidiaries and Holdings in the Financial Statements on page 193.
Branches and countries in which the Group conducts business
In accordance with the Companies Act 2006, we disclose below our subsidiary companies that have representative or scientific branches/offices outside the UK:
| > | AstraZeneca UK Limited: Algeria (scientific office), Angola, Belarus, Chile, Costa Rica, Croatia, Cuba, Dubai (branch office), Georgia, Ghana (scientific office), Jordan, Kazakhstan, Romania, Russia, Saudi Arabia (scientific office), Serbia, Slovenia (branch office), Syria, Ukraine and Yemen (scientific office) |
| > | AstraZeneca AB: Egypt (scientific office) and Slovakia (branch office) |
| > | AstraZeneca Singapore Pte Limited: Vietnam |
| > | Astra Export & Trading AB: United Arab Emirates (branch office). |
Distributions to shareholders – dividends for 2016
Details of our distribution policy are set out in the Financial Review from page 76 and Notes 22 and 23 to the Financial Statements on page 172.
The Company’s dividend for 2016 of $2.80 (218.9 pence, SEK 24.38) per Ordinary Share amount to, in aggregate, a total dividend payment to shareholders of $3,542 million. An employee share trust, AstraZeneca Share Trust Limited, waived its right to a dividend on the Ordinary Shares that it holds and instead received a nominal dividend.
A shareholders’ resolution was passed at the 2016 AGM authorising the Company to purchase its own shares. The Company did not repurchase any of its own shares in 2016. On 31 December 2016, the Company did not hold any shares in treasury.
Going concern accounting basis
Information on the business environment in which AstraZeneca operates, including the factors underpinning the industry’s future growth prospects, is included in the Strategic Report. Details of the product portfolio of the Group are contained in both the Strategic Report (in the Therapy Area Review from page 23) and the Directors’ Report. Information on patent expiry dates for key marketed products is included in Patent Expiries of Key Marketed Products from page 211. Our approach to product development and our development pipeline are also covered in detail with additional information by therapy area in the Strategic Report.
The financial position of the Group, its cash flows, liquidity position and borrowing facilities are described in the Financial Review from page 62. In addition, Note 26 to the Financial Statements from page 177 includes the Group’s objectives, policies and processes for managing capital; financial risk management objectives; details of its financial instruments and hedging activities; and its exposures to credit, market and liquidity risk. Further details of the Group’s cash balances and borrowings are included in Notes 16 and 17 to the Financial Statements from page 162.
The Group has considerable financial resources available. As at 31 December 2016 the Group had $5.7 billion in financial resources (cash balances of $5.0 billion and undrawn committed bank facilities of $3.0 billion which are available until April 2020, with only $2.3 billion of debt due within one year). The Group’s revenues are largely derived from sales of products which are covered by patents which provide a relatively high level of resilience and predictability to cash inflows, although our revenue is expected to continue to be significantly impacted by the expiry of patents over the medium term. In addition, government price interventions in response to budgetary constraints are expected to continue to adversely affect revenues in many of our mature markets. However, we anticipate new revenue streams from both recently launched medicines and products in development, and the Group has a wide diversity of customers and suppliers across different geographic areas. Consequently, the Directors believe that, overall, the Group is well placed to manage its business risks successfully.
After making enquiries, the Directors have a reasonable expectation that the Company and the Group have adequate resources to continue in operational existence for the foreseeable future. Accordingly, they continue to adopt the going concern basis in preparing the Annual Report and Financial Statements.
Changes in share capital
Changes in the Company’s Ordinary Share capital during 2016, including details of the allotment of new shares under the Company’s share plans, are given in Note 22 to the Financial Statements on page 172.
| | |
| 96 | | AstraZenecaAnnual Report and Form 20-F Information 2016 |
Directors’ shareholdings
The Articles require each Director to be the beneficial owner of Ordinary Shares in the Company with an aggregate nominal value of $125 (which currently represents at least 500 shares because each Ordinary Share has a nominal value of $0.25). Such holding must be obtained within two months of the date of the Director’s appointment. At 31 December 2016, all of the Directors complied with this requirement and full details of each Director’s interests in shares of the Company are set out in Directors’ interests in shares on pages 114 and 115. Information about the shareholding expectations of the Remuneration Committee (in respect of Executive Directors and SET members) and the Board (in respect of Non-Executive Directors) is also set out in Directors’ interests in shares on pages 114 and 115.
Political donations
Neither the Company nor its subsidiaries made any EU political donations or incurred any EU political expenditure in 2016 and they do not intend to do so in the future in respect of which shareholder authority is required, or for which disclosure in this Annual Report is required, under the Companies Act 2006. However, to enable the Company and its subsidiaries to continue to support interest groups or lobbying organisations concerned with the review of government policy or law reform without inadvertently breaching the Companies Act 2006, which defines political donations and other political expenditure in broad terms, a resolution will be put to shareholders at the 2017 AGM, similar to that passed at the 2016 AGM, to authorise the Company and its subsidiaries to:
| > | make donations to political parties or independent election candidates |
| > | make donations to political organisations other than political parties |
| > | incur political expenditure, up to an aggregate limit of $250,000. |
Corporate political contributions in the US are permitted in defined circumstances under the First Amendment of the US Constitution and are subject to both federal and state laws and regulations. In 2016, the Group’s US legal entities made contributions amounting in aggregate to $1,568,250 (2015: $1,224,550) to national political organisations, state-level political party committees and to campaign committees
of various state candidates. No corporate donations were made at the federal level and all contributions were made only where allowed by US federal and state law. We publicly disclose details of our corporate US political contributions, which can be found on our website, www.astrazeneca-us.com/ sustainability/corporate-transparency.html. The annual corporate contributions budget is reviewed and approved by the US Vice-President, Corporate Affairs and the President of our US business to ensure robust governance and oversight. US citizens or individuals holding valid green cards exercised decision making over the contributions and the funds were not provided or reimbursed by any non-US legal entity. Such contributions do not constitute political donations or political expenditure for the purposes of the Companies Act 2006 and were made without any involvement of persons or entities outside the US.
Significant agreements
There are no significant agreements to which the Company is a party that take effect, alter or terminate on a change of control of the Company following a takeover bid. There are no persons with whom we have contractual or other arrangements, who are deemed by the Directors to be essential to our business.
Use of financial instruments
The Notes to the Financial Statements, including Note 26 from page 177, include further information on our use of financial instruments.
Annual General Meeting
The Company’s AGM will be held on 27 April 2017. The meeting place will be in London, UK. A Notice of AGM will be sent to all registered holders of Ordinary Shares and, where requested, to the beneficial holders of shares.
External auditor
A resolution will be proposed at the AGM on 27 April 2017 for the appointment of PricewaterhouseCoopers LLP (PwC) as auditor of the Company. The external auditor during 2016 was KPMG LLP. The proposed change of auditor follows a recommendation by the Audit Committee to the Board in 2015 based on a formal tender in line with best practice. During 2016, KPMG undertook various non-audit
services. More information about this work and the audit and non-audit fees that we have paid are set out in Note 30 to the Financial Statements on page 192. The external auditor is not engaged by AstraZeneca to carry out any non-audit work in respect of which it might, in the future, be required to express an audit opinion. As explained more fully in the Audit Committee Report from page 98, the Audit Committee has established pre-approval policies and procedures for audit and non-audit work permitted to be carried out by the external auditor and has carefully monitored the objectivity and independence of the external auditor throughout 2016.
Directors’ Report
The Directors’ Report, which has been prepared in accordance with the requirements of the Companies Act 2006, comprises the following sections:
| > | Chief Executive Officer’s Review |
| > | Resources Review, including Employees |
| > | Financial Review: Financial risk management |
| > | Corporate Governance: including the Audit Committee Report and Corporate Governance Report |
| > | Directors’ Responsibility Statement |
| > | Sustainability: supplementary information |
and has been approved by the Board and signed on its behalf.
The Board considers this Annual Report, taken as a whole, to be fair, balanced and understandable, and provides the necessary information for shareholders to assess AstraZeneca’s position and performance, business model and strategy.
A C N Kemp
Company Secretary
2 February 2017
| | |
| AstraZenecaAnnual Report and Form 20-F Information 2016 | | 97 |
Corporate Governance
Audit Committee Report
| | | | | | |
| | | | | | |
| | |
 | | The quality of AstraZeneca��s financial reporting is underpinned by effective internal controls, appropriate accounting practices and policies, and the exercise of good judgement.” Risk management During the year, the Committee regularly reviewed the Company’s approach to risk management, its risk reporting framework and risk mitigation. These discussions also provided the context for the Committee’s consideration of the Directors’ viability statement and the analysis that underpins the assurance provided by that statement. For more details on the viability statement, please refer to the Risk overview from page 20. The Committee’s consideration of risk management was supported by ‘deep dive’ reviews of key activities such as: supply chain responsiveness; improvements to IS/IT infrastructure and the adequacy of cybersecurity; commercial operations in China and the US; and pricing, reimbursement and market access. Further information on the Company’s Principal Risks are on pages 20 to 21. The Committee visited the Company’s US Commercial head office in Wilmington and the MedImmune leadership team in Gaithersburg to gain further insight into emerging risks as the Company’s strategy develops in a dynamic external environment. Compliance with the Code of Conduct The Committee’s priorities continue to include: maintaining compliance with the Company’s Code of Conduct; high ethical standards; and operating within the law in all countries where we conduct business or have interactions. In 2015, the Company had met all of its obligations under its five-year Corporate Integrity Agreement in the US, which terminated in April 2015. During a visit to the Company’s US Commercial head office in Wilmington, the Committee heard about how the US Compliance Programme has evolved, after completion of the Corporate Integrity |
| | Financial reporting The quality of AstraZeneca’s financial reporting is underpinned by effective internal controls, appropriate accounting practices and policies, and the exercise of good judgement. The Committee reviewed, at least quarterly, the Company’s significant accounting matters and, where appropriate, challenged management’s decisions before approving the accounting policies applied. During 2016, the Committee reviewed aspects of the Group’s significant restructuring programmes initiated from 2013 onwards, including accounting for restructuring charges, control over capital expenditure and arrangements for monitoring the effective implementation of these programmes. The Committee continued to monitor the inclusion of Externalisation Revenue in AstraZeneca’s Statement of Comprehensive Income. For more information on Externalisation Revenue, please refer to the Financial Review from page 62. The Committee looked closely at intangible asset impairment reviews, including reviews of our FluMist and Ardea intangible assets; legal provisions and other related charges, | | to ensure that items are appropriately accounted for in ‘Reported’ and ‘Core’ results. Following the competitive tender of the Company’s external audit services in 2015 and the Board’s decision to recommend the appointment of PwC to shareholders at the Company’s 2017 AGM, the Committee has monitored the transition planning to ensure the Company is well prepared for a change of external auditors should this be approved by shareholders. In December 2015, the FRC announced that it would conduct a thematic review of companies’ tax reporting to encourage more transparent recording of the relationship between the tax charges and accounting profit. The FRC Corporate Reporting Review Team subsequently conducted a review of the tax disclosures in the Company’s financial statements for the year ended 31 December 2015 and in 2016 confirmed that they had no substantive issues to raise. The Committee took note of and was satisfied with relevant reports from the regulators that exercise routine oversight over the Company’s external auditors, the FRC and the Public Company Accounting Oversight Board. | |
| | |
| 98 | | AstraZenecaAnnual Report and Form 20-F Information 2016 |
| | | | | | | | |
| | Agreement, to maintain strong focus and remain relevant, proactively addressing key compliance risks. Throughout 2016, the Committee monitored and reviewed compliance with our Code of Conduct, including the effectiveness of our anti-bribery and anti-corruption controls, across the Group. The Committee prioritised its focus on countries where we have significant operations and countries in which doing business is generally considered to pose a higher corruption or general compliance risk such as the US, the UK, China, Japan, Nigeria and India. Engagement with senior leaders The Committee considers it important to interact with members of management below the SET. In July, members of the Committee visited the Company’s US Commercial and MedImmune leadership teams in Wilmington and Gaithersburg respectively. We talked to senior leaders about the opportunities and challenges the Company faces, and the current and emerging risks arising from the development and successful delivery to patients of medicines from our rapidly evolving pipeline. The Committee also met informally with senior leaders from the Operations IS/IT, Finance, Legal and Global Payer Evidence & Pricing teams. In June 2016, I participated in a discussion at the Company’s Internal Audit Services (IA) team conference on the role of the Board and Audit Committee generally and at AstraZeneca, and I shared my perspective on the importance of the work of IA in providing assurance on AstraZeneca’s risk management, controls and governance generally. Finally, I would like to offer thanks from the Committee to Jean-Philippe Courtois, who retired from the Committee on 1 December 2016, for his valued contribution to the Committee and its work. We value dialogue with our shareholders and welcome your feedback on this report. Yours sincerely 
Rudy Markham Chairman of the Audit Committee | | Audit Committee membership and attendance All Committee members are Non-Executive Directors and considered by the Board to be independent under the UK Corporate Governance Code. The Committee’s members are Rudy Markham (Committee Chairman), Bruce Burlington, Ann Cairns and Shriti Vadera. Jean-Philippe Courtois was a member of the Committee until he stepped down from the Board on 1 December 2016. In December 2016, the Board determined that, for the purposes of the UK Corporate Governance Code, at least one Audit Committee member has recent and relevant financial experience and that Rudy Markham and Ann Cairns are financial experts for the purposes of the Sarbanes-Oxley Act. The Board of Directors’ biographies on pages 86 and 87 contain details of each Audit Committee member’s skills and experience. The Audit Committee held five meetings in 2016 and Committee members’ attendance is set out in the table on page 84. Role and operation of the Audit Committee The Audit Committee’s terms of reference are available on our website, www.astrazeneca.com. The Committee regularly reports to the Board on how it discharges its main responsibilities, which include: > monitoring the integrity of the Company’s financial reporting and formal announcements relating to its financial performance, and reviewing significant financial reporting judgements contained within them > ensuring the Company’s Annual Report and Accounts present a fair, balanced and understandable assessment of the Company’s position and prospects > reviewing the effectiveness of the Company’s internal financial controls, internal non-financial controls, risk management systems (including whistleblowing procedures) and compliance with laws and the AstraZeneca Code of Conduct | | > monitoring and reviewing the role, resources and effectiveness of the Company’s Internal Audit function, its Compliance function, the external audit process and the Company’s relationship with its external auditor > monitoring and reviewing the external auditor’s independence and objectivity > ensuring the provision of non-audit services by the external auditor are appropriate and in accordance with policy approved by the Committee > making recommendations to the Board for shareholder approval relating to the appointment, reappointment and removal of the external auditor, and to approve the remuneration and terms of engagement of the external auditor > monitoring the Company’s response to any external enquiries and investigations regarding matters within the Committee’s area of responsibility. Audit Committee meeting minutes are circulated to the Board. Following each Committee meeting, the Committee Chairman informs the Board of the principal matters the Committee considered and of any significant concerns it has or that have been reported by the external auditor, the Vice-President, IA or the Chief Compliance Officer. The Committee identifies matters that require action or improvement and makes recommendations on the steps to be taken. The Committee’s work is supported by valuable insight gained from its interactions with other Board Committees, senior executives, managers and external experts. Committee meetings are routinely attended by the CFO; the General Counsel; the Chief Compliance Officer; the Vice-President, IA; the Vice-President Finance, Group Controller; and the Company’s external auditor. The CEO attends on an agenda-driven basis. In addition, the Committee and separately the Committee Chairman, meet privately with the CFO; Chief Compliance Officer; General Counsel; Vice-President, IA; and the Company’s external auditor on an individual basis to ensure the effective flow of material information between the Committee and management. | | |
| | |
| AstraZenecaAnnual Report and Form 20-F Information 2016 | | 99 |
Corporate Governance
Audit Committee Reportcontinued
| | | | | | |
Activities of the Audit Committee in 2016 During 2016 and in January 2017, the Audit Committee considered and discussed the following standing items: > key elements of the Financial Statements and the estimates and judgements contained in the Company’s financial disclosures. Accounting matters considered included the areas described in the Financial Review under ‘Critical accounting policies and estimates’ (with a focus on accounting issues relevant to revenue recognition, litigation and taxation matters, goodwill and intangible asset impairment) from page 77 and other important matters such as monitoring the accounting for Externalisation Revenue in the Group’s Consolidated Statement of Comprehensive Income. The Committee reviewed the Company’s definition of Externalisation Revenue against market practice, and individual judgements on items falling within that definition. Discussion of these matters was supported by papers prepared by management and the external auditor, and input from the Science Committee (as appropriate) > the external auditor’s reports on its audit of the Group Financial Statements, and reports from management, IA, Global Compliance and the external auditor on the effectiveness of our system of internal controls and, in particular, our internal control over financial reporting > quarterly reports of work carried out by IA, Global Compliance and Finance including the status of follow-up actions with management > the Company’s principal, enduring and emerging risks, including the Company’s risk management approach, risk reporting framework and risk mitigation. More information about the principal risks faced by the Company is set out in the Risk overview section from page 20 > compliance with applicable provisions of the Sarbanes-Oxley Act. In particular, the status of compliance with the programme of internal controls over financial reporting implemented pursuant to Section 404 of the Sarbanes-Oxley Act. The Committee continued its focus on IT controls in the context of the changes to the Group’s IT environment. More information about this is set out in the Sarbanes-Oxley Act Section 404 section of the Financial Review on page 81 | | > data from reports made by employees via the AZethics helpline, online facilities and other routes regarding potential breaches of the Code of Conduct, together with the results of enquiries into those matters > reports from the Group Treasury function, in particular, concerning the Company’s liquidity and cash position and the appropriateness of its investment management policy in the context of the current economic situation > the going concern assessment and adoption of the going concern basis in preparing this Annual Report and the Financial Statements. More information on the basis of preparation of Financial Statements on a going concern basis is set out in the Financial Statements on page 142 > the preparation of the Directors’ viability statement and the adequacy of the analysis supporting the assurance provided by that statement > quarterly reports from the General Counsel on the status of significant litigation matters and governmental investigations > audit and non-audit fees of the external auditor during 2016, including the objectivity and independence of the external auditor through the application of the Non-Audit Services Policy as described further below. Further information about the audit and non-audit fees for 2016 is disclosed in Note 30 to the Financial Statements on page 192 > the Audit Committee conducted the annual evaluation of its own performance with each Committee member responding to a web-based questionnaire prepared by an external third party. The effectiveness review of the Audit Committee was assessed as high performing with a good balance struck between the necessary rigour and a holistic understanding of issues under consideration, quality engagement with the business outside formal meetings, and appropriate attention given to the external auditor transition > effectiveness review of Internal Audit, which noted an external assessment of IA observed that the function is well respected and trusted, providing assurance that is aligned to the Company’s risk profile and well-coordinated with the other risk and assurance functions. IA continues to build its capabilities seeking opportunities for continuous improvement. | | Matters considered and discussed by the Audit Committee in addition to its usual business as described above included: > significant capital expenditure and the execution of restructuring programmes, including the construction of the new strategic bioscience site and corporate head office in Cambridge, UK and review of historic restructuring programmes > the level of assurance regarding the effective integration of recently acquired entities and their compliance with Group policies and governance arrangements > regular updates from the IT team with particular attention to cybersecurity and the progress of the Group’s IT infrastructure transformation, including the set-up of the global technology centre in Chennai, India and related business continuity arrangements, noting a new global technology centre in Guadalajara, Mexico has become operational > supply chain responsiveness for launches of new products, in particular biologics, including critical capabilities and robust processes that will support delivery of the evolving pipeline > opportunities, challenges, compliance and risk management discussed with the US commercial business leadership team and MedImmune leadership team during the Committee’s visit to the Company’s Wilmington and Gaithersburg sites > key compliance risks arising from our activities in China, including the effectiveness of controls, noting senior leadership’s continued focus on a strong compliance and ethics culture as the China business grows > consideration of major trends regarding pricing, reimbursement and market access for biopharmaceuticals, and the key external and internal risks the Company faces > monitoring the external audit transition process to ensure an effective transition of the Group’s external auditors in 2017, subject to shareholders’ approval to appoint the new external auditor at the Company’s AGM in April 2017 > the Group’s approach to taxation noting that AstraZeneca aims to comply with tax laws in the countries in which it does business and is committed to transparent and constructive relationships with all relevant tax authorities | | |
| | |
| 100 | | AstraZenecaAnnual Report and Form 20-F Information 2016 |
| | | | | | |
| | > relevance to the Company of new Compliance and Disclosure Interpretations issued by the SEC on the use of non-GAAP measures, in particular the disclosure of and prominence given to non-GAAP measures and the appropriateness of items removed from GAAP numbers in arriving at non-GAAP measures > proposals for the Directors’ Slavery and Human Trafficking Statement and the adequacy of the arrangements supporting the assurance provided by that statement, and preparation for compliance with the Market Abuse Regulation before it came into force on 3 July 2016 > monitoring the resource requirements of key control functions (Finance, IA, Compliance) with particular reference to succession planning and the potential impact of ongoing restructuring on the effectiveness of risk and control processes. Significant financial reporting issues considered by the Audit Committee in 2016 Revenue recognition The US is our largest single market and sales accounted for 35% of our Product Sales in 2016. Revenue recognition, particularly in the US, is impacted by rebates, chargebacks, cash discounts and returns (for more information, please see the Financial Review from page 62). The Audit Committee pays particular attention to management’s estimates of these items, its analysis of any unusual movements and their impact on revenue recognition informed by commentary from the external auditor. Valuation and possible impairment of intangible assets The Group carries significant intangible assets on its Balance Sheet arising from the acquisition of businesses and IP rights to medicines in development and on the market. Each quarter, the CFO outlines the carrying value of the Group’s intangible assets and, in respect of those intangible assets that are identified as at risk of impairment, the difference between the carrying value and management’s current estimate of discounted future cash flows for ‘at risk’ products (the headroom). Products will be identified as ‘at risk’ because the headroom is small or, for example, in the case of a medicine in development, there is | | a significant development milestone such as the publication of clinical trial results which could significantly alter management’s forecasts for the product. In 2016, the Audit Committee considered specific impairment review papers and supporting information on the Group’sFluMist and Ardea intangible assets. TheFluMist impairment review included detailed consideration of the impact of the announcement in June 2016 by the Advisory Committee on Immunization Practices of the Center for Disease Control and Prevention of an interim recommendation on the use ofFluMist Quadrivalent in the US during the 2016/2017 influenza season. The Ardea intangible asset impairment review included considerations in both the gout indication as well as indications in the CVMD therapy area. The Audit Committee obtained valuable input from the Science Committee for this review. The Audit Committee agreed with the conclusion that no impairment was required. In 2016, there were no significant impairments of intangible assets. Litigation and contingent liabilities The Audit Committee was regularly informed by the General Counsel and external auditor about IP litigation, product liability actions and governmental investigations that might result in fines or damages against the Company, to assess whether provisions should be taken and, if so, when and in what amount. Of the matters the Committee considered in 2016, the most significant included: FCPA investigation (US);Nexium anti-trust litigation (US);Pulmicort Respules patent litigation (US);Faslodex patent litigation (US and Europe); andCrestor damages claims (Australia). The US FCPA investigation was resolved in 2016 following a civil settlement agreed with the SEC; the DOJ closed its investigation without taking action against the Company. Notwithstanding the Company’s success defending the claims in theNexium anti-trust case, the plaintiffs continue to seek opportunities to assert their claims.Faslodex patent litigation continues in the US and Europe. Settlements have been reached with lead litigants in the US. Further information about the Company’s litigation and contingent | | liabilities is set out in Note 28 to the Financial Statements from page 185. Tax accounting The Audit Committee reviewed the Company’s approach to tax including governance, risk management and compliance, tax planning, dealings with tax authorities and the level of tax risk the Company is prepared to accept. The full statement, which was published in November 2016, can be found at www.astrazeneca.com. In 2016, following a review by the FRC designed to encourage more transparent recording of the relationship between the tax charges and accounting profit, the FRC confirmed that they had no substantive issues to raise in respect of the tax disclosures in the Company’s 2015 accounts. The FRC has noted that their review does not provide assurance that our report and accounts are correct in all material respects and that the FRC’s role is not to verify the information provided but to consider compliance with reporting requirements. Retirement benefits Pension accounting continues to be a significant area of focus recognising the level of pension fund deficit and its sensitivity to small changes in interest rates, which the Committee continues to monitor carefully. The Audit Committee reviewed the Company’s defined benefit pension global funding objective and principles, focusing in particular on the Company’s main defined benefit pensions obligations in the UK, Sweden and the US, and the defined benefit plans in Germany. Internal controls The Audit Committee receives a report of the matters considered by the Disclosure Committee during each quarter. At the January 2017 meeting, the CFO presented to the Committee the conclusions of the CEO and the CFO following the evaluation of the effectiveness of our disclosure controls and procedures required by Item 15(a) of Form 20-F at 31 December 2016. Based on their evaluation, the CEO and the CFO concluded that, as at that date, we maintained an effective system of disclosure controls and procedures. |
| | |
| AstraZenecaAnnual Report and Form 20-F Information 2016 | | 101 |
Corporate Governance
Audit Committee Report,continued
| | | | | | |
There was no change in our internal control over financial reporting that occurred during the period covered by this Annual Report that has materially affected, or is reasonably likely to materially affect, our internal control over financial reporting. Appointing the auditor As we reported in 2012, the Audit Committee determined that the audit would be put out to tender by 2018 in accordance with the UK Corporate Governance Code and guidance issued by the FRC. KPMG was first appointed as sole external auditor to Zeneca Group PLC in 1993 and to AstraZeneca PLC in 2001 following a competitive tender. Anthony Cates is the current lead audit partner at KPMG following lead partner rotation in 2013. Having concluded the competitive tender process in December 2015, the Audit Committee recommended to the Board that PwC be appointed as the Group’s statutory auditor for the 2017 financial year. The Audit Committee confirmed in September 2016 that PwC is independent under SEC and UK independence regulations. A resolution to approve the appointment of PwC will be put to shareholders at the Company’s AGM in 2017. The Audit Committee considers that the Company has complied with the Competition and Markets Authority’s Statutory Audit Services for Large Companies Market Investigation (Mandatory Use of Competitive Tender Processes and Audit Committee Responsibilities) Order 2014 in respect of its financial year commencing 1 January 2016. Non-audit services and safeguards The Audit Committee maintains a policy (the Audit and Non-Audit Services Pre Approval Policy) for the pre-approval of all audit services and permitted non-audit services undertaken by the external auditor, the principal purpose of which is to ensure that the independence of the external auditor is not impaired. The policy covers three | | categories of work: audit services; audit-related services; and tax services. The policies define the type of work that falls within each of these categories and the non-audit services that the external auditor is prohibited from performing under the rules of the SEC and other relevant UK and US professional and regulatory requirements. The pre-approval procedures permit certain audit, audit-related and tax services to be performed by the external auditor during the year, subject to fee limits agreed with the Audit Committee in advance. The Audit Committee is mindful of the 70% non-audit services fee cap under EU regulation, together with the overall proportion of fees for audit and non-audit services in determining whether to pre-approve such services. The CFO (supported by the Vice-President Finance, Group Controller), monitors the status of all services being provided by the external auditor. Authority to approve work in excess of the pre-agreed fee limits is delegated to the Chairman of the Audit Committee together with one other Audit Committee member in the first instance. A standing agenda item at Audit Committee meetings covers the operation of the pre-approval procedures and regular reports are provided to the full Audit Committee. In 2016, non-audit services provided to the Company by KPMG included the audit of a product line required as part of the disposal of this asset, audit services in relation to employee benefit funds such as the audit of subsidiary company pension funds and, tax compliance services. KPMG was considered better placed to provide these services, in terms of skills, capability and efficiency, than any alternative audit firm. All such services were either within the scope of the pre-approved services set out in the Non-Audit Services Policy or were presented to Audit Committee members for pre-approval. | | Fees paid to the auditor for audit, audit-related and other services are analysed in Note 30 to the Financial Statements on page 192. Fees for non-audit services amounted to 29% of the fees paid to KPMG for audit, audit-related and other services in 2016. Assessing external audit effectiveness In accordance with its normal practice, the Audit Committee considered the performance of KPMG and its compliance with the independence criteria under the relevant statutory, regulatory and ethical standards applicable to auditors. Having considered all these factors (Judgement, Mind-set & Culture, Skills, Character & Knowledge and Quality Control) and changes in audit approach in response to finding and comments in the Audit Quality Review report performed by the FRC issued in May 2016. The Audit Committee concluded that the KPMG audit was effective for the financial year commencing 1 January 2016. | | |
| | |
| 102 | | AstraZenecaAnnual Report and Form 20-F Information 2016 |
|
Directors’ Remuneration Report |

| | |
| AstraZenecaAnnual Report and Form 20-F Information 2016 | | 103 |
Corporate Governance
Directors’ Remuneration Reportcontinued
Directors will only be made under the PSP. We have also taken the opportunity to simplify the proposed Remuneration Policy which we hope shareholders will find helpful.
2016 performance
We delivered a strong pipeline performance in 2016 as AstraZeneca’s transformation continues and we implement our strategy to achieve scientific leadership, return to growth and achieve our Group financial targets. The majority of the elements of our performance-related pay are directly aligned to the business plan based on these three strategic pillars with the intention of driving performance that promotes the long-term success of the Company.
We continued to make strong progress towards achieving scientific leadership and our ability to deliver innovation to the market. A number of significant opportunities, not expected to be achieved in 2016, have been successfully accelerated. For example, the FDA’s acceptance of the Company’s first Biologics License Application for durvalumab in urothelial bladder cancer is an important milestone demonstrating the advance of our immuno-oncology medicines. The US and European regulatory submission acceptances for Tagrisso in lung cancer and fast track review in China further demonstrate AstraZeneca’s commitment to prioritise the progression of our new oncology pipeline.
Overall, our 2016 financial performance was in line with expectations as AstraZeneca’s pipeline-driven transformation continues. While 2016 Product Sales declined by 10% (8% at CER), driven by the entry of multiple Crestor generic medicines in the US, our six Growth Platforms grew by 4% (5% at CER) representing 63% of our Total Revenue. We have completed a number of strategic business development transactions this year, such as the sale of the Company’s small molecule antibiotics business to Pfizer and the agreement with Aspen Pharma for the commercialisation rights to the Company’s global anaesthetics portfolio outside the US. The 7% decline (5% at CER) in Total Revenue reflects the loss of Crestor exclusivity. Core EPS increased by 1% (5% decline at CER). Our leadership team has taken care to manage costs and continue investment in the long-term success of the Company. Good progress was made on
R&D cost control despite the absorption of Acerta Pharma and ZS Pharma R&D costs. Core SG&A expenses declined by 12% (9% at CER).
2016 remuneration outcomes
The performance measures used in our incentives are closely aligned with Company strategy, ensuring our Executive Directors are only rewarded for delivery of stretching and appropriately balanced financial, non-financial and individual performance. The Committee’s evaluation has ensured that executive reward reflects the performance of the business and shareholder experience. Valuable insight was provided by the Science Committee for the assessment of science related matters and by the two Committee members who are also members of the Audit Committee.
When considering business performance together with the Executive Directors’ individual performance, annual bonus awards of 98% and 88.2% of base salary were awarded to Mr Soriot and Mr Dunoyer, respectively, reflecting the Group scorecard outcome. Following the end of 2016, performance was tested for the three-year performance period for the 2014 PSP awards. As a result of our performance over the past three years, the 2014 PSP award will vest at 92% of maximum.
The two performance tests (progressive dividend and 1.5 times dividend cover) for the AZIP granted in 2013 were met in each year of the four-year performance period ending 31 December 2016, meaning that the award vests in full. Awards are subject to a further four-year holding period and they will be released on 31 December 2020.
We have reported Mr Soriot’s single total figure remuneration for 2016 on page 107. In addition to the regular 2013 AZIP award, this figure includes the previously reported one-off AZIP award granted to buyout LTIs from Mr Soriot’s previous employment, which he forfeited in order to join AstraZeneca. To enable a like-for-like comparison to be made between Mr Soriot’s 2015 and 2016 remuneration we have included columns with and without the one-off buyout award in the single figure table. The one-off AZIP award is subject to a further four-year holding period before the award pays out.
Shareholder engagement
We received approximately 90% shareholder support for our 2015 Directors’ Remuneration Report. We have consulted with our major shareholders in developing our proposals for executive remuneration for 2017.
Overall our major shareholders responded positively to the proposals we discussed and they encouraged further simplification of the Company’s executive remuneration arrangements in the future where possible. In light of the positive feedback received, the Committee decided to proceed with the changes it proposed, which I have summarised below.
Remuneration in 2017
Overall executive pay opportunity
Executive Directors will receive salary increases of 2.5%, effective from 1 January 2017, in line with those for the wider UK employee population. There will be no increase in the CEO’s maximum pay opportunity as a percentage of base salary, and LTI awards in excess of 500% base salary (at face value) will cease to be available under the proposed Directors’ Remuneration Policy as only a single LTI plan will be operated. Mr Soriot’s and Mr Dunoyer’s target LTI awards are unchanged at 250% and 200% of base salary respectively. The level of LTI vesting at threshold performance under the PSP will be reduced from 25% to 20% of maximum.
From 2017 onwards no awards will be made under the AZIP. LTI awards for Executive Directors will be made under the PSP only. Since the AZIP was first introduced in 2010, AstraZeneca has undergone significant change and the AZIP is no longer closely aligned to the delivery of the Company’s strategy. The Company’s pipeline of potential innovative medicines has been transformed and the Company’s efforts need to be sharply focused on delivering value from the late-stage pipeline through the successful approval and launch of its new medicines.
In addition, shareholder concern that the AZIP has the potential to incentivise short-termism in decision making rather than delivering sustainable value for shareholders is addressed through ceasing awards under
| | |
| 104 | | AstraZenecaAnnual Report and Form 20-F Information 2016 |
this plan. Awards under the PSP have an expected value of 50%, whereas the expected value that has been used when making AZIP awards has been 100%. A consequence of awarding shares entirely under the PSP is that the value that could potentially be delivered to the CFO for maximum performance under the LTI plan has increased from 350% of base salary to 400% (face value). There is no increase in Mr Soriot’s maximum remuneration opportunity under the LTI plan, which remains at 500%.
2017 PSP simplification, transparency and alignment to strategy
Building on the simplification of the PSP last year, in 2017 we will reduce the five Achieve scientific leadership measures to three: NME approvals, major life-cycle management approvals, and Phase III registration/NME approvals. These three measures focus on the successful delivery of the late-stage pipeline in alignment with the Return to growth phase of the Company’s strategy.
To ensure the link between executive reward and the achievement of operating profit is maintained, when we stop awarding shares under the AZIP, a new PSP measure will be adopted: Reported EBITDA (excluding non-cash movements on fair value of contingent consideration on business combinations). In selecting ‘Reported’ EBITDA, the Committee has addressed a general concern about the pharmaceutical industry’s use of ‘core’ earnings for incentive purposes. Further, in line with our aim to increase transparency and accountability in our reporting, we have disclosed the targets for this measure at the start of the performance period.
During the year, the Committee also reviewed the TSR peer group used for the PSP and has decided to increase the number of companies that form the group from 10 to 18. The new peer group provides a better comparison in terms of revenue, innovation portfolio and geographical presence. Twenty percent of the award will vest for median performance and 100% for upper quartile performance. TSR ranking within the new peer group is expected to reward consistent strong performance and mitigate market volatility.
The adjustment and significant simplification of our LTI arrangements outlined above will support a sharp focus on critical decisions as the executive management continues to execute AstraZeneca’s strategy and deliver value for shareholders from its late-stage pipeline.
Legacy AZIP awards
Although no new awards will be made under the AZIP, awards made under this plan in the past will continue in operation until the end of 2019, which is the final performance year of the AZIP awards granted in 2016. The AZIP targets (progressive dividend and 1.5 times dividend cover) will remain unchanged for all outstanding AZIP awards.
As originally operated, if an AZIP performance test was not achieved in any one of the four performance years, all outstanding AZIP awards would fail, which meant that the incentive to meet either target for the remaining years was rendered completely ineffective. Some of our shareholders have told us that they are concerned that the AZIP may incentivise too great a focus on short-term earnings rather than the investment needed to deliver the value of the Company’s late-stage pipeline.
The Committee considered a number of different ways to address this concern. For example, the volatility of exchange rates can have a significant impact on EPS with the consequence that the AZIP dividend cover target can become unachievable. Missing the dividend cover target for this reason would not be a fair reflection of the underlying business performance. However, making adjustments over the long term to balance the impact of exchange rate volatility across multiple markets, both in cases where the impact is positive for the Company as well as negative, would introduce significant complexity to the operation of the AZIP.
Another way to mitigate the risk of incentivising a focus on delivering short-term earnings would be to lower the AZIP’s targets. However, the Committee considered it inappropriate to reduce the performance targets set at the time the award was originally granted. The Committee is satisfied that the current
dividend level and cover targets remain stretching and appropriate for the three years left to run under the existing AZIP awards.
The Committee also considered whether changes should be made to other elements of executive remuneration in order to mitigate the impact of the AZIP cliff-edge vesting but concluded that maintaining the stretch of the original AZIP targets was important. The Committee concluded that since the AZIP cliff-edge vesting was the root cause of shareholder concern, adjusting this is the most effective way to mitigate the risk that the AZIP could drive sub-optimal decision making.
Ultimately, the Committee decided to operate a simple pro rata sliding scale for future performance years of the remaining awards. If a performance target is missed in any one year, instead of every outstanding AZIP award failing, only 25% will fail reflecting the fact that only one of the four performance years has failed. The Committee believes that this sliding scale directly addresses shareholder concern and will provide a good balance between challenging and achievable targets.
Next steps
We remain committed to ensuring that our remuneration arrangements support our strategy and deliver sustainable value to our shareholders. As such I hope that you find this report explains clearly how we intend to achieve this and that it gives you the information you need to be able to support the two remuneration resolutions that will be put forward to a shareholder vote at the 2017 AGM (the new Remuneration Policy and the Annual Report on Remuneration for the year ending 31 December 2016). Our ongoing dialogue with shareholders is valued greatly and, as always, we welcome your feedback on this Directors’ Remuneration Report.
Yours sincerely

Graham Chipchase
Chairman of the Remuneration Committee
2 February 2017
| | |
| AstraZenecaAnnual Report and Form 20-F Information 2016 | | 105 |
Corporate Governance
Directors’ Remuneration Reportcontinued
At a glance summary of Executive Directors’ remuneration
Looking ahead to 2017 – our remuneration framework
| | | | | | |
Element | | Structure | | Opportunity | | Change from 2016 |
| | | | |
| Salary | | Base salary, paid monthly | | CEO – £1,220,000 | | 2.5% increase |
| | | | CFO – £725,000 | | 2.5% increase |
| | | | |
| Pension | | Allowance taken as cash in lieu of pension participation | | CEO – 30% of base salary | | No change |
| | | | |
| | | | | CFO – 24% of base salary | | No change |
| | | | |
| Annual bonus | | Quantum determined by one-year performance against financial, non-financial and individual performance targets. One-third of bonus deferred into Ordinary Shares or ADSs, which will vest after three years | ���� | CEO �� maximum 180% of base salary | | No change |
| | | CFO – maximum 150% of base salary | | No change |
| | | | |
| LTI | | Delivered under the PSP Proportion vesting determined by three-year performance against five equally-weighted measures: > Relative TSR > Reported EBITDA > Cash flow > Return to growth > Achieve scientific leadership (3 individual measures) Two-year holding period follows performance period | | CEO – maximum 500% of base salary | | No change |
| | | CFO – maximum 400% of base salary | | 14.3% increase as a consequence of awarding shares entirely under the PSP Awards only made under the PSP going forward Reported EBITDA has been introduced as a measure and the Achieve scientific leadership measure has been reduced from five to three individual measures For further information on these changes see the Implementation of Remuneration Policy in 2017 section from page 117 |
Our variable remuneration – 2016
2016 Annual bonus (see page 107 for further details)
| | | | | | | | |
Measure | | Target (one-year) | | Weighting | | Performance | | Level of award1 |
Achieve Group financial targets | | Cash flow Core EPS Revenue | | 10% 20% 10% | | Exceeded target Below target Below threshold | | CEO – 54.4% of maximum (98% of salary) |
Achieve scientific leadership | | 5 measures | | 6% each | | Exceeded target | | CFO – 58.8% of maximum (88.2% of salary) |
Return to growth | | 6 measures | | 5% each | | Below target | |
| 1 | Includes assessment of Executive Director’s performance against individual objectives. |
2014-2016 PSP (see page 108 for further details)
| | | | | | | | |
Measure | | Target (three-year) | | Weighting | | Performance | | Level of award |
Relative TSR | | TSR performance relative to peer group | | 25% each | | 85% of maximum | | 92% of maximum |
Cash flow | | Cumulative free cash flow | | | 100% of maximum | |
Achieve scientific leadership | | 5 measures | | | 100% of maximum | |
Return to growth | | 5 measures | | | 82% of maximum | |
2013-2016 AZIP (see page 109 for further details)
| | | | | | | | |
Measure | | Target (four-year) | | Weighting | | Performance | | Level of award |
Dividend level | | Annual dividend per share of $2.80 or more | | Both targets must be achieved for the award to vest | | 100% of maximum | | 100% of maximum |
Dividend cover | | At least 1.5 calculated on the basis of Core EPS | | | 100% of maximum | |
| | |
| 106 | | AstraZenecaAnnual Report and Form 20-F Information 2016 |
|
Annual Report on Remuneration |
What did we pay our Directors?
Executive Directors’ single total figure remuneration (Audited)
| | | | | | | | | | | | | | | | | | | | | | | | | | | | | | | | | | | | | | | | | | | | | | | | | | | | | | | | | | | | | | | | | | | | | | | | | | | | | | | | | | | | | | | | | | | | | | | | | | | | |
| | | Base Salary | | | | | | Taxable benefits | | | | | | Annual bonus | | | | | | Long-term incentives | | | | | | Pension | | | | | | Other | | | | | | Total (excluding buyout long-term incentive) | | | | | | Total | |
| | |
| 2016
£’000 |
| |
| 2015
£’000 |
| | | | | |
| 2016
£’000 |
| |
| 2015
£’000 |
| | | | | |
| 2016
£’000 |
| |
| 2015
£’000 |
| | | | | |
| Regular
2016
£’000 | ³
| |
| Regular
2015
£’000 | 1,3
| |
| Buyout
2016
£’000 | 2,3
| |
| Buyout
2015
£’000 | 3
| | | | | |
| 2016
£’000 |
| |
| 2015
£’000 |
| | | | | |
| 2016
£’000 | 3
| |
| 2015
£’000 |
| | | | | |
| 2016
£’000 |
| |
| 2015
£’000 |
| | | | | |
| 2016
£’000 |
| |
| 2015
£’000 | 1
|
| Pascal Soriot | | | 1,190 | | | | 1,167 | | | | | | | | 121 | | | | 115 | | | | | | | | 1,167 | | | | 2,042 | | | | | | | | 6,910 | | | | 4,289 | | | | 3,623 | | | | – | | | | | | | | 357 | | | | 350 | | | | | | | | 21 | | | | – | | | | | | | | 9,766 | | | | 7,963 | | | | | | | | 13,389 | | | | 7,963 | |
| Marc Dunoyer | | | 707 | | | | 694 | | | | | | | | 71 | | | | 65 | | | | | | | | 624 | | | | 1,036 | | | | | | | | 2,878 | | | | 4,613 | | | | – | | | | – | | | | | | | | 170 | | | | 167 | | | | | | | | – | | | | – | | | | | | | | 4,450 | | | | 6,575 | | | | | | | | 4,450 | | | | 6,575 | |
| Total | | | 1,897 | | | | 1,861 | | | | | | | | 192 | | | | 180 | | | | | | | | 1,791 | | | | 3,078 | | | | | | | | 9,788 | | | | 8,902 | | | | 3,623 | | | | – | | | | | | | | 527 | | | | 517 | | | | | | | | 21 | | | | – | | | | | | | | 14,216 | | | | 14,538 | | | | | | | | 17,839 | | | | 14,538 | |
| 1 | These figures have been revised using the actual share price on vesting. The figures disclosed in last year’s Directors’ Remuneration Report were based on the average closing share price over the three-month period to 31 December 2015. |
| 2 | Shares awarded to Mr Soriot in 2013 under the AZIP to compensate him for LTIs from previous employment which were forfeited on his recruitment as the Company’s CEO (as previously disclosed to shareholders in the 2013 Directors’ Remuneration Report) and the cash equivalent of dividends accrued on those AZIP shares during the performance period, payable on vesting. |
| 3 | Cash equivalent of the dividends accrued on shares deferred under the annual bonus awarded in respect of 2012, paid during the year on the completion of the bonus share deferral period. |
Notes to the Executive Directors’ single total figure remuneration table
Taxable benefits
Executive Directors may select benefits within the Company’s UK Flexible Benefits Programme or can select to take all, or any remaining allowance after the selection of benefits, in cash. In 2016, the Executive Directors principally took the allowance in cash (£103,000 in respect of Mr Soriot and £54,000 in respect of Mr Dunoyer) and selected other benefits including healthcare insurance, death-in-service provision and advice in relation to tax.
2016 Annual bonus
The CEO had a target annual bonus of 100% of base salary (range 0-180%) and the CFO had a target annual bonus of 90% of base salary (range 0-150%).
One-third of the pre-tax bonuses shown will be deferred into Ordinary Shares which will vest three years from the date of deferral, subject to continued employment. The bonus is not pensionable.
The precise targets or target ranges set at the beginning of the performance period are closely aligned to the Company’s strategic priorities, set out in the Group scorecard. As in prior years, we have set out below the targets for 2016 in respect of the Achieve Group financial targets element of the annual bonus and Company performance against those targets. In addition, we have provided the outcomes under each of the Achieve scientific leadership and Return to growth targets. While, in the judgement of the Board, the targets themselves under these areas remain commercially sensitive, we remain committed to making retrospective disclosure of these targets when they are no longer considered to be commercially sensitive. It is anticipated that targets will be disclosed two years after the end of the performance period (as has been done for the 2014 annual bonus targets which are set out on page 114).
The 2016 bonus for both Executive Directors was below their individual target and was determined by applying the Group scorecard outcome directly to their target. The Group scorecard outcome was 98% and consequently the Committee determined that Mr Soriot’s annual bonus should amount to 98% of base salary, representing 54.4% of his potential maximum, and that Mr Dunoyer’s bonus should amount to 88.2% of base salary, representing 58.8% of his potential maximum.
1. Achieve Group financial targets
These targets are based on the Company’s key financial measures. Cash flow performance in 2016 was strong and the target was exceeded. The Core EPS and Revenue outcomes were below target – Core EPS performance was within the performance range and resulted in a below target payout. There will be no payout related to Revenue performance, which was below the threshold level set for that measure.
| | | | | | | | | | | | | | | | | | | | | | | | |
| Performance targets for 2016 | | Weighting | | | Target | | | Outcome | | | Performance | | | Pascal Soriot
level of award | | | Marc Dunoyer
level of award | |
| Cash flow from operating activities target | | | 10% | | | | $3.9bn | 1 | | | $4.5bn | 1 | | | Exceeded target | | | | 19.0% | | | | 17.1% | |
| Core EPS | | | 20% | | | | $4.20 | 2 | | | $4.13 | 2 | | | Below target | | | | 17.0% | | | | 15.3% | |
| Overall revenue | | | 10% | | | | $24.3bn | 2 | | | $23.5bn | 2 | | | Below threshold | | | | 0% | | | | 0% | |
| Pascal Soriot level of award | | | | | | | £429,000 (representing 36.7% of total annual bonus outcome) | |
| Marc Dunoyer level of award | | | | | | | £229,000 (representing 36.7% of total annual bonus outcome) | |
| 1 | The cash flow target, and the performance against that target, is evaluated by reference to net cash flow before distributions and other adjustments required by the performance conditions. |
| 2 | The Core EPS and Revenue targets, and the performance against those targets, are evaluated by reference to budget exchange rates such that beneficial or adverse movements in currency, which are outside the Company’s control, do not impact reward outcomes. |
| | |
| AstraZenecaAnnual Report and Form 20-F Information 2016 | | 107 |
Corporate Governance
Annual Report on Remunerationcontinued
2. Achieve scientific leadership
These targets reflect the Company’s ability to deliver innovation to the market. In 2016, we continued to make progress towards achieving scientific leadership.
The AstraZeneca pipeline includes 132 projects, of which 120 are in the clinical phase of development. There are 12 NME projects currently in late-stage development, either in Phase III/pivotal Phase II studies or under regulatory review. During 2016, across the portfolio, 48 projects successfully progressed to their next phase. This includes four first approvals in a major market, and 15 NME progressions. In addition, 17 projects have entered Phase I and 22 projects have been discontinued.
The Committee and the Science Committee assessed the substance of the achievements and concluded a fair and balanced outcome was 15 Phase II starts/progressions (versus 16 as reported in the KPI section on page 16) and 13 NME and major life-cycle management submissions (versus 14 as reported in the KPI section).
| | | | | | | | | | | | | | | | | | | | | | | | |
| Performance targets for 2016 | | Weighting | | | Target | | | Outcome | | | Performance | | | Pascal Soriot
aggregate level of award | | | Marc Dunoyer
aggregate level of award | |
| Phase II starts/progressions | |
| 6% per
measure |
| |
| Commercially
sensitive until March 2019 |
| | | 15 | | | | Below target | | | | 41.0% | | | | 36.9% | |
| Positive Phase III investment decisions | | | | | 7 | | | | Met target | | | |
| NME and major life-cycle management submissions | | | | | 13 | | | | Below target | | | |
| NME and major life-cycle management approvals | | | | | 11 | | | | Met target | | | |
| Clinical-stage external licensing and partnering opportunities | | | | | 10 | | | | Exceeded target | | | |
| Pascal Soriot level of award £488,000 (representing 41.9% of total annual bonus outcome) | |
| Marc Dunoyer level of award £261,000 (representing 41.9% of total annual bonus outcome) | |
3. Return to growth1
These targets are based on quantitative sales targets for 2016 relating to the Company’s Growth Platforms: Brilinta/Brilique, CVMD, Respiratory, New Oncology, Emerging Markets, and Japan. In 2016, the New Oncology therapy area performed well, exceeding target, and Japan met its target. The other Return to growth platform outcomes were below target reflecting a number of challenges in meeting these stretching targets.
| | | | | | | | | | | | | | | | | | | | | | | | |
| Performance targets for 2016 | | Weighting | | | Target | | | Outcome | | | Performance | | | Pascal Soriot
aggregate level of award | | | Marc Dunoyer
aggregate level of award | |
| Brilinta/Brilique | | | 5% per measure | | |
| Commercially sensitive until March
2019 |
| | | $0.9bn | | | | Below target | | | | 21.0% | | | | 18.9% | |
| CVMD | | | | | $2.5bn | | | | Below target | | | |
| Respiratory | | | | | $4.9bn | | | | Below target | | | |
| New Oncology | | | | | $0.7bn | | | | Exceeded target | | | |
| Emerging Markets | | | | | $6.3bn | | | | Below target | | | |
| Japan | | | | | $1.9bn | | | | Met target | | | |
| Pascal Soriot level of award £250,000 (representing 21.4% of total annual bonus outcome) | |
| Marc Dunoyer level of award £134,000 (representing 21.4% of total annual bonus outcome) | |
| 1 | In respect of the Return to growth measures only, the targets are set at budget exchange rates at the beginning of the performance period and evaluated at those rates at the end of the performance period. |
4. Individual performance
Although the performance targets in the Group scorecard driveprima facie bonus outcomes, the Committee also applies judgement to assess the Executive Director’s individual performance.
Our Executive Directors delivered 2016 business performance in line with expectations and against stretching performance targets, while managing a number of factors that impacted 2016 Product Sales and Total Revenue, such as pricing pressure and new competition from Crestor generic medicines. Strong leadership from our Executive Directors has enabled significant achievements such as the strategic prioritisation of scientific projects leading to the acceleration of a number of important opportunities and an organisational transformation to support entrepreneurial and agile teams focused on the most critical business priorities while delivering a 12% reduction in Core SG&A expense (9% at CER) and continuing to invest in R&D. When considering our Executive Directors’ individual performance and the business’ performance overall, the Committee decided a Group scorecard outcome of 98% represents a fair and balanced reflection of performance in a challenging year and that no upward or downward adjustment to the bonus outcomes for either Executive Director was required.
Long-term incentives:
2014 Performance Share Plan (PSP)
92% of the PSP awards granted to Mr Soriot and Mr Dunoyer in 2014 in respect of the 2014-2016 performance period will vest in 2017.
| | | | | | | | | | | | |
| | | | Number of shares awarded | | | | Number of shares vesting | | |
| Value vesting
£’000 | 1
|
| Pascal Soriot | | | 124,066 | | | | 114,140 | | | | 5,817 | |
| Marc Dunoyer | | | 52,254 | | | | 48,073 | | | | 2,450 | |
| 1 | Based on average closing share price over the three-month period to 31 December 2016 plus accrued dividends over the vesting period. |
| | |
| 108 | | AstraZenecaAnnual Report and Form 20-F Information 2016 |
The TSR and cash flow targets were disclosed at the time of the award. The Committee has determined that the 2014 targets relating to the Achieve scientific leadership and Return to growth elements of the PSP are no longer commercially sensitive. The targets, outcomes and relative weighting of each of the PSP’s performance measures are set out in the tables below.
More information about the PSP is set out in the Share interests awarded in 2016 section from page 110.
1. Relative TSR
| | | | | | | | | | | | | | |
Performance measure for 2014-2016 | | Weighting | | | Threshold target:
25% vesting | | Maximum target: 100% vesting | | Outcome | | | Vesting (% of
maximum) |
| AstraZeneca’s rank against peer group | | | 25% | | | Median (6th) | | Above upper quartile (2nd or above, at the discretion of the Committee) | | | 2nd | | | 85% |
Above upper quartile TSR performance achieved. In the Committee’s judgement, 85% vesting is a fair reflection of underlying business performance and shareholder experience over the performance period. More information about the TSR performance of the Company, including the Company’s peer group, is set out in the Total shareholder return section on page 113.
2. Cumulative cash flow
| | | | | | | | | | | | | | | | |
Performance target for 2014-2016 | | Weighting | | | Threshold target:
25% vesting | | Maximum target: 100% vesting | | Outcome | | | Vesting (% of
maximum) | |
| Adjusted cumulative cash flow1 | | | 25% | | | $9.0bn | | $13.0bn | | | $13.3bn | | | | 100% | |
| 1 | The cash flow target, and the performance against that target, is evaluated by reference to net cash flow before distributions and other adjustments required by the performance conditions. |
3. Achieve scientific leadership
| | | | | | | | | | | | | | | | |
Performance targets for 2014-2016 | | Weighting | | | Threshold target:
25% vesting | | Maximum target: 100% vesting | | Outcome | | | Vesting (% of
maximum) | |
| NME approvals | | | 5% per measure | | | 2 | | 6 | | | 9 | | | | 100% | |
| Major life-cycle management approvals | | | 3 | | 6 | | | 6 | | | | 100% | |
| Phase III/registration NME volume | | | 5 | | 7 | | | 15 | | | | 100% | |
| Prospective peak-year sales from NME and major life-cycle management approvals | | | $2.0bn | | $4.0bn | | | $7.0bn | | | | 100% | |
| Phase II starts | | | 12 | | 16 | | | 36 | | | | 100% | |
4. Return to growth1
| | | | | | | | | | | | | | | | |
Performance targets for 2014-2016 | | Weighting | | | Threshold target:
25% vesting | | Maximum target: 100% vesting | | Outcome | | | Vesting (% of
maximum) | |
| Brilinta/Brilique | | | | | | $0.8bn | | $1.1bn | | | $0.9bn | | | | 79% | |
| Diabetes franchise | | | 5% per | | | $2.3bn | | $3.3bn | | | $2.6bn | | | | 55% | |
| Respiratory | | | measure | | | $3.4bn | | $4.8bn | | | $5.3bn | | | | 100% | |
| Emerging Markets | | | | | | $5.0bn | | $7.2bn | | | $6.9bn | | | | 94% | |
| Japan | | | | | | $1.9bn | | $2.7bn | | | $2.4bn | | | | 81% | |
| 1 | The Return to growth targets are set at budget exchange rates at the beginning of the performance period and evaluated at those rates at the end of the performance period. |
2013 AstraZeneca Investment Plan (AZIP)
100% of the AZIP awards granted to Mr Soriot and Mr Dunoyer in 2013 in respect of the 2013-2016 performance period will vest in 2021, subject to continued employment. Mr Soriot’s 2013 AZIP comprised a regular award of 20,852 shares and a one-off award of 69,108 shares to compensate him for LTIs from previous employment forfeited on his recruitment as the Company’s CEO. The AZIP targets were disclosed at the time of the award and the targets and outcomes are set out below.
| | | | | | | | | | | | | | | | |
| | | | | | | | Number of shares awarded | | | | Number of shares vesting | | |
| Value vesting
£’000 | 1
|
| Pascal Soriot | | | | | | | 89,960 | | | | 89,960 | | | | 4,716 | |
| Marc Dunoyer | | | | | | | 8,176 | | | | 8,176 | | | | 429 | |
1 Based on average closing share price over the three-month period to 31 December 2016 plus accrued dividends over the performance period. | |
| | | | | | | | | | | | Outcome | |
| Performance targets for 2013-2016 | | 2013 | | | 2014 | | | 2015 | | | 2016 | |
| Annual dividend per share at or above $2.80 | | | $2.80 | | | | $2.80 | | | | $2.80 | | | | $2.80 | |
| Dividend cover of 1.5 calculated on the basis of Core EPS | | | 1.80 | | | | 1.53 | | | | 1.52 | | | | 1.54 | |
More information about the AZIP is set out in the Share interests awarded in 2016 section from page 110.
| | |
| AstraZenecaAnnual Report and Form 20-F Information 2016 | | 109 |
Corporate Governance
Annual Report on Remunerationcontinued
Pension allowance
Mr Soriot’s annual pension allowance is 30% of base salary and Mr Dunoyer’s is 24% of base salary. Both Executive Directors took their pension allowance as a cash alternative to participation in a defined contribution pension scheme.
Non-Executive Directors’ single total figure remuneration (Audited)
| | | | | | | | | | | | | | | | |
| | | 2016
Fees
£’000 | | | 2015
Fees
£’000 | | | 2016
Total
£’000 | | | 2015
Total
£’000 | |
| Leif Johansson | | | 611 | | | | 609 | | | | 611 | | | | 609 | |
| Geneviève Berger | | | 87 | | | | 87 | | | | 87 | | | | 87 | |
| Bruce Burlington | | | 117 | | | | 114 | | | | 117 | | | | 114 | |
| Ann Cairns | | | 95 | | | | 95 | | | | 95 | | | | 95 | |
| Graham Chipchase | | | 115 | | | | 107 | | | | 115 | | | | 107 | |
| Rudy Markham | | | 165 | | | | 156 | | | | 165 | | | | 156 | |
| Shriti Vadera | | | 110 | | | | 108 | | | | 110 | | | | 108 | |
| Marcus Wallenberg | | | 87 | | | | 87 | | | | 87 | | | | 87 | |
| Former Non-Executive Directors | | | | | | | | | | | | | | | | |
| Cori Bargmann | | | 65 | | | | 59 | | | | 65 | | | | 59 | |
| Jean-Philippe Courtois | | | 87 | | | | 95 | | | | 87 | | | | 95 | |
| Nancy Rothwell | | | – | | | | 35 | | | | – | | | | 35 | |
| John Varley | | | – | | | | 46 | | | | – | | | | 46 | |
| Total | | | 1,539 | | | | 1,598 | | | | 1,539 | | | | 1,598 | |
Notes to the Non-Executive Directors’ single total figure remuneration table
Board fees and office costs
The Chairman’s fee includes office costs (invoiced in Swedish krona) of £36,000 for 2016, and £34,000 for 2015. Further information on the Non-Executive Directors’ fees can be found in the Summary of Non-Executive Directors’ remuneration for 2017 section on page 119.
Board changes
Cori Bargmann and Jean-Philippe Courtois stepped down from the Board with effect from 1 October 2016 and 1 December 2016 respectively.
Share interests awarded in 2016 (Audited)
Deferred Bonus Plan
| | | | |
| | | Pascal Soriot | | Marc Dunoyer |
| Interest awarded | | 17,352 Ordinary Shares awarded on 24 March 2016 at a grant price of 3923 pence per share. | | 8,798 Ordinary Shares awarded on 24 March 2016 at a grant price of 3923 pence per share. |
| Description of interest | | Award over shares equal to one-third of the pre-tax annual bonus paid in respect of performance during 2015, based on the prevailing market share price on the award date. |
| Basis of award | | Automatic deferral of one-third of annual bonus into Ordinary Shares or ADSs. |
| Face value of award | | £681,000 | | £345,000 |
| Vesting level at threshold performance1 | | 100% |
| End of performance period2 | | 24 March 2019 |
Summary of performance measures and targets | | No performance conditions apply, but vesting is ordinarily subject to continued employment. |
| 1 | No performance conditions apply under the Deferred Bonus Plan, other than continued employment. |
| 2 | As no performance conditions apply, this date represents the end of the holding period. |
| | |
| 110 | | AstraZenecaAnnual Report and Form 20-F Information 2016 |
Performance Share Plan (PSP)
| | | | |
| | | Pascal Soriot | | Marc Dunoyer |
| Interest awarded | | 129,713 Ordinary Shares awarded on 24 March 2016 at a grant price of 3923 pence per share. | | 54,101 Ordinary Shares awarded on 24 March 2016 at a grant price of 3923 pence per share. |
| Description of interest | | An award over shares. The vesting date is the fifth anniversary of the date of grant, subject to performance over a three-year period commencing on 1 January in the year of the award and a two-year holding period commencing three years from the date of grant, and continued employment. The award is expressed as a percentage of base salary. Awards are weighted 75% in favour of the PSP and 25% in favour of the AZIP. |
| Basis of award | | 427.5% of base salary. | | 300% of base salary. |
| Face value of award | | £5,087,000 | | £2,122,000 |
| Vesting level at threshold performance | | 25% |
| End of performance period | | 31 December 2018 |
| End of holding period | | 24 March 2021 |
| Summary of performance measures and targets | | A combination of measures focused on our scientific, commercial and financial performance assessed over the relevant three-year performance period: Twenty five percent of the award is based on the relative TSR performance of the Company against a predetermined peer group of global pharmaceutical companies. The rank which the Company’s TSR achieves over the performance period will determine how many shares will vest under the part of the award subject to the TSR performance measure. Payouts against performance in relation to TSR for PSP awards are expressed as a percentage of the maximum award currently payable, shown within a range of 0% to 100%, as shown in the table below. |
| | | TSR ranking of the Company – PSP awards made in 2016 | | % of award under TSR performance measure that vests |
| | Below median | | 0% |
| | Median | | 25% |
| | Between median and upper quartile | | Pro rata |
| | Upper quartile | | 75% |
| | Above upper quartile | | 75% to 100% at the Committee’s discretion |
| | More information about the TSR performance of the Company, including the Company’s peer group, is set out in the Total shareholder return section on page 113. Twenty five percent of the award is based on the achievement of a cumulative free cash flow target. The measure for the cash flow target for the PSP awards made in 2016 is net cash flow before distributions and other adjustments required by the performance conditions (subject to any further adjustments the Committee chooses to make using its judgement) and thus referred to as ‘adjusted cumulative cash flow’, over the same three-year performance period as the TSR performance measure, and the level of vesting for the part of the award subject to the cash flow performance measure is based on a sliding scale between a threshold cash flow target and an upper target. Vesting levels in relation to the threshold target and the upper target are shown in the table below. |
| | | Adjusted cumulative cash flow – PSP awards made in 2016 | | % of award under cash flow performance measure that vests |
| | Less than $9bn | | 0% |
| | $9bn | | 25% |
| | Between $9bn and $11bn | | Pro rata |
| | $11bn | | 75% |
| | Between $11bn and $13.5bn | | Pro rata |
| | $13.5bn and above | | 100% |
| | Twenty five percent of the award is based on Return to growth measures based on achievement of an aggregate revenue target relating to the Company’s Growth Platforms. |
| | | Aggregate revenue of Growth Platforms – PSP awards made in 2016 | | % of award under Return to growth performance measure that
vests |
| | $17bn | | 25% |
| | $20bn | | 100% |
| | | Twenty five percent of the award is based on Achieve scientific leadership measures covering five areas: an NME target, which reflects the Company’s ability to deliver innovation to the market; major life-cycle management approvals, which represent a good proxy for near-to-mid term growth; the volume of NMEs in Phase III and their registration; a target for peak-year sales, to track the value of pipeline output; and delivery from our research and early development organisation, assessed by Phase II starts. As the PSP performance measures related to Achieve scientific leadership are an indicator of the Company’s longer-term strategic priorities, we believe that the targets/target ranges associated with them are commercially sensitive. We will make retrospective disclosure when the targets are deemed to be no longer commercially sensitive, which we currently anticipate to be immediately following the end of the performance period. More information about the PSP’s performance measures is set out on page 125 of the Remuneration Policy Report. |
| | |
| AstraZenecaAnnual Report and Form 20-F Information 2016 | | 111 |
Corporate Governance
Annual Report on Remunerationcontinued
AstraZeneca Investment Plan (AZIP)
| | | | |
| | | Pascal Soriot | | Marc Dunoyer |
| Interest awarded | | 21,618 Ordinary Shares awarded on 24 March 2016 at a grant price of 3923 pence per share. | | 9,016 Ordinary Shares awarded on 24 March 2016 at a grant price of 3923 pence per share. |
| Description of interest | | An award over shares. The vesting date is the eighth anniversary of the start of the performance period (being 1 January in any given year), subject to performance and continued employment. The award is expressed as a percentage of base salary. Awards are weighted 75% in favour of the PSP and 25% in favour of the AZIP. |
| Basis of award | | 71.25% of base salary. | | 50% of base salary. |
| Face value of award | | £848,000 | | £354,000 |
| Vesting level at threshold performance | | 100% |
| End of performance period | | 31 December 2019 |
| End of holding period | | 31 December 2023 |
Summary of performance measures and targets | | Dividend and dividend cover hurdles, assessed over the relevant four-year performance period > dividend per share of $2.80 maintained, or increased, over the performance period > dividend cover of 1.5 maintained over the performance period, calculated on the basis of Core EPS. If both targets are achieved in each year of the performance period, the awards will vest in full. Twenty five percent of an award will lapse for each year in which neither, or only one, target is achieved. More information about the AZIP’s performance hurdles is set out on page 127 of the Remuneration Policy Report. |
Payments to former Directors (Audited)
No payments were made during 2016 to former Directors.
Payments for loss of office (Audited)
No payments were made for loss of office during 2016.
Remuneration context and our past performance
Statement of change in remuneration of CEO compared to other employees
| | | | |
| | | Percentage change for CEO against 2015 | | Average percentage change for employees against 2015 |
| Salary | | 2.0% | | 3.3% |
| Taxable benefits | | 5.2% | | 3.3% |
| Annual bonus | | (42.9)% | | (21.5)% |
The employee comparator group comprises employees in the UK, US and Sweden. We consider this to be an appropriate comparator group because it is representative of the Group’s major science, business and enabling units, and the employee populations are well balanced in terms of seniority and demographics. To provide a meaningful comparison of salary increases, a consistent employee comparator group is used by which the same individuals appear in the 2015 and 2016 group.
CEO total remuneration table
| | | | | | | | | | | | | | | | | | | | | | |
| Year | | CEO | |
| CEO single total figure
remuneration
£’000 |
| |
| Annual bonus
£’000 |
| |
| Annual bonus payout
against maximum
opportunity
% |
| |
| Value of LTIs
at vest
£’000 |
| |
| LTI vesting rates
against maximum
opportunity
% |
|
| 2016 | | Pascal Soriot | | | 13,389 | 1,2 | | | 1,167 | | | | 54 | | | | 10,533 | 1,2 | | | 95 | |
| 2015 | | Pascal Soriot | | | 7,963 | 3 | | | 2,042 | | | | 97 | | | | 4,289 | 3 | | | 78 | |
| 2014 | | Pascal Soriot | | | 3,507 | | | | 1,926 | | | | 94 | | | | – | | | | – | |
| 2013 | | Pascal Soriot | | | 3,344 | | | | 1,870 | | | | 94 | | | | – | | | | – | |
| 2012 | | Pascal Soriot4 | | | 3,693 | 5 | | | 335 | | | | 68 | | | | – | | | | – | |
| 2012 | | Simon Lowth6 | | | 3,289 | | | | 1,034 | | | | 86 | | | | 1,301 | 7 | | | 38 | 7 |
| 2012 | | David Brennan8 | | | 4,147 | 9 | | | – | | | | – | 10 | | | 2,538 | | | | 38 | |
| 2011 | | David Brennan | | | 7,863 | | | | 1,326 | | | | 74 | | | | 5,386 | | | | 62 | |
| 2010 | | David Brennan | | | 9,690 | | | | 1,583 | | | | 90 | | | | 6,937 | | | | 100 | |
| 2009 | | David Brennan | | | 5,767 | | | | 1,751 | | | | 100 | | | | 2,795 | | | | 62 | |
| 1 | This figure includes shares awarded to Mr Soriot in 2013 under the AZIP to compensate him for LTIs from previous employment forfeited on his recruitment as the Company’s CEO. |
| 2 | Based on average closing share price over the three-month period to 31 December 2016 plus accrued dividends over the vesting and performance periods. |
| 3 | These figures have been revised using the actual share price on vesting. The figures disclosed in last year’s Directors’ Remuneration Report were based on the average closing share price over the three-month period to 31 December 2015. |
| 4 | Mr Soriot was appointed CEO with effect from 1 October 2012. |
| 5 | This figure includes £991,000 paid to compensate Mr Soriot in respect of his forfeited bonus opportunity for 2012 and an award of £2,000,000 to compensate him for his loss of LTI awards, both in respect of his previous employment. |
| 6 | Mr Lowth acted as Interim CEO from June to September 2012 inclusive. |
| 7 | Mr Lowth’s LTI awards which vested during 2012 were not awarded or received in respect of his performance as Interim CEO. |
| 8 | Mr Brennan ceased to be a Director on 1 June 2012. |
| 9 | This figure includes Mr Brennan’s pay in lieu of notice of £914,000. |
| 10 | Mr Brennan informed the Committee that he did not wish to be considered for a bonus in respect of that part of 2012 in which he was CEO. The Committee determined that no such bonus would be awarded and also that there should be no bonus award relating to his contractual notice period. |
| | |
| 112 | | AstraZenecaAnnual Report and Form 20-F Information 2016 |
Total shareholder return (TSR)
The graph below compares the TSR performance of the Company over the past eight years with the TSR of the FTSE100 Index. This graph is re-based to 100 at the start of the relevant period. As a constituent of the FTSE100, this index represents an appropriate reference point for the Company. We have also included a ‘Pharmaceutical peers average’, which reflects the TSR of the current comparator group and provides shareholders with additional context.
The charts below show how the Company’s TSR performance has compared with the TSR for the relevant companies in the comparator group from the first day in the three-year performance period in respect of the PSP awards made in 2014, 2015 and 2016, and how the Company ranks against those other companies on this basis.
To alleviate any short-term volatility, the return index is averaged in the TSR calculations for each company over the three months prior to the start of the relevant performance period (as stipulated in the PSP rules) and, for the purposes of the charts below, over the last three months of 2016.
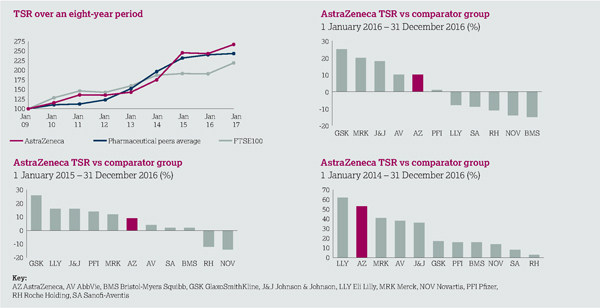
| | |
| AstraZenecaAnnual Report and Form 20-F Information 2016 | | 113 |
Corporate Governance
Annual Report on Remunerationcontinued
Relative importance of spend on remuneration
The table below shows the remuneration paid to all employees in the Group and expenditure on shareholder distributions through dividends.
The figures below have been calculated in accordance with the Group Accounting Policies and drawn from either the Company’s Consolidated Statement of Comprehensive Income on page 138, or its Consolidated Statement of Cash Flows on page 141. Further information on the Group’s Accounting Policies can be found from page 142.
| | | | | | | | | | | | | | | | |
| | | 2016 $m | | | 2015 $m | | | Difference in spend
between years $m | | | Difference in spend
between years % | |
| Total employee remuneration | | | 6,284 | | | | 6,128 | | | | 156 | | | | 2.5 | |
Distributions to shareholders: – Dividends paid | | | 3,561 | | | | 3,486 | | | | 75 | | | | 2.2 | |
Disclosure of historic performance targets
2014 Annual bonus
In accordance with the Committee’s commitment to disclosure as set out in the 2014 Directors’ Remuneration Report, the Committee has determined that the 2014 targets relating to the Achieve scientific leadership and Return to growth elements of the annual bonus are no longer commercially sensitive and can therefore be disclosed. The Achieve Group financial targets were disclosed in the 2014 Directors’ Remuneration Report. Mr Soriot’s 2014 annual bonus award was 170% of base salary, and Mr Dunoyer’s award was 149.4%. The level of award for the Executive Directors in respect of the Achieve scientific leadership performance measures was 35% of the total bonus outcome, with the Return to growth measures contributing 22%. These figures reflect the outcome of the global Scorecard and the Executive Directors’ individual performance against it.
1. Achieve scientific leadership
| | | | | | | | | | | | |
| Performance measures for 2014 | | Target | | | Outcome | | | Performance | |
| Phase II starts/progressions | | | 8 | | | | 13 | | | | Exceeded target | |
| Positive Phase III investment decisions | | | 5 | | | | 9 | | | | Exceeded target | |
| NME major life-cycle management submissions | | | 5 | | | | 6 | | | | Met target | |
| NME major life-cycle management approvals | | | 6 | | | | 12 | | | | Exceeded target | |
| Clinical-stage external licensing and partnering opportunities | | | 2 | | | | 3 | | | | Met target | |
2. Return to growth1
| | | | | | | | | | | | |
| Performance measures for 2014 | | Target | | | Outcome | | | Performance | |
| Deliver Brilinta/Briliquetarget | | | $487m | | | | $476m | | | | Below target | |
| Build Diabetes franchise | | | $1,824m | | | | $1,870m | | | | Met target | |
| Deliver sales growth in Emerging Markets | | | $5,761m | | | | $5,827m | | | | Met target | |
| Deliver Respiratory goals | | | $4,460m | | | | $4,747m | | | | Exceeded target | |
| Deliver Japan growth target | | | $2,456m | | | | $2,227m | | | | Below target | |
| 1 | In respect of the Return to growth measures only, the targets are set at budget exchange rates at the beginning of the performance period and evaluated at those rates at the end of the performance period. |
Directors’ interests in shares (Audited)
Under the Company’s Articles all Directors must, within two months of their appointment, acquire a beneficial interest in at least 500 shares in the Company. All of the Directors fulfil this requirement at the date of this Directors’ Remuneration Report.
In addition to this mandatory requirement, the Board imposes minimum shareholding requirements on the Executive Directors and SET members. The CEO is required to build a shareholding and hold shares amounting to 300% of base salary, and the CFO is required to hold shares amounting to 200% of base salary, each within five years of their dates of appointment. As at 31 December 2016, Mr Soriot and Mr Dunoyer had fulfilled this requirement. All other SET members are required to build a shareholding over time and hold 125% of base salary as shares while in office.
The Board also encourages each Non-Executive Director to build up, over a period of three years, a shareholding in the Company with a value approximately equivalent to the basic annual fee for a Non-Executive Director (£75,000) or, in the case of the Chairman, approximately equivalent to his basic annual fee (£575,000). All of the Non-Executive Directors, including the Chairman, had fulfilled this expectation as at 31 December 2016.
| | |
| 114 | | AstraZenecaAnnual Report and Form 20-F Information 2016 |
The tables below show the interests of the Directors (including the interests of their connected persons) in Ordinary Shares as at 31 December 2016, as well as details of any Director’s interests in options over the Company’s shares. All such interests were beneficial except as otherwise stated. No Director or senior executive beneficially owns, or has options over, 1% or more of the issued share capital of the Company, nor do they have different voting rights from other shareholders. None of the Directors has a beneficial interest in the shares of any of the Company’s subsidiaries. Between 31 December 2016 and 2 February 2017, there was no change in the interests in Ordinary Shares shown in the tables below.
Executive Directors
| | | | | | | | | | | | | | | | | | | | | | | | | | | | | | | | | | | | | | | | |
| | | Shares held | | | | | | Options held | | | | |
| Executive Director | |
| Held
beneficially |
| |
| Value of shares
held beneficially
as percentage
of base salary |
1 | |
| Shareholding
requirement
(to be built up within
5 years of date of
appointment) |
| |
| Subject to
performance
conditions |
| |
| Subject to
deferral |
| | | | | | | Unvested | | |
| Vested but
unexercised |
| |
| Exercised
during the year |
| | | Total | |
| Pascal Soriot | | | 87,355 | | | | 326% | | | | 300% | | | | 418,298 | | | | 136,760 | | | | | | | | – | | | | – | | | | – | | | | 642,413 | |
| Marc Dunoyer | | | 101,034 | | | | 634% | | | | 200% | | | | 177,606 | | | | 26,764 | | | | | | | | 544 | | | | – | | | | – | | | | 305,948 | |
| 1 | The value of shares is based on the London Stock Exchange closing price of 4437.5 pence per Ordinary Share on 31 December 2016. |
Non-Executive Directors
The Non-Executive Directors are not eligible to receive shares in the Company that are the subject of performance conditions, and have acquired their beneficial interests in the Company’s shares using their own resources.
| | | | | | | | | | | | |
| Non-Executive Director | | Beneficial interest in
Ordinary Shares at
31 December 2015 or
(if later) appointment date | | | Change to beneficial interest | | | Beneficial interest in
Ordinary Shares at
31 December 2016 or
(if earlier) date of retirement | |
| Leif Johansson | | | 39,009 | | | | – | | | | 39,009 | |
| Geneviève Berger | | | 2,090 | | | | – | | | | 2,090 | |
| Bruce Burlington | | | 3,349 | | | | – | | | | 3,349 | |
| Ann Cairns | | | 2,325 | | | | – | | | | 2,325 | |
| Graham Chipchase | | | 3,000 | | | | 100 | | | | 3,100 | |
| Rudy Markham | | | 2,452 | | | | – | | | | 2,452 | |
| Shriti Vadera | | | 10,000 | | | | – | | | | 10,000 | |
| Marcus Wallenberg | | | 63,646 | | | | – | | | | 63,646 | |
| Former Directors | | | | | | | | | | | | |
| Cori Bargmann | | | 1,959 | | | | – | | | | 1,959 | |
| Jean-Philippe Courtois | | | 6,035 | | | | – | | | | 6,035 | |
Governance
Committee membership
The Committee members are Graham Chipchase (Chairman of the Committee), Leif Johansson, Rudy Markham and Shriti Vadera. The Deputy Company Secretary acts as the secretary to the Committee.
The Committee met five times in 2016. The individual attendance record of Committee members is set out on page 84. The Committee was materially assisted, except in relation to their own remuneration, by the CEO; the CFO; the VP Finance, Group Controller; the EVP GMD; the EVP, Human Resources; the Human Resources Vice-President, Centre of Excellence; the Executive Compensation Director; and the Company Secretary during the year. The Committee’s independent adviser, Nicki Demby, Deloitte LLP (Deloitte) attended all Committee meetings.
| | |
| AstraZenecaAnnual Report and Form 20-F Information 2016 | | 115 |
Corporate Governance
Annual Report on Remunerationcontinued
The Committee focused on the following principal matters at its meetings held in 2016 and in January 2017:
| > | The terms of senior executives’ employment and remuneration packages on appointment, promotion or termination. |
| > | The assessment of Group and individual performance against targets to determine the level of annual bonuses for performance during 2015 and to set executive bonus targets during 2016 and LTI awards to be granted during 2016. |
| > | The assessment of performance against targets to determine the level of vesting in 2016 under the PSP and AZIP, and the setting of PSP and AZIP performance thresholds for awards made in 2016. |
| > | The determination of individual awards made to SET members and other participants under the Group’s main LTI plans: the PSP; the AZIP; and the AstraZeneca Global Restricted Stock Plan. |
| > | The determination of restricted share awards to a number of senior executives under the AstraZeneca Restricted Share Plan. |
| > | A review of shareholder voting in respect of the Directors’ Remuneration Report 2015 (including dialogue with major shareholders). |
| > | Consultation with major shareholders and shareholder representative bodies regarding proposals to simplify LTI plans. |
| > | A review of a report providing an analysis of key aspects of reward across the wider Group. |
| > | The determination of the Executive Directors’ and other SET members’ remuneration for 2016 and for 2017. |
| > | The assessment and setting of executive bonus targets for 2017 and LTI awards to be granted in 2017. |
| > | The annual review of the performance of the Committee. |
| > | The review of the terms of reference of the Committee. |
| > | The preparation, review and approval of this Directors’ Remuneration Report. |
Independent adviser to the Committee
The Committee reappointed Deloitte as its independent adviser following a tender process undertaken in 2013, which involved interviews with both the Company’s management and the Chairman of the Committee. The role as independent adviser will be re-tendered no later than the end of 2018. Deloitte’s service to the Committee was provided on a time-spent basis at a cost to the Company of £99,000 (excluding VAT). During the year, Deloitte also provided taxation advice and other specific non-audit advisory services to the Group. The Committee reviewed the potential for conflicts of interest and judged that there were no conflicts. Deloitte is a member of the Remuneration Consultants’ Group, which is responsible for the stewardship and development of the voluntary code of conduct in relation to executive remuneration consulting in the UK. The principles on which the code is based are transparency, integrity, objectivity, competence, due care and confidentiality. Deloitte adheres to the code.
Shareholder context
At the Company’s AGM held in April 2016, the resolution to approve the Annual Report on Remuneration for the year ended 31 December 2015 was passed.
| | | | | | | | | | | | | | | | | | | | | | | | | | | | |
| Resolution | | Votes for | | | % for | | | Votes against | | | % against | | | Total votes cast | | | % of Issued Share
Capital voted | | | Votes withheld | |
| Ordinary Resolution to approve the Annual Report on Remuneration for the year ended 31 December 2015 | | | 836,396,151 | | | | 89.61 | | | | 96,959,428 | | | | 10.39 | | | | 933,355,579 | | | | 73.81 | | | | 3,822,290 | |
At the Company’s AGM held in April 2014, the resolution to approve the current Remuneration Policy was passed.
| | | | | | | | | | | | | | | | | | | | | | | | | | | | |
| Resolution | | Votes for | | | % for | | | Votes against | | | % against | | | Total votes cast | | | % of Issued Share
Capital voted | | | Votes withheld | |
| Ordinary Resolution to approve the Directors’ Remuneration Policy | | | 623,298,717 | | | | 85.00 | | | | 110,030,311 | | | | 15.00 | | | | 733,329,028 | | | | 58.13 | | | | 166,623,018 | |
As explained in the Annual Statement from the Chairman of the Remuneration Committee from page 103, an updated Remuneration Policy will be proposed for approval by shareholders at the 2017 AGM.
In 2015, we simplified the PSP for awards made in 2016 by replacing the six Return to growth performance targets with one aggregate sales target for our Growth Platforms and increased transparency in our reporting by disclosing the target for that measure at the start of the performance period, in line with our aim to strike the right balance between transparency in our reporting on executive pay and protecting our commercially sensitive information.
In 2016, the Chairman of the Committee consulted with our major shareholders and shareholder representative bodies on executive remuneration. The feedback we received has informed the Committee’s approach to executive remuneration in 2017, with further detail set out in the Annual Statement from the Chairman of the Remuneration Committee from page 103 and the Implementation of Remuneration Policy in 2017 section from page 117.
Based on our shareholder consultation we believe that the changes made to the Committee’s approach to executive remuneration in 2017 will closely align our reward mechanisms with the experience of shareholders. We intend to continue the dialogue with our major shareholders and shareholder representative bodies during the course of 2017 as the Company’s strategy and business needs evolve, to ensure executive reward remains aligned to the delivery of sustainable value for our shareholders.
| | |
| 116 | | AstraZenecaAnnual Report and Form 20-F Information 2016 |
Service contracts
The notice periods and unexpired terms of Executive Directors’ service contracts at 31 December 2016 are shown in the table below.
AstraZeneca or the Executive Director may terminate the service contract on 12 months’ notice.
| | | | | | |
| Executive Director | | Date of service contract | | Unexpired term at 31 December 2016 | | Notice period |
| Pascal Soriot | | 15 December 2016 | | 12 months | | 12 months |
| Marc Dunoyer | | 6 December 2016 | | 12 months | | 12 months |
Terms of reference
A copy of the Committee’s terms of reference is available on our website, www.astrazeneca.com. The Committee conducted a review of its terms of reference during 2016 and recommended minor changes including an express reference to the regular tender for the services of the Committee’s independent adviser. The Board approved this recommendation.
Basis of preparation of this Directors’ Remuneration Report
This Directors’ Remuneration Report has been prepared in accordance with the Large and Medium-sized Companies and Groups (Accounts and Reports) (Amendment) Regulations 2013 (the Regulations) and meets the relevant requirements of the Financial Conduct Authority’s Listing Rules. As required by the Regulations, resolutions to approve the Annual Report on Remuneration and the Directors’ Remuneration Policy will be proposed at the AGM on 27 April 2017.
Implementation of Remuneration Policy in 2017
This section sets out how the Committee intends to implement our Remuneration Policy in 2017.
Changes to LTI plans
From 1 January 2017, LTI plans will be simplified: no new awards will be made under the AZIP so LTI awards for Executive Directors will only be made under the PSP. The performance measures and weightings for 2017 PSP awards are set out in the table overleaf. Taking into account shareholder feedback, a number of changes have been made to the PSP’s performance measures:
| > | The level of vesting for threshold performance has been reduced from 25% to 20% of maximum for all measures. |
| > | The TSR peer group will be increased from 10 to 18 companies. The new peer group provides a better comparison in terms of revenue, innovative portfolio and geographical presence. The TSR peer group is set out in the Summary of Executive Directors’ remuneration for 2017 section on page 118. |
| > | We have introduced a Reported EBITDA measure. In selecting ‘Reported’ EBITDA, the Committee has addressed a general concern about the pharmaceutical industry’s use of ‘core’ earnings for incentive purposes. Further to this, in line with our aim to increase transparency and accountability in our reporting, we have disclosed the targets for this measure at the start of the performance period. |
| > | The number of measures under the Achieve scientific leadership element has been reduced from five to three measures ensuring focus on late-stage value creation. |
For AZIP awards that still have performance years to run in 2017, 2018 and 2019, the Committee is responding to concerns expressed by some shareholders that the AZIP may incentivise decision making that is strongly focused on short-term earnings, by introducing a simplepro rata sliding scale to assess performance for the outstanding AZIP awards. If a performance target is missed in any one year, instead of every outstanding AZIP award failing, only 25% will fail reflecting the fact that only one of the four performance years has failed. The Committee believes that this sliding scale directly addresses shareholder concerns and will provide a good balance between challenging and achievable targets.
Executive Directors’ remuneration opportunity for 2017
Effective from 1 January 2017, Mr Soriot’s base salary was increased, in line with increases in the UK employee population, by 2.5% to £1,220,000. For performance in line with the Company’s expectations, Mr Soriot’s overall remuneration opportunity will remain unchanged at 100% of base salary for his annual bonus, and 250% of base salary for his LTI award.
Effective from 1 January 2017, Mr Dunoyer’s base salary was increased, in line with increases in the UK employee population, by 2.5% to £725,000. For performance in line with the Company’s expectations, Mr Dunoyer’s overall remuneration opportunity will also remain unchanged at 90% of base salary for his annual bonus, and 200% of base salary for his LTI award. Awards under the PSP have an expected value of 50%, whereas the expected value that has been used when making AZIP awards has been 100%. A consequence of awarding shares entirely under the PSP is that the value that could potentially be delivered to Mr Dunoyer for maximum performance under the LTI has increased from 350% of base salary to 400% at face value. There is no increase in Mr Soriot’s maximum remuneration opportunity under the LTI which remains at 500% at face value.
The annual bonus measures and weightings for 2017 are set out in the table overleaf and are broadly consistent with those applicable in 2016. Individual performance for each of the Executive Directors will be assessed by reference to individual objectives in line with the Company’s objectives for the year.
| | |
| AstraZenecaAnnual Report and Form 20-F Information 2016 | | 117 |
Corporate Governance
Annual Report on Remunerationcontinued
Summary of Executive Directors’ remuneration for 2017
| | | | |
| | | Pascal Soriot | | Marc Dunoyer |
| Base salary | | £1,220,000 | | £725,000 |
| Pension provision | | 30% of base salary | | 24% of base salary |
| Annual bonus target | | 100% of base salary (normal range 0-180%) | | 90% of base salary (normal range 0-150%) |
| LTI plan award | | 500% of base salary | | 400% of base salary |
Annual bonus
| | | | | | | | | | | | | | |
Return to growth performance measures | | Weighting | | | | Achieve scientific leadership performance measures | | Weighting | | | Achieve Group financial targets performance measures | | Weighting |
| New CVMD (includingBrilinta) | | | | | | NME Phase II starts/progressions | | | | | | Cash flow | | 10% |
| Respiratory | | 6% per | | | | NME and major life-cycle management Phase III investment decisions | | | 6% per | | | Core EPS | | 20% |
| New Oncology | | measure | | | | NME and major life-cycle management regional submissions | | | measure | | | Total Revenue | | 10% |
| Emerging Markets | | | | | | NME and major life-cycle management regional approvals | | | | | | | | |
| Japan | | | | | | Acquisition, licensing and divestment deals | | | | | | | | |
The measure for the cash flow target is net cash flow from operating activities less capital expenditure adding back proceeds from disposal of intangible assets.
PSP
| | | | | | | | |
| Performance measure | | Weighting | | | | Threshold target: 20% vesting | | Maximum target: 100% vesting |
| Relative TSR | | 20% per | | | | Median | | Upper quartile |
| Reported EBITDA1,2 | | measure | | | | $12.0bn | | $18.0bn |
| Cash flow3 | | | | | | $8.5bn | | $12.0bn |
| Return to growth2 | | | | | | $16.5bn | | $20.7bn |
Achieve scientific leadership: > NME approvals > Major life-cycle management approvals > Phase III registration | | 6.67% per measure | | | | Commercially sensitive | | Commercially sensitive |
| 1 | The target is Reported EBITDA less gains on disposals of intangible assets, adjusted for the fair value movements on contingent considerations arising from revised forecasts. |
| 2 | The targets and the performance against those targets, are evaluated by reference to budget exchange rates such that beneficial or adverse movements in currency, which are outside the Company’s control, do not impact reward outcomes. |
| 3 | The cash flow target is net cash flow from operating activities less capital expenditure adding back proceeds from disposal of intangible assets. |
For 2017 awards, the number of companies in the TSR group has been increased from 10 to 18 (AbbVie, Amgen, Astellas, BMS, Celgene, Daiichi Sankyo, Lilly, Gilead, GSK, Johnson & Johnson, Merck, Novo Nordisk, Novartis, Pfizer, Roche, Sanofi, Shire and Takeda). The Committee is of the opinion that the new peer group provides a better comparison in terms of revenue, innovative portfolio and geographical presence.
| | |
| 118 | | AstraZenecaAnnual Report and Form 20-F Information 2016 |
Summary of Non-Executive Directors’ remuneration for 2017
Board fees for the Non-Executive Directors, including the Chairman, were reviewed in 2016, but no changes were proposed. The Non-Executive Director fees for 2017 (together with those for 2016) are set out below. Further information on the Non-Executive Directors’ Board fees can be found on page 132 of the Remuneration Policy Report.
| | | | | | | | |
| Non-Executive Director fees in 2016 and in 2017 | | 2016
£’000 | | | 2017
£’000 | |
| Chairman’s fee1 | | | 575 | | | | 575 | |
| Basic Non-Executive Director’s fee | | | 75 | | | | 75 | |
| Senior independent Non-Executive Director | | | 30 | | | | 30 | |
| Membership of the Audit Committee | | | 20 | | | | 20 | |
| Membership of the Remuneration Committee | | | 15 | | | | 15 | |
| Chairman of the Audit Committee or the Remuneration Committee2 | | | 25 | | | | 25 | |
| Membership of the Science Committee | | | 12 | | | | 12 | |
| Chairman of the Science Committee2 | | | 10 | | | | 10 | |
| 1 | The Chairman does not receive any additional fees for chairing, or being a member of, a committee. |
| 2 | This fee is in addition to the fee for membership of the relevant committee. |
Additional information: Executive Directors’ share plans
Deferred Bonus Plan
The interests of Directors at 31 December 2016 in Ordinary Shares that are the subject of awards under the Deferred Bonus Plan are shown below.
| | | | | | | | | | | | | | | | | | | | |
| | |
| Number of
shares |
| |
| Award price
(pence) |
| |
| Price
on vesting
date (pence) |
| | | Grant date | 1 | | | Vesting date | 1 |
| Pascal Soriot | | | | | | | | | | | | | | | | | | | | |
| Award in respect of 2012 performance period | | | 3,799 | | | | 2939 | | | | | | | | 25.02.13 | | | | 25.02.16 | |
| Award in respect of 2013 performance period | | | 15,966 | | | | 3904 | | | | | | | | 28.03.14 | | | | 28.03.17 | |
| Award in respect of 2014 performance period | | | 13,482 | | | | 4762 | | | | | | | | 27.03.15 | | | | 27.03.18 | |
| Total at 1 January 2016 | | | 33,247 | | | | | | | | | | | | | | | | | |
| Vesting of award in respect of 2012 performance period | | | (3,799 | ) | | | | | | | 4086.5 | | | | | | | | | |
| Award in respect of 2015 performance period | | | 17,352 | | | | 3923 | | | | | | | | 24.03.16 | | | | 24.03.19 | |
| Total at 31 December 2016 | | | 46,800 | | | | | | | | | | | | | | | | | |
| Marc Dunoyer | | | | | | | | | | | | | | | | | | | | |
| Award in respect of 2013 performance period | | | 2,679 | | | | 3904 | | | | | | | | 28.03.14 | | | | 28.03.17 | |
| Award in respect of 2014 performance period | | | 7,111 | | | | 4762 | | | | | | | | 27.03.15 | | | | 27.03.18 | |
| Total at 1 January 2016 | | | 9,790 | | | | | | | | | | | | | | | | | |
| Award in respect of 2015 performance period | | | 8,798 | | | | 3923 | | | | | | | | 24.03.16 | | | | 24.03.19 | |
| Total at 31 December 2016 | | | 18,588 | | | | | | | | | | | | | | | | | |
| 1 | UK date convention applies. |
| | |
| AstraZenecaAnnual Report and Form 20-F Information 2016 | | 119 |
Corporate Governance
Annual Report on Remunerationcontinued
Performance Share Plan (PSP)
The interests of Directors at 31 December 2016 in Ordinary Shares that are the subject of awards under the PSP are shown below.
| | | | | | | | | | | | | | | | | | | | | | | | |
| | |
| Number of
shares |
| |
| Award price
(pence) |
| |
| Price on
vesting date
(pence) |
| | | Grant date | 1 | | | Vesting date | 1 | | | Performance period | 1 |
| Pascal Soriot | | | | | | | | | | | | | | | | | | | | | | | | |
| 2013 award | | | 125,113 | | | | 3297 | | | | | | | | 11.06.13 | | | | 11.06.16 | | | | 01.01.13 – 31.12.15 | |
| 2014 award | | | 124,066 | | | | 3904 | | | | | | | | 28.03.14 | | | | 28.03.17 | | | | 01.01.14 – 31.12.16 | |
| 2015 award | | | 104,764 | | | | 4762 | | | | | | | | 27.03.15 | | | | 27.03.20 | | | | 01.01.15 – 31.12.17 | |
| Total at 1 January 2016 | | | 353,943 | | | | | | | | | | | | | | | | | | | | | |
| 2016 award | | | 129,713 | | | | 3923 | | | | | | | | 24.03.16 | | | | 24.03.21 | | | | 01.01.16 – 31.12.18 | |
| Partial vesting of 2013 award2 | | | (97,589 | )3 | | | | | | | 3852 | | | | | | | | | | | | | |
| Partial lapse of 2013 award | | | (27,524 | ) | | | | | | | | | | | | | | | | | | | | |
| Total at 31 December 2016 | | | 358,543 | | | | | | | | | | | | | | | | | | | | | |
| Marc Dunoyer | | | | | | | | | | | | | | | | | | | | | | | | |
| 2013 award | | | 90,853 | | | | 3302 | | | | | | | | 01.08.13 | | | | 01.08.16 | | | | 01.01.13 – 31.12.15 | |
| 2014 award | | | 52,254 | | | | 3904 | | | | | | | | 28.03.14 | | | | 28.03.17 | | | | 01.01.14 – 31.12.16 | |
| 2015 award | | | 45,880 | | | | 4762 | | | | | | | | 27.03.15 | | | | 27.03.20 | | | | 01.01.15 – 31.12.17 | |
| Total at 1 January 2016 | | | 188,987 | | | | | | | | | | | | | | | | | | | | | |
| 2016 award | | | 54,101 | | | | 3923 | | | | | | | | 24.03.16 | | | | 24.03.21 | | | | 01.01.16 – 31.12.18 | |
| Partial vesting of 2013 award2 | | | (70,866 | )4 | | | | | | | 5048 | | | | | | | | | | | | | |
| Partial lapse of 2013 award | | | (19,987 | ) | | | | | | | | | | | | | | | | | | | | |
| Total at 31 December 2016 | | | 152,235 | | | | | | | | | | | | | | | | | | | | | |
| 1 | UK date convention applies. |
| 2 | Awards granted in 2013 vested in 2016 at 78%. |
| 3 | Following certain mandatory tax deductions, Mr Soriot became beneficially interested in a net number of 84,316 Ordinary Shares. |
| 4 | Following certain mandatory tax deductions, Mr Dunoyer became beneficially interested in a net number of 37,558 Ordinary Shares. |
AstraZeneca Investment Plan (AZIP)
The interests of Directors at 31 December 2016 in Ordinary Shares that are the subject of awards under the AZIP are shown below.
| | | | | | | | | | | | | | | | | | | | | | | | |
| | |
| Number of
shares |
| |
| Award price
(pence) |
| | | Grant date | 1 | | | Vesting date | 1 | | | Performance period | 1 | | | Holding period | 1 |
| Pascal Soriot | | | | | | | | | | | | | | | | | | | | | | | | |
| 2013 award2 | | | 89,960 | | | | 3297 | | | | 11.06.13 | | | | 01.01.21 | | | | | | | | 01.01.17 – 31.12.20 | |
| 2014 award | | | 20,677 | | | | 3904 | | | | 28.03.14 | | | | 01.01.22 | | | | 01.01.14 – 31.12.17 | | | | | |
| 2015 award | | | 17,460 | | | | 4762 | | | | 27.03.15 | | | | 01.01.23 | | | | 01.01.15 – 31.12.18 | | | | | |
| Total at 1 January 2016 | | | 128,097 | | | | | | | | | | | | | | | | | | | | | |
| 2016 award | | | 21,618 | | | | 3923 | | | | 24.03.16 | | | | 01.01.24 | | | | 01.01.16 – 31.12.19 | | | | | |
| Total at 31 December 2016 | | | 149,715 | | | | | | | | | | | | | | | | | | | | | |
| Marc Dunoyer | | | | | | | | | | | | | | | | | | | | | | | | |
| 2013 award | | | 8,176 | | | | 3302 | | | | 01.08.13 | | | | 01.01.21 | | | | | | | | 01.01.17 – 31.12.20 | |
| 2014 award | | | 8,709 | | | | 3904 | | | | 28.03.14 | | | | 01.01.22 | | | | 01.01.14 – 31.12.17 | | | | | |
| 2015 award | | | 7,646 | | | | 4762 | | | | 27.03.15 | | | | 01.01.23 | | | | 01.01.15 – 31.12.18 | | | | | |
| Total at 1 January 2016 | | | 24,531 | | | | | | | | | | | | | | | | | | | | | |
| 2016 award | | | 9,016 | | | | 3923 | | | | 24.03.16 | | | | 01.01.24 | | | | 01.01.16 – 31.12.19 | | | | | |
| Total at 31 December 2016 | | | 33,547 | | | | | | | | | | | | | | | | | | | | | |
| 1 | UK date convention applies. |
| 2 | The AZIP award of 89,960 shares comprises a regular 2013 award of 20,852 shares and a previously announced award which replaces that originally made when Mr Soriot joined the Company in October 2012. |
| | |
| 120 | | AstraZenecaAnnual Report and Form 20-F Information 2016 |
Restricted Share Plan
On 1 August 2013, Mr Dunoyer was granted an award of 65,505 restricted shares at an award price of 3302 pence per share. When Mr Dunoyer joined AstraZeneca as EVP, GPPS, he forfeited awards made to him by his previous employer. The Committee determined that it was appropriate to compensate him for the value of those forfeited awards. AstraZeneca received an independent assessment of their value. The restricted shares vested as follows:
> 9,103 shares vested on 15 June 2014
> 41,472 shares vested on 15 June 2015
> 11,645 shares vested on 1 August 2016 (3,285 shares lapsed).
The interests of Mr Dunoyer at 31 December 2016 in Ordinary Shares that are the subject of awards under this arrangement are shown below.
| | | | | | | | |
| | | Number of
shares | | | Price on
vesting
date
(pence) | |
| Marc Dunoyer | | | | | | | | |
| Total at 1 January 2016 | | | 14,930 | | | | | |
| Partial vesting of 2013 award | | | (11,645 | )1 | | | 5048 | |
| Partial lapse of 2013 award | | | (3,285 | ) | | | | |
| Total at 31 December 2016 | | | 0 | | | | | |
| 1 | Following certain mandatory tax deductions, Mr Dunoyer became beneficially interested in a net number of 6,172 Ordinary Shares. |
AstraZeneca 2012 Savings Related Share Option Scheme (SAYE)
The interests of Mr Dunoyer at 31 December 2016 in options to subscribe for Ordinary Shares that are the subject of awards under the SAYE are shown below.
| | | | | | | | | | | | | | | | | | | | |
| | |
| Number of
shares under
option |
| |
| Exercise price
(pence |
) | | | Grant date | 1 | |
| First date
exercisable |
1 | |
| Last date
exercisable |
1 |
| Marc Dunoyer | | | | | | | | | | | | | | | | | | | | |
| 2015 award | | | 544 | | | | 3307 | | | | 28.09.15 | | | | 01.12.18 | | | | 31.05.19 | |
| Total at 1 January 2016 | | | 544 | | | | | | | | | | | | | | | | | |
| Total at 31 December 2016 | | | 544 | | | | | | | | | | | | | | | | | |
| 1 | UK date convention applies. |
| | |
| AstraZenecaAnnual Report and Form 20-F Information 2016 | | 121 |
Corporate Governance
Remuneration Policy
This section sets out the Remuneration Policy (the Policy) proposed for approval by shareholders at the Company’s AGM in April 2017. Subject to shareholder approval, the Policy is intended to remain in effect for three years from the 2017 AGM. There are two substantive differences between the previous policy approved by shareholders in April 2014 and the proposed Policy: (i) the level of LTI vesting at threshold performance will be reduced from 25% to 20% of maximum; and (ii) no new awards will be made under the AZIP so, from 2017, LTI awards for Executive Directors will only be made under the PSP. For the outstanding AZIP awards that still have performance years to run in 2017, 2018 and 2019, a simplepro rata sliding scale will be used to assess performance against unchanged targets. In addition, the Policy has been drafted more concisely and is shorter than the previous policy.
Setting remuneration policy
The Remuneration Committee (the Committee) is responsible for setting overall remuneration policy and makes decisions about specific remuneration arrangements in the broader context of employee remuneration throughout the Group. Remuneration for all roles within the organisation is benchmarked against that for comparable roles in similar organisations and in the employee’s local market to ensure the Company is paying fairly at all levels. Executive Directors’ remuneration is benchmarked against a global pharmaceutical peer group and the FTSE30. Each year, the Company engages with employees, either on a Group-wide basis or in the context of smaller focus groups, to solicit feedback generally on a wide range of matters, including pay.
While the Committee does not consult employees when setting the Executive Directors’ remuneration policy, it does review Group remuneration data annually, including ratios of average pay to senior executive pay; bonus data; and gender and geographical data in relation to base salaries and variable compensation. Many employees are also shareholders in the Company and therefore have the opportunity to vote at the 2017 AGM on the Policy. In reviewing the base salaries of Executive Directors, the Committee considers the overall level of any salary increases being awarded to employees in the Executive Director’s local market in the relevant year.
In all aspects of its work, the Committee considers both the external environment in which the Company operates and the guidance issued by organisations representing institutional shareholders. It consults the Company’s major investors on general and specific remuneration matters and provides opportunities for representatives of those investors to meet the Chairman of the Committee and other Committee and Board members. It is the Company’s policy to seek input from major shareholders on anad hoc basis when significant changes to remuneration arrangements are proposed. The Company’s shareholders are encouraged to attend the AGM and any views expressed will be considered by Committee members. The Committee works with the Audit Committee to ensure that the Group’s remuneration policies and practices achieve the right balance between appropriate incentives to reward good performance, management of risk, and the pursuit of the Company’s business objectives.
Legacy arrangements
The Committee may approve remuneration payments and payments for loss of office on terms that differ to the terms in the Policy where the terms of the payment were agreed before the Policy came into effect or were agreed at a time when the relevant individual was not a Director of the Company (provided that, in the opinion of the Committee, the agreement was not entered into in consideration for the individual becoming a Director of the Company). This includes the exercise of any discretion available to the Committee in connection with such payments.
For these purposes, payments include the Committee satisfying awards of variable remuneration including share awards, in line with the terms agreed at the time the award was granted.
Minor amendments
The Committee may make minor amendments to the arrangements for Directors described in the Policy for regulatory, exchange control, tax or administrative purposes or to take account of a change in legislation.
| | |
| 122 | | AstraZenecaAnnual Report and Form 20-F Information 2016 |
|
Remuneration Policy for Executive Directors |
| | | | |
| Fixed elements of remuneration: base salary, benefits and pension |
| Base salary |
| Purpose and link to strategy | | Operation | | Maximum opportunity |
Base salary is intended to be sufficient to attract, retain and develop high-calibre individuals. | | Consideration is given to a number of factors, including (but not limited to): > recognition of the value of an individual’s personal performance and contribution to the business > the individual’s skills and experience > internal relativities > conditions in the relevant external market. Base salaries are normally reviewed annually with any change usually taking effect from 1 January. | | While there is no formal maximum, any increases in base salary will normally be in line with the percentage increases awarded to the employee population within the individual’s country location. Higher increases may be made if the Committee considers it appropriate, for example to reflect: > an increase in the scope and/or responsibility of the individual’s role; or > development of the individual within the role. |
| Benefits |
| Purpose and link to strategy | | Operation | | Maximum opportunity |
To provide market competitive benefits. Non-cash benefits are designed to be sufficient to attract, retain and develop high-calibre individuals. | | UK Executive Directors are provided with a fund, the value of which is based on a range of benefits including: > private medical insurance for partner and children > life assurance > permanent health insurance > company car > additional holidays > other additional benefits made available by the Company from time to time that the Committee considers appropriate based on the Executive Director’s circumstances. A Director may choose to take a proportion of, or the entire, fund as cash. Non-UK-based Executive Directors will receive a range of benefits (or a fund of equivalent value) comparable to those typically offered in their local market. Depending on local market practices they may be able to elect to take the fund as cash or elect to take one or more of these benefits and take the balance as cash. At its discretion the Committee may consider support towards the reasonable costs associated with relocation and/or provide an allowance towards the reasonable fees for professional services such as legal, tax, property and financial advice. The Company may also fund the cost of a driver and car for Executive Directors and any expenses deemed to be taxable which are reasonably incurred in the course of the Company’s business, together with any taxes thereon. The Company provides directors’ and officers’ liability insurance and an indemnity to the fullest extent permitted by law and the Company’s Articles. | | The maximum value of the benefits available will be equivalent to the cost to the Company of the suite of benefits available in the local market at the time. The value of the support towards the costs of relocation, professional fees and other costs will be the reasonable costs associated with the Executive Director’s particular circumstances. The maximum value of the directors’ and officers’ liability insurance and third party indemnity insurance is the cost at the relevant time. While the Committee has not set an overall level of benefit provision, the Committee keeps the benefit policy and benefit levels under review. |
| Pension |
| Purpose and link to strategy | | Operation | | Maximum opportunity |
Provision of retirement benefits to attract, retain and develop high-calibre individuals. | | For UK-based Executive Directors, the Company provides a pension allowance based on a percentage of base salary, which the Director may elect to pay into a pension scheme (or an equivalent arrangement) or take as cash. The Company will provide an amount benchmarked to the local market. Non-UK-based Executive Directors will receive an allowance for the purpose of providing retirement benefits in line with local market practice. A non-UK-based Executive Director may be offered the opportunity to elect to take some or all of the allowance as cash. | | The maximum pension allowance that may be provided to UK-based Executive Directors is 35% of base salary. For 2017, the CEO and CFO receive allowances of 30% and 24% of their base salaries respectively. The maximum value that may be provided to non-UK-based Executive Directors will be a sum in line with local market practice. |
| | |
| AstraZenecaAnnual Report and Form 20-F Information 2016 | | 123 |
Corporate Governance
Remuneration Policy for Executive Directorscontinued
| | | | |
| Variable elements of remuneration: annual bonus and long-term incentive |
| Annual bonus |
| Purpose and link to strategy | | Operation and framework used to assess performance | | Maximum opportunity |
The annual bonus rewards short-term (annual) performance against specific Group targets and individual objectives. The deferred share element of the annual bonus is designed to align Executive Directors’ interests with those of shareholders. | | Performance is measured over one year and the bonus, if awarded, is paid after the year end. Currently, two-thirds is delivered in cash and one-third is delivered in shares, which are deferred for three years under the deferred bonus plan. Stretching Group targets are set annually by the Committee based on the key strategic priorities for the year. Payout levels are determined by the Committee after the year end, based on performance against the targets as well as the Executive Director’s individual performance. The performance targets form a Group scorecard, which is closely aligned to the Company’s strategy, and are designed to reward scientific, commercial and financial success. In relation to each performance target, a threshold level of performance is specified. If performance falls below this level there will be no payout for that proportion of the award. The Committee may use its discretion to ensure that a fair and balanced outcome is achieved, taking into account the overall performance of the Company and the experience of shareholders. On vesting of the deferred shares, the cash value equivalent to the dividends that would have been paid during the deferral period will be paid to the Director. For bonuses awarded in respect of 2015 and subsequent years, the Committee has discretion, for up to six years from the payment date, to claw-back from individuals some or all of the cash bonus award in certain circumstances including: (i) material restatement of the results of the Group, (ii) significant reputational damage to the Group, or (iii) serious misconduct by the individual. However, in the case of (i) and (ii) the Committee may only exercise its discretion for up to two years from the payment date. For deferred shares relating to bonuses awarded in respect of 2015 and subsequent years, the Committee has discretion: > to reduce or cancel any portion of an unvested deferred bonus share award in certain circumstances (malus), including (i) material restatement of the results of the Group, (ii) significant reputational damage to the Group, or (iii) serious misconduct by the individual > for up to six years from the vesting date, to claw-back from individuals some or all of the deferred bonus share award in certain circumstances, including (i) material restatement of the results of the Group, (ii) significant reputational damage to the Group, or (iii) serious misconduct by the individual. However, in the case of (i) and (ii) the Committee may only exercise its discretion for up to two years from the vesting date. | | The maximum annual bonus amount that can be awarded is 250% of base salary. If the Committee believed it to be in the interests of shareholders to award an annual bonus of an amount exceeding the historical maximum opportunity of 180% of base salary in the case of the CEO and 150% of base salary in the case of the CFO it would consult major shareholders in advance. |
| | |
| 124 | | AstraZenecaAnnual Report and Form 20-F Information 2016 |
| | | | |
| Long-term incentive (LTI) |
| Performance Share Plan (PSP) |
| Purpose and link to strategy | | Operation and framework used to assess performance | | Maximum opportunity |
The PSP is designed to align the variable pay of Executive Directors with the successful execution of the Company’s strategy. | | The PSP provides for the grant of awards over Ordinary Shares or ADSs. Vesting is dependent on the achievement of stretching performance targets and continued employment, as further described in the Treatment of LTI and deferred bonus plan awards on cessation of employment section on page 131. | | The maximum market value of shares that may be awarded under the PSP in any year is equivalent to 500% of the participant’s annual base salary at the date of grant. |
| | Performance targets are set by the Committee at the beginning of the relevant performance period. They are closely aligned to the Company’s strategy and are designed to reward scientific, commercial and financial success. Performance is currently assessed against a combination of five measures: TSR; cash flow; reported EBITDA; sales of medicines in key therapy areas and territories; and innovation metrics. If the Committee was to propose any material changes to the PSP performance targets, it would consult major shareholders in advance. | | |
| | |
| | When setting performance targets, the Committee allocates such weightings to the targets as it considers appropriate, taking into account strategic priorities. The intention of the Committee is to exercise appropriate judgement, in particular so that the experience of shareholders over time is taken into account. | | |
| | |
| | Performance is assessed over the three-year period commencing on 1 January in the year of grant. Shares are then subject to a two-year holding period following the performance period, so full vesting takes place on the fifth anniversary of grant. During the holding period, no further performance measures apply. | | |
| | |
| | Payout under the PSP can range from 0% to 100% of the original award. All PSP performance targets have a payout curve. Each payout curve is structured to suit the objective it is intended to measure and the relationship between threshold, target and out-performance is determined at grant. | | |
| | |
| | Typically, 20% of the proportion of a PSP award linked to a performance target will vest on the achievement of threshold level of performance and 100% will vest if the target level of performance is achieved. For relative measures (such as relative TSR) the threshold level of performance associated with a target will be performance at or above median. The maximum level of performance will usually be set as achievement of performance at the upper quartile level. Where the performance target permits, there will be further vesting points between threshold and maximum vesting levels, with vesting typically taking place on a straight-line basis. | | |
| | |
| | The Committee may (acting fairly and reasonably) adjust or waive a performance target if an event occurs that causes it to believe that the performance target is no longer appropriate. | | |
| | |
| | On vesting, the cash value equivalent to the dividends that would have been paid on the vesting shares during the performance and holding periods will be paid to the Director. | | |
| | |
| | For awards granted in 2015 and for subsequent years, the Committee has discretion: | | |
| | |
| | > to reduce or cancel any portion of an unvested award in certain circumstances (malus), including (i) material restatement of the results of the Group, (ii) significant reputational damage to the Group, or (iii) serious misconduct by the individual | | |
| | | > for up to six years from the third anniversary of the date of grant, to claw-back from individuals some or all of the award in certain circumstances, including (i) material restatement of the results of the Group, (ii) significant reputational damage to the Group, or (iii) serious misconduct by the individual. However, in the case of (i) and (ii) the Committee may only exercise its discretion for up to two years from the third anniversary of the date of grant. | | |
| | |
| AstraZenecaAnnual Report and Form 20-F Information 2016 | | 125 |
Corporate Governance
Remuneration Policy for Executive Directorscontinued
| | | | |
| Restricted shares |
| Purpose and link to strategy | | Operation and framework used to assess performance | | Maximum opportunity |
In certain circumstances, typically as part of recruitment arrangements, an Executive Director may be made awards of restricted shares. This would ordinarily be to compensate for loss of remuneration opportunities suffered on leaving previous employment. | | There are ordinarily no performance measures attached to awards of restricted shares because they are awarded for the purpose of compensating newly recruited Executive Directors for loss of entitlements on leaving a previous employment. However, the Committee considers whether the lost incentives were subject to performance targets and their probability of vesting. If foregone awards were subject to performance testing, then the compensatory AstraZeneca award is normally granted under the PSP in order to align the performance targets attaching to the award to successful execution of the Company’s strategy. Restricted share awards are generally used only when the foregone compensation was not subject to performance testing. The Committee may divide an award of restricted shares into tranches which vest at different points and may apply performance measures bespoke to the individual if it considers it appropriate. If it decides to attach performance conditions, the performance conditions and performance period are defined at grant. If no performance targets are attached to a restricted share award, it will vest in full if the individual remains in office on the vesting date. On vesting, the cash value equivalent to the dividends that would have been paid during the vesting period will be paid to the Director. There are no contractual provisions for claw-back ormalus of restricted share awards. | | There is no maximum value of an award which may be granted. The Committee sets the value of the award at grant, as it considers appropriate in all the circumstances. |
|
| UK employee share plans |
| Share Incentive Plan (SIP) |
| Purpose and link to strategy | | Operation | | Maximum opportunity |
Encouraging employee share ownership | | The Company operates an HM Revenue & Customs (HMRC)-approved SIP whereby UK employees, including Executive Directors, may elect to save a regular amount to be used to purchase shares. The Company currently grants one matching share in respect of every four shares purchased by the participant. | | Participants may contribute up to £150 per month from pre-tax pay or such other maximum amount as determined by the Company within the parameters of applicable legislation. |
| Save As You Earn Share Option Scheme (SAYE) |
| Purpose and link to strategy | | Operation | | Maximum opportunity |
Encouraging employee share ownership | | The Company operates an HMRC-approved SAYE whereby UK employees, including Executive Directors, may save a regular amount over three or five years and are granted options to purchase shares at the end of the saving period. A maximum discount of 20% to the market price prevailing at the date of the commencement of the scheme applies to the option price. | | Participants may save up to £500 per month from post-tax pay or such other maximum amount as determined by the Company within the parameters of applicable legislation. |
| | |
| 126 | | AstraZenecaAnnual Report and Form 20-F Information 2016 |
Historical LTI: AstraZeneca Investment Plan (AZIP)
No further awards will be made under the AZIP.
There are three extant AZIP awards which were granted to the Executive Directors in 2014, 2015 and 2016. Vesting of these awards is dependent on the achievement of two performance targets measured over a four-year performance period commencing on 1 January in the year of grant. Shares are subject to a four-year holding period following the performance period, so vesting takes place on the eighth anniversary of the start of the performance period. During the holding period, no further performance measures apply. Payout of the award is subject to continued employment as further described in the Treatment of LTI and deferred bonus plan awards on cessation of employment section on page 131. The performance targets are dividend level and dividend cover. If both targets are achieved in each year of the performance period, the award will vest in full at the end of the holding period. Twenty five percent of an award will lapse for each year in which neither or only one target is achieved.
On vesting, the cash value equivalent to the dividends that would have been paid on the vesting shares during the performance and holding periods will be paid to the Director.
The Committee may (acting fairly and reasonably) adjust or waive a performance target if an event occurs that causes it to believe that the performance target is no longer appropriate.
The Committee has discretion:
| > | to reduce or cancel any portion of an unvested award in certain circumstances (malus), including (i) material restatement of the results of the Group, (ii) significant reputational damage to the Group, or (iii) serious misconduct by the individual |
| > | for up to six years from the end of the performance period, to claw-back from individuals some or all of the award in certain circumstances, including (i) in the case of material restatement of the results of the Group, (ii) significant reputational damage to the Group, or (iii) serious misconduct by the individual. However, in the case of (i) and (ii) the Committee may only exercise its discretion for up to two years from the end of the performance period. |
Differences in remuneration policy for other employees
The Company’s approach to determining and reviewing the salaries of the Executive Directors and the employee population as a whole is the same. On an annual basis the salaries for individual roles are reviewed in the context of individual sustained performance and the external market. AstraZeneca participates in annual global compensation surveys, which provide benchmarking data for all roles within the organisation, ensuring a robust salary review process for all employees. The Company seeks to provide an appropriate range of competitive benefits, including pension, to all employees (including Executive Directors) in the context of their local market.
Employees at mid to senior levels globally are eligible for LTI awards in the form of the PSP and/or restricted stock units. The occupants of approximately 700 senior roles in the Company are currently eligible for PSP awards – these are the leaders who have the ability to directly influence the execution of the Company’s strategic goals. An LTI award may be used for the same purpose as described above on the recruitment of employees (other than Directors) or for the retention of employees.
| | |
| AstraZenecaAnnual Report and Form 20-F Information 2016 | | 127 |
Corporate Governance
Remuneration Policy for Executive Directorscontinued
Remuneration scenarios for Executive Directors
The charts below illustrate how much the current Executive Directors could receive under different performance scenarios in 2017, assuming a constant share price. In order to compile the charts, the following assumptions have been made:
| | |
Minimum remuneration | | > base salary is that applicable in 2017 > taxable benefits are those included in the Executive Directors’ single total figure remuneration table for 2016 as set out on page 107 > pension of 30% of base salary for the CEO and 24% of base salary for the CFO. |
| | | | | | | | | | | | | | | | |
| | | Base salary £’000 | | | Taxable benefits £’000 | | | Pension £’000 | | | Total £’000 | |
| Pascal Soriot | | | 1,220 | | | | 121 | | | | 366 | | | | 1,707 | |
| Marc Dunoyer | | | 725 | | | | 71 | | | | 174 | | | | 970 | |
| | |
Remuneration for performance in line with the Company’s expectations | | > annual bonus payout equivalent to 100% of base salary for the CEO and 90% for the CFO > LTI share award vesting at 250% of base salary for the CEO and 200% of base salary for the CFO (representing 50% of the value of the PSP award). |
Maximum remuneration | | > annual bonus payout equivalent to 180% of base salary for the CEO and 150% for the CFO > LTI share award vesting at 500% of base salary for the CEO and 400% for the CFO (representing 100% of the value of the PSP award). |
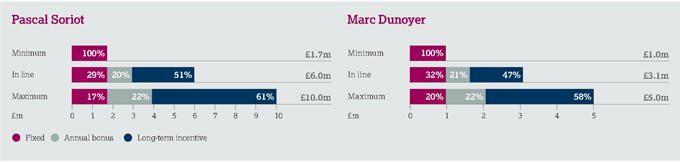
Approach to recruitment remuneration for Executive Directors
On the recruitment of a new Executive Director, the Committee seeks to pay no more than is necessary to attract and retain the best candidate available, aiming to put in place a remuneration package broadly in line with the arrangements of the relevant incumbent. In order to offer a competitive package to attract the most suitable candidate, the Committee may consider providing remuneration arrangements that exceed those of the existing Executive Directors and may agree to pay allowances to expatriates in line with the Company’s international assignment policy to provide support towards housing, schooling and other relocation or assignment related costs. The Committee will offer a remuneration package that it considers appropriate in the particular circumstances of the recruitment, giving due regard to the interests of the Company’s shareholders and taking into account factors such as typical market practice, existing arrangements for the other Executive Directors, internal relativities and market positioning.
The pharmaceutical industry is global and future Executive Directors might be recruited from organisations with pay structures and practices that differ from AstraZeneca’s usual remuneration policy. The Committee believes that it is in the interests of shareholders for it to retain an element of flexibility in its approach to recruitment to enable it to attract the best candidates; however, this flexibility is limited. The Committee may find it necessary to compensate a new recruit for forfeiture of entitlements as a consequence of the recruit leaving his or her previous employment to join AstraZeneca. Where such compensation is offered to a new recruit on his or her hire, the Committee will explain the rationale to shareholders in a timely manner and will provide details of the arrangement. The value of such compensation will depend upon the circumstances of the recruitment and the individual in question. The Committee will seek to offer a package weighted towards equity in the Company; however, the precise nature of the compensation arrangement will depend on the type of entitlement being forfeited, which the Committee will generally seek to compensate in kind. The arrangement might therefore comprise cash and/or restricted shares and/or an LTI award. The Committee will obtain and take into account independent valuations of the forfeited entitlements to determine the appropriate level of compensation. All other aspects of a new recruit’s compensation opportunity will be subject to the maxima stated in the Policy. The Committee’s intention is to use buyout awards for this compensatory purpose only.
A new recruit may be granted shares under an LTI plan within the Policy or under a plan specific to that individual, as permitted under the Financial Conduct Authority’s Listing Rules. Vesting of such awards may be subject to the achievement of performance conditions. The precise targets and measures will depend on the objectives of the Company and the individual at the time of the recruitment and will be determined by the Committee.
| | |
| 128 | | AstraZenecaAnnual Report and Form 20-F Information 2016 |
Ongoing annual variable remuneration will not exceed an award which comprises up to 250% of base salary under the annual bonus, and up to 500% of base salary under the PSP. If the Committee ever felt that it would be in the interests of shareholders to grant annual variable awards to a new Executive Director with values exceeding the historical maximum of 680% of base salary (comprising up to 180% under the annual bonus and up to 500% in aggregate under the LTI), it would consult major shareholders in advance.
In the case of Group employees who are promoted internally to the position of Executive Director, the Committee intends to honour all remuneration arrangements entered into before the promotion.
The Company may reimburse the costs of financial planning and tax advice.
Service contracts for Executive Directors
Save as noted below, it is not intended that service contracts for new Executive Directors will contain terms that are materially different from those summarised below or contained in the Policy set out in this Remuneration Policy Report. The contractual obligations below are applicable to each of the current Executive Directors unless stated otherwise.
| | |
Notice period | | The Company may terminate employment by giving not less than 12 months’ written notice. The Company may agree on appointment that any notice given by the Company will not expire prior to the second anniversary of the commencement date of the Executive Director’s appointment. |
| |
| | Executive Directors may terminate their employment on 12 months’ written notice. |
Payments in lieu of notice | | The Company may terminate an Executive Director’s contract at any time with immediate effect and pay a sum in lieu of notice. This sum will consist of (i) the base salary that they would have been entitled to receive during the notice period and (ii) the cost to the Company of funding the flexible benefit arrangements for this period, including the Company’s contribution in respect of pension. |
Garden leave | | The Company has the right to place the Executive Director on ‘garden leave’. |
Summary termination | | The Company may terminate employment summarily in particular defined circumstances such as gross misconduct, with no further payment. |
Payments in lieu of holiday | | If, on termination, the Executive Director has exceeded their accrued holiday entitlement, the value of this excess may be deducted by the Company from any sums payable. If the Executive Director has unused holiday entitlement, the Committee has discretion to require the Executive Director to take such unused holiday during any notice period, or make a payment in lieu of it calculated in the same way as the value of any excess holiday. |
Directors’ and officers’ liability insurance | | Directors’ and officers’ liability insurance and an indemnity to the fullest extent permitted by law and the Company’s Articles is provided for the duration of an Executive Director’s employment and for a minimum of five years following termination. |
Deemed treatment under AZIP | | In respect of awards made to compensate Mr Soriot for loss of remuneration opportunity at his previous employer, if Mr Soriot gives notice of termination of his employment after the end of the performance period under the AZIP but before the end of the holding period, the award under the AZIP will vest on the earlier of the end of the holding period and the end of the period of 24 months from the date of cessation of employment, unless the Committee determines otherwise. |
| | |
| AstraZenecaAnnual Report and Form 20-F Information 2016 | | 129 |
Corporate Governance
Remuneration Policy for Executive Directorscontinued
Principles of payment for loss of office for Executive Directors
The Company does not make additional payments for loss of office, other than, as appropriate, payments in lieu of notice as described on the previous page or payments in respect of damages if the Company terminates an Executive Director’s service contract in breach of contract (taking into account, as appropriate, the Director’s ability to mitigate his loss). The Committee has discretion to award payments in certain circumstances, as set out below, depending on the nature of the termination and the Executive Director’s performance. The LTI plans are governed by plan rules, which define how individual awards under those plans should be treated upon termination of employment and corporate activity including sale of a business outside the Group. The treatment of awards in these circumstances may also be subject to Committee discretion. Generally, awards under LTI plans will only be allowed to vest for those Executive Directors who leave the Company by mutual agreement, for example in circumstances of ill-health, injury, disability, redundancy or retirement, or where employment terminates by reason of the Executive Director’s death (see the table opposite for further information). In addition to any payment in lieu of notice, the individual components of remuneration and other payments which may be payable on loss of office are set out below, subject to the terms of any applicable bonus rules or share plan rules.
At the discretion of the Committee, an Executive Director may receive a bonus for the performance year in which they leave the Company. Typically this sum will reflect an on-target bonus pro-rated for the part of the year in which they worked. This will depend on the circumstances, including an assessment of the Executive Director’s performance in the relevant period and the circumstances of their departure and may be in such proportion of cash and/or shares as the Committee will determine. The deferred share element of previous bonuses granted, and any deferred share element of the bonus awarded in respect of the departing year, may still vest for the benefit of the departing Executive Director at the end of the period of deferral despite the fact that the Executive Director did not work for the entirety of this period. The Committee has the discretion to accelerate and/or retain the deferral period and allow shares to vest for the benefit of the Executive Director on their departure and/or in accordance with the vesting schedule as the case may be. The Committee will decide whether it is appropriate in the circumstances for these shares to vest for the benefit of the departing Executive Director.
The LTI plan rules envisage circumstances under which some, all or none of the shares held under LTI plans will vest in connection with departure. The exact timing and number of shares vesting will depend on the circumstances, including the reason for leaving (as set out in the table opposite) and may be subject to Committee discretion, depending on what it considers to be fair and reasonable in the circumstances.
The treatment on termination will depend upon the terms of the individual Executive Director’s awards on recruitment. The Committee has discretion to determine the treatment at the time of departure based on what it considers to be fair and reasonable in the circumstances.
| > | Non-statutory redundancy payment |
Executive Directors are not entitled to non-statutory redundancy payments.
| > | Pension contributions and other benefits |
Pension contributions and other benefits for Executive Directors will be payable up to the termination date or as part of a payment in lieu of notice as described on page 129.
| > | Payments in relation to statutory rights |
The amount considered reasonable to pay by the Committee in respect of statutory rights may be included in the overall termination payment.
| > | Payments required by law |
The Committee reserves the right to make any other payments in connection with an Executive Director’s cessation of office or employment where the payments are made in good faith in discharge of an existing legal obligation (or by way of damages for breach of such an obligation) or by way of settlement of any claim arising in connection with the cessation of an Executive Director’s office or employment. Any such payments may include but are not limited to paying any fees for outplacement assistance and/or an Executive Director’s legal and/or professional advice fees in connection with their cessation of office or employment.
The departing Executive Director will be required to mitigate their loss by using reasonable efforts to secure new employment.
The Company may pay an amount considered reasonable by the Committee in respect of fees for legal and tax advice, and outplacement support for the departing Executive Director.
| | |
| 130 | | AstraZenecaAnnual Report and Form 20-F Information 2016 |
Treatment of LTI and deferred bonus plan awards on cessation of employment
| | | | |
| Plan | | Termination by mutual agreement (broadly in circumstances of ill-health, injury, disability, redundancy or retirement and in the case of death and certain corporate events eg sale of a business outside the Group) | | Other leaver scenarios |
Deferred bonus plan (Annual bonus) | | Awards will vest at the end of the relevant deferral period, unless the Committee decides otherwise. | | Ordinarily awards will lapse unless the Committee exercises its discretion to apply the treatment for leavers by mutual agreement. |
| PSP | | Where cessation of employment occurs within three years of the date of grant awards will vest,pro rata to the time elapsed between the date of grant of the award and the date of cessation of employment, at the end of the performance period after performance has been assessed, to the extent that the performance target(s) measured over the performance period has been met. However, the Committee has discretion to permit the award to vest immediately on cessation of employment where that cessation occurred as a result of one of the events mentioned above to the extent that the performance target(s) has, in the opinion of the Committee, been satisfied from the date of grant to the date of cessation of employment. However, if the Committee believes that exceptional circumstances warrant this, it may exercise its discretion to vest the award on another basis. Where cessation of employment occurs during any holding period the award will vest in respect of all the shares that continue to be subject to the award as soon as practicable following the cessation of employment. However, the Committee has discretion to require the award to vest only at the end of the holding period. | | Other than during a holding period, ordinarily awards will lapse unless the Committee exercises its discretion to preserve all or part of an award and apply the default treatment for leavers by mutual agreement as described in this table. This discretion will not be exercised in the case of dismissal for gross misconduct. |
| AZIP | | Death, ill-health, injury or disability: > in the performance period: the award will vest as soon as practicable following the cessation of employment, pro-rated to take into account the period elapsed between the date of grant and the date of cessation of employment relative to the performance period and pro-rated to take into account the satisfaction of any performance measure(s), as agreed by the Committee > in the holding period: the award will vest in respect of all the shares that continue to be subject to the award as soon as practicable following the cessation of employment. Redundancy, retirement or certain corporate events (eg sale of a business outside the Group): > in the performance period: the award will vest at the later of the end of the performance period and the end of the period of 24 months from the date of cessation of employment, to the extent any performance measures have been met by the end of the performance period and pro-rated to take into account the period elapsed between the date of grant and the date of cessation of employment relative to the performance period > in the holding period: the award will vest in respect of all shares that continue to be subject to the award at the earlier of the end of the holding period and the end of the period of 24 months from the date of cessation of employment. Where the Committee terminates an Executive Director’s employment (other than for gross misconduct) during the holding period, the awards will vest on the same basis. In each case described above, the Committee has discretion to vest the award or part of the award on a different basis. | | Ordinarily awards will lapse unless the Committee exercises its discretion to apply the default treatment for leavers by reason of redundancy or retirement described in this table. |
| Restricted shares | | Awards will lapse unless the Committee exercises its discretion to preserve all or part of an award. In relation to awards granted on or after 3 February 2014 and, where that award was granted at the time of the Executive Director’s recruitment to the Company in compensation for any awards or bonuses forfeited at his previous employer, the award will vest on the date his employment ceases, pro-rated to take into account the period elapsed between the date of grant and the date of cessation of employment, unless the Committee decides not to pro-rate or to pro-rate on some other basis. | | Ordinarily awards will lapse unless the Committee exercises its discretion to preserve all or part of an award. |
| | |
| AstraZenecaAnnual Report and Form 20-F Information 2016 | | 131 |
Corporate Governance
Remuneration Policy for Non-Executive Directors
Non-Executive Directors, including the Chairman, receive annual Board fees. With the exception of the Chairman, Non-Executive Directors receive additional fees for membership and chairmanship of Board Committees and for holding the position of Senior independent Non-Executive Director. Non-Executive Directors are not eligible for performance-related bonuses or the grant of share awards or options. No pension contributions are made on their behalf. The annual Board fees applicable to Non-Executive Directors are set out in the Annual Report on Remuneration. Changes to these fees in future years will be set out in the corresponding year’s Annual Report. The remuneration of Non-Executive Directors (excluding the Chairman) is determined by the Chairman and the Executive Directors. The remuneration of the Chairman is determined by the other members of the Committee and the Senior independent Non-Executive Director.
| | | | |
| Annual Board fees | | |
| Purpose and link to strategy | | Operation | | Maximum opportunity |
The annual fees are intended to be sufficient to attract, retain and develop high-calibre individuals. | | Board fees for Non-Executive Directors are subject to periodic review and may be increased in the future to ensure that they remain sufficient to attract high-calibre individuals while remaining fair and proportionate. Although Non-Executive Directors currently receive their fees in cash, the Company may pay part or all of their fees in the form of shares. Non-Executive Directors are eligible to receive a base fee and additional fees where appropriate to reflect any additional time commitment or duties (eg being the chairman of a committee). The fee structure is set out in the Annual Report on Remuneration. | | Under Articles 89 and 90 of the Company’s Articles, as approved by the Company’s shareholders, the ordinary remuneration of the Non-Executive Directors for their services shall not exceed in aggregate £2,250,000 per annum and any Non-Executive Director who serves on any Board committee may be paid such extra remuneration as the Board may determine. |
| Benefits | | |
| Purpose and link to strategy | | Operation | | Maximum opportunity |
Intended to attract and retain high-calibre individuals. | | The Company also provides directors’ and officers’ liability insurance and an indemnity to the fullest extent permitted by law and the Company’s Articles and may also reimburse the costs of financial planning and tax advice. | | The maximum amount payable in respect of these costs and cost of insurance will be the reimbursement of the Directors’ benefits grossed up for any tax payable by the individual. |
| Other costs and expenses | | |
| Purpose and link to strategy | | Operation | | Maximum opportunity |
Intended to reimburse individuals for legitimately incurred costs and expenses. | | In addition to the Chairman’s fee, a proportion of the office costs of the Chairman are reimbursed. In 2016, this amounted to £36,000. The amount of office costs to be reimbursed each year will be determined at the discretion of the Committee, based on an assessment of the reasonable requirements of the Chairman. The Committee has the discretion to approve contributions by the Company to office costs of other Non-Executive Directors in circumstances where such payments are deemed proportionate and reasonable. The Company will pay for all travel (including travel to the Company’s offices), hotel and other expenses reasonably incurred by Non-Executive Directors in the course of the Company’s business, for example, professional fees such as secretarial support, and reimbursement for domestic security arrangements such as lights and alarms following a security assessment. There are no contractual provisions for claw-back ormalus of other costs and expenses. | | The maximum amounts payable in respect of these costs and expenses will be the reimbursement of the Directors’ costs and expenses grossed up for any tax payable by the individual. |
Letters of appointment
None of the Non-Executive Directors has a service contract but each has a letter of appointment. In accordance with the Company’s Articles, following their appointment all Directors must retire at each AGM and may present themselves for re-election. The Company is mindful of the director independence provisions of the UK Corporate Governance Code and, in this regard, a Non-Executive Director’s overall tenure will not normally exceed nine years. The Chairman may terminate his appointment at any time, on three months’ notice. None of the other Non-Executive Directors have a notice period or any provision in their letters of appointment giving them a right to compensation upon early termination of appointment.
On behalf of the Board
A C N Kemp
Company Secretary
2 February 2017
| | |
| 132 | | AstraZenecaAnnual Report and Form 20-F Information 2016 |
Preparation of the Financial Statements
and Directors’ Responsibilities
The Directors are responsible for preparing this Annual Report and Form 20-F Information and the Group and Parent Company Financial Statements in accordance with applicable law and regulations.
Company law requires the Directors to prepare Group and Parent Company Financial Statements for each financial year. Under that law they are required to prepare the Group Financial Statements in accordance with IFRSs as adopted by the EU and applicable law and have elected to prepare the Parent Company Financial Statements in accordance with UK Accounting Standards, including FRS 101 ‘Reduced Disclosure Framework’ and applicable law.
Under company law, the Directors must not approve the Financial Statements unless they are satisfied that they give a true and fair view of the state of affairs of the Group and Parent Company and of their profit or loss for that period. In preparing each of the Group and Parent Company Financial Statements, the Directors are required to:
| > | select suitable accounting policies and then apply them consistently |
| > | make judgements and estimates that are reasonable and prudent |
| > | for the Group Financial Statements, state whether they have been prepared in accordance with IFRSs as adopted by the EU |
| > | for the Parent Company Financial Statements, state whether FRS 101 has been followed, subject to any material departures disclosed and explained in the Parent Company Financial Statements |
| > | prepare the Financial Statements on the going concern basis unless it is inappropriate to presume that the Group and the Parent Company will continue in business. |
The Directors are responsible for keeping adequate accounting records that are sufficient to show and explain the Parent Company’s transactions and disclose with reasonable accuracy at any time the financial position of the Parent Company and enable them to ensure that its Financial Statements comply with the Companies Act 2006. They have general responsibility for taking such steps as are reasonably open to them to safeguard the assets of the Group and to prevent and detect fraud and other irregularities.
Under applicable law and regulations, the Directors are also responsible for preparing a Directors’ Report, Strategic Report, Directors’ Remuneration Report, Corporate Governance Report and Audit Committee Report that comply with that law and those regulations.
The Directors are responsible for the maintenance and integrity of the corporate and financial information included on our website. Legislation in the UK governing the preparation and dissemination of Financial Statements may differ from legislation in other jurisdictions.
Directors’ responsibility statement pursuant to DTR 4
The Directors confirm that to the best of our knowledge:
| > | The Financial Statements, prepared in accordance with the applicable set of accounting standards, give a true and fair view of the assets, liabilities, financial position and profit or loss of the Company and the undertakings included in the consolidation taken as a whole. |
| > | The Directors’ Report includes a fair review of the development and performance of the business and the position of the issuer and the undertakings included in the consolidation taken as a whole, together with a description of the principal risks and uncertainties that they face. |
On behalf of the Board of Directors on 2 February 2017
Pascal Soriot
Director
Directors’ Responsibilities for, and Report on,
Internal Control over Financial Reporting
The Directors are responsible for establishing and maintaining adequate internal control over financial reporting. AstraZeneca’s internal control over financial reporting is designed to provide reasonable assurance over the reliability of financial reporting and the preparation of consolidated Financial Statements in accordance with generally accepted accounting principles.
Due to its inherent limitations, internal control over financial reporting may not prevent or
detect misstatements. Projections of any evaluation of effectiveness to future periods are subject to the risks that controls may become inadequate because of changes in conditions or that the degree of compliance with the policies or procedures may deteriorate.
The Directors assessed the effectiveness of AstraZeneca’s internal control over financial reporting as at 31 December 2016 based on the criteria set forth by the Committee of Sponsoring Organizations of the Treadway
Commission in Internal Control-Integrated Framework (2013). Based on this assessment, the Directors believe that, as at 31 December 2016, the internal control over financial reporting is effective based on those criteria.
KPMG LLP, an independent registered public accounting firm, has audited the effectiveness of internal control over financial reporting as at 31 December 2016 and, as explained on page 134, has issued an unqualified report thereon.

| | |
| AstraZenecaAnnual Report and Form 20-F Information 2016 | | 133 |
Financial Statements
Auditor’s Reports on the Financial Statements
and on Internal Control over Financial Reporting
(Sarbanes-Oxley Act Section 404)
The report set out below is provided in compliance with International Standards on Auditing (UK and Ireland). KPMG LLP has also issued reports in accordance with standards of the Public Company Accounting Oversight Board in the US, which will be included in the Annual Report on Form 20-F to be filed with
the US Securities and Exchange Commission. Those reports are unqualified and include opinions on the Group Financial Statements and on the effectiveness of internal control over financial reporting as at 31 December 2016 (Sarbanes-Oxley Act Section 404). The Directors’ statement on internal control
over financial reporting is set out on page 133. KPMG LLP has also reported separately on the Company Financial Statements of AstraZeneca PLC and on the information in the Directors’ Remuneration Report that is described as having been audited. This audit report is set out on page 197.
Independent Auditor’s Report to the
Members of AstraZeneca PLC only
Opinions and conclusions arising from our audit
| 1 | Our opinion on the Group Financial Statements is unmodified |
We have audited the Group Financial Statements of AstraZeneca PLC for the year ended 31 December 2016 set out on pages 138 to 196. In our opinion the Group Financial Statements:
| > | give a true and fair view of the state of the Group’s affairs as at 31 December 2016 and of its profit for the year then ended; |
| > | have been properly prepared in accordance with International Financial Reporting Standards (IFRSs) as adopted by the European Union (EU); and |
| > | have been prepared in accordance with the requirements of the Companies Act 2006 and Article 4 of the IAS Regulation. |
| 2 | Separate opinion in relation to IFRSs as issued by the International Accounting Standards Board (IASB) |
As explained in the Group accounting policies section of the Group Financial Statements set out on pages 142 to 146, the Group, in addition to complying with its legal obligation to apply IFRSs as adopted by the EU, has also applied IFRSs as issued by the IASB.
In our opinion, the Group Financial Statements comply with IFRSs as issued by the IASB.
| 3 | Our assessment of risks of material misstatement |
We summarise below the risks of material misstatement that had the greatest effect on our audit (in decreasing order of audit significance), our key audit procedures to address those risks and our findings from those procedures in order that the Company’s members as a body may better understand the process by which we arrived at our audit opinion. Our findings
are based on procedures undertaken in the context of and solely for the purpose of our statutory audit opinion on the Group Financial Statements as a whole and consequently are incidental to that opinion, and we do not express discrete opinions on separate elements of the Group Financial Statements.
Rebates and chargebacks in the US
($2,812m) (2015: $3,307m) Risk vs 2015: tu
Refer to page 98 (Audit Committee Report), page 142 (accounting policy) and page 77 (financial risk management).
The risk
The Group makes sales to customers in the United States of America (‘US’) that fall under certain commercial and governmental reimbursement schemes, of which the most significant are Medicaid and Medicare. The resulting rebates and chargebacks, which are deducted in arriving at revenue, are complex and require significant judgement and estimation in establishing an appropriate accrual at year-end.
Our response
Our principal audit procedures included testing the Group’s controls surrounding the deductions made to US revenue for rebates and chargebacks, and key manual and systems-based controls in the order-to-cash transaction cycle. Our audit work involved testing key controls including reconciliations between sales systems and the general ledger and those over claims, credits and system accrual rates. We also assessed the accuracy of the calculation of the accrual, corroborated inputs and key assumptions, both to internal and independent sources including sales contracts with customers, performed an analysis of the accrual balance and deductions to sales year on year, corroborating movements
compared with expectations and payment claims, and considered the historical accuracy of the accrual. We also assessed the adequacy of the Group’s disclosure of its rebates and chargebacks policy, the judgement involved, and other related disclosures.
Our findings
In determining the appropriateness of the deductions made in relation to US rebates and chargebacks, there is room for judgement and we found that within that, the assumptions used and the resulting estimates were balanced (2015: balanced). We also found no errors in the year-end US rebate accrual calculations. We found the disclosures on US rebates and chargebacks to be ample (2015: proportionate).
Carrying value of intangible assets
($27,586m) (2015: $22,646m) Risk vs 2015: tu
Refer to page 98 (Audit Committee Report), page 145 (accounting policy), page 157 (financial disclosures) and page 80 (financial risk management).
The risk
The Group has significant intangible assets arising from the acquisition of products both launched and in development. Recoverability of these assets is based on forecasting and discounting future cash flows, which are inherently highly judgemental. For products in development, the main risk is achieving successful trial results and obtaining required clinical and regulatory approvals. For launched products, the key risk is the ability to successfully commercialise the individual product concerned.
| | |
| 134 | | AstraZenecaAnnual Report and Form 20-F Information 2016 |
Our response
Our principal audit procedures included testing the Group’s controls surrounding intangible asset impairments and evaluating the Group’s assumptions used in assessing the recoverability of intangible assets, in particular, revenue and cash flow projections and the probability of obtaining regulatory approval for in-development assets. We also performed sensitivity analysis over individual intangible asset models, where we considered there to be a higher risk of impairment, to assess the level of sensitivity to key assumptions and focus our work in those areas. Our procedures for products in development included assessing the reasonableness of the Group’s assumptions regarding probability of obtaining regulatory approval through consideration of the current phase of development and comparison to industry practice. We also interviewed a range of key research, development, and commercial personnel to corroborate these assumptions. For both launched and in-development products we challenged management’s key assumptions regarding the size of the therapeutic area market and the product’s projected share of this market through both discussion with a range of commercial personnel and comparison to external scientific literature and market research. Our procedures also included challenging internally generated evidence by reviewing analyst forecasts, and retrospective assessment of the accuracy of the Group’s projections. We also assessed the adequacy of related disclosures in the Group’s financial statements.
Our findings
We found the Group’s assumptions and the resulting estimates to be balanced (2015: balanced). We found that the disclosures proportionately (2015: proportionately) describe the inherent degree of subjectivity in the estimates and the potential impact on future periods of revisions to these estimates.
Acquisition of Acerta Pharma (Intangible asset – $7,307m; option liability – $1,901m) (2015: n/a) (New risk)
Refer to page 143 (accounting policy), page 173 (financial disclosures) and page 79 (financial risk management).
The risk
In February 2016, the Group completed the acquisition of 55% of Acerta Pharma. The acquisition agreement included a mechanism providing Acerta shareholders the option to sell, and the Group the option to buy, the outstanding 45% of shares in Acerta. There is significant judgement involved in selecting the underlying assumptions used to value both the acalabrutinib asset in development and the option liability identified and recognised on acquisition. The assumptions with the greatest impact on
the valuations are the discount rate and probability that acalabrutinib obtains approval in the US and Europe.
Our response
Our principal audit procedures included testing the Group’s controls surrounding the selection and review of significant assumptions within the forecast cash flows used for the valuation of each of the acalabrutinib asset and option liability. We engaged our valuation specialists to assist in our review of the discount rate, which involved comparing the methodology used to the methodology KPMG would apply in a similar transaction and challenging the market inputs used based on observed market data. In addition, we challenged the probability of obtaining regulatory approval by interviewing a range of key research, development, and commercial personnel as well as corroborating the outcome of acalabrutinib’s Phase I/II clinical trials. We considered whether adjustments to the original valuations were appropriate in light of additional information about assumptions that have become available in the measurement period to date. We also assessed the adequacy of the Group’s disclosure of the judgements involved in valuing the acalabrutinib asset and the option liability, and related disclosures.
Our findings
We found the Group’s assumptions and the resulting estimates to be balanced. We found that the disclosures proportionately describe the nature of the transaction, the judgements taken, and their impact on the valuation of the acalabrutinib asset and the option liability recognised.
Tax provisioning ($1,327m) (2015: $1,734m) Risk vs 2015: tu
Refer to page 98 (Audit Committee Report), page 143 (accounting policy), page 191 (financial disclosures) and page 81 (financial risk management).
The risk
Due to the Group operating in a number of different tax jurisdictions and the complexities of transfer pricing and other international tax legislation, accruals for tax contingencies require the Directors to make judgements and estimates in relation to subjective tax issues and exposures.
Our response
In this area our principal audit procedures included testing the Group’s controls surrounding tax provisioning, reviewing settlement correspondence between the Group and the relevant tax authorities, and the assistance of our own local and international tax specialists in analysing and challenging the assumptions used by management to determine tax provisions, based on our knowledge and experience of the application of the relevant legislation by
authorities and courts. We also assessed the adequacy of the Group’s disclosures in respect of tax and uncertain tax positions.
Our findings
We found the Group’s estimate of the amounts to be recognised as tax liabilities to be conservative(2015: conservative) and that the disclosures provide a proportionate (2015: proportionate) description of the current status of uncertain tax positions.
Litigation and contingent liabilities (provisions of $438m) (2015: $357m) Risk vs 2015: tu
Refer to page 98 (Audit Committee Report), page 145 (accounting policy), page 185 (financial disclosures) and page 80 (financial risk management).
The risk
In the normal course of business, litigation and contingent liabilities may arise from product-specific and general legal proceedings, from guarantees or from government investigations. The amounts involved are potentially material and the application of accounting standards to determine the amount, if any, to be provided as a liability is inherently subjective.
Our response
Having made enquiries of Directors and in-house legal counsel to obtain their view on the status of significant legal matters, our principal audit procedures included testing the Group’s controls surrounding litigation and contingent liabilities, obtaining formal confirmations from the Group’s external counsel for all significant legal cases, and discussions with external counsel where necessary. In addition we used our own forensic and compliance specialists to assess the Group’s compliance reports to identify actual and potential non-compliance with laws��and regulations, both those specific to the Group’s business and those relating to the conduct of business generally. We then analysed correspondence with regulators, considered legal expenses incurred during the year, monitored external sources and considered assessments made by management of the probability of defending any litigation and the reliability of estimating any obligation. We also assessed whether the Group’s disclosures detailing significant legal proceedings adequately disclose the potential liabilities of the Group.
Our findings
Whilst the outcome of these litigation matters is inherently uncertain in each case, we found that the Group applied balanced judgements (2015: balanced), on a case by case basis, in assessing whether or not a provision should be recognised. We found that the assumptions used and the resulting liability recorded to be balanced (2015: balanced). We found that the
| | |
| AstraZenecaAnnual Report and Form 20-F Information 2016 | | 135 |
Financial Statements
Group gives ample disclosure (2015: ample) on the potential liability in excess of that recognised in the Financial Statements and the significant but unquantifiable contingent liability in respect of these litigation matters.
Post-retirement benefits ($2,186m) (2015: $1,974m) Risk vs 2015: tu
Refer to page 101 (Audit Committee Report), page 143 (accounting policy), page 165 (financial disclosures) and page 80 (financial risk management).
The risk
Significant estimates are made in valuing the Group’s post-retirement defined benefit plans. Small changes in assumptions and estimates used to value the Group’s net pension deficit could have a significant effect on the results and financial position of the Group.
Our response
Our principal audit procedures included the testing of the Group’s controls surrounding the valuation of the post-retirement defined benefit plans and the challenge of key assumptions, being the discount rate, inflation rate and mortality/life expectancy, which are included in the valuation calculations of the Group’s retirement benefit obligations in countries with significant defined benefit pension plans, with the assistance of our own actuarial specialists. This involved a comparison of these key assumptions used against our own internal benchmarks and externally derived data. We also assessed the adequacy of the Group’s disclosures in respect of post-retirement benefits.
Our findings
Overall, we found the key assumptions used in, and the resulting estimate of, the valuation of retirement benefit obligations within the Group to be mildly optimistic (2015: mildly optimistic). We found the disclosures in respect of post-retirement benefits to be proportionate (2015: proportionate).
Overall findings
In reaching our audit opinion on the Group Financial Statements we took into account the findings that we describe above and those for other, lower risk areas. Overall the findings from across the whole audit are that, although the Group Financial Statements uses estimates that are mainly balanced, there is one conservative estimate and one mildly optimistic estimate. However, compared with materiality and considering the qualitative aspects of the Group Financial Statements as a whole, our opinion on the Group Financial Statements is unmodified.
| 4 | Our application of materiality and an overview of the scope of our audit |
The materiality for the Group Financial Statements as a whole was set at $146m (2015: $140m), determined with reference to a benchmark of Group profit before taxation, normalised to exclude this year’s asset
Materiality for the Group Financial Statements
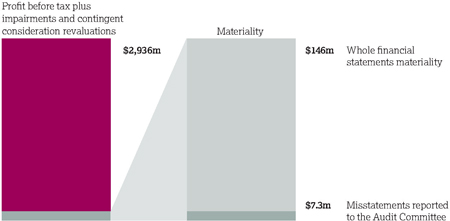
impairments and fair value movement and discount unwind on contingent consideration as disclosed in Notes 9 and 18, which are specifically audited, of which it represents 5.0% (2015: 5.0%).
We report to the Audit Committee any corrected or uncorrected identified misstatements exceeding $7.3m (2015: $7.0m) (0.25% of normalised Group profit before taxation), in addition to other identified misstatements that warranted reporting on qualitative grounds.
The Group operates a significant number of entities, of which there are 191 (2015: 181) located in 67 (2015: 65) countries around the globe. The Operating Segment disclosures in Note 6 set out the individual significance of each geographical region.
We performed audits for Group reporting purposes at 11 components (2015: nine) and specified risk-focused audit procedures at three (2015: two) standalone components as well as at 33 (2015: 33) components serviced by the Group’s shared service centres. The latter 36 (2015: 35) components were not individually financially significant enough to require an audit for Group reporting purposes, but were included in the scope of our audit in order to provide further coverage over relevant account balances.
The Group operates four principal shared service centres (both in-house and outsourced) in the UK, Malaysia, Romania and India, which process a substantial proportion of the Group’s transactions. The outputs from the shared service centres are included in the financial information of the reporting components they service and therefore they are not separate reporting components. Each of the service centres is subject to specified risk-focused audit procedures, predominantly the testing of transaction processing and review controls. Additional procedures are performed by component audit teams at certain reporting components to address the audit risks not
Scoping and coverage
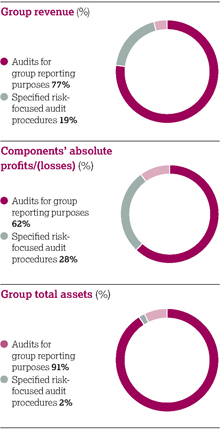
| | |
| 136 | | AstraZenecaAnnual Report and Form 20-F Information 2016 |
covered by the work performed over the shared service centres. These procedures are designed to address the risk of material misstatement identified through our Group risk assessment processes.
This resulted in the coverage shown in the opposite charts. For the remaining components, we performed analysis at the Group level to re-examine our assessment that there were no significant risks of material misstatement within them.
The Group audit team instructed component and shared service centre auditors as to the significant areas to be covered, including the relevant risks detailed above and the information to be reported back. The Group audit team approved the component materiality levels, which ranged from $9m to $80m, having regard to the mix of size and risk profile of the Group across the components.
The work on all components in scope of our work, other than on the Parent Company, was performed by component and shared service centre auditors. The audit of the Parent Company and consolidation was performed by the Group audit team.
The Group audit team visited six (2015: five) component locations, during the year, in the UK, Sweden, Japan, China, Malaysia, and the United States to discuss and challenge key risks and audit strategy. Video or telephone conference meetings were also held with all Group reporting component auditors and shared service auditors throughout the audit. At these visits and meetings, the audit approach, findings and observations reported to the Group audit team were discussed in more detail, and any further work required by the Group audit team was then performed by the component auditor.
| 5 | Our opinion on the other matter prescribed by the Companies Act 2006 is unmodified |
In our opinion the information given in the Strategic Report and the Directors’ Report for the financial year for which the Financial Statements are prepared is consistent with the Group Financial Statements.
Based solely on the work required to be undertaken in the course of the audit of the Financial Statements and from reading the Strategic Report and the Directors’ Report:
| > | we have not identified material misstatements in those reports; and |
| > | in our opinion, those reports have been prepared in accordance with the Companies Act 2006. |
| 6 | We have nothing to report on the disclosures of principal risks |
Based on the knowledge we acquired during our audit, we have nothing material to add or draw attention to in relation to:
| > | the Directors’ statement of Risk overview on pages 20 to 22, concerning the principal risks, their management, and, based on that, the Directors’ assessment and expectations of the Group’s continuing in operation over the three years to 31 December 2019; or |
| > | the disclosures in the Group Accounting Policies concerning the use of the going concern basis of accounting. |
| 7 | We have nothing to report in respect of the matters on which we are required to report by exception |
Under ISAs (UK and Ireland) we are required to report to you if, based on the knowledge we acquired during our audit, we have identified other information in this Annual Report that contains a material inconsistency with either that knowledge or the Financial Statements, a material misstatement of fact, or that is otherwise misleading.
In particular, we are required to report to you if:
| > | we have identified material inconsistencies between the knowledge we acquired during our audit and the Directors’ statement that they consider that the Annual Report and Financial Statements taken as a whole is fair, balanced and understandable and provides the information necessary for shareholders to assess the Group’s position and performance, business model and strategy; or |
| > | the Audit Committee Report does not appropriately address matters communicated by us to the Audit Committee. |
Under the Companies Act 2006 we are required to report to you if, in our opinion:
| > | certain disclosures of Directors’ remuneration specified by law are not made; or |
| > | we have not received all the information and explanations we require for our audit. |
Under the Listing Rules we are required to review:
| > | the Directors’ statements, set out on pages 96 and 22, in relation to going concern and longer-term viability; and |
| > | the part of the Corporate Governance Report on pages 82 to 97 relating to the Company’s compliance with the 11 provisions of the 2014 UK Corporate Governance Code specified for our review. |
We have nothing to report in respect of the above responsibilities.
| 8 | Other matter – we have reported separately on the Parent Company Financial Statements |
We have reported separately on the Parent Company Financial Statements of AstraZeneca PLC for the year ended 31 December 2016 and on the information in the Directors’ Remuneration Report that is described as having been audited.
Scope and responsibilities
As explained more fully in the Directors’ Responsibilities Statement set out on page 133, the Directors are responsible for the preparation of the Financial Statements and for being satisfied that they give a true and fair view. A description of the scope of an audit of financial statements is provided on the Financial Reporting Council’s website at www.frc.org.uk/auditscopeukprivate. This report is made solely to the Company’s members as a body and is subject to important explanations and disclaimers regarding our responsibilities, published on our website at www.kpmg.com/uk/ auditscopeukco2014b, which are incorporated into this report as if set out in full and should be read to provide an understanding of the purpose of this report, the work we have undertaken and the basis of our opinions.
Antony Cates (Senior Statutory Auditor)
for and on behalf of KPMG LLP,
Statutory Auditor
Chartered Accountants
15 Canada Square
London
E14 5GL
2 February 2017
| | |
| AstraZenecaAnnual Report and Form 20-F Information 2016 | | 137 |
Financial Statements
Consolidated Statement of Comprehensive Income
for the year ended 31 December
| | | | | | | | | | | | | | | | |
| | | Notes | | | 2016 $m | | | 2015 $m | | | 2014 $m | |
| Product Sales | | | 1 | | | | 21,319 | | | | 23,641 | | | | 26,095 | |
| Externalisation Revenue | | | 1 | | | | 1,683 | | | | 1,067 | | | | 452 | |
| Total Revenue | | | | | | | 23,002 | | | | 24,708 | | | | 26,547 | |
| Cost of sales | | | | | | | (4,126 | ) | | | (4,646 | ) | | | (5,842 | ) |
| Gross profit | | | | | | | 18,876 | | | | 20,062 | | | | 20,705 | |
| Distribution costs | | | | | | | (326 | ) | | | (339 | ) | | | (324 | ) |
| Research and development expense | | | 2 | | | | (5,890 | ) | | | (5,997 | ) | | | (5,579 | ) |
| Selling, general and administrative costs | | | 2 | | | | (9,413 | ) | | | (11,112 | ) | | | (13,000 | ) |
| Other operating income and expense | | | 2 | | | | 1,655 | | | | 1,500 | | | | 335 | |
| Operating profit | | | | | | | 4,902 | | | | 4,114 | | | | 2,137 | |
| Finance income | | | 3 | | | | 67 | | | | 46 | | | | 78 | |
| Finance expense | | | 3 | | | | (1,384 | ) | | | (1,075 | ) | | | (963 | ) |
| Share of after tax losses in associates and joint ventures | | | 10 | | | | (33 | ) | | | (16 | ) | | | (6 | ) |
| Profit before tax | | | | | | | 3,552 | | | | 3,069 | | | | 1,246 | |
| Taxation | | | 4 | | | | (146 | ) | | | (243 | ) | | | (11 | ) |
| Profit for the period | | | | | | | 3,406 | | | | 2,826 | | | | 1,235 | |
| | | | |
| Other comprehensive income: | | | | | | | | | | | | | | | | |
| Items that will not be reclassified to profit or loss: | | | | | | | | | | | | | | | | |
| | | | |
Remeasurement of the defined benefit pension liability | | | 20 | | | | (575 | ) | | | 652 | | | | (766 | ) |
| | | | |
Tax on items that will not be reclassified to profit or loss | | | 4 | | | | 136 | | | | (199 | ) | | | 216 | |
| | | | | | | | (439 | ) | | | 453 | | | | (550 | ) |
| Items that may be reclassified subsequently to profit or loss: | | | | | | | | | | | | | | | | |
| | | | |
Foreign exchange arising on consolidation | | | 21 | | | | (1,050 | ) | | | (528 | ) | | | (823 | ) |
Foreign exchange arising on designating borrowings in net investment hedges | | | 21 | | | | (591 | ) | | | (333 | ) | | | (529 | ) |
Fair value movements on cash flow hedges | | | | | | | (115 | ) | | | – | | | | – | |
Fair value movements on cash flow hedges transferred to profit and loss | | | | | | | 195 | | | | – | | | | – | |
Fair value movements on derivatives designated in net investment hedges | | | 21 | | | | (4 | ) | | | 14 | | | | 100 | |
Amortisation of loss on cash flow hedge | | | | | | | 1 | | | | 1 | | | | 1 | |
Net available for sale gains/(losses) taken to equity | | | | | | | 139 | | | | (32 | ) | | | 245 | |
Tax on items that may be reclassified subsequently to profit or loss | | | 4 | | | | 86 | | | | 87 | | | | 50 | |
| | | | | | | | (1,339 | ) | | | (791 | ) | | | (956 | ) |
| Other comprehensive income for the period, net of tax | | | | | | | (1,778 | ) | | | (338 | ) | | | (1,506 | ) |
| Total comprehensive income for the period | | | | | | | 1,628 | | | | 2,488 | | | | (271 | ) |
| | | | |
| Profit attributable to: | | | | | | | | | | | | | | | | |
| Owners of the Parent | | | | | | | 3,499 | | | | 2,825 | | | | 1,233 | |
| Non-controlling interests | | | 24 | | | | (93 | ) | | | 1 | | | | 2 | |
| | | | |
| Total comprehensive income attributable to: | | | | | | | | | | | | | | | | |
| Owners of the Parent | | | | | | | 1,722 | | | | 2,488 | | | | (266 | ) |
| Non-controlling interests | | | 24 | | | | (94 | ) | | | – | | | | (5 | ) |
| | | | | | | | | | | | | | | | | |
| Basic earnings per $0.25 Ordinary Share | | | 5 | | | | $2.77 | | | | $2.23 | | | | $0.98 | |
| Diluted earnings per $0.25 Ordinary Share | | | 5 | | | | $2.76 | | | | $2.23 | | | | $0.98 | |
| Weighted average number of Ordinary Shares in issue (millions) | | | 5 | | | | 1,265 | | | | 1,264 | | | | 1,262 | |
| Diluted weighted average number of Ordinary Shares in issue (millions) | | | 5 | | | | 1,266 | | | | 1,265 | | | | 1,264 | |
| | | | | | | | | | | | | | | | | |
| Dividends declared and paid in the period | | | 23 | | | | 3,540 | | | | 3,537 | | | | 3,532 | |
All activities were in respect of continuing operations.
$m means millions of US dollars.
| | |
| 138 | | AstraZenecaAnnual Report and Form 20-F Information 2016 |
Consolidated Statement of Financial Position
at 31 December
| | | | | | | | | | | | | | | | |
| | | | Notes | | |
| 2016
$m |
| |
| 2015
Restated $m |
* | |
| 2014
$m |
|
| | | | |
| Assets | | | | | | | | | | | | | | | | |
| | | | |
| Non-current assets | | | | | | | | | | | | | | | | |
| Property, plant and equipment | | | 7 | | | | 6,848 | | | | 6,413 | | | | 6,010 | |
| Goodwill | | | 8 | | | | 11,658 | | | | 11,800 | | | | 11,550 | |
| Intangible assets | | | 9 | | | | 27,586 | | | | 22,646 | | | | 20,981 | |
| Investments in associates and joint ventures | | | 10 | | | | 99 | | | | 85 | | | | 59 | |
| Other investments | | | 11 | | | | 727 | | | | 458 | | | | 502 | |
| Derivative financial instruments | | | 12 | | | | 343 | | | | 446 | | | | 465 | |
| Other receivables | | | 13 | | | | 901 | | | | 907 | | | | 1,112 | |
| Deferred tax assets | | | 4 | | | | 1,102 | | | | 1,294 | | | | 1,219 | |
| | | | | | | | 49,264 | | | | 44,049 | | | | 41,898 | |
| | | | |
| Current assets | | | | | | | | | | | | | | | | |
| Inventories | | | 14 | | | | 2,334 | | | | 2,143 | | | | 1,960 | |
| Trade and other receivables | | | 15 | | | | 4,573 | | | | 6,622 | | | | 7,232 | |
| Other investments | | | 11 | | | | 884 | | | | 613 | | | | 795 | |
| Derivative financial instruments | | | 12 | | | | 27 | | | | 2 | | | | 21 | |
| Income tax receivable | | | | | | | 426 | | | | 387 | | | | 329 | |
| Cash and cash equivalents | | | 16 | | | | 5,018 | | | | 6,240 | | | | 6,360 | |
| | | | | | | | 13,262 | | | | 16,007 | | | | 16,697 | |
| Total assets | | | | | | | 62,526 | | | | 60,056 | | | | 58,595 | |
| | | | |
| Liabilities | | | | | | | | | | | | | | | | |
| | | | |
| Current liabilities | | | | | | | | | | | | | | | | |
| Interest-bearing loans and borrowings | | | 17 | | | | (2,307 | ) | | | (916 | ) | | | (2,446 | ) |
| Trade and other payables | | | 18 | | | | (10,486 | ) | | | (11,663 | ) | | | (11,886 | ) |
| Derivative financial instruments | | | 12 | | | | (18 | ) | | | (9 | ) | | | (21 | ) |
| Provisions | | | 19 | | | | (1,065 | ) | | | (798 | ) | | | (623 | ) |
| Income tax payable | | | | | | | (1,380 | ) | | | (1,483 | ) | | | (2,354 | ) |
| | | | | | | | (15,256 | ) | | | (14,869 | ) | | | (17,330 | ) |
| | | | |
| Non-current liabilities | | | | | | | | | | | | | | | | |
| Interest-bearing loans and borrowings | | | 17 | | | | (14,501 | ) | | | (14,137 | ) | | | (8,397 | ) |
| Derivative financial instruments | | | 12 | | | | (117 | ) | | | (1 | ) | | | – | |
| Deferred tax liabilities | | | 4 | | | | (3,956 | ) | | | (2,665 | ) | | | (1,796 | ) |
| Retirement benefit obligations | | | 20 | | | | (2,186 | ) | | | (1,974 | ) | | | (2,951 | ) |
| Provisions | | | 19 | | | | (353 | ) | | | (444 | ) | | | (484 | ) |
| Other payables | | | 18 | | | | (9,488 | ) | | | (7,457 | ) | | | (7,991 | ) |
| | | | | | | | (30,601 | ) | | | (26,678 | ) | | | (21,619 | ) |
| Total liabilities | | | | | | | (45,857 | ) | | | (41,547 | ) | | | (38,949 | ) |
| Net assets | | | | | | | 16,669 | | | | 18,509 | | | | 19,646 | |
| | | | |
| Equity | | | | | | | | | | | | | | | | |
| | | | |
| Capital and reserves attributable to equity holders of the Company | | | | | | | | | | | | | | | | |
| Share capital | | | 22 | | | | 316 | | | | 316 | | | | 316 | |
| Share premium account | | | | | | | 4,351 | | | | 4,304 | | | | 4,261 | |
| Capital redemption reserve | | | | | | | 153 | | | | 153 | | | | 153 | |
| Merger reserve | | | | | | | 448 | | | | 448 | | | | 448 | |
| Other reserves | | | 21 | | | | 1,446 | | | | 1,435 | | | | 1,420 | |
| Retained earnings | | | 21 | | | | 8,140 | | | | 11,834 | | | | 13,029 | |
| | | | | | | | 14,854 | | | | 18,490 | | | | 19,627 | |
| Non-controlling interests | | | 24 | | | | 1,815 | | | | 19 | | | | 19 | |
| Total equity | | | | | | | 16,669 | | | | 18,509 | | | | 19,646 | |
| * | 2015 comparatives have been restated to reflect an adjustment to the acquisition accounting for ZS Pharma (see Note 25). |
The Financial Statements from pages 138 to 196 were approved by the Board on 2 February 2017 and were signed on its behalf by
| | |
| Pascal Soriot | | Marc Dunoyer |
| Director | | Director |
| | |
| AstraZenecaAnnual Report and Form 20-F Information 2016 | | 139 |
Financial Statements
Consolidated Statement of Changes in Equity
for the year ended 31 December
| | | | | | | | | | | | | | | | | | | | | | | | | | | | | | | | | | | | |
| | | Share capital $m | | | Share premium account $m | | | Capital redemption reserve $m | | | Merger reserve $m | | | Other reserves $m | | | Retained earnings $m | | | Total attributable to owners $m | | | Non- controlling interests $m | | | Total equity $m | |
| At 1 January 2014 | | | 315 | | | | 3,983 | | | | 153 | | | | 433 | | | | 1,380 | | | | 16,960 | | | | 23,224 | | | | 29 | | | | 23,253 | |
| Profit for the period | | | – | | | | – | | | | – | | | | – | | | | – | | | | 1,233 | | | | 1,233 | | | | 2 | | | | 1,235 | |
| Other comprehensive income | | | – | | | | – | | | | – | | | | – | | | | – | | | | (1,499 | ) | | | (1,499 | ) | | | (7 | ) | | | (1,506 | ) |
| Transfer to other reserves1 | | | – | | | | – | | | | – | | | | – | | | | 40 | | | | (40 | ) | | | – | | | | – | | | | – | |
| | | | | | | | | |
| Transactions with owners | | | | | | | | | | | | | | | | | | | | | | | | | | | | | | | | | | | | |
| Dividends | | | – | | | | – | | | | – | | | | – | | | | – | | | | (3,532 | ) | | | (3,532 | ) | | | – | | | | (3,532 | ) |
| Issue of Ordinary Shares | | | 1 | | | | 278 | | | | – | | | | – | | | | – | | | | – | | | | 279 | | | | – | | | | 279 | |
| Share-based payments | | | – | | | | – | | | | – | | | | – | | | | – | | | | (93 | ) | | | (93 | ) | | | – | | | | (93 | ) |
| Transfer from non-controlling interests to payables | | | – | | | | – | | | | – | | | | – | | | | – | | | | – | | | | – | | | | (5 | ) | | | (5 | ) |
| True-up to Astra AB non-controlling interest buy out | | | – | | | | – | | | | – | | | | 15 | | | | – | | | | – | | | | 15 | | | | – | | | | 15 | |
| Net movement | | | 1 | | | | 278 | | | | – | | | | 15 | | | | 40 | | | | (3,931 | ) | | | (3,597 | ) | | | (10 | ) | | | (3,607 | ) |
| At 31 December 2014 | | | 316 | | | | 4,261 | | | | 153 | | | | 448 | | | | 1,420 | | | | 13,029 | | | | 19,627 | | | | 19 | | | | 19,646 | |
| Profit for the period | | | – | | | | – | | | | – | | | | – | | | | – | | | | 2,825 | | | | 2,825 | | | | 1 | | | | 2,826 | |
| Other comprehensive income | | | – | | | | – | | | | – | | | | – | | | | – | | | | (337 | ) | | | (337 | ) | | | (1 | ) | | | (338 | ) |
| Transfer to other reserves1 | | | – | | | | – | | | | – | | | | – | | | | 15 | | | | (15 | ) | | | – | | | | – | | | | – | |
| | | | | | | | | |
| Transactions with owners | | | | | | | | | | | | | | | | | | | | | | | | | | | | | | | | | | | | |
| Dividends | | | – | | | | – | | | | – | | | | – | | | | – | | | | (3,537 | ) | | | (3,537 | ) | | | – | | | | (3,537 | ) |
| Issue of Ordinary Shares | | | – | | | | 43 | | | | – | | | | – | | | | – | | | | – | | | | 43 | | | | – | | | | 43 | |
| Share-based payments | | | – | | | | – | | | | – | | | | – | | | | – | | | | (131 | ) | | | (131 | ) | | | – | | | | (131 | ) |
| Net movement | | | – | | | | 43 | | | | – | | | | – | | | | 15 | | | | (1,195 | ) | | | (1,137 | ) | | | – | | | | (1,137 | ) |
| At 31 December 2015 | | | 316 | | | | 4,304 | | | | 153 | | | | 448 | | | | 1,435 | | | | 11,834 | | | | 18,490 | | | | 19 | | | | 18,509 | |
| Profit for the period | | | – | | | | – | | | | – | | | | – | | | | – | | | | 3,499 | | | | 3,499 | | | | (93 | ) | | | 3,406 | |
| Other comprehensive income | | | – | | | | – | | | | – | | | | – | | | | – | | | | (1,777 | ) | | | (1,777 | ) | | | (1 | ) | | | (1,778 | ) |
| Transfer to other reserves1 | | | – | | | | – | | | | – | | | | – | | | | 11 | | | | (11 | ) | | | – | | | | – | | | | – | |
| | | | | | | | | |
| Transactions with owners | | | | | | | | | | | | | | | | | | | | | | | | | | | | | | | | | | | | |
| Dividends | | | – | | | | – | | | | – | | | | – | | | | – | | | | (3,540 | ) | | | (3,540 | ) | | | – | | | | (3,540 | ) |
| Dividends paid by subsidiary to non-controlling interest | | | – | | | | – | | | | – | | | | – | | | | – | | | | – | | | | – | | | | (13 | ) | | | (13 | ) |
| Acerta put option (Note 24) | | | – | | | | – | | | | – | | | | – | | | | – | | | | (1,825 | ) | | | (1,825 | ) | | | – | | | | (1,825 | ) |
| Changes in non-controlling interest (Note 25) | | | – | | | | – | | | | – | | | | – | | | | – | | | | – | | | | – | | | | 1,903 | | | | 1,903 | |
| Issue of Ordinary Shares | | | – | | | | 47 | | | | – | | | | – | | | | – | | | | – | | | | 47 | | | | – | | | | 47 | |
| Share-based payments | | | – | | | | – | | | | – | | | | – | | | | – | | | | (40 | ) | | | (40 | ) | | | – | | | | (40 | ) |
| Net movement | | | – | | | | 47 | | | | – | | | | – | | | | 11 | | | | (3,694 | ) | | | (3,636 | ) | | | 1,796 | | | | (1,840 | ) |
| At 31 December 2016 | | | 316 | | | | 4,351 | | | | 153 | | | | 448 | | | | 1,446 | | | | 8,140 | | | | 14,854 | | | | 1,815 | | | | 16,669 | |
| 1 | Amounts charged or credited to other reserves relate to exchange adjustments arising on goodwill. |
| | |
| 140 | | AstraZenecaAnnual Report and Form 20-F Information 2016 |
Consolidated Statement of Cash Flows
for the year ended 31 December
| | | | | | | | | | | | | | | | |
| | | | Notes | | |
| 2016
$m |
| |
| 2015
$m |
| |
| 2014
$m |
|
| | | | |
| Cash flows from operating activities | | | | | | | | | | | | | | | | |
| Profit before tax | | | | | | | 3,552 | | | | 3,069 | | | | 1,246 | |
| Finance income and expense | | | 3 | | | | 1,317 | | | | 1,029 | | | | 885 | |
| Share of after tax losses of associates and joint ventures | | | 10 | | | | 33 | | | | 16 | | | | 6 | |
| Depreciation, amortisation and impairment | | | | | | | 2,357 | | | | 2,852 | | | | 3,282 | |
| Decrease in trade and other receivables | | | | | | | 1,610 | | | | 152 | | | | 311 | |
| (Increase)/decrease in inventories | | | | | | | (343 | ) | | | (315 | ) | | | 108 | |
| (Decrease)/increase in trade and other payables and provisions | | | | | | | (341 | ) | | | 114 | | | | 2,089 | |
| Gains on disposal of intangible assets | | | 2 | | | | (1,301 | ) | | | (961 | ) | | | – | |
| Fair value movements on contingent consideration arising from business combinations | | | 18 | | | | (1,158 | ) | | | (432 | ) | | | 512 | |
| Non-cash and other movements | | | | | | | (492 | ) | | | (350 | ) | | | 353 | |
| Cash generated from operations | | | | | | | 5,234 | | | | 5,174 | | | | 8,792 | |
| Interest paid | | | | | | | (677 | ) | | | (496 | ) | | | (533 | ) |
| Tax paid | | | | | | | (412 | ) | | | (1,354 | ) | | | (1,201 | ) |
| Net cash inflow from operating activities | | | | | | | 4,145 | | | | 3,324 | | | | 7,058 | |
| | | | |
| Cash flows from investing activities | | | | | | | | | | | | | | | | |
| Upfront payments on business combinations | | | 25 | | | | (2,564 | ) | | | (2,446 | ) | | | (3,804 | ) |
| Payment of contingent consideration from business combinations | | | 18 | | | | (293 | ) | | | (579 | ) | | | (657 | ) |
| Purchase of property, plant and equipment | | | | | | | (1,446 | ) | | | (1,328 | ) | | | (1,012 | ) |
| Disposal of property, plant and equipment | | | | | | | 82 | | | | 47 | | | | 158 | |
| Purchase of intangible assets | | | | | | | (868 | ) | | | (1,460 | ) | | | (1,740 | ) |
| Disposal of intangible assets | | | | | | | 1,427 | | | | 1,130 | | | | – | |
| Purchase of non-current asset investments | | | | | | | (230 | ) | | | (57 | ) | | | (130 | ) |
| Disposal of non-current asset investments | | | | | | | 3 | | | | 93 | | | | 59 | |
| Movement in short-term investments and fixed deposits | | | | | | | (166 | ) | | | 283 | | | | 34 | |
| Payments to joint ventures | | | 10 | | | | (41 | ) | | | (45 | ) | | | (70 | ) |
| Interest received | | | | | | | 140 | | | | 123 | | | | 140 | |
| Payments made by subsidiaries to non-controlling interests | | | | | | | (13 | ) | | | – | | | | (10 | ) |
| Net cash outflow from investing activities | | | | | | | (3,969 | ) | | | (4,239 | ) | | | (7,032 | ) |
| Net cash inflow/(outflow) before financing activities | | | | | | | 176 | | | | (915 | ) | | | 26 | |
| | | | |
| Cash flows from financing activities | | | | | | | | | | | | | | | | |
| Proceeds from issue of share capital | | | | | | | 47 | | | | 43 | | | | 279 | |
| Repayment of obligations under finance leases | | | | | | | (16 | ) | | | (42 | ) | | | (36 | ) |
| Issue of loans | | | | | | | 2,491 | | | | 5,928 | | | | 919 | |
| Repayment of loans | | | | | | | – | | | | (884 | ) | | | (750 | ) |
| Dividends paid | | | | | | | (3,561 | ) | | | (3,486 | ) | | | (3,521 | ) |
| Hedge contracts relating to dividend payments | | | | | | | 18 | | | | (51 | ) | | | (14 | ) |
| Payments to acquire non-controlling interests | | | | | | | – | | | | – | | | | (102 | ) |
| Movement in short-term borrowings | | | | | | | (303 | ) | | | (630 | ) | | | 520 | |
| Net cash (outflow)/inflow from financing activities | | | | | | | (1,324 | ) | | | 878 | | | | (2,705 | ) |
| Net decrease in cash and cash equivalents in the period | | | | | | | (1,148 | ) | | | (37 | ) | | | (2,679 | ) |
| Cash and cash equivalents at the beginning of the period | | | | | | | 6,051 | | | | 6,164 | | | | 8,995 | |
| Exchange rate effects | | | | | | | 21 | | | | (76 | ) | | | (152 | ) |
| Cash and cash equivalents at the end of the period | | | 16 | | | | 4,924 | | | | 6,051 | | | | 6,164 | |
| | |
| AstraZenecaAnnual Report and Form 20-F Information 2016 | | 141 |
Financial Statements
Group Accounting Policies
Basis of accounting and preparation of financial information
The Consolidated Financial Statements have been prepared under the historical cost convention, modified to include revaluation to fair value of certain financial instruments as described below, in accordance with the Companies Act 2006 and International Financial Reporting Standards (IFRSs) as adopted by the EU (adopted IFRSs) in response to the IAS regulation (EC 1606/2002). The Consolidated Financial Statements also comply fully with IFRSs as issued by the International Accounting Standards Board (IASB).
During the year, the Group has adopted the amendments to IFRS 11 Accounting for Acquisitions of Interests in Joint Operations, amendments to IAS 16 ‘Property, Plant and Equipment’ and IAS 38 ‘Intangible Assets’ Clarification of Acceptable Methods of Depreciation and Amortisation, and amendments to IAS 1 Disclosure Initiative, which were all effective for periods beginning on or after 1 January 2016.
The adoption has not had a significant impact on the Group’s profit for the period, net assets or cash flows.
The Company has elected to prepare the Company Financial Statements in accordance with UK Accounting Standards, including FRS 101 ‘Reduced Disclosure Framework’. These are presented on pages 198 to 202 and the Accounting Policies in respect of Company information are set out on page 200.
The Consolidated Financial Statements are presented in US dollars, which is the Company’s functional currency.
In preparing their individual Financial Statements, the accounting policies of some overseas subsidiaries do not conform with IASB issued IFRSs. Therefore, where appropriate, adjustments are made in order to present the Consolidated Financial Statements on a consistent basis.
Basis for preparation of Financial Statements on a going concern basis
Information on the business environment AstraZeneca operates in, including the factors underpinning the pharmaceutical industry’s future growth prospects, is included in the Strategic Report. Details of the product portfolio of the Group (including patent expiry dates for key marketed products), our approach to product development and our development pipeline are covered in detail with additional information by Therapy Area in the Strategic Report and Directors’ Report.
The financial position of the Group, its cash flows, liquidity position and borrowing facilities are described in the Financial Review from page 62. In addition, Note 26 to the Financial Statements includes the Group’s objectives, policies and processes for managing its capital, its financial risk management objectives, details of its financial instruments and hedging activities and its exposures to credit, market and liquidity risk. Further details of the Group’s cash balances and borrowings are included in Notes 16 and 17 to the Financial Statements.
The Group has considerable financial resources available. As at 31 December 2016, the Group has $5.7bn in financial resources (cash balances of $5.0bn and undrawn committed bank facilities of $3.0bn that are available until April 2020, with only $2.3bn of debt due within one year). The Group’s revenues are largely derived from sales of products which are covered by patents which provide a relatively high level of resilience and predictability to cash inflows, although our revenue is expected to continue to be significantly impacted by the expiry of patents over the medium term. In addition, government price interventions in response to budgetary constraints are expected to continue to adversely affect revenues in many of our mature markets. However, we anticipate new revenue streams from both recently launched medicines and products in development, and the Group has a wide diversity of customers and suppliers across different geographic areas. Consequently, the Directors believe that, overall, the Group is well placed to manage its business risks successfully.
After making enquiries, the Directors have a reasonable expectation that the Company and the Group have adequate resources to continue in operational existence for the foreseeable future. Accordingly, they continue to adopt the going concern basis in preparing the Annual Report and Financial Statements.
Estimates and judgements
The preparation of the Financial Statements in conformity with generally accepted accounting principles requires management to make estimates and judgements that affect the reported amounts of assets and liabilities at the date of the Financial Statements and the reported amounts of revenues and expenses during the reporting period. Actual results could differ from those estimates.
Judgements include matters such as the determination of operating segments while estimates focus on areas such as carrying values, estimated useful lives, potential obligations and contingent consideration.
AstraZeneca’s management considers the following to be the most important accounting policies in the context of the Group’s operations.
The accounting policy descriptions set out the areas where judgements and estimates need exercising, the most significant of which are revenue recognition, research and development (including impairment reviews of associated intangible assets), business combinations and goodwill, litigation and environmental liabilities, employee benefits and taxation.
Further information on estimates and critical judgements made in applying accounting policies, including details of significant methods and assumptions used, is detailed in the Financial Review from page 62 and is included in Notes 4, 8, 9, 20, 25 and 28 to the Financial Statements. Financial risk management policies are detailed in Note 26.
Revenue
Revenues comprise Product Sales and Externalisation Revenue.
Revenues exclude inter-company revenues and value-added taxes.
Product Sales
Product Sales represent net invoice value less estimated rebates, returns and chargebacks. Sales are recognised when the significant risks and rewards of ownership have been transferred to a third party. In general, this is upon delivery of the products to wholesalers. In markets where returns are significant (currently only in the US), estimates of returns are accounted for at the point revenue is recognised. In markets where returns are not significant, they are recorded when returned.
For the US market, we estimate the quantity and value of goods which may ultimately be returned at the point of sale. Our returns accruals are based on actual experience over the preceding 12 months for established products together with market-related information such as estimated stock levels at wholesalers and competitor activity which we receive via third party information services. For newly launched products, we use rates based on our experience with similar products or a predetermined percentage.
When a product faces generic competition, particular attention is given to the possible levels of returns and, in cases where the circumstances are such that the level of returns (and, hence, revenue) cannot be measured reliably, revenues are only recognised when the right of return expires, which is generally on ultimate prescription of the product to patients.
| | |
| 142 | | AstraZenecaAnnual Report and Form 20-F Information 2016 |
Externalisation Revenue
Externalisation Revenue includes income from collaborative arrangements on the Group’s products where the Group retains a significant ongoing interest and there is no derecognition of an intangible asset. These may include development arrangements, commercialisation arrangements and collaborations.
Income may take the form of upfront access fees, milestones and/or sales royalties. Generally, upfront access fees are recognised upon delivery of the access. Where the Group provides ongoing services, revenue in respect of this element will be recognised over the duration of those services. Milestones and sales royalties are recognised when virtually certain and the amount can be reliably estimated.
Further detail on key judgements and estimates is included in the Financial Review from page 62.
Research and development
Research expenditure is recognised in profit in the year in which it is incurred.
Internal development expenditure is capitalised only if it meets the recognition criteria of IAS 38 ‘Intangible Assets’. Where regulatory and other uncertainties are such that the criteria are not met, the expenditure is recognised in profit and this is almost invariably the case prior to approval of the drug by the relevant regulatory authority. Where, however, recognition criteria are met, intangible assets are capitalised and amortised on a straight-line basis over their useful economic lives from product launch. At 31 December 2016, no amounts have met recognition criteria.
Payments to in-license products and compounds from third parties for new research and development projects (in process research and development), generally taking the form of upfront payments and milestones, are capitalised. Where payments made to third parties represent future research and development activities, an evaluation is made as to the nature of the payments. Such payments are expensed if they represent compensation for subcontracted research and development services not resulting in a transfer of intellectual property. By contrast, payments are capitalised if they represent compensation for the transfer of intellectual property developed at the risk of the third party. Since acquired products and compounds will only generate sales and cash inflows following launch, our policy is to minimise the period between final approval and launch if it is within AstraZeneca’s control to do so. Assets capitalised are amortised, on a straight-line basis, over their useful economic lives from product launch. Under this policy, it is not possible to determine precise economic lives for individual classes of intangible assets. However, lives do not exceed 25 years.
Intangible assets relating to products in development are subject to impairment testing annually. All intangible assets are tested for impairment when there are indications that the carrying value may not be recoverable. Any impairment losses are recognised immediately in profit. Intangible assets relating to products which fail during development (or for which development ceases for other reasons) are tested for impairment at the point of termination and are written down to their recoverable amount (which is usually nil).
If, subsequent to an impairment loss being recognised, development restarts or other facts and circumstances change indicating that the impairment is less or no longer exists, the value of the asset is re-estimated and its carrying value is increased to the recoverable amount, but not exceeding the original value, by recognising an impairment reversal in profit.
Business combinations and goodwill
On the acquisition of a business, fair values are attributed to the identifiable assets and liabilities and contingent liabilities unless the fair value cannot be measured reliably, in which case the value is subsumed into goodwill. Where the Group fully acquires, through a business combination, assets that were previously held in joint operations, the Group has elected not to uplift the book value of the existing interest in the asset held in the joint operation to fair value at the date full control is taken. Where fair values of acquired contingent liabilities cannot be measured reliably, the assumed contingent liability is not recognised but is disclosed in the same manner as other contingent liabilities.
Where not all of the equity of a subsidiary is acquired the non-controlling interest is recognised either at fair value or at the non-controlling interest’s proportionate share of the net assets of the subsidiary, on a case-by-case basis. Put options over non-controlling interests are recognised as a financial liability, with a corresponding entry in either retained earnings or against non-controlling interest reserves on a case-by-case basis.
Future contingent elements of consideration, which may include development and launch milestones, revenue threshold milestones and revenue-based royalties, are fair valued at the date of acquisition using decision-tree analysis with key inputs including probability of success, consideration of potential delays and revenue projections based on the Group’s internal forecasts. Unsettled amounts of consideration are held at fair value within payables with changes in fair value recognised immediately in profit.
Goodwill is the difference between the fair value of the consideration and the fair value of net assets acquired.
Goodwill arising on acquisitions is capitalised and subject to an impairment review, both annually and when there is an indication that the carrying value may not be recoverable. Between 1 January 1998 and 31 December 2002, goodwill was amortised over its estimated useful life; such amortisation ceased on 31 December 2002.
The Group’s policy up to and including 1997 was to eliminate goodwill arising upon acquisitions against reserves. Under IFRS 1 ‘First-time Adoption of International Financial Reporting Standards’ and IFRS 3 ‘Business Combinations’, such goodwill will remain eliminated against reserves.
Joint arrangements and associates
The Group has arrangements over which it has joint control and which qualify as joint operations or joint ventures under IFRS 11 ‘Joint Arrangements’. For joint operations, the Group recognises its share of revenue that it earns from the joint operations and its share of expenses incurred. The Group also recognises the assets associated with the joint operations that it controls and the liabilities it incurs under the joint arrangement. For joint ventures and associates, the Group recognises its interest in the joint venture as an investment and uses the equity method of accounting.
Employee benefits
The Group accounts for pensions and other employee benefits (principally healthcare) under IAS 19 ‘Employee Benefits’. In respect of defined benefit plans, obligations are measured at discounted present value while plan assets are measured at fair value. The operating and financing costs of such plans are recognised separately in profit; current service costs are spread systematically over the lives of employees and financing costs are recognised in full in the periods in which they arise. Remeasurements of the net defined pension liability, including actuarial gains and losses, are recognised immediately in other comprehensive income.
Where the calculation results in a surplus to the Group, the recognised asset is limited to the present value of any available future refunds from the plan or reductions in future contributions to the plan. Payments to defined contribution plans are recognised in profit as they fall due.
Taxation
The current tax payable is based on taxable profit for the year. Taxable profit differs from reported profit because taxable profit excludes items that are either never taxable or tax deductible or items that are taxable or tax deductible in a different period. The Group’s current tax assets and liabilities are calculated using tax rates that have been enacted or substantively enacted by the reporting date.
| | |
| AstraZenecaAnnual Report and Form 20-F Information 2016 | | 143 |
Financial Statements
Deferred tax is provided using the balance sheet liability method, providing for temporary differences between the carrying amounts of assets and liabilities for financial reporting purposes and the amounts used for taxation purposes. Deferred tax assets are recognised to the extent that it is probable that taxable profit will be available against which the asset can be utilised. This requires judgements to be made in respect of the availability of future taxable income.
No deferred tax asset or liability is recognised in respect of temporary differences associated with investments in subsidiaries and branches where the Group is able to control the timing of reversal of the temporary differences and it is probable that the temporary differences will not reverse in the foreseeable future.
The Group’s deferred tax assets and liabilities are calculated using tax rates that are expected to apply in the period when the liability is settled or the asset realised based on tax rates that have been enacted or substantively enacted by the reporting date.
Accruals for tax contingencies require management to make judgements and estimates of exposures in relation to tax audit issues. Tax benefits are not recognised unless the tax positions will probably be sustained based upon management’s interpretation of applicable laws and regulations. Once considered to be probable, management reviews each material tax benefit to assess whether a provision should be taken against full recognition of that benefit on the basis of potential settlement through negotiation and/or litigation. Accruals for tax contingencies are measured using the single best estimate of likely outcome approach. Any liability to pay interest on tax liabilities is provided for in the tax charge. See Note 28 to the Financial Statements for further details.
Share-based payments
All plans are assessed and have been classified as equity settled. The grant date fair value of employee share plan awards is calculated using a modified version of the binomial model. In accordance with IFRS 2 ‘Share-based Payment’, the resulting cost is recognised in profit over the vesting period of the awards, being the period in which the services are received. The value of the charge is adjusted to reflect expected and actual levels of awards vesting, except where the failure to vest is as a result of not meeting a market condition. Cancellations of equity instruments are treated as an acceleration of the vesting period and any outstanding charge is recognised in profit immediately.
Property, plant and equipment
The Group’s policy is to write off the difference between the cost of each item of property, plant and equipment and its residual value over its estimated useful life on a straight-line basis. Assets under construction are not depreciated.
Reviews are made annually of the estimated remaining lives and residual values of individual productive assets, taking account of commercial and technological obsolescence as well as normal wear and tear. Under this policy it becomes impractical to calculate average asset lives exactly. However, the total lives range from approximately 10 to 50 years for buildings, and three to 15 years for plant and equipment. All items of property, plant and equipment are tested for impairment when there are indications that the carrying value may not be recoverable. Any impairment losses are recognised immediately in profit.
Borrowing costs
The Group has no borrowing costs with respect to the acquisition or construction of qualifying assets. All other borrowing costs are recognised in profit as incurred and in accordance with the effective interest rate method.
Leases
Leases are classified as finance leases if they transfer substantially all the risks and rewards incidental to ownership, otherwise they are classified as operating leases. Assets and liabilities arising on finance leases are initially recognised at fair value or, if lower, the present value of the minimum lease payments. The discount rate used in calculating the present value of the minimum lease payments is the interest rate implicit in the lease. Finance charges under finance leases are allocated to each reporting period so as to produce a constant periodic rate of interest on the remaining balance of the finance liability. Rentals under operating leases are charged to profit on a straight-line basis.
Subsidiaries
A subsidiary is an entity controlled, directly or indirectly, by AstraZeneca PLC. Control is regarded as the exposure or rights to the variable returns of the entity when combined with the power to affect those returns.
The financial results of subsidiaries are consolidated from the date control is obtained until the date that control ceases.
Inventories
Inventories are stated at the lower of cost and net realisable value. The first in, first out or an average method of valuation is used. For finished goods and work in progress, cost includes directly attributable costs and certain overhead expenses (including depreciation). Selling expenses and certain other overhead expenses (principally central administration costs) are excluded. Net realisable value is
determined as estimated selling price less all estimated costs of completion and costs to be incurred in selling and distribution.
Write-downs of inventory occur in the general course of business and are recognised in cost of sales.
Trade and other receivables
Financial assets included in trade and other receivables are recognised initially at fair value. Subsequent to initial recognition they are measured at amortised cost using the effective interest rate method, less any impairment losses. Trade receivables that are subject to debt factoring arrangements are derecognised if they meet the conditions for derecognition detailed in IAS 39 ‘Financial Instruments: Recognition and Measurement’.
Trade and other payables
Financial liabilities included in trade and other payables are recognised initially at fair value. Subsequent to initial recognition they are measured at amortised cost using the effective interest rate method.
Financial instruments
The Group’s financial instruments include interests in leases, trade and other receivables and payables, liabilities for contingent consideration under business combinations, and rights and obligations under employee benefit plans which are dealt with in specific accounting policies.
The Group’s other financial instruments include:
> cash and cash equivalents
> fixed deposits
> other investments
> bank and other borrowings
> derivatives.
Cash and cash equivalents
Cash and cash equivalents comprise cash in hand, current balances with banks and similar institutions and highly liquid investments with maturities of three months or less when acquired. They are readily convertible into known amounts of cash and are held at amortised cost.
Fixed deposits
Fixed deposits, principally comprising funds held with banks and other financial institutions, are initially measured at fair value, plus direct transaction costs, and are subsequently measured at amortised cost using the effective interest rate method at each reporting date. Changes in carrying value are recognised in profit.
Other investments
Where investments have been classified as held for trading, they are measured initially at fair value and subsequently remeasured to fair value at each reporting date. Changes in fair value are recognised in profit.
| | |
| 144 | | AstraZenecaAnnual Report and Form 20-F Information 2016 |
In all other circumstances, the investments are classified as ‘available for sale’, initially measured at fair value (including direct transaction costs) and subsequently remeasured to fair value at each reporting date. Changes in carrying value due to changes in exchange rates on monetary available for sale investments or impairments are recognised in profit with other operating income and expense. All other changes in fair value are recognised in other comprehensive income.
Impairments are recorded in profit when there is a decline in the value of an investment that is deemed to be other than temporary. On disposal of the investment, the cumulative amount recognised in other comprehensive income is recognised in profit as part of the gain or loss on disposal.
Bank and other borrowings
The Group uses derivatives, principally interest rate swaps, to hedge the interest rate exposure inherent in a portion of its fixed interest rate debt. In such cases the Group will either designate the debt as fair value through profit or loss when certain criteria are met or as the hedged item under a fair value hedge.
If the debt instrument is designated as fair value through profit or loss, the debt is initially measured at fair value (with direct transaction costs being included in profit as an expense) and is remeasured to fair value at each reporting date with changes in carrying value being recognised in profit (along with changes in the fair value of the related derivative). Such a designation has been made where this significantly reduces an accounting mismatch which would result from recognising gains and losses on different bases.
If the debt is designated as the hedged item under a fair value hedge, the debt is initially measured at fair value (with direct transaction costs being amortised over the life of the debt), and is remeasured for fair value changes in respect of the hedged risk at each reporting date with changes in carrying value being recognised in profit (along with changes in the fair value of the related derivative).
If the debt is designated in a cash flow hedge, the debt is measured at amortised cost (with gains or losses taken to profit and direct transaction costs being amortised over the life of the debt). The related derivative is remeasured for fair value changes at each reporting date with the portion of the gain or loss on the derivative that is determined to be an effective hedge recognised in other comprehensive income. The amounts that have been recognised in other comprehensive income are reclassified to profit in the same period that the hedged forecast cash flows affect profit.
Other interest-bearing loans are initially measured at fair value (with direct transaction costs being amortised over the life of the bond) and are subsequently measured at amortised cost using the effective interest rate method at each reporting date. Changes in carrying value are recognised in profit.
Derivatives
Derivatives are initially measured at fair value (with direct transaction costs being included in profit as an expense) and are subsequently remeasured to fair value at each reporting date. Changes in carrying value are recognised in profit.
Foreign currencies
Foreign currency transactions, being transactions denominated in a currency other than an individual Group entity’s functional currency, are translated into the relevant functional currencies of individual Group entities at average rates for the relevant monthly accounting periods, which approximate to actual rates.
Monetary assets and liabilities arising from foreign currency transactions are retranslated at exchange rates prevailing at the reporting date. Exchange gains and losses on loans and on short-term foreign currency borrowings and deposits are included within finance expense. Exchange differences on all other foreign currency transactions are recognised in operating profit in the individual Group entity’s accounting records.
Non-monetary items arising from foreign currency transactions are not retranslated in the individual Group entity’s accounting records.
In the Consolidated Financial Statements, income and expense items for Group entities with a functional currency other than US dollars are translated into US dollars at average exchange rates, which approximate to actual rates, for the relevant accounting periods. Assets and liabilities are translated at the US dollar exchange rates prevailing at the reporting date. Exchange differences arising on consolidation are recognised in other comprehensive income.
If certain criteria are met, non-US dollar denominated loans or derivatives are designated as net investment hedges of foreign operations. Exchange differences arising on retranslation of net investments, and of foreign currency loans which are designated in an effective net investment hedge relationship, are recognised in other comprehensive income in the Consolidated Financial Statements. Foreign exchange derivatives hedging net investments in foreign operations are carried at fair value. Effective fair value movements are recognised in other comprehensive income, with any
ineffectiveness taken to profit. Gains and losses accumulated in the translation reserve will be recycled to profit when the foreign operation is sold.
Litigation and environmental liabilities
AstraZeneca is involved in legal disputes, the settlement of which may involve cost to the Group. Provision is made where an adverse outcome is probable and associated costs, including related legal costs, can be estimated reliably. In other cases, appropriate disclosures are included.
Where it is considered that the Group is more likely than not to prevail, or in the rare circumstances where the amount of the legal liability cannot be estimated reliably, legal costs involved in defending the claim are charged to profit as they are incurred.
Where it is considered that the Group has a valid contract which provides the right to reimbursement (from insurance or otherwise) of legal costs and/or all or part of any loss incurred or for which a provision has been established, the best estimate of the amount expected to be received is recognised as an asset only when it is virtually certain.
AstraZeneca is exposed to environmental liabilities relating to its past operations, principally in respect of soil and groundwater remediation costs. Provisions for these costs are made when there is a present obligation and where it is probable that expenditure on remedial work will be required and a reliable estimate can be made of the cost. Provisions are discounted where the effect is material.
Impairment
The carrying values of non-financial assets, other than inventories and deferred tax assets, are reviewed at least annually to determine whether there is any indication of impairment. For goodwill, intangible assets under development and for any other assets where such indication exists, the asset’s recoverable amount is estimated based on the greater of its value in use and its fair value less cost to sell. In assessing value in use, the estimated future cash flows, adjusted for the risks specific to each asset, are discounted to their present value using a discount rate that reflects current market assessments of the time value of money, the general risks affecting the pharmaceutical industry and other risks specific to each asset. For the purpose of impairment testing, assets are grouped together into the smallest group of assets that generates cash inflows from continuing use that are largely independent of the cash flows of other assets. Impairment losses are recognised immediately in profit.
| | |
| AstraZenecaAnnual Report and Form 20-F Information 2016 | | 145 |
Financial Statements
International accounting transition
On transition to using adopted IFRSs in the year ended 31 December 2005, the Group took advantage of several optional exemptions available in IFRS 1 ‘First-time Adoption of International Financial Reporting Standards’. The major impacts which are of continuing importance are detailed below:
| > | Business combinations – IFRS 3 ‘Business Combinations’ has been applied from 1 January 2003, the date of transition, rather than being applied fully retrospectively. As a result, the combination of Astra and Zeneca is still accounted for as a merger, rather than through purchase accounting. If purchase accounting had been adopted, Zeneca would have been deemed to have acquired Astra. |
| > | Cumulative exchange differences – the Group chose to set the cumulative exchange difference reserve at 1 January 2003 to nil. |
Applicable accounting standards and interpretations issued but not yet adopted
IFRS 9 ‘Financial Instruments’ was finalised by the IASB in July 2014 and is effective for accounting periods beginning on or after 1 January 2018. The new standard will replace existing accounting standards. It is applicable to financial assets and liabilities, and will introduce changes to existing accounting concerning classification and measurement, impairment (introducing an expected-loss method), hedge accounting, and on the treatment of gains arising from the impact of credit risk on the measurement of liabilities held at fair value. The standard was endorsed by the EU on 22 November 2016. The adoption of IFRS 9 is not expected to have a significant impact on the Group’s net results or net assets, although the full impact will be subject to further assessment. The Group will early adopt the treatment of fair value changes arising from changes in own credit risk from 1 January 2017.
IFRS 15 ‘Revenue from Contracts with Customers’ was issued by the IASB in May 2014. It is effective for accounting periods beginning on or after 1 January 2018. The new standard will replace existing accounting standards, and provides enhanced detail on the principle of recognising revenue to reflect the transfer of goods and services to customers at a value which the Company expects to be entitled to receive. The standard also updates revenue disclosure requirements. The standard was endorsed by the EU on 22 September 2016. The adoption of IFRS 15 is not expected to have a significant impact on the Group’s recognition of Product Sales. The Group is continuing to assess the impact of IFRS 15 on the results of the Group for other
revenue and income streams including, but not limited to, the impact on revenue from collaborative arrangements, licence income and milestone revenues.
IFRS 16 ‘Leases’ was issued by the IASB in January 2016 and is effective for accounting periods beginning on or after 1 January 2019. The new standard will replace IAS 17 ‘Leases’ and will eliminate the classification of leases as either operating leases or finance leases and, instead, introduce a single lessee accounting model. The standard has yet to be endorsed by the EU. The adoption of IFRS 16 is not expected to have a significant impact on the Group’s net results or net assets, although the full impact will be subject to further assessment.
In addition, the following amendments have been issued:
| > | Amendments to IFRS 10 and IAS 28 Sale or Contribution of Assets between an Investor and its Associate or Joint Venture. The IASB has deferred these amendments until a date to be determined by the IASB, although early application is permitted. |
| > | Amendments to IAS 12 Recognition of Deferred Tax Assets for Unrealised Losses, effective for periods beginning on or after 1 January 2017. |
| > | Amendments to IAS 7 Disclosure Initiative, effective for periods beginning on or after 1 January 2017. |
| > | Amendments to IFRS 2 Classification and Measurement of Share-based Payment Transactions, effective for periods beginning on or after 1 January 2018. |
The above amendments are not expected to have a significant impact on the Group’s net results, net assets or disclosures. The amendments have yet to be endorsed by the EU.
| | |
| 146 | | AstraZenecaAnnual Report and Form 20-F Information 2016 |
Notes to the Group Financial Statements
1 Revenue
Product Sales
| | | | | | | | | | | | |
| | |
| 2016
$m |
| |
| 2015
$m |
| |
| 2014
$m |
|
| | | |
| Oncology: | | | | | | | | | | | | |
| Faslodex | | | 830 | | | | 704 | | | | 720 | |
| Zoladex | | | 816 | | | | 816 | | | | 924 | |
| Iressa | | | 513 | | | | 543 | | | | 623 | |
| Tagrisso | | | 423 | | | | 19 | | | | – | |
| Casodex | | | 247 | | | | 267 | | | | 320 | |
| Arimidex | | | 232 | | | | 250 | | | | 298 | |
| Lynparza | | | 218 | | | | 94 | | | | – | |
| Others | | | 104 | | | | 132 | | | | 142 | |
| | | | 3,383 | | | | 2,825 | | | | 3,027 | |
| | | |
| Cardiovascular and Metabolic Diseases: | | | | | | | | | | | | |
| Crestor | | | 3,401 | | | | 5,017 | | | | 5,512 | |
| Brilinta | | | 839 | | | | 619 | | | | 476 | |
| Farxiga | | | 835 | | | | 492 | | | | 225 | |
| Seloken/Toprol-XL | | | 737 | | | | 710 | | | | 758 | |
| Onglyza | | | 720 | | | | 786 | | | | 820 | |
| Bydureon | | | 578 | | | | 580 | | | | 440 | |
| Atacand | | | 315 | | | | 358 | | | | 501 | |
| Byetta | | | 254 | | | | 316 | | | | 327 | |
| Plendil | | | 136 | | | | 234 | | | | 249 | |
| Tenormin | | | 106 | | | | 118 | | | | 161 | |
| Others | | | 195 | | | | 259 | | | | 333 | |
| | | | 8,116 | | | | 9,489 | | | | 9,802 | |
| | | |
| Respiratory: | | | | | | | | | | | | |
| Symbicort | | | 2,989 | | | | 3,394 | | | | 3,801 | |
| Pulmicort | | | 1,061 | | | | 1,014 | | | | 946 | |
| Tudorza/Eklira | | | 170 | | | | 190 | | | | 13 | |
| Daliresp/Daxas | | | 154 | | | | 104 | | | | – | |
| Rhinocort | | | 112 | | | | 120 | | | | 139 | |
| Others | | | 267 | | | | 165 | | | | 164 | |
| | | | 4,753 | | | | 4,987 | | | | 5,063 | |
| | | |
| Other: | | | | | | | | | | | | |
| Nexium | | | 2,032 | | | | 2,496 | | | | 3,655 | |
| Seroquel XR | | | 735 | | | | 1,025 | | | | 1,224 | |
| Synagis | | | 677 | | | | 662 | | | | 900 | |
| Local Anaesthetics | | | 329 | | | | 404 | | | | 488 | |
| Losec/Prilosec | | | 276 | | | | 340 | | | | 422 | |
| Seroquel IR | | | 231 | | | | 250 | | | | 178 | |
| Merrem | | | 201 | | | | 241 | | | | 253 | |
| Diprivan | | | 143 | | | | 200 | | | | 252 | |
| FluMist/Fluenz | | | 104 | | | | 288 | | | | 295 | |
| Others | | | 339 | | | | 434 | | | | 536 | |
| | | | 5,067 | | | | 6,340 | | | | 8,203 | |
| Product Sales | | | 21,319 | | | | 23,641 | | | | 26,095 | |
Externalisation Revenue
Externalisation Revenue in 2016 was $1,683m (2015: $1,067m; 2014: $452m).
In 2016, Externalisation Revenue includes $520m from Aspen Global Incorporated for our anaesthetics medicines portfolio, $298m from the sale of commercialisation rights forPlendil in China to China Medical System Holdings Ltd, and $175m from Aralez Pharmaceuticals Inc. for the US rights toToprol-XL.
In 2015, Externalisation Revenue includes $450m on entering into a collaboration with Celgene on durvalumab, $200m on entering into a collaboration with Daiichi Sankyo onMovantik and $100m on entering into a collaboration with Valeant on brodalumab.
In 2014, Externalisation Revenue includes $250m from a licence agreement with Pfizer onNexium OTC.
Royalty income of $119m (2015: $87m; 2014: $53m) is included in Externalisation Revenue.
| | |
| AstraZenecaAnnual Report and Form 20-F Information 2016 | | 147 |
Financial Statements
2 Operating profit
Operating profit includes the following significant items:
Selling, general and administrative costs
In 2016, selling, general and administrative costs includes a credit of $999m (2015: credit of $378m; 2014: charge of $529m) resulting from changes in the fair value of contingent consideration arising from the acquisition of the diabetes alliance with BMS. These adjustments reflect revised estimates for future sales performance for the products acquired and, as a result, revised estimates for future royalties payable.
In 2016, selling, general and administrative costs also includes a total of $223m (2015: $313m) of legal provisions relating to a number of legal proceedings in various jurisdictions in relation to several marketed products.
In July 2014, the US Internal Revenue Service issued final regulations that affected the recognition of the annual Branded Pharmaceutical Fee, imposed by the health care reform legislation in 2010. As a result, entities covered by the legislation now accrue for the obligation as each sale occurs. AstraZeneca recorded a catch-up charge of $226m in 2014 to reflect this new basis, $113m of which was recorded in selling, general and administrative costs and $113m as a deduction from revenue.
Further details of impairment charges for 2016, 2015 and 2014 are included in Notes 7 and 9.
Other operating income and expense
| | | | | | | | | | | | |
| | | 2016 $m | | | 2015 $m | | | 2014 $m | |
| | | |
| Royalties | | | | | | | | | | | | |
Income | | | 406 | | | | 322 | | | | 533 | |
Amortisation | | | (86 | ) | | | (114 | ) | | | (212 | ) |
| Impairment of intangible assets | | | – | | | | (64 | ) | | | (18 | ) |
| Gains on disposal of intangible assets | | | 1,301 | | | | 961 | | | | – | |
| Net gains/(losses) on disposal of other non-current assets | | | 29 | | | | 85 | | | | (235 | ) |
| Other income | | | 146 | | | | 327 | | | | 290 | |
| Other expense | | | (141 | ) | | | (17 | ) | | | (23 | ) |
| Other operating income and expense | | | 1,655 | | | | 1,500 | | | | 335 | |
Royalty amortisation and impairment relates to income streams acquired with MedImmune and amounts relating to our arrangements with Merck.
Gains on disposal of intangible assets in 2016 includes $368m on the disposal of the small molecule antibiotics business in most markets outside the US, $321m on the disposal of Rest of World rights toRhinocort Aqua, $231m on the disposal of global rights to MEDI2070 and $183m on the disposal of Rest of World rights toImdur.
Gains on disposal of intangible assets in 2015 includes $380m on the disposal of US rights toEntocort, $215m on the disposal of Rest of World rights toEntocort, $193m on the disposal of global rights toMyalept and $165m on the disposal of global rights toCaprelsa.
Net losses on disposal of non-current assets in 2014 included a loss of $292m on disposal of Alderley Park.
Restructuring costs
The tables below show the costs that have been charged in respect of restructuring programmes by cost category and type. Severance provisions are detailed in Note 19.
| | | | | | | | | | | | |
| | | 2016 $m | | | 2015 $m | | | 2014 $m | |
| Cost of sales | | | 130 | | | | 158 | | | | 107 | |
| Research and development expense | | | 178 | | | | 258 | | | | 497 | |
| Selling, general and administrative costs | | | 823 | | | | 618 | | | | 662 | |
| Other operating income and expense | | | (24 | ) | | | – | | | | 292 | |
| Total charge | | | 1,107 | | | | 1,034 | | | | 1,558 | |
| | | | | | | | | | | | | |
| | | 2016 $m | | | 2015 $m | | | 2014 $m | |
| Severance costs | | | 505 | | | | 298 | | | | 246 | |
| Accelerated depreciation and impairment | | | 46 | | | | 81 | | | | 153 | |
| Relocation costs | | | 18 | | | | 34 | | | | 209 | |
| Loss on disposal of Alderley Park | | | – | | | | – | | | | 292 | |
| Other | | | 538 | | | | 621 | | | | 658 | |
| Total charge | | | 1,107 | | | | 1,034 | | | | 1,558 | |
Other costs are those incurred in designing and implementing the Group’s various restructuring initiatives including costs of decommissioning sites impacted by changes to our global footprint, temporary leave costs during relocation, internal project costs, and external consultancy fees.
| | |
| 148 | | AstraZenecaAnnual Report and Form 20-F Information 2016 |
2 Operating profitcontinued
Financial instruments
Included within operating profit are the following net gains and losses on financial instruments:
| | | | | | | | | | | | |
| | |
| 2016
$m |
| |
| 2015
$m |
| |
| 2014
$m |
|
| Losses on forward foreign exchange contracts | | | (216 | ) | | | (22 | ) | | | (98 | ) |
| Gains/(losses) on receivables and payables | | | 132 | | | | (36 | ) | | | (64 | ) |
| Gains and losses on available for sale investments | | | – | | | | 74 | | | | 31 | |
| Total | | | (84 | ) | | | 16 | | | | (131 | ) |
Gains and losses on available for sale investments includes no gains or losses (2015: gains of $43m; 2014: gains of $9m) which have been reclassified from other comprehensive income.
3 Finance income and expense
| | | | | | | | | | | | |
| | |
| 2016
$m |
| |
| 2015
$m |
| |
| 2014
$m |
|
| | | |
| Finance income | | | | | | | | | | | | |
| Returns on fixed deposits and equity securities | | | 8 | | | | 8 | | | | 10 | |
| Returns on short-term deposits | | | 35 | | | | 28 | | | | 23 | |
| Fair value gains on debt and interest rate swaps | | | – | | | | 10 | | | | 16 | |
| Net exchange gains | | | 8 | | | | – | | | | 29 | |
| Discount unwind on other long-term assets | | | 16 | | | | – | | | | – | |
| Total | | | 67 | | | | 46 | | | | 78 | |
| | | |
| Finance expense | | | | | | | | | | | | |
| Interest on debt and commercial paper | | | (565 | ) | | | (361 | ) | | | (383 | ) |
| Interest on overdrafts, finance leases and other financing costs | | | (52 | ) | | | (31 | ) | | | (35 | ) |
| Net interest on post-employment defined benefit plan net liabilities (Note 20) | | | (63 | ) | | | (77 | ) | | | (92 | ) |
| Net exchange losses | | | – | | | | (36 | ) | | | – | |
| Discount unwind on contingent consideration arising from business combinations (Note 18) | | | (497 | ) | | | (524 | ) | | | (391 | ) |
| Discount unwind on other long-term liabilities | | | (190 | ) | | | (46 | ) | | | (62 | ) |
| Fair value losses on debt and interest rate swaps | | | (17 | ) | | | – | | | | – | |
| Total | | | (1,384 | ) | | | (1,075 | ) | | | (963 | ) |
| Net finance expense | | | (1,317 | ) | | | (1,029 | ) | | | (885 | ) |
Financial instruments
Included within finance income and expense are the following net gains and losses on financial instruments:
| | | | | | | | | | | | |
| | |
| 2016
$m |
| |
| 2015
$m |
| |
| 2014
$m |
|
| Interest and fair value adjustments in respect of debt designated at fair value through profit or loss, net of derivatives | | | (14 | ) | | | 6 | | | | (7 | ) |
| Interest and changes in carrying values of debt designated as hedged items, net of derivatives | | | (21 | ) | | | (10 | ) | | | 8 | |
| Interest and fair value changes on fixed and short-term deposits, equity securities and other derivatives | | | 74 | | | | 46 | | | | 45 | |
| Interest on debt, overdrafts, finance leases and commercial paper held at amortised cost | | | (553 | ) | | | (384 | ) | | | (415 | ) |
Fair value losses of $29m (2015: $30m fair value losses; 2014: $29m fair value losses) on interest rate fair value hedging instruments and $30m fair value gains (2015: $30m fair value gains; 2014: $29m fair value gains) on the related hedged items have been included within interest and changes in carrying values of debt designated as hedged items, net of derivatives. All fair value hedge relationships were effective during the year.
Fair value losses of $12m (2015: $5m fair value losses; 2014: $4m fair value losses) on derivatives related to debt instruments designated at fair value through profit or loss and $9m fair value gains (2015: $15m fair value gains; 2014: $3m fair value gains) on debt instruments designated at fair value through profit or loss have been included within interest and fair value adjustments in respect of debt designated at fair value through profit or loss, net of derivatives. Ineffectiveness on the net investment hedge taken to profit was $nil (2015: $nil; 2014: $nil).
| | |
| AstraZenecaAnnual Report and Form 20-F Information 2016 | | 149 |
Financial Statements
4 Taxation
Taxation recognised in the profit for the period in the consolidated statement of comprehensive income is as follows:
| | | | | | | | | | | | |
| | |
| 2016
$m |
| |
| 2015
$m |
| |
| 2014
$m |
|
| | | |
| Current tax expense | | | | | | | | | | | | |
| Current year | | | 384 | | | | 1,037 | | | | 981 | |
| Adjustment to prior years | | | (14 | ) | | | (404 | ) | | | (109 | ) |
| Total | | | 370 | | | | 633 | | | | 872 | |
| | | |
| Deferred tax expense | | | | | | | | | | | | |
| Origination and reversal of temporary differences | | | (94 | ) | | | (482 | ) | | | (833 | ) |
| Adjustment to prior years | | | (130 | ) | | | 92 | | | | (28 | ) |
| Total | | | (224 | ) | | | (390 | ) | | | (861 | ) |
| Taxation recognised in the profit for the period | | | 146 | | | | 243 | | | | 11 | |
Taxation relating to components of other comprehensive income is as follows:
| | | | | | | | | | | | |
| | |
| 2016
$m |
| |
| 2015
$m |
| |
| 2014
$m |
|
| Current and deferred tax | | | | | | | | | | | | |
| | | |
| Items that will not be reclassified to profit or loss: | | | | | | | | | | | | |
Remeasurement of the defined benefit liability | | | 110 | | | | (133 | ) | | | 182 | |
Deferred tax impact of reduction in UK tax rate | | | (25 | ) | | | (58 | ) | | | – | |
Share-based payments | | | 51 | | | | (8 | ) | | | 34 | |
| Total | | | 136 | | | | (199 | ) | | | 216 | |
| | | |
| Items that may be reclassified subsequently to profit or loss: | | | | | | | | | | | | |
Foreign exchange arising on consolidation | | | 63 | | | | (8 | ) | | | (39 | ) |
Foreign exchange arising on designating borrowings in net investment hedges | | | 83 | | | | 80 | | | | 150 | |
Net available for sale (gains)/losses recognised in other comprehensive income | | | (61 | ) | | | 14 | | | | (64 | ) |
Other | | | 1 | | | | 1 | | | | 3 | |
| Total | | | 86 | | | | 87 | | | | 50 | |
| Taxation relating to components of other comprehensive income | | | 222 | | | | (112 | ) | | | 266 | |
The reported tax rate of 4% for the year ended 31 December 2016 benefited from a $453m adjustment following agreements between the Canadian tax authority and the UK and Swedish tax authorities in respect of transfer pricing arrangements for the 13-year period from 2004 to 2016. Excluding these effects, the reported tax rate for the year was 17%.
The cash tax paid for the year was $412m which was 12% of profit before tax. Cash tax was lower in 2016 due to refunds arising in relation to agreement of prior period tax liabilities and audit settlements.
Taxation has been provided at current rates on the profits earned for the periods covered by the Group Financial Statements. The 2016 prior period current tax adjustment relates mainly to net reductions in provisions for tax contingencies totalling $67m and tax accrual to tax return adjustments. The 2015 prior period current tax adjustment relates mainly to a $186m tax benefit following agreement of US federal tax liabilities of open years to 2008, net reductions in provisions for tax contingencies totalling $259m and tax accrual to tax return adjustments. The 2014 prior period current tax adjustment relates mainly to a reduction in provisions for tax contingencies, including a benefit of $117m arising from the inter-governmental agreement of a transfer pricing matter, partially offset by tax accrual to tax return adjustments.
The 2016 prior period deferred tax adjustments relate mainly to tax accrual to tax return adjustments and releases in provisions for tax contingencies. The 2015 and 2014 prior period deferred tax adjustments relate mainly to tax accrual to tax return adjustments.
To the extent that dividends remitted from overseas subsidiaries, joint ventures and associates are expected to result in additional taxes, appropriate amounts have been provided for. No deferred tax has been provided for unremitted earnings of Group companies overseas as these are considered permanently employed in the business of these companies. Unremitted earnings may be liable to overseas taxes and/or UK taxation (after allowing for double tax relief) if distributed as dividends. The aggregate amount of temporary differences associated with investments in subsidiaries and branches for which deferred tax liabilities have not been recognised totalled approximately $6,884m at 31 December 2016 (2015: $6,957m; 2014: $6,128m).
Factors affecting future tax charges
As a group with worldwide operations, AstraZeneca is subject to several factors that may affect future tax charges, principally the levels and mix of profitability in different jurisdictions, transfer pricing regulations, tax rates imposed and tax regime reforms. In 2016, the UK Government enacted legislation to reduce the main rate of UK Statutory Corporation Tax to 17% by 2020. Details of material tax exposures and items currently under audit and negotiation are set out in Note 28.
| | |
| 150 | | AstraZenecaAnnual Report and Form 20-F Information 2016 |
4 Taxationcontinued
Tax reconciliation to UK statutory rate
The table below reconciles the UK statutory tax charge to the Group’s total tax charge.
| | | | | | | | | | | | |
| | |
| 2016
$m |
| |
| 2015
$m |
| |
| 2014
$m |
|
| Profit before tax | | | 3,552 | | | | 3,069 | | | | 1,246 | |
| Notional taxation charge at UK corporation tax rate of 20% (2015: 20.25%; 2014: 21.5%) | | | 710 | | | | 621 | | | | 268 | |
| Differences in effective overseas tax rates | | | (233 | ) | | | (144 | ) | | | (195 | ) |
| Deferred tax (credit)/charge relating to reduction in UK and other tax rates1 | | | (16 | ) | | | (25 | ) | | | 23 | |
| Unrecognised deferred tax asset2 | | | 242 | | | | 149 | | | | 34 | |
| Items not deductible for tax purposes | | | 132 | | | | 29 | | | | 50 | |
| Items not chargeable for tax purposes | | | (7 | ) | | | – | | | | (39 | ) |
| Other items3 | | | (538 | ) | | | (75 | ) | | | 7 | |
| Adjustments in respect of prior periods4 | | | (144 | ) | | | (312 | ) | | | (137 | ) |
| Total tax charge for the year | | | 146 | | | | 243 | | | | 11 | |
| 1 | The 2016 item relates to the reduction in the UK Statutory Corporation Tax rate from 18% to 17% effective from 1 April 2020. The 2015 item relates to the reduction in the UK Statutory Corporation Tax rate from 20% to 18% previously announced to be effective from 1 April 2020. The 2014 item relates to the reduction in the UK Statutory Corporation Tax rate from 23% to 20% effective from 1 April 2015. |
| 2 | Includes an amount of $122m in relation to a write down of a previously recognised deferred tax asset. |
| 3 | Other items relate to the release of tax contingencies following agreements between the Canadian tax authority and the UK and Swedish tax authorities in respect of transfer pricing arrangements for the 13-year period from 2004 to 2016 (credit of $453m) and release of certain tax contingencies following the expiry of the relevant statute of limitations (credit of $280m) partially offset by provision build for transfer pricing contingencies (charge of $195m). Other items in 2015 included the impact of internal transfers of intellectual property (tax charge of $181m) and the release of certain tax contingencies following the expiry of the relevant statute of limitations (tax credit of $256m). Other items in 2014 included the impact of internal transfers of intellectual property including recognition of deferred tax benefits acquired as part of a business combination (tax charge of $304m), and the release of certain tax contingencies following the expiry of the relevant statute of limitations (tax credits of $297m). |
| 4 | Further detail explaining the adjustments in respect of prior periods is set out above on page 150. |
AstraZeneca is domiciled in the UK but operates in other countries where the tax rates and tax laws are different to those in the UK. The impact of differences in effective overseas tax rates on the Group’s overall tax charge is noted above. Profits arising from our manufacturing operation in Puerto Rico are granted special status and are taxed at a reduced rate compared with the normal rate of tax in that territory under a tax incentive grant continuing until 2031.
Deferred tax
The movements in the net deferred tax balance during the year are as follows:
| | | | | | | | | | | | | | | | | | | | | | | | | | | | |
| | |
| Intangibles,
property, plant & equipment $m |
1 | |
| Pension and
post-retirement benefits $m |
| |
| Intercompany
inventory transfers $m |
| |
| Untaxed
reserves $m |
2 | |
| Losses and
tax credits carried forward $m |
3 | |
| Accrued
expenses and other $m |
| |
| Total
$m |
|
| Net deferred tax balance at 1 January 2014 | | | (3,064 | ) | | | 510 | | | | 736 | | | | (1,114 | ) | | | 573 | | | | 737 | | | | (1,622 | ) |
| Taxation expense | | | 543 | | | | (4 | ) | | | (6 | ) | | | 368 | | | | (44 | ) | | | 4 | | | | 861 | |
| Other comprehensive income | | | 150 | | | | 215 | | | | – | | | | – | | | | – | | | | (35 | ) | | | 330 | |
| Additions through business combinations4 | | | (147 | ) | | | – | | | | (35 | ) | | | – | | | | – | | | | 37 | | | | (145 | ) |
| Exchange | | | 40 | | | | (93 | ) | | | (65 | ) | | | 168 | | | | (4 | ) | | | (47 | ) | | | (1 | ) |
| Net deferred tax balance at 31 December 2014 | | | (2,478 | ) | | | 628 | | | | 630 | | | | (578 | ) | | | 525 | | | | 696 | | | | (577 | ) |
| Taxation expense | | | 355 | | | | 30 | | | | 156 | | | | (156 | ) | | | 58 | | | | (53 | ) | | | 390 | |
| Other comprehensive income | | | 80 | | | | (198 | ) | | | – | | | | – | | | | – | | | | (9 | ) | | | (127 | ) |
| Additions through business combinations (restated)5 | | | (1,206 | ) | | | – | | | | – | | | | – | | | | 229 | | | | – | | | | (977 | ) |
| Exchange | | | (12 | ) | | | (33 | ) | | | (48 | ) | | | 42 | | | | (8 | ) | | | (21 | ) | | | (80 | ) |
| Net deferred tax balance at 31 December 2015 (restated)5 | | | (3,261 | ) | | | 427 | | | | 738 | | | | (692 | ) | | | 804 | | | | 613 | | | | (1,371 | ) |
| Income statement | | | (132 | ) | | | 11 | | | | 314 | | | | (53 | ) | | | 151 | | | | (67 | ) | | | 224 | |
| Other comprehensive income | | | 83 | | | | 101 | | | | – | | | | – | | | | – | | | | (24 | ) | | | 160 | |
| Additions through business combinations6 | | | (1,827 | ) | | | – | | | | – | | | | – | | | | 50 | | | | – | | | | (1,777 | ) |
| Exchange | | | (1 | ) | | | (74 | ) | | | (38 | ) | | | 48 | | | | (1 | ) | | | (13 | ) | | | (79 | ) |
| Other movements7 | | | (11 | ) | | | – | | | | – | | | | – | | | | – | | | | – | | | | (11 | ) |
| Net deferred tax balance at 31 December 20168 | | | (5,149 | ) | | | 465 | | | | 1,014 | | | | (697 | ) | | | 1,004 | | | | 509 | | | | (2,854 | ) |
| 1 | Includes deferred tax on contingent liabilities in respect of intangibles. |
| 2 | Untaxed reserves relate to taxable profits where the tax liability is deferred to later periods. |
| 3 | Includes losses and tax credits carried forward which will expire within nine to 20 years. |
| 4 | The deferred tax liability of $145m relates to the acquisition of BMS’s share of Global Diabetes Alliance Assets ($28m) and the acquisition of Definiens Group ($117m). |
| 5 | The deferred tax liability of $977m relates to the acquisition of ZS Pharma, which has been restated (see Note 25). |
| 6 | The deferred tax liability of $1,777m relates to the acquisition of Acerta Pharma. |
| 7 | Arising on the deconsolidation of Entasis as detailed in Note 10. |
| 8 | The UK had a net deferred tax asset of $172m as at 31 December 2016, mainly in respect of the pension and post-retirement benefits, which has been recognised on the basis of sufficient forecast future taxable profits against which the deductible temporary differences can be utilised. |
| | |
| AstraZenecaAnnual Report and Form 20-F Information 2016 | | 151 |
Financial Statements
4 Taxationcontinued
The net deferred tax balance, before the offset of balances within countries, consists of:
| | | | | | | | | | | | | | | | | | | | | | | | | | | | |
| | |
| Intangibles,
property, plant & equipment $m |
| |
| Pension and
post-retirement benefits $m |
| |
| Intercompany
inventory transfers $m |
| |
| Untaxed
reserves $m |
| |
| Losses and
tax credits carried forward $m |
| |
| Accrued
expenses and other $m |
| |
| Total
$m |
|
| Deferred tax assets at 31 December 2014 | | | 1,212 | | | | 631 | | | | 657 | | | | – | | | | 525 | | | | 838 | | | | 3,863 | |
| Deferred tax liabilities at 31 December 2014 | | | (3,690 | ) | | | (3 | ) | | | (27 | ) | | | (578 | ) | | | – | | | | (142 | ) | | | (4,440 | ) |
| Net deferred tax balance at 31 December 2014 | | | (2,478 | ) | | | 628 | | | | 630 | | | | (578 | ) | | | 525 | | | | 696 | | | | (577 | ) |
| Deferred tax assets at 31 December 2015 (restated)* | | | 1,055 | | | | 430 | | | | 780 | | | | – | | | | 804 | | | | 732 | | | | 3,801 | |
| Deferred tax liabilities at 31 December 2015 | | | (4,316 | ) | | | (3 | ) | | | (42 | ) | | | (692 | ) | | | – | | | | (119 | ) | | | (5,172 | ) |
| Net deferred tax balance at 31 December 2015 (restated)* | | | (3,261 | ) | | | 427 | | | | 738 | | | | (692 | ) | | | 804 | | | | 613 | | | | (1,371 | ) |
| Deferred tax assets at 31 December 2016 | | | 875 | | | | 465 | | | | 1,014 | | | | – | | | | 1,004 | | | | 629 | | | | 3,987 | |
| Deferred tax liabilities at 31 December 2016 | | | (6,024 | ) | | | – | | | | – | | | | (697 | ) | | | – | | | | (120 | ) | | | (6,841 | ) |
| Net deferred tax balance at 31 December 2016 | | | (5,149 | ) | | | 465 | | | | 1,014 | | | | (697 | ) | | | 1,004 | | | | 509 | | | | (2,854 | ) |
| * | 2015 comparatives have been restated to reflect an adjustment to the acquisition accounting for ZS Pharma (see Note 25). |
Analysed in the statement of financial position, after offset of balances within countries, as:
| | | | | | | | | | | | |
| | |
| 2016
$m |
| |
| 2015
Restated $m |
* | |
| 2014
$m |
|
| Deferred tax assets | | | 1,102 | | | | 1,294 | | | | 1,219 | |
| Deferred tax liabilities | | | (3,956 | ) | | | (2,665 | ) | | | (1,796 | ) |
| Net deferred tax balance | | | (2,854 | ) | | | (1,371 | ) | | | (577 | ) |
| * | 2015 comparatives have been restated to reflect an adjustment to the acquisition accounting for ZS Pharma (see Note 25). |
Unrecognised deferred tax assets
Deferred tax assets of $542m have not been recognised in respect of deductible temporary differences (2015: $414m; 2014: $216m) because it is not probable that future taxable profit will be available against which the Group can utilise the benefits therefrom.
5 Earnings per $0.25 Ordinary Share
| | | | | | | | | | | | |
| | | 2016 | | | 2015 | | | 2014 | |
| Profit for the year attributable to equity holders ($m) | | | 3,499 | | | | 2,825 | | | | 1,233 | |
| Basic earnings per Ordinary Share | | | $2.77 | | | | $2.23 | | | | $0.98 | |
| Diluted earnings per Ordinary Share | | | $2.76 | | | | $2.23 | | | | $0.98 | |
| Weighted average number of Ordinary Shares in issue for basic earnings (millions) | | | 1,265 | | | | 1,264 | | | | 1,262 | |
| Dilutive impact of share options outstanding (millions) | | | 1 | | | | 1 | | | | 2 | |
| Diluted weighted average number of Ordinary Shares in issue (millions) | | | 1,266 | | | | 1,265 | | | | 1,264 | |
The earnings figures used in the calculations above are post-tax.
6 Segment information
AstraZeneca is engaged in a single business activity of biopharmaceuticals and the Group does not have multiple operating segments.
AstraZeneca’s biopharmaceuticals business consists of the discovery and development of new products, which are then manufactured, marketed and sold. All of these functional activities take place (and are managed) globally on a highly integrated basis. These individual functional areas are not managed separately.
The SET, established and chaired by the CEO, is the vehicle through which he exercises the authority delegated to him from the Board for the management, development and performance of our business. It is considered that the SET is AstraZeneca’s chief operating decision making body (as defined by IFRS 8 ‘Operating Segments’). The operation of the SET is principally driven by the management of the commercial operations, R&D, and manufacturing and supply. In addition to the CEO, CFO, the General Counsel and the Chief Compliance Officer, the SET comprises 10 Executive Vice-Presidents representing IMED, MedImmune, Global Medicines Development, North America, Europe, International East, International West, GPPS, Operations & Information Technology, and Human Resources. All significant operating decisions are taken by the SET. While members of the SET have responsibility for implementation of decisions in their respective areas, operating decision making is at SET level as a whole. Where necessary, these are implemented through cross-functional sub-committees that consider the Group-wide impact of a new decision. For example, product launch decisions would be initially considered by the SET and, on approval, passed to an appropriate sub-team for implementation. The impacts of being able to develop, produce, deliver and commercialise a wide range of pharmaceutical products drive the SET decision making process.
| | |
| 152 | | AstraZenecaAnnual Report and Form 20-F Information 2016 |
6 Segment informationcontinued
In assessing performance, the SET reviews financial information on an integrated basis for the Group as a whole, substantially in the form of, and on the same basis as, the Group’s IFRS Financial Statements. The high upfront cost of discovering and developing new products coupled with the relatively insignificant and stable unit cost of production means that there is not the clear link that exists in many manufacturing businesses between the revenue generated on an individual product sale and the associated cost and hence margin generated on a product. Consequently, the profitability of individual drugs or classes of drugs is not considered a key measure of performance for the business and is not monitored by the SET.
Resources are allocated on a Group-wide basis according to need. In particular, capital expenditure, in-licensing, and R&D resources are allocated between activities on merit, based on overall therapeutic considerations and strategy under the aegis of the Group’s Early Stage Product Committees and a single Late Stage Product Committee.
Geographic areas
The following tables show information by geographic area and, for Total Revenue and property, plant and equipment, material countries. The figures show the Total Revenue, operating profit and profit before tax made by companies located in that area/country, together with segment assets, segment assets acquired, net operating assets, and property, plant and equipment owned by the same companies; export sales and the related profit are included in the area/country where the legal entity resides and from which those sales were made.
| | | | | | | | | | | | |
| | | | Total Revenue | |
| | |
| 2016
$m |
| |
| 2015
$m |
| |
| 2014
$m |
|
| | | |
| UK | | | | | | | | | | | | |
| External | | | 1,849 | | | �� | 2,176 | | | | 1,878 | |
| Intra-Group | | | 7,503 | | | | 6,001 | | | | 4,718 | |
| | | | 9,352 | | | | 8,177 | | | | 6,596 | |
| | | |
| Continental Europe | | | | | | | | | | | | |
| Belgium | | | 163 | | | | 176 | | | | 260 | |
| France | | | 899 | | | | 1,015 | | | | 1,325 | |
| Germany | | | 615 | | | | 608 | | | | 687 | |
| Italy | | | 529 | | | | 544 | | | | 688 | |
| Spain | | | 440 | | | | 426 | | | | 495 | |
| Sweden | | | 1,522 | | | | 645 | | | | 639 | |
| Others | | | 1,412 | | | | 1,448 | | | | 1,794 | |
| Intra-Group | | | 4,108 | | | | 4,664 | | | | 4,763 | |
| | | | 9,688 | | | | 9,526 | | | | 10,651 | |
| | | |
| The Americas | | | | | | | | | | | | |
| Canada | | | 495 | | | | 530 | | | | 583 | |
| US | | | 7,828 | | | | 9,949 | | | | 10,692 | |
| Others | | | 846 | | | | 1,018 | | | | 1,165 | |
| Intra-Group | | | 3,487 | | | | 2,167 | | | | 2,346 | |
| | | | 12,656 | | | | 13,664 | | | | 14,786 | |
| | | |
| Asia, Africa & Australasia | | | | | | | | | | | | |
| Australia | | | 385 | | | | 435 | | | | 657 | |
| China | | | 2,650 | | | | 2,548 | | | | 2,228 | |
| Japan | | | 2,145 | | | | 1,985 | | | | 2,202 | |
| Others | | | 1,224 | | | | 1,205 | | | | 1,254 | |
| Intra-Group | | | 85 | | | | 46 | | | | 56 | |
| | | | 6,489 | | | | 6,219 | | | | 6,397 | |
| Continuing operations | | | 38,185 | | | | 37,586 | | | | 38,430 | |
| Intra-Group eliminations | | | (15,183 | ) | | | (12,878 | ) | | | (11,883 | ) |
| Total Revenue | | | 23,002 | | | | 24,708 | | | | 26,547 | |
Export sales from the UK totalled $8,421m for the year ended 31 December 2016 (2015: $6,851m; 2014: $5,709m). Intra-Group pricing is determined on an arm’s length basis.
| | |
| AstraZenecaAnnual Report and Form 20-F Information 2016 | | 153 |
Financial Statements
6 Segment informationcontinued
| | | | | | | | | | | | | | | | | | | | | | | | | | | | |
| | | | Operating (loss)/profit | | | | | | | | (Loss)/profit before tax | |
| | |
| 2016
$m |
| |
| 2015
$m |
| |
| 2014
$m |
| | | | | |
| 2016
$m |
| |
| 2015
$m |
| |
| 2014
$m |
|
| UK | | | (526 | ) | | | (743 | ) | | | (851 | ) | | | | | | | (950 | ) | | | (1,113 | ) | | | (1,174 | ) |
| Continental Europe | | | 3,695 | | | | 3,412 | | | | 1,780 | | | | | | | | 3,136 | | | | 3,023 | | | | 1,477 | |
| The Americas | | | 1,259 | | | | 1,101 | | | | 818 | | | | | | | | 919 | | | | 821 | | | | 549 | |
| Asia, Africa & Australasia | | | 474 | | | | 344 | | | | 390 | | | | | | | | 447 | | | | 338 | | | | 394 | |
| Continuing operations | | | 4,902 | | | | 4,114 | | | | 2,137 | | | | | | | | 3,552 | | | | 3,069 | | | | 1,246 | |
| | | | | | | | | | | | | | | | | | | | | | | | | | | | | |
| | | | Non-current assets1 | | | | | | | | Total assets | |
| | |
| 2016
$m |
| |
| 2015
Restated $m |
* | |
| 2014
$m |
| | | | | |
| 2016
$m |
| |
| 2015
Restated $m |
* | |
| 2014
$m |
|
| UK | | | 5,127 | | | | 6,251 | | | | 5,826 | | | | | | | | 12,704 | | | | 14,712 | | | | 14,926 | |
| Continental Europe | | | 15,731 | | | | 8,690 | | | | 8,764 | | | | | | | | 18,174 | | | | 10,636 | | | | 11,184 | |
| The Americas | | | 26,044 | | | | 26,431 | | | | 24,750 | | | | | | | | 28,792 | | | | 31,536 | | | | 29,324 | |
| Asia, Africa & Australasia | | | 917 | | | | 937 | | | | 874 | | | | | | | | 2,856 | | | | 3,172 | | | | 3,161 | |
| Continuing operations | | | 47,819 | | | | 42,309 | | | | 40,214 | | | | | | | | 62,526 | | | | 60,056 | | | | 58,595 | |
| | | | | | | | | | | | | | | | | | | | | | | | | | | | | |
| | | | Assets acquired2 | | | | | | | | Net operating assets3 | |
| | |
| 2016
$m |
| |
| 2015
Restated $m |
* | |
| 2014
$m |
| | | | | |
| 2016
$m |
| |
| 2015
$m |
| |
| 2014
$m |
|
| UK | | | 362 | | | | 1,478 | | | | 2,703 | | | | | | | | 3,306 | | | | 3,713 | | | | 3,002 | |
| Continental Europe | | | 8,494 | | | | 653 | | | | 6,362 | | | | | | | | 8,479 | | | | 3,704 | | | | 4,110 | |
| The Americas | | | 688 | | | | 4,147 | | | | 2,732 | | | | | | | | 20,969 | | | | 22,334 | | | | 20,190 | |
| Asia, Africa & Australasia | | | 129 | | | | 172 | | | | 199 | | | | | | | | 1,030 | | | | 1,458 | | | | 1,570 | |
| Continuing operations | | | 9,673 | | | | 6,450 | | | | 11,996 | | | | | | | | 33,784 | | | | 31,209 | | | | 28,872 | |
| * | 2015 comparatives have been restated to reflect an adjustment to the acquisition accounting for ZS Pharma (see Note 25). |
| 1 | Non-current assets exclude deferred tax assets and derivative financial instruments. |
| 2 | Included in Assets acquired are those assets that are expected to be used during more than one period (property, plant and equipment, goodwill and intangible assets). |
| 3 | Net operating assets exclude short-term investments, cash, short-term borrowings, loans, derivative financial instruments, retirement benefit obligations and non-operating receivables and payables. |
| | | | | | | | | | | | |
| | | Property, plant and equipment | |
| | | 2016
$m | | | 2015
$m | | | 2014
$m | |
| UK | | | 1,026 | | | | 1,024 | | | | 824 | |
| Sweden | | | 1,142 | | | | 1,023 | | | | 971 | |
| US | | | 3,233 | | | | 2,986 | | | | 2,830 | |
| Rest of the world | | | 1,447 | | | | 1,380 | | | | 1,385 | |
| Continuing operations | | | 6,848 | | | | 6,413 | | | | 6,010 | |
Geographic markets
The table below shows Product Sales in each geographic market in which customers are located.
| | | | | | | | | | | | |
| | | 2016 $m | | | 2015 $m | | | 2014 $m | |
| UK | | | 487 | | | | 588 | | | | 773 | |
| Continental Europe | | | 4,987 | | | | 5,180 | | | | 6,394 | |
| The Americas | | | 8,717 | | | | 11,031 | | | | 11,892 | |
| Asia, Africa & Australasia | | | 7,128 | | | | 6,842 | | | | 7,036 | |
| Continuing operations | | | 21,319 | | | | 23,641 | | | | 26,095 | |
Product Sales are recognised when the significant risks and rewards of ownership have been transferred to a third party. In general this is upon delivery of the products to wholesalers. Transactions with one wholesaler (2015: two; 2014: two) individually represented greater than 10% of Product Sales. The value of these transactions recorded as Product Sales were $2,851m (2015: $3,458m and $2,757m; 2014: $3,261m and $2,674m).
| | |
| 154 | | AstraZenecaAnnual Report and Form 20-F Information 2016 |
7 Property, plant and equipment
| | | | | | | | | | | | | | | | |
| | |
| Land and
buildings $m |
| |
| Plant and
equipment
$m |
| |
| Assets in course
of construction $m |
| |
| Total property,
plant and equipment $m |
|
| | | | |
| Cost | | | | | | | | | | | | | | | | |
| At 1 January 2014 | | | 5,683 | | | | 8,453 | | | | 771 | | | | 14,907 | |
| Capital expenditure | | | 34 | | | | 184 | | | | 874 | | | | 1,092 | |
| Additions through business combinations (Note 25) | | | 213 | | | | 206 | | | | 96 | | | | 515 | |
| Transfers in from other non-current assets | | | 156 | | | | 124 | | | | 70 | | | | 350 | |
| Transfer of assets into use | | | 136 | | | | 405 | | | | (541 | ) | | | – | |
| Disposals and other movements | | | (976 | ) | | | (962 | ) | | | (27 | ) | | | (1,965 | ) |
| Exchange adjustments | | | (334 | ) | | | (698 | ) | | | (123 | ) | | | (1,155 | ) |
| At 31 December 2014 | | | 4,912 | | | | 7,712 | | | | 1,120 | | | | 13,744 | |
| Capital expenditure | | | 23 | | | | 223 | | | | 1,155 | | | | 1,401 | |
| Additions through business combinations (Note 25) | | | 21 | | | | – | | | | – | | | | 21 | |
| Transfer of assets into use | | | 269 | | | | 359 | | | | (628 | ) | | | – | |
| Disposals and other movements | | | (239 | ) | | | (442 | ) | | | (3 | ) | | | (684 | ) |
| Exchange adjustments | | | (174 | ) | | | (384 | ) | | | (76 | ) | | | (634 | ) |
| At 31 December 2015 | | | 4,812 | | | | 7,468 | | | | 1,568 | | | | 13,848 | |
| Capital expenditure | | | 29 | | | | 206 | | | | 1,214 | | | | 1,449 | |
| Transfer of assets into use | | | 222 | | | | 109 | | | | (331 | ) | | | – | |
| Disposals and other movements | | | (236 | ) | | | (700 | ) | | | (16 | ) | | | (952 | ) |
| Exchange adjustments | | | (211 | ) | | | (540 | ) | | | (143 | ) | | | (894 | ) |
| At 31 December 2016 | | | 4,616 | | | | 6,543 | | | | 2,292 | | | | 13,451 | |
| | | | |
| Depreciation | | | | | | | | | | | | | | | | |
| At 1 January 2014 | | | 2,952 | | | | 6,137 | | | | – | | | | 9,089 | |
| Charge for year | | | 252 | | | | 524 | | | | – | | | | 776 | |
| Disposals and other movements | | | (639 | ) | | | (744 | ) | | | – | | | | (1,383 | ) |
| Exchange adjustments | | | (214 | ) | | | (534 | ) | | | – | | | | (748 | ) |
| At 31 December 2014 | | | 2,351 | | | | 5,383 | | | | – | | | | 7,734 | |
| Charge for year | | | 198 | | | | 479 | | | | – | | | | 677 | |
| Impairment | | | 9 | | | | 19 | | | | – | | | | 28 | |
| Disposals and other movements | | | (203 | ) | | | (411 | ) | | | – | | | | (614 | ) |
| Exchange adjustments | | | (102 | ) | | | (288 | ) | | | – | | | | (390 | ) |
| At 31 December 2015 | | | 2,253 | | | | 5,182 | | | | – | | | | 7,435 | |
| Charge for year | | | 185 | | | | 424 | | | | – | | | | 609 | |
| Impairment | | | 2 | | | | – | | | | – | | | | 2 | |
| Disposals and other movements | | | (222 | ) | | | (656 | ) | | | – | | | | (878 | ) |
| Exchange adjustments | | | (126 | ) | | | (439 | ) | | | – | | | | (565 | ) |
| At 31 December 2016 | | | 2,092 | | | | 4,511 | | | | – | | | | 6,603 | |
| | | | |
| Net book value | | | | | | | | | | | | | | | | |
| At 31 December 2014 | | | 2,561 | | | | 2,329 | | | | 1,120 | | | | 6,010 | |
| At 31 December 2015 | | | 2,559 | | | | 2,286 | | | | 1,568 | | | | 6,413 | |
| At 31 December 2016 | | | 2,524 | | | | 2,032 | | | | 2,292 | | | | 6,848 | |
Impairment charges in 2015 were attributable to assets dedicated to the production and manufacture of Caprelsa, for which global product rights were divested during the year, and to strategy changes affecting manufacturing operations in the US. These charges have been recognised in cost of sales.
| | | | | | | | | | | | |
| | | 2016
$m | | | 2015
$m | | | 2014
$m | |
| | | |
| The net book value of land and buildings comprised: | | | | | | | | | | | | |
| Freeholds | | | 2,326 | | | | 2,432 | | | | 2,489 | |
| Leaseholds | | | 198 | | | | 127 | | | | 72 | |
Included within plant and equipment are Information Technology assets held under finance leases with a net book value of $43m (2015: $70m; 2014: $74m).
| | |
| AstraZenecaAnnual Report and Form 20-F Information 2016 | | 155 |
Financial Statements
8 Goodwill
| | | | | | | | | | | | |
| | |
| 2016
$m |
| |
| 2015
Restated $m |
* | |
| 2014
$m |
|
| | | |
| Cost | | | | | | | | | | | | |
| At 1 January | | | 12,113 | | | | 11,868 | | | | 10,307 | |
| Additions through business combinations (Note 25) | | | 19 | | | | 388 | | | | 1,841 | |
| Exchange and other adjustments | | | (163 | ) | | | (143 | ) | | | (280 | ) |
| At 31 December | | | 11,969 | | | | 12,113 | | | | 11,868 | |
| | | |
| Amortisation and impairment losses | | | | | | | | | | | | |
| At 1 January | | | 313 | | | | 318 | | | | 326 | |
| Exchange and other adjustments | | | (2 | ) | | | (5 | ) | | | (8 | ) |
| At 31 December | | | 311 | | | | 313 | | | | 318 | |
| Net book value at 31 December | | | 11,658 | | | | 11,800 | | | | 11,550 | |
| * | 2015 comparatives have been restated to reflect an adjustment to the acquisition accounting for ZS Pharma (see Note 25). |
For the purpose of impairment testing of goodwill, the Group is regarded as a single cash-generating unit.
The recoverable amount is based on value in use using discounted risk-adjusted projections of the Group’s pre-tax cash flows over 10 years which is considered by the Board as a reasonable period given the long development and life-cycle of a medicine. The projections include assumptions about product launches, competition from rival products and pricing policy as well as the possibility of generics entering the market. In setting these assumptions we consider our past experience, external sources of information (including information on expected increases and ageing of the populations in our established markets and the expanding patient population in newer markets), our knowledge of competitor activity and our assessment of future changes in the pharmaceutical industry. The 10-year period is covered by internal budgets and forecasts. Given that internal budgets and forecasts are prepared for all projections, no general growth rates are used to extrapolate internal budgets and forecasts for the purposes of determining value in use. No terminal value is included as these cash flows are more than sufficient to establish that an impairment does not exist. The methods used to determine recoverable amounts have remained consistent with the prior year.
In arriving at value in use, we disaggregate our projected pre-tax cash flows into groups reflecting similar risks and tax effects. For each group of cash flows we use an appropriate discount rate reflecting those risks and tax effects. In arriving at the appropriate discount rate for each group of cash flows, we adjust AstraZeneca’s post-tax weighted average cost of capital (7.0% for 2016, 2015 and 2014) to reflect the impact of risks relevant to that group of assets, the time value of money and tax effects. The weighted average pre-tax discount rate we used was approximately 10% (2015: 10%; 2014: 10%).
As a further check, we compare our market capitalisation to the book value of our net assets and this indicates significant surplus at 31 December 2016 (and 31 December 2015 and 31 December 2014).
No goodwill impairment was identified.
The Group has also performed sensitivity analysis calculations on the projections used and discount rate applied. The Directors have concluded that, given the significant headroom that exists, and the results of the sensitivity analysis performed, there is no significant risk that reasonable changes in any key assumptions would cause the carrying value of goodwill to exceed its value in use.
| | |
| 156 | | AstraZenecaAnnual Report and Form 20-F Information 2016 |
9 Intangible assets
| | | | | | | | | | | | | | | | |
| | |
| Product,
marketing and distribution rights $m |
| |
| Other
intangibles $m |
| |
| Software
development costs $m |
| |
| Total
$m |
|
| | | | |
| Cost | | | | | | | | | | | | | | | | |
| At 1 January 2014 | | | 25,553 | | | | 2,499 | | | | 2,090 | | | | 30,142 | |
| Additions through business combinations (Note 25) | | | 6,926 | | | | 575 | | | | – | | | | 7,501 | |
| Additions – separately acquired | | | 907 | | | | 25 | | | | 115 | | | | 1,047 | |
| Disposals | | | (23 | ) | | | – | | | | (41 | ) | | | (64 | ) |
| Exchange and other adjustments | | | (1,464 | ) | | | (287 | ) | | | (138 | ) | | | (1,889 | ) |
| At 31 December 2014 | | | 31,899 | | | | 2,812 | | | | 2,026 | | | | 36,737 | |
| Additions through business combinations (Note 25) | | | 3,162 | | | | – | | | | – | | | | 3,162 | |
| Additions – separately acquired | | | 1,341 | | | | 60 | | | | 77 | | | | 1,478 | |
| Disposals | | | (198 | ) | | | (4 | ) | | | (14 | ) | | | (216 | ) |
| Exchange and other adjustments | | | (886 | ) | | | (73 | ) | | | (70 | ) | | | (1,029 | ) |
| At 31 December 2015 | | | 35,318 | | | | 2,795 | | | | 2,019 | | | | 40,132 | |
| Additions through business combinations (Note 25) | | | 7,307 | | | | – | | | | – | | | | 7,307 | |
| Additions – separately acquired | | | 789 | | | | 32 | | | | 77 | | | | 898 | |
| Disposals | | | (339 | ) | | | (15 | ) | | | (141 | ) | | | (495 | ) |
| Exchange and other adjustments | | | (1,472 | ) | | | (232 | ) | | | (127 | ) | | | (1,831 | ) |
| At 31 December 2016 | | | 41,603 | | | | 2,580 | | | | 1,828 | | | | 46,011 | |
| | | | |
| Amortisation and impairment losses | | | | | | | | | | | | | | | | |
| At 1 January 2014 | | | 10,944 | | | | 1,682 | | | | 1,469 | | | | 14,095 | |
| Amortisation for year | | | 2,008 | | | | 193 | | | | 183 | | | | 2,384 | |
| Impairment | | | 81 | | | | 18 | | | | 23 | | | | 122 | |
| Disposals | | | (23 | ) | | | – | | | | (41 | ) | | | (64 | ) |
| Exchange and other adjustments | | | (465 | ) | | | (240 | ) | | | (76 | ) | | | (781 | ) |
| At 31 December 2014 | | | 12,545 | | | | 1,653 | | | | 1,558 | | | | 15,756 | |
| Amortisation for year | | | 1,718 | | | | 174 | | | | 107 | | | | 1,999 | |
| Impairment | | | 143 | | | | – | | | | 5 | | | | 148 | |
| Disposals | | | (31 | ) | | | (2 | ) | | | (14 | ) | | | (47 | ) |
| Exchange and other adjustments | | | (271 | ) | | | (52 | ) | | | (47 | ) | | | (370 | ) |
| At 31 December 2015 | | | 14,104 | | | | 1,773 | | | | 1,609 | | | | 17,486 | |
| Amortisation for year | | | 1,454 | | | | 162 | | | | 85 | | | | 1,701 | |
| Impairment | | | 43 | | | | 1 | | | | 1 | | | | 45 | |
| Disposals | | | (25 | ) | | | (15 | ) | | | (124 | ) | | | (164 | ) |
| Exchange and other adjustments | | | (481 | ) | | | (85 | ) | | | (77 | ) | | | (643 | ) |
| At 31 December 2016 | | | 15,095 | | | | 1,836 | | | | 1,494 | | | | 18,425 | |
| | | | |
| Net book value | | | | | | | | | | | | | | | | |
| At 31 December 2014 | | | 19,354 | | | | 1,159 | | | | 468 | | | | 20,981 | |
| At 31 December 2015 | | | 21,214 | | | | 1,022 | | | | 410 | | | | 22,646 | |
| At 31 December 2016 | | | 26,508 | | | | 744 | | | | 334 | | | | 27,586 | |
Other intangibles consist mainly of licensing and rights to contractual income streams.
| | |
| AstraZenecaAnnual Report and Form 20-F Information 2016 | | 157 |
Financial Statements
9 Intangible assetscontinued
Amortisation charges are recognised in profit as follows:
| | | | | | | | | | | | | | | | |
| | | Product, marketing and distribution rights $m | | | Other intangibles $m | | | Software development costs $m | | | Total $m | |
| | | | |
| Year ended 31 December 2014 | | | | | | | | | | | | | | | | |
| Cost of sales | | | 701 | | | | – | | | | – | | | | 701 | |
| Research and development expense | | | – | | | | 60 | | | | – | | | | 60 | |
| Selling, general and administrative costs | | | 1,203 | | | | 25 | | | | 183 | | | | 1,411 | |
| Other operating income and expense | | | 104 | | | | 108 | | | | – | | | | 212 | |
| Total | | | 2,008 | | | | 193 | | | | 183 | | | | 2,384 | |
| | | | |
| Year ended 31 December 2015 | | | | | | | | | | | | | | | | |
| Cost of sales | | | 369 | | | | – | | | | – | | | | 369 | |
| Research and development expense | | | – | | | | 57 | | | | – | | | | 57 | |
| Selling, general and administrative costs | | | 1,321 | | | | 31 | | | | 107 | | | | 1,459 | |
| Other operating income and expense | | | 28 | | | | 86 | | | | – | | | | 114 | |
| Total | | | 1,718 | | | | 174 | | | | 107 | | | | 1,999 | |
| | | | |
| Year ended 31 December 2016 | | | | | | | | | | | | | | | | |
| Cost of sales | | | 124 | | | | – | | | | – | | | | 124 | |
| Research and development expense | | | – | | | | 48 | | | | – | | | | 48 | |
| Selling, general and administrative costs | | | 1,327 | | | | 31 | | | | 85 | | | | 1,443 | |
| Other operating income and expense | | | 3 | | | | 83 | | | | – | | | | 86 | |
| Total | | | 1,454 | | | | 162 | | | | 85 | | | | 1,701 | |
Impairment charges are recognised in profit as follows: | | | | | | | | | | | | | | | | |
| | | Product, marketing and distribution rights
$m | | | Other intangibles $m | | | Software development costs $m | | | Total
$m | |
| | | | |
| Year ended 31 December 2014 | | | | | | | | | | | | | | | | |
| Research and development expense | | | 81 | | | | – | | | | – | | | | 81 | |
| Selling, general and administrative costs | | | – | | | | – | | | | 23 | | | | 23 | |
| Other operating income and expense | | | – | | | | 18 | | | | – | | | | 18 | |
| Total | | | 81 | | | | 18 | | | | 23 | | | | 122 | |
| | | | |
| Year ended 31 December 2015 | | | | | | | | | | | | | | | | |
| Research and development expense | | | 79 | | | | – | | | | – | | | | 79 | |
| Selling, general and administrative costs | | | – | | | | – | | | | 5 | | | | 5 | |
| Other operating income and expense | | | 64 | | | | – | | | | – | | | | 64 | |
| Total | | | 143 | | | | – | | | | 5 | | | | 148 | |
| | | | |
| Year ended 31 December 2016 | | | | | | | | | | | | | | | | |
| Research and development expense | | | 32 | | | | 1 | | | | – | | | | 33 | |
| Selling, general and administrative costs | | | 11 | | | | – | | | | 1 | | | | 12 | |
| Total | | | 43 | | | | 1 | | | | 1 | | | | 45 | |
Impairment charges and reversals
Impairment charges relate to the termination, or reassessment of the likelihood of success, of several individual projects, none of which had significant capitalised values.
The write downs in value of intangible assets, other than those arising from termination of R&D activities, were determined based on value in use calculations using discounted risk-adjusted projections of the products’ expected post-tax cash flows over a period reflecting the patent-protected lives of the individual products. The full period of projections is covered by internal budgets and forecasts. In arriving at the appropriate discount rate to use for each product, we adjust AstraZeneca’s post-tax weighted average cost of capital (7.0% for 2016, 2015 and 2014) to reflect the impact of risks and tax effects specific to the individual products. The weighted average pre-tax discount rate we used was approximately 13% (2015: 13%; 2014: 13%).
By their nature, the value in use calculations are sensitive to the underlying methods, assumptions and estimates. Consistent with prior years, as part of the impairment review process, management has identified that reasonably possible changes in certain key assumptions may cause the carrying amount of the intangible assets to exceed the recoverable amount. At 31 December 2016, the Group held intangible assets for products in development of $14,261m (2015: $8,732m; 2014: $6,598m), for which the most sensitive assumption is the probability of technical success, and intangible assets for launched products of $12,991m (2015: $13,504m; 2014: $13,915m), for which the most sensitive assumptions are the projected market share of the therapeutic area and expected pricing. In particular, where a trial is unsuccessful and there is no alternative use for the development asset, this will result in a full impairment. As detailed in Note 25, we have recognised significant intangible assets for late stage development programmes and launched products on business combinations at their fair value at acquisition. Management has identified that the impairment review calculations on these assets, in particular those from Acerta Pharma, ZS Pharma, BMS’s share of the Global Diabetes Alliance and Almirall’s respiratory franchise, are especially sensitive to the key assumptions noted above. Given their nature, impairment adjustments triggered by future events that have yet to occur may be material. In addition, there is a significant risk that impairments recognised in any one period may be subject to material adjustments in future periods.
| | |
| 158 | | AstraZenecaAnnual Report and Form 20-F Information 2016 |
9 Intangible assetscontinued
Significant assets
| | | | | | | | |
| | | Carrying value $m | | | Remaining amortisation period | |
| Intangible assets arising from the acquisition of Acerta Pharma1 | | | 7,307 | | | | Not amortised | |
| Intangible assets arising from the acquisition of ZS Pharma1 | | | 3,162 | | | | Not amortised | |
| RSV franchise assets arising from the acquisition of MedImmune | | | 2,503 | | | | 9 years | |
| Intangible assets arising from the restructuring of a joint venture with Merck | | | 1,587 | | | | 2 to 14 years | |
| Farxiga/Forxiga intangible assets acquired from BMS | | | 1,427 | | | | 11 years | |
| Intangible assets arising from the acquisition of Ardea | | | 1,359 | | | | 11 years | |
| Intangible assets acquired from Almirall and Actavis | | | 1,318 | | | | 3 to 22 years | |
| Bydureon intangible assets acquired from BMS | | | 1,161 | | | | 14 years | |
| Onglyza intangible assets acquired from BMS | | | 1,055 | | | | 7 years | |
| Other diabetes intangible assets acquired from BMS | | | 1,235 | | | | 6 to 17 years | |
| Intangible assets arising from the acquisition of Pearl Therapeutics1 | | | 877 | | | | Not amortised | |
| Intangible assets arising from the acquisition of Omthera1 | | | 533 | | | | Not amortised | |
| Intangible assets arising from the acquisition of Amplimmune1 | | | 470 | | | | Not amortised | |
| Intangible assets arising from the acquisition of Takeda | | | 456 | | | | 3 to 8 years | |
| FluMist intangible assets arising from the acquisition of MedImmune | | | 415 | | | | 15 years | |
| Roxadustat intangible assets acquired from FibroGen1 | | | 301 | | | | Not amortised | |
| 1 | Assets in development are not amortised but are tested annually for impairment. |
All the assets listed above are classified as Product, marketing and distribution rights.
10 Investments in associates and joint ventures
| | | | | | | | | | | | |
| | |
| 2016
$m |
| |
| 2015
$m |
| |
| 2014
$m |
|
| At 1 January | | | 85 | | | | 59 | | | | – | |
| Additions | | | 65 | | | | 45 | | | | 70 | |
| Share of after tax losses | | | (33 | ) | | | (16 | ) | | | (6 | ) |
| Exchange adjustments | | | (18 | ) | | | (3 | ) | | | (5 | ) |
| At 31 December | | | 99 | | | | 85 | | | | 59 | |
In 2015, AstraZeneca established the subsidiaries Entasis Therapeutics Ltd and Entasis Therapeutics Inc. (collectively known as ‘Entasis’) for the development of early stage infection assets. On 29 March 2016, Entasis closed a Series B financing, raising $25m from four third-party investors. Under the funding agreement, a new board of directors was appointed, and a voting rights agreement was put in place committing to reduce AstraZeneca’s voting interest to approximately 49%. Since AstraZeneca no longer has overall control of Entasis, it is now treated as an associate rather than a wholly owned subsidiary of the Group. The results of Entasis were deconsolidated from the Group on 29 March, with an investment in associate of $24m recognised. There was no gain or loss recognised on deconsolidation.
On 1 December 2015, AstraZeneca entered into a joint venture agreement with Fujifilm Kyowa Kirin Biologics Co., Ltd. to develop a biosimilar using the combined capabilities of the two parties. The agreement resulted in the formation of a joint venture entity based in the UK, Centus Biotherapeutics Limited. AstraZeneca contributed $45m in cash to the joint venture entity and has a 50% interest in the joint venture. An additional contribution of $10m was made in 2016.
On 30 April 2014, AstraZeneca entered into a joint venture agreement with Samsung Biologics Co., Ltd. to develop a biosimilar using the combined capabilities of the two parties. The agreement resulted in the formation of a joint venture entity based in the UK, Archigen Biotech Limited, with a branch in South Korea. AstraZeneca contributed $70m in cash to the joint venture entity and has a 50% interest in the joint venture. An additional contribution of $30m was made in 2016.
All investments are accounted for using the equity method.
Aggregated summarised financial information for the associate and joint venture entities is set out below.
| | | | | | | | | | | | |
| | |
| 2016
$m |
| |
| 2015
$m |
| |
| 2014
$m |
|
| Non-current assets | | | 144 | | | | 123 | | | | 76 | |
| Current assets | | | 128 | | | | 75 | | | | 58 | |
| Current liabilities | | | (20 | ) | | | (11 | ) | | | (6 | ) |
| Net assets | | | 252 | | | | 187 | | | | 128 | |
| Amount attributable to AstraZeneca | | | 125 | | | | 93 | | | | 64 | |
| Exchange adjustments | | | (26 | ) | | | (8 | ) | | | (5 | ) |
| Carrying value of investments in associate and joint ventures | | | 99 | | | | 85 | | | | 59 | |
| | |
| AstraZenecaAnnual Report and Form 20-F Information 2016 | | 159 |
Financial Statements
11 Other investments
| | | | | | | | | | | | |
| | | 2016 $m | | | 2015 $m | | | 2014 $m | |
| | | |
| Non-current investments | | | | | | | | | | | | |
| Equity securities available for sale | | | 727 | | | | 458 | | | | 502 | |
| Total | | | 727 | | | | 458 | | | | 502 | |
| | | |
| Current investments | | | | | | | | | | | | |
| Equity securities and bonds available for sale | | | 847 | | | | 548 | | | | 775 | |
| Fixed deposits | | | 37 | | | | 65 | | | | 20 | |
| Total | | | 884 | | | | 613 | | | | 795 | |
The equity securities and bonds available for sale in current investments include $nil (2015: $467m; 2014: $775m) held in a custody account. Further details of this custody account are included in Note 20.
Impairment charges of $21m in respect of available for sale securities are included in other operating income and expense (2015: $17m; 2014: $23m). Equity securities and bonds available for sale are held at fair value. The fair value of listed investments is based on year end quoted market prices. For unlisted investments whose fair value cannot be reliably measured, cost is considered to approximate to fair value. Fixed deposits are held at amortised cost with carrying value being a reasonable approximation of fair value given their short-term nature.
None of the financial assets or liabilities have been reclassified in the year.
Fair value hierarchy
The table below analyses equity securities and bonds available for sale, contained within other investments and carried at fair value, by valuation method. The different levels have been defined as follows:
| | |
| > Level 1: | | quoted prices (unadjusted) in active markets for identical assets or liabilities. |
| > Level 2: | | inputs other than quoted prices included within Level 1 that are observable for the asset or liability, either directly (ie as prices) or indirectly (ie derived from prices). |
| > Level 3: | | inputs for the asset or liability that are not based on observable market data (unobservable inputs). |
| | | | | | | | | | | | |
| | | 2016 $m | | | 2015 $m | | | 2014 $m | |
| Level 1 | | | 933 | | | | 654 | | | | 927 | |
| Level 2 | | | – | | | | – | | | | – | |
| Level 3 | | | 641 | | | | 352 | | | | 350 | |
| Total | | | 1,574 | | | | 1,006 | | | | 1,277 | |
Equity securities available for sale that are analysed at Level 3 include investments in private biotech companies. In the absence of specific market data, these unlisted investments are held at cost, adjusted as necessary for impairments and revaluations on new funding rounds, which approximates to fair value. Movements in Level 3 investments are detailed below.
| | | | | | | | | | | | |
| | |
| 2016
$m |
| |
| 2015
$m |
| |
| 2014
$m |
|
| At 1 January | | | 352 | | | | 350 | | | | 209 | |
| Additions | | | 210 | | | | 49 | | | | 107 | |
| Revaluations | | | 110 | | | | – | | | | 95 | |
| Transfers out | | | (12 | ) | | | (22 | ) | | | (35 | ) |
| Disposals | | | (2 | ) | | | (6 | ) | | | – | |
| Impairments and exchange adjustments | | | (17 | ) | | | (19 | ) | | | (26 | ) |
| At 31 December | | | 641 | | | | 352 | | | | 350 | |
Assets are transferred in or out of Level 3 on the date of the event or change in circumstances that caused the transfer.
| | |
| 160 | | AstraZenecaAnnual Report and Form 20-F Information 2016 |
12 Derivative financial instruments
| | | | | | | | | | | | | | | | | | | | |
| | |
| Non-current
assets $m |
| |
| Current
assets $m |
| |
| Current
liabilities $m |
| |
| Non-current
liabilities $m |
| |
| Total
$m |
|
| Interest rate swaps designated in a fair value hedge | | | 79 | | | | – | | | | – | | | | – | | | | 79 | |
| Interest rate swaps related to instruments designated at fair value through profit and loss | | | 82 | | | | – | | | | – | | | | – | | | | 82 | |
| Cross currency swaps designated in a net investment hedge | | | 304 | | | | – | | | | – | | | | – | | | | 304 | |
| Other derivatives | | | – | | | | 21 | | | | (21 | ) | | | – | | | | – | |
| 31 December 2014 | | | 465 | | | | 21 | | | | (21 | ) | | | – | | | | 465 | |
| | | | | | | | | | | | | | | | | | | | | |
| | |
| Non-current
assets
$m |
| |
| Current
assets
$m |
| |
| Current
liabilities
$m |
| |
| Non-current
liabilities
$m |
| |
| Total
$m |
|
| Interest rate swaps designated in a fair value hedge | | | 49 | | | | – | | | | – | | | | – | | | | 49 | |
| Interest rate swaps related to instruments designated at fair value through profit and loss | | | 77 | | | | – | | | | – | | | | – | | | | 77 | |
| Cross currency swaps designated in a net investment hedge | | | 320 | | | | – | | | | – | | | | – | | | | 320 | |
| Other derivatives | | | – | | | | 2 | | | | (9 | ) | | | (1 | ) | | | (8 | ) |
| 31 December 2015 | | | 446 | | | | 2 | | | | (9 | ) | | | (1 | ) | | | 438 | |
| | | | | | | | | | | | | | | | | | | | | |
| | |
| Non-current
assets
$m |
| |
| Current
assets
$m |
| |
| Current
liabilities
$m |
| |
| Non-current
liabilities
$m |
| |
| Total
$m |
|
| Interest rate swaps designated in a fair value hedge | | | – | | | | 19 | | | | – | | | | (2 | ) | | | 17 | |
| Interest rate swaps related to instruments designated at fair value through profit and loss | | | 65 | | | | – | | | | – | | | | – | | | | 65 | |
| Cross currency swaps designated in a net investment hedge | | | 278 | | | | – | | | | – | | | | – | | | | 278 | |
| Cross currency swaps designated in a cashflow hedge | | | – | | | | – | | | | – | | | | (115 | ) | | | (115 | ) |
| Other derivatives | | | – | | | | 8 | | | | (18 | ) | | | – | | | | (10 | ) |
| 31 December 2016 | | | 343 | | | | 27 | | | | (18 | ) | | | (117 | ) | | | 235 | |
All derivatives are held at fair value and fall within Level 2 of the fair value hierarchy as defined in Note 11. None of the derivatives have been reclassified in the year.
The fair value of interest rate swaps and cross-currency swaps is estimated using appropriate zero coupon curve valuation techniques to discount future contractual cash flows based on rates at current year end.
The fair value of forward foreign exchange contracts and currency options are estimated by cash flow accounting models using appropriate yield curves based on market forward foreign exchange rates at the year end. The majority of forward foreign exchange contracts for existing transactions had maturities of less than one month from year end.
The interest rates used to discount future cash flows for fair value adjustments, where applicable, are based on market swap curves at the reporting date, and were as follows.
| | | | | | | | | | | | |
| | | 2016 | | | 2015 | | | 2014 | |
| Derivatives | | | 1.5% to 2.2% | | | | 1.2% to 2.1% | | | | 1.2% to 2.3% | |
13 Non-current other receivables
Non-current other receivables of $901m (2015: $907m; 2014: $1,112m) include a prepayment of $380m (2015: $617m; 2014: $906m) which represents the long-term element of minimum contractual royalties payable to Shionogi under the global licence agreement for Crestor, which was renegotiated in December 2013. The resulting modified royalty structure, which includes fixed minimum and maximum payments in years until 2020, has resulted in the Group recognising liabilities, and corresponding prepayments, for the discounted value of total minimum payments. The current portion of the prepayment is $116m (2015: $260m; 2014: $323m) and is reported in amounts due within one year (see Note 15).
Non-current other receivables also include $178m (2015: $158m; 2014: $150m) prepayments in relation to our research collaboration with Moderna Therapeutics and $175m (2015: $nil; 2014: $nil) receivable related to the disposal of the small molecule antibiotics business.
14 Inventories
| | | | | | | | | | | | |
| | | 2016 $m | | | 2015 $m | | | 2014 $m | |
| Raw materials and consumables | | | 811 | | | | 960 | | | | 663 | |
| Inventories in process | | | 1,060 | | | | 545 | | | | 501 | |
| Finished goods and goods for resale | | | 463 | | | | 638 | | | | 796 | |
| Inventories | | | 2,334 | | | | 2,143 | | | | 1,960 | |
The Group recognised $2,644m (2015: $2,942m; 2014: $3,214m) of inventories as an expense within cost of sales during the year. Inventory write-offs in the year amounted to $198m (2015: $112m; 2014: $126m).
| | |
| AstraZenecaAnnual Report and Form 20-F Information 2016 | | 161 |
Financial Statements
15 Current trade and other receivables
| | | | | | | | | | | | |
| | |
| 2016
$m |
| |
| 2015
$m |
| |
| 2014
$m |
|
| | | |
| Amounts due within one year | | | | | | | | | | | | |
| Trade receivables | | | 2,625 | | | | 4,685 | | | | 4,816 | |
| Less: Amounts provided for doubtful debts (Note 26) | | | (42 | ) | | | (52 | ) | | | (54 | ) |
| | | | 2,583 | | | | 4,633 | | | | 4,762 | |
| Other receivables | | | 852 | | | | 543 | | | | 1,050 | |
| Prepayments and accrued income | | | 879 | | | | 1,268 | | | | 1,262 | |
| | | | 4,314 | | | | 6,444 | | | | 7,074 | |
| | | |
| Amounts due after more than one year | | | | | | | | | | | | |
| Other receivables | | | 140 | | | | 28 | | | | 22 | |
| Prepayments and accrued income | | | 119 | | | | 150 | | | | 136 | |
| | | | 259 | | | | 178 | | | | 158 | |
| Trade and other receivables | | | 4,573 | | | | 6,622 | | | | 7,232 | |
All financial assets included within current trade and other receivables are held at amortised costs with carrying value being a reasonable approximation of fair value.
16 Cash and cash equivalents
| | | | | | | | | | | | |
| | |
| 2016
$m |
| |
| 2015
$m |
| |
| 2014
$m |
|
| Cash at bank and in hand | | | 782 | | | | 1,250 | | | | 1,009 | |
| Short-term deposits | | | 4,236 | | | | 4,990 | | | | 5,351 | |
| Cash and cash equivalents | | | 5,018 | | | | 6,240 | | | | 6,360 | |
| Unsecured bank overdrafts | | | (94 | ) | | | (189 | ) | | | (196 | ) |
| Cash and cash equivalents in the cash flow statement | | | 4,924 | | | | 6,051 | | | | 6,164 | |
The Group holds $91m (2015: $110m; 2014: $114m) of cash and cash equivalents which is required to meet insurance solvency, capital and security requirements, and which, as a result, is not readily available for the general purposes of the Group.
Cash and cash equivalents are held at amortised cost. Fair value approximates to carrying value.
17 Interest-bearing loans and borrowings
| | | | | | | | | | | | | | | | | | | | |
| | | | | | Repayment dates | | | 2016 $m | | | 2015 $m | | | 2014 $m | |
| | | | | |
| Current liabilities | | | | | | | | | | | | | | | | | | | | |
| Bank overdrafts | | | | | | | On demand | | | | 94 | | | | 189 | | | | 196 | |
| Finance leases | | | | | | | | | | | 87 | | | | 67 | | | | 48 | |
| 5.125% Non-callable bond | | | euros | | | | 2015 | | | | – | | | | – | | | | 912 | |
| 5.9% Callable bond | | | US dollars | | | | 2017 | | | | 1,769 | | | | – | | | | – | |
| Other loans (Commercial paper) | | | | | | | Within one year | | | | 357 | | | | 660 | | | | 1,290 | |
| Total | | | | | | | | | | | 2,307 | | | | 916 | | | | 2,446 | |
| | | | | |
| Non-current liabilities | | | | | | | | | | | | | | | | | | | | |
| Finance leases | | | | | | | | | | | 6 | | | | 28 | | | | 60 | |
| 5.9% Callable bond | | | US dollars | | | | 2017 | | | | – | | | | 1,796 | | | | 1,825 | |
| Floating rate notes | | | US dollars | | | | 2018 | | | | 399 | | | | 399 | | | | – | |
| 1.75% Callable bond | | | US dollars | | | | 2018 | | | | 998 | | | | 997 | | | | – | |
| 1.95% Callable bond | | | US dollars | | | | 2019 | | | | 998 | | | | 997 | | | | 996 | |
| 2.375% Callable bond | | | US dollars | | | | 2020 | | | | 1,589 | | | | 1,586 | | | | – | |
| 0.875% Non-callable bond | | | euros | | | | 2021 | | | | 782 | | | | 812 | | | | 902 | |
| 0.25% Callable bond | | | euros | | | | 2021 | | | | 522 | | | | – | | | | – | |
| 7% Guaranteed debentures | | | US dollars | | | | 2023 | | | | 350 | | | | 355 | | | | 370 | |
| 0.75% Callable bond | | | euros | | | | 2024 | | | | 937 | | | | – | | | | – | |
| 3.375% Callable bond | | | US dollars | | | | 2025 | | | | 1,976 | | | | 1,971 | | | | – | |
| 1.25% Callable bond | | | euros | | | | 2028 | | | | 827 | | | | – | | | | – | |
| 5.75% Non-callable bond | | | pounds sterling | | | | 2031 | | | | 426 | | | | 515 | | | | 540 | |
| 6.45% Callable bond | | | US dollars | | | | 2037 | | | | 2,719 | | | | 2,719 | | | | 2,718 | |
| 4% Callable bond | | | US dollars | | | | 2042 | | | | 986 | | | | 986 | | | | 986 | |
| 4.375% Callable bond | | | US dollars | | | | 2045 | | | | 979 | | | | 976 | | | | – | |
| Other loans | | | | | | | | | | | 7 | | | | – | | | | – | |
| Total | | | | | | | | | | | 14,501 | | | | 14,137 | | | | 8,397 | |
All loans and borrowings above are unsecured, except for finance leases which are secured against the Information Technology assets to which they relate (see Note 7).
| | |
| 162 | | AstraZenecaAnnual Report and Form 20-F Information 2016 |
17 Interest-bearing loans and borrowingscontinued
Set out below is a comparison by category of carrying values and fair values of all the Group’s interest-bearing loans and borrowings.
| | | | | | | | | | | | | | | | | | | | | | | | |
| | |
| Instruments in a
fair value hedge relationship $m |
1 | |
| Instruments
designated at fair value $m |
2 | |
| Instruments
designated in cash flow hedge $m |
3 | |
| Amortised
cost $m |
4 | |
| Total
carrying value $m |
| |
| Fair
value $m |
|
| | | | | | |
| 2014 | | | | | | | | | | | | | | | | | | | | | | | | |
| Overdrafts | | | – | | | | – | | | | – | | | | 196 | | | | 196 | | | | 196 | |
| Finance leases due within one year | | | – | | | | – | | | | – | | | | 48 | | | | 48 | | | | 48 | |
| Finance leases due after more than one year | | | – | | | | – | | | | – | | | | 60 | | | | 60 | | | | 60 | |
| Loans due within one year | | | – | | | | – | | | | – | | | | 2,202 | | | | 2,202 | | | | 2,202 | |
| Loans due after more than one year | | | 828 | | | | 370 | | | | – | | | | 7,139 | | | | 8,337 | | | | 9,662 | |
| Total at 31 December 2014 | | | 828 | | | | 370 | | | | – | | | | 9,645 | | | | 10,843 | | | | 12,168 | |
| | | | | | |
| 2015 | | | | | | | | | | | | | | | | | | | | | | | | |
| Overdrafts | | | – | | | | – | | | | – | | | | 189 | | | | 189 | | | | 189 | |
| Finance leases due within one year | | | – | | | | – | | | | – | | | | 67 | | | | 67 | | | | 67 | |
| Finance leases due after more than one year | | | – | | | | – | | | | – | | | | 28 | | | | 28 | | | | 28 | |
| Loans due within one year | | | – | | | | – | | | | – | | | | 660 | | | | 660 | | | | 660 | |
| Loans due after more than one year | | | 1,398 | | | | 355 | | | | – | | | | 12,356 | | | | 14,109 | | | | 15,132 | |
| Total at 31 December 2015 | | | 1,398 | | | | 355 | | | | – | | | | 13,300 | | | | 15,053 | | | | 16,076 | |
| | | | | | |
| 2016 | | | | | | | | | | | | | | | | | | | | | | | | |
| Overdrafts | | | – | | | | – | | | | – | | | | 94 | | | | 94 | | | | 94 | |
| Finance leases due within one year | | | – | | | | – | | | | – | | | | 87 | | | | 87 | | | | 87 | |
| Finance leases due after more than one year | | | – | | | | – | | | | – | | | | 6 | | | | 6 | | | | 6 | |
| Loans due within one year | | | 770 | | | | – | | | | – | | | | 1,356 | | | | 2,126 | | | | 2,161 | |
| Loans due after more than one year | | | 598 | | | | 350 | | | | 2,286 | | | | 11,261 | | | | 14,495 | | | | 15,826 | |
| Total at 31 December 2016 | | | 1,368 | | | | 350 | | | | 2,286 | | | | 12,804 | | | | 16,808 | | | | 18,174 | |
| 1 | Instruments designated as hedged items in fair value hedge relationships with respect to interest rate risk include a designated portion of the US dollar 5.9% Callable bond repayable in 2017, and a portion of the US dollar 1.75% Callable bond repayable in 2018. |
| 2 | Instruments designated at fair value through profit or loss include the US dollar 7% guaranteed debentures repayable in 2023. |
| 3 | Instruments designated in a cash flow hedge include the euro 0.25%, euro 0.75% and euro 1.25% Callable bonds repayable in 2021, 2024 and 2028 respectively. |
| 4 | Included within borrowings held at amortised cost are amounts designated as hedges of net investments in foreign operations of $1,208m (2015: $1,327m; 2014: $1,453m) held at amortised cost. The fair value of these borrowings was $1,400m at 31 December 2016 (2015: $1,516m; 2014: $1,641m). |
The fair value of fixed-rate publicly traded debt is based on year end quoted market prices; the fair value of floating rate debt is nominal value, as mark to market differences would be minimal given the frequency of resets. The carrying value of loans designated at fair value through profit or loss is the fair value; this falls within the Level 1 valuation method as defined in Note 11. For loans designated in a fair value hedge relationship, carrying value is initially measured at fair value and remeasured for fair value changes in respect of the hedged risk at each reporting date. All other loans are held at amortised cost. Fair values, as disclosed in the table above, are all determined using the Level 1 valuation method as defined in Note 11, with the exception of overdrafts and finance leases, where fair value approximates to carrying values.
A loss of $8m was made during the year on the fair value of bonds designated at fair value through profit or loss, due to decreased credit risk. A gain of $40m has been made on these bonds since designation due to increased credit risk. Changes in credit risk had no material effect on any other financial assets and liabilities recognised at fair value in the Group Financial Statements. The change in fair value attributable to changes in credit risk is calculated as the change in fair value not attributable to market risk. The amount payable at maturity on bonds designated at fair value through profit or loss is $288m.
The interest rates used to discount future cash flows for fair value adjustments, where applicable, are based on market swap curves at the reporting date, and were as follows:
| | | | | | | | | | | | |
| | | 2016 | | | 2015 | | | 2014 | |
| Loans and borrowings | | | 1.5% to 2.2% | | | | 1.2% to 2.1% | | | | 1.2% to 2.3% | |
| | |
| AstraZenecaAnnual Report and Form 20-F Information 2016 | | 163 |
Financial Statements
18 Trade and other payables
| | | | | | | | | | | | |
| | |
| 2016
$m |
| |
| 2015
$m |
| |
| 2014
$m |
|
| | | |
| Current liabilities | | | | | | | | | | | | |
| Trade payables | | | 2,990 | | | | 3,469 | | | | 3,492 | |
| Value added and payroll taxes and social security | | | 240 | | | | 207 | | | | 201 | |
| Rebates and chargebacks | | | 2,812 | | | | 3,307 | | | | 3,530 | |
| Accruals | | | 2,855 | | | | 2,983 | | | | 3,231 | |
| Contingent consideration | | | 527 | | | | 396 | | | | 347 | |
| Other payables | | | 1,062 | | | | 1,301 | | | | 1,085 | |
| Total | | | 10,486 | | | | 11,663 | | | | 11,886 | |
| | | |
| Non-current liabilities | | | | | | | | | | | | |
| Accruals | | | 292 | | | | 256 | | | | 219 | |
| Contingent consideration | | | 4,930 | | | | 6,015 | | | | 6,552 | |
| Other payables | | | 4,266 | | | | 1,186 | | | | 1,220 | |
| Total | | | 9,488 | | | | 7,457 | | | | 7,991 | |
Non-current other payables includes $1,901m arising from the put option over the non-controlling interest in Acerta Pharma (see Note 24). The put option liability is remeasured each period based on the latest assessment of the expected redemption amount, with remeasurements taken to selling, general and administrative costs (see Note 2). Interest arising from amortising the liability is included within Finance expense (see Note 3).
With the exception of contingent consideration payables of $5,457m (2015: $6,411m; 2014: $6,899m) held within other payables, that arose on business combinations (see Note 25), and which are held at fair value within Level 3 of the fair value hierarchy as defined in Note 11, all other financial liabilities are held at amortised cost with carrying value being a reasonable approximation of fair value.
Contingent consideration
| | | | | | | | | | | | |
| | |
| 2016
$m |
| |
| 2015
$m |
| |
| 2014
$m |
|
| At 1 January | | | 6,411 | | | | 6,899 | | | | 514 | |
| Additions arising on business combinations (Note 25) | | | – | | | | – | | | | 6,138 | |
| Settlements | | | (293 | ) | | | (579 | ) | | | (657 | ) |
| Revaluations | | | (1,158 | ) | | | (432 | ) | | | 512 | |
| Discount unwind | | | 497 | | | | 524 | | | | 391 | |
| Foreign exchange | | | – | | | | (1 | ) | | | 1 | |
| At 31 December | | | 5,457 | | | | 6,411 | | | | 6,899 | |
As detailed in Note 25, contingent consideration arising from business combinations is fair valued using decision-tree analysis, with key inputs including the probability of success, consideration of potential delays and the expected levels of future revenues.
Revaluations of contingent consideration are recognised in selling, general and administrative costs and include a decrease of $999m in 2016 (2015: a decrease of $378m; 2014: an increase of $529m) based on revised milestone probabilities, and revenue and royalty forecasts, relating to the acquisition of BMS’s share of the Global Diabetes Alliance.
Management has identified that reasonably possible changes in certain key assumptions including the likelihood of achieving successful trial results, obtaining regulatory approval, the projected market share of the therapeutic area and expected pricing for launched products may cause the calculated fair value of the above contingent consideration to vary materially in future years.
The maximum development and sales milestones payable under outstanding contingent consideration arrangements arising on business combinations are as follows:
| | | | | | | | | | | | |
| Acquisitions | | Year | | | Nature of
contingent consideration | | | Maximum future milestones
$m | |
| Spirogen | | | 2013 | | | | Milestones | | | | 216 | |
| Amplimmune | | | 2013 | | | | Milestones | | | | 275 | |
| Omthera Pharmaceuticals | | | 2013 | | | | Milestones | | | | 120 | |
| Pearl Therapeutics | | | 2013 | | | | Milestones | | | | 465 | |
| BMS’s share of Global Diabetes Alliance | | | 2014 | | | | Milestones and royalties | | | | 700 | |
| Almirall | | | 2014 | | | | Milestones and royalties | | | | 1,005 | |
| Definiens | | | 2014 | | | | Milestones | | | | 150 | |
As detailed in Note 25, the amount of royalties payable under the arrangements is inherently uncertain and difficult to predict, given the direct link to future sales and the range of outcomes cannot be reliably estimated. The maximum amount of royalties payable in each year is with reference to net sales.
| | |
| 164 | | AstraZenecaAnnual Report and Form 20-F Information 2016 |
19 Provisions
| | | | | | | | | | | | | | | | | | | | | | | | |
| | |
| Severance
$m |
| |
| Environmental
$m |
| |
| Employee
benefits $m |
| |
| Legal
$m |
| |
| Other
provisions $m |
| |
| Total
$m |
|
| At 1 January 2014 | | | 771 | | | | 87 | | | | 152 | | | | 59 | | | | 320 | | | | 1,389 | |
| Additions arising on business acquisitions | | | 39 | | | | – | | | | – | | | | – | | | | – | | | | 39 | |
| Charge for year | | | 254 | | | | 15 | | | | 8 | | | | 91 | | | | 66 | | | | 434 | |
| Cash paid | | | (472 | ) | | | (17 | ) | | | (16 | ) | | | (71 | ) | | | (57 | ) | | | (633 | ) |
| Reversals | | | (21 | ) | | | – | | | | – | | | | (4 | ) | | | (39 | ) | | | (64 | ) |
| Exchange and other movements | | | (45 | ) | | | (1 | ) | | | 19 | | | | (1 | ) | | | (30 | ) | | | (58 | ) |
| At 31 December 2014 | | | 526 | | | | 84 | | | | 163 | | | | 74 | | | | 260 | | | | 1,107 | |
| Additions arising on business acquisitions | | | – | | | | – | | | | – | | | | – | | | | 10 | | | | 10 | |
| Charge for year | | | 338 | | | | 8 | | | | 7 | | | | 313 | | | | 40 | | | | 706 | |
| Cash paid | | | (408 | ) | | | (25 | ) | | | (12 | ) | | | (69 | ) | | | (43 | ) | | | (557 | ) |
| Reversals | | | (40 | ) | | | – | | | | – | | | | – | | | | (12 | ) | | | (52 | ) |
| Exchange and other movements | | | (13 | ) | | | – | | | | – | | | | 39 | | | | 2 | | | | 28 | |
| At 31 December 2015 | | | 403 | | | | 67 | | | | 158 | | | | 357 | | | | 257 | | | | 1,242 | |
| Charge for year | | | 578 | | | | 11 | | | | 6 | | | | 223 | | | | 170 | | | | 988 | |
| Cash paid | | | (433 | ) | | | (19 | ) | | | (21 | ) | | | (126 | ) | | | (87 | ) | | | (686 | ) |
| Reversals | | | (40 | ) | | | – | | | | – | | | | – | | | | (39 | ) | | | (79 | ) |
| Exchange and other movements | | | (21 | ) | | | – | | | | – | | | | (16 | ) | | | (10 | ) | | | (47 | ) |
| At 31 December 2016 | | | 487 | | | | 59 | | | | 143 | | | | 438 | | | | 291 | | | | 1,418 | |
| | | | | | | | | | | | | | | | | | | | | | | | | |
| | | | | | | | | | | | | | |
| 2016
$m |
| |
| 2015
$m |
| |
| 2014
$m |
|
| Due within one year | | | | | | | | | | | | | | | 1,065 | | | | 798 | | | | 623 | |
| Due after more than one year | | | | | | | | | | | | | | | 353 | | | | 444 | | | | 484 | |
| Total | | | | | | | | | | | | | | | 1,418 | | | | 1,242 | | | | 1,107 | |
AstraZeneca is undergoing a global restructuring initiative which involves rationalisation of the global supply chain, the sales and marketing organisation, IT and business support infrastructure, and R&D. Employee costs in connection with the initiatives are recognised in severance provisions. Final severance costs are often subject to the completion of the requisite consultations on the areas impacted.
Details of the environmental and legal provisions are provided in Note 28.
Employee benefit provisions include the Deferred Bonus Plan. Further details are included in Note 27.
Other provisions comprise amounts relating to specific contractual or constructive obligations and disputes.
No provision has been released or applied for any purpose other than that for which it was established.
20 Post-retirement benefits
Pensions
Background
The Company and most of its subsidiaries offer retirement plans which cover the majority of employees in the Group. Many of these plans are ‘defined contribution’, where AstraZeneca’s contribution and resulting charge is fixed at a set level or is a set percentage of employees’ pay.
However, several plans, mainly in the UK, the US and Sweden, are ‘defined benefit’, where benefits are based on employees’ length of service and linked to their salary. The major defined benefit plans, apart from the collectively bargained Swedish plan (which is still open to employees born before 1979), have been closed to new entrants since 2000. During 2010, following consultation with its UK employees’ representatives, AstraZeneca introduced a freeze on pensionable pay at 30 June 2010 levels for defined benefit members of the UK Pension Fund.
The major defined benefit plans are funded through separate, fiduciary-administered assets. The cash funding of the plans, which may from time to time involve special payments, is designed, in consultation with independent qualified actuaries, to ensure that the assets together with future contributions should be sufficient to meet future obligations. The funding is monitored rigorously by AstraZeneca and appropriate fiduciaries including with reference to AstraZeneca’s credit rating, market capitalisation, cash flows and the solvency and maturity of the relevant pension scheme.
| | |
| AstraZenecaAnnual Report and Form 20-F Information 2016 | | 165 |
Financial Statements
20 Post-retirement benefitscontinued
Financing principles
92% of the Company’s defined benefit obligations at 31 December 2016 are in schemes within the UK, the US and Sweden. In these countries, the pension obligations are funded with reference to the following financing principles:
| > | The Company has a fundamental belief in funding the benefits it promises to employees. |
| > | The Company considers its pension arrangements in the context of its broader capital structure. In general, it does not believe in committing excessive capital for funding while it has better uses of capital within the business nor does it wish to generate surpluses. |
| > | The pension funds are not part of the Company’s core business. The Company believes in taking some measured and rewarded risks with the investments underlying the funding, subject to a long-term plan to reduce those risks when opportunities arise. |
| > | The Company recognises that deciding to hold certain investments may cause volatility in the funding position. The Company would not wish to amend its contribution level for relatively small deviations from its preferred funding level, because it is expected that there will be short-term volatility, but it is prepared to react appropriately to more significant deviations. |
| > | The Company proactively engages with local Fiduciary Bodies to provide oversight and input in relation to funding and investment strategy and to help facilitate liability management exercises appropriate to each pension plan. |
| > | The Company considers the use of alternative methods of providing security that do not require immediate cash funding but help mitigate exposure of the pension arrangement to the credit risk of the Company. |
These principles are appropriate to AstraZeneca’s business at the present date; should circumstances change they may require review.
AstraZeneca has developed a long-term funding framework to implement these principles, which targets full funding on a low risk funding measure over the long term, as the pension funds mature. This framework determines the cash contributions payable to the pension funds, but does not affect the IAS 19 liabilities.
UK
With regard to the Company’s UK defined benefit pension fund, the above principles are modified in light of the UK regulatory requirements (summarised below) and resulting discussions with the Pension Fund Trustee.
Role of Trustees (UK)
The UK Pension Fund is governed and administered by a corporate Trustee which is legally separate from the Company. The Trustee Directors are comprised of representatives appointed by both the employer and employees, and include an independent professional Trustee Director. The Trustee Directors are required by law to act in the interest of all relevant beneficiaries and are responsible in particular for the asset investment policy and the day-to-day administration of the benefits. They are also responsible for jointly agreeing with the employer the level of contributions due to the UK Pension Fund (see below).
Funding requirements (UK)
UK legislation requires that pension schemes are funded prudently (ie to a level in excess of the current expected cost of providing benefits). On a triennial basis, the Trustee and the Company must agree the contributions required (if any) to ensure the Fund is fully funded over time on a suitable prudent measure. The last full actuarial valuation of the AstraZeneca Pension Fund was carried out by a qualified actuary as at 31 March 2013. An updated actuarial valuation as at 31 March 2016 is in the process of being finalised with discussions ongoing between the Trustee and the Company.
A lump sum contribution of £51m ($72m) was made to help narrow the deficit in March 2016, with a further £51m contribution due before 31 March 2017.
The Company entered into a long-term funding agreement with the Trustee on 21 October 2016. Under this agreement, the Company will grant a charge in favour of the Trustee over the new Cambridge Biomedical Campus, which would crystallise only in the event of the Company’s insolvency. This charge will provide security in respect of future UK Pension Fund contributions and replaces a charge over assets in a ring-fenced custodial account held by AstraZeneca with HSBC. Since the Trustee’s charge over this custodial account has been released, these assets are now available for the Company to use in the business.
Under the funding assumptions used to set the statutory funding target, the key assumptions as at 31 March 2013 were as follows: long-term UK price inflation set at 3.55% per annum, salary increases at 0% per annum (as a result of pensionable pay levels being frozen in 2010), pension increases at 3.2% per annum and investment returns at 4.86% per annum. The resulting valuation of the Fund’s liabilities on that basis were £4,887m ($5,997m) compared to a market value of assets at 31 March 2013 of £4,394m ($5,392m).
Under the governing documentation of the UK Pension Fund, any future surplus in the Fund would be returnable to AstraZeneca by refund assuming gradual settlement of the liabilities over the lifetime of the Fund. As such, there are no adjustments required in respect of IFRIC 14 ‘IAS 19 – The Limit on a Defined Benefit Asset, Minimum Funding Requirements and their Interaction’.
Liability Management Exercises (UK)
During 2016, the Company conducted a Pensions Increase Exchange (‘PIE’) exercise in two stages. This exercise offers certain pensioner members the option of taking a higher amount of pension right away, in exchange for giving up any potential future inflation linked increases on all, or part of their pension. Stage 1 was completed in 2016. Stage 2 commenced in 2016 and is due to complete by the end of June 2017.
| | |
| 166 | | AstraZenecaAnnual Report and Form 20-F Information 2016 |
20 Post-retirement benefitscontinued
Regulation (UK)
The UK pensions market is regulated by the Pensions Regulator whose statutory objectives and regulatory powers are described on its website, www.thepensionsregulator.gov.uk.
Rest of Group
The IAS 19 positions for the US and Sweden as at 31 December 2016 are shown below. These plans account for 29% of the Group’s defined benefit obligations. The US and Sweden pension funds are governed by fiduciary bodies with responsibility for the investment policies of those funds. These plans are funded in line with the Company’s financing principles and contributions are paid as prescribed by the long-term funding framework.
| > | The US defined benefits programme was actuarially revalued at 31 December 2016, when plan obligations were $1,795m and plan assets were $1,563m. This includes obligations in respect of the non-qualified plan which is largely unfunded. |
| > | The Swedish defined benefits programme was actuarially revalued at 31 December 2016, when plan obligations were estimated to amount to $1,521m and plan assets were $1,009m. |
On current bases, it is expected that contributions (excluding those in respect of past service deficit contributions) during the year ending 31 December 2017 for the three main countries will be approximately $55m.
Post-retirement benefits other than pensions
In the US, and to a lesser extent in certain other countries, AstraZeneca’s employment practices include the provision of healthcare and life assurance benefits for retired employees. As at 31 December 2016, some 3,283 retired employees and covered dependants currently benefit from these provisions and some 10,381 current employees will be eligible on their retirement. AstraZeneca accrues for the present value of such retiree obligations over the working life of the employee. In practice, these benefits will be funded with reference to the financing principles.
The cost of post-retirement benefits other than pensions for the Group in 2016 was $17m (2015: $23m; 2014: $20m). Plan assets were $285m and plan obligations were $309m at 31 December 2016. These benefit plans have been included in the disclosure of post-retirement benefits under IAS 19.
Financial assumptions
Qualified independent actuaries have updated the actuarial valuations under IAS 19 of the major defined benefit schemes operated by the Group to 31 December 2016. The assumptions used by the actuaries are chosen from a range of possible actuarial assumptions which, due to the long-term nature of the schemes, may not necessarily be borne out in practice. These assumptions were as follows:
| | | | | | | | | | | | | | | | |
| | | 2016 | | | 2015 | |
| | | UK | | | Rest of Group | | | UK | | | Rest of Group | |
| Inflation assumption | | | 3.2% | | | | 2.1% | | | | 3.0% | | | | 2.1% | |
| Rate of increase in salaries | | | – | 1 | | | 3.1% | | | | – | 1 | | | 3.0% | |
| Rate of increase in pensions in payment | | | 3.0% | | | | 0.9% | | | | 3.0% | | | | 0.8% | |
| Discount rate | | | 2.7% | | | | 3.3% | | | | 3.8% | | | | 3.8% | |
| 1 | Pensionable pay frozen at 30 June 2010 levels following UK fund changes. |
Discount rate and methodology changes
Over 2016, the Company’s discount rates were based on yields on long-term AA-rated fixed income instruments, using a single discount rate for each pension plan to value the defined benefit obligations, service cost and interest cost. The discount rate was based on the duration of cash flows underlying the defined benefit obligations. From 2017, for the largest plans, the Company will move to a multiple discount rate approach. This will result in separate discount rates for defined benefit obligations, service cost and interest cost. This change had no effect on the 2016 expense, and will not affect the future measurement of the defined benefit obligations, but will impact the service cost and interest cost in future years.
Demographic assumptions
The mortality assumptions are based on country-specific mortality tables. These are compared to actual AstraZeneca experience and adjusted where sufficient data is available. Additional allowance for future improvements in life expectancy is included for all major schemes where there is credible data to support this continuing trend.
The table below illustrates life expectancy assumptions at age 65 for male members retiring in 2016 and members expected to retire in 2036 (2015: 2015 and 2035 respectively).
| | | | | | | | | | | | | | | | |
| | | Life expectancy assumption for a male member retiring at age 65 | |
| Country | | 2016 | | | 2036 | | | 2015 | | | 2035 | |
| UK | | | 23.3 | | | | 24.6 | | | | 23.2 | | | | 24.5 | |
| US | | | 22.4 | | | | 23.9 | | | | 22.9 | | | | 24.4 | |
| Sweden | | | 21.8 | | | | 23.6 | | | | 20.5 | | | | 22.4 | |
The Company adopted the CMI 2015 Mortality Projections Model with a 1% long-term improvement rate in 2015.
| | |
| AstraZenecaAnnual Report and Form 20-F Information 2016 | | 167 |
Financial Statements
20 Post-retirement benefitscontinued
Risks associated with the Company’s defined benefit pensions
The UK defined benefit plan accounts for 63% of the Group’s defined benefit obligations and exposes the Company to a number of risks, the most significant of which are:
| | | | |
| Risk | | Description | | Mitigation |
| | |
Volatile asset returns | | The Defined Benefit Obligation (DBO) is calculated using a discount rate set with reference to AA-rated corporate bond yields; asset returns that differ from the discount rate will create an element of volatility in the solvency ratio. The UK Pension Fund holds a significant proportion (around 72.5%) in growth assets. Although these growth assets are expected to outperform corporate bonds in the long term, they can lead to volatility and mismatching risk in the short term. The allocation to growth assets is monitored to ensure it remains appropriate given the UK Pension Fund’s long-term objectives. | | In order to mitigate investment risk, changes to investment strategy, including to the portfolio of growth assets, were completed during 2016 to establish a suitably diversified range of asset classes, return drivers and investment managers. The investment strategy will continue to evolve to further improve the expected risk/return profile as opportunities arise. The Trustee has hedged the vast majority (over 90%) of unintended non-sterling, overseas currency risk within the UK Pension Fund assets. |
| | |
Changes in bond yields | | A decrease in corporate bond yields will increase the present value placed on the DBO for accounting purposes. | | The interest rate hedge of the UK Pension Fund significantly increased in 2016 via additional investments in gilts and interest rate derivatives. The hedge is set at 75% of total assets and protects to some degree against falling interest rates (approximately 55% hedged at the end of 2015). Note that there are some differences in the bonds and instruments held by the UK Pension Fund to hedge interest rate risk on the statutory and long-term funding basis (gilts) and the bonds analysed to set the DBO discount rate on an accounting basis (AA corporate bonds). As such, there remains some mismatching risk on an accounting basis should yields on gilts and swaps diverge compared to corporate bonds (ie the ‘credit spread’ between gilts and corporate bonds narrows). The UK Pension Fund retains some exposure to corporate bonds to help mitigate this risk. |
| | |
| Inflation risk | | A significant proportion of the DBO is indexed in line with price inflation (specifically inflation in the UK Retail Price Index) and higher inflation will lead to higher liabilities (although, in most cases, this is capped at an annual increase of 5%). | | The UK Pension Fund holds index-linked gilts and derivative instruments such as swaps, which provide a hedge against higher-than-expected inflation increases on the DBO. The inflation hedge of the UK Pension Fund significantly increased in 2016 via additional investments in such assets, so that overall, the hedge is approximately 75% as a proportion of total assets (approximately 60% hedged at the end of 2015). The PIE exercise will further reduce the inflation sensitivity of the liabilities and mitigate this risk. |
| | |
| Life expectancy | | The majority of the UK Pension Fund’s obligations are to provide benefits for the life of the member, so increases in life expectancy will result in an increase in the liabilities. | | The UK Pension Fund entered into a longevity swap during 2013 which provides hedging against the longevity risk of increasing life expectancy over the next 77 years for around 10,000 of the UK Pension Fund’s current pensioners and covers $2.4bn of the UK Pension Fund’s liabilities. A one-year increase in life expectancy will result in a $200m increase in pension fund assets. |
Other risks
There are a number of other risks of running the UK Pension Fund including operational risks (such as paying out the wrong benefits) and legislative risks (such as the government increasing the burden on pension funds through new legislation). These are mitigated in so far as possible via the governance structure in place which oversees and administers the pension funds.
| | |
| 168 | | AstraZenecaAnnual Report and Form 20-F Information 2016 |
20 Post-retirement benefitscontinued
Post-retirement scheme deficit
The assets and obligations of the defined benefit schemes operated by the Company at 31 December 2016, as calculated in accordance with IAS 19, are shown below. The fair values of the schemes’ assets are not intended to be realised in the short term and may be subject to significant change before they are realised. The present value of the schemes’ obligations is derived from cash flow projections over long periods and is therefore inherently uncertain.
| | | | | | | | | | | | | | | | | | | | | | | | | | | | |
| | | 2016 | | | | | | 2015 | |
| | | UK $m | | | Rest of Group $m | | | Total $m | | | | | | UK $m | | | Rest of Group $m | | | Total $m | |
| Scheme assets | | | | | | | | | | | | | | | | | | | | | | | | | | | | |
| Equity: Global (exc Emerging markets) | | | 704 | | | | 769 | | | | 1,473 | | | | | | | | 1,362 | | | | 770 | | | | 2,132 | |
| Equity: Emerging markets | | | 158 | | | | – | | | | 158 | | | | | | | | 140 | | | | 1 | | | | 141 | |
| Government bonds: Global (exc Emerging markets) | | | 1,624 | | | | 124 | | | | 1,748 | | | | | | | | 1,614 | | | | 421 | | | | 2,035 | |
| Government bonds: Emerging markets | | | – | | | | 2 | | | | 2 | | | | | | | | 3 | | | | 59 | | | | 62 | |
| Investment grade corporate bonds (AAA-BBB): | | | | | | | | | | | | | | | | | | | | | | | | | | | | |
| Global (exc Emerging markets) | | | 83 | | | | 951 | | | | 1,034 | | | | | | | | 2,273 | | | | 940 | | | | 3,213 | |
| Investment grade corporate bonds (AAA-BBB): Emerging markets | | | 9 | | | | – | | | | 9 | | | | | | | | 30 | | | | – | | | | 30 | |
| Other corporate bonds: Global (exc Emerging markets) | | | 222 | | | | 112 | | | | 334 | | | | | | | | 61 | | | | 6 | | | | 67 | |
| Other corporate bonds: Emerging markets | | | 114 | | | | 2 | | | | 116 | | | | | | | | 23 | | | | 2 | | | | 25 | |
| Derivatives: Interest rate contracts | | | (43 | ) | | | (4 | ) | | | (47 | ) | | | | | | | (111 | ) | | | (32 | ) | | | (143 | ) |
| Derivatives: Inflation rate contracts | | | (63 | ) | | | (13 | ) | | | (76 | ) | | | | | | | (92 | ) | | | 9 | | | | (83 | ) |
| Derivatives: Foreign exchange contracts | | | 32 | | | | 3 | | | | 35 | | | | | | | | (84 | ) | | | 3 | | | | (81 | ) |
| Derivatives: Other | | | (7 | ) | | | – | | | | (7 | ) | | | | | | | (140 | ) | | | – | | | | (140 | ) |
| Derivatives: Longevity swap | | | (43 | ) | | | – | | | | (43 | ) | | | | | | | (37 | ) | | | – | | | | (37 | ) |
| Investment funds: Private equity funds (no quoted market price) | | | – | | | | 1 | | | | 1 | | | | | | | | – | | | | – | | | | – | |
| Investment funds: Hedge funds | | | 1,133 | | | | 360 | | | | 1,493 | | | | | | | | 531 | | | | 154 | | | | 685 | |
| Investment funds: Other | | | 1,751 | | | | 287 | | | | 2,038 | | | | | | | | 390 | | | | 373 | | | | 763 | |
| Cash and cash equivalents | | | 211 | | | | 141 | | | | 352 | | | | | | | | 436 | | | | 159 | | | | 595 | |
| Others | | | 252 | | | | 244 | | | | 496 | | | | | | | | 68 | | | | 89 | | | | 157 | |
| Total fair value of scheme assets1 | | | 6,137 | | | | 2,979 | | | | 9,116 | | | | | | | | 6,467 | | | | 2,954 | | | | 9,421 | |
| | | | | | | |
| Scheme obligations | | | | | | | | | | | | | | | | | | | | | | | | | | | | |
| Present value of scheme obligations in respect of: | | | | | | | | | | | | | | | | | | | | | | | | | | | | |
Active membership | | | (679 | ) | | | (1,590 | ) | | | (2,269 | ) | | | | | | | (1,094 | ) | | | (1,420 | ) | | | (2,514 | ) |
Deferred membership | | | (1,806 | ) | | | (1,046 | ) | | | (2,852 | ) | | | | | | | (1,862 | ) | | | (986 | ) | | | (2,848 | ) |
Pensioners | | | (4,633 | ) | | | (1,548 | ) | | | (6,181 | ) | | | | | | | (4,495 | ) | | | (1,538 | ) | | | (6,033 | ) |
| Total value of scheme obligations | | | (7,118 | ) | | | (4,184 | ) | | | (11,302 | ) | | | | | | | (7,451 | ) | | | (3,944 | ) | | | (11,395 | ) |
Deficit in the scheme as recognised in the
Consolidated Statement of Financial Position | | | (981 | ) | | | (1,205 | ) | | | (2,186 | ) | | | | | | | (984 | ) | | | (990 | ) | | | (1,974 | ) |
| 1 | Included in scheme assets is $nil (2015: $nil) of the Company’s own assets. |
Fair value of scheme assets
| | | | | | | | | | | | | | | | | | | | | | | | | | | | |
| | | 2016 | | | | | | 2015 | |
| | | UK $m | | | Rest of Group $m | | | Total $m | | | | | | UK $m | | | Rest of Group $m | | | Total $m | |
| At beginning of year | | | 6,467 | | | | 2,954 | | | | 9,421 | | | | | | | | 7,311 | | | | 3,235 | | | | 10,546 | |
| Interest income on scheme assets | | | 221 | | | | 104 | | | | 325 | | | | | | | | 257 | | | | 100 | | | | 357 | |
| Expenses | | | (5 | ) | | | (9 | ) | | | (14 | ) | | | | | | | (5 | ) | | | (10 | ) | | | (15 | ) |
| Actuarial gains/(losses) | | | 858 | | | | 84 | | | | 942 | | | | | | | | (375 | ) | | | (64 | ) | | | (439 | ) |
| Exchange adjustments | | | (1,228 | ) | | | (26 | ) | | | (1,254 | ) | | | | | | | (311 | ) | | | (97 | ) | | | (408 | ) |
| Employer contributions | | | 130 | | | | 62 | | | | 192 | | | | | | | | 360 | | | | 42 | | | | 402 | |
| Participant contributions | | | 4 | | | | – | | | | 4 | | | | | | | | 5 | | | | – | | | | 5 | |
| Settlements | | | – | | | | – | | | | – | | | | | | | | (447 | ) | | | – | | | | (447 | ) |
| Benefits paid | | | (310 | ) | | | (190 | ) | | | (500 | ) | | | | | | | (328 | ) | | | (252 | ) | | | (580 | ) |
| Scheme assets’ fair value at end of year | | | 6,137 | | | | 2,979 | | | | 9,116 | | | | | | | | 6,467 | | | | 2,954 | | | | 9,421 | |
The actual return on the plan assets was a gain of $1,267m (2015: loss of $82m).
| | |
| AstraZenecaAnnual Report and Form 20-F Information 2016 | | 169 |
Financial Statements
20 Post-retirement benefitscontinued
Movement in post-retirement scheme obligations
| | | | | | | | | | | | | | | | | | | | | | | | | | | | |
| | | 2016 | | | | | | 2015 | |
| | | UK $m | | | Rest of Group $m | | | Total $m | | | | | | UK $m | | | Rest of Group $m | | | Total $m | |
| Present value of obligations in scheme at beginning of year | | | (7,451 | ) | | | (3,944 | ) | | | (11,395 | ) | | | | | | | (8,842 | ) | | | (4,655 | ) | | | (13,497 | ) |
| Current service cost | | | (20 | ) | | | (82 | ) | | | (102 | ) | | | | | | | (34 | ) | | | (105 | ) | | | (139 | ) |
| Past service credit/(cost) | | | 27 | | | | 15 | | | | 42 | | | | | | | | (44 | ) | | | 16 | | | | (28 | ) |
| Participant contributions | | | (4 | ) | | | (4 | ) | | | (8 | ) | | | | | | | (5 | ) | | | – | | | | (5 | ) |
| Benefits paid | | | 310 | | | | 190 | | | | 500 | | | | | | | | 328 | | | | 252 | | | | 580 | |
| Interest expense on post-retirement scheme obligations | | | (253 | ) | | | (135 | ) | | | (388 | ) | | | | | | | (301 | ) | | | (133 | ) | | | (434 | ) |
| Actuarial (losses)/gains | | | (1,189 | ) | | | (328 | ) | | | (1,517 | ) | | | | | | | 613 | | | | 478 | | | | 1,091 | |
| Settlements | | | – | | | | – | | | | – | | | | | | | | 447 | | | | – | | | | 447 | |
| Exchange adjustments | | | 1,462 | | | | 104 | | | | 1,566 | | | | | | | | 387 | | | | 203 | | | | 590 | |
| Present value of obligations in scheme at end of year | | | (7,118 | ) | | | (4,184 | ) | | | (11,302 | ) | | | | | | | (7,451 | ) | | | (3,944 | ) | | | (11,395 | ) |
The obligations arise from the following plans:
| | | | | | | | | | | | | | | | | | | | | | | | | | | | |
| | | 2016 | | | | | | 2015 | |
| | | UK $m | | | Rest of Group $m | | | Total $m | | | | | | UK $m | | | Rest of Group $m | | | Total $m | |
| Funded – pension schemes | | | (7,101 | ) | | | (3,309 | ) | | | (10,410 | ) | | | | | | | (7,429 | ) | | | (3,142 | ) | | | (10,571 | ) |
| Funded – post-retirement healthcare | | | – | | | | (279 | ) | | | (279 | ) | | | | | | | – | | | | (281 | ) | | | (281 | ) |
| Unfunded – pension schemes | | | – | | | | (583 | ) | | | (583 | ) | | | | | | | – | | | | (506 | ) | | | (506 | ) |
| Unfunded – post-retirement healthcare | | | (17 | ) | | | (13 | ) | | | (30 | ) | | | | | | | (22 | ) | | | (15 | ) | | | (37 | ) |
| Total | | | (7,118 | ) | | | (4,184 | ) | | | (11,302 | ) | | | | | | | (7,451 | ) | | | (3,944 | ) | | | (11,395 | ) |
The weighted average duration of the post-retirement scheme obligations in the UK is 18 years and 15 years in the Rest of Group.
Consolidated Statement of Comprehensive Income disclosures
The amounts that have been charged to the Consolidated Statement of Comprehensive Income, in respect of defined benefit schemes for the year ended 31 December 2016, are set out below.
| | | | | | | | | | | | | | | | | | | | | | | | | | | | |
| | | 2016 | | | | | | 2015 | |
| | | UK $m | | | Rest of Group $m | | | Total $m | | | | | | UK $m | | | Rest of Group $m | | | Total $m | |
| Operating profit | | | | | | | | | | | | | | | | | | | | | | | | | | | | |
| Current service cost | | | (20 | ) | | | (82 | ) | | | (102 | ) | | | | | | | (34 | ) | | | (105 | ) | | | (139 | ) |
| Past service credit/(cost) | | | 27 | | | | 15 | | | | 42 | | | | | | | | (44 | ) | | | 16 | | | | (28 | ) |
| Expenses | | | (5 | ) | | | (9 | ) | | | (14 | ) | | | | | | | (5 | ) | | | (10 | ) | | | (15 | ) |
| Total charge to operating profit | | | 2 | | | | (76 | ) | | | (74 | ) | | | | | | | (83 | ) | | | (99 | ) | | | (182 | ) |
| | | | | | | |
| Finance expense | | | | | | | | | | | | | | | | | | | | | | | | | | | | |
| Interest income on scheme assets | | | 221 | | | | 104 | | | | 325 | | | | | | | | 257 | | | | 100 | | | | 357 | |
| Interest expense on post-retirement scheme obligations | | | (253 | ) | | | (135 | ) | | | (388 | ) | | | | | | | (301 | ) | | | (133 | ) | | | (434 | ) |
| Net interest on post-employment defined benefit plan liabilities | | | (32 | ) | | | (31 | ) | | | (63 | ) | | | | | | | (44 | ) | | | (33 | ) | | | (77 | ) |
| Charge before taxation | | | (30 | ) | | | (107 | ) | | | (137 | ) | | | | | | | (127 | ) | | | (132 | ) | | | (259 | ) |
| | | | | | | |
| Other comprehensive income | | | | | | | | | | | | | | | | | | | | | | | | | | | | |
| Difference between the actual return and the expected return on the post-retirement scheme assets | | | 858 | | | | 84 | | | | 942 | | | | | | | | (375 | ) | | | (64 | ) | | | (439 | ) |
| Experience gains/(losses) arising on the post-retirement scheme obligations | | | 220 | | | | (6 | ) | | | 214 | | | | | | | | 3 | | | | 56 | | | | 59 | |
| Changes in financial assumptions underlying the present value of the post-retirement scheme obligations | | | (1,409 | ) | | | (377 | ) | | | (1,786 | ) | | | | | | | 370 | | | | 386 | | | | 756 | |
| Changes in demographic assumptions | | | – | | | | 55 | | | | 55 | | | | | | | | 240 | | | | 36 | | | | 276 | |
| Remeasurement of the defined benefit liability | | | (331 | ) | | | (244 | ) | | | (575 | ) | | | | | | | 238 | | | | 414 | | | | 652 | |
Past service credit in 2016 includes a credit to operating income of £54m ($74m) arising from the PIE exercise in the UK, as referred to in the Liability Management Exercises section on page 166, and a credit to operating income of $16m arising from a restructuring programme in the US which will involuntarily terminate certain targeted participants in the Defined Benefit Pension Plan, AZ Supplemental Plan and the VEBA Retiree Health Plan. The past service credit in 2016 has been partially offset by costs predominantly related to enhanced pensions in early retirement in the UK and Sweden.
Group costs in respect of defined contribution schemes during the year were $352m (2015: $302m).
2015 settlements included $447m relating to the removal of the Investment Account (defined contribution) section of the UK Pension Fund from both the UK assets and liabilities with a net impact of $nil on the overall deficit.
| | |
| 170 | | AstraZenecaAnnual Report and Form 20-F Information 2016 |
20 Post-retirement benefitscontinued
Rate sensitivities
The following table shows the US dollar effect of a change in the significant actuarial assumptions used to determine the retirement benefits obligations in our three main defined benefit pension obligation countries.
| | | | | | | | | | | | | | | | | | | | |
| | | 2016 | | | | | | 2015 | |
| | | +0.5% | | | -0.5% | | | | | | +0.5% | | | -0.5% | |
| Discount rate | | | | | | | | | | | | | | | | | | | | |
| UK ($m) | | | 546 | | | | (712 | ) | | | | | | | 530 | | | | (600 | ) |
| US ($m) | | | 107 | | | | (114 | ) | | | | | | | 111 | | | | (118 | ) |
| Sweden ($m) | | | 128 | | | | (149 | ) | | | | | | | 143 | | | | (164 | ) |
| Total ($m) | | | 781 | | | | (975 | ) | | | | | | | 784 | | | | (882 | ) |
| | | | | | | | | | | | | | | | | | | | |
| | | 2016 | | | | | | 2015 | |
| | | +0.5% | | | -0.5% | | | | | | +0.5% | | | -0.5% | |
| Inflation rate1 | | | | | | | | | | | | | | | | | | | | |
| UK ($m) | | | (510 | ) | | | 486 | | | | | | | | (525 | ) | | | 517 | |
| US ($m) | | | (12 | ) | | | 12 | | | | | | | | (14 | ) | | | 15 | |
| Sweden ($m) | | | (147 | ) | | | 127 | | | | | | | | (159 | ) | | | 140 | |
| Total ($m) | | | (669 | ) | | | 625 | | | | | | | | (698 | ) | | | 672 | |
| | | | | | | | | | | | | | | | | | | | |
| | | 2016 | | | | | | 2015 | |
| | | +0.5% | | | -0.5% | | | | | | +0.5% | | | -0.5% | |
| Rate of increase in salaries | | | | | | | | | | | | | | | | | | | | |
| UK ($m) | | | – | | | | – | | | | | | | | – | | | | – | |
| US ($m) | | | (9 | ) | | | 9 | | | | | | | | (12 | ) | | | 12 | |
| Sweden ($m) | | | (33 | ) | | | 30 | | | | | | | | (66 | ) | | | 58 | |
| Total ($m) | | | (42 | ) | | | 39 | | | | | | | | (78 | ) | | | 70 | |
| | | | | | | | | | | | | | | | | | | | |
| | | 2016 | | | | | | 2015 | |
| | | +1 year | | | -1 year | | | | | | +1 year | | | -1 year | |
| Mortality rate | | | | | | | | | | | | | | | | | | | | |
| UK ($m) | | | (300 | )2 | | | 292 | 3 | | | | | | | (313 | ) | | | 314 | |
| US ($m) | | | (27 | ) | | | 28 | | | | | | | | (24 | ) | | | 25 | |
| Sweden ($m) | | | (57 | ) | | | 57 | | | | | | | | (63 | ) | | | 62 | |
| Total ($m) | | | (384 | ) | | | 377 | | | | | | | | (400 | ) | | | 401 | |
| 1 | Rate of increase in pensions in payment follows inflation. |
| 2 | Of the $300m increase, $200m is covered by the longevity swap. |
| 3 | Of the $292m decrease, $196m is covered by the longevity swap. |
The sensitivity to the financial assumptions shown above has been estimated taking into account the approximate duration of the liabilities and the overall profile of the plan membership. The sensitivity to the life expectancy assumption has been estimated based on the distribution of the plan cash flows.
| | |
| AstraZenecaAnnual Report and Form 20-F Information 2016 | | 171 |
Financial Statements
21 Reserves
Retained earnings
The cumulative amount of goodwill written off directly to reserves resulting from acquisitions, net of disposals, amounted to $613m (2015: $624m; 2014: $639m) using year end rates of exchange. At 31 December 2016, 276,303 shares, at a cost of $19m, have been deducted from retained earnings (2015: 49,105 shares, at a cost of $4m; 2014: 168,388 shares, at a cost of $10m).
There are no significant statutory or contractual restrictions on the distribution of current profits of subsidiaries; undistributed profits of prior years are, in the main, permanently employed in the businesses of these companies. The undistributed income of AstraZeneca companies overseas might be liable to overseas taxes and/or UK taxation (after allowing for double taxation relief) if they were to be distributed as dividends (see Note 4).
| | | | | | | | | | | | |
| | | 2016 $m | | | 2015 $m | | | 2014 $m | |
| Cumulative translation differences included within retained earnings | | | | | | | | | | | | |
| At 1 January | | | (372 | ) | | | 490 | | | | 1,782 | |
| Foreign exchange arising on consolidation | | | (1,050 | ) | | | (528 | ) | | | (823 | ) |
| Exchange adjustments on goodwill (recorded against other reserves) | | | (11 | ) | | | (15 | ) | | | (40 | ) |
| Foreign exchange arising on designating borrowings in net investment hedges | | | (591 | ) | | | (333 | ) | | | (529 | ) |
| Fair value movement on derivatives designated in net investment hedges | | | (4 | ) | | | 14 | | | | 100 | |
| Net exchange movement in retained earnings | | | (1,656 | ) | | | (862 | ) | | | (1,292 | ) |
| At 31 December | | | (2,028 | ) | | | (372 | ) | | | 490 | |
Cumulative amounts with respect to cash flow hedges included within retained earnings are $80m (2015: $nil; 2014: $nil).
Other reserves
The other reserves arose from the cancellation of £1,255m of share premium account by the Company in 1993 and the redenomination of share capital ($157m) in 1999. The reserves are available for writing off goodwill arising on consolidation and, subject to guarantees given to preserve creditors at the date of the court order, are available for distribution.
22 Share capital of the Company
| | | | | | | | | | | | |
| | | Allotted, called-up and fully paid | |
| | | 2016 $m | | | 2015 $m | | | 2014 $m | |
| Issued Ordinary Shares ($0.25 each) | | | 316 | | | | 316 | | | | 316 | |
| Redeemable Preference Shares (£1 each – £50,000) | | | – | | | | – | | | | – | |
| At 31 December | | | 316 | | | | 316 | | | | 316 | |
The Redeemable Preference Shares carry limited class voting rights and no dividend rights. This class of shares is capable of redemption at par at the option of the Company on the giving of seven days’ written notice to the registered holder of the shares.
The movements in the number of Ordinary Shares during the year can be summarised as follows:
| | | | | | | | | | | | |
| | | No. of shares | |
| | | 2016 | | | 2015 | | | 2014 | |
| At 1 January | | | 1,264,122,670 | | | | 1,263,143,338 | | | | 1,257,170,087 | |
| Issues of shares (share schemes) | | | 1,106,754 | | | | 979,332 | | | | 5,973,251 | |
| At 31 December | | | 1,265,229,424 | | | | 1,264,122,670 | | | | 1,263,143,338 | |
Details of Directors’ interests in shares are shown in the Directors’ Remuneration Report from page 103.
Share repurchases
No Ordinary Shares were repurchased by the Company in 2016 (2015: nil; 2014: nil).
Shares held by subsidiaries
No shares in the Company were held by subsidiaries in any year.
23 Dividends to shareholders
| | | | | | | | | | | | | | | | | | | | | | | | |
| | | 2016 Per share | | | 2015 Per share | | | 2014 Per share | | | 2016 $m | | | 2015 $m | | | 2014 $m | |
| Final | | | $1.90 | | | | $1.90 | | | | $1.90 | | | | 2,402 | | | | 2,400 | | | | 2,395 | |
| Interim | | | $0.90 | | | | $0.90 | | | | $0.90 | | | | 1,138 | | | | 1,137 | | | | 1,137 | |
| Total | | | $2.80 | | | | $2.80 | | | | $2.80 | | | | 3,540 | | | | 3,537 | | | | 3,532 | |
The second interim dividend, to be confirmed as final, is $1.90 per Ordinary Share and $2,404m in total. This will be payable on 20 March 2017.
On payment of the dividends, exchange losses of $3m (2015: $nil; 2014: losses of $3m) arose. These exchange losses are included in Note 3.
| | |
| 172 | | AstraZenecaAnnual Report and Form 20-F Information 2016 |
24 Non-controlling interests
Following the acquisition of a majority stake in Acerta Pharma on 2 February 2016, the Group Financial Statements at 31 December 2016 reflect equity of $1,808m and total comprehensive income of $95m attributable to the non-controlling interests, held by other parties, of Acerta Pharma B.V. and its subsidiaries. The following summarised financial information, for Acerta Pharma B.V. and its subsidiaries, is presented on a stand-alone basis since the acquisition date, and before the impact of Group-related adjustments:
| | | | |
| | | 2016 $m | |
| Total Revenue | | | – | |
| Loss after tax | | | (212 | ) |
| Other comprehensive income | | | – | |
| Total comprehensive income | | | (212 | ) |
| | | | |
| | | 2016 $m | |
| Non-current assets | | | 73 | |
| Current assets | | | 79 | |
| Total assets | | | 152 | |
| Current liabilities | | | (171 | ) |
| Total liabilities | | | (171 | ) |
| Net liabilities | | | (19 | ) |
| | | | |
| | | 2016 $m | |
| Net cash outflow from operating activities | | | (223 | ) |
| Net cash inflow from investing activities | | | 139 | |
| Decrease in cash and cash equivalents in the year | | | (84 | ) |
The non-controlling interest in Acerta Pharma is subject to a put option, exercisable by the minority shareholders at certain points in the future, not earlier than the commercial launch of acalabrutinib. This put option gives rise to a liability which is recorded at the present value of the expected redemption amount, calculated using a simulation model based on forecast revenue and earnings of Acerta Pharma, and is recorded within Non-current other payables (see Note 18). The corresponding debit has been recorded in retained earnings.
25 Acquisitions of business operations
2016 Acquisitions
Acerta Pharma
On 2 February 2016, AstraZeneca completed an agreement to invest in a majority equity stake in Acerta Pharma, a privately-owned biopharmaceutical company based in the Netherlands and US. The transaction provides AstraZeneca with a potential best-in-class irreversible oral Bruton’s tyrosine kinase (BTK) inhibitor, acalabrutinib (ACP-196), currently in Phase III development for B-cell blood cancers and in Phase I/II clinical trials in multiple solid tumours. Acerta Pharma has approximately 150 employees.
Under the terms of the agreement, AstraZeneca has acquired 55% of the issued share capital of Acerta Pharma for an upfront payment of $2.5bn. A further payment of $1.5bn will be paid either on receipt of the first regulatory approval for acalabrutinib for any indication in the US, or the end of 2018, depending on which is first. The agreement also includes options which, if exercised, provide the opportunity for Acerta Pharma’s shareholders to sell, and AstraZeneca to buy, the remaining 45% of shares in Acerta Pharma. The options can be exercised at various points in time, conditional on the first approval of acalabrutinib in both the US and Europe and when the extent of the commercial opportunity has been fully established, at a price of approximately $3bn net of certain costs and payments incurred by AstraZeneca and net of agreed future adjusting items, using a pre-agreed pricing mechanism.
The acquiring entity within the Group was a Swedish krona functional currency subsidiary. Foreign currency risk arises from the retranslation of the US dollar denominated liabilities arising from the transaction. To manage this foreign currency risk these liabilities have been designated as the hedge instrument in a net investment hedge of the Group’s underlying US dollar net investments. Exchange differences on the retranslation of the contingent consideration liability are recognised in other comprehensive income to the extent that the hedge is effective. Any ineffectiveness is taken to profit.
AstraZeneca’s 55% holding is a controlling interest and Acerta Pharma’s combination of intangible product rights with an established workforce and their operating processes requires that the transaction is accounted for as a business combination in accordance with IFRS 3.
Goodwill is principally attributable to the value of the specialist know-how inherent in the acquired workforce and the accounting for deferred taxes. Goodwill is not expected to be deductible for tax purposes.
Acerta Pharma’s results have been consolidated into the Group’s results from 2 February 2016. From the period from acquisition to 31 December 2016, Acerta Pharma had no revenues and its loss after tax was $212m.
If the acquisition had taken effect at the beginning of the reporting period in which the acquisition occurred (1 January 2016), on aproforma basis, the revenue of the combined Group for 2016 would have been unchanged and the profit after tax would have been $3,367m. Thispro forma information does not purport to represent the results of the combined Group that actually would have occurred had the acquisition taken place on 1 January 2016 and should not be taken to be representative of future results.
| | |
| AstraZenecaAnnual Report and Form 20-F Information 2016 | | 173 |
Financial Statements
25 Acquisitions of business operationscontinued
The fair values assigned to the Acerta Pharma business combination completed in 2016 were:
| | | | |
| | | Fair value $m | |
| |
| Non-current assets | | | | |
| Intangible assets (Note 9) | | | 7,307 | |
| Current assets | | | 253 | |
| Current liabilities | | | (90 | ) |
| |
| Non-current liabilities | | | | |
| Deferred tax liabilities | | | (1,777 | ) |
| Total net assets acquired | | | 5,693 | |
| Non-controlling interests | | | (1,903 | ) |
| Goodwill (Note 8) | | | 19 | |
| Fair value of total consideration | | | 3,809 | |
| Less: fair value of deferred consideration | | | (1,332 | ) |
| Total upfront consideration | | | 2,477 | |
| Less: cash and cash equivalents acquired | | | (94 | ) |
| Net cash outflow | | | 2,383 | |
Acquisition costs were immaterial.
2015 Acquisitions
ZS Pharma
On 17 December 2015, AstraZeneca completed the acquisition of ZS Pharma, a biopharmaceutical company based in San Mateo, California. ZS Pharma uses its proprietary ion-trap technology to develop novel treatments for hyperkalaemia, a serious condition of elevated potassium in the bloodstream, typically associated with chronic kidney disease (CKD) and chronic heart failure (CHF).
The acquisition gives AstraZeneca access to the potassium-binding compound ZS-9, a potential best-in-class treatment for hyperkalaemia.
ZS Pharma represents a strong fit with AstraZeneca’s pipeline and portfolio in Cardiovascular & Metabolic Disease, one of the Company’s three main therapy areas. AstraZeneca’s strategy focuses on reducing morbidity, mortality and organ damage by addressing multiple risk factors across cardiovascular disease, diabetes and chronic kidney disease. ZS-9 complements the Company’s increasing focus on CKD and CHF, including the investigational medicine roxadustat, which is currently in Phase III development for patients with anaemia associated with CKD, as well as its leading Diabetes portfolio.
Under the terms of the agreement, AstraZeneca acquired 100% of the share capital of ZS Pharma for $90 per share in an all-cash transaction, or approximately $2.7bn in aggregate transaction value.
ZS Pharma has around 200 employees across three sites in California, Texas and Colorado. The combination of intangible product rights with an established workforce and their associated operating processes, principally those related to research and development and manufacturing, requires that the transaction is accounted for as a business combination in accordance with IFRS 3.
Goodwill is principally attributable to the commercial synergies AstraZeneca expects to be able to realise upon launch of ZS-9, the value of the specialist know-how inherent in the acquired workforce and the accounting for deferred taxes. Goodwill is not expected to be deductible for tax purposes.
ZS Pharma’s results have been consolidated into the Group’s results from 17 December 2015. From the period from acquisition to 31 December 2015, ZS Pharma’s revenues and loss were immaterial.
If the acquisition had taken effect at the beginning of the reporting period in which the acquisition occurred (1 January 2015), on a pro forma basis, the revenue of the combined Group for 2015 would have been unchanged and the profit after tax would have been $2,702m. This pro forma information does not purport to represent the results of the combined Group that actually would have occurred had the acquisition taken place on 1 January 2015 and should not be taken to be representative of future results.
Given the proximity of the completion of the transaction to the date the 2015 Financial Statements were approved, the finalisation of the accounting entries for this transaction was not complete. Our provisional assessment of the fair values of the assets and liabilities acquired, as detailed in the 2015 Financial Statements, was revised during 2016 as a result of new information obtained about facts and circumstances that existed at the date of acquisition that impact the value of deferred tax. This has resulted in a reduction to both deferred tax liabilities and goodwill of $68m.
| | |
| 174 | | AstraZenecaAnnual Report and Form 20-F Information 2016 |
25 Acquisitions of business operationscontinued
The final fair values assigned to the ZS Pharma business combination are detailed below:
| | | | |
| | | Fair value $m | |
| |
| Non-current assets | | | | |
| Intangible assets (Note 9) | | | 3,162 | |
| Property, plant and equipment (Note 7) | | | 21 | |
| | | | 3,183 | |
| Current assets | | | 169 | |
| Current liabilities | | | (50 | ) |
| |
| Non-current liabilities | | | | |
| Deferred tax liabilities | | | (977 | ) |
| Other liabilities | | | (13 | ) |
| | | | (990 | ) |
| Total net assets acquired | | | 2,312 | |
| Goodwill (Note 8) | | | 388 | |
| Total upfront consideration | | | 2,700 | |
| Less: cash and cash equivalents acquired | | | (73 | ) |
| Less: upfront consideration settled in January 2016 | | | (181 | ) |
| Net cash outflow | | | 2,446 | |
Acquisition costs were immaterial.
2014 Acquisitions
BMS’s share of Global Diabetes Alliance Assets
On 1 February 2014, AstraZeneca completed the acquisition of BMS’s interests in the companies’ diabetes alliance. The acquisition provided AstraZeneca with 100% ownership of the intellectual property and global rights for the development, manufacture and commercialisation of the diabetes business, includingOnglyza (saxagliptin),Kombiglyze XR (saxagliptin and metformin HCl extended release),Komboglyze (saxagliptin and metformin HCl),Farxiga (dapagliflozin, marketed asForxiga outside the US),Byetta(exenatide),Bydureon (exenatide extended release for injectable suspension),Myalept (metreleptin) andSymlin (pramlintide acetate).
The transaction consolidated worldwide ownership of the diabetes business within AstraZeneca, leveraging its primary and specialty care capabilities and its geographical reach, especially in emerging markets. The transaction included the acquisition of 100% of the share capital of Amylin Pharmaceuticals, LLC, and the asset purchase of the additional intellectual property and global rights not already owned by AstraZeneca, for the development, manufacture and commercialisation ofOnglyza,Kombiglyze XR,KomboglyzeandFarxiga, including associated BMS employees. This combination of intangible product rights and manufacturing assets with an established workforce and their associated operating processes, principally those related to the global manufacturing and selling and marketing operations, required that the acquisition be accounted for as a business combination in accordance with IFRS 3.
Upfront consideration for the acquisition of $2.7bn was paid on 1 February 2014, with further payments of up to $1.4bn being payable for future regulatory, launch and sales-related milestones as well as various sales-related royalty payments up until 2025. The amount of royalties payable under the agreement is inherently uncertain and difficult to predict, given the direct link to future sales and the range of outcomes cannot be reliably estimated. The maximum amount payable in each year is with reference to net sales. AstraZeneca also agreed to make payments up to $225m when certain additional assets are transferred. Contingent consideration was fair valued using decision-tree analysis, with key inputs including the probability of success, consideration of potential delays and the expected levels of future revenues. In accordance with IFRS 3, the fair value of contingent consideration, including future royalties, was recognised immediately as a liability.
The acquiring entity within the Group was a Swedish krona functional currency subsidiary. Foreign currency risk arises from the retranslation of the US dollar denominated contingent consideration. To manage this foreign currency risk the contingent consideration liability has been designated as the hedge instrument in a net investment hedge of the Group’s underlying US dollar net investments. Exchange differences on the retranslation of the contingent consideration liability are recognised in other comprehensive income to the extent that the hedge is effective. Any ineffectiveness is taken to profit.
In addition to the acquired interests, AstraZeneca entered into certain agreements with BMS to maintain the manufacturing and supply chain of the full portfolio of diabetes products and to deliver specified clinical trials with an agreed number of R&D and manufacturing employees dedicated to diabetes remaining with BMS to progress the diabetes portfolio and support the transition for these areas. Payments by AstraZeneca to BMS in relation to these arrangements are expensed as incurred. No amounts were recognised in the initial acquisition accounting in relation to these arrangements but were separated, at fair value, from the business combination accounting.
The terms of the agreement partially reflected settlement of the launch and sales-related milestones under the pre-existing Onglyza and Farxiga collaboration agreements, which were terminated in relation to the acquisition. The expected value of those pre-existing milestones was $0.3bn and was recognised as a separate component of consideration and excluded from the business combination accounting. Subsequently, these separate intangible assets have been recognised.
Goodwill of $1,530m arising on the transaction is underpinned by a number of elements, which individually cannot be quantified. Most significant among these are the synergies AstraZeneca expects to be able to generate through more efficient manufacturing processes and the incremental value accessible through strategic and operational independence upon taking full control of the alliance. Goodwill of $1.5bn is expected to be deductible for tax purposes.
| | |
| AstraZenecaAnnual Report and Form 20-F Information 2016 | | 175 |
Financial Statements
25 Acquisitions of business operationscontinued
The fair value of receivables acquired as part of the acquisition approximated the gross contractual amounts receivable. There were no significant amounts which were not expected to be collected.
The results from the additional acquired interests in the diabetes alliance were consolidated into the Group’s results from 1 February 2014, which added revenue of $895m in the period to 31 December 2014. Due to the highly integrated nature of the diabetes alliance, and the fact that it is not operated through a separate legal entity, the incremental direct costs associated with the additional acquired interest are not separately identifiable and it is impracticable therefore to disclose the profit or loss recognised in the period since acquisition.
If the acquisition had taken effect at the beginning of the reporting period in which the acquisition occurred (1 January 2014), on a pro forma basis, the revenue of the combined Group for 2014 would have been $26,174m. As detailed above, it is impracticable to disclose apro forma profit after tax. Thispro forma information does not purport to represent the results of the combined Group that actually would have occurred had the acquisition taken place on 1 January 2014 and should not be taken to be representative of future results.
Almirall
On 31 October 2014, the Group completed the agreement with Almirall to transfer the rights to Almirall’s respiratory franchise to AstraZeneca.
The transaction provided AstraZeneca with 100% of the rights for the development and commercialisation of Almirall’s existing proprietary respiratory business, including rights to revenues from Almirall’s existing collaborations, as well as its pipeline of investigational novel therapies. The franchise includesEklira (aclidinium);DuaklirGenuair, the combination of aclidinium with formoterol which had been filed for registration in the EU and developed in the US (EU approval received in November 2014); LAS100977 (abediterol), a once-daily long-acting beta2-agonist (LABA) in Phase II; an M3 antagonist beta2-agonist (MABA) platform in pre-clinical development (LAS191351, LAS194871) and Phase I (LAS190792); and multiple pre-clinical programmes. Almirall Sofotec, an Almirall subsidiary focused on the development of innovative proprietary devices, also transferred to AstraZeneca. In addition, Almirall employees dedicated to the respiratory business, including Almirall Sofotec employees, transferred to AstraZeneca.
Upfront consideration for the acquisition of $878m was paid in November 2014, with further payments of up to $1.22bn being payable for future development, launch, and sales-related milestones. AstraZeneca also agreed to make various sales-related royalty payments. The amount of royalties payable under the agreement is inherently uncertain and difficult to predict, given the direct link to future sales and the range of outcomes cannot be reliably estimated. The maximum amount payable in each year is with reference to net sales. Contingent consideration was fair valued using decision-tree analysis, with key inputs including the probability of success, consideration of potential delays and the expected levels of future revenues.
The acquiring entity within the Group was a pounds sterling functional currency subsidiary. Foreign currency risk arises from the retranslation of the contingent consideration. To manage this foreign currency risk the contingent consideration liability has been designated as the hedge instrument in a net investment hedge. Exchange differences on the retranslation of the contingent consideration liability are recognised in other comprehensive income to the extent that the hedge is effective. Any ineffectiveness is taken to profit.
Almirall’s pipeline of novel respiratory assets and its device capabilities further strengthen AstraZeneca’s Respiratory portfolio, which includesSymbicort andPulmicort, as well as the investigational medicines in development. The addition of aclidinium and the combination of aclidinium with formoterol, both in proprietaryGenuair device, allows AstraZeneca to offer patients a choice between dry powder inhaler and metered-dose inhaler devices across a range of molecules and combinations.
The combination of intangible product rights with an established workforce and their associated operating processes, principally those related to the selling and marketing operations, requires that the transaction is accounted for as a business combination in accordance with IFRS 3.
Goodwill of $311m is underpinned by a number of elements, which individually cannot be quantified. Most significant among these is the premium attributable to the significant competitive advantage associated with AstraZeneca’s complementary portfolio and that attributable to a highly skilled workforce. Goodwill of $0.3bn is expected to be deductible for tax purposes.
Almirall’s respiratory franchise results were consolidated into the Group’s results from 31 October 2014. For the period from acquisition to 31 December 2014, Almirall’s respiratory franchise revenues were $13m. Due to the highly integrated nature of the respiratory franchise, and the fact that it is not operated through a separate legal entity, the incremental direct costs associated with the acquired interest are not separately identifiable and it is impracticable therefore to disclose the profit or loss recognised in the period since acquisition.
If the acquisition had taken effect at the beginning of the reporting period in which the acquisition occurred (1 January 2014), on apro forma basis, the revenue of the combined Group for 2014 would have been $26,198m. As detailed above, it is impracticable to disclose apro forma profit after tax. Thispro forma information does not purport to represent the results of the combined Group that actually would have occurred had the acquisition taken place on 1 January 2014 and should not be taken to be representative of future results.
Definiens
On 25 November 2014, AstraZeneca completed the acquisition of Definiens Group, a privately-held German company focused on imaging and data analysis technology, known as Tissue Phenomics™, which dramatically improves the identification of biomarkers in tumour tissue.
Definiens’ technology provides detailed cell-by-cell readouts from target structures on tissue slides and allows the correlation of this information with data derived from other sources, generating new knowledge and supporting better decisions in research, diagnostics and therapy.
AstraZeneca acquired 100% of Definiens’ shares for an upfront consideration of $150m and contingent consideration of up to $150m based on reaching three predetermined development milestones. Contingent consideration was fair valued using decision-tree analysis, with key inputs including the probability of success and consideration of potential delays.
| | |
| 176 | | AstraZenecaAnnual Report and Form 20-F Information 2016 |
25 Acquisitions of business operationscontinued
The acquiring entity within the Group was a pounds sterling functional currency subsidiary. Foreign currency risk arises from the retranslation of the US dollar denominated contingent consideration. To manage this foreign currency risk the contingent consideration liability has been designated as the hedge instrument in a net investment hedge of the Group’s underlying US dollar net investments. Exchange differences on the retranslation of the contingent consideration liability are recognised in other comprehensive income to the extent that the hedge is effective. Any ineffectiveness is taken to profit.
Definiens’ results were consolidated into the Group’s results from 25 November 2014. For the period from acquisition to 31 December 2014, Definiens’ revenues were immaterial, in the context of the Group’s revenues, and its loss after tax was immaterial.
If the acquisition had taken effect at the beginning of the reporting period in which the acquisition occurred (1 January 2014), on a pro forma basis, the revenue of the combined Group for 2014 would have been unchanged and the change in profit after tax would have been immaterial. Thispro forma information does not purport to represent the results of the combined Group that actually would have occurred had the acquisition taken place on 1 January 2014 and should not be taken to be representative of future results.
The fair values assigned to the business combinations completed in 2014 were:
| | | | | | | | | | | | | | | | |
| 2014 acquisitions | | BMS’s share of Global Diabetes Alliance Assets $m | | | Almirall $m | | | Definiens $m | | | Total $m | |
| | | | |
| Non-current assets | | | | | | | | | | | | | | | | |
| Intangible assets (Note 9) | | | 5,746 | | | | 1,400 | | | | 355 | | | | 7,501 | |
| Property, plant and equipment (Note 7) | | | 478 | | | | 37 | | | | – | | | | 515 | |
| | | | 6,224 | | | | 1,437 | | | | 355 | | | | 8,016 | |
| Current assets | | | 480 | | | | 24 | | | | – | | | | 504 | |
| Current liabilities | | | (278 | ) | | | (2 | ) | | | – | | | | (280 | ) |
| Non-current liabilities | | | (84 | ) | | | (11 | ) | | | (117 | ) | | | (212 | ) |
| Total net assets acquired | | | 6,342 | | | | 1,448 | | | | 238 | | | | 8,028 | |
| Goodwill (Note 8) | | | 1,530 | | | | 311 | | | | – | | | | 1,841 | |
| Fair value of total consideration | | | 7,872 | | | | 1,759 | | | | 238 | | | | 9,869 | |
| Less: fair value of contingent consideration (Note 18) | | | (5,169 | ) | | | (881 | ) | | | (88 | ) | | | (6,138 | ) |
| Total upfront consideration | | | 2,703 | | | | 878 | | | | 150 | | | | 3,731 | |
| Less: cash and cash equivalents acquired | | | – | | | | (2 | ) | | | – | | | | (2 | ) |
| Net cash outflow | | | 2,703 | | | | 876 | | | | 150 | | | | 3,729 | |
Acquisition costs arising on acquisitions in 2014 were immaterial.
26 Financial risk management objectives and policies
The Group’s principal financial instruments, other than derivatives, comprise bank overdrafts, finance leases, loans, current and non-current investments, cash and short-term deposits. The main purpose of these financial instruments is to manage the Group’s funding and liquidity requirements. The Group has other financial assets and liabilities such as trade receivables and trade payables, which arise directly from its operations.
The principal financial risks to which the Group is exposed are those of liquidity, interest rate, foreign currency and credit. Each of these is managed in accordance with Board-approved policies. These policies are set out below.
The Group uses foreign currency borrowings, foreign currency forwards and swaps, currency options, cross-currency swaps and interest rate swaps for the purpose of hedging its foreign currency and interest rate risks. The Group may designate certain financial instruments as fair value hedges, cash flow hedges or net investment hedges in accordance with IAS 39. Key controls applied to transactions in derivative financial instruments are: to use only instruments where good market liquidity exists, to revalue all financial instruments regularly using current market rates and to sell options only to offset previously purchased options or as part of a risk management strategy. The Group is not a net seller of options, and does not use derivative financial instruments for speculative purposes.
Capital management
The capital structure of the Group consists of shareholders’ equity (Note 22), debt (Note 17) and cash (Note 16). For the foreseeable future, the Board will maintain a capital structure that supports the Group’s strategic objectives through:
| > | managing funding and liquidity risk |
| > | optimising shareholder return |
| > | maintaining a strong, investment-grade credit rating. |
The Group utilises factoring arrangements for selected trade receivables. These factoring arrangements qualify for full derecognition of the associated trade receivables under IAS 39.
Funding and liquidity risk are reviewed regularly by the Board and managed in accordance with policies described below.
The Board’s distribution policy comprises a regular cash dividend and, subject to business needs, a share repurchase component. The Board regularly reviews its shareholders’ return strategy, and in 2012 decided to suspend share repurchases in order to retain strategic flexibility.
The Group’s net debt position (loans and borrowings net of cash and cash equivalents, current investments and derivative financial instruments) has increased from a net debt position of $7,762m at the beginning of the year to a net debt position of $10,657m at 31 December 2016, primarily as a result of increased outflows from investing activities, including acquisitions.
| | |
| AstraZenecaAnnual Report and Form 20-F Information 2016 | | 177 |
Financial Statements
26 Financial risk management objectives and policiescontinued
Liquidity risk
The Board reviews the Group’s ongoing liquidity risks annually as part of the planning process and on an ad hoc basis. The Board considers short-term requirements against available sources of funding, taking into account forecast cash flows. The Group manages liquidity risk by maintaining access to a number of sources of funding which are sufficient to meet anticipated funding requirements. Specifically, the Group uses US commercial paper, committed bank facilities and cash resources to manage short-term liquidity and manages long-term liquidity by raising funds through the capital markets. The Group is assigned short-term credit ratings of P-2 by Moody’s and A-2 by Standard and Poor’s. The Group’s long-term credit rating is A3 stable outlook by Moody’s and A- stable outlook by Standard and Poor’s.
In addition to cash and cash equivalents of $5,018m, fixed deposits of $37m, less overdrafts of $94m at 31 December 2016, the Group has committed bank facilities of $3bn available to manage liquidity. At 31 December 2016, the Group has issued $3,494m under a Euro Medium Term Note programme and $12,763m under a SEC-registered programme. The Group regularly monitors the credit standing of the banking group and currently does not anticipate any issue with drawing on the committed facilities should this be necessary. The committed facilities of $3bn mature in April 2021 and were undrawn at 31 December 2016.
The maturity profile of the anticipated future contractual cash flows including interest in relation to the Group’s financial liabilities, on an undiscounted basis and which, therefore, differs from both the carrying value and fair value, is as follows:
| | | | | | | | | | | | | | | | | | | | | | | | | | | | | | | | | | | | |
| | | Bank overdrafts and other loans $m | | | Bonds $m | | | Finance leases $m | | | Trade and other payables $m | | | Total non-derivative financial instruments $m | | | Interest rate swaps $m | | | Cross- currency swaps $m | | | Total derivative financial instruments $m | | | Total $m | |
| Within one year | | | 1,488 | | | | 1,490 | | | | 45 | | | | 11,909 | | | | 14,932 | | | | (52 | ) | | | (16 | ) | | | (68 | ) | | | 14,864 | |
| In one to two years | | | – | | | | 401 | | | | 45 | | | | 1,720 | | | | 2,166 | | | | (52 | ) | | | (16 | ) | | | (68 | ) | | | 2,098 | |
| In two to three years | | | – | | | | 2,151 | | | | 31 | | | | 936 | | | | 3,118 | | | | (52 | ) | | | (16 | ) | | | (68 | ) | | | 3,050 | |
| In three to four years | | | – | | | | 298 | | | | 8 | | | | 924 | | | | 1,230 | | | | (16 | ) | | | (19 | ) | | | (35 | ) | | | 1,195 | |
| In four to five years | | | – | | | | 1,298 | | | | 1 | | | | 1,323 | | | | 2,622 | | | | (16 | ) | | | (325 | ) | | | (341 | ) | | | 2,281 | |
| In more than five years | | | – | | | | 10,135 | | | | – | | | | 7,002 | | | | 17,137 | | | | (62 | ) | | | – | | | | (62 | ) | | | 17,075 | |
| | | | 1,488 | | | | 15,773 | | | | 130 | | | | 23,814 | | | | 41,205 | | | | (250 | ) | | | (392 | ) | | | (642 | ) | | | 40,563 | |
| Effect of interest | | | (2 | ) | | | (6,461 | ) | | | (22 | ) | | | – | | | | (6,485 | ) | | | 250 | | | | 83 | | | | 333 | | | | (6,152 | ) |
| Effect of discounting, fair values and issue costs | | | – | | | | (63 | ) | | | – | | | | (3,937 | ) | | | (4,000 | ) | | | (161 | ) | | | 5 | | | | (156 | ) | | | (4,156 | ) |
| 31 December 2014 | | | 1,486 | | | | 9,249 | | | | 108 | | | | 19,877 | | | | 30,720 | | | | (161 | ) | | | (304 | ) | | | (465 | ) | | | 30,255 | |
| | | | | | | | | | | | | | | | | | | | | | | | | | | | | | | | | | | | |
| | | Bank overdrafts and other loans $m | | | Bonds $m | | | Finance leases $m | | | Trade and other payables $m | | | Total non-derivative financial instruments $m | | | Interest rate swaps $m | | | Cross- currency swaps $m | | | Total derivative financial instruments $m | | | Total $m | |
| Within one year | | | 851 | | | | 568 | | | | 66 | | | | 11,701 | | | | 13,186 | | | | (54 | ) | | | (17 | ) | | | (71 | ) | | | 13,115 | |
| In one to two years | | | – | | | | 2,318 | | | | 41 | | | | 1,522 | | | | 3,881 | | | | (54 | ) | | | (17 | ) | | | (71 | ) | | | 3,810 | |
| In two to three years | | | – | | | | 1,865 | | | | 22 | | | | 1,110 | | | | 2,997 | | | | (19 | ) | | | (26 | ) | | | (45 | ) | | | 2,952 | |
| In three to four years | | | – | | | | 1,444 | | | | 10 | | | | 1,277 | | | | 2,731 | | | | (15 | ) | | | (330 | ) | | | (345 | ) | | | 2,386 | |
| In four to five years | | | – | | | | 2,025 | | | | 2 | | | | 2,187 | | | | 4,214 | | | | (15 | ) | | | – | | | | (15 | ) | | | 4,199 | |
| In more than five years | | | – | | | | 14,192 | | | | – | | | | 5,313 | | | | 19,505 | | | | (44 | ) | | | – | | | | (44 | ) | | | 19,461 | |
| | | | 851 | | | | 22,412 | | | | 141 | | | | 23,110 | | | | 46,514 | | | | (201 | ) | | | (390 | ) | | | (591 | ) | | | 45,923 | |
| Effect of interest | | | (2 | ) | | | (8,194 | ) | | | (46 | ) | | | – | | | | (8,242 | ) | | | 201 | | | | 67 | | | | 268 | | | | (7,974 | ) |
| Effect of discounting, fair values and issue costs | | | – | | | | (109 | ) | | | – | | | | (3,990 | ) | | | (4,099 | ) | | | (126 | ) | | | 3 | | | | (123 | ) | | | (4,222 | ) |
| 31 December 2015 | | | 849 | | | | 14,109 | | | | 95 | | | | 19,120 | | | | 34,173 | | | | (126 | ) | | | (320 | ) | | | (446 | ) | | | 33,727 | |
| | | | | | | | | | | | | | | | | | | | | | | | | | | | | | | | | | | | |
| | | Bank overdrafts and other loans $m | | | Bonds $m | | | Finance leases $m | | | Trade and other payables $m | | | Total non-derivative financial instruments $m | | | Interest rate swaps $m | | | Cross- currency swaps $m | | | Total derivative financial instruments $m | | | Total $m | |
| Within one year | | | 455 | | | | 2,374 | | | | 42 | | | | 10,566 | | | | 13,437 | | | | (54 | ) | | | 32 | | | | (22 | ) | | | 13,415 | |
| In one to two years | | | – | | | | 1,921 | | | | 24 | | | | 4,986 | | | | 6,931 | | | | (19 | ) | | | 12 | | | | (7 | ) | | | 6,924 | |
| In two to three years | | | – | | | | 1,500 | | | | 16 | | | | 1,144 | | | | 2,660 | | | | (15 | ) | | | (216 | ) | | | (231 | ) | | | 2,429 | |
| In three to four years | | | – | | | | 2,080 | | | | 10 | | | | 1,666 | | | | 3,756 | | | | (15 | ) | | | 47 | | | | 32 | | | | 3,788 | |
| In four to five years | | | 7 | | | | 1,756 | | | | 3 | | | | 877 | | | | 2,643 | | | | (15 | ) | | | 86 | | | | 71 | | | | 2,714 | |
| In more than five years | | | – | | | | 14,796 | | | | – | | | | 3,624 | | | | 18,420 | | | | (30 | ) | | | 320 | | | | 290 | | | | 18,710 | |
| | | | 462 | | | | 24,427 | | | | 95 | | | | 22,863 | | | | 47,847 | | | | (148 | ) | | | 281 | | | | 133 | | | | 47,980 | |
| Effect of interest | | | (4 | ) | | | (8,111 | ) | | | (2 | ) | | | – | | | | (8,117 | ) | | | 148 | | | | (351 | ) | | | (203 | ) | | | (8,320 | ) |
| Effect of discounting, fair values and issue costs | | | – | | | | (59 | ) | | | – | | | | (2,889 | ) | | | (2,948 | ) | | | (82 | ) | | | (93 | ) | | | (175 | ) | | | (3,123 | ) |
| 31 December 2016 | | | 458 | | | | 16,257 | | | | 93 | | | | 19,974 | | | | 36,782 | | | | (82 | ) | | | (163 | ) | | | (245 | ) | | | 36,537 | |
| | |
| 178 | | AstraZenecaAnnual Report and Form 20-F Information 2016 |
26 Financial risk management objectives and policiescontinued
Where interest payments are on a floating rate basis, it is assumed that rates will remain unchanged from the last business day of each year ended 31 December.
It is not expected that the cash flows in the maturity profile could occur significantly earlier or at significantly different amounts, with the exception of $5,457m of contingent consideration and $1,901m arising from the put option over the non-controlling interest in Acerta Pharma, both held within other payables (see Note 18).
Market risk
Interest rate risk
The Group maintains a mix of fixed and floating rate debt. The portion of fixed rate debt was approved by the Board and any variation requires Board approval.
A significant portion of the Group’s long-term debt is held at fixed rates of interest. The Group uses interest rate swaps and forward rate agreements to manage this mix.
At 31 December 2016, the Group held interest rate swaps with a notional value of $1.6bn, converting the 7% guaranteed debentures payable in 2023 to floating rates, partially converting the 5.9% callable bond maturing in 2017 to floating rates and partially converting the 1.75% callable bond maturing in 2018 to floating rates. No new interest rate swaps were entered into during 2016. At 31 December 2016, swaps with a notional value of $1.35bn were designated in fair value hedge relationships and swaps with a notional value of $0.29bn related to debt designated as fair value through profit or loss. Designated hedges are expected to be effective and therefore the impact of ineffectiveness on profit is not expected to be material. The accounting treatment for fair value hedges and debt designated as fair value through profit or loss is disclosed in the Group Accounting Policies section from page 142.
The majority of surplus cash is currently invested in US dollar liquidity funds earning floating rates of interest.
The interest rate profile of the Group’s interest-bearing financial instruments is set out below. In the case of current and non-current financial liabilities, the classification includes the impact of interest rate swaps which convert the debt to floating rate.
| | | | | | | | | | | | | | | | | | | | | | | | | | | | | | | | | | | | | | | | | | | | |
| | | 2016 | | | | | | 2015 | | | | | | 2014 | |
| | | Fixed rate $m | | | Floating rate $m | | | Total $m | | | | | | Fixed rate $m | | | Floating rate $m | | | Total $m | | | | | | Fixed rate $m | | | Floating rate $m | | | Total $m | |
| | | | | | | | | | | |
| Financial liabilities | | | | | | | | | | | | | | | | | | | | | | | | | | | | | | | | | | | | | | | | | | | | |
| Interest-bearing loans and borrowings | | | | | | | | | | | | | | | | | | | | | | | | | | | | | | | | | | | | | | | | | | | | |
| Current | | | 1,086 | | | | 1,221 | | | | 2,307 | | | | | | | | 67 | | | | 849 | | | | 916 | | | | | | | | 960 | | | | 1,486 | | | | 2,446 | |
| Non-current | | | 13,154 | | | | 1,347 | | | | 14,501 | | | | | | | | 11,986 | | | | 2,151 | | | | 14,137 | | | | | | | | 7,199 | | | | 1,198 | | | | 8,397 | |
| Total | | | 14,240 | | | | 2,568 | | | | 16,808 | | | | | | | | 12,053 | | | | 3,000 | | | | 15,053 | | | | | | | | 8,159 | | | | 2,684 | | | | 10,843 | |
| | | | | | | | | | | |
| Financial assets | | | | | | | | | | | | | | | | | | | | | | | | | | | | | | | | | | | | | | | | | | | | |
| Fixed deposits | | | – | | | | 37 | | | | 37 | | | | | | | | – | | | | 65 | | | | 65 | | | | | | | | – | | | | 20 | | | | 20 | |
| Cash and cash equivalents | | | – | | | | 5,018 | | | | 5,018 | | | | | | | | – | | | | 6,240 | | | | 6,240 | | | | | | | | – | | | | 6,360 | | | | 6,360 | |
| Total | | | – | | | | 5,055 | | | | 5,055 | | | | | | | | – | | | | 6,305 | | | | 6,305 | | | | | | | | – | | | | 6,380 | | | | 6,380 | |
In addition to the financial assets above, there are $5,519m (2015: $6,494m; 2014: $7,576m) of other current and non-current asset investments and other financial assets on which no interest is received.
Foreign currency risk
The US dollar is the Group’s most significant currency. As a consequence, the Group results are presented in US dollars and exposures are managed against US dollars accordingly.
Translational
Approximately 66% of Group external sales in 2016 were denominated in currencies other than the US dollar, while a significant proportion of manufacturing, and research and development costs were denominated in pounds sterling and Swedish krona. Surplus cash generated by business units is substantially converted to, and held centrally in, US dollars. As a result, operating profit and total cash flow in US dollars will be affected by movements in exchange rates.
This currency exposure is managed centrally, based on forecast cash flows. The impact of movements in exchange rates is mitigated significantly by the correlations which exist between the major currencies to which the Group is exposed and the US dollar. Monitoring of currency exposures and correlations is undertaken on a regular basis and hedging is subject to pre-execution approval.
As at 31 December 2016, 2.5% of interest-bearing loans and borrowings were denominated in pounds sterling and 18.3% were denominated in euros. Where there is non-US dollar debt and an underlying net investment of that amount in the same currency, the Group applies net investment hedging. Exchange differences on the retranslation of debt designated as net investment hedges are recognised in other comprehensive income to the extent that the hedge is effective. Any ineffectiveness is taken to profit.
In 2016, the Group issued€2.2bn of bonds in the euro debt capital markets with maturities of 5, 8 and 12 years. The Group entered into cross-currency swaps to convert the proceeds into fixed US dollar debt with a weighted average interest rate of 2.69% and maturities equal to the bonds. These instruments were designated in a cash flow hedge. To the extent that the hedge is effective, fair value movements on the revaluation of cross-currency swaps designated in a cash flow hedge are taken to other comprehensive income. Any ineffectiveness is taken to profit.
| | |
| AstraZenecaAnnual Report and Form 20-F Information 2016 | | 179 |
Financial Statements
26 Financial risk management objectives and policiescontinued
In 2016, the Group entered into a cross-currency swap to convert an additional $69m into fixed Chinese renminbi debt maturing in 2026. This instrument was designated in a net investment hedge against the foreign currency risk of the Group’s renminbi net assets. Fair value movements on the revaluation of the cross-currency swaps are recognised in other comprehensive income to the extent that the hedge is effective. Any ineffectiveness is taken to profit.
Foreign currency risk arises when the Group has intercompany funding and investments in certain subsidiaries operating in countries with exchange controls. The most significant risk in this respect is Venezuela, where the Group has approximately $104m equivalent of local currency cash, on which there have been delays in obtaining approval for remittance outside the country.
The official exchange rate for essential goods and services is VEF 10/$ (the DIPRO rate) as published by CENCOEX (the National Foreign Trade Center). Alternative exchange rates include the SIMADI (Sistema Marginal de Divisas) rate, which was introduced in 2015. At 31 December 2016, the SIMADI rate was VEF 673.76/$ (31 December 2015: VEF 199.7/$).
For 2016, the Group used the DIPRO rate for the consolidation of the financial statements of the Venezuelan subsidiaries. The Group believes that this rate represents the most appropriate rate for consolidation as it reflects their best expectation of the rate at which profits will be remitted.
The Group has restructured $153m of intercompany trading balances in order to manage the FX retranslation risk should the DIPRO rate increase over the next 12 months. Had the Group applied the SIMADI rate for the consolidation of the financial statements of the Venezuelan subsidiaries, the Group would be exposed to a potential income statement devaluation loss of $15m on its total intercompany balances and the local currency cash would be reduced to $2m on consolidation.
Transactional
One hundred percent of the Group’s major transactional currency exposures on working capital balances, which typically extend for up to three months, are hedged, where practicable, using forward foreign exchange contracts against individual Group companies’ reporting currency. In addition, the Group’s external dividend, which is paid principally in pounds sterling and Swedish krona, is fully hedged from announcement to payment date. Foreign exchange gains and losses on forward contracts transacted for transactional hedging are taken to profit.
Sensitivity analysis
The sensitivity analysis set out below summarises the sensitivity of the market value of our financial instruments to hypothetical changes in market rates and prices. The range of variables chosen for the sensitivity analysis reflects our view of changes which are reasonably possible over a one-year period. Market values are the present value of future cash flows based on market rates and prices at the valuation date. For long-term debt, an increase in interest rates results in a decline in the fair value of debt.
The sensitivity analysis assumes an instantaneous 100 basis point change in interest rates in all currencies from their levels at 31 December 2016, with all other variables held constant. Based on the composition of our long-term debt portfolio as at 31 December 2016, a 1% increase in interest rates would result in an additional $26m in interest expense being incurred per year. The exchange rate sensitivity analysis assumes an instantaneous 10% change in foreign currency exchange rates from their levels at 31 December 2016, with all other variables held constant. The +10% case assumes a 10% strengthening of the US dollar against all other currencies and the -10% case assumes a 10% weakening of the US dollar.
Each incremental 10% movement in foreign currency exchange rates would have approximately the same effect as the initial 10% detailed in the table below and each 1% change in interest rates would have approximately the same effect as the 1% detailed in the table below.
| | | | | | | | | | | | | | | | | | | | |
| | | Interest rates | | | | | | Exchange rates | |
| 31 December 2014 | | +1% | | | -1% | | | | | | +10% | | | -10% | |
| Increase/(decrease) in fair value of financial instruments ($m) | | | 844 | | | | (856 | ) | | | | | | | 85 | | | | (85 | ) |
| Impact on profit: (loss)/gain ($m) | | | – | | | | – | | | | | | | | (247 | ) | | | 247 | |
| Impact on equity: gain/(loss) ($m) | | | – | | | | – | | | | | | | | 332 | | | | (332 | ) |
| | | | | | | | | | | | | | | | | | | | |
| | | Interest rates | | | | | | Exchange rates | |
| 31 December 2015 | | +1% | | | -1% | | | | | | +10% | | | -10% | |
| Increase/(decrease) in fair value of financial instruments ($m) | | | 997 | | | | (1,150 | ) | | | | | | | 136 | | | | (136 | ) |
| Impact on profit: (loss)/gain ($m) | | | – | | | | – | | | | | | | | (91 | ) | | | 91 | |
| Impact on equity: gain/(loss) ($m) | | | – | | | | – | | | | | | | | 227 | | | | (227 | ) |
| | | | | | | | | | | | | | | | | | | | |
| | | Interest rates | | | | | | Exchange rates | |
| 31 December 2016 | | +1% | | | -1% | | | | | | +10% | | | -10% | |
| Increase/(decrease) in fair value of financial instruments ($m) | | | 1,249 | | | | (1,390 | ) | | | | | | | 180 | | | | (180 | ) |
| Impact on profit: (loss)/gain ($m) | | | – | | | | – | | | | | | | | (24 | ) | | | 24 | |
| Impact on equity: gain/(loss) ($m) | | | – | | | | – | | | | | | | | 204 | | | | (204 | ) |
There has been no change in the methods and assumptions used in preparing the above sensitivity analysis over the three-year period.
| | |
| 180 | | AstraZenecaAnnual Report and Form 20-F Information 2016 |
26 Financial risk management objectives and policiescontinued
Credit risk
The Group is exposed to credit risk on financial assets, such as cash balances (including fixed deposits and cash and cash equivalents), derivative instruments, trade and other receivables. The Group is also exposed in its net asset position to its own credit risk in respect of the 2023 debentures which are accounted for at fair value through profit or loss.
Trade and other receivables
Trade receivable exposures are managed locally in the operating units where they arise and credit limits are set as deemed appropriate for the customer. The Group is exposed to customers ranging from government-backed agencies and large private wholesalers to privately owned pharmacies, and the underlying local economic and sovereign risks vary throughout the world. Where appropriate, the Group endeavours to minimise risks by the use of trade finance instruments such as letters of credit and insurance. The Group establishes an allowance for impairment that represents its estimate of incurred losses in respect of specific trade and other receivables where it is deemed that a receivable may not be recoverable. When the debt is deemed irrecoverable, the allowance account is written off against the underlying receivable.
In the US, sales to three wholesalers accounted for approximately 83% of US sales (2015: three wholesalers accounted for approximately 84%; 2014: three wholesalers accounted for approximately 75%).
The ageing of trade receivables at the reporting date was:
| | | | | | | | | | | | |
| | | 2016 $m | | | 2015 $m | | | 2014 $m | |
| Not past due | | | 2,559 | | | | 4,388 | | | | 4,316 | |
| Past due 0-90 days | | | 14 | | | | 189 | | | | 354 | |
| Past due 90-180 days | | | – | | | | 21 | | | | 75 | |
| Past due > 180 days | | | 10 | | | | 35 | | | | 17 | |
| | | | 2,583 | | | | 4,633 | | | | 4,762 | |
| | | | | | | | | | | | |
| | | 2016 $m | | | 2015 $m | | | 2014 $m | |
| | | |
| Movements in provisions for trade receivables | | | | | | | | | | | | |
| At 1 January | | | 52 | | | | 54 | | | | 64 | |
| Income statement | | | – | | | | 2 | | | | (2 | ) |
| Amounts utilised, exchange and other movements | | | (10 | ) | | | (4 | ) | | | (8 | ) |
| At 31 December | | | 42 | | | | 52 | | | | 54 | |
The allowance for impairment has been calculated based on past experience and is in relation to specific customers. Given the profile of our customers, including large wholesalers and government-backed agencies, no further credit risk has been identified with the trade receivables not past due other than those balances for which an allowance has been made. The income statement charge is recorded in selling, general and administrative costs.
Other financial assets
The Group may hold significant cash balances as part of its normal operations, with the amount of cash held at any point reflecting the level of cash flow generated by the business and the timing of the use of that cash. The majority of excess cash is centralised within the Group treasury entity and is subject to counterparty risk on the principal invested. This risk is mitigated through a policy of prioritising security and liquidity over return, and as such cash is only invested in high credit quality investments. Counterparty limits are set according to the assessed risk of each counterparty and exposures are monitored against these limits on a regular basis. The majority of the Group’s cash is invested in US dollar AAA-rated liquidity funds, fully collateralised repurchase agreements, fixed income securities and short-term bank deposits.
The most significant concentration of financial credit risk at 31 December 2016 was $3,440m invested in five AAA-rated liquidity funds. The liquidity fund portfolios are managed by the related external third party fund managers to maintain the AAA rating. No more than 15% of fund value is invested within each individual fund. There were no other significant concentrations of financial credit risk at the reporting date.
At 31 December 2016, the Group had investments of $950m (2015: $1,050m; 2014: $300m) in short-term repurchase agreements, which are fully collateralised investments. In the event of any default, ownership of the collateral would revert to the Group and would be readily convertible to cash. The value of the collateral held at 31 December 2016 was $951m (2015: $1,098m; 2014: $316m).
All financial derivatives are transacted with commercial banks, in line with standard market practice. The Group has agreements with some bank counterparties whereby the parties agree to post cash collateral, for the benefit of the other, equivalent to the market valuation of the derivative positions above a predetermined threshold. The carrying value of such cash collateral held by the Group at 31 December 2016 was $242m (2015: $451m; 2014: $457m).
| | |
| AstraZenecaAnnual Report and Form 20-F Information 2016 | | 181 |
Financial Statements
27 Employee costs and share plans for employees
Employee costs
The average number of people, to the nearest hundred, employed by the Group is set out in the table below. In accordance with the Companies Act 2006, this includes part-time employees.
| | | | | | | | | | | | |
| | | 2016 | | | 2015 | | | 2014 | |
| | | |
| Employees | | | | | | | | | | | | |
| UK | | | 7,000 | | | | 7,100 | | | | 7,200 | |
| Continental Europe | | | 14,700 | | | | 14,800 | | | | 13,800 | |
| The Americas | | | 17,800 | | | | 17,500 | | | | 16,800 | |
| Asia, Africa & Australasia | | | 22,000 | | | | 20,700 | | | | 18,100 | |
| Continuing operations | | | 61,500 | | | | 60,100 | | | | 55,900 | |
Geographical distribution described in the table above is by location of legal entity employing staff. Certain staff will spend some or all of their activity in a different location.
The number of people employed by the Group at the end of 2016 was 59,700 (2015: 61,500; 2014: 57,500).
The costs incurred during the year in respect of these employees were:
| | | | | | | | | | | | |
| | | 2016 $m | | | 2015 $m | | | 2014 $m | |
| Salaries | | | 4,664 | | | | 4,603 | | | | 4,657 | |
| Social security costs | | | 584 | | | | 567 | | | | 664 | |
| Pension costs | | | 426 | | | | 484 | | | | 459 | |
| Other employment costs | | | 610 | | | | 474 | | | | 499 | |
| Total | | | 6,284 | | | | 6,128 | | | | 6,279 | |
Severance costs of $578m are not included above (2015: $338m; 2014: $254m).
The Directors believe that, together with the basic salary system, the Group’s employee incentive schemes provide competitive and market-related packages to motivate employees. They should also align the interests of employees with those of shareholders, as a whole, through long-term share ownership in the Company. The Group’s current UK, Swedish and US schemes are described below; other arrangements apply elsewhere.
Bonus plans
The AstraZeneca UK Performance Bonus Plan
Employees of participating AstraZeneca UK companies are invited to participate in this bonus plan, which rewards strong individual performance. Bonuses are paid in cash.
The AstraZeneca Executive Annual Bonus Scheme
This scheme is a performance bonus scheme for Directors and senior employees who do not participate in the AstraZeneca UK Performance Bonus Plan. Annual bonuses are paid in cash and reflect both corporate and individual performance measures. The Remuneration Committee has discretion to reduce or withhold bonuses if business performance falls sufficiently short of expectations in any year such as to make the payment of bonuses inappropriate.
The AstraZeneca Deferred Bonus Plan
This plan was introduced in 2006 and is used to defer a portion of the bonus earned under the AstraZeneca Executive Annual Bonus Scheme into Ordinary Shares in the Company for a period of three years. The plan currently operates only in respect of Executive Directors and members of the SET. Awards of shares under this plan are typically made in March each year, the first award having been made in February 2006. Further details of this plan can be found in the Directors’ Remuneration Report from page 103.
Sweden
In Sweden, an all-employee performance bonus plan is in operation, which rewards strong individual performance. Bonuses are paid 50% into a fund investing in AstraZeneca equities and 50% in cash. The AstraZeneca Executive Annual Bonus Scheme, the AstraZeneca Performance Share Plan and the AstraZeneca Global Restricted Stock Plan all operate in respect of relevant AstraZeneca employees in Sweden.
US
In the US, there are two all-employee short-term or annual performance bonus plans in operation to differentiate and reward strong individual performance. Annual bonuses are paid in cash. There is also one senior staff long-term incentive scheme, under which 91 participants may be eligible for awards granted as AstraZeneca ADSs. AstraZeneca ADSs necessary to satisfy the awards are purchased in the market or funded via a share trust. The AstraZeneca Performance Share Plan and the AstraZeneca Global Restricted Stock Plan operate in respect of relevant employees in the US.
| | |
| 182 | | AstraZenecaAnnual Report and Form 20-F Information 2016 |
27 Employee costs and share plans for employeescontinued
Share plans
The charge for share-based payments in respect of share plans is $241m (2015: $211m; 2014: $178m). The plans are equity settled.
The AstraZeneca UK All-Employee Share Plan
The Company offers UK employees the opportunity to buy Partnership Shares (Ordinary Shares). Employees may invest up to £1,800 over a 12 month accumulation period and purchase Partnership Shares in the Company with the total proceeds at the end of the period. The purchase price for the shares is the lower of the price at the beginning or the end of the 12-month period. In 2010, the Company introduced a Matching Share element, the first award of which was made in 2011. Currently one Matching Share is awarded for every four Partnership Shares purchased. Partnership Shares and Matching Shares are held in the HM Revenue & Customs (HMRC)-approved All-Employee Share Plan. At the Company’s AGM in 2002, shareholders approved the issue of new shares for the purposes of the All-Employee Share Plan.
The AstraZeneca Performance Share Plan
This plan was approved by shareholders in 2005 for a period of 10 years. Generally, awards could be granted at any time, but not during a closed period of the Company. The first grant of awards was made in June 2005 and the last grant of awards was made in March 2014. Awards granted under the plan vest after three years and can be subject to the achievement of performance conditions. The Remuneration Committee has responsibility for agreeing any awards under the plan and for setting the policy for the way in which the plan should be operated, including agreeing performance targets and which employees would be invited to participate. The plan has been replaced by the AstraZeneca 2014 Performance Share Plan.
| | | | | | | | | | | | |
| | |
| Shares
’000 |
| |
| WAFV
pence | 1
| |
| WAFV
$ | 1
|
| Shares awarded in February 2014 | | | 37 | | | | N/A | | | | 30.55 | |
| Shares awarded in March 2014 | | | 2,368 | | | | 1952 | | | | 32.34 | |
| 1 | Weighted average fair value. |
The AstraZeneca 2014 Performance Share Plan (PSP)
This plan was approved by shareholders in 2014 for a period of 10 years and replaces the AstraZeneca Performance Share Plan. Generally, awards can be granted at any time, but not during a closed period of the Company. The first grant of awards was made in May 2014. Awards granted under the plan vest after three years, or in the case of Executive Directors, after an additional two-year holding period, and can be subject to the achievement of performance conditions. For awards granted to all participants in 2016, vesting is subject to a combination of measures focused on scientific leadership, revenue growth and financial performance. The Remuneration Committee has responsibility for agreeing any awards under the plan and for setting the policy for the way in which the plan should be operated, including agreeing performance targets and which employees should be invited to participate. Further details of this plan can be found in the Directors’ Remuneration Report from page 103. The main grant of awards in 2016 under the plan took place in March with further grants in May and August.
| | | | | | | | | | | | |
| | |
| Shares
’000 |
| |
| WAFV
pence |
| |
| WAFV
$ |
|
| Shares awarded in May 2014 | | | 12 | | | | 2133 | | | | 35.75 | |
| Shares awarded in August 2014 | | | 141 | | | | 2156 | | | | 35.79 | |
| Shares awarded in September 2014 | | | 40 | | | | 2250 | | | | N/A | |
| Shares awarded in November 2014 | | | 2 | | | | N/A | | | | 36.62 | |
| Shares awarded in March 2015 | | | 2,223 | | | | 2381 | | | | 35.29 | |
| Shares awarded in June 2015 | | | 36 | | | | 2087 | | | | 33.05 | |
| Shares awarded in August 2015 | | | 152 | | | | 2123 | | | | 33.21 | |
| Shares awarded in September 2015 | | | 8 | | | | N/A | | | | 32.32 | |
| Shares awarded in November 2015 | | | 7 | | | | 2178 | | | | 33.31 | |
| Shares awarded in March 2016 | | | 2,673 | | | | 1962 | | | | 28.19 | |
| Shares awarded in May 2016 | | | 24 | | | | 1935 | | | | 28.64 | |
| Shares awarded in August 2016 | | | 67 | | | | 2536 | | | | 33.58 | |
The AstraZeneca Investment Plan (AZIP)
This plan was introduced in 2010 and approved by shareholders at the 2010 AGM. The grant of awards in 2016 took place in March. Awards granted under the plan vest after eight years and are subject to performance conditions measured over a period of between three and eight years. For awards granted in 2016, the performance conditions relate to the annual dividend paid to shareholders and dividend cover over a four-year performance period. The awards are then subject to a four-year holding period before they can vest. The Remuneration Committee has responsibility for agreeing any awards under the plan and for setting the policy for the way in which the plan should be operated, including agreeing performance targets and which employees should be invited to participate. Further details of this plan can be found in the Directors’ Remuneration Report from page 103.
| | | | | | | | | | | | |
| | |
| Shares
’000 |
| |
| WAFV
pence |
| |
| WAFV
$ |
|
| Shares awarded in March 2014 | | | 67 | | | | 3904 | | | | 64.68 | |
| Shares awarded in September 2014 | | | 7 | | | | 4499 | | | | N/A | |
| Shares awarded in March 2015 | | | 64 | | | | 4762 | | | | 70.58 | |
| Shares awarded in August 2015 | | | 4 | | | | N/A | | | | 66.42 | |
| Shares awarded in March 2016 | | | 84 | | | | 3923 | | | | 56.38 | |
| | |
| AstraZenecaAnnual Report and Form 20-F Information 2016 | | 183 |
Financial Statements
27 Employee costs and share plans for employeescontinued
The AstraZeneca Global Restricted Stock Plan
This plan was introduced in 2010. The main grant of awards in 2016 under the plan was in March, with a further, smaller grant in August. This plan provides for the grant of restricted stock unit (RSU) awards to selected below SET-level employees and is used in conjunction with the AstraZeneca Performance Share Plan to provide a mix of RSUs and performance shares. Awards typically vest on the third anniversary of the date of grant and are contingent on continued employment with the Company. The Remuneration Committee has responsibility for agreeing any awards under the plan and for setting the policy for the way in which the plan should be operated.
| | | | | | | | | | | | |
| | |
| Shares
’000 |
| |
| WAFV
pence |
| |
| WAFV
$ |
|
| Shares awarded in March 2014 | | | 2,076 | | | | 3904 | | | | 64.68 | |
| Shares awarded in August 2014 | | | 25 | | | | 4312 | | | | 71.57 | |
| Shares awarded in March 2015 | | | 1,966 | | | | 4762 | | | | 70.58 | |
| Shares awarded in August 2015 | | | 17 | | | | 4245 | | | | 66.42 | |
| Shares awarded in March 2016 | | | 2,695 | | | | 3923 | | | | 56.38 | |
| Shares awarded in August 2016 | | | 122 | | | | 5071 | | | | 67.16 | |
The AstraZeneca Restricted Share Plan
This plan was introduced in 2008 and provides for the grant of restricted share awards to key employees, excluding Executive Directors. Awards are made on an ad hoc basis with variable vesting dates. The plan has been used four times in 2016 to make awards to 714 employees. The Remuneration Committee has responsibility for agreeing any awards under the plan and for setting the policy for the way in which the plan should be operated.
| | | | | | | | | | | | |
| | |
| Shares
’000 |
| |
| WAFV
pence |
| |
| WAFV
$ |
|
| Shares awarded in February 2014 | | | 115 | | | | 4042 | | | | 61.10 | |
| Shares awarded in March 2014 | | | 155 | | | | N/A | | | | 64.68 | |
| Shares awarded in May 2014 | | | 134 | | | | 4265 | | | | 71.50 | |
| Shares awarded in August 2014 | | | 72 | | | | 4312 | | | | 71.57 | |
| Shares awarded in September 2014 | | | 64 | | | | 4499 | | | | 74.05 | |
| Shares awarded in November 2014 | | | 9 | | | | 4672 | | | | 73.23 | |
| Shares awarded in March 2015 | | | 164 | | | | 4762 | | | | 70.58 | |
| Shares awarded in June 2015 | | | 69 | | | | 4174 | | | | 66.09 | |
| Shares awarded in August 2015 | | | 31 | | | | 4245 | | | | 66.42 | |
| Shares awarded in September 2015 | | | 41 | | | | 4199 | | | | 64.64 | |
| Shares awarded in November 2015 | | | 41 | | | | 4355 | | | | 66.62 | |
| Shares awarded in March 2016 | | | 809 | | | | 3923 | | | | 56.38 | |
| Shares awarded in May 2016 | | | 335 | | | | 3869 | | | | 57.28 | |
| Shares awarded in August 2016 | | | 37 | | | | 5071 | | | | 67.16 | |
| Shares awarded in November 2016 | | | 14 | | | | 4233 | | | | 53.42 | |
The fair values were determined using a modified version of the binomial model. This method incorporated expected dividends but no other features into the measurements of fair value. The grant date fair values of share awards disclosed in this section do not take account of service and non-market related performance conditions.
| | |
| 184 | | AstraZenecaAnnual Report and Form 20-F Information 2016 |
28 Commitments and contingent liabilities
| | | | | | | | | | | | |
| | | 2016 $m | | | 2015 $m | | | 2014 $m | |
| | | |
| Commitments | | | | | | | | | | | | |
| Contracts placed for future capital expenditure on property, plant and equipment and software development costs not provided for in these accounts | | | 629 | | | | 518 | | | | 438 | |
Guarantees and contingencies arising in the ordinary course of business, for which no security has been given, are not expected to result in any material financial loss.
Research and development collaboration payments
The Group has various ongoing collaborations, including in-licensing and similar arrangements with development partners. Such collaborations may require the Group to make payments on achievement of stages of development, launch or revenue milestones, although the Group generally has the right to terminate these agreements at no cost. The Group recognises research and development milestones as intangible assets once it is committed to payment, which is generally when the Group reaches set trigger points in the development cycle. Revenue-related milestones are recognised as intangible assets on product launch at a value based on the Group’s long-term revenue forecasts for the related product. The table below indicates potential development and revenue-related payments that the Group may be required to make under such collaborations.
| | | | | | | | | | | | | | | | | | | | |
| | | Total $m | | | Under 1 year $m | | | Years 1 and 2 $m | | | Years 3 and 4 $m | | | Years 5 and greater $m | |
| Future potential research and development milestone payments | | | 6,651 | | | | 412 | | | | 1,286 | | | | 647 | | | | 4,306 | |
| Future potential revenue milestone payments | | | 5,259 | | | | 77 | | | | 143 | | | | 970 | | | | 4,069 | |
The table includes all potential payments for achievement of milestones under ongoing research and development arrangements. Revenue-related milestone payments represent the maximum possible amount payable on achievement of specified levels of revenue as set out in individual contract agreements, but exclude variable payments that are based on unit sales (eg royalty-type payments) which are expensed as the associated sale is recognised. The table excludes any payments already capitalised in the Financial Statements for the year ended 31 December 2016.
The future payments we disclose represent contracted payments and, as such, are not discounted and are not risk adjusted. As detailed in the Risk section from page 214, the development of any pharmaceutical product candidate is a complex and risky process that may fail at any stage in the development process due to a number of factors (including items such as failure to obtain regulatory approval, unfavourable data from key studies, adverse reactions to the product candidate or indications of other safety concerns). The timing of the payments is based on the Group’s current best estimate of achievement of the relevant milestone.
Environmental costs and liabilities
The Group’s expenditure on environmental protection, including both capital and revenue items, relates to costs that are necessary for implementing internal systems and programmes, and meeting legal and regulatory requirements for processes and products. This includes investment to conserve natural resources and otherwise minimise the impact of our activities on the environment.
They are an integral part of normal ongoing expenditure for carrying out the Group’s research, manufacturing and commercial operations and are not separated from overall operating and development costs. There are no known changes in legal, regulatory or other requirements resulting in material changes to the levels of expenditure for 2014, 2015 or 2016.
In addition to expenditure for meeting current and foreseen environmental protection requirements, the Group incurs costs in investigating and cleaning up land and groundwater contamination. In particular, AstraZeneca has environmental liabilities at some currently or formerly owned, leased and third party sites.
In the US, Zeneca Inc., and/or its indemnitees, have been named as potentially responsible parties (PRPs) or defendants at approximately 14 sites where Zeneca Inc. is likely to incur future environmental investigation, remediation, operation and maintenance costs under federal, state, statutory or common law environmental liability allocation schemes (together, US Environmental Consequences). Similarly, Stauffer Management Company LLC (SMC), which was established in 1987 to own and manage certain assets of Stauffer Chemical Company acquired that year, and/or its indemnitees, have been named as PRPs or defendants at 34 sites where SMC is likely to incur US Environmental Consequences.
AstraZeneca has also given indemnities to third parties for a number of sites outside the US. These environmental liabilities arise from legacy operations that are not currently part of the Group’s business and, at most of these sites, remediation, where required, is either completed or nearing completion. AstraZeneca has made provisions for the estimated costs of future environmental investigation, remediation, operation and maintenance activity beyond normal ongoing expenditure for maintaining the Group’s R&D and manufacturing capacity and product ranges, where a present obligation exists, it is probable that such costs will be incurred and they can be estimated reliably. With respect to such estimated future costs, there were provisions at 31 December 2016 in the aggregate of $59m (2015: $67m; 2014: $84m), mainly relating to the US. Where we are jointly liable or otherwise have cost-sharing agreements with third parties, we reflect only our share of the obligation. Where the liability is insured in part or in whole by insurance or other arrangements for reimbursement, an asset is recognised to the extent that this recovery is virtually certain.
It is possible that AstraZeneca could incur future environmental costs beyond the extent of our current provisions. The extent of such possible additional costs is inherently difficult to estimate due to a number of factors, including: (1) the nature and extent of claims that may be asserted in the future; (2) whether AstraZeneca has or will have any legal obligation with respect to asserted or unasserted claims; (3) the type of remedial action, if any, that may be selected at sites where the remedy is presently not known; (4) the potential for recoveries from or allocation of liability to third parties; and (5) the length of time that the environmental investigation, remediation and liability allocation process can take. Notwithstanding and subject to the foregoing, we estimate the potential additional loss for future environmental investigation, remediation, remedial operation and maintenance activity above and beyond our provisions to be, in aggregate, between $85m and $141m (2015: $71m and $119m; 2014: $50m and $80m), which relates mainly to the US.
| | |
| AstraZenecaAnnual Report and Form 20-F Information 2016 | | 185 |
Financial Statements
28 Commitments and contingent
liabilitiescontinued
Legal proceedings
AstraZeneca is involved in various legal proceedings considered typical to its business, including actual or threatened litigation and/or actual or potential government investigations relating to employment matters, product liability, commercial disputes, pricing, sales and marketing practices, infringement of IP rights, and the validity of certain patents and competition laws. The more significant matters are discussed below.
Most of the claims involve highly complex issues. Often these issues are subject to substantial uncertainties and, therefore, the probability of a loss, if any, being sustained and an estimate of the amount of any loss is difficult to ascertain. Consequently, for a majority of these claims, it is not possible to make a reasonable estimate of the expected financial effect, if any, that will result from ultimate resolution of the proceedings. In these cases, AstraZeneca discloses information with respect to the nature and facts of the cases.
With respect to each of the legal proceedings described below, other than those for which provision has been made, we are unable to make estimates of the possible loss or range of possible losses at this stage, other than as set forth in this section. We also do not believe that disclosure of the amount sought by plaintiffs, if known, would be meaningful with respect to those legal proceedings. This is due to a number of factors, including (1) the stage of the proceedings (in many cases trial dates have not been set) and the overall length and extent of pre-trial discovery; (2) the entitlement of the parties to an action to appeal a decision; (3) clarity as to theories of liability, damages and governing law; (4) uncertainties in timing of litigation; and (5) the possible need for further legal proceedings to establish the appropriate amount of damages, if any.
While there can be no assurance regarding the outcome of any of the legal proceedings referred to in this Note 28, based on management’s current and considered view of each situation, we do not currently expect them to have a material adverse effect on our financial position. This position could of course change over time, not least because of the factors referred to above.
In cases that have been settled or adjudicated, or where quantifiable fines and penalties have been assessed and which are not subject to appeal (or other similar forms of relief), or where a loss is probable and we are able to make a reasonable estimate of the loss, we generally indicate the loss absorbed or make a provision for our best estimate of the expected loss.
Where it is considered that the Group is more likely than not to prevail, legal costs involved in defending the claim are charged to profit as they are incurred.
Where it is considered that the Group has a valid contract which provides the right to reimbursement (from insurance or otherwise) of legal costs and/or all or part of any loss incurred or for which a provision has been established, and we consider recovery to be virtually certain, the best estimate of the amount expected to be received is recognised as an asset.
Assessments as to whether or not to recognise provisions or assets, and of the amounts concerned, usually involve a series of complex judgements about future events and can rely heavily on estimates and assumptions. AstraZeneca believes that the provisions recorded are adequate based on currently available information and that the insurance recoveries recorded will be received. However, given the inherent uncertainties involved in assessing the outcomes of these cases, and in estimating the amount of the potential losses and the associated insurance recoveries, we could in the future incur judgments or insurance settlements that could have a material adverse effect on our results in any particular period.
IP claims include challenges to the Group’s patents on various products or processes and assertions of non-infringement of patents. A loss in any of these cases could result in loss of patent protection on the related product. The consequences of any such loss could be a significant decrease in product sales, which could have a material adverse effect on our results. The lawsuits filed by AstraZeneca for patent infringement against companies that have filed ANDAs in the US, seeking to market generic forms of products sold by the Group prior to the expiry of the applicable patents covering these products, typically also involve allegations of non-infringement, invalidity and unenforceability of these patents by the ANDA filers. In the event that the Group is unsuccessful in these actions or the statutory 30-month stay expires before a ruling is obtained, the ANDA filers involved will also have the ability, subject to FDA approval, to introduce generic versions of the product concerned.
AstraZeneca has full confidence in, and will vigorously defend and enforce, its IP.
Over the course of the past several years, including in 2016, a significant number of commercial litigation claims in which AstraZeneca is involved have been resolved, particularly in the US, thereby reducing potential contingent liability exposure arising from such litigation. Similarly, in part due to patent litigation and settlement developments, greater certainty has been achieved regarding
possible generic entry dates with respect to some of our patented products. At the same time, like other companies in the pharmaceutical sector and other industries, AstraZeneca continues to be subject to government investigations around the world.
Patent litigation
Brilinta(ticagrelor)
US patent proceedings
In 2015, in response to Paragraph IV notices challenging patents listed in the FDA Orange Book with reference toBrilinta, AstraZeneca filed separate patent infringement lawsuits against ANDA filers seeking to market ticagrelor. Proceedings are ongoing in the US District Court for the District of Delaware. Trial is scheduled for March and April 2018.
Byetta(exenatide)
US patent proceedings
In 2014, in the US District Court for the District of Delaware (the District Court), AstraZeneca filed a patent infringement lawsuit in response to a Paragraph IV notice from Teva Pharmaceuticals USA, Inc. (Teva) relating to patents listed in the FDA Orange Book with reference toByetta. In June 2016, AstraZeneca settled the patent litigation against Teva. The District Court entered a consent judgment which will enjoin Teva from launching its proposed exenatide product until October 2017, subject to regulatory approval. Separately, in December 2015, AstraZeneca filed a patent infringement lawsuit in response to a Paragraph IV notice from Amneal Pharmaceuticals LLC in the District Court. Trial is scheduled for December 2017.
In November 2015, Sanofi-Aventis U.S. LLC and Sanofi-Aventis Deutschland GmbH (together, Sanofi) served AstraZeneca with a complaint for declaratory judgment that Sanofi’s proposed lixisenatide product would not infringe three AstraZeneca patents. Sanofi also alleged invalidity of the patents. Separately, in December 2015, Sanofi filed petitions in the US Patent Trial and Appeals Board (PTAB) forinter partes review of certain patents at issue in the above-referenced District Court litigations. In October 2016, AstraZeneca and Sanofi settled the District Court and PTAB proceedings. Sanofi’s claims have been dismissed.
Crestor(rosuvastatin calcium)
US patent proceedings
AstraZeneca has been a defendant in three patent infringement lawsuits in the US District Court for the District of South Carolina (the District Court) which, among other things, claimed that AstraZeneca’sCrestor sales induce infringement of the plaintiffs’ patents.
The first lawsuit, filed in April 2011 by plaintiff Palmetto Pharmaceuticals, LLC (Palmetto), was dismissed by the District Court in December 2015 with judgment entered in
| | |
| 186 | | AstraZenecaAnnual Report and Form 20-F Information 2016 |
28 Commitments and contingent liabilitiescontinued
AstraZeneca’s favour. Palmetto subsequently appealed. In December 2016, the Federal Circuit Court of Appeals affirmed the District Court’s order dismissing the lawsuit.
The other two lawsuits were filed by co-plaintiffs Medical University of South Carolina Foundation for Research Development and Charleston Medical Therapeutics, Inc. (together, CMT) in July and December 2013 and subsequently consolidated. In February 2016, the District Court granted AstraZeneca’s motion for summary judgment and dismissed the two consolidated lawsuits, and CMT appealed. In July 2016, AstraZeneca and CMT jointly filed a stipulated dismissal of CMT’s appeal.
Patent proceedings outside the US
In Australia, AstraZeneca was unsuccessful in defending the validity of certainCrestor patents, at trial and on appeal. The patent litigation concluded in September 2015. A provision was taken in 2015 in respect of claims from generic entities which were prevented by court order from launching their products in Australia before AstraZeneca’s patents were subsequently found to be invalid. In April 2016, AstraZeneca was notified that the Commonwealth of Australia also intended to pursue a claim against AstraZeneca in relation to alleged losses it suffered in connection with the same patent litigation and the Commonwealth formally joined the proceedings in November 2016. AstraZeneca has updated its provisions accordingly.
In France, in February 2016, Biogaran S.A.S. (Biogaran) obtained a marketing authorisation for its rosuvastatin zinc product. In April 2016, AstraZeneca and Shionogi Seiyaku Kabushiki Kaisha (Shionogi) sought a preliminary injunction to prevent Biogaran from launching its product. In July 2016, the Paris Court of First Instance declined to issue a preliminary injunction. AstraZeneca and Shionogi appealed, however, the parties settled the preliminary proceedings before the appeal hearing. AstraZeneca and Shionogi have commenced patent infringement proceedings against Biogaran relying on infringement of the supplementary protection certificate related to theCrestor substance patent (European Patent No. EP 0521471).
In Japan, in March 2015, an individual filed a patent invalidation request with the Japanese Patent Office (JPO) in relation to theCrestor substance patent (Japanese Patent No. JP 2648897). In July 2016, the JPO dismissed the request. The individual appealed to the Intellectual Property High Court of Japan (the High Court) with the intervention of Nippon Chemiphar Co. Ltd (Nippon). In addition, Nippon has commenced a separate patent invalidation request with the JPO in relation to
theCrestor substance patent. In November 2016, the JPO refused Nippon’s request. Nippon has appealed to the High Court.
In the Netherlands, in April 2014, AstraZeneca received a writ of summons from Resolution Chemicals Ltd (Resolution) alleging partial invalidity and non-infringement of the supplementary protection certificate (SPC) related to theCrestor substance patent (European Patent No. EP 0521471). In July 2015, the District Court of the Hague determined that the SPC does not extend to zinc salts of rosuvastatin and that Resolution’s rosuvastatin zinc product does not infringe the SPC. In February 2016, the Court of Appeal of the Hague overturned the decision and found that Resolution’s product does infringe the SPC. Resolution appealed, and a hearing was held before the Supreme Court in December 2016. A decision is pending.
In Switzerland, in May 2016, Mepha Pharma AG challenged the validity of the supplementary protection certificate related to theCrestor substance patent (European Patent No. EP 0521471). AstraZeneca has responded.
In the UK, in October 2015, Resolution commenced an action in the UK Patent Court alleging partial invalidity and non-infringement of the supplementary protection certificate related to theCrestor substance patent (European Patent No. EP 0521471). The case has been stayed.
Daliresp(roflumilast)
US patent proceedings
In 2015, in response to Paragraph IV notices challenging patents listed in the FDA Orange Book with reference toDaliresp, AstraZeneca filed separate patent infringement lawsuits against ANDA filers seeking to market roflumilast. Proceedings are ongoing in the US District Court for the District of New Jersey. No trial date has been set.
Faslodex(fulvestrant)
US patent proceedings
AstraZeneca has filed patent infringement lawsuits in the US District Court in New Jersey (the District Court) relating to four patents listed in the FDA Orange Book with reference toFaslodex after AstraZeneca received seven Paragraph IV notices relating to six ANDAs seeking FDA approval to market generic versions ofFaslodex prior to the expiration of AstraZeneca’s patents. In July 2016, AstraZeneca settled one of these, the lawsuit brought against Sandoz, Inc. (Sandoz), and the District Court entered a consent judgment, which includes an injunction preventing Sandoz from launching a generic fulvestrant product until 25 March 2019, or earlier in certain circumstances. In August and December 2016, AstraZeneca settled the lawsuits against three additional ANDA filers, and the District Court also entered consent
judgments ending those lawsuits. The related lawsuit in the US District Court in West Virginia, that had been stayed pending the District Court lawsuits, was also settled and dismissed pursuant to a consent judgment. AstraZeneca continues to litigate in the District Court against two ANDA filers.
In July 2016, AstraZeneca was served with four petitions forinter partes review by the Patent Trial and Appeal Board (PTAB) relating to each of the four Orange Book-listed patents. In December 2016, the PTAB issued an order denying institution of the first of the four petitions. In January 2017, the PTAB terminated the remaining petitions at the request of the parties.
Patent proceedings outside the US
In Germany, in July 2015, AstraZeneca was served with complaints filed by Hexal AG (Hexal) and ratiopharm GmbH (ratiopharm) requesting the revocation of the German part of European Patent No. EP 1250138 (the ’138 Patent). In January 2017, the German Federal Patent Court declared the patent invalid. AstraZeneca intends to appeal. In January 2017, the Regional Court of Düsseldorf lifted a provisional injunction based on the ’138 Patent which had been in place against Hexal since February 2016. Hexal is also seeking to lift the provisional injunction based on European Patent No. EP 2266573. In January 2017, the Higher Regional Court of Düsseldorf suspended the effects of a provisional injunction based on the ’138 Patent which had been in place against ratiopharm since September 2016.
In Spain, in January 2016, the Barcelona Commercial Court ordered a preliminary injunction based on European Patent No. EP 1250138 and European Patent No. EP 2266573, preventing Sandoz Farmacéutica, S.A. from launching genericFaslodex in Spain. Sandoz Farmacéutica, S.A. appealed.
In October 2015, Hexal filed a notice of opposition against European Patent No. EP 2266573, granted in June 2015, at the European Patent Office. In February and March 2016, further oppositions were filed by Actavis Group PTC ehf, Fresenius Kabi Deutschland GmbH, Intas Pharmaceuticals Ltd. and Teva Pharmaceutical Industries Ltd. An oral hearing has been scheduled for May 2017.
In China, in March 2014, AstraZeneca received a request for invalidation of theFaslodex formulation patent CN01803546.9 filed by Jiangsu Hansoh Pharmaceutical Co. Ltd. at the Chinese Patent Office. In September 2014, the Patent Re-examination Board of the Chinese Patent Board declared the patent invalid. AstraZeneca appealed to the Beijing IP Court and the appeal was rejected in April 2016. AstraZeneca appealed this decision to
| | |
| AstraZenecaAnnual Report and Form 20-F Information 2016 | | 187 |
Financial Statements
28 Commitments and contingent liabilitiescontinued
the Beijing Higher People’s Court and the appeal was rejected in December 2016. AstraZeneca is considering its options.
In Brazil, in February 2013, Eurofarma Laboratorios S.A. (Eurofarma) filed a nullity action against a formulation patent forFaslodex in the 31st Specialized Intellectual Property Federal Court of Rio de Janeiro (the Court). In October 2015, the Court ruled in Eurofarma’s favour and invalidated AstraZeneca’s patent. In November 2015, AstraZeneca appealed the decision and the appeal remains pending.
Losec/Prilosec(omeprazole)
Patent proceedings outside the US
In Canada, in 2004, AstraZeneca brought proceedings against Apotex Inc. (Apotex) for infringement of several patents related to Losec. In February 2015, the Federal Court of Canada found that Apotex had infringed AstraZeneca’sLosec formulation patent (Canadian Patent No. 1,292,693). Apotex appealed. In January 2017, the Federal Court of Appeal (the Appeal Court) upheld the trial court’s findings of infringement and validity. However, the Appeal Court upheld one aspect of Apotex’s appeal relating to a limitation period defence, which may lower the amount of damages owed by Apotex. A reference to determine patent infringement damages is scheduled to commence in February 2017.
Movantik/Movantig(naloxegol)
US patent proceedings
In 2015, Neptune Generics LLC, filed a petition seeking inter partes review with the Patent Office challenging the validity of a patent listed in the FDA Orange Book with reference toMovantik (US Patent No. 7,786,133). In April 2016, the Patent Trial and Appeal Board denied the petition.
Patent proceedings outside the US
In Europe, Generics (UK) Ltd (trading as Mylan) filed an opposition to the grant of European Patent No. EP 1694363 with the European Patent Office (EPO). In February 2016, the Opposition Division of the EPO upheld the patent as granted, and dismissed the opposition.
In Europe, in September 2016, Generics (UK) Ltd; ABG Patentes, SL; and Stada Arzneimittel AG filed oppositions to the grant of European Patent No. EP 2621496 with the European Patent Office. The Patent’s proprietors (AstraZeneca AB and Nektar Therapeutics) have been invited to file a response to the Statements of Opposition.
Nexium(esomeprazole magnesium)
US patent proceedings
Several separateNexium,Nexium oral suspension andNexium 24HR (OTC) patent litigations are ongoing in the US District Court
for the District of New Jersey. Proceedings are at various stages and no trial dates have been set.
Patent proceedings outside the US
In Canada, in July 2014, the Federal Court found theNexium substance patent (Canadian Patent No. 2,139,653) invalid and not infringed by Apotex Inc. In July 2015, AstraZeneca’s appeal was dismissed. AstraZeneca was granted leave to appeal to the Supreme Court of Canada and a hearing was held in November 2016. A decision is pending.
Onglyza (saxagliptin) andKombiglyze (saxagliptin and metformin)
US patent proceedings
AstraZeneca initiated patent infringement proceedings against various entities in the US District Court for the District of Delaware (the District Court) after those entities had submitted ANDAs containing a Paragraph IV Certification alleging that US Patent No. RE44,186, listed in the FDA Orange Book with reference toOnglyza andKombiglyze XR, is invalid and/or will not be infringed by the products as described in their ANDAs. A trial was held in September 2016 against Wockhardt Bio AG and Wockhardt USA LLC, Sun Pharma Global FZE, Sun Pharmaceutical Industries Ltd, Amneal Pharmaceuticals LLC, Mylan Pharmaceuticals Inc., Aurobindo Pharma Ltd., Aurobindo Pharma U.S.A., Inc., Actavis Laboratories FL, Inc. and Watson Laboratories, Inc. A decision is awaited. In September 2016, Apotex Corp. and Apotex, Inc. agreed to be bound by the District Court’s decision.
In June 2016, the US Court of Appeals for the Federal Circuit denied Mylan Pharmaceuticals Inc. (Mylan) petition for rehearing en banc of the decision affirming the denial of Mylan’s motion to dismiss for lack of jurisdiction. In September 2016, Mylan filed a petition for writ ofcertiorari with the Supreme Court of the United States seeking an appeal of that decision and, in January 2017, that petition was denied.
In May 2016, the US Patent and Trademark Office (USPTO) instituted aninter partes review brought by Mylan Pharmaceutical Inc. (the Mylan IPR) challenging the validity of US Patent No. RE44,186 (the ’186 Patent). Subsequently, Wockhardt Bio AG, Teva Pharmaceuticals USA, Inc., Sun Pharmaceutical Industries, Ltd., Sun Pharma Global FZE and Amneal Pharmaceuticals LLC also filed petitions forinter partes review challenging the validity of the ’186 Patent and joined the Mylan IPR. A hearing in the Mylan IPR was held in January 2017. A decision is awaited.
Pulmicort Respules(budesonide inhalation suspension)
US patent proceedings
In February 2015, the US District Court for the District of New Jersey (the District Court)
determined that the asserted claims of US Patent No. 7,524,834 were invalid and denied AstraZeneca’s motion for an injunction against Apotex, Inc. and Apotex Corp., Breath Limited, Sandoz, Inc. and Watson Laboratories, Inc. (together, the Generic Challengers) pending an appeal of the District Court’s decision. AstraZeneca appealed that decision to the US Court of Appeals for the Federal Circuit (the Court of Appeals) and filed an Emergency Motion for an Injunction Pending Appeal. The Court of Appeals granted AstraZeneca’s motion and issued an injunction against the Generic Challengers pending appeal. In May 2015, the Court of Appeals affirmed the District Court’s decision and lifted the injunction that was issued. Since 2009, various injunctions were issued in this matter. Damages claims based on those injunctions have been filed and a provision has been taken.
Seroquel XR(quetiapine fumarate)
Patent proceedings outside the US
In Denmark, in June 2016, following a challenge to the validity of the formulation patent coveringSeroquel XR by Teva Denmark A/S and Accord Healthcare Ltd., the Danish Maritime and Commercial High Court found theSeroquel XR formulation patent invalid.
In France, in April 2015, Mylan SAS (Mylan) brought a patent invalidation action against AstraZeneca’s French designation of theSeroquel XR formulation patent. In July 2016, the Tribunal de grande instance de Paris found theSeroquel XR formulation patent invalid.
In Spain, in May 2016, the Supreme Court affirmed a decision from October 2013 which found theSeroquel XR formulation patent invalid. The generic challengers were Accord Healthcare S.L.U. and Sandoz Farmacéutica, S.A.
In Sweden, in May 2016, following a challenge to the validity of the formulation patent coveringSeroquel XR by Sandoz A/S, the Stockholm District Court found theSeroquel XR formulation patent invalid.
In various countries in Europe generic entities have claimed, or may claim, damages relating to preliminary injunctions issued in those countries that prevented genericSeroquel XR sales by those entities. A provision has been taken.
Synagis(palivizumab)
US patent proceedings
In December 2016, UCB BioPharma SPRL filed a complaint against MedImmune in the US District Court for the District of Delaware alleging infringement of US Patent No. 7,566,771. The complaint relates to a royalty-bearing licence between Celltech R&D LTD and MedImmune which was terminated by MedImmune in 2010.
| | |
| 188 | | AstraZenecaAnnual Report and Form 20-F Information 2016 |
28 Commitments and contingent liabilitiescontinued
Tagrisso(osimertinib)
Patent proceedings outside the US
In Europe, in October 2016, Stada Arzneimittel AG filed an opposition to the grant of European Patent No. EP 2736895.
Vimovo(naproxen/ esomeprazole magnesium)
Patent proceedings outside the US
In Canada, in January 2015, AstraZeneca received two notices of allegation from Mylan Pharmaceuticals ULC. In response, AstraZeneca and Pozen Inc. (now Aralez Pharmaceuticals Inc.), the licensee and patent holder, respectively, commenced proceedings in relation to theVimovo formulation patent (Canadian Patent No. 2,449,098). A hearing was held in November 2016 and a decision is pending.
Product liability litigation
Byetta/Bydureon(exenatide)
Amylin Pharmaceuticals, LLC, a wholly owned subsidiary of AstraZeneca, and/or AstraZeneca are among multiple defendants in various lawsuits filed in federal and state courts in the US involving claims of physical injury from treatment withByetta and/orBydureon. The lawsuits allege several types of injuries including pancreatitis, pancreatic cancer, thyroid cancer, and kidney cancer. A multidistrict litigation was established in the US District Court for the Southern District of California (the District Court) in regard to the alleged pancreatic cancer cases in federal courts. Further, a coordinated proceeding has been established in Los Angeles, California in regard to the various lawsuits in California state courts.
In November 2015, the District Court granted the defendants’ motion for summary judgment and dismissed all claims alleging pancreatic cancer that accrued prior to 11 September 2015. A similar motion was granted in favour of the defendants in the California state coordinated proceeding, and judgment was entered in May 2016. Plaintiffs have appealed both rulings.
A single case alleging similar claims that was pending in Alabama state court is now resolved.
Crestor(rosuvastatin calcium)
AstraZeneca is defending a number of lawsuits in the US alleging multiple types of injuries caused by the use ofCrestor, including diabetes mellitus, various cardiac injuries, rhabdomyolysis, and/or liver and kidney injuries. The claims of approximately 600 plaintiffs, comprising approximately 100 California residents and approximately 500 non-California residents, were aggregated in one coordinated proceeding in Los Angeles, California. The claims of approximately 600 additional non-California plaintiffs were also
pending in California state court. In October 2014, the coordination judge dismissed the claims of the non-California plaintiffs whose claims were in the coordinated proceeding. The plaintiffs appealed the October 2014 order dismissing the non-California plaintiffs from the proceeding. In July 2016, the Court of Appeal in California dismissed the plaintiffs’ appeal, effectively dismissing the claims of all of the non-California residents from California state court, leaving the option of re-filing in the plaintiffs’ home states. The claims of approximately 30 plaintiffs remain pending in California state court.
Farxiga(dapagliflozin)
AstraZeneca has been named as a defendant in lawsuits in the US involving plaintiffs claiming physical injury, including diabetic ketoacidosis and kidney failure, from treatment withFarxiga and/orXigduo XR. Cases with these allegations have been filed in several jurisdictions in the US. In October 2016, one of these cases was dismissed with prejudice in favour of AstraZeneca. Since then, several other cases have been dismissed, either voluntarily or by the courts. Motions to dismiss are pending in many of the jurisdictions where AstraZeneca has been served.
Counsel for plaintiffs in a product liability action pertaining toInvokana (a product in the same class asFarxiga) filed a motion with the Judicial Panel on Multidistrict Litigation (JPML) seeking transfer of any currently pending cases as well as any similar, subsequently filed cases to a coordinated and consolidated pre-trial multidistrict litigation (MDL) proceeding on a class-wide basis. In December 2016, the JPML granted an MDL to only those plaintiffs alleging injury fromInvokana.
Nexium and Prilosec(esomeprazole and omeprazole)
AstraZeneca has been defending product liability lawsuits brought in US federal and state courts by approximately 1,900 plaintiffs who alleged thatNexium caused osteoporotic injuries, such as bone deterioration, loss of bone density and/or bone fractures, but all such claims have now been dismissed with judgment entered in AstraZeneca’s favour. Approximately 270 plaintiffs appealed the dismissal of their claims to the US Court of Appeals for the Ninth Circuit, and fewer than 40 plaintiffs appealed the dismissal of their claims to the California Second Appellate Division. In October 2016, the US Court of Appeals for the Ninth Circuit affirmed the dismissal of the approximately 270 claims in federal court. In January 2017, the California Second Appellate Division affirmed the dismissal of the fewer than 40 cases in California state court.
AstraZeneca is defending various lawsuits in the US involving multiple plaintiffs claiming that they have been diagnosed with kidney
injuries following treatment with proton pump inhibitors, includingNexium andPrilosec. In October 2016, counsel for some of these plaintiffs filed a motion with the Judicial Panel on Multidistrict Litigation seeking transfer of any currently pending federal court cases as well as any similar, subsequently filed cases to a coordinated and consolidated pre-trial multidistrict litigation proceeding.
Onglyza/Kombiglyze(saxagliptin)
Amylin Pharmaceuticals, LLC, a wholly owned subsidiary of AstraZeneca, and/or AstraZeneca are among multiple defendants in various lawsuits filed in federal and state courts in the US involving multiple plaintiffs claiming pancreatic injuries, heart failure, cardiac failure and/or death injuries from treatment withOnglyza orKombiglyze. In May 2016, a federal judge in California granted AstraZeneca’s motion for summary judgment and dismissed the claims of 14 plaintiffs who alleged pancreatic injuries, including pancreatic cancer, from treatment with eitherOnglyza orKombiglyze. No similar claims remain actively pending in any US jurisdiction.
In October 2016, the claims of 14 plaintiffs alleging heart failure, cardiac failure and/or death from treatment with eitherOnglyza orKombiglyze were dismissed in response to motions filed by AstraZeneca. Approximately 85 plaintiffs’ claims currently remain in active litigation. In December 2016, plaintiffs in the California Superior Court filed a Petition for Coordination with the Judicial Council of California requesting that all similar, currently pending or subsequently filed cases in California be coordinated for pre-trial purposes.
Seroquel IR(quetiapine fumarate)
AstraZeneca has resolved all active claims with regard to the Seroquel product liability litigation in the US.
Synagis(palivizumab)
AstraZeneca and MedImmune were named as defendants in a lawsuit filed in the US District Court for the Middle District of Louisiana involving two plaintiffs alleging wrongful death from treatment withSynagis. In July 2016, the plaintiffs dismissed their claims voluntarily.
Commercial litigation
Crestor(rosuvastatin calcium)
Qui tamlitigation
In the US, in January and February 2014, AstraZeneca was served with lawsuits filed in the US District Court for the District of Delaware under thequi tam (whistleblower) provisions of the federal False Claims Act and related state statutes, alleging that AstraZeneca directed certain employees to promoteCrestor off-label and provided unlawful remuneration to physicians in connection with the promotion of Crestor. The DOJ and all US states have declined to intervene in the lawsuits. This litigation has been stayed pending trial court
| | |
| AstraZenecaAnnual Report and Form 20-F Information 2016 | | 189 |
Financial Statements
28 Commitments and contingent liabilitiescontinued
disposition or earlier resolution of the Texas Attorney General litigation involvingCrestor disclosed below.
Texas Attorney General Litigation
In the US, in January 2015, following a previously disclosed investigation by the State of Texas into AstraZeneca’s sales and marketing activities involvingCrestor, AstraZeneca was served with a lawsuit in which the Texas Attorney General’s office intervened in a state whistleblower action pending in Travis County Court, Texas. The lawsuit alleges that AstraZeneca engaged in inappropriate promotion of Crestor and improperly influenced the formulary status ofCrestor.
Israel
In Israel, in November 2012, a Motion to Certify a Claim as a Class Action and Statement of Claim (together, a Motion to Certify) were filed in the District Court in Tel Aviv, Jaffa, (the District Court) against AstraZeneca and four other pharmaceutical companies for alleged deception and failure to disclose material facts to consumers regarding potential adverse events associated with certain drugs, includingCrestor. In July 2013, an amended Motion to Certify containing similar allegations to those in the first action were filed in the same District Court against the same defendants. In November 2016, the plaintiff filed a motion to withdraw from the action, which the District Court granted in December 2016. This matter has now concluded.
Citizen’s Petition
In the US, in May 2016, AstraZeneca filed a Citizen’s Petition with the FDA requesting that the FDA not approve any pending generic ANDAs for rosuvastatin until the expiration of the paediatric orphan exclusivity for Crestor. In June 2016, AstraZeneca filed its Complaint for Declaratory and Injunctive Relief and an Application for a Temporary Restraining Order (TRO) with the US District Court for the District of Columbia (the District Court) requesting that the District Court prohibit the FDA from granting final approval to any pending ANDAs for generic versions of Crestor until the expiration of paediatric orphan exclusivity. In July 2016, the District Court denied AstraZeneca’s application for a TRO. In August 2016, the District Court entered an order dismissing the case without prejudice. This matter is now concluded.
Nexium (esomeprazole magnesium)
Consumer litigation
In the US, AstraZeneca has been a defendant in a class action filed in Delaware State Court (the State Court) alleging that AstraZeneca’s promotion, advertising and pricing ofNexium to physicians, consumers and third party payers was unfair, unlawful and deceptive. In July 2015, the State Court granted
AstraZeneca’s motion to dismiss and entered judgment in AstraZeneca’s favour. In April 2016, the Delaware Supreme Court affirmed the dismissal.
Settlement anti-trust litigation
In the US, AstraZeneca is a defendant in a multidistrict litigation class action and individual lawsuit alleging that AstraZeneca’s settlements of certain patent litigation in the US relating toNexium violated US antitrust law and various state laws. A trial in the US District Court for the District of Massachusetts commenced in October 2014 and, in December 2014, a jury returned a verdict in favour of AstraZeneca and entered judgment in favour of AstraZeneca in September 2015. The plaintiffs appealed that judgment and, in November 2016, the US Court of Appeals for the First Circuit affirmed. The plaintiffs petitioned for rehearing and rehearingenbanc, both of which were denied in January 2017.
Trademark litigation
AstraZeneca filed separate complaints in the US District Court for the District of Delaware against Camber Pharmaceuticals, Inc. and Dr. Reddy’s Laboratories, Inc. to enforce certain AstraZeneca trademark rights related toNexium andPrilosec. These matters have been successfully resolved.
Seroquel IR (quetiapine fumarate) andSeroquel XR (quetiapine fumarate)
Mississippi Attorney General Investigation
In relation to the state law claims brought by State Attorneys General in the US generally alleging that AstraZeneca made false and/or misleading statements in marketing and promoting Seroquel, AstraZeneca’s remaining case with the Attorney General of Mississippi has been resolved and the matter has been dismissed. This matter is now concluded.
Qui tam litigation in New York
In the US, in September 2015, AstraZeneca was served with a lawsuit filed in US Federal Court in New York under thequi tam (whistleblower) provisions of the federal and certain state False Claims Acts. The lawsuit alleges that AstraZeneca misrepresented the safety profile of, and improperly promoted,Seroquel IR andSeroquel XR. The US government and the named states have declined to intervene in this case.
Qui tam litigation in Delaware
In the US, in April 2014, AstraZeneca was served with lawsuits filed in the US District Court for the District of Delaware under thequi tam (whistleblower) provisions of the federal False Claims Act and related state statutes, alleging that AstraZeneca directed certain employees to promote Seroquel IR andSeroquel XR off-label and provided unlawful remuneration to physicians in connection with the promotion ofSeroquel IR andSeroquel XR. The DOJ and all US states have declined
to intervene in the lawsuits. This litigation has been stayed pending trial court disposition or earlier resolution of the Texas Attorney General litigation involvingSeroquel disclosed below.
Texas Attorney General Litigation
In the US, in October 2014, following a previously disclosed investigation by the State of Texas into AstraZeneca’s sales and marketing activities involvingSeroquel, the Texas Attorney General’s Office intervened in a state whistleblower action pending in Travis County Court, Texas. The lawsuit alleges that AstraZeneca engaged in inappropriate promotion ofSeroquel and made improper payments intended to influence the formulary status ofSeroquel.
Toprol-XL (metoprolol succinate)
In the US, in March 2015, AstraZeneca was served with a state court complaint filed by the Attorney General for the State of Louisiana alleging that, in connection with enforcement of its patents forToprol-XL, it had engaged in unlawful monopolisation and unfair trade practices, causing the state government to pay increased prices forToprol-XL. In February 2016, the Louisiana state court heard oral argument on AstraZeneca’s motion to dismiss and ordered the dismissal of the complaint with prejudice and judgment in AstraZeneca’s favour. The State is appealing the dismissal.
Other commercial litigation
Ocimum Lawsuit
In the US, in December 2015, AstraZeneca was served with a complaint filed by Ocimum Biosciences, Ltd. (Ocimum) in the Superior Court for the State of Delaware that alleges, among other things, breaches of contractual obligations and misappropriation of trade secrets, relating to a now terminated 2001 licensing agreement between AstraZeneca and Gene Logic, Inc. (Gene Logic), the rights to which Ocimum purports to have acquired from Gene Logic.
Pearl Therapeutics
In the US, AstraZeneca was served with a complaint filed in Delaware State Court by the former shareholders of Pearl Therapeutics, Inc. (Pearl) that alleged, among other things, breaches of contractual obligations relating to a 2013 merger agreement between AstraZeneca and Pearl. This case was resolved in September 2016. This matter is now concluded.
Telephone Consumer Protection Act litigation
In the US, in December 2016, AstraZeneca and several other entities were served with a complaint filed in the US District Court for the Southern District of Florida (the District Court) that alleges, among other things, violations of the Telephone Consumer Protection Act caused by the sending of unsolicited advertisements by facsimile. AstraZeneca’s motion to dismiss is pending. Plaintiff also
| | |
| 190 | | AstraZenecaAnnual Report and Form 20-F Information 2016 |
28 Commitments and contingent liabilitiescontinued
made a motion for class certification, which, in January 2017, was denied without prejudice by the District Court.
Government investigations/proceedings
Synagis (palivizumab)
In the US, in June 2011, MedImmune received a demand from the US Attorney’s Office for the Southern District of New York requesting certain documents related to the sales and marketing activities ofSynagis. In July 2011, MedImmune received a similar court order to produce documents from the Office of the Attorney General for the State of New York Medicaid and Fraud Control Unit pursuant to what the government attorneys advised was a joint investigation. MedImmune is cooperating with these inquiries.
In May 2012, MedImmune received asubpoena duces tecum from the Office of Attorney General for the State of Florida Medicaid and Fraud Control Unit requesting certain documents related to the sales and marketing activities ofSynagis. MedImmune has accepted receipt of the request and has coordinated with the Florida government to provide the appropriate responses and cooperate with any related investigation. AstraZeneca is unaware of the nature or focus of the investigation, however, based on the nature of the requests, it appears to be similar to the inquiry from the State of New York (which is described above).
Other government investigations/proceedings
Foreign Corrupt Practices Act
In connection with investigations into anti-bribery and corruption issues in the pharmaceutical industry, AstraZeneca received inquiries from enforcement agencies, including the DOJ and the SEC, regarding, among other things, sales practices, internal controls, certain distributors and interactions with healthcare providers and other government officials in several countries. In August 2016, AstraZeneca entered into a civil settlement with the SEC to resolve these
inquiries. The DOJ has informed AstraZeneca that it has closed its inquiry into this matter.
Additional government inquiries
As is true for most, if not all, major prescription pharmaceutical companies operating in the US, AstraZeneca is currently involved in multiple US federal and state inquiries into drug marketing and pricing practices. In addition to the investigations described above, various federal and state law enforcement offices have, from time to time, requested information from the Group. There have been no material developments in those matters.
Tax
Where tax exposures can be quantified, an accrual is made based on best estimates and management’s judgement. Details of the movements in relation to material tax exposures are discussed below. As accruals can be built up over a long period of time but the ultimate resolution of tax exposures usually occurs at a point in time, and given the inherent uncertainties in assessing the outcomes of these exposures (which sometimes can be binary in nature), we could, in future periods, experience adjustments to these accruals that have a material positive or negative effect on our results in any particular period.
AstraZeneca faces a number of audits in jurisdictions around the world and, in some cases, is in dispute with the tax authorities. The issues under discussion are often complex and can require many years to resolve. Accruals for tax contingencies require management to make estimates and judgements with respect to the ultimate outcome of a tax audit, and actual results could vary from these estimates.
Transfer pricing and other international tax contingencies
The total net accrual included in the Group Financial Statements to cover the worldwide exposure to transfer pricing audits is $320m, a decrease of $41m compared with 2015 mainly due to the release of the net accrual following agreements between the Canadian and the UK and Swedish tax authorities in respect of transfer pricing arrangements for the
13-year period 2004 to 2016, partially offset by increases in accruals for transfer pricing contingencies and exchange rate effects.
Management continues to believe that AstraZeneca’s positions on all its transfer pricing audits and disputes are robust and that AstraZeneca is appropriately provided, including the assessment where corresponding relief will be available. For transfer pricing audits where AstraZeneca and the tax authorities are in dispute, AstraZeneca estimates the potential for reasonably possible additional losses above and beyond the amount provided to be up to $184m (2015: $357m; 2014: $521m), however, management believes that it is unlikely that these additional losses will arise. It is possible that some of these contingencies may reduce in the future to the extent that any tax authority challenge is unsuccessful, or matters lapse following expiry of the relevant statutes of limitation resulting in a reduction in the tax charge in future periods.
Other tax contingencies
Included in the tax accrual is $1,007m relating to a number of other tax contingencies, a decrease of $366m mainly due to releases following expiry of statute of limitations, audit settlements and exchange rate effects offset by the impact of an additional year of transactions relating to contingencies for which accruals had already been established. For these tax exposures, AstraZeneca does not expect material additional losses. It is, however, possible that some of these contingencies may reduce in the future if any tax authority challenge is unsuccessful or matters lapse following expiry of the relevant statutes of limitation resulting in a reduction in the tax charge in future periods.
Timing of cash flows and interest
It is not possible to estimate the timing of tax cash flows in relation to each outcome, however, it is anticipated that a number of significant disputes may be resolved over the next one to two years. Included in the provision is an amount of interest of $142m (2015: $174m; 2014: $227m). Interest is accrued as a tax expense.
29 Operating leases
Total rentals under operating leases charged to profit were as follows:
| | | | | | | | | | | | |
| | | 2016 $m | | | 2015 $m | | | 2014 $m | |
| Operating leases | | | 174 | | | | 185 | | | | 185 | |
The future minimum lease payments under operating leases that have initial or remaining terms in excess of one year at 31 December 2016 were as follows:
| | | | | | | | | | | | |
| | | 2016 $m | | | 2015 $m | | | 2014 $m | |
| | | |
| Obligations under leases comprise: | | | | | | | | | | | | |
| Not later than one year | | | 98 | | | | 95 | | | | 100 | |
| Later than one year and not later than five years | | | 247 | | | | 245 | | | | 247 | |
| Later than five years | | | 96 | | | | 69 | | | | 91 | |
| Total future minimum lease payments | | | 441 | | | | 409 | | | | 438 | |
| | |
| AstraZenecaAnnual Report and Form 20-F Information 2016 | | 191 |
Financial Statements
30 Statutory and other information
| | | | | | | | | | | | |
| | | 2016 $m | | | 2015 $m | | | 2014 $m | |
| Fees payable to KPMG LLP and its associates: | | | | | | | | | | | | |
Group audit fee | | | 2.8 | | | | 3.2 | | | | 2.5 | |
| | | |
| Fees payable to KPMG LLP and its associates for other services: | | | | | | | | | | | | |
The audit of subsidiaries pursuant to legislation | | | 5.4 | | | | 5.4 | | | | 5.0 | |
Audit-related assurance services | | | 2.5 | | | | 2.5 | | | | 2.5 | |
Tax compliance services | | | – | | | | 0.1 | | | | 0.3 | |
Other assurance services | | | 0.2 | | | | 0.5 | | | | 0.5 | |
| | | |
| Fees payable to KPMG LLP in respect of the Group’s pension schemes: | | | | | | | | | | | | |
The audit of subsidiaries’ pension schemes | | | 0.6 | | | | 0.6 | | | | 0.5 | |
| | | | 11.5 | | | | 12.3 | | | | 11.3 | |
Audit-related assurance services include fees of $1.8m (2015: $1.8m; 2014: $1.8m) in respect of section 404 of the Sarbanes-Oxley Act.
Related party transactions
The Group had no material related party transactions which might reasonably be expected to influence decisions made by the users of these Financial Statements.
Key management personnel compensation
Key management personnel are defined for the purpose of disclosure under IAS 24 ‘Related Party Disclosures’ as the members of the Board and the members of the SET.
| | | | | | | | | | | | |
| | | 2016 $’000 | | | 2015 $’000 | | | 2014 $’000 | |
| Short-term employee benefits | | | 23,725 | | | | 29,265 | | | | 30,252 | |
| Post-employment benefits | | | 2,407 | | | | 2,636 | | | | 2,265 | |
| Share-based payments | | | 20,377 | | | | 17,885 | | | | 20,253 | |
| | | | 46,509 | | | | 49,786 | | | | 52,770 | |
Total remuneration is included within employee costs (see Note 27). Further details of Directors’ emoluments are included in the Directors’ Remuneration Report from pages 103 to 132.
31 Subsequent events
There were no material subsequent events.
| | |
| 192 | | AstraZenecaAnnual Report and Form 20-F Information 2016 |
Group Subsidiaries and Holdings
In accordance with section 409 of the Companies Act 2006 a full list of subsidiaries, partnerships, associates, joint ventures and joint arrangements, the country of incorporation, registered office address, and the effective percentage of equity owned as at 31 December 2016 are disclosed below. Unless otherwise stated the share capital disclosed comprises ordinary shares which are indirectly held by AstraZeneca PLC.
Unless otherwise stated the accounting year ends of subsidiaries are 31 December. The Group Financial Statements consolidate the Financial Statements of the Company and its subsidiaries at 31 December 2016.
| | | | |
| At 31 December 2016 | | Percentage of
voting share
capital held | |
| Wholly owned subsidiaries | | | | |
| |
| Argentina | | | | |
| AstraZeneca S.A. | | | 100 | |
Vedia 3616-Piso 8, Ciudad de Buenos Aires, Argentina | |
| | | | | |
| |
| Australia | | | | |
| AstraZeneca Holdings Pty Limited | | | 100 | |
| AstraZeneca PTY Limited | | | 100 | |
Pharmaceutical Manufacturing Company Pty Limited | | | 100 | |
Pharmaceutical Manufacturing Division Pty Limited | | | 100 | |
66 Talavera Road, Macquarie Park NSW 2113, Australia | |
| | | | | |
| |
| Austria | | | | |
| AstraZeneca Österreich GmbH | | | 100 | |
| A-1030 Wien, Schwarzenbergplatz 7, Austria | |
| | | | | |
| |
| Belgium | | | | |
| AstraZeneca S.A. / N.V. | | | 100 | |
Egide Van Ophemstraat 110 1180 Brussels, Belgium | |
| | | | | |
| |
| Brazil | | | | |
| AstraZeneca do Brasil Limitada | | | 100 | |
| Rod. Raposo Tavares, KM 26, 9, Cotia, Brazil | |
| | | | | |
| |
| Bulgaria | | | | |
| AstraZeneca Bulgaria EOOD | | | 100 | |
36 Dragan Tzankov Blvd., District Izgrev, Sofia, 1057, Bulgaria | |
| | | | | |
| |
| Canada | | | | |
| AstraZeneca Canada Inc.1 | | | 100 | |
1004 Middlegate Road, Ontario, L4Y 1M4, Canada | |
| | | | | |
| |
| Cayman Islands | | | | |
| AZ Reinsurance Limited | | | 100 | |
| 94 Solaris Avenue, Second Floor, Camana Bay, Grand Cayman, Cayman Islands | |
| | | | | |
| |
| Chile | | | | |
| AstraZeneca S.A. | | | 100 | |
| AstraZeneca Farmaceutica Chile Limitada | | | 100 | |
Av. Isadora Goyenechea 2939, of .201, Santiago de Chile, Chile | | | | |
| | | | | |
| |
| China | | | | |
AstraZeneca Pharmaceuticals Co., Limited. | | | 100 | |
No 2 Huangshan Road, Wuxi, Jiangsu Province, China | |
| | | | | |
| | | | |
| At 31 December 2016 | | Percentage of
voting share
capital held | |
| AstraZeneca (Wuxi) Trading Co. Ltd | | | 100 | |
2F, Building 4, No 2 Huangshan Road, Wuxi, Jiangsu Province, China | |
| | | | | |
| AstraZeneca Investment (China) Co., Ltd | | | 100 | |
No.199 Liangjing Road, ZhangJiang Hi-tech Park, Shanghai, China | |
| | | | | |
AstraZeneca Pharmaceutical (China) Co. Ltd | | | 100 | |
No 88 Yaocheng Avenue, Taizhou, Jiangsu Province, China | |
| | | | | |
| |
| Colombia | | | | |
| AstraZeneca Colombia S.A. | | | 100 | |
Carrera 7 No. 71-21, Torre A, Piso 19, Santafe de Bogota, Colombia | |
| | | | | |
| |
| Costa Rica | | | | |
| AstraZeneca CAMCAR Costa Rica, S.A. | | | 100 | |
Escazu, Guachipelin, Centro Corporativo Plaza Roble, Edificio Los Balcones, Segundo Nivel, San Jose, Costa Rica | |
| | | | | |
| |
| Croatia | | | | |
| AstraZeneca d.o.o. | | | 100 | |
| Radnicka cesta 80/11, 10000 Zagreb, Croatia | |
| | | | | |
| |
| Czech Republic | | | | |
| AstraZeneca Czech Republic, s.r.o. | | | 100 | |
Smichov Gate – Prague, Plzenska 3217/16, Prague 5, 150 00, Czech Republic | |
| | | | | |
| |
| Denmark | | | | |
| AstraZeneca A/S | | | 100 | |
Arne Jacobsens Allé 13, DK-2300, Copenhagen S, Denmark | |
| | | | | |
| |
| Egypt | | | | |
AstraZeneca Egypt for Pharmaceutical Industries JSC | | | 100 | |
| Villa 133, Road 90 North, New Cairo, Egypt | |
| | | | | |
| Drimex LLC | | | 100 | |
| Villa 47, Road 270, New Maadi, Cairo 11435, Egypt | |
| | | | | |
| AstraZeneca Egypt for Trading LLC | | | 100 | |
| 14C Ahmed Kamel Street, New Maadi, Cairo, Egypt | |
| | | | | |
| |
| Estonia | | | | |
| AstraZeneca Eesti OÜ | | | 100 | |
| Jarvevana tee 9, II korrus, Tallinn, 11314, Estonia | |
| | | | | |
| |
| Finland | | | | |
| AstraZeneca OY. | | | 100 | |
| Itsehallintokuja 4, Espoo, 02600, Finland | |
| | | | | |
| | | | |
| At 31 December 2016 | | Percentage of
voting share
capital held | |
| |
| France | | | | |
| AstraZeneca S.A.S. | | | 100 | |
| AstraZeneca Finance S.A.S. | | | 100 | |
| AstraZeneca Holding France S.A.S. | | | 100 | |
| AstraZeneca Reims S.A.S. | | | 100 | |
Tour Carpe Diem – 31, Place des Corolles, 92400 Courbevoie, France | |
| | | | | |
| AstraZeneca Dunkerque Production SCS | | | 100 | |
224 Avenue de la Dordogne, 59640 Dunkerque, France | |
| | | | | |
| |
| Germany | | | | |
| AstraZeneca Holding GmbH | | | 100 | |
| AstraZeneca GmbH | | | 100 | |
| Tinsdaler Weg 183, Wedel, D-22880, Germany | |
| | | | | |
| Sofotec GmbH | | | 100 | |
Benzstrasse 1-3, 61352, Bad Homburg v.d. Hohe, Germany | |
| | | | | |
| Definiens AG | | | 100 | |
Bernhard-Wicki-Straße 5, 80636, Munich, Germany | |
| | | | | |
| |
| Greece | | | | |
| AstraZeneca S.A. | | | 100 | |
Theotokopoulou 4 & Astronafton, Athens, 151 25, Greece | |
| | | | | |
| |
| Hong Kong | | | | |
| AstraZeneca Hong Kong Limited | | | 100 | |
18/F., Shui On Centre, 6-8 Harbour Road, Wanchai, Hong Kong | |
| | | | | |
| |
| Hungary | | | | |
| AstraZeneca Kft | | | 100 | |
| 2nd floor, 134-146 building B, Bocskai str., Budapest, 1113, Hungary | |
| | | | | |
| |
| India | | | | |
| AstraZeneca India Private Limited2 | | | 100 | |
| 12th Mile on Bellary Road, Venkatala, Opp. BSF (Border Security Force), Yelahanka, Bangalore-560 063, India | |
| | | | | |
| |
| Iran | | | | |
| AstraZeneca Pars Company | | | 100 | |
No.4, Mahshahr Street, Karimkhan Street, Tehran, 15847-38515, Islamic Republic of Iran | |
| | | | | |
| |
| Ireland | | | | |
AstraZeneca Pharmaceuticals (Ireland) Designated Activity Company | | | 100 | |
4th Floor, South Bank House, Barrow Street, Dublin, 4, Republic of Ireland | |
| | | | | |

| | |
| AstraZenecaAnnual Report and Form 20-F Information 2016 | | 193 |
Financial Statements
| | | | |
| At 31 December 2016 | | Percentage of
voting share
capital held | |
| |
| Israel | | | | |
| AstraZeneca Israel Ltd | | | 100 | |
| 13 Zarcin St., Ra’anana 43662, Israel | |
| | | | | |
| |
| Italy | | | | |
| Simesa SpA | | | 100 | |
| AstraZeneca SpA | | | 100 | |
Palazzo Ferraris, via Ludovico il Moro 6/c 20080, Basiglio (Milan), Italy | |
| | | | | |
| |
| Japan | | | | |
| AstraZeneca K.K. | | | 100 | |
| 3-1, Ofuka-cho, Kita-ku, Osaka, Japan | |
| | | | | |
| |
| Kenya | | | | |
| AstraZeneca Pharmaceuticals Limited | | | 100 | |
Chaka Place, Ground Floor, Argwings Kodhek, Nairobi, Kenya | |
| | | | | |
| |
| Latvia | | | | |
| AstraZeneca Latvija SIA | | | 100 | |
| Skanstes iela 54, Riga, LV-1013, Latvia | |
| | | | | |
| |
| Lithuania | | | | |
| AstraZeneca Lietuva UAB | | | 100 | |
| Jasinkio 16A, Vilnius, LT-03163, Lithuania | |
| | | | | |
| |
| Luxembourg | | | | |
| AstraZeneca Luxembourg S.A. | | | 100 | |
Am Brill 7 B – L-3961 Ehlange – Grand Duchy du Luxembourg, Luxembourg | |
| | | | | |
| |
| Malaysia | | | | |
AstraZeneca Asia-Pacific Business Services Sdn Bhd | | | 100 | |
Level 8, Unit 8.01-8.05 Menara UAC, Jalan PJU 7/5, Multiara Damansara 47800 Petaling Jaya, Selangor, Malaysia | |
| | | | | |
| AstraZeneca Sdn Bhd | | | 100 | |
Level 12, Surian Tower, No. 1 Jalan PJU 7/3, Mutiara Damansara, 47810 Petaling Jaya, Selangor, Malaysia | |
| | | | | |
| |
| Mexico | | | | |
| AstraZeneca, S.A. de C.V. | | | 100 | |
Av. Periferico Sur 4305 interior 5, Colonia Jardines en la Montana, Mexico City, Tlalpan Distrito Federal, CP14210, Mexico | |
| | | | | |
| AstraZeneca Health Care S.A. de C.V. | | | 100 | |
Avenida Lomas Verdes 67 Colonia Lomas Verdes, Naucalpan de Juarez, CP 53120, Mexico | |
| | | | | |
| |
| Morocco | | | | |
| AstraZeneca Maroc SARLAU | | | 100 | |
92 Boulevard Anfa ETG 2 Casablanca 20000, Morocco | |
| | | | | |
| |
| The Netherlands | | | | |
| AstraZeneca B.V. | | | 100 | |
| AstraZeneca Continent B.V. | | | 100 | |
| AstraZeneca Gamma B.V. | | | 100 | |
| AstraZeneca Holdings B.V. | | | 100 | |
| AstraZeneca Jota B.V. | | | 100 | |
| AstraZeneca Rho B.V. | | | 100 | |
| | | | |
| At 31 December 2016 | | Percentage of
voting share
capital held | |
| AstraZeneca Sigma B.V. | | | 100 | |
| AstraZeneca Zeta B.V. | | | 100 | |
PO Box 283, 2700 AG Zoetermeer, Louis Pasteurlaan 5, 2719 EE, Zoetermeer, The Netherlands | |
| | | | | |
| MedImmune Pharma B.V. | | | 100 | |
Lagelandsweeg 78, 6545 CG Nijmegen, The Netherlands | |
| | | | | |
| |
| New Zealand | | | | |
| AstraZeneca Limited | | | 100 | |
Level 2, 347-351 Parnell Rd, Parnell, Auckland, 1052, New Zealand | |
| | | | | |
| |
| Nigeria | | | | |
| AstraZeneca Nigeria Limited | | | 100 | |
No.9 Joel Ogunaike Street, GRA Ikeja, Lagos, Nigeria | |
| | | | | |
| |
| Norway | | | | |
| AstraZeneca AS | | | 100 | |
Grensveien 92, Box 6050 Etterstad, NO-0602 Oslo, Norway | |
| | | | | |
| |
| Pakistan | | | | |
| AstraZeneca Pharmaceuticals Pakistan (Private) Limited | | | 100 | |
Office No 1, 2nd Floor, Sasi Arcade, Block 7, Main Clifton Road, Karachi, Pakistan | |
| | | | | |
| |
| Panama | | | | |
| AstraZeneca CAMCAR, S.A. | | | 100 | |
Bodega #1, Parque Logistico MIT, Carretera Hacia Coco Solo, Colon, Panama | |
| | | | | |
| |
| Peru | | | | |
| AstraZeneca Peru S.A. | | | 100 | |
Av. El Derby 055, Torre 2. Piso 5. Of. 503. Santiago de Surco, Lima, Peru | |
| | | | | |
| |
| Philippines | | | | |
| AstraZeneca Pharmaceuticals (Phils.) Inc. | | | 100 | |
16th Floors, Net Cube Center, corner 3rd Avenue & 30th St., E-Square Zone, Crescent Park W, Taguig, Metro Manila, 1634, Philippines | |
| | | | | |
| |
| Poland | | | | |
| AstraZeneca Pharma Poland Sp.z.o.o. | | | 100 | |
| Postepu 14, 02-676, Warszawa, Poland | |
| | | | | |
| |
| Portugal | | | | |
| Astra Alpha Produtos Farmaceuticos Lda | | | 100 | |
| AstraZeneca Produtos Farmaceuticos Lda | | | 100 | |
Novastra Promoção e Comércio Farmacêutico Lda | | | 100 | |
| Novastuart Produtos Farmaceuticos Lda | | | 100 | |
| Stuart-Produtos Farmacêuticos Lda | | | 100 | |
Zeneca Epsilon – Produtos Farmacêuticos Lda | | | 100 | |
Zenecapharma Produtos Farmaceuticos Lda | | | 100 | |
Rua Humberto Madeira, No 7, Queluz de Baixo, 2730-097, Barcarena, Portugal | |
| | | | | |
| | | | |
| At 31 December 2016 | | Percentage of
voting share
capital held | |
| |
| Puerto Rico | | | | |
| IPR Pharmaceuticals, Inc. | | | 100 | |
San Isidro Industrial Park, Road 188, Lot 17, Canóvanas, PR 00729, Puerto Rico | |
| | | | | |
| |
| Romania | | | | |
| AstraZeneca Pharma S.R.L. | | | 100 | |
12 Menuetului Street, Bucharest Business Park, Building D, West Wing, 1st Floor, Sector 1, Bucharest, 013713, Romania | |
| | | | | |
| |
| Russia | | | | |
| AstraZeneca Industries, LLC | | | 100 | |
| AstraZeneca Pharmaceuticals, LLC | | | 100 | |
125284, Begovaya str, 3, block 1, Moscow, Russian Federation | |
| | | | | |
| |
| Singapore | | | | |
| AstraZeneca Singapore Pte Limited | | | 100 | |
10 Kallang Avenue #12-10, Aperia Tower 2, 339510, Singapore | |
| | | | | |
| |
| South Africa | | | | |
| Astra Pharmaceuticals (Pty) Limited | | | 100 | |
| AstraZeneca Pharmaceuticals (Pty) Limited | | | 100 | |
| 17 Georgian Crescent West, Northdowns Office Park, Bryanston, 2041, South Africa | |
| | | | | |
| |
| South Korea | | | | |
| AstraZeneca Korea Co. Ltd | | | 100 | |
Shincheon-dong, Luther Building 17fl. 42, Shincheon-ro2-gil, Songpa-gu, Seoul, Republic of Korea | |
| | | | | |
| |
| Spain | | | | |
| AstraZeneca Farmaceutica Spain S.A. | | | 100 | |
| AstraZeneca Farmaceutica Holding Spain, S.A. | | | 100 | |
| Laboratorio Beta, S.A. | | | 100 | |
| Laboratorio Lailan, S.A. | | | 100 | |
| Laboratorio Odin, S.A. | | | 100 | |
| Laboratorio Tau S.A. | | | 100 | |
| Parque Norte, Edificio Álamo, C/Serrano Galvache no 56., 28033 Madrid, Spain | |
| | | | | |
| |
| Sweden | | | | |
| Astra Export & Trading Aktiebolag | | | 100 | |
| Astra Lakemedel Aktiebolag | | | 100 | |
| AstraZeneca AB | | | 100 | |
| AstraZeneca Biotech AB | | | 100 | |
| AstraZeneca BioVentureHub AB | | | 100 | |
| AstraZeneca Holding Aktiebolag3 | | | 100 | |
| AstraZeneca International Holdings Aktiebolag4 | | | 100 | |
| AstraZeneca Nordic AB | | | 100 | |
| AstraZeneca Pharmaceuticals Aktiebolag | | | 100 | |
| AstraZeneca Sodertalje 2 AB | | | 100 | |
| Stuart Pharma Aktiebolag | | | 100 | |
| Tika Lakemedel Aktiebolag | | | 100 | |
SE-151 85 Sodertalje, Sweden | | | | |
| Aktiebolaget Hassle | | | 100 | |
| Symbicom Aktiebolag4 | | | 100 | |
| 431 83 MoIndal, Sweden | |
| | | | | |
| Astra Tech International Aktiebolag | | | 100 | |
| Box 14, 431 21 MoIndal, Sweden | |
| | | | | |
| | |
| 194 | | AstraZenecaAnnual Report and Form 20-F Information 2016 |
| | | | |
| At 31 December 2016 | | Percentage of
voting share
capital held | |
| |
| Switzerland | | | | |
| AstraZeneca AG | | | 100 | |
| AstraZeneca, Grafenauweg 10, CH-6301, Zug, Switzerland | |
| | | | | |
| Spirogen Sarl4 | | | 100 | |
Rue du Grand-Chêne 5, CH-1003 Lausanne, Switzerland | |
| | | | | |
| |
| Taiwan | | | | |
| AstraZeneca Taiwan Limited1 | | | 100 | |
21st Floor, Taipei Metro Building 207, Tun Hwa South Road, SEC 2 Taipei, Taiwan, Republic of China | |
| | | | | |
| |
| Thailand | | | | |
| AstraZeneca (Thailand) Limited | | | 100 | |
| Asia Centre 19th floor, 173/20, South Sathorn Rd, Khwaeng Thungmahamek, Khet Sathorn, Bangkok, 10120, Thailand | |
| | | | | |
| |
| Tunisia | | | | |
| AstraZeneca Tunisie SaRL | | | 100 | |
| Lot n°1.5.5 les jardins du lac,bloc B les berges du lac Tunis, Tunisia | |
| | | | | |
| |
| Turkey | | | | |
| AstraZeneca Ilac Sanayi ve Ticaret Limited Sirketi | | | 100 | |
YKB Plaza, B Blok, Kat:3-4, Levent/Beşiktaş, Istanbul, Turkey | |
| | | | | |
| Zeneca Ilac Sanayi Ve Ticaret Anonim Sirketi | | | 100 | |
Büyükdere Cad., Y.K.B. Plaza, B Blok, Kat:4, Levent/Beşiktaş, Istanbul, Turkey | |
| | | | | |
| |
| Ukraine | | | | |
| AstraZeneca Ukraina LLC | | | 100 | |
| Ukraine, 04080 Kyiv, 15/15, V. Khvoyky str. | |
| | | | | |
| |
| United Arab Emirates | | | | |
| AstraZeneca FZ-LLC | | | 100 | |
| P.O. Box 27614, Block D, Dubai Healthcare City, Oud Mehta Road, Dubai, United Arab Emirates | |
| | | | | |
| |
| United Kingdom | | | | |
| AlphaCore Pharma Limited | | | 100 | |
| Ardea Biosciences Limited | | | 100 | |
| Arrow Therapeutics Limited | | | 100 | |
| Astra Pharmaceuticals Limited | | | 100 | |
| AstraPharm4 | | | 100 | |
| AstraZeneca China UK Limited | | | 100 | |
| AstraZeneca Death In Service | | | | |
| Trustee Limited | | | 100 | |
| AstraZeneca Employee Share Trust Limited | | | 100 | |
| AstraZeneca Finance Limited | | | 100 | |
| AstraZeneca Insurance Company Limited | | | 100 | |
| AstraZeneca Intermediate Holdings Limited3 | | | 100 | |
| AstraZeneca Investments Limited | | | 100 | |
| AstraZeneca Japan Limited | | | 100 | |
| AstraZeneca Nominees Limited | | | 100 | |
| AstraZeneca Quest Limited | | | 100 | |
| AstraZeneca Share Trust Limited | | | 100 | |
| AstraZeneca Sweden Investments Limited | | | 100 | |
| | | | |
| At 31 December 2016 | | Percentage of
voting share
capital held | |
| AstraZeneca Treasury Limited4 | | | 100 | |
| AstraZeneca UK Limited | | | 100 | |
| AstraZeneca US Investments Limited3 | | | 100 | |
| Ayzee 1 Limited | | | 100 | |
| AYZEE 2 Limited | | | 100 | |
| AYZEE 3 Limited | | | 100 | |
| AYZEE 4 Limited | | | 100 | |
| AZENCO2 Limited | | | 100 | |
| AZENCO4 Limited | | | 100 | |
| Cambridge Antibody Technology | | | | |
| Group Limited | | | 100 | |
| KuDOS Horsham Limited | | | 100 | |
| KuDOS Pharmaceuticals Limited | | | 100 | |
| Meronem Group Limited | | | 100 | |
| Zenco (No 8) Limited | | | 100 | |
| Zeneca Finance (Netherlands) Company | | | 100 | |
| 1 Francis Crick Avenue, | | | | |
| Cambridge Biomedical Campus, | | | | |
| Cambridge, CB2 0AA, United Kingdom | | | | |
| MedImmune Limited | | | 100 | |
| Milstein Building, Granta Park, Cambridge, | | | | |
| CB21 6GH, United Kingdom | | | | |
| MedImmune U.K. Limited | | | 100 | |
Plot 6, Renaissance Way, Boulevard Park, Liverpool, L24 9JW, United Kingdom | |
| | | | | |
| |
| United States | | | | |
| Amylin Pharmaceuticals LLC5 | | | 100 | |
| AstraZeneca Collaboration Ventures LLC5 | | | 100 | |
| AstraZeneca Pharmaceuticals, LP6 | | | 100 | |
| AstraZeneca, LLC5 | | | 100 | |
| AstraZeneca, LP6 | | | 100 | |
| Atkemix Nine Inc. | | | 100 | |
| Atkemix Ten Inc. | | | 100 | |
| BMS Holdco Inc. | | | 100 | |
| Corpus Christi Holdings Inc. | | | 100 | |
| Omthera Pharmaceuticals Inc. | | | 100 | |
| Stauffer Management Company LLC5 | | | 100 | |
| Zeneca Holdings Inc. | | | 100 | |
| Zeneca Inc. | | | 100 | |
| Zeneca Wilmington Inc.3 | | | 100 | |
| 1800 Concord Pike, Wilmington DE 19850, United States | |
| | | | | |
| ZS Pharma Inc. | | | 100 | |
| 1100 Park Place, Suite 300, San Mateo, CA 94403, United States | |
| | | | | |
| AlphaCore Pharma, LLC5 | | | 100 | |
| 333 Parkland Plaza, Suite 5, Ann Arbor, MI 48103, United States | |
| | | | | |
| Amylin Ohio LLC5 | | | 100 | |
| 8814 Trade Port Drive, West Chester, OH 45011, United States | |
| | | | | |
| Ardea Biosciences, Inc. | | | 100 | |
| 4939 Directors Place, San Diego, CA 92121, United States | |
| | | | | |
| AZ-Mont Insurance Company | | | 100 | |
| 76 St Paul Street, Suite 500, 05401-4477, United States | |
| | | | | |
| Definiens Inc. | | | 100 | |
| 1808 Aston Avenue, Suite 190, Carlsbad, CA 92008, United States | |
| | | | | |
| | | | |
| At 31 December 2016 | | Percentage of
voting share
capital held | |
| MedImmune Biologics Inc. | | | 100 | |
| MedImmune, LLC5 | | | 100 | |
| MedImmune Ventures, Inc. | | | 100 | |
MedImmune, One MedImmune Way, Gaithersburg, Maryland 20878, United States | |
| | | | | |
| Optein, Inc. | | | 100 | |
2711 Centerville Road, Suite 400, Wilmington, Delaware 1989, United States | |
| | | | | |
| Pearl Therapeutics, Inc. | | | 100 | |
200 Saginaw Drive, Redwood City CA 94063, United States | |
| | | | | |
| |
| Uruguay | | | | |
| AstraZeneca S.A.1 | | | 100 | |
| Yaguarón 1407 of 1205, Montevideo, Uruguay | |
| | | | | |
| |
| Venezuela | | | | |
| AstraZeneca Venezuela S.A. | | | 100 | |
Av. Principal De la Castellana, Cruce con calle, Jose Angel Lamas Piso 14, Venezuela | |
| | | | | |
| Gotland Pharma S.A. | | | 100 | |
| Av. La Castellana, Torre La Castellana, Piso 5, Oficina 5-G, 5-H, 5-I, Urbanización La Castellana, Municipio Chacao, Estado Bolivariano de Miranda, Venezuela | |
| | | | | |
|
Subsidiaries where the effective interest is less than 100% | |
| |
| Algeria | | | | |
| SPA AstraZeneca Al Djazair7 | | | 65.77% | |
No 20 Zone Macro Economique, dar El Medina-Hydra, Alger, Algeria` | |
| | | | | |
| |
| India | | | | |
| AstraZeneca Pharma India Limited2 | | | 75% | |
Block N1, 12th Floor, Manyata Embassy Business Park, Rachenahalli, Outer Ring Road, Bangalore-560 045, India | |
| | | | | |
| |
| Indonesia | | | | |
| P.T. AstraZeneca Indonesia | | | 95% | |
Perkantoran Hijau Arkadia Tower F, 3rd Floor, JI. T.B. Simatupang Kav. 88, Jakarta, 12520, Indonesia | |
| | | | | |
| |
| The Netherlands | | | | |
| Acerta Pharma B.V. | | | 55% | |
| Molenstraat 110, 5342CC Oss, The Netherlands | |
| | | | | |
| Aspire Therapeutics B.V. | | | 55% | |
| Kloosterstraat 9, 5349 AB, Oss, The Netherlands | |
| | | | | |
| |
| United Kingdom | | | | |
I.C. Insurance Holdings Limited (In Liquidation) | | | 51% | |
| c/o Deloitte LLP, PO Box 500, 2 Hardman Street, Manchester M60 2AT | |
| | | | | |
| | |
| AstraZenecaAnnual Report and Form 20-F Information 2016 | | 195 |
Financial Statements
| | | | |
| At 31 December 2016 | | Percentage of
voting share
capital held | |
| |
| United States | | | | |
Advent Healthcare & Life Sciences III-A Limited Partnership | | | 60% | |
| 75 State Street, Boston, 02109, United States | |
| | | | | |
| Acerta Pharma LLC | | | 55% | |
1509 Industrial Road, San Carlos, CA 94070, United States | | | | |
| | | | | |
|
| Joint Ventures | |
| |
| China | | | | |
| WuXi MedImmune Biopharmaceutical Co. Limited | | | 50% | |
Room 1902, 19/F, Lee Garden One, Hysan Avenue, Causeway Bay, Hong Kong | |
| | | | | |
| |
| United Kingdom | | | | |
| Archigen Biotech Limited7 | | | 50% | |
| Centus Biotherapeutics Limited7 | | | 50% | |
1 Francis Crick Avenue, Cambridge Biomedical Campus, Cambridge, CB2 0AA, United Kingdom | |
| | | | | |
| |
| United States | | | | |
| Montrose Chemical Corporation of California | | | 50% | |
Suite 380, 600 Ericksen Ave N/A, Bainbridge Island, United States | |
| | | | | |
|
| Significant Holdings | |
| |
| United Kingdom | | | | |
| Apollo Therapeutics LLP | | | 25% | |
Stevenage Biosciences Catalyst, Gunnels Wood Road, Stevenage, Hertfordshire, SG1 2FX, United Kingdom | |
| | | | | |
| Entasis Therapeutics Limited8 | | | 49% | |
2 Kingdom Street, London, W2 6BD, United Kingdom | |
| | | | | |
| |
| United States | | | | |
| C.C.Global Chemicals Company | | | 37.5% | |
PO Box 7, MS2901, Texas, TX76101-0007, United States | |
| | | | | |
|
| Associated Holdings | |
| |
| Australia | | | | |
| Armaron Bio Ltd9 | | | 17.43% | |
Level 1/120 Jolimont Road, East Melbourne 3002 VIC, Australia | |
| | | | | |
| |
| British Virgin Islands | | | | |
Biohaven Pharmaceuticals Holding Company Ltd.10 | | | 5% | |
P.O. Box 173, Kingston Chambers, Road Town, Tortola, British Virgin Islands | |
| | | | | |
| |
| New Zealand | | | | |
| Adherium Limited | | | 5.6% | |
Level 2, 204 Quay Street, Auckland, 1010, New Zealand | |
| | | | | |
| |
| Switzerland | | | | |
| ADC Therapeutics Sàrl Switzerland11 | | | 8.84% | |
Biopôle, Route de la Corniche 3B, 1066 Epalinges, Switzerland | |
| | | | | |
| | | | |
| At 31 December 2016 | | Percentage of
voting share
capital held | |
| |
| United Kingdom | | | | |
| Silence Therapeutics PLC | | | 0.17% | |
27 Eastcastle Street, London, W1W 8DH, United Kingdom | |
| | | | | |
| |
| United States | | | | |
| Affinita Biotech, Inc.12 | | | 16.23% | |
329 Oyster Point Blvd., 3rd Floor, South San Francisco, CA 94080, United States | |
| | | | | |
| Albireo Pharma, Inc.13 | | | 15.89% | |
50 Milk Street, 16th Floor, Boston, MA 02109, United States | |
| | | | | |
| Biodesix Inc. | | | 0.3% | |
2970 Wilderness Place Suite 100, Boulder, CO 80301, United States | |
| | | | | |
| BlinkBio Inc.9 | | | 18.49% | |
25 Health Sciences Drive, Mailbox 123, Stony Brook, NY 11790, United States | |
| | | | | |
| Catabasis Pharmaceuticals, Inc. | | | 10.7% | |
One Kendall Square Bldg. 1400E, Suite B14202, Cambridge, MA 02139, United States | |
| | | | | |
| Cerapedics, Inc.14 | | | 8.61% | |
11025 Dover St #1600, Broomfield, CO 80021, United States | |
| | | | | |
| Cordivia Corporation | | | 19.9% | |
1209 Orange Street, Wilmington, DE 19801, United States | |
| | | | | |
| Elusys Therapeutics, Inc.15 | | | 7.2% | |
25 Riverside Drive Unit One, Pine Brook, NJ 07058, United States | |
| | | | | |
| FibroGen, Inc. | | | 1.8% | |
409 Illinois St., San Francisco, CA 94158, United States | |
| | | | | |
| G1 Therapeutics, Inc.16 | | | 18.03% | |
79 T.W. Alexander Drive, 4401 Research Commons Suite 105, Research Triangle Park, NC 7709, United States | |
| | | | | |
| Hydra Biosciences Inc. | | | 4.27% | |
45 Moulton Street, Cambridge, MA 02138, United States | |
| | | | | |
| Inotek Pharmaceuticals Corporation | | | 7.3% | |
91 Hartwell Ave 2nd Floor, Lexington, MA 02421, United States | |
| | | | | |
| Millendo Therapeutics, Inc.9 | | | 8.45% | |
301 North Main Street, Suite 100, Ann Arbor, MI 48104, United States | |
| | | | | |
| Moderna Therapeutics Inc.17 | | | 7% | |
320 Bent Street, Cambridge, MA 02141, United States | |
| | | | | |
| PhaseBio Pharmaceuticals, Inc.14 | | | 14.5% | |
One Great Valley, Parkway, Suite 30, Malvern, PA 19355, United States | |
| | | | | |
| Rani Therapeutics, L.L.C.14 | | | 1% | |
2051 Ringwood Ave, San Jose, CA 95116, United States | |
| | | | | |
| | | | |
| At 31 December 2016 | | Percentage of
voting share
capital held | |
| Regulus Therapeutics Inc. | | | 6.7% | |
10614 Science Center Dr., San Diego, CA 92121, United States | |
| | | | | |
| VentiRx Pharmaceuticals, Inc.10 | | | 12% | |
1191 Second Avenue, Suite 1105, Seattle, WA 98101, United States | |
| | | | | |
| 1 | Ownership held in ordinary and special shares. |
| 2 | Accounting year end is 31 March. |
| 3 | Directly held by AstraZeneca PLC. |
| 4 | Ownership held in class A and class B shares. |
| 5 | Ownership held as membership interest. |
| 6 | Ownership held as partnership interest. |
| 7 | Ownership held in class A shares. |
| 8 | Ownership held in preference, deferred and ordinary shares. |
| 9 | Ownership held in class B preference shares. |
| 10 | Ownership held in class A preference shares. |
| 11 | Ownership held in class B ordinary shares, class C ordinary shares, and class D ordinary shares. |
| 12 | Ownership held in class A voting and class A non-voting shares. |
| 13 | Ownership held in class A voting preference shares, class A non-voting preference shares, and class B voting preference shares. |
| 14 | Ownership held in class C preference shares. |
| 15 | Ownership held in class D preference shares. |
| 16 | Ownership held in class A preference shares and class B preference shares. |
| 17 | Ownership held in class D preference shares and class E preference shares. |
| | |
| 196 | | AstraZenecaAnnual Report and Form 20-F Information 2016 |
Independent Auditor’s Report to the
Members of AstraZeneca PLC only
Opinions and conclusions arising from our audit
| 1 | Our opinion on the Parent Company Financial Statements is unmodified |
We have audited the Parent Company Financial Statements of AstraZeneca PLC for the year ended 31 December 2016 set out on pages 198 to 202. In our opinion the Parent Company Financial Statements:
| > | give a true and fair view of the state of the Company’s affairs as at 31 December 2016 |
| > | have been properly prepared in accordance with UK Accounting Standards, including FRS 101 ‘Reduced Disclosure Framework’; and |
| > | have been prepared in accordance with the requirements of the Companies Act 2006. |
| 2 | Our opinion on other matters prescribed by the Companies Act 2006 is unmodified |
In our opinion:
| > | the part of the Directors’ Remuneration Report to be audited has been properly prepared in accordance with the Companies Act 2006; and |
| > | the information given in the Strategic Report and the Directors’ Report for the financial year for which the Financial Statements are prepared is consistent with the Parent Company Financial Statements. |
| 3 | We have nothing to report in respect of the matters on which we are required to report by exception |
The Companies Act 2006 requires us to report to you if, in our opinion:
| > | adequate accounting records have not been kept by the Parent Company, or returns adequate for our audit have not been received from branches not visited by us; or |
| > | the Parent Company Financial Statements and the part of the Directors’ Remuneration Report to be audited are not in agreement with the accounting records and returns; or |
| > | certain disclosures of Directors’ remuneration specified by law are not made; or |
| > | we have not received all the information and explanations we require for our audit. |
We have nothing to report in respect of the above responsibilities.
| 4 | Other matter – we have reported separately on the Group Financial Statements |
We have reported separately on the Group Financial Statements of AstraZeneca PLC for the year ended 31 December 2016.
Scope and responsibilities
As explained more fully in the Directors’ Responsibilities Statement set out on page 133, the Directors are responsible for the preparation of the Parent Company Financial Statements and for being satisfied that they give a true and fair view. A description of the scope of an audit of financial statements is provided on the Financial Reporting Council’s website at www.frc.org.uk/auditscopeukprivate. This report is made solely to the Company’s members as a body and is subject to important explanations and disclaimers regarding our responsibilities, published on our website www.kpmg.com/uk/auditscopeukco2014a, which are incorporated into this report as if set out in full and should be read to provide an understanding of the purpose of this report, the work we have undertaken and the basis of our opinions.
Antony Cates (Senior Statutory Auditor)
for and on behalf of KPMG LLP,
Statutory Auditor
Chartered Accountants
15 Canada Square, London, E14 5GL
2 February 2017
| | |
| AstraZenecaAnnual Report and Form 20-F Information 2016 | | 197 |
Financial Statements
Company Balance Sheet
at 31 December
AstraZeneca PLC
| | | | | | | | | | | | |
| | | Notes | | | 2016 $m | | | 2015 $m | |
| | | |
| Fixed assets | | | | | | | | | | | | |
| Fixed asset investments | | | 1 | | | | 30,449 | | | | 30,047 | |
| | | |
| Current assets | | | | | | | | | | | | |
| Debtors – other | | | | | | | 14 | | | | 15 | |
| Debtors – amounts owed by Group undertakings | | | | | | | 8,935 | | | | 7,283 | |
| | | | | | | | 8,949 | | | | 7,298 | |
| | | |
| Creditors: Amounts falling due within one year | | | | | | | | | | | | |
| Non-trade creditors | | | 2 | | | | (518 | ) | | | (814 | ) |
| Interest-bearing loans and borrowings | | | 3 | | | | (1,749 | ) | | | – | |
| | | | | | | | (2,267 | ) | | | (814 | ) |
| Net current assets | | | | | | | 6,682 | | | | 6,484 | |
| Total assets less current liabilities | | | | | | | 37,131 | | | | 36,531 | |
| | | |
| Creditors: Amounts falling due after more than one year | | | | | | | | | | | | |
| Amounts owed to Group undertakings | | | 3 | | | | (283 | ) | | | (283 | ) |
| Interest-bearing loans and borrowings | | | 3 | | | | (14,138 | ) | | | (13,705 | ) |
| | | | | | | | (14,421 | ) | | | (13,988 | ) |
| Net assets | | | | | | | 22,710 | | | | 22,543 | |
| | | |
| Capital and reserves | | | | | | | | | | | | |
| Called-up share capital | | | 4 | | | | 316 | | | | 316 | |
| Share premium account | | | | | | | 4,351 | | | | 4,304 | |
| Capital redemption reserve | | | | | | | 153 | | | | 153 | |
| Other reserves | | | | | | | 2,583 | | | | 2,623 | |
| Profit and loss account | | | | | | | 15,307 | | | | 15,147 | |
| Shareholders’ funds | | | | | | | 22,710 | | | | 22,543 | |
$m means millions of US dollars.
The Company Financial Statements from page 198 to 202 were approved by the Board on 2 February 2017 and were signed on its behalf by
| | |
Pascal Soriot | | Marc Dunoyer |
Director | | Director |
Company’s registered number 02723534
| | |
| 198 | | AstraZenecaAnnual Report and Form 20-F Information 2016 |
Statement of Changes in Equity
for the year ended 31 December
| | | | | | | | | | | | | | | | | | | | | | | | |
| | | Share capital $m | | | Share premium account $m | | | Capital redemption reserve $m | | | Other reserves $m | | | Profit and loss account $m | | | Total equity $m | |
| At 1 January 2015 | | | 316 | | | | 4,261 | | | | 153 | | | | 2,754 | | | | 16,709 | | | | 24,193 | |
| | | | | | |
| Total comprehensive income for the period | | | | | | | | | | | | | | | | | | | | | | | | |
| Profit for the period | | | – | | | | – | | | | – | | | | – | | | | 1,974 | | | | 1,974 | |
| Amortisation of loss on cash flow hedge | | | – | | | | – | | | | – | | | | – | | | | 1 | | | | 1 | |
| Total comprehensive income for the period | | | – | | | | – | | | | – | | | | – | | | | 1,975 | | | | 1,975 | |
| | | | | | |
| Transactions with owners, recorded directly in equity | | | | | | | | | | | | | | | | | | | | | | | | |
| Dividends | | | – | | | | – | | | | – | | | | – | | | | (3,537 | ) | | | (3,537 | ) |
| Equity-settled share-based payment transactions | | | – | | | | – | | | | – | | | | (131 | ) | | | – | | | | (131 | ) |
| Issue of Ordinary Shares | | | – | | | | 43 | | | | – | | | | – | | | | – | | | | 43 | |
| Total contributions by and distributions to owners | | | – | | | | 43 | | | | – | | | | (131 | ) | | | (3,537 | ) | | | (3,625 | ) |
| At 31 December 2015 | | | 316 | | | | 4,304 | | | | 153 | | | | 2,623 | | | | 15,147 | | | | 22,543 | |
| | | | | | |
| Total comprehensive income for the period | | | | | | | | | | | | | | | | | | | | | | | | |
| Profit for the period | | | – | | | | – | | | | – | | | | – | | | | 3,699 | | | | 3,699 | |
| Amortisation of loss on cash flow hedge | | | – | | | | – | | | | – | | | | – | | | | 1 | | | | 1 | |
| Total comprehensive income for the period | | | – | | | | – | | | | – | | | | – | | | | 3,700 | | | | 3,700 | |
| | | | | | |
| Transactions with owners, recorded directly in equity | | | | | | | | | | | | | | | | | | | | | | | | |
| Dividends | | | – | | | | – | | | | – | | | | – | | | | (3,540 | ) | | | (3,540 | ) |
| Equity-settled share-based payment transactions | | | – | | | | – | | | | – | | | | (40 | ) | | | – | | | | (40 | ) |
| Issue of Ordinary Shares | | | – | | | | 47 | | | | – | | | | – | | | | – | | | | 47 | |
| Total contributions by and distributions to owners | | | – | | | | 47 | | | | – | | | | (40 | ) | | | (3,540 | ) | | | (3,533 | ) |
| At 31 December 2016 | | | 316 | | | | 4,351 | | | | 153 | | | | 2,583 | | | | 15,307 | | | | 22,710 | |
At 31 December 2016, $15,307m (2015: $15,147m) of the profit and loss account reserve was available for distribution. Included in other reserves is a special reserve of $157m (2015: $157m), arising on the redenomination of share capital in 1999.
Included within other reserves at 31 December 2016 is $742m (2015: $782m) in respect of cumulative share-based payment awards. These amounts are not available for distribution.
| | |
| AstraZenecaAnnual Report and Form 20-F Information 2016 | | 199 |
Financial Statements
Company Accounting Policies
Basis of presentation of
financial information
These financial statements were prepared in accordance with FRS 101 ‘Reduced Disclosure Framework’.
In preparing these financial statements, the Company applied the recognition, measurement and disclosure requirements of International Financial Reporting Standards as adopted by the EU (‘Adopted IFRSs’), but makes amendments where necessary in order to comply with Companies Act 2006 and has set out below where advantage of the FRS 101 disclosure exemptions has been taken. In these financial statements, the Company has applied the exemptions available under FRS 101 in respect of the following disclosures:
| > | Statement of Cash Flows and related notes |
| > | comparative period reconciliations for share capital |
| > | disclosures in respect of transactions with wholly owned subsidiaries |
| > | disclosures in respect of capital management |
| > | the effects of new but not yet effective IFRSs |
| > | disclosures in respect of the compensation of Key Management Personnel. |
As the Group Financial Statements (presented on pages 138 to 196) include the equivalent disclosures, the Company has also taken the exemptions under FRS 101 available in respect of the following disclosures:
| > | IFRS 2 Share-based Payment in respect of group settled share-based payments. |
No individual profit and loss account is prepared as provided by section 408 of the Companies Act 2006. The Company proposes to continue to adopt the reduced disclosure framework of FRS 101 in its next financial statements.
The accounting policies set out below have, unless otherwise stated, been applied consistently to all periods presented in these financial statements.
Basis of accounting
The Company Financial Statements are prepared under the historical cost convention, in accordance with the Companies Act 2006. The Group Financial Statements are presented on pages 138 to 196 and have been prepared in accordance with IFRSs as adopted by the EU and as issued by the IASB and in accordance with the Group Accounting Policies set out on pages 142 to 146.
The following paragraphs describe the main accounting policies, which have been applied consistently.
Foreign currencies
Profit and loss account items in foreign currencies are translated into US dollars at average rates for the relevant accounting periods. Assets and liabilities are translated at exchange rates prevailing at the date of the Company Balance Sheet. Exchange gains and losses on loans and on short-term foreign currency borrowings and deposits are included within net interest payable. Exchange differences on all other transactions, except relevant foreign currency loans, are taken to operating profit.
Taxation
The current tax payable is based on taxable profit for the year. Taxable profit differs from reported profit because taxable profit excludes items that are either never taxable or tax deductible or items that are taxable or tax deductible in a different period. The Company’s current tax assets and liabilities are calculated using tax rates that have been enacted or substantively enacted by the reporting date.
Deferred tax is provided using the balance sheet liability method, providing for temporary differences between the carrying amounts of assets and liabilities for financial reporting purposes and the amounts used for taxation purposes. Deferred tax assets are recognised to the extent that it is probable that taxable profit will be available against which the asset can be utilised. This requires judgements to be made in respect of the availability of future taxable income.
No deferred tax asset or liability is recognised in respect of temporary differences associated with investments in subsidiaries and branches where the Company is able to control the timing of reversal of the temporary differences and it is probable that the temporary differences will not reverse in the foreseeable future.
The Company’s deferred tax assets and liabilities are calculated using tax rates that are expected to apply in the period when the liability is settled or the asset realised based on tax rates that have been enacted or substantively enacted by the reporting date.
Accruals for tax contingencies require management to make judgements and estimates of exposures in relation to tax audit issues. Tax benefits are not recognised unless the tax positions will probably be sustained based upon management’s interpretation of applicable laws and regulations. Once considered to be probable, management reviews each material tax benefit to assess whether a provision should be taken against full recognition of that benefit on the basis of potential settlement through negotiation and/or litigation. Accruals for tax contingencies are
measured using the single best estimate of likely outcome approach. Any liability to interest on tax liabilities is provided for in the tax charge.
Investments
Fixed asset investments, including investments in subsidiaries, are stated at cost and reviewed for impairment if there are indications that the carrying value may not be recoverable.
Share-based payments
The issuance by the Company to employees of its subsidiaries of a grant of awards over the Company’s shares, represents additional capital contributions by the Company to its subsidiaries. An additional investment in subsidiaries results in a corresponding increase in shareholders’ equity. The additional capital contribution is based on the fair value of the grant issued, allocated over the underlying grant’s vesting period, less the market cost of shares charged to subsidiaries in settlement of such share awards.
Financial instruments
Loans and other receivables are held at amortised cost. Long-term loans payable are held at amortised cost.
Litigation
Through the normal course of business, the AstraZeneca Group is involved in legal disputes, the settlement of which may involve cost to the Company. Provision is made where an adverse outcome is probable and associated costs can be estimated reliably. In other cases, appropriate descriptions are included.
| | |
| 200 | | AstraZenecaAnnual Report and Form 20-F Information 2016 |
Notes to the Company Financial Statements
1 Fixed asset investments
| | | | | | | | | | | | |
| | | | | | Investments in subsidiaries | |
| | | Shares $m | | | Loans $m | | | Total $m | |
| At 1 January 2016 | | | 16,053 | | | | 13,994 | | | | 30,047 | |
| Additions | | | – | | | | 2,480 | | | | 2,480 | |
| Transfer to current assets | | | – | | | | (1,749 | ) | | | (1,749 | ) |
| Capital reimbursement | | | (27 | ) | | | – | | | | (27 | ) |
| Exchange | | | – | | | | (307 | ) | | | (307 | ) |
| Amortisation | | | – | | | | 5 | | | | 5 | |
| At 31 December 2016 | | | 16,026 | | | | 14,423 | | | | 30,449 | |
A list of subsidiaries is included on pages 193 to 196.
2 Non-trade creditors
| | | | | | | | |
| | | 2016 $m | | | 2015 $m | |
| | |
| Amounts due within one year | | | | | | | | |
| Short-term borrowings | | | 371 | | | | 679 | |
| Other creditors | | | 140 | | | | 128 | |
| Amounts owed to Group undertakings | | | 7 | | | | 7 | |
| | | | 518 | | | | 814 | |
3 Loans
| | | | | | | | | | | | | | | | |
| | | | | | Repayment dates | | | 2016 $m | | | 2015 $m | |
| | | | |
| Amounts due within one year | | | | | | | | | | | | | | | | |
| Interest-bearing loans and borrowings (unsecured) | | | | | | | | | | | | | | | | |
5.9% Callable bond | | | US dollars | | | | 2017 | | | | 1,749 | | | | – | |
| | | | | | | | | | | | 1,749 | | | | – | |
| | | | |
| Amounts due after more than one year | | | | | | | | | | | | | | | | |
| Amounts owed to Group undertakings (unsecured) | | | | | | | | | | | | | | | | |
7.2% Loan | | | US dollars | | | | 2023 | | | | 283 | | | | 283 | |
| Interest-bearing loans and borrowings (unsecured) | | | | | | | | | | | | | | | | |
5.9% Callable bond | | | US dollars | | | | 2017 | | | | – | | | | 1,747 | |
Floating rate notes | | | US dollars | | | | 2018 | | | | 399 | | | | 399 | |
1.75% Callable bond | | | US dollars | | | | 2018 | | | | 998 | | | | 997 | |
1.95% Callable bond | | | US dollars | | | | 2019 | | | | 998 | | | | 997 | |
2.375% Callable bond | | | US dollars | | | | 2020 | | | | 1,589 | | | | 1,586 | |
0.875% Non-callable bond | | | euros | | | | 2021 | | | | 782 | | | | 812 | |
0.25% Callable bond | | | euros | | | | 2021 | | | | 522 | | | | – | |
0.75% Callable bond | | | euros | | | | 2024 | | | | 937 | | | | – | |
3.375% Callable bond | | | US dollars | | | | 2025 | | | | 1,976 | | | | 1,971 | |
1.25% Callable bond | | | euros | | | | 2028 | | | | 827 | | | | – | |
5.75% Non-callable bond | | | pounds sterling | | | | 2031 | | | | 426 | | | | 515 | |
6.45% Callable bond | | | US dollars | | | | 2037 | | | | 2,719 | | | | 2,719 | |
4% Callable bond | | | US dollars | | | | 2042 | | | | 986 | | | | 986 | |
4.375% Callable bond | | | US dollars | | | | 2045 | | | | 979 | | | | 976 | |
| | | | | | | | | | | | 14,138 | | | | 13,705 | |
| | | | | | | | | | | | | | | | | |
| | | | | | | | | 2016 $m | | | 2015 $m | |
| Loans or instalments thereof are repayable: | | | | | | | | | | | | | | | | |
After five years from balance sheet date | | | | | | | | | | | 9,133 | | | | 8,262 | |
From two to five years | | | | | | | | | | | 3,891 | | | | 3,979 | |
From one to two years | | | | | | | | | | | 1,397 | | | | 1,747 | |
Within one year | | | | | | | | | | | 1,749 | | | | – | |
| Total unsecured | | | | | | | | | | | 16,170 | | | | 13,988 | |
With the exception of the 2018 floating rate notes, all loans are at fixed interest rates. Accordingly, the fair values of the loans will change as market rates change. However, since the loans are held at amortised cost, changes in interest rates and the credit rating of the Company do not have any effect on the Company’s net assets.
| | |
| AstraZenecaAnnual Report and Form 20-F Information 2016 | | 201 |
Financial Statements
4 Share capital
Details of share capital movements in the year and share option schemes are included in Note 22 to the Group Financial Statements.
5 Contingent liabilities
In addition to the matter disclosed below, there are other cases where the Company is named as a party to legal proceedings. These include theNexium andFarxiga product liability litigations, each of which are described more fully in Note 28 to the Group Financial Statements.
Foreign Corrupt Practices Act
In connection with investigations into anti-bribery and corruption issues in the pharmaceutical industry, AstraZeneca has received inquiries from enforcement agencies, including the DOJ and the SEC, regarding, among other things, sales practices, internal controls, certain distributors and interactions with healthcare providers and other government officials in several countries. In August 2016, AstraZeneca entered into a civil settlement with the SEC to resolve these inquiries. The DOJ has informed AstraZeneca that it has closed its inquiry into this matter.
Other
The Company has guaranteed the external borrowing of a subsidiary in the amount of $286m.
6 Statutory and other information
The Directors were paid by another Group company in 2016 and 2015.
7 Subsequent events
On 31 January 2017, the Company received a dividend from a subsidiary of $1,623m.
| | |
| 202 | | AstraZenecaAnnual Report and Form 20-F Information 2016 |
Group Financial Record
| | | | | | | | | | | | | | | | | | | | |
| For the year ended 31 December | | 2012 $m | | | 2013 $m | | | 2014 $m | | | 2015 $m | | | 2016 $m | |
| Revenue and profits | | | | | | | | | | | | | | | | | | | | |
| Product Sales | | | 27,973 | | | | 25,711 | | | | 26,095 | | | | 23,641 | | | | 21,319 | |
| Externalisation Revenue | | | 451 | | | | 95 | | | | 452 | | | | 1,067 | | | | 1,683 | |
| Cost of sales | | | (5,393 | ) | | | (5,261 | ) | | | (5,842 | ) | | | (4,646 | ) | | | (4,126 | ) |
| Distribution costs | | | (320 | ) | | | (306 | ) | | | (324 | ) | | | (339 | ) | | | (326 | ) |
| Research and development expense | | | (5,243 | ) | | | (4,821 | ) | | | (5,579 | ) | | | (5,997 | ) | | | (5,890 | ) |
| Selling, general and administrative costs | | | (9,839 | ) | | | (12,206 | ) | | | (13,000 | ) | | | (11,112 | ) | | | (9,413 | ) |
| Other operating income and expense | | | 519 | | | | 500 | | | | 335 | | | | 1,500 | | | | 1,655 | |
| Operating profit | | | 8,148 | | | | 3,712 | | | | 2,137 | | | | 4,114 | | | | 4,902 | |
| Finance income | | | 42 | | | | 50 | | | | 78 | | | | 46 | | | | 67 | |
| Finance expense | | | (544 | ) | | | (495 | ) | | | (963 | ) | | | (1,075 | ) | | | (1,384 | ) |
| Share of after tax losses in associates and joint ventures | | | – | | | | – | | | | (6 | ) | | | (16 | ) | | | (33 | ) |
| Profit before tax | | | 7,646 | | | | 3,267 | | | | 1,246 | | | | 3,069 | | | | 3,552 | |
| Taxation | | | (1,376 | ) | | | (696 | ) | | | (11 | ) | | | (243 | ) | | | (146 | ) |
| Profit for the period | | | 6,270 | | | | 2,571 | | | | 1,235 | | | | 2,826 | | | | 3,406 | |
| Other comprehensive income for the period, net of tax | | | 135 | | | | (113 | ) | | | (1,506 | ) | | | (338 | ) | | | (1,778 | ) |
| Total comprehensive income for the period | | | 6,405 | | | | 2,458 | | | | (271 | ) | | | 2,488 | | | | 1,628 | |
| Profit attributable to: | | | | | | | | | | | | | | | | | | | | |
| Owners of the Parent | | | 6,240 | | | | 2,556 | | | | 1,233 | | | | 2,825 | | | | 3,499 | |
| Non-controlling interests | | | 30 | | | | 15 | | | | 2 | | | | 1 | | | | (93 | ) |
| Earnings per share | | | | | | | | | | | | | | | | | | | | |
| Basic earnings per $0.25 Ordinary Share | | | $4.95 | | | | $2.04 | | | | $0.98 | | | | $2.23 | | | | $2.77 | |
| Diluted earnings per $0.25 Ordinary Share | | | $4.94 | | | | $2.04 | | | | $0.98 | | | | $2.23 | | | | $2.76 | |
| Dividends | | | $2.85 | | | | $2.80 | | | | $2.80 | | | | $2.80 | | | | $2.80 | |
| Return on revenues | | | | | | | | | | | | | | | | | | | | |
| Operating profit as a percentage of Total Revenue | | | 28.7% | | | | 14.4% | | | | 8.0% | | | | 16.7% | | | | 21.3% | |
| Ratio of earnings to fixed charges | | | 19.9 | | | | 9.9 | | | | 6.1 | | | | 11.3 | | | | 8.9 | |
| | | | | | | | | | | | | | | | | | | | | |
| At 31 December | |
| 2012
$m |
| |
| 2013
$m |
| |
| 2014
$m |
| |
| 2015
Restated $m |
* | |
| 2016
$m |
|
| Statement of Financial Position | | | | | | | | | | | | | | | | | | | | |
| Property, plant and equipment, goodwill and intangible assets | | | 32,435 | | | | 31,846 | | | | 38,541 | | | | 40,859 | | | | 46,092 | |
| Other investments and non-current receivables | | | 940 | | | | 2,513 | | | | 2,138 | | | | 1,896 | | | | 2,070 | |
| Deferred tax assets | | | 1,111 | | | | 1,205 | | | | 1,219 | | | | 1,294 | | | | 1,102 | |
| Current assets | | | 19,048 | | | | 20,335 | | | | 16,697 | | | | 16,007 | | | | 13,262 | |
| Total assets | | | 53,534 | | | | 55,899 | | | | 58,595 | | | | 60,056 | | | | 62,526 | |
| Current liabilities | | | (13,903 | ) | | | (16,051 | ) | | | (17,330 | ) | | | (14,869 | ) | | | (15,256 | ) |
| Non-current liabilities | | | (15,685 | ) | | | (16,595 | ) | | | (21,619 | ) | | | (26,678 | ) | | | (30,601 | ) |
| Net assets | | | 23,946 | | | | 23,253 | | | | 19,646 | | | | 18,509 | | | | 16,669 | |
| Share capital | | | 312 | | | | 315 | | | | 316 | | | | 316 | | | | 316 | |
| Reserves attributable to equity holders of the Company | | | 23,419 | | | | 22,909 | | | | 19,311 | | | | 18,174 | | | | 14,538 | |
| Non-controlling interests | | | 215 | | | | 29 | | | | 19 | | | | 19 | | | | 1,815 | |
| Total equity and reserves | | | 23,946 | | | | 23,253 | | | | 19,646 | | | | 18,509 | | | | 16,669 | |
* 2015 comparatives have been restated to reflect an adjustment to the acquisition accounting for ZS Pharma (see Note 25 from page 173). | |
| For the year ended 31 December | |
| 2012
$m |
| |
| 2013
$m |
| |
| 2014
$m |
| |
| 2015
$m |
| |
| 2016
$m |
|
Cash flows | | | | | | | | | | | | | | | | | | | | |
| Net cash inflow/(outflow) from: | | | | | | | | | | | | | | | | | | | | |
| Operating activities | | | 6,948 | | | | 7,400 | | | | 7,058 | | | | 3,324 | | | | 4,145 | |
| Investing activities | | | (1,859 | ) | | | (2,889 | ) | | | (7,032 | ) | | | (4,239 | ) | | | (3,969 | ) |
| Financing activities | | | (4,923 | ) | | | (3,047 | ) | | | (2,705 | ) | | | 878 | | | | (1,324 | ) |
| | | | 166 | | | | 1,464 | | | | (2,679 | ) | | | (37 | ) | �� | | (1,148 | ) |
For the purpose of computing the ratio of earnings to fixed charges, earnings consist of the income from continuing ordinary activities before taxation of Group companies and income received from companies owned 50% or less, plus fixed charges. Fixed charges consist of interest on all indebtedness, amortisation of debt discount and expense, and that portion of rental expense representative of the interest factor.
| | |
| AstraZenecaAnnual Report and Form 20-F Information 2016 | | 203 |
Additional Information
Development Pipeline
as at 31 December 2016
Includes AstraZeneca sponsored or directed trials only.
Phase III/Pivotal Phase II/Registration
New Molecular Entities (NMEs) and significant additional indications
Regulatory submission dates shown for assets in Phase III and beyond. As disclosure of compound information is balanced by the business need to maintain confidentiality, information in relation to some compounds listed here has not been disclosed at this time.
| | | | | | | | | | | | | | |
| | | | | | | Date
Commenced | | Estimated Regulatory Acceptance Date/Submission Status |
| Compound | | Mechanism | | Area Under Investigation | | Phase | | US | | EU | | Japan | | China |
| Oncology | | | | | | | | | | | | | | |
| Tagrisso | | EGFR inhibitor | | ³2nd line advanced EGFRm | | | | Launched | | Launched | | Launched | | Accepted |
| AURA, AURA2, (AURA17 Asia | | | | T790M NSCLC | | | | (Breakthrough | | (Accelerated | | | | |
| regional) | | | | | | | | Therapy, | | assessment) | | | | |
| | | | | | | | Priority Review, | | | | | | |
| | | | | | | | | Orphan Drug) | | | | | | |
| Tagrisso | | EGFR inhibitor | | ³2nd line advanced EGFRm | | | | Accepted | | Accepted | | | | |
| AURA3 | | | | T790M NSCLC | | | | (Priority | | | | | | |
| | | | | | | | | Review) | | | | | | |
| durvalumab# | | PD-L1 MAb | | ³2nd line advanced bladder | | | | Accepted | | | | | | |
| | | | cancer | | | | (Breakthrough | | | | | | |
| | | | | | | | Therapy & | | | | | | |
| | | | | | | | | Priority Review) | | | | | | |
| acalabrutinib# | | BTK inhibitor | | B-cell malignancy | | Q1 2015 | | H1 2017 | | | | | | |
| | | | | | | | | (Orphan Drug) | | | | | | |
| acalabrutinib# | | BTK inhibitor | | 1st line CLL | | Q3 2015 | | 2020 | | 2020 | | | | |
| | | | | | | | | (Orphan Drug) | | (Orphan Drug) | | | | |
| acalabrutinib# | | BTK inhibitor | | r/r CLL, high risk | | Q4 2015 | | 2020 | | 2020 | | | | |
| | | | | | | | | (Orphan Drug) | | (Orphan Drug) | | | | |
| selumetinib | | MEK inhibitor | | differentiated thyroid cancer | | Q3 2013 | | 2018 | | 2018 | | | | |
| ASTRA | | | | | | | | (Orphan Drug) | | | | | | |
| moxetumomab pasudotox# | | anti-CD22 recombinant | | hairy cell leukaemia | | Q2 2013 | | 2018 | | | | | | |
| PLAIT | | immunotoxin | | | | | | (Orphan Drug) | | | | | | |
durvalumab# PACIFIC | | PD-L1 MAb | | stage III NSCLC | | Q2 2014 | | H2 2017 | | H2 2017 | | H2 2017 | | |
durvalumab#+ tremelimumab ARCTIC | | PD-L1 MAb + CTLA-4 MAb | | 3rd line NSCLC | | Q2 2015 | | H2 2017 | | H2 2017 | | H2 2017 | | |
durvalumab#+ tremelimumab MYSTIC | | PD-L1 MAb + CTLA-4 MAb | | 1st line NSCLC | | Q3 2015 | | H2 2017 | | H2 2017 | | H2 2017 | | |
durvalumab#+ tremelimumab NEPTUNE | | PD-L1 MAb + CTLA-4 MAb | | 1st line NSCLC | | Q4 2015 | | 2019 | | 2019 | | 2019 | | 2020 |
durvalumab#+ tremelimumab KESTREL | | PD-L1 MAb + CTLA-4 MAb | | 1st line HNSCC | | Q4 2015 | | 2018 | | 2018 | | 2018 | | |
durvalumab#+ tremelimumab EAGLE | | PD-L1 MAb + CTLA-4 MAb | | 2nd line HNSCC | | Q4 2015 | | 2018 | | 2018 | | 2018 | | |
durvalumab#+ tremelimumab DANUBE | | PD-L1 MAb + CTLA-4 MAb | | 1st line bladder cancer | | Q4 2015 | | 2018 | | 2018 | | 2018 | | |
| | |
| 204 | | AstraZenecaAnnual Report and Form 20-F Information 2016 |
| | | | | | | | | | | | | | |
| | | | | | | Date
Commenced | | Estimated Regulatory Acceptance Date/Submission Status |
| Compound | | Mechanism | | Area Under Investigation | | Phase | | US | | EU | | Japan | | China |
| Cardiovascular & Metabolic Disease | | | | | | | | | | | | |
| Brilinta1 | | P2Y12 receptor antagonist | | arterial thrombosis | | | | Launched | | Launched | | Approved | | Launched |
| Farxiga2 | | SGLT2 inhibitor | | Type 2 diabetes | | | | Launched | | Launched | | Launched | | Accepted |
| Epanova | | omega-3 carboxylic acids | | severe hypertriglyceridaemia | | | | Approved | | | | 2018 | | |
| ZS-9 (sodium zirconium cyclosilicate) | | potassium binder | | hyperkalaemia | | | | Accepted | | Accepted | | | | |
| roxadustat#OLYMPUS (US) | | hypoxia-inducible factor prolyl | | anaemia in CKD/ESRD | | Q3 2014 | | 2018 | | | | | | Initiated3 |
| ROCKIES (US) | | hydroxylase inhibitor | | | | | | | | | | | | |
| Respiratory | | | | | | | | | | | | | | |
| Bevespi Aerosphere(PT003) | | LABA/LAMA | | COPD | | | | Launched4 | | H1 2017 | | 2018 | | 2018 |
| benralizumab# | | IL-5R MAb | | severe asthma | | | | Accepted | | Accepted | | H1 2017 | | 2020 |
| CALIMA | | | | | | | | | | | | | | |
| SIROCCO | | | | | | | | | | | | | | |
| ZONDA | | | | | | | | | | | | | | |
| BISE | | | | | | | | | | | | | | |
BORA GREGALE | | | | | | | | | | | | | | |
| benralizumab# | | IL-5R MAb | | COPD | | Q3 2014 | | 2018 | | 2018 | | 2019 | | |
| TERRANOVA | | | | | | | | | | | | | | |
| GALATHEA | | | | | | | | | | | | | | |
| PT010 | | LABA/LAMA/ICS | | COPD | | Q3 2015 | | 2018 | | 2018 | | 2018 | | 2019 |
| tralokinumab | | IL-13 MAb | | severe asthma | | Q3 2014 | | 2018 | | 2018 | | 2018 | | |
| STRATOS 1,2 | | | | | | | | | | | | | | |
| TROPOS | | | | | | | | | | | | | | |
| MESOS | | | | | | | | | | | | | | |
| Other | | | | | | | | | | | | | | |
| anifrolumab# | | IFN-alphaR MAb | | systemic lupus erythematosus | | Q3 2015 | | 2019 (Fast Track) | | 2019 | | 2019 | | |
| TULIP | | | | | | | | | | | | | | |
| AZD3293# | | beta-secretase inhibitor | | Alzheimer’s disease | | Q2 2016 | | 2020 | | 2020 | | 2020 | | |
| AMARANTH | | | | | | | | (Fast Track) | | | | | | |
| DAYBREAK-ALZ | | | | | | | | | | | | | | |
| 1 | Brilinta in the US and Japan;Brilique in ROW. |
| 2 | Farxiga in the US;Forxiga in ROW. |
| 3 | Rolling New Drug Application (NDA) regulatory submission initiated in Q4 2016. |
| 4 | Bevespi Aerosphere (glycopyrrolate and formoterol fumarate) inhalation aerosol was launched commercially in the US in January 2017. |

| | |
| AstraZenecaAnnual Report and Form 20-F Information 2016 | | 205 |
Additional Information
Development Pipelinecontinued
Phases I and II
NMEs and significant additional indications
| | | | | | | | | | | | |
| Compound | | Mechanism | | Area Under Investigation | | Phase | | | Date
Commenced
Phase | |
| Oncology | | | | | | | | | | | | |
| durvalumab# | | PD-L1 MAb | | solid tumours | | | II | | | | Q3 2014 | |
| durvalumab#+ tremelimumab | | PD-L1 MAb + CTLA-4 MAb | | hepatocellular carcinoma (liver cancer) | | | II | | | | Q4 2016 | |
| durvalumab#+ tremelimumab | | PD-L1 MAb + CTLA-4 MAb | | gastric cancer | | | II | | | | Q2 2015 | |
| durvalumab#+ AZD5069 | | PD-L1 MAb + CXCR2 | | HNSCC | | | II | | | | Q3 2015 | |
| durvalumab#+ AZD9150# | | PD-L1 MAb + STAT3 inhibitor | | | |
| durvalumab#+ dabrafenib + trametinib | | PD-L1 MAb + BRAF inhibitor + MEK inhibitor | | melanoma | | | II | | | | Q1 2014 | |
| durvalumab#+ AZD1775# | | PD-L1 MAb + Wee1 inhibitor | | solid tumours | | | I | | | | Q4 2015 | |
| durvalumab#+ MEDI0680 | | PD-L1 MAb + PD-1 MAb | | solid tumours | | | I | | | | Q3 2016 | |
durvalumab#or durvalumab#+ (tremelimumab or AZD9150#) | | PD-L1 MAb or PD-L1 MAb + (CTLA-4 MAb or STAT3 inhibitor) | | diffuse large B-cell lymphoma | | | I | | | | Q3 2016 | |
| durvalumab#+Iressa | | PD-L1 MAb + EGFR inhibitor | | NSCLC | | | I | | | | Q2 2014 | |
| durvalumab#+ MEDI0562# | | PD-L1 MAb + humanised OX40 agonist | | solid tumours | | | I | | | | Q2 2016 | |
| durvalumab#+ MEDI9447 | | PD-L1 MAb + CD73 MAb | | solid tumours | | | I | | | | Q1 2016 | |
| durvalumab#+ monalizumab | | PD-L1 MAb + NKG2a MAb | | solid tumours | | | I | | | | Q1 2016 | |
| durvalumab#+ selumetinib | | PD-L1 MAb + MEK inhibitor | | solid tumours | | | I | | | | Q4 2015 | |
| durvalumab#+ tremelimumab | | PD-L1 MAb + CTLA-4 MAb | | solid tumours | | | I | | | | Q4 2013 | |
| tremelimumab + MEDI0562# | | CTLA-4 MAb + humanised OX40 agonist | | solid tumours | | | I | | | | Q2 2016 | |
| Lynparza + AZD6738 | | PARP inhibitor + ATR inhibitor | | gastric cancer | | | II | | | | Q3 2016 | |
| Lynparza + AZD1775# | | PARP inhibitor + Wee1 inhibitor | | solid tumours | | | I | | | | Q3 2015 | |
| savolitinib# | | MET inhibitor | | papillary renal cell carcinoma | | | II | | | | Q2 2014 | |
Tagrisso + (selumetinib#or savolitinib#) TATTON | | EGFR inhibitor + (MEK inhibitor or MET inhibitor) | | advanced EGFRm NSCLC | | | II | | | | Q2 2016 | |
| Tagrisso BLOOM | | EGFR inhibitor | | CNS metastases in advanced EGFRm NSCLC | | | II | | | | Q4 2015 | |
| AZD1775#+ chemotherapy | | Wee1 inhibitor + chemotherapy | | ovarian cancer | | | II | | | | Q4 2012 | |
| AZD1775# | | Wee1 inhibitor | | solid tumours | | | II | | | | Q1 2016 | |
| vistusertib (AZD2014) | | mTOR inhibitor | | solid tumours | | | II | | | | Q1 2013 | |
| AZD5363# | | AKT inhibitor | | breast cancer | | | II | | | | Q1 2014 | |
| AZD4547 | | FGFR inhibitor | | solid tumours | | | II | | | | Q4 2011 | |
| MEDI-573# | | IGF MAb | | metastatic breast cancer | | | II | | | | Q2 2012 | |
| AZD0156 | | ATM inhibitor | | solid tumours | | | I | | | | Q4 2015 | |
| AZD2811# | | Aurora B inhibitor | | solid tumours | | | I | | | | Q4 2015 | |
| AZD4635 | | A2aR inhibitor | | solid tumours | | | I | | | | Q2 2016 | |
| AZD6738 | | ATR inhibitor | | solid tumours | | | I | | | | Q4 2013 | |
| AZD8186 | | PI3k inhibitor | | solid tumours | | | I | | | | Q2 2013 | |
| AZD9150# | | STAT3 inhibitor | | haematological malignancies | | | I | | | | Q1 2012 | |
| AZD9496 | | selective oestrogen receptor downregulator (SERD) | | ER + breast cancer | | | I | | | | Q4 2014 | |
| MEDI-565# | | CEA BiTE MAb | | solid tumours | | | I | | | | Q1 2011 | |
| MEDI0562# | | humanised OX40 agonist | | solid tumours | | | I | | | | Q1 2015 | |
| MEDI0680 | | PD-1 MAb | | solid tumours | | | I | | | | Q4 2013 | |
| MEDI1873 | | GITR agonist fusion protein | | solid tumours | | | I | | | | Q4 2015 | |
| MEDI4276 | | HER2 bispecific ADC MAb | | solid tumours | | | I | | | | Q4 2015 | |
| MEDI9197# | | TLR 7/8 agonist | | solid tumours | | | I | | | | Q4 2015 | |
| MEDI9447 | | CD73 MAb | | solid tumours | | | I | | | | Q3 2015 | |
| Cardiovascular & Metabolic Disease | | | | | | | | | | | | |
| MEDI0382 | | GLP-1/glucagon dual agonist | | diabetes/obesity | | | II | | | | Q3 2016 | |
| MEDI4166 | | PCSK9/GLP-1 MAb + peptide fusion | | diabetes/cardiovascular | | | II | | | | Q1 2016 | |
| MEDI6012 | | LCAT | | ACS | | | II | | | | Q4 2015 | |
| AZD4076 | | anti-miR103/107 oligonucleotide | | non-alcoholic fatty liver disease/non-alcoholic steatohepatitis (NASH) | | | II | | | | Q4 2016 | |
| AZD4831 | | myeloperoxidase | | heart failure with a preserved ejection fraction | | | I | | | | Q3 2016 | |
| AZD5718 | | FLAP | | CAD | | | I | | | | Q1 2016 | |
| AZD8601# | | VEGF-A | | cardiovascular | | | I | | | | Q1 2017 | |
| MEDI8111 | | Rh-factor II | | trauma/bleeding | | | I | | | | Q1 2014 | |
| | |
| 206 | | AstraZenecaAnnual Report and Form 20-F Information 2016 |
| | | | | | | | | | | | |
| Compound | | Mechanism | | Area Under Investigation | | Phase | | | Date Commenced Phase | |
| Respiratory | | | | | | | | | | | | |
| tezepelumab# | | TSLP MAb | | asthma/atopic dermatitis | | | II | | | | Q2 2014 | |
| abediterol# | | LABA | | asthma/COPD | | | II | | | | Q4 2007 | |
| AZD7594 | | inhaled SGRM | | asthma/COPD | | | II | | | | Q3 2015 | |
| AZD9412# | | inhaled interferon beta | | asthma/COPD | | | II | | | | Q3 2015 | |
| PT010 | | LABA/LAMA/ICS | | asthma | | | II | | | | Q2 2014 | |
| AZD1419# | | TLR9 agonist | | asthma | | | II | | | | Q4 2016 | |
| AZD8871# | | MABA | | COPD | | | II | | | | Q1 2017 | |
| AZD0284 | | inhaled RORg | | psoriasis | | | I | | | | Q4 2016 | |
| AZD5634 | | inhaled ENaC | | cystic fibrosis | | | I | | | | Q1 2016 | |
| AZD7594 + abediterol# | | inhaled SGRM + LABA | | asthma/COPD | | | I | | | | Q4 2016 | |
| AZD7986# | | DPP1 | | COPD | | | I | | | | Q4 2014 | |
| AZD9567 | | oral SGRM | | rheumatoid arthritis | | | I | | | | Q4 2015 | |
| Other | | | | | | | | | | | | |
| anifrolumab# | | IFN-alphaR MAb | | lupus nephritis | | | II | | | | Q4 2015 | |
| anifrolumab# | | IFN-alphaR MAb | | systemic lupus erythematosus (subcutaneous) | | | I | | | | Q4 2015 | |
| inebilizumab# | | CD19 MAb | | neuromyelitis optica | | | II | | |
| Q1 2015
(Orphan Drug |
) |
| mavrilimumab# | | GM-CSFR MAb | | rheumatoid arthritis | | | II | | | | Q1 2010 | |
| verinurad1 | | selective uric acid reabsorption | | chronic treatment of hyperuricemia | | | II | | | | Q3 2013 | |
| | | inhibitor (URAT-1) | | in patients with gout | | | | | | | | |
| MEDI5872# | | B7RP1 MAb | | primary Sjögren’s syndrome | | | II | | | | Q3 2016 | |
| AZD3241 | | myeloperoxidase inhibitor | | multiple system atrophy | | | II | | | | Q2 2015 | |
| | | | | | | | | | | | (Orphan Drug | ) |
| MEDI3902 | | Psl/PcrV bispecific MAb | | prevention of nosocomial pseudomonas pneumonia | | | II | | |
| Q2 2016
(Fast Track, US |
) |
| MEDI4893 | | MAb binding to S. aureus toxin | | hospital-acquired pneumonia/seriousS. aureus infection | | | II | | |
| Q4 2014
(Fast Track, US |
) |
| MEDI8852 | | influenza A MAb | | influenza A treatment | | | II | | |
| Q4 2015
(Fast Track, US |
) |
| MEDI8897# | | RSV MAb-YTE | | passive RSV prophylaxis | | | II | | |
| Q1 2015
(Fast Track, US |
) |
| MEDI0700# | | BAFF/B7RP1 bispecific MAb | | systemic lupus erythematosus | | | I | | | | Q1 2016 | |
| MEDI1814#2 | | amyloid beta MAb | | Alzheimer’s disease | | | I | | | | Q2 2014 | |
| MEDI4920 | | anti-CD40L-Tn3 fusion protein | | primary Sjögren’s syndrome | | | I | | | | Q2 2014 | |
| MEDI7352 | | NGF/TNF bispecific MAb | | osteoarthritis pain | | | I | | | | Q1 2016 | |
| MEDI7734 | | ILT7 MAb | | myositis | | | I | | | | Q3 2016 | |
| MEDI9314 | | IL-4R MAb | | atopic dermatitis | | | I | | | | Q1 2016 | |
| 1 | Planning to initiate a programme for CKD. |
| 2 | Co-development collaboration with Lilly for MEDI1814. |

| | |
| AstraZenecaAnnual Report and Form 20-F Information 2016 | | 207 |
Additional Information
Development Pipelinecontinued
Significant Life-Cycle Management
| | | | | | | | | | | | | | | | | | | | | | | | |
| | | | | | | Date
Commenced | | | Estimated Regulatory Acceptance Date/Submission Status | |
| Compound | | Mechanism | | Area Under Investigation | | Phase | | | US | | | EU | | | Japan | | | China | |
| Oncology | | | | | | | | | | | | | | | | | | | | | | | | |
Faslodex FALCON | | oestrogen receptor antagonist | | 1st line hormone receptor +ve advanced breast cancer | | | | | | | Accepted | | | | Accepted | | | | Accepted | | | | H2 2017 | |
| Lynparza OlympiAD | | PARP inhibitor | | gBRCA metastatic breast cancer | | | Q2 2014 | | | | H2 2017 | | | | H2 2017 | | | | H2 2017 | | | | | |
Lynparza SOLO-2 | | PARP inhibitor | | 2nd line or greater BRCAm PSR ovarian cancer, maintenance monotherapy | | | Q3 2013 | | |
| H1 2017
(Fast Track |
) | | | H1 2017 | | | | H2 2017 | | | | | |
Lynparza SOLO-1 | | PARP inhibitor | | 1st line BRCAm ovarian cancer | | | Q3 2013 | | | | 2018 | | | | 2018 | | | | 2018 | | | | | |
Lynparza SOLO-3 | | PARP inhibitor | | gBRCA PSR ovarian cancer | | | Q1 2015 | | | | 2018 | | | | | | | | | | | | | |
Lynparza POLO | | PARP inhibitor | | pancreatic cancer | | | Q1 2015 | | | | 2018 | | | | 2018 | | | | | | | | | |
| Lynparza | | PARP inhibitor | | prostate cancer | | | Q3 2014 | | |
| (Breakthrough
Therapy |
) | | | | | | | | | | | | |
Lynparza OlympiA | | PARP inhibitor | | gBRCA adjuvant breast cancer | | | Q2 2014 | | | | 2020 | | | | 2020 | | | | 2020 | | | | | |
Tagrisso FLAURA | | EGFR inhibitor | | 1st line advanced EGFRm NSCLC | | | Q1 2015 | | | | H2 2017 | | | | H2 2017 | | | | H2 2017 | | | | H2 2017 | |
Tagrisso ADAURA | | EGFR inhibitor | | adjuvant EGFRm NSCLC | | | Q4 2015 | | | | 2022 | | | | 2022 | | | | 2022 | | | | 2022 | |
| Cardiovascular & Metabolic Disease | | | | | | | | | | | | | | | | | | | | | | |
Brilinta1 PEGASUS-TIMI 54 | | P2Y12 receptor antagonist | | outcomes trial in patients with prior myocardial infarction | | | | | |
| Launched
(Priority Review |
) | | | Launched | | | | Approved | | | | Accepted | |
Brilinta1 THEMIS | | P2Y12 receptor antagonist | | outcomes trial in patients with Type 2 diabetes and CAD, but without a previous history of myocardial infarction or stroke | | | Q1 2014 | | | | 2018 | | | | 2018 | | | | 2018 | | | | 2019 | |
Brilinta1 HESTIA | | P2Y12 receptor antagonist | | prevention of vaso-occlusive crises in paediatric patients with sickle cell disease | | | Q1 2014 | | | | 2020 | | | | 2020 | | | | | | | | | |
Onglyza SAVOR-TIMI 53 | | DPP-4 inhibitor | | Type 2 diabetes outcomes trial | | | | | | | Launched | | | | Launched | | | | | | | | Accepted | |
| Kombiglyze XR/Komboglyze2 | | DPP-4 inhibitor/metformin FDC | | Type 2 diabetes | | | | | | | Launched | | | | Launched | | | | | | | | Accepted | |
Farxiga3 DECLARE-TIMI 58 | | SGLT2 inhibitor | | Type 2 diabetes outcomes trial | | | Q2 2013 | | | | 2020 | | | | 2020 | | | | | | | | | |
| Farxiga3 | | SGLT2 inhibitor | | Type 1 diabetes | | | Q4 2014 | | | | 2018 | | | | 2018 | | | | 2018 | | | | | |
| Xigduo XR/Xigduo4 | | SGLT2 inhibitor/metformin FDC | | Type 2 diabetes | | | | | | | Launched | | | | Launched | | | | | | | | | |
Qtern (saxagliptin/
dapagliflozin FDC) | | DPP-4 inhibitor/ SGLT2 inhibitor FDC | | Type 2 diabetes | | | | | | | Accepted | | | | Approved | | | | | | | | | |
| Bydureon weekly suspension | | GLP-1 receptor agonist | | Type 2 diabetes | | | Q1 2013 | | | | H1 2017 | | | | H2 2017 | | | | | | | | | |
| Bydureon EXSCEL | | GLP-1 receptor agonist | | Type 2 diabetes outcomes trial | | | Q2 2010 | | | | 2018 | | | | 2018 | | | | | | | | 2018 | |
Epanova STRENGTH | | omega-3 carboxylic acids | | outcomes trial in statin-treated patients at high CV risk, with persistent hypertriglyceridaemia plus low HDL-cholesterol | | | Q4 2014 | | | | 2020 | | | | 2020 | | | | 2020 | | | | 2020 | |
| Respiratory | | | | | | | | | | | | | | | | | | | | | | |
Symbicort SYGMA | | ICS/LABA | | as-needed use in mild asthma | | | Q4 2014 | | | | | | | | 2018 | | | | | | | | 2019 | |
| Symbicort | | ICS/LABA | | breath actuated inhaler asthma/COPD | | | | | | | 2018 | | | | | | | | | | | | | |
| Duaklir Genuair# | | LAMA/LABA | | COPD | | | | | | | 2018 | | | | Launched | | | | | | | | 2019 | |
| Other | | | | | | | | | | | | | | | | | | | | | | |
| Nexium | | proton pump inhibitor | | stress ulcer prophylaxis | | | | | | | | | | | | | | | | | | | Submitted | |
| Nexium | | proton pump inhibitor | | paediatrics | | | | | | | Launched | | | | Launched | | | | Accepted | | | | | |
| linaclotide# | | GC-C receptor peptide agonist | | irritable bowel syndrome with constipation (IBS-C) | | | | | | | | | | | | | | | | | | | Accepted | |
| 1 | Brilinta in the US and Japan;Brilique in ROW. |
| 2 | Kombiglyze XR in the US;Komboglyze in the EU. |
| 3 | Farxiga in the US;Forxiga in ROW. |
| 4 | Xigduo XR in the US;Xigduo in the EU. |
| | |
| 208 | | AstraZenecaAnnual Report and Form 20-F Information 2016 |
| | | | | | |
| Terminations | | | | | | |
| NME/Line Extension | | Compound | | Reason for Discontinuation | | Area Under Investigation |
| LCM | | inebilizumab#(MEDI-551) + rituximab | | Safety/efficacy | | haematological malignancies |
| NME | | AZD5312# | | Safety/efficacy | | solid tumours |
| NME | | AZD8835 | | Safety/efficacy | | solid tumour |
| NME | | tremelimumab¶ | | Safety/efficacy | | mesothelioma 2nd/3rd line |
| | | DETERMINE | | | | |
| LCM | | Tagrisso + durvalumab | | Safety/efficacy | | ³2nd line advanced EGFRm T790M |
| | | CAURAL | | | | NSCLC |
| NME | | abrilumab# | | Strategic | | Crohn’s disease/ulcerative colitis |
| NME | | AZD8999 | | Strategic | | COPD |
| LCM | | Brilinta/Brilique SOCRATES | | Safety/efficacy | | outcomes trial in patients with stroke or TIA |
| NME | | MEDI7836 | | Safety/efficacy | | asthma |
| NME | | MEDI6383# | | Strategic | | solid tumours |
| NME | | durvalumab#+ MEDI6383# | | Strategic | | solid tumours |
| NME | | MEDI0639 | | Safety/efficacy | | solid tumours |
| LCM | | Epanova/Farxiga | | Safety/efficacy | | non-alcoholic fatty liver disease/ |
| | | | | | | non-alcoholic steatohepatitis (NASH) |
| LCM | | Lynparza GOLD | | Safety/efficacy | | 2nd line gastric cancer |
| NME | | AZD7624 | | Safety/efficacy | | COPD |
| LCM | | Brilinta EUCLID | | Safety/efficacy | | peripheral artery disease |
| NME | | inebilizumab | | Safety/efficacy | | diffuse large B-cell lymphoma |
| NME | | MEDI3617# | | Safety/efficacy | | solid tumours |
| NME | | cediranib ICON 6 | | Regulatory | | PSR ovarian cancer |
| NME | | selumetinib# | | Safety/efficacy | | 2nd line KRASm NSCLC |
| | | SELECT-1 | | | | |
| NME | | durvalumab#+ tremelimumab | | Safety/efficacy | | metastatic pancreatic ductal carcinoma |
| | | ALPS¶ | | | | |
| NME | | MEDI7510 | | Safety/efficacy | | prevention of RSV disease in older patients |
| ¶ | Registrational Phase II trial. |
| # | Partnered and/or in collaboration. |
| | |
| AstraZenecaAnnual Report and Form 20-F Information 2016 | | 209 |
Additional Information
Development Pipelinecontinued
Completed Projects/Divestitures
| | | | | | | | | | | | | | | | | | | | | | | | |
| | | | | | | Completed/ | | | Estimated Regulatory Submission Acceptance† | |
| Compound | | Mechanism | | Area Under Investigation | | Divested | | | US | | | EU | | | Japan | | | China | |
| Diprivan#1 | | sedative and anaesthetic | | conscious sedation | | | Divested | | | | N/A | | | | Launched | | | | Accepted | | | | Launched | |
| Zurampic2 | | selective uric acid reabsorption inhibitor (URAT-1) | | chronic treatment of hyperuricemia in patients with gout | |
| Completed/
Divested |
| | | Launched | | | | Approved | | | | N/A | | | | N/A | |
| Zurampic + allopurinol FDC2 | | selective uric acid reabsorption inhibitor (URAT-1) + xanthine oxidase inhibitor FDC | | chronic treatment of hyperuricemia in patients with gout | | | Divested | | | | | | | | | | | | | | | | | |
| MEDI-550 | | pandemic influenza virus vaccine | | pandemic influenza prophylaxis | | | Completed | | | | N/A | | | | Approved | | | | N/A | | | | N/A | |
| tralokinumab3 | | IL-13 MAb | | atopic dermatitis | | | Divested | | | | | | | | | | | | | | | | | |
brodalumab4 AMAGINE-1,2,3 | | IL-17R MAb | | psoriasis | | | Divested | | | | | | | | | | | | | | | | | |
| MEDI2070#5 | | IL-23 MAb | | Crohn’s disease | | | Divested | | | | | | | | | | | | | | | | | |
| Zinforo#6 | | extended spectrum | | pneumonia/skin infections | | | Divested | | | | N/A | | | | Launched | | | | N/A | | | | Submitted | |
| | | cephalosporin with affinity to penicillin-binding proteins | | | | | | | | | | | | | | | | | | | | | | |
| Zavicefta#6 | | cephalosporin/beta lactamase | | hospital-acquired pneumonia/ | | | Divested | | | | N/A | | | | Approved | | | | N/A | | | | | |
| (CAZ AVI) | | inhibitor | | ventilator-associated pneumonia | | | | | | | | | | | | | | | | | | | | |
Zavicefta#6 (CAZ AVI) | | cephalosporin/beta lactamase inhibitor | | serious infections, complicated intra-abdominal infection, complicated urinary tract infection | | | Divested | | | | N/A | | | | Approved | | | | N/A | | | | | |
| ATM AVI#6 | | monobactam/beta lactamase inhibitor | | targeted serious bacterial infections | | | Divested | | | | | | | | | | | | | | | | | |
| CXL#6 | | beta lactamase inhibitor/ cephalosporin | | methicillin-resistantS. aureus | | | Divested | | | | | | | | | | | | | | | | | |
| AZD8108 | | NMDA antagonist | | suicidal ideation | | | Divested | | | | | | | | | | | | | | | | | |
durvalumab# HAWK¶7 | | PD-L1 MAb | | 2nd line HNSCC (PD-L1 positive) | | | Completed | | | | N/A | | | | N/A | | | | N/A | | | | N/A | |
| durvalumab#+ tremelimumab CONDOR¶7 | | PD-L1 MAb + CTLA-4 MAb | | 2nd line HNSCC (PD-L1 negative) | | | Completed | | | | N/A | | | | N/A | | | | N/A | | | | N/A | |
| # | Partnered and/or in collaboration. |
| † | US and EU dates correspond to anticipated acceptance of the regulatory submission. |
| ¶ | Registrational Phase II trial. |
| 1 | AstraZeneca announced it entered into a commercialisation agreement with Aspen Global Incorporated (AGI), part of the Aspen Group, for its global anaesthetics portfolio outside of the US on 9 June 2016. |
| 2 | AstraZeneca has granted Ironwood Pharmaceuticals, Inc. exclusive US rights (26 April 2016) and Grünenthal GmbH exclusive rights in Europe and Latin America (2 June 2016).Zurampic launched in US on 3 October 2016. |
| 3 | AstraZeneca entered into a licensing agreement with LEO Pharma (1 July 2016, completed on 16 August 2016). |
| 4 | AstraZeneca and Valeant agreed to terminate the licence for Valeant’s right to develop and commercialise brodalumab in Europe. AstraZeneca entered into an agreement with LEO Pharma for the exclusive licence to brodalumab in Europe (1 July 2016). |
| 5 | AstraZeneca licensing agreement with Allergan. |
| 6 | AstraZeneca completed transaction with Pfizer to sell the commercialisation and development rights to its late-stage, small molecule antibiotics business in most markets globally outside the US. |
| 7 | Registrational studies now complete (data will contribute towards subsequent HNSCC regulatory submissions). |
| | |
| 210 | | AstraZenecaAnnual Report and Form 20-F Information 2016 |
|
Patent Expiries of Key Marketed Products |
Patents covering our products are or may be challenged by third parties. Generic products may be launched ‘at risk’ and our patents may be revoked, circumvented or found not to be infringed. For more information, please see Risk from page 214. Many of our products are subject to challenges by third parties. Details of material challenges by third parties can be found in Note 28 to the Financial Statements from page 185. The expiry dates shown below include granted SPC/PTE and/or Paediatric Exclusivity periods (as appropriate), but do not include projected expiry dates based on pending applications for these exclusivities unless asterisked. (In Europe, the exact SPC situation may vary by country as different Patent Offices grant SPCs at different rates.) Expiry dates in red relate to new chemical entity or antibody patents, the remaining dates relate to other patents. A number of our products are subject to generic competition in one or more markets. Further information can be found in the Geographical Review from page 226.
| | | | | | | | | | | | | | | | | | | | | | | | | | | | | | | | | | | | | | | | | | | | | | |
| | | | | | | | | | | | | | | | | | | | |
| US
Product Sales |
| | | | | |
| Aggregate Revenue for
China, Japan and Europe2 Product Sales |
|
| Key marketed | | | | | | | | | | | | | | | | | | | | | | | | | | | | | ($m) | | | | | | | | | | | | | | | | ($m) | |
| products | | Description | | | US | | | | China | | | | EU | 1 | | | Japan | | | | 2016 | | | | 2015 | | | | 2014 | | | | | | | | 2016 | | | | 2015 | | | | 2014 | |
| Atacand3 | | An angiotensin II antagonist for the 1st line treatment of hypertension and symptomatic heart failure | | | expired | | | | 4 | | | | expired | | | | 4 | | | | 36 | | | | 34 | | | | 44 | | | | | | | | 97 | | | | 106 | | | | 169 | |
| Brilinta/Brilique | | An oral P2Y12 platelet inhibitor for acute coronary syndromes (ACS) or extended therapy in high-risk patients with a history of myocardial infarction (MI) | |
| 2018-2019,
2024*,
2021-2030 |
| |
| 2018-2019,
2021 |
| |
| 2018-2024,
20215 |
| |
| 2018-2019,
2024*,
2021-2027 |
| | | 348 | | | | 240 | | | | 146 | | | | | | | | 347 | | | | 268 | | | | 245 | |
| Bydureon | | A once-weekly injectable glucagon-like peptide-1 (GLP-1) receptor agonist available as a single-dose tray or a single-dose pen indicated to improve glycaemic control, in adults with Type 2 diabetes | | | 2018-2028 | | | | 2020-2028 | | | | 2017-2028 | | | | 2018-2028 | | | | 463 | | | | 482 | | | | 374 | | | | | | | | 109 | | | | 90 | | | | 62 | |
| Byetta | | A twice-daily injectable GLP-1 receptor agonist indicated to improve glycaemic control in adults with Type 2 diabetes | | | 2017-2020 | | | | 2020 | | | | 2017-2021 | | | | 2018-2020 | | | | 164 | | | | 209 | | | | 199 | | | | | | | | 62 | | | | 86 | | | | 107 | |
| Crestor | | A statin for dyslipidaemia and hypercholesterolaemia | | | 2018-20226 | | | | 2020-2021 | | | | 2017, 2020 | | |
| 2017,
2021-2023 |
| | | 1,223 | | | | 2,844 | | | | 2,918 | | | | | | | | 1,698 | | | | 1,642 | | | | 1,931 | |
| Daliresp/Daxas | | An oral PDE4 (phosphodiesterase-4) inhibitor for adults with severe COPD to decrease their number of exacerbations (US only) | |
| 2020,
2023-2024 |
| | | 2023 | | | | 20197, 2023 | | | | 2023 | | | | 134 | | | | 104 | | | | – | | | | | | | | 15 | | | | – | | | | – | |
| Duaklir | | A fixed-dose combination of a long-acting muscarinic antagonist (LAMA) and a long-acting beta2-adrenergic receptor agonist (LABA) for the maintenance treatment of COPD | |
| 2020, 2025*,
2022-20278 |
| |
| 2020,
2022-2027 |
| |
| 2025,
2022-2029 |
| |
| 2025,
2021-2029 |
| | | – | | | | – | | | | – | | | | | | | | 62 | | | | 26 | | | | – | |
| Faslodex | | An injectable estrogen receptor antagonist. It is used for the treatment of hormone receptor positive advanced breast cancer for post-menopausal women whose disease has progressed following treatment with prior endocrine therapy | | | 20219 | | | | | | | | 2021 | | | | 2026 | | | | 438 | | | | 356 | | | | 340 | | | | | | | | 311 | | | | 269 | | | | 305 | |
| Farxiga/Forxiga | | A selective inhibitor of human sodium-glucose co-transporter 2 (SGLT2 inhibitor) indicated as an adjunct to diet and exercise to improve glycaemic control in adult patients with Type 2 diabetes | | | 2020,2026* | | |
| 2020-2023,
2028 |
| | | 2020-2028* | | |
| 2020-2025,
2028 |
| | | 358 | | | | 229 | | | | 120 | | | | | | | | 175 | | | | 121 | | | | 66 | |

| | |
| AstraZenecaAnnual Report and Form 20-F Information 2016 | | 211 |
Additional Information
Patent Expiries of Key Marketed Productscontinued
| | | | | | | | | | | | | | | | | | | | | | | | | | | | | | | | | | | | | | | | | | | | | | |
| | | | | | | | | | | | | | | | | | | | |
| US
Product Sales |
| | | | | |
| Aggregate Revenue for
China, Japan and Europe2 Product Sales |
|
| Key marketed | | | | | | | | | | | | | | | | | | | | | | | | | | | | | ($m) | | | | | | | | | | | | | | | | ($m) | |
| products | | Description | | | US | | | | China | | | | EU | 1 | | | Japan | | | | 2016 | | | | 2015 | | | | 2014 | | | | | | | | 2016 | | | | 2015 | | | | 2014 | |
| Iressa | | An epidermal growth factor receptor-tyrosine kinase inhibitor (EGFR-TKI) that acts to block signals for cancer cell growth and survival in advanced non-small cell lung cancer (NSCLC) | | | 201710 | | | | 2023 | | | | 201911, 2023 | | | | 2018, 2023 | | | | 23 | | | | 6 | | | | – | | | | | | | | 358 | | | | 396 | | | | 467 | |
| Kombiglyze XR | | Combines saxagliptin(Onglyza) and extended release metformin (metformin XR) in a once-daily tablet for Type 2 diabetes | |
| 2021-2023,
2025 |
| | | 2021, 2025 | | |
| 2021-2026,
2025 |
| | | | | | | 145 | | | | 154 | | | | 159 | | | | | | | | – | | | | – | | | | – | |
| Komboglyze | | Combines saxagliptin(Onglyza) and metformin immediate release (metformin IR) in a twice-daily tablet for Type 2 diabetes | | | 8 | | | | 2021, 2025 | | |
| 2021-2026,
2025 |
| | | | | | | – | | | | – | | | | – | | | | | | | | 49 | | | | 48 | | | | 40 | |
| Lynparza | | An oral poly ADP-ribose polymerase (PARP) inhibitor currently only approved as a capsule formulation. It is approved in the EU for the treatment of adult patients with platinum-sensitive relapsed BRCA-mutated (germline and/or somatic) high-grade serous epithelial ovarian, fallopian tube or primary peritoneal cancer. It is approved in the US for the treatment of patients with germline BRCA-mutated advanced ovarian cancer who have been treated with three or more prior lines of chemotherapy | |
| 2022-2024,
2028*,
2024-2031 |
| |
| 2021-2024,
2024-2027 |
| |
| 2021-2029,
2024-2027 |
| |
| 2021-2024,
2024-2027 |
| | | 127 | | | | 70 | | | | – | | | | | | | | 81 | | | | 23 | | | | – | |
| Movantik/Moventig | | A once-daily, peripherally-acting mu-opioid receptor antagonist approved for the treatment of opioid-induced constipation (OIC) in adult patients. The indication varies by jurisdiction | |
| 2022-2027,
2028*, 2032 |
| | | 2024 | | |
| 2022-2024,
2029*14 |
| | | 2022-2024 | | | | 90 | | | | 28 | | | | – | | | | | | | | – | | | | – | | | | – | |
| Nexium | | A proton pump inhibitor used to treat acid-related diseases | | | 2018-202015 | | | | 2018-2019 | | | | 2018 | | |
| 2018,
2018-2019 |
| | | 526 | | | | 870 | | | | 1,821 | | | | | | | | 975 | | | | 985 | | | | 1,015 | |
| Onglyza | | An oral dipeptidyl peptidase 4 (DPP-4) inhibitor for Type 2 diabetes | |
| 2021-2024*,
2018-2028 |
| | | 2021, 2025 | | |
| 2021-2025*,
2025 |
| | | 12 | | | | 231 | | | | 266 | | | | 322 | | | | | | | | 119 | | | | 124 | | | | 129 | |
| Pulmicort | | An inhaled corticosteroid for maintenance treatment of asthma | | | 2018-201916 | | | | 201817 | | | | 201817 | | | | 201817 | | | | 174 | | | | 200 | | | | 211 | | | | | | | | 732 | | | | 662 | | | | 574 | |
| Seloken/Toprol-XL | | A beta-blocker once-daily tablet for control of hypertension, heart failure and angina | | | expired | | | | expired | | | | expired | | | | expired | | | | 95 | | | | 89 | | | | 91 | | | | | | | | 462 | | | | 436 | | | | 438 | |
| | |
| 212 | | AstraZenecaAnnual Report and Form 20-F Information 2016 |
| | | | | | | | | | | | | | | | | | | | | | | | | | | | | | | | | | | | | | | | | | |
| | | | | | | | | | | | | | | | | | | | |
| US
Product Sales |
| |
| Aggregate Revenue for
China, Japan and Europe2 Product Sales |
|
| Key marketed | | | | | | | | | | | | | | | | | | | | | | | | | | | | | ($m) | | | | | | | | | | | | ($m) | |
| products | | Description | | | US | | | | China | | | | EU | 1 | | | Japan | | | | 2016 | | | | 2015 | | | | 2014 | | | | 2016 | | | | 2015 | | | | 2014 | |
| Seroquel XR | | Generally approved for the treatment of schizophrenia, bipolar disorder, major depressive disorder and, on a more limited basis, for generalised anxiety disorder | | | 201718 | | | | 2017 | | | | 2017 | | | | 19 | | | | 515 | | | | 716 | | | | 738 | | | | 134 | | | | 201 | | | | 342 | |
| Symbicort | | A combination of an inhaled corticosteroid and a fast onset LABA for maintenance treatment of asthma and COPD | | | 2017-202920 | | | | 201821 | | | | 2018-201921 | | | | 2017-202021 | | | | 1,242 | | | | 1,520 | | | | 1,511 | | | | 1,276 | | | | 1,375 | | | | 1,756 | |
| Synagis | | A humanised MAb used to prevent serious lower respiratory tract disease caused by respiratory syncytial virus (RSV) in paediatric patients at high risk of acquiring RSV disease | | | 2023 | | | | | | | | 2023 | | | | 2023 | | | | 325 | | | | 285 | | | | 499 | | | | 352 | | | | 377 | | | | 401 | |
| Tagrisso | | An EGFR-TKI indicated for patients with metastatic EGFR T790M mutation-positive NSCLC | | | 2032, 2035 | | | | 2032, 2035 | | | | 2032, 2035 | | |
| 2032, 2034*,
2035 |
| | | 254 | | | | 15 | | | | – | | | | 158 | | | | 4 | | | | – | |
| Tudorza/Eklira Genuair | | A LAMA for the maintenance treatment of COPD | |
| 2020, 2025*,
2022-2027 |
| |
| 2020,
2022-2027 |
| |
| 2025,
2022-2029 |
| |
| 2025,
2021-2029 |
| | | 77 | | | | 103 | | | | – | | | | 84 | | | | 77 | | | | 13 | |
| Xigduo | | Combines dapagliflozin(Farxiga/Forxiga), an SGLT2 inhibitor, and metformin IR, in a twice-daily tablet to improve glycaemic control in adult patients with Type 2 diabetes who are inadequately controlled by metformin alone | | | 2020,2026* | | | | 2020-2023 | | | | 2020-2028 | | |
| 2020-2025,
2030 |
| | | 99 | | | | 32 | | | | 2 | | | | 40 | | | | 21 | | | | 12 | |
| Zoladex | | A luteinising hormone-releasing hormone (LHRH) agonist used to treat prostate cancer, breast cancer and certain benign gynaecological disorders | | | 2022 | | | | 2021 | | | | 2021 | | | | 2021 | | | | 35 | | | | 28 | | | | 26 | | | | 498 | | | | 485 | | | | 544 | |
| * | Date represents expiry of any granted SPC/PTE and/or Paediatric Exclusivity periods. |
| 1 | Expiry in major EU markets. |
| 2 | The Product Sales reflected are of Europe Region as defined in Market definitions on page 239. |
| 4 | Takeda retained rights. |
| 5 | The patent was revoked during opposition proceedings at the European Patent Office (EPO). The patentee has appealed that decision. |
| 6 | A settlement agreement in the US permitted Watson Laboratories, Inc. and Actavis, Inc. (together, Watson) to begin selling its generic version ofCrestor and its rosuvastatin zinc product from 2 May 2016. |
| 7 | There is eight years’ data exclusivity and two years’ market exclusivity forDaxas in the EU to 5 July 2020. |
| 8 | Not filed for approval in US. |
| 9 | Settled with Sandoz, Inc. for a licensed entry date of 25 March 2019. |
| 10 | In the US,Iressa has seven years’ orphan drug exclusivity to 13 July 2022. |
| 11 | SPCs expire 2 March 2019. There is eight years’ data exclusivity and two years’ market exclusivity forIressa in the EU to 24 June 2019. |
| 12 | AstraZeneca does not have commercialisation rights. |
| 13 | Komboglyze/Kombiglyze XR revenue is included in theOnglyza revenue figure. |
| 14 | ProStrakan Group (a subsidiary of Kyowa Hakko Kirin Co. Ltd) is exclusively licensed in the EU, Iceland, Norway, Switzerland and Liechtenstein. |
| 15 | Licence agreements with Teva and Ranbaxy Pharmaceuticals Inc. and other generic companies allow each to launch a generic version in the US from May 2014, subject to regulatory approval. |
| 16 | A licence agreement with Teva permits its ongoing sale in the US of a generic version from December 2009. The 2018 expiry relates to theFlexhaler device, while the 2019 expiry relates to the formulation in theFlexhaler presentation and also toRespules. |
| 17 | The 2018 expiry relates to the formulation in theTurbuhaler presentation and to a process useful for theRespules product. |
| 18 | Licence agreements with various generics companies allowed launches of generic versions ofSeroquel XR in the US as of 1 November 2016. |
| 19 | Rights licensed to Astellas. |
| 20 | Patent expiry dates relate to theSymbicort pMDI product. The six months of paediatric exclusivity that have been granted are not included as they are not yet included in the Orange Book. |
| 21 | Patent expiry dates relate to theSymbicort Turbuhaler product. |
| | |
| AstraZenecaAnnual Report and Form 20-F Information 2016 | | 213 |
Additional Information
Risk
Risks and uncertainties
Operating in the pharmaceutical sector carries various inherent risks and uncertainties that may affect our business. In this section, we describe the risks and uncertainties that we consider material to our business in that they may have a significant effect on our financial condition, results of operations, and/or reputation.
These risks are not listed in any particular order of priority and have been categorised consistently with the Principal Risks detailed from page 20. Other risks, unknown or not currently considered material, could have a similar effect. We believe that the forward-looking statements about AstraZeneca in this Annual Report, identified by words such as ‘anticipates’, ‘believes’, ‘expects’ and ‘intends’, and that include, among other things, Future prospects in the Financial Review on page 76, are based on reasonable assumptions. However, forward-looking statements involve inherent risks and uncertainties such as those summarised below. They relate to events that may occur in the future, that may be influenced by factors beyond our control and that may have actual outcomes materially different from our expectations.
| | |
Product pipeline and IP risks | | Impact |
Failure or delay in delivery of pipeline or launch of new products |
Our continued success depends on the development and successful launch of innovative new drugs. The development of pharmaceutical product candidates is a complex, risky and lengthy process involving significant financial, R&D and other resources. It may fail at any stage of the process due to various factors, including failure to obtain the required regulatory or marketing approvals for the product candidate or for its manufacturing facilities, unfavourable clinical efficacy data, safety concerns, failure to demonstrate adequate cost-effective benefits to regulatory authorities and/or payers and the emergence of competing products. More details of projects that have suffered setbacks or failures during 2016 can be found in the Therapy Area Review. The anticipated launch dates of major new products significantly affect our business, including investment in large clinical studies, the manufacture of pre-launch product stocks, investment in marketing materials pre-launch, sales force training and the timing of anticipated future revenue streams from new Product Sales. Launch dates are primarily driven by our development programmes and the demands from various factors, including adverse findings in pre-clinical or clinical studies, regulatory demands, price negotiation, competitor activity and technology transfer. More complex and stringent regulations govern the manufacturing and supply of biologics products, thus impacting the production and release schedules of such products more significantly. In addition to developing products in-house, we also expand our product portfolio and geographical presence through licensing arrangements and strategic collaborations, which are key to growing and strengthening our business. The success of such arrangements is largely dependent on the technology and other IP rights we acquire, and the resources, efforts and skills of our partners. Disputes or difficulties in our relationship with our collaborators or partners may arise, for example, due to conflicting priorities or conflicts of interest between parties. In many cases we make milestone payments well in advance of the commercialisation of the products, with no assurance that we will recoup these payments. We experience strong competition from other pharmaceutical companies in respect of licensing arrangements, strategic collaborations, and acquisition targets. | | Failure or delay in development of new product candidates that achieve the expected commercial success could frustrate the achievement of development targets, adversely affect the reputation of our R&D capabilities, and is likely to materially adversely affect our business and results of operations. See also Failure to achieve strategic plans or meet targets and expectations on page 223. Since our business model and strategy rely on the success of relatively few compounds, the failure of any in line production may have a significant negative effect on our business or results of operations. Significant delays to anticipated launch dates of new products could have a material adverse effect on our financial position and/or results of operations. For example, for the launch of products that are seasonal in nature, delays in regulatory approvals or manufacturing difficulties may delay launch to the next season which, in turn, may significantly reduce the return on costs incurred in preparing for the launch for that season. Furthermore, in immuno-oncology speed to market is critical given the large number of clinical trials being conducted by other companies. In addition, a delayed launch may lead to increased costs if, for example, marketing and sales efforts need to be rescheduled or performed for longer than expected. Failure to complete collaborative projects in a timely, cost-effective manner may limit our ability to access a greater portfolio of products, IP technology and shared expertise. Disputes and difficulties with our partners may erode or eliminate the benefits of our alliances and collaborations. In addition, failure to perform on the part of parties to externalisation transactions may diminish the future value of those transactions. Delay of launch can also erode the term of patent exclusivity. Competition from other pharmaceutical companies means that we may be unsuccessful in implementing some of our intended projects or we may have to pay a significant premium over book or market values for our acquisitions. |
| | |
| 214 | | AstraZenecaAnnual Report and Form 20-F Information 2016 |
| | |
Product pipeline and IP risks | | Impact |
Difficulties in obtaining or maintaining regulatory drug approval for products |
We are subject to strict controls on the commercialisation processes for our pharmaceutical products, including their development, manufacture, distribution and marketing. The criteria for establishing safety, efficacy and quality, which are essential for securing marketing approvals, may vary by country and by region. Regulators can refuse to grant approval or may require additional data before approval is granted, even though the medicine may already be launched in other countries. Factors, including advances in science and technology, evolving regulatory science, and different approaches to benefit/risk tolerance by regulatory authorities, the general public, and other third party public interest groups influence the initial approvability of new drugs. While we seek to manage many of these risks, unanticipated and unpredictable policymaking by governments and regulators, limited regulatory authority resources or conflicting priorities often lead to severe delays in regulatory approvals. We may be required to conduct additional clinical trials after a drug’s approval because a regulatory authority may have a concern that impacts the benefit/risk profile of one of our marketed drugs or drugs currently in development. For our marketed drugs, new data and meta-analyses have the potential to drive changes in the approval status or labelling. In addition, recent years have seen an increase in post-marketing regulatory requirements and commitments, and an increased call for third party access to regulatory and clinical trial data packages for independent analysis and interpretation, and broader data transparency. Such transparency, while important, could lead to inappropriate or incorrect data analyses which may damage the integrity of our products and our Company’s reputation. | | Delays in regulatory reviews and approvals could delay our ability to market our products and may adversely affect our revenue. In addition, post-approval requirements, including additional clinical trials, could result in increased costs, and may impact the labelling and approval status of currently marketed products. |
Failure to obtain and enforce effective IP protection |
A pharmaceutical product is protected from being copied for a limited period of time under certain patent rights and/or related IP rights, such as Regulatory Data Protection or Orphan Drug status. Typically, products protected by such rights generate significantly higher revenues than those not protected. Our ability to obtain, maintain and enforce patents and other IP rights in relation to our products is an important element in protecting and recouping our investment in R&D and creating long-term value for the business. Some countries in which we operate do not offer robust IP protection. This may be because IP laws are still developing, the scope of those laws is limited or the political environment does not support such legislation. | | Limitations on the availability of patent protection, the ability to obtain related IP rights or the use of compulsory licensing in certain countries in which we operate could allow for earlier entry of generic or biosimilar competitor products. This could have a material adverse effect on the pricing and sales of our products and, consequently, could materially adversely affect our revenues. More information about protecting our IP, the risk of patent litigation and the early loss of IP rights is contained in the Intellectual Property section on page 57, the Competitive pressures including expiry or loss of IP rights and generic competition risk on page 216 and Note 28 to the Financial Statements from page 185. |
| | |
| AstraZenecaAnnual Report and Form 20-F Information 2016 | | 215 |
Additional Information
Riskcontinued
| | |
Commercialisation risks | | Impact |
Competitive pressures including expiry or loss of IP rights and generic competition |
A pharmaceutical product competes with other products marketed by research-based pharmaceutical companies and with generic or biosimilar drugs marketed by generic drug manufacturers. Approval of competitive products for the same or similar indication as one of our products may result in immediate and significant decreases in our revenues. Generic versions of products, including biosimilars, are often sold at lower prices than branded products, as the manufacturer does not have to recoup the significant cost of R&D investment and market development. Expiry or loss of IP rights can materially adversely affect our revenues and financial condition due to the launch of cheaper generic copies of the product in the country where the rights have expired or been lost (see the table in the Patent Expiries of Key Marketed Products section from page 211). For example in 2016, our US Product Sales of Crestor fell to $1,223 million (2015: $2,844 million), following the launch of generics. Additionally, the expiry or loss of patents covering other innovator companies’ products may also lead to increased competition and pricing pressure for our own, still-patented products in the same product class due to the availability of lower priced generic products in that product class. Generic manufacturers may also take advantage of the failure of certain countries to properly enforce Regulatory Data Protection or other related IP rights and may launch generics during this protected period. This is a particular risk in some Emerging Markets where appropriate patent protection or other related IP rights may be difficult to obtain or enforce. Various regulatory authorities are implementing or considering abbreviated approval processes for biosimilars, allowing quicker entry to market for such products and earlier than anticipated competition for patented biologics. As well as facing generic competition upon expiry or loss of IP rights, we also face the risk that generic drug manufacturers seek to market generic versions of our products prior to expiries of our patents and/or the Regulatory Exclusivity periods. For example, we are currently facing challenges from numerous generic drug manufacturers regarding our patents relating to key products, includingBrilinta,Faslodex,Byetta,Daliresp,Onglyza andCrestor. IP rights protecting our products may be challenged by external parties. We expect our most valuable products to receive the greatest number of challenges. Despite our efforts to establish and defend robust patent protection for our products, we bear the risk that courts may decide that our IP rights are invalid and/or that third parties do not infringe our asserted IP rights. Where we assert our IP rights but are ultimately unsuccessful, third parties may seek damages, alleging, for example, that they have been inappropriately restrained from entering the market. In such cases, we bear the risk that we incur liabilities to those third parties. We also bear the risk that we may be found to infringe patents owned or licensed by third parties, including research-based and generic pharmaceutical companies and individuals. These third parties may seek remedies for patent infringement, including injunctions (for example, preventing the marketing of one of our products) and damages. Details of material patent litigation matters can be found in Note 28 to the Financial Statements from page 185. | | If we are not successful in obtaining, maintaining, defending or enforcing our exclusive rights to market our products, particularly in the US where we achieve our highest Product Sales, our revenue and margins could be materially adversely affected. In addition, unsuccessful assertion of our IP rights may lead to damages or other liabilities to third parties that could materially adversely affect our financial performance. Third parties may be awarded remedies for alleged infringement of their IP, for example injunctions and damages for alleged patent infringement. In the US, courts may order enhanced (ie up to treble) damages for alleged wilful infringement of patents. From time to time we may acquire licences, discontinue activities and/or modify processes to avoid claims of patent infringement. These steps could entail significant costs and our revenue and margins could be materially adversely affected. Unfavourable resolution of current and potential future patent litigation may require us to make significant provisions in our accounts relating to legal proceedings and/or could materially adversely affect our financial condition or results of operations. |
| | |
| 216 | | AstraZenecaAnnual Report and Form 20-F Information 2016 |
| | |
Commercialisation risks | | Impact |
Price controls and reductions |
Most of our key markets have experienced the implementation of various cost control or reimbursement mechanisms for pharmaceutical products. In the US, there is significant pricing pressure driven by payer consolidation, restrictive reimbursement policies, and cost control tools, such as exclusionary formularies and price protection clauses. Many formularies employ ‘generic first’ strategies and/or require physicians to obtain prior approval for the use of a branded medicine where a generic alternative exists. These mechanisms can be used by payers to limit the use of branded products and put pressure on manufacturers to reduce net prices. In addition, patients are seeing changes in the design of their health plan benefits and may experience variation in how their plans cover their medications, including increases in the out-of-pocket payments for their branded medications. Patient out-of-pocket spending is generally in the form of a co-payment or co-insurance, but there is a growing trend towards high deductible health plans that require that patients pay the full list price of their drugs and services until they meet certain out-of-pocket thresholds. Ongoing scrutiny of the US pharmaceutical industry, focused largely on pricing, is placing increased emphasis on the value of medications. This scrutiny will likely continue across many stakeholders, including policymakers and legislators. The new US political leadership has initiated various legislative and policy processes that could affect the ACA. US prescription drug costs and importation policies could be among the policy proposals considered in initial steps to repeal and replace the ACA. In addition to addressing the ACA directly, lawmaker and policymaker proposals are also discussing a variety of other related changes relating to, for example, tax and Medicare reform. For more information, please see Pricing of medicines in the Marketplace section from page 13. Currently it is difficult to predict what specific proposals may be directed at existing laws and regulations (including the ACA or the Medicare Part D program) and to determine the implications for the healthcare system and pharmaceutical industry. This uncertainty could impact our ability to execute our plans, strategies, and business operations. However, significantly modifying existing laws and regulations, including the ACA and those relating to drug pricing and importation, could affect private health insurance, coverage through Medicaid and the health insurance exchange marketplaces, Medicare coverage and savings provisions, and other facets of the US healthcare market, with potentially significant impacts on the pharmaceutical industry. In Europe, the industry continues to be exposed to variousad hoc cost-containment measures and reference pricing mechanisms, which impact prices. There is a trend towards increasing transparency and comparison of prices among EU Member States which may eventually lead to a change in the overall pricing and reimbursement landscape. In Emerging Markets, governments are increasingly controlling pricing in the self-pay sector and favouring locally manufactured drugs. In addition, the emergence of price referencing is seen in some markets. Concurrently, many markets are adopting the use of Health Technology Assessment (HTA) to provide a rigorous evaluation of the clinical efficacy of a product at, or post, launch. HTA evaluations are also increasingly being used to assess the clinical effect, as well as cost- effectiveness, of products in a particular health system. This comes as payers and policymakers attempt to increase efficiencies in the use and choice of pharmaceutical products. A summary of the principal aspects of price regulation and how pricing pressures are affecting our business in our most important markets is set out in Pricing of medicines in the Marketplace section from page 13 and overleaf in the following risk factor. | | Due to these pricing pressures, there can be no certainty that we will be able to charge prices for a product that, in a particular country or in the aggregate, enable us to earn an adequate return on our product investment. These pressures, including the increasingly restrictive reimbursement policies to which we are subject, could materially adversely affect our business or results of operations. We expect these pricing pressures will continue and may increase. The continued disparities in EU and US pricing systems could lead to marked price differentials between regions, which, by way of the implementation of existing or new reference pricing mechanisms, increases the pricing pressure affecting the industry. The importation of pharmaceutical products from countries where prices are low due to government price controls, or other market dynamics, to countries where prices for those products are higher, is already prevalent and may increase. Strengthened collaboration by governments may accelerate the development of further cost-containment policies (such as joint procurement). Increased and simplified access to national and regional prices in markets and the publication of these prices in centralised databases have facilitated the uptake and efficiency of price referencing across the world. |
| | |
| AstraZenecaAnnual Report and Form 20-F Information 2016 | | 217 |
Additional Information
Riskcontinued
| | |
Commercialisation risks | | Impact |
Economic, regulatory and political pressures |
Operating in over 100 countries, we are subject to political, socio-economic and financial factors both globally and in individual countries. A sustained global economic downturn may further exacerbate pressure from governments and other healthcare payers on medicine prices and volumes of sales in response to pressures on budgets, and may cause a slowdown or a decline in growth in some markets. Those most severely impacted by the economic downturn may seek alternative ways to settle their debts through, for example, the issuance of government bonds which might trade at a discount to the face value of the debt. Other customers may cease to trade, which may result in losses from writing off debts, or a reduction in demand for products. We are highly dependent on being able to access a sustainable flow of liquid funds due to the high fixed costs of operating our business and the long and uncertain development cycles of our products. In a sustained economic downturn, financial institutions with whom we deal may cease to trade and there can be no guarantee that we will be able to access monies owed to us without a protracted, expensive and uncertain process, if at all. More than 90% of our cash investments are managed centrally and are invested in collateralised bank deposits, fixed income securities in government, financial and non-financial securities and AAA credit rated institutional money market funds. Money market funds are backed by institutions in the US and the EU, which, in turn, invest in other funds, including sovereign funds. This means our credit exposure is a mix of US and EU sovereign default risk, financial institution and non-financial institution default risk. On 23 June 2016, the UK held a remain- or- leave referendum on the UK’s membership within the EU, the outcome of which was a decision for the UK to exit from the EU (Brexit). A process of negotiation will likely determine the future terms of the UK’s relationship with the EU, as well as whether the UK will be able to continue to benefit from the EU’s free trade and similar arrangements. Until the Brexit negotiation process is initiated and completed, it is difficult to anticipate the potential impact on AstraZeneca’s market share, sales, profitability and results of operations. The Group operates from a global footprint and retains flexibility to adapt to changing circumstances. The uncertainty before, during and after the period of negotiation is also expected to increase volatility and may have an economic impact, particularly in the UK and Eurozone. The Board reviews the potential impact of Brexit as an integral part of its Principal Risks (as outlined from page 20) rather than as a stand-alone risk. As the process of Brexit evolves, the Board will continue to assess its impact on the Company. | | Deterioration of, or failure to improve, socio-economic conditions, and situations and/or resulting events, depending on their severity, could adversely affect our supply and/or distribution chain in the affected countries and the ability of customers or ultimate payers to purchase our medicines. This could adversely affect our business or results of operations. While we have adopted cash management and treasury policies to manage the risk of not being able to access a sustainable flow of liquid funds (see the Financial risk management policies section of the Financial Review from page 76), we cannot be certain that these will be as effective as they are intended to be, in particular in the event of a global liquidity crisis. In addition, open positions where we are owed money and investments we have made in financial and non-financial institutions or money market funds cannot be guaranteed to be recoverable. Additionally, if we need access to external sources of financing to sustain and/or grow our business, such as the debt or equity capital financial markets, this may not be available on commercially acceptable terms, if at all, in the event of a severe and/or sustained economic downturn. This may, for instance, be the case in the event of any default by the Company on its debt obligations, which may materially adversely affect our ability to secure debt funding in the future or our financial condition in general. Further information on debt funding arrangements is contained in the Financial risk management policies section of the Financial Review from page 76. It is too early to judge the impact of Brexit as it is unclear as to the trading relationships the UK will be able to negotiate with the EU and other significant trading partners. Any deterioration in market access or trading terms including customs duties, VAT or other tariffs that constitute real cost or delay to the movement of goods and increased administration may materially adversely impact our financial performance. |
| | |
| 218 | | AstraZenecaAnnual Report and Form 20-F Information 2016 |
| | |
Commercialisation risks | | Impact |
Failures or delays in the quality and execution of our commercial strategies |
Commercial success of our Growth Platforms are critical factors in sustaining or increasing global Product Sales and replacing lost Product Sales due to patent expiry. The successful launch of a new pharmaceutical product involves substantial investment in sales and marketing activities, launch stocks and other items. We may ultimately be unable to achieve commercial success for various reasons including difficulties in manufacturing sufficient quantities of the product candidate for development or commercialisation in a timely manner, the impact of price control measures imposed by governments and healthcare authorities, the outcome of negotiations with third party payers, erosion of IP rights, including infringement by third parties, failure to show a differentiated product profile and changes in prescribing habits. The commercialisation of biologics is often more complex than for small molecule pharmaceutical products, primarily due to differences in the mode of administration, technical aspects of the product, and rapidly changing distribution and reimbursement environments. We face particular challenges in Emerging Markets, including: > More volatile economic conditions and/or political environments. > Competition from multinational and local companies with existing market presence. > The need to identify and to leverage appropriate opportunities for sales and marketing. > Poor IP protection. > Inadequate protection against crime (including counterfeiting, corruption and fraud). > The need to impose developed market compliance standards. > The need to meet a more diverse range of national regulatory, clinical, manufacturing and distribution requirements. > Potential inadvertent breaches of local and international law. > Not being able to recruit appropriately skilled and experienced personnel. > Difficulty in identifying the most effective sales and marketing channels and routes to market. > Intervention by national governments or regulators restricting market access and/or introducing adverse price controls. > Difficulty in managing local partnerships such as co-promotion and co-marketing; both driving performance and adhering to AstraZeneca’s compliance standards which are often higher than the market norm. > Difficulties in cash repatriation due to strict foreign currency controls and lack of hard currency reserves in some Emerging Markets. > Complexity inherent within a direct exports business from UK and Sweden operations to countries where we do not have a legal entity. We may also seek to acquire complementary businesses or enter into other strategic transactions. The integration of an acquired business could involve incurring significant debt and unknown or contingent liabilities, as well as having a negative effect on our reported results of operations from acquisition-related charges, amortisation of expenses related to intangibles and charges for the implementation of long-term assets. We may also experience difficulties in integrating geographically separated organisations, systems and facilities, and personnel with different organisational cultures. Disputes or difficulties in our relationship with our collaborators or partners may also arise, often due to conflicting priorities or conflicts of interest between parties. | | Failure to execute our commercial strategies could materially adversely impact our business or results of operations. If a new product does not succeed as anticipated or its rate of sales growth is slower than anticipated, there is a risk that we may be unable to fully recoup the costs incurred in launching it, which could materially adversely affect our business or results of operations. Due to the complexity of the commercialisation process for biologics, the methods of distributing and marketing biologics could materially adversely impact our revenues from the sales of biologics medicines, such asSynagis andFluMist/Fluenz. The failure to exploit potential opportunities appropriately in Emerging Markets or materialisation of the risks and challenges of doing business in such markets, including inadequate protection against crime (including counterfeiting, corruption and fraud) or inadvertent breaches of local and international law may materially adversely affect our reputation, business or results of operations. Integration processes may also result in business disruption, diversion of management resources, the loss of key employees and other issues, such as a failure to integrate IT and other systems. The incurrence of significant debt or liabilities due to the integration of an acquired business could cause deterioration in our credit rating and result in increased borrowing costs and interest expense. We may issue additional shares to pay for acquired businesses, which would result in the dilution of our then existing shareholders. |
| | |
| AstraZenecaAnnual Report and Form 20-F Information 2016 | | 219 |
Additional Information
Riskcontinued
| | |
Supply chain and business execution risks | | Impact |
|
Failure to maintain supply of compliant, quality product |
We may experience difficulties, delays and interruptions in the manufacturing and supply of our products for various reasons, including: > Demand significantly in excess of forecast demand, which may lead to supply shortages (this is particularly challenging before launch). > Supply chain disruptions, including those due to natural or man-made disasters at one of our facilities or at a critical supplier or vendor. > Delays in construction of new facilities or the expansion of existing facilities, including those intended to support future demand for our products (the complexities associated with biologics facilities, especially for drug substance, increases the probability of delay). > The inability to supply products due to a product quality failure or regulatory agency compliance action such as licence withdrawal, product recall or product seizure. > Other manufacturing or distribution problems, including changes in manufacturing production sites, limits to manufacturing capacity due to regulatory requirements, changes in the types of products produced, or physical limitations or other business interruptions that could impact continuous supply. We increasingly rely on third parties for the timely supply of goods, such as raw materials (for example, the API in some of our medicines and drug substances and/or finished drug products for some of our biologics medicines), equipment, formulated drugs and packaging, and services, all of which are key to our operations. Many of these goods are difficult to substitute in a timely manner or at all. We expect that external capacity for biologics drug substance production will remain constrained for the next few years and, accordingly, may not be readily available for supplementary production in the event that we experience an unforeseen need for such capacity. | | Difficulties with manufacturing and supply, forecasting, distribution or third party suppliers may result in product shortages, which may lead to lost Product Sales and materially adversely affect our reputation and revenues. Even slight variations in components or any part of the manufacturing process may lead to a product that is non-compliant and does not meet quality standards. This could lead to recalls, spoilage, product shortage, regulatory action and/or reputational harm. |
Illegal trade in our products | | |
| |
The illegal trade in pharmaceutical products is widely recognised by industry, non-governmental organisations and governmental authorities to be increasing. Illegal trade includes counterfeiting, theft and illegal diversion (that is, when our products are found in a market where we did not send them and where they are not approved or not permitted/allowed to be sold). There is a risk to public health when illegally traded products enter the supply chain, as well as associated financial risk. Authorities and the public expect us to help reduce opportunities for illegal trade in our products through securing the integrity of our supply chain, surveillance, investigation and supporting legal action against those found to be engaged in illegal trade. | | Public loss of confidence in the integrity of pharmaceutical products as a result of illegal trade could materially adversely affect our reputation and financial performance. In addition, undue or misplaced concern about this issue may cause some patients to stop taking their medicines, with consequential risks to their health. Authorities may take action, financial or otherwise, if they believe we are liable for breaches in our own supply chains. There is also a direct financial loss when, for example, counterfeit and/or illegally diverted products replace sales of genuine products or genuine products are recalled following discovery of counterfeit products. |
Reliance on third party goods and services |
| |
Many of our business-critical operations, including certain R&D processes, IT systems, HR, finance, tax and accounting services have been outsourced to third party providers. We are thus heavily reliant on these third parties not just to deliver timely and high quality services but also to comply with applicable laws and regulations and adhere to our ethical business expectations from third party providers. | | The failure of outsource providers to deliver timely services, and to the required level of quality, or the failure of outsource providers to cooperate with each other, could materially adversely affect our financial condition or results of operations. Moreover, the failure of these third parties to operate in an ethical manner could adversely impact our reputation both internally and externally or even result in non-compliance with applicable laws and regulations. Our business and financial results could be materially adversely affected by disruptions caused by our failure to successfully manage either the integration of outsourced services or the transition process of insourcing services from third parties. For instance, insourcing some of the previously outsourced services into our service centre in Chennai, India and Guadalajara, Mexico may result in deterioration of the quality of service or deployment of resources by these third parties. |
| | |
| 220 | | AstraZenecaAnnual Report and Form 20-F Information 2016 |
| | |
Supply chain and business execution risks | | Impact |
|
Failure of information security, data protection and cybercrime |
| | |
We are dependent on effective IT systems. These systems support key business functions such as our R&D, manufacturing, supply chain and sales capabilities and are an important means of safeguarding and communicating data, including critical or sensitive information, the confidentiality and integrity of which we rely on. Examples of sensitive information that we protect include clinical trial records (patient names and treatments), personal information (employee bank details, home address), IP related to manufacturing process and compliance, key research science techniques, AstraZeneca property (theft) and privileged access (rights to perform IT tasks). The size and complexity of our IT systems, and those of our third party vendors (including outsource providers) with whom we contract, have significantly increased over the past decade and this makes such systems potentially vulnerable to service interruptions and security breaches from attacks by malicious third parties, or from intentional or inadvertent actions by our employees or vendors. Significant changes in the business footprint and the implementation of the IT strategy, including the creation and use of captive offshore Global Technology Centres, could lead to temporary loss of capability. We increasingly use the internet, digital content, social media, mobile applications and other forms of new technology to communicate internally and externally. The accessibility and instantaneous nature of interactions with such media may facilitate or exacerbate the risk of data leakages from within AstraZeneca. It may also lead to false or misleading statements being made about AstraZeneca, which may damage our reputation. As existing social media platforms expand and evolve and new social media platforms emerge, it becomes increasingly challenging to identify new points of entry and to put structures in place to secure and protect information. | | Any significant disruption to these IT systems, including breaches of data security or cybersecurity, or failure to integrate new and existing IT systems, could harm our reputation and materially adversely affect our financial condition or results of operations. While we invest heavily in the protection of our data and IT, we may be unable to prevent breakdowns or breaches in our systems that could result in disclosure of confidential information, damage to our reputation, regulatory penalties, financial losses and/or other costs. The inability to effectively back up and restore data could lead to permanent loss of data that could result in non-compliance with applicable laws and regulations. We and our vendors could be susceptible to third party attacks on our information security systems. Such attacks are of ever-increasing levels of sophistication and are made by groups and individuals with a wide range of motives and expertise, including criminal groups, ‘hacktivists’ and others. From time to time we experience intrusions, including as a result of computer-related malware. Inappropriate use of certain media vehicles could lead to the unauthorised or unintentional public disclosure of sensitive information (such as personally identifiable information on employees, healthcare professionals or patients, such as those enrolled in our clinical trials), which may damage our reputation, adversely affect our business or results of operations and expose us to legal risks and/or additional legal obligations. Similarly, the involuntary public disclosure of commercially sensitive information or an information loss could adversely affect our business or results of operations. In addition, negative posts or comments about us (or, for example, the safety of our products) on social media websites or other digital channels could harm our reputation. |
|
Failure of critical processes |
| | |
Unexpected events and/or events beyond our control could result in the failure of critical processes within the Company or at third parties on whom we are reliant. The business faces threats to business continuity from many directions. Examples of material threats include: > Disruption to our business if there is instability in a particular geographic region, including as a result of war, terrorism, riots, unstable governments, civil insurrection or social unrest. > Natural disasters in areas of the world prone to extreme weather events and earthquakes. > Cyber threats similar to those detailed in the Failure of information security, data protection and cybercrime section above. | | Failure of critical processes may result in an inability to research, manufacture or supply products to patients. AstraZeneca has developed a Business Resilience framework which is designed to mitigate such risks. However, there is no guarantee that these measures will be sufficient to prevent business interruption. This may expose the Company to litigation and/or regulatory action which may result in fines, loss of revenue and adversely affect the Company’s financial results. |
|
Any expected gains from productivity initiatives are uncertain |
| | |
| We continue to implement various productivity initiatives and restructuring programmes with the aim of enhancing the long-term efficiency of the business. However, anticipated cost savings and other benefits from these programmes are based on estimates and the actual savings may vary significantly. In particular, these cost-reduction measures are often based on current conditions and cannot always take into account any future changes to the pharmaceutical industry or our operations, including new business developments or wage or price increases. | | Our failure to successfully implement these planned cost-reduction measures, either through the successful implementation of employee relations processes (including consultation, engagement, talent management, recruitment and retention), or the possibility that these efforts do not generate the level of cost savings we anticipate, could materially adversely affect our business or results of operations. |
|
Failure to attract and retain key personnel, and engage successfully with our employees |
| | |
We rely heavily on recruiting and retaining talented employees with a diverse range of skills and capabilities to meet our strategic objectives. We face intense competition for well-qualified individuals, as the supply of people with specific skills and significant leadership potential or in specific geographic regions may be limited. The successful delivery of our business objectives is dependent on high levels of engagement, commitment and motivation of the workforce. | | The inability to attract and retain highly skilled personnel may weaken our succession plans for critical positions in the medium term, may materially adversely affect the implementation of our strategic objectives and could ultimately impact our business or results of operations. Failure to engage effectively with our employees could lead to business disruption in our day-to-day operations, reduce levels of productivity and/or increase levels of voluntary turnover, all of which could ultimately materially adversely affect our business or results of operations. |
| | |
| AstraZenecaAnnual Report and Form 20-F Information 2016 | | 221 |
Additional Information
Riskcontinued
| | |
Legal, regulatory and compliance risks | | Impact |
Failure to adhere to applicable laws, rules and regulations |
| | |
Our many business operations are subject to a wide range of laws, rules and regulations from governmental and non-governmental bodies around the world. Any failure to comply with these applicable laws, rules and regulations may result in us being investigated by relevant agencies and authorities and/or in legal proceedings being filed against us. Such investigations or proceedings could result in us becoming subject to civil or criminal sanctions and/or being forced to pay fines or damages. Relevant authorities have wide-ranging administrative powers to deal with any failure to comply with continuing regulatory oversight and this could affect us, whether such failure is our own or that of our contractors or external partners. Material examples of statutes, rules and regulations impacting business operations include: | | Failure to comply with applicable laws, rules and regulations; manage our liabilities; or to adequately anticipate or proactively manage emerging policy and legal developments could materially adversely affect our licence to operate, or results of operations; adversely affect our reputation; cause harm to people or the environment; and/or lead to fines or other penalties. For example, once a product has been approved for marketing by the regulatory authorities, it is subject to continuing control and regulation, such as the manner of its manufacture, distribution, marketing and safety surveillance. If regulatory issues concerning compliance with environmental, current Good Manufacturing Practice or safety monitoring regulations for pharmaceutical products (often referred to as pharmacovigilance) arise, this could lead to loss of product approvals, product recalls and seizures, and interruption of production, which could create product shortages and delays in new product approvals, and negatively impact patient access. |
> Compliance with Good Manufacturing Practice. | |
> Local, national and international environment or occupational health and safety laws and regulations. | |
> Trade control laws governing our imports and exports including nationally and internationally recognised trade agreements, embargoes, trade and economic sanctions and anti-boycott requirements. | | |
> Competition laws and regulations, including challenges from competition authorities to patent settlement agreements and private damages actions. | | |
> Rules and regulations established to promote ethical supply chain management. | | |
> Financial regulations including, but not limited to, external financial reporting, taxation and money laundering. | | |
> Employment practices. | | |
> Disclosure of payments to healthcare professionals under the Sunshine Act and EFPIA legislation. | | |
> Appropriate disclosure of community support, patient group support and product donations. | | |
We have environmental and/or occupational health and safety-related liabilities at some current, formerly owned, leased and third party sites. For more information on the most significant of these and for details on other significant litigation matters, please refer to Note 28 to the Financial Statements from page 185. | | |
Safety and efficacy of marketed products is questioned |
| | |
Our ability to accurately assess, prior to launch, the eventual efficacy or safety of a new product once in broader clinical use can only be based on data available at that time, which is inherently limited due to relatively short periods of product testing and relatively small clinical study patient samples. Any unforeseen safety concerns or adverse events relating to our products or failure to comply with laws, rules and regulations relating to provision of appropriate warnings concerning the dangers and risks of our products that result in injuries could expose us to large product liability damages claims, settlements and awards, particularly in the US. Adverse publicity relating to the safety of a product or of other competing products may increase the risk of product liability claims. Details of material product liability litigation matters can be found in Note 28 to the Financial Statements from page 185. | | Serious safety concerns or adverse events relating to our products could lead to product recalls, seizures, loss of product approvals and interruption of supply and could materially adversely impact patient access, our reputation and financial revenues. Significant product liability claims could also arise which could be costly, divert management attention or damage our reputation and demand for our products. Unfavourable resolution of such current and similar future product liability claims could subject us to enhanced damages, require us to make significant provisions in our accounts relating to legal proceedings and could materially adversely affect our financial condition or results of operations, particularly where such circumstances are not covered by insurance. For more information, see the Limited third party insurance coverage risk on page 224. |
| | |
| 222 | | AstraZenecaAnnual Report and Form 20-F Information 2016 |
| | |
Legal, regulatory and compliance risks | | Impact |
Adverse outcome of litigation and/or governmental investigations |
| | |
We may be subject to various product liability, consumer commercial, anti-trust, environmental, employment or tax litigation or other legal proceedings and governmental investigations. Litigation, particularly in the US, is inherently unpredictable and unexpectedly high awards for damages can result from an adverse verdict. In many cases, plaintiffs may claim enhanced damages in extremely high amounts. In particular, the marketing, promotional, clinical and pricing practices of pharmaceutical manufacturers, as well as the manner in which manufacturers interact with purchasers, prescribers and patients, are subject to extensive regulation, litigation and governmental investigation. Many companies, including AstraZeneca, have been subject to claims related to these practices asserted by federal and state governmental authorities and private payers and consumers, which have resulted in substantial expense and other significant consequences. Note 28 to the Financial Statements from page 185 describes the material legal proceedings in which we are currently involved. | | Governmental investigations, for example under the Foreign Corrupt Practices Act or federal or state False Claims Acts or other types of legal proceedings, regardless of their outcome, could be costly, divert management attention, or damage our reputation and demand for our products. Unfavourable resolution of current and similar future proceedings against us could subject us to criminal liability, fines, penalties or other monetary or non-monetary remedies, including enhanced damages, require us to make significant provisions in our accounts relating to legal proceedings and could materially adversely affect our business or results of operations. |
Failure to adhere to increasingly stringent anti-bribery and anti-corruption legislation |
| | |
There is an increasing global focus on the implementation and enforcement of anti-bribery and anti-corruption legislation. In the UK, the Bribery Act 2010 has extensive extra territorial application, and imposes organisational liability for any bribe paid by persons or entities associated with an organisation where the organisation failed to have adequate preventative controls in place at the time of the offence. In the US, there has been significant enforcement activity in respect of the Foreign Corrupt Practices Act by the SEC and DOJ against US companies and non-US companies listed in the US. China, Brazil, India and other countries are also enforcing their own anti-bribery laws more aggressively and/or adopting tougher new measures. We have been the subject of anti-corruption investigations and there can be no assurance that we will not, from time to time, continue to be subject to informal enquiries and formal investigations from governmental agencies. In the context of our business, governmental officials interact with us in various roles that are important to our operations, such as in the capacity of a regulator, partner or healthcare payer, reimburser or prescriber, among others. Details of these matters are included in Note 28 to the Financial Statements from page 185. | | Despite taking measures to prevent breaches of applicable anti-bribery and anti-corruption laws by our personnel and associated third parties, breaches may still occur, potentially resulting in the imposition of significant penalties, such as fines, the requirement to comply with monitoring or self-reporting obligations, or debarment or exclusion from government sales or reimbursement programmes, any of which could materially adversely affect our reputation, business or results of operations. |
| | |
Economic and financial risks | | Impact |
Failure to achieve strategic plans or meet targets and expectations |
| | |
We may from time to time communicate our business strategy or our targets or expectations regarding our future financial or other performance (for example, the expectations described in Future prospects in the Financial Review on page 76). All such statements are of a forward-looking nature and are based on assumptions and judgements we make, all of which are subject to significant inherent risks and uncertainties, including those that we are unaware of and/or that are beyond our control. Any failure to successfully implement our business strategy, whether determined by internal or external risk factors, may frustrate the achievement of our financial or other targets or expectations and, in turn, materially damage our brand and materially adversely affect our business, financial position or results of operations. | | There can be no guarantee that our financial targets or expectations will materialise on the expected timeline or at all. Actual results may deviate materially and adversely from any such target or expectation, including if one or more of the assumptions or judgements underlying any such target or expectation proves to be incorrect in whole or in part. |
| | |
| AstraZenecaAnnual Report and Form 20-F Information 2016 | | 223 |
Additional Information
Riskcontinued
| | |
Economic and financial risks | | Impact |
Unexpected deterioration in the Company’s financial position |
A wide range of financial risks could result in a material deterioration in the Company’s financial position. As a global business, currency fluctuations can significantly affect our results of operations, which are reported in US dollars. Approximately 35% of our global 2016 Product Sales were in the US, which is expected to remain our largest single market for the foreseeable future. Product Sales in other countries are predominantly in currencies other than the US dollar, including the euro, Japanese yen, Chinese renminbi and Australian dollar. Our consolidated balance sheet contains significant investments in intangible assets, including goodwill. The nature of the biopharmaceutical business is high risk and requires that we invest in a large number of projects in an effort to develop a successful portfolio of approved products. Our ability to realise value on these significant investments is often contingent upon, among other things, regulatory approvals, market acceptance, competition and legal developments. As such, in the course of our many acquisitions and R&D activities, we expect that some of our intangible assets will become impaired and be written off at some time in the future. Inherent variability of biologics manufacturing increases the risk of write-offs of these product batches. Due to the value of the materials used, the carrying amount of biological products is much higher than that of small molecule products. As we continue to grow our biologics business, we also increase the risk of potential impairment charges. In recent years, the costs associated with product liability litigation have increased the cost of, and narrowed the coverage afforded by, pharmaceutical companies’ product liability insurance. To contain insurance costs, we have continued to adjust our coverage profile, accepting a greater degree of uninsured exposure. The Company has not held any material product liability insurance since February 2006. In addition, where claims are made under insurance policies, insurers may reserve the right to deny coverage on various grounds. For example, product liability litigation cases relating toCrestor andNexium in the US are not covered by third party product liability insurance. See Note 28 to the Financial Statements from page 185 for details. The integrated nature of our worldwide operations can produce conflicting claims from revenue authorities as to the profits to be taxed in individual countries. The majority of the jurisdictions in which we operate have double tax treaties with other foreign jurisdictions, which provide a framework for mitigating the incidence of double taxation on our revenues and capital gains. The Company’s worldwide operations are taxed under laws in the jurisdictions in which they operate. International standards governing the global tax environment regularly change. The Organisation for Economic Co-operation and Development (OECD) has proposed a number of changes under the Base Erosion and Profit Shifting (BEPS) Action Plans. Our defined benefit pension obligations are largely backed by assets invested across the broad investment market. Our most significant obligations relate to defined benefit pension funds in the UK, Sweden and the US. The largest obligation is in the UK. | | Movements in the exchange rates used to translate foreign currencies into US dollars may materially adversely affect our financial condition or results of operations. Some of our subsidiaries import and export goods and services in currencies other than their own functional currency, and so the financial results of such subsidiaries could be affected by currency fluctuations arising between the transaction and settlement dates. In addition, there are foreign exchange differences arising on the translation of investments in subsidiaries. We have significant investments in goodwill and intangible assets as a result of our acquisitions of various businesses and our purchases of certain assets, such as product development and marketing rights. Impairment losses may materially adversely affect our financial condition or results of operations. Details of the carrying values of goodwill and intangible assets, and the estimates and assumptions we make in our impairment testing, are included in Notes 8 and 9 to the Financial Statements from page 156. Financial liabilities arising due to product liability or other litigation, in respect of which we do not have insurance coverage, or if an insurer’s denial of coverage is ultimately upheld, could require us to make significant provisions relating to legal proceedings and could materially adversely affect our financial condition or results of operations. For more information, please see the Adverse outcome of litigation and/or governmental investigations risk on page 223. The resolution of tax disputes regarding the profits to be taxed in individual territories can result in a reallocation of profits between jurisdictions and an increase or decrease in related tax costs, and has the potential to affect our cash flows, EPS and post-tax earnings. Claims, regardless of their merits or their outcome, are costly, divert management attention and may adversely affect our reputation. If any double tax treaties should be withdrawn or amended, especially in a territory where a member of the AstraZeneca Group is involved in a taxation dispute with a tax authority in relation to cross-border transactions, such withdrawal or amendment could materially adversely affect our financial condition or results of operations, as could a negative outcome of a tax dispute or a failure by tax authorities to agree through competent authority proceedings. See the Financial risk management policies section of the Financial Review on page 76 for tax risk management policies and Note 28 to the Financial Statements from page 185 for details of current tax disputes. Changes in tax regimes could result in a material impact on the Company’s cash tax liabilities and tax charge, resulting in either an increase or a reduction in financial results depending upon the nature of the change. We represent views to the OECD, governments and tax authorities through public consultations to ensure international institutions and governments understand the business implications of proposed law changes. Specific OECD BEPS recommendations that we expect to impact the Company include changes to patent box regimes, restrictions of interest deductibility and revised transfer pricing guidelines. Sustained falls in asset values could reduce pension fund solvency levels, which may result in requirements for additional cash, restricting the cash available for our business. Changes to funding regulations for defined benefit pensions may also result in a requirement for additional cash contributions by the Company. If the present value of the liabilities increase due to a sustained low interest rate environment, an increase in expectations of future inflation, or an improvement in member longevity (above that already assumed), this could also reduce pension fund solvency ratios. The likely increase in the IAS 19 accounting deficit generated by any of these factors may cause the credit rating agencies to review our credit rating, with the potential to negatively affect our ability to raise debt and the price of new debt issuances. See Note 20 to the Financial Statements from page 165 for further details of the Group’s pension obligations. |
| | |
| 224 | | AstraZenecaAnnual Report and Form 20-F Information 2016 |
| | |
Economic and financial risks | | Impact |
Failure in financial control or the occurrence of fraud |
Effective internal controls are necessary for us to provide reliable financial reports and are designed to prevent and detect fraud. Lapses in controls and procedures could undermine the ability to prevent fraud or provide accurate disclosure of financial information on a timely basis. Testing of our internal controls can provide only reasonable assurance with respect to the preparation and fair presentation of financial statements and may not prevent or detect misstatements or fraud. | | Significant resources may be required to remediate any lapse or deficiency in internal controls. Any such deficiency may also trigger investigations by a number of organisations, for example, the SEC, the DOJ or the SFO and may result in fines being levied against the Company or individual directors. Serious fraud may lead to potential prosecution or even imprisonment of senior management. |
| | |
| AstraZenecaAnnual Report and Form 20-F Information 2016 | | 225 |
Additional Information
Geographical Review
This section contains further information about the performance of our products within the geographical areas in which our sales and marketing efforts are focused. Sales relates to Product Sales.
| | | | | | | | | | | | | | | | | | | | | | | | | | | | | | | | | | | | | | | | | | | | | | | | | | | | | | | | | | | | | | | | | | | | | | | | |
| | | World | | | | | | US | | | | | | | | | | | | Europe | | | | | | Established ROW | | | | | | Emerging Markets | |
| 2016 | | Sales
$m | | | Actual
% | | | CER
% | | | | | | Sales
$m | | | Actual
% | | | | | | Sales
$m | | | Actual
% | | | CER % | | | | | | Sales
$m | | | Actual
% | | | CER
% | | | | | | Sales
$m | | | Actual
% | | | CER
% | |
| Oncology: | | | | | | | | | | | | | | | | | | | | | | | | | | | | | | | | | | | | | | | | | | | | | | | | | | | | | | | | | | | | | | | | | | | | | | | | |
| Faslodex | | | 830 | | | | 18 | | | | 19 | | | | | | | | 438 | | | | 23 | | | | | | | | 228 | | | | 10 | | | | 11 | | | | | | | | 68 | | | | 26 | | | | 15 | | | | | | | | 96 | | | | 10 | | | | 25 | |
| Zoladex | | | 816 | | | | – | | | | – | | | | | | | | 35 | | | | 25 | | | | | | | | 156 | | | | (8 | ) | | | (4 | ) | | | | | | | 270 | | | | (1 | ) | | | (7 | ) | | | | | | | 355 | | | | 3 | | | | 6 | |
| Iressa | | | 513 | | | | (6 | ) | | | (5 | ) | | | | | | | 23 | | | | n/m | | | | | | | | 120 | | | | (7 | ) | | | (5 | ) | | | | | | | 137 | | | | – | | | | (8 | ) | | | | | | | 233 | | | | (14 | ) | | | (10 | ) |
| Tagrisso | | | 423 | | | | n/m | | | | n/m | | | | | | | | 254 | | | | n/m | | | | | | | | 76 | | | | n/m | | | | n/m | | | | | | | | 83 | | | | 100 | | | | 100 | | | | | | | | 10 | | | | 100 | | | | 100 | |
| Casodex | | | 247 | | | | (7 | ) | | | (9 | ) | | | | | | | 2 | | | | 100 | | | | | | | | 27 | | | | (7 | ) | | | (7 | ) | | | | | | | 111 | | | | (15 | ) | | | (23 | ) | | | | | | | 107 | | | | 1 | | | | 8 | |
| Arimidex | | | 232 | | | | (7 | ) | | | (6 | ) | | | | | | | 14 | | | | (26 | ) | | | | | | | 37 | | | | (24 | ) | | | (24 | ) | | | | | | | 71 | | | | (10 | ) | | | (18 | ) | | | | | | | 110 | | | | 7 | | | | 15 | |
| Lynparza | | | 218 | | | | n/m | | | | n/m | | | | | | | | 127 | | | | 81 | | | | | | | | 81 | | | | n/m | | | | n/m | | | | | | | | 3 | | | | n/m | | | | n/m | | | | | | | | 7 | | | | n/m | | | | n/m | |
| Others | | | 104 | | | | (21 | ) | | | (26 | ) | | | | | | | – | | | | n/m | | | | | | | | 8 | | | | (65 | ) | | | (65 | ) | | | | | | | 71 | | | | 18 | | | | 7 | | | | | | | | 25 | | | | (17 | ) | | | (13 | ) |
| Total Oncology | | | 3,383 | | | | 20 | | | | 20 | | | | | | | | 893 | | | | 74 | | | | | | | | 733 | | | | 16 | | | | 18 | | | | | | | | 814 | | | | 11 | | | | 2 | | | | | | | | 943 | | | | – | | | | 6 | |
| | | | | | | | | | | | | | | | | | | | | | | | | | | | | | | | | | | | | | | | | | | | | | | | | | | | | | | | | | | | | | | | | | | | | | | | | |
| Cardiovascular & Metabolic Disease: | | | | | | | | | | | | | | | | | | | | | | | | | | | | | | | | | | | | | | | | | | | | | | | | | | | | | | | | | | | | | | | | | | | | | | | | |
| Crestor | | | 3,401 | | | | (32 | ) | | | (32 | ) | | | | | | | 1,223 | | | | (57 | ) | | | | | | | 866 | | | | (5 | ) | | | (4 | ) | | | | | | | 591 | | | | 4 | | | | (5 | ) | | | | | | | 721 | | | | 5 | | | | 12 | |
| Brilinta | | | 839 | | | | 36 | | | | 39 | | | | | | | | 348 | | | | 45 | | | | | | | | 258 | | | | 12 | | | | 15 | | | | | | | | 44 | | | | 19 | | | | 22 | | | | | | | | 189 | | | | 69 | | | | 80 | |
| Farxiga | | | 835 | | | | 70 | | | | 72 | | | | | | | | 457 | | | | 75 | | | | | | | | 187 | | | | 48 | | | | 52 | | | | | | | | 58 | | | | 81 | | | | 72 | | | | | | | | 133 | | | | 82 | | | | 96 | |
| Seloken/Toprol-XL | | | 737 | | | | 4 | | | | 9 | | | | | | | | 95 | | | | 7 | | | | | | | | 90 | | | | (6 | ) | | | (5 | ) | | | | | | | 16 | | | | 33 | | | | 25 | | | | | | | | 536 | | | | 4 | | | | 12 | |
| Onglyza | | | 720 | | | | (8 | ) | | | (6 | ) | | | | | | | 376 | | | | (10 | ) | | | | | | | 132 | | | | (6 | ) | | | (5 | ) | | | | | | | 70 | | | | 6 | | | | 11 | | | | | | | | 142 | | | | (11 | ) | | | (4 | ) |
| Bydureon | | | 578 | | | | – | | | | – | | | | | | | | 463 | | | | (4 | ) | | | | | | | 100 | | | | 22 | | | | 23 | | | | | | | | 11 | | | | 38 | | | | 25 | | | | | | | | 4 | | | | (50 | ) | | | (25 | ) |
| Atacand | | | 315 | | | | (13 | ) | | | (8 | ) | | | | | | | 36 | | | | 6 | | | | | | | | 97 | | | | (8 | ) | | | (8 | ) | | | | | | | 20 | | | | (20 | ) | | | (20 | ) | | | | | | | 162 | | | | (17 | ) | | | (9 | ) |
| Byetta | | | 254 | | | | (20 | ) | | | (19 | ) | | | | | | | 164 | | | | (22 | ) | | | | | | | 45 | | | | (26 | ) | | | (25 | ) | | | | | | | 21 | | | | (5 | ) | | | (9 | ) | | | | | | | 24 | | | | – | | | | 13 | |
| Others | | | 437 | | | | (28 | ) | | | (26 | ) | | | | | | | 40 | | | | (27 | ) | | | | | | | 119 | | | | (17 | ) | | | (17 | ) | | | | | | | 50 | | | | (14 | ) | | | (21 | ) | | | | | | | 228 | | | | (35 | ) | | | (30 | ) |
| Total Cardiovascular & Metabolic Disease | | | 8,116 | | | | (14 | ) | | | (13 | ) | | | | | | | 3,202 | | | | (31 | ) | | | | | | | 1,894 | | | | – | | | | 1 | | | | | | | | 881 | | | | 6 | | | | (1 | ) | | | | | | | 2,139 | | | | 1 | | | | 8 | |
| | | | | | | | | | | | | | | | | | | | | | | | | | | | | | | | | | | | | | | | | | | | | | | | | | | | | | | | | | | | | | | | | | | | | | | | | |
| Respiratory: | | | | | | | | | | | | | | | | | | | | | | | | | | | | | | | | | | | | | | | | | | | | | | | | | | | | | | | | | | | | | | | | | | | | | | | | |
| Symbicort | | | 2,989 | | | | (12 | ) | | | (10 | ) | | | | | | | 1,242 | | | | (18 | ) | | | | | | | 909 | | | | (15 | ) | | | (12 | ) | | | | | | | 436 | | | | 8 | | | | 5 | | | | | | | | 402 | | | | 2 | | | | 10 | |
| Pulmicort | | | 1,061 | | | | 5 | | | | 8 | | | | | | | | 174 | | | | (13 | ) | | | | | | | 99 | | | | (15 | ) | | | (14 | ) | | | | | | | 90 | | | | 2 | | | | (3 | ) | | | | | | | 698 | | | | 15 | | | | 21 | |
| Tudorza/Eklira | | | 170 | | | | (11 | ) | | | (9 | ) | | | | | | | 77 | | | | (25 | ) | | | | | | | 83 | | | | 8 | | | | 9 | | | | | | | | 9 | | | | – | | | | – | | | | | | | | 1 | | | | – | | | | n/m | |
| Daliresp/Daxas | | | 154 | | | | 48 | | | | 48 | | | | | | | | 134 | | | | 29 | | | | | | | | 15 | | | | 100 | | | | 100 | | | | | | | | 1 | | | | n/m | | | | n/m | | | | | | | | 4 | | | | n/m | | | | n/m | |
| Duaklir | | | 63 | | | | n/m | | | | n/m | | | | | | | | – | | | | – | | | | | | | | 60 | | | | n/m | | | | n/m | | | | | | | | 2 | | | | n/m | | | | n/m | | | | | | | | 1 | | | | – | | | | n/m | |
| Others | | | 316 | | | | 22 | | | | 27 | | | | | | | | 11 | | | | (39 | ) | | | | | | | 118 | | | | 34 | | | | 38 | | | | | | | | 50 | | | | 108 | | | | 108 | | | | | | | | 137 | | | | 8 | | | | 13 | |
| Total Respiratory | | | 4,753 | | | | (5 | ) | | | (3 | ) | | | | | | | 1,638 | | | | (16 | ) | | | | | | | 1,284 | | | | (7 | ) | | | (4 | ) | | | | | | | 588 | | | | 12 | | | | 8 | | | | | | | | 1,243 | | | | 10 | | | | 17 | |
| | | | | | | | | | | | | | | | | | | | | | | | | | | | | | | | | | | | | | | | | | | | | | | | | | | | | | | | | | | | | | | | | | | | | | | | | |
| Other: | | | | | | | | | | | | | | | | | | | | | | | | | | | | | | | | | | | | | | | | | | | | | | | | | | | | | | | | | | | | | | | | | | | | | | | | |
| Nexium | | | 2,032 | | | | (19 | ) | | | (18 | ) | | | | | | | 554 | | | | (39 | ) | | | | | | | 251 | | | | (12 | ) | | | (11 | ) | | | | | | | 537 | | | | (2 | ) | | | (10 | ) | | | | | | | 690 | | | | (9 | ) | | | (3 | ) |
| Seroquel XR | | | 735 | | | | (28 | ) | | | (27 | ) | | | | | | | 515 | | | | (28 | ) | | | | | | | 134 | | | | (33 | ) | | | (32 | ) | | | | | | | 17 | | | | (32 | ) | | | (32 | ) | | | | | | | 69 | | | | (17 | ) | | | (7 | ) |
| Synagis | | | 677 | | | | 2 | | | | 2 | | | | | | | | 325 | | | | 14 | | | | | | | | 352 | | | | (7 | ) | | | (7 | ) | | | | | | | – | | | | – | | | | – | | | | | | | | – | | | | – | | | | – | |
| Losec/Prilosec | | | 276 | | | | (19 | ) | | | (17 | ) | | | | | | | 10 | | | | (44 | ) | | | | | | | 83 | | | | (14 | ) | | | (13 | ) | | | | | | | 55 | | | | (26 | ) | | | (31 | ) | | | | | | | 128 | | | | (15 | ) | | | (9 | ) |
| FluMist/Fluenz | | | 104 | | | | (64 | ) | | | (59 | ) | | | | | | | 33 | | | | (84 | ) | | | | | | | 64 | | | | (16 | ) | | | 3 | | | | | | | | 6 | | | | (14 | ) | | | (14 | ) | | | | | | | 1 | | | | n/m | | | | n/m | |
| Movantik/Moventig | | | 91 | | | | n/m | | | | n/m | | | | | | | | 90 | | | | n/m | | | | | | | | – | | | | – | | | | – | | | | | | | | – | | | | – | | | | – | | | | | | | | 1 | | | | – | | | | – | |
| Others | | | 1,152 | | | | (23 | ) | | | (20 | ) | | | | | | | 105 | | | | (54 | ) | | | | | | | 269 | | | | (27 | ) | | | (21 | ) | | | | | | | 198 | | | | (29 | ) | | | (27 | ) | | | | | | | 580 | | | | (9 | ) | | | (4 | ) |
| Total Other | | | 5,067 | | | | (20 | ) | | | (19 | ) | | | | | | | 1,632 | | | | (31 | ) | | | | | | | 1,153 | | | | (18 | ) | | | (15 | ) | | | | | | | 813 | | | | (13 | ) | | | (17 | ) | | | | | | | 1,469 | | | | (9 | ) | | | (4 | ) |
| Total Product Sales | | | 21,319 | | | | (10 | ) | | | (8 | ) | | | | | | | 7,365 | | | | (22 | ) | | | | | | | 5,064 | | | | (5 | ) | | | (3 | ) | | | | | | | 3,096 | | | | 2 | | | | (4 | ) | | | | | | | 5,794 | | | | – | | | | 6 | |
| | |
| 226 | | AstraZenecaAnnual Report and Form 20-F Information 2016 |
| | | | | | | | | | | | | | | | | | | | | | | | | | | | | | | | | | | | | | | | | | | | | | | | | | | | | | | | | | | | | | | | | | | | | | | | |
| | | World | | | | | | US | | | | | | | | | | | | Europe | | | | | | Established ROW | | | | | | Emerging Markets | |
| 2015 | | Sales
$m | | | Actual
% | | | CER
% | | | | | | Sales
$m | | | Actual
% | | | | | | Sales
$m | | | Actual
% | | | CER
% | | | | | | Sales
$m | | | Actual
% | | | CER
% | | | | | | Sales
$m | | | Actual
% | | | CER
% | |
| Oncology: | | | | | | | | | | | | | | | | | | | | | | | | | | | | | | | | | | | | | | | | | | | | | | | | | | | | | | | | | | | | | | | | | | | | | | | | |
| Faslodex | | | 704 | | | | (2 | ) | | | 9 | | | | | | | | 356 | | | | 5 | | | | | | | | 207 | | | | (15 | ) | | | 2 | | | | | | | | 54 | | | | (8 | ) | | | 5 | | | | | | | | 87 | | | | 14 | | | | 49 | |
| Zoladex | | | 816 | | | | (12 | ) | | | 7 | | | | | | | | 28 | | | | 8 | | | | | | | | 171 | | | | (24 | ) | | | (12 | ) | | | | | | | 272 | | | | (16 | ) | | | (2 | ) | | | | | | | 345 | | | | (2 | ) | | | 27 | |
| Iressa | | | 543 | | | | (13 | ) | | | (2 | ) | | | | | | | 6 | | | | n/m | | | | | | | | 128 | | | | (22 | ) | | | (8 | ) | | | | | | | 137 | | | | (23 | ) | | | (10 | ) | | | | | | | 272 | | | | (3 | ) | | | 4 | |
| Tagrisso | | | 19 | | | | n/m | | | | n/m | | | | | | | | 15 | | | | n/m | | | | | | | | 4 | | | | n/m | | | | n/m | | | | | | | | – | | | | – | | | | – | | | | | | | | – | | | | – | | | | – | |
| Casodex | | | 267 | | | | (17 | ) | | | (6 | ) | | | | | | | 1 | | | | (80 | ) | | | | | | | 30 | | | | (29 | ) | | | (14 | ) | | | | | | | 131 | | | | (22 | ) | | | (11 | ) | | | | | | | 105 | | | | 1 | | | | 9 | |
| Arimidex | | | 250 | | | | (16 | ) | | | (5 | ) | | | | | | | 19 | | | | 27 | | | | | | | | 49 | | | | (36 | ) | | | (24 | ) | | | | | | | 79 | | | | (27 | ) | | | (17 | ) | | | | | | | 103 | | | | 4 | | | | 16 | |
| Lynparza | | | 94 | | | | n/m | | | | n/m | | | | | | | | 70 | | | | n/m | | | | | | | | 23 | | | | n/m | | | | n/m | | | | | | | | – | | | | – | | | | – | | | | | | | | 1 | | | | n/m | | | | n/m | |
| Others | | | 132 | | | | (7 | ) | | | 6 | | | | | | | | 19 | | | | (24 | ) | | | | | | | 23 | | | | (30 | ) | | | (18 | ) | | | | | | | 60 | | | | 25 | | | | 44 | | | | | | | | 30 | | | | (17 | ) | | | – | |
| Total Oncology | | | 2,825 | | | | (7 | ) | | | 7 | | | | | | | | 514 | | | | 25 | | | | | | | | 635 | | | | (19 | ) | | | (4 | ) | | | | | | | 733 | | | | (17 | ) | | | (4 | ) | | | | | | | 943 | | | | – | | | | 18 | |
| | | | | | | | | | | | | | | | | | | | | | | | | | | | | | | | | | | | | | | | | | | | | | | | | | | | | | | | | | | | | | | | | | | | | | | | | |
| Cardiovascular & Metabolic Disease: | | | | | | | | | | | | | | | | | | | | | | | | | | | | | | | | | | | | | | | | | | | | | | | | | | | | | | | | | | | | | | | | | | | | | | | | |
| Crestor | | | 5,017 | | | | (9 | ) | | | (3 | ) | | | | | | | 2,844 | | | | (3 | ) | | | | | | | 916 | | | | (24 | ) | | | (9 | ) | | | | | | | 571 | | | | (14 | ) | | | (1 | ) | | | | | | | 686 | | | | (6 | ) | | | 2 | |
| Brilinta | | | 619 | | | | 30 | | | | 44 | | | | | | | | 240 | | | | 64 | | | | | | | | 230 | | | | – | | | | 18 | | | | | | | | 37 | | | | 12 | | | | 33 | | | | | | | | 112 | | | | 70 | | | | 91 | |
| Farxiga | | | 492 | | | | 119 | | | | 137 | | | | | | | | 261 | | | | 114 | | | | | | | | 126 | | | | 91 | | | | 126 | | | | | | | | 32 | | | | 88 | | | | 124 | | | | | | | | 73 | | | | n/m | | | | n/m | |
| Seloken/Toprol-XL | | | 710 | | | | (6 | ) | | | 4 | | | | | | | | 89 | | | | (2 | ) | | | | | | | 97 | | | | (22 | ) | | | (6 | ) | | | | | | | 12 | | | | (37 | ) | | | (26 | ) | | | | | | | 512 | | | | (2 | ) | | | 9 | |
| Onglyza | | | 786 | | | | (4 | ) | | | 2 | | | | | | | | 420 | | | | (13 | ) | | | | | | | 141 | | | | (9 | ) | | | 8 | | | | | | | | 66 | | | | 12 | | | | 27 | | | | | | | | 159 | | | | 27 | | | | 41 | |
| Bydureon | | | 580 | | | | 32 | | | | 35 | | | | | | | | 482 | | | | 29 | | | | | | | | 81 | | | | 42 | | | | 65 | | | | | | | | 8 | | | | 60 | | | | 80 | | | | | | | | 9 | | | | 125 | | | | 150 | |
| Atacand | | | 358 | | | | (29 | ) | | | (15 | ) | | | | | | | 34 | | | | (23 | ) | | | | | | | 105 | | | | (38 | ) | | | (26 | ) | | | | | | | 26 | | | | (40 | ) | | | (30 | ) | | | | | | | 193 | | | | (21 | ) | | | (4 | ) |
| Byetta | | | 316 | | | | (3 | ) | | | 2 | | | | | | | | 209 | | | | 5 | | | | | | | | 62 | | | | (23 | ) | | | (11 | ) | | | | | | | 22 | | | | (19 | ) | | | (7 | ) | | | | | | | 23 | | | | 15 | | | | 30 | |
| Others | | | 611 | | | | (18 | ) | | | (10 | ) | | | | | | | 55 | | | | (28 | ) | | | | | | | 143 | | | | (29 | ) | | | (15 | ) | | | | | | | 60 | | | | (26 | ) | | | (15 | ) | | | | | | | 353 | | | | (9 | ) | | | (3 | ) |
| Total Cardiovascular & Metabolic Disease | | | 9,489 | | | | (3 | ) | | | 4 | | | | | | | | 4,634 | | | | 4 | | | | | | | | 1,901 | | | | (17 | ) | | | (1 | ) | | | | | | | 834 | | | | (12 | ) | | | 1 | | | | | | | | 2,120 | | | | – | | | | 11 | |
| | | | | | | | | | | | | | | | | | | | | | | | | | | | | | | | | | | | | | | | | | | | | | | | | | | | | | | | | | | | | | | | | | | | | | | | | |
| Respiratory: | | | | | | | | | | | | | | | | | | | | | | | | | | | | | | | | | | | | | | | | | | | | | | | | | | | | | | | | | | | | | | | | | | | | | | | | |
| Symbicort | | | 3,394 | | | | (11 | ) | | | (3 | ) | | | | | | | 1,520 | | | | 1 | | | | | | | | 1,076 | | | | (26 | ) | | | (14 | ) | | | | | | | 404 | | | | (12 | ) | | | 2 | | | | | | | | 394 | | | | 6 | | | | 22 | |
| Pulmicort | | | 1,014 | | | | 7 | | | | 15 | | | | | | | | 200 | | | | (5 | ) | | | | | | | 117 | | | | (28 | ) | | | (13 | ) | | | | | | | 88 | | | | (9 | ) | | | 4 | | | | | | | | 609 | | | | 28 | | | | 35 | |
| Tudorza/Eklira | | | 190 | | | | n/m | | | | n/m | | | | | | | | 103 | | | | n/m | | | | | | | | 76 | | | | n/m | | | | n/m | | | | | | | | 9 | | | | n/m | | | | n/m | | | | | | | | 2 | | | | n/m | | | | n/m | |
| Daliresp/Daxas | | | 104 | | | | n/m | | | | n/m | | | | | | | | 104 | | | | n/m | | | | | | | | – | | | | – | | | | – | | | | | | | | – | | | | – | | | | – | | | | | | | | – | | | | – | | | | – | |
| Duaklir | | | 27 | | | | n/m | | | | n/m | | | | | | | | – | | | | – | | | | | | | | 26 | | | | n/m | | | | n/m | | | | | | | | 1 | | | | n/m | | | | n/m | | | | | | | | – | | | | – | | | | – | |
| Others | | | 258 | | | | (15 | ) | | | (5 | ) | | | | | | | 18 | | | | (31 | ) | | | | | | | 88 | | | | (20 | ) | | | (6 | ) | | | | | | | 25 | | | | (7 | ) | | | 4 | | | | | | | | 127 | | | | (9 | ) | | | (1 | ) |
| Total Respiratory | | | 4,987 | | | | (2 | ) | | | 7 | | | | | | | | 1,945 | | | | 11 | | | | | | | | 1,383 | | | | (21 | ) | | | (7 | ) | | | | | | | 527 | | | | (9 | ) | | | 5 | | | | | | | | 1,132 | | | | 15 | | | | 25 | |
| | | | | | | | | | | | | | | | | | | | | | | | | | | | | | | | | | | | | | | | | | | | | | | | | | | | | | | | | | | | | | | | | | | | | | | | | |
| Other: | | | | | | | | | | | | | | | | | | | | | | | | | | | | | | | | | | | | | | | | | | | | | | | | | | | | | | | | | | | | | | | | | | | | | | | | |
| Nexium | | | 2,496 | | | | (32 | ) | | | (26 | ) | | | | | | | 902 | | | | (52 | ) | | | | | | | 284 | | | | (23 | ) | | | (7 | ) | | | | | | | 549 | | | | (9 | ) | | | 5 | | | | | | | | 761 | | | | (6 | ) | | | 3 | |
| Seroquel XR | | | 1,025 | | | | (16 | ) | | | (12 | ) | | | | | | | 716 | | | | (3 | ) | | | | | | | 202 | | | | (41 | ) | | | (30 | ) | | | | | | | 25 | | | | (43 | ) | | | (34 | ) | | | | | | | 82 | | | | (18 | ) | | | (1 | ) |
| Synagis | | | 662 | | | | (26 | ) | | | (26 | ) | | | | | | | 285 | | | | (43 | ) | | | | | | | 377 | | | | (6 | ) | | | (6 | ) | | | | | | | – | | | | – | | | | – | | | | | | | | – | | | | – | | | | – | |
| Losec/Prilosec | | | 340 | | | | (19 | ) | | | (10 | ) | | | | | | | 18 | | | | (32 | ) | | | | | | | 97 | | | | (25 | ) | | | (10 | ) | | | | | | | 74 | | | | (30 | ) | | | (19 | ) | | | | | | | 151 | | | | (5 | ) | | | (1 | ) |
| FluMist/Fluenz | | | 288 | | | | (2 | ) | | | – | | | | | | | | 206 | | | | (6 | ) | | | | | | | 76 | | | | 9 | | | | 16 | | | | | | | | 7 | | | | – | | | | 14 | | | | | | | | (1 | ) | | | (100 | ) | | | (100 | ) |
| Movantik/Moventig | | | 29 | | | | n/m | | | | n/m | | | | | | | | 28 | | | | n/m | | | | | | | | 1 | | | | n/m | | | | n/m | | | | | | | | – | | | | – | | | | – | | | | | | | | – | | | | – | | | | – | |
| Others | | | 1,500 | | | | (12 | ) | | | – | | | | | | | | 226 | | | | 50 | | | | | | | | 367 | | | | (28 | ) | | | (15 | ) | | | | | | | 273 | | | | (17 | ) | | | (3 | ) | | | | | | | 634 | | | | (12 | ) | | | 1 | |
| Total Other | | | 6,340 | | | | (23 | ) | | | (16 | ) | | | | | | | 2,381 | | | | (32 | ) | | | | | | | 1,404 | | | | (23 | ) | | | (13 | ) | | | | | | | 928 | | | | (15 | ) | | | (1 | ) | | | | | | | 1,627 | | | | (9 | ) | | | 2 | |
| Total Product Sales | | | 23,641 | | | | (9 | ) | | | (1 | ) | | | | | | | 9,474 | | | | (6 | ) | | | | | | | 5,323 | | | | (20 | ) | | | (6 | ) | | | | | | | 3,022 | | | | (14 | ) | | | – | | | | | | | | 5,822 | | | | – | | | | 12 | |
All commentary in this section relates to Product Sales. The market definitions used in the geographical areas review below are defined in the Glossary on page 239.
2016 in brief
Sales decreased 10% (CER: decreased 8%) in the year to $21,319 million (2015: $23,641 million; 2014: $26,095 million).
In 2016, sales in the US decreased 22% to $7,365 million (2015: $9,474 million; 2014: $10,120 million). The decline in US sales reflected the competition from genericCrestor medicines that entered the US market from July 2016. Unfavourable
managed-care pricing and continued competitive intensity also impacted the sales ofSymbicort.
Sales in Europe decreased 5% (CER: decreased 3%) to $5,064 million in the year (2015: $5,323 million; 2014: $6,638 million). Strong growth in sales ofForxiga, up 48% (CER: up 52%) to $187 million (2015: $126 million; 2014: $66 million), andBrilique, up 12% (CER: up 15%) to $258 million (2015: $230 million; 2014: $231 million), was more than offset by a 15% decrease inSymbicort sales (CER: 12% decrease) to $909 million (2015: $1,076 million; 2014: $1,462 million). However,Symbicort maintained its position
as the number one ICS/LABA medicine by volume, despite competition from analogue medicines.Lynparza andTagrisso sales increased to $81 million (2015: $23 million; 2014: $nil) and $76 million (2015: $4 million; 2014: $nil) respectively.
Sales in the Established Rest of World (ROW) in 2016 increased 2% (CER: decreased 4%) to $3,096 million (2015: $3,022 million; 2014: $3,510 million). Sales ofForxiga in Established ROW increased 81% (CER: increased 72%), to $58 million (2015: $32 million; 2014: $17 million).Nexium sales decreased 2% (CER: decreased 10%) to
| | |
| AstraZenecaAnnual Report and Form 20-F Information 2016 | | 227 |
Additional Information
Geographical Reviewcontinued
$537 million (2015: $549 million; 2014: $606 million). Japan sales increased 8% (CER: decreased 3%) to $2,184 million (2015: $2,020 million; 2014: $2,227 million), reflecting the biennial price reduction effective from April 2016 of around 6% after eliminating the exchange rate impact. The CER percentage decline in Japan was partly mitigated by stable sales ofCrestor of $521 million (2015: $468 million; 2014: $502 million) in the year. Since the launch ofTagrisso in Japan in March 2016, sales amounted to $82 million (2015 & 2014: $nil).
Sales growth for the year in Emerging Markets remained stable (CER: increased 6%) at $5,794 million (2015: $5,822 million; 2014: $5,827 million). Sales growth was impacted by challenging macro-economic conditions in Latin America, such as the current economic situation in Venezuela, where ex-Brazil sales decreased 20% (CER: decreased 7%) to $516 million (2015: $643 million; 2014: $730 million). The effects of significant reductions in Saudi Arabian governmental healthcare spending, as well as the reduction of AstraZeneca’s activities in Venezuela, also adversely impacted sales. China sales increased 4% (CER: increased 10%) to $2,636 million (2015: $2,530 million; 2014: $2,242 million), and represent 45% of the Group’s Emerging Markets sales. Sales in Brazil decreased 9% (CER: increased 2%) to $348 million (2015: $381 million; 2014: $451 million). The increase after eliminating exchange rate impacts reflects the strong performances ofForxiga, which increased 40% (CER: increased 50%) to $28 million (2015: $20 million; 2014: $5 million), Oncology medicines, which decreased 8% (CER: increased 1%) to $82 million (2015: $89 million; 2014: $99 million), andSeloken, which decreased 6% (CER: increased 6%) to $63 million (2015: $67 million; 2014: $84 million). Russia sales increased 1% (CER: increased 13%) to $233 million (2015: $231 million; 2014: $312 million), led by strong performances in Cardiovascular & Metabolic Disease medicine sales, which increased 23% (CER: increased 38%) to $80 million (2015: $65 million; 2014: $89 million).
2015 in brief
Product Sales decreased 9% (CER: decreased 1%) in the year to $23,641 million (2014: $26,095 million; 2013: $25,711 million).
In 2015, sales in the US decreased 6% to $9,474 million (2014: $10,120 million; 2013: $9,691 million). Declines in revenue fromNexium,Crestor andSynagis were partially offset by strong performance of our Growth Platforms, includingFarxiga, Bydureon and
Brilinta, the launches ofLynparza andTagrisso as well as the impact of completing the acquisition of Actavis’s rights toTudorza andDaliresp in the US.
Sales in Europe decreased 20% (CER: decreased 6%) to $5,323 million in the year (2014: $6,638 million; 2013: $6,658 million). Strong growth from the Diabetes portfolio was more than offset by pricing pressure and continued generic competition facingCrestor, Nexium andSeroquel XR. A 26% decrease (CER: decrease of 14%) inSymbicort sales to $1,076 million (2014: $1,462 million; 2013: $1,502 million) reflected adverse pricing movements driven by competition from analogues in key markets. Also,Lynparzawas launched in Europe in 2015.
Sales in the Established ROW decreased 14% (CER: stable) to $3,022 million (2014: $3,510 million; 2013: $3,973 million). Japan sales decreased 9% (CER: increased 4%) to $2,020 million (2014: $2,227 million; 2013: $2,485 million). After eliminating the exchange rate impact, sales were driven by strong growth ofCrestor andNexium, though there was a decline in the sales ofSymbicort. Canada sales decreased 10% (CER: increased 4%) to $533 million (2014: $590 million; 2013: $637 million) in the year, driven by increased sales ofOnglyza andSymbicort after exchange rate effects.
Emerging Markets sales in the year remained stable (CER: increased 12%) at $5,822 million (2014: $5,827 million; 2013: $5,389 million), with contributions to CER growth emanating from across the region. Around 60% of Emerging Markets sales were derived outside of China in the year. China sales in the year increased 13% (CER: increased 15%) to $2,530 million (2014: $2,242 million; 2013: $1,840 million), while Brazil sales decreased 16% (CER: increased 16%) to $381 million (2014: $451 million; 2013: $447 million) and Russia sales decreased 26% (CER: increased 21%) to $231 million (2014: $312 million; 2013: $310 million).
Sales by region
US
Sales in the US decreased 22% to $7,365 million (2015: $9,474 million; 2014: $10,120 million).
Oncology
Oncology sales in the US increased 74% to $893 million (2015: $514 million; 2014: $411 million). An increase inTagrisso andLynparza sales, which were launched in 2015, contributed to this.
Faslodex sales increased 23% to $438 million (2015: $356 million; 2014: $340 million), mainly driven by an expanded label in March 2016, in combination with palbociclib, for 2nd line advanced or metastatic breast cancer.
Sales ofTagrisso were $254 million (2015: $15 million; 2014: $nil). On 29 September 2016, a third party, blood-based companion-diagnostic test forTagrissowas approved in the US. The test is designed to confirm the presence of a T790M mutation in patients.
Lynparza sales increased 81% to $127 million (2015: $70 million; 2014: $nil), reflecting high market-penetration rates.
Zoladex sales increased 25% to $35 million (2015: $28 million; 2014: $26 million).
Cardiovascular & Metabolic Disease
Cardiovascular & Metabolic Disease sales in the US decreased 31% to $3,202 million (2015: $4,634 million; 2014: $4,451 million), primarily due to the decline inCrestor sales.
Crestor sales decreased 57% to $1,223 million (2015: $2,844 million; 2014: $2,918 million), reflecting the market entry ofCrestor generic medicines.
Brilinta sales increased 45% to $348 million (2015: $240 million; 2014: $146 million), reflecting updated preferred guidelines regarding acute coronary syndrome treatment from the American College of Cardiology and the American Heart Association;Brilinta remained the branded oral anti-platelet market leader in the US.
Sales ofFarxiga in the US increased 75% to $457 million (2015: $261 million; 2014: $122 million), primarily reflecting overall market growth and a higher net price. A stronger emphasis on promotional activity and improved levels of patient access resulted in market-share growth.
Onglyza sales decreased 10% to $376 million (2015: $420 million; 2014: $481 million), as the Company prioritised sales and marketing resources towardsFarxiga. Continued competitive pressures in the DPP-4 class led to lower market share but were partially offset by reduced levels of utilisation of patient-access programmes.
Combined sales forBydureon/Byetta were $627 million (2015: $691 million; 2014: $573 million).Bydureon sales decreased 4% to $463 million (2015: $482 million; 2014: $374 million), representing 74% of totalBydureon/ Byetta US sales. Approximately 75% of sales came from the new dual-chamber pen
| | |
| 228 | | AstraZenecaAnnual Report and Form 20-F Information 2016 |
compared to the prior tray presentation. The decrease inByetta sales of 22% to $164 million (2015: $209 million; 2014: $199 million) was attributed to the Company’s promotional focus onBydureon. The decline in bothBydureon andByetta US sales reflected lower net pricing.
Respiratory
Respiratory sales in the US decreased 16% to $1,638 million (2015: $1,945 million; 2014: $1,748 million). Declines inSymbicort andTudorza sales were offset by growth inDaliresp sales.
Symbicort sales decreased 18% to $1,242 million (2015: $1,520 million; 2014: $1,511 million). This primarily reflected the impact of the effects of pricing pressure from managed-care access within the ICS/LABA class. Competition also remained intense from other classes.
Sales ofTudorza decreased 25% to $77 million (2015: $103 million; 2014: $nil), reflecting adverse market demand, limited Medicare Part D access and the focus on the launch ofBevespi.
Daliresp sales increased 29% to $134 million (2015: $104 million; 2014: $nil) driven primarily by favourable market penetration. US sales represented 87% of global sales.
Other
Other sales in the US decreased 31% to $1,632 million (2015: $2,381 million; 2014: $3,510 million).
Nexium sales decreased 39% to $554 million (2015: $902 million; 2014: $1,876 million), reflecting lower demand and inventory de-stocking, which followed the loss of exclusivity in 2015.
Sales ofSeroquel XR decreased 28% to $515 million (2015: $716 million; 2014: $738 million) as since 1 November 2016, two companies have launched licensed generic medicines in the US.
Synagis sales increased 14% to $325 million (2015: $285 million; 2014: $499 million), due to greater market demand.
Sales ofFluMist decreased 84% to $33 million (2015: $206 million; 2014: $218 million). The Company confirmed on 23 June 2016 that the Advisory Committee on Immunization Practices (ACIP) of the US Centers for Disease Control and Prevention had provided its interim recommendation not to useFluMist Quadrivalent Live Attenuated Influenza Vaccine (FluMist Quadrivalent) in the US for the 2016 to 2017 influenza season.
Europe
Sales in Europe decreased 5% (CER: decreased 3%) to $5,064 million in the year (2015: $5,323 million; 2014: $6,638 million).
Oncology
Total Oncology sales in Europe increased 16% (CER: increased 18%) to $733 million (2015: $635 million; 2014: $788 million), driven by new product launches.
Sales ofFaslodex increased 10% (CER: increased 11%) to $228 million (2015: $207 million; 2014: $245 million) due to early line use with palbociclib.Tagrisso sales in Europe were $76 million (2015: $4 million; 2014: $nil), following regulatory approval in the EU during the year.
Sales ofZoladex decreased 8% (CER: decreased 4%) to $156 million (2015: $171 million; 2014: $226 million), andIressa sales decreased 7% (CER: decreased 5%) to $120 million (2015: $128 million; 2014: $166 million).
However,Lynparza sales increased to $81 million (2015: $23 million; 2014: $nil), following several successful launches.
Cardiovascular & Metabolic Disease
Cardiovascular & Metabolic Disease sales in Europe were $1,894 million (2015: $1,901 million; 2014: $2,283 million), consistent with prior year at actual rate of exchange but a 1% increase at CER. The decrease inCrestor sales was partly offset by an increase inBrilique andForxiga sales.
Crestor sales decreased 5% (CER: decreased 4%) to $866 million (2015: $916 million; 2014: $1,200 million), reflecting the increasing use of generic medicines.
Sales ofBrilique in Europe increased 12% (CER: increased 15%) to $258 million (2015: $230 million; 2014: $231 million), reflecting indication leadership across a number of markets. In the year, the German Institute for Quality and Efficiency in Healthcare (IQWiG) gave its assessment of the additional benefit fromBrilique at the 60mg dose as tested in the PEGASUS trial, as did the National Institute for Health and Clinical Excellence in England, UK.
Forxiga sales increased 48% (CER: increased 52%) to $187 million (2015: $126 million; 2014: $66 million), as the medicine continued to lead the growing class.
Onglyza sales decreased 6% (CER: decreased 5%) to $132 million (2015: $141 million; 2014: $155 million), reflecting the Company’s focus onForxiga.
Sales ofBydureon/Byetta increased 1% (CER: increased 3%) to $145 million (2015: $143 million; 2014: $138 million), reflecting the Company’s ongoing effort to expand its Diabetes presence.
Respiratory
Respiratory sales in Europe amounted to $1,284 million in 2016 (2015: $1,383 million; 2014: $1,747 million), a decrease of 7% (CER: decrease of 4%). The reduction was driven by reducedSymbicort sales, offset by newDaxas sales.
Symbicort sales decreased 15% (CER: decreased 12%) to $909 million (2015: $1,076 million; 2014: $1,462 million), primarily a result of competition from branded and analogue medicines. European rights toDaxas were added in May 2016; sales amounted to $15 million (2015 and 2014: $nil).
Other
Total Other sales in Europe amounted to $1,153 million (2015: $1,404 million; 2014: $1,820 million), a decrease of 18% (CER: decrease of 15%).
Sales ofNexium decreased 12% (CER: decreased 11%) to $251 million (2015: $284 million; 2014: $368 million) andSeroquel XR sales decreased 33% (CER: decreased 32%) to $134 million (2015: $202 million; 2014: $343 million); declines reflect the impact of generic competition.
Established Rest of World
Sales in the Established ROW increased 2% (CER: decreased 4%) to $3,096 million (2015: $3,022 million; 2014: $3,510 million).
Oncology
Oncology sales in Established ROW increased 11% (CER: increased 2%) to $814 million (2015: $733 million; 2014: $883 million). The negative impact of generic competition on our non-promoted legacy Oncology product was offset by new sales ofTagrisso.
On 27 December 2016, a third party, blood-based companion-diagnostic test forTagrisso was approved in Japan. The test is designed to confirm the presence of a T790M mutation in patients. Sales ofTagrisso in Japan were $82 million (2015 and 2014: $nil).
Sales ofFaslodex increased 26% (CER: increased 15%) to $68 million (2015: $54 million; 2014: $59 million). This was due to an increase in demand in Japan, where sales increased 24% (CER: increased 12%) to $63 million (2015: $51 million; 2014: $56 million).
| | |
| AstraZenecaAnnual Report and Form 20-F Information 2016 | | 229 |
Additional Information
Geographical Reviewcontinued
Cardiovascular & Metabolic Disease
Cardiovascular & Metabolic Disease sales in Established ROW increased 6% (CER: decreased 1%) to $881 million (2015: $834 million; 2014: $951 million). This primarily consists ofCrestor sales of $591 million (2015: $571 million; 2014: $667 million),Onglyza sales of $70 million (2015: $66 million; 2014: $59 million), andForxiga sales of $58 million (2015: $32 million; 2014: $17 million).
Crestor consolidated its position as the leading statin in Japan, with sales growth of 11% (CER: stable) to $521 million (2015: $468 million; 2014: $502 million), driven by an increase in volume.
Respiratory
Respiratory sales in Established ROW increased 12% (CER: increased 8%) to $588 million (2015: $527 million; 2014: $582 million).Symbicort sales increased 8% (CER: increased 5%) to $436 million (2015: $404 million; 2014: $458 million).
Other
Total Other sales in Established ROW decreased 13% (CER: decreased 17%) to $813 million (2015: $928 million; 2014: $1,094 million).
Notably, Japan sales ofNexium increased 8% (CER: decreased 4%) to $436 million (2015: $405 million; 2014: $358 million). After eliminating the exchange rate impact, the decrease in sales reflects the mandated biennial price reduction, effective from April 2016.
Emerging Markets
Sales in Emerging Markets remained stable (CER: increased 6%) at $5,794 million (2015: $5,822 million; 2014: $5,827 million).
Oncology
Oncology sales in Emerging Markets remained stable (CER: increased 6%) at $943 million (2015: $943 million; 2014: $945 million).
Sales ofFaslodex increased 10% (CER: increased 25%) to $96 million (2015: $87 million; 2014: $76 million), which was supported by China sales of $20 million (2015: $11 million; 2014: $7 million).
Sales ofIressa decreased 14% (CER: decreased 10%) to $233 million (2015: $272 million; 2014: $280 million). China sales ofIressa decreased 21% (CER: decreased 16%) to $116 million (2015: $146 million; 2014: $142 million), as a result of the price
reset following national reimbursement listing obtained in June 2016. Strong competition from branded medicines in Korea also contributed to the decline.
Regulatory approvals forTagrisso were granted in a number of markets, including Brazil, Hong Kong, Singapore, Taiwan and the United Arab Emirates.
Cardiovascular & Metabolic Disease
Cardiovascular & Metabolic Disease sales in Emerging Markets increased 1% (CER: increased 8%), to $2,139 million (2015: $2,120 million; 2014: $2,117 million).
Crestor sales in Emerging Markets increased 5% (CER: increased 12%) to $721 million (2015: $686 million; 2014: $727 million), reflecting growth in China of 21% (CER: growth of 27%) and growth in Russia of 16% (CER: growth of 28%).
Sales ofBrilique increased 69% (CER: increased 80%) to $189 million (2015: $112 million; 2014: $66 million), with China sales more than doubling. China represented 47% of Emerging Markets sales of the medicine at $89 million (2015: $38 million; 2014: $15 million), despite the medicine not being included on the National Reimbursement Drug List. Growth was underpinned by a combination of strong levels of hospital-listing expansion and increased use in existing hospitals.
Sales ofForxiga increased 82% (CER: increase 96%) to $133 million (2015: $73 million; 2014: $20 million), driven by ongoing launches and improved access. In particular, strong performances were seen in the Asia Pacific region, which increased 100% (CER: increased 108%) to $52 million (2015: $26 million; 2014: $5 million), Brazil, which increased 40% (CER: increased 50%), and the Middle East, Africa and Others region increased to $32 million (2015: $15 million; 2014: $2 million).
Sales ofByetta remained stable (CER: increased 13%) to $24 million (2015: $23 million; 2014: $20 million), and sales ofBydureon decreased 50% (CER: decreased 25%) to $4 million (2015: $9 million; 2014: $4 million). On 10 October 2016, AstraZeneca entered into a strategic collaboration with 3SBio Inc. (3SBio) for the rights to commercialiseBydureon and Byetta in the Chinese market. The agreement allowed the Company to benefit from 3SBio’s established local expertise in injectable medicines and focus on oral Type 2 diabetes medicines.
On 29 February 2016, the Company sold the commercialisation rights forPlendil in China; sales in Emerging Markets forPlendil amounted to $119 million (2015: $213 million; 2014: $221 million).
Respiratory
Respiratory sales in Emerging Markets increased 10% (CER: increased 17%) to $1,243 million (2015: $1,132 million; 2014: $986 million).
Sales ofSymbicort increased 2% (CER: increased 10%) to $402 million (2015: $394 million; 2014: $370 million). Sales in China increased 26% (CER: increased 32%) to $156 million (2015: $124 million; 2014: $91 million), which was offset by a 12% decrease (CER: increase of 12%) in Latin America (ex-Brazil), where sales were $37 million (2015: $42 million; 2014: $57 million).
Strong underlying volume growth ofPulmicort in Emerging Markets drove a 15% sales increase (CER: 21% sales increase) to $698 million (2015: $609 million; 2014: $476 million). China sales increased 18% (CER: increased 24%) to $570 million (2015: $485 million; 2014: $348 million), and represented 54% of sales ofPulmicort. Volume demand in China partly reflected the long-term increase of acute COPD and paediatric asthma. AstraZeneca continued its expansion of treatment centres and provided increased access to home-based patient-care systems.
Other
Other sales in Emerging Markets decreased 9% (CER: decreased 4%) to $1,469 million (2015: $1,627 million; 2014: $1,779 million), reflecting declines inNexium sales, which decreased 9% (CER: decreased 3%) to $690 million (2015: $761 million; 2014: $805 million), andSeroquel XR sales, which decreased 17% (CER: decreased 7%) to $69 million (2015: $82 million; 2014: $99 million).
Sales of other products within this therapy area decreased 9% (CER: decreased 4%) to $580 million (2015: $634 million; 2014: $717 million). This includes the anaesthetics portfolio sales of $258 million (2015: $261 million; 2014: $305 million), which was disposed of on 1 September 2016, andMerrem sales of $181 million (2015: $199 million; 2014: $211 million), which was disposed of along with other products on 23 December 2016.
| | |
| 230 | | AstraZenecaAnnual Report and Form 20-F Information 2016 |
|
Sustainability: supplementary information |
Summary information about our commitment and performance in key areas is introduced on page 43 and is integrated into the relevant sections of this Annual Report. Further information about these and other areas is available on our website, www.astrazeneca.com.
A core element of our business strategy is value-creating business development activity that strengthens our pipeline and accelerates growth. This includes targeted acquisitions. When we acquire companies we aim to align standards of responsible business and incorporate the companies in the setting of targets and measurement of performance.
Benchmarking
Our DJSI performance was summarised on page 44. We achieved a total score of 86% (2015: 84%) compared with a sector best score of 89%. Sector best scores attained for five criteria: Occupational Health and Safety (88%), Code of Conduct (100%), Marketing Practices (93%), Climate Strategy (100%) and Health Outcomes Contribution (100%). We increased individual scores for 11 out of 22 criteria for 2016: Risk & Crisis Management, Marketing Practices, Tax Management, Climate Strategy, Environmental Reporting, Operational Eco-efficiency, Human Capital Development, Talent Attraction & Retention, Corporate Citizenship & Philanthropy, Occupational Health & Safety and Addressing the Cost Burden.
External assurance
Bureau Veritas has provided independent external assurance to a limited level on the following sustainability information contained within this Annual Report:
| > | Sustainability framework, page 43 |
| > | Benchmarking and assurance, page 44 |
| > | Responsible research, page 47 |
| > | Healthy Heart Africa, page 49 |
| > | Pricing and access to healthcare, page 51 |
| > | Sales and marketing ethics, page 52 |
| > | Working with suppliers, page 52 |
| > | Safety, health and wellbeing, page 53 |
| > | Community investment, page 53 |
| > | Develop a strong and diverse pipeline of leaders, page 55 |
| > | Managing change, page 57 |
| > | Employee relations, page 57 |
| > | Natural resource efficiency, page 60 |
| > | Following the science to protect the environment, page 61 |
Based on the evidence provided and subject to the scope, objectives and limitations defined in the full assurance statement, nothing has come to the attention of Bureau Veritas causing them to believe that the sustainability information contained within this Annual Report is materially misstated. Bureau Veritas is a professional services company that has a long history of providing independent assurance services in environmental, health, safety, social and ethical management and disclosure.
The full assurance statement, which includes Bureau Veritas’s scope of work, methodology, overall opinion, and limitations and exclusions, is available on our website, www.astrazeneca.com.
Carbon reporting
The table below provides data on our global greenhouse gas emissions for 2016. The data coverage includes 100% of our owned and controlled sites globally. In 2015, data was recalculated to include acquired sites that form part of the 2016 to 2025 strategy baseline. We have reported on all of the emission sources required under the Quoted Companies Greenhouse Gas Emissions (Directors’ Reports) Regulations 2013. These sources fall within our consolidated Financial Statements. We do not have responsibility for any emission sources that are not included in our consolidated Financial Statements.
We have used the GHG Protocol Corporate Accounting and Reporting Standard (revised edition). Emission factors for electricity have been derived from the International Energy Agency, USEPA eGRID and the EU RE:DISS II databases and for all other fuels and emission sources from the 2006 IPCC Guidelines for National Greenhouse Gas Inventories.
Bureau Veritas has undertaken a limited assurance on the 2016 GHG emissions data. The assurance statement, including scope, methodology, overall opinion, and limitations and exclusions, is available on our website, www.astrazeneca.com.
Carbon reporting
Global greenhouse gas emissions data for the period 1 January 2016 to 31 December 2016
| | | | | | | | | | | | | | | | |
| | | | | | | | | Tonnes of CO2e | |
| | | 2016 | | | 2015 | | | 2014 | | | 20131 | |
| Emissions from: | | | | | | | | | | | | | | | | |
| Scope 1: Combustion of fuel and operation of facilities2 | | | 329,140 | | | | 338,038 | | | | 328,722 | | | | 318,626 | |
| Scope 2 (Market-based): Electricity (net of market instruments), heat, steam and cooling purchased for own use3 | | | 219,574 | | | | 351,471 | | | | N/A | | | | N/A | |
| Scope 2 (Location-based): Electricity, heat, steam and cooling purchased for own use3 | | | 292,363 | | | | 287,903 | | | | 290,288 | | | | 274,399 | |
| Company’s chosen intensity measurement: | | | | | | | | | | | | | | | | |
| Scope 1 + Scope 2 (Market-based) emissions reported above normalised to million US dollar revenue | | | 23.9 | | | | 27.9 | | | | N/A | | | | N/A | |
| Scope 3 Total: Emissions from all 15 Greenhouse Gas Protocol Scope 3 Categories4(one year in arrears) | | | 7,661,092 | | | | 6,310,359 | | | | N/A | | | | N/A | |
| Scope 3 in our Operational Footprint: | | | | | | | | | | | | | | | | |
| Supply chain emissions: Upstream emissions from personal air travel, goods transport, waste incineration, and first tier active pharmaceutical ingredients and formulation & packaging suppliers (>90% of category spend, energy only); Downstream emissions from HFA propellants released during patient use of our inhaled medicines | | | 1,108,204 | | | | 1,053,690 | | | | N/A | | | | N/A | |
| 2016-2025 Strategy ‘Operational Footprint’ KPI: Scope 1 + Scope 2 (Market-based) + our Operational Footprint Scope 3 sources. Baseline year is 2015 | | | 1,656,917 | | | | 1,743,199 | | | | N/A | | | | N/A | |
| 2016-2025 Strategy Scope 3 intensity measurement KPI: Scope 3 emissions from all 15 Greenhouse Gas Protocol Scope 3 Categories normalised to million US dollar revenue. Baseline year is 2015 (one year in arrears) | | | 333 | | | | 255 | | | | N/A | | | | N/A | |
| 1 | Regular review of the data is carried out to ensure accuracy and consistency. This has led to slight changes in the data for previous years. None of the changes is statistically significant. The data quoted in this Annual Report are generated from the revised data. |
| 2 | Included in this section are greenhouse gases from direct fuel combustion, process and engineering emissions at our sites and from fuel use in our vehicle fleet. |
| 3 | Greenhouse gases from imported electricity are calculated using the GHG Protocol Scope 2 Guidance (January 2015) requiring the dual reporting using two emissions factors for each site – market-based and location-based. Location-based factors are the grid average emissions factor for the country (or subregion in the US) that a site is in. Market-based factors are more specific to the site and local energy market, taking account of the residual energy mix a site is sourcing power from and any certified renewable power purchased by a site. |
| 4 | GHG Protocol Scope 3 Categories: Purchased goods and services; Capital goods; Fuel- and energy-related activities; Upstream transportation and distribution; Waste generated in operations; Business travel; Employee commuting; Upstream leased assets; Downstream transportation and distribution; Processing of sold products; Use of sold products; End-of-life treatment of sold products; Downstream leased assets; Franchises; Investments. |
| | |
| AstraZenecaAnnual Report and Form 20-F Information 2016 | | 231 |
Additional Information
Shareholder Information
AstraZeneca PLC share listings and prices
| | | | | | | | | | | | | | | | | | | | |
| | | 2012 | | | 2013 | | | 2014 | | | 2015 | | | 2016 | |
| Ordinary Shares in issue – millions | | | | | | | | | | | | | | | | | | | | |
| At year end | | | 1,247 | | | | 1,257 | | | | 1,263 | | | | 1,264 | | | | 1,265 | |
| Weighted average for year | | | 1,261 | | | | 1,252 | | | | 1,262 | | | | 1,264 | | | | 1,265 | |
| Stock market price – per Ordinary Share | | | | | | | | | | | | | | | | | | | | |
| Highest (pence) | | | 3111.5 | | | | 3612.0 | | | | 4823.5 | | | | 4863.0 | | | | 5220.0 | |
| Lowest (pence) | | | 2591.0 | | | | 2909.5 | | | | 3549.5 | | | | 3903.5 | | | | 3774.0 | |
| At year end (pence) | | | 2909.5 | | | | 3574.5 | | | | 4555.5 | | | | 4616.5 | | | | 4437.5 | |
Percentage analysis of issued share capital at 31 December | | | | | | | | | | | | | | | | | | | | |
By size of account Number of Ordinary Shares | | 2012 % | | | 2013 % | | | 2014 % | | | 2015 % | | | 2016 % | |
| 1 – 250 | | | 0.6 | | | | 0.5 | | | | 0.5 | | | | 0.5 | | | | 0.5 | |
| 251 – 500 | | | 0.7 | | | | 0.6 | | | | 0.6 | | | | 0.6 | | | | 0.5 | |
| 501 – 1,000 | | | 0.8 | | | | 0.8 | | | | 0.7 | | | | 0.7 | | | | 0.6 | |
| 1,001 – 5,000 | | | 1.1 | | | | 1.1 | | | | 1.0 | | | | 0.9 | | | | 0.8 | |
| 5,001 – 10,000 | | | 0.2 | | | | 0.2 | | | | 0.2 | | | | 0.2 | | | | 0.2 | |
| 10,001 – 50,000 | | | 1.0 | | | | 1.0 | | | | 1.0 | | | | 0.9 | | | | 0.9 | |
| 50,001 – 1,000,000 | | | 12.6 | | | | 12.3 | | | | 13.3 | | | | 13.0 | | | | 12.3 | |
| Over 1,000,0001 | | | 83.0 | | | | 83.5 | | | | 82.7 | | | | 83.2 | | | | 84.2 | |
| 1 | Includes Euroclear and ADR holdings. |
At 31 December 2016, the Company had 90,113 registered holders of 1,265,229,424 Ordinary Shares. There were 107,074 holders of Ordinary Shares held under the Euroclear Services Agreement, representing 10.4% of the issued share capital of the Company and 1,880 registered holders of ADSs, representing 14.5% of the issued share capital of the Company. With effect from 27 July 2015, the Company’s ADS ratio changed to two ADSs per one Ordinary Share. The former ratio was one ADS per one Ordinary Share. The Company’s ADS depositary is Citibank, N.A. (Citibank). Citibank succeeded JPMorgan Chase Bank as depositary of the ADSs.
In 1999, in connection with the merger between Astra and Zeneca through which the Company was formed, the Company’s share capital was redenominated in US dollars. On 6 April 1999, Zeneca shares were cancelled and US dollar shares issued, credited as fully paid on the basis of one dollar share for each Zeneca share then held. This was achieved by a reduction of capital under section 135 of the Companies Act 1985. Upon the reduction of capital
becoming effective, all issued and unissued Zeneca shares were cancelled and the sum arising as a result of the share cancellation credited to a special reserve, which was converted into US dollars at the rate of exchange prevailing on the record date. This US dollar reserve was then applied in paying up, at par, newly created US dollar shares.
At the same time as the US dollar shares were issued, the Company issued 50,000 Redeemable Preference Shares for cash, at par. The Redeemable Preference Shares carry limited class voting rights, no dividend rights and are capable of redemption, at par, at the option of the Company on the giving of seven days’ written notice to the registered holder of the Redeemable Preference Shares.
A total of 826 million Ordinary Shares were issued to Astra shareholders who accepted the merger offer before the final closing date, 21 May 1999. The Company received acceptances from Astra shareholders representing 99.6% of Astra’s shares and the remaining 0.4% was acquired in 2000, for cash.
Since April 1999, following the merger of Astra and Zeneca, the principal markets for trading in the shares of the Company are the LSE, the SSE and the NYSE. The table overleaf sets out, for 2015 and 2016, the reported high and low share prices of the Company, on the following bases:
| > | For shares listed on the LSE, the reported high and low middle market closing quotations are derived from the Daily Official List. |
| > | For shares listed on the SSE, the high and low closing sales prices are as stated in the Official List. |
| > | For ADSs listed on the NYSE, the reported high and low sales prices are as reported by Dow Jones (ADR quotations). |
| | |
| 232 | | AstraZenecaAnnual Report and Form 20-F Information 2016 |
| | | | | | | | | | | | | | | | | | | | | | | | | | | | | | | | | | |
| | | | | | | | Ordinary LSE | | | | | | | | | Ordinary SSE | | | | | | | | | ADS | |
| | | | | High (pence) | | | Low (pence) | | | | | | High (SEK) | | | Low (SEK) | | | | | | High (US$) | | | Low (US$) | |
| 2015 | | – Quarter 1 | | | 4847.0 | | | | 4272.0 | | | | | | | | 625.0 | | | | 538.0 | | | | | | | | 72.22 | | | | 64.44 | |
| | | – Quarter 2 | | | 4863.0 | | | | 4019.0 | | | | | | | | 638.0 | | | | 522.5 | | | | | | | | 73.35 | | | | 63.71 | |
| | | – Quarter 3 | | | 4424.5 | | | | 3903.5 | | | | | | | | 603.0 | | | | 508.5 | | | | | | | | 34.54 | 1 | | | 30.28 | 1 |
| | | – Quarter 4 | | | 4627.5 | | | | 3947.0 | | | | | | | | 597.5 | | | | 509.0 | | | | | | | | 34.77 | | | | 30.47 | |
| 2016 | | – Quarter 1 | | | 4562.0 | | | | 3890.0 | | | | | | | | 584.0 | | | | 452.8 | | | | | | | | 33.90 | | | | 27.95 | |
| | | – Quarter 2 | | | 4467.0 | | | | 3774.0 | | | | | | | | 592.0 | | | | 458.2 | | | | | | | | 30.25 | | | | 27.26 | |
| | | – Quarter 3 | | | 5220.0 | | | | 4469.5 | | | | | | | | 556.0 | | | | 456.6 | | | | | | | | 34.50 | | | | 29.97 | |
| | | – Quarter 4 | | | 5096.0 | | | | 4007.0 | | | | | | | | 581.5 | | | | 448.5 | | | | | | | | 33.00 | | | | 25.81 | |
| | | – July | | | 5048.0 | | | | 4469.5 | | | | | | | | 542.5 | | | | 456.6 | | | | | | | | 34.29 | | | | 29.97 | |
| | | – August | | | 5220.0 | | | | 4909.0 | | | | | | | | 552.5 | | | | 470.7 | | | | | | | | 34.50 | | | | 32.81 | |
| | | – September | | | 5170.0 | | | | 4819.0 | | | | | | | | 556.0 | | | | 465.0 | | | | | | | | 34.28 | | | | 32.20 | |
| | | – October | | | 5096.0 | | | | 4588.0 | | | | | | | | 581.5 | | | | 448.5 | | | | | | | | 33.00 | | | | 28.32 | |
| | | – November | | | 4575.5 | | | | 4149.5 | | | | | | | | 562.5 | | | | 466.9 | | | | | | | | 28.95 | | | | 26.14 | |
| | | – December | | | 4437.5 | | | | 4007.0 | | | | | | | | 507.0 | | | | 475.6 | | | | | | | | 27.86 | | | | 25.81 | |
| 1 | With effect from 27 July 2015, the Company’s ADS ratio was changed to two ADSs per one Ordinary Share. The former ratio was one ADS per one Ordinary Share. |
Major shareholdings
At 31 December 2016, the following persons had disclosed an interest in the issued Ordinary Share capital of the Company in accordance with the requirements of rules 5.1.2 or 5.1.5 of the UK Listing Authority’s Disclosure Guidance and Transparency Rules:
| | | | | | | | | | | | |
| Shareholder | | Number of Ordinary Shares | | | Date of disclosure to Company1 | | | Number of Ordinary
Shares disclosed as a
percentage of issued share capital at 31 December 2016 | |
| BlackRock, Inc. | | | 100,885,181 | | | | 8 December 2009 | | | | 7.97 | |
| Investor AB | | | 51,587,810 | | | | 2 February 2012 | | | | 4.08 | |
| The Capital Group Companies, Inc. | | | 37,925,813 | | | | 17 July 2015 | | | | 3.00 | |
| 1 | Since the date of disclosure to the Company, the interest of any person listed above in Ordinary Shares may have increased or decreased. No requirement to notify the Company of any increase or decrease arises unless the holding passes a notifiable threshold in accordance with rules 5.1.2 or 5.1.5 of the UK Listing Authority’s Disclosure Guidance and Transparency Rules. |
So far as the Company is aware, no other person held a notifiable interest in the issued Ordinary Share capital of the Company.
No changes to major shareholdings were disclosed to the Company between 31 December 2016 and 31 January 2017. Any changes between 31 January 2017 and 28 February 2017 will be set out in the Notice of Annual General Meeting 2017 and Shareholders’ Circular.
Changes in the percentage ownerships disclosed by major shareholders during the past three years are set out below. Major shareholders do not have different voting rights.
| | | | | | | | | | | | | | | | |
| Shareholder | | 31 January
2017 | | | 31 January
2016 | | | 31 January
2015 | | | 31 January
2014 | |
| BlackRock, Inc. | | | 7.97 | | | | 7.98 | | | | 7.99 | | | | 8.01 | |
| Investor AB | | | 4.08 | | | | 4.08 | | | | 4.08 | | | | 4.09 | |
| The Capital Group Companies, Inc. | | | 3.00 | | | | 3.00 | | | | < 3.00 | | | | 3.01 | |
| Invesco Limited | | | < 5.00 | | | | < 5.00 | | | | < 5.00 | | | | 5.78 | |
| Axa SA | | | < 3.00 | | | | < 3.00 | | | | < 3.00 | | | | 4.52 | |
ADSs evidenced by ADRs issued by Citibank, as depositary, are listed on the NYSE. At 31 January 2017, the proportion of Ordinary Shares represented by ADSs was 14.5% of the Ordinary Shares outstanding.
Number of registered holders of Ordinary Shares at 31 January 2017:
| Number | of record holders of ADRs at 31 January 2017: |
| | |
| AstraZenecaAnnual Report and Form 20-F Information 2016 | | 233 |
Additional Information
Shareholder Informationcontinued
So far as the Company is aware, it is neither directly nor indirectly owned or controlled by one or more corporations or by any government.
The Company does not know of any arrangements, the operation of which might result in a change in the control of the Company.
At 31 January 2017, the total amount of the Company’s voting securities owned by Directors and officers of the Company was:
| | | | | | | | |
| Title of class | | Amount
owned | | | Percentage
of class | |
| Ordinary Shares | | | 636,639 | | | | 0.05 | |
Related party transactions
During the period 1 January 2017 to 31 January 2017, there were no transactions, loans, or proposed transactions between the Company and any related parties which were material to either the Company or the related party, or which were unusual in their nature or conditions (see also Note 30 to the Financial Statements from page 192).
Options to purchase securities from registrant or subsidiaries
(a) At 31 January 2017, options outstanding to subscribe for Ordinary Shares were:
| | | | | | | | |
| Number of shares | | Subscription price (pence) | | | Normal expiry date | |
| 2,827,110 | | | 1882–3929 | | | | 2017–2022 | |
The weighted average subscription price of options outstanding at 31 January 2017 was 2857 pence. All options were granted under Company employee share schemes.
(b) Included in paragraph (a) are options granted to Directors and officers of the Company as follows:
| | | | | | | | |
| Number of shares | | Subscription price (pence) | | | Normal expiry date | |
| 2,495 | | | 3307–3599 | | | | 2018–2021 | |
(c) Included in paragraph (b) are options granted to individually named Directors. Details of these option holdings at 31 December 2016 are shown in the Remuneration Report on page 115.
During the period 1 January 2017 to 31 January 2017, no Director exercised any options.
Dividend payments
For Ordinary Shares listed on the LSE and the SSE, the record date for the second interim dividend for 2016, payable on 20 March 2017, is 17 February 2017 and the ex-dividend date is 16 February 2017. For ADRs listed on the NYSE, the record date is 17 February 2017 and the ex-dividend date is 15 February 2017.
The record date for the first interim dividend for 2017, payable on 11 September 2017, is 11 August 2017.
Future dividends will normally be paid as follows:
| > | First interim: Announced in July/August and paid in September. |
| > | Second interim: Announced in January/ February and paid in March. |
Shareview
The Company’s shareholders with internet access may visit the website, www.shareview.co.uk, and register their details to create a portfolio. Shareview is a free and secure online service from the Company’s registrar, Equiniti, which gives access to shareholdings, including balance movements, indicative share prices and information about recent dividends.
ShareGift
The Company welcomes and values all of its shareholders, no matter how many or how few shares they own. However, shareholders who have only a small number of shares whose value makes it uneconomic to sell them, either now or at some stage in the future, may wish to consider donating them to charity through ShareGift, an independent charity share donation scheme. One feature of the scheme is that there is no gain or loss for UK capital gains tax purposes on gifts of shares through ShareGift, and it may now also be possible to obtain UK income tax relief on the donation. Further information about ShareGift can be found on its website, www.sharegift.org, or by contacting ShareGift on 020 7930 3737 or at 17 Carlton House Terrace, London SW1Y 5AH. ShareGift is administered by The Orr Mackintosh Foundation, registered charity number 1052686. More information about the UK tax position on gifts of shares to
ShareGift can be obtained from HM Revenue & Customs on its website, www.hmrc.gov.uk.
The Unclaimed Assets Register
The Company supplies unclaimed dividend data to the Unclaimed Assets Register (UAR), which provides investors who have lost track of shareholdings with an opportunity to search the UAR’s database of unclaimed financial assets on payment of a small fixed fee. The UAR donates part of the search fee to charity. The UAR can be contacted on 0844 481 8180 or at uarenquiries@uk.experian.com.
Results
Unaudited trading results of AstraZeneca in respect of the first three months of 2017 will be published on 27 April 2017 and results in respect of the first six months of 2017 will be published on 27 July 2017.
Documents on display
The Articles and other documents concerning the Company which are referred to in this Annual Report may be inspected at the Company’s registered office at 1 Francis Crick Avenue, Cambridge Biomedical Campus, Cambridge CB2 0AA, UK.
Taxation for US persons
The following summary of material UK and US federal income tax consequences of ownership of Ordinary Shares or ADRs held as capital assets by the US holders described below is based on current UK and US federal income tax law, including the US/UK double taxation convention relating to income and capital gains, which entered into force on 31 March 2003 (the Convention). This summary does not describe all of the tax consequences that may be relevant in light of the US holders’ particular circumstances and tax consequences applicable to US holders subject to special rules (such as certain financial institutions, entities treated as partnerships for US federal income tax purposes, persons whose functional currency for US federal income tax purposes is not the US dollar, tax-exempt entities, persons subject to alternative minimum tax, persons subject to the Medicare contribution tax on ‘net investment income’, or persons holding Ordinary Shares or ADRs in connection with a trade or business conducted outside of
| | |
| 234 | | AstraZenecaAnnual Report and Form 20-F Information 2016 |
the US). US holders are urged to consult their tax advisers regarding the UK and US federal income tax consequences of the ownership and disposition of Ordinary Shares or ADRs in their particular circumstances.
This summary is based in part on representations of Citibank as depositary for ADRs and assumes that each obligation in the deposit agreement among the Company and the depositary and the holders from time to time of ADRs and any related agreements will be performed in accordance with its terms. The US Treasury has expressed concerns that parties to whom American depositary shares are released before shares are delivered to the depositary (pre-release), or intermediaries in the chain of ownership between holders and the issuer of the security underlying the American depositary shares, may be taking actions that are inconsistent with the claiming, by US holders of American depositary shares, of foreign tax credits for US federal income tax purposes. Such actions would also be inconsistent with the claiming of the reduced tax rates, described below, applicable to dividends received by certain non-corporate US holders. Accordingly, the availability of the reduced tax rates for dividends received by certain non-corporate US holders could be affected by actions that may be taken by parties to whom ADRs are pre-released.
For the purposes of this summary, the term ‘US holder’ means a beneficial owner of Ordinary Shares or ADRs that is, for US federal income tax purposes, a citizen or resident of the US, a corporation (or other entity taxable as a corporation) created or organised in or under the laws of the US, any state in the US or the District of Columbia, or an estate or trust, the income of which is subject to US federal income taxation regardless of its source.
This summary assumes that we are not, and will not become, a passive foreign investment company, as discussed below.
UK and US income taxation of dividends
The UK does not currently impose a withholding tax on dividends paid by a UK company, such as the Company.
For US federal income tax purposes, distributions paid by the Company to a US holder are included in gross income as foreign source ordinary dividend income to the extent paid out of the Company’s current or accumulated earnings and profits, calculated in accordance with US federal income tax principles. The Company does not maintain calculations of its earnings and profits under US federal income tax principles and so it is expected that distributions generally will be reported to US holders as dividends. The amount of the dividend will be the US dollar amount received by the depositary for US holders of ADRs (or, in the case of Ordinary Shares, the US dollar value of the foreign currency payment, determined at the spot rate of the relevant foreign currency on the date the dividend is received by the US holders, regardless of whether the dividend is converted into US dollars), and it will not be eligible for the dividends received deduction generally available to US corporations. If the dividend is converted into US dollars on the date of receipt, US holders of Ordinary Shares generally should not be required to recognise foreign currency gains or losses in respect of the dividend income. They may have foreign currency gain or loss (taxable at the rates applicable to ordinary income) if the amount of such dividend is converted into US dollars after the date of its receipt.
Subject to applicable limitations and the discussion above regarding concerns expressed by the US Treasury, dividends received by certain non-corporate US holders of Ordinary Shares or ADRs may be taxable at favourable US federal income tax rates. US holders should consult their own tax advisers to determine whether they are subject to any special rules which may limit their ability to be taxed at these favourable rates.
Taxation on capital gains
Under present English law, individuals who are neither resident nor ordinarily resident in the UK, and companies which are not resident in the UK, will not be liable for UK tax on capital gains made on the disposal of their Ordinary Shares or ADRs, unless such Ordinary Shares or ADRs are held in connection with a trade, profession or vocation carried on in the UK through a branch or agency or other permanent establishment.
A US holder will generally recognise US source capital gains or losses for US federal income tax purposes on the sale or exchange of Ordinary Shares or ADRs in an amount equal to the difference between the US dollar amount realised and such holder’s US dollar tax basis in the Ordinary Shares or ADRs. US holders should consult their own tax advisers about the treatment of capital gains, which may be taxed at lower rates than ordinary income for non-corporate US holders and capital losses, the deductibility of which may be subject to limitations.
Passive Foreign Investment Company (PFIC) rules
We believe that we were not a PFIC for US federal income tax purposes for the year ended 31 December 2016. However, since PFIC status depends on the composition of our income and assets, and the market value of our assets (including, among others, less than 25% owned equity investments), from time to time, there can be no assurance that we will not be considered a PFIC for any taxable year. If we were treated as a PFIC for any taxable year during which Ordinary Shares or ADRs were held, certain adverse tax consequences could apply to US holders.
Information reporting and backup withholding
Payments of dividends and sales proceeds that are made within the US or through certain US-related financial intermediaries may be subject to information reporting and backup withholding, unless: (i) the US holder is a corporation or other exempt recipient; or (ii) in the case of backup withholding, the US holder provides a correct taxpayer identification number and certifies that it is not subject to backup withholding. The amount of any backup withholding from a payment to a US holder will be allowed as a credit against the holder’s US federal income tax liability and may entitle the holder to a refund, provided that the required information is timely supplied to the US Internal Revenue Service (IRS).
Certain US holders who are individuals (and certain entities closely-held by individuals), may be required to report information relating to securities issued by non-US persons (or foreign accounts through which the securities are held), generally on IRS Form 8938, subject to certain exceptions
| | |
| AstraZenecaAnnual Report and Form 20-F Information 2016 | | 235 |
Additional Information
Shareholder Informationcontinued
(including an exception for securities held in accounts maintained by US financial institutions). US holders should consult their tax advisers regarding their reporting obligations with respect to the Ordinary Shares or ADRs.
UK inheritance tax
Under the current Double Taxation (Estates) Convention (the Estate Tax Convention) between the US and the UK, Ordinary Shares or ADRs held by an individual shareholder who is domiciled for the purposes of the Estate Tax Convention in the US, and is not for the purposes of the Estate Tax Convention a national of the UK, will generally not be subject to UK inheritance tax on the individual’s death or on a chargeable gift of the Ordinary Shares or ADRs during the individual’s lifetime, provided that any applicable US federal gift or estate tax liability is paid, unless the Ordinary Shares or ADRs are part of the business property of a permanent establishment of the individual in the UK or, in the case of a shareholder who performs independent personal services, pertain to a fixed base situated in the UK. Where the Ordinary Shares or ADRs have been placed in trust by a settlor who, at the time of settlement, was a US domiciled shareholder, the Ordinary Shares or ADRs will generally not be subject to UK inheritance tax unless the settlor, at the time of settlement, was a UK national, or the Ordinary Shares or ADRs are part of the
business property of a permanent establishment of the individual in the UK or, in the case of a shareholder who performs independent personal services, pertain to a fixed base situated in the UK. In the exceptional case where the Ordinary Shares or ADRs are subject to both UK inheritance tax and US federal gift or estate tax, the Estate Tax Convention generally provides for double taxation to be relieved by means of credit relief.
UK stamp duty reserve tax and stamp duty
A charge to UK stamp duty or UK stamp duty reserve tax (SDRT) may arise on the deposit of Ordinary Shares in connection with the creation of ADRs. The rate of stamp duty or SDRT will generally be 1.5% of the value of the consideration or, in some circumstances, the value of the Ordinary Shares. There is no 1.5% SDRT charge on the issue of Ordinary Shares (or, where it is integral to the raising of new capital, the transfer of Ordinary Shares) into the ADR arrangement.
No UK stamp duty will be payable on the acquisition or transfer of existing ADRs provided that any instrument of transfer or written agreement to transfer is executed outside the UK and remains at all times outside the UK. An agreement for the transfer of ADRs will not give rise to a liability for SDRT.
A transfer of, or an agreement to, transfer Ordinary Shares will generally be subject to UK stamp duty or SDRT at 0.5% of the amount or value of any consideration, provided, in the case of stamp duty, it is rounded to the nearest £5.
Transfers of Ordinary Shares into CREST will generally not be subject to stamp duty or SDRT, unless such a transfer is made for a consideration in money or money’s worth, in which case a liability to SDRT will arise, usually at the rate of 0.5% of the value of the consideration. Paperless transfers of Ordinary Shares within CREST are generally liable to SDRT at the rate of 0.5% of the value of the consideration. CREST is obliged to collect SDRT from the purchaser on relevant transactions settled within the system.
Exchange controls and other limitations affecting security holders
There are no governmental laws, decrees or regulations in the UK restricting the import or export of capital or affecting the remittance of dividends, interest or other payments to non-resident holders of Ordinary Shares or ADRs.
There are no limitations under English law or the Articles on the right of non-resident or foreign owners to be the registered holders of, or to exercise voting rights in relation to, Ordinary Shares or ADRs or to be registered holders of notes or debentures of Zeneca Wilmington Inc. or the Company.
Exchange rates
The following information relating to average and spot exchange rates used by AstraZeneca is provided for convenience:
| | | | | | | | |
| | | SEK/US$ | | | US$/GBP | |
| Average rates (statement of comprehensive income, statement of cash flows) | | | | | | | | |
| 2014 | | | 6.7901 | | | | 1.6532 | |
| 2015 | | | 8.3950 | | | | 1.5357 | |
| 2016 | | | 8.5286 | | | | 1.3673 | |
| End of year spot rates (statement of financial position) | | | | | | | | |
| 2014 | | | 7.7451 | | | | 1.5559 | |
| 2015 | | | 8.4114 | | | | 1.4816 | |
| 2016 | | | 9.1162 | | | | 1.2272 | |
Compliance requirements under Listing Rule 9.8.4
Other than as set out below, the Company has nothing to report under Listing Rule 9.8.4
| | |
| Item | | Location of details in Annual Report |
| Details of any long-term incentive schemes | | Note 27 of the Financial Statements and Directors’ Remuneration Report |
| Shareholder waiver of dividends | | Page 96 in the Corporate Governance Report |
| | |
| 236 | | AstraZenecaAnnual Report and Form 20-F Information 2016 |
History and development of the Company
AstraZeneca PLC was incorporated in England and Wales on 17 June 1992 under the Companies Act 1985. It is a public limited company domiciled in the UK. The Company’s registered number is 2723534 and its registered office is at 1 Francis Crick Avenue, Cambridge Biomedical Campus, Cambridge CB2 0AA, UK (telephone +44 20 3749 5000). From February 1993 until April 1999, the Company was called Zeneca Group PLC. On 6 April 1999, the Company changed its name to AstraZeneca PLC.
The Company was formed when the pharmaceutical, agrochemical and specialty chemical businesses of Imperial Chemical Industries PLC were demerged in 1993. In 1999, the Company sold the specialty chemical business. Also in 1999, the Company merged with Astra of Sweden. In 2000, it demerged the agrochemical business and merged it with the similar business of Novartis to form a new company called Syngenta AG.
In 2007, the Group acquired MedImmune, a biologics and vaccines business based in the US.
Articles
The current Articles were adopted by shareholders at the Company’s AGM held on 24 April 2015.
Objects
The Company’s objects are unrestricted.
Any amendment to the Articles requires the approval of shareholders by a special resolution at a general meeting of the Company.
Directors
The Board has the authority to manage the business of the Company, for example, through powers to allot and repurchase its shares, subject where required to shareholder resolutions. Subject to certain exceptions, Directors do not have power to vote at Board meetings on matters in which they have a material interest.
The quorum for meetings of the Board is a majority of the full Board, of whom at least four must be Non-Executive Directors. In the absence of a quorum, the Directors do not have power to determine compensation arrangements for themselves or any member of the Board.
The Board may exercise all the powers of the Company to borrow money. Variation of these borrowing powers would require the passing of a special resolution of the Company’s shareholders.
All Directors must retire from office at the Company’s AGM each year and may present themselves for election or re-election. Directors are not prohibited, upon reaching a particular age, from submitting themselves for election or re-election.
Within two months of the date of their appointment, Directors are required to beneficially own Ordinary Shares of an aggregate nominal amount of at least $125, which currently represents 500 shares.
Rights, preferences and restrictions attaching to shares
As at 31 December 2016, the Company had 1,265,229,424 Ordinary Shares and 50,000 Redeemable Preference Shares in issue. The Ordinary Shares represent 99.98% and the Redeemable Preference Shares represent 0.02% of the Company’s total share capital (these percentages have been calculated by reference to the closing mid-point US$/GBP exchange rate on 31 December 2016 as published in the London edition of the Financial Times newspaper).
As agreed by the shareholders at the Company’s AGM held on 29 April 2010, the Articles were amended with immediate effect to remove the requirement for the Company to have an authorised share capital, the concept of which was abolished under the Companies Act 2006. Each Ordinary Share carries the right to vote at general meetings of the Company. The rights and restrictions attaching to the Redeemable Preference Shares differ from those attaching to Ordinary Shares as follows:
| > | The Redeemable Preference Shares carry no rights to receive dividends. |
| > | The holders of Redeemable Preference Shares have no rights to receive notices of, attend or vote at general meetings except in certain limited circumstances. They have one vote for every 50,000 Redeemable Preference Shares held. |
| > | On a distribution of assets of the Company, on a winding-up or other return of capital (subject to certain exceptions), the holders of Redeemable Preference Shares have priority over the holders of Ordinary Shares to receive the capital paid up on those shares. |
| > | Subject to the provisions of the Companies Act 2006, the Company has the right to redeem the Redeemable Preference Shares at any time on giving not less than seven days’ written notice. |
There are no specific restrictions on the transfer of shares in the Company, which is governed by the Articles and prevailing legislation.
The Company is not aware of any agreements between holders of shares that may result in restrictions on the transfer of shares or that may result in restrictions on voting rights. The Company is also not aware of any arrangements under which financial rights are held by a person other than the holder of the shares.
Action necessary to change the rights of shareholders
In order to vary the rights attached to any class of shares, the consent in writing of the holders of three-quarters in nominal value of the issued shares of that class or the sanction of a special resolution passed at a general meeting of such holders is required.
General meetings
AGMs require 21 clear days’ notice to shareholders. Subject to the Companies Act 2006, other general meetings require 14 clear days’ notice.
For all general meetings, a quorum of two shareholders present in person or by proxy, and entitled to vote on the business transacted, is required unless each of the two persons present is a corporate representative of the same corporation; or each of the two persons present is a proxy of the same shareholder.
Shareholders and their duly appointed proxies and corporate representatives are entitled to be admitted to general meetings.
Limitations on the rights to own shares
There are no limitations on the rights to own shares.
Property
Substantially all of our properties are held freehold, free of material encumbrances and are fit for their purpose.
For more information please refer to Note 7 to the Group Financial Statements on page 155.
| | |
| AstraZenecaAnnual Report and Form 20-F Information 2016 | | 237 |
Additional Information
Trade Marks
AstraZeneca, the AstraZeneca logotype, and the AstraZeneca symbol are all trade marks of the Group.
The following brand names which appear in italics in this Annual Report are trade marks of the Group:
| | | | | | |
| Trade mark | | | | | | |
| Accolate1 | | EMLA | | Naropin | | Symbicort SMART |
| Arimidex | | Entocort3 | | Nexium | | Symbicort Turbuhaler |
| Atacand | | Farxiga | | Nolvadex | | Symlin |
| Atacand HCT | | Faslodex | | Onglyza | | Synagis8 |
| Atacand Plus | | Fluenz | | Oxis Turbuhaler | | Tagrisso |
| Bevespi Aerosphere | | FluMist | | Plendil | | Tenormin9 |
| Bricanyl | | Forxiga | | Pressair | | Toprol-XL |
| Brilinta | | Genuair | | Prilosec | | Turbuhaler |
| Brilique | | Imdur4 | | Pulmicort | | Vimovo |
| Bydureon | | Iressa | | Pulmicort Flexhaler | | Xigduo |
| Byetta | | Kombiglyze | | Pulmicort Respules | | Xylocaine |
| Caprelsa2 | | Komboglyze | | Pulmicort Turbuhaler | | Xylocard |
| Carbocaine | | Losec | | Qtern | | Xyloproct |
| Casodex | | Lynparza | | Respules | | Zavicefta10 |
| Citanest | | Marcaine | | Rhinocort7 | | Zestril9 |
| Cosudex | | Meronem5 | | Rhinocort Aqua7 | | Zoladex |
| Crestor | | Merrem5 | | Seloken | | Zomig |
| Daliresp | | Movantik | | Seroquel | | Zurampic |
| Daxas | | Moventig | | Seroquel XR | | |
| Diprivan | | Myalept6 | | Symbicort | | |
| 1 | AstraZeneca assigned this trade mark in the US to Par Pharmaceuticals Inc. effective 5 January 2015. |
| 2 | AstraZeneca assigned this trade mark to Genzyme Corporation effective 30 September 2015. |
| 3 | AstraZeneca assigned this trade mark in the US to Elan Pharma International Limited effective 15 December 2015, and in the rest of the world to Tillots Pharma AG effective 16 July 2015. |
| 4 | AstraZeneca assigned this trade mark to Everest Future Limited effective 1 May 2016. |
| 5 | AstraZeneca assignedMeronem andMerrem to Pfizer Inc. in most markets outside the US effective 23 December 2016. |
| 6 | AstraZeneca assigned this trade mark to Aegerion effective 9 January 2015. |
| 7 | AstraZeneca assignedRhinocort andRhinocort Aqua to Cilag GmbH International outside the US effective 5 December 2016. |
| 8 | AstraZeneca owns this trade mark in the US only. AbbVie owns it in the rest of the world. |
| 9 | AstraZeneca assigned these trade marks in the US to Alvogen Pharma US Inc. effective 9 January 2015. |
| 10 | AstraZeneca assigned this trade mark to Pfizer Inc. effective 23 December 2016. |
The following brand names which appear in italics in this Annual Report are trade marks licensed to the Group by the entities set out below:
| | |
| Trade mark | | Licensor or Owner |
| Duaklir | | Almirall, S.A. |
| Eklira | | Almirall, S.A. |
| Epanova | | Chrysalis Pharma AG |
| Tudorza | | Almirall, S.A. |
| Zinforo | | Forest Laboratories Holdings Limited |
The following brand names which appear in italics throughout this Annual Report are not owned by or licensed to the Group and are owned by the entities set out below:
| | |
| Trade mark | | Owner |
| Lipitor | | Pfizer Ireland Pharmaceuticals |
| messenger RNA Therapeutics | | Moderna Therapeutics, Inc. |
| Vidaza | | Celgene Corporation |
| | |
| 238 | | AstraZenecaAnnual Report and Form 20-F Information 2016 |
Market definitions
| | | | | | | | | | |
| Region | | Country | | | | | | | | |
| US | | US | | | | | | | | |
| Europe | | Albania* | | Czech Republic | | Hungary | | Luxembourg* | | Serbia and Montenegro* |
| | | Austria | | Denmark | | Iceland* | | Malta* | | Slovakia |
| | | Belgium | | Estonia* | | Ireland | | Netherlands | | Slovenia* |
| | | Bosnia and Herzegovina* | | Finland | | Israel* | | Norway | | Spain |
| | | Bulgaria | | France | | Italy | | Poland | | Sweden |
| | | Croatia | | Germany | | Latvia* | | Portugal* | | Switzerland |
| | | Cyprus* | | Greece | | Lithuania* | | Romania | | UK |
| Established ROW | | Australia | | Japan | | | | | | |
| | | Canada | | New Zealand | | | | | | |
| Emerging Markets | | Algeria | | Costa Rica | | Iraq* | | Other Africa* | | Sudan* |
| | | Argentina | | Cuba* | | Jamaica* | | Pakistan* | | Syria* |
| | | Aruba* | | Dominican Republic* | | Jordan* | | Palestine* | | Taiwan |
| | | Bahamas* | | Ecuador | | Kazakhstan | | Panama | | Thailand |
| | | Bahrain* | | Egypt | | Kuwait* | | Peru | | Trinidad and Tobago* |
| | | Barbados* | | El Salvador | | Lebanon* | | Philippines | | Tunisia* |
| | | Belarus* | | Georgia* | | Libya* | | Qatar* | | Turkey |
| | | Belize* | | Guatemala | | Malaysia | | Russia | | Ukraine* |
| | | Bermuda* | | Honduras | | Mexico | | Saudi Arabia | | United Arab Emirates |
| | | Brazil | | Hong Kong | | Morocco* | | Singapore | | Uruguay* |
| | | Chile | | India | | Netherlands Antilles* | | South Africa | | Venezuela* |
| | | China | | Indonesia | | Nicaragua | | South Korea | | Vietnam* |
| | | Colombia | | Iran* | | Oman* | | Sri Lanka* | | Yemen* |
| * | IMS Health, IMS Midas Quantum Q3 2016 data is not available or AstraZeneca does not subscribe for IMS Health quarterly data for these countries. |
The above table is not an exhaustive list of all the countries in which AstraZeneca operates, and excludes countries with revenue in 2016 of less than $1 million.
Established Markets means US, Europe and Established ROW.
North America means US and Canada.
Other Established ROW means Australia and New Zealand.
Other Emerging Markets means all Emerging Markets except China.
Other Africa includes Angola, Botswana, Ethiopia, Ghana, Kenya, Mauritius, Mozambique, Namibia, Nigeria, Swaziland, Tanzania, Uganda, Zambia and Zimbabwe.
Asia Area comprises India, Indonesia, Malaysia, Philippines, Singapore, South Korea, Sri Lanka, Taiwan, Thailand and Vietnam.
US equivalents
| | |
| Terms used in this Annual Report | | US equivalent or brief description |
| Accruals | | Accrued expenses |
| Allotted | | Issued |
| Called-up share capital | | Issued share capital |
| Creditors | | Liabilities/payables |
| Debtors | | Receivables and prepaid expenses |
| Earnings | | Net income |
| Employee share schemes | | Employee stock benefit plans |
| Fixed asset investments | | Non-current investments |
| Freehold | | Ownership with absolute rights in perpetuity |
| Interest payable | | Interest expense |
| Loans | | Long-term debt |
| Prepayments | | Prepaid expenses |
| Profit | | Income |
| Profit and loss account | | Income statement/consolidated statement of comprehensive income |
| Share premium account | | Premiums paid in excess of par value of Ordinary Shares |
| Short-term investments | | Redeemable securities and short-term deposits |
| | |
| AstraZenecaAnnual Report and Form 20-F Information 2016 | | 239 |
Additional Information
Glossarycontinued
The following abbreviations and expressions have the following meanings when used in this Annual Report:
Abbott – Abbott Laboratories.
AbbVie – AbbVie Inc.
ACA (Affordable Care Act) – the US Patient Protection and Affordable Care Act which was signed into law on 23 March 2010 as amended by the Health Care and Education Reconciliation Act which was signed into law on 30 March 2010.
Acerta Pharma – Acerta Pharma B.V.
ACS – acute coronary syndromes.
Actavis – Actavis plc.
ADC Therapeutics – ADC Therapeutics Sàrl.
ADR – an American Depositary Receipt evidencing title to an ADS.
ADS – an American Depositary Share representing one underlying Ordinary Share.
Aegerion – Aegerion Pharmaceuticals, Inc.
AGM – an Annual General Meeting of the Company.
Allergan – Allergan plc.
Almirall – Almirall, S.A.
Amgen – Amgen, Inc.
Amplimmune – Amplimmune, Inc.
Amylin – Amylin Pharmaceuticals, LLC (formerly Amylin Pharmaceuticals, Inc.).
ANDA – an abbreviated new drug application, which is a marketing approval application for a generic drug submitted to the FDA.
Annual Report – this Annual Report and Form 20-F Information 2016.
API – active pharmaceutical ingredient.
Aralez – Aralez Pharmaceuticals Trading DAC.
Ardea – Ardea Biosciences, Inc.
Articles – the Articles of Association of the Company.
Aspen – Aspen Global Incorporated.
Astellas – Astellas Pharma Inc.
Astra – Astra AB, being the company with whom the Company merged in 1999.
AstraZeneca – the Company and its subsidiaries.
AZIP – AstraZeneca Investment Plan.
BACE – beta secretase cleaving enzyme.
biologic(s) – a class of drugs that are produced in living cells.
biosimilars – a copy of a biologic that is sufficiently similar to meet regulatory requirements.
BMS – Bristol-Myers Squibb Company.
Board – the Board of Directors of the Company.
Bureau Veritas – Bureau Veritas UK Limited.
CDP – a not-for-profit that runs the global disclosure system for investors, companies, cities, states and regions to manage their environmental impacts.
Celgene – Celgene International Sàrl/Celgene Corporation.
CEO – the Chief Executive Officer of the Company.
CER – constant exchange rates.
CFDA – China Food and Drug Administration.
CFO – the Chief Financial Officer of the Company.
CHMP – the Committee for Medicinal Products for Human Use.
Cilag – Cilag GmbH International.
CIS – Commonwealth of Independent States.
CMS – China Medical System Holdings Ltd.
Code of Conduct – the Group’s Code of Conduct.
Company or Parent Company – AstraZeneca PLC (formerly Zeneca Group PLC (Zeneca)).
COPD – chronic obstructive pulmonary disease.
CREST – UK-based securities settlement system.
CRL – Complete Response Letter.
CROs – contract research organisations.
CRUK – Cancer Research UK.
CV – cardiovascular.
CVMD – Cardiovascular & Metabolic Disease.
Daiichi Sankyo – Daiichi Sankyo, Inc.
Definiens – Definiens AG.
Director – a director of the Company.
DJSI – Dow Jones Sustainability Index.
DOJ – the United States Department of Justice.
DTR – UK Disclosure Guidance and Transparency Rules.
earnings per share (EPS) – profit for the year after tax and non-controlling interests, divided by the weighted average number of Ordinary Shares in issue during the year.
EC – European Commission.
EFPIA – European Federation of Pharmaceutical Industries and Associations.
EGFR – epidermal growth factor receptor.
EMA – European Medicines Agency.
EPO – European Patent Office.
ESPC – Early Stage Product Committee.
ESRD – end-stage renal disease.
EVP – Executive Vice-President.
EU – the European Union.
FDA – the US Food and Drug Administration, which is part of the US Department of Health and Human Services Agency, which is the regulatory authority for all pharmaceuticals (including biologics and vaccines) and medical devices in the US.
FDC – fixed-dose combination.
FibroGen – FibroGen, Inc.
FRC – Financial Reporting Council.
GAAP – Generally Accepted Accounting Principles.
GMD – Global Medicines Development.
GPPS – Global Product and Portfolio Strategy.
gross margin – the margin, as a percentage, by which sales exceed the cost of sales, calculated by dividing the difference between the two by the sales figure.
Group – AstraZeneca PLC and its subsidiaries.
GSK – GlaxoSmithKline plc.
HHA – Healthy Heart Africa programme.
HR – human resources.
IA – the Group’s Internal Audit Services function.
IAS – International Accounting Standards.
IAS 19 – IAS 19 ‘Employee Benefits’.
IAS 32 – IAS 32 ‘Financial Instruments: Presentation’.
IAS 39 – IAS 39 ‘Financial Instruments: Recognition and Measurement’.
IASB – International Accounting Standards Board.
ICS – inhaled corticosteroid.
IFPMA – International Federation of Pharmaceutical Manufacturers and Associations.
IFRS – International Financial Reporting Standards or International Financial Reporting Standard, as the context requires.
IFRS 8 – IFRS 8 ‘Operating Segments’.
IMED – Innovative Medicines and Early Development.
Incyte – Incyte Corporation.
Innate Pharma – Innate Pharma S.A.
IO – immuno-oncology.
IP – intellectual property.
Ironwood – Ironwood Pharmaceuticals, Inc.
IS – information services.
ISAs – International Standards on Auditing.
IT – information technology.
KPI – key performance indicator.
krona or SEK – references to the currency of Sweden.
Kyowa Hakko Kirin – Kyowa Hakko Kirin Co., Ltd.
LABA – long-acting beta2-agonist.
LAMA – long-acting muscarinic antagonist.
LCM projects – significant life-cycle management projects (as determined by potential revenue generation), or line extensions.
Lean – means enhancing value for customers with fewer resources.
LEO Pharma – LEO Pharma A/S.
Lilly – Eli Lilly and Company.
LSPC – Late Stage Product Committee.
| | |
| 240 | | AstraZenecaAnnual Report and Form 20-F Information 2016 |
LTI – long-term incentive, in the context of share plan remuneration arrangements.
MAA – a marketing authorisation application, which is an application for authorisation to place medical products on the market. This is a specific term used in the EU and European Economic Area markets.
MAb – monoclonal antibody, a biologic that is specific, that is, it binds to and attacks one particular antigen.
major market – US, EU, Japan (JP) and China (CN).
MAT – moving annual total.
MedImmune – MedImmune, LLC (formerly MedImmune, Inc.).
Merck – Merck Sharp & Dohme Corp. (formerly Merck & Co., Inc.).
MI – myocardial infarction.
Moderna – Moderna Therapeutics, Inc.
NCD – non-communicable disease.
NDA – a new drug application to the FDA for approval to market a new medicine in the US.
NME – new molecular entity.
Novartis – Novartis Pharma AG.
NSAID – a non-steroidal anti-inflammatory drug.
NSCLC – non-small cell lung cancer.
NSTE-ACS – non-ST-Elevation acute coronary syndromes.
NYSE – the New York Stock Exchange.
n/m – not meaningful.
OECD – the Organisation for Economic Cooperation and Development.
Omthera – Omthera Pharmaceuticals, Inc.
operating profit – sales, less cost of sales, less operating costs, plus operating income.
Ordinary Share – an ordinary share of $0.25 each in the share capital of the Company.
Orphan Drug – a drug which has been approved for use in a relatively low-incidence indication (an orphan indication) and has been rewarded with a period of market exclusivity; the period of exclusivity and the available orphan indications vary between markets.
OTC – over-the-counter.
Paediatric Exclusivity – in the US, a six-month period of exclusivity to market a drug which is awarded by the FDA in return for certain paediatric clinical studies using that drug. This six-month period runs from the date of relevant patent expiry. Analogous provisions are available in certain other territories (such as European Supplementary Protection Certificate (SPC) paediatric extensions).
PARP – an oral poly ADP-ribose polymerase.
PD-L1 – an anti-programmed death-ligand 1.
Pearl Therapeutics – Pearl Therapeutics, Inc.
Pfizer – Pfizer, Inc.
PhRMA – Pharmaceutical Research and Manufacturers of America.
Phase I – the phase of clinical research where a new drug or treatment is tested in small groups of people (20 to 80) to check that the drug can achieve appropriate concentrations in the body, determine a safe dosage range and identify side effects. This phase includes healthy volunteer studies.
Phase II – the phase of clinical research which includes the controlled clinical activities conducted to evaluate the effectiveness of the drug in patients with the disease under study and to begin to determine the safety profile of the drug. Phase II studies are typically conducted in small or medium sized groups of patients and can be divided into Phase IIa studies, which tend to be designed to assess dosing requirements, and Phase IIb studies, which tend to assess safety and efficacy.
Phase III – the phase of clinical research which is performed to gather additional information about effectiveness and safety of the drug, often in a comparative setting, to evaluate the overall benefit/risk profile of the drug. Phase III studies usually include between several hundred and several thousand patients.
PHC – personalised healthcare.
PMDA – Pharmaceuticals and Medical Devices Agency of Japan.
pMDI – pressurised metered-dose inhaler.
PMI – process mass intensity.
pound sterling, £, GBP or pence – references to the currency of the UK.
Pozen – POZEN, Inc.
primary care – general healthcare provided by physicians who ordinarily have first contact with patients and who may have continuing care for them.
Proof of Concept – data demonstrating that a candidate drug results in a clinical change on an acceptable endpoint or surrogate in patients with the disease.
PSP – AstraZeneca Performance Share Plan.
PTE – Patent Term Extension, an extension of up to five years in the term of a US patent relating to a drug which compensates for delays in marketing resulting from the need to obtain FDA approval. The analogous right in the EU is an SPC.
Qiagen – Qiagen NV.
R&D – research and development.
Redeemable Preference Share – a redeemable preference share of £1 each in the share capital of the Company.
Regulatory Data Protection (RDP) – see the Intellectual Property section on page 57.
Regulatory Exclusivity – any of the IP rights arising from generation of clinical data and includes Regulatory Data Protection, Paediatric Exclusivity and Orphan Drug status.
RNA – ribonucleic acid
Roche – F. Hoffmann-La Roche AG.
ROW – rest of world.
RSV – respiratory syncytial virus.
Sanofi – SANOFI S.A.
Sarbanes-Oxley Act – the US Sarbanes-Oxley Act of 2002.
SDRT – UK stamp duty reserve tax.
SEC – the US Securities and Exchange Commission, the governmental agency that regulates the US securities industry and stock markets.
Seroquel –Seroquel IR andSeroquelXR.
SET – Senior Executive Team.
SG&A costs – selling, general and administrative costs.
SGLT2– sodium-glucose co-transporter 2.
SHE – Safety, Health and Environment.
Shionogi – Shionogi & Co. Ltd.
SLE – systemic lupus erythematosus.
SPC – supplementary protection certificate
specialty care – specific healthcare provided by medical specialists who do not generally have first contact with patients.
Spirogen – Spirogen Sàrl.
SSE – the Stockholm Stock Exchange.
Takeda – Takeda Pharmaceutical Company Limited.
Teva – Teva Pharmaceuticals USA, Inc.
Total Revenue – the sum of Product Sales and Externalisation Revenue.
TSR – total shareholder return, being the total return on a share over a period of time, including dividends reinvested.
UK – United Kingdom of Great Britain and Northern Ireland.
UK Corporate Governance Code – the UK Corporate Governance Code published by the FRC in September 2014 that sets out standards of good practice in corporate governance for the UK.
US – United States of America.
US dollar, US$, USD or $ – references to the currency of the US.
Valeant – Valeant Holdings Ireland/Valeant Pharmaceutical International, Inc.
WHO – World Health Organization, the United Nations’ specialised agency for health.
YHP – Young Health Programme.
ZS Pharma – ZS Pharma, Inc.
| | |
| AstraZenecaAnnual Report and Form 20-F Information 2016 | | 241 |
Additional Information
Index
| | |
| Accounting policies | | 77, 142, 200 |
| Acerta Pharma | | 26, 29, 62-74, 173 |
| Acquisitions | | 173-177 |
| Affordable Care Act | | 13, 49, 82 |
| Almirall | | 68, 72, 176 |
| Animal research | | 48 |
| Annual General Meeting | | 97, 105, 237 |
| Articles of Association | | 237 |
| AstraZeneca at a glance | | 2-3 |
| Audit Committee | | 84, 98-102 |
| Audit Committee Report | | 98-102 |
| Bioethics | | 47-48 |
| Biologics | | 12, 15 |
| BMS | | 63-69, 175 |
| Board of Directors | | 86-87 |
| Brilinta/Brilique | | 31-33 |
| Business model | | 8-10 |
| Cambridge | | 7 |
| Capitalisation and shareholder return | | 76 |
| Cardiovascular and Metabolic diseases | | 30-34 |
| Cash and cash equivalents | | 162 |
| Chairman’s Statement | | 82-83 |
| Chief Executive Officer’s Review | | 4-6 |
| Clinical trials | | 8-9, 46-48 |
| Code of Conduct | | 52, 95-96 |
| Commitments and contingent liabilities | | 185-191 |
| Community investment | | 53 |
| Company history | | 237 |
| Compliance and Internal Audit Services | | 95 |
| Consolidated Statements | | 138-141 |
| Corporate Governance | | 82-131 |
| Corporate Information | | 237 |
| Corporate Integrity Agreement | | 98 |
| Definiens | | 176-177 |
| Development pipeline | | 23, 204-210 |
| Diabetes | | 32-34 |
| Directors’ interest in shares | | 114-115 |
| Directors’ responsibility statement | | 133 |
| Diversity | | 55-56, 90-91 |
| Dividends | | 3, 76, 96, 172 |
| Earnings per Ordinary Share | | 152 |
| Employee costs and share plans for employees | | 182-184 |
| Employees | | 52-57 |
| Environmental impact | | 60-61 |
| Ethics | | 52, 95 |
| Externalisation | | 23-24, 67 |
| Finance income and expense | | 149 |
| Financial instruments | | 149 |
| Financial position 2016 | | 72 |
| Financial Review | | 62-81 |
| Financial risk management | | 76-77, 177-181 |
| Financial Statements 2016 | | 133-192 |
| Financial summary | | 1 |
| Gender diversity | | 55-56 |
| Geographical Review | | 226-230 |
| Global pharmaceutical sales | | 11-12 |
| Glossary | | 239-241 |
| Group Financial Record | | 203 |
| Group Subsidiaries and Holdings | | 193-196 |
| Growth Platforms | | 17 |
| Healthy Heart Africa programme | | 49 |
| Human Rights | | 56-67 |
| Independent auditor’s report | | 134-137 |
| Infection, Neuroscience and Gastrointestinal | | See Other Disease Areas |
| | |
| Information Technology | | 60 |
| Intangible assets | | 73, 80, 101, 134-135, 143, 157-159 |
| Intellectual Property | | 57 |
| Interest-bearing loans and borrowings | | 162-163 |
| Key performance indicators | | 16-19 |
| Leases | | 144, 146, 191 |
| Life-cycle of a medicine | | 8-9 |
| Litigation | | 20, 80, 101, 135, 145, 185-200 |
| Lynparza | | 26-29 |
| Manufacturing and Supply | | 58-59 |
| Market definitions | | 239 |
| Marketplace | | 11-15 |
| Modern Slavery Act | | 56 |
| Oncology | | 25-29 |
| Operating profit | | 1, 62-65, 148-149 |
| Operational overview | | 2-3 |
| Other Disease Areas | | 38-41 |
| Other investments | | 144, 160 |
| PARTHENON programme | | 33 |
| Patent Expiries | | 15, 211-213 |
| Patents | | See Intellectual Property |
| Patient safety | | 47-48 |
| Personalised healthcare | | 46 |
| Physician Payments Sunshine Act | | 52 |
| Political donations | | 97 |
| Post-retirement benefits | | 80, 136, 165-171 |
| Product revenue information | | 226-230 |
| Property, plant and equipment | | 73 |
| Provisions | | 165 |
| Regulatory requirements | | 13-14 |
| Related party transactions | | 192, 234 |
| Relations with shareholders | | 93 |
| Remuneration | | 103-121 |
| Remuneration Policy | | 122-132 |
| Research and Development | | 45-48 |
| Reserves | | 172 |
| Respiratory | | 37 |
| Restructuring | | 43, 69, 148 |
| Results of operations 2016 | | 65 |
| Risk | | 20-22, 214-225 |
| Sales and Marketing | | 48-51 |
| Sales by geographical area | | 226-230 |
| Sales by therapy area | | 23, 226-230 |
| Sarbanes-Oxley Act | | 81 |
| Science Committee | | 93-94 |
| Segment information | | 152-153 |
| Senior management (SET) | | 85, 88-89 |
| Share capital | | 172 |
| Share repurchase | | 76, 172 |
| Shareholder distributions | | 3, 76, 96 |
| Shareholder information | | 232-236 |
| Strategic priorities | | 2, 5, 16-19 |
| Sustainability: supplementary information | | 231 |
| Tagrisso | | 4-5, 26-29 |
| Takeda | | 24, 36-37, 57 |
| Taxation | | 69, 76, 81, 143, 150-152, 200 |
| Taxation information for shareholders | | 234-236 |
| Therapy Area Overview and Pipeline | | 23-41 |
| Trade and other payables | | 72, 144, 164 |
| Trade and other receivables | | 72, 144, 162, 181 |
| Trade marks | | 238 |
| Values and Purpose | | 8 |
| Young Health Programme | | 53 |
| ZS Pharma | �� | 34, 62-73, 174-175 |
| | |
| 242 | | AstraZenecaAnnual Report and Form 20-F Information 2016 |
|
Important information for readers of this Annual Report |
Cautionary statement regarding forward-looking statements
The purpose of this Annual Report is to provide information to the members of the Company. The Company and its Directors, employees, agents and advisers do not accept or assume responsibility to any other person to whom this Annual Report is shown or into whose hands it may come and any such responsibility or liability is expressly disclaimed. In order, among other things, to utilise the ‘safe harbour’ provisions of the US Private Securities Litigation Reform Act of 1995 and the UK Companies Act 2006, we are providing the following cautionary statement: This Annual Report contains certain forward-looking statements with respect to the operations, performance and financial condition of the Group, including, among other things, statements about expected revenues, margins, earnings per share or other financial or other measures. Forward-looking statements are statements relating to the future which are based on information available at the time such statements are made, including information relating to risks and uncertainties. Although we believe that the forward-looking statements in this Annual Report are based on reasonable assumptions, the matters discussed in the forward-looking statements may be influenced by factors that could cause actual outcomes and results to be materially different from those expressed or implied by these statements. The forward-looking statements reflect knowledge and information available at the date of the preparation of this Annual Report and the Company undertakes no obligation to update these forward-looking statements. We identify the forward-looking statements by using the words ‘anticipates’, ‘believes’, ‘expects’, ‘intends’ and similar expressions in such statements. Important factors that could cause actual results to differ materially from those contained in forward-looking statements, certain of which are beyond our control, include, among other things, those factors identified in the Risk section from page 214 of this Annual Report. Nothing in this Annual Report should be construed as a profit forecast.
Inclusion of Reported performance,
Core financial measures and constant exchange rate growth rates
AstraZeneca’s determination of non-GAAP measures together with our presentation of them within our financial information may differ from similarly titled non-GAAP measures of other companies.
Statements of competitive position, growth rates and sales
In this Annual Report, except as otherwise stated, market information regarding the position of our business or products relative to its or their competition is based upon published statistical sales data for the 12 months ended 30 September 2016 obtained from IMS Health, a leading supplier of statistical data to the pharmaceutical industry. Unless otherwise noted, for the US, dispensed new or total prescription data and audited sales data are taken, respectively, from IMS Health National Prescription Audit and IMS National Sales Perspectives for the 12 months ended 31 December 2016; such data is not adjusted for Medicaid and similar rebates. Except as otherwise stated, these market share and industry data from IMS Health have been derived by comparing our sales revenue with competitors’ and total market sales revenues for that period, and except as otherwise stated, growth rates are given at CER. For the purposes of this Annual Report, unless otherwise stated, references to the world pharmaceutical market or similar phrases are to the 54 countries contained in the IMS Health database, which amounted to approximately 96% (in value) of the countries audited by IMS Health.
AstraZeneca websites
Information on or accessible through our websites, including www.astrazeneca.com, www.astrazenecaclinicaltrials.com and www.medimmune.com, does not form part of and is not incorporated into this Annual Report.
External/third party websites
Information on or accessible through any third party or external website does not form part of and is not incorporated into this Annual Report.
Figures
Figures in parentheses in tables and in the Financial Statements are used to represent negative numbers.
| | |
| AstraZenecaAnnual Report and Form 20-F Information 2016 | | 243 |
Additional Information
| | | | |
| Registered office and corporate | | Registrar |
| headquarters | | Equiniti Limited |
| AstraZeneca PLC | | Aspect House |
| 1 Francis Crick Avenue | | Spencer Road |
| Cambridge Biomedical Campus | | Lancing |
| Cambridge CB2 0AA | | West Sussex BN99 6DA |
| UK | | UK |
| Tel: +44 (0)20 3749 5000 | | Tel: (freephone in the UK) 0800 389 1580 |
| | Tel: (outside the UK) +44 (0)121 415 7033 |
| Investor relations | | |
| UK: as above | | Swedish Central Securities Depository |
| | Euroclear Sweden AB |
| US: | | PO Box 191 |
| Investor Relations | | SE-101 23 Stockholm |
| AstraZeneca Pharmaceuticals LP | | Sweden |
| One MedImmune Way | | Tel: +46 (0)8 402 9000 |
| Gaithersburg MD 20878 | | |
| US | | US Depositary |
| Tel: +1 (301) 398 0000 | | Citibank Shareholder Services |
| | PO Box 43077 |
| | Providence |
| | RI 02940-3077 |
| | US |
| | | | Tel: (toll free in the US) +1 (888) 697 8018 |
 | | For more information please see www.astrazeneca.com | | Tel: (outside the US) +1 (781) 575 4555 citibank@shareholders-online.com |
| | |
| 244 | | AstraZenecaAnnual Report and Form 20-F Information 2016 |
| | | | |
Designed and produced by CONRAN DESIGN GROUP Board and SET photography by Marcus Lyon | | This Annual Report is printed on Heaven 42 which is FSC® certified virgin fibre. The pulp is a mix; partly bleached using an Elemental Chlorine Free process and partly bleached using a Totally Chlorine Free process. It is printed in the UK by Pureprint using itsalcofree® andpureprint® environmental printing technology, and vegetable inks were used throughout. Pureprint is a CarbonNeutral® company. Both the manufacturing mill and the printer are registered to the Environmental Management System ISO 14001 and are Forest Stewardship Council® chain-of-custody certified. | | 
|
AstraZeneca PLC
1 Francis Crick Avenue
Cambridge Biomedical Campus
Cambridge CB2 0AA
UK
Tel: +44 (0)20 3749 5000