Item 1. Report to Stockholders:
The following is a copy of the report transmitted to stockholders pursuant to Rule 30e-1 under the Investment Company Act of 1940:
What makes Putnam different?

In 1830, Massachusetts Supreme Judicial Court Justice Samuel Putnam established The Prudent Man Rule, a legal foundation for responsible money management.
THE PRUDENT MAN RULE
All that can be required of a trustee to invest is that he shall conduct himself faithfully and exercise a sound discretion. He is to observe how men of prudence, discretion, and intelligence manage their own affairs, not in regard to speculation, but in regard to the permanent disposition of their funds, considering the probable income, as well as the probable safety of the capital to be invested.

A time-honored tradition in money management
Since 1937, our values have been rooted in a profound sense of responsibility for the money entrusted to us.
A prudent approach to investing
We use a research-driven team approach to seek consistent, dependable, superior investment results over time, although there is no guarantee a fund will meet its objectives.
Funds for every investment goal
We offer a broad range of mutual funds and other financial products so investors and their advisors can build diversified portfolios.
A commitment to doing what’s right for investors
We have below-average expenses and stringent investor protections, and provide a wealth of information about the Putnam funds.
Industry-leading service
We help investors, along with their financial advisors, make informed investment decisions with confidence.
Putnam Capital
Appreciation
Fund |
11| 30| 05
Semiannual Report
| Message from the Trustees | 2 |
| About the fund | 4 |
| Report from the fund managers | 7 |
| Performance | 12 |
| Expenses | 15 |
| Portfolio turnover | 17 |
| Risk | 18 |
| Your fund’s management | 19 |
| Terms and definitions | 22 |
| Trustee approval of management contract | 24 |
| Other information for shareholders | 29 |
| Financial statements | 30 |
| Brokerage commissions | 59 |
Cover photograph: © Marco Cristofori
Message from the Trustees
Dear Fellow Shareholder
During the course of 2005, U.S. and global economies proved resilient in the face of some emerging challenges. Higher energy prices, mounting inflationary pressures, and damage caused by an unusually active hurricane season appeared at times to pose a risk to corporate earnings, raising investors’ concerns. The Federal Reserve Board’s program of interest-rate increases remained in effect throughout the year, as well. Nevertheless, in recent months the financial markets have demonstrated trends consistent with an expanding economy -- relative weakness for bonds and relative strength for stocks. With many companies appearing likely to deliver strong earnings, our teams are working to identify investment opportunities while remaining cognizant of the risks posed by higher energy prices in the winter months, as well as the possibility of continued increases in interest rates in 2006.
In our view, the professional research, diversification, and active management that mutual funds provide continue to make them an intelligent choice for investors. We want you to know that Putnam Investments’ management team, under the leadership of Chief Executive Officer Ed Haldeman, continues to focus on investment performance and remains committed to putting the interests of shareholders first. Also, in keeping with these goals, we have redesigned and expanded our shareholder reports to make it easier for you to learn more about your fund. Furthermore, on page 24 we provide information about the 2005 approval by the Trustees of your fund’s management contract with Putnam.
2
In the following pages, members of your fund’s management team discuss the fund’s performance and strategies, and their outlook for the months ahead. We thank you for your support of the Putnam funds throughout 2005 and wish you a happy and prosperous 2006.
Putnam Capital Appreciation Fund:
seeking overlooked, underpriced companies
|

At any given time, financial market conditions may favor one type of stock over another. For example, the market may favor growth stocks -- stocks of companies with potential for rapid growth. At other times, the market may favor value stocks -- those whose prices are low relative to the company’s long-term potential. A key advantage of Putnam Capital Appreciation Fund is that it invests in both types of stocks, which means the fund’s management team can seek opportunities in any market environment. In addition, the fund can also invest in stocks across a wide range of industries and in companies of all sizes. The ability to spread fund assets so broadly brings diversity to the fund’s portfolio.
The fund’s management team believes that every company, regardless of its size, products, services, or industry, has an underlying long-term business worth. While a stock price may fluctuate, a company's long-term growth potential is crucial in determining this underlying worth. In seeking investments for the fund’s portfolio, the team looks for companies whose current stock prices do not reflect this long-term worth. Often, investors will underestimate the ability of successful companies to maintain their long-term competitive advantages. Short-term setbacks also can cause a company’s stock price to decline. The fund’s management team searches for these market “inefficiencies,” identifying undervalued stocks, and holding them in the portfolio until their prices more closely reflect the company’s true worth. To gain a better understanding of companies and stocks, the team combines
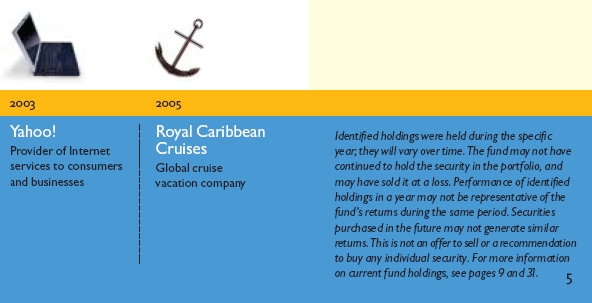
Putnam Capital Appreciation Fund’s holdings have spanned
sectors and industries over time.

4
two types of analysis: quantitative analysis of a company’s historical results, and fundamental analysis of those results to forecast the future direction of a company.
The fund invests some or all of its assets in small and/or midsize companies. Such investments increase the risk of greater price fluctuations.
In-depth stock analysis:
Evaluate the future and
understand the past |
Drawing on the expertise of dedicated stock analysts, the fund’s management team seeks stocks that are believed to be worth more than their current prices indicate.
In conducting research, the team uses both quantitative and fundamental analysis. While many research organizations emphasize just one approach, Putnam analysts look for companies that score well using both measures. They also dig behind the numbers to try to get a better understanding of each company’s competitive advantages and weaknesses.
The thoroughness of this process enables the fund’s managers to have greater conviction when their views differ from the market. Once a stock is selected for the portfolio, it is regularly assessed by the team to ensure that it continues to meet their criteria.
Putnam Capital Appreciation Fund invests in stocks of companies at all capitalization levels, and across a broad range of industries. While it has no bias toward either growth or value stocks, it targets companies believed to be worth more than their current stock prices indicate. It may be suitable for investors who are seeking growth through a well-diversified stock portfolio.
Highlights
* For the six months ended November 30, 2005, Putnam Capital Appreciation Fund’s class A shares returned 9.32% without sales charges.
* The fund’s benchmark, the Russell 3000 Index, gained 6.78% .
* The average return for the fund’s Lipper category, Multi-Cap Core Funds, was 7.01% .
* Additional fund performance, comparative performance, and Lipper data can be found in the performance section beginning on page 12.
Performance
Total return for class A shares for periods ended 11/30/05
Since the fund's inception (8/5/93), average annual return is 10.88% at NAV and 10.40% at POP.
| | | Average annual return | | Cumulative return |
| | | NAV | POP | NAV | POP |
|
| 10 years | | 7.72% | 7.14% | 110.38% | 99.34% |
|
| 5 years | | 1.06 | –0.02 | 5.44 | –0.11 |
|
| 3 years | | 14.08 | 12.05 | 48.46 | 40.70 |
|
| 1 year | | 12.17 | 6.26 | 12.17 | 6.26 |
|
| 6 months | | -- | -- | 9.32 | 3.60 |
|
Data is historical. Past performance does not guarantee future results. More recent returns may be less or more than those shown. Investment return and principal value will fluctuate, and you may have a gain or a loss when you sell your shares. Performance assumes reinvestment of distributions and does not account for taxes. Returns at NAV do not reflect a sales charge of 5.25% . For the most recent month-end performance, visit www.putnam.com. For a portion of the period, this fund limited expenses, without which returns would have been lower. A short-term trading fee of up to 2% may apply.
6
Report from the fund managers
The period in review
We are pleased to report that your fund delivered solid returns at net asset value (NAV, or without sales charges) for the six months ended November 30, 2005. Based on results at NAV, the fund finished ahead of both its benchmark, the Russell 3000 Index, and the average for its Lipper category, Multi-Cap Core Funds.
We attribute this outperformance to successful stock selection in the consumer cyclical, health-care, energy, and capital goods sectors, although consumer staples holdings detracted from returns to some extent. The fund continued to benefit from our bottom-up, research-intensive stock selection process and our ability to invest in both growth- and value-style stocks.
Market overview
During the six months ended November 30, 2005, stocks gained ground overall, although at several points, investors were concerned by issues such as rising interest rates and soaring energy prices. These worries, however, were offset by some positive trends. The economy continued to expand, job creation improved, and corporate profits were generally solid. Stock market performance was strong early in the period, punctuated by an advance in July that pushed the S&P 500 and Nasdaq Composite indexes to new four-year highs.
Later in the period, however, U.S. financial markets were somewhat choppy. Among the factors causing market jitters were surging oil prices and the devastation on the U.S. Gulf Coast caused by hurricanes Katrina and Rita. October was an especially tough month overall for the markets; major stock indexes declined as investors grew increasingly concerned about inflation and slowing economic growth. These concerns were tempered at the close of the month when the Commerce Department reported that U.S. gross domestic product had grown
7
at a faster-than-expected rate for the third calendar quarter, indicating that the economy remained strong despite its recent challenges. In November, the final month of the period, stocks rallied strongly, partly in response to falling energy prices and strong earnings news.
Strategy overview
In managing your fund’s portfolio, we continued to take a bottom-up approach to stock selection. Regardless of how the economy or markets are behaving, we look for companies whose stocks appear to be mispriced by the market -- in other words, companies that we believe are worth more than their current stock prices indicate.
The fund is managed in a “blend” investment style, which means that instead of having a strong growth or value orientation, it has the flexibility to invest in a wide range of companies. It can invest in companies that are growing rapidly and seem to have the potential to continue growing, as well as out-of-favor companies that are undergoing changes that may improve their earnings and growth potential. In either case, we look for companies whose stock prices are currently low relative to our assessment of the company’s earnings and growth potential.
We find that, typically, stocks become attractively valued when the market underestimates the ability of good companies to maintain their returns
| Market sector performance |
These indexes provide an overview of performance in different market sectors for the |
| six months ended 11/30/05. |
|
| Equities |
|
| Russell 3000 Index (large-company stocks) | 6.78% |
|
| Russell 1000 Growth Index (large-company growth stocks) | 7.05% |
|
| Russell 1000 Value Index (large-company value stocks) | 5.70% |
|
| Russell 2000 Index (small-company stocks) | 10.47% |
|
| Bonds |
|
| Lehman Aggregate Bond Index (broad bond market) | –0.48% |
|
| JP Morgan Global High Yield Index (global high-yield corporate bonds) | 2.72% |
|
| Lehman Government Bond Index (U.S. Treasury and agency securities) | –0.63% |
|
8
and growth rates, or when the market overreacts to short-term events. We believe that if we focus on cash flows and valuations, maintain a diversified portfolio, and remain willing to buy and hold controversial stocks that we think are temporarily out of favor, the fund may be able to consistently profit from mispricings in the market.
Your fund’s holdings
One of the fund’s top-performing stocks during the period was that of Office Depot, the world’s second-largest office-supply chain. This stock performed particularly well after the company announced the appointment of a new CEO, which was followed by a solid improvement in earnings and margins. For several years, the company had struggled to keep pace with its competitor, Staples, the leader in the office-supply industry. We sold the fund’s position in Office Depot by period-end, as the company’s valuation, in our opinion, became less attractive.
Another top-performing stock in the fund’s portfolio was Apple Computer. We believed that investors were underestimating the long-term growth potential of Apple, maker of Macintosh computers and the extremely popular iPod digital music player. We expect Apple’s success to continue as more people use computers for media-related tasks such as music, photography, and video -- areas in which Apple excels in
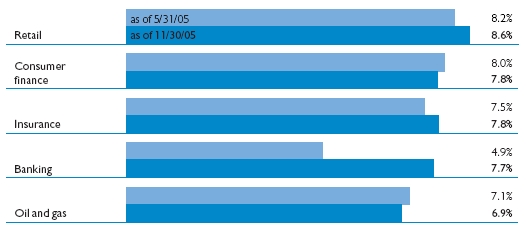
Comparison of top industry weightings
This chart shows how the fund’s top weightings have changed over the last six months. Weightings are shown as a percentage of net assets. Holdings will vary over time.
9
creating software. Apple should also continue to profit from strong demand for the iPod, and the company’s new retail stores should help familiarize more consumers with Apple’s computers, particularly the iMac and PowerBook. Oil and natural gas company Amerada Hess, another fund portfolio highlight, announced in October a 53% rise in profits, driven by high energy prices. In addition, investors gained confidence in management’s ability to increase production and control costs.
Another positive contributor was Administaff, a company that provides human resources services to small and midsize businesses. Administaff’s stock advanced strongly after the company posted better-than-expected third-quarter results. The company’s renewed strength was due in part to successful client retention and new hires within the company’s existing client base. Improved cash flow and earnings helped boost the stock of Terex Corporation during the semian-nual period. This manufacturer of construction and transportation equipment was able to overcome the challenge of increasing steel prices during the period.
Despite the fund’s strong performance for the period, some holdings detracted from performance, including Fannie Mae. We believed that the stock price of this mortgage financing company was significantly undervalued, as it had been hurt by regulatory investigations of its
Top holdings
This table shows the fund’s top holdings, and the percentage of the fund’s net assets that each comprised, as of 11/30/05. The fund's holdings will change over time.
| Holding (percent of fund's net assets) | Industry |
| Countrywide Financial Corp. (3.9%) | Consumer finance |
|
| American International Group, Inc. (3.4%) | Insurance |
|
| Capital One Financial Corp. (3.3%) | Consumer finance |
|
| Occidental Petroleum Corp. (3.3%) | Oil and gas |
|
| Commerce Bancorp, Inc. (3.1%) | Banking |
|
| Dell, Inc. (2.7%) | Computers |
|
| Amerada Hess Corp. (2.3%) | Oil and gas |
|
| UnitedHealth Group, Inc. (2.2%) | Health-care services |
|
| Home Depot, Inc. (The) (2.2%) | Retail |
|
| NVR, Inc. (2.1%) | Homebuilding |
|
10
accounting practices. However, as these issues continued during the period, our view of the business and the future value of the company began to change. As a result, we sold Fannie Mae from the portfolio, replacing it with Freddie Mac, another mortgage-financing company.
Also delivering weak performance during the period were homebuilding company NVR and Dell Computer. NVR declined in response to investor concerns about a slowdown in the housing market, while Dell’s slowing growth rate and disappointing quarterly results caused its stock to weaken. Both NVR and Dell remained in the portfolio at the close of the period, as we believe the declines were the result of short-term challenges rather than fundamental weaknesses. In the case of Avon Products, another detractor, we decided to sell the position. The company is dealing with a number of longer-term issues in several overseas markets, and we concluded that its stock no longer represented an attractive opportunity.
Please note that the holdings discussed in this report may not have been held by the fund for the entire period discussed, are subject to review in accordance with the fund’s investment strategy, and may vary in the future.
The outlook for your fund
The following commentary reflects anticipated developments that could affect your fund over the next six months, as well as your management team’s plans for responding to them.
At the close of the semiannual period, worries about rising interest rates, high energy costs, and slowing consumer spending continued to weigh on the financial markets. However, there was also good news, including relatively tame inflation and a healthy pace of corporate profitability growth.
Regardless of the direction the markets take in the months ahead, we remain focused on the long-term potential of individual companies rather than short-term developments in the economy. While the market as a whole is affected by world events and economic cycles, we believe investors’ long-term goals are best served by the fund’s diversified portfolio and our bottom-up approach to stock selection, which relies heavily on fundamental research and analysis.
The views expressed in this report are exclusively those of Putnam Management. They are not meant as investment advice.
The fund invests some or all of its assets in small and/or midsize companies. Such investments increase the risk of fluctuations in the value of your investment.
11
Your fund’s performance
This section shows your fund’s performance during the first half of its fiscal year, which ended November 30, 2005. In accordance with regulatory requirements, we also include performance for the most current calendar quarter-end. Performance should always be considered in light of a fund’s investment strategy. Data represents past performance. Past performance does not guarantee future results. More recent returns may be less or more than those shown. Investment return and principal value will fluctuate, and you may have a gain or a loss when you sell your shares. For the most recent month-end performance, please visit www.putnam.com or call Putnam at 1-800-225-1581. Class Y shares are generally only available to corporate and institutional clients. See the Terms and Definitions section in this report for definitions of the share classes offered by your fund.
Fund performance
Total return for periods ended 11/30/05
|
| | Class A | | Class B | | Class C | | Class M | | Class R | Class Y |
| (inception dates) | (8/5/93) | | (11/2/94) | | (7/14/00) | | (1/22/96) | | (12/1/03) | (10/4/05) |
| | NAV | POP | NAV | CDSC | NAV | CDSC | NAV | POP | NAV | NAV |
|
| Annual average | | | | | | | | | | |
| (life of fund) | 10.88% | 10.40% | 10.07% | 10.07% | 10.30% | 10.30% | 10.32% | 10.03% | 10.61% | 10.89% |
|
| 10 years | 110.38 | 99.34 | 95.70 | 95.70 | 97.28 | 97.28 | 100.00 | 93.55 | 105.23 | 110.49 |
| Annual average | 7.72 | 7.14 | 6.94 | 6.94 | 7.03 | 7.03 | 7.18 | 6.83 | 7.45 | 7.73 |
|
| 5 years | 5.44 | –0.11 | 1.56 | –0.08 | 1.58 | 1.58 | 2.88 | –0.47 | 4.18 | 5.49 |
| Annual average | 1.06 | –0.02 | 0.31 | –0.02 | 0.31 | 0.31 | 0.57 | –0.09 | 0.82 | 1.07 |
|
| 3 years | 48.46 | 40.70 | 45.15 | 42.15 | 45.21 | 45.21 | 46.26 | 41.55 | 47.47 | 48.53 |
| Annual average | 14.08 | 12.05 | 13.22 | 12.44 | 13.24 | 13.24 | 13.51 | 12.28 | 13.82 | 14.10 |
|
| 1 year | 12.17 | 6.26 | 11.31 | 6.31 | 11.30 | 10.30 | 11.59 | 7.98 | 11.91 | 12.22 |
|
| 6 months | 9.32 | 3.60 | 8.88 | 3.88 | 8.93 | 7.93 | 9.08 | 5.51 | 9.20 | 9.38 |
|
Performance assumes reinvestment of distributions and does not account for taxes. Returns at public offering price (POP) for class A and M shares reflect a sales charge of 5.25% and 3.25%, respectively. Class B share returns reflect the applicable contingent deferred sales charge (CDSC), which is 5% in the first year, declining to 1% in the sixth year, and is eliminated thereafter. Class C shares reflect a 1% CDSC the first year that is eliminated thereafter. Class R and Y shares have no initial sales charge or CDSC. Performance for class B, C, M, R, and Y shares before their inception is derived from the historical performance of class A shares, adjusted for the applicable sales charge (or CDSC) and, except for class Y shares, the higher operating expenses for such shares.
For a portion of the period, this fund limited expenses, without which returns would have been lower.
A 2% short-term trading fee may be applied to shares exchanged or sold within 5 days of purchase.
12
Comparative index returns
For periods ended 11/30/05
|
| | | Lipper Multi-Cap |
| | Russell | Core Funds |
| | 3000 Index | category average* |
|
| Annual average | | |
| (life of fund) | 10.66% | 10.24% |
|
| 10 years | 144.88 | 151.72 |
| Annual average | 9.37 | 9.12 |
|
| 5 years | 9.88 | 14.74 |
| Annual average | 1.90 | 2.30 |
|
| 3 years | 46.76 | 44.61 |
| Annual average | 13.64 | 12.97 |
|
| 1 year | 9.80 | 9.31 |
|
| 6 months | 6.78 | 7.01 |
|
Index and Lipper results should be compared to fund performance at net asset value.
* Over the 6-month and 1-, 3-, 5-, and 10-year periods ended 11/30/05, there were 913, 825, 579, 407, and 130 funds, respectively, in this Lipper category.
Fund price and distribution* information
For the six-month period ended 11/30/05
| | | Class A | | | Class B | | Class C | | Class M | | Class R | | Class Y |
|
| Share value: | | NAV | POP | | NAV | | NAV | | NAV | POP | | NAV | | NAV |
| 5/31/05 | | $18.45 | $19.47 | | $17.45 | | $17.81 | | $17.74 | $18.34 | | $18.38 | | -- |
|
| 10/4/05† | | -- | -- | | -- | | -- | | -- | -- | | -- | | $19.55 |
|
| 11/30/05 | | 20.17 | 21.29 | | 19.00 | | 19.40 | | 19.35 | 20.00 | | 20.07 | | 20.18 |
|
* The fund made no distributions during the period.
† Inception date of class Y shares.
13
| Fund performance for most recent calendar quarter | | | |
Total return for periods ended 12/31/05 | | | | | | | |
|
| | Class A | | Class B | | Class C | | Class M | | Class R | Class Y |
| (inception dates) | (8/5/93) | | (11/2/94) | | (7/14/00) | | (1/22/96) | | (12/1/03) | (10/4/05) |
| | NAV | POP | NAV | CDSC | NAV | CDSC | NAV | POP | NAV | NAV |
|
| Annual average | | | | | | | | | | |
| (life of fund) | 10.81% | 10.33% | 10.00% | 10.00% | 10.23% | 10.23% | 10.25% | 9.95% | 10.53% | 10.81% |
|
| 10 years | 105.76 | 95.02 | 91.39 | 91.39 | 93.90 | 93.90 | 95.62 | 89.25 | 100.70 | 105.85 |
| Annual average | 7.48 | 6.91 | 6.71 | 6.71 | 6.85 | 6.85 | 6.94 | 6.59 | 7.21 | 7.49 |
|
| 5 years | 1.32 | –3.98 | –2.41 | –4.37 | –2.46 | –2.46 | –1.23 | –4.44 | 0.05 | 1.36 |
| Annual average | 0.26 | –0.81 | –0.49 | –0.89 | –0.50 | –0.50 | –0.25 | –0.91 | 0.01 | 0.27 |
|
| 3 years | 57.35 | 49.10 | 53.85 | 50.85 | 53.85 | 53.85 | 55.05 | 50.00 | 56.18 | 57.41 |
| Annual average | 16.31 | 14.24 | 15.44 | 14.69 | 15.44 | 15.44 | 15.74 | 14.47 | 16.02 | 16.33 |
|
| 1 year | 7.82 | 2.14 | 7.04 | 2.04 | 7.01 | 6.01 | 7.26 | 3.75 | 7.56 | 7.86 |
|
| 6 months | 6.45 | 0.87 | 6.09 | 1.09 | 6.07 | 5.07 | 6.20 | 2.76 | 6.30 | 6.49 |
|
14
Your fund’s expenses
As a mutual fund investor, you pay ongoing expenses, such as management fees, distribution fees (12b-1 fees), and other expenses. Using the information below, you can estimate how these expenses affect your investment and compare them with the expenses of other funds. You may also pay one-time transaction expenses, including sales charges (loads) and redemption fees, which are not shown in this section and would have resulted in higher total expenses. For more information, see your fund’s prospectus or talk to your financial advisor.
Review your fund’s expenses
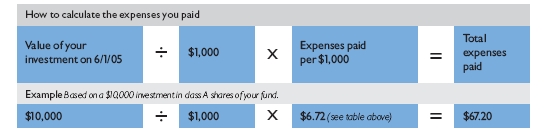
The table below shows the expenses you would have paid on a $1,000 investment in Putnam Capital Appreciation Fund from June 1, 2005, to November 30, 2005. It also shows how much a $1,000 investment would be worth at the close of the period, assuming actual returns and expenses.
| | Class A | Class B | Class C | Class M | Class R | Class Y |
|
| Expenses paid per $1,000* | $ 6.72 | $ 10.63 | $ 10.63 | $ 9.33 | $ 8.02 | $ | 1.66 |
|
| Ending value (after expenses) | $1,093.20 | $1,088.80 | $1,089.30 | $1,090.80 | $1,092.00 | $1,032.20 |
|
* Expenses for each share class are calculated using the fund’s annualized expense ratio for each class, which represents the ongoing expenses as a percentage of net assets for the six months ended 11/30/05 (for the period from 10/4/05 to 11/30/05 for Y shares). The expense ratio may differ for each share class (see the table at the bottom of the next page). Expenses are calculated by multiplying the expense ratio by the average account value for the period then multiplying the result by the number of days in the period and then dividing that result by the number of days in the year.
Estimate the expenses you paid
To estimate the ongoing expenses you paid for the six months ended November 30, 2005, use the calculation method below. To find the value of your investment on June 1, 2005, go to www.putnam.com and log on to your account. Click on the “Transaction History” tab in your Daily Statement and enter 06/01/2005 in both the “from” and “to” fields. Alternatively, call Putnam at 1-800-225-1581.
15
Compare expenses using the SEC’s method
The Securities and Exchange Commission (SEC) has established guidelines to help investors assess fund expenses. Per these guidelines, the table below shows your fund’s expenses based on a $1,000 investment, assuming a hypothetical 5% annualized return. You can use this information to compare the ongoing expenses (but not transaction expenses or total costs) of investing in the fund with those of other funds. All mutual fund shareholder reports will provide this information to help you make this comparison. Please note that you cannot use this information to estimate your actual ending account balance and expenses paid during the period.
| | Class A | Class B | Class C | Class M | Class R | Class Y |
|
| Expenses paid per $1,000* | $ 6.48 | $ 10.25 | $ 10.25 | $ 9.00 | $ 7.74 | $ 1.64 |
|
| Ending value (after expenses) | $1,018.65 | $1,014.89 | $1,014.89 | $1,016.14 | $1,017.40 | $1,006.31 |
|
* Expenses for each share class are calculated using the fund’s annualized expense ratio for each class, which represents the ongoing expenses as a percentage of net assets for the six months ended 11/30/05 (for the period from 10/4/05 to 11/30/05 for Y shares). The expense ratio may differ for each share class (see the table at the bottom of this page). Expenses are calculated by multiplying the expense ratio by the average account value for the period then multiplying the result by the number of days in the period and then dividing that result by the number of days in the year.
Compare expenses using industry averages
You can also compare your fund’s expenses with the average of its peer group, as defined by Lipper, an independent fund-rating agency that ranks funds relative to others that Lipper considers to have similar investment styles or objectives. The expense ratio for each share class shown below indicates how much of your fund’s net assets have been used to pay ongoing expenses during the period.
| | Class A | Class B | Class C | Class M | Class R | Class Y |
| Your fund's annualized | | | | | | |
| expense ratio | 1.28% | 2.03% | 2.03% | 1.78% | 1.53% | 1.03% |
|
| Average annualized expense | | | | | | |
| ratio for Lipper peer group† | 1.41% | 2.16% | 2.16% | 1.91% | 1.66% | 1.16% |
|
† Simple average of the expenses of all front-end load funds in the fund’s Lipper peer group, calculated in accordance with Lipper’s standard method for comparing fund expenses (excluding 12b-1 fees and without giving effect to any expense offset and brokerage service arrangements that may reduce fund expenses). This average reflects each fund’s expenses for its most recent fiscal year available to Lipper as of 9/30/05. To facilitate comparison, Putnam has adjusted this average to reflect the 12b-1 fees carried by each class of shares other than class Y shares, which do not incur 12b-1 fees. The peer group may include funds that are significantly smaller or larger than the fund, which may limit the comparability of the fund’s expenses to the simple average, which typically is higher than the asset-weighted average.
16
Your fund’s
portfolio turnover
|
Putnam funds are actively managed by teams of experts who buy and sell securities based on intensive analysis of companies, industries, economies, and markets. Portfolio turnover is a measure of how often a fund’s managers buy and sell securities for your fund. A portfolio turnover of 100%, for example, means that the managers sold and replaced securities valued at 100% of a fund’s assets within a one-year period. Funds with high turnover may be more likely to generate capital gains and dividends that must be distributed to shareholders as taxable income. High turnover may also cause a fund to pay more brokerage commissions and other transaction costs, which may detract from performance.
Turnover comparisons
Percentage of holdings that change every year
|
| | 2005 | 2004 | 2003 | 2002 | 2001 |
| Putnam Capital Appreciation Fund | 121% | 111% | 107% | 134% | 264% |
|
| Lipper Multi-Cap Core Funds | | | | | |
| category average | 75% | 79% | 80% | 87% | 94% |
|
Turnover data for the fund is calculated based on the fund’s fiscal-year period, which ends on May 31. Turnover data for the fund’s Lipper category is calculated based on the average of the turnover of each fund in the category for its fiscal year ended during the indicated year. Fiscal years vary across funds in the Lipper category, which may limit the comparability of the fund’s portfolio turnover rate to the Lipper average. Comparative data for 2005 is based on information available as of 9/30/05.
17
Your fund’s risk
This risk comparison is designed to help you understand how your fund compares with other funds. The comparison utilizes a risk measure developed by Morningstar, an independent fund-rating agency. This risk measure is referred to as the fund’s Overall Morningstar Risk.
Your fund’s Overall Morningstar® Risk

Your fund’s Overall Morningstar Risk is shown alongside that of the average fund in its broad asset class, as determined by Morningstar. The risk bar broadens the comparison by translating the fund’s Overall Morningstar Risk into a percentile, which is based on the fund’s ranking among all funds rated by Morningstar as of December 31, 2005. A higher Overall Morningstar Risk generally indicates that a fund’s monthly returns have varied more widely.
Morningstar determines a fund’s Overall Morningstar Risk by assessing variations in the fund’s monthly returns -- with an emphasis on downside variations -- over 3-, 5-, and 10-year periods, if available. Those measures are weighted and averaged to produce the fund’s Overall Morningstar Risk. The information shown is provided for the fund’s class A shares only; information for other classes may vary. Overall Morningstar Risk is based on historical data and does not indicate future results. Morningstar does not purport to measure the risk associated with a current investment in a fund, either on an absolute basis or on a relative basis. Low Overall Morningstar Risk does not mean that you cannot lose money on an investment in a fund. Copyright 2004 Morningstar, Inc. All Rights Reserved. The information contained herein (1) is proprietary to Morningstar and/or its content providers; (2) may not be copied or distributed; and (3) is not warranted to be accurate, complete, or timely. Neither Morningstar nor its content providers are responsible for any damages or losses arising from any use of this information.
18
Your fund’s management
Your fund is managed by the members of the Putnam U.S. Core and U.S. Small- and Mid-Cap Core teams. James Wiess is the Portfolio Leader, and Richard Cervone, Joseph Joseph, and James Yu are Portfolio Members of the fund. The Portfolio Leader and Portfolio Members coordinate the teams’ management of the fund.
For a complete listing of the members of the Putnam U.S. Core and U.S. Small- and Mid-Cap Core teams, including those who are not Portfolio Leaders or Portfolio Members of your fund, visit Putnam’s Individual Investor Web site at www.putnam.com.
Fund ownership by the Portfolio Leader and Portfolio Members
The table below shows how much the fund’s current Portfolio Leader and Portfolio Members have invested in the fund (in dollar ranges). Information shown is as of November 30, 2005, and November 30, 2004.
| | | | $1 – | $10,001 – | $50,001 – | $100,001 – | $500,001 – | $1,000,001 |
| | Year | $0 | $10,000 | $50,000 | $100,000 | $500,000 | $1,000,000 | and over |
|
| James Wiess | 2005 | • | | | | | | |
|
|
| Portfolio Leader | 2004 | • | | | | | | |
|
| Richard Cervone | 2005 | | | • | | | | |
|
|
| Portfolio Member | 2004 | | | • | | | | |
|
| Joseph Joseph | 2005 | • | | | | | | |
|
|
| Portfolio Member | 2004 | • | | | | | | |
|
| James Yu | 2005 | • | | | | | | |
|
|
| Portfolio Member | 2004 | • | | | | | | |
|
19
Fund manager compensation
The total 2004 fund manager compensation that is attributable to your fund is approximately $620,000. This amount includes a portion of 2004 compensation paid by Putnam Management to the fund managers listed in this section for their portfolio management responsibilities, calculated based on the fund assets they manage taken as a percentage of the total assets they manage. The compensation amount also includes a portion of the 2004 compensation paid to the Chief Investment Officers of the teams and the Group Chief Investment Officers of the fund’s broader investment categories for their oversight responsibilities, calculated based on the fund assets they oversee taken as a percentage of the total assets they oversee. This amount does not include compensation of other personnel involved in research, trading, administration, systems, compliance, or fund operations; nor does it include non-compensation costs. These percentages are determined as of the fund’s fiscal period-end. For personnel who joined Putnam Management during or after 2004, the calculation reflects annualized 2004 compensation or an estimate of 2005 compensation, as applicable.
Other Putnam funds managed by the Portfolio Leader and Portfolio Members
James Wiess is also a Portfolio Leader of Putnam Investors Fund and Putnam Tax Smart Equity Fund.
Richard Cervone is also a Portfolio Member of Putnam Investors Fund and Putnam Tax Smart Equity Fund.
Joseph Joseph is also a Portfolio Leader of Putnam Capital Opportunities Fund and Putnam International Capital Opportunities Fund.
James Yu is also a Portfolio Member of Putnam Investors Fund and Putnam Tax Smart Equity Fund.
James Wiess, Richard Cervone, Joseph Joseph, and James Yu may also manage other accounts and variable trust funds advised by Putnam Management or an affiliate.
Changes in your fund’s Portfolio Leader and Portfolio Members
During the year ended November 30, 2005, Portfolio Leader Joshua Brooks moved to other fund assignments within Putnam and Portfolio Member James Wiess became Portfolio Leader of your fund.
20
Fund ownership by Putnam’s Executive Board
The table below shows how much the members of Putnam’s Executive Board have invested in the fund (in dollar ranges). Information shown is as of November 30, 2005, and November 30, 2004.
| | | | $1 – | $10,001 – | $50,001– | $100,001 |
| | Year | $0 | $10,000 | $50,000 | $100,000 | and over |
|
| Philippe Bibi | 2005 | • | | | | |
|
|
| Chief Technology Officer | 2004 | • | | | | |
|
| Joshua Brooks | 2005 | | | | • | |
|
|
| Deputy Head of Investments | N/A | | | | | |
|
| William Connolly | 2005 | • | | | | |
|
|
| Head of Retail Management | N/A | | | | | |
|
| Kevin Cronin | 2005 | • | | | | |
|
|
| Head of Investments | 2004 | • | | | | |
|
| Charles Haldeman, Jr. | 2005 | | | • | | |
|
|
| President and CEO | 2004 | | | • | | |
|
| Amrit Kanwal | 2005 | • | | | | |
|
|
| Chief Financial Officer | 2004 | • | | | | |
|
| Steven Krichmar | 2005 | • | | | | |
|
|
| Chief of Operations | 2004 | • | | | | |
|
| Francis McNamara, III | 2005 | | • | | | |
|
|
| General Counsel | 2004 | • | | | | |
|
| Richard Robie, III | 2005 | • | | | | |
|
|
| Chief Administrative Officer | 2004 | • | | | | |
|
| Edward Shadek | 2005 | | | • | | |
|
|
| Deputy Head of Investments | N/A | | | | | |
|
| Sandra Whiston | 2005 | • | | | | |
|
|
| Head of Institutional Management | N/A | | | | | |
|
N/A indicates the individual was not a member of Putnam’s Executive Board as of 11/30/04.
21
Terms and definitions
Important terms
Total return shows how the value of the fund’s shares changed over time, assuming you held the shares through the entire period and reinvested all distributions in the fund.
Net asset value (NAV) is the price, or value, of one share of a mutual fund, without a sales charge. NAVs fluctuate with market conditions. NAV is calculated by dividing the net assets of each class of shares by the number of outstanding shares in the class.
Public offering price (POP) is the price of a mutual fund share plus the maximum sales charge levied at the time of purchase. POP performance figures shown here assume the 5.25% maximum sales charge for class A shares and 3.25% for class M shares.
Contingent deferred sales charge (CDSC) is a charge applied at the time of the redemption of class B or C shares and assumes redemption at the end of the period. Your fund’s class B CDSC declines from a 5% maximum during the first year to 1% during the sixth year. After the sixth year, the CDSC no longer applies. The CDSC for class C shares is 1% for one year after purchase.
Share classes
Class A shares are generally subject to an initial sales charge and no sales charge on redemption (except on certain redemptions of shares bought without an initial sales charge).
Class B shares may be subject to a sales charge upon redemption.
Class C shares are not subject to an initial sales charge and are subject to a contingent deferred sales charge only if the shares are redeemed during the first year.
Class M shares have a lower initial sales charge and a higher 12b-1 fee than class A shares and no sales charge on redemption (except on certain redemptions of shares bought without an initial sales charge).
Class R shares are not subject to an initial sales charge or CDSC and are available only to certain defined contribution plans.
Class Y shares are not subject to an initial sales charge or CDSC, and carry no 12b-1 fee. They are only available to eligible purchasers, including eligible defined contribution plans or corporate IRAs.
22
Comparative indexes
JP Morgan Global High Yield Index is an unmanaged index of global high-yield fixed-income securities.
Lehman Aggregate Bond Index is an unmanaged index of U.S. investment-grade fixed-income securities.
Lehman Government Bond Index is an unmanaged index of U.S. Treasury and agency securities. Russell 1000 Growth Index is an unmanaged index of those companies in the large-cap Russell 1000 Index chosen for their growth orientation.
Russell 1000 Value Index is an unmanaged index of those companies in the large-cap Russell 1000 Index chosen for their value orientation.
Russell 2000 Index is an unmanaged index of the 2,000 smallest companies in the Russell 3000 Index.
Russell 3000 Index is an unmanaged index of the 3,000 largest U.S. companies in the Russell universe.
Indexes assume reinvestment of all distributions and do not account for fees. Securities and performance of a fund and an index will differ. You cannot invest directly in an index.
Lipper is a third-party industry-ranking entity that ranks mutual funds. Lipper rankings are based on total return at net asset value and do not reflect sales charges. Funds are ranked among other funds with similar current investment styles or objectives as determined by Lipper. Lipper may change a fund’s category assignment at its discretion. Lipper category averages reflect performance trends for funds within a category.
23
Trustee approval of
management contract
|
General conclusionsThe Board of Trustees of the Putnam funds oversees the management of each fund and, as required by law, determines annually whether to approve the continuance of your fund’s management contract with Putnam Management. In this regard, the Board of Trustees, with the assistance of its Contract Committee consisting solely of Trustees who are not “interested persons” (as such term is defined in the Investment Company Act of 1940, as amended) of the Putnam funds (the “Independent Trustees”), requests and evaluates all information it deems reasonably necessary under the circumstances. Over the course of several months beginning in March and ending in June 2005, the Contract Committee met five times to consider the information provided by Putnam Management and other information developed with the assistance of the Board’s independent counsel and independent staff. The Contract Committee reviewed and discussed key aspects of this information with all of the Independent Trustees. Upon completion of this review, the Contract Committee recommended and the Independent Trustees approved the continuance of your fund’s management contract, effective July 1, 2005.
This approval was based on the following conclusions:
* That the fee schedule currently in effect for your fund represents reasonable compensation in light of the nature and quality of the services being provided to the fund, the fees paid by competitive funds and the costs incurred by Putnam Management in providing such services, and
* That such fee schedule represents an appropriate sharing between fund shareholders and Putnam Management of such economies of scale as may exist in the management of the fund at current asset levels.
These conclusions were based on a comprehensive consideration of all information provided to the Trustees and were not the result of any single factor. Some of the factors that figured particularly in the Trustees’ deliberations and how the Trustees considered these factors are described below, although individual Trustees may have evaluated the information presented differently, giving different weights to various factors. It is also important to recognize that the fee arrangements for your fund and the other Putnam funds are the result of many years of review and discussion between the Independent Trustees and Putnam Management, that certain aspects of such arrangements may receive greater scrutiny in some years than others, and that the Trustees’ conclusions may be based, in part, on their consideration of these same arrangements in prior years.
24
Model fee schedules and categories; total expenses
The Trustees’ review of the management fees and total expenses of the Putnam funds focused on three major themes:
* Consistency. The Trustees, working in cooperation with Putnam Management, have developed and implemented a series of model fee schedules for the Putnam funds designed to ensure that each fund’s management fee is consistent with the fees for similar funds in the Putnam family of funds and compares favorably with fees paid by competitive funds sponsored by other investment advisors. Under this approach, each Putnam fund is assigned to one of several fee categories based on a combination of factors, including competitive fees and perceived difficulty of management, and a common fee schedule is implemented for all funds in a given fee category. The Trustees reviewed the model fee schedule currently in effect for your fund, including fee levels and breakpoints, and the assignment of the fund to a particular fee category under this structure. (“Breakpoints” refer to reductions in fee rates that apply to additional assets once specified asset levels are reached.) The Trustees concluded that no changes should be made in the fund’s current fee schedule at this time.
* Competitiveness. The Trustees also reviewed comparative fee and expense information for competitive funds, which indicated that, in a custom peer group of competitive funds selected by Lipper Inc., your fund ranked in the 21st percentile in management fees and in the 14th percentile in total expenses (less any applicable 12b-1 fees) as of December 31, 2004 (the first percentile being the least expensive funds and the 100th percentile being the most expensive funds). (Because the fund’s custom peer group is smaller than the fund’s broad Lipper Inc. peer group, this expense comparison may differ from the Lipper peer expense information found elsewhere in this report.) The Trustees noted that expense ratios for a number of Putnam funds, which show the percentage of fund assets used to pay for management and administrative services, distribution (12b-1) fees and other expenses, had been increasing recently as a result of declining net assets and the natural operation of fee breakpoints. They noted that such expense ratio increases were currently being controlled by expense limitations implemented in January 2004 and which Putnam Management, in consultation with the Contract Committee, has committed to maintain at least through 2006. The Trustees expressed their intention to monitor this information closely to ensure that fees and expenses of the Putnam funds continue to meet evolving competitive standards.
* Economies of scale. The Trustees concluded that the fee schedule currently in effect for your fund represents an appropriate sharing of economies of scale at current asset levels. Your fund currently has the benefit of breakpoints in its management fee that provide shareholders with significant economies of scale, which means that the effective management fee rate of a fund (as a percentage of fund assets) declines as a fund grows in size and crosses specified asset thresholds. The Trustees examined the existing breakpoint structure of the Putnam funds’ management fees in light of competitive industry practices. The Trustees considered various possible modifications to the Putnam funds’ current breakpoint structure, but ultimately
25
concluded that the current breakpoint structure continues to serve the interests of fund shareholders. Accordingly, the Trustees continue to believe that the fee schedules currently in effect for the funds represent an appropriate sharing of economies of scale at current asset levels. The Trustees noted that significant redemptions in many Putnam funds, together with signifi-cant changes in the cost structure of Putnam Management, have altered the economics of Putnam Management’s business in significant ways. In view of these changes, the Trustees intend to consider whether a greater sharing of the economies of scale by fund shareholders would be appropriate if and when aggregate assets in the Putnam funds begin to experience meaningful growth.
In connection with their review of the management fees and total expenses of the Putnam funds, the Trustees also reviewed the costs of the services to be provided and profits to be realized by Putnam Management and its affiliates from the relationship with the funds. This information included trends in revenues, expenses and profitability of Putnam Management and its affiliates relating to the investment management and distribution services provided to the funds. In this regard, the Trustees also reviewed an analysis of Putnam Management’s revenues, expenses and profitability with respect to the funds’ management contracts, allocated on a fund-by-fund basis.
The quality of the investment process provided by Putnam Management represented a major factor in the Trustees’ evaluation of the quality of services provided by Putnam Management under your fund’s management contract. The Trustees were assisted in their review of the funds’ investment process and performance by the work of the Investment Oversight Committees of the Trustees, which meet on a regular monthly basis with the funds’ portfolio teams throughout the year. The Trustees concluded that Putnam Management generally provides a high quality investment process -- as measured by the experience and skills of the individuals assigned to the management of fund portfolios, the resources made available to such personnel, and in general the ability of Putnam Management to attract and retain high-quality personnel -- but also recognize that this does not guarantee favorable investment results for every fund in every time period. The Trustees considered the investment performance of each fund over multiple time periods and considered information comparing the fund’s performance with various benchmarks and with the performance of competitive funds. The Trustees noted the satisfactory investment performance of many Putnam funds. They also noted the disappointing investment performance of certain funds in recent years and continued to discuss with senior management of Putnam Management the factors contributing to such underperformance and actions being taken to improve performance. The Trustees recognized that, in recent years, Putnam Management has made significant changes in its investment personnel and processes and in the fund product line to address areas of underperformance. The Trustees indicated their intention to continue to monitor performance trends to assess the effectiveness of these changes and to evaluate whether additional remedial changes are warranted.
26
In the case of your fund, the Trustees considered that your fund’s class A share performance at net asset value was in the following percentiles of its Lipper Inc. peer group for the one-, three-and five-year periods ended December 31, 2004 (the first percentile being the best-performing funds and the 100th percentile being the worst-performing funds):
| One-year period | Three-year period | Five-year period |
|
| 14th | 62nd | 73rd |
(Because of the passage of time, these performance results may differ from the performance results for more recent periods shown elsewhere in this report.)
As a general matter, the Trustees believe that cooperative efforts between the Trustees and Putnam Management represent the most effective way to address investment performance problems. The Trustees believe that investors in the Putnam funds have, in effect, placed their trust in the Putnam organization, under the oversight of the funds’ Trustees, to make appropriate decisions regarding the management of the funds. Based on the responsiveness of Putnam Management in the recent past to Trustee concerns about investment performance, the Trustees believe that it is preferable to seek change within Putnam Management to address performance shortcomings. In the Trustees’ view, the alternative of terminating a management contract and engaging a new investment advisor for an underperforming fund would entail significant disruptions and would not provide any greater assurance of improved investment performance.
Brokerage and soft-dollar allocations; other benefits
The Trustees considered various potential benefits that Putnam Management may receive in connection with the services it provides under the management contract with your fund. These include principally benefits related to brokerage and soft-dollar allocations, whereby a portion of the commissions paid by a fund for brokerage is earmarked to pay for research services that may be utilized by a fund’s investment advisor, subject to the obligation to seek best execution. The Trustees believe that soft-dollar credits and other potential benefits associated with the allocation of fund brokerage, which pertains mainly to funds investing in equity securities, represent assets of the funds that should be used for the benefit of fund shareholders. This area has been marked by significant change in recent years. In July 2003, acting upon the Contract Committee’s recommendation, the Trustees directed that allocations of brokerage to reward firms that sell fund shares be discontinued no later than December 31, 2003. In addition, commencing in 2004, the allocation of brokerage commissions by Putnam Management to acquire research services from third-party service providers has been significantly reduced, and continues at a modest level only to acquire research that is customarily not available for cash. The Trustees will continue to monitor the allocation of the funds’ brokerage to ensure that the principle of “best price and execution” remains paramount in the portfolio trading process.
27
The Trustees’ annual review of your fund’s management contract also included the review of its distributor’s contract and distribution plan with Putnam Retail Management Limited Partnership and the custodian agreement and investor servicing agreement with Putnam Fiduciary Trust Company, all of which provide benefits to affiliates of Putnam Management.
Comparison of retail and institutional fee schedules
The information examined by the Trustees as part of their annual contract review has included for many years information regarding fees charged by Putnam Management and its affiliates to institutional clients such as defined benefit pension plans, college endowments, etc. This information included comparison of such fees with fees charged to the funds, as well as a detailed assessment of the differences in the services provided to these two types of clients. The Trustees observed, in this regard, that the differences in fee rates between institutional clients and the mutual funds are by no means uniform when examined by individual asset sectors, suggesting that differences in the pricing of investment management services to these types of clients reflect to a substantial degree historical competitive forces operating in separate market places. The Trustees considered the fact that fee rates across all asset sectors are higher on average for mutual funds than for institutional clients, as well as the differences between the services that Putnam Management provides to the Putnam funds and those that it provides to institutional clients of the firm, but have not relied on such comparisons to any significant extent in concluding that the management fees paid by your fund are reasonable.
28
Other information
for shareholders
|
Important notice regarding delivery of shareholder documents
In accordance with SEC regulations, Putnam sends a single copy of annual and semiannual shareholder reports, prospectuses, and proxy statements to Putnam shareholders who share the same address. If you prefer to receive your own copy of these documents, please call Putnam at 1-800-225-1581, and Putnam will begin sending individual copies within 30 days.
Proxy voting
Putnam is committed to managing our mutual funds in the best interests of our shareholders. The Putnam funds’ proxy voting guidelines and procedures, as well as information regarding how your fund voted proxies relating to portfolio securities during the 12-month period ended June 30, 2005, are available on the Putnam Individual Investor Web site, www.putnam.com/individual, and on the SEC’s Web site, www.sec.gov. If you have questions about finding forms on the SEC’s Web site, you may call the SEC at 1-800-SEC-0330. You may also obtain the Putnam funds’ proxy voting guidelines and procedures at no charge by calling Putnam’s Shareholder Services at 1-800-225-1581.
Fund portfolio holdings
The fund will file a complete schedule of its portfolio holdings with the SEC for the first and third quarters of each fiscal year on Form N-Q. Shareholders may obtain the fund’s Forms N-Q on the SEC’s Web site at www.sec.gov. In addition, the fund’s Forms N-Q may be reviewed and copied at the SEC’s public reference room in Washington, D.C. You may call the SEC at 1-800-SEC-0330 for information about the SEC’s Web site or the operation of the public reference room.
29
Financial statements
A guide to financial statements
These sections of the report, as well as the accompanying Notes, constitute the fund’s financial statements.
The fund’s portfolio lists all the fund’s investments and their values as of the last day of the reporting period. Holdings are organized by asset type and industry sector, country, or state to show areas of concentration and diversification.
Statement of assets and liabilities shows how the fund’s net assets and share price are determined. All investment and noninvestment assets are added together. Any unpaid expenses and other liabilities are subtracted from this total. The result is divided by the number of shares to determine the net asset value per share, which is calculated separately for each class of shares. (For funds with preferred shares, the amount subtracted from total assets includes the liquidation preference of preferred shares.)
Statement of operations shows the fund’s net investment gain or loss. This is done by first adding up all the fund’s earnings -- from dividends and interest income - -- and subtracting its operating expenses to determine net investment income (or loss). Then, any net gain or loss the fund realized on the sales of its holdings - -- as well as any unrealized gains or losses over the period -- is added to or subtracted from the net investment result to determine the fund’s net gain or loss for the fiscal period.
Statement of changes in net assets shows how the fund’s net assets were affected by the fund’s net investment gain or loss, by distributions to shareholders, and by changes in the number of the fund’s shares. It lists distributions and their sources (net investment income or realized capital gains) over the current reporting period and the most recent fiscal year-end. The distributions listed here may not match the sources listed in the Statement of operations because the distributions are determined on a tax basis and may be paid in a different period from the one in which they were earned.
Financial highlights provide an overview of the fund’s investment results, per-share distributions, expense ratios, net investment income ratios, and portfolio turnover in one summary table, reflecting the five most recent reporting periods. In a semiannual report, the highlight table also includes the current reporting period. For open-end funds, a separate table is provided for each share class.
30
| The fund's portfolio 11/30/05 (Unaudited) | | | |
|
| |
| |
| |
| COMMON STOCKS (97.7%)* | | | |
|
| | Shares | | Value |
| |
| Aerospace and Defense (0.1%) | | | |
| AAR Corp. † (S) | 10,512 | $ | 220,121 |
| Triumph Group, Inc. † | 3,741 | | 141,971 |
| | | | 362,092 |
|
| |
| Airlines (1.0%) | | | |
| Alaska Air Group, Inc. † (S) | 22,151 | | 780,380 |
| ExpressJet Holdings, Inc. † (S) | 106,772 | | 931,052 |
| JetBlue Airways Corp. † (S) | 302,000 | | 5,568,880 |
| World Air Holdings, Inc. † | 9,264 | | 97,457 |
| | | | 7,377,769 |
|
| |
| Automotive (0.8%) | | | |
| BorgWarner, Inc. (S) | 47,069 | | 2,824,140 |
| Tenneco Automotive, Inc. † (S) | 155,410 | | 2,699,472 |
| | | | 5,523,612 |
|
| |
| Banking (7.7%) | | | |
| Anchor BanCorp Wisconsin, Inc. | 9,612 | | 297,011 |
| Bank of America Corp. | 253,900 | | 11,651,471 |
| Center Financial Corp. | 2,518 | | 63,202 |
| City Holding Co. | 6,266 | | 228,584 |
| Commerce Bancorp, Inc. (S) | 662,400 | | 22,316,256 |
| Corus Bankshares, Inc. | 9,350 | | 549,593 |
| First Regional Bancorp † | 665 | | 47,321 |
| FirstFed Financial Corp. † (S) | 66,617 | | 3,486,734 |
| Independent Bank Corp. | 7,764 | | 226,476 |
| Lakeland Financial Corp. | 645 | | 28,025 |
| Provident Financial Holdings, Inc. | 2,192 | | 60,258 |
| R&G Financial Corp. Class B (Puerto Rico) | 79,512 | | 1,012,188 |
| Republic Bancorp, Inc. Class A | 2,044 | | 41,984 |
| Southwest Bancorp, Inc. | 4,361 | | 98,428 |
| U.S. Bancorp | 458,800 | | 13,892,464 |
| Westcorp | 13,918 | | 935,846 |
| | | | 54,935,841 |
|
| |
| Biotechnology (0.3%) | | | |
| Albany Molecular Research, Inc. † | 30,766 | | 376,576 |
| Arqule, Inc. † | 12,050 | | 83,507 |
| Connetics Corp. † | 13,300 | | 176,358 |
| Diversa Corp. † | 19,373 | | 99,190 |
| Incyte Pharmaceuticals, Inc. † | 14,587 | | 81,104 |
| Regeneron Pharmaceuticals, Inc. † | 44,996 | | 502,605 |
| Savient Pharmaceuticals, Inc. † (S) | 66,300 | | 247,962 |
| Telik, Inc. † | 22,100 | | 370,838 |
| | | | 1,938,140 |
31
| COMMON STOCKS (97.7%)* continued | | | |
|
| | Shares | | Value |
| |
| Building Materials (0.1%) | | | |
| Tyler Technologies, Inc. † | 20,640 | $ | 180,600 |
| Universal Forest Products, Inc. | 8,203 | | 471,344 |
| | | | 651,944 |
|
| |
| Chemicals (0.5%) | | | |
| Georgia Gulf Corp. | 120,054 | | 3,344,704 |
| NewMarket Corp. † | 3,200 | | 70,144 |
| | | | 3,414,848 |
|
| |
| Commercial and Consumer Services (5.2%) | | | |
| Administaff, Inc. | 50,823 | | 2,289,576 |
| Arbitron, Inc. (S) | 18,993 | | 733,130 |
| Catalina Marketing Corp. (S) | 89,299 | | 2,363,745 |
| CCC Information Services Group † | 4,285 | | 111,881 |
| Consolidated Graphics, Inc. † | 12,953 | | 663,064 |
| eBay, Inc. † | 267,700 | | 11,995,637 |
| Escala Group, Inc. † (S) | 6,377 | | 105,539 |
| Google, Inc. Class A † | 16,100 | | 6,520,339 |
| HUB Group, Inc. Class A † | 10,836 | | 439,400 |
| John H. Harland Co. | 36,805 | | 1,391,229 |
| NCO Group, Inc. † | 5,419 | | 93,424 |
| Sabre Holdings Corp. (S) | 38,989 | | 891,678 |
| Spherion Corp. † (S) | 12,983 | | 127,233 |
| Startek, Inc. | 10,892 | | 180,916 |
| TeleTech Holdings, Inc. † | 40,838 | | 507,616 |
| Unifirst Corp. | 3,536 | | 109,262 |
| Yahoo!, Inc. † | 208,700 | | 8,396,001 |
| | | | 36,919,670 |
|
| |
| Communications Equipment (1.9%) | | | |
| Cisco Systems, Inc. † | 770,400 | | 13,512,816 |
| Tekelec † | 21,119 | | 274,547 |
| | | | 13,787,363 |
|
| |
| Computers (6.7%) | | | |
| Apple Computer, Inc. † | 174,200 | | 11,814,244 |
| Brocade Communications Systems, Inc. † | 785,002 | | 3,430,459 |
| Catapult Communications Corp. † | 12,239 | | 206,961 |
| Checkpoint Systems, Inc. † (S) | 20,179 | | 483,287 |
| Dell, Inc. † | 632,400 | | 19,073,184 |
| EMC Corp. † | 577,200 | | 8,040,396 |
| Emulex Corp. † (S) | 221,523 | | 4,414,953 |
| Magma Design Automation, Inc. † (S) | 14,771 | | 124,815 |
| Netgear, Inc. † | 3,034 | | 58,556 |
| | | | 47,646,855 |
|
| |
| Conglomerates (1.4%) | | | |
| Tyco International, Ltd. | 337,400 | | 9,622,648 |
32
| COMMON STOCKS (97.7%)* continued | | | |
|
| | Shares | | Value |
| |
| Construction (--%) | | | |
| Huttig Building Products, Inc. † | 9,865 | $ | 85,530 |
|
| |
| Consumer Cyclicals (--%) | | | |
| Hooker Furniture Corp. | 1,223 | | 18,981 |
|
| |
| Consumer Finance (7.8%) | | | |
| Accredited Home Lenders Holding Co. † (S) | 41,699 | | 1,806,401 |
| Asta Funding, Inc. (S) | 6,168 | | 152,843 |
| Capital One Financial Corp. | 285,533 | | 23,716,371 |
| CompuCredit Corp. † (S) | 47,900 | | 1,871,453 |
| Countrywide Financial Corp. | 787,500 | | 27,412,875 |
| World Acceptance Corp. † (S) | 12,335 | | 339,706 |
| | | | 55,299,649 |
|
| |
| Consumer Goods (0.7%) | | | |
| Blyth Industries, Inc. | 23,897 | | 473,161 |
| Chattem, Inc. † (S) | 24,734 | | 785,799 |
| Darling International, Inc. † | 22,181 | | 75,194 |
| Yankee Candle Co., Inc. (The) | 134,475 | | 3,408,941 |
| | | | 4,743,095 |
|
| |
| Consumer Services (0.3%) | | | |
| Alderwoods Group, Inc. (Canada) † | 32,379 | | 486,333 |
| Geo Group, Inc. (The) † | 10,199 | | 249,366 |
| Labor Ready, Inc. † | 55,902 | | 1,234,316 |
| | | | 1,970,015 |
|
| |
| Electric Utilities (0.6%) | | | |
| Alliant Energy Corp. | 3,135 | | 88,877 |
| Black Hills Corp. | 22,997 | | 840,540 |
| CMS Energy Corp. † (S) | 237,129 | | 3,315,063 |
| Puget Energy, Inc. | 2,312 | | 48,043 |
| | | | 4,292,523 |
|
| |
| Electronics (1.2%) | | | |
| Agilysys, Inc. | 8,561 | | 163,087 |
| FEI Co. † (S) | 3,102 | | 61,916 |
| IXYS Corp. † | 25,681 | | 308,686 |
| Methode Electronics, Inc. Class A | 20,432 | | 213,514 |
| Omnivision Technologies, Inc. † (S) | 100,787 | | 1,783,930 |
| Stoneridge, Inc. † | 12,387 | | 74,941 |
| Texas Instruments, Inc. | 147,900 | | 4,803,792 |
| TriQuint Semiconductor, Inc. † | 126,000 | | 567,000 |
| TTM Technologies, Inc. † (S) | 38,858 | | 355,162 |
| | | | 8,332,028 |
|
| |
| Energy (0.4%) | | | |
| Atwood Oceanics, Inc. † | 2,925 | | 207,646 |
| Parker Drilling Co. † | 254,263 | | 2,410,413 |
| | | | 2,618,059 |
33
| COMMON STOCKS (97.7%)* continued | | | |
|
| | Shares | | Value |
| |
| Engineering & Construction (--%) | | | |
| Noble International, Ltd. (S) | 6,618 | $ | 149,037 |
|
| |
| Financial (3.4%) | | | |
| Asset Acceptance Capital Corp. † | 8,907 | | 181,792 |
| Freddie Mac | 228,400 | | 14,263,580 |
| PMI Group, Inc. (The) (S) | 157,500 | | 6,394,500 |
| Radian Group, Inc. (S) | 61,562 | | 3,481,947 |
| Student Loan Corp. | 72 | | 15,200 |
| | | | 24,337,019 |
|
| |
| Food (--%) | | | |
| American Italian Pasta Co. Class A (S) | 12,500 | | 77,375 |
|
| |
| Forest Products and Packaging (0.7%) | | | |
| Albany International Corp. | 61,073 | | 2,328,713 |
| CSS Industries, Inc. | 4,077 | | 136,009 |
| Graphic Packaging Corp. † | 14,350 | | 39,032 |
| Grief, Inc. Class A (S) | 15,589 | | 936,119 |
| Louisiana-Pacific Corp. | 54,172 | | 1,461,019 |
| | | | 4,900,892 |
|
| |
| Gaming & Lottery (--%) | | | |
| Dover Downs Gaming & Entertainment, Inc. | 5,564 | | 69,884 |
|
| |
| Health Care Services (4.8%) | | | |
| American Dental Partners, Inc. † | 3,807 | | 71,077 |
| AMICAS, Inc. † | 33,482 | | 159,040 |
| AMN Healthcare Services, Inc. † | 25,541 | | 486,556 |
| Cerner Corp. † (S) | 10,461 | | 1,008,440 |
| Genesis HealthCare Corp. † | 27,305 | | 1,148,175 |
| HCA, Inc. | 197,000 | | 10,045,030 |
| Manor Care, Inc. | 133,535 | | 5,265,285 |
| OCA, Inc. † (S) | 5,529 | | 2,101 |
| Odyssey Healthcare, Inc. † | 15,422 | | 285,615 |
| UnitedHealth Group, Inc. (S) | 261,400 | | 15,647,404 |
| | | | 34,118,723 |
|
| |
| Homebuilding (2.1%) | | | |
| NVR, Inc. † (S) | 21,300 | | 14,638,425 |
|
| |
| Household Furniture and Appliances (--%) | | | |
| Select Comfort Corp. † | 6,201 | | 148,638 |
|
| |
| Insurance (7.8%) | | | |
| Affirmative Insurance Holdings, Inc. | 6,118 | | 82,593 |
| American Equity Investment Life Holding Co. (S) | 77,627 | | 912,894 |
| American International Group, Inc. | 355,800 | | 23,888,412 |
| American Physicians Capital, Inc. † | 3,631 | | 165,029 |
| AmerUs Group Co. (S) | 88,294 | | 5,185,507 |
| CNA Surety Corp. † | 3,617 | | 53,423 |
34
| COMMON STOCKS (97.7%)* continued | | | |
|
| | Shares | | Value |
| |
| Insurance continued | | | |
| Commerce Group, Inc. | 17,175 | $ | 997,181 |
| Delphi Financial Group Class A | 18,024 | | 853,977 |
| Direct General Corp. | 9,042 | | 154,528 |
| Everest Re Group, Ltd. (Barbados) | 103,000 | | 10,827,360 |
| FPIC Insurance Group, Inc. † | 2,238 | | 84,775 |
| HCC Insurance Holdings, Inc. | 134,161 | | 4,098,619 |
| Infinity Property & Casualty Corp. | 12,781 | | 472,258 |
| IPC Holdings, Ltd. (Bermuda) | 537 | | 15,680 |
| Midland Co. (The) | 3,818 | | 144,320 |
| National Interstate Corp. | 3,312 | | 60,411 |
| Presidential Life Corp. | 1,264 | | 24,383 |
| Stancorp Financial Group | 11,570 | | 1,192,173 |
| Triad Guaranty, Inc. † | 4,302 | | 186,535 |
| United Fire & Casualty Co. (S) | 8,186 | | 374,100 |
| W.R. Berkley Corp. | 89,851 | | 4,188,854 |
| Zenith National Insurance Corp. | 26,167 | | 1,240,316 |
| | | | 55,203,328 |
|
| |
| Investment Banking/Brokerage (1.0%) | | | |
| Affiliated Managers Group † (S) | 61,720 | | 4,866,005 |
| Calamos Asset Management, Inc. Class A | 8,754 | | 237,233 |
| Eaton Vance Corp. | 46,002 | | 1,264,135 |
| IndyMac Bancorp, Inc. (S) | 22,595 | | 864,937 |
| | | | 7,232,310 |
|
| |
| Leisure (1.7%) | | | |
| Artic Cat, Inc. (S) | 16,652 | | 349,359 |
| Harley-Davidson, Inc. (S) | 221,100 | | 11,908,446 |
| Marine Products Corp. | 4,752 | | 47,805 |
| | | | 12,305,610 |
|
| |
| Lodging/Tourism (2.8%) | | | |
| Las Vegas Sands Corp. † (S) | 122,600 | | 5,113,646 |
| MeriStar Hospitality Corp. † (R) (S) | 76,758 | | 751,461 |
| MTR Gaming Group, Inc. † | 18,532 | | 138,249 |
| Royal Caribbean Cruises, Ltd. | 305,900 | | 14,028,574 |
| | | | 20,031,930 |
|
| |
| Machinery (2.4%) | | | |
| Applied Industrial Technologies, Inc. | 12,377 | | 395,445 |
| Cascade Corp. | 10,594 | | 536,586 |
| Caterpillar, Inc. | 167,000 | | 9,649,260 |
| Terex Corp. † (S) | 105,547 | | 6,503,806 |
| | | | 17,085,097 |
|
| |
| Manufacturing (0.1%) | | | |
| Blount International, Inc. † | 9,954 | | 154,785 |
| Titan International, Inc. | 12,874 | | 221,948 |
| | | | 376,733 |
35
| COMMON STOCKS (97.7%)* continued | | | |
|
| | Shares | | Value |
| |
| Medical Technology (0.8%) | | | |
| Alliance Imaging, Inc. † | 11,804 | $ | 65,630 |
| American Medical Systems Holdings, Inc. † | 85,819 | | 1,579,070 |
| Analogic Corp. | 11,230 | | 538,591 |
| Candela Corp. † | 5,260 | | 75,744 |
| Cantel Medical Corp. † | 3,979 | | 72,855 |
| Charles River Laboratories International, Inc. † | 860 | | 39,182 |
| Epix Pharmaceuticals, Inc. † | 28,478 | | 140,397 |
| Medical Action Industries, Inc. † | 3,035 | | 57,270 |
| Mentor Corp. (S) | 14,352 | | 699,516 |
| Respironics, Inc. † | 74,312 | | 2,874,388 |
| | | | 6,142,643 |
|
| |
| Metal Fabricators (0.1%) | | | |
| Brush Engineered Materials, Inc. † | 23,276 | | 369,856 |
| Mueller Industries, Inc. | 6,900 | | 186,783 |
| | | | 556,639 |
|
| |
| Metals (2.5%) | | | |
| A.M. Castle & Co. † | 15,130 | | 312,435 |
| AK Steel Holding Corp. † | 382,009 | | 3,166,855 |
| NS Group, Inc. † | 1,602 | | 65,778 |
| Reliance Steel & Aluminum Co. (S) | 29,510 | | 1,903,690 |
| Shiloh Industries, Inc. † | 2,136 | | 28,238 |
| Steel Dynamics, Inc. (S) | 170,536 | | 5,903,956 |
| United States Steel Corp. | 142,600 | | 6,787,760 |
| | | | 18,168,712 |
|
| |
| Natural Gas Utilities (0.2%) | | | |
| Energen Corp. | 1,079 | | 39,599 |
| Transmontaigne, Inc. † | 36,396 | | 227,111 |
| WGL Holdings, Inc. | 38,100 | | 1,159,002 |
| | | | 1,425,712 |
|
| |
| Office Equipment & Supplies (0.1%) | | | |
| Kimball International, Inc. Class B | 8,750 | | 93,188 |
| Steelcase, Inc. | 37,822 | | 559,387 |
| Systemax, Inc. † | 13,517 | | 80,021 |
| | | | 732,596 |
|
| |
| Oil & Gas (6.9%) | | | |
| Amerada Hess Corp. | 134,600 | | 16,491,192 |
| Cabot Oil & Gas Corp. Class A (S) | 2,854 | | 120,467 |
| Callon Petroleum Co. † | 15,973 | | 282,722 |
| Giant Industries, Inc. † | 67,593 | | 3,626,364 |
| Harvest Natural Resources, Inc. † (S) | 9,598 | | 88,110 |
| Occidental Petroleum Corp. | 294,300 | | 23,337,990 |
| Petroleum Development Corp. † | 12,631 | | 426,296 |
| Vintage Petroleum, Inc. | 97,036 | | 5,082,746 |
| | | | 49,455,887 |
36
| COMMON STOCKS (97.7%)* continued | | | |
|
| | Shares | | Value |
| |
| Pharmaceuticals (0.7%) | | | |
| Endo Pharmaceuticals Holdings, Inc. † | 22,767 | $ | 681,189 |
| Enzon, Inc. † | 21,277 | | 144,471 |
| King Pharmaceuticals, Inc. † | 64,091 | | 1,008,151 |
| Medicis Pharmaceutical Corp. Class A (S) | 7,400 | | 236,134 |
| Watson Pharmaceuticals, Inc. † | 78,699 | | 2,625,399 |
| | | | 4,695,344 |
|
| |
| Power Producers (1.0%) | | | |
| AES Corp. (The) † | 470,400 | | 7,418,208 |
|
| |
| Publishing (--%) | | | |
| Hollinger International, Inc. | 36,205 | | 326,207 |
|
| |
| Railroads (--%) | | | |
| Rail America, Inc. † | 10,452 | | 113,822 |
|
| |
| Real Estate (2.9%) | | | |
| Boykin Lodging Co. † (R) | 16,471 | | 197,652 |
| Capital Automotive (R) | 80,922 | | 3,126,017 |
| CBL & Associates Properties (R) (S) | 117,698 | | 4,737,345 |
| Cedar Shopping Centers, Inc. (R) | 18,428 | | 253,385 |
| Commercial Net Lease Realty (R) (S) | 33,195 | | 672,531 |
| Correctional Properties Trust | 7,800 | | 224,328 |
| Equity Inns, Inc. (R) | 159,315 | | 2,185,802 |
| Hospitality Properties Trust (R) (S) | 17,603 | | 725,068 |
| Innkeepers USA Trust (R) (S) | 13,659 | | 238,213 |
| LTC Properties, Inc. (R) | 21,359 | | 437,432 |
| Mills Corp. (R) (S) | 33,800 | | 1,450,020 |
| National Health Investors, Inc. (R) | 52,309 | | 1,446,344 |
| Nationwide Health Properties, Inc. (R) (S) | 48,966 | | 1,113,977 |
| Newcastle Investment Corp. (R) | 21,031 | | 570,571 |
| Novastar Financial, Inc. (R) (S) | 10,904 | | 305,203 |
| Omega Healthcare Investors, Inc. (R) | 44,343 | | 533,003 |
| RAIT Investment Trust (R) (S) | 55,848 | | 1,467,685 |
| Redwood Trust, Inc. (R) (S) | 19,803 | | 854,301 |
| | | | 20,538,877 |
|
| |
| Restaurants (0.3%) | | | |
| Denny's Corp. † | 56,931 | | 277,823 |
| Domino's Pizza, Inc. (S) | 78,114 | | 1,952,850 |
| Luby's, Inc. † | 16,556 | | 211,586 |
| | | | 2,442,259 |
|
| |
| Retail (8.6%) | | | |
| Best Buy Co., Inc. (S) | 248,900 | | 12,006,936 |
| Blair Corp. | 1,194 | | 44,536 |
| Borders Group, Inc. | 54,705 | | 1,115,435 |
| Buckle, Inc. (The) (S) | 11,788 | | 386,646 |
| Cato Corp. (The) Class A | 34,685 | | 749,196 |
| CSK Auto Corp. † | 15,257 | | 236,484 |
37
| COMMON STOCKS (97.7%)* continued | | | |
|
| | Shares | | Value |
| |
| Retail continued | | | |
| Genesco, Inc. † | 4,997 | $ | 198,131 |
| Home Depot, Inc. (The) | 365,900 | | 15,287,302 |
| Ingles Markets, Inc. Class A | 4,825 | | 81,253 |
| Nash Finch Co. (S) | 48,141 | | 1,293,549 |
| Nu Skin Enterprises, Inc. Class A | 60,535 | | 1,052,098 |
| Payless ShoeSource, Inc. † | 79,706 | | 1,821,282 |
| Rent-A-Center, Inc. † | 155,551 | | 3,041,022 |
| ShopKo Stores, Inc. | 27,100 | | 777,228 |
| Staples, Inc. | 462,200 | | 10,676,820 |
| Stride Rite Corp. | 11,466 | | 157,543 |
| Supervalu, Inc. (S) | 159,304 | | 5,212,427 |
| Timberland Co. (The) Class A † | 142,992 | | 4,731,605 |
| Too, Inc. † | 54,565 | | 1,725,891 |
| Trans World Entertainment Corp. † | 19,870 | | 129,751 |
| Wilsons The Leather Experts, Inc. † | 8,091 | | 36,005 |
| | | | 60,761,140 |
|
| |
| Schools (1.8%) | | | |
| Apollo Group, Inc. Class A † (S) | 140,000 | | 9,968,000 |
| Career Education Corp. † | 37,399 | | 1,394,983 |
| Education Management Corp. † | 34,508 | | 1,164,645 |
| | | | 12,527,628 |
|
| |
| Semiconductor (0.3%) | | | |
| Advanced Energy Industries, Inc. † | 9,777 | | 130,621 |
| Lam Research Corp. † (S) | 29,364 | | 1,102,325 |
| Sigmatel, Inc. † | 56,066 | | 816,321 |
| | | | 2,049,267 |
|
| |
| Shipping (0.2%) | | | |
| ABX Air, Inc. † | 24,331 | | 182,483 |
| Arkansas Best Corp. (S) | 16,001 | | 659,881 |
| Maritrans, Inc. | 8,860 | | 255,965 |
| | | | 1,098,329 |
|
| |
| Software (3.7%) | | | |
| Ansoft Corp. † | 5,470 | | 189,754 |
| Atari, Inc. † (S) | 49,978 | | 62,972 |
| Blackboard, Inc. † | 8,941 | | 276,635 |
| BMC Software, Inc. † (S) # | 300,453 | | 6,156,282 |
| Citrix Systems, Inc. † (S) | 209,104 | | 5,675,083 |
| EPIQ Systems, Inc. † (S) | 15,798 | | 300,320 |
| Hyperion Solutions Corp. † | 53,496 | | 2,832,613 |
| Mantech International Corp. Class A † | 5,869 | | 146,960 |
| MicroStrategy, Inc. † (S) | 9,666 | | 714,027 |
| Oracle Corp. † | 737,500 | | 9,270,375 |
| SonicWall, Inc. † | 38,895 | | 288,990 |
| SPSS, Inc. † | 11,288 | | 325,997 |
| | | | 26,240,008 |
38
| COMMON STOCKS (97.7%)* continued | | | |
|
| | Shares | | Value |
| |
| Technology Services (0.7%) | | | |
| Acxiom Corp. | 106,792 | $ | 2,368,647 |
| MTS Systems Corp.�� | 2,600 | | 91,702 |
| Transaction Systems Architects, Inc. † | 30,050 | | 874,455 |
| United Online, Inc. | 104,600 | | 1,475,906 |
| | | | 4,810,710 |
|
| |
| Telecommunications (1.7%) | | | |
| CenturyTel, Inc. (S) | 85,653 | | 2,835,113 |
| Commonwealth Telephone Enterprises, Inc. (S) | 11,032 | | 382,368 |
| Earthlink, Inc. † (S) | 535,883 | | 6,130,502 |
| Intrado, Inc. † (S) | 15,757 | | 355,793 |
| Premiere Global Services, Inc. † | 249,066 | | 1,882,938 |
| Talk America Holdings, Inc. † | 30,266 | | 290,554 |
| | | | 11,877,268 |
|
| |
| Textiles (0.7%) | | | |
| Columbia Sportswear Co. † (S) | 4,519 | | 210,043 |
| Tommy Hilfiger Corp. (Hong Kong) † | 77,598 | | 1,401,420 |
| Wolverine World Wide, Inc. | 148,424 | | 3,223,769 |
| | | | 4,835,232 |
|
| |
| Toys (0.3%) | | | |
| Hasbro, Inc. (S) | 102,084 | | 2,084,555 |
| Jakks Pacific, Inc. † (S) | 20,930 | | 426,553 |
| | | | 2,511,108 |
|
| |
| Trucks & Parts (0.7%) | | | |
| Autoliv, Inc. (Sweden) | 109,040 | | 4,771,590 |
|
| |
| Total common stocks (cost $645,184,874) | | $ | 693,714,849 |
|
| |
| |
| SHORT-TERM INVESTMENTS (17.0%) * | | | |
|
| | Principal amount/shares | | Value |
| |
| Short-term investments held as collateral for loaned | | | |
| securities with yields ranging from 4.00% to 4.29% | | | |
| and due dates ranging from December 9, 2005 | | | |
| to January 27, 2006 (d) | $104,270,690 | $ | 104,124,446 |
| Putnam Prime Money Market Fund (e) | 16,455,884 | | 16,455,884 |
|
| |
| Total short-term investments (cost $120,580,330) | | $ | 120,580,330 |
|
| |
| |
| TOTAL INVESTMENTS | | | |
| Total investments (cost $765,765,204) | | $ | 814,295,179 |
39
* Percentages indicated are based on net assets of $709,734,043.
† Non-income-producing security.
(S) Securities on loan, in part or in entirety, at November 30, 2005.
# A portion of this security was pledged and segregated with the custodian to cover margin requirements for futures contracts at November 30, 2005.
(R) Real Estate Investment Trust. (d) See Note 1 to the financial statements.
(e) See Note 5 to the financial statements regarding investments in Putnam Prime Money Market Fund.
At November 30, 2005, liquid assets totaling $6,670,741 have been designated as collateral for open swap contracts and future contracts.
| FUTURES CONTRACTS OUTSTANDING at 11/30/05 (Unaudited) | | |
|
| | Number of | | Expiration | Unrealized |
| | contracts | Value | date | depreciation |
| |
| Russell 2000 Index Mini (Long) | 30 | $2,305,540 | Dec 05 | $(17,047) |
| S&P 500 Index (Long) | 14 | 1,563,875 | Dec 05 | (13,975) |
| S&P Mid 400 Index Mini (Long) | 18 | 1,469,200 | Dec 05 | (9,536) |
|
| Total | | | | $(40,558) |
|
| TOTAL RETURN SWAP CONTRACTS OUTSTANDING at 11/30/05 (Unaudited) | | |
|
| | Notional | Termination | Unrealized |
| | amount | date | appreciation |
| | | |
| Agreement with Citigroup Global Markets Limited dated | | | |
| October 12, 2005 to receive/(pay) monthly the notional | | | |
| amount multiplied by the total rate of return of the | | | |
| Commerce Bancorp Inc. NJ and pay semi-annually | | | |
| the notional amount multiplied by the six month | | | |
| USD-LIBOR-BBA plus 25 basis points. | $1,330,372 | 10/12/06 | $170,216 |
The accompanying notes are an integral part of these financial statements.
40
| Statement of assets and liabilities 11/30/05 (Unaudited) | |
|
| |
| ASSETS | |
| Investments in securities, at value, including $101,119,160 of securities on loan (Note 1) | |
| Unaffiliated issuers (identified cost $749,309,320) | $797,839,295 |
| Affiliated issuers (identified cost $16,455,884) (Note 5) | 16,455,884 |
|
| Cash | 974 |
|
| Dividends, interest and other receivables | 786,850 |
|
| Receivable for shares of the fund sold | 185,444 |
|
| Receivable for securities sold | 3,838,149 |
|
| Unrealized appreciation on swap contracts (Note 1) | 170,216 |
|
| Total assets | 819,276,812 |
|
| |
| LIABILITIES | |
| Payable for variation margin (Note 1) | 23,540 |
|
| Payable for securities purchased | 1,239,155 |
|
| Payable for shares of the fund repurchased | 1,941,397 |
|
| Payable for compensation of Manager (Notes 2 and 5) | 1,085,346 |
|
| Payable for investor servicing and custodian fees (Note 2) | 413,822 |
|
| Payable for Trustee compensation and expenses (Note 2) | 181,358 |
|
| Payable for administrative services (Note 2) | 1,577 |
|
| Payable for distribution fees (Note 2) | 379,365 |
|
| Collateral on securities loaned, at value (Note 1) | 104,124,446 |
|
| Other accrued expenses | 152,763 |
|
| Total liabilities | 109,542,769 |
|
| Net assets | $709,734,043 |
|
| |
| REPRESENTED BY | |
| Paid-in capital (Unlimited shares authorized) (Notes 1 and 4) | $734,149,994 |
|
| Undistributed net investment income (Note 1) | 759,263 |
|
| Accumulated net realized loss on investments (Note 1) | (73,834,847) |
|
| Net unrealized appreciation of investments | 48,659,633 |
|
| Total -- Representing net assets applicable to capital shares outstanding | $709,734,043 |
| |
| (Continued on next page) | |
41
Statement of assets and liabilities (Continued)
| COMPUTATION OF NET ASSET VALUE AND OFFERING PRICE | |
| Net asset value and redemption price per class A share | |
| ($467,689,036 divided by 23,187,749 shares) | $20.17 |
|
| Offering price per class A share | |
| (100/94.75 of $20.17)* | $21.29 |
|
| Net asset value and offering price per class B share | |
| ($216,240,958 divided by 11,380,587 shares)** | $19.00 |
|
| Net asset value and offering price per class C share | |
| ($3,571,583 divided by 184,109 shares)** | $19.40 |
|
| Net asset value and redemption price per class M share | |
| ($15,465,755 divided by 799,391 shares) | $19.35 |
|
| Offering price per class M share | |
| (100/96.75 of $19.35)* | $20.00 |
|
| Net asset value, offering price and redemption price per class R share | |
| ($27,107 divided by 1,351 shares) | $20.07 |
|
| Net asset value, offering price and redemption price per class Y share | |
| ($6,739,604 divided by 333,993 shares) | $20.18 |
* On single retail sales of less than $50,000. On sales of $50,000 or more and on group sales, the offering price is reduced.
** Redemption price per share is equal to net asset value less any applicable contingent deferred sales charge.
The accompanying notes are an integral part of these financial statements.
42
| Statement of operations Six months ended 11/30/05 (Unaudited) | |
|
| INVESTMENT INCOME | |
| Dividends | $4,290,093 |
|
| Interest (including interest income of $137,798 | |
| from investments in affiliated issuers) (Note 5) | 137,798 |
|
| Securities lending | 238,092 |
|
| Total investment income | 4,665,983 |
|
| |
| EXPENSES | |
| Compensation of Manager (Note 2) | 2,235,155 |
|
| Investor servicing fees (Note 2) | 1,263,620 |
|
| Custodian fees (Note 2) | 119,948 |
|
| Trustee compensation and expenses (Note 2) | 18,978 |
|
| Administrative services (Note 2) | 8,644 |
|
| Distribution fees -- Class A (Note 2) | 565,756 |
|
| Distribution fees -- Class B (Note 2) | 1,235,310 |
|
| Distribution fees -- Class C (Note 2) | 17,551 |
|
| Distribution fees -- Class M (Note 2) | 62,114 |
|
| Distribution fees -- Class R (Note 2) | 50 |
|
| Other | 75,498 |
|
| Non-recurring costs (Note 2 and 6) | 3,570 |
|
| Costs assumed by Manager (Notes 2 and 6) | (3,570) |
|
| Fees waived and reimbursed by Manager (Note 5) | (6,092) |
|
| Total expenses | 5,596,532 |
|
| Expense reduction (Note 2) | (181,745) |
|
| Net expenses | 5,414,787 |
|
| Net investment income | (748,804) |
|
| Net realized gain on investments (Notes 1 and 3) | 42,404,621 |
|
| Net realized gain on futures contracts (Note 1) | 658,288 |
|
| Net unrealized appreciation of investments, futures contracts | |
| and swap contracts during the period | 20,643,048 |
|
| Net gain on investments | 63,705,957 |
|
| Net increase in net assets resulting from operations | $62,957,153 |
The accompanying notes are an integral part of these financial statements.
43
Statement of changes in net assets
| DECREASE IN NET ASSETS | | |
|
| | Six months ended | Year ended |
| | 11/30/05* | 5/31/05 |
|
| Operations: | | |
| Net investment income (loss) | $ (748,804) | $ 2,021,903 |
|
| Net realized gain on investments | 43,062,909 | 105,223,829 |
|
| Net unrealized appreciation (depreciation) of investments | 20,643,048 | (28,617,402) |
|
| Net increase in net assets resulting from operations | 62,957,153 | 78,628,330 |
|
| Distributions to shareholders: (Note 1) | | |
|
| From net investment income | | |
|
| Class A | -- | (415,329) |
|
| Class R | -- | (17) |
|
| Redemption fees (Note 1) | 962 | 3,247 |
|
| Decrease from capital share transactions (Note 4) | (70,953,507) | (147,783,445) |
|
| Total decrease in net assets | (7,995,392) | (69,567,214) |
|
| |
| NET ASSETS | | |
| Beginning of period | 717,729,435 | 787,296,649 |
|
| End of period (including undistributed net investment | | |
| income of $759,263 and $1,508,067, respectively) | $709,734,043 | $717,729,435 |
* Unaudited
The accompanying notes are an integral part of these financial statements.
44
Financial highlights (For a common share outstanding throughout the period)
| CLASS A | | | | | | |
|
| PER-SHARE OPERATING PERFORMANCE | | | | |
|
| | Six months ended** | | | Year ended | | |
| | 11/30/05 | 5/31/05 | 5/31/04 | 5/31/03 | 5/31/02 | 5/31/01 |
|
| Net asset value, | | | | | | |
| beginning of period | $18.45 | $16.55 | $14.24 | $15.89 | $18.32 | $23.75 |
|
| Investment operations: | | | | | | |
| Net investment income (loss)(a) .01(d) | .10(d,e) | (.01)(d) | --(f ) | --(f ) | --(f ) |
|
| Net realized and unrealized | | | | | | |
| gain (loss) on investments | 1.71 | 1.82 | 2.32 | (1.65) | (2.43) | (.75) |
|
| Total from | | | | | | |
| investment operations | 1.72 | 1.92 | 2.31 | (1.65) | (2.43) | (.75) |
|
| Less distributions: | | | | | | |
| From net investment income | -- | (.02) | -- | -- | -- | -- |
|
| From net realized gain | | | | | | |
| on investments | -- | -- | -- | -- | -- | (4.61) |
|
| Return of capital | -- | -- | -- | -- | -- | (.07) |
|
| Total distributions | -- | (.02) | -- | -- | -- | (4.68) |
|
| Redemption fees | --(f ) | --(f ) | -- | -- | -- | -- |
|
| Net asset value, | | | | | | |
| end of period | $20.17 | $18.45 | $16.55 | $14.24 | $15.89 | $18.32 |
|
| Total return at | | | | | | |
| net asset value (%)(b) | 9.32* | 11.59 | 16.22 | (10.38) | (13.26) | (5.06) |
|
| |
| RATIOS AND SUPPLEMENTAL DATA | | | | | |
| Net assets, end of period | | | | | | |
| (in thousands) | $467,689 | $429,902 | $416,249 | $495,165 | $697,394 | $911,299 |
|
| Ratio of expenses to | | | | | | |
| average net assets (%)(c) | .64*(d) | 1.28(d) | 1.23(d) | 1.22 | 1.08 | 1.00 |
|
| Ratio of net investment income | | | | | |
| (loss) to average net assets (%) .05*(d) | .60(d,e) | (.07)(d) | .01 | .02 | --(g) |
|
| Portfolio turnover (%) | 58.67* | 121.26 | 111.20 | 107.08 | 133.78 | 263.98 |
* Not annualized.
** Unaudited.
(a) Per share net investment income has been determined on the basis of the weighted average number of shares outstanding during the period.
(b) Total return assumes dividend reinvestment and does not reflect the effect of sales charges.
(c) Includes amounts paid through expense offset and brokerage service arrangements (Note 2).
(d) Reflects waivers of certain fund expenses in connection with investments in Putnam Prime Money Market Fund during the period. As a result of such waivers, the expenses of the fund for the periods ended November 30, 2005, May 31, 2005 and May 31, 2004 reflect a reduction of less than 0.01% of average net assets for class A shares (Note 5).
(e) Reflects a non-recurring accrual related to Putnam Management’s settlement with the SEC regarding brokerage allocation practices, which amounted to $0.03 per share and 0.14% of average net assets for class A shares (Note 6).
(f) Amount represents less than $0.01 per share.
(g) Ratio of net investment income to average net assets is less than 0.01% .
The accompanying notes are an integral part of these financial statements.
45
Financial highlights (For a common share outstanding throughout the period)
| CLASS B | | | | | | |
|
| PER-SHARE OPERATING PERFORMANCE | | | | |
|
| Six months ended** | | | Year ended | | |
| | 11/30/05 | 5/31/05 | 5/31/04 | 5/31/03 | 5/31/02 | 5/31/01 |
|
| Net asset value, | | | | | | |
| beginning of period | $17.45 | $15.76 | $13.66 | $15.35 | $17.84 | $23.39 |
|
| Investment operations: | | | | | | |
| Net investment loss (a) | (.06)(d) | (.02)(d,e) | (.12)(d) | (.09) | (.12) | (.15) |
|
| Net realized and unrealized | | | | | | |
| gain (loss) on investments | 1.61 | 1.71 | 2.22 | (1.60) | (2.37) | (.72) |
|
| Total from | | | | | | |
| investment operations | 1.55 | 1.69 | 2.10 | (1.69) | (2.49) | (.87) |
|
| Less distributions: | | | | | | |
| From net realized gain | | | | | | |
| on investments | -- | -- | -- | -- | -- | (4.61) |
|
| Return of capital | | -- | -- | -- | -- | (.07) |
|
| Total distributions | -- | -- | -- | -- | -- | (4.68) |
|
| Redemption fees | --(f ) | --(f ) | -- | -- | -- | -- |
|
| Net asset value, | | | | | | |
| end of period | $19.00 | $17.45 | $15.76 | $13.66 | $15.35 | $17.84 |
|
| Total return at | | | | | | |
| net asset value (%)(b) | 8.88* | 10.72 | 15.37 | (11.01) | (13.96) | (5.70) |
|
| |
| RATIOS AND SUPPLEMENTAL DATA | | | | | |
| Net assets, end of period | | | | | | |
| (in thousands) | $216,241 | $267,369 | $348,212 | $391,161 | $554,719 | $796,227 |
|
| Ratio of expenses to | | | | | | |
| average net assets (%)(c) | 1.02*(d) | 2.03(d) | 1.98(d) | 1.97 | 1.83 | 1.70 |
|
| Ratio of net investment loss | | | | | | |
| to average net assets (%) | (.33)*(d) | (.14)(d,e) | (.82)(d) | (.74) | (.73) | (.70) |
|
| Portfolio turnover (%) | 58.67* | 121.26 | 111.20 | 107.08 | 133.78 | 263.98 |
* Not annualized.
** Unaudited.
(a) Per share net investment income has been determined on the basis of the weighted average number of shares outstanding during the period.
(b) Total return assumes dividend reinvestment and does not reflect the effect of sales charges.
(c) Includes amounts paid through expense offset and brokerage service arrangements (Note 2).
(d) Reflects waivers of certain fund expenses in connection with investments in Putnam Prime Money Market Fund during the period. As a result of such waivers, the expenses of the fund for the periods ended November 30, 2005, May 31, 2005 and May 31, 2004 reflect a reduction of less than 0.01% of average net assets for class B shares (Note 5).
(e) Reflects a non-recurring accrual related to Putnam Management’s settlement with the SEC regarding brokerage allocation practices, which amounted to $0.02 per share and 0.12% of average net assets for class B shares (Note 6).
(f) Amount represents less than $0.01 per share.
The accompanying notes are an integral part of these financial statements.
46
Financial highlights (For a common share outstanding throughout the period)
| CLASS C | | | | | | |
|
| PER-SHARE OPERATING PERFORMANCE | | | | | |
|
| | | | | | | Period |
| Six months ended** | | Year ended | | 7/14/00†- |
| | 11/30/05 | 5/31/05 | 5/31/04 | 5/31/03 | 5/31/02 | 5/31/01 |
|
| Net asset value, | | | | | | |
| beginning of period | $17.81 | $16.09 | $13.94 | $15.67 | $18.21 | $27.15 |
|
| Investment operations: | | | | | | |
| Net investment loss (a) | (.06)(d) | (.03)(d,e) | (.12)(d) | (.10) | (.12) | (.11) |
|
| Net realized and unrealized | | | | | | |
| loss on investments | 1.65 | 1.75 | 2.27 | (1.63) | (2.42) | (4.15) |
|
| Total from | | | | | | |
| investment operations | 1.59 | 1.72 | 2.15 | (1.73) | (2.54) | (4.26) |
|
| Less distributions: | | | | | | |
| From net realized gain | | | | | | |
| on investments | -- | -- | -- | -- | -- | (4.61) |
|
| Return of capital | | -- | -- | -- | -- | (.07) |
|
| Total distributions | -- | -- | -- | -- | -- | (4.68) |
|
| Redemption fees | --(f ) | --(f ) | -- | -- | -- | -- |
|
| Net asset value, | | | | | | |
| end of period | $19.40 | $17.81 | $16.09 | $13.94 | $15.67 | $18.21 |
|
| Total return at | | | | | | |
| net asset value (%)(b) | 8.93* | 10.69 | 15.42 | (11.04) | (13.95) | (17.40)* |
|
| |
| RATIOS AND SUPPLEMENTAL DATA | | | | | |
| Net assets, end of period | | | | | | |
| (in thousands) | $3,572 | $3,460 | $3,547 | $2,993 | $3,405 | $2,175 |
|
| Ratio of expenses to | | | | | | |
| average net assets (%)(c) | 1.02*(d) | 2.03(d) | 1.98(d) | 1.97 | 1.83 | 1.54* |
|
| Ratio of net investment loss | | | | | | |
| to average net assets (%) | (.33)*(d) | (.15)(d,e) | (.83)(d) | (.74) | (.71) | (.44)* |
|
| Portfolio turnover (%) | 58.67* | 121.26 | 111.20 | 107.08 | 133.78 | 263.98 |
† Commencement of operations.
* Not annualized.
** Unaudited.
(a) Per share net investment income has been determined on the basis of the weighted average number of shares outstanding during the period.
(b) Total return assumes dividend reinvestment and does not reflect the effect of sales charges.
(c) Includes amounts paid through expense offset and brokerage service arrangements (Note 2).
(d) Reflects waivers of certain fund expenses in connection with investments in Putnam Prime Money Market Fund during the period. As a result of such waivers, the expenses of the fund for the periods ended November 30, 2005, May 31, 2005 and May 31, 2004 reflect a reduction of less than 0.01% of average net assets for class C shares (Note 5).
(e) Reflects a non-recurring accrual related to Putnam Management’s settlement with the SEC regarding brokerage allocation practices, which amounted to $0.02 per share and 0.14% of average net assets for class C shares (Note 6).
(f) Amount represents less than $0.01 per share.
The accompanying notes are an integral part of these financial statements.
47
Financial highlights (For a common share outstanding throughout the period)
| CLASS M | | | | | | |
|
| PER-SHARE OPERATING PERFORMANCE | | | | |
|
| Six months ended** | | | Year ended | | |
| | 11/30/05 | 5/31/05 | 5/31/04 | 5/31/03 | 5/31/02 | 5/31/01 |
|
| Net asset value, | | | | | | |
| beginning of period | $17.74 | $15.98 | $13.82 | $15.49 | $17.96 | $23.47 |
|
| Investment operations: | | | | | | |
| Net investment income (loss)(a) | (.04)(d) | .02(d,e) | (.09)(d) | (.06) | (.08) | (.11) |
|
| Net realized and unrealized | | | | | | |
| gain (loss) on investments | 1.65 | 1.74 | 2.25 | (1.61) | (2.39) | (.72) |
|
| Total from | | | | | | |
| investment operations | 1.61 | 1.76 | 2.16 | (1.67) | (2.47) | (.83) |
|
| Less distributions: | | | | | | |
| From net realized gain | | | | | | |
| on investments | -- | -- | -- | -- | -- | (4.61) |
|
| Return of capital | | -- | -- | -- | -- | (.07) |
|
| Total distributions | -- | -- | -- | -- | -- | (4.68) |
|
| Redemption fees | --(f ) | --(f ) | -- | -- | -- | -- |
|
| Net asset value, | | | | | | |
| end of period | $19.35 | $17.74 | $15.98 | $13.82 | $15.49 | $17.96 |
|
| Total return at | | | | | | |
| net asset value (%)(b) | 9.08* | 11.01 | 15.63 | (10.78) | (13.75) | (5.49) |
|
| |
| RATIOS AND SUPPLEMENTAL DATA | | | | | |
| Net assets, end of period | | | | | | |
| (in thousands) | $15,466 | $16,984 | $19,280 | $24,702 | $38,646 | $55,231 |
|
| Ratio of expenses to | | | | | | |
| average net assets (%)(c) | .89*(d) | 1.78(d) | 1.73(d) | 1.72 | 1.58 | 1.50 |
|
| Ratio of net investment income | | | | | |
| (loss) to average net assets (%) | (.21)*(d) | .11(d,e) | (.57)(d) | (.49) | (.48) | (.50) |
|
| Portfolio turnover (%) | 58.67* | 121.26 | 111.20 | 107.08 | 133.78 | 263.98 |
* Not annualized.
** Unaudited.
(a) Per share net investment income has been determined on the basis of the weighted average number of shares outstanding during the period.
(b) Total return assumes dividend reinvestment and does not reflect the effect of sales charges.
(c) Includes amounts paid through expense offset and brokerage service arrangements (Note 2).
(d) Reflects waivers of certain fund expenses in connection with investments in Putnam Prime Money Market Fund during the period. As a result of such waivers, the expenses of the fund for the periods ended November 30, 2005, May 31, 2005 and May 31, 2004 reflect a reduction of less than 0.01% of average net assets for class M shares (Note 5).
(e) Reflects a non-recurring accrual related to Putnam Management’s settlement with the SEC regarding brokerage allocation practices, which amounted to $0.02 per share and 0.13% of average net assets for class M shares (Note 6).
(f) Amount represents less than $0.01 per share.
The accompanying notes are an integral part of these financial statements.
48
Financial highlights (For a common share outstanding throughout the period)
| CLASS R | | | |
|
| PER-SHARE OPERATING PERFORMANCE | | |
|
| | Six months ended** | Year ended | Period |
| | 11/30/05 | 5/31/05 | 12/1/03†-5/31/04 |
|
| Net asset value, | | | |
| beginning of period | $18.38 | $16.54 | $15.82 |
|
| Investment operations: | | | |
| Net investment loss (a) | (.01)(d) | .07(d,e) | (.02)(d) |
|
| Net realized and unrealized | | | |
| gain on investments | 1.70 | 1.80 | .74 |
|
| Total from | | | |
| investment operations | 1.69 | 1.87 | .72 |
|
| Less distributions: | | | |
| From net investment income | -- | (.03) | -- |
|
| Total distributions | -- | (.03) | -- |
|
| Redemption fees | --(f ) | --(f ) | -- |
|
| Net asset value, | | | |
| end of period | $20.07 | $18.38 | $16.54 |
|
| Total return at | | | |
| net asset value (%)(b) | 9.20* | 11.29 | 4.55* |
|
| |
| RATIOS AND SUPPLEMENTAL DATA | | |
| Net assets, end of period | | | |
| (in thousands) | $27 | $15 | $8 |
|
| Ratio of expenses to | | | |
| average net assets (%)(c) | .77*(d) | 1.53(d) | .74*(d) |
|
| Ratio of net investment income | | | |
| (loss) to average net assets (%) | (.08)*(d) | .39(d,e) | (.19)*(d) |
|
| Portfolio turnover (%) | 58.67* | 121.26 | 111.20 |
† Commencement of operations.
* Not annualized.
** Unaudited.
(a) Per share net investment income has been determined on the basis of the weighted average number of shares outstanding during the period.
(b) Total return assumes dividend reinvestment and does not reflect the effect of sales charges.
(c) Includes amounts paid through expense offset and brokerage service arrangements (Note 2).
(d) Reflects waivers of certain fund expenses in connection with investments in Putnam Prime Money Market Fund during the period. As a result of such waivers, the expenses of the fund for the periods ended November 30, 2005, May 31, 2005 and May 31, 2004 reflect a reduction of less than 0.01% of average net assets for class R shares (Note 5).
(e) Reflects a non-recurring accrual related to Putnam Management’s settlement with the SEC regarding brokerage allocation practices, which amounted to $0.03 per share and 0.18% of average net assets for class R shares (Note 6).
(f) Amount represents less than $0.01 per share.
The accompanying notes are an integral part of these financial statements.
49
Financial highlights (For a common share outstanding throughout the period)
| CLASS Y | |
|
| PER-SHARE OPERATING PERFORMANCE | |
|
| | Period** |
| | 10/4/05†-11/30/05 |
|
| Net asset value, | |
| beginning of period | $19.55 |
|
| Investment operations: | |
| Net investment loss (a) | .01(d) |
|
| Net realized and unrealized | |
| gain on investments | .62 |
|
| Total from | |
| investment operations | .63 |
|
| Less distributions: | |
| From net investment income | -- |
|
| Total distributions | -- |
|
| Redemption fees | --(e) |
|
| Net asset value, | |
| end of period | $20.18 |
|
| Total return at | |
| net asset value (%)(b) | 3.22* |
|
| |
| RATIOS AND SUPPLEMENTAL DATA | |
| Net assets, end of period | |
| (in thousands) | $6,740 |
|
| Ratio of expenses to | |
| average net assets (%)(c) | .16*(d) |
|
| Ratio of net investment income (loss) | |
| to average net assets (%) | .03*(d) |
|
| Portfolio turnover (%) | 58.67 |
† Commencement of operations.
* Not annualized.
** Unaudited.
(a) Per share net investment income has been determined on the basis of the weighted average number of shares outstanding during the period.
(b) Total return assumes dividend reinvestment and does not reflect the effect of sales charges.
(c) Includes amounts paid through expense offset and brokerage service arrangements (Note 2).
(d) Reflects waivers of certain fund expenses in connection with investments in Putnam Prime Money Market Fund during the period. As a result of such waivers, the expenses of the fund for the period ended November 30, 2005 reflect a reduction of less than 0.01% of average net assets for class Y shares (Note 5).
(e) Amount represents less than $0.01 per share.
The accompanying notes are an integral part of these financial statements.
50
Notes to financial statements 11/30/05 (Unaudited)
Note 1: Significant accounting policies
Putnam Capital Appreciation Fund (the “fund”) is registered under the Investment Company Act of 1940, as amended, as a diversified open-end management investment company. The fund seeks capital appreciation by investing primarily in common stocks that offer potential for capital appreciation. Current income is only an incidental consideration in selecting investments for the fund.
The fund offers class A, class B, class C, class M, class R and class Y shares. The fund began offering class Y shares on October 4, 2005. Class A and class M shares are sold with a maximum front-end sales charge of 5.25% and 3.25%, respectively, and generally do not pay a contingent deferred sales charge. Class B shares, which convert to class A shares after approximately eight years, do not pay a front-end sales charge and are subject to a contingent deferred sales charge, if those shares are redeemed within six years of purchase. Class C shares are subject to the same fees as class B shares, except that class C shares have a one-year 1.00% contingent deferred sales charge and do not convert to class A shares. Class R shares, which are offered to qualified employee-benefit plans are sold without a front-end sales charge or a contingent deferred sales charge. The expenses for class A, class B, class C, class M and class R shares may differ based on the distribution fee of each class, which is identified in Note 2. Class Y shares, which are sold at net asset value, are generally subject to the same expenses as class A, class B, class C, class M and class R shares, but do not bear a distribution fee. Class Y shares are sold to certain eligible purchasers including certain defined contribution plans (including corporate IRAs), bank trust departments and trust companies.
A 2.00% redemption fee may apply to any shares that are redeemed (either by selling or exchanging into another fund) within 5 days of purchase. The redemption fee is accounted for as an addition to paid-in-capital.
The redemption fee is accounted for as an addition to paid-in-capital. Prior year redemption fee balances have been reclassified to conform with current year financial statement presentation.
Investment income, realized and unrealized gains and losses and expenses of the fund are borne pro-rata based on the relative net assets of each class to the total net assets of the fund, except that each class bears expenses unique to that class (including the distribution fees applicable to such classes). Each class votes as a class only with respect to its own distribution plan or other matters on which a class vote is required by law or determined by the Trustees. Shares of each class would receive their pro-rata share of the net assets of the fund, if the fund were liquidated. In addition, the Trustees declare separate dividends on each class of shares.
In the normal course of business, the fund enters into contracts that may include agreements to indemnify another party under given circumstances. The fund’s maximum exposure under these arrangements is unknown as this would involve future claims that may be, but have not yet been, made against the fund. However, the fund expects the risk of material loss to be remote.
The following is a summary of significant accounting policies consistently followed by the fund in the preparation of its financial statements. The preparation of financial statements is in conformity with accounting principles generally accepted in the United States of America and requires management to make estimates and assumptions that affect the reported amounts of assets and liabilities in the financial statements and the reported amounts of increases and decreases in net assets from operations during the reporting period. Actual results could differ from those estimates.
A) Security valuation Investments for which market quotations are readily available are valued at the last reported sales price on their principal exchange, or official closing price for certain markets. If no sales are reported -- as in the case of some securities traded over-the-counter -- a
51
security is valued at its last reported bid price. Many securities markets and exchanges outside the U.S. close prior to the close of the New York Stock Exchange and therefore the closing prices for securities in such markets or on such exchanges may not fully reflect events that occur after such close but before the close of the New York Stock Exchange. Accordingly, on certain days, the fund will fair value foreign securities taking into account multiple factors, including movements in the U.S. securities markets. The number of days on which fair value prices will be used will depend on market activity and it is possible that fair value prices will be used by the fund to a significant extent. Securities quoted in foreign currencies, if any, are translated into U.S. dollars at the current exchange rate.
Other investments, including certain restricted securities, are valued at fair value following procedures approved by the Trustees. Such valuations and procedures are reviewed periodically by the Trustees.
B) Joint trading account Pursuant to an exemptive order from the Securities and Exchange Commission, the fund may transfer uninvested cash balances, including cash collateral received under security lending arrangements, into a joint trading account along with the cash of other registered investment companies and certain other accounts managed by Putnam Investment Management, LLC (“Putnam Management”), the fund’s manager, an indirect wholly-owned subsidiary of Putnam, LLC. These balances may be invested in issues of high-grade short-term investments having maturities of up to 397 days for collateral received under security lending arrangements and up to 90 days for other cash investments.
C) Security transactions and related investment income Security transactions are recorded on the trade date (the date the order to buy or sell is executed). Gains or losses on securities sold are determined on the identified cost basis. Interest income is recorded on the accrual basis. Dividend income, net of applicable withholding taxes, is recognized on the ex-dividend date except that certain dividends from foreign securities, if any, are recognized as soon as the fund is informed of the ex-dividend date. Non-cash dividends, if any, are recorded at the fair market value of the securities received.
D) Futures and options contracts The fund may use futures and options contracts to hedge against changes in the values of securities the fund owns or expects to purchase. The fund may also write options on swaps or securities it owns or in which it may invest to increase its current returns. The potential risk to the fund is that the change in value of futures and options contracts may not correspond to the change in value of the hedged instruments. In addition, losses may arise from changes in the value of the underlying instruments, if there is an illiquid secondary market for the contracts, or if the counterparty to the contract is unable to perform. Risks may exceed amounts recognized on the statement of assets and liabilities. When the contract is closed, the fund records a realized gain or loss equal to the difference between the value of the contract at the time it was opened and the value at the time it was closed. Realized gains and losses on purchased options are included in realized gains and losses on investment securities. If a written call option is exercised, the premium originally received is recorded as an addition to sales proceeds. If a written put option is exercised, the premium originally received is recorded as a reduction to the cost of investments.
Futures contracts are valued at the quoted daily settlement prices established by the exchange on which they trade. The fund and the broker agree to exchange an amount of cash equal to the daily fluctuation in the value of the futures contract. Such receipts or payments are known as “variation margin.” Exchange traded options are valued at the last sale price, or if no sales are reported, the last bid price for purchased options and the last ask price for written options. Options traded over-the-counter are valued using prices supplied by dealers. Futures and written option contracts
52
outstanding at period end, if any, are listed after the fund’s portfolio.
E) Total return swap contracts The fund may enter into total return swap contracts, which are arrangements to exchange a market linked return for a periodic payment, both based on a notional principal amount. To the extent that the total return of the security, index or other financial measure underlying the transaction exceeds or falls short of the offsetting interest rate obligation, the fund will receive a payment from or make a payment to the counterparty. Total return swap contracts are marked to market daily based upon quotations from market makers and the change, if any, is recorded as unrealized gain or loss. Payments received or made are recorded as realized gains or loss. The fund could be exposed to credit or market risk due to unfavorable changes in the fluctuation of interest rates or in the price of the underlying security or index, the possibility that there is no liquid market for these agreements or that the counterparty may default on its obligation to perform. Risk of loss may exceed amounts recognized on the statement of assets and liabilities. Total return swap contracts outstanding at period end, if any, are listed after the fund’s portfolio.
F) Security lending The fund may lend securities, through its agents, to qualified borrowers in order to earn additional income. The loans are collateralized by cash and/or securities in an amount at least equal to the market value of the securities loaned. The market value of securities loaned is determined daily and any additional required collateral is allocated to the fund on the next business day. The risk of borrower default will be borne by the fund’s agents; the fund will bear the risk of loss with respect to the investment of the cash collateral. Income from securities lending is included in investment income on the statement of operations. At November 30, 2005 the value of securities loaned amounted to $101,119,160. Certain of these securities were sold prior to period end and are included in the Receivable for securities sold on the Statement of assets and liabilities. The fund received cash collateral of $104,124,446 which is pooled with collateral of other Putnam funds into 25 issues of high grade short-term investments.
G) Federal taxes It is the policy of the fund to distribute all of its income within the prescribed time and otherwise comply with the provisions of the Internal Revenue Code of 1986 (the “Code”) applicable to regulated investment companies. It is also the intention of the fund to distribute an amount sufficient to avoid imposition of any excise tax under Section 4982 of the Code, as amended. Therefore, no provision has been made for federal taxes on income, capital gains or unrealized appreciation on securities held nor for excise tax on income and capital gains.
At May 31, 2005, the fund had a capital loss carryover of $116,591,775 available to the extent allowed by the Code to offset future net capital gain, if any. This capital loss carryover will expire on May 31, 2011.
The aggregate identified cost on a tax basis is $765,976,244, resulting in gross unrealized appreciation and depreciation of $77,733,281 and $29,414,346, respectively, or net unrealized appreciation of $48,318,935.
H) Distributions to shareholders Distributions to shareholders from net investment income are recorded by the fund on the ex-dividend date. Distributions from capital gains, if any, are recorded on the ex-dividend date and paid at least annually. The amount and character of income and gains to be distributed are determined in accordance with income tax regulations, which may differ from generally accepted accounting principles. Reclassifications are made to the fund’s capital accounts to reflect income and gains available for distribution (or available capital loss carryovers) under income tax regulations.
Note 2: Management fee, administrative
services and other transactions
Putnam Management is paid for management and investment advisory services quarterly based on the average net assets of the fund. Such fee is
53
based on the following annual rates: 0.65% of the first $500 million of average net assets, 0.55% of the next $500 million, 0.50% of the next $500 million, 0.45% of the next $5 billion, 0.425% of the next $5 billion, 0.405% of the next $5 billion, 0.39% of the next $5 billion and 0.38% thereafter.
Putnam Management has agreed to waive fees and reimburse expenses of the fund through May 31, 2006, to the extent necessary to ensure that the fund’s expenses do not exceed the simple average of the expenses of all front-end load funds viewed by Lipper Inc. as having the same investment classifi-cation or objective as the fund. The expense reimbursement is based on a comparison of the fund’s expenses with the average annualized operating expenses of the funds in its Lipper peer group for each calendar quarter during the fund’s last fiscal year, excluding 12b-1 fees and without giving effect to any expense offset and brokerage service arrangements that may reduce fund expenses. For the period ended November 30, 2005, Putnam Management did not waive any of its management fee from the fund.
For the period ended November 30, 2005, Putnam Management has assumed $3,570 of legal, shareholder servicing and communication, audit and Trustee fees incurred by the fund in connection with certain legal and regulatory matters (including those described in Note 6).
The fund reimburses Putnam Management an allocated amount for the compensation and related expenses of certain officers of the fund and their staff who provide administrative services to the fund. The aggregate amount of all such reimbursements is determined annually by the Trustees.
Custodial functions for the fund’s assets are provided by Putnam Fiduciary Trust Company (“PFTC”), a subsidiary of Putnam, LLC. PFTC receives fees for custody services based on the fund’s asset level, the number of its security holdings and transaction volumes. Putnam Investor Services, a division of PFTC, provides investor servicing agent functions to the fund. Putnam Investor Services receives fees for investor servicing based on the number of shareholder accounts in the fund and the level of defined contribution plan assets in the fund. During the period ended November 30, 2005, the fund incurred $1,383,568 for these services.
The fund has entered into an arrangement with PFTC whereby credits realized as a result of uninvested cash balances are used to reduce a portion of the fund’s expenses. The fund also reduced expenses through brokerage service arrangements. For the period ended November 30, 2005, the fund’s expenses were reduced by $181,745 under these arrangements.
Each independent Trustee of the fund receives an annual Trustee fee, of which $349 as a quarterly retainer, has been allocated to the fund, and an additional fee for each Trustees meeting attended. Trustees receive additional fees for attendance at certain committee meetings, industry seminars and for certain compliance-related matters. Trustees also are reimbursed for expenses they incur relating to their services as Trustees. George, Putnam, III, who is not an independent Trustee, also receives the foregoing fees for his services as Trustee.
The fund has adopted a Trustee Fee Deferral Plan (the “Deferral Plan”) which allows the Trustees to defer the receipt of all or a portion of Trustees fees payable on or after July 1, 1995. The deferred fees remain invested in certain Putnam funds until distribution in accordance with the Deferral Plan.
The fund has adopted an unfunded noncontribu-tory defined benefit pension plan (the “Pension Plan”) covering all Trustees of the fund who have served as a Trustee for at least five years and were first elected prior to 2004. Benefits under the Pension Plan are equal to 50% of the Trustee’s average total retainer and meeting fees for the three years preceding retirement. Pension expense for the fund is included in Trustee compensation and expenses in the statement of operations. Accrued pension liability is included in Payable for Trustee compensation and expenses
54
in the statement of assets and liabilities. The Trustees have terminated the Pension Plan with respect to any Trustee first elected after 2003.
The fund has adopted distribution plans (the “Plans”) with respect to its class A, class B, class C, class M and class R shares pursuant to Rule 12b-1 under the Investment Company Act of 1940. The purpose of the Plans is to compensate Putnam Retail Management, a wholly-owned subsidiary of Putnam, LLC and Putnam Retail Management GP, Inc., for services provided and expenses incurred in distributing shares of the fund. The Plans provide for payments by the fund to Putnam Retail Management at an annual rate of up to 035%, 1.00%, 1.00%, 1.00%, 1.00% of the average net assets attributable to class A, class B, class C, class M and class R shares, respectively. The Trustees have approved payment by the fund at an annual rate of 025%, 1.00%, 1.00%, 0.75%, 0.50% of the average net assets attributable to class A, class B, class C, class M and class R shares, respectively.
For the period ended November 30, 2005, Putnam Retail Management, acting as underwriter, received net commissions of $11,290 and $354 from the sale of class A and class M shares, respectively, and received $78,750 and $14 in contingent deferred sales charges from redemptions of class B and class C shares, respectively. A deferred sales charge of up to 1.00% and 0.65% is assessed on certain redemptions of class A and class M shares, respectively. For the year ended November 30, 2005, Putnam Retail Management, acting as underwriter, received $492 and no monies on class A and class M redemptions, respectively.
Note 3: Purchases and sales of securities
During the six months ended November 30, 2005, cost of purchases and proceeds from sales of investment securities other than short-term investments aggregated $422,830,569 and $492,897,891, respectively. There were no purchases or sales of U.S. government securities.
Note 4: Capital shares
At November 30, 2005, there was an unlimited number of shares of beneficial interest authorized. Transactions in capital shares were as follows:
| CLASS A | Shares | | Amount |
| Six months ended 11/30/05: | | |
| Shares sold | 3,401,857 | $ | 65,979,749 |
|
| Shares issued | | | |
| in connection | | | |
| with reinvestment | | | |
| of distributions | -- | | -- |
|
| | 3,401,857 | | 65,979,749 |
|
| Shares | | | |
| repurchased | (3,513,966) | | (68,151,558) |
|
| Net decrease | (112,109) | $ | (2,171,809) |
| |
| Year ended 5/31/05: | | | |
| Shares sold | 4,775,978 | $ | 84,506,446 |
|
| Shares issued | | | |
| in connection | | | |
| with reinvestment | | | |
| of distributions | 21,827 | | 398,551 |
|
| | 4,797,805 | | 84,904,997 |
|
| Shares | | | |
| repurchased | (6,642,953) | | (115,348,347) |
|
| Net decrease | (1,845,148) | $ | (30,443,350) |
55
| CLASS B | Shares | | Amount | CLASS M | Shares | Amount |
| Six months ended 11/30/05: | | | Six months ended 11/30/05: | |
| Shares sold | 332,429 | $ | 6,091,841 | Shares sold | 22,336 | $ 416,557 |
|
| Shares issued | | | | Shares issued | | |
| in connection | | | | in connection | | |
| with reinvestment | | | | with reinvestment | | |
| of distributions | -- | | -- | of distributions | -- | -- |
|
| | 332,429 | | 6,091,841 | | 22,336 | 416,557 |
|
| Shares | | | | Shares | | |
| repurchased | (4,277,310) | | (78,223,490) | repurchased | (180,200) | (3,364,749) |
|
| Net decrease | (3,944,881) | $ | (72,131,649) | Net decrease | (157,864) | $(2,948,192) |
| |
| Year ended 5/31/05: | | | | Year ended 5/31/05: | | |
| Shares sold | 1,103,114 | $ | 18,233,282 | Shares sold | 89,908 | $ 1,496,168 |
|
| Shares issued | | | | Shares issued | | |
| in connection | | | | in connection | | |
| with reinvestment | | | | with reinvestment | | |
| of distributions | -- | | -- | of distributions | -- | -- |
|
| | 1,103,114 | | 18,233,282 | | 89,908 | 1,496,168 |
|
| Shares | | | | Shares | | |
| repurchased | (7,879,069) | | (130,993,276) | repurchased | (339,015) | (5,653,378) |
|
| Net decrease | (6,775,955) | | $(112,759,994) | Net decrease | (249,107) | $(4,157,210) |
|
| |
| CLASS C | Shares | | Amount | CLASS R | Shares | Amount |
| Six months ended 11/30/05: | | | Six months ended 11/30/05: | |
| Shares sold | 17,361 | $ | 325,715 | Shares sold | 535 | $10,353 |
|
| Shares issued | | | | Shares issued | | |
| in connection | | | | in connection | | |
| with reinvestment | | | | with reinvestment | | |
| of distributions | -- | | -- | of distributions | -- | -- |
|
| | 17,361 | | 325,715 | | 535 | 10,353 |
|
| Shares | | | | Shares | | |
| repurchased | (27,503) | | (509,953) | repurchased | (6) | (136) |
|
| Net decrease | (10,142) | $ | (184,238) | Net increase | 529 | $10,217 |
| |
| Year ended 5/31/05: | | | | Year ended 5/31/05: | | |
| Shares sold | 55,032 | $ | 923,741 | Shares sold | 530 | $ 8,996 |
|
| Shares issued | | | | Shares issued | | |
| in connection | | | | in connection | | |
| with reinvestment | | | | with reinvestment | | |
| of distributions | -- | | -- | of distributions | 1 | 17 |
|
| | 55,032 | | 923,741 | | 531 | 9,013 |
|
| Shares | | | | Shares | | |
| repurchased | (81,293) | | (1,352,168) | repurchased | (208) | (3,477) |
|
| Net decrease | (26,261) | $ | (428,427) | Net increase | 323 | $ 5,536 |
56
| CLASS Y | Shares | Amount |
| For the period 10/4/05 (commencement of operations) |
| to 11/30/05: | | |
| Shares sold | 368,021 | $7,151,209 |
|
| Shares issued | | |
| in connection | | |
| with reinvestment | | |
| of distributions | -- | -- |
|
| | 368,021 | 7,151,209 |
|
| Shares | | |
| repurchased | (34,028) | (679,045) |
|
| Net increase | 333,993 | $6,472,164 |
At November 30, 2005, Putnam, LLC owned 63 class R shares of the fund (4.7% of class R shares outstanding), valued at $1,264.
Note 5: Investment in Putnam Prime Money Market Fund
Pursuant to an exemptive order from the Securities and Exchange Commission, the fund invests in Putnam Prime Money Market Fund, an open-end management investment company managed by Putnam Management. Management fees paid by the fund are reduced by an amount equal to the management and administrative services fees paid by Putnam Prime Money Market Fund with respect to assets invested by the fund in Putnam Prime Money Market Fund. For the period ended November 30, 2005, management fees paid were reduced by $6,092 relating to the fund’s investment in Putnam Prime Money Market Fund. Income distributions earned by the fund are recorded as income in the statement of operations and totaled $137,798 for the period ended November 30, 2005. During the period ended November 30, 2005, cost of purchases and cost of sales of investments in Putnam Prime Money Market Fund aggregated $116,076,176 and $108,388,956, respectively.
Note 6: Regulatory matters and litigation
Putnam Management has entered into agreements with the Securities and Exchange Commission and the Massachusetts Securities Division settling charges connected with excessive short-term trading by Putnam employees and, in the case of the charges brought by the Massachusetts Securities Division, by participants in some Putnam-administered 401(k) plans. Pursuant to these settlement agreements, Putnam Management will pay a total of $193.5 million in penalties and restitution, with $153.5 million being paid to certain open-end funds and their shareholders. The amount will be allocated to shareholders and funds pursuant to a plan developed by an independent consultant, and will be paid following approval of the plan by the SEC and the Massachusetts Securities Division.
The Securities and Exchange Commission’s and Massachusetts Securities Division’s allegations and related matters also serve as the general basis for numerous lawsuits, including purported class action lawsuits filed against Putnam Management and certain related parties, including certain Putnam funds. Putnam Management will bear any costs incurred by Putnam funds in connection with these lawsuits. Putnam Management believes that the likelihood that the pending private lawsuits and purported class action lawsuits will have a material adverse financial impact on the fund is remote, and the pending actions are not likely to materially affect its ability to provide investment management services to its clients, including the Putnam funds.
Pursuant to a settlement with the Securities and Exchange Commission relating to Putnam Management’s brokerage allocation practices, on October 13, 2005 the fund received $ 997,890 in proceeds paid by Putnam Management. The fund had accrued a receivable for this amount in the prior fiscal year.
57
Putnam Investments has recorded a charge of $30 million for the estimated cost, excluding interest, that it believes will be necessary to address issues relating to the calculation of certain amounts paid by the Putnam mutual funds in previous years. The previous payments were cost reimbursements by the Putnam funds to Putnam for transfer agent services relating to defined contribution operations. Putnam currently anticipates that any payments made by Putnam related to this issue will be paid to the Putnam funds. Review of this issue is ongoing.
Putnam Management and Putnam Retail Management are named as defendants in a civil suit in which the plaintiffs allege that the management and distribution fees paid by certain Putnam funds were excessive and seek recovery under the Investment Company Act of 1940. Putnam Management and Putnam Retail Management have contested the plaintiffs’ claims and the matter is currently pending in the U.S. District Court for the District of Massachusetts. Based on currently available information, Putnam Management believes that this action is without merit and that it is unlikely to have a material effect on Putnam Management’s and Putnam Retail Management’s ability to provide services to their clients, including the fund.
58
Brokerage commissions
(Unaudited)
|
Brokerage commissions are paid to firms that execute trades on behalf of your fund. When choosing these firms, Putnam is required by law to seek the best execution of the trades, taking all relevant factors into consideration, including expected quality of execution and commission rate. Listed below are the largest relationships based upon brokerage commissions for your fund and the other funds in Putnam’s U.S. Core group for the year ended November 30, 2005. The other Putnam mutual funds in this group are Putnam Investors Fund, Putnam Tax Smart Equity Fund, Putnam VT Capital Appreciation Fund, and Putnam VT Investors Fund.
The top five firms that received brokerage commissions for trades executed for the U.S. Core group are (in descending order) Goldman Sachs, Lehman Brothers, Deutsche Bank Securities, Merrill Lynch, and Credit Suisse First Boston. Commissions paid to these firms together represented approximately 52% of the total brokerage commissions paid for the year ended November 30, 2005.
Commissions paid to the next 10 firms together represented approximately 34% of the total brokerage commissions paid during the period. These firms are (in alphabetical order) Bank of America, Bear Stearns & Company, CIBC World Markets, Citigroup Global Markets, JP Morgan Clearing, Lazard Freres & Co., Morgan Stanley Dean Witter, RBC Capital Markets, UBS Warburg, and Wachovia Securities.
Additional information about brokerage commissions is available on the Securities and Exchange Commission (SEC) Web site at www.sec.gov. Putnam funds disclose commissions by firm to the SEC in semiannual filings on Form N-SAR.
59
Fund information
Founded over 65 years ago, Putnam Investments was built around the concept that a balance between risk and reward is the hallmark of a well-rounded financial program. We manage over 100 mutual funds in growth, value, blend, fixed income, and international.
| Investment Manager |
| Putnam Investment |
| Management, LLC |
| One Post Office Square |
| Boston, MA 02109 |
Marketing Services |
| Putnam Retail Management |
| One Post Office Square |
| Boston, MA 02109 |
Custodian |
| Putnam Fiduciary |
| Trust Company |
Legal Counsel |
| Ropes & Gray LLP |
Trustees |
| John A. Hill, Chairman |
| Jameson Adkins Baxter, |
| Vice Chairman |
| Charles B. Curtis |
| Myra R. Drucker |
| Charles E. Haldeman, Jr. |
| Paul L. Joskow |
| Elizabeth T. Kennan |
| John H. Mullin, III |
| Robert E. Patterson |
| George Putnam, III |
| W. Thomas Stephens |
| Richard B. Worley |
| Officers |
| George Putnam, III |
| President |
Charles E. Porter |
| Executive Vice President, |
| Associate Treasurer and |
| Principal Executive Officer |
Jonathan S. Horwitz |
| Senior Vice President |
| and Treasurer |
Steven D. Krichmar |
| Vice President and |
| Principal Financial Officer |
Michael T. Healy |
| Assistant Treasurer and |
| Principal Accounting Officer |
Daniel T. Gallagher |
| Senior Vice President, |
| Staff Counsel and |
| Compliance Liaison |
Beth S. Mazor |
| Vice President |
James P. Pappas |
| Vice President |
Richard S. Robie, III |
| Vice President |
| Mark C. Trenchard |
| Vice President and |
| BSA Compliance Officer |
Francis J. McNamara, III |
| Vice President and |
| Chief Legal Officer |
Charles A. Ruys de Perez |
| Vice President and |
| Chief Compliance Officer |
Judith Cohen |
| Vice President, Clerk and |
| Assistant Treasurer |
Wanda M. McManus |
| Vice President, Senior Associate |
| Treasurer and Assistant Clerk |
Nancy T. Florek |
| Vice President, Assistant Clerk, |
| Assistant Treasurer |
| and Proxy Manager |
This report is for the information of shareholders of Putnam Capital Appreciation Fund. It may also be used as sales literature when preceded or accompanied by the current prospectus, the most recent copy of Putnam’s Quarterly Performance Summary, and Putnam’s Quarterly Ranking Summary. For more recent performance, please visit www.putnam.com. Investors should carefully consider the investment objective, risks, charges, and expenses of a fund, which are described in its prospectus. For this and other information or to request a prospectus, call 1-800-225-1581 toll free. Please read the prospectus carefully before investing. The fund’s Statement of Additional Information contains additional information about the fund’s Trustees and is available without charge upon request by calling 1-800-225-1581.
60

Item 2. Code of Ethics:
Not applicable
Item 3. Audit Committee Financial Expert:
Not applicable
Item 4. Principal Accountant Fees and Services:
Not applicable
Item 5. Audit Committee
Not applicable
Item 6. Schedule of Investments:
Not applicable
Item 7. Disclosure of Proxy Voting Policies and Procedures For Closed-End Management Investment Companies:
Not applicable
Item 8. Portfolio Managers of Closed-End Investment Companies
Not Applicable
Item 9. Purchases of Equity Securities by Closed-End Management Investment Companies and Affiliated Purchasers:
Not applicable
Item 10. Submission of Matters to a Vote of Security Holders:
Not applicable
Item 11. Controls and Procedures: |
(a) The registrant's principal executive officer and principal financial officer have concluded, based on their evaluation of the effectiveness of the design and operation of the registrant's disclosure controls and procedures as of a date within 90 days of the filing date of this report, that the design and operation of such procedures are generally effective to provide reasonable assurance that information required to be disclosed by the registrant in this report is recorded, processed, summarized and reported within the time periods specified in the Commission's rules and forms.
(b) Changes in internal control over financial reporting:
Not applicable
Item 12. Exhibits:
(a) Not applicable
(b) A separate certification for each principal executive officer and principal financial officer of the registrant as required by Rule 30a-2 under the Investment Company Act of 1940, as amended, and the officer certifications as required by Section 906 of the Sarbanes-Oxley Act of 2002 are filed herewith.
SIGNATURES
Pursuant to the requirements of the Securities Exchange Act of 1934 and the Investment Company Act of 1940, the registrant has duly caused this report to be signed on its behalf by the undersigned, thereunto duly authorized.
NAME OF REGISTRANT
By (Signature and Title):
/s/Michael T. Healy
Michael T. Healy
Principal Accounting Officer
Date: January 27, 2006 |
Pursuant to the requirements of the Securities Exchange Act of 1934 and the Investment Company Act of 1940, this report has been signed below by the following persons on behalf of the registrant and in the capacities and on the dates indicated.
By (Signature and Title):
/s/Charles E. Porter
Charles E. Porter
Principal Executive Officer
Date: January 27, 2006
By (Signature and Title):
/s/Steven D. Krichmar
Steven D. Krichmar
Principal Financial Officer
Date: January 27, 2006 |