UNITED STATES
SECURITIES AND EXCHANGE COMMISSION
Washington, D.C. 20549
|
CERTIFIED SHAREHOLDER REPORT OF REGISTERED
MANAGEMENT INVESTMENT COMPANIES
|
Investment Company Act file number: (811- 07061 )
Exact name of registrant as specified in charter: Putnam Capital Appreciation Fund
Address of principal executive offices: One Post Office Square, Boston, Massachusetts 02109
| Name and address of agent for service: | Beth S. Mazor, Vice President |
| | One Post Office Square |
| | Boston, Massachusetts 02109 |
| |
| Copy to: | John W. Gerstmayr, Esq. |
| | Ropes & Gray LLP |
| | One International Place |
| | Boston, Massachusetts 02110 |
Registrant’s telephone number, including area code: (617) 292-1000
Date of fiscal year end: May 31, 2006
Date of reporting period: June 1, 2005—May 31, 2006
Item 1. Report to Stockholders:
The following is a copy of the report transmitted to stockholders pursuant to Rule 30e-1 under the Investment Company Act of 1940:

What makes Putnam different?

In 1830, Massachusetts Supreme Judicial Court Justice Samuel Putnam established The Prudent Man Rule, a legal foundation for responsible money management.
THE PRUDENT MAN RULE
All that can be required of a trustee to invest is that he shall conduct himself faithfully and exercise a sound discretion. He is to observe how men of prudence, discretion, and intelligence manage their own affairs, not in regard to speculation, but in regard to the permanent disposition of their funds, considering the probable income, as well as the probable safety of the capital to be invested.

A time-honored tradition in money management
Since 1937, our values have been rooted in a profound sense of responsibility for the money entrusted to us.
A prudent approach to investing
We use a research-driven team approach to seek consistent, dependable, superior investment results over time, although there is no guarantee a fund will meet its objectives.
Funds for every investment goal
We offer a broad range of mutual funds and other financial products so investors and their financial representatives can build diversified portfolios.
A commitment to doing what’s right for investors
We have below-average expenses and stringent investor protections, and provide a wealth of information about the Putnam funds.
Industry-leading service
We help investors, along with their financial representatives, make informed investment decisions with confidence.
Putnam Capital
Appreciation
Fund
|
| Message from the Trustees | 2 |
| About the fund | 4 |
| Report from the fund managers | 7 |
| Performance | 13 |
| Expenses | 16 |
| Portfolio turnover | 18 |
| Risk | 19 |
| Your fund’s management | 20 |
| Terms and definitions | 23 |
| Trustee approval of management contract | 25 |
| Other information for shareholders | 30 |
| Financial statements | 31 |
| Federal tax information | 58 |
| Brokerage commissions | 59 |
| About the Trustees | 60 |
| Officers | 66 |
Cover photograph: © Marco Cristofori
Message from the Trustees
|
Dear Fellow Shareholder
Investors continue to keep a close watch on the course of the economy. Globally, it appears that, assuming economic growth exceeds 4% in 2006, we will have seen the strongest economic performance over a four-year period in over thirty years. Corporate profits have boomed around the world, business capacity utilization rates have moved up, and unemployment rates have come down. Given such a sustained period of robust growth, it is not surprising that prices have begun to rise, inflation rates have crept up, and central banks in many countries, particularly the Federal Reserve (the Fed) in the United States, have pushed interest rates higher.
In recent weeks, investors have worried that these higher rates could threaten the fundamentals of the global economy, prompting a widespread sell-off. However, we believe that today’s higher interest rates, far from being a threat to global economic fundamentals, are in fact an integral part of them. Higher interest rates are bringing business borrowing costs closer to the rate of return available from investments. In our view, this should help provide the basis for a longer and more durable business expansion and a continued healthy investment environment.
You can be assured that the investment professionals managing your fund are closely monitoring the factors that influence the performance of the securities in which your fund invests. Moreover, Putnam Investments’ management team, under the leadership of Chief Executive Officer Ed Haldeman, continues to focus on investment performance and remains committed to putting the interests of shareholders first.
2
In the following pages, members of your fund’s management team discuss the fund’s performance and strategies for the fiscal period ended May 31, 2006, and provide their outlook for the months ahead. As always, we thank you for your support of the Putnam funds.

Putnam Capital Appreciation Fund:
seeking overlooked, underpriced companies
|

At any given time, financial market conditions may favor one type of stock over another. For example, the market may favor growth stocks — stocks of companies with potential for rapid growth. At other times, the market may favor value stocks — those whose prices are low relative to the company’s long-term potential. A key advantage of Putnam Capital Appreciation Fund is that it invests in both types of stocks, which means the fund’s management team can seek opportunities in any market environment. In addition, the fund can also invest in stocks across a wide range of industries and in companies of all sizes. The ability to spread fund assets so broadly brings diversity to the fund’s portfolio.
The fund’s management team believes that every company, regardless of its size, products, services, or industry, has an underlying long-term business worth. It is determined by analyzing a number of factors, including the company’s long-term growth potential. A stock’s price, however, may or may not accurately reflect the company’s underlying worth. Often, investors will underestimate the ability of successful companies to maintain their long-term competitive advantages. Short-term setbacks also can cause a company’s stock price to decline below its long-term worth. The fund’s management team searches for these market “inefficien-cies,” identifying undervalued stocks and holding them in the portfolio until their prices more closely reflect the company’s true worth. To gain a better understanding of companies and stocks, the team combines
Putnam Capital Appreciation Fund’s holdings have spanned
sectors and industries over time.
|
two types of analysis: quantitative analysis of a company’s historical results, and fundamental analysis of those results to forecast the future direction of a company.
The fund invests some or all of its assets in small and/or midsize companies. Such investments increase the risk of greater price fluctuations.
In-depth stock analysis:
Evaluate the future and
understand the past
|
Drawing on the expertise of dedicated stock analysts, the fund’s management team seeks stocks that are believed to be worth more than their current prices indicate.
In conducting research, the team uses both quantitative and fundamental analysis. While many research organizations emphasize just one approach, Putnam analysts look for companies that score well using both measures. They also dig behind the numbers to try to get a better understanding of each company’s competitive advantages and weaknesses.
The thoroughness of this process enables the fund’s managers to have greater conviction when their views differ from the market. Once a stock is selected for the portfolio, it is regularly assessed by the team to ensure that it continues to meet their criteria.
Putnam Capital Appreciation Fund invests in stocks of companies at all capitalization levels, and across a broad range of industries. While it has no bias toward either growth or value stocks, it targets companies believed to be worth more than their current stock prices indicate. It may be suitable for investors who are seeking growth through a well-diversified stock portfolio.
Highlights
* For the 12 months ended May 31, 2006, Putnam Capital Appreciation Fund’s class A shares returned 12.06% without sales charges.
* The fund’s benchmark, the Russell 3000 Index, gained 10.13% .
* The average return for the fund’s Lipper category, Multi-Cap Core Funds, was 10.76% .
* Additional fund performance, comparative performance, and Lipper data can be found in the performance section beginning on page 13.
Total return for class A shares for periods ended 5/31/06
Since the fund’s inception (8/5/93), average annual return is 10.65% at NAV and 10.19% at POP.
| | Average annual return | Cumulative return |
| | NAV | POP | NAV | POP |
|
| 10 years | 6.07% | 5.50% | 80.32% | 70.89% |
|
| 5 years | 2.47 | 1.36 | 12.97 | 7.01 |
|
| 3 years | 13.27 | 11.25 | 45.33 | 37.69 |
|
| 1 year | 12.06 | 6.19 | 12.06 | 6.19 |
|
Data is historical. Past performance does not guarantee future results. More recent returns may be less or more than those shown. Investment return and principal value will fluctuate, and you may have a gain or a loss when you sell your shares. Performance assumes reinvestment of distributions and does not account for taxes. Returns at NAV do not reflect a sales charge of 5.25% . For the most recent month-end performance, visit www.putnam.com. For a portion of the period, this fund limited expenses, without which returns would have been lower. A short-term trading fee of up to 2% may apply.
6
Report from the fund managers
|
The year in review
We are pleased to report that your fund delivered solid returns for the 12 months ended May 31, 2006. Based on results at net asset value (NAV, or without sales charges), the fund finished ahead of both its benchmark, the Russell 3000 Index, and the average for its Lipper category, Multi-Cap Core Funds. The fund continued to benefit from our bottom-up, research-intensive stock selection process and our ability to invest in both growth- and value-style stocks. Sectors that contributed positively to returns were consumer cyclicals, basic materials, energy, and capital goods, while holdings in the transportation, consumer staples, and communications services sectors detracted somewhat.
Market overview
During the year ended May 31, 2006, stocks delivered substantial gains overall, despite significant challenges such as rising interest rates, soaring energy prices, and — late in the period — growing concerns about inflation and slowing economic growth. Just before the close of the period, in early May, the Fed raised short-term interest rates for the 16th consecutive time. In the weeks that followed, stocks declined as investors grew increasingly worried that economic growth might weaken if the Fed were to go too far in raising rates.
Despite that difficult final month, the fund’s fiscal year was marked by several performance highlights. For example, in the first calendar quarter of 2006, the S&P 500 Index delivered its strongest first-quarter gain since 1999. In fact, by April, several major market indexes had begun to approach multi-year highs. While energy prices and interest rates remained a concern, investors were also cheered by many positive economic trends. Job creation improved, the economy continued to expand, inflation remained contained, and corporate profits were generally solid. For the period, stocks of small and midsize companies delivered strong performance, particularly in comparison with their large-cap counterparts. Among larger companies, value-style stocks
7
generally outperformed growth-style stocks. Among small-company stocks, growth performed in line with value.
Strategy overview
In managing your fund’s portfolio, we continued to take a bottom-up approach to stock selection. Regardless of how the economy or markets are behaving, we look for companies whose stocks appear to be mispriced by the market — in other words, companies that we believe are worth more than their current stock prices indicate. The fund is managed in a “blend” investment style, which means that instead of having a strong growth or value orientation, it has the flexibility to invest in a wide range of companies. It can invest in companies that are growing rapidly and seem to have the potential to continue growing (typically classified as “growth” stocks), as well as out-of-favor companies that are undergoing changes that may improve their earnings and growth potential (usually considered “value” stocks). In either case, we look for companies whose stock prices are currently low relative to our assessment of the company’s earnings and growth potential.
We find that, typically, stocks become attractively valued when the market underestimates the ability of good companies to maintain their returns and growth rates, or when the market overreacts to short-term events. We believe that if we focus on cash flows and valuations, maintain a diversified
Market sector performance
|
These indexes provide an overview of performance in different market sectors for the 12 months ended 5/31/06.
| Equities | |
| Russell 3000 Index (large-company stocks) | 10.13% |
|
| Russell 1000 Growth Index (large-company growth stocks) | 6.14% |
|
| Russell 1000 Value Index (large-company value stocks) | 12.61% |
|
| S&P 500 Index (broad stock market) | 8.64% |
|
| Bonds | |
| Lehman Aggregate Bond Index (broad bond market) | –0.48% |
|
| JP Morgan Global High Yield Index (global high-yield corporate bonds) | 7.40% |
|
| Lehman Government Bond Index (U.S. Treasury and agency securities) | –0.88% |
|
8
portfolio, and remain willing to buy and hold controversial stocks that we think are temporarily out of favor, the fund may be able to consistently profit from mispricings in the market.
Your fund’s holdings
A key advantage of your fund’s investment strategy is its flexibility to invest in a wide range of companies. The portfolio often includes newer, fast-growing companies as well as older, more established businesses. In some cases, our view of a stock is positive while most investors have a negative view. In other cases, a stock may be doing well, but we believe it can sustain its strong performance longer than the market generally does. An example of this contrast can be found in two of the strongest-performing holdings during the period — Office Depot and Apple Computer.
When we added the stock of Office Depot to the portfolio, the company was struggling with management mistakes, and investors were skeptical about its ability to keep pace with its competitor, Staples, the leader in the office-supply industry. We believed the market was underestimating the long-term potential of Office Depot. The investment proved rewarding; Office Depot was one of the portfolio’s top performers, due in part to the company’s appointment of a new CEO, which was followed by a solid improvement in earnings and margins. By the close of the fiscal year, we had sold the fund’s position in Office Depot
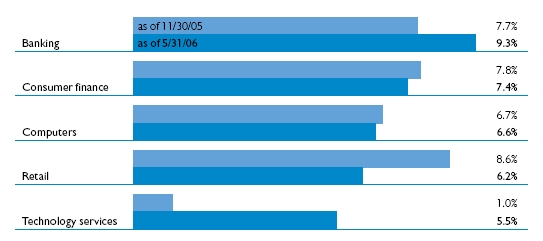
Comparison of top industry weightings
|
This chart shows how the fund’s top weightings have changed over the last six months. Weightings
are shown as a percentage of net assets. Holdings will vary over time.
9
as the company’s valuation, in our opinion, became less attractive.
At the other end of the spectrum is Apple, whose stock gained more than 120% in the 2005 calendar year. Investors are certainly positive about Apple, maker of Macintosh computers and the extremely popular iPod digital music player. But we believe investors are underestimating the company’s potential, and we have a higher estimate of Apple’s long-term revenue growth and profit margins. While investors are focusing primarily on iPods, we believe some of Apple’s most promising growth potential lies in the personal computer area. We believe the company can gain market share thanks to continued innovation, such as the recent addition of Intel chips to its PCs and software that enables Microsoft Windows software to run on Apple computers.
Another successful holding that we believe has room for even further growth is Las Vegas Sands, a hotel and gaming company. While the company’s U.S. operations have been very successful, we believe much of its future growth potential lies in its international land and property development opportunities, particularly in Macao. Many small and midsize companies in the portfolio were standouts during the period, including Steel Dynamics and Terex. Steel Dynamics, a manufacturer of flat steel, steel bars, and structural steel, benefited from significant price and volume increases as construction
This table shows the fund’s top holdings, and the percentage of the fund’s net assets that each comprised, as of 5/31/06. The fund’s holdings will change over time.
| Holding (percent of fund’s net assets) | Industry |
| Capital One Financial Corp. (4.0%) | Consumer finance |
|
| Dell, Inc. (3.2%) | Computers |
|
| Bank of America Corp. (3.1%) | Banking |
|
| Countrywide Financial Corp. (2.7%) | Consumer finance |
|
| Citigroup, Inc. (2.7%) | Financial |
|
| Commerce Bancorp, Inc. (2.6%) | Banking |
|
| Home Depot, Inc. (2.3%) | Retail |
|
| Las Vegas Sands Corp. (2.3%) | Lodging/tourism |
|
| Caterpillar, Inc. (2.2%) | Machinery |
|
| U.S. Bancorp (2.1%) | Banking |
|
10
activities picked up nationwide. Terex, a manufacturer of construction equipment, benefited from recent acquisitions, as well as improvement in the commercial and industrial construction markets.
Despite the fund’s strong performance for the period, some holdings detracted from performance, including Fannie Mae. We believed that the stock of this mortgage financing company was signifi-cantly undervalued, as it had been hurt by regulatory investigations of its accounting practices. However, as these issues continued during the period, our view of the business and our forecasts for the future value of the company began to change. As a result, we sold Fannie Mae from the portfolio, replacing it with Freddie Mac, another mortgage-financing company.
Also delivering weak performance during the period was Dell Computer. This was due partly to strategic missteps and increased competition, particularly from Hewlett Packard, which caused Dell’s growth rate to slow. We believe Dell’s recent problems can be resolved and that the stock continues to represent an attractive investment opportunity. JetBlue Airways is another position that we have maintained although it declined during the fiscal year. Surging oil prices, rapid expansion into major markets, and the company’s failure to maintain adequate pricing were some of the reasons for the weakness. However, overall airline profitability has begun to improve, and we believe JetBlue still has a cost advantage in the industry as well as the ability to raise its fares without altering its brand or culture.
Please note that the holdings discussed in this report may not have been held by the fund for the entire period. Portfolio composition is subject to review in accordance with the fund’s investment strategy and may vary in the future.
11
The outlook for your fund
|
The following commentary reflects anticipated developments that could affect your fund over the next six months, as well as your management team’s plans for responding to them.
As the fund’s fiscal year came to a close, investors continued to pay close attention to energy prices, and were growing increasingly concerned about the possibility of rising inflation and slowing economic growth. Uncertainty in the financial markets centered on the intentions of the new Fed Chairman Benjamin Bernanke and whether the Fed might go too far in its rate increases in an attempt to stop inflation. Despite these worries, however, there was also cause for optimism, including continued economic expansion, low unemployment, relatively low inflation, and generally strong corporate profits.
Regardless of the direction the markets take in the months ahead, we remain focused on the long-term potential of individual companies rather than short-term developments in the economy. While the market as a whole is affected by world events and economic cycles, we believe investors’ long-term goals are best served by the fund’s diversified portfolio and our bottom-up approach to stock selection, which relies heavily on fundamental research and analysis. Of course, our beliefs about general themes at work in the market do influence our decisions about the weightings of stocks within the portfolio.
The views expressed in this report are exclusively those of Putnam Management. They are not meant as investment advice.
The fund invests some or all of its assets in small and/or midsize companies. Such investments increase the risk of fluctuations in the value of your investment.
12
This section shows your fund’s performance for periods ended May 31, 2006, the end of its fiscal year. In accordance with regulatory requirements for mutual funds, we also include performance as of the most recent calendar quarter-end. Performance should always be considered in light of a fund’s investment strategy. Data represents past performance. Past performance does not guarantee future results. More recent returns may be less or more than those shown. Investment return and principal value will fluctuate, and you may have a gain or a loss when you sell your shares. For the most recent month-end performance, please visit www.putnam.com or call Putnam at 1-800-225-1581. Class Y shares are generally only available to corporate and institutional clients. See the Terms and Definitions section in this report for definitions of the share classes offered by your fund.
Total return for periods ended 5/31/06
| | Class A | | Class B | | Class C | | Class M | | Class R | Class Y |
| (inception dates) | (8/5/93) | | (11/2/94) | | (7/14/00) | | (1/22/96) | | (12/1/03) | (10/4/05) |
| | NAV | POP | NAV | CDSC | NAV | CDSC | NAV | POP | NAV | NAV |
|
| Annual average | | | | | | | | | | |
| (life of fund) | 10.65% | 10.19% | 9.84% | 9.84% | 10.06% | 10.06% | 10.09% | 9.80% | 10.37% | 10.66% |
|
| 10 years | 80.32 | 70.89 | 67.62 | 67.62 | 69.39 | 69.39 | 71.49 | 65.89 | 75.91 | 80.56 |
| Annual average | 6.07 | 5.50 | 5.30 | 5.30 | 5.41 | 5.41 | 5.54 | 5.19 | 5.81 | 6.09 |
|
| 5 years | 12.97 | 7.01 | 8.75 | 6.74 | 8.79 | 8.79 | 10.13 | 6.57 | 11.62 | 13.12 |
| Annual average | 2.47 | 1.36 | 1.69 | 1.31 | 1.70 | 1.70 | 1.95 | 1.28 | 2.22 | 2.50 |
|
| 3 years | 45.33 | 37.69 | 42.02 | 39.02 | 42.11 | 42.11 | 43.13 | 38.52 | 44.26 | 45.53 |
| Annual average | 13.27 | 11.25 | 12.40 | 11.61 | 12.43 | 12.43 | 12.70 | 11.47 | 12.99 | 13.32 |
|
| 1 year | 12.06 | 6.19 | 11.18 | 6.18 | 11.23 | 10.23 | 11.50 | 7.85 | 11.76 | 12.21 |
|
Performance assumes reinvestment of distributions and does not account for taxes. Returns at public offering price (POP) for class A and M shares reflect a sales charge of 5.25% and 3.25%, respectively. Class B share returns reflect the applicable contingent deferred sales charge (CDSC), which is 5% in the first year, declining to 1% in the sixth year, and is eliminated thereafter. Class C shares reflect a 1% CDSC the first year that is eliminated thereafter. Class R and Y shares have no initial sales charge or CDSC. Performance for class B, C, M, R, and Y shares before their inception is derived from the historical performance of class A shares, adjusted for the applicable sales charge (or CDSC) and, except for class Y shares, the higher operating expenses for such shares.
For a portion of the period, this fund limited expenses, without which returns would have been lower.
A 2% short-term trading fee may be applied to shares exchanged or sold within 5 days of purchase.
13
Change in the value of a $10,000 investment ($9,475 after sales charge)

Past performance does not indicate future results. At the end of the same time period, a $10,000 investment in the fund’s
class B and class C shares would have been valued at $16,762 and $16,939, respectively, and no contingent deferred sales
charges would apply. A $10,000 investment in the fund’s class M shares would have been valued at $17,149 ($16,589 at public
offering price). A $10,000 investment in the fund’s class R and class Y shares would have been valued at $17,591 and $18,056,
respectively. See first page of performance section for performance calculation method.
Comparative index returns
|
For periods ended 5/31/06
|
| | | Lipper Multi-Cap |
| | Russell | Core Funds |
| | 3000 Index | category average* |
|
| Annual average | | |
| (life of fund) | 10.49% | 9.91% |
|
| 10 years | 125.47 | 123.37 |
| Annual average | 8.47 | 7.83 |
|
| 5 years | 16.52 | 16.23 |
| Annual average | 3.11 | 2.79 |
|
| 3 years | 44.27 | 42.34 |
| Annual average | 13.00 | 12.36 |
|
| 1 year | 10.13 | 10.76 |
|
Index and Lipper results should be compared to fund performance at net asset value.
* Over the 1-, 3-, 5-, and 10-year periods ended 5/31/06, there were 803, 578, 418, and 155 funds, respectively, in this Lipper category.
14
Fund price and distribution information
|
For the 12-month period ended 5/31/06
|
| Distributions | Class A | Class B | Class C | Class M | Class R | Class Y |
|
| Number | 1 | — | — | — | 1 | 1 |
|
| Income | $0.064 | — | — | — | $0.051 | $0.072 |
|
| Capital gains | — | — | — | — | — | — |
|
| Total | $0.064 | — | — | — | $0.051 | $0.072 |
|
| Share value: | NAV | POP | NAV | NAV | NAV | POP | NAV | NAV |
|
| 5/31/05 | $18.45 | $19.47 | $17.45 | $17.81 | $17.74 | $18.34 | $18.38 | — |
|
| 10/4/05* | — | — | — | — | — | — | — | $19.55 |
|
| 5/31/06 | 20.61 | 21.75 | 19.40 | 19.81 | 19.78 | 20.44 | 20.49 | 20.63 |
|
* Inception date of class Y shares.
Fund performance for most recent calendar quarter
|
Total return for periods ended 6/30/06
|
| | Class A | | Class B | | Class C | | Class M | | Class R | Class Y |
| (inception dates) | (8/5/93) | | (11/2/94) | | (7/14/00) | | (1/22/96) | | (12/1/03) | (10/4/05) |
| | NAV | POP | NAV | CDSC | NAV | CDSC | NAV | POP | NAV | NAV |
|
| Annual average | | | | | | | | | | |
| (life of fund) | 10.57% | 10.11% | 9.77% | 9.77% | 9.98% | 9.98% | 10.01% | 9.73% | 10.30% | 10.59% |
|
| 10 years | 81.45 | 71.91 | 68.80 | 68.80 | 70.36 | 70.36 | 72.68 | 67.09 | 77.10 | 81.79 |
| Annual average | 6.14 | 5.57 | 5.37 | 5.37 | 5.47 | 5.47 | 5.61 | 5.27 | 5.88 | 6.16 |
|
| 5 years | 14.03 | 8.01 | 9.86 | 7.86 | 9.82 | 9.82 | 11.26 | 7.62 | 12.67 | 14.24 |
| Annual average | 2.66 | 1.55 | 1.90 | 1.52 | 1.89 | 1.89 | 2.16 | 1.48 | 2.41 | 2.70 |
|
| 3 years | 43.45 | 35.91 | 40.23 | 37.23 | 40.16 | 40.16 | 41.32 | 36.72 | 42.50 | 43.71 |
| Annual average | 12.78 | 10.77 | 11.93 | 11.13 | 11.91 | 11.91 | 12.22 | 10.99 | 12.53 | 12.85 |
|
| 1 year | 8.99 | 3.27 | 8.21 | 3.21 | 8.20 | 7.20 | 8.51 | 4.99 | 8.75 | 9.19 |
|
15
As a mutual fund investor, you pay ongoing expenses, such as management fees, distribution fees (12b-1 fees), and other expenses. In the most recent six-month period, your fund limited these expenses; had it not done so, expenses would have been higher. Using the information below, you can estimate how these expenses affect your investment and compare them with the expenses of other funds. You may also pay one-time transaction expenses, including sales charges (loads) and redemption fees, which are not shown in this section and would have resulted in higher total expenses. For more information, see your fund’s prospectus or talk to your financial advisor.
Review your fund’s expenses
The table below shows the expenses you would have paid on a $1,000 investment in Putnam Capital Appreciation Fund from December 1, 2005, to May 31, 2006. It also shows how much a $1,000 investment would be worth at the close of the period, assuming actual returns and expenses.
| | Class A | Class B | Class C | Class M | Class R | Class Y |
|
| Expenses paid per $1,000* | $ 6.56 | $ 10.33 | $ 10.33 | $ 9.07 | $ 7.82 | $ 5.30 |
|
| Ending value (after expenses) | $1,025.00 | $1,021.10 | $1,021.10 | $1,022.20 | $1,023.50 | $1,025.90 |
|
* Expenses for each share class are calculated using the fund’s annualized expense ratio for each class, which represents the ongoing expenses as a percentage of net assets for the six months ended 5/31/06. The expense ratio may differ for each share class (see the table at the bottom of the next page). Expenses are calculated by multiplying the expense ratio by the average account value for the period; then multiplying the result by the number of days in the period; and then dividing that result by the number of days in the year. Does not reflect the effect of a non-recurring reimbursement by Putnam. If this amount had been reflected in the table above, expenses for each share class would have been lower.
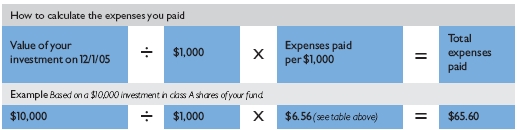
Estimate the expenses you paid
|
To estimate the ongoing expenses you paid for the six months ended May 31, 2006, use the calculation method below. To find the value of your investment on December 1, 2005, go to www.putnam.com and log on to your account. Click on the “Transaction History” tab in your Daily Statement and enter 12/01/2005 in both the “from” and “to” fields. Alternatively, call Putnam at 1-800-225-1581.
16
Compare expenses using the SEC’s method
|
The Securities and Exchange Commission (SEC) has established guidelines to help investors assess fund expenses. Per these guidelines, the table below shows your fund’s expenses based on a $1,000 investment, assuming a hypothetical 5% annualized return. You can use this information to compare the ongoing expenses (but not transaction expenses or total costs) of investing in the fund with those of other funds. All mutual fund shareholder reports will provide this information to help you make this comparison. Please note that you cannot use this information to estimate your actual ending account balance and expenses paid during the period.
| | Class A | Class B | Class C | Class M | Class R | Class Y |
|
| Expenses paid per $1,000* | $ 6.54 | $ 10.30 | $ 10.30 | $ 9.05 | $ 7.80 | $ 5.29 |
|
| Ending value (after expenses) | $1,018.45 | $1,014.71 | $1,014.71 | $1,015.96 | $1,017.20 | $1,019.70 |
|
* Expenses for each share class are calculated using the fund’s annualized expense ratio for each class, which represents the ongoing expenses as a percentage of net assets for the six months ended 5/31/06. The expense ratio may differ for each share class (see the table at the bottom of this page). Expenses are calculated by multiplying the expense ratio by the average account value for the period then multiplying the result by the number of days in the period and then dividing that result by the number of days in the year. Does not reflect the effect of a non-recurring reimbursement by Putnam. If this amount had been reflected in the table above, expenses for each share class would have been lower.
Compare expenses using industry averages
You can also compare your fund’s expenses with the average of its peer group, as defined by Lipper, an independent fund-rating agency that ranks funds relative to others that Lipper considers to have similar investment styles or objectives. The expense ratio for each share class shown below indicates how much of your fund’s net assets have been used to pay ongoing expenses during the period.
| | Class A | Class B | Class C | Class M | Class R | Class Y |
|
| Your fund’s annualized | | | | | | |
| expense ratio* | 1.30% | 2.05% | 2.05% | 1.80% | 1.55% | 1.05% |
|
| Average annualized expense | | | | | | |
| ratio for Lipper peer group† | 1.40% | 2.15% | 2.15% | 1.90% | 1.65% | 1.15% |
|
* For the fund’s most recent fiscal half year; may differ from expense ratios based on one-year data in the financial highlights. Does not reflect the effect of a non-recurring reimbursement by Putnam. If this amount had been reflected in the table above, the expense ratio for each share class would have been lower.
† Simple average of the expenses of all front-end load funds in the fund’s Lipper peer group, calculated in accordance with Lipper’s standard method for comparing fund expenses (excluding 12b-1 fees and without giving effect to any expense offset and brokerage service arrangements that may reduce fund expenses). This average reflects each fund’s expenses for its most recent fiscal year available to Lipper as of 3/31/06. To facilitate comparison, Putnam has adjusted this average to reflect the 12b-1 fees carried by each class of shares other than class Y shares, which do not incur 12b-1 fees. The peer group may include funds that are significantly smaller or larger than the fund, which may limit the comparability of the fund’s expenses to the simple average, which typically is higher than the asset-weighted average.
17
Your fund’s
portfolio turnover
|
Putnam funds are actively managed by teams of experts who buy and sell securities based on intensive analysis of companies, industries, economies, and markets. Portfolio turnover is a measure of how often a fund’s managers buy and sell securities for your fund. A portfolio turnover of 100%, for example, means that the managers sold and replaced securities valued at 100% of a fund’s assets within a one-year period. Funds with high turnover may be more likely to generate capital gains and dividends that must be distributed to shareholders as taxable income. High turnover may also cause a fund to pay more brokerage commissions and other transaction costs, which may detract from performance.
Percentage of holdings that change every year
| | 2006 | 2005 | 2004 | 2003 | 2002 |
|
| Putnam Capital Appreciation Fund | 95% | 121% | 111% | 107% | 134% |
|
| Lipper Multi-Cap Core Funds | | | | | |
| category average | 70% | 69% | 70% | 72% | 77% |
|
Turnover data for the fund is calculated based on the fund’s fiscal-year period, which ends on November 30. Turnover data for the fund’s Lipper category is calculated based on the average of the turnover of each fund in the category for its fiscal year ended during the indicated year. Fiscal years vary across funds in the Lipper category, which may limit the comparability of the fund’s portfolio turnover rate to the Lipper average. Comparative data for 2006 is based on information available as of 5/31/06.
18
This risk comparison is designed to help you understand how your fund compares with other funds. The comparison utilizes a risk measure developed by Morningstar, an independent fund-rating agency. This risk measure is referred to as the fund’s Overall Morningstar Risk.
Your fund’s Overall Morningstar® Risk

Your fund’s Overall Morningstar Risk is shown alongside that of the average fund in its broad asset class, as determined by Morningstar. The risk bar broadens the comparison by translating the fund’s Overall Morningstar Risk into a percentile, which is based on the fund’s ranking among all funds rated by Morningstar as of June 30, 2006. A higher Overall Morningstar Risk generally indicates that a fund’s monthly returns have varied more widely.
Morningstar determines a fund’s Overall Morningstar Risk by assessing variations in the fund’s monthly returns — with an emphasis on downside variations — over 3-, 5-, and 10-year periods, if available. Those measures are weighted and averaged to produce the fund’s Overall Morningstar Risk. The information shown is provided for the fund’s class A shares only; information for other classes may vary. Overall Morningstar Risk is based on historical data and does not indicate future results. Morningstar does not purport to measure the risk associated with a current investment in a fund, either on an absolute basis or on a relative basis. Low Overall Morningstar Risk does not mean that you cannot lose money on an investment in a fund. Copyright 2006 Morningstar, Inc. All Rights Reserved. The information contained herein (1) is proprietary to Morningstar and/or its content providers; (2) may not be copied or distributed; and (3) is not warranted to be accurate, complete, or timely. Neither Morningstar nor its content providers are responsible for any damages or losses arising from any use of this information.
19
Your fund is managed by the members of the Putnam U.S. Core and U.S. Small- and Mid-Cap Core teams. James Wiess is the Portfolio Leader, and Richard Cervone and Joseph Joseph are Portfolio Members of the fund. The Portfolio Leader and Portfolio Members coordinate the teams’ management of the fund.
For a complete listing of the members of the Putnam U.S. Core and U.S. Small- and Mid-Cap Core teams, including those who are not Portfolio Leaders or Portfolio Members of your fund, visit Putnam’s Individual Investor Web site at www.putnam.com.
Fund ownership by the Portfolio Leader and Portfolio Members
The table below shows how much the fund’s current Portfolio Leader and Portfolio Members have invested in the fund (in dollar ranges). Information shown is as of May 31, 2006, and May 31, 2005.
| | | | $1 – | $10,001 – | $50,001 – | $100,001 – | $500,001 – | $1,000,001 |
| | Year | $0 | $10,000 | $50,000 | $100,000 | $500,000 | $1,000,000 | and over |
|
| James Wiess | 2006 | | | * | | | | |
|
|
| Portfolio Leader | 2005 | * | | | | | | |
|
| Richard Cervone | 2006 | | | | * | | | |
|
|
| Portfolio Member | 2005 | | | * | | | | |
|
| Joseph Joseph | 2006 | | | | | | * | |
|
|
| Portfolio Member | 2005 | * | | | | | | |
|
20
Fund manager compensation
The total 2005 fund manager compensation that is attributable to your fund is approximately $710,000. This amount includes a portion of 2005 compensation paid by Putnam Management to the fund managers listed in this section for their portfolio management responsibilities, calculated based on the fund assets they manage taken as a percentage of the total assets they manage. The compensation amount also includes a portion of the 2005 compensation paid to the Chief Investment Officers of the teams and the Group Chief Investment Officers of the fund’s broader investment categories for their oversight responsibilities, calculated based on the fund assets they oversee taken as a percentage of the total assets they oversee. This amount does not include compensation of other personnel involved in research, trading, administration, systems, compliance, or fund operations; nor does it include non-compensation costs. These percentages are determined as of the fund’s fiscal period-end. For personnel who joined Putnam Management during or after 2005, the calculation reflects annualized 2005 compensation or an estimate of 2006 compensation, as applicable.
Other Putnam funds managed by the Portfolio Leader and Portfolio Members
James Wiess is also a Portfolio Leader of Putnam Investors Fund and Putnam Tax Smart Equity Fund.
Richard Cervone is also a Portfolio Member of Putnam Investors Fund and Putnam Tax Smart Equity Fund.
Joseph Joseph is also a Portfolio Leader of Putnam Capital Opportunities Fund and Putnam International Capital Opportunities Fund.
James Wiess, Richard Cervone, and Joseph Joseph may also manage other accounts and variable trust funds advised by Putnam Management or an affiliate.
Changes in your fund’s Portfolio Leader and Portfolio Members
During the year ended May 31, 2006, Portfolio Leader Joshua Brooks moved to other fund assignments within Putnam and Portfolio Member James Wiess became Portfolio Leader of your fund. Also during the period, Portfolio Member James Yu left the fund's management team.
21
Fund ownership by Putnam’s Executive Board
The table below shows how much the members of Putnam’s Executive Board have invested in the fund (in dollar ranges). Information shown is as of May 31, 2006, and May 31, 2005.
| | | | | $1 – | $10,001 – | $50,001– | $100,001 |
| | Year | | $0 | $10,000 | $50,000 | $100,000 | and over |
|
| Philippe Bibi | 2006 | | * | | | | |
|
|
| Chief Technology Officer | 2005 | | * | | | | |
|
| Joshua Brooks | 2006 | | | | | * | |
|
|
| Deputy Head of Investments | 2005 | | | | | * | |
|
| William Connolly | 2006 | | * | | | | |
|
|
| Head of Retail Management | N/A | | | | | | |
|
| Kevin Cronin | 2006 | | * | | | | |
|
|
| Head of Investments | 2005 | | * | | | | |
|
| Charles Haldeman, Jr. | 2006 | | | | * | | |
|
|
| President and CEO | 2005 | | | | * | | |
|
| Amrit Kanwal | 2006 | | * | | | | |
|
|
| Chief Financial Officer | 2005 | | * | | | | |
|
| Steven Krichmar | 2006 | | * | | | | |
|
|
| Chief of Operations | 2005 | | * | | | | |
|
| Francis McNamara, III | 2006 | | | * | | | |
|
|
| General Counsel | 2005 | | | * | | | |
|
| Richard Robie, III | 2006 | | * | | | | |
|
|
| Chief Administrative Officer | 2005 | | * | | | | |
|
| Edward Shadek | 2006 | | | | | * | |
|
|
| Deputy Head of Investments | 2005 | | | | * | | |
|
| Sandra Whiston | 2006 | | * | | | | |
|
|
| Head of Institutional Management | N/A | | | | | | |
|
N/A indicates the individual was not a member of Putnam’s Executive Board as of 5/31/05.
22
Important terms
Total return shows how the value of the fund’s shares changed over time, assuming you held the shares through the entire period and reinvested all distributions in the fund.
Net asset value (NAV) is the price, or value, of one share of a mutual fund, without a sales charge. NAVs fluctuate with market conditions. NAV is calculated by dividing the net assets of each class of shares by the number of outstanding shares in the class.
Public offering price (POP) is the price of a mutual fund share plus the maximum sales charge levied at the time of purchase. POP performance figures shown here assume the 5.25% maximum sales charge for class A shares and 3.25% for class M shares.
Contingent deferred sales charge (CDSC) is generally a charge applied at the time of the redemption of class B or C shares and assumes redemption at the end of the period. Your fund’s class B CDSC declines from a 5% maximum during the first year to 1% during the sixth year. After the sixth year, the CDSC no longer applies. The CDSC for class C shares is 1% for one year after purchase.
Share classes
Class A shares are generally subject to an initial sales charge and no CDSC (except on certain redemptions of shares bought without an initial sales charge).
Class B shares are not subject to an initial sales charge. They may be subject to a CDSC.
Class C shares are not subject to an initial sales charge and are subject to a CDSC only if the shares are redeemed during the first year.
Class M shares have a lower initial sales charge and a higher 12b-1 fee than class A shares and no CDSC (except on certain redemptions of shares bought without an initial sales charge).
Class R shares are not subject to an initial sales charge or CDSC and are available only to certain defined contribution plans.
Class Y shares are not subject to an initial sales charge or CDSC, and carry no 12b-1 fee. They are only available to eligible purchasers, including eligible defined contribution plans or corporate IRAs.
23
JP Morgan Global High Yield Index is an unmanaged index of global high-yield fixed-income securities.
Lehman Aggregate Bond Index is an unmanaged index of U.S. investment-grade fixed-income securities.
Lehman Government Bond Index is an unmanaged index of U.S. Treasury and agency securities.
Russell 1000 Growth Index is an unmanaged index of those companies in the large-cap Russell 1000 Index chosen for their growth orientation.
Russell 1000 Value Index is an unmanaged index of those companies in the large-cap Russell 1000 Index chosen for their value orientation.
Russell 3000 Index is an unmanaged index of the 3,000 largest U.S. companies.
S&P 500 Index is an unmanaged index of common stock performance.
Indexes assume reinvestment of all distributions and do not account for fees. Securities and performance of a fund and an index will differ. You cannot invest directly in an index.
Lipper is a third-party industry-ranking entity that ranks mutual funds. Its rankings do not reflect sales charges. Lipper rankings are based on total return at net asset value relative to other funds that have similar current investment styles or objectives as determined by Lipper. Lipper may change a fund’s category assignment at its discretion. Lipper category averages reflect performance trends for funds within a category.
24
Trustee approval of
management contract
|
The Board of Trustees of the Putnam funds oversees the management of each fund and, as required by law, determines annually whether to approve the continuance of your fund’s management contract with Putnam Management. In this regard, the Board of Trustees, with the assistance of its Contract Committee consisting solely of Trustees who are not “interested persons” (as such term is defined in the Investment Company Act of 1940, as amended) of the Putnam funds (the “Independent Trustees”), requests and evaluates all information it deems reasonably necessary under the circumstances. Over the course of several months beginning in March and ending in June 2005, the Contract Committee met five times to consider the information provided by Putnam Management and other information developed with the assistance of the Board’s independent counsel and independent staff. The Contract Committee reviewed and discussed key aspects of this information with all of the Independent Trustees. Upon completion of this review, the Contract Committee recommended and the Independent Trustees approved the continuance of your fund’s management contract, effective July 1, 2005.
This approval was based on the following conclusions:
|
* That the fee schedule currently in effect for your fund represents reasonable compensation in light of the nature and quality of the services being provided to the fund, the fees paid by competitive funds and the costs incurred by Putnam Management in providing such services, and
* That such fee schedule represents an appropriate sharing between fund shareholders and Putnam Management of such economies of scale as may exist in the management of the fund at current asset levels.
These conclusions were based on a comprehensive consideration of all information provided to the Trustees and were not the result of any single factor. Some of the factors that figured particularly in the Trustees’ deliberations and how the Trustees considered these factors are described below, although individual Trustees may have evaluated the information presented differently, giving different weights to various factors. It is also important to recognize that the fee arrangements for your fund and the other Putnam funds are the result of many years of review and discussion between the Independent Trustees and Putnam Management, that certain aspects of such arrangements may receive greater scrutiny in some years than others, and that the Trustees’ conclusions may be based, in part, on their consideration of these same arrangements in prior years.
25
Model fee schedules and categories; total expenses
|
The Trustees’ review of the management fees and total expenses of the Putnam funds focused on three major themes:
* Consistency. The Trustees, working in cooperation with Putnam Management, have developed and implemented a series of model fee schedules for the Putnam funds designed to ensure that each fund’s management fee is consistent with the fees for similar funds in the Putnam family of funds and compares favorably with fees paid by competitive funds sponsored by other investment advisors. Under this approach, each Putnam fund is assigned to one of several fee categories based on a combination of factors, including competitive fees and perceived difficulty of management, and a common fee schedule is implemented for all funds in a given fee category. The Trustees reviewed the model fee schedule then in effect for your fund, including fee levels and breakpoints, and the assignment of the fund to a particular fee category under this structure. (“Breakpoints” refer to reductions in fee rates that apply to additional assets once specified asset levels are reached.) The Trustees concluded that no changes should be made in the fund’s current fee schedule at this time.
* Competitiveness. The Trustees also reviewed comparative fee and expense information for competitive funds, which indicated that, in a custom peer group of competitive funds selected by Lipper Inc., your fund ranked in the 21st percentile in management fees and in the 14th percentile in total expenses (less any applicable 12b-1 fees) as of December 31, 2004 (the first percentile being the least expensive funds and the 100th percentile being the most expensive funds). (Because the fund’s custom peer group is smaller than the fund’s broad Lipper Inc. peer group, this expense comparison may differ from the Lipper peer expense information found elsewhere in this report.) The Trustees noted that expense ratios for a number of Putnam funds, which show the percentage of fund assets used to pay for management and administrative services, distribution (12b-1) fees and other expenses, had been increasing recently as a result of declining net assets and the natural operation of fee breakpoints. They noted that such expense ratio increases were currently being controlled by expense limitations implemented in January 2004 and which Putnam Management, in consultation with the Contract Committee, had committed to maintain at least through 2006. The Trustees expressed their intention to monitor this information closely to ensure that fees and expenses of the Putnam funds continue to meet evolving competitive standards.
* Economies of scale. The Trustees concluded that the fee schedule currently in effect for your fund represents an appropriate sharing of economies of scale at current asset levels. Your fund currently has the benefit of breakpoints in its management fee that provide shareholders with significant economies of scale, which means that the effective management fee rate of a fund (as a percentage of fund assets) declines as a fund grows in size and crosses specified asset thresholds. The Trustees examined the existing breakpoint structure of the Putnam funds’ management fees in light of competitive industry practices. The Trustees considered various possible modifications to the Putnam funds’ current breakpoint structure, but ultimately
26
concluded that the current breakpoint structure continues to serve the interests of fund shareholders. Accordingly, the Trustees continue to believe that the fee schedules currently in effect for the funds represent an appropriate sharing of economies of scale at current asset levels. The Trustees noted that significant redemptions in many Putnam funds, together with signifi-cant changes in the cost structure of Putnam Management, have altered the economics of Putnam Management’s business in significant ways. In view of these changes, the Trustees intend to consider whether a greater sharing of the economies of scale by fund shareholders would be appropriate if and when aggregate assets in the Putnam funds begin to experience meaningful growth.
In connection with their review of the management fees and total expenses of the Putnam funds, the Trustees also reviewed the costs of the services to be provided and profits to be realized by Putnam Management and its affiliates from the relationship with the funds. This information included trends in revenues, expenses and profitability of Putnam Management and its affiliates relating to the investment management and distribution services provided to the funds. In this regard, the Trustees also reviewed an analysis of Putnam Management’s revenues, expenses and profitability with respect to the funds’ management contracts, allocated on a fund-by-fund basis.
Investment performance
The quality of the investment process provided by Putnam Management represented a major factor in the Trustees’ evaluation of the quality of services provided by Putnam Management under your fund’s management contract. The Trustees were assisted in their review of the funds’ investment process and performance by the work of the Investment Oversight Committees of the Trustees, which meet on a regular monthly basis with the funds’ portfolio teams throughout the year. The Trustees concluded that Putnam Management generally provides a high quality investment process — as measured by the experience and skills of the individuals assigned to the management of fund portfolios, the resources made available to such personnel, and in general the ability of Putnam Management to attract and retain high-quality personnel — but also recognize that this does not guarantee favorable investment results for every fund in every time period. The Trustees considered the investment performance of each fund over multiple time periods and considered information comparing the fund’s performance with various benchmarks and with the performance of competitive funds. The Trustees noted the satisfactory investment performance of many Putnam funds. They also noted the disappointing investment performance of certain funds in recent years and continued to discuss with senior management of Putnam Management the factors contributing to such underperformance and actions being taken to improve performance. The Trustees recognized that, in recent years, Putnam Management has made significant changes in its investment personnel and processes and in the fund product line to address areas of underperformance. The Trustees indicated their intention to continue to monitor performance trends to assess the effectiveness of these changes and to evaluate whether additional remedial changes are warranted.
27
In the case of your fund, the Trustees considered that your fund’s class A share cumulative total return performance at net asset value was in the following percentiles of its Lipper Inc. peer group (Lipper Multi-Cap Core Funds) for the one-, three-, and five-year periods ended December 31, 2004 (the first percentile being the best-performing funds and the 100th percentile being the worst-performing funds):
| One-year period | Three-year period | Five-year period |
|
| 14th | 62nd | 73rd |
(Because of the passage of time, these performance results may differ from the performance results for more recent periods shown elsewhere in this report. Over the one-, three-, and five-year periods ended December 31, 2004, there were 722, 514, and 347 funds, respectively, in your fund’s Lipper peer group.* Past performance is no guarantee of future performance.)
As a general matter, the Trustees believe that cooperative efforts between the Trustees and Putnam Management represent the most effective way to address investment performance problems. The Trustees believe that investors in the Putnam funds have, in effect, placed their trust in the Putnam organization, under the oversight of the funds’ Trustees, to make appropriate decisions regarding the management of the funds. Based on the responsiveness of Putnam Management in the recent past to Trustee concerns about investment performance, the Trustees believe that it is preferable to seek change within Putnam Management to address performance shortcomings. In the Trustees’ view, the alternative of terminating a management contract and engaging a new investment advisor for an underperforming fund would entail significant disruptions and would not provide any greater assurance of improved investment performance.
Brokerage and soft-dollar allocations; other benefits
The Trustees considered various potential benefits that Putnam Management may receive in connection with the services it provides under the management contract with your fund. These include principally benefits related to brokerage and soft-dollar allocations, whereby a portion of the commissions paid by a fund for brokerage is earmarked to pay for research services that may be utilized by a fund’s investment advisor, subject to the obligation to seek best execution. The Trustees believe that soft-dollar credits and other potential benefits associated with the allocation of fund brokerage, which pertains mainly to funds investing in equity securities, represent assets of the funds that should be used for the benefit of fund shareholders. This area has been marked by significant change in recent years. In July 2003, acting upon the Contract Committee’s recommendation, the Trustees directed that allocations of brokerage to reward firms that sell fund shares be discontinued no later than December 31, 2003. In addition,
* The percentile rankings for your fund’s class A share annualized total return performance in the Lipper Multi-Cap Core Funds category for the one-, five-, and ten-year periods ended June 30, 2006, were 58%, 62%, and 72%, respectively. Over the one-, five-, and ten-year periods ended June 30, 2006, the fund ranked 475th out of 819, 264th out of 430, and 112th out of 155 funds, respectively. Note that this more recent information was not available when the Trustees approved the continuance of your fund’s management contract.
28
commencing in 2004, the allocation of brokerage commissions by Putnam Management to acquire research services from third-party service providers has been significantly reduced, and continues at a modest level only to acquire research that is customarily not available for cash. The Trustees will continue to monitor the allocation of the funds’ brokerage to ensure that the principle of “best price and execution” remains paramount in the portfolio trading process.
The Trustees’ annual review of your fund’s management contract also included the review of its distributor’s contract and distribution plan with Putnam Retail Management Limited Partnership and the custodian agreement and investor servicing agreement with Putnam Fiduciary Trust Company, all of which provide benefits to affiliates of Putnam Management.
Comparison of retail and institutional fee schedules
The information examined by the Trustees as part of their annual contract review has included for many years information regarding fees charged by Putnam Management and its affiliates to institutional clients such as defined benefit pension plans, college endowments, etc. This information included comparison of such fees with fees charged to the funds, as well as a detailed assessment of the differences in the services provided to these two types of clients. The Trustees observed, in this regard, that the differences in fee rates between institutional clients and the mutual funds are by no means uniform when examined by individual asset sectors, suggesting that differences in the pricing of investment management services to these types of clients reflect to a substantial degree historical competitive forces operating in separate market places. The Trustees considered the fact that fee rates across all asset sectors are higher on average for mutual funds than for institutional clients, as well as the differences between the services that Putnam Management provides to the Putnam funds and those that it provides to institutional clients of the firm, but have not relied on such comparisons to any significant extent in concluding that the management fees paid by your fund are reasonable.
29
Other information
for shareholders
|
Putnam’s policy on confidentiality
|
In order to conduct business with our shareholders, we must obtain certain personal information such as account holders’ addresses, telephone numbers, Social Security numbers, and the names of their financial advisors. We use this information to assign an account number and to help us maintain accurate records of transactions and account balances. It is our policy to protect the confidentiality of your information, whether or not you currently own shares of our funds, and in particular, not to sell information about you or your accounts to outside marketing firms. We have safeguards in place designed to prevent unauthorized access to our computer systems and procedures to protect personal information from unauthorized use. Under certain circumstances, we share this information with outside vendors who provide services to us, such as mailing and proxy solicitation. In those cases, the service providers enter into confidentiality agreements with us, and we provide only the information necessary to process transactions and perform other services related to your account. We may also share this information with our Putnam affiliates to service your account or provide you with information about other Putnam products or services. It is also our policy to share account information with your financial advisor, if you’ve listed one on your Putnam account. If you would like clarification about our confidentiality policies or have any questions or concerns, please don’t hesitate to contact us at 1-800-225-1581, Monday through Friday, 8:30 a.m. to 7:00 p.m., or Saturdays from 9:00 a.m. to 5:00 p.m. Eastern Time.
Putnam is committed to managing our mutual funds in the best interests of our shareholders. The Putnam funds’ proxy voting guidelines and procedures, as well as information regarding how your fund voted proxies relating to portfolio securities during the 12-month period ended June 30, 2005, are available on the Putnam Individual Investor Web site, www.putnam.com/individual, and on the SEC’s Web site, www.sec.gov. If you have questions about finding forms on the SEC’s Web site, you may call the SEC at 1-800-SEC-0330. You may also obtain the Putnam funds’ proxy voting guidelines and procedures at no charge by calling Putnam’s Shareholder Services at 1-800-225-1581.
The fund will file a complete schedule of its portfolio holdings with the SEC for the first and third quarters of each fiscal year on Form N-Q. Shareholders may obtain the fund’s Forms N-Q on the SEC’s Web site at www.sec.gov. In addition, the fund’s Forms N-Q may be reviewed and copied at the SEC’s Public Reference Room in Washington, D.C. You may call the SEC at 1-800-SEC-0330 for information about the SEC’s Web site or the operation of the Public Reference Room.
30
A guide to financial statements
|
These sections of the report, as well as the accompanying Notes, preceded by the Report of Independent Registered Public Accounting Firm, constitute the fund’s financial statements.
The fund’s portfolio lists all the fund’s investments and their values as of the last day of the reporting period. Holdings are organized by asset type and industry sector, country, or state to show areas of concentration and diversification.
Statement of assets and liabilities shows how the fund’s net assets and share price are determined. All investment and noninvestment assets are added together. Any unpaid expenses and other liabilities are subtracted from this total. The result is divided by the number of shares to determine the net asset value per share, which is calculated separately for each class of shares. (For funds with preferred shares, the amount subtracted from total assets includes the liquidation preference of preferred shares.)
Statement of operations shows the fund’s net investment gain or loss. This is done by first adding up all the fund’s earnings — from dividends and interest income — and subtracting its operating expenses to determine net investment income (or loss). Then, any net gain or loss the fund realized on the sales of its holdings — as well as any unrealized gains or losses over the period — is added to or subtracted from the net investment result to determine the fund’s net gain or loss for the fiscal year.
Statement of changes in net assets shows how the fund’s net assets were affected by the fund’s net investment gain or loss, by distributions to shareholders, and by changes in the number of the fund’s shares. It lists distributions and their sources (net investment income or realized capital gains) over the current reporting period and the most recent fiscal year-end. The distributions listed here may not match the sources listed in the Statement of operations because the distributions are determined on a tax basis and may be paid in a different period from the one in which they were earned.
Financial highlights provide an overview of the fund’s investment results, per-share distributions, expense ratios, net investment income ratios, and portfolio turnover in one summary table, reflecting the five most recent reporting periods. In a semiannual report, the highlight table also includes the current reporting period.
31
Report of Independent Registered Public Accounting Firm
To the Trustees and Shareholders of
Putnam Capital Appreciation Fund:
|
In our opinion, the accompanying statement of assets and liabilities, including the fund’s portfolio, and the related statements of operations and of changes in net assets and the financial highlights present fairly, in all material respects, the financial position of Putnam Capital Appreciation Fund (the “fund”) at May 31, 2006, and the results of its operations, the changes in its net assets and the financial highlights for each of the periods indicated, in conformity with accounting principles generally accepted in the United States of America. These financial statements and financial highlights (hereafter referred to as “financial statements”) are the responsibility of the fund’s management; our responsibility is to express an opinion on these financial statements based on our audits. We conducted our audits of these financial statements in accordance with the standards of the Public Company Accounting Oversight Board (United States). Those standards require that we plan and perform the audit to obtain reasonable assurance about whether the financial statements are free of material misstatement. An audit includes examining, on a test basis, evidence supporting the amounts and disclosures in the financial statements, assessing the accounting principles used and significant estimates made by management, and evaluating the overall financial statement presentation. We believe that our audits, which included confirmation of investments owned at May 31, 2006, by correspondence with the custodian and brokers, provide a reasonable basis for our opinion.
PricewaterhouseCoopers LLP
Boston, Massachusetts
July 14, 2006
|
32
| The fund’s portfolio 5/31/06 | | | |
|
| |
| |
| |
| COMMON STOCKS (99.5%)* | | | |
|
| | Shares | | Value |
|
| Aerospace and Defense (—%) | | | |
| Triumph Group, Inc. † | 3,741 | $ | 176,687 |
|
| |
| Airlines (1.8%) | | | |
| Alaska Air Group, Inc. † (S) | 22,151 | | 858,130 |
| ExpressJet Holdings, Inc. † | 272,270 | | 1,598,225 |
| JetBlue Airways Corp. † (S) | 903,300 | | 9,412,386 |
| World Air Holdings, Inc. † (S) | 9,264 | | 87,545 |
| | | | 11,956,286 |
|
| |
| Automotive (0.6%) | | | |
| Tenneco Automotive, Inc. † | 153,010 | | 3,647,758 |
| Visteon Corp. † (S) | 18,877 | | 140,067 |
| | | | 3,787,825 |
|
| |
| Banking (9.3%) | | | |
| Anchor BanCorp Wisconsin, Inc. | 9,612 | | 280,190 |
| Bank of America Corp. | 423,100 | | 20,478,040 |
| Center Financial Corp. | 2,518 | | 58,745 |
| City Holding Co. (S) | 6,266 | | 226,579 |
| Commerce Bancorp, Inc. (S) | 440,200 | | 17,295,458 |
| Corus Bankshares, Inc. (S) | 113,408 | | 3,203,776 |
| First Regional Bancorp † | 665 | | 56,758 |
| FirstFed Financial Corp. † (S) | 81,217 | | 4,697,591 |
| Independent Bank Corp. (S) | 7,764 | | 209,240 |
| Lakeland Financial Corp. | 1,290 | | 29,335 |
| Provident Financial Holdings, Inc. | 2,192 | | 61,091 |
| R&G Financial Corp. Class B (Puerto Rico) | 78,312 | | 712,639 |
| Republic Bancorp, Inc. Class A | 2,146 | | 43,929 |
| Southwest Bancorp, Inc. | 4,361 | | 104,708 |
| U.S. Bancorp | 458,800 | | 14,163,156 |
| | | | 61,621,235 |
|
| |
| Biotechnology (1.6%) | | | |
| Albany Molecular Research, Inc. † | 30,766 | | 317,197 |
| Amgen, Inc. † | 95,700 | | 6,468,363 |
| Applera Corp.-Applied Biosystems Group (S) | 75,300 | | 2,228,880 |
| Arqule, Inc. † | 12,050 | | 65,070 |
| Connetics Corp. † | 13,300 | | 156,275 |
| Diversa Corp. † (S) | 19,373 | | 181,525 |
| Incyte Pharmaceuticals, Inc. † (S) | 14,587 | | 60,828 |
| Regeneron Pharmaceuticals, Inc. �� | 33,596 | | 434,732 |
| Savient Pharmaceuticals, Inc. † (S) | 66,300 | | 381,225 |
| | | | 10,294,095 |
|
| |
| Broadcasting (0.1%) | | | |
| Sinclair Broadcast Group, Inc. Class A | 64,400 | | 548,044 |
33
| COMMON STOCKS (99.5%)* continued | | | |
|
| | Shares | | Value |
|
| Building Materials (0.9%) | | | |
| Sherwin-Williams Co. (The) | 100,400 | $ | 4,856,348 |
| Tyler Technologies, Inc. † (S) | 20,640 | | 219,403 |
| Universal Forest Products, Inc. (S) | 8,203 | | 539,183 |
| | | | 5,614,934 |
|
| |
| Chemicals (0.7%) | | | |
| Georgia Gulf Corp. | 118,254 | | 3,811,326 |
| NewMarket Corp. | 11,778 | | 570,055 |
| | | | 4,381,381 |
|
| |
| Commercial and Consumer Services (0.9%) | | | |
| Administaff, Inc. (S) | 5,061 | | 194,494 |
| Catalina Marketing Corp. | 32,254 | | 944,720 |
| CBIZ, Inc. † (S) | 10,695 | | 88,234 |
| Chemed Corp. (S) | 18,615 | | 1,002,418 |
| Consolidated Graphics, Inc. † | 12,953 | | 659,826 |
| Escala Group, Inc. † (S) | 6,377 | | 46,106 |
| HUB Group, Inc. Class A † | 10,836 | | 512,760 |
| John H. Harland Co. (S) | 36,205 | | 1,550,660 |
| Spherion Corp. † (S) | 12,983 | | 108,538 |
| Startek, Inc. | 10,892 | | 164,251 |
| TeleTech Holdings, Inc. † | 40,838 | | 491,690 |
| | | | 5,763,697 |
|
| |
| Communications Equipment (1.3%) | | | |
| ADTRAN, Inc. | 49,500 | | 1,248,390 |
| Cisco Systems, Inc. † | 363,700 | | 7,157,616 |
| Tekelec † (S) | 21,119 | | 304,747 |
| | | | 8,710,753 |
|
| |
| Computers (6.6%) | | | |
| Adaptec, Inc. † | 32,955 | | 147,309 |
| Agilysys, Inc. | 8,561 | | 141,257 |
| Apple Computer, Inc. † | 183,200 | | 10,949,864 |
| Brocade Communications Systems, Inc. † | 773,102 | | 4,723,653 |
| Catapult Communications Corp. † | 12,239 | | 150,540 |
| Checkpoint Systems, Inc. † (S) | 20,179 | | 455,844 |
| Dell, Inc. † | 835,400 | | 21,202,452 |
| Emulex Corp. † | 318,923 | | 5,651,316 |
| Magma Design Automation, Inc. † (S) | 14,771 | | 103,249 |
| Netgear, Inc. † | 3,034 | | 71,026 |
| | | | 43,596,510 |
|
| |
| Construction (—%) | | | |
| Builders FirstSource, Inc. † | 10,092 | | 209,510 |
| Huttig Building Products, Inc. † | 9,865 | | 63,235 |
| | | | 272,745 |
|
| |
| Consumer Cyclicals (—%) | | | |
| Hooker Furniture Corp. | 1,223 | | 19,641 |
34
| COMMON STOCKS (99.5%)* continued | | | |
|
| | Shares | | Value |
|
| Consumer Finance (7.4%) | | | |
| Accredited Home Lenders Holding Co. † (S) | 41,099 | $ | 2,134,682 |
| Asta Funding, Inc. (S) | 14,068 | | 514,326 |
| Capital One Financial Corp. | 314,900 | | 26,064,273 |
| CompuCredit Corp. † (S) | 47,200 | | 1,805,872 |
| Countrywide Financial Corp. (S) | 467,952 | | 17,913,203 |
| World Acceptance Corp. † (S) | 12,335 | | 396,817 |
| | | | 48,829,173 |
|
| |
| Consumer Goods (0.9%) | | | |
| Blyth Industries, Inc. (S) | 28,537 | | 603,558 |
| Chattem, Inc. † (S) | 50,391 | | 1,767,716 |
| Darling International, Inc. † | 22,181 | | 89,389 |
| Yankee Candle Co., Inc. (The) (S) | 132,475 | | 3,613,918 |
| | | | 6,074,581 |
|
| |
| Consumer Services (0.3%) | | | |
| Alderwoods Group, Inc. (Canada) † | 32,379 | | 626,210 |
| Labor Ready, Inc. † | 55,102 | | 1,275,611 |
| | | | 1,901,821 |
|
| |
| Distribution (—%) | | | |
| BlueLinx Holdings, Inc. | 6,904 | | 93,066 |
|
| |
| Electric Utilities (0.1%) | | | |
| Alliant Energy Corp. | 3,135 | | 107,844 |
| Black Hills Corp. | 12,152 | | 411,102 |
| Puget Energy, Inc. | 2,312 | | 48,991 |
| | | | 567,937 |
|
| |
| Electronics (0.8%) | | | |
| Greatbatch, Inc. † (S) | 10,500 | | 238,245 |
| IXYS Corp. † | 25,681 | | 256,810 |
| Methode Electronics, Inc. Class A | 20,432 | | 194,921 |
| Netlogic Microsystems, Inc. † (S) | 3,625 | | 118,393 |
| Omnivision Technologies, Inc. † (S) | 78,987 | | 2,314,319 |
| PortalPlayer, Inc. † (S) | 67,192 | | 675,280 |
| Stoneridge, Inc. † | 12,387 | | 96,371 |
| TriQuint Semiconductor, Inc. † | 126,000 | | 650,160 |
| TTM Technologies, Inc. † | 38,858 | | 567,715 |
| Varian, Inc. † | 8,500 | | 374,085 |
| | | | 5,486,299 |
|
| |
| Energy (0.5%) | | | |
| Atwood Oceanics, Inc. † | 5,850 | | 285,305 |
| Parker Drilling Co. † | 410,063 | | 3,026,265 |
| | | | 3,311,570 |
|
| |
| Engineering & Construction (—%) | | | |
| Noble International, Ltd. | 9,927 | | 154,365 |
35
| COMMON STOCKS (99.5%)* continued | | | |
|
| | Shares | | Value |
|
| Financial (5.1%) | | | |
| Asset Acceptance Capital Corp. † | 8,907 | $ | 154,091 |
| Citigroup, Inc. | 359,300 | | 17,713,490 |
| Freddie Mac | 197,300 | | 11,845,892 |
| Radian Group, Inc. (S) | 63,203 | | 3,862,967 |
| Student Loan Corp. | 72 | | 13,389 |
| | | | 33,589,829 |
|
| |
| Food (—%) | | | |
| American Italian Pasta Co. Class A (S) | 12,500 | | 91,625 |
|
| |
| Forest Products and Packaging (0.6%) | | | |
| Albany International Corp. (S) | 60,173 | | 2,404,513 |
| CSS Industries, Inc. | 4,077 | | 123,737 |
| Graphic Packaging Corp. † | 14,350 | | 55,678 |
| Louisiana-Pacific Corp. (S) | 53,372 | | 1,294,805 |
| | | | 3,878,733 |
|
| |
| Gaming & Lottery (—%) | | | |
| Dover Downs Gaming & Entertainment, Inc. (S) | 5,564 | | 141,326 |
|
| |
| Health Care Services (5.5%) | | | |
| Aetna, Inc. | 171,200 | | 6,584,352 |
| American Dental Partners, Inc. † | 3,807 | | 52,765 |
| AMICAS, Inc. † (S) | 33,482 | | 119,196 |
| AMN Healthcare Services, Inc. † | 25,541 | | 502,647 |
| HCA, Inc. (S) | 197,000 | | 8,756,650 |
| Manor Care, Inc. (S) | 122,703 | | 5,698,327 |
| Odyssey Healthcare, Inc. † (S) | 15,422 | | 251,533 |
| UnitedHealth Group, Inc. | 319,600 | | 14,049,616 |
| | | | 36,015,086 |
|
| |
| Homebuilding (2.0%) | | | |
| NVR, Inc. † (S) | 21,300 | | 12,971,700 |
|
| |
| Household Furniture and Appliances (—%) | | | |
| Conn’s, Inc. † (S) | 1,100 | | 31,812 |
| Select Comfort Corp. † (S) | 6,201 | | 203,145 |
| | | | 234,957 |
|
| |
| Insurance (4.8%) | | | |
| Affirmative Insurance Holdings, Inc. | 6,118 | | 89,506 |
| American Equity Investment Life Holding Co. (S) | 36,691 | | 478,818 |
| American Physicians Capital, Inc. † | 3,631 | | 167,825 |
| AmerUs Group Co. (S) | 81,694 | | 4,749,689 |
| CNA Surety Corp. † (S) | 3,617 | | 62,104 |
| Commerce Group, Inc. | 16,875 | | 957,656 |
| Delphi Financial Group Class A (S) | 17,724 | | 937,068 |
| Direct General Corp. (S) | 9,042 | | 160,134 |
| Everest Re Group, Ltd. (Barbados) | 124,000 | | 11,079,400 |
| FPIC Insurance Group, Inc. † | 2,238 | | 84,082 |
36
| COMMON STOCKS (99.5%)* continued | | | |
|
| | Shares | | Value |
|
| Insurance continued | | | |
| HCC Insurance Holdings, Inc. | 132,161 | $ | 4,056,021 |
| Infinity Property & Casualty Corp. (S) | 12,781 | | 544,726 |
| IPC Holdings, Ltd. (Bermuda) (S) | 537 | | 13,092 |
| Midland Co. (The) | 3,818 | | 151,575 |
| National Interstate Corp. | 3,312 | | 74,619 |
| Presidential Life Corp. | 1,264 | | 31,613 |
| Selective Insurance Group | 8,200 | | 446,900 |
| Stancorp Financial Group | 22,740 | | 1,110,167 |
| Triad Guaranty, Inc. † | 4,302 | | 232,867 |
| W.R. Berkley Corp. | 132,676 | | 4,560,074 |
| Zenith National Insurance Corp. | 44,472 | | 1,778,880 |
| | | | 31,766,816 |
|
| |
| Investment Banking/Brokerage (2.3%) | | | |
| Bear Stearns Cos., Inc. (The) (S) | 54,300 | | 7,262,625 |
| Eaton Vance Corp. | 45,302 | | 1,201,409 |
| IndyMac Bancorp, Inc. (S) | 22,595 | | 1,037,111 |
| Janus Capital Group, Inc. | 307,400 | | 5,536,274 |
| | | | 15,037,419 |
|
| |
| Leisure (1.6%) | | | |
| Arctic Cat, Inc. | 16,652 | | 305,398 |
| Harley-Davidson, Inc. (S) | 199,900 | | 9,965,015 |
| Marine Products Corp. (S) | 4,752 | | 46,094 |
| | | | 10,316,507 |
|
| |
| Lodging/Tourism (3.8%) | | | |
| Las Vegas Sands Corp. † | 213,600 | | 15,082,296 |
| Royal Caribbean Cruises, Ltd. | 255,600 | | 9,733,248 |
| | | | 24,815,544 |
|
| |
| Machinery (3.3%) | | | |
| Applied Industrial Technologies, Inc. | 10,077 | | 388,468 |
| Cascade Corp. | 10,594 | | 398,334 |
| Caterpillar, Inc. | 197,400 | | 14,400,330 |
| Terex Corp. † (S) | 72,270 | | 6,612,705 |
| | | | 21,799,837 |
|
| |
| Manufacturing (0.3%) | | | |
| Blount International, Inc. † | 9,954 | | 127,610 |
| Teleflex, Inc. | 30,900 | | 1,895,406 |
| | | | 2,023,016 |
|
| |
| Medical Technology (2.7%) | | | |
| Analogic Corp. (S) | 8,858 | | 506,058 |
| Bausch & Lomb, Inc. (S) | 7,300 | | 358,795 |
| Boston Scientific Corp. † | 552,000 | | 11,415,360 |
| Candela Corp. † | 5,260 | | 90,577 |
| Charles River Laboratories International, Inc. † | 860 | | 34,434 |
| Epix Pharmaceuticals, Inc. † | 28,478 | | 101,951 |
37
| COMMON STOCKS (99.5%)* continued | | | |
|
| | Shares | | Value |
|
| Medical Technology continued | | | |
| Hillenbrand Industries, Inc. | 12,067 | $ | 609,866 |
| Immucor, Inc. † (S) | 48,000 | | 873,120 |
| Medical Action Industries, Inc. † | 3,035 | | 69,684 |
| Mentor Corp. (S) | 26,652 | | 1,076,474 |
| Respironics, Inc. † | 73,212 | | 2,490,672 |
| | | | 17,626,991 |
|
| |
| Metal Fabricators (0.1%) | | | |
| Brush Engineered Materials, Inc. † | 23,276 | | 481,115 |
|
| |
| Metals (2.3%) | | | |
| A.M. Castle & Co. | 15,130 | | 419,101 |
| AK Steel Holding Corp. † | 151,360 | | 2,035,792 |
| NS Group, Inc. † (S) | 1,602 | | 79,972 |
| Quanex Corp. (S) | 66,242 | | 2,604,635 |
| Shiloh Industries, Inc. † | 2,136 | | 41,930 |
| Steel Dynamics, Inc. | 93,836 | | 5,450,933 |
| United States Steel Corp. (S) | 72,100 | | 4,785,998 |
| | | | 15,418,361 |
|
| |
| Natural Gas Utilities (0.1%) | | | |
| Energen Corp. (S) | 1,079 | | 36,557 |
| Transmontaigne, Inc. † | 36,396 | | 418,554 |
| | | | 455,111 |
|
| |
| Office Equipment & Supplies (0.2%) | | | |
| Kimball International, Inc. Class B | 11,650 | | 174,750 |
| Steelcase, Inc. | 37,822 | | 701,220 |
| Systemax, Inc. † | 13,517 | | 101,107 |
| | | | 977,077 |
|
| |
| Oil & Gas (5.0%) | | | |
| Cabot Oil & Gas Corp. Class A | 2,854 | | 125,205 |
| Callon Petroleum Co. † | 15,973 | | 285,278 |
| EOG Resources, Inc. | 107,500 | | 7,058,450 |
| Giant Industries, Inc. † | 54,593 | | 3,450,278 |
| Harvest Natural Resources, Inc. † | 35,450 | | 489,565 |
| Hess Corp. (S) | 46,000 | | 6,900,000 |
| Occidental Petroleum Corp. | 100,900 | | 9,998,181 |
| Petroleum Development Corp. † | 12,631 | | 460,274 |
| St. Mary Land & Exploration Co. (S) | 5,300 | | 207,177 |
| XTO Energy, Inc. | 97,000 | | 3,998,340 |
| | | | 32,972,748 |
|
| |
| Pharmaceuticals (1.3%) | | | |
| Alpharma, Inc. Class A | 33,200 | | 777,544 |
| Endo Pharmaceuticals Holdings, Inc. † | 22,767 | | 667,984 |
| Enzon, Inc. † (S) | 21,277 | | 158,514 |
| King Pharmaceuticals, Inc. † | 198,767 | | 3,534,077 |
38
| COMMON STOCKS (99.5%)* continued | | | |
|
| | Shares | | Value |
|
| Pharmaceuticals continued | | | |
| Medicis Pharmaceutical Corp. Class A (S) | 26,100 | $ | 778,302 |
| Watson Pharmaceuticals, Inc. † | 110,783 | | 2,806,133 |
| | | | 8,722,554 |
|
| |
| Power Producers (0.8%) | | | |
| AES Corp. (The) † | 284,500 | | 5,234,800 |
|
| |
| Real Estate (2.4%) | | | |
| CBL & Associates Properties (R) | 112,498 | | 4,208,550 |
| CentraCore Properties Trust (R) | 7,800 | | 188,916 |
| Digital Realty Trust, Inc. (R) (S) | 4,501 | | 112,975 |
| Equity Inns, Inc. (R) | 156,915 | | 2,424,337 |
| FelCor Lodging Trust, Inc. (R) | 61,300 | | 1,275,653 |
| Hospitality Properties Trust (R) | 17,603 | | 742,319 |
| Innkeepers USA Trust (R) | 33,259 | | 516,180 |
| LTC Properties, Inc. (R) | 21,359 | | 469,044 |
| National Health Investors, Inc. (R) | 52,309 | | 1,399,789 |
| Nationwide Health Properties, Inc. (R) (S) | 48,266 | | 1,013,103 |
| National Retail Properties, Inc. (R) | 33,195 | | 640,664 |
| Novastar Financial, Inc. (R) (S) | 10,904 | | 343,258 |
| Omega Healthcare Investors, Inc. (R) | 44,343 | | 546,749 |
| RAIT Investment Trust (R) (S) | 55,048 | | 1,387,210 |
| Senior Housing Properties Trust (R) | 31,800 | | 547,278 |
| | | | 15,816,025 |
|
| |
| Regional Bells (—%) | | | |
| Cincinnati Bell, Inc. † (S) | 44,500 | | 173,105 |
|
| |
| Restaurants (0.3%) | | | |
| Denny’s Corp. † | 56,931 | | 261,883 |
| Domino’s Pizza, Inc. | 76,914 | | 1,821,324 |
| Luby’s, Inc. † | 16,556 | | 172,845 |
| | | | 2,256,052 |
|
| |
| Retail (6.2%) | | | |
| Bed Bath & Beyond, Inc. † (S) | 141,000 | | 4,958,970 |
| Blair Corp. | 1,194 | | 42,554 |
| Bon-Ton Stores, Inc. (The) (S) | 12,190 | | 322,060 |
| Borders Group, Inc. | 27,640 | | 573,806 |
| Buckle, Inc. (The) | 11,788 | | 488,259 |
| Cato Corp. (The) Class A (S) | 89,316 | | 2,106,964 |
| CSK Auto Corp. † | 15,257 | | 193,916 |
| Genesco, Inc. † | 4,997 | | 175,844 |
| Home Depot, Inc. (The) | 399,300 | | 15,221,316 |
| Ingles Markets, Inc. Class A | 4,825 | | 83,328 |
| Nash Finch Co. (S) | 4,641 | | 107,810 |
| Nu Skin Enterprises, Inc. Class A | 59,635 | | 1,023,337 |
| Payless ShoeSource, Inc. † | 78,506 | | 2,094,540 |
| Rent-A-Center, Inc. † (S) | 135,551 | | 3,223,403 |
39
| COMMON STOCKS (99.5%)* continued | | | |
|
| | Shares | | Value |
|
| Retail continued | | | |
| Supervalu, Inc. (S) | 152,704 | $ | 4,452,849 |
| Timberland Co. (The) Class A † | 140,792 | | 3,890,083 |
| Too, Inc. † | 53,765 | | 2,204,365 |
| Wilsons The Leather Experts, Inc. † | 8,091 | | 29,532 |
| | | | 41,192,936 |
|
| |
| Schools (0.8%) | | | |
| Career Education Corp. † | 124,248 | | 4,049,242 |
| Education Management Corp. † | 34,008 | | 1,460,644 |
| | | | 5,509,886 |
|
| |
| Semiconductor (0.3%) | | | |
| Advanced Energy Industries, Inc. † | 9,777 | | 137,856 |
| Lam Research Corp. † | 36,764 | | 1,646,660 |
| | | | 1,784,516 |
|
| |
| Shipping (0.2%) | | | |
| ABX Air, Inc. † | 24,331 | | 163,991 |
| Arkansas Best Corp. | 16,001 | | 659,401 |
| Maritrans, Inc. (S) | 8,860 | | 228,499 |
| | | | 1,051,891 |
|
| |
| Software (4.8%) | | | |
| Ansoft Corp. † | 10,940 | | 214,205 |
| Aspen Technology, Inc. † | 29,955 | | 350,474 |
| BMC Software, Inc. † (S) # | 265,753 | | 5,354,923 |
| Citrix Systems, Inc. † | 163,304 | | 6,136,964 |
| EPIQ Systems, Inc. † (S) | 7,598 | | 121,720 |
| Hyperion Solutions Corp. † | 79,044 | | 2,269,353 |
| Microsoft Corp. | 352,000 | | 7,972,800 |
| MicroStrategy, Inc. † (S) | 27,519 | | 2,597,243 |
| Oracle Corp. † | 403,100 | | 5,732,082 |
| SonicWall, Inc. † | 38,895 | | 327,885 |
| SPSS, Inc. † (S) | 11,288 | | 417,656 |
| Websense, Inc. † | 17,400 | | 385,410 |
| | | | 31,880,715 |
|
| |
| Technology Services (5.5%) | | | |
| Acxiom Corp. | 105,192 | | 2,480,427 |
| Digitas, Inc. † (S) | 29,900 | | 388,999 |
| eBay, Inc. † | 382,200 | | 12,539,982 |
| Google, Inc. Class A † | 24,700 | | 9,183,954 |
| MTS Systems Corp. | 2,600 | | 108,550 |
| United Online, Inc. (S) | 228,600 | | 2,724,912 |
| Yahoo!, Inc. † | 287,900 | | 9,094,761 |
| | | | 36,521,585 |
40
| COMMON STOCKS (99.5%)* continued | | | |
|
| | Shares | | Value |
|
| Telecommunications (1.3%) | | | |
| Brightpoint, Inc. † (S) | 3,685 | $ | 78,785 |
| Broadwing Corp. † (S) | 28,987 | | 330,452 |
| CenturyTel, Inc. (S) | 84,353 | | 3,015,620 |
| Commonwealth Telephone Enterprises, Inc. (S) | 11,032 | | 364,608 |
| Earthlink, Inc. † | 393,723 | | 3,279,705 |
| Premiere Global Services, Inc. † (S) | 143,440 | | 1,075,800 |
| Talk America Holdings, Inc. † (S) | 30,266 | | 236,075 |
| | | | 8,381,045 |
|
| |
| Textiles (0.8%) | | | |
| Columbia Sportswear Co. † (S) | 43,978 | | 2,081,479 |
| DHB Industries, Inc. † (F) | 115,357 | | 144,196 |
| Wolverine World Wide, Inc. (S) | 146,224 | | 3,354,379 |
| | | | 5,580,054 |
|
| |
| Toys (0.5%) | | | |
| Hasbro, Inc. | 137,738 | | 2,553,663 |
| Jakks Pacific, Inc. † | 23,566 | | 459,301 |
| | | | 3,012,964 |
|
| |
| Trucks & Parts (0.8%) | | | |
| Autoliv, Inc. (Sweden) | 99,940 | | 5,556,664 |
|
| Total common stocks (cost $622,994,308) | | $ | 656,451,235 |
|
| |
| SHORT-TERM INVESTMENTS (14.7%)* | | | |
|
| | Principal amount/shares | | Value |
|
| Short-term investments held as collateral for loaned | | | |
| securities with yields ranging from 4.90% to 5.19% and | | | |
| due dates ranging from June 1, 2006 to June 29, 2006 (d) | $91,142,738 | $ | 91,004,558 |
| Putnam Prime Money Market Fund (e) | 5,911,989 | | 5,911,989 |
|
| Total short-term investments (cost $96,916,547) | | $ | 96,916,547 |
|
| |
| TOTAL INVESTMENTS | | | |
| Total investments (cost $719,910,855) | | $ | 753,367,782 |
* Percentages indicated are based on net assets of $659,790,912.
† Non-income-producing security.
(S) Securities on loan, in part or in entirety, at May 31, 2006.
# A portion of this security was pledged and segregated with the custodian to cover margin requirements for futures contracts
at May 31, 2006.
(R) Real Estate Investment Trust.
(d) See Note 1 to the financial statements.
(e) See Note 5 to the financial statements regarding investments in Putnam Prime Money Market Fund.
(F) Security is valued at fair value following procedures approved by the Trustees.
At May 31, 2006, liquid assets totaling $3,201,316 have been designated as collateral for open futures contracts.
|
41
| FUTURES CONTRACTS OUTSTANDING at 5/31/06 | | | |
|
| | Number of | | Expiration | Unrealized |
| | contracts | Value | date | appreciation |
|
| |
| Russell 2000 Index Mini (Long) | 24 | $1,733,280 | Jun-06 | $ 7,713 |
| S&P Mid-Cap 400 E-Mini (Long) | 15 | 1,150,050 | Jun-06 | 5,748 |
| S&P 500 Index (Long) | 1 | 318,025 | Jun-06 | 108 |
|
| Total | | | | $13,569 |
The accompanying notes are an integral part of these financial statements.
42
| Statement of assets and liabilities 5/31/06 | |
|
| |
| ASSETS | |
| Investment in securities, at value, including $88,192,329 of securities on loan (Note 1): | |
| Unaffiliated issuers (identified cost $713,998,866) | $747,455,793 |
| Affiliated issuers (identified cost $5,911,989) (Note 5) | 5,911,989 |
|
| Cash | 101 |
|
| Dividends, interest and other receivables | 578,385 |
|
| Receivable for shares of the fund sold | 107,479 |
|
| Receivable for securities sold | 7,902,133 |
|
| Receivable for variation margin (Note 1) | 39,085 |
|
| Total assets | 761,994,965 |
|
| |
| LIABILITIES | |
| Payable for securities purchased | 7,834,466 |
|
| Payable for shares of the fund repurchased | 1,182,193 |
|
| Payable for compensation of Manager (Notes 2 and 5) | 1,084,063 |
|
| Payable for investor servicing and custodian fees (Note 2) | 358,258 |
|
| Payable for Trustee compensation and expenses (Note 2) | 191,072 |
|
| Payable for administrative services (Note 2) | 5,397 |
|
| Payable for distribution fees (Note 2) | 342,308 |
|
| Collateral on securities loaned, at value (Note 1) | 91,004,558 |
|
| Other accrued expenses | 201,738 |
|
| Total liabilities | 102,204,053 |
|
| Net assets | $659,790,912 |
|
| |
| REPRESENTED BY | |
| Paid-in capital (Unlimited shares authorized) (Notes 1 and 4) | $666,401,524 |
|
| Undistributed net investment income (Note 1) | 22,636 |
|
| Accumulated net realized loss on investments (Note 1) | (40,103,744) |
|
| Net unrealized appreciation of investments | 33,470,496 |
|
| Total — Representing net assets applicable to capital shares outstanding | $659,790,912 |
| |
| (Continued on next page) | |
43
Statement of assets and liabilities (Continued)
| COMPUTATION OF NET ASSET VALUE AND OFFERING PRICE | |
| Net asset value and redemption price per class A share | |
| ($514,930,728 divided by 24,989,289 shares) | $20.61 |
|
| Offering price per class A share | |
| Offering price per class A share (100/94.75 of $20.61)* | $21.75 |
|
| Net asset value and offering price per class B share | |
| ($120,192,116 divided by 6,196,081 shares)** | $19.40 |
|
| Net asset value and offering price per class C share | |
| ($3,716,755 divided by 187,654 shares)** | $19.81 |
|
| Net asset value and redemption price per class M share | |
| ($14,035,466 divided by 709,646 shares) | $19.78 |
|
| Offering price per class M share | |
| Offering price per class M share (100/96.75 of $19.78)* | $20.44 |
|
| Net asset value, offering price and redemption price per class R share | |
| ($64,238 divided by 3,136 shares) | $20.49 |
|
| Net asset value, offering price and redemption price per class Y share | |
| ($6,851,609 divided by 332,080 shares) | $20.63 |
* On single retail sales of less than $50,000. On sales of $50,000 or more and on group sales, the offering price is reduced.
** Redemption price per share is equal to net asset value less any applicable contingent deferred sales charge.
The accompanying notes are an integral part of these financial statements.
|
44
| Statement of operations Year ended 5/31/06 | |
|
| |
| INVESTMENT INCOME | |
| Dividends | $ 8,093,440 |
|
| Interest (including interest income of $293,711 | |
| from investments in affiliated issuers) (Note 5) | 293,759 |
|
| Securities lending | 358,288 |
|
| Total investment income | 8,745,487 |
|
| |
| EXPENSES | |
| Compensation of Manager (Note 2) | 4,398,978 |
|
| Investor servicing fees (Note 2) | 2,448,787 |
|
| Custodian fees (Note 2) | 219,444 |
|
| Trustee compensation and expenses (Note 2) | 50,490 |
|
| Administrative services (Note 2) | 26,796 |
|
| Distribution fees — Class A (Note 2) | 1,182,129 |
|
| Distribution fees — Class B (Note 2) | 2,125,015 |
|
| Distribution fees — Class C (Note 2) | 36,347 |
|
| Distribution fees — Class M (Note 2) | 117,514 |
|
| Distribution fees — Class R (Note 2) | 178 |
|
| Other | 228,114 |
|
| Non-recurring costs (Notes 2 and 6) | 8,375 |
|
| Costs assumed by Manager (Notes 2 and 6) | (8,375) |
|
| Fees waived and reimbursed by Manager or affiliate (Notes 5 and 6) | (230,673) |
|
| Total expenses | 10,603,119 |
|
| Expense reduction (Note 2) | (373,170) |
|
| Net expenses | 10,229,949 |
|
| Net investment income | (1,484,462) |
|
| Net realized gain on investments (Notes 1 and 3) | 75,544,668 |
|
| Net realized gain on swap contracts (Note 1) | 187,037 |
|
| Net realized gain on futures contracts (Note 1) | 850,060 |
|
| Net unrealized appreciation of investments | |
| and futures contracts during the year | 5,453,911 |
|
| Net gain on investments | 82,035,676 |
|
| Net increase in net assets resulting from operations | $80,551,214 |
The accompanying notes are an integral part of these financial statements.
45
| Statement of changes in net assets | | | | |
|
| |
| DECREASE IN NET ASSETS | | | | |
|
| | | Year ended | | Year ended |
| | | 5/31/06 | | 5/31/05 |
|
| Operations: | | | | |
| Net investment income (loss) | $ | (1,484,462) | $ | 2,021,903 |
|
| Net realized gain on investments | | 76,581,765 | | 105,223,829 |
|
| Net unrealized appreciation (depreciation) of investments | | 5,453,911 | | (28,617,402) |
|
| Net increase in net assets resulting from operations | | 80,551,214 | | 78,628,330 |
|
| Distributions to shareholders: (Note 1) | | | | |
|
| From net investment income | | | | |
|
| Class A | | (1,481,868) | | (415,329) |
|
| Class R | | (71) | | (17) |
|
| Class Y | | (24,045) | | — |
|
| Redemption fees (Note 1) | | 674 | | 3,247 |
|
| Decrease from capital share transactions (Note 4) | | (136,984,427) | | (147,783,445) |
|
| Total decrease in net assets | | (57,938,523) | | (69,567,214) |
|
| |
| NET ASSETS | | | | |
| Beginning of year | | 717,729,435 | | 787,296,649 |
|
| End of year (including undistributed net investment | | | | |
| income of $22,636 and $1,508,067, respectively) | $ | 659,790,912 | $ | 717,729,435 |
The accompanying notes are an integral part of these financial statements.
46
This page left blank intentionally.
47
Financial highlights (For a common share outstanding throughout the period)
|
| INVESTMENT OPERATIONS: | | | | LESS DISTRIBUTIONS: | | | | RATIOS AND SUPPLEMENTAL DATA: | |
|
| | | | Net | | | | | | Total | | | | Ratio of net | |
| | Net asset | | realized and | Total | From | | | Net asset | return | Net | Ratio of | | investment | |
| | value, | Net | unrealized | from | net | | | value, | at net | assets, | expenses to | | income (loss) | Portfolio |
| | beginning | investment | gain (loss) on | investment | investment | Total | Redemption | end | asset | end of period | average net | | to average | turnover |
| Period ended | of period | income (loss)(a) | investments | operations | income | distributions | fees | of period | value (%)(b) | (in thousands) | assets (%)(c) | net assets (%) | (%) |
|
| CLASS A | | | | | | | | | | | | | | |
| May 31, 2006 | $18.45 | .01(d,e) | 2.21 | 2.22 | (.06) | (.06) | —(g) | $20.61 | 12.06 | $514,931 | 1.26(d,e) | .04(d,e) | 94.76 |
| May 31, 2005 | 16.55 | .10(d,f ) | 1.82 | 1.92 | (.02) | (.02) | —(g) | 18.45 | 11.59 | 429,902 | 1.28(d) | .60(d,f ) | 121.26 |
| May 31, 2004 | 14.24 | (.01)(d) | 2.32 | 2.31 | — | — | — | 16.55 | 16.22 | 416,249 | 1.23(d) | (.07)(d) | 111.20 |
| May 31, 2003 | 15.89 | —(g) | (1.65) | (1.65) | — | — | — | 14.24 | (10.38) | 495,165 | 1.22 | | .01 | 107.08 |
| May 31, 2002 | 18.32 | —(g) | (2.43) | (2.43) | — | — | — | 15.89 | (13.26) | 697,394 | 1.08 | | .02 | 133.78 |
|
| |
| CLASS B | | | | | | | | | | | | | | |
| May 31, 2006 | $17.45 | (.15)(d,e) | 2.10 | 1.95 | — | — | —(g) | $19.40 | 11.18 | $120,192 | 2.01(d,e) | (.70)(d,e) | 94.76 |
| May 31, 2005 | 15.76 | (.02)(d,f ) | 1.71 | 1.69 | — | — | —(g) | 17.45 | 10.72 | 267,369 | 2.03(d) | (.14)(d,f ) | 121.26 |
| May 31, 2004 | 13.66 | (.12)(d) | 2.22 | 2.10 | — | — | — | 15.76 | 15.37 | 348,212 | 1.98(d) | (.82)(d) | 111.20 |
| May 31, 2003 | 15.35 | (.09) | (1.60) | (1.69) | — | — | — | 13.66 | (11.01) | 391,161 | 1.97 | | (.74) | 107.08 |
| May 31, 2002 | 17.84 | (.12) | (2.37) | (2.49) | — | — | — | 15.35 | (13.96) | 554,719 | 1.83 | | (.73) | 133.78 |
|
| |
| CLASS C | | | | | | | | | | | | | | |
| May 31, 2006 | $17.81 | (.14)(d,e) | 2.14 | 2.00 | — | — | —(g) | $19.81 | 11.23 | $3,717 | 2.01(d,e) | (.71)(d,e) | 94.76 |
| May 31, 2005 | 16.09 | (.03)(d,f ) | 1.75 | 1.72 | — | — | —(g) | 17.81 | 10.69 | 3,460 | 2.03(d) | (.15)(d,f ) | 121.26 |
| May 31, 2004 | 13.94 | (.12)(d) | 2.27 | 2.15 | — | — | — | 16.09 | 15.42 | 3,547 | 1.98(d) | (.83)(d) | 111.20 |
| May 31, 2003 | 15.67 | (.10) | (1.63) | (1.73) | — | — | — | 13.94 | (11.04) | 2,993 | 1.97 | | (.74) | 107.08 |
| May 31, 2002 | 18.21 | (.12) | (2.42) | (2.54) | — | — | — | 15.67 | (13.95) | 3,405 | 1.83 | | (.71) | 133.78 |
|
| |
| CLASS M | | | | | | | | | | | | | | |
| May 31, 2006 | $17.74 | (.09)(d,e) | 2.13 | 2.04 | — | — | —(g) | $19.78 | 11.50 | $14,035 | 1.76(d,e) | (.46)(d,e) | 94.76 |
| May 31, 2005 | 15.98 | .02(d,f ) | 1.74 | 1.76 | — | — | —(g) | 17.74 | 11.01 | 16,984 | 1.78(d) | .11(d,f) | 121.26 |
| May 31, 2004 | 13.82 | (.09)(d) | 2.25 | 2.16 | — | — | — | 15.98 | 15.63 | 19,280 | 1.73(d) | (.57)(d) | 111.20 |
| May 31, 2003 | 15.49 | (.06) | (1.61) | (1.67) | — | — | — | 13.82 | (10.78) | 24,702 | 1.72 | | (.49) | 107.08 |
| May 31, 2002 | 17.96 | (.08) | (2.39) | (2.47) | — | — | — | 15.49 | (13.75) | 38,646 | 1.58 | | (.48) | 133.78 |
|
| |
| CLASS R | | | | | | | | | | | | | | |
| May 31, 2006 | $18.38 | (.02)(d,e) | 2.18 | 2.16 | (.05) | (.05) | —(g) | $20.49 | 11.76 | $64 | 1.51(d,e) | (.24)(d,e) | 94.76 |
| May 31, 2005 | 16.54 | .07(d,f) | 1.80 | 1.87 | (.03) | (.03) | —(g) | 18.38 | 11.29 | 15 | 1.53(d) | .39(d,f) | 121.26 |
| December 1, 2003†- | | | | | | | | | | | | | | |
| May 31, 2004 | 15.82 | (.02)(d) | .74 | .72 | — | — | — | 16.54 | 4.55 | 8 | .74(d) | (.19)(d) | 111.20 |
|
| |
| CLASS Y | | | | | | | | | | | | | | |
| October 4, 2005†- | | | | | | | | | | | | | | |
| May 31, 2006 | $19.55 | .05(d,e) | 1.10 | 1.15 | (.07) | (.07) | —(g) | $20.63 | 5.90* | $6,852 | .66*(d,e) | .18*(d,e) | 94.76 |
|
See notes to financial highlights at the end of this section.
|
The accompanying notes are an integral part of these financial statements.
|
Financial highlights (Continued)
|
* Not annualized.
† Commencement of operations.
(a) Per share net investment income (loss) has been determined on the basis of the weighted average number of shares outstanding during the period.
(b) Total return assumes dividend reinvestment and does not reflect the effect of sales charges.
(c) Includes amounts paid through expense offset and brokerage service arrangements (Note 2).
(d) Reflects waivers of certain fund expenses in connection with investments in Putnam Prime Market Fund during the period. As a result of such waivers, the expenses of each class, as a percentage of its net assets, reflect a reduction of the following amounts (Note 5):
| | 5/31/06 | 5/31/05 | 5/31/04 |
|
| Class A | <0.01% | <0.01 | <0.01 |
|
| Class B | <0.01% | <0.01 | <0.01 |
|
| Class C | <0.01% | <0.01 | <0.01 |
|
| Class M | <0.01% | <0.01 | <0.01 |
|
| Class R | <0.01% | <0.01 | <0.01 |
|
| Class Y | <0.01% | N/A | N/A |
|
(e) Reflects a non-recurring accrual related to a reimbursement to the fund from Putnam Investments relating to the calculation of certain amounts paid by the fund to Putnam in previous years for transfer agent services, which amounted to less than $0.01 per share and 0.03% of average net assets for the period ended May 31, 2006 (Note 6).
(f) Reflects a non-recurring accrual related to Putnam Management’s settlement with the SEC regarding brokerage allocation practices, which amounted to the following amounts (Note 6):
| | | Percentage of |
| | Per share | net assets |
|
| Class A | $0.03 | 0.14% |
|
| Class B | 0.02 | 0.12 |
|
| Class C | 0.02 | 0.14 |
|
| Class M | 0.02 | 0.13 |
|
| Class R | 0.03 | 0.18 |
|
| Class Y | N/A | N/A |
|
(g) Amount represents less than $0.01 per share.
The accompanying notes are an integral part of these financial statements.
|
50
Notes to financial statements 5/31/06
Note 1: Significant accounting policies
Putnam Capital Appreciation Fund (the “fund”) is registered under the Investment Company Act of 1940, as amended, as a diversified open-end management investment company. The fund seeks capital appreciation by investing primarily in common stocks that offer potential for capital appreciation. Current income is only an incidental consideration in selecting investments for the fund.
The fund offers class A, class B, class C, class M, class R and class Y shares. The fund began offering class Y shares on October 4, 2005. Class A and class M shares are sold with a maximum front-end sales charge of 5.25% and 3.25%, respectively, and generally do not pay a contingent deferred sales charge. Class B shares, which convert to class A shares after approximately eight years, do not pay a front-end sales charge and are subject to a contingent deferred sales charge, if those shares are redeemed within six years of purchase. Class C shares have a one-year 1.00% contingent deferred sales charge and do not convert to class A shares. Class R shares, which are offered to qualified employee-benefit plans are sold without a front-end sales charge or a contingent deferred sales charge. The expenses for class A, class B, class C, class M and class R shares may differ based on the distribution fee of each class, which is identified in Note 2. Class Y shares, which are sold at net asset value, are generally subject to the same expenses as class A, class B, class C, class M and class R shares, but do not bear a distribution fee. Class Y shares are sold to certain eligible purchasers including certain defined contribution plans (including corporate IRAs), bank trust departments and trust companies.
A 2.00% redemption fee may apply to any shares that are redeemed (either by selling or exchanging into another fund) within 5 days of purchase. The redemption fee is accounted for as an addition to paid-in-capital.
Investment income, realized and unrealized gains and losses and expenses of the fund are borne pro-rata based on the relative net assets of each class to the total net assets of the fund, except that each class bears expenses unique to that class (including the distribution fees applicable to such classes). Each class votes as a class only with respect to its own distribution plan or other matters on which a class vote is required by law or determined by the Trustees. Shares of each class would receive their pro-rata share of the net assets of the fund, if the fund were liquidated. In addition, the Trustees declare separate dividends on each class of shares.
In the normal course of business, the fund enters into contracts that may include agreements to indemnify another party under given circumstances. The fund’s maximum exposure under these arrangements is unknown as this would involve future claims that may be, but have not yet been, made against the fund. However, the fund expects the risk of material loss to be remote.
The following is a summary of significant accounting policies consistently followed by the fund in the preparation of its financial statements. The preparation of financial statements is in conformity with accounting principles generally accepted in the United States of America and requires management to make estimates and assumptions that affect the reported amounts of assets and liabilities in the financial statements and the reported amounts of increases and decreases in net assets from operations during the reporting period. Actual results could differ from those estimates.
A) Security valuation Investments for which market quotations are readily available are valued at the last reported sales price on their principal exchange, or official closing price for certain markets. If no sales are reported — as in the case of some securities traded over-the-counter — a security is valued at its last reported bid price. Many securities markets and exchanges outside the U.S. close prior to the close of the New York Stock Exchange and therefore the closing prices for securities in such markets or on such exchanges may not fully reflect events that occur
51
after such close but before the close of the New York Stock Exchange. Accordingly, on certain days, the fund will fair value foreign equity securities taking into account multiple factors, including movements in the U.S. securities markets. The number of days on which fair value prices will be used will depend on market activity and it is possible that fair value prices will be used by the fund to a significant extent. Securities quoted in foreign currencies, if any, are translated into U.S. dollars at the current exchange rate. Other investments, including certain restricted securities, are valued at fair value following procedures approved by the Trustees. Such valuations and procedures are reviewed periodically by the Trustees.
B) Joint trading account Pursuant to an exemptive order from the Securities and Exchange Commission, the fund may transfer uninvested cash balances, including cash collateral received under security lending arrangements, into a joint trading account along with the cash of other registered investment companies and certain other accounts managed by Putnam Investment Management, LLC (“Putnam Management”), the fund’s manager, an indirect wholly-owned subsidiary of Putnam, LLC. These balances may be invested in issues of high-grade short-term investments having maturities of up to 397 days for collateral received under security lending arrangements and up to 90 days for other cash investments.
C) Security transactions and related investment income Security transactions are recorded on the trade date (the date the order to buy or sell is executed). Gains or losses on securities sold are determined on the identified cost basis. Interest income is recorded on the accrual basis. Dividend income, net of applicable withholding taxes, is recognized on the ex-dividend date except that certain dividends from foreign securities, if any, are recognized as soon as the fund is informed of the ex-dividend date. Non-cash dividends, if any, are recorded at the fair market value of the securities received.
D) Futures and options contracts The fund may use futures and options contracts to hedge against changes in the values of securities the fund owns or expects to purchase, or for other investment purposes. The fund may also write options on swaps or securities it owns or in which it may invest to increase its current returns.
The potential risk to the fund is that the change in value of futures and options contracts may not correspond to the change in value of the hedged instruments. In addition, losses may arise from changes in the value of the underlying instruments, if there is an illiquid secondary market for the contracts, or if the counterparty to the contract is unable to perform. Risks may exceed amounts recognized on the statement of assets and liabilities. When the contract is closed, the fund records a realized gain or loss equal to the difference between the value of the contract at the time it was opened and the value at the time it was closed. Realized gains and losses on purchased options are included in realized gains and losses on investment securities. If a written call option is exercised, the premium originally received is recorded as an addition to sales proceeds. If a written put option is exercised, the premium originally received is recorded as a reduction to the cost of investments.
Futures contracts are valued at the quoted daily settlement prices established by the exchange on which they trade. The fund and the broker agree to exchange an amount of cash equal to the daily fluctuation in the value of the futures contract. Such receipts or payments are known as “variation margin.” Exchange traded options are valued at the last sale price or, if no sales are reported, the last bid price for purchased options and the last ask price for written options. Options traded over-the-counter are valued using prices supplied by dealers. Futures and written option contracts outstanding at period end, if any, are listed after the fund’s portfolio.
E) Total return swap contracts The fund may enter into total return swap contracts, which are arrangements to exchange a market linked return for a periodic payment, both based on a notional principal amount. To the extent that the total return
52
of the security, index or other financial measure underlying the transaction exceeds or falls short of the offsetting interest rate obligation, the fund will receive a payment from or make a payment to the counterparty. Total return swap contracts are marked to market daily based upon quotations from market makers and the change, if any, is recorded as unrealized gain or loss. Payments received or made are recorded as realized gains or loss. The fund could be exposed to credit or market risk due to unfavorable changes in the fluctuation of interest rates or in the price of the underlying security or index, the possibility that there is no liquid market for these agreements or that the counterparty may default on its obligation to perform. Risk of loss may exceed amounts recognized on the statement of assets and liabilities. Total return swap contracts outstanding at period end, if any, are listed after the fund’s portfolio.
F) Security lending The fund may lend securities, through its agents, to qualified borrowers in order to earn additional income. The loans are collateralized by cash and/or securities in an amount at least equal to the market value of the securities loaned. The market value of securities loaned is determined daily and any additional required collateral is allocated to the fund on the next business day. The risk of borrower default will be borne by the fund’s agents; the fund will bear the risk of loss with respect to the investment of the cash collateral. Income from securities lending is included in investment income on the statement of operations. At May 31, 2006, the value of securities loaned amounted to $88,192,329. The fund received cash collateral of $91,004,558 which is pooled with collateral of other Putnam funds into 27 issues of high grade short-term investments.
G) Federal taxes It is the policy of the fund to distribute all of its taxable income within the prescribed time and otherwise comply with the provisions of the Internal Revenue Code of 1986 (the “Code”) applicable to regulated investment companies. It is also the intention of the fund to distribute an amount sufficient to avoid imposition of any excise tax under Section 4982 of the Code, as amended. Therefore, no provision has been made for federal taxes on income, capital gains or unrealized appreciation on securities held nor for excise tax on income and capital gains.
At May 31, 2006, the fund had a capital loss carryover of $39,969,426 available to the extent allowed by the Code to offset future net capital gain, if any. This capital loss carryover will expire on May 31, 2011.
H) Distributions to shareholders Distributions to shareholders from net investment income are recorded by the fund on the ex-dividend date. Distributions from capital gains, if any, are recorded on the ex-dividend date and paid at least annually. The amount and character of income and gains to be distributed are determined in accordance with income tax regulations, which may differ from generally accepted accounting principles. These differences include temporary and permanent differences due to nontaxable dividends and net operating losses. Reclassifications are made to the fund’s capital accounts to reflect income and gains available for distribution (or available capital loss carryovers) under income tax regulations. For the year ended May 31, 2006, the fund reclassified $1,505,015 to increase undistributed net investment income and $1,717,262 to decrease paid-in-capital, with a decrease to accumulated net realized losses of $212,247.
The tax basis components of distributable earnings and the federal tax cost as of period end May 31, 2006 were as follows:
| Unrealized appreciation | $ 79,332,455 |
| Unrealized depreciation | (45,973,641) |
| | ———————————— |
| Net unrealized appreciation | 33,358,814 |
| Capital loss carryforward | (39,969,426) |
| Cost for federal income | |
| tax purposes | $720,008,968 |
Note 2: Management fee, administrative services and other transactions
Putnam Management is paid for management and investment advisory services quarterly based on the average net assets of the fund. Such fee is
53
based on the following annual rates: 0.65% of the first $500 million of average net assets, 0.55% of the next $500 million, 0.50% of the next $500 million, 0.45% of the next $5 billion, 0.425% of the next $5 billion, 0.405% of the next $5 billion, 0.39% of the next $5 billion and 0.38% thereafter.
Putnam Management has agreed to waive fees and reimburse expenses of the fund through May 31, 2007 to the extent necessary to ensure that the fund’s expenses do not exceed the simple average of the expenses of all front-end load funds viewed by Lipper Inc. as having the same investment classification or objective as the fund. The expense reimbursement is based on a comparison of the fund’s expenses with the average annualized operating expenses of the funds in its Lipper peer group for each calendar quarter during the fund’s last fiscal year, excluding 12b-1 fees and without giving effect to any expense offset and brokerage service arrangements that may reduce fund expenses. For the year ended May 31, 2006 Putnam Management did not waive any of its management fee from the fund.
For the year ended May 31, 2006, Putnam Management has assumed $8,375 of legal, shareholder servicing and communication, audit and Trustee fees incurred by the fund in connection with certain legal and regulatory matters (including those described in Note 6).
The fund reimburses Putnam Management an allocated amount for the compensation and related expenses of certain officers of the fund and their staff who provide administrative services to the fund. The aggregate amount of all such reimbursements is determined annually by the Trustees.
Custodial functions for the fund’s assets are provided by Putnam Fiduciary Trust Company (“PFTC”), a subsidiary of Putnam, LLC. PFTC receives fees for custody services based on the fund’s asset level, the number of its security holdings and transaction volumes. Putnam Investor Services, a division of PFTC, provides investor servicing agent functions to the fund. Putnam Investor Services receives fees for investor servicing based on the number of shareholder accounts in the fund and the level of defined contribution plan assets in the fund. During the year ended May 31, 2006, the fund incurred $2,668,231 for these services.
The fund has entered into an arrangement with PFTC whereby credits realized as a result of uninvested cash balances are used to reduce a portion of the fund’s expenses. The fund also reduced expenses through brokerage service arrangements. For the year ended, May 31, 2006, the fund’s expenses were reduced by $373,170 under these arrangements.
Each independent Trustee of the fund receives an annual Trustee fee, of which $372, as a quarterly retainer, has been allocated to the fund, and an additional fee for each Trustees meeting attended. Trustees receive additional fees for attendance at certain committee meetings, industry seminars and for certain compliance-related matters. Trustees also are reimbursed for expenses they incur relating to their services as Trustees. George Putnam, III, who is not an independent Trustee, also receives the foregoing fees for his services as Trustee.
The fund has adopted a Trustee Fee Deferral Plan (the “Deferral Plan”) which allows the Trustees to defer the receipt of all or a portion of Trustees fees payable on or after July 1, 1995. The deferred fees remain invested in certain Putnam funds until distribution in accordance with the Deferral Plan.
The fund has adopted an unfunded noncontributory defined benefit pension plan (the “Pension Plan”) covering all Trustees of the fund who have served as a Trustee for at least five years and were first elected prior to 2004. Benefits under the Pension Plan are equal to 50% of the Trustee’s average annual attendance and retainer fees for the three years ended December 31, 2005. Pension expense for the fund is included in Trustee compensation and expenses in the statement of operations. Accrued pension liability is included in Payable for Trustee compensation and expenses in the statement of assets and liabilities. The Trustees
54
have terminated the Pension Plan with respect to any Trustee first elected after 2003.
The fund has adopted distribution plans (the “Plans”) with respect to its class A, class B, class C, class M and class R shares pursuant to Rule 12b-1 under the Investment Company Act of 1940. The purpose of the Plans is to compensate Putnam Retail Management, a wholly-owned subsidiary of Putnam, LLC and Putnam Retail Management GP, Inc., for services provided and expenses incurred in distributing shares of the fund. The Plans provide for payments by the fund to Putnam Retail Management at an annual rate of up to 0.35%, 1.00%, 1.00%, 1.00% and 1.00% of the average net assets attributable to class A, class B, class C, class M and class R shares, respectively. The Trustees have approved payment by the fund at an annual rate of 0.25%, 1.00%, 1.00%, 0.75% and 0.50% of the average net assets attributable to class A, class B, class C, class M and class R shares, respectively.
For the year ended May 31, 2006, Putnam Retail Management, acting as underwriter, received net commissions of $25,723 and $826 from the sale of class A and class M shares, respectively, and received $150,609 and $148 in contingent deferred sales charges from redemptions of class B and class C shares, respectively.
Note 3: Purchases and sales of securities
During the year ended May 31, 2006, cost of purchases and proceeds from sales of investment securities other than short-term investments aggregated $663,106,637 and $788,318,895, respectively. There were no purchases or sales of U.S. government securities.
Note 4: Capital shares
At May 31, 2006, there was an unlimited number of shares of beneficial interest authorized. Transactions in capital shares were as follows:
| CLASS A | Shares | | Amount |
|
| Year ended 5/31/06: | | | |
| Shares sold | 8,315,822 | | $ 168,768,973 |
|
| Shares issued | | | |
| in connection | | | |
| with reinvestment | | | |
| of distributions | 67,778 | | 1,379,969 |
|
| | 8,383,600 | | 170,148,942 |
|
| Shares | | | |
| repurchased | (6,694,169) | | (134,409,425) |
|
| Net increase | 1,689,431 | $ | 35,739,517 |
| |
| Year ended 5/31/05: | | | |
| Shares sold | 4,775,978 | $ | 84,506,446 |
|
| Shares issued | | | |
| in connection | | | |
| with reinvestment | | | |
| of distributions | 21,827 | | 398,551 |
|
| | 4,797,805 | | 84,904,997 |
|
| Shares | | | |
| repurchased | (6,642,953) | | (115,348,347) |
|
| Net decrease | (1,845,148) | | $ (30,443,350) |
|
| |
| CLASS B | Shares | | Amount |
|
| Year ended 5/31/06: | | | |
| Shares sold | 667,710 | $ | 12,688,273 |
|
| Shares issued | | | |
| in connection | | | |
| with reinvestment | | | |
| of distributions | — | | — |
|
| | 667,710 | | 12,688,273 |
|
| Shares | | | |
| repurchased | (9,797,097) | | (187,046,714) |
|
| Net decrease | (9,129,387) | | $(174,358,441) |
| |
| Year ended 5/31/05: | | | |
| Shares sold | 1,103,114 | $ | 18,233,282 |
|
| Shares issued | | | |
| in connection | | | |
| with reinvestment | | | |
| of distributions | — | | — |
|
| | 1,103,114 | | 18,233,282 |
|
| Shares | | | |
| repurchased | (7,879,069) | | (130,993,276) |
|
| Net decrease | (6,775,955) | | $(112,759,994) |
55
| CLASS C | Shares | | Amount |
|
| Year ended 5/31/06: | | | |
| Shares sold | 40,525 | $ | 788,899 |
|
| Shares issued | | | |
| in connection | | | |
| with reinvestment | | | |
| of distributions | — | | — |
|
| | 40,525 | | 788,899 |
|
| Shares | | | |
| repurchased | (47,122) | | (904,331) |
|
| Net decrease | (6,597) | $ | (115,432) |
| |
| Year ended 5/31/05: | | | |
| Shares sold | 55,032 | $ | 923,741 |
|
| Shares issued | | | |
| in connection | | | |
| with reinvestment | | | |
| of distributions | — | | — |
|
| | 55,032 | | 923,741 |
|
| Shares | | | |
| repurchased | (81,293) | | (1,352,168) |
|
| Net decrease | (26,261) | $ | (428,427) |
|
| |
| CLASS M | Shares | | Amount |
|
| Year ended 5/31/06: | | | |
| Shares sold | 43,494 | $ | 841,301 |
|
| Shares issued | | | |
| in connection | | | |
| with reinvestment | | | |
| of distributions | — | | — |
|
| | 43,494 | | 841,301 |
|
| Shares | | | |
| repurchased | (291,103) | | (5,575,560) |
|
| Net decrease | (247,609) | | $(4,734,259) |
| |
| Year ended 5/31/05: | | | |
| Shares sold | 89,908 | | $ 1,496,168 |
|
| Shares issued | | | |
| in connection | | | |
| with reinvestment | | | |
| of distributions | — | | — |
|
| | 89,908 | | 1,496,168 |
|
| Shares | | | |
| repurchased | (339,015) | | (5,653,378) |
|
| Net decrease | (249,107) | | $(4,157,210) |
| CLASS R | Shares | Amount |
|
| Year ended 5/31/06: | | |
| Shares sold | 2,629 | $53,655 |
|
| Shares issued | | |
| in connection | | |
| with reinvestment | | |
| of distributions | 3 | 67 |
|
| | 2,632 | 53,722 |
|
| Shares | | |
| repurchased | (318) | (6,578) |
|
| Net increase | 2,314 | $47,144 |
| |
| Year ended 5/31/05: | | |
| Shares sold | 530 | $ 8,996 |
|
| Shares issued | | |
| in connection | | |
| with reinvestment | | |
| of distributions | 1 | 17 |
|
| | 531 | 9,013 |
|
| Shares | | |
| repurchased | (208) | (3,477) |
|
| Net increase | 323 | $ 5,536 |
|
| |
| CLASS Y | Shares | Amount |
|
| For the period 10/4/05 (commencement | |
| of operations) to 5/31/06: | | |
| Shares sold | 397,923 | $ 7,778,644 |
|
| Shares issued | | |
| in connection | | |
| with reinvestment | | |
| of distributions | 1,181 | 24,045 |
|
| | 399,104 | 7,802,689 |
|
| Shares | | |
| repurchased | (67,024) | (1,365,645) |
|
| Net increase | 332,080 | $ 6,437,044 |
Note 5: Investment in Putnam Prime Money Market Fund
Pursuant to an exemptive order from the Securities and Exchange Commission, the fund invests in Putnam Prime Money Market Fund, an open-end management investment company managed by Putnam Management. Management fees paid by the fund are reduced by an amount
equal to the management and administrative services fees paid by Putnam Prime Money Market Fund with respect to assets invested by the fund in Putnam Prime Money Market Fund. For the year ended May 31, 2006, management fees paid were reduced by $10,145 relating to the fund’s investment in Putnam Prime Money Market Fund. Income distributions earned by the fund are recorded as income in the statement of operations and totaled $293,711 for the year ended May 31, 2006. During the year ended May 31, 2006, cost of purchases and cost of sales of investments in Putnam Prime Money Market Fund aggregated $197,884,417 and $200,741,092, respectively.
Note 6: Regulatory matters and litigation
Putnam Management has entered into agreements with the Securities and Exchange Commission and the Massachusetts Securities Division settling charges connected with excessive short-term trading by Putnam employees and, in the case of the charges brought by the Massachusetts Securities Division, by participants in some Putnam-administered 401(k) plans. Pursuant to these settlement agreements, Putnam Management will pay a total of $193.5 million in penalties and restitution, with $153.5 million being paid to certain open-end funds and their shareholders. The amount will be allocated to shareholders and funds pursuant to a plan developed by an independent consultant, and will be paid following approval of the plan by the SEC and the Massachusetts Securities Division.
The Securities and Exchange Commission’s and Massachusetts Securities Division’s allegations and related matters also serve as the general basis for numerous lawsuits, including purported class action lawsuits filed against Putnam Management and certain related parties, including certain Putnam funds. Putnam Management will bear any costs incurred by Putnam funds in connection with these lawsuits. Putnam Management believes that the likelihood that the pending private lawsuits and purported class action lawsuits will have a material adverse financial impact on the fund is remote, and the pending actions are not likely to materially affect its ability to provide investment management services to its clients, including the Putnam funds.
Pursuant to a settlement with the Securities and Exchange Commission relating to Putnam Management’s brokerage allocation practices, on October 13, 2005 the fund received $997,890 in proceeds paid by Putnam Management. The fund had accrued a receivable for this amount in the prior fiscal year.
In March 2006, the fund received $220,528 from Putnam to address issues relating to the calculation of certain amounts paid by the Putnam mutual funds to Putnam for transfer agent services. This amount is included in Fees waived and reimbursed by Manager or affiliate on the Statement of operations. Review of this matter is ongoing and the amount received by the fund may be adjusted in the future. Such adjustment is not expected to be material.
Putnam Management and Putnam Retail Management are named as defendants in a civil suit in which the plaintiffs allege that the management and distribution fees paid by certain Putnam funds were excessive and seek recovery under the Investment Company Act of 1940. Putnam Management and Putnam Retail Management have contested the plaintiffs’ claims and the matter is currently pending in the U.S. District Court for the District of Massachusetts. Based on currently available information, Putnam Management believes that this action is without merit and that it is unlikely to have a material effect on Putnam Management’s and Putnam Retail Management’s ability to provide services to their clients, including the fund.
57
Federal tax information
(Unaudited)
|
The Form 1099 you receive in January 2007 will show the tax status of all distributions paid to your account in calendar 2006.
58
Brokerage commissions
(Unaudited)
|
Brokerage commissions are paid to firms that execute trades on behalf of your fund. When choosing these firms, Putnam is required by law to seek the best execution of the trades, taking all relevant factors into consideration, including expected quality of execution and commission rate. Listed below are the largest relationships based upon brokerage commissions for your fund and the other funds in Putnam’s U.S. Core group for the year ended May 31, 2006. The other Putnam mutual funds in this group are Putnam Investors Fund, Putnam Tax Smart Equity Fund, Putnam VT Capital Appreciation Fund, and Putnam VT Investors Fund.
The top five firms that received brokerage commissions for trades executed for the U.S. Core group are (in descending order) Goldman Sachs, Lehman Brothers, Citigroup Global Markets, Deutsche Bank Securities, and Credit Suisse First Boston. Commissions paid to these firms together represented approximately 46% of the total brokerage commissions paid for the year ended May 31, 2006.
Commissions paid to the next 10 firms together represented approximately 35% of the total brokerage commissions paid during the period. These firms are (in alphabetical order) Bank of America, Bear Stearns & Company, JP Morgan Clearing, Lazard Freres & Co., Merrill Lynch, Morgan Stanley Dean Witter, RBC Capital Markets, Sanford Bernstein, UBS Warburg, and Wachovia Securities.
Additional information about brokerage commissions is available on the Securities and Exchange Commission (SEC) Web site at www.sec.gov. Putnam funds disclose commissions by firm to the SEC in semiannual filings on Form N-SAR.
59
Jameson A. Baxter (Born 1943), Trustee since 1994, Vice Chairman since 2005
Ms. Baxter is the President of Baxter Associates, Inc., a private investment firm that she founded in 1986.
Ms. Baxter serves as a Director of ASHTA Chemicals, Inc., Banta Corporation (a printing and digital imaging firm), Ryerson Tull, Inc. (a steel service corporation), the Mutual Fund Directors Forum, Advocate Health Care and BoardSource, formerly the National Center for Nonprofit Boards. She is Chairman Emeritus of the Board of Trustees, Mount Holyoke College, having served as Chairman for five years and as a board member for thirteen years. Until 2002, Ms. Baxter was a Director of Intermatic Corporation (a manufacturer of energy control products).
Ms. Baxter has held various positions in investment banking and corporate finance, including Vice President and Principal of the Regency Group, and Vice President of and Consultant to First Boston Corporation. She is a graduate of Mount Holyoke College.
Charles B. Curtis (Born 1940), Trustee since 2001
Mr. Curtis is President and Chief Operating Officer of the Nuclear Threat Initiative (a private foundation dealing with national security issues) and serves as Senior Advisor to the United Nations Foundation.
Mr. Curtis is a member of the Council on Foreign Relations and the Trustee Advisory Council of the Applied Physics Laboratory, Johns Hopkins University. Until 2003, Mr. Curtis was a member of the Electric Power Research Institute Advisory Council and the University of Chicago Board of Governors for Argonne National Laboratory. Prior to 2002, Mr. Curtis was a Member of the Board of Directors of the Gas Technology Institute and the Board of Directors of the Environment and Natural Resources Program Steering Committee, John F. Kennedy School of Government, Harvard University. Until 2001, Mr. Curtis was a member of the Department of Defense Policy Board and Director of EG&G Technical Services, Inc. (a fossil energy research and development support company).
From August 1997 to December 1999, Mr. Curtis was a Partner at Hogan & Hartson L.L.P., a Washington, D.C. law firm. Prior to May 1997, Mr. Curtis was Deputy Secretary of Energy and Under Secretary of the U.S. Department of Energy. He served as Chairman of the Federal Energy Regulatory Commission from 1977 to 1981 and has held positions on the staff of the U.S. House of Representatives, the U.S. Treasury Department, and the SEC.
60
Myra R. Drucker (Born 1948), Trustee since 2004
Ms. Drucker is a Vice Chair of the Board of Trustees of Sarah Lawrence College, Vice Chair of the Board of Trustees of the Commonfund (a not-for-profit firm specializing in asset management for educational endowments and foundations) and a member of the Investment Committee of the Kresge Foundation (a charitable trust).
Ms. Drucker is an ex-officio member of the New York Stock Exchange (NYSE) Pension Managers Advisory Committee, having served as Chair for seven years and a member of the Executive Committee of the Committee on Investment of Employee Benefit Assets. She is Chair of the Advisory Board of Hamilton Lane Advisors (an investment management firm) and a member of the Advisory Board of RCM (an investment management firm). Until August 31, 2004, Ms. Drucker was Managing Director and a member of the Board of Directors of General Motors Asset Management and Chief Investment Officer of General Motors Trust Bank. Ms. Drucker also served as a member of the NYSE Corporate Accountability and Listing Standards Committee and the NYSE/NASD IPO Advisory Committee.
Prior to joining General Motors Asset Management in 2001, Ms. Drucker held various executive positions in the investment management industry. Ms. Drucker served as Chief Investment Officer of Xerox Corporation (a technology and service company in the document industry), where she was responsible for the investment of the company’s pension assets. Ms. Drucker was also Staff Vice President and Director of Trust Investments for International Paper (a paper, paper distribution, packaging and forest products company) and previously served as Manager of Trust Investments for Xerox Corporation. Ms. Drucker received a B.A. degree in Literature and Psychology from Sarah Lawrence College and pursued graduate studies in economics, statistics and portfolio theory at Temple University.
John A. Hill (Born 1942), Trustee since 1985 and Chairman since 2000
Mr. Hill is Vice Chairman of First Reserve Corporation, a private equity buyout firm that specializes in energy investments in the diversified worldwide energy industry.
Mr. Hill is a Director of Devon Energy Corporation, TransMontaigne Oil Company and various private companies controlled by First Reserve Corporation, as well as Chairman of TH Lee, Putnam Investment Trust (a closed-end investment company advised by an affiliate of Putnam Management). He is also a Trustee of Sarah Lawrence College. Until 2005, he was a Director of Continuum Health Partners of New York.
Prior to acquiring First Reserve Corporation in 1983, Mr. Hill held executive positions in investment banking and investment management with several firms and with the federal government, including Deputy Associate Director of the Office of Management and Budget and Deputy
61
Director of the Federal Energy Administration. He is active in various business associations, including the Economic Club of New York, and lectures on energy issues in the United States and Europe. Mr. Hill holds a B.A. degree in Economics from Southern Methodist University and pursued graduate studies there as a Woodrow Wilson Fellow.
Paul L. Joskow (Born 1947), Trustee since 1997
|
Dr. Joskow is the Elizabeth and James Killian Professor of Economics and Management, and Director of the Center for Energy and Environmental Policy Research at the Massachusetts Institute of Technology.
Dr. Joskow serves as a Director of National Grid plc (a UK-based holding company with interests in electric and gas transmission and distribution and telecommunications infrastructure) and TransCanada Corporation (an energy company focused on natural gas transmission and power services). He also serves on the Board of Overseers of the Boston Symphony Orchestra. Prior to February 2005, he served on the board of the Whitehead Institute for Biomedical Research (a non-profit research institution) and has been President of the Yale University Council since 1993. Prior to February 2002, he was a Director of State Farm Indemnity Company (an automobile insurance company), and, prior to March 2000, he was a Director of New England Electric System (a public utility holding company).
Dr. Joskow has published five books and numerous articles on topics in industrial organization, government regulation of industry, and competition policy. He is active in industry restructuring, environmental, energy, competition and privatization policies — serving as an advisor to governments and corporations worldwide. Dr. Joskow holds a Ph.D. and M. Phil from Yale University and a B.A. from Cornell University.
Elizabeth T. Kennan (Born 1938), Trustee since 1992
Dr. Kennan is a Partner of Cambus-Kenneth Farm (thoroughbred horse and cattle breeding). She is President Emeritus of Mount Holyoke College.
Dr. Kennan served as Chairman and is now Lead Director of Northeast Utilities. Until 2005, she was a Director of Talbots, Inc. She has served as Director on a number of other boards, including Bell Atlantic, Chastain Real Estate, Shawmut Bank, Berkshire Life Insurance and Kentucky Home Life Insurance. She is a Trustee of the National Trust for Historic Preservation, of Centre College and of Midway College in Midway, Kentucky. Until 2006, she was a member of The Trustees of Reservations. Dr. Kennan has served on the oversight committee of the Folger Shakespeare Library, as President of Five Colleges Incorporated, as a Trustee of Notre Dame University and is active in various educational and civic associations.
62
As a member of the faculty of Catholic University for twelve years, until 1978, Dr. Kennan directed the post-doctoral program in Patristic and Medieval Studies, taught history and published numerous articles. Dr. Kennan holds a Ph.D. from the University of Washington in Seattle, an M.S. from St. Hilda’s College at Oxford University and an A.B. from Mount Holyoke College. She holds several honorary doctorates.
Robert E. Patterson (Born 1945), Trustee since 1984
Mr. Patterson is Senior Partner of Cabot Properties, L.P. and Chairman of Cabot Properties, Inc. (a private equity firm investing in commercial real estate).
Mr. Patterson serves as Chairman Emeritus and Trustee of the Joslin Diabetes Center and as a Director of Brandywine Trust Group, LLC. Prior to June 2003, he was a Trustee of Sea Education Association. Prior to December 2001, he was President and Trustee of Cabot Industrial Trust (a publicly traded real estate investment trust). Prior to February 1998, he was Executive Vice President and Director of Acquisitions of Cabot Partners Limited Partnership (a registered investment adviser involved in institutional real estate investments). Prior to 1990, he served as Executive Vice President of Cabot, Cabot & Forbes Realty Advisors, Inc. (the predecessor company of Cabot Partners).
Mr. Patterson practiced law and held various positions in state government and was the founding Executive Director of the Massachusetts Industrial Finance Agency. Mr. Patterson is a graduate of Harvard College and Harvard Law School.
W. Thomas Stephens (Born 1942), Trustee since 1997
Mr. Stephens is Chairman and Chief Executive Officer of Boise Cascade, L.L.C. (a paper, forest products and timberland assets company).
Until 2005, Mr. Stephens was a director of TransCanadaPipelines, Ltd. Until 2004, Mr. Stephens was a Director of Xcel Energy Incorporated (a public utility company), Qwest Communications, and Norske Canada, Inc. (a paper manufacturer). Until 2003, Mr. Stephens was a Director of Mail-Well, Inc. (a diversified printing company). He served as Chairman of Mail-Well until 2001 and as CEO of MacMillan-Bloedel, Ltd. (a forest products company) until 1999.
Prior to 1996, Mr. Stephens was Chairman and Chief Executive Officer of Johns Manville Corporation. He holds B.S. and M.S. degrees from the University of Arkansas.
63
Richard B. Worley (Born 1945), Trustee since 2004
Mr. Worley is Managing Partner of Permit Capital LLC, an investment management firm.
Mr. Worley serves on the Executive Committee of the University of Pennsylvania Medical Center, is a Trustee of The Robert Wood Johnson Foundation (a philanthropic organization devoted to health care issues) and is a Director of The Colonial Williamsburg Foundation (a historical preservation organization). Mr. Worley also serves on the investment committees of Mount Holyoke College and World Wildlife Fund (a wildlife conservation organization).
Prior to joining Permit Capital LLC in 2002, Mr. Worley served as Chief Strategic Officer of Morgan Stanley Investment Management. He previously served as President, Chief Executive Officer and Chief Investment Officer of Morgan Stanley Dean Witter Investment Management and as a Managing Director of Morgan Stanley, a financial services firm. Mr. Worley also was the Chairman of Miller Anderson & Sherrerd, an investment management firm.
Mr. Worley holds a B.S. degree from University of Tennessee and pursued graduate studies in economics at the University of Texas.
Charles E. Haldeman, Jr.* (Born 1948), Trustee since 2004
Mr. Haldeman is President and Chief Executive Officer of Putnam, LLC (“Putnam Investments”). He is a member of Putnam Investments’ Executive Board of Directors and Advisory Council. Prior to November 2003, Mr. Haldeman served as Co-Head of Putnam Investments’ Investment Division.
Prior to joining Putnam Investments in 2002, Mr. Haldeman held executive positions in the investment management industry. He previously served as Chief Executive Officer of Delaware Investments and President & Chief Operating Officer of United Asset Management. Mr. Haldeman was also a partner and director of Cooke & Bieler, Inc. (an investment management firm).
Mr. Haldeman currently serves on the Board of Governors of the Investment Company Institute and as a Trustee of Dartmouth College, and he is a member of the Partners HealthCare Systems Investment Committee. He is a graduate of Dartmouth College, Harvard Law School and Harvard Business School. Mr. Haldeman is also a Chartered Financial Analyst (CFA) charterholder.
64
George Putnam, III* (Born 1951), Trustee since 1984 and President since 2000
Mr. Putnam is President of New Generation Research, Inc. (a publisher of financial advisory and other research services), and of New Generation Advisers, Inc. (a registered investment advisor to private funds). Mr. Putnam founded the New Generation companies in 1986.
Mr. Putnam is a Director of The Boston Family Office, LLC (a registered investment adviser). He is a Trustee of St. Mark’s School and Shore Country Day School, and until 2002 was a Trustee of the Sea Education Association.
Mr. Putnam previously worked as an attorney with the law firm of Dechert LLP (formerly known as Dechert Price & Rhoads) in Philadelphia. He is a graduate of Harvard College, Harvard Business School and Harvard Law School.
The address of each Trustee is One Post Office Square, Boston, MA 02109.
As of May 31, 2006, there were 108 Putnam Funds. All Trustees serve as Trustees of all Putnam funds.
Each Trustee serves for an indefinite term, until his or her resignation, retirement at age 72, death, or removal.
* Trustees who are or may be deemed to be “interested persons” (as defined in the Investment Company Act of 1940) of the fund, Putnam Management, Putnam Retail Management, or Marsh & McLennan Companies, Inc., the parent company of Putnam, LLC and its affiliated companies. Messrs. Haldeman and Putnam, III are deemed “interested persons” by virtue of their positions as officers of the fund, Putnam Management or Putnam Retail Management and as shareholders of Marsh & McLennan Companies, Inc. Mr. Putnam, III is the President of your fund and each of the other Putnam funds. Mr. Haldeman is President and Chief Executive Officer of Putnam Investments.
65
In addition to George Putnam, III, the other officers of the fund are shown below:
Charles E. Porter (Born 1938)
Executive Vice President, Associate Treasurer
and Principal Executive Officer
Since 1989
Jonathan S. Horwitz (Born 1955)
Senior Vice President and Treasurer
Since 2004
Prior to 2004, Managing Director,
Putnam Investments
Steven D. Krichmar (Born 1958)
Vice President and Principal Financial Officer
Since 2002
Senior Managing Director, Putnam
Investments. Prior to July 2001, Partner,
PricewaterhouseCoopers LLP
Michael T. Healy (Born 1958)
Assistant Treasurer and Principal
Accounting Officer
Since 2000
Managing Director, Putnam Investments
Beth S. Mazor (Born 1958)
Vice President
Since 2002
Managing Director, Putnam Investments
James P. Pappas (Born 1953)
Vice President
Since 2004
Managing Director, Putnam Investments
and Putnam Management. During 2002,
Chief Operating Officer, Atalanta/Sosnoff
Management Corporation; prior to 2001,
President and Chief Executive Officer,
UAM Investment Services, Inc. |
Richard S. Robie, III (Born 1960)
Vice President
Since 2004
Senior Managing Director, Putnam
Investments, Putnam Management
and Putnam Retail Management. Prior
to 2003, Senior Vice President, United
Asset Management Corporation
Francis J. McNamara, III (Born 1955)
Vice President and Chief Legal Officer
Since 2004
Senior Managing Director, Putnam
Investments, Putnam Management
and Putnam Retail Management. Prior
to 2004, General Counsel, State Street
Research & Management Company
Charles A. Ruys de Perez (Born 1957)
Vice President and Chief Compliance Officer
Since 2004
Managing Director, Putnam Investments
Mark C. Trenchard (Born 1962)
Vice President and BSA Compliance Officer
Since 2002
Managing Director, Putnam Investments
Judith Cohen (Born 1945)
Vice President, Clerk and Assistant Treasurer
Since 1993
Wanda M. McManus (Born 1947)
Vice President, Senior Associate Treasurer
and Assistant Clerk
Since 2005
Nancy E. Florek (Born 1957)
Vice President, Assistant Clerk,
Assistant Treasurer and Proxy Manager
Since 2005
|
The address of each Officer is One Post Office Square, Boston, MA 02109.
66
Putnam puts your
interests first
|
In January 2004, Putnam began introducing a number of voluntary initiatives designed to reduce fund expenses, provide investors with more useful information, and help safeguard the interests of all Putnam investors. Visit www.putnam.com for details.
Reduced sales charges The maximum sales charge for class A shares has been reduced to 5.25% for equity funds (formerly 5.75%) and 3.75% for most income funds (formerly 4.50%) . The maximum sales charge for class M shares has been reduced to 3.25% for equity funds (formerly 3.50%) .*
Lower class B purchase limit To help ensure that investors are in the most cost-effective share class, the maximum amount that can be invested in class B shares has been reduced to $100,000. (Larger trades or accumulated amounts will be refused.)
Ongoing expenses will be limited Through calendar 2006, total ongoing expenses, including management fees for all funds, will be maintained at or below the average of each fund’s industry peers in its Lipper load-fund universe. For more information, please see the Statement of Additional information.
Putnam fund prospectuses and shareholder reports have been revised to disclose additional information that will help shareholders compare funds and weigh their costs and risks along with their potential benefits. Shareholders will find easy-to-understand information about fund expense ratios, portfolio manager compensation, risk comparisons, turnover comparisons, brokerage commissions, and employee and trustee ownership of Putnam funds. Disclosure of breakpoint discounts has also been enhanced to alert investors to potential cost savings.
Protecting investors’ interests
|
Short-term trading fee introduced To discourage short-term trading, which can interfere with a fund’s long-term strategy, a 2% short-term trading fee may be imposed on any Putnam fund shares (other than money market funds) redeemed or exchanged within five calendar days of purchase.
* The maximum sales charge for class A shares of Putnam Limited Duration Government Income Fund (formerly Putnam Intermediate U.S. Government Income Fund) and Putnam Floating Rate Income Fund remains 3.25% ..
67
Founded over 65 years ago, Putnam Investments was built around the concept that a balance between risk and reward is the hallmark of a well-rounded financial program. We manage over 100 mutual funds in growth, value, blend, fixed income, and international.
Investment Manager
Putnam Investment
Management, LLC
One Post Office Square
Boston, MA 02109
|
Marketing Services
Putnam Retail Management
One Post Office Square
Boston, MA 02109
|
Custodian
Putnam Fiduciary
Trust Company
|
Legal Counsel
Ropes & Gray LLP
|
Independent Registered
Public Accounting Firm
PricewaterhouseCoopers LLP
|
Trustees
John A. Hill, Chairman
Jameson Adkins Baxter,
Vice Chairman
Charles B. Curtis
Myra R. Drucker
Charles E. Haldeman, Jr.
Paul L. Joskow
Elizabeth T. Kennan
Robert E. Patterson
|
George Putnam, III
W. Thomas Stephens
Richard B. Worley
|
Officers
George Putnam, III
President
|
Charles E. Porter
Executive Vice President,
Associate Treasurer and
Principal Executive Officer
|
Jonathan S. Horwitz
Senior Vice President
and Treasurer
|
Steven D. Krichmar
Vice President and
Principal Financial Officer
|
Michael T. Healy
Assistant Treasurer and
Principal Accounting Officer
|
Beth S. Mazor
Vice President
|
James P. Pappas
Vice President
|
Richard S. Robie, III
Vice President
|
Francis J. McNamara, III
Vice President and
Chief Legal Officer
|
Charles A. Ruys de Perez
Vice President and
Chief Compliance Officer
|
Mark C. Trenchard
Vice President and
BSA Compliance Officer
|
Judith Cohen
Vice President, Clerk and
Assistant Treasurer
|
Wanda M. McManus
Vice President, Senior Associate
Treasurer and Assistant Clerk
|
Nancy E. Florek
Vice President, Assistant Clerk,
Assistant Treasurer and
Proxy Manager
|
This report is for the information of shareholders of Putnam Capital Appreciation Fund. It may also be used as sales literature when preceded or accompanied by the current prospectus, the most recent copy of Putnam’s Quarterly Performance Summary, and Putnam’s Quarterly Ranking Summary. For more recent performance, please visit www.putnam.com. Investors should carefully consider the investment objective, risks, charges, and expenses of a fund, which are described in its prospectus. For this and other information or to request a prospectus, call 1-800-225-1581 toll free. Please read the prospectus carefully before investing. The fund’s Statement of Additional Information contains additional information about the fund’s Trustees and is available without charge upon request by calling 1-800-225-1581.
68

(a) The fund’s principal executive, financial and accounting officers are employees of Putnam Investment Management, LLC, the Fund's investment manager. As such they are subject to a comprehensive Code of Ethics adopted and administered by Putnam Investments which is designed to protect the interests of the firm and its clients. The Fund has adopted a Code of Ethics which incorporates the Code of Ethics of Putnam Investments with respect to all of its officers and Trustees who are employees of Putnam Investment Management, LLC. For this reason, the Fund has not adopted a separate code of ethics governing its principal executive, financial and accounting officers.
(c) In July 2005, Putnam Investment Management, LLC, the Fund's investment manager, Putnam Retail Management Limited Partnership, the Fund's principal underwriter, and Putnam Investments Limited, the sub-manager for a portion of the assets of certain funds as determined by Putnam Management from time to time, adopted several amendments to their Code of Ethics. Insofar as such Code of Ethics applies to the Fund's principal executive officer, principal financial officer and principal accounting officer, the amendments provided for an exception to the standard 90-day holding period (one year, in the case of employees deemed to be “access persons” under the Code) for shares of Putnam mutual funds in the case of redemptions from an employee’s account in a college savings plan qualified under Section 529 of the Internal Revenue Code. Under this exception, an employee may, without penalty under the Code, make “qualified redemptions” of shares from such an account less than 90 days (or one year, as applicable) after purchase. “Qualified redemptions” include redemptions for higher education purposes for the account beneficiary and redemptions made upon death or disability. The July 2005 amendments also provide that an employee may, for purposes of the rule limiting the number of trades per calendar quarter in an employee’s personal account to a maximum of 10, count all trades of the same security in the same direction (all buys or all sells) over a period of five consecutive business days as a single trade.
The July 2005 amendments were incorporated into a restated Code of Ethics dated December 2005 (filed as an exhibit hereto).
Item 3. Audit Committee Financial Expert:
|
The Funds' Audit and Compliance Committee is comprised solely of Trustees who are "independent" (as such term has been defined by the Securities and Exchange Commission ("SEC") in regulations implementing Section 407 of the Sarbanes-Oxley Act (the "Regulations")). The Trustees believe that each of the members of the Audit and Compliance Committee also possess a combination of knowledge and experience with respect to financial accounting matters, as well as other attributes, that qualify them for service on the Committee. In addition, the Trustees have determined that all members of the Funds' Audit and Compliance Committee meet the financial literacy requirements of the New York Stock Exchange's rules and that Mr. Patterson, Mr. Stephens and Mr. Hill qualify as "audit committee financial experts" (as such term has been defined by the Regulations) based on their review of their pertinent experience and education. Certain other Trustees, although not on the Audit and Compliance Committee, would also qualify as "audit committee financial experts." The SEC has stated that the designation or identification of a person as an audit committee financial expert pursuant to this Item 3 of Form N-CSR does not impose on such person any duties, obligations or liability that are greater than the duties, obligations and liability imposed on such person as a member of the Audit and Compliance Committee and the Board of Trustees in the absence of such designation or identification.
Item 4. Principal Accountant Fees and Services:
|
The following table presents fees billed in each of the last two fiscal years for services rendered to the fund by the fund’s independent auditor:
| Fiscal | | Audit- | | |
| year | Audit | Related | Tax | All Other |
| ended | Fees | Fees | Fees | Fees |
| |
| May 31, 2006 | $48,746* | $-- | $3,396 | $ - |
| May 31, 2005 | $54,009* | $-- | $3,533 | $371 |
* Includes fees of $626 and $818 billed by the fund’s independent auditor to the fund for audit procedures necessitated by regulatory and litigation matters for the fiscal years ended May 31, 2006 and May 31, 2005, respectively. These fees were reimbursed to the fund by Putnam Investment Management, LLC (“Putnam Management”).
For the fiscal years ended May 31, 2006 and May 31, 2005, the fund’s independent auditor billed aggregate non-audit fees in the amounts of $235,170 and $186,017 respectively, to the fund, Putnam Management and any entity controlling, controlled by or under common control with Putnam Management that provides ongoing services to the fund.
Audit Fees represent fees billed for the fund’s last two fiscal years.
Audit-Related Fees represent fees billed in the fund’s last two fiscal years for services traditionally performed by the fund’s auditor, including accounting consultation for proposed transactions or concerning financial accounting and reporting standards and other audit or attest services not required by statute or regulation.
Tax Fees represent fees billed in the fund’s last two fiscal years for tax compliance, tax planning and tax advice services. Tax planning and tax advice services include assistance with tax audits, employee benefit plans and requests for rulings or technical advice from taxing authorities.
All Other Fees represent fees billed for services relating to an analysis of recordkeeping fees.
Pre-Approval Policies of the Audit and Compliance Committee. The Audit and Compliance Committee of the Putnam funds has determined that, as a matter of policy, all work performed for the funds by the funds’ independent auditors will be pre-approved by the Committee itself and thus will generally not be subject to pre-approval procedures.
The Audit and Compliance Committee also has adopted a policy to pre-approve the engagement by Putnam Management and certain of its affiliates of the funds’ independent auditors, even in circumstances where pre-approval is not required by applicable law. Any such requests by Putnam Management or certain of its affiliates are typically submitted in writing to the Committee and explain, among other things, the nature of the proposed engagement, the estimated fees, and why this work should be performed by that particular audit firm as opposed to another one.
The following table presents fees billed by the fund’s independent auditor for services required to be approved pursuant to paragraph (c)(7)(ii) of Rule 2-01 of Regulation S-X.
| Fiscal | Audit- | | All | Total |
| year | Related | Tax | Other | Non-Audit |
| ended | Fees | Fees | Fees | Fees |
| May 31, | | | | |
| 2006 | $ - | $ 98,160 | $ - | $ - |
| May | | | | |
| 31, 2005 | $ - | $ - | $ - | $ - |
Item 5. Audit Committee of Listed Registrants | | |
Not applicable | | | | |
Item 6. Schedule of Investments: | | | |
The registrant’s schedule of investments in unaffiliated issuers is included in the report to shareholders in Item 1 above.
Item 7. Disclosure of Proxy Voting Policies and Procedures For Closed-End Management Investment Companies:
Item 8. Portfolio Managers of Closed-End Investment Companies
Item 9. Purchases of Equity Securities by Closed-End Management Investment Companies and Affiliated Purchasers:
Item 10. Submission of Matters to a Vote of Security Holders:
Item 11. Controls and Procedures:
|
(a) The registrant's principal executive officer and principal financial officer have concluded, based on their evaluation of the effectiveness of the design and operation of the registrant's disclosure controls and procedures as of a date within 90 days of the filing date of this report, that the design and operation of such procedures are generally effective to provide reasonable assurance that information required to be disclosed by the registrant in this report is recorded, processed, summarized and reported within the time periods specified in the Commission's rules and forms.
(b) Changes in internal control over financial reporting: Not applicable
(a)(1) The Code of Ethics of The Putnam Funds, which incorporates the Code of Ethics of Putnam Investments, is filed herewith.
(a)(2) Separate certifications for the principal executive officer and principal financial officer of the registrant as required by Rule 30a-2(a) under the Investment Company Act of 1940, as amended, are filed herewith.
(b) The certifications required by Rule 30a-2(b) under the Investment Company Act of 1940, as amended, are filed herewith.
Pursuant to the requirements of the Securities Exchange Act of 1934 and the Investment Company Act of 1940, the registrant has duly caused this report to be signed on its behalf by the undersigned, thereunto duly authorized.
Putnam Capital Appreciation Fund
By (Signature and Title):
/s/Michael T. Healy
Michael T. Healy
Principal Accounting Officer
Date: July 27, 2006
|
Pursuant to the requirements of the Securities Exchange Act of 1934 and the Investment Company Act of 1940, this report has been signed below by the following persons on behalf of the registrant and in the capacities and on the dates indicated.
By (Signature and Title):
/s/Charles E. Porter
Charles E. Porter
Principal Executive Officer
Date: July 27, 2006
|
By (Signature and Title):
/s/Steven D. Krichmar
Steven D. Krichmar
Principal Financial Officer
Date: July 27, 2006
|