UNITED STATES
SECURITIES AND EXCHANGE COMMISSION
Washington, D.C. 20549
FORM N-CSR
CERTIFIED SHAREHOLDER REPORT OF REGISTERED
MANAGEMENT INVESTMENT COMPANIES
| | |
Investment Company Act file number: | | 811-07692 |
Legg Mason Investors Trust, Inc.
|
| 100 Light Street, Baltimore, MD 21202 |
| Address of Principal Executive Offices: |
Richard M. Wachterman, Esq.
Legg Mason & Co., LLC
100 Light Street
Baltimore, MD 21202
|
| Name and address of agent for service: |
Registrant’s telephone number, including area code: (410) 539-0000
Date of fiscal year-end: March 31, 2009
Date of reporting period: September 30, 2008
| Item 1. | Report to Shareholders. |
Page 1 of 5

| | |
| Semi-Annual Report to Shareholders | | 1 |
To Our Shareholders
We are pleased to provide you with Legg Mason Investors Trust’s semi-annual report for American Leading Companies Trust and U.S. Small-Capitalization Value Trust, for the six months ended September 30, 2008.
| | | | | | |
| | | Total Returns | |
| | | 6 Months | | | 1 Year | |
American Leading Companies Trust: | | | | | | |
Primary Class | | –19.00 | % | | –36.38 | % |
Institutional Class | | –18.57 | % | | –35.72 | % |
S&P 500 Stock Composite IndexA | | –10.87 | % | | –21.98 | % |
| | |
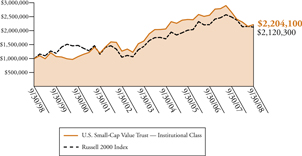
U.S. Small-Cap Value Trust: | | | | | | |
Primary Class | | –4.54 | % | | –17.68 | % |
Institutional Class | | –4.07 | % | | –16.87 | % |
Russell 2000 IndexB | | –0.54 | % | | –14.48 | % |
The performance data quoted represent past performance and do not guarantee future results. The performance stated may have been due to extraordinary market conditions, which may not be duplicated in the future. Current performance may be lower or higher than the performance data quoted. To obtain the most recent month-end performance information for the Primary Class please visit www.leggmason.com/individualinvestors. For the Institutional Class please visit www.lminstitutionalfunds.com. The investment return and principal value of the Funds will fluctuate so that an investor’s shares, when redeemed, may be worth more or less than the original cost. Calculations assume reinvestment of dividends and capital gain distributions. Performance would have been lower if fees had not been waived in various periods. Performance figures for periods shorter than one year represent cumulative figures and are not annualized.
The market environment of the past six months has been among the most challenging seen by equity investors for generations. Concerns about our global financial system and the health of the global economy have negatively affected virtually all asset classes, including, of course, U.S. equities.
We understand the concerns created by market turmoil and declining prices. While no one can predict with certainty when the current crisis will end, we are heartened by the recent actions of the U.S. government to support and repair our financial system.
A | S&P 500 Stock Composite Index — A market capitalization-weighted index, composed of 500 widely held common stocks, that is generally considered representative of the U.S. stock market. |
B | Russell 2000® Index — An unmanaged index comprised of the 2,000 smallest companies of the 3,000 largest U.S. companies based on market capitalization. |
| | |
2 | | Semi-Annual Report to Shareholders |
We continue to believe in the resiliency of the U.S. economy. We believe that turmoil and downturn will eventually be followed by recovery and appreciation. And we believe in the long-term potential of our equity markets to provide rewards to patient investors. We remain committed to helping you, our shareholders, build wealth over the long term.
Information about each Fund’s performance over longer periods of time is shown in the respective Performance Information sections within this report. For more information about each Fund’s share classes included in this report, please contact your financial advisor.
Many Primary Class shareholders invest regularly in Fund shares on a dollar cost averaging basis. Most do so by authorizing automatic, monthly transfers of $50 or more from their bank checking or brokerage accounts. Dollar cost averaging is a convenient and sensible way to invest, as it encourages continued purchases over time regardless of fluctuating price levels. Of course, it does not ensure a profit nor protect against declines in the value of your investment. Your financial advisor will be happy to help you establish a dollar cost averaging account should you wish to do so.
On behalf of the Board and the entire team at Legg Mason, we appreciate your support.
| | | | |
| Sincerely, | | | | |
| | |

| | | | 
|
| John F. Curley, Jr. | | | | Mark R. Fetting |
| Chairman | | | | President |
October 21, 2008
| | |
| Semi-Annual Report to Shareholders | | 3 |
Expense Example
American Leading Companies Trust
As a shareholder of the Fund, you incur ongoing costs, including management fees, distribution and service (12b-1) fees on Primary Class shares, and other Fund expenses. These examples are intended to help you understand your ongoing costs (in dollars) of investing in the Fund and to compare these costs with the ongoing costs of investing in other mutual funds. These examples are based on an investment of $1,000 invested on April 1, 2008, and held through September 30, 2008. The ending value assumes dividends were reinvested at the time they were paid.
Actual Expenses
The first line for each class in the table below provides information about actual account values and actual expenses for each class. You may use the information in this line, together with the amount you invested, to estimate the expenses that you paid over the period. Simply divide your account value by $1,000 (for example, an $8,600 account value divided by $1,000 = 8.6), then multiply the result by the number in the first line under the heading entitled “Expenses Paid During the Period” to estimate the expenses you paid on your account if your shares were held through the entire period.
Hypothetical Example for Comparison Purposes
The second line for each class in the table below provides information about hypothetical account values and hypothetical expenses based on the relevant class’s actual expense ratio and an assumed rate of return of 5% per year before expenses, which is not the class’s actual return. The hypothetical account values and expenses may not be used to estimate the actual ending account balance or expenses you paid for the period. You may use this information to compare the ongoing costs of investing in the Fund and other funds. To do so, compare these 5% hypothetical examples with the 5% hypothetical examples for the relevant class that appear in the shareholder reports of other funds.
| | | | | | | | | |
| | | Beginning
Account
Value
4/1/08 | | Ending
Account
Value
9/30/08 | | Expenses PaidA
During the Period
4/1/08 to 9/30/08 |
Primary Class | | | | | | | | | |
Actual | | $ | 1,000.00 | | $ | 810.00 | | $ | 8.44 |
Hypothetical (5% return before expenses) | | | 1,000.00 | | | 1,015.74 | | | 9.40 |
Institutional Class | | | | | | | | | |
Actual | | $ | 1,000.00 | | $ | 814.30 | | $ | 3.73 |
Hypothetical (5% return before expenses) | | | 1,000.00 | | | 1,020.96 | | | 4.15 |
A | These calculations are based on expenses incurred in the most recent fiscal half-year. The dollar amounts shown as “Expenses Paid” are equal to the annualized expense ratios of 1.86% and 0.82% for the Primary Class and Institutional Class respectively, multiplied by the average values over the period, multiplied by the number of days in the most recent fiscal half-year (183) and divided by 365. |
| | |
4 | | Semi-Annual Report to Shareholders |
Performance Information
American Leading Companies Trust
The graphs on the following pages compare the Fund’s total returns to those of a closely matched broad-based securities market index. The graphs illustrate the cumulative total return of an initial $10,000 investment in the Primary Class and an initial $1,000,000 investment in the Institutional Class, for the periods indicated. The lines for the Fund represent the total return after deducting all Fund investment management and other administrative expenses and the transaction costs of buying and selling securities. The lines representing the securities market index do not take into account any transaction costs associated with buying and selling portfolio securities in the index or other administrative expenses.
Total return measures investment performance in terms of appreciation or depreciation in a fund’s net asset value per share, plus dividends and any capital gain distributions. Both the Fund’s results and the index’s results assume reinvestment of all dividends and distributions at the time they were paid. Average annual returns tend to smooth out variations in a fund’s return, so that they differ from actual year-to-year results.
| | |
| Semi-Annual Report to Shareholders | | 5 |
Growth of a $10,000 Investment — Primary Class
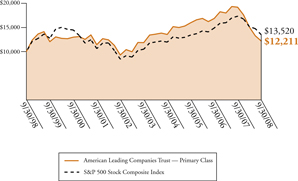
Periods Ended September 30, 2008
| | | | | | |
| | | Cumulative
Total Return | | | Average Annual
Total Return | |
One Year | | –36.38 | % | | –36.38 | % |
Five Years | | +2.93 | % | | +0.58 | % |
Ten Years | | +22.11 | % | | +2.02 | % |
The performance data quoted represent past performance and do not guarantee future results. The performance stated may have been due to extraordinary market conditions, which may not be duplicated in the future. Current performance may be lower or higher than the performance data quoted. To obtain the most recent month-end performance information please visit www.leggmason.com/individualinvestors. The investment return and principal value of the Fund will fluctuate so that an investor’s shares, when redeemed, may be worth more or less than the original cost. Calculations assume reinvestment of dividends and capital gain distributions. Performance would have been lower if fees had not been waived in various periods.
The graph and table do not reflect the deduction of taxes that a shareholder would pay on Fund distributions or the redemption of Fund shares.
| | |
| 6 | | Semi-Annual Report to Shareholders |
Performance Information — Continued
Growth of a $1,000,000 Investment — Institutional Class
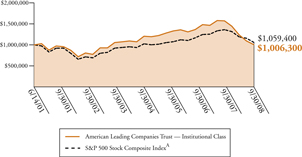
Periods Ended September 30, 2008
| | | | | | |
| | | Cumulative
Total Return | | | Average Annual
Total Return | |
One Year | | –35.72 | % | | –35.72 | % |
Five Years | | +8.23 | % | | +1.59 | % |
Life of Class* | | +0.63 | % | | +0.09 | % |
| * | Inception date: June 14, 2001 |
The performance data quoted represent past performance and do not guarantee future results. The performance stated may have been due to extraordinary market conditions, which may not be duplicated in the future. Current performance may be lower or higher than the performance data quoted. To obtain the most recent month-end performance information please visit www.lminstitutionalfunds.com. The investment return and principal value of the Fund will fluctuate so that an investor’s shares, when redeemed, may be worth more or less than the original cost. Calculations assume reinvestment of dividends and capital gain distributions. Performance would have been lower if fees had not been waived in various periods.
The graph and table do not reflect the deduction of taxes that a shareholder would pay on Fund distributions or the redemption of Fund shares.
A | Index returns are for periods beginning May 31, 2001. |
| | |
| Semi-Annual Report to Shareholders | | 7 |
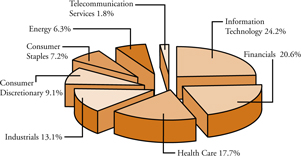
Portfolio Composition (as of September 30, 2008)B
(As a percentage of the portfolio)
Top 10 Holdings (as of September 30, 2008)
| | | |
Security | | % of
Net Assets | |
J.P. Morgan Chase and Co. | | 6.6 | % |
Bank of America Corp. | | 6.0 | % |
International Business Machines Corp. | | 4.0 | % |
Philip Morris International Inc. | | 4.0 | % |
Citigroup Inc. | | 3.9 | % |
Hewlett-Packard Co. | | 3.9 | % |
UnitedHealth Group Inc. | | 3.8 | % |
Health Net Inc. | | 3.8 | % |
General Electric Co. | | 3.7 | % |
Texas Instruments Inc. | | 3.2 | % |
B | The Fund is actively managed. As a result, the composition of its portfolio holdings and sectors is subject to change at any time. |
| | |
| 8 | | Semi-Annual Report to Shareholders |
Performance Information — Continued
American Leading Companies Trust
Selected Portfolio PerformanceC
| | | | | |
Strongest performers for the quarter ended September 30, 2008D | |
1. | | UAL Corp. | | +68.4 | % |
2. | | Bank of America Corp. | | +49.5 | % |
3. | | Pulte Homes Inc. | | +45.5 | % |
4. | | J.P. Morgan Chase and Co. | | +37.6 | % |
5. | | Capital One Financial Corp. | | +35.4 | % |
6. | | Sears Holding Corp. | | +26.9 | % |
7. | | Amgen Inc. | | +25.7 | % |
8. | | Lennar Corp. | | +24.6 | % |
9. | | Citigroup Inc. | | +24.5 | % |
10. | | Kraft Foods Inc. | | +16.1 | % |
| | | | | |
Weakest performers for the quarter ended September 30, 2008D | |
1. | | Jabil Circuit Inc. | | –41.6 | % |
2. | | Sprint Nextel Corp. | | –35.8 | % |
3. | | Anadarko Petroleum Corp. | | –35.1 | % |
4. | | Lloyds TSB Group PLC | | –32.8 | % |
5. | | Noble Corp. | | –32.4 | % |
6. | | Baker Hughes Inc. | | –30.6 | % |
7. | | Transocean Inc. | | –27.9 | % |
8. | | Apache Corp. | | –24.9 | % |
9. | | Devon Energy Corp. | | –24.0 | % |
10. | | Nokia Oyj – ADR | | –23.9 | % |
C | Individual security performance is measured by the change in the security’s price; for stocks, dividends are assumed to be reinvested at the time they were paid. |
D | Securities held for the entire quarter. |
| | |
| Semi-Annual Report to Shareholders | | 9 |
Portfolio Changes
| | |
Securities added during the quarter | | Securities sold during the quarter |
| None | | American International Group Inc. |
| | Applied Materials Inc. |
| | Centax Corp. |
| | Countrywide Financial Corp. |
| | Expedia Inc. |
| | Flextronics International Ltd. |
| | Freddie Mac |
| | General Motors Corp. |
| | Morgan Stanley |
| | The Travelers Cos. Inc. |
| | XL Capital Ltd. |
| | |
10 | | Semi-Annual Report to Shareholders |
Portfolio of Investments
American Leading Companies Trust
September 30, 2008 (Unaudited)
| | | | | | |
| | | Shares | | Value | |
Common Stocks and Equity Interests — 99.8% | | | | | | |
Consumer Discretionary — 9.1% | | | | | | |
Household Durables — 2.9% | | | | | | |
Lennar Corp. | | 317,500 | | $ | 4,822,825 | |
Pulte Homes Inc. | | 420,900 | | | 5,879,973 | |
| | | | | | |
| | | | | 10,702,798 | |
| | | | | | |
Media — 2.1% | | | | | | |
Time Warner Inc. | | 569,000 | | | 7,459,590 | |
| | | | | | |
Multiline Retail — 1.6% | | | | | | |
Sears Holdings Corp. | | 62,500 | | | 5,843,750 | A |
| | | | | | |
Specialty Retail — 2.5% | | | | | | |
The TJX Cos. Inc. | | 293,000 | | | 8,942,360 | |
| | | | | | |
Consumer Staples — 7.2% | | | | | | |
Food Products — 2.0% | | | | | | |
Kraft Foods Inc. | | 220,000 | | | 7,205,000 | |
| | | | | | |
Tobacco — 5.2% | | | | | | |
Altria Group Inc. | | 230,000 | | | 4,563,200 | |
Philip Morris International Inc. | | 299,000 | | | 14,381,900 | |
| | | | | | |
| | | | | 18,945,100 | |
| | | | | | |
Energy — 6.3% | | | | | | |
Energy Equipment and Services — 3.1% | | | | | | |
Baker Hughes Inc. | | 33,000 | | | 1,997,820 | |
Noble Corp. | | 88,000 | | | 3,863,200 | |
Transocean Inc. | | 48,000 | | | 5,272,320 | A |
| | | | | | |
| | | | | 11,133,340 | |
| | | | | | |
Oil, Gas and Consumable Fuels — 3.2% | | | | | | |
Anadarko Petroleum Corp. | | 47,000 | | | 2,279,970 | |
Apache Corp. | | 33,000 | | | 3,441,240 | |
| | |
| Semi-Annual Report to Shareholders | | 11 |
| | | | | | |
| | | Shares | | Value | |
Energy — Continued | | | | | | |
Oil, Gas and Consumable Fuels — Continued | | | | | | |
Devon Energy Corp. | | 46,000 | | $ | 4,195,200 | |
Exxon Mobil Corp. | | 23,000 | | | 1,786,180 | |
| | | | | | |
| | | | | 11,702,590 | |
| | | | | | |
Financials — 20.6% | | | | | | |
Capital Markets — 0.8% | | | | | | |
Merrill Lynch and Co. Inc. | | 115,000 | | | 2,909,500 | |
| | | | | | |
Commercial Banks — 2.5% | | | | | | |
Lloyds TSB Group PLC | | 1,810,000 | | | 7,534,478 | |
National City Corp. | | 900,000 | | | 1,575,000 | |
| | | | | | |
| | | | | 9,109,478 | |
| | | | | | |
Consumer Finance — 0.8% | | | | | | |
Capital One Financial Corp. | | 54,750 | | | 2,792,250 | |
| | | | | | |
Diversified Financial Services — 16.5% | | | | | | |
Bank of America Corp. | | 625,000 | | | 21,875,000 | |
Citigroup Inc. | | 697,500 | | | 14,305,725 | |
J.P. Morgan Chase and Co. | | 511,000 | | | 23,863,700 | |
| | | | | | |
| | | | | 60,044,425 | |
| | | | | | |
Health Care — 17.7% | | | | | | |
Biotechnology — 2.4% | | | | | | |
Amgen Inc. | | 146,000 | | | 8,653,420 | A |
| | | | | | |
Health Care Providers and Services — 10.5% | | | | | | |
Health Net Inc. | | 582,600 | | | 13,749,360 | A |
UnitedHealth Group Inc. | | 549,000 | | | 13,939,110 | |
WellPoint Inc. | | 226,600 | | | 10,598,082 | A |
| | | | | | |
| | | | | 38,286,552 | |
| | | | | | |
| | |
| 12 | | Semi-Annual Report to Shareholders |
Portfolio of Investments — Continued
American Leading Companies Trust — Continued
| | | | | |
| | | Shares | | Value |
Health Care — Continued | | | | | |
Pharmaceuticals — 4.8% | | | | | |
Johnson and Johnson | | 163,500 | | $ | 11,327,280 |
Pfizer Inc. | | 320,000 | | | 5,900,800 |
| | | | | |
| | | | | 17,228,080 |
| | | | | |
Industrials — 13.0% | | | | | |
Aerospace and Defense — 5.3% | | | | | |
General Dynamics Corp. | | 119,000 | | | 8,760,780 |
Lockheed Martin Corp. | | 95,000 | | | 10,418,650 |
| | | | | |
| | | | | 19,179,430 |
| | | | | |
Airlines — 2.3% | | | | | |
UAL Corp. | | 940,000 | | | 8,262,600 |
| | | | | |
Industrial Conglomerates — 3.7% | | | | | |
General Electric Co. | | 530,500 | | | 13,527,750 |
| | | | | |
Machinery — 1.7% | | | | | |
Caterpillar Inc. | | 107,500 | | | 6,407,000 |
| | | | | |
Information Technology — 24.1% | | | | | |
Communications Equipment — 2.8% | | | | | |
Nokia Oyj — ADR | | 544,703 | | | 10,158,711 |
| | | | | |
Computers and Peripherals — 7.9% | | | | | |
Hewlett-Packard Co. | | 308,700 | | | 14,274,288 |
International Business Machines Corp. | | 125,000 | | | 14,620,000 |
| | | | | |
| | | | | 28,894,288 |
| | | | | |
Electronic Equipment, Instruments & Components — 2.0% | | | | | |
Jabil Circuit Inc. | | 760,000 | | | 7,250,400 |
| | | | | |
| | |
| Semi-Annual Report to Shareholders | | 13 |
| | | | | | |
| | | Shares | | Value | |
Information Technology — Continued | | | | | | |
Internet Software and Services — 3.4% | | | | | | |
eBay Inc. | | 342,000 | | $ | 7,653,960 | A |
Yahoo! Inc. | | 263,500 | | | 4,558,550 | A |
| | | | | | |
| | | | | 12,212,510 | |
| | | | | | |
IT Services — 2.3% | | | | | | |
Accenture Ltd. | | 219,000 | | | 8,322,000 | |
| | | | | | |
Semiconductors and Semiconductor Equipment — 3.2% | | | | | | |
Texas Instruments Inc. | | 544,200 | | | 11,700,300 | |
| | | | | | |
Software — 2.5% | | | | | | |
Microsoft Corp. | | 346,000 | | | 9,234,740 | |
| | | | | | |
Telecommunication Services — 1.8% | | | | | | |
Wireless Telecommunication Services — 1.8% | | | | | | |
Sprint Nextel Corp. | | 1,075,000 | | | 6,557,500 | |
| | | | | | |
Total Common Stocks and Equity Interests
(Cost — $305,002,574) | | | | | 362,665,462 | |
| | | | | | |
Total Investments — 99.8% (Cost — $305,002,574)B | | | | | 362,665,462 | |
Other Assets Less Liabilities — 0.2% | | | | | 748,170 | |
| | | | | | |
Net Assets — 100.0% | | | | $ | 363,413,632 | |
| | | | | | |
B | Aggregate cost for federal income tax purposes is substantially the same as book cost. At September 30, 2008, the aggregate gross unrealized appreciation and depreciation of investments for federal income tax purposes were substantially as follows: |
| | | | |
Gross unrealized appreciation | | $ | 112,766,967 | |
| |
Gross unrealized depreciation | | | (55,104,079 | ) |
| | | | |
| |
Net unrealized appreciation | | $ | 57,662,888 | |
| | | | |
ADR — American Depository Receipt
See notes to financial statements.
| | |
14 | | Semi-Annual Report to Shareholders |
Statement of Assets and Liabilities
American Leading Companies Trust
September 30, 2008 (Unaudited)
| | | | | | | |
Assets: | | | | | | | |
Investment securities at market value
(Cost – $305,002,574) | | | | | $ | 362,665,462 | |
Receivable for securities sold | | | | | | 8,126,625 | |
Dividends receivable | | | | | | 891,668 | |
Receivable for fund shares sold | | | | | | 106,409 | |
Other assets | | | | | | 6,975 | |
| | | | | | | |
Total assets | | | | | | 371,797,139 | |
Liabilities: | | | | | | | |
Payable for fund shares repurchased | | $ | 7,125,254 | | | | |
Accrued distribution and service fees | | | 406,827 | | | | |
Cash overdraft | | | 394,107 | | | | |
Accrued management fee | | | 139,589 | | | | |
Accrued expenses | | | 317,730 | | | | |
| | | | | | | |
Total liabilities | | | | | | 8,383,507 | |
| | | | | | | |
Net Assets | | | | | $ | 363,413,632 | |
| | | | | | | |
Net assets consist of: | | | | | | | |
Accumulated paid-in-capital | | | | | $ | 319,254,723 | |
Undistributed net investment income | | | | | | 3,019,430 | |
Accumulated net realized loss on investments and foreign currency transactions | | | | | | (16,488,590 | ) |
Unrealized appreciation of investments | | | | | | 57,628,069 | |
| | | | | | | |
Net Assets | | | | | $ | 363,413,632 | |
| | | | | | | |
Net Asset Value Per Share: | | | | | | | |
Primary Class (21,742,294 shares outstanding) | | | | | $ | 15.77 | |
| | | | | | | |
Institutional Class (1,239,778 shares outstanding) | | | | | $ | 16.61 | |
| | | | | | | |
See notes to financial statements.
| | |
| Semi-Annual Report to Shareholders | | 15 |
Statement of Operations
American Leading Companies Trust
For the Six Months Ended September 30, 2008 (Unaudited)
| | | | | | | | |
Investment Income: | | | | | | | | |
Dividends | | $ | 6,253,751 | | | | | |
Interest | | | 8,423 | | | | | |
Less: Foreign taxes withheld | | | (74,679 | ) | | | | |
| | | | | | | | |
Total income | | | | | | $ | 6,187,495 | |
| | |
Expenses: | | | | | | | | |
Management fees | | | 1,772,332 | | | | | |
Distribution and service fees: | | | | | | | | |
Primary Class | | | 2,301,422 | | | | | |
Audit and legal fees | | | 23,650 | | | | | |
Custodian fees | | | 37,596 | | | | | |
Directors’ fees and expenses | | | 36,222 | | | | | |
Registration fees | | | 21,952 | | | | | |
Reports to shareholders | | | 97,100 | | | | | |
Transfer agent and shareholder servicing expense: | | | | | | | | |
Primary Class | | | 141,187 | | | | | |
Institutional Class | | | 7,452 | | | | | |
Other expenses | | | 20,300 | | | | | |
| | | | | | | | |
Net expenses | | | | | | | 4,459,213 | |
| | | | | | | | |
Net Investment Income | | | | | | | 1,728,282 | |
Net Realized and Unrealized Gain/(Loss) on Investments: | | | | | | | | |
Net realized loss on: | | | | | | | | |
Investments | | | (8,622,903 | ) | | | | |
Foreign currency transactions | | | (25,336 | ) | | | | |
| | | | | | | | |
| | | | | | | (8,648,239 | ) |
| | | | | | | | |
Change in unrealized depreciation of: | | | | | | | | |
Investments | | | (90,837,929 | ) | | | | |
Assets and liabilities denominated in foreign currency | | | (30,414 | ) | | | | |
| | | | | | | | |
| | | | | | | (90,868,343 | ) |
| | | | | | | | |
Net Realized and Unrealized Loss on Investments | | | | | | | (99,516,582 | ) |
| | | | | | | | |
Change in Net Assets Resulting From Operations | | | | | | $ | (97,788,300 | ) |
| | | | | | | | |
See notes to financial statements.
| | |
16 | | Semi-Annual Report to Shareholders |
Statement of Changes in Net Assets
American Leading Companies Trust
| | | | | | | | |
| | | For the Six Months Ended
September 30, 2008 | | | For the Year Ended
March 31, 2008 | |
| | | (Unaudited) | | | | |
Change in Net Assets: | | | | | | | | |
| | |
Net investment income | | $ | 1,728,282 | | | $ | 1,793,894 | |
| | |
Net realized gain/(loss) | | | (8,648,239 | ) | | | 38,783,820 | |
| | |
Change in unrealized depreciation | | | (90,868,343 | ) | | | (160,538,236 | ) |
| | | | | | | | |
Change in net assets resulting from operations | | | (97,788,300 | ) | | | (119,960,522 | ) |
Distributions to shareholders from: | | | | | | | | |
Net investment income: | | | | | | | | |
Institutional Class | | | (376,810 | ) | | | — | |
Net realized gain on investments: | | | | | | | | |
Primary Class | | | (1,224,154 | ) | | | (44,369,956 | ) |
Institutional Class | | | (159,648 | ) | | | (4,690,375 | ) |
Change in net assets from fund share transactions: | | | | | | | | |
Primary Class | | | (98,710,605 | ) | | | (82,074,308 | ) |
Institutional Class | | | (38,071,800 | ) | | | 13,294,031 | |
| | | | | | | | |
Change in net assets | | | (236,331,317 | ) | | | (237,801,130 | ) |
| | |
Net Assets: | | | | | | | | |
| | |
Beginning of period | | | 599,744,949 | | | | 837,546,079 | |
| | | | | | | | |
End of period | | $ | 363,413,632 | | | $ | 599,744,949 | |
| | | | | | | | |
Undistributed net investment income | | $ | 3,019,430 | | | $ | 1,667,958 | |
| | | | | | | | |
See notes to financial statements.
| | |
| Semi-Annual Report to Shareholders | | 17 |
Financial Highlights
American Leading Companies Trust
For a share of each class of capital stock outstanding:
Primary Class:
| | | | | | | | | | | | | | | | | | | | | | | | |
| | | Six Months
Ended
September 30, | | | Years Ended March 31, | |
| | | 2008 | | | 2008 | | | 2007 | | | 2006 | | | 2005 | | | 2004 | |
| | | (Unaudited) | | | | | | | | | | | | | | | | |
Net asset value, beginning of period | | $ | 19.52 | | | $ | 24.87 | | | $ | 24.59 | | | $ | 21.85 | | | $ | 19.85 | | | $ | 14.54 | |
| | | | | | | | | | | | | | | | | | | | | | | | |
Investment operations: | | | | | | | | | | | | | | | | | | | | | | | | |
Net investment income/(loss) | | | .05 | A | | | .03 | A | | | (.06 | )A | | | .01 | | | | — | B | | | .01 | |
Net realized and unrealized gain/(loss) | | | (3.75 | ) | | | (3.81 | ) | | | 1.64 | | | | 2.73 | | | | 2.01 | | | | 5.30 | |
| | | | | | | | | | | | | | | | | | | | | | | | |
Total from investment operations | | | (3.70 | ) | | | (3.78 | ) | | | 1.58 | | | | 2.74 | | | | 2.01 | | | | 5.31 | |
| | | | | | | | | | | | | | | | | | | | | | | | |
Distributions from: | | | | | | | | | | | | | | | | | | | | | | | | |
Net investment income | | | — | | | | — | | | | (.01 | ) | | | — | | | | (.01 | ) | | | — | B |
Net realized gain on investments | | | (.05 | ) | | | (1.57 | ) | | | (1.29 | ) | | | — | | | | — | | | | — | |
| | | | | | | | | | | | | | | | | | | | | | | | |
Total distributions | | | (.05 | ) | | | (1.57 | ) | | | (1.30 | ) | | | — | | | | (.01 | ) | | | — | |
| | | | | | | | | | | | | | | | | | | | | | | | |
Net asset value, end of period | | $ | 15.77 | | | $ | 19.52 | | | $ | 24.87 | | | $ | 24.59 | | | $ | 21.85 | | | $ | 19.85 | |
| | | | | | | | | | | | | | | | | | | | | | | | |
Total return | | | (19.00 | )%C | | | (16.24 | )% | | | 6.68 | % | | | 12.54 | % | | | 10.12 | % | | | 36.54 | % |
| | | | | | |
Ratios to Average Net Assets:D | | | | | | | | | | | | | | | | | | | | | | | | |
Total expenses | | | 1.86 | %E | | | 1.83 | % | | | 1.85 | % | | | 1.86 | % | | | 1.88 | % | | | 1.90 | % |
Expenses net of waivers, if any | | | 1.86 | %E | | | 1.83 | % | | | 1.85 | % | | | 1.86 | % | | | 1.88 | % | | | 1.90 | % |
Expenses net of all reductions | | | 1.86 | %E | | | 1.83 | % | | | 1.85 | % | | | 1.86 | % | | | 1.88 | % | | | 1.90 | % |
Net investment income (loss) | | | .59 | %E | | | .12 | % | | | (.23 | )% | | | .04 | % | | | (.01 | )% | | | .05 | % |
Supplemental Data: | | | | | | | | | | | | | | | | | | | | | | | | |
Portfolio turnover rate | | | 12.2 | %C | | | 28.4 | % | | | 19.0 | % | | | 14.3 | % | | | 19.4 | % | | | 19.6 | % |
Net assets, end of period (in thousands) | | $ | 342,817 | | | $ | 531,186 | | | $ | 765,000 | | | $ | 757,630 | | | $ | 654,019 | | | $ | 585,295 | |
| | | | | | | | | | | | | | | | | | | | | | | | |
A | Computed using average daily shares outstanding. |
B | Amount less than $.01 per share. |
D | Total expenses reflects operating expenses prior to any voluntary expense waivers and/or compensating balance credits. Expenses net of waivers reflects total expenses before compensating balance credits but net of any voluntary expense waivers. Expenses net of all reductions reflects expenses less any compensating balance credits and/or voluntary expense waivers. |
See notes to financial statements.
| | |
18 | | Semi-Annual Report to Shareholders |
Financial Highlights — Continued
Institutional Class:
| | | | | | | | | | | | | | | | | | | | | | | | |
| | | Six Months
Ended
September 30, | | | Years Ended March 31, | |
| | | 2008 | | | 2008 | | | 2007 | | | 2006 | | | 2005 | | | 2004 | |
| | | (Unaudited) | | | | | | | | | | | | | | | | |
Net asset value, beginning of period | | $ | 20.57 | | | $ | 25.86 | | | $ | 25.33 | | | $ | 22.34 | | | $ | 20.28 | | | $ | 14.83 | |
| | | | | | | | | | | | | | | | | | | | | | | | |
Investment operations: | | | | | | | | | | | | | | | | | | | | | | | | |
Net investment income | | | .16 | A | | | .31 | A | | | .23 | A | | | .22 | | | | .21 | | | | .20 | |
Net realized and unrealized gain/(loss) | | | (3.96 | ) | | | (4.03 | ) | | | 1.67 | | | | 2.82 | | | | 2.06 | | | | 5.42 | |
| | | | | | | | | | | | | | | | | | | | | | | | |
Total from investment operations | | | (3.80 | ) | | | (3.72 | ) | | | 1.90 | | | | 3.04 | | | | 2.27 | | | | 5.62 | |
| | | | | | | | | | | | | | | | | | | | | | | | |
Distributions from: | | | | | | | | | | | | | | | | | | | | | | | | |
Net investment income | | | (.11 | ) | | | — | | | | (.08 | ) | | | (.05 | ) | | | (.21 | ) | | | (.17 | ) |
Net realized gain on investments | | | (.05 | ) | | | (1.57 | ) | | | (1.29 | ) | | | — | | | | — | | | | — | |
| | | | | | | | | | | | | | | | | | | | | | | | |
Total distributions | | | (.16 | ) | | | (1.57 | ) | | | (1.37 | ) | | | (.05 | ) | | | (.21 | ) | | | (.17 | ) |
| | | | | | | | | | | | | | | | | | | | | | | | |
Net asset value, end of period | | $ | 16.61 | | | $ | 20.57 | | | $ | 25.86 | | | $ | 25.33 | | | $ | 22.34 | | | $ | 20.28 | |
| | | | | | | | | | | | | | | | | | | | | | | | |
Total return | | | (18.57 | )%C | | | (15.37 | )% | | | 7.77 | % | | | 13.63 | % | | | 11.21 | % | | | 37.96 | % |
| | | | | | |
Ratios to Average Net Assets:D | | | | | | | | | | | | | | | | | | | | | | | | |
Total expenses | | | .82 | %E | | | .79 | % | | | .82 | % | | | .84 | % | | | .90 | % | | | .85 | % |
Expenses net of waivers, if any | | | .82 | %E | | | .79 | % | | | .82 | % | | | .84 | % | | | .90 | % | | | .85 | % |
Expenses net of all reductions | | | .82 | %E | | | .79 | % | | | .82 | % | | | .84 | % | | | .90 | % | | | .85 | % |
Net investment income | | | 1.61 | %E | | | 1.22 | % | | | .90 | % | | | 1.09 | % | | | .99 | % | | | 1.14 | % |
Supplemental Data: | | | | | | | | | | | | | | | | | | | | | | | | |
Portfolio turnover rate | | | 12.2 | %C | | | 28.4 | % | | | 19.0 | % | | | 14.3 | % | | | 19.4 | % | | | 19.6 | % |
Net assets, end of period (in thousands) | | $ | 20,597 | | | $ | 68,559 | | | $ | 72,546 | | | $ | 41,476 | | | $ | 21,386 | | | $ | 16,996 | |
| | | | | | | | | | | | | | | | | | | | | | | | |
See notes to financial statements.
| | |
| Semi-Annual Report to Shareholders | | 19 |
Expense Example
U.S. Small-Capitalization Value Trust
As a shareholder of the Fund, you incur ongoing costs, including management fees, distribution and service (12b-1) fees on Primary Class shares, and other Fund expenses. These examples are intended to help you understand your ongoing costs (in dollars) of investing in the Fund and to compare these costs with the ongoing costs of investing in other mutual funds. These examples are based on an investment of $1,000 invested on April 1, 2008, and held through September 30, 2008. The ending value assumes dividends were reinvested at the time they were paid.
Actual Expenses
The first line for each class in the table below provides information about actual account values and actual expenses for each class. You may use the information in this line, together with the amount you invested, to estimate the expenses that you paid over the period. Simply divide your account value by $1,000 (for example, an $8,600 account value divided by $1,000 = 8.6), then multiply the result by the number in the first line under the heading entitled “Expenses Paid During the Period” to estimate the expenses you paid on your account if your shares were held through the entire period.
Hypothetical Example for Comparison Purposes
The second line for each class in the table below provides information about hypothetical account values and hypothetical expenses based on the relevant class’s actual expense ratio and an assumed rate of return of 5% per year before expenses, which is not the class’s actual return. The hypothetical account values and expenses may not be used to estimate the actual ending account balance or expenses you paid for the period. You may use this information to compare the ongoing costs of investing in the Fund and other funds. To do so, compare these 5% hypothetical examples with the 5% hypothetical examples for the relevant class that appear in the shareholder reports of other funds.
| | | | | | | | | |
| | | Beginning
Account
Value
4/1/08 | | Ending
Account
Value
9/30/08 | | Expenses PaidA
During the
Period
4/1/08 to 9/30/08 |
Primary Class | | | | | | | | | |
Actual | | $ | 1,000.00 | | $ | 954.60 | | $ | 9.80 |
Hypothetical (5% return before expenses) | | | 1,000.00 | | | 1,015.04 | | | 10.10 |
Institutional Class | | | | | | | | | |
Actual | | $ | 1,000.00 | | $ | 959.30 | | $ | 4.91 |
Hypothetical (5% return before expenses) | | | 1,000.00 | | | 1,020.05 | | | 5.06 |
A | These calculations are based on expenses incurred in the most recent fiscal half-year. The dollar amounts shown as “Expenses Paid” are equal to the annualized expense ratios of 2.00% and 1.00% for the Primary Class and Institutional Class respectively, multiplied by the average values over the period, multiplied by the number of days in the most recent fiscal half-year (183) and divided by 365. |
| | |
20 | | Semi-Annual Report to Shareholders |
Performance Information
U.S. Small-Capitalization Value Trust
The graphs on the following pages compare the Fund’s total returns to those of a closely matched broad-based securities market index. The graphs illustrate the cumulative total return of an initial $10,000 investment in the Primary Class and an initial $1,000,000 investment in the Institutional Class, for the periods indicated. The lines for the Fund represent the total return after deducting all Fund investment management and other administrative expenses and the transaction costs of buying and selling securities. The lines representing the securities market index do not take into account any transaction costs associated with buying and selling portfolio securities in the index or other administrative expenses.
Total return measures investment performance in terms of appreciation or depreciation in a fund’s net asset value per share, plus dividends and any capital gain distributions. Both the Fund’s results and the index’s results assume reinvestment of all dividends and distributions at the time they were paid. Average annual returns tend to smooth out variations in a fund’s return, so that they differ from actual year-to-year results.
| | |
| Semi-Annual Report to Shareholders | | 21 |
Growth of a $10,000 Investment — Primary Class
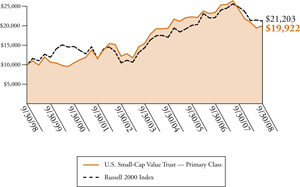
Periods Ended September 30, 2008
| | | | | | |
| | | Cumulative
Total Return | | | Average Annual
Total Return | |
One Year | | –17.68 | % | | –17.68 | % |
Five Years | | +28.80 | % | | +5.19 | % |
Ten Years | | +99.22 | % | | +7.14 | % |
The performance data quoted represent past performance and do not guarantee future results. The performance stated may have been due to extraordinary market conditions, which may not be duplicated in the future. Current performance may be lower or higher than the performance data quoted. To obtain the most recent month-end performance information please visit www.leggmason.com/individualinvestors. The investment return and principal value of the Fund will fluctuate so that an investor’s shares, when redeemed, may be worth more or less than the original cost. Calculations assume reinvestment of dividends and capital gain distributions. Performance would have been lower if fees had not been waived in various periods.
The graph and table do not reflect the deduction of taxes that a shareholder would pay on Fund distributions or the redemption of Fund shares.
| | |
22 | | Semi-Annual Report to Shareholders |
Performance Information — Continued
Growth of a $1,000,000 Investment — Institutional Class
Periods Ended September 30, 2008
| | | | | | |
| | | Cumulative
Total Return | | | Average Annual
Total Return | |
One Year | | –16.87 | % | | –16.87 | % |
Five Years | | +35.84 | % | | +6.32 | % |
Ten Years | | +120.41 | % | | +8.22 | % |
The performance data quoted represent past performance and do not guarantee future results. The performance stated may have been due to extraordinary market conditions, which may not be duplicated in the future. Current performance may be lower or higher than the performance data quoted. To obtain the most recent month-end performance information please visit www.lminstitutionalfunds.com. The investment return and principal value of the Fund will fluctuate so that an investor’s shares, when redeemed, may be worth more or less than the original cost. Calculations assume reinvestment of dividends and capital gain distributions. Performance would have been lower if fees had not been waived in various periods.
The graph and table do not reflect the deduction of taxes that a shareholder would pay on Fund distributions or the redemption of Fund shares.
| | |
| Semi-Annual Report to Shareholders | | 23 |
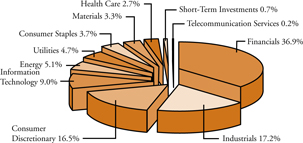
Portfolio Composition (as of September 30, 2008)A
(As a percentage of the portfolio)
Top 10 Holdings (as of September 30, 2008)
| | | |
Security | | % of
Net Assets | |
Rent-A-Center Inc. | | 1.7 | % |
Con-way Inc. | | 1.4 | % |
Del Monte Foods Co. | | 1.2 | % |
Delphi Financial Group Inc. | | 1.2 | % |
Ethan Allen Interiors Inc. | | 1.1 | % |
Lennox International Inc. | | 1.1 | % |
Stone Energy Corp. | | 1.1 | % |
WGL Holdings Inc. | | 1.1 | % |
International Bancshares Corp. | | 1.1 | % |
Trustmark Corp. | | 1.1 | % |
A | The Fund is actively managed. As a result, the composition of its portfolio holdings and sectors is subject to change at any time. |
| | |
24 | | Semi-Annual Report to Shareholders |
Performance Information — Continued
U.S. Small-Capitalization Value Trust B
Selected Portfolio Performance C
| | | | | |
Strongest performers for the quarter ended September 30, 2008D | |
1. | | TriCo Bancshares | | +98.0 | % |
2. | | Unifi Inc. | | +92.1 | % |
3. | | Univest Corporation of Pennsylvania | | +87.6 | % |
4. | | Ameris Bancorp | | +71.3 | % |
5. | | Guaranty Bancorp | | +69.4 | % |
6. | | Arrow Financial Corp. | | +63.8 | % |
7. | | Union Bankshares Corp. | | +62.4 | % |
8. | | BancorpSouth Inc. | | +62.2 | % |
9. | | Michael Baker Corp. | | +59.1 | % |
10. | | Frontier Financial Corp. | | +58.7 | % |
|
Weakest performers for the quarter ended September 30, 2008D | |
1. | | TBS International Ltd. | | –66.3 | % |
2. | | Conseco Inc. | | –64.5 | % |
3. | | Nanometrics Inc. | | –63.8 | % |
4. | | Integrated Silicon Solution Inc. | | –58.5 | % |
5. | | Plug Power Inc. | | –57.9 | % |
6. | | Trico Marine Services, Inc. | | –53.1 | % |
7. | | PC Mall, Inc. | | –49.6 | % |
8. | | National Dentex Corp. | | –49.3 | % |
9. | | Complete Production Services, Inc. | | –44.7 | % |
10. | | Bronco Drilling Co. Inc. | | –44.4 | % |
B | Portfolio changes are not reported for U.S. Small-Cap due to the Fund’s high volume of trading. |
C | Individual security performance is measured by the change in the security’s price; for stocks, dividends are assumed to be reinvested at the time they were paid. |
D | Securities held for the entire quarter. |
| | |
| Semi-Annual Report to Shareholders | | 25 |
Portfolio of Investments
U.S. Small-Capitalization Value Trust
September 30, 2008 (Unaudited)
| | | | | | |
| | | Shares/Par | | Value | |
Common Stocks and Equity Interests — 97.9% | | | | | | |
Consumer Discretionary — 16.3% | | | | | | |
Auto Components — 0.7% | | | | | | |
ATC Technology Corp. | | 4,675 | | $ | 110,985 | A |
Dorman Products Inc. | | 10,280 | | | 128,808 | A |
Modine Manufacturing Co. | | 13,360 | | | 193,453 | |
Standard Motor Products Inc. | | 5,100 | | | 31,722 | |
Superior Industries International Inc. | | 7,380 | | | 141,401 | |
TRW Automotive Holdings Corp. | | 2,280 | | | 36,275 | A |
| | | | | | |
| | | | | 642,644 | |
| | | | | | |
Distributors — 0.1% | | | | | | |
Audiovox Corp. | | 5,750 | | | 53,878 | A |
Core-Mark Holding Co. Inc. | | 2,870 | | | 71,721 | A |
| | | | | | |
| | | | | 125,599 | |
| | | | | | |
Diversified Consumer Services — 0.5% | | | | | | |
Pre-Paid Legal Services Inc. | | 11,100 | | | 457,986 | A |
| | | | | | |
Hotels, Restaurants and Leisure — 1.5% | | | | | | |
CBRL Group Inc. | | 24,910 | | | 655,133 | |
CEC Entertainment Inc. | | 2,040 | | | 67,728 | A |
Domino’s Pizza Inc. | | 6,490 | | | 78,789 | A |
Dover Downs Gaming and Entertainment Inc. | | 5,390 | | | 41,934 | |
Frisch’s Restaurants Inc. | | 5,300 | | | 120,310 | |
Interstate Hotels and Resorts Inc. | | 7,010 | | | 16,473 | A |
Landry’s Restaurants Inc. | | 1,820 | | | 28,301 | |
Lodgian Inc. | | 6,100 | | | 47,580 | A |
Red Lion Hotels Corp. | | 5,100 | | | 40,902 | A |
Speedway Motorsports Inc. | | 18,050 | | | 351,614 | |
Town Sports International Holdings Inc. | | 3,400 | | | 20,740 | A |
| | | | | | |
| | | | | 1,469,504 | |
| | | | | | |
Household Durables — 2.6% | | | | | | |
Bassett Furniture Industries Inc. | | 3,230 | | | 27,617 | |
Blyth Inc. | | 9,990 | | | 113,287 | |
CSS Industries Inc. | | 15,880 | | | 408,751 | |
| | |
| 26 | | Semi-Annual Report to Shareholders |
Portfolio of Investments — Continued
U.S. Small-Capitalization Value Trust — Continued
| | | | | | |
| | | Shares/Par | | Value | |
Consumer Discretionary — Continued | | | | | | |
Household Durables — Continued | | | | | | |
Ethan Allen Interiors Inc. | | 37,970 | | $ | 1,063,919 | |
Furniture Brands International Inc. | | 25,670 | | | 270,048 | |
Helen of Troy Ltd. | | 8,300 | | | 188,991 | A |
Hooker Furniture Corp. | | 12,280 | | | 217,970 | |
La-Z-Boy Inc. | | 14,330 | | | 133,556 | |
| | | | | | |
| | | | | 2,424,139 | |
| | | | | | |
Internet and Catalog Retail — N.M. | | | | | | |
NutriSystem Inc. | | 1,900 | | | 33,668 | |
| | | | | | |
Leisure Equipment and Products — 1.3% | | | | | | |
Arctic Cat Inc. | | 3,000 | | | 27,450 | |
Cybex International Inc. | | 4,500 | | | 13,545 | A |
JAKKS Pacific Inc. | | 31,140 | | | 775,698 | A |
Nautilus Inc. | | 8,100 | | | 37,017 | A |
Polaris Industries Inc. | | 7,760 | | | 353,002 | |
The Fairchild Corp. | | 5,200 | | | 13,520 | A |
| | | | | | |
| | | | | 1,220,232 | |
| | | | | | |
Media — 0.9% | | | | | | |
AH Belo Corp. | | 6,528 | | | 33,685 | |
Alloy Inc. | | 3,700 | | | 28,601 | A |
Belo Corp. | | 11,080 | | | 66,037 | |
Cox Radio Inc. | | 8,850 | | | 93,456 | A |
Lakes Entertainment Inc. | | 2,800 | | | 18,424 | A |
Saga Communications Inc. | | 13,800 | | | 78,660 | A |
Scholastic Corp. | | 10,190 | | | 261,679 | |
Valassis Communications Inc. | | 32,040 | | | 277,466 | A |
| | | | | | |
| | | | | 858,008 | |
| | | | | | |
Specialty Retail — 6.5% | | | | | | |
America’s Car-Mart Inc. | | 2,650 | | | 49,263 | A |
Asbury Automotive Group Inc. | | 43,320 | | | 499,046 | |
Cabela’s Inc. | | 12,300 | | | 148,584 | A |
Charlotte Russe Holding Inc. | | 8,480 | | | 86,920 | A |
| | |
| Semi-Annual Report to Shareholders | | 27 |
| | | | | | |
| | | Shares/Par | | Value | |
Consumer Discretionary — Continued | | | | | | |
Specialty Retail — Continued | | | | | | |
Charming Shoppes Inc. | | 26,276 | | $ | 128,490 | A |
Conn’s Inc. | | 24,590 | | | 460,079 | A |
Eddie Bauer Holdings Inc. | | 6,600 | | | 35,310 | A |
Group 1 Automotive Inc. | | 28,160 | | | 611,917 | |
Hastings Entertainment Inc. | | 17,230 | | | 99,762 | A |
Haverty Furniture Cos. Inc. | | 4,700 | | | 53,768 | |
Hot Topic Inc. | | 1,300 | | | 8,593 | A |
Jos. A Bank Clothiers Inc. | | 4,948 | | | 166,253 | A |
Mothers Work Inc. | | 1,600 | | | 22,208 | A |
Penske Automotive Group Inc. | | 56,830 | | | 651,840 | |
Rent-A-Center Inc. | | 71,620 | | | 1,595,694 | A |
REX Stores Corp. | | 15,595 | | | 180,122 | A |
Shoe Carnival Inc. | | 3,410 | | | 55,856 | A |
Sonic Automotive Inc. | | 4,940 | | | 41,792 | |
Stage Stores Inc. | | 18,385 | | | 251,139 | |
Stein Mart Inc. | | 9,700 | | | 37,927 | |
Systemax Inc. | | 10,100 | | | 142,006 | |
The Dress Barn Inc. | | 16,790 | | | 256,719 | A |
The Finish Line Inc. | | 4,350 | | | 43,456 | |
Zale Corp. | | 19,450 | | | 486,250 | A |
| | | | | | |
| | | | | 6,112,994 | |
| | | | | | |
Textiles, Apparel and Luxury Goods — 2.2% | | | | | | |
Brown Shoe Co. Inc. | | 15,430 | | | 252,743 | |
Columbia Sportswear Co. | | 9,140 | | | 383,514 | |
Culp Inc. | | 3,340 | | | 19,773 | A |
Jones Apparel Group Inc. | | 24,920 | | | 461,269 | |
K-Swiss Inc. | | 13,330 | | | 231,942 | |
Lakeland Industries Inc. | | 1,480 | | | 19,092 | A |
Maidenform Brands Inc. | | 16,540 | | | 239,995 | A |
Oxford Industries Inc. | | 4,300 | | | 111,069 | |
Perry Ellis International Inc. | | 4,150 | | | 61,877 | A |
R.G. Barry Corp. | | 3,000 | | | 20,460 | A |
| | |
| 28 | | Semi-Annual Report to Shareholders |
Portfolio of Investments — Continued
U.S. Small-Capitalization Value Trust — Continued
| | | | | | |
| | | Shares/Par | | Value | |
Consumer Discretionary — Continued | | | | | | |
Textiles, Apparel and Luxury Goods — Continued | | | | | | |
Skechers U.S.A. Inc. | | 11,460 | | $ | 192,872 | A |
Unifi Inc. | | 16,690 | | | 80,780 | A |
| | | | | | |
| | | | | 2,075,386 | |
| | | | | | |
Consumer Staples — 3.6% | | | | | | |
Food and Staples Retailing — 0.2% | | | | | | |
Ingles Markets Inc. | | 3,400 | | | 77,622 | |
The Andersons Inc. | | 4,710 | | | 165,886 | |
| | | | | | |
| | | | | 243,508 | |
| | | | | | |
Food Products — 2.1% | | | | | | |
Cal-Maine Foods Inc. | | 5,100 | | | 139,944 | |
Chiquita Brands International Inc. | | 12,100 | | | 191,301 | A |
Del Monte Foods Co. | | 141,180 | | | 1,101,204 | |
John B. Sanfilippo and Son Inc. | | 2,200 | | | 18,810 | A |
Monterey Gourmet Foods Inc. | | 3,740 | | | 7,293 | A |
Sanderson Farms Inc. | | 6,640 | | | 243,954 | |
TreeHouse Foods Inc. | | 8,710 | | | 258,687 | A |
| | | | | | |
| | | | | 1,961,193 | |
| | | | | | |
Personal Products — 0.8% | | | | | | |
CCA Industries Inc. | | 2,460 | | | 13,284 | |
Elizabeth Arden Inc. | | 2,740 | | | 53,786 | A |
NBTY Inc. | | 13,120 | | | 387,302 | A |
Nutraceutical International Corp. | | 9,390 | | | 103,760 | A |
Parlux Fragrances Inc. | | 5,720 | | | 29,401 | A |
Prestige Brands Holdings Inc. | | 13,100 | | | 116,328 | A |
Schiff Nutrition International Inc. | | 9,740 | | | 66,524 | A |
| | | | | | |
| | | | | 770,385 | |
| | | | | | |
Tobacco — 0.5% | | | | | | |
Universal Corp. | | 9,560 | | | 469,300 | |
| | | | | | |
| | |
| Semi-Annual Report to Shareholders | | 29 |
| | | | | | |
| | | Shares/Par | | Value | |
Energy — 5.0% | | | | | | |
Energy Equipment and Services — 3.3% | | | | | | |
Allis-Chalmers Energy Inc. | | 7,580 | | $ | 95,887 | A |
Basic Energy Services Inc. | | 3,300 | | | 70,290 | A |
Bristow Group Inc. | | 7,840 | | | 265,306 | A |
Bronco Drilling Co. Inc. | | 8,660 | | | 88,505 | A |
Cal Dive International Inc. | | 27,695 | | | 293,567 | A |
Complete Production Services Inc. | | 18,600 | | | 374,418 | A |
Grey Wolf Inc. | | 31,750 | | | 247,015 | A |
Gulf Island Fabrication Inc. | | 3,000 | | | 103,410 | |
Gulfmark Offshore Inc. | | 12,090 | | | 542,599 | A |
Hornbeck Offshore Services Inc. | | 8,300 | | | 320,546 | A |
Parker Drilling Co. | | 6,670 | | | 53,493 | A |
PHI Inc. | | 1,000 | | | 36,930 | A |
Pioneer Drilling Co. | | 8,400 | | | 111,720 | A |
SEACOR Holdings Inc. | | 5,470 | | | 431,857 | A |
Trico Marine Services Inc. | | 4,520 | | | 77,202 | A |
| | | | | | |
| | | | | 3,112,745 | |
| | | | | | |
Oil, Gas and Consumable Fuels — 1.7% | | | | | | |
Adams Resources and Energy Inc. | | 1,100 | | | 25,058 | |
GeoMet Inc. | | 8,400 | | | 45,696 | A |
Stone Energy Corp. | | 24,750 | | | 1,047,667 | A |
Swift Energy Co. | | 8,440 | | | 326,544 | A |
The Meridian Resource Corp. | | 24,700 | | | 45,448 | A |
World Fuel Services Corp. | | 6,300 | | | 145,089 | |
| | | | | | |
| | | | | 1,635,502 | |
| | | | | | |
Financials — 36.3% | | | | | | |
Capital Markets — 0.3% | | | | | | |
LaBranche Co. Inc. | | 17,300 | | | 77,850 | A |
Sanders Morris Harris Group Inc. | | 7,060 | | | 61,069 | |
TradeStation Group Inc. | | 12,180 | | | 113,883 | A |
| | | | | | |
| | | | | 252,802 | |
| | | | | | |
Commercial Banks — 15.1% | | | | | | |
1st Source Corp. | | 6,850 | | | 160,975 | |
| | |
| 30 | | Semi-Annual Report to Shareholders |
Portfolio of Investments — Continued
U.S. Small-Capitalization Value Trust — Continued
| | | | | | |
| | | Shares/Par | | Value | |
Financials — Continued | | | | | | |
Commercial Banks — Continued | | | | | | |
American National Bankshares Inc. | | 8,660 | | $ | 142,890 | |
Ameris Bancorp | | 3,840 | | | 57,024 | |
Arrow Financial Corp. | | 10,137 | | | 298,129 | |
BancorpSouth Inc. | | 17,400 | | | 489,462 | |
Cadence Financial Corp. | | 3,540 | | | 32,816 | |
Camden National Corp. | | 10,740 | | | 375,363 | |
Chemical Financial Corp. | | 17,561 | | | 546,850 | |
Community Trust Bancorp Inc. | | 12,569 | | | 432,374 | |
F.N.B. Corp. | | 46,490 | | | 742,910 | |
First Bancorp | | 6,468 | | | 110,603 | |
First Community Bancshares Inc. | | 10,470 | | | 392,834 | |
First M&F Corp. | | 9,766 | | | 111,625 | |
First Merchants Corp. | | 6,850 | | | 156,180 | |
First Midwest Bancorp Inc. | | 14,890 | | | 360,934 | |
First United Corp. | | 7,386 | | | 146,981 | |
Firstbank Corp. | | 1,091 | | | 11,128 | |
FirstMerit Corp. | | 700 | | | 14,700 | |
FNB Corp. | | 1,900 | | | 13,889 | |
Frontier Financial Corp. | | 3,570 | | | 47,945 | |
Fulton Financial Corp. | | 69,690 | | | 760,318 | |
German American Bancorp Inc. | | 9,020 | | | 105,083 | |
Guaranty Bancorp | | 14,740 | | | 89,914 | A |
IBERIABANK Corp. | | 3,075 | | | 162,514 | |
International Bancshares Corp. | | 37,586 | | | 1,014,822 | |
Lakeland Financial Corp. | | 10,110 | | | 222,016 | |
Macatawa Bank Corp. | | 6,145 | | | 42,954 | |
MainSource Financial Group Inc. | | 14,824 | | | 290,550 | |
MB Financial Inc. | | 4,900 | | | 162,043 | |
Merchants Bancshares Inc. | | 3,840 | | | 93,120 | |
Nara Bancorp Inc. | | 7,330 | | | 82,096 | |
National Penn Bancshares Inc. | | 20,743 | | | 302,848 | |
NBT Bancorp Inc. | | 1,200 | | | 35,904 | |
Northrim BanCorp Inc. | | 8,060 | | | 132,184 | |
Old Point Financial Corp. | | 1,801 | | | 36,025 | |
| | |
| Semi-Annual Report to Shareholders | | 31 |
| | | | | | |
| | | Shares/Par | | Value | |
Financials — Continued | | | | | | |
Commercial Banks — Continued | | | | | | |
PAB Bankshares Inc. | | 9,185 | | $ | 61,172 | |
Pacific Capital Bancorp | | 17,510 | | | 356,328 | |
Park National Corp. | | 3,230 | | | 251,940 | |
Penns Woods Bancorp Inc. | | 4,270 | | | 123,830 | |
Peoples Bancorp Inc. | | 10,568 | | | 230,065 | |
Prosperity Bancshares Inc. | | 8,840 | | | 300,472 | |
Renasant Corp. | | 8,322 | | | 180,671 | |
Republic First Bancorp Inc. | | 2,478 | | | 21,336 | A |
Sierra Bancorp | | 5,340 | | | 111,392 | |
Simmons First National Corp. | | 5,080 | | | 180,848 | |
Southwest Bancorp Inc. | | 9,560 | | | 168,925 | |
StellarOne Corp. | | 5,400 | | | 111,618 | |
Sun Bancorp Inc | | 5,176 | | | 70,135 | A |
Susquehanna Bancshares Inc. | | 21,840 | | | 426,317 | |
TriCo Bancshares | | 3,727 | | | 80,242 | |
Trustmark Corp. | | 48,120 | | | 998,009 | |
Union Bankshares Corp. | | 179 | | | 4,296 | |
United Bankshares Inc. | | 16,150 | | | 565,250 | |
Univest Corp. of Pennsylvania | | 3,410 | | | 126,170 | |
Washington Trust Bancorp Inc. | | 5,570 | | | 148,162 | |
WesBanco Inc. | | 13,170 | | | 350,585 | |
West Bancorporation | | 4,126 | | | 53,762 | |
Whitney Holding Corp. | | 33,670 | | | 816,497 | |
Wilshire Bancorp Inc. | | 7,100 | | | 86,407 | |
Wintrust Financial Corp. | | 5,390 | | | 158,197 | |
Yadkin Valley Financial Corp. | | 5,570 | | | 94,467 | |
| | | | | | |
| | | | | 14,255,096 | |
| | | | | | |
Consumer Finance — 1.3% | | | | | | |
AmeriCredit Corp. | | 40,170 | | | 406,922 | A |
Cash America International Inc. | | 5,800 | | | 209,032 | |
Credit Acceptance Corp. | | 10,560 | | | 179,520 | A |
Dollar Financial Corp. | | 6,760 | | | 104,036 | A |
| | |
| 32 | | Semi-Annual Report to Shareholders |
Portfolio of Investments — Continued
U.S. Small-Capitalization Value Trust — Continued
| | | | | | |
| | | Shares/Par | | Value | |
Financials — Continued | | | | | | |
Consumer Finance — Continued | | | | | | |
Nelnet Inc. | | 11,770 | | $ | 167,134 | |
World Acceptance Corp. | | 4,140 | | | 149,040 | A |
| | | | | | |
| | | | | 1,215,684 | |
| | | | | | |
Diversified Financial Services — 0.4% | | | | | | |
Asset Acceptance Capital Corp. | | 5,410 | | | 57,021 | A |
Encore Capital Group Inc. | | 5,500 | | | 75,350 | A |
Financial Federal Corp. | | 11,280 | | | 258,538 | |
Medallion Financial Corp. | | 4,820 | | | 50,465 | |
| | | | | | |
| | | | | 441,374 | |
| | | | | | |
Insurance — 15.6% | | | | | | |
American Equity Investment Life Holding Co. | | 49,380 | | | 370,350 | |
American Physicians Capital Inc. | | 2,690 | | | 113,868 | |
American Physicians Service Group Inc. | | 1,924 | | | 40,731 | |
Amerisafe Inc. | | 5,200 | | | 94,640 | A |
Amtrust Financial Services Inc. | | 16,200 | | | 220,158 | |
Argo Group International Holdings Ltd. | | 14,792 | | | 545,085 | A |
Baldwin and Lyons Inc. | | 3,430 | | | 82,217 | |
CNA Surety Corp. | | 40,170 | | | 670,839 | A |
Conseco Inc. | | 3,330 | | | 11,722 | A |
Delphi Financial Group Inc. | | 39,155 | | | 1,097,906 | |
Donegal Group Inc. — Class A | | 6,625 | | | 120,111 | |
Donegal Group Inc. — Class B | | 3,672 | | | 61,690 | |
Eastern Insurance Holdings Inc. | | 2,680 | | | 35,966 | |
EMC Insurance Group Inc. | | 5,452 | | | 160,725 | |
Employers Holdings Inc. | | 11,900 | | | 206,822 | |
FBL Financial Group Inc. | | 9,080 | | | 253,241 | |
First Mercury Financial Corp. | | 5,100 | | | 72,675 | A |
FPIC Insurance Group Inc. | | 2,410 | | | 123,850 | A |
Hallmark Financial Services Inc. | | 5,750 | | | 52,268 | A |
Harleysville Group Inc. | | 16,690 | | | 630,882 | |
Hilltop Holdings Inc. | | 13,600 | | | 140,352 | A |
Horace Mann Educators Corp. | | 40,170 | | | 516,988 | |
Infinity Property and Casualty Corp. | | 22,840 | | | 941,008 | |
| | |
| Semi-Annual Report to Shareholders | | 33 |
| | | | | | |
| | | Shares/Par | | Value | |
Financials — Continued | | | | | | |
Insurance — Continued | | | | | | |
IPC Holdings Ltd. | | 12,890 | | $ | 389,407 | |
Max Capital Group Ltd. | | 13,540 | | | 314,534 | |
Meadowbrook Insurance Group Inc. | | 43,060 | | | 304,004 | |
Mercer Insurance Group Inc. | | 1,730 | | | 27,784 | |
Montpelier Re Holdings Ltd. | | 23,420 | | | 386,664 | |
National Interstate Corp. | | 4,390 | | | 105,492 | |
National Western Life Insurance Co. | | 2,920 | | | 706,844 | |
Navigators Group Inc. | | 6,670 | | | 386,860 | A |
Nymagic Inc. | | 7,480 | | | 188,870 | |
OneBeacon Insurance Group Ltd. | | 6,500 | | | 137,475 | |
Platinum Underwriters Holdings Ltd. | | 9,780 | | | 346,994 | |
PMA Capital Corp. | | 8,810 | | | 77,704 | A |
Presidential Life Corp. | | 29,960 | | | 473,068 | |
ProAssurance Corp. | | 8,300 | | | 464,800 | A |
RLI Corp. | | 7,850 | | | 487,406 | |
Safety Insurance Group Inc. | | 20,305 | | | 770,169 | |
SeaBright Insurance Holdings | | 8,480 | | | 110,240 | A |
Selective Insurance Group Inc. | | 23,010 | | | 527,389 | |
Specialty Underwriters’ Alliance Inc. | | 5,850 | | | 28,841 | A |
State Auto Financial Corp. | | 14,430 | | | 419,480 | |
Stewart Information Services Corp. | | 4,200 | | | 124,950 | |
The Phoenix Cos. Inc. | | 46,210 | | | 426,980 | |
Tower Group Inc. | | 5,600 | | | 131,936 | |
Unico American Corp. | | 4,750 | | | 38,950 | A |
United America Indemnity Ltd. | | 5,660 | | | 80,542 | A |
United Fire and Casualty Co. | | 13,176 | | | 376,702 | |
Zenith National Insurance Corp. | | 10,380 | | | 380,323 | |
| | | | | | |
| | | | | 14,778,502 | |
| | | | | | |
Real Estate Management and Development — N.M. | | | | | | |
HouseValues Inc. | | 5,800 | | | 15,370 | A |
| | | | | | |
| | |
| 34 | | Semi-Annual Report to Shareholders |
Portfolio of Investments — Continued
U.S. Small-Capitalization Value Trust — Continued
| | | | | | |
| | | Shares/Par | | Value | |
Financials — Continued | | | | | | |
Thrifts and Mortgage Finance — 3.6% | | | | | | |
Abington Bancorp Inc. | | 6,770 | | $ | 68,512 | |
BankFinancial Corp. | | 5,300 | | | 77,804 | |
Berkshire Hills Bancorp Inc. | | 2,970 | | | 95,040 | |
First Defiance Financial Corp. | | 2,652 | | | 29,199 | |
First Financial Holdings Inc. | | 12,540 | | | 328,297 | |
First Niagara Financial Group Inc. | | 26,490 | | | 417,217 | |
First Place Financial Corp. | | 9,862 | | | 126,727 | |
Home Federal Bancorp Inc | | 4,830 | | | 61,583 | |
Legacy Bancorp Inc. | | 2,500 | | | 33,750 | |
NewAlliance Bancshares Inc. | | 29,320 | | | 440,680 | |
Parkvale Financial Corp. | | 7,850 | | | 123,637 | |
Provident Financial Services Inc. | | 14,400 | | | 237,744 | |
Timberland Bancorp Inc. | | 1,950 | | | 15,600 | |
United Financial Bancorp Inc. | | 4,900 | | | 72,765 | |
Washington Federal Inc. | | 33,137 | | | 611,378 | |
Webster Financial Corp. | | 13,280 | | | 335,320 | |
Westfield Financial Inc. | | 8,820 | | | 90,846 | |
WSFS Financial Corp. | | 3,650 | | | 219,000 | |
| | | | | | |
| | | | | 3,385,099 | |
| | | | | | |
Health Care — 2.7% | | | | | | |
Biotechnology — 0.2% | | | | | | |
Emergent Biosolutions Inc. | | 7,000 | | | 91,630 | A |
Repligen Corp. | | 8,150 | | | 38,386 | A |
Trimeris Inc. | | 8,200 | | | 32,144 | |
| | | | | | |
| | | | | 162,160 | |
| | | | | | |
Health Care Equipment and Supplies — 0.4% | | | | | | |
AngioDynamics Inc. | | 6,600 | | | 104,280 | A |
Cardiac Science Corp. | | 6,310 | | | 65,372 | A |
HealthTronics Inc. | | 8,210 | | | 23,973 | A |
Invacare Corp. | | 6,100 | | | 147,254 | |
| | |
| Semi-Annual Report to Shareholders | | 35 |
| | | | | | |
| | | Shares/Par | | Value | |
Health Care — Continued | | | | | | |
Health Care Equipment and Supplies — Continued | | | | | | |
National Dentex Corp. | | 1,842 | | $ | 11,236 | A |
Theragenics Corp. | | 9,380 | | | 29,266 | A |
| | | | | | |
| | | | | 381,381 | |
| | | | | | |
Health Care Providers and Services — 1.5% | | | | | | |
Advocat Inc. | | 2,460 | | | 12,251 | A |
AMERIGROUP Corp. | | 7,500 | | | 189,300 | A |
Cross Country Healthcare Inc. | | 3,200 | | | 52,128 | A |
Healthspring Inc. | | 16,400 | | | 347,024 | A |
LifePoint Hospitals Inc. | | 24,830 | | | 798,036 | A |
PDI Inc. | | 3,890 | | | 30,887 | A |
| | | | | | |
| | | | | 1,429,626 | |
| | | | | | |
Health Care Technology — N.M. | | | | | | |
AMICAS Inc. | | 7,700 | | | 18,480 | A |
| | | | | | |
Life Sciences Tools and Services — 0.1% | | | | | | |
Albany Molecular Research Inc. | | 6,320 | | | 114,329 | A |
| | | | | | |
Pharmaceuticals — 0.5% | | | | | | |
Caraco Pharmaceutical Laboratories Ltd. | | 6,500 | | | 81,315 | A |
Questcor Pharmaceuticals Inc. | | 5,400 | | | 39,690 | A |
ViroPharma Inc. | | 23,400 | | | 307,008 | A |
| | | | | | |
| | | | | 428,013 | |
| | | | | | |
Industrials — 17.0% | | | | | | |
Aerospace and Defense — 0.2% | | | | | | |
Ceradyne Inc. | | 1,300 | | | 47,658 | A |
Herley Industries Inc. | | 3,380 | | | 57,798 | A |
Kratos Defense and Security Solutions Inc. | | 11,100 | | | 21,867 | A |
SIFCO Industries Inc. | | 3,190 | | | 25,520 | A |
The Allied Defense Group Inc. | | 2,300 | | | 14,122 | A |
| | | | | | |
| | | | | 166,965 | |
| | | | | | |
| | |
| 36 | | Semi-Annual Report to Shareholders |
Portfolio of Investments — Continued
U.S. Small-Capitalization Value Trust — Continued
| | | | | | |
| | | Shares/Par | | Value | |
Industrials — Continued | | | | | | |
Air Freight and Logistics — 0.6% | | | | | | |
Atlas Air Worldwide Holdings Inc. | | 2,010 | | $ | 81,023 | A |
Pacer International Inc. | | 24,640 | | | 405,821 | |
Park-Ohio Holdings Corp. | | 2,970 | | | 53,133 | A |
| | | | | | |
| | | | | 539,977 | |
| | | | | | |
Airlines — 1.0% | | | | | | |
Alaska Air Group Inc. | | 10,110 | | | 206,143 | A |
Republic Airways Holdings Inc. | | 4,970 | | | 50,644 | A |
SkyWest Inc. | | 40,550 | | | 647,989 | |
| | | | | | |
| | | | | 904,776 | |
| | | | | | |
Building Products — 2.4% | | | | | | |
Apogee Enterprises Inc. | | 11,900 | | | 178,857 | |
Armstrong World Industries Inc. | | 10,400 | | | 300,560 | |
Insteel Industries Inc. | | 3,700 | | | 50,283 | |
Lennox International Inc. | | 31,650 | | | 1,052,995 | |
NCI Building Systems Inc. | | 5,350 | | | 169,863 | A |
Universal Forest Products Inc. | | 15,710 | | | 548,436 | |
| | | | | | |
| | | | | 2,300,994 | |
| | | | | | |
Commercial Services and Supplies — 2.0% | | | | | | |
American Reprographics Co. | | 12,000 | | | 207,000 | A |
Consolidated Graphics Inc. | | 2,800 | | | 84,924 | A |
Ennis Inc. | | 16,510 | | | 255,244 | |
G & K Services Inc. | | 3,711 | | | 122,648 | |
GeoEye Inc. | | 5,090 | | | 112,642 | A |
Herman Miller Inc. | | 15,710 | | | 384,424 | |
ICT Group Inc. | | 4,300 | | | 34,615 | A |
Industrial Services of America Inc. | | 1,200 | | | 12,300 | |
Kimball International Inc. | | 7,010 | | | 75,708 | |
Knoll Inc. | | 15,800 | | | 238,896 | |
Mobile Mini Inc. | | 900 | | | 17,397 | A |
North American Galvanizing and Coating Inc. | | 4,399 | | | 22,435 | A |
RSC Holdings Inc. | | 10,700 | | | 121,552 | A |
United Stationers Inc. | | 3,470 | | | 165,970 | A |
| | |
| Semi-Annual Report to Shareholders | | 37 |
| | | | | | |
| | | Shares/Par | | Value | |
Industrials — Continued | | | | | | |
Commercial Services and Supplies — Continued | | | | | | |
Virco Manufacturing | | 8,300 | | $ | 28,469 | |
WCA Waste Corp. | | 4,540 | | | 21,293 | A |
| | | | | | |
| | | | | 1,905,517 | |
| | | | | | |
Construction and Engineering — 0.4% | | | | | | |
Granite Construction Inc. | | 7,800 | | | 279,396 | |
Michael Baker Corp. | | 2,000 | | | 69,600 | A |
Perini Corp. | | 2,680 | | | 69,117 | A |
| | | | | | |
| | | | | 418,113 | |
| | | | | | |
Electrical Equipment — 2.0% | | | | | | |
A.O. Smith Corp. | | 14,800 | | | 580,012 | |
Acuity Brands Inc. | | 10,580 | | | 441,821 | |
Belden CDT Inc. | | 1,400 | | | 44,506 | |
Chase Corp. | | 2,200 | | | 27,500 | |
Plug Power Inc. | | 36,100 | | | 35,739 | A |
Regal-Beloit Corp. | | 16,880 | | | 717,738 | |
SL Industries Inc. | | 100 | | | 1,325 | A |
| | | | | | |
| | | | | 1,848,641 | |
| | | | | | |
Industrial Conglomerates — 0.2% | | | | | | |
Tredegar Corp. | | 8,800 | | | 156,552 | |
| | | | | | |
Machinery — 2.1% | | | | | | |
Alamo Group Inc. | | 2,670 | | | 45,524 | |
American Railcar Industries Inc. | | 5,280 | | | 84,691 | |
Ampco-Pittsburgh Corp. | | 4,290 | | | 111,111 | |
Astec Industries Inc. | | 5,100 | | | 157,233 | A |
Columbus McKinnon Corp. | | 5,220 | | | 123,035 | A |
Flow International Corp. | | 10,400 | | | 52,832 | A |
Greenbrier Cos. Inc. | | 4,600 | | | 89,746 | |
Hardinge Inc. | | 2,600 | | | 33,020 | |
Hurco Cos. Inc. | | 2,360 | | | 69,785 | A |
Lydall Inc. | | 6,360 | | | 61,247 | A |
Mueller Industries Inc. | | 23,920 | | | 550,399 | |
| | |
38 | | Semi-Annual Report to Shareholders |
Portfolio of Investments — Continued
U.S. Small-Capitalization Value Trust — Continued
| | | | | | |
| | | Shares/Par | | Value | |
Industrials — Continued | | | | | | |
Machinery — Continued | | | | | | |
NACCO Industries Inc. | | 1,600 | | $ | 151,232 | |
NN Inc. | | 4,915 | | | 63,158 | |
Tecumseh Products Co. | | 2,800 | | | 70,112 | A |
The L.S. Starrett Co. | | 1,570 | | | 28,935 | |
Twin Disc Inc. | | 300 | | | 4,128 | |
Wabash National Corp. | | 8,420 | | | 79,569 | |
Watts Water Technologies Inc. | | 7,500 | | | 205,125 | |
| | | | | | |
| | | | | 1,980,882 | |
| | | | | | |
Marine — 0.2% | | | | | | |
Genco Shipping and Trading Ltd. | | 1,000 | | | 33,240 | |
International Shipholding Corp. | | 5,020 | | | 109,938 | A |
TBS International Ltd. | | 2,920 | | | 39,303 | A |
| | | | | | |
| | | | | 182,481 | |
| | | | | | |
Professional Services — 1.7% | | | | | | |
Barrett Business Services Inc. | | 2,400 | | | 31,152 | |
COMSYS IT Partners Inc. | | 5,350 | | | 52,002 | A |
Heidrick and Struggles International Inc. | | 4,320 | | | 130,248 | |
Kelly Services Inc. | | 11,640 | | | 221,742 | |
Korn/Ferry International | | 12,400 | | | 220,968 | A |
MPS Group Inc. | | 24,210 | | | 244,037 | A |
School Specialty Inc. | | 5,360 | | | 167,178 | A |
TrueBlue Inc. | | 27,350 | | | 441,976 | A |
Volt Information Sciences Inc. | | 8,210 | | | 73,726 | A |
VSE Corp. | | 1,090 | | | 36,766 | |
| | | | | | |
| | | | | 1,619,795 | |
| | | | | | |
Road and Rail — 2.2% | | | | | | |
Arkansas Best Corp. | | 11,310 | | | 381,034 | |
Con-way Inc. | | 30,050 | | | 1,325,506 | |
Frozen Food Express Industries Inc. | | 4,620 | | | 24,994 | |
P.A.M. Transportation Services Inc. | | 6,580 | | | 72,051 | A |
Saia Inc. | | 10,330 | | | 137,182 | A |
| | |
| Semi-Annual Report to Shareholders | | 39 |
| | | | | | |
| | | Shares/Par | | Value | |
Industrials — Continued | | | | | | |
Road and Rail — Continued | | | | | | |
USA Truck Inc. | | 2,280 | | $ | 36,366 | A |
YRC Worldwide Inc. | | 12,280 | | | 146,869 | A |
| | | | | | |
| | | | | 2,124,002 | |
| | | | | | |
Trading Companies and Distributors — 2.0% | | | | | | |
Applied Industrial Technologies Inc. | | 11,820 | | | 318,313 | |
GATX Corp. | | 11,430 | | | 452,285 | |
H&E Equipment Services Inc. | | 300 | | | 2,898 | A |
Houston Wire & Cable Co. | | 2,000 | | | 34,340 | |
Interline Brands Inc. | | 3,650 | | | 59,167 | A |
Rush Enterprises Inc. | | 6,290 | | | 80,512 | A |
TAL International Group Inc. | | 5,020 | | | 104,516 | |
United Rentals Inc. | | 26,900 | | | 409,956 | A |
WESCO International Inc. | | 11,100 | | | 357,198 | A |
Willis Lease Finance Corp. | | 2,320 | | | 25,914 | A |
| | | | | | |
| | | | | 1,845,099 | |
| | | | | | |
Transportation Infrastructure — N.M. | | | | | | |
CAI International Inc. | | 3,800 | | | 42,028 | A |
| | | | | | |
Information Technology — 8.9% | | | | | | |
Communications Equipment — 0.8% | | | | | | |
Bel Fuse Inc. | | 2,500 | | | 71,175 | |
Black Box Corp. | | 4,800 | | | 165,744 | |
Communications Systems Inc. | | 2,400 | | | 25,536 | |
Endwave Corp. | | 2,300 | | | 11,546 | A |
Globecomm Systems Inc. | | 4,300 | | | 37,582 | A |
Oplink Communications Inc. | | 5,000 | | | 60,350 | A |
Performance Technologies Inc. | | 3,230 | | | 14,147 | A |
Sycamore Networks Inc. | | 79,360 | | | 256,333 | A |
Symmetricom Inc. | | 12,400 | | | 61,628 | A |
| | | | | | |
| | | | | 704,041 | |
| | | | | | |
| | |
40 | | Semi-Annual Report to Shareholders |
Portfolio of Investments — Continued
U.S. Small-Capitalization Value Trust — Continued
| | | | | | |
| | | Shares/Par | | Value | |
Information Technology — Continued | | | | | | |
Computers and Peripherals — 0.6% | | | | | | |
Adaptec Inc. | | 33,800 | | $ | 110,864 | A |
Hutchinson Technology Inc. | | 6,600 | | | 76,428 | A |
Imation Corp. | | 10,400 | | | 234,936 | |
Rackable Systems Inc. | | 6,760 | | | 66,316 | A |
Super Micro Computer Inc. | | 8,500 | | | 76,585 | A |
| | | | | | |
| | | | | 565,129 | |
| | | | | | |
Electronic Equipment, Instruments & Components — 3.7% | | | | | | |
Benchmark Electronics Inc. | | 49,290 | | | 694,003 | A |
Coherent Inc. | | 2,560 | | | 91,008 | A |
CPI International Inc. | | 3,480 | | | 50,391 | A |
CTS Corp. | | 9,390 | | | 120,004 | |
Data I/O Corp. | | 2,300 | | | 9,637 | A |
DDi Corp. | | 4,520 | | | 23,504 | A |
Electro Scientific Industries Inc. | | 7,710 | | | 109,636 | A |
Frequency Electronics Inc. | | 1,920 | | | 8,007 | |
Insight Enterprises Inc. | | 9,800 | | | 131,418 | A |
Methode Electronics Inc. | | 10,500 | | | 93,870 | |
Multi-Fineline Electronix Inc. | | 5,300 | | | 78,387 | A |
Newport Corp. | | 10,000 | | | 107,800 | A |
PC Mall Inc. | | 3,500 | | | 23,905 | A |
Plexus Corp. | | 4,100 | | | 84,870 | A |
RadiSys Corp. | | 5,720 | | | 49,192 | A |
Richardson Electronics Ltd. | | 3,900 | | | 24,180 | |
SYNNEX Corp. | | 34,480 | | | 770,283 | A |
Tech Data Corp. | | 14,760 | | | 440,586 | A |
TESSCO Technologies Inc. | | 800 | | | 10,240 | A |
TTM Technologies Inc. | | 9,200 | | | 91,264 | A |
Vishay Intertechnology Inc. | | 68,315 | | | 452,245 | A |
Zygo Corp. | | 4,500 | | | 56,610 | A |
| | | | | | |
| | | | | 3,521,040 | |
| | | | | | |
| | |
| Semi-Annual Report to Shareholders | | 41 |
| | | | | | |
| | | Shares/Par | | Value | |
Information Technology — Continued | | | | | | |
Internet Software and Services — 1.0% | | | | | | |
EasyLink Services International Corp. | | 6,500 | | $ | 21,385 | A |
ModusLink Global Solutions Inc. | | 13,500 | | | 129,735 | A |
RealNetworks Inc. | | 39,920 | | | 202,793 | A |
Spark Networks Inc. | | 6,300 | | | 24,570 | A |
United Online Inc. | | 61,580 | | | 579,468 | |
| | | | | | |
| | | | | 957,951 | |
| | | | | | |
IT Services — 0.6% | | | | | | |
Ciber Inc. | | 16,800 | | | 117,432 | A |
Computer Task Group Inc. | | 4,390 | | | 28,535 | A |
Convergys Corp. | | 3,800 | | | 56,164 | A |
CSG Systems International Inc. | | 9,600 | | | 168,288 | A |
Edgewater Technology Inc. | | 1,180 | | | 5,735 | A |
Ness Technologies Inc. | | 8,040 | | | 92,219 | A |
StarTek Inc. | | 4,080 | | | 26,194 | A |
TechTeam Global Inc. | | 2,900 | | | 21,518 | A |
Tier Technologies Inc. | | 5,380 | | | 39,973 | A |
| | | | | | |
| | | | | 556,058 | |
| | | | | | |
Semiconductors and Semiconductor Equipment — 2.1% | | | | | | |
Amkor Technology Inc. | | 48,300 | | | 307,671 | A |
Applied Micro Circuits Corp. | | 2,000 | | | 11,960 | A |
California Micro Devices Corp. | | 6,100 | | | 18,239 | A |
Cascade Microtech Inc. | | 3,600 | | | 15,228 | A |
Cymer Inc. | | 4,100 | | | 103,853 | A |
Entegris Inc. | | 27,600 | | | 133,584 | A |
Exar Corp. | | 9,800 | | | 75,068 | A |
Integrated Device Technology Inc. | | 36,700 | | | 285,526 | A |
Integrated Silicon Solution Inc. | | 5,680 | | | 13,121 | A |
Kulicke and Soffa Industries Inc. | | 16,960 | | | 76,490 | A |
MKS Instruments Inc. | | 38,360 | | | 763,747 | A |
Nanometrics Inc. | | 1,470 | | | 3,102 | A |
Rudolph Technologies Inc. | | 7,040 | | | 58,995 | A |
| | |
42 | | Semi-Annual Report to Shareholders |
Portfolio of Investments — Continued
U.S. Small-Capitalization Value Trust — Continued
| | | | | | |
| | | Shares/Par | | Value | |
Information Technology — Continued | | | | | | |
Semiconductors and Semiconductor Equipment — Continued | | | | | | |
Silicon Storage Technology Inc. | | 28,300 | | $ | 92,258 | A |
White Electronic Designs Corp. | | 6,220 | | | 31,100 | A |
| | | | | | |
| | | | | 1,989,942 | |
| | | | | | |
Software — 0.1% | | | | | | |
CallWave Inc. | | 4,200 | | | 7,938 | A |
Catapult Communications Corp. | | 3,700 | | | 17,797 | A |
Dynamics Research Corp. | | 2,580 | | | 19,814 | A |
Pervasive Software Inc. | | 5,480 | | | 22,468 | A |
Versant Corp. | | 989 | | | 19,147 | A |
| | | | | | |
| | | | | 87,164 | |
| | | | | | |
Materials — 3.3% | | | | | | |
Chemicals — 1.8% | | | | | | |
GenTek Inc. | | 2,800 | | | 71,988 | A |
LSB Industries Inc. | | 5,400 | | | 74,790 | A |
Material Sciences Corp. | | 3,780 | | | 21,735 | A |
Olin Corp. | | 43,030 | | | 834,782 | |
OM Group Inc. | | 4,270 | | | 96,075 | A |
PolyOne Corp. | | 48,290 | | | 311,471 | A |
Spartech Corp. | | 1,460 | | | 14,454 | |
Westlake Chemical Corp. | | 11,080 | | | 233,012 | |
| | | | | | |
| | | | | 1,658,307 | |
| | | | | | |
Construction Materials — 0.5% | | | | | | |
Headwaters Inc. | | 36,020 | | | 480,867 | A |
U.S. Concrete Inc. | | 5,700 | | | 25,479 | A |
| | | | | | |
| | | | | 506,346 | |
| | | | | | |
Metals and Mining — 0.9% | | | | | | |
A.M. Castle and Co. | | 5,790 | | | 100,051 | |
Friedman Industries Inc. | | 550 | | | 3,658 | |
Gibraltar Industries Inc. | | 15,752 | | | 294,720 | |
Olympic Steel Inc. | | 2,300 | | | 67,827 | |
Schnitzer Steel Industries Inc. | | 3,300 | | | 129,492 | |
| | |
| Semi-Annual Report to Shareholders | | 43 |
| | | | | | |
| | | Shares/Par | | Value | |
Materials — Continued | | | | | | |
Metals and Mining — Continued | | | | | | |
Synalloy Corp. | | 1,700 | | $ | 23,035 | |
Universal Stainless and Alloy Products Inc. | | 1,860 | | | 47,523 | A |
Worthington Industries Inc. | | 9,050 | | | 135,207 | |
| | | | | | |
| | | | | 801,513 | |
| | | | | | |
Paper and Forest Products — 0.1% | | | | | | |
Kapstone Paper and Packaging Corp. | | 7,000 | | | 44,450 | A |
Schweitzer-Mauduit International Inc. | | 4,260 | | | 80,897 | |
| | | | | | |
| | | | | 125,347 | |
| | | | | | |
Telecommunication Services — 0.2% | | | | | | |
Diversified Telecommunication Services — 0.2% | | | | | | |
Cincinnati Bell Inc. | | 49,170 | | | 151,935 | A |
| | | | | | |
Utilities — 4.6% | | | | | | |
Electric Utilities — 2.1% | | | | | | |
El Paso Electric Co. | | 8,300 | | | 174,300 | A |
Great Plains Energy Inc. | | 17,030 | | | 378,407 | |
IDACORP Inc. | | 29,870 | | | 868,918 | |
Portland General Electric Co. | | 25,510 | | | 603,566 | |
| | | | | | |
| | | | | 2,025,191 | |
| | | | | | |
Gas Utilities — 1.7% | | | | | | |
Nicor Inc. | | 7,290 | | | 323,312 | |
Southwest Gas Corp. | | 6,670 | | | 201,834 | |
WGL Holdings Inc. | | 32,070 | | | 1,040,671 | |
| | | | | | |
| | | | | 1,565,817 | |
| | | | | | |
| | |
44 | | Semi-Annual Report to Shareholders |
Portfolio of Investments — Continued
U.S. Small-Capitalization Value Trust — Continued
| | | | | |
| | | Shares/Par | | Value |
Utilities — Continued | | | | | |
Multi-Utilities — 0.8% | | | | | |
Avista Corp. | | 12,250 | | $ | 265,948 |
Black Hills Corp. | | 10,020 | | | 311,321 |
CH Energy Group Inc. | | 4,340 | | | 189,094 |
| | | | | |
| | | | | 766,363 |
| | | | | |
Total Common Stocks and Equity Interests
(Cost — $98,199,849) | | | | | 92,508,675 |
| | | | | |
Repurchase Agreement — 0.6% | | | | | |
JPMorgan Chase and Co.
1.00%, dated 9/30/08, to be repurchased at $628,874 on 10/1/08 (Collateral: $645,000 Freddie Mac bond, 3.140% due 2/28/07, value $643,388) | | 628,857 | | | 628,857 |
| | | | | |
Total Repurchase Agreements (Cost — $628,857) | | | | | 628,857 |
| | | | | |
Total Investments — 98.5% (Cost — $98,828,706)B | | | | | 93,137,532 |
Other Assets Less Liabilities — 1.5% | | | | | 1,387,307 |
| | | | | |
Net Assets — 100.0% | | | | $ | 94,524,839 |
| | | | | |
N.M. Not Meaningful.
B | Aggregate cost for federal income tax purposes is substantially the same as book cost. At September 30, 2008, the aggregate gross unrealized appreciation and depreciation of investments for federal income tax purposes were substantially as follows: |
| | | | |
Gross unrealized appreciation | | $ | 8,080,804 | |
Gross unrealized depreciation | | | (13,771,978 | ) |
| | | | |
Net unrealized depreciation | | $ | (5,691,174 | ) |
| | | | |
See notes to financial statements.
| | |
| Semi-Annual Report to Shareholders | | 45 |
Statement of Assets and Liabilities
U.S. Small-Capitalization Value Trust
September 30, 2008 (Unaudited)
| | | | | | | |
Assets: | | | | | | | |
Investment securities at market value
(Cost – $98,199,849) | | | | | $ | 92,508,675 | |
Short-term securities at value (Cost – $628,857) | | | | | | 628,857 | |
Cash | | | | | | 628,856 | |
Receivable for securities sold | | | | | | 1,245,444 | |
Dividends and interest receivable | | | | | | 117,819 | |
Receivable for fund shares sold | | | | | | 69,381 | |
| | | | | | | |
Total assets | | | | | | 95,199,032 | |
Liabilities: | | | | | | | |
Payable for fund shares repurchased | | $ | 280,660 | | | | |
Payable for securities purchased | | | 155,594 | | | | |
Accrued distribution and service fees | | | 56,294 | | | | |
Accrued management fee | | | 57,026 | | | | |
Accrued expenses | | | 124,619 | | | | |
| | | | | | | |
Total liabilities | | | | | | 674,193 | |
| | | | | | | |
Net Assets | | | | | $ | 94,524,839 | |
| | | | | | | |
Net assets consist of: | | | | | | | |
Accumulated paid-in-capital | | | | | $ | 106,720,087 | |
Overdistributed net investment income | | | | | | (119,049 | ) |
Accumulated net realized loss on investments | | | | | | (6,385,025 | ) |
Net unrealized depreciation on investments | | | | | | (5,691,174 | ) |
| | | | | | | |
Net Assets | | | | | $ | 94,524,839 | |
| | | | | | | |
Net Asset Value Per Share: | | | | | | | |
Primary Class (8,910,227 shares outstanding) | | | | | $ | 9.03 | |
| | | | | | | |
Institutional Class (1,353,325 shares outstanding) | | | | | $ | 10.40 | |
| | | | | | | |
See notes to financial statements.
| | |
46 | | Semi-Annual Report to Shareholders |
Statement of Operations
U.S. Small-Capitalization Value Trust
For the Six Months Ended September 30, 2008 (Unaudited)
| | | | | | | | |
Investment Income: | | | | | | | | |
Dividends | | $ | 1,016,267 | | | | | |
Interest | | | 21,298 | | | | | |
| | | | | | | | |
Total income | | | | | | $ | 1,037,565 | |
| | |
Expenses: | | | | | | | | |
Management fees | | | 463,703 | | | | | |
Distribution and service fees: | | | | | | | | |
Primary Class | | | 467,060 | | | | | |
Audit and legal fees | | | 20,650 | | | | | |
Custodian fees | | | 22,101 | | | | | |
Directors’ fees and expenses | | | 23,035 | | | | | |
Registration fees | | | 19,732 | | | | | |
Reports to shareholders | | | 47,000 | | | | | |
Transfer agent and shareholder servicing expense: | | | | | | | | |
Primary Class | | | 47,516 | | | | | |
Institutional Class | | | 6,254 | | | | | |
Other expenses | | | 15,007 | | | | | |
| | | | | | | | |
| | | 1,132,058 | | | | | |
Less: Fees waived and expenses reimbursed | | | (113,210 | ) | | | | |
Compensating balance credits | | | (104 | ) | | | | |
| | | | | | | | |
Net expenses | | | | | | | 1,018,744 | |
| | | | | | | | |
Net Investment Income | | | | | | | 18,821 | |
Net Realized and Unrealized Gain/(Loss) on Investments: | | | | | | | | |
Net realized loss on investments | | | (6,382,927 | ) | | | | |
Change in unrealized appreciation/(depreciation) of investments | | | 2,048,618 | | | | | |
| | | | | | | | |
Net Realized and Unrealized Loss on Investments | | | | | | | (4,334,309 | ) |
| | | | | | | | |
Change in Net Assets Resulting From Operations | | | | | | $ | (4,315,488 | ) |
| | | | | | | | |
See notes to financial statements.
| | |
| Semi-Annual Report to Shareholders | | 47 |
Statement of Changes in Net Assets
U.S. Small-Capitalization Value Trust
| | | | | | | | |
| | | For the Six Months Ended
September 30, 2008 | | | For the Year Ended
March 31, 2008 | |
| | | (Unaudited) | | | | |
Change in Net Assets: | | | | | | | | |
| | |
Net investment income | | $ | 18,821 | | | $ | 514,176 | |
| | |
Net realized gain/(loss) | | | (6,382,927 | ) | | | 20,425,094 | |
| | |
Change in unrealized appreciation/(depreciation) | | | 2,048,618 | | | | (56,545,169 | ) |
| | | | | | | | |
Change in net assets resulting from operations | | | (4,315,488 | ) | | | (35,605,899 | ) |
| | |
Distributions to shareholders from: | | | | | | | | |
Net investment income: | | | | | | | | |
Primary Class | | | (196,623 | ) | | | — | |
Institutional Class | | | (259,266 | ) | | | — | |
Net realized gain on investments: | | | | | | | | |
Primary Class | | | (208,539 | ) | | | (23,950,967 | ) |
Institutional Class | | | (28,656 | ) | | | (3,985,324 | ) |
| | |
Change in net assets from fund share transactions: | | | | | | | | |
Primary Class | | | (19,240,458 | ) | | | (49,660,316 | ) |
Institutional Class | | | (10,517,143 | ) | | | 673,996 | |
| | | | | | | | |
Change in net assets | | | (34,766,173 | ) | | | (112,528,510 | ) |
| | |
Net Assets: | | | | | | | | |
| | |
Beginning of period | | | 129,291,012 | | | | 241,819,522 | |
| | | | | | | | |
End of period | | $ | 94,524,839 | | | $ | 129,291,012 | |
| | | | | | | | |
(Over)/Undistributed net investment income | | $ | (119,049 | ) | | $ | 318,019 | |
| | | | | | | | |
See notes to financial statements.
| | |
48 | | Semi-Annual Report to Shareholders |
Financial Highlights
U.S. Small-Capitalization Value Trust
For a share of each class of capital stock outstanding:
Primary Class:
| | | | | | | | | | | | | | | | | | | | | | | | |
| | | Six Months
Ended
September 30,
2008 | | | Years Ended March 31, | |
| | | | 2008 | | | 2007 | | | 2006 | | | 2005 | | | 2004 | |
| | | (Unaudited) | | | | | | | | | | | | | | | | |
Net asset value, beginning of period | | $ | 9.50 | | | $ | 13.73 | | | $ | 14.51 | | | $ | 14.43 | | | $ | 14.52 | | | $ | 8.93 | |
| | | | | | | | | | | | | | | | | | | | | | | | |
Investment operations: | | | | | | | | | | | | | | | | | | | | | | | | |
Net investment income/(loss) | | | (.01 | )A | | | .01 | A | | | (.02 | )A | | | (.06 | ) | | | (.05 | ) | | | (.07 | ) |
Net realized and unrealized gain/(loss) | | | (.42 | ) | | | (2.30 | ) | | | .98 | | | | 1.77 | | | | 1.38 | | | | 5.75 | |
| | | | | | | | | | | | | | | | | | | | | | | | |
Total from investment operations | | | (.43 | ) | | | (2.29 | ) | | | .96 | | | | 1.71 | | | | 1.33 | | | | 5.68 | |
| | | | | | | | | | | | | | | | | | | | | | | | |
Distributions from: | | | | | | | | | | | | | | | | | | | | | | | | |
Net investment income | | | (.02 | ) | | | — | | | | — | | | | — | | | | — | | | | — | |
Net realized gain on investments | | | (.02 | ) | | | (1.94 | ) | | | (1.74 | ) | | | (1.63 | ) | | | (1.42 | ) | | | (.09 | ) |
| | | | | | | | | | | | | | | | | | | | | | | | |
Total distributions | | | (.04 | ) | | | (1.94 | ) | | | (1.74 | ) | | | (1.63 | ) | | | (1.42 | ) | | | (.09 | ) |
| | | | | | | | | | | | | | | | | | | | | | | | |
Net asset value, end of period | | $ | 9.03 | | | $ | 9.50 | | | $ | 13.73 | | | $ | 14.51 | | | $ | 14.43 | | | $ | 14.52 | |
| | | | | | | | | | | | | | | | | | | | | | | | |
Total return | | | (4.54 | )%B | | | (17.94 | )% | | | 7.00 | % | | | 12.63 | % | | | 9.67 | % | | | 63.71 | % |
| | | | | | |
Ratios to Average Net Assets:C | | | | | | | | | | | | | | | | | | | | | | | | |
Total expenses | | | 2.21 | %D | | | 2.05 | % | | | 2.04 | % | | | 2.01 | % | | | 2.00 | % | | | 2.05 | % |
Expenses net of waivers, if any | | | 2.00 | %D | | | 2.00 | % | | | 2.00 | % | | | 2.00 | % | | | 2.00 | % | | | 2.00 | % |
Expenses net of all reductions | | | 2.00 | %D | | | 2.00 | % | | | 2.00 | % | | | 2.00 | % | | | 2.00 | % | | | 2.00 | % |
Net investment income (loss) | | | (.11 | )%D | | | .10 | % | | | (.15 | )% | | | (.40 | )% | | | (.39 | )% | | | (.61 | )% |
Supplemental Data: | | | | | | | | | | | | | | | | | | | | | | | | |
Portfolio turnover rate | | | 26.2 | %B | | | 31.7 | % | | | 28.9 | % | | | 30.9 | % | | | 46.7 | % | | | 44.3 | % |
Net assets, end of period (in thousands) | | $ | 80,447 | | | $ | 104,013 | | | $ | 207,926 | | | $ | 232,061 | | | $ | 242,719 | | | $ | 226,351 | |
| | | | | | | | | | | | | | | | | | | | | | | | |
A | Computed using average daily shares outstanding. |
C | Total expenses reflects operating expenses prior to any voluntary expense waivers and/or compensating balance credits. Expenses net of waivers reflects total expenses before compensating balance credits but net of any voluntary expense waivers. Expenses net of all reductions reflects expenses less any compensating balance credits and/or voluntary expense waivers. |
See notes to financial statements.
| | |
| Semi-Annual Report to Shareholders | | 49 |
Institutional Class:
| | | | | | | | | | | | | | | | | | | | | | | | |
| | | Six Months
Ended
September 30,
2008 | | | Years Ended March 31, | |
| | | | 2008 | | | 2007 | | | 2006 | | | 2005 | | | 2004 | |
| | | (Unaudited) | | | | | | | | | | | | | | | | |
Net asset value, beginning of period | | $ | 11.05 | | | $ | 15.48 | | | $ | 15.99 | | | $ | 15.59 | | | $ | 15.39 | | | $ | 9.36 | |
| | | | | | | | | | | | | | | | | | | | | | | | |
Investment operations: | | | | | | | | | | | | | | | | | | | | | | | | |
Net investment income | | | .05 | A | | | .16 | A | | | .13 | A | | | — | E | | | .09 | | | | .05 | |
Net realized and unrealized gain/(loss) | | | (.49 | ) | | | (2.65 | ) | | | 1.10 | | | | 2.03 | | | | 1.53 | | | | 6.07 | |
| | | | | | | | | | | | | | | | | | | | | | | | |
Total from investment operations | | | (.44 | ) | | | (2.49 | ) | | | 1.23 | | | | 2.03 | | | | 1.62 | | | | 6.12 | |
| | | | | | | | | | | | | | | | | | | | | | | | |
Distributions from: | | | | | | | | | | | | | | | | | | | | | | | | |
Net investment income | | | (.19 | ) | | | — | | | | — | | | | — | | | | — | | | | — | |
Net realized gain on investments | | | (.02 | ) | | | (1.94 | ) | | | (1.74 | ) | | | (1.63 | ) | | | (1.42 | ) | | | (.09 | ) |
| | | | | | | | | | | | | | | | | | | | | | | | |
Total distributions | | | (.21 | ) | | | (1.94 | ) | | | (1.74 | ) | | | (1.63 | ) | | | (1.42 | ) | | | (.09 | ) |
| | | | | | | | | | | | | | | | | | | | | | | | |
Net asset value, end of period | | $ | 10.40 | | | $ | 11.05 | | | $ | 15.48 | | | $ | 15.99 | | | $ | 15.59 | | | $ | 15.39 | |
| | | | | | | | | | | | | | | | | | | | | | | | |
Total return | | | (4.07 | )%B | | | (17.17 | )% | | | 8.09 | % | | | 13.81 | % | | | 11.06 | % | | | 65.49 | % |
| | | | | | |
Ratios to Average Net Assets:C | | | | | | | | | | | | | | | | | | | | | | | | |
Total expenses | | | 1.18 | %D | | | 1.01 | % | | | 1.00 | % | | | .98 | % | | | .93 | % | | | .98 | % |
Expenses net of waivers, if any | | | 1.00 | %D | | | 1.00 | % | | | 1.00 | % | | | .98 | % | | | .93 | % | | | .98 | % |
Expenses net of all reductions | | | 1.00 | %D | | | 1.00 | % | | | 1.00 | % | | | .98 | % | | | .93 | % | | | .98 | % |
Net investment income | | | .83 | %D | | | 1.13 | % | | | .85 | % | | | .66 | % | | | .69 | % | | | .41 | % |
Supplemental Data: | | | | | | | | | | | | | | | | | | | | | | | | |
Portfolio turnover rate | | | 26.2 | %B | | | 31.7 | % | | | 28.9 | % | | | 30.9 | % | | | 46.7 | % | | | 44.3 | % |
Net assets, end of period (in thousands) | | $ | 14,078 | | | $ | 25,278 | | | $ | 33,894 | | | $ | 35,997 | | | $ | 14,349 | | | $ | 10,351 | |
| | | | | | | | | | | | | | | | | | | | | | | | |
E | Amount less than $.01 per share. |
See notes to financial statements.
| | |
50 | | Semi-Annual Report to Shareholders |
Notes to Financial Statements
Legg Mason Investors Trust, Inc. (Unaudited)
1. Organization and Significant Accounting Policies:
Legg Mason Investors Trust, Inc. (“Corporation”), consisting of American Leading Companies Trust (“American Leading Companies”) and U.S. Small-Capitalization Value Trust (“U.S. Small-Cap”) (each a “Fund”), is registered under the Investment Company Act of 1940, as amended (“1940 Act”), as an open-end, diversified investment company.
Each Fund consists of three classes of shares: Primary Class, Institutional Class and Financial Intermediary Class. The Financial Intermediary Class is not currently active in either Fund. The income and expenses of the Funds are allocated proportionately to each class of shares based on daily net assets, except for Rule 12b-1 distribution and service fees, which are charged only on Primary Class shares, and transfer agent and shareholder servicing expenses, which are determined separately for each class.
Preparation of the financial statements in accordance with accounting principles generally accepted in the United States of America requires management to make estimates and assumptions that affect the reported amounts and disclosures in the financial statements. Actual results could differ from those estimates. The following is a summary of significant accounting policies followed by the Funds in the preparation of their financial statements:
Investment Valuation
The Funds’ securities are valued under policies approved by and under the general oversight of the Board of Directors. Effective January 1, 2008, the Fund adopted Statement of Financial Accounting Standards No. 157 (“FAS 157”). FAS 157 establishes a single definition of fair value, creates a three-tier hierarchy as a framework for reporting methods of measuring fair value based on inputs used to value the Fund’s investments, and requires additional disclosure about fair value. The hierarchy of inputs is summarized below.
| | • | | Level 1 — quoted prices in active markets for identical investments |
| | • | | Level 2 — other significant observable inputs (including quoted prices for similar investments, interest rates, prepayment speeds, credit risk, etc.) |
| | • | | Level 3 — significant unobservable inputs (including a Fund’s own assumptions in determining the fair value of investments) |
Equity securities for which market quotations are available are valued at the last sale price or official closing price on the primary market or exchange on which they trade. Debt securities are valued at the last quoted bid prices provided by an independent pricing service that are based on transactions in debt obligations, quotations from bond dealers, market transactions in comparable securities and various other relationships
| | |
| Semi-Annual Report to Shareholders | | 51 |
between securities. Publicly traded foreign government debt securities are typically traded internationally in the over-the-counter market and are valued at the bid price as of the close of business of that market. When prices are not readily available, or are determined not to reflect fair value, such as when the value of a security has been significantly affected by events after the close of the exchange or market on which the security is principally traded, but before the Fund calculates its net asset value, the Fund may value these securities at fair value as determined in accordance with the procedures approved by the Fund’s Board of Directors.
The following is a summary of the inputs used in valuing each Fund’s assets carried at fair value:
American Leading Companies Trust
| | | | | | | | | | |
| | | September 30,
2008 | | Quoted
Prices
(Level 1) | | Other
Significant
Observable
Inputs
(Level 2) | | Significant
Unobservable
Inputs
(Level 3) |
Investments in Securities | | $ | 362,665,462 | | $ | 362,665,462 | | — | | — |
Other Financial Instruments* | | | — | | | — | | — | | — |
| | | | | | | | | | |
Total | | $ | 362,665,462 | | $ | 362,665,462 | | — | | — |
| | | | | | | | | | |
U.S. Small-Capitalization Value Trust
| | | | | | | | | | | |
| | | September 30,
2008 | | Quoted
Prices
(Level 1) | | Other
Significant
Observable
Inputs
(Level 2) | | Significant
Unobservable
Inputs
(Level 3) |
Investments in Securities | | $ | 93,137,532 | | $ | 92,508,675 | | $ | 628,857 | | — |
Other Financial Instruments* | | | — | | | — | | | — | | — |
| | | | | | | | | | | |
Total | | $ | 93,137,532 | | $ | 92,508,675 | | $ | 628,857 | | — |
| | | | | | | | | | | |
| * | Other financial instruments include options, futures, swaps and forward contracts. |
| | |
52 | | Semi-Annual Report to Shareholders |
Notes to Financial Statements — Continued
Legg Mason Investors Trust, Inc. — Continued
Security Transactions
Security transactions are accounted for as of the trade date. Realized gains and losses from security transactions are reported on an identified cost basis for both financial reporting and federal income tax purposes.
For the six months ended September 30, 2008, security transactions (excluding short-term investments were:)
| | | | | | |
| | | Purchases | | Proceeds From Sales |
American Leading Companies | | $ | 60,463,346 | | $ | 198,308,007 |
U.S. Small-Cap | | | 28,416,741 | | | 59,114,761 |
Foreign Currency Translation
Assets and liabilities initially expressed in non-U.S. currencies are translated into U.S. dollars using currency exchange rates determined prior to the close of trading on the New York Stock Exchange, usually at 2:00 p.m. Eastern time. Purchases and sales of securities and income and expenses are translated into U.S. dollars at the prevailing market rates on the dates of such transactions. The effects of changes in non-U.S. currency exchange rates on investment securities and other assets and liabilities are included with the net realized and unrealized gain or loss on investment securities for each fund.
Repurchase Agreements
Each Fund may enter into repurchase agreements with institutions that its investment adviser has determined are creditworthy. Each repurchase agreement is recorded at cost. Under the terms of a typical repurchase agreement, a fund takes possession of an underlying debt obligation subject to an obligation of the seller to repurchase, and of the fund to resell, the obligation at an agreed-upon price and time, thereby determining the yield during a fund’s holding period. When entering into repurchase agreements, it is each Fund’s policy that its custodian acting on the Fund’s behalf, or a third party custodian take possession of the underlying collateral securities, the market value of which, at all times, at least equals the principal amount of the repurchase transaction, including accrued interest. To the extent that any repurchase transaction exceeds one business day, the value of the collateral is marked to market to ensure the adequacy of the collateral. If the counterparty defaults, a fund generally has the right to use the collateral to satisfy the terms of the repurchase transaction. However, if the market value of the collateral declines during the period in which a fund seeks to assert its rights or if bankruptcy proceedings are commenced with respect to the seller of the security, realization on the collateral by a fund may be delayed or limited.
| | |
| Semi-Annual Report to Shareholders | | 53 |
Compensating Balance Credits
Each Fund has an arrangement with their custodian bank whereby a portion of the custodian’s fee is paid indirectly by credits earned on the Fund’s cash on deposit with the bank. This deposit arrangement is an alternative to purchasing overnight investments.
Commission Recapture
American Leading Companies has entered into a directed brokerage agreement with State Street Bank & Trust Company (“State Street”). Under the agreement, State Street Bank will rebate to the Fund a percentage of commissions generated by the Fund. Such payments are included with realized gain/(loss) on investment transactions. During the six months ended September 30, 2008, the Fund did not receive any commission rebates.
Investment Income and Distributions to Shareholders
Interest income and expenses are recorded on the accrual basis. Bond premiums and discounts are amortized for financial reporting and federal income tax purposes. Dividend income is recorded on the ex-dividend date. Dividends from net investment income, if available, are determined at the class level and paid annually for each Fund. Distributions from net realized capital gains, which are calculated at the Fund level, are declared and paid annually in June, if available. An additional distribution may be made in December, to the extent necessary, in order to comply with federal excise tax requirements. Distributions are determined in accordance with federal income tax regulations, which may differ from those determined in accordance with accounting principles generally accepted in the United States of America. Accordingly, periodic reclassifications are made within each Fund’s capital accounts to reflect income and gains available for distribution under federal income tax regulations.
Foreign Taxes
The Funds are subject to foreign income taxes imposed by certain countries in which each invests. Foreign income taxes are accrued by the Funds and withheld from dividend and interest income.
Other
In the normal course of business, each Fund enters into contracts that provide general indemnifications. Each Fund’s maximum exposure under these arrangements is dependent on claims that may be made against that Fund in the future and, therefore, cannot be estimated. However, based on experience, the risk of material loss from such claims is considered remote.
| | |
54 | | Semi-Annual Report to Shareholders |
Notes to Financial Statements — Continued
Legg Mason Investors Trust, Inc. — Continued
2. Federal Income Taxes:
It is each Fund’s policy to comply with the federal income and excise tax requirements of the Internal Revenue Code of 1986, as amended, applicable to regulated investment companies. Accordingly, each Fund intends to distribute substantially all of its taxable income and net realized gains, if any, to shareholders each year. Therefore, no federal income tax provision is required in either Fund’s financial statements.
Management has analyzed each Fund’s tax positions taken on federal income tax returns for all open tax years and has concluded that as of September 30, 2008, no provision for income tax would be required in either Fund’s financial statements. Each Fund’s federal and state income and federal excise tax returns for tax years for which the applicable statutes of limitations have not expired are subject to examination by the Internal Revenue Service and state departments of revenue.
The amount and character of tax-basis distributions and composition of net assets are finalized at fiscal year-end; accordingly, tax basis balances have not been determined as of September 30, 2008.
3. Transactions With Affiliates:
American Leading Companies has an investment advisory and management agreement with Legg Mason Capital Management, Inc. (“LMCM”). Pursuant to the agreement, LMCM provides American Leading Companies with investment advisory, management and administrative services for which the Fund pays a fee, computed daily and payable monthly, at an annual rates of the Fund’s average daily net assets shown in the table below.
U.S. Small-Cap has a management agreement with Legg Mason Fund Adviser, Inc. (“LMFA”). Pursuant to the agreement, LMFA provides U.S. Small-Cap with management and administrative services for which the Fund pays a fee, computed daily and payable monthly, at the annual rate of the Fund’s average daily net assets shown in the table below.
The following chart summarizes the management fees for each of the Funds:
| | | | |
Fund | | Management
Fee | | Asset Breakpoint |
American Leading Companies | | 0.70% | | on assets up to $2 billion |
| | 0.65% | | on assets in excess of $2 billion |
| | |
U.S. Small-Cap | | 0.85% | | on assets up to $100 million |
| | 0.75% | | on assets $100 million – $1 billion |
| | 0.65% | | on assets in excess of $1 billion |
| | |
| Semi-Annual Report to Shareholders | | 55 |
LMCM and LMFA have voluntarily agreed to waive their fees in any month to the extent a Fund’s expenses (exclusive of taxes, interest, brokerage and extraordinary expenses) exceed during that month certain annual rates of that Fund’s average daily net assets until August 1, 2008. These voluntary waivers may be terminated at any time. For the six months ended September 31, 2008, LMFA waived distribution fees and reimbursed expenses in the amount of $113,210 for U.S. Small-Cap.
The following chart summarizes the expense limitations for each of the Funds:
| | | | | | |
Fund | | Primary Class
Expense Limitation | | | Institutional Class
Expense Limitation | |
American Leading Companies | | 1.95 | % | | 0.95 | % |
U.S. Small-Cap | | 2.00 | % | | 1.00 | % |
Brandywine Global Investment Management, LLC (“Brandywine Global”) serves as investment adviser to U.S. Small-Cap. Brandywine Global is responsible, subject to the general supervision of LMFA, for the actual investment activity of the Fund. LMFA pays Brandywine Global a fee for its services, computed daily and payable monthly, at an annual rate equal to 58.8% of the fee received by LMFA.
Legg Mason Investor Services, LLC (“LMIS”), serves as the Funds’distributor. LMIS receives an annual distribution fee and an annual service fee based on each Fund’s Primary Class’s average daily net assets, computed daily and payable monthly as follows:
| | | | | | |
Fund | | Distribution
Fee | | | Service
Fee | |
American Leading Companies | | | | | | |
Primary Class | | 0.75 | % | | 0.25 | % |
U.S. Small-Cap | | | | | | |
Primary Class | | 0.75 | % | | 0.25 | % |
LMFA serves as administrator to American Leading Companies under an administrative services agreement with LMCM. For LMFA’s services to American Leading Companies, LMCM (not the Fund) pays LMFA a fee, calculated daily and payable monthly, of 0.05% of the average daily net assets of the Fund.
LMCM, LMFA, Brandywine Global and LMIS are wholly owned subsidiaries and corporate affiliates of Legg Mason, Inc.
Under a Deferred Compensation Plan (the “Plan”), directors may elect to defer receipt of all or a specified portion of their compensation. A participating director may select one or more funds in which his or her deferred director’s fees will be deemed to be invested. Deferred amounts remain in the fund(s) until distributed in accordance with the Plan.
| | |
56 | | Semi-Annual Report to Shareholders |
Notes to Financial Statements — Continued
Legg Mason Investors Trust, Inc. — Continued
4. Line of Credit:
The Funds, along with certain other Legg Mason Funds, participate in a $400 million line of credit (“Credit Agreement”) to be used for temporary or emergency purposes. Pursuant to the Credit Agreement, each participating fund is liable only for principal and interest payments related to borrowings made by that fund. Borrowings under the Credit Agreement bear interest at a rate equal to the prevailing federal funds rate plus the federal funds rate margin. The Funds did not utilize the line of credit during the six months ended September 30, 2008.
5. Fund Share Transactions:
At September 30, 2008, there were 250,000,000 and 50,000,000 shares authorized at $.001 par value for the Primary Classes of American Leading Companies and U.S. Small-Cap, respectively. At September 30, 2008, there were 100,000,000 shares authorized at $.001 par value for the Financial Intermediary Class of each of American Leading Companies and U.S. Small-Cap, (the Financial Intermediary Class of each Fund is not currently operational). At September 30, 2008, there were 250,000,000 and 50,000,000 shares authorized at $.001 par value for the Institutional Classes of American Leading Companies and U.S. Small-Cap, respectively.
Share transactions are detailed below:
American Leading Companies Trust
| | | | | | | | | | | | | | |
| | | Six Months Ended
September 30, 2008 | | | Year Ended
March 31, 2008 | |
| | | Shares | | | Amount | | | Shares | | | Amount | |
Primary Class | | | | | | | | | | | | | | |
Shares sold | | 1,100,752 | | | $ | 20,622,487 | | | 2,357,186 | | | $ | 56,648,242 | |
Shares issued on reinvestment | | 66,629 | | | | 1,223,311 | | | 1,793,915 | | | | 42,205,622 | |
Shares repurchased | | (6,641,446 | ) | | | (120,556,403 | ) | | (7,694,594 | ) | | | (180,928,172 | ) |
| | | | | | | | | | | | | | |
Net Decrease | | (5,474,065 | ) | | $ | (98,710,605 | ) | | (3,543,493 | ) | | $ | (82,074,308 | ) |
| | | | | | | | | | | | | | |
Institutional Class | | | | | | | | | | | | | | |
Shares sold | | 372,031 | | | $ | 7,520,122 | | | 978,756 | | | $ | 24,402,089 | |
Shares issued on reinvestment | | 27,448 | | | | 529,461 | | | 188,146 | | | | 4,645,699 | |
Shares repurchased | | (2,492,378 | ) | | | (46,121,383 | ) | | (639,339 | ) | | | (15,753,757 | ) |
| | | | | | | | | | | | | | |
Net Increase (Decrease) | | (2,092,899 | ) | | $ | (38,071,800 | ) | | 527,563 | | | $ | 13,294,031 | |
| | | | | | | | | | | | | | |
| | |
| Semi-Annual Report to Shareholders | | 57 |
U.S. Small-Capitalization Value Trust
| | | | | | | | | | | | | | |
| | | Six Months Ended
September 30, 2008 | | | Year Ended
March 31, 2008 | |
| | | Shares | | | Amount | | | Shares | | | Amount | |
Primary Class | | | | | | | | | | | | | | |
Shares sold | | 323,437 | | | $ | 3,068,488 | | | 546,261 | | | $ | 6,603,007 | |
Shares issued on reinvestment | | 42,395 | | | | 403,602 | | | 2,093,967 | | | | 22,785,853 | |
Shares repurchased | | (2,408,522 | ) | | | (22,712,548 | ) | | (6,828,085 | ) | | | (79,049,176 | ) |
| | | | | | | | | | | | | | |
Net Decrease | | (2,042,690 | ) | | $ | (19,240,458 | ) | | (4,187,857 | ) | | $ | (49,660,316 | ) |
| | | | | | | | | | | | | | |
Institutional Class | | | | | | | | | | | | | | |
Shares sold | | 212,832 | | | $ | 2,318,282 | | | 822,469 | | | $ | 11,074,327 | |
Shares issued on reinvestment | | 26,319 | | | | 287,922 | | | 319,399 | | | | 3,985,324 | |
Shares repurchased | | (1,173,621 | ) | | | (13,123,347 | ) | | (1,043,915 | ) | | | (14,385,655 | ) |
| | | | | | | | | | | | | | |
Net Increase (Decrease) | | (934,470 | ) | | $ | (10,517,143 | ) | | 97,953 | | | $ | 673,996 | |
| | | | | | | | | | | | | | |
6. Recent Accounting Pronouncements
In March 2008, the Financial Accounting Standards Board issued Statement of Financial Accounting Standards No. 161, “Disclosures about Derivative Instruments and Hedging Activities” (“FAS 161”). FAS 161 is effective for fiscal years and interim periods beginning after November 15, 2008. FAS 161 requires enhanced disclosures about a fund’s derivative and hedging activities, including how such activities are accounted for and their effect on a fund’s financial position, performance and cash flows.
The Funds’ investment policies do not permit the Funds to engage in derivative transactions. Unless the Funds’ investment policies change and the Funds begin engaging in derivative transactions, FAS 161 will have no impact on the Funds’ disclosures.
Notes
Notes
Notes
Fund Information
Investment Managers
For American Leading Companies Trust:
Legg Mason Capital Management, Inc.
Baltimore, MD
For U.S. Small-Cap Value Trust:
Legg Mason Fund Adviser, Inc.
Baltimore, MD
Investment Advisers
For American Leading Companies Trust:
Legg Mason Capital Management, Inc.
Baltimore, MD
For U.S. Small-Cap Value Trust:
Brandywine Global Investment Management, LLC
Philadelphia, PA
Board of Directors
John F. Curley, Jr., Chairman
Mark R. Fetting, President
Dr. Ruby P. Hearn
Arnold L. Lehman
Robin J.W. Masters
Dr. Jill E. McGovern
Arthur S. Mehlman
G. Peter O’Brien
S. Ford Rowan
Robert M. Tarola
Officers
Marie K. Karpinski, Vice President and Chief Financial Officer
Gregory T. Merz, Vice President and Chief Legal Officer
Ted P. Becker, Vice President and Chief Compliance Officer
Wm. Shane Hughes, Treasurer
Susan C. Curry, Assistant Treasurer
William S. Kirby, Assistant Treasurer
Richard M. Wachterman, Secretary
Peter J. Ciliberti, Assistant Secretary
Transfer and Shareholder Servicing Agent
Boston Financial Data Services
Braintree, MA
Custodian
State Street Bank & Trust Company
Boston, MA
Counsel
K&L Gates LLP
Washington, DC
Independent Registered Public Accounting Firm
PricewaterhouseCoopers LLP
Baltimore, MD
About the Legg Mason Funds
| | |
Equity Funds American Leading Companies Trust Classic Valuation Fund Growth Trust Special Investment Trust U.S. Small-Capitalization Value Trust Value Trust Specialty Fund Opportunity Trust Global Funds Emerging Markets Trust International Equity Trust Taxable Bond Funds Investment Grade Income Portfolio Limited Duration Bond Portfolio Tax-Free Bond Fund Maryland Tax-Free Income Trust | | Legg Mason, Inc., based in Baltimore, Maryland, has built its reputation, at least in part, on the success of the Legg Mason Funds, introduced in 1979. The primary purpose of our funds is to enable investors to diversify their portfolios across various asset classes and, consequently, enjoy the stability and growth prospects generally associated with diversification. The success of our funds is contingent on the experience, discipline, and acumen of our fund managers. We believe the quality of our managers is crucial to investment success. Unlike many firms, which focus on a particular asset class or the fluctuations of the market, at Legg Mason we focus on providing a collection of top-notch managers in all the major asset classes. Information about the policies and procedures that each Fund uses to determine how to vote proxies relating to its portfolio securities is contained in the Statement of Additional Information, available without charge upon request by calling 1-800-822-5544 or on the Securities and Exchange Commission’s (“SEC”) website (http://www.sec.gov). Information regarding how each Fund voted proxies relating to portfolio securities during the most recent twelve-month period ended June 30 is also available on the SEC’s website or through the Legg Mason Funds’ website at www.leggmason.com/individualinvestors. Each Fund files its complete schedule of portfolio holdings with the SEC for the first and third quarters of each fiscal year on Form N-Q. You may obtain a free copy of each Fund’s portfolio holdings as filed on Form N-Q, by contacting each Fund at the appropriate phone number, address or website listed below. Additionally, each Fund’s Form N-Q is available on the SEC’s website (http://www.sec.gov) or may be reviewed and copied at the SEC’s Public Reference Room in Washington, DC. Information about the operation of the Public Reference Room may be obtained by calling 1-800-SEC-0330. |
This report must be preceded or accompanied by a free prospectus. Investors should consider each Fund’s investment objectives, risks, charges, and expenses carefully before investing. The prospectus contains this and other important information about each Fund. For a free prospectus for this or any other Legg Mason Fund, visit www.leggmason.com/individualinvestors. Please read the prospectus carefully before investing.
| | |
| Legg Mason Funds | | Legg Mason Investor Services-Institutional |
| For Primary Class Shareholders | | For R, FI and I Class Shareholders |
| c/o BFDS | | c/o BFDS, P.O. Box 8037 |
| P.O. Box 55214 | | Boston, MA 02206-8037 |
| Boston, MA 02205-8504 | | 888-425-6432 |
| 800-822-5544 | | www.lminstitutionalfunds.com |
| www.leggmason.com/individualinvestors | | |
| | | | |
| | Legg Mason Investor Services, LLC, Distributor | |  |
| | A Legg Mason, Inc. Subsidiary | |
LMF-013/S (11/08) TN08-3395 | | | |
Not applicable for semiannual reports.
| Item 3. | Audit Committee Financial Expert. |
Not applicable for semiannual reports.
| Item 4. | Principal Accountant Fees and Services. |
Not applicable for semiannual reports.
Page 2 of 5
| Item 5. | Audit Committee of Listed Registrants. |
The Registrant is not a listed issuer as defined in Rule 10A-3 under the Securities Exchange Act of 1934.
| Item 6. | Schedule of Investments |
The schedule of investments in securities of unaffiliated issuers is included as part of the report to shareholders filed under Item 1 of this Form.
| Item 7. | Disclosure of Proxy Voting Policies and Procedures for Closed-End Management Investment Companies. |
Not applicable.
| Item 8. | Portfolio Managers of Closed-End Management Investment Companies. |
Not applicable.
| Item 9. | Purchases of Equity Securities by Closed-End Management Investment Companies and Affiliated Purchasers. |
Not applicable.
| Item 10. | Submission of Matters to a Vote of Security Holders. |
Not applicable.
| Item 11. | Controls and Procedures. |
(a) The Registrant’s principal executive and principal financial officers have concluded, based on their evaluation of the effectiveness of the design and operation of the Registrant’s disclosure controls and procedures (as defined in Rule 30a-3(c) under the Investment Company Act of 1940) as of a date within 90 days of the filing date of this report that the Registrant’s disclosure controls and procedures are effective, and that the disclosure controls and procedures are reasonably designed to ensure that (1) the information required to be disclosed by the Registrant on Form N-CSR is recorded, processed, summarized and reported within the time periods specified in the SEC’s rules and forms and (2) that information required to be disclosed is properly communicated to the Registrant’s management, including its principal executive and principal financial officers, as appropriate, to allow timely decisions regarding the required disclosures.
(b) There were no changes in the Registrant’s internal control over financial reporting (as defined in Rule 30a-3(d) under the Investment Company Act of 1940) during the Registrant’s second fiscal quarter of the period covered by this report that have materially affected, or are reasonably likely to materially affect, the Registrant’s internal control over financial reporting.
Page 3 of 5
(a) (1) Not applicable for semiannual reports.
(a) (2) Separate certifications for the Registrant’s principal executive officer and principal financial officer are attached.
(a) (3) Not applicable.
(b) Separate certifications for the Registrant’s principal executive officer and principal financial officer are attached.
The certifications provided pursuant to Rule 30a-2(b) of the Investment Company Act of 1940 and Section 906 of the Sarbanes-Oxley Act are not deemed “filed” for purposes of Section 18 of the Securities Exchange Act of 1934 (“Exchange Act”), or otherwise subject to the liability of that section. Such certifications will not be deemed to be incorporated by reference into any filing under the Securities Act of 1933 or the Exchange Act, except to the extent that the Registrant specifically incorporates them by reference.
Page 4 of 5
SIGNATURES
Pursuant to the requirements of the Securities Exchange Act of 1934 and the Investment Company Act of 1940, the Registrant has duly caused this report to be signed on its behalf by the undersigned, thereunto duly authorized.
|
| Legg Mason Investors Trust, Inc. |
|
/s/ Mark R. Fetting |
| Mark R. Fetting |
| President, Legg Mason Investors Trust, Inc. |
|
| Date: November 24, 2008 |
Pursuant to the requirements of the Securities Exchange Act of 1934 and the Investment Company Act of 1940, this report has been signed below by the following persons on behalf of the registrant and in the capacities and on the dates indicated.
|
/s/ Mark R. Fetting |
| Mark R. Fetting |
| President, Legg Mason Investors Trust, Inc. |
|
| Date: November 24, 2008 |
|
/s/ Marie K. Karpinski |
| Marie K. Karpinski |
| Vice President and Chief Financial Officer, Legg Mason Investors Trust, Inc. |
|
| Date: November 24, 2008 |
Page 5 of 5