UNITED STATES
SECURITIES AND EXCHANGE COMMISSION
Washington, D.C. 20549
FORM N-CSR
CERTIFIED SHAREHOLDER REPORT OF REGISTERED
MANAGEMENT INVESTMENT COMPANIES
Investment Company Act file number 811-07692
Legg Mason Investors Trust Inc.
(Exact name of Registrant as specified in charter)
55 Water Street, New York, NY 10041
(Address of principal executive offices) (Zip code)
Robert I. Frenkel, Esq.
Legg Mason & Co., LLC
100 First Stamford Place
Stamford, CT 06902
(Name and address of agent for service)
Registrant’s telephone number, including area code:
Funds Investor Services 1-800-822-5544
or
Institutional Shareholder Services 1-888-425-6432
Date of fiscal year end: October 31
Date of reporting period: April 30, 2010
| ITEM 1. | REPORT TO STOCKHOLDERS. |
The Semi-Annual Report to Stockholders is filed herewith.
April 30, 2010

Investment Commentary and
Semi-Annual Repor t
Legg Mason
Capital Management
American Leading
Companies Trust
INVESTMENT PRODUCTS: NOT FDIC INSURED • NO BANK GUARANTEE • MAY LOSE VALUE
| | |
| II | | Legg Mason Capital Management American Leading Companies Trust |
Fund objective
The Fund seeks long-term capital appreciation and current income consistent with prudent investment risk.
Fund name change
Prior to October 5, 2009, the Fund was known as Legg Mason American Leading Companies Trust. There was no change in the Fund’s investment objective or investment policies as a result of the name change.
Investment commentary
Market overview
The current bull market celebrated its first birthday on March 9, 2010 but with little fanfare. The Wall Street Journal wrote a subdued front page story on the event, but the New York Times and Financial Times barely made note of it. This strikes us as odd, and probably quite bullish, since the twelve-month return of the S&P 500 Index i from March 9, 2009 (+72.29%) was the best in over seventy years. Instead of sporting party hats, many observers seem more inclined to fret about when the next correction might begin. Michael Santoli’s March 15, 2010 Streetwise column in Barron’s entitled “Is Another Market Pullback Near?” exemplified the cautious mood, failing to even mention the fact that the bull’s first birthday had occurred in the previous week.
One would think that following such a bountiful year in the equity market, investors would be positively giddy with excitement. Nothing could be further from the truth. Anecdotal evidence from discussions with a number of friends who are financial advisors reveals that most investors remain very nervous and highly skeptical of the market’s recovery. Flow of funds data support the same conclusion, as flows into U.S. equity funds have only recently turned modestly positive, after being hugely negative all last year, while flows into bond funds have been massive.
In early 2009, in many respects, it required a considerable leap of faith to be bullish on equities. Among other things, one had to believe that frozen credit markets would thaw, that gapping credit spreads would normalize, that the banking system would survive and that the sickening year-long decline in global equity markets would one day end. Many investors were unwilling or unable to make that leap of faith and, as a consequence, have missed one of the most powerful upswings in stock market history.
In our judgment, no such leap of faith is required today to be bullish on equities. An objective evaluation of the available evidence should be sufficient to do so, in our opinion. Credit markets have healed, credit spreads have narrowed and the banking system has been recapitalized. Most economic indicators point to recovery and corporate profits have snapped back strongly. So far, for many investors the evidence has not been sufficient to persuade them to be bullish.
We believe most investors remain far too pessimistic about the outlook for equities. The economy is clearly in recovery, corporate earnings are booming and stocks are not expensive. With the Federal Reserve Board (“Fed”)ii likely to be on hold until late this year due to moderating rates of core inflation, slack in the economy and continuing high rates of unemployment, we think we are in the sweet spot of the equity investment cycle. Stocks are clearly not as cheap as they were a year ago, but they are still attractive, in our view, especially relative to cash, which yields next to nothing, and bonds, which face the headwind of rising long-term interest rates. Rising long-term rates will ultimately pose a headwind for equities but, in the near term, powerful earnings growth will mitigate the damage in our view.
The Investment Commentary is not a part of the Semi-Annual Report.
| | |
| Legg Mason Capital Management American Leading Companies Trust | | III |
Investment results
Total returns for Legg Mason Capital Management American Leading Companies Trust (the “Fund”) for various periods ended April 30, 2010 are presented below, along with those of comparative indices:
| | | | | | | | | | | | | | | |
| Average Annual Total Returns | |
| | | 6
months | | | 1
year | | | 5
years | | | 10
years | | | Since
inception | |
| Without Sales Charges | | | | | | | | | | | | | | | |
Class A | | 19.84 | % | | 50.55 | % | | N/A | | | N/A | | | 42.80 | % |
Class C | | 19.39 | % | | 49.49 | % | | -3.04 | % | | 0.04 | % | | 5.18 | % |
Class I1 | | 20.03 | % | | 51.00 | % | | -2.08 | % | | N/A | | | 0.56 | % |
| S&P 500 Index | | 15.66 | % | | 38.84 | % | | 2.63 | % | | -0.19 | % | | 7.84 | % |
| Lipper Large-Cap Value Funds Category Averageiii | | 14.65 | % | | 38.20 | % | | 1.63 | % | | 2.89 | % | | 7.55 | % |
| With Sales Charges | | | | | | | | | | | | | | | |
Class A | | 12.91 | % | | 41.85 | % | | N/A | | | N/A | | | 36.09 | % |
Class C | | 18.39 | % | | 48.49 | % | | -3.04 | % | | 0.04 | % | | 5.18 | % |
Class I1 | | 20.03 | % | | 51.00 | % | | -2.08 | % | | N/A | | | 0.56 | % |
The performance shown represents past performance. Past performance is no guarantee of future results and current performance may be higher or lower than the performance shown above. Principal value and investment returns will fluctuate and investors’ shares, when redeemed, may be worth more or less than their original cost. To obtain performance data current to the most recent month-end, please visit our website at www.leggmason.com/individualinvestors.
All share class returns assume the reinvestment of all distributions, including returns of capital, if any, at net asset value and the deduction of all Fund expenses. Performance figures for periods shorter than one year represent cumulative figures and are not annualized.
Performance figures reflect compensating balance agreements, expense reimbursements and/or fee waivers, without which the performance would have been lower.
For performance data including the effects of sales charges, Class A shares reflect the deduction of a maximum initial sales charge of 5.75%, and Class C shares reflect the deduction of a contingent deferred sales charge of 1.00%, which applies if shares are redeemed within one year of purchase.
The inception dates of Class A, C and I shares are February 3, 2009, September 1, 1993 and June 14, 2001, respectively. The Index return is for the period beginning September 1, 1993. The Lipper return is for the period beginning August 31, 1993. All Index performance reflects no deduction for fees, expenses or taxes. Please note that an investor cannot invest directly in an index.
As of the Fund’s most current prospectus dated February 26, 2010, the gross total operating expense ratios for Class A, Class C and Class I shares were 1.16%, 1.92% and 0.91%, respectively.
Actual expenses may be higher. For example, expenses may be higher than those shown if average net assets decrease. Net assets are more likely to decrease and Fund expense ratios are more likely to increase when markets are volatile.
1 Prior to October 5, 2009, Class I was known as the Institutional Class.
For the six months ended April 30, 2010, Class C shares of Legg Mason Capital Management American Leading Companies Trust, excluding sales charges, returned 19.39%. The Fund’s unmanaged benchmark, the S&P 500 Index, returned 15.66% over the same time frame. The Lipper Large-Cap Value Funds Category Average returned 14.65% for the same period.
On an absolute basis, the Fund had positive total returns in nine of the ten equity market sectors over the six-month period, with the greatest contributions coming from the Industrials, Materials and Health Care sectors. The only sector with a negative return was Utilities; however, the Fund had a modest exposure and, therefore, the negative impact was not substantial.
On a relative basis, the Fund outperformed its benchmark for the period due to security selection decisions and, to a lesser extent, due to the interaction of our sector allocation and security selection. The greatest contributors to relative security selection outperformance were in the Industrials and Materials sectors and, to a lesser degree, the Health Care sector. Selection decisions in the Information Technology, Utilities and Energy sectors offset these gains somewhat.
Significant contributors
UAL Corp. and Delta Air Lines Inc. contributed positively to performance during the period, with investor enthusiasm over merger plans with Continental Airlines, Inc. buoying the former and improved industry metrics boosting the latter. The UAL-Continental merger would create the world’s largest airline in an industry many analysts feel needs further consolidation. If the merger agreement can overcome potential regulatory hurdles, the deal is both strategically compelling and value accretive in the long run. More broadly, UAL and Delta benefited from improving trends in the airline industry and in the economy. After more than a year of capacity reductions, airplanes are fuller than ever, business travel is picking up and ticket prices continue to rebound. Improving jobs data also bolstered airlines, as falling unemployment usually leads to greater demand from both leisure and business travelers.
Prudential Financial Inc. carried its solid 2009 showing into the new year as the company’s industry-leading financial strength has grown even stronger. Credit normalization has continued to play
The Investment Commentary is not a part of the Semi-Annual Report.
| | |
| IV | | Legg Mason Capital Management American Leading Companies Trust |
Investment commentary (cont’d)
a role in the stock’s upward moves, leading to net gains in its investment portfolio and sustained growth in book value. By generating powerful sales growth even after record gains in the third quarter of 2009, the company is demonstrating that its market share gains in 2009 may be more sustainable than investors expected. We believe that Prudential’s recent results point to continued strength in its business franchise, and we believe that valuation remains attractive given the company’s greater long-term growth potential and higher return on equity (“ROE”) relative to its peers.
Significant detractors
Goldman Sachs Group Inc. shares lost about 15% of their value in April 2010 following a civil lawsuit by the Securities and Exchange Commission (“SEC”) alleging that the investment bank fraudulently marketed a collateralized debt obligation (“CDO”) tied to subprime mortgages. We continue to believe the company’s shares are undervalued, trading at around 8x next year’s earnings with about 20% ROE. While the lawsuit creates political, reputational and headline risk, unless something new emerges, at the end of the day we think it is unlikely to result in a lasting impact on the firm. Current prices, in our view, discount returns far below present levels, meaning the stock already discounts very stringent reforms.
A disappointing first quarter earnings report following a dilutive equity raise in December 2009 weighed on AES Corp. In March 2010, AES closed a deal with the China Investment Corporation that gives the sovereign wealth fund a 15% stake in AES for $1.6 billion. While enhancing its ability to invest in new generation projects and bolstering the company’s balance sheet, the move diluted existing shareholders and pushed the stock down. That deal came after the company’s first quarter earnings missed on the bottom line and management’s guidance for 2010 and 2011 came in below expectations, further discouraging investors. While we believe AES will benefit longer term from the growing need for power generation around the world and will grow significantly as a result over the foreseeable future, deploying new capital in a competitive environment creates uncertainty about long-term growth.
Shares of Nokia OYJ (ADR) staged a comeback during the first quarter of 2010 but it wasn’t enough to overcome the stock’s sluggish performance at the end of 2009. The handset manufacturer suffered a mixed fourth quarter, reporting steep declines in gross margins and eroding market share in the hot smartphone segment. Even though cost reductions and product development were bright spots, investors were not convinced and sent shares lower. The firm rebounded in the subsequent quarter, beating estimates handily for the first time in several quarters. Management appears to be doing the right things to improve its smartphone portfolio, narrowing its focus to help improve time to market and application development. The company has new versions of its Symbian operating system slated for later this year. As smartphones continue their push into the mainstream, Nokia is well-positioned to capitalize on this given its strong brand recognition and customer relationship across most of the globe. Further, its leverage to emerging market growth and its potential for margin improvement underscore the longer-term investment case for the stock.
Market outlook
In thinking about how best to convey our thoughts on the outlook for the U.S. equity market at this juncture, we find a framing that PIMCO co-CEO Mohammed El-Erian has used in a couple of recent press interviews to be a useful mental model. In a Barron’s interview on May 3, 2010 and an earlier Q&A on April 26, 2010 with Financial Times reporter Henny Sender, El-Erian offered the view that the current economic environment is being driven by strong cyclical tailwinds but faces looming structural headwinds. El-Erian’s opinion is that the market is placing too much emphasis on the cyclical tailwinds and not enough on the structural headwinds. In his May 3rd Barron’s interview with Leslie Norton, El-Erian said:
There are very strong cyclical tailwinds that will hit structural headwinds in the second half. The cyclical tailwinds driven by the stimulus and the inventory cycle will get weaker. The structural headwinds of consistently high unemployment, difficult credit conditions and a very large fiscal deficit become more of a reality. Cyclical tailwinds speak directly to the market’s playbook. Structural headwinds do not. Then, the market has a problem aggregating all these together into a new picture. Human beings are anchored by certain things.
The minute something takes us out of our comfort zone, out of what is familiar, we need overwhelming evidence that it’s happening. That leads to a recognition lag. Market participants are challenged because you can be too early or too late.
The Investment Commentary is not a part of the Semi-Annual Report.
| | |
| Legg Mason Capital Management American Leading Companies Trust | | V |
We believe El-Erian’s comments are very insightful and focus the discussion about the outlook for the economy and the market exactly where it needs to be. Where we disagree with PIMCO, at present, is the degree of weight to accord each of these two opposing forces in positioning portfolios. PIMCO’s belief that the U.S. economy is headed for a “new normal” characterized by secularly slower growth is driven, in our view, by its conviction that structural headwinds will dominate the economic landscape. In contrast, our portfolio positioning has, for the last year or so, been driven by the belief that because of the trauma of the prior deep recession and brutal bear market, most investors have been consistently underestimating the powerful cyclical recovery potential of the economy and its leveraged effect on the recovery in corporate earnings. To this point, that portfolio positioning has been correct. The key question now, in our opinion, is when, and how quickly, to transition from a pro-cyclical portfolio positioning to one that is appropriate for a more normalized economic environment. We believe 2010 is the year in which this transition needs to be made.
Investor skepticism concerning the economy’s recovery potential has gone through a number of stages. In the teeth of the recession, many observers claimed that the economy would not recover at all, and we were, in fact, headed for another depression. Once the economy showed signs of life, skeptics said that any recovery would be anemic, taking the shape of a “U” or “L” or “W” (the double-dip school of thought), but certainly not the “V” shape that has characterized past recoveries from severe recessions. Now that the recovery has displayed more V-shaped characteristics than most observers believed possible, the debate has begun as to whether the recovery is as strong as it should be, and whether or not it can stand on its own two feet as monetary and fiscal stimulus is withdrawn over the next year or so.
These last two questions — the ultimate strength and sustainability of the recovery — are key considerations, and we will continue to evaluate the evidence as it unfolds. For now, we think the available evidence supports the view that the economic recovery will be stronger than most observers expect, but likely not as strong as history would suggest coming out of a deep recession. (The structural headwinds are real, not imagined.) We also continue to believe that investors generally fail to fully appreciate the power of the recovery underway in corporate earnings. Though consensus earnings estimates are clearly pointing in this direction, we don’t think most investors have much faith in the numbers.
Finally, we continue to believe that investors — traumatized by their disastrous experience with stocks in the bear market of 2007-2009 — are turning a blind eye to the current attractiveness of equities relative to cash and bonds. We think the continued recovery in earnings in the U.S. and relative stability of the U.S. dollar, together with legitimate investor concerns about the outlook for equities in the Eurozone and China, could transform U.S. equities into a favored asset class, rather than one to be underweighted or avoided.
As always, we thank you for your support and welcome your comments.
Sincerely,

David E. Nelson, CFA
May 18, 2010
RISKS: Equity securities are subject to price fluctuation and possible loss of principal. The manager’s investment style may become out of favor and/or the manager’s selection process may prove incorrect, which may have a negative impact on the Fund’s performance. The value approach to investing involves the risk that those stocks deemed to be undervalued by the portfolio manager may remain undervalued. The Fund may focus its investments in certain regions or industries, thereby increasing its potential vulnerability to market volatility. Additional risks may include those risks associated with investing in foreign and fixed-income securities. Please see the Fund’s prospectus for more information on these and other risks.
Portfolio holdings and breakdowns are as of April 30, 2010 and are subject to change and may not be representative of the portfolio manager’s current or future investments. The Fund’s top ten holdings (as a percentage of net assets) as of this date were: UAL Corp. (4.5%), Microsoft Corp. (3.9%), Hewlett-Packard Co. (3.8%), International Business Machines Corp. (3.2%), eBay Inc. (2.8%), Time Warner Inc. (2.8%), JPMorgan Chase & Co. (2.6%), EMC Corp. (2.3%), Texas Instruments Inc. (2.3%) and Nokia OYJ, ADR (2.3%). Please refer to pages 4 through 7 for a list and percentage breakdown of the Fund’s holdings.
The mention of sector breakdowns is for informational purposes only and should not be construed as a recommendation to purchase or sell any securities. The information provided regarding such sectors is not a sufficient basis upon which to make an investment decision. Investors seeking financial advice regarding the appropriateness of investing in any securities or investment strategies discussed should consult their financial professional. The Fund’s top five sector holdings (as a percentage of net assets) as of April 30, 2010 were: Information Technology (24.2%), Financials (18.3%), Industrials (16.6%), Health Care (10.2%) and Consumer Staples (7.2%). The Fund’s portfolio composition is subject to change at any time.
The Investment Commentary is not a part of the Semi-Annual Report.
| | |
| VI | | Legg Mason Capital Management American Leading Companies Trust |
Investment commentary (cont’d)
The views expressed in this commentary reflect those solely of the portfolio manager as of the date of this commentary and may differ from those of Legg Mason, Inc. as a whole or the other portfolio managers of its affiliates. Any such views are subject to change at any time based on market or other conditions. These views are not intended to be a forecast of future events, a guarantee of future results or investment advice. The information contained herein has been prepared from sources believed to be reliable, but cannot be guaranteed. Forecasts and predictions are inherently limited and should not be relied upon as an indication of actual or future performance.
All investments are subject to risk including the possible loss of principal. All index performance reflects no deduction for fees, expenses or taxes. Please note that an investor cannot invest directly in an index.
| i | The S&P 500 Index is an unmanaged index of 500 stocks and is generally representative of the performance of larger companies in the U.S. |
| ii | The Federal Reserve Board (“Fed”) is responsible for the formulation of policies designed to promote economic growth, full employment, stable prices and a sustainable pattern of international trade and payments. |
| iii | Lipper, Inc., a wholly-owned subsidiary of Reuters, provides independent insight on global collective investments. The Lipper Large-Cap Value Funds Category Average is comprised of the Fund’s peer group of mutual funds. |
The Investment Commentary is not a part of the Semi-Annual Report.
April 30, 2010
Semi-Annual Repor t
Legg Mason
Capital Management
American Leading
Companies Trust
INVESTMENT PRODUCTS: NOT FDIC INSURED • NO BANK GUARANTEE • MAY LOSE VALUE
| | |
| Legg Mason Capital Management American Leading Companies Trust 2010 Semi-Annual Report | | 1 |
Letter to our shareholders
Dear Shareholder,
We are pleased to provide the semi-annual report of Legg Mason Capital Management American Leading Companies Trust for the six-month reporting period ended April 30, 2010.
Important information with regard to recent regulatory developments that may affect the Fund is contained in the Notes to Financial Statements included in this report.
As always, we remain committed to providing you with excellent service and a full spectrum of investment choices. We also remain committed to supplementing the support you receive from your financial advisor. One way we accomplish this is through our website, www.leggmason.com/individualinvestors. Here you can gain immediate access to market and investment information, including:
| Ÿ | | Fund prices and performance, |
| Ÿ | | Market insights and commentaries from our portfolio managers, and |
| Ÿ | | A host of educational resources. |
We look forward to helping you meet your financial goals.
Sincerely,
| | |
 | |  |
Mark R. Fetting Chairman | | David R. Odenath President |
May 28, 2010
| | |
| 2 | | Legg Mason Capital Management American Leading Companies Trust 2010 Semi-Annual Report |
Fund at a glance† (unaudited)
Investment breakdown (%) as a percent of total investments
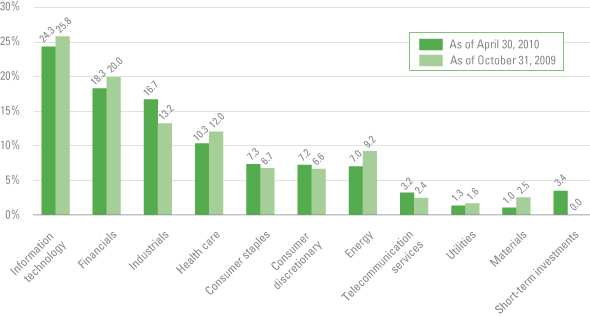
| † | The bar graph above represents the composition of the Fund’s investments as of April 30, 2010 and October 31, 2009. The Fund is actively managed. As a result, the composition of the Fund’s investments is subject to change at any time. |
| | |
| Legg Mason Capital Management American Leading Companies Trust 2010 Semi-Annual Report | | 3 |
Fund expenses (unaudited)
Example
As a shareholder of the Fund, you may incur two types of costs: (1) transaction costs, including front-end and back-end sales charges (loads) on purchase payments; and (2) ongoing costs, including management fees; distribution and/or service (12b-1) fees; and other Fund expenses. This example is intended to help you understand your ongoing costs (in dollars) of investing in the Fund and to compare these costs with the ongoing costs of investing in other mutual funds.
This example is based on an investment of $1,000 invested on November 1, 2009 and held for the six months ended April 30, 2010.
Actual expenses
The table below titled “Based on Actual Total Return” provides information about actual account values and actual expenses. You may use the information provided in this table, together with the amount you invested, to estimate the expenses that you paid over the period. To estimate the expenses you paid on your account, divide your ending account value by $1,000 (for example, an $8,600 ending account value divided by $1,000 = 8.6), then multiply the result by the number under the heading entitled “Expenses Paid During the Period”.
| | | | | | | | | | | | | | | |
| Based on actual total return1 |
| | | Actual Total
Return
Without
Sales
Charges2 | | | Beginning
Account
Value | | Ending
Account
Value | | Annualized
Expense
Ratio | | | Expenses
Paid
During
the
Period3 |
| Class A | | 19.84 | % | | $ | 1,000.00 | | $ | 1,198.40 | | 1.15 | % | | $ | 6.27 |
| Class C | | 19.39 | | | | 1,000.00 | | | 1,193.90 | | 1.90 | | | | 10.34 |
| Class I | | 20.03 | | | | 1,000.00 | | | 1,200.30 | | 0.90 | | | | 4.91 |
Hypothetical example for comparison purposes
The table below titled “Based on Hypothetical Total Return” provides information about hypothetical account values and hypothetical expenses based on the actual expense ratio and an assumed rate of return of 5.00% per year before expenses, which is not the Fund’s actual return. The hypothetical account values and expenses may not be used to estimate the actual ending account balance or expenses you paid for the period. You may use the information provided in this table to compare the ongoing costs of investing in the Fund and other funds. To do so, compare the 5.00% hypothetical example relating to the Fund with the 5.00% hypothetical examples that appear in the shareholder reports of the other funds.
Please note that the expenses shown in the table below are meant to highlight your ongoing costs only and do not reflect any transactional costs, such as front-end or back-end sales charges (loads). Therefore, the table is useful in comparing ongoing costs only, and will not help you determine the relative total costs of owning different funds. In addition, if these transaction costs were included, your costs would have been higher.
| | | | | | | | | | | | | | | |
| Based on hypothetical total return1 |
| | | Hypothetical
Annualized
Total Return | | | Beginning
Account
Value | | Ending
Account
Value | | Annualized
Expense
Ratio | | | Expenses
Paid
During
the
Period3 |
| Class A | | 5.00 | % | | $ | 1,000.00 | | $ | 1,019.09 | | 1.15 | % | | $ | 5.76 |
| Class C | | 5.00 | | | | 1,000.00 | | | 1,015.37 | | 1.90 | | | | 9.49 |
| Class I | | 5.00 | | | | 1,000.00 | | | 1,020.33 | | 0.90 | | | | 4.51 |
| 1 | For the six months ended April 30, 2010. |
| 2 | Assumes the reinvestment of all distributions, including returns of capital, if any, at net asset value and does not reflect the deduction of the applicable initial sales charge with respect to Class A shares or the applicable contingent deferred sales charge (“CDSC”) with respect to Class C shares. Total return is not annualized, as it may not be representative of the total return for the year. Performance figures may reflect compensating balance agreements, fee waivers and/or expense reimbursements. In the absence of compensating balance agreements, fee waivers and/or expense reimbursements, the total return would have been lower. Past performance is no guarantee of future results. |
| 3 | Expenses (net of compensating balance agreements, fee waivers and/or expense reimbursements) are equal to each class’ respective annualized expense ratio multiplied by the average account value over the period, multiplied by the number of days in the most recent fiscal half-year, then divided by 365. |
| | |
| 4 | | Legg Mason Capital Management American Leading Companies Trust 2010 Semi-Annual Report |
Schedule of investments (unaudited)
April 30, 2010
Legg Mason Capital Management American Leading Companies Trust
| | | | | | | | | | |
| Security | | | | | | Shares | | Value | |
| Common Stocks — 96.2% | | | | | | | | | | |
| Consumer Discretionary — 7.2% | | | | | | | | | | |
Media — 5.7% | | | | | | | | | | |
CBS Corp., Class B Shares | | | | | | 230,000 | | $ | 3,728,300 | |
DIRECTV, Class A Shares | | | | | | 20,000 | | | 724,600 | * |
Time Warner Cable Inc. | | | | | | 47,608 | | | 2,677,950 | |
Time Warner Inc. | | | | | | 200,000 | | | 6,616,000 | |
Total Media | | | | | | | | | 13,746,850 | |
Specialty Retail — 1.5% | | | | | | | | | | |
TJX Cos. Inc. | | | | | | 75,000 | | | 3,475,500 | |
Total Consumer Discretionary | | | | | | | | | 17,222,350 | |
| Consumer Staples — 7.2% | | | | | | | | | | |
Beverages — 0.5% | | | | | | | | | | |
PepsiCo Inc. | | | | | | 18,000 | | | 1,173,960 | |
Food & Staples Retailing — 3.0% | | | | | | | | | | |
Costco Wholesale Corp. | | | | | | 55,000 | | | 3,249,400 | |
Safeway Inc. | | | | | | 120,000 | | | 2,832,000 | |
Wal-Mart Stores Inc. | | | | | | 21,000 | | | 1,126,650 | |
Total Food & Staples Retailing | | | | | | | | | 7,208,050 | |
Household Products — 0.5% | | | | | | | | | | |
Procter & Gamble Co. | | | | | | 19,000 | | | 1,181,040 | |
Tobacco — 3.2% | | | | | | | | | | |
Altria Group Inc. | | | | | | 125,000 | | | 2,648,750 | |
Philip Morris International Inc. | | | | | | 105,000 | | | 5,153,400 | |
Total Tobacco | | | | | | | | | 7,802,150 | |
Total Consumer Staples | | | | | | | | | 17,365,200 | |
| Energy — 7.0% | | | | | | | | | | |
Energy Equipment & Services — 5.1% | | | | | | | | | | |
Baker Hughes Inc. | | | | | | 65,000 | | | 3,234,400 | |
National-Oilwell Varco Inc. | | | | | | 70,000 | | | 3,082,100 | |
Noble Corp. | | | | | | 88,000 | | | 3,475,120 | * |
Transocean Ltd. | | | | | | 35,000 | | | 2,535,750 | * |
Total Energy Equipment & Services | | | | | | | | | 12,327,370 | |
Oil, Gas & Consumable Fuels — 1.9% | | | | | | | | | | |
Apache Corp. | | | | | | 31,000 | | | 3,154,560 | |
Exxon Mobil Corp. | | | | | | 20,000 | | | 1,357,000 | |
Total Oil, Gas & Consumable Fuels | | | | | | | | | 4,511,560 | |
Total Energy | | | | | | | | | 16,838,930 | |
| Financials — 18.3% | | | | | | | | | | |
Capital Markets — 4.3% | | | | | | | | | | |
Goldman Sachs Group Inc. | | | | | | 25,000 | | | 3,630,000 | |
Morgan Stanley | | | | | | 120,000 | | | 3,626,400 | |
State Street Corp. | | | | | | 70,000 | | | 3,045,000 | |
Total Capital Markets | | | | | | | | | 10,301,400 | |
Commercial Banks — 1.2% | | | | | | | | | | |
Wells Fargo & Co. | | | | | | 87,500 | | | 2,897,125 | |
Consumer Finance — 1.8% | | | | | | | | | | |
Capital One Financial Corp. | | | | | | 100,000 | | | 4,341,000 | |
See Notes to Financial Statements.
| | |
| Legg Mason Capital Management American Leading Companies Trust 2010 Semi-Annual Report | | 5 |
Legg Mason Capital Management American Leading Companies Trust
| | | | | | | | | | |
| Security | | | | | | Shares | | Value | |
Diversified Financial Services — 3.8% | | | | | | | | | | |
Bank of America Corp. | | | | | | 160,000 | | $ | 2,852,800 | |
JPMorgan Chase & Co. | | | | | | 148,000 | | | 6,301,840 | |
Total Diversified Financial Services | | | | | | | | | 9,154,640 | |
Insurance — 7.2% | | | | | | | | | | |
AFLAC Inc. | | | | | | 75,000 | | | 3,822,000 | |
Hartford Financial Services Group Inc. | | | | | | 155,000 | | | 4,428,350 | |
MetLife Inc. | | | | | | 92,000 | | | 4,193,360 | |
Prudential Financial Inc. | | | | | | 75,000 | | | 4,767,000 | |
Total Insurance | | | | | | | | | 17,210,710 | |
Total Financials | | | | | | | | | 43,904,875 | |
| Health Care — 10.2% | | | | | | | | | | |
Biotechnology — 2.4% | | | | | | | | | | |
Amgen Inc. | | | | | | 73,000 | | | 4,187,280 | * |
Genzyme Corp. | | | | | | 30,000 | | | 1,597,200 | * |
Total Biotechnology | | | | | | | | | 5,784,480 | |
Health Care Equipment & Supplies — 1.8% | | | | | | | | | | |
Stryker Corp. | | | | | | 75,000 | | | 4,308,000 | |
Health Care Providers & Services — 3.5% | | | | | | | | | | |
Aetna Inc. | | | | | | 40,000 | | | 1,182,000 | |
UnitedHealth Group Inc. | | | | | | 130,000 | | | 3,940,300 | |
WellPoint Inc. | | | | | | 60,000 | | | 3,228,000 | * |
Total Health Care Providers & Services | | | | | | | | | 8,350,300 | |
Pharmaceuticals — 2.5% | | | | | | | | | | |
Johnson & Johnson | | | | | | 70,000 | | | 4,501,000 | |
Pfizer Inc. | | | | | | 100,000 | | | 1,672,000 | |
Total Pharmaceuticals | | | | | | | | | 6,173,000 | |
Total Health Care | | | | | | | | | 24,615,780 | |
| Industrials — 16.6% | | | | | | | | | | |
Aerospace & Defense — 4.6% | | | | | | | | | | |
Boeing Co. | | | | | | 40,000 | | | 2,897,200 | |
General Dynamics Corp. | | | | | | 62,000 | | | 4,734,320 | |
Lockheed Martin Corp. | | | | | | 42,000 | | | 3,565,380 | |
Total Aerospace & Defense | | | | | | | | | 11,196,900 | |
Airlines — 5.9% | | | | | | | | | | |
Delta Air Lines Inc. | | | | | | 280,000 | | | 3,382,400 | * |
UAL Corp. | | | | | | 500,000 | | | 10,790,000 | * |
Total Airlines | | | | | | | | | 14,172,400 | |
Electrical Equipment — 0.9% | | | | | | | | | | |
Emerson Electric Co. | | | | | | 40,000 | | | 2,089,200 | |
Industrial Conglomerates — 3.5% | | | | | | | | | | |
General Electric Co. | | | | | | 265,000 | | | 4,997,900 | |
United Technologies Corp. | | | | | | 45,000 | | | 3,372,750 | |
Total Industrial Conglomerates | | | | | | | | | 8,370,650 | |
Machinery — 1.7% | | | | | | | | | | |
Caterpillar Inc. | | | | | | 60,000 | | | 4,085,400 | |
Total Industrials | | | | | | | | | 39,914,550 | |
See Notes to Financial Statements.
| | |
| 6 | | Legg Mason Capital Management American Leading Companies Trust 2010 Semi-Annual Report |
Schedule of investments (unaudited) (cont’d)
April 30, 2010
Legg Mason Capital Management American Leading Companies Trust
| | | | | | | | | | | | |
| Security | | | | | | | Shares | | Value | |
| Information Technology — 24.2% | | | | | | | | | | | | |
Communications Equipment — 5.0% | | | | | | | | | | | | |
Cisco Systems Inc. | | | | | | | | 110,000 | | $ | 2,961,200 | * |
Nokia OYJ, ADR | | | | | | | | 445,000 | | | 5,411,200 | * |
QUALCOMM Inc. | | | | | | | | 95,000 | | | 3,680,300 | |
Total Communications Equipment | | | | | | | | | | | 12,052,700 | |
Computers & Peripherals — 6.0% | | | | | | | | | | | | |
EMC Corp. | | | | | | | | 290,000 | | | 5,512,900 | * |
Hewlett-Packard Co. | | | | | | | | 174,000 | | | 9,042,780 | |
Total Computers & Peripherals | | | | | | | | | | | 14,555,680 | |
Internet Software & Services — 2.8% | | | | | | | | | | | | |
eBay Inc. | | | | | | | | 280,000 | | | 6,666,800 | * |
IT Services — 4.2% | | | | | | | | | | | | |
Accenture PLC, Class A Shares | | | | | | | | 57,000 | | | 2,487,480 | |
International Business Machines Corp. | | | | | | | | 60,000 | | | 7,740,000 | |
Total IT Services | | | | | | | | | | | 10,227,480 | |
Semiconductors & Semiconductor Equipment — 2.3% | | | | | | | | | | | | |
Texas Instruments Inc. | | | | | | | | 210,000 | | | 5,462,100 | |
Software — 3.9% | | | | | | | | | | | | |
Microsoft Corp. | | | | | | | | 305,000 | | | 9,314,700 | |
Total Information Technology | | | | | | | | | | | 58,279,460 | |
| Materials — 1.0% | | | | | | | | | | | | |
Metals & Mining — 1.0% | | | | | | | | | | | | |
United States Steel Corp. | | | | | | | | 45,000 | | | 2,459,700 | |
| Telecommunication Services — 3.2% | | | | | | | | | | | | |
Diversified Telecommunication Services — 1.2% | | | | | | | | | | | | |
AT&T Inc. | | | | | | | | 110,000 | | | 2,866,600 | |
Wireless Telecommunication Services — 2.0% | | | | | | | | | | | | |
Sprint Nextel Corp. | | | | | | | | 1,100,000 | | | 4,675,000 | * |
Total Telecommunication Services | | | | | | | | | | | 7,541,600 | |
| Utilities — 1.3% | | | | | | | | | | | | |
Independent Power Producers & Energy Traders — 1.3% | | | | | | | | | | | | |
AES Corp. | | | | | | | | 275,000 | | | 3,173,500 | * |
Total Investments Before Short-Term Investments (Cost — $149,686,472) | | | | | | | | | | | 231,315,945 | |
| | | | |
| | | Rate | | | Maturity
Date | | Face
Amount | | | |
| Short-Term Investments — 3.3% | | | | | | | | | | | | |
Repurchase Agreements — 3.3% | | | | | | | | | | | | |
Bank of America repurchase agreement dated 4/30/10; Proceeds at maturity — $4,033,434; (Fully collateralized by U.S. government agency obligations, 0.000% due 7/30/10; Market value — $4,115,588) | | 0.120 | % | | 5/3/10 | | $ | 4,033,394 | | | 4,033,394 | |
Goldman Sachs & Co. repurchase agreement dated 4/30/10; Proceeds at maturity — $4,033,452; (Fully collateralized by U.S. government agency obligations, 1.375% due 1/9/13; Market value — $4,122,295) | | 0.170 | % | | 5/3/10 | | | 4,033,395 | | | 4,033,395 | |
Total Short-Term Investments (Cost — $8,066,789) | | | | | | | | | | | 8,066,789 | |
Total Investments — 99.5% (Cost — $157,753,261#) | | | | | | | | | | | 239,382,734 | |
Other Assets in Excess of Liabilities — 0.5% | | | | | | | | | | | 1,106,911 | |
Total Net Assets — 100.0% | | | | | | | | | | $ | 240,489,645 | |
See Notes to Financial Statements.
| | |
| Legg Mason Capital Management American Leading Companies Trust 2010 Semi-Annual Report | | 7 |
Legg Mason Capital Management American Leading Companies Trust
| * | Non-income producing security. |
| # | Aggregate cost for federal income tax purposes is substantially the same. |
| | |
Abbreviation used in this schedule: |
| ADR | | — American Depositary Receipt |
See Notes to Financial Statements.
| | |
| 8 | | Legg Mason Capital Management American Leading Companies Trust 2010 Semi-Annual Report |
Statement of assets and liabilities (unaudited)
April 30, 2010
| | | |
|
| Assets: |
Investments, at value (Cost — $157,753,261) | | $ | 239,382,734 |
Receivable for securities sold | | | 1,930,440 |
Dividends and interest receivable | | | 207,093 |
Receivable for Fund shares sold | | | 94,193 |
Other assets | | | 6,975 |
Total Assets | | | 241,621,435 |
| |
| Liabilities: | | | |
Payable for Fund shares repurchased | | | 709,364 |
Distribution fees payable | | | 183,798 |
Investment management fee payable | | | 143,238 |
Directors’ fees payable | | | 2,202 |
Accrued expenses | | | 93,188 |
Total Liabilities | | | 1,131,790 |
| Total Net Assets | | $ | 240,489,645 |
| |
| Net Assets: | | | |
Par value (Note 7) | | $ | 14,923 |
Paid-in capital in excess of par value | | | 230,987,748 |
Overdistributed net investment income | | | (626,466) |
Accumulated net realized loss on investments | | | (71,516,033) |
Net unrealized appreciation on investments | | | 81,629,473 |
| Total Net Assets | | $ | 240,489,645 |
| |
| Shares Outstanding: | | | |
Class A | | | 924,964 |
Class C | | | 13,184,451 |
Class I | | | 813,542 |
| |
| Net Asset Value: | | | |
Class A (and redemption price) | | | $16.12 |
Class C* | | | $16.07 |
Class I (and redemption price) | | | $16.84 |
| Maximum Public Offering Price Per Share: | | | |
Class A (based on maximum initial sales charge of 5.75%) | | | $17.10 |
| * | Redemption price per share is NAV of Class C shares reduced by a 1.00% CDSC, if shares are redeemed within one year from purchase payment (See Note 2). |
See Notes to Financial Statements.
| | |
| Legg Mason Capital Management American Leading Companies Trust 2010 Semi-Annual Report | | 9 |
Statement of operations (unaudited)
For the Six Months Ended April 30, 2010
| | | |
|
| Investment Income: |
Dividends | | $ | 1,659,918 |
Interest | | | 458 |
Total Investment Income | | | 1,660,376 |
| |
| Expenses: | | | |
Distribution fees (Notes 2 and 5) | | | 1,073,662 |
Investment management fee (Note 2) | | | 833,540 |
Transfer agent fees (Note 5) | | | 115,547 |
Shareholder reports | | | 24,906 |
Directors’ fees | | | 23,806 |
Custody fees | | | 20,377 |
Registration fees | | | 20,240 |
Audit and tax | | | 15,034 |
Legal fees | | | 9,330 |
Miscellaneous expenses | | | 7,067 |
Total Expenses | | | 2,143,509 |
Less: Compensating balance agreements (Note 1) | | | (148) |
Net Expenses | | | 2,143,361 |
| Net Investment Loss | | | (482,985) |
| |
| Realized and Unrealized Gain on Investments (Notes 1 and 3): | | | |
Net realized gain from investment transactions | | | 5,175,380 |
Change in Net Unrealized Appreciation/Depreciation From Investments | | | 37,501,684 |
| Net Gain on Investments | | | 42,677,064 |
| Increase in Net Assets from Operations | | $ | 42,194,079 |
See Notes to Financial Statements.
| | |
| 10 | | Legg Mason Capital Management American Leading Companies Trust 2010 Semi-Annual Report |
Statements of changes in net assets
| | | | | | | | | |
For the Six Months Ended April 30, 2010 (unaudited),
the Period Ended October 31, 2009 and the Year Ended March 31, 2009 | | 2010 | | 2009† | | 2009 |
| | | |
| Operations: | | | | | | | | | |
Net investment income (loss) | | $ | (482,985) | | $ | (245,589) | | $ | 2,591,726 |
Net realized gain (loss) | | | 5,175,380 | | | 3,787,525 | | | (61,929,002) |
Change in net unrealized appreciation/depreciation | | | 37,501,684 | | | 71,684,996 | | | (177,335,018) |
Increase (Decrease) in Net Assets From Operations | | | 42,194,079 | | | 75,226,932 | | | (236,672,294) |
| | | |
| Distributions to Shareholders From (Notes 1 and 6): | | | | | | | | | |
Net investment income | | | (177,924) | | | — | | | (2,676,889) |
Net realized gains | | | — | | | — | | | (1,383,802) |
Decrease in Net Assets from Distributions to Shareholders | | | (177,924) | | | — | | | (4,060,691) |
| | | |
| Fund Share Transactions (Note 7): | | | | | | | | | |
Net proceeds from sale of shares | | | 6,121,170 | | | 5,331,212 | | | 61,872,409 |
Reinvestment of distributions | | | 173,428 | | | — | | | 4,041,034 |
Cost of shares repurchased | | | (33,833,539) | | | (33,792,715) | | | (245,678,405) |
Decrease in Net Assets From Fund Share Transactions | | | (27,538,941) | | | (28,461,503) | | | (179,764,962) |
Increase (Decrease) in Net Assets | | | 14,477,214 | | | 46,765,429 | | | (420,497,947) |
| | | |
| Net Assets: | | | | | | | | | |
Beginning of period | | | 226,012,431 | | | 179,247,002 | | | 599,744,949 |
End of period* | | $ | 240,489,645 | | $ | 226,012,431 | | $ | 179,247,002 |
* Includes (overdistributed) and undistributed net investment income, respectively, of: | | | $(626,466) | | | $34,443 | | | $28,635 |
| † | For the period April 1, 2009 through October 31, 2009. |
See Notes to Financial Statements.
| | |
| Legg Mason Capital Management American Leading Companies Trust 2010 Semi-Annual Report | | 11 |
Financial highlights
| | | | | | | | | |
| For a share of each class of capital stock outstanding throughout each period ended October 31, unless otherwise noted: | |
| Class A Shares1 | | 20102 | | | 20093 | | | 20094 | |
| | | |
| Net asset value, beginning of period | | $13.53 | | | $9.40 | | | $10.44 | |
| | | |
| Income (loss) from operations: | | | | | | | | | |
Net investment income | | 0.02 | | | 0.03 | | | 0.03 | |
Net realized and unrealized gain (loss) | | 2.65 | | | 4.10 | | | (1.07) | |
Total income (loss) from operations | | 2.67 | | | 4.13 | | | (1.04) | |
| | | |
| Less distributions from: | | | | | | | | | |
Net investment income | | (0.08) | | | — | | | — | |
Total distributions | | (0.08) | | | — | | | — | |
| | | |
| Net asset value, end of period | | $16.12 | | | $13.53 | | | $9.40 | |
Total return5 | | 19.84 | % | | 43.94 | % | | (9.96) | % |
| | | |
| Net assets, end of period (000s) | | $14,910 | | | $13,099 | | | $9,877 | |
| | | |
| Ratios to average net assets: | | | | | | | | | |
Gross expenses6 | | 1.15 | % | | 1.14 | % | | 1.34 | % |
Net expenses6 | | 1.15 | 7 | | 1.13 | 8 | | 1.10 | 8 |
Net investment income6 | | 0.25 | 7 | | 0.46 | | | 1.93 | |
| | | |
| Portfolio turnover rate | | 4 | % | | 9 | % | | 33 | % |
| 1 | Per share amounts have been calculated using the average shares method. |
| 2 | For the six months ended April 30, 2010 (unaudited). |
| 3 | For the period April 1, 2009 through October 31, 2009. |
| 4 | For the period February 3, 2009 (commencement of operations) to March 31, 2009. |
| 5 | Performance figures, exclusive of sales charges, may reflect compensating balance agreements, fee waivers and/or expense reimbursements. In the absence of compensating balance agreements, fee waivers and/or expense reimbursements, the total return would have been lower. Past performance is no guarantee of future results. Total returns for periods of less than one year are not annualized. |
| 7 | The impact was less than 0.01% as a result of compensating balance agreements. |
| 8 | Reflects fee waivers and/or expense reimbursements. |
See Notes to Financial Statements.
| | |
| 12 | | Legg Mason Capital Management American Leading Companies Trust 2010 Semi-Annual Report |
Financial highlights (cont’d)
| | | | | | | | | | | | | | | | | | | | | |
| For a share of each class of capital stock outstanding throughout each period ended October 31, unless otherwise noted: | |
| Class C Shares1 | | 20102,3 | | | 20093,4 | | | 20093,5 | | | 20083,5 | | | 20073,5 | | | 20065 | | | 20055 | |
| | | | | | | |
| Net asset value, beginning of period | | $ 13.46 | | | $ 9.39 | | | $ 19.52 | | | $ 24.87 | | | $ 24.59 | | | $ 21.85 | | | $ 19.85 | |
| | | | | | | |
| Income (loss) from operations: | | | | | | | | | | | | | | | | | | | | | |
Net investment income (loss) | | (0.04) | | | (0.02) | | | 0.09 | | | 0.03 | | | (0.06) | | | 0.01 | | | 0.00 | 6 |
Net realized and unrealized gain (loss) | | 2.65 | | | 4.09 | | | (10.07) | | | (3.81) | | | 1.64 | | | 2.73 | | | 2.01 | |
Total income (loss) from operations | | 2.61 | | | 4.07 | | | (9.98) | | | (3.78) | | | 1.58 | | | 2.74 | | | 2.01 | |
| | | | | | | |
| Less distributions from: | | | | | | | | | | | | | | | | | | | | | |
Net investment income | | — | | | — | | | (0.10) | | | — | | | (0.01) | | | — | | | (0.01) | |
Net realized gains | | — | | | — | | | (0.05) | | | (1.57) | | | (1.29) | | | — | | | — | |
Total distributions | | — | | | — | | | (0.15) | | | (1.57) | | | (1.30) | | | — | | | (0.01) | |
| | | | | | | |
| Net asset value, end of period | | $16.07 | | | $13.46 | | | $9.39 | | | $19.52 | | | $24.87 | | | $24.59 | | | $21.85 | |
Total return7 | | 19.39 | % | | 43.34 | % | | (51.32) | % | | (16.24) | % | | 6.68 | % | | 12.54 | % | | 10.12 | % |
| | | | | | | |
| Net assets, end of period (000s) | | $211,882 | | | $200,905 | | | $159,944 | | | $531,186 | | | $765,000 | | | $757,630 | | | $654,019 | |
| | | | | | | |
| Ratios to average net assets: | | | | | | | | | | | | | | | | | | | | | |
Gross expenses | | 1.90 | %8 | | 1.88 | %8 | | 1.89 | % | | 1.83 | % | | 1.85 | % | | 1.86 | % | | 1.88 | % |
Net expenses | | 1.90 | 8,9 | | 1.88 | 8 | | 1.88 | 10 | | 1.83 | | | 1.85 | | | 1.86 | | | 1.88 | |
Net investment income (loss) | | (0.50) | 8,9 | | (0.28) | 8 | | 0.62 | | | 0.12 | | | (0.23) | | | 0.04 | | | (0.01) | |
| | | | | | | |
| Portfolio turnover rate | | 4 | % | | 9 | % | | 33 | % | | 28 | % | | 19 | % | | 14 | % | | 19 | % |
| 1 | On February 1, 2009, Primary Class shares were renamed Class C shares. |
| 2 | For the six months ended April 30, 2010 (unaudited). |
| 3 | Per share amounts have been calculated using the average shares method. |
| 4 | For the period April 1, 2009 through October 31, 2009 |
| 5 | For the year ended March 31. |
| 6 | Amount represents less than $0.01 per share. |
| 7 | Performance figures, exclusive of CDSC, may reflect compensating balance agreements, fee waivers and/or expense reimbursements. In the absence of compensating balance agreements, fee waivers and/or expense reimbursements, the total return would have been lower. Past performance is no guarantee of future results. Total returns for periods of less than one year are not annualized. |
| 9 | The impact was less than 0.01% as a result of compensating balance agreements. |
| 10 | Reflects fee waivers and/or expense reimbursements. |
See Notes to Financial Statements.
| | |
| Legg Mason Capital Management American Leading Companies Trust 2010 Semi-Annual Report | | 13 |
| | | | | | | | | | | | | | | | | | | | | |
| For a share of each class of capital stock outstanding throughout each period ended October 31, unless otherwise noted: | |
| Class I Shares1 | | 20102,3 | | | 20093,4 | | | 20093,5 | | | 20083,5 | | | 20073,5 | | | 20065 | | | 20055 | |
| | | | | | | |
| Net asset value, beginning of period | | $ 14.14 | | | $ 9.81 | | | $20.57 | | | $ 25.86 | | | $ 25.33 | | | $ 22.34 | | | $20.28 | |
|
| Income (loss) from operations: | |
Net investment income | | 0.04 | | | 0.05 | | | 0.28 | | | 0.31 | | | 0.23 | | | 0.22 | | | 0.21 | |
Net realized and unrealized gain (loss) | | 2.78 | | | 4.28 | | | (10.63) | | | (4.03) | | | 1.67 | | | 2.82 | | | 2.06 | |
Total income (loss) from operations | | 2.82 | | | 4.33 | | | (10.35) | | | (3.72) | | | 1.90 | | | 3.04 | | | 2.27 | |
| | | | | | | |
| Less distributions from: | | | | | | | | | | | | | | | | | | | | | |
Net investment income | | (0.12) | | | — | | | (0.36) | | | — | | | (0.08) | | | (0.05) | | | (0.21) | |
Net realized gains | | — | | | — | | | (0.05) | | | (1.57) | | | (1.29) | | | — | | | — | |
Total distributions | | (0.12) | | | — | | | (0.41) | | | (1.57) | | | (1.37) | | | (0.05) | | | (0.21) | |
| | | | | | | |
| Net asset value, end of period | | $16.84 | | | $14.14 | | | $9.81 | | | $20.57 | | | $25.86 | | | $25.33 | | | $22.34 | |
Total return6 | | 20.03 | % | | 44.14 | % | | (50.86) | % | | (15.37) | % | | 7.77 | % | | 13.63 | % | | 11.21 | % |
| | | | | | | |
| Net assets, end of period (000s) | | $13,698 | | | $12,008 | | | $9,426 | | | $68,559 | | | $72,546 | | | $41,476 | | | $21,386 | |
| | | | | |
| Ratios to average net assets: | | | | | | | | | | | | | | | | |
Gross expenses | | 0.90 | %7 | | 0.89 | %7 | | 0.87 | % | | 0.79 | % | | 0.82 | % | | 0.84 | % | | 0.90 | % |
Net expenses | | 0.90 | 7,8 | | 0.89 | 7 | | 0.86 | 9 | | 0.79 | | | 0.82 | | | 0.84 | | | 0.90 | |
Net investment income | | 0.49 | 7,8 | | 0.70 | 7 | | 1.61 | | | 1.22 | | | 0.90 | | | 1.09 | | | 0.99 | |
| | | | | | | |
| Portfolio turnover rate | | 4 | % | | 9 | % | | 33 | % | | 28 | % | | 19 | % | | 14 | % | | 19 | % |
| 1 | On October 5, 2009, Institutional Class shares were renamed Class I shares. |
| 2 | For the six months ended April 30, 2010 (unaudited). |
| 3 | Per share amounts have been calculated using the average shares method. |
| 4 | For the period April 1, 2009 through October 31, 2009. |
| 5 | For the year ended March 31. |
| 6 | Performance figures may reflect compensating balance agreements, fee waivers and/or expense reimbursements. In the absence of compensating balance agreements, fee waivers and/or expense reimbursements, the total return would have been lower. Past performance is no guarantee of future results. Total returns for periods of less than one year are not annualized. |
| 8 | The impact was less than 0.01% as a result of compensating balance agreements. |
| 9 | Reflects fee waivers and/or expense reimbursements. |
See Notes to Financial Statements.
| | |
| 14 | | Legg Mason Capital Management American Leading Companies Trust 2010 Semi-Annual Report |
Notes to financial statements (unaudited)
1. Organization and significant accounting policies
Legg Mason Capital Management American Leading Companies Trust (the “Fund”) is a separate series of Legg Mason Investors Trust, Inc. (“Corporation”) registered under the Investment Company Act of 1940, as amended (“1940 Act”), as an open-end, diversified investment company.
The Fund currently offers three classes of shares: Class A, Class C and Class I. The income and expenses of the Fund are allocated proportionately to each class of shares based on daily net assets, except for Rule 12b-1 distribution and/or service fees, which are charged only on Class A and Class C shares. Transfer agent fees are charged separately for each class.
The following are significant accounting policies consistently followed by the Fund and are in conformity with U.S. generally accepted accounting principles (“GAAP”). Estimates and assumptions are required to be made regarding assets, liabilities and changes in net assets resulting from operations when financial statements are prepared. Changes in the economic environment, financial markets and any other parameters used in determining these estimates could cause actual results to differ. Subsequent events have been evaluated through the issuance date of the financial statements.
(a) Investment valuation. Equity securities for which market quotations are available are valued at the last reported sales price or official closing price on the primary market or exchange on which they trade. Debt securities are valued at the last quoted bid price provided by an independent pricing service that is based on transactions in debt obligations, quotations from bond dealers, market transactions in comparable securities and various other relationships between securities. When prices are not readily available, or are determined not to reflect fair value, such as when the value of a security has been significantly affected by events after the close of the exchange or market on which the security is principally traded, but before the Fund calculates its net asset value, the Fund values these securities at fair value as determined in accordance with procedures approved by the Fund’s Board of Directors. Short-term obligations with maturities of 60 days or less are valued at amortized cost, which approximates fair value.
The Fund has adopted Financial Accounting Standards Board Codification Topic 820 (“ASC Topic 820”). ASC Topic 820 establishes a single definition of fair value, creates a three-tier hierarchy as a framework for measuring fair value based on inputs used to value the Fund’s investments, and requires additional disclosure about fair value. The hierarchy of inputs is summarized below.
| Ÿ | | Level 1 — quoted prices in active markets for identical investments |
| Ÿ | | Level 2 — other significant observable inputs (including quoted prices for similar investments, interest rates, prepayment speeds, credit risk, etc.) |
| Ÿ | | Level 3 — significant unobservable inputs (including the Fund’s own assumptions in determining the fair value of investments) |
The inputs or methodology used for valuing securities are not necessarily an indication of the risk associated with investing in those securities.
The Fund uses valuation techniques to measure fair value that are consistent with the market approach and/or income approach, depending on the type of the security and the particular circumstance. The market approach uses prices and other relevant information generated by market transactions involving identical or comparable securities. The income approach uses valuation techniques to convert future amounts of cash flow to a single present amount.
The following is a summary of the inputs used in valuing the Fund’s assets carried at fair value:
| | | | | | | | | | | |
| Description | | Quoted Prices
(Level 1) | | Other Significant
Observable Inputs
(Level 2) | | Significant
Unobservable
Inputs
(Level 3) | | Total |
| Common stocks† | | $ | 231,315,945 | | | — | | — | | $ | 231,315,945 |
| Short-term investments† | | | — | | $ | 8,066,789 | | — | | | 8,066,789 |
| Total investments | | $ | 231,315,945 | | $ | 8,066,789 | | — | | $ | 239,382,734 |
| † | See Schedule of Investments for additional detailed categorizations. |
| | |
| Legg Mason Capital Management American Leading Companies Trust 2010 Semi-Annual Report | | 15 |
(b) Repurchase agreements. The Fund may enter into repurchase agreements with institutions that its investment adviser has determined are creditworthy. Each repurchase agreement is recorded at cost. Under the terms of a typical repurchase agreement, a fund takes possession of an underlying debt obligation subject to an obligation of the seller to repurchase, and of the fund to resell, the obligation at an agreed-upon price and time, thereby determining the yield during a fund’s holding period. When entering into repurchase agreements, it is the Fund’s policy that its custodian or a third party custodian, acting on the Fund’s behalf, take possession of the underlying collateral securities, the market value of which, at all times, at least equals the principal amount of the repurchase transaction, including accrued interest. To the extent that any repurchase transaction maturity exceeds one business day, the value of the collateral is marked to market and measured against the value of the agreement in an effort to ensure the adequacy of the collateral. If the counterparty defaults, the Fund generally has the right to use the collateral to satisfy the terms of the repurchase transaction. However, if the market value of the collateral declines during the period in which the Fund seeks to assert its rights or if bankruptcy proceedings are commenced with respect to the seller of the security, realization of the collateral by the Fund may be delayed or limited.
(c) Security transactions and investment income. Security transactions are accounted for on a trade date basis. Interest income, adjusted for amortization of premium and accretion of discount, is recorded on the accrual basis. Dividend income is recorded on the ex-dividend date. The cost of investments sold is determined by use of the specific identification method. To the extent any issuer defaults or a credit event occurs that impacts the issuer, the Fund may halt any additional interest income accruals and consider the realizability of interest accrued up to the date of default or credit event.
(d) Distributions to shareholders. Distributions from net investment income and distributions of net realized gains, if any, are declared at least annually. Distributions to shareholders of the Fund are recorded on the ex-dividend date and are determined in accordance with income tax regulations, which may differ from GAAP.
(e) Compensating balance agreements. The Fund has an arrangement with its custodian bank whereby a portion of the custodian’s fees is paid indirectly by credits earned on the Fund’s cash on deposit with the bank. The amount is shown as a reduction of expenses in the Statement of Operations.
(f) Commission recapture. The Fund has entered into a directed brokerage agreement with State Street Bank & Trust Company, its custodian, whereby a portion of commissions paid on investment transactions may be rebated to the Fund. Such payments are included in the realized gain/(loss) on investment transactions. During the six months ended April 30, 2010, the Fund did not receive any commission rebates.
(g) Share class accounting. Investment income, common expenses and realized/unrealized gains (losses) on investments are allocated to the various classes of the Fund on the basis of daily net assets of each class. Fees relating to a specific class are charged directly to that share class.
(h) Federal and other taxes. It is the Fund’s policy to comply with the federal income and excise tax requirements of the Internal Revenue Code of 1986 (the “Code”), as amended, applicable to regulated investment companies. Accordingly, the Fund intends to distribute its taxable income and net realized gains, if any, to shareholders in accordance with timing requirements imposed by the Code. Therefore, no federal income tax provision is required in the Fund’s financial statements.
Management has analyzed the Fund’s tax positions taken on federal income tax returns for all open tax years and has concluded that as of April 30, 2010, no provision for income tax is required in the Fund’s financial statements. The Fund’s federal and state income and federal excise tax returns for tax years for which the applicable statutes of limitations have not expired are subject to examination by Internal Revenue Service and state departments of revenue.
(i) Reclassification. GAAP requires that certain components of net assets be adjusted to reflect permanent differences between financial and tax reporting. These reclassifications have no effect on net assets or net asset value per share.
(j) Other. In the normal course of business, the Fund enters into contracts that provide general indemnifications. The Fund’s maximum exposure under these arrangements is dependent upon claims that
| | |
| 16 | | Legg Mason Capital Management American Leading Companies Trust 2010 Semi-Annual Report |
Notes to financial statements (unaudited) (cont’d)
may be made against the Fund in the future and, therefore, cannot be estimated; however, based on experience, the risk of material loss from such claims is considered remote.
2. Investment management agreement and other transactions with affiliates
The Fund has an investment advisory and management agreement with Legg Mason Capital Management, Inc. (“LMCM”). Pursuant to the agreement, LMCM provides the Fund with investment advisory, management and administrative services for which the Fund pays a fee, computed daily and payable monthly, at an annual rate of the Fund’s average daily net assets. The annual advisory fee rates for the Fund are provided in the chart below:
| | | |
| Average Daily Net Assets | | Annual Rate | |
| First $1 billion | | 0.70 | % |
| Next $1 billion | | 0.68 | |
| Next $3 billion | | 0.65 | |
| Next $5 billion | | 0.62 | |
| Over $10 billion | | 0.59 | |
Legg Mason Partners Fund Advisor, LLC (“LMPFA”) provides administrative and certain oversight services to the Fund. For LMPFA’s services to the Fund, LMCM (not the Fund) pays LMPFA a fee, calculated daily and payable monthly, at an annual rate of 0.05% of the average daily net assets of the Fund. LMCM and LMPFA are wholly-owned subsidiaries and corporate affiliates of Legg Mason, Inc. (“Legg Mason”).
As a result of an expense limitation agreement between the Fund and LMCM, the ratio of expenses, other than interest, brokerage, taxes and extraordinary expenses, to average net assets of Class A, Class C and Class I shares will not exceed 1.20%, 1.95% and 0.95%, respectively. This expense limitation agreement cannot be terminated prior to December 31, 2011 without the Board of Directors’ consent.
The manager is permitted to recapture amounts forgone or reimbursed to a class within three years after the year in which the manager earned the fee or incurred the expense if the class’ total annual operating expenses have fallen to a level below an expense limitation (“expense cap”). In no case will the manager recapture any amount that would result, on any particular business day of the Fund, in a class’ total annual operating expenses exceeding the expense cap.
Legg Mason Investor Services, LLC (“LMIS”), a wholly-owned broker-dealer subsidiary of Legg Mason, serves as the Fund’s sole and exclusive distributor.
There is a maximum initial sales charge of 5.75% for Class A shares. Class C shares have a 1.00% contingent deferred sales charge (“CDSC”) which applies if shares are redeemed within one year from purchase payment. In certain cases, Class A shares have a 1.00% CDSC, which applies if redemption occurs within one year from purchase payment. This CDSC only applies to those purchases of Class A shares, which, when combined with current holdings of Class A shares, equal or exceed $1,000,000 in the aggregate. These purchases do not incur an initial sales charge.
For the six months ended April 30, 2010, LMIS and its affiliates received sales charges of approximately $100 on sales of the Fund’s Class A shares. In addition, for the six months ended April 30, 2010, CDSCs paid to LMIS and its affiliates were approximately $9,000 for Class C shares.
Under a Deferred Compensation Plan (the “Plan”), Directors may elect to defer receipt of all or a specified portion of their compensation. A participating director may select one or more funds in which his or her deferred director’s fees will be deemed to be invested. Deferred amounts remain in the Fund until distributed in accordance with the Plan.
All officers and two Directors of the Fund are employees of Legg Mason or its affiliates and do not receive compensation from the Fund.
| | |
| Legg Mason Capital Management American Leading Companies Trust 2010 Semi-Annual Report | | 17 |
3. Investments
During the six months ended April 30, 2010, the aggregate cost of purchases and proceeds from sales of investments (excluding short-term investments) were as follows:
| | | |
| Purchases | | $ | 8,372,138 |
| Sales | | | 45,266,930 |
At April 30, 2010, the aggregate gross unrealized appreciation and depreciation of investments for federal income tax purposes were substantially as follows:
| | | |
| Gross unrealized appreciation | | $ | 86,907,018 |
| Gross unrealized depreciation | | | (5,277,545) |
| Net unrealized appreciation | | $ | 81,629,473 |
4. Derivative instruments and hedging activities
Financial Accounting Standards Board Codification Topic 815 requires enhanced disclosure about an entity’s derivative and hedging activities.
During the six months ended April 30, 2010, the Fund did not invest in any derivative instruments.
5. Class specific expenses, waivers and/or reimbursements
The Fund has adopted Rule 12b-1 distribution plans and under the plans the Fund pays a service fee with respect to its Class A and C shares calculated at the annual rate of 0.25% of the average daily net assets of each class, respectively. The Fund also pays a distribution fee with respect to its Class C shares calculated at the annual rate of 0.75% of the average daily net assets of its Class C shares. Distribution fees are accrued daily and paid monthly.
For the six months ended April 30, 2010, class specific expenses were as follows:
| | | | | | |
| | | Distribution
Fees | | Transfer Agent
Fees |
| Class A | | $ | 17,665 | | $ | 6,644 |
| Class C | | | 1,055,997 | | | 102,513 |
| Class I | | | — | | | 6,390 |
| Total | | $ | 1,073,662 | | $ | 115,547 |
6. Distributions to shareholders by class
| | | | | | | | |
| | | Six Months Ended
April 30, 2010 | | Period Ended
October 31, 2009† | | Year Ended
March 31, 2009 |
| Net Investment Income: |
| Class A | | $ | 80,169 | | — | | | — |
| Class C | | | — | | — | | $ | 2,036,660 |
| Class I | | | 97,755 | | — | | | 640,229 |
| Total | | $ | 177,924 | | — | | $ | 2,676,889 |
|
| Net Realized Gains: |
| Class A | | | — | | — | | | — |
| Class C | | | — | | — | | $ | 1,224,154 |
| Class I | | | — | | — | | | 159,648 |
| Total | | | — | | — | | $ | 1,383,802 |
| † | For the period April 1, 2009 through October 31, 2009. |
7. Shares of beneficial interest
At April 30, 2010, there were 100,000,000 shares authorized at $.001 par value for Class A and 250,000,000 shares authorized at $.001 par value for each of Class C and Class I of the Fund.
| | |
| 18 | | Legg Mason Capital Management American Leading Companies Trust 2010 Semi-Annual Report |
Notes to financial statements (unaudited) (cont’d)
Transactions in shares of each class were as follows:
| | | | | | | | | | | | | | | | | |
| | | Six Months Ended
April 30, 2010 | | Period Ended
October 31, 2009† | | Year Ended
March 31, 2009 | |
| | | Shares | | Amount | | Shares | | Amount | | Shares | | | Amount | |
| | | | | | |
| Class A | | | | | | | | | | | | | | | | | |
| Shares sold | | 30,542 | | $ | 496,556 | | 22,568 | | $ | 292,982 | | 1,201,487 | * | | $ | 12,544,198 | * |
| Shares issued on reinvestment | | 5,525 | | | 80,115 | | — | | | — | | — | | | | — | |
| Shares repurchased | | (79,318) | | | (1,209,948) | | (105,168) | | | (1,285,454) | | (150,672) | * | | | (1,469,770) | * |
| Net increase (decrease) | | (43,251) | | $ | (633,277) | | (82,600) | | $ | (992,472) | | 1,050,815 | * | | $ | 11,074,428 | * |
| | | | | | |
| Class C1 | | | | | | | | | | | | | | | | | |
| Shares sold | | 226,802 | | $ | 3,444,592 | | 290,289 | | $ | 3,557,107 | | 2,832,671 | | | $ | 39,612,249 | |
| Shares issued on reinvestment | | — | | | — | | — | | | — | | 251,573 | | | | 3,257,702 | |
| Shares repurchased | | (1,967,905) | | | (29,830,903) | | (2,394,861) | | | (29,650,377) | | (13,270,477) | | | | (192,414,805) | |
| Net decrease | | (1,741,103) | | $ | (26,386,311) | | (2,104,572) | | $ | (26,093,270) | | (10,186,233) | | | $ | (149,544,854) | |
| | | | | | |
| Class I2 | | | | | | | | | | | | | | | | | |
| Shares sold | | 135,538 | | $ | 2,180,022 | | 115,985 | | $ | 1,481,123 | | 568,283 | | | $ | 9,715,962 | |
| Shares issued on reinvestment | | 6,167 | | | 93,313 | | — | | | — | | 49,581 | | | | 783,332 | |
| Shares repurchased | | (177,202) | | | (2,792,688) | | (227,574) | | | (2,856,884) | | (2,989,913) | | | | (51,793,830) | |
| Net decrease | | (35,497) | | $ | (519,353) | | (111,589) | | $ | (1,375,761) | | (2,372,049) | | | $ | (41,294,536) | |
| † | For the period April 1, 2009 through October 31, 2009. |
| * | For the period February 3, 2009 (inception date) to March 31, 2009. |
| 1 | On February 1, 2009, Primary Class shares were renamed Class C shares. |
| 2 | On October 5, 2009, Institutional Class shares were renamed Class I shares. |
8. Line of credit
The Fund, along with certain other Legg Mason Funds, participates in a $200 million line of credit (“Credit Agreement”) to be used for temporary or emergency purposes. This 364-day revolving Credit Agreement matures on March 3, 2011. Pursuant to the Credit Agreement, each participating fund is liable only for principal and interest payments related to borrowings made by that fund. Borrowings under the Credit Agreement bear interest at a rate equal to the prevailing federal funds rate plus the federal funds rate margin. The Fund did not utilize the line of credit during the six months ended April 30, 2010.
9. Capital loss carryforward
As of October 31, 2009, the Fund had a net capital loss carryforward of $76,480,752, of which $36,469,435 expires in 2016 and $40,011,317 expires in 2017. These amounts will be available to offset any future taxable capital gains.
| | |
| Legg Mason Capital Management American Leading Companies Trust | | 19 |
Board approval of investment advisory and management agreement (unaudited)
At its November 2009 meeting, the Fund’s Board of Directors (the “Board”) approved the continuation of the investment advisory and management agreement (the “Agreement”) with Legg Mason Capital Management, Inc. (the “Adviser”). The directors who are not “interested persons” of the Fund (as defined in the Investment Company Act of 1940, as amended (the “1940 Act”) (the “Independent Directors”), met on October 14, 2009, with the assistance of their independent legal counsel and their contract review consultant, to review and evaluate the materials provided by the Adviser to assist the Board, and in particular the Independent Directors, in considering renewal of the Agreement. At such October meeting the Independent Directors received presentations from the Adviser, as well as a memorandum from their independent legal counsel and materials from the contract review consultant. In follow up to that meeting, the Adviser provided supplemental materials as requested. The Independent Directors further discussed renewal of the Agreement in executive sessions held on November 5 and 6, 2009.
In voting to approve continuance of the Agreement, the Board, including the Independent Directors, considered whether continuance of the Agreement would be in the best interests of the Fund and its shareholders. No single factor or item of information reviewed by the Board was identified as the principal factor in determining whether to approve the Agreement. Based upon its evaluation of all material factors, including those described below, the Board concluded that the terms of the Agreement are reasonable and fair and that it was in the best interest of the Fund and its shareholders to approve continuance of the Agreement.
The Board received and considered information regarding the nature, extent and quality of services provided to the Fund by the Adviser under the Agreement. In addition, the Board received and considered other information regarding the administrative and other services rendered to the Fund and its shareholders by an affiliate of the Adviser. The Board noted information received at regular meetings throughout the year related to the services rendered by the Adviser. The Board’s evaluation of the services provided by the Adviser took into account the Board’s knowledge and familiarity gained as Board members of funds in the Legg Mason fund complex, including the scope and quality of the investment management by the Adviser.
The Board reviewed the qualifications, backgrounds and responsibilities of the Fund’s Officers and the portfolio management team primarily responsible for the day-to-day portfolio management of the Fund. The Board also considered, based on its knowledge of the Adviser and the Adviser’s affiliates, the financial resources available through the Adviser’s parent organization, Legg Mason, Inc.
The Board also considered the Adviser’s brokerage policies and practices, the standards applied in seeking best execution, the policies and practices regarding soft dollars, and the existence of quality controls applicable to brokerage allocation procedures.
The Board received and reviewed performance information for the Fund and for a group of funds (the “Performance Universe”) selected by Lipper, Inc. (“Lipper”), an independent provider of investment company data. The Board was provided with a description of the methodology Lipper used to determine the similarity of the Fund to the funds included in the Performance Universe. The Lipper data also included a comparison of the Fund’s performance to a benchmark index selected by Lipper. The Board also received from the contract review consultant analysis of the risk adjusted performance of the Fund compared with its corresponding Lipper benchmark index. The Board also reviewed performance information for the Fund showing rolling returns based upon trailing performance. In addition, the Directors noted that they also had received and discussed at periodic intervals information comparing the Fund’s performance to that of its benchmark index.
The Board noted that as of June 30, 2009 this Fund’s underperformance resulted in fifth quintile 1, 3, 5 and 10 year performance rankings. However, the Board also considered more recent favorable performance, which resulted in third quartile ranking for the one-year ended September 30, 2009. The Board also concluded that the Adviser has capable personnel and adequate resources and that the Adviser was employing an investment methodology that appeared to be fundamentally sound. The Board noted that the Adviser’s investment style is relatively more volatile and was disproportionately negatively impacted by the extreme market and credit conditions in 2008 and 2009. The Board further considered the Adviser’s commitment to,
| | |
| 20 | | Legg Mason Capital Management American Leading Companies Trust |
Board approval of investment advisory and management agreement (unaudited) (cont’d)
and past history of, continual improvement and enhancement of its investment process, including steps recently taken by the Adviser to improve performance and risk awareness. As a result, the Board concluded that it was in the best interest of the Fund to approve renewal of the Agreement.
The Board reviewed and considered the contractual management fee (the “Contractual Management Fee”) payable by the Fund to the Adviser in light of the nature, extent and quality of the services provided by the Adviser. In addition, the Board reviewed and considered the actual management fee rate (after taking into account fee waivers and expense reimbursements by the Adviser which partially reduced the management fee paid to the Adviser) (“Actual Management Fee”).
The Board also reviewed information regarding the fees the Adviser charged any of its U.S. clients investing primarily in an asset class similar to that of the Fund including, where applicable, separate accounts. The Adviser reviewed with the Board the significant differences in the scope of services provided to the Fund and to such other clients. The Board considered the fee comparisons in light of the scope of services required to manage these different types of accounts.
The Board received an analysis of complex-wide management fees provided by the Adviser, which, among other things, set out the range of fees based on asset classes. In addition, the Adviser provided and discussed with the Board a comparison with the fees of other registered investment companies managed by affiliated advisers in the same investment style. Management also discussed with the Board the Fund’s distribution arrangements, including how amounts received by the Fund’s distributors are expended.
Additionally, the Board received and considered information comparing the Fund’s Contractual Management Fee and Actual Management Fee and the Fund’s overall expense ratio with those of a group of funds selected by Lipper as comparable to the Fund and a broader universe of funds also selected by Lipper. With respect to the Fund, the Board noted that Contractual and Actual Management Fees were competitive (second and fourth quintile, respectively) and that actual expenses were lower than the Lipper expense group average.
The Board was provided an overview of the process followed in conducting the profitability study and received a report on the profitability of Legg Mason in providing services to the Fund, based on financial information and business data for the 12 months ended March 31, 2009, which corresponds to Legg Mason’s most recently completed fiscal year. The Directors considered the profitability study along with the other materials previously provided to the Board and determined that the profitability was not excessive in light of the nature, extent and quality of the services provided to the Fund.
The Board received and considered information regarding whether there have been economies of scale with respect to the management of the Fund as the Fund’s assets grow, whether the Fund has appropriately benefited from any economies of scale, and whether there is potential for realization of any further economies of scale. The Board noted that as a result of market conditions and net redemptions, the Fund complex had suffered a substantial decline in assets over its historic highs. Given the asset size of the Fund and the complex and the currently existing breakpoints, the Board concluded that any economies of scale currently being realized were appropriately being reflected in the Management Fee paid by the Fund.
The Board considered other benefits received by the Adviser and its affiliates, as a result of the Adviser’s relationship with the Fund, including the opportunity to offer additional products and services to Fund shareholders. The Board also considered the information provided regarding intermediary arrangements.
In light of the structure of the fees, the costs of providing investment advisory and other services to the Fund, the Adviser’s ongoing commitment to the Fund and the ancillary benefits received, the Board concluded that the Management Fees were reasonable.
After evaluation of all material factors, the Board concluded that the continuation of the Agreement is in the best interest of the Fund.
Legg Mason Capital Management
American Leading Companies Trust
Board of directors
Mark R. Fetting
Chairman
David R. Odenath
President
Dr. Ruby P. Hearn
Arnold L. Lehman
Robin J.W. Masters
Dr. Jill E. McGovern
Arthur S. Mehlman
G. Peter O’Brien
S. Ford Rowan
Robert M. Tarola
Investment manager/adviser
Legg Mason Capital Management, Inc.
Baltimore, MD
Custodian
State Street Bank & Trust Company
Transfer agent and shareholder servicing agent
Boston Financial Data Services, Inc.
2000 Crown Colony Drive
Quincy, MA 02169
Counsel
K & L Gates LLP
Washington, DC
Independent registered public accounting firm
PricewaterhouseCoopers LLP
Baltimore, MD
Legg Mason Capital Management American Leading Companies Trust
Legg Mason Capital Management American Leading Companies Trust
Legg Mason Funds
55 Water Street
New York, New York 10041
The Fund files its complete schedule of portfolio holdings with the Securities and Exchange Commission (“SEC”) for the first and third quarters of each fiscal year on Form N-Q. The Fund’s Forms N-Q are available on the SEC’s website at www.sec.gov. The Fund’s Forms N-Q may be reviewed and copied at the SEC’s Public Reference Room in Washington, D.C., and information on the operation of the Public Reference Room may be obtained by calling 1-800-SEC-0330. To obtain information on Form N-Q from the Fund, shareholders can call Funds Investor Services at 1-800-822-5544 or Institutional Shareholder Services at 1-888-425-6432.
Information on how the Fund voted proxies relating to portfolio securities during the prior 12-month period ended June 30th of each year and a description of the policies and procedures that the Fund uses to determine how to vote proxies related to portfolio transactions are available (1) without charge, upon request, by calling Funds Investor Services at 1-800-822-5544 or Institutional Shareholder Services at 1-888-425-6432, (2) on the Fund’s website at www.leggmason.com/individualinvestors and (3) on the SEC’s website at www.sec.gov.
This report is submitted for the general information of the shareholders of Legg Mason Capital Management American Leading Companies Trust. This report is not authorized for distribution to prospective investors in Legg Mason Capital Management American Leading Companies Trust unless preceded or accompanied by a current prospectus.
Investors should consider the Fund’s investment objectives, risks, charges and expenses carefully before investing. The prospectus contains this and other important information about the Fund. Please read the prospectus carefully before investing.
www.leggmason.com/individualinvestors
©2010 Legg Mason Investor Services, LLC
Member FINRA, SIPC
Privacy policy
We are committed to keeping nonpublic personal information about you secure and confidential. This notice is intended to help you understand how we fulfill this commitment. From time to time, we may collect a variety of personal information about you, including:
| Ÿ | | Information we receive from you on applications and forms, via the telephone, and through our websites; |
| Ÿ | | Information about your transactions with us, our affiliates, or others (such as your purchases, sales, or account balances); and |
| Ÿ | | Information we receive from consumer reporting agencies. |
We do not disclose nonpublic personal information about our customers or former customers, except to our affiliates (such as broker-dealers or investment advisers within the Legg Mason family of companies) or as is otherwise permitted by applicable law or regulation. For example, we may share this information with others in order to process your transactions or service an account. We may also provide this information to companies that perform marketing services on our behalf, such as printing and mailing, or to other financial institutions with whom we have joint marketing agreements. When we enter into such agreements, we will require these companies to protect the confidentiality of this information and to use it only to perform the services for which we hired them.
With respect to our internal security procedures, we maintain physical, electronic, and procedural safeguards to protect your nonpublic personal information, and we restrict access to this information.
If you decide at some point either to close your account(s) or become an inactive customer, we will continue to adhere to our privacy policies and practices with respect to your nonpublic personal information.
NOT PART OF THE SEMI-ANNUAL REPORT
At Legg Mason, we’ve assembled a collection of experienced investment management firms and empowered each of them with the tools, the resources and, most importantly, the independence to pursue the strategies they know best.
| Ÿ | | Each was purposefully chosen for their commitment to investment excellence. |
| Ÿ | | Each is focused on specific investment styles and asset classes. |
| Ÿ | | Each exhibits thought leadership in their chosen area of focus. |
Together, we’ve built a powerful portfolio of solutions for financial advisors and their clients. And it has made us a world leader in money management.*
| * | Ranked eighth-largest money manager in the world, according to Pensions & Investments, May 31, 2010, based on 12/31/09 worldwide institutional assets under management. |
www.leggmason.com/individualinvestors
©2010 Legg Mason Investor Services, LLC Member FINRA, SIPC
LMF-013/S (6/10) SR10-1114
NOT PART OF THE SEMI-ANNUAL REPORT
Not applicable.
| ITEM 3. | AUDIT COMMITTEE FINANCIAL EXPERT. |
Not applicable.
| ITEM 4. | PRINCIPAL ACCOUNTANT FEES AND SERVICES. |
Not applicable.
| ITEM 5. | AUDIT COMMITTEE OF LISTED REGISTRANTS. |
Not applicable.
| ITEM 6. | SCHEDULE OF INVESTMENTS. |
Included herein under Item 1.
| ITEM 7. | DISCLOSURE OF PROXY VOTING POLICIES AND PROCEDURES FOR CLOSED-END MANAGEMENT INVESTMENT COMPANIES. |
Not applicable.
| ITEM 8. | PORTFOLIO MANAGERS OF CLOSED-END MANAGEMENT INVESTMENT COMPANIES. |
Not applicable.
| ITEM 9. | PURCHASES OF EQUITY SECURITIES BY CLOSED-END MANAGEMENT INVESTMENT COMPANY AND AFFILIATED PURCHASERS. |
Not applicable.
| ITEM 10. | SUBMISSION OF MATTERS TO A VOTE OF SECURITY HOLDERS. |
The Nominating Committee will accept recommendations for nominations from shareholders. Shareholders may forward recommendations to the Fund Assistant Secretary at 100 International Drive, 7th Floor, Baltimore, Maryland 21202, Attn.: Fund Assistant Secretary.
| ITEM 11. | CONTROLS AND PROCEDURES. |
| | (a) | The Registrant’s principal executive officer and principal financial officer have concluded that the Registrant’s disclosure controls and procedures (as defined in Rule 30a- 3(c) under the Investment Company Act of 1940, as amended (the “1940 Act”)) are effective as of a date within 90 days of the filing date of this report that includes the disclosure required by this paragraph, based on their evaluation of the disclosure controls and procedures required by Rule 30a-3(b) under the 1940 Act and 15d-15(b) under the Securities Exchange Act of 1934. |
| | (b) | There were no changes in the Registrant’s internal control over financial reporting (as defined in Rule 30a-3(d) under the 1940 Act) that occurred during the Registrant’s last fiscal half-year (the Registrant’s second fiscal half-year in the case of an |
| | annual report) that have materially affected, or are likely to materially affect the Registrant’s internal control over financial reporting. |
(a) (1) Not applicable.
(This Exhibit should not be filed with the N-CSRS. It is not required in semi-annual report filings. )
(a) (2) Certifications pursuant to section 302 of the Sarbanes-Oxley Act of 2002 attached hereto.
Exhibit 99.CERT
(a) (3) Not applicable.
(b) Certifications pursuant to Section 906 of the Sarbanes-Oxley Act of 2002 attached hereto.
Exhibit 99.906CERT
SIGNATURES
Pursuant to the requirements of the Securities Exchange Act of 1934 and the Investment Company Act of 1940, the Registrant has duly caused this Report to be signed on its behalf by the undersigned, thereunto duly authorized.
| | |
Legg Mason Investors Trust Inc. |
| |
By: | | /S/ DAVID R. ODENATH |
| | (David R. Odenath) |
| | President and Director of |
| | Legg Mason Investors Trust Inc. |
Date: July 1, 2010
Pursuant to the requirements of the Securities Exchange Act of 1934 and the Investment Company Act of 1940, this report has been signed below by the following persons on behalf of the Registrant and in the capacities and on the dates indicated.
| | |
| |
By: | | /S/ DAVID R. ODENATH |
| | | (David R. Odenath) |
| | President and Director of |
| | Legg Mason Investors Trust Inc. |
Date: July 1, 2010
| | |
| |
By: | | /S/ KAPREL OZSOLAK |
| | (Kaprel Ozsolak) |
| | Chief Financial Officer of |
| | Legg Mason Investors Trust Inc. |
Date: July 1, 2010