UNITED STATES
SECURITIES AND EXCHANGE COMMISSION
Washington, D.C. 20549
FORM N-CSRS
CERTIFIED SHAREHOLDER REPORT OF REGISTERED
MANAGEMENT INVESTMENT COMPANIES
Investment Company Act file number: 811-07704
Schwab Capital Trust – Target Index Funds
(Exact name of registrant as specified in charter)
211 Main Street, San Francisco, California 94105
(Address of principal executive offices) (Zip code)
Marie Chandoha
Schwab Capital Trust
211 Main Street, San Francisco, California 94105
(Name and address of agent for service)
Registrant’s telephone number, including area code: (415) 636-7000
Date of fiscal year end: March 31
Date of reporting period: September 30, 2016
Item 1: Report(s) to Shareholders.
Semiannual Report | September 30, 2016
Schwab Target Index Funds
Schwab Target 2010 Index Fund
Schwab Target 2015 Index Fund
Schwab Target 2020 Index Fund
Schwab Target 2025 Index Fund
Schwab Target 2030 Index Fund
Schwab Target 2035 Index Fund
Schwab Target 2040 Index Fund
Schwab Target 2045 Index Fund
Schwab Target 2050 Index Fund
Schwab Target 2055 Index Fund
Schwab Target 2060 Index Fund
This page is intentionally left blank.
Schwab Target Index Funds
Fund investment adviser: Charles Schwab Investment Management, Inc. (CSIM).
Distributor: Charles Schwab & Co., Inc. (Schwab).
Schwab Target Index Funds | Semiannual Report
Schwab Target Index Funds
The performance data quoted represents past performance. Past performance does not guarantee future results. Investment returns and principal value of an investment will fluctuate so that an investor’s shares may be worth more or less than their original cost. Current performance may be lower or higher than performance data quoted. To obtain performance information current to the most recent month end, please visit www.csimfunds.com.
| Total Returns From Inception (August 25, 2016) to September 30, 2016 |
| Schwab Target 2010 Index Fund | |
| Investor Shares (Ticker Symbol: SWXAX) | 0.10% |
| Institutional Shares (Ticker Symbol: SWYAX) | 0.10% |
| Target 2010 Passive Composite Index | 0.08% |
| Fund Category: Morningstar Target-Date 2000-2010 | 0.21% |
| Performance Details | pages 9-10 |
| |
| Schwab Target 2015 Index Fund | |
| Investor Shares (Ticker Symbol: SWXBX) | 0.10% |
| Institutional Shares (Ticker Symbol: SWYBX) | 0.10% |
| Target 2015 Passive Composite Index | 0.08% |
| Fund Category: Morningstar Target-Date 2015 | 0.23% |
| Performance Details | pages 11-12 |
| |
| Schwab Target 2020 Index Fund | |
| Investor Shares (Ticker Symbol: SWXCX) | 0.10% |
| Institutional Shares (Ticker Symbol: SWYLX) | 0.10% |
| Target 2020 Passive Composite Index | 0.08% |
| Fund Category: Morningstar Target-Date 2020 | 0.23% |
| Performance Details | pages 13-14 |
| |
| Schwab Target 2025 Index Fund | |
| Investor Shares (Ticker Symbol: SWXDX) | 0.20% |
| Institutional Shares (Ticker Symbol: SWYDX) | 0.10% |
| Target 2025 Passive Composite Index | 0.08% |
| Fund Category: Morningstar Target-Date 2025 | 0.24% |
| Performance Details | pages 15-16 |
| |
| Schwab Target 2030 Index Fund | |
| Investor Shares (Ticker Symbol: SWXEX) | 0.10% |
| Institutional Shares (Ticker Symbol: SWYEX) | 0.20% |
| Target 2030 Passive Composite Index | 0.09% |
| Fund Category: Morningstar Target-Date 2030 | 0.27% |
| Performance Details | pages 17-18 |
| |
| Schwab Target 2035 Index Fund | |
| Investor Shares (Ticker Symbol: SWXFX) | 0.10% |
| Institutional Shares (Ticker Symbol: SWYFX) | 0.10% |
| Target 2035 Passive Composite Index | 0.09% |
| Fund Category: Morningstar Target-Date 2035 | 0.29% |
| Performance Details | pages 19-20 |
All total returns on this page assume dividends and distributions were reinvested. Index figures do not include trading and management costs, which would lower performance. Indexes are unmanaged and cannot be invested in directly. Performance results less than one year are not annualized.
The components that make up each of the composite indexes may vary over time. For index definitions, please see the Glossary.
Fund expenses may have been partially absorbed by CSIM and its affiliates. Without these reductions, a fund’s total return would have been lower. Performance does not reflect the deduction of taxes that a shareholder would pay on fund distributions or on the redemption of fund shares.
Source for category information: Morningstar, Inc. The Morningstar Category return represents all active and index mutual funds within the category as of the report date.
Schwab Target Index Funds | Semiannual Report
Schwab Target Index Funds
Performance at a Glance (continued)
| Total Returns From Inception (August 25, 2016) to September 30, 2016 |
| Schwab Target 2040 Index Fund | |
| Investor Shares (Ticker Symbol: SWXGX) | 0.10% |
| Institutional Shares (Ticker Symbol: SWYGX) | 0.10% |
| Target 2040 Passive Composite Index | 0.10% |
| Fund Category: Morningstar Target-Date 2040 | 0.31% |
| Performance Details | pages 21-22 |
| |
| Schwab Target 2045 Index Fund | |
| Investor Shares (Ticker Symbol: SWXHX) | 0.10% |
| Institutional Shares (Ticker Symbol: SWYHX) | 0.10% |
| Target 2045 Passive Composite Index | 0.11% |
| Fund Category: Morningstar Target-Date 2045 | 0.31% |
| Performance Details | pages 23-24 |
| |
| Schwab Target 2050 Index Fund | |
| Investor Shares (Ticker Symbol: SWXIX) | 0.10% |
| Institutional Shares (Ticker Symbol: SWYMX) | 0.20% |
| Target 2050 Passive Composite Index | 0.11% |
| Fund Category: Morningstar Target-Date 2050 | 0.33% |
| Performance Details | pages 25-26 |
| |
| Schwab Target 2055 Index Fund | |
| Investor Shares (Ticker Symbol: SWXJX) | 0.20% |
| Institutional Shares (Ticker Symbol: SWYJX) | 0.20% |
| Target 2055 Passive Composite Index | 0.11% |
| Fund Category: Morningstar Target-Date 2055 | 0.32% |
| Performance Details | pages 27-28 |
| |
| Schwab Target 2060 Index Fund | |
| Investor Shares (Ticker Symbol: SWXKX) | 0.20% |
| Institutional Shares (Ticker Symbol: SWYNX) | 0.20% |
| Target 2060 Passive Composite Index | 0.11% |
| Fund Category: Morningstar Target-Date 2060+ | 0.34% |
| Performance Details | pages 29-30 |
| |
| Minimum Initial Investment1 | |
| Investor Shares | $ 100 |
| Institutional Shares | $10,000,000 |
All total returns on this page assume dividends and distributions were reinvested. Index figures do not include trading and management costs, which would lower performance. Indexes are unmanaged and cannot be invested in directly. Performance results less than one year are not annualized.
The components that make up each of the composite indexes may vary over time. For index definitions, please see the Glossary.
Fund expenses may have been partially absorbed by CSIM and its affiliates. Without these reductions, a fund’s total return would have been lower. Performance does not reflect the deduction of taxes that a shareholder would pay on fund distributions or on the redemption of fund shares.
Source for category information: Morningstar, Inc. The Morningstar Category return represents all active and index mutual funds within the category as of the report date.
| 1 | There is no minimum investment requirement for employer-sponsored retirement plans (including, but not limited to, profit sharing, 401(k), 403(b), 457(b) and defined benefit plans). Please see the funds' prospectus for further detail and eligibility requirements. |
Schwab Target Index Funds | Semiannual Report
Schwab Target Index Funds
Marie Chandoha
President and CEO of
Charles Schwab Investment
Management, Inc. and the
funds covered in this report.
Dear Shareholder,
As one of the nation’s largest asset managers, our goal at Charles Schwab Investment Management is to provide investors with a diverse selection of foundational products. We aim to deliver these products with consistent performance and at a competitive cost, providing investors with quality and value in an ever-changing market and industry. Our new Schwab Target Index Funds (the funds), launched in August of this year, are an important addition to our well-established Target Date Fund suite, and broaden our roster of investment options designed to help institutional and individual clients with retirement savings needs. Our Target Index Funds are just one example of our commitment to providing investors with quality funds at a great value.
Lower fees can mean a significant increase in savings at retirement, and so to help investors reach and maximize their target savings, we rely primarily on low-cost Schwab exchange-traded funds (ETFs) for the funds’ underlying investments. Our market-cap ETFs offer some of the lowest operating expense ratios in the industry, which is why our Target Index Funds are among the lowest-cost target date mutual funds available. Individuals can access the funds for a fee of 0.13%, while those in an employer-sponsored retirement
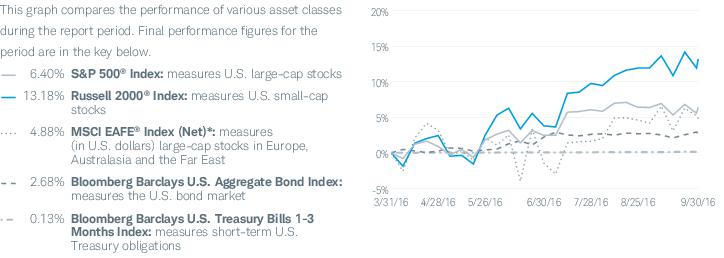
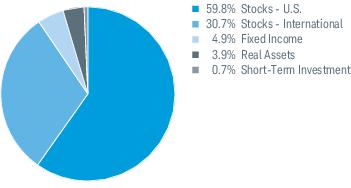
Asset Class Performance Comparison % returns during the six months ended 9/30/2016
Index figures assume dividends and distributions were reinvested. Index figures do not include trading and management costs, which would lower performance. Indexes are unmanaged and cannot be invested in directly. Past performance is not an indication of future results.
For index definitions, please see the Glossary.
Data source: Index provider websites and CSIM.
Nothing in this report represents a recommendation of a security by the investment adviser.
Management views and portfolio holdings may have changed since the report date.
Schwab Target Index Funds | Semiannual Report
Schwab Target Index Funds
From the President (continued)
“ Our new Schwab Target Index Funds (the funds), launched in August of this year, are an important addition to our well-established Target Date Fund suite, and broaden our roster of investment options designed to help institutional and individual clients with retirement savings needs.”
plan will pay 0.08%—just $1.30 and $0.80 per $1,000 invested, respectively.1 These new funds represent important milestones for our industry, and are great news for retirement savers.
At Charles Schwab Investment Management, we believe that our target date funds can help investors achieve long-term investing success by recognizing and helping mitigate various risk factors over time. The funds’ asset allocations are adjusted annually and follow a predetermined glide path, becoming more conservative as the target retirement date approaches and adjusting to assume less risk. When developing the funds’ glide path, we use a series of factors to quantify investors’ risk tolerance and future retirement income needs, which allows us to identify appropriate market exposures at various ages.
For the abbreviated reporting period of the funds’ inception of August 25 through September 30, the funds’ generated positive returns, and also tracked their respective indexes.
Thank you for investing with Charles Schwab Investment Management, and for trusting us to help you achieve your financial goals. For more information about the Schwab Target Index Funds, please continue reading this report, or you can find further details about the funds by visiting our website at www.csimfunds.com. We are also happy to hear from you at 1-877-824-5615.
Sincerely,
| 1 | $10 million minimum investment for Institutional Shares not purchased in an employer sponsored plan |
Schwab Target Index Funds | Semiannual Report
Schwab Target Index Funds
The Investment Environment
Over the six-month reporting period ended September 30, 2016, most markets generated positive returns despite weak global growth and continued uncertainty. The Federal Reserve (the Fed) left short-term interest rates unchanged and concerns lessened around the effects of China’s decelerating economy, while the United Kingdom’s (U.K.) decision in June to leave the European Union (EU), also known as Brexit, caused a spike in volatility. The S&P 500® Index, a bellwether for the overall U.S. stock market, returned 6.40% and the MSCI EAFE Index (Net), a broad measure of developed international equity performance, returned 4.88% for the reporting period. In the U.S. real estate market, the Dow Jones U.S. Select REIT Index returned 4.12%, while in fixed income, the Bloomberg Barclays U.S. Aggregate Bond Index returned 2.68%.
During the reporting period, steps to normalize interest rates in the U.S. stalled amid inconsistent economic data and global growth concerns. The Fed left short-term interest rates unchanged at each meeting during the six months, though markets continued to expect one rate hike by the end of 2016. At its meeting in September, the Fed noted that although the case for a rate increase had strengthened, the committee had “…decided, for the time being, to wait for further evidence of continued progress toward its objectives.” The continued low interest rate environment supported the performance of U.S. REITs and U.S. and emerging market stocks, and also contributed to historically low yields on U.S. government bonds.
Meanwhile, many central banks outside the U.S. increased their accommodative monetary policy measures over the reporting period. The People’s Bank of China (PBOC) expanded its lending facilities, contributing to signs of stability and lessening concerns surrounding growth in China’s economy. In international developed markets, both the Bank of Japan (BOJ) and the European Central Bank (ECB) maintained negative interest rates and increased their bond purchase programs. However, these measures proved to be less effective than the central banks had hoped, and led both the ECB and BOJ to consider additional stimulative moves at the end of the reporting period. Following the June Brexit vote, the Bank of England (BoE) announced its plan to take additional measures as required as markets adjusted. Less than two months later in early August, the BoE cut its benchmark rate and resumed quantitative easing, and also increased lending to consumers and companies.
U.S. bond yields remained low over the reporting period. Short-term interest rates, which are driven by Fed policy, were relatively stable over the six months. Longer-term rates, by comparison, are influenced more by inflation and economic growth expectations. Longer-term yields generally declined in the first four months of the reporting period, and then gradually rose over the remainder of the six months as some economic data measurements improved. Though U.S. bond yields remained historically low during the reporting period, negative interest rates and other accommodative monetary policies elsewhere resulted in even lower yields on many international government-backed securities. These low yields, in combination with a flight to safety for some investors, increased the relative appeal of U.S. Treasuries over the reporting period.
Schwab Target Index Funds | Semiannual Report
Schwab Target Index Funds
The Investment Environment (continued)
During the reporting period, oil and commodity prices remained low but stabilized in the second half of the six months. Excess supply and declining demand kept a ceiling on oil prices, though a relatively narrow trading range supported an overall rebound in the performance of many energy companies, oil-producing countries, and high-yield bonds. In the last week of the reporting period, the Organization of the Petroleum Exporting Countries proposed an agreement to limit output in order to raise oil prices, with details to be formalized at their next meeting in November. This announcement initially boosted oil prices, though the longer-term effects of an agreement were uncertain and skepticism surrounding the deal tempered optimism among many investors and banks.
Index figures assume dividends and distributions were reinvested. Index figures do not include trading and management costs, which would lower performance. Indices are unmanaged and cannot be invested in directly. Performance results less than one year are not annualized. Past performance is not an indication of future results.
For index definitions, please see the Glossary.
Nothing in this report represents a recommendation of a security by the investment adviser.
Management views may have changed since the report date.
Schwab Target Index Funds | Semiannual Report
Schwab Target Index Funds
 | Zifan Tang, Ph.D., CFA, Managing Director, Senior Portfolio Manager, leads the portfolio management team and has overall responsibility for all aspects of the management of the funds. She has served as portfolio manager of the funds since their inception. Prior to joining CSIM in 2012, Ms. Tang was a product manager at Thomson Reuters and, from 1997 to 2009, worked as a portfolio manager at Barclays Global Investors, which was subsequently acquired by BlackRock. |
Schwab Target Index Funds | Semiannual Report
Schwab Target 2010 Index Fund
Performance and Fund Facts as of 09/30/16
The performance data quoted represents past performance. Past performance does not guarantee future results. Investment returns and principal value of an investment will fluctuate so that an investor’s shares may be worth more or less than their original cost. Current performance may be lower or higher than performance data quoted. To obtain performance information current to the most recent month end, please visit www.csimfunds.com.
| Class and Inception Date | Since Inception |
| Investor Shares (8/25/16) | 0.10% |
| Institutional Shares (8/25/16) | 0.10% |
| Target 2010 Passive Composite Index | 0.08% |
| Dow Jones U.S. Total Stock Market IndexSM | 0.10% |
| Bloomberg Barclays U.S. Aggregate Bond Index | -0.09% |
| Fund Category: Morningstar Target-Date 2000-2010 | 0.21% |
| Fund Expense Ratios3: Investor Shares: Net 0.13%; Gross 0.19% / Institutional Shares: Net 0.08%; Gross 0.14% |
All total returns on this page assume dividends and distributions were reinvested. Index figures do not include trading and management costs, which would lower performance. Indexes are unmanaged and cannot be invested in directly. Performance results less than one year are not annualized.
For index definitions, please see the Glossary.
Portfolio holdings may have changed since the report date.
| 1 | Fund expenses may have been partially absorbed by CSIM and its affiliates. Without these reductions, the fund's returns would have been lower. These returns do not reflect the deduction of taxes that a shareholder would pay on fund distributions or the redemption of fund shares. |
| 2 | Source for category information: Morningstar, Inc. The Morningstar Category return represents all active and index mutual funds within the category as of the report date. |
| 3 | As stated in the prospectus. Includes expenses of the underlying funds in which the fund invests. The annualized weighted average expense ratio of the underlying funds was 0.06%. Net Expense: Expenses reduced by a contractual fee waiver in effect for so long as CSIM serves as the investment adviser to the fund. Gross Expense: Does not reflect the effect of contractual fee waivers. For actual ratios during the period, refer to the financial highlights section of the financial statements. |
Schwab Target Index Funds | Semiannual Report
Schwab Target 2010 Index Fund
Performance and Fund Facts as of 09/30/16 (continued)
| Number of Holdings | 9 |
| Portfolio Turnover Rate | 0% |
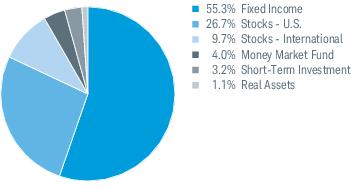
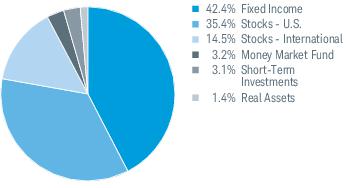
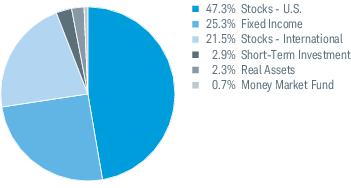
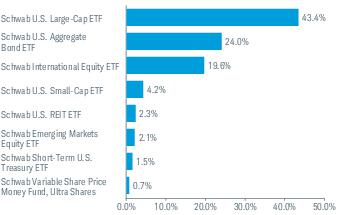
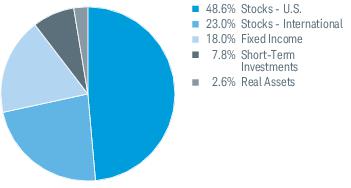
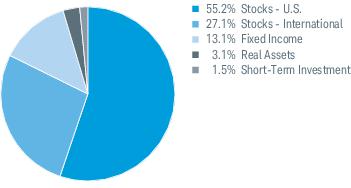
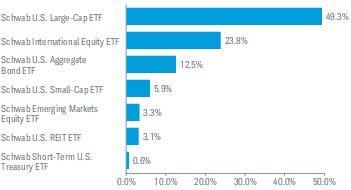
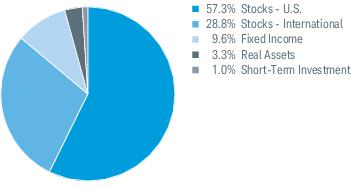
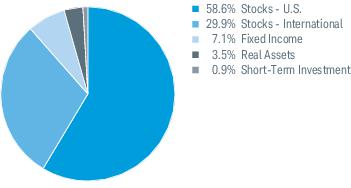
Asset Class Weightings % of Investments1
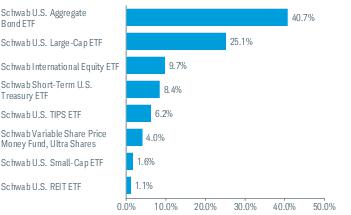
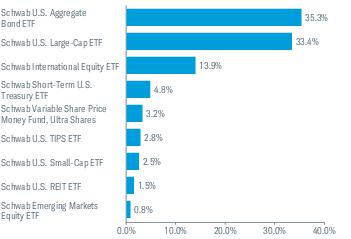
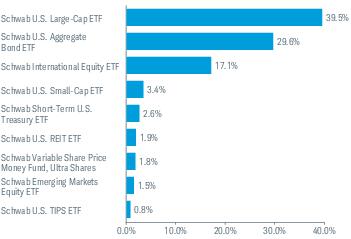
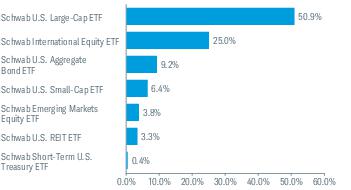
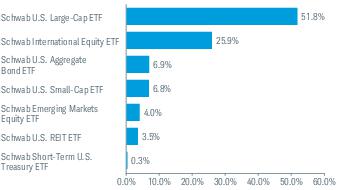
Top Holdings % of Net Assets2,3
| 1 | The fund intends to primarily invest in affiliated Schwab ETFs and may also invest in affiliated Schwab and Laudus mutual funds
and unaffiliated third party ETFs and mutual funds (all such ETFs and mutual funds referred to as "underlying funds"). |
| 2 | This list is not a recommendation of any security by the investment adviser. |
| 3 | The holdings listed exclude any temporary liquidity investments. |
Schwab Target Index Funds | Semiannual Report
Schwab Target 2015 Index Fund
Performance and Fund Facts as of 09/30/16
The performance data quoted represents past performance. Past performance does not guarantee future results. Investment returns and principal value of an investment will fluctuate so that an investor’s shares may be worth more or less than their original cost. Current performance may be lower or higher than performance data quoted. To obtain performance information current to the most recent month end, please visit www.csimfunds.com.
| Class and Inception Date | Since Inception |
| Investor Shares (8/25/16) | 0.10% |
| Institutional Shares (8/25/16) | 0.10% |
| Target 2015 Passive Composite Index | 0.08% |
| Dow Jones U.S. Total Stock Market IndexSM | 0.10% |
| Bloomberg Barclays U.S. Aggregate Bond Index | -0.09% |
| Fund Category: Morningstar Target-Date 2015 | 0.23% |
| Fund Expense Ratios3: Investor Shares: Net 0.13%; Gross 0.19% / Institutional Shares: Net 0.08%; Gross 0.14% |
All total returns on this page assume dividends and distributions were reinvested. Index figures do not include trading and management costs, which would lower performance. Indexes are unmanaged and cannot be invested in directly. Performance results less than one year are not annualized.
For index definitions, please see the Glossary.
Portfolio holdings may have changed since the report date.
| 1 | Fund expenses may have been partially absorbed by CSIM and its affiliates. Without these reductions, the fund's returns would have been lower. These returns do not reflect the deduction of taxes that a shareholder would pay on fund distributions or the redemption of fund shares. |
| 2 | Source for category information: Morningstar, Inc. The Morningstar Category return represents all active and index mutual funds within the category as of the report date. |
| 3 | As stated in the prospectus. Includes expenses of the underlying funds in which the fund invests. The annualized weighted average expense ratio of the underlying funds was 0.06%. Net Expense: Expenses reduced by a contractual fee waiver in effect for so long as CSIM serves as the investment adviser to the fund. Gross Expense: Does not reflect the effect of contractual fee waivers. For actual ratios during the period, refer to the financial highlights section of the financial statements. |
Schwab Target Index Funds | Semiannual Report
Schwab Target 2015 Index Fund
Performance and Fund Facts as of 09/30/16 (continued)
| Number of Holdings | 9 |
| Portfolio Turnover Rate | 0% |
Asset Class Weightings % of Investments1
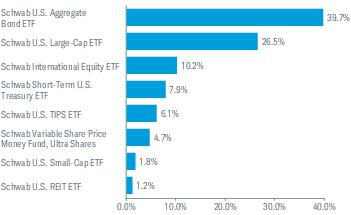
Top Holdings % of Net Assets2,3
| 1 | The fund intends to primarily invest in affiliated Schwab ETFs and may also invest in affiliated Schwab and Laudus mutual funds
and unaffiliated third party ETFs and mutual funds (all such ETFs and mutual funds referred to as "underlying funds"). |
| 2 | This list is not a recommendation of any security by the investment adviser. |
| 3 | The holdings listed exclude any temporary liquidity investments. |
Schwab Target Index Funds | Semiannual Report
Schwab Target 2020 Index Fund
Performance and Fund Facts as of 09/30/16
The performance data quoted represents past performance. Past performance does not guarantee future results. Investment returns and principal value of an investment will fluctuate so that an investor’s shares may be worth more or less than their original cost. Current performance may be lower or higher than performance data quoted. To obtain performance information current to the most recent month end, please visit www.csimfunds.com.
| Class and Inception Date | Since Inception |
| Investor Shares (8/25/16) | 0.10% |
| Institutional Shares (8/25/16) | 0.10% |
| Target 2020 Passive Composite Index | 0.08% |
| Dow Jones U.S. Total Stock Market IndexSM | 0.10% |
| Bloomberg Barclays U.S. Aggregate Bond Index | -0.09% |
| Fund Category: Morningstar Target-Date 2020 | 0.23% |
| Fund Expense Ratios3: Investor Shares: Net 0.13%; Gross 0.19% / Institutional Shares: Net 0.08%; Gross 0.14% |
All total returns on this page assume dividends and distributions were reinvested. Index figures do not include trading and management costs, which would lower performance. Indexes are unmanaged and cannot be invested in directly. Performance results less than one year are not annualized.
For index definitions, please see the Glossary.
Portfolio holdings may have changed since the report date.
| 1 | Fund expenses may have been partially absorbed by CSIM and its affiliates. Without these reductions, the fund's returns would have been lower. These returns do not reflect the deduction of taxes that a shareholder would pay on fund distributions or the redemption of fund shares. |
| 2 | Source for category information: Morningstar, Inc. The Morningstar Category return represents all active and index mutual funds within the category as of the report date. |
| 3 | As stated in the prospectus. Includes expenses of the underlying funds in which the fund invests. The annualized weighted average expense ratio of the underlying funds was 0.06%. Net Expense: Expenses reduced by a contractual fee waiver in effect for so long as CSIM serves as the investment adviser to the fund. Gross Expense: Does not reflect the effect of contractual fee waivers. For actual ratios during the period, refer to the financial highlights section of the financial statements. |
Schwab Target Index Funds | Semiannual Report
Schwab Target 2020 Index Fund
Performance and Fund Facts as of 09/30/16 (continued)
| Number of Holdings | 11 |
| Portfolio Turnover Rate | 0% |
Asset Class Weightings % of Investments1
Top Holdings % of Net Assets2,3
| 1 | The fund intends to primarily invest in affiliated Schwab ETFs and may also invest in affiliated Schwab and Laudus mutual funds
and unaffiliated third party ETFs and mutual funds (all such ETFs and mutual funds referred to as "underlying funds"). |
| 2 | This list is not a recommendation of any security by the investment adviser. |
| 3 | The holdings listed exclude any temporary liquidity investments. |
Schwab Target Index Funds | Semiannual Report
Schwab Target 2025 Index Fund
Performance and Fund Facts as of 09/30/16
The performance data quoted represents past performance. Past performance does not guarantee future results. Investment returns and principal value of an investment will fluctuate so that an investor’s shares may be worth more or less than their original cost. Current performance may be lower or higher than performance data quoted. To obtain performance information current to the most recent month end, please visit www.csimfunds.com.
| Class and Inception Date | Since Inception |
| Investor Shares (8/25/16) | 0.20% |
| Institutional Shares (8/25/16) | 0.10% |
| Target 2025 Passive Composite Index | 0.08% |
| Dow Jones U.S. Total Stock Market IndexSM | 0.10% |
| Bloomberg Barclays U.S. Aggregate Bond Index | -0.09% |
| Fund Category: Morningstar Target-Date 2025 | 0.24% |
| Fund Expense Ratios3: Investor Shares: Net 0.13%; Gross 0.19% / Institutional Shares: Net 0.08%; Gross 0.14% |
All total returns on this page assume dividends and distributions were reinvested. Index figures do not include trading and management costs, which would lower performance. Indexes are unmanaged and cannot be invested in directly. Performance results less than one year are not annualized.
For index definitions, please see the Glossary.
Portfolio holdings may have changed since the report date.
| 1 | Fund expenses may have been partially absorbed by CSIM and its affiliates. Without these reductions, the fund's returns would have been lower. These returns do not reflect the deduction of taxes that a shareholder would pay on fund distributions or the redemption of fund shares. |
| 2 | Source for category information: Morningstar, Inc. The Morningstar Category return represents all active and index mutual funds within the category as of the report date. |
| 3 | As stated in the prospectus. Includes expenses of the underlying funds in which the fund invests. The annualized weighted average expense ratio of the underlying funds was 0.06%. Net Expense: Expenses reduced by a contractual fee waiver in effect for so long as CSIM serves as the investment adviser to the fund. Gross Expense: Does not reflect the effect of contractual fee waivers. For actual ratios during the period, refer to the financial highlights section of the financial statements. |
Schwab Target Index Funds | Semiannual Report
Schwab Target 2025 Index Fund
Performance and Fund Facts as of 09/30/16 (continued)
| Number of Holdings | 10 |
| Portfolio Turnover Rate | 4% |
Asset Class Weightings % of Investments1
Top Holdings % of Net Assets2,3
| 1 | The fund intends to primarily invest in affiliated Schwab ETFs and may also invest in affiliated Schwab and Laudus mutual funds
and unaffiliated third party ETFs and mutual funds (all such ETFs and mutual funds referred to as "underlying funds"). |
| 2 | This list is not a recommendation of any security by the investment adviser. |
| 3 | The holdings listed exclude any temporary liquidity investments. |
Schwab Target Index Funds | Semiannual Report
Schwab Target 2030 Index Fund
Performance and Fund Facts as of 09/30/16
The performance data quoted represents past performance. Past performance does not guarantee future results. Investment returns and principal value of an investment will fluctuate so that an investor’s shares may be worth more or less than their original cost. Current performance may be lower or higher than performance data quoted. To obtain performance information current to the most recent month end, please visit www.csimfunds.com.
| Class and Inception Date | Since Inception |
| Investor Shares (8/25/16) | 0.10% |
| Institutional Shares (8/25/16) | 0.20% |
| Target 2030 Passive Composite Index | 0.09% |
| Dow Jones U.S. Total Stock Market IndexSM | 0.10% |
| Bloomberg Barclays U.S. Aggregate Bond Index | -0.09% |
| Fund Category: Morningstar Target-Date 2030 | 0.27% |
| Fund Expense Ratios3: Investor Shares: Net 0.13%; Gross 0.19% / Institutional Shares: Net 0.08%; Gross 0.14% |
All total returns on this page assume dividends and distributions were reinvested. Index figures do not include trading and management costs, which would lower performance. Indexes are unmanaged and cannot be invested in directly. Performance results less than one year are not annualized.
For index definitions, please see the Glossary.
Portfolio holdings may have changed since the report date.
| 1 | Fund expenses may have been partially absorbed by CSIM and its affiliates. Without these reductions, the fund's returns would have been lower. These returns do not reflect the deduction of taxes that a shareholder would pay on fund distributions or the redemption of fund shares. |
| 2 | Source for category information: Morningstar, Inc. The Morningstar Category return represents all active and index mutual funds within the category as of the report date. |
| 3 | As stated in the prospectus. Includes expenses of the underlying funds in which the fund invests. The annualized weighted average expense ratio of the underlying funds was 0.06%. Net Expense: Expenses reduced by a contractual fee waiver in effect for so long as CSIM serves as the investment adviser to the fund. Gross Expense: Does not reflect the effect of contractual fee waivers. For actual ratios during the period, refer to the financial highlights section of the financial statements. |
Schwab Target Index Funds | Semiannual Report
Schwab Target 2030 Index Fund
Performance and Fund Facts as of 09/30/16 (continued)
| Number of Holdings | 9 |
| Portfolio Turnover Rate | 0% |
Asset Class Weightings % of Investments1
Top Holdings % of Net Assets2,3
| 1 | The fund intends to primarily invest in affiliated Schwab ETFs and may also invest in affiliated Schwab and Laudus mutual funds
and unaffiliated third party ETFs and mutual funds (all such ETFs and mutual funds referred to as "underlying funds"). |
| 2 | This list is not a recommendation of any security by the investment adviser. |
| 3 | The holdings listed exclude any temporary liquidity investments. |
Schwab Target Index Funds | Semiannual Report
Schwab Target 2035 Index Fund
Performance and Fund Facts as of 09/30/16
The performance data quoted represents past performance. Past performance does not guarantee future results. Investment returns and principal value of an investment will fluctuate so that an investor’s shares may be worth more or less than their original cost. Current performance may be lower or higher than performance data quoted. To obtain performance information current to the most recent month end, please visit www.csimfunds.com.
| Class and Inception Date | Since Inception |
| Investor Shares (8/25/16) | 0.10% |
| Institutional Shares (8/25/16) | 0.10% |
| Target 2035 Passive Composite Index | 0.09% |
| Dow Jones U.S. Total Stock Market IndexSM | 0.10% |
| Bloomberg Barclays U.S. Aggregate Bond Index | -0.09% |
| Fund Category: Morningstar Target-Date 2035 | 0.29% |
| Fund Expense Ratios3: Investor Shares: Net 0.13%; Gross 0.18% / Institutional Shares: Net 0.08%; Gross 0.13% |
All total returns on this page assume dividends and distributions were reinvested. Index figures do not include trading and management costs, which would lower performance. Indexes are unmanaged and cannot be invested in directly. Performance results less than one year are not annualized.
For index definitions, please see the Glossary.
Portfolio holdings may have changed since the report date.
| 1 | Fund expenses may have been partially absorbed by CSIM and its affiliates. Without these reductions, the fund's returns would have been lower. These returns do not reflect the deduction of taxes that a shareholder would pay on fund distributions or the redemption of fund shares. |
| 2 | Source for category information: Morningstar, Inc. The Morningstar Category return represents all active and index mutual funds within the category as of the report date. |
| 3 | As stated in the prospectus. Includes expenses of the underlying funds in which the fund invests. The annualized weighted average expense ratio of the underlying funds was 0.05%. Net Expense: Expenses reduced by a contractual fee waiver in effect for so long as CSIM serves as the investment adviser to the fund. Gross Expense: Does not reflect the effect of contractual fee waivers. For actual ratios during the period, refer to the financial highlights section of the financial statements. |
Schwab Target Index Funds | Semiannual Report
Schwab Target 2035 Index Fund
Performance and Fund Facts as of 09/30/16 (continued)
| Number of Holdings | 9 |
| Portfolio Turnover Rate | 7% |
Asset Class Weightings % of Investments1
Top Holdings % of Net Assets2,3
| 1 | The fund intends to primarily invest in affiliated Schwab ETFs and may also invest in affiliated Schwab and Laudus mutual funds
and unaffiliated third party ETFs and mutual funds (all such ETFs and mutual funds referred to as "underlying funds"). |
| 2 | This list is not a recommendation of any security by the investment adviser. |
| 3 | The holdings listed exclude any temporary liquidity investments. |
Schwab Target Index Funds | Semiannual Report
Schwab Target 2040 Index Fund
Performance and Fund Facts as of 09/30/16
The performance data quoted represents past performance. Past performance does not guarantee future results. Investment returns and principal value of an investment will fluctuate so that an investor’s shares may be worth more or less than their original cost. Current performance may be lower or higher than performance data quoted. To obtain performance information current to the most recent month end, please visit www.csimfunds.com.
| Class and Inception Date | Since Inception |
| Investor Shares (8/25/16) | 0.10% |
| Institutional Shares (8/25/16) | 0.10% |
| Target 2040 Passive Composite Index | 0.10% |
| Dow Jones U.S. Total Stock Market IndexSM | 0.10% |
| Bloomberg Barclays U.S. Aggregate Bond Index | -0.09% |
| Fund Category: Morningstar Target-Date 2040 | 0.31% |
| Fund Expense Ratios3: Investor Shares: Net 0.13%; Gross 0.18% / Institutional Shares: Net 0.08%; Gross 0.13% |
All total returns on this page assume dividends and distributions were reinvested. Index figures do not include trading and management costs, which would lower performance. Indexes are unmanaged and cannot be invested in directly. Performance results less than one year are not annualized.
For index definitions, please see the Glossary.
Portfolio holdings may have changed since the report date.
| 1 | Fund expenses may have been partially absorbed by CSIM and its affiliates. Without these reductions, the fund's returns would have been lower. These returns do not reflect the deduction of taxes that a shareholder would pay on fund distributions or the redemption of fund shares. |
| 2 | Source for category information: Morningstar, Inc. The Morningstar Category return represents all active and index mutual funds within the category as of the report date. |
| 3 | As stated in the prospectus. Includes expenses of the underlying funds in which the fund invests. The annualized weighted average expense ratio of the underlying funds was 0.05%. Net Expense: Expenses reduced by a contractual fee waiver in effect for so long as CSIM serves as the investment adviser to the fund. Gross Expense: Does not reflect the effect of contractual fee waivers. For actual ratios during the period, refer to the financial highlights section of the financial statements. |
Schwab Target Index Funds | Semiannual Report
Schwab Target 2040 Index Fund
Performance and Fund Facts as of 09/30/16 (continued)
| Number of Holdings | 8 |
| Portfolio Turnover Rate | 0% |
Asset Class Weightings % of Investments1
Top Holdings % of Net Assets2,3
| 1 | The fund intends to primarily invest in affiliated Schwab ETFs and may also invest in affiliated Schwab and Laudus mutual funds
and unaffiliated third party ETFs and mutual funds (all such ETFs and mutual funds referred to as "underlying funds"). |
| 2 | This list is not a recommendation of any security by the investment adviser. |
| 3 | The holdings listed exclude any temporary liquidity investments. |
Schwab Target Index Funds | Semiannual Report
Schwab Target 2045 Index Fund
Performance and Fund Facts as of 09/30/16
The performance data quoted represents past performance. Past performance does not guarantee future results. Investment returns and principal value of an investment will fluctuate so that an investor’s shares may be worth more or less than their original cost. Current performance may be lower or higher than performance data quoted. To obtain performance information current to the most recent month end, please visit www.csimfunds.com.
| Class and Inception Date | Since Inception |
| Investor Shares (8/25/16) | 0.10% |
| Institutional Shares (8/25/16) | 0.10% |
| Target 2045 Passive Composite Index | 0.11% |
| Dow Jones U.S. Total Stock Market IndexSM | 0.10% |
| Bloomberg Barclays U.S. Aggregate Bond Index | -0.09% |
| Fund Category: Morningstar Target-Date 2045 | 0.31% |
| Fund Expense Ratios3: Investor Shares: Net 0.13%; Gross 0.18% / Institutional Shares: Net 0.08%; Gross 0.13% |
All total returns on this page assume dividends and distributions were reinvested. Index figures do not include trading and management costs, which would lower performance. Indexes are unmanaged and cannot be invested in directly. Performance results less than one year are not annualized.
For index definitions, please see the Glossary.
Portfolio holdings may have changed since the report date.
| 1 | Fund expenses may have been partially absorbed by CSIM and its affiliates. Without these reductions, the fund's returns would have been lower. These returns do not reflect the deduction of taxes that a shareholder would pay on fund distributions or the redemption of fund shares. |
| 2 | Source for category information: Morningstar, Inc. The Morningstar Category return represents all active and index mutual funds within the category as of the report date. |
| 3 | As stated in the prospectus. Includes expenses of the underlying funds in which the fund invests. The annualized weighted average expense ratio of the underlying funds was 0.05%. Net Expense: Expenses reduced by a contractual fee waiver in effect for so long as CSIM serves as the investment adviser to the fund. Gross Expense: Does not reflect the effect of contractual fee waivers. For actual ratios during the period, refer to the financial highlights section of the financial statements. |
Schwab Target Index Funds | Semiannual Report
Schwab Target 2045 Index Fund
Performance and Fund Facts as of 09/30/16 (continued)
| Number of Holdings | 8 |
| Portfolio Turnover Rate | 1% |
Asset Class Weightings % of Investments1
Top Holdings % of Net Assets2,3
| 1 | The fund intends to primarily invest in affiliated Schwab ETFs and may also invest in affiliated Schwab and Laudus mutual funds
and unaffiliated third party ETFs and mutual funds (all such ETFs and mutual funds referred to as "underlying funds"). |
| 2 | This list is not a recommendation of any security by the investment adviser. |
| 3 | The holdings listed exclude any temporary liquidity investments. |
Schwab Target Index Funds | Semiannual Report
Schwab Target 2050 Index Fund
Performance and Fund Facts as of 09/30/16
The performance data quoted represents past performance. Past performance does not guarantee future results. Investment returns and principal value of an investment will fluctuate so that an investor’s shares may be worth more or less than their original cost. Current performance may be lower or higher than performance data quoted. To obtain performance information current to the most recent month end, please visit www.csimfunds.com.
| Class and Inception Date | Since Inception |
| Investor Shares (8/25/16) | 0.10% |
| Institutional Shares (8/25/16) | 0.20% |
| Target 2050 Passive Composite Index | 0.11% |
| Dow Jones U.S. Total Stock Market IndexSM | 0.10% |
| Bloomberg Barclays U.S. Aggregate Bond Index | -0.09% |
| Fund Category: Morningstar Target-Date 2050 | 0.33% |
| Fund Expense Ratios3: Investor Shares: Net 0.13%; Gross 0.18% / Institutional Shares: Net 0.08%; Gross 0.13% |
All total returns on this page assume dividends and distributions were reinvested. Index figures do not include trading and management costs, which would lower performance. Indexes are unmanaged and cannot be invested in directly. Performance results less than one year are not annualized.
For index definitions, please see the Glossary.
Portfolio holdings may have changed since the report date.
| 1 | Fund expenses may have been partially absorbed by CSIM and its affiliates. Without these reductions, the fund's returns would have been lower. These returns do not reflect the deduction of taxes that a shareholder would pay on fund distributions or the redemption of fund shares. |
| 2 | Source for category information: Morningstar, Inc. The Morningstar Category return represents all active and index mutual funds within the category as of the report date. |
| 3 | As stated in the prospectus. Includes expenses of the underlying funds in which the fund invests. The annualized weighted average expense ratio of the underlying funds was 0.05%. Net Expense: Expenses reduced by a contractual fee waiver in effect for so long as CSIM serves as the investment adviser to the fund. Gross Expense: Does not reflect the effect of contractual fee waivers. For actual ratios during the period, refer to the financial highlights section of the financial statements. |
Schwab Target Index Funds | Semiannual Report
Schwab Target 2050 Index Fund
Performance and Fund Facts as of 09/30/16 (continued)
| Number of Holdings | 8 |
| Portfolio Turnover Rate | 8% |
Asset Class Weightings % of Investments1
Top Holdings % of Net Assets2,3
| 1 | The fund intends to primarily invest in affiliated Schwab ETFs and may also invest in affiliated Schwab and Laudus mutual funds
and unaffiliated third party ETFs and mutual funds (all such ETFs and mutual funds referred to as "underlying funds"). |
| 2 | This list is not a recommendation of any security by the investment adviser. |
| 3 | The holdings listed exclude any temporary liquidity investments. |
Schwab Target Index Funds | Semiannual Report
Schwab Target 2055 Index Fund
Performance and Fund Facts as of 09/30/16
The performance data quoted represents past performance. Past performance does not guarantee future results. Investment returns and principal value of an investment will fluctuate so that an investor’s shares may be worth more or less than their original cost. Current performance may be lower or higher than performance data quoted. To obtain performance information current to the most recent month end, please visit www.csimfunds.com.
| Class and Inception Date | Since Inception |
| Investor Shares (8/25/16) | 0.20% |
| Institutional Shares (8/25/16) | 0.20% |
| Target 2055 Passive Composite Index | 0.11% |
| Dow Jones U.S. Total Stock Market IndexSM | 0.10% |
| Bloomberg Barclays U.S. Aggregate Bond Index | -0.09% |
| Fund Category: Morningstar Target-Date 2055 | 0.32% |
| Fund Expense Ratios3: Investor Shares: Net 0.13%; Gross 0.18% / Institutional Shares: Net 0.08%; Gross 0.13% |
All total returns on this page assume dividends and distributions were reinvested. Index figures do not include trading and management costs, which would lower performance. Indexes are unmanaged and cannot be invested in directly. Performance results less than one year are not annualized.
For index definitions, please see the Glossary.
Portfolio holdings may have changed since the report date.
| 1 | Fund expenses may have been partially absorbed by CSIM and its affiliates. Without these reductions, the fund's returns would have been lower. These returns do not reflect the deduction of taxes that a shareholder would pay on fund distributions or the redemption of fund shares. |
| 2 | Source for category information: Morningstar, Inc. The Morningstar Category return represents all active and index mutual funds within the category as of the report date. |
| 3 | As stated in the prospectus. Includes expenses of the underlying funds in which the fund invests. The annualized weighted average expense ratio of the underlying funds was 0.05%. Net Expense: Expenses reduced by a contractual fee waiver in effect for so long as CSIM serves as the investment adviser to the fund. Gross Expense: Does not reflect the effect of contractual fee waivers. For actual ratios during the period, refer to the financial highlights section of the financial statements. |
Schwab Target Index Funds | Semiannual Report
Schwab Target 2055 Index Fund
Performance and Fund Facts as of 09/30/16 (continued)
| Number of Holdings | 8 |
| Portfolio Turnover Rate | 0% |
Asset Class Weightings % of Investments1
Top Holdings % of Net Assets2,3
| 1 | The fund intends to primarily invest in affiliated Schwab ETFs and may also invest in affiliated Schwab and Laudus mutual funds
and unaffiliated third party ETFs and mutual funds (all such ETFs and mutual funds referred to as "underlying funds"). |
| 2 | This list is not a recommendation of any security by the investment adviser. |
| 3 | The holdings listed exclude any temporary liquidity investments. |
Schwab Target Index Funds | Semiannual Report
Schwab Target 2060 Index Fund
Performance and Fund Facts as of 09/30/16
The performance data quoted represents past performance. Past performance does not guarantee future results. Investment returns and principal value of an investment will fluctuate so that an investor’s shares may be worth more or less than their original cost. Current performance may be lower or higher than performance data quoted. To obtain performance information current to the most recent month end, please visit www.csimfunds.com.
| Class and Inception Date | Since Inception |
| Investor Shares (8/25/16) | 0.20% |
| Institutional Shares (8/25/16) | 0.20% |
| Target 2060 Passive Composite Index | 0.11% |
| Dow Jones U.S. Total Stock Market IndexSM | 0.10% |
| Bloomberg Barclays U.S. Aggregate Bond Index | -0.09% |
| Fund Category: Morningstar Target-Date 2060+ | 0.34% |
| Fund Expense Ratios3: Investor Shares: Net 0.13%; Gross 0.18% / Institutional Shares: Net 0.08%; Gross 0.13% |
All total returns on this page assume dividends and distributions were reinvested. Index figures do not include trading and management costs, which would lower performance. Indexes are unmanaged and cannot be invested in directly. Performance results less than one year are not annualized.
For index definitions, please see the Glossary.
Portfolio holdings may have changed since the report date.
| 1 | Fund expenses may have been partially absorbed by CSIM and its affiliates. Without these reductions, the fund's returns would have been lower. These returns do not reflect the deduction of taxes that a shareholder would pay on fund distributions or the redemption of fund shares. |
| 2 | Source for category information: Morningstar, Inc. The Morningstar Category return represents all active and index mutual funds within the category as of the report date. |
| 3 | As stated in the prospectus. Includes expenses of the underlying funds in which the fund invests. The annualized weighted average expense ratio of the underlying funds was 0.05%. Net Expense: Expenses reduced by a contractual fee waiver in effect for so long as CSIM serves as the investment adviser to the fund. Gross Expense: Does not reflect the effect of contractual fee waivers. For actual ratios during the period, refer to the financial highlights section of the financial statements. |
Schwab Target Index Funds | Semiannual Report
Schwab Target 2060 Index Fund
Performance and Fund Facts as of 09/30/16 (continued)
| Number of Holdings | 8 |
| Portfolio Turnover Rate | 0% |
Asset Class Weightings % of Investments1
Top Holdings % of Net Assets2,3
| 1 | The fund intends to primarily invest in affiliated Schwab ETFs and may also invest in affiliated Schwab and Laudus mutual funds
and unaffiliated third party ETFs and mutual funds (all such ETFs and mutual funds referred to as "underlying funds"). |
| 2 | This list is not a recommendation of any security by the investment adviser. |
| 3 | The holdings listed exclude any temporary liquidity investments. |
Schwab Target Index Funds | Semiannual Report
Schwab Target Index Funds
Fund Expenses (Unaudited)
Examples for a $1,000 Investment
As a fund shareholder, you may incur two types of costs: (1) transaction costs, such as redemption fees; and (2) ongoing costs, including management fees, transfer agent and shareholder services fees, and other fund expenses.
The expense examples below are intended to help you understand your ongoing cost (in dollars) of investing in a fund and to compare this cost with the ongoing cost of investing in other mutual funds. The Hypothetical expense examples are based on an investment of $1,000 invested for the six months beginning April 1, 2016 and held through September 30, 2016. The Actual expense examples are based on an investment of $1,000 invested for the period beginning from commencement of operations on August 25, 2016 and held through September 30, 2016.
Actual Return lines in the table below provide information about actual account values and actual expenses. You may use this information, together with the amount you invested, to estimate the expenses that you paid over the period. To do so, simply divide your account value by $1,000 (for example, an $8,600 account value ÷ $1,000 = 8.6), then multiply the result by the number given for your fund under the heading entitled “Expenses Paid During Period.”
Hypothetical Return lines in the table below provide information about hypothetical account values and hypothetical expenses based on a fund’s actual expense ratio and an assumed return of 5% per year before expenses. Because the return used is not an actual return, it may not be used to estimate the actual ending account value or expenses you paid for the period.
You may use this information to compare the ongoing costs of investing in a fund and other funds. To do so, compare this 5% hypothetical example with the 5% hypothetical examples that appear in the shareholder reports of the other funds.
Please note that the expenses shown in the table are meant to highlight your ongoing costs only, and do not reflect any transactional costs, such as redemption fees, or any non-routine expenses, such as proxy fees. Therefore, the hypothetical return lines of the table are useful in comparing ongoing costs only, and will not help you determine the relative total costs of owning different funds. In addition, if these transactional costs or non-routine expenses were included, your costs would have been higher.
| | Expense Ratio1
(Annualized) | Beginning
Account Value
at 8/25/16 | Ending
Account Value
(Net of Expenses)
at 9/30/16 | Expenses Paid
During Period2,3 | |
| Schwab Target 2010 Index Fund | | | | | |
| Investor Shares | | | | | |
| Actual Return | 0.08% | $1,000.00 | $1,001.00 | $0.08 | |
| Hypothetical 5% Return | 0.08% | $1,000.00 | $1,024.70 | $0.41 | |
| Institutional Shares | | | | | |
| Actual Return | 0.03% | $1,000.00 | $1,001.00 | $0.03 | |
| Hypothetical 5% Return | 0.03% | $1,000.00 | $1,024.95 | $0.15 | |
| Schwab Target 2015 Index Fund | | | | | |
| Investor Shares | | | | | |
| Actual Return | 0.08% | $1,000.00 | $1,001.00 | $0.08 | |
| Hypothetical 5% Return | 0.08% | $1,000.00 | $1,024.70 | $0.41 | |
| Institutional Shares | | | | | |
| Actual Return | 0.03% | $1,000.00 | $1,001.00 | $0.03 | |
| Hypothetical 5% Return | 0.03% | $1,000.00 | $1,024.95 | $0.15 | |
| Schwab Target 2020 Index Fund | | | | | |
| Investor Shares | | | | | |
| Actual Return | 0.08% | $1,000.00 | $1,001.00 | $0.08 | |
| Hypothetical 5% Return | 0.08% | $1,000.00 | $1,024.70 | $0.41 | |
| Institutional Shares | | | | | |
| Actual Return | 0.03% | $1,000.00 | $1,001.00 | $0.03 | |
| Hypothetical 5% Return | 0.03% | $1,000.00 | $1,024.95 | $0.15 | |
| Schwab Target 2025 Index Fund | | | | | |
| Investor Shares | | | | | |
| Actual Return | 0.08% | $1,000.00 | $1,002.00 | $0.08 | |
| Hypothetical 5% Return | 0.08% | $1,000.00 | $1,024.70 | $0.41 | |
| Institutional Shares | | | | | |
| Actual Return | 0.03% | $1,000.00 | $1,001.00 | $0.03 | |
| Hypothetical 5% Return | 0.03% | $1,000.00 | $1,024.95 | $0.15 | |
Schwab Target Index Funds | Semiannual Report
Schwab Target Index Funds
Fund Expenses (Unaudited) (continued)
| | Expense Ratio1
(Annualized) | Beginning
Account Value
at 8/25/16 | Ending
Account Value
(Net of Expenses)
at 9/30/16 | Expenses Paid
During Period2,3 | |
| Schwab Target 2030 Index Fund | | | | | |
| Investor Shares | | | | | |
| Actual Return | 0.08% | $1,000.00 | $1,001.00 | $0.08 | |
| Hypothetical 5% Return | 0.08% | $1,000.00 | $1,024.70 | $0.41 | |
| Institutional Shares | | | | | |
| Actual Return | 0.03% | $1,000.00 | $1,002.00 | $0.03 | |
| Hypothetical 5% Return | 0.03% | $1,000.00 | $1,024.95 | $0.15 | |
| Schwab Target 2035 Index Fund | | | | | |
| Investor Shares | | | | | |
| Actual Return | 0.08% | $1,000.00 | $1,001.00 | $0.08 | |
| Hypothetical 5% Return | 0.08% | $1,000.00 | $1,024.70 | $0.41 | |
| Institutional Shares | | | | | |
| Actual Return | 0.03% | $1,000.00 | $1,001.00 | $0.03 | |
| Hypothetical 5% Return | 0.03% | $1,000.00 | $1,024.95 | $0.15 | |
| Schwab Target 2040 Index Fund | | | | | |
| Investor Shares | | | | | |
| Actual Return | 0.08% | $1,000.00 | $1,001.00 | $0.08 | |
| Hypothetical 5% Return | 0.08% | $1,000.00 | $1,024.70 | $0.41 | |
| Institutional Shares | | | | | |
| Actual Return | 0.03% | $1,000.00 | $1,001.00 | $0.03 | |
| Hypothetical 5% Return | 0.03% | $1,000.00 | $1,024.95 | $0.15 | |
| Schwab Target 2045 Index Fund | | | | | |
| Investor Shares | | | | | |
| Actual Return | 0.08% | $1,000.00 | $1,001.00 | $0.08 | |
| Hypothetical 5% Return | 0.08% | $1,000.00 | $1,024.70 | $0.41 | |
| Institutional Shares | | | | | |
| Actual Return | 0.03% | $1,000.00 | $1,001.00 | $0.03 | |
| Hypothetical 5% Return | 0.03% | $1,000.00 | $1,024.95 | $0.15 | |
| Schwab Target 2050 Index Fund | | | | | |
| Investor Shares | | | | | |
| Actual Return | 0.08% | $1,000.00 | $1,001.00 | $0.08 | |
| Hypothetical 5% Return | 0.08% | $1,000.00 | $1,024.70 | $0.41 | |
| Institutional Shares | | | | | |
| Actual Return | 0.03% | $1,000.00 | $1,002.00 | $0.03 | |
| Hypothetical 5% Return | 0.03% | $1,000.00 | $1,024.95 | $0.15 | |
| Schwab Target 2055 Index Fund | | | | | |
| Investor Shares | | | | | |
| Actual Return | 0.08% | $1,000.00 | $1,002.00 | $0.08 | |
| Hypothetical 5% Return | 0.08% | $1,000.00 | $1,024.70 | $0.41 | |
| Institutional Shares | | | | | |
| Actual Return | 0.03% | $1,000.00 | $1,002.00 | $0.03 | |
| Hypothetical 5% Return | 0.03% | $1,000.00 | $1,024.95 | $0.15 | |
| Schwab Target 2060 Index Fund | | | | | |
| Investor Shares | | | | | |
| Actual Return | 0.08% | $1,000.00 | $1,002.00 | $0.08 | |
| Hypothetical 5% Return | 0.08% | $1,000.00 | $1,024.70 | $0.41 | |
| Institutional Shares | | | | | |
| Actual Return | 0.03% | $1,000.00 | $1,002.00 | $0.03 | |
| Hypothetical 5% Return | 0.03% | $1,000.00 | $1,024.95 | $0.15 | |
| 1 | The expense ratio provided is for the period from 8/25/16 (commencement of operations) through 9/30/16. See financial note 4. |
| 2 | Actual expenses for the fund are equal to its annualized expense ratio, multiplied by the average account value over the period, multiplied by the 36 days of the period from commencement of operations on 8/25/16 through 9/30/16, and divided by 365 days of the fiscal year. |
| 3 | Hypothetical expenses for the fund are equal to its annualized expense ratio, multiplied by the average account value over the period, multiplied by the 183 days of the period, and divided by 365 days of the fiscal year. |
Schwab Target Index Funds | Semiannual Report
Schwab Target 2010 Index Fund
Financial Statements
Financial Highlights
| Investor Shares | 8/25/16 1–
9/30/16* | | | | | |
| Per-Share Data |
| Net asset value at beginning of period | $10.00 | | | | | |
| Income (loss) from investment operations: | | | | | | |
| Net investment income (loss)2 | 0.02 | | | | | |
| Net realized and unrealized gains (losses) | (0.01) | | | | | |
| Total from investment operations | 0.01 | | | | | |
| Net asset value at end of period | $10.01 | | | | | |
| Total return | 0.10% 3 | | | | | |
| Ratios/Supplemental Data |
| Ratios to average net assets: | | | | | | |
| Net operating expenses4 | 0.08% 5 | | | | | |
| Gross operating expenses4 | 0.13% 5 | | | | | |
| Net investment income (loss) | 1.79% 5 | | | | | |
| Portfolio turnover rate | 0% 3 | | | | | |
| Net assets, end of period (x 1,000) | $300 | | | | | |
| |
| Institutional Shares | 8/25/16 1–
9/30/16* | | | | | |
| Per-Share Data |
| Net asset value at beginning of period | $10.00 | | | | | |
| Income (loss) from investment operations: | | | | | | |
| Net investment income (loss)2 | 0.02 | | | | | |
| Net realized and unrealized gains (losses) | (0.01) | | | | | |
| Total from investment operations | 0.01 | | | | | |
| Net asset value at end of period | $10.01 | | | | | |
| Total return | 0.10% 3 | | | | | |
| Ratios/Supplemental Data |
| Ratios to average net assets: | | | | | | |
| Net operating expenses4 | 0.03% 5 | | | | | |
| Gross operating expenses4 | 0.08% 5 | | | | | |
| Net investment income (loss) | 1.84% 5 | | | | | |
| Portfolio turnover rate | 0% 3 | | | | | |
| Net assets, end of period (x 1,000) | $100 | | | | | |
1
Commencement of operations.
2
Calculated based on the average shares outstanding during the period.
3
Not annualized.
4
The expenses incurred by underlying funds in which the fund invests are not included in this ratio.
5
Annualized.
Schwab Target Index Funds | Semiannual Report
Schwab Target 2010 Index Fund
Portfolio Holdings as of September 30, 2016 (Unaudited)
This section shows all the securities in the fund's portfolio and their values as of the report date.
The fund files its complete schedule of portfolio holdings with the SEC for the first and third quarters of each fiscal year on Form N-Q. The fund's Form N-Q is available on the SEC's website at www.sec.gov and may be viewed and copied at the SEC's Public Reference Room in Washington, D.C. Call 1-800-SEC-0330 for information on the operation of the Public Reference Room. The fund also makes available its complete schedule of portfolio holdings 15 to 20 days after calendar quarters on the fund's website at www.csimfunds.com/schwabfunds_prospectus.
| Holdings by Category | Cost ($) | Value ($) |
| 96.8% | Other Investment Companies | 388,078 | 387,815 |
| 3.2% | Short-Term Investment | 12,671 | 12,671 |
| 100.0% | Total Investments | 400,749 | 400,486 |
| (0.0%) | Other Assets and Liabilities, Net | | (17) |
| 100.0% | Net Assets | | 400,469 |
| Security | Number
of Shares | Value ($) |
| Other Investment Companies 96.8% of net assets |
| |
| U.S. Stocks 26.7% |
| Large-Cap 25.1% |
| Schwab U.S. Large-Cap ETF (a) | 1,948 | 100,556 |
| Small-Cap 1.6% |
| Schwab U.S. Small-Cap ETF (a) | 114 | 6,561 |
| | | 107,117 |
| |
| International Stock 9.7% |
| Developed-Market Large-Cap 9.7% |
| Schwab International Equity ETF (a) | 1,346 | 38,751 |
| |
| Real Assets 1.1% |
| Real Estate 1.1% |
| Schwab U.S. REIT ETF (a) | 100 | 4,265 |
| |
| Fixed Income 55.3% |
| Inflation-Protected Bond 6.2% |
| Schwab U.S. TIPS ETF (a) | 440 | 25,115 |
| Intermediate-Term Bond 40.7% |
| Schwab U.S. Aggregate Bond ETF (a) | 3,035 | 162,889 |
| Treasury Bond 8.4% |
| Schwab Short-Term U.S. Treasury ETF (a) | 663 | 33,674 |
| | | 221,678 |
| |
| Security | Number
of Shares | Value ($) |
| Money Market Fund 4.0% |
| Schwab Variable Share Price Money Fund, Ultra Shares 0.53% (a)(b) | 16,000 | 16,004 |
| Total Other Investment Companies |
| (Cost $388,078) | | 387,815 |
Issuer
Rate, Maturity Date | Face
Amount ($) | Value ($) |
| Short-Term Investment 3.2% of net assets |
| |
| Time Deposit 3.2% |
| Brown Brothers Harriman |
| 0.15%, 10/03/16 (c) | 12,671 | 12,671 |
| Total Short-Term Investment |
| (Cost $12,671) | | 12,671 |
End of Investments.
At 09/30/16, the tax basis cost of the fund's investments was $400,749 and the unrealized appreciation and depreciation were $392 and ($655) respectively, with a net unrealized depreciation of ($263).
| (a) | Issuer is affiliated with the fund's investment adviser. |
| (b) | The rate shown is the 7-day yield. |
| (c) | The rate shown is the current daily overnight rate. |
| | |
| ETF — | Exchange-traded fund |
| REIT — | Real Estate Investment Trust |
| TIPS — | Treasury Inflation Protected Securities |
The following is a summary of the inputs used to value the fund’s investments as of September 30, 2016 (see financial note 2(a) for additional information):
| Description | Quoted Prices in
Active Markets for
Identical Assets
(Level 1) | Other Significant
Observable Inputs
(Level 2) | Significant
Unobservable Inputs
(Level 3) | Total | |
| Other Investment Companies1 | $387,815 | $— | $— | $387,815 | |
| Short-Term Investment1 | — | 12,671 | — | 12,671 | |
| Total | $387,815 | $12,671 | $— | $400,486 | |
| 1 | As categorized in Portfolio Holdings. |
Schwab Target Index Funds | Semiannual Report
Schwab Target 2010 Index Fund
Portfolio Holdings as of September 30, 2016 (Unaudited) (continued)
The fund’s policy is to recognize transfers between Level 1, Level 2 and Level 3 as of the beginning of the fiscal year. There were no transfers between Level 1, Level 2 and Level 3 for the period ended September 30, 2016.
Schwab Target Index Funds | Semiannual Report
Schwab Target 2010 Index Fund
Statement of Assets and Liabilities
As of September 30, 2016; unaudited
| Assets |
| Investments in affiliated underlying funds, at value (cost $388,078) | | $387,815 |
| Investments in unaffiliated issuers, at value (cost $12,671) | + | 12,671 |
| Total investments, at value (cost $400,749) | | 400,486 |
| Receivables: | | |
| Dividends | + | 4 |
| Total assets | | 400,490 |
| Liabilities |
| Payables: | | |
| Investment adviser fees | | 9 |
| Shareholder service fees | + | 12 |
| Total liabilities | | 21 |
| Net Assets |
| Total assets | | 400,490 |
| Total liabilities | – | 21 |
| Net assets | | $400,469 |
| Net Assets by Source | | |
| Capital received from investors | | 400,022 |
| Net investment income not yet distributed | | 710 |
| Net unrealized capital depreciation | | (263) |
| Net Asset Value (NAV) by Shares Class | |
| Share Class | Net Assets | ÷ | Shares
Outstanding | = | NAV |
| Investor Shares | $300,343 | | 30,001 | | $10.01 |
| Institutional Shares | $100,126 | | 10,001 | | $10.01 |
| | | | | | |
Schwab Target Index Funds | Semiannual Report
Schwab Target 2010 Index Fund
Statement of Operations
For the period August 25, 2016* through September 30, 2016; unaudited
| Investment Income |
| Dividends received from affiliated underlying funds | | $731 |
| Interest | + | 4 |
| Total investment income | | 735 |
| Expenses |
| Investment adviser and administrator fees | | 32 |
| Shareholder service fees: | | |
| Investor Shares | + | 14 |
| Total expenses | | 46 |
| Expense reduction by CSIM | – | 21 |
| Net expenses | – | 25 |
| Net investment income | | 710 |
| Realized and Unrealized Gains (Losses) |
| Net change in unrealized appreciation (depreciation) on affiliated underlying funds | + | (263) |
| Net realized and unrealized losses | | (263) |
| Increase in net assets resulting from operations | | $447 |
| * | Commencement of operations. |
Schwab Target Index Funds | Semiannual Report
Schwab Target 2010 Index Fund
Statement of Changes in Net Assets
For the current period only. Because the fund commenced operations on August 25, 2016, it has no prior report period
Figures for the current period are unaudited
| Operations |
| | 8/25/16*-9/30/16 |
| Net investment income | | $710 |
| Net change in unrealized appreciation (depreciation) | + | (263) |
| Increase in net assets from operations | | 447 |
| Transactions in Fund Shares | |
| | | 8/25/16*-9/30/16 |
| | | SHARES | VALUE |
| Shares Sold | | | |
| Investor Shares | | 30,001 | $300,012 |
| Institutional Shares | + | 10,001 | 100,010 |
| Total shares sold | | 40,002 | $400,022 |
| Net transactions in fund shares | | 40,002 | $400,022 |
| Shares Outstanding and Net Assets | |
| | | 8/25/16*-9/30/16 |
| | | SHARES | NET ASSETS |
| Beginning of period | | — | $— |
| Total increase | + | 40,002 | 400,469 |
| End of period | | 40,002 | $400,469 |
| Net investment income not yet distributed | | | $710 |
| * | Commencement of operations. |
Schwab Target Index Funds | Semiannual Report
Schwab Target 2015 Index Fund
Financial Statements
Financial Highlights
| Investor Shares | 8/25/16 1–
9/30/16* | | | | | |
| Per-Share Data |
| Net asset value at beginning of period | $10.00 | | | | | |
| Income (loss) from investment operations: | | | | | | |
| Net investment income (loss)2 | 0.02 | | | | | |
| Net realized and unrealized gains (losses) | (0.01) 3 | | | | | |
| Total from investment operations | 0.01 | | | | | |
| Net asset value at end of period | $10.01 | | | | | |
| Total return | 0.10% 4 | | | | | |
| Ratios/Supplemental Data |
| Ratios to average net assets: | | | | | | |
| Net operating expenses5 | 0.08% 6 | | | | | |
| Gross operating expenses5 | 0.13% 6 | | | | | |
| Net investment income (loss) | 2.05% 6 | | | | | |
| Portfolio turnover rate | 0% 4 | | | | | |
| Net assets, end of period (x 1,000) | $1,598 | | | | | |
| |
| Institutional Shares | 8/25/16 1–
9/30/16* | | | | | |
| Per-Share Data |
| Net asset value at beginning of period | $10.00 | | | | | |
| Income (loss) from investment operations: | | | | | | |
| Net investment income (loss)2 | 0.02 | | | | | |
| Net realized and unrealized gains (losses) | (0.01) 3 | | | | | |
| Total from investment operations | 0.01 | | | | | |
| Net asset value at end of period | $10.01 | | | | | |
| Total return | 0.10% 4 | | | | | |
| Ratios/Supplemental Data |
| Ratios to average net assets: | | | | | | |
| Net operating expenses5 | 0.03% 6 | | | | | |
| Gross operating expenses5 | 0.08% 6 | | | | | |
| Net investment income (loss) | 1.88% 6 | | | | | |
| Portfolio turnover rate | 0% 4 | | | | | |
| Net assets, end of period (x 1,000) | $100 | | | | | |
1
Commencement of operations.
2
Calculated based on the average shares outstanding during the period.
3
The per share amount does not accord with the change in aggregate gains and losses in securities during the period because of the timing of sales and repurchases of fund shares in relation to fluctuating market values.
4
Not annualized.
5
The expenses incurred by underlying funds in which the fund invests are not included in this ratio.
6
Annualized.
Schwab Target Index Funds | Semiannual Report
Schwab Target 2015 Index Fund
Portfolio Holdings as of September 30, 2016 (Unaudited)
This section shows all the securities in the fund's portfolio and their values as of the report date.
The fund files its complete schedule of portfolio holdings with the SEC for the first and third quarters of each fiscal year on Form N-Q. The fund's Form N-Q is available on the SEC's website at www.sec.gov and may be viewed and copied at the SEC's Public Reference Room in Washington, D.C. Call 1-800-SEC-0330 for information on the operation of the Public Reference Room. The fund also makes available its complete schedule of portfolio holdings 15 to 20 days after calendar quarters on the fund's website at www.csimfunds.com/schwabfunds_prospectus.
| Holdings by Category | Cost ($) | Value ($) |
| 98.1% | Other Investment Companies | 1,665,388 | 1,666,167 |
| 1.9% | Short-Term Investment | 32,528 | 32,528 |
| 100.0% | Total Investments | 1,697,916 | 1,698,695 |
| (0.0%) | Other Assets and Liabilities, Net | | (67) |
| 100.0% | Net Assets | | 1,698,628 |
| Security | Number
of Shares | Value ($) |
| Other Investment Companies 98.1% of net assets |
| |
| U.S. Stocks 28.3% |
| Large-Cap 26.5% |
| Schwab U.S. Large-Cap ETF (a) | 8,733 | 450,798 |
| Small-Cap 1.8% |
| Schwab U.S. Small-Cap ETF (a) | 524 | 30,156 |
| | | 480,954 |
| |
| International Stock 10.2% |
| Developed-Market Large-Cap 10.2% |
| Schwab International Equity ETF (a) | 6,011 | 173,057 |
| |
| Real Assets 1.2% |
| Real Estate 1.2% |
| Schwab U.S. REIT ETF (a) | 464 | 19,789 |
| |
| Fixed Income 53.7% |
| Inflation-Protected Bond 6.1% |
| Schwab U.S. TIPS ETF (a) | 1,804 | 102,972 |
| Intermediate-Term Bond 39.7% |
| Schwab U.S. Aggregate Bond ETF (a) | 12,571 | 674,686 |
| Treasury Bond 7.9% |
| Schwab Short-Term U.S. Treasury ETF (a) | 2,652 | 134,695 |
| | | 912,353 |
| |
| Security | Number
of Shares | Value ($) |
| Money Market Fund 4.7% |
| Schwab Variable Share Price Money Fund, Ultra Shares 0.53% (a)(b) | 79,990 | 80,014 |
| Total Other Investment Companies |
| (Cost $1,665,388) | | 1,666,167 |
Issuer
Rate, Maturity Date | Face
Amount ($) | Value ($) |
| Short-Term Investment 1.9% of net assets |
| |
| Time Deposit 1.9% |
| Brown Brothers Harriman |
| 0.15%, 10/03/16 (c) | 32,528 | 32,528 |
| Total Short-Term Investment |
| (Cost $32,528) | | 32,528 |
End of Investments.
At 09/30/16, the tax basis cost of the fund's investments was $1,697,916 and the unrealized appreciation and depreciation were $2,406 and ($1,627) respectively, with a net unrealized appreciation of $779.
| (a) | Issuer is affiliated with the fund's investment adviser. |
| (b) | The rate shown is the 7-day yield. |
| (c) | The rate shown is the current daily overnight rate. |
| | |
| ETF — | Exchange-traded fund |
| REIT — | Real Estate Investment Trust |
| TIPS — | Treasury Inflation Protected Securities |
The following is a summary of the inputs used to value the fund’s investments as of September 30, 2016 (see financial note 2(a) for additional information):
| Description | Quoted Prices in
Active Markets for
Identical Assets
(Level 1) | Other Significant
Observable Inputs
(Level 2) | Significant
Unobservable Inputs
(Level 3) | Total | |
| Other Investment Companies1 | $1,666,167 | $— | $— | $1,666,167 | |
| Short-Term Investment1 | — | 32,528 | — | 32,528 | |
| Total | $1,666,167 | $32,528 | $— | $1,698,695 | |
| 1 | As categorized in Portfolio Holdings. |
Schwab Target Index Funds | Semiannual Report
Schwab Target 2015 Index Fund
Portfolio Holdings as of September 30, 2016 (Unaudited) (continued)
The fund’s policy is to recognize transfers between Level 1, Level 2 and Level 3 as of the beginning of the fiscal year. There were no transfers between Level 1, Level 2 and Level 3 for the period ended September 30, 2016.
Schwab Target Index Funds | Semiannual Report
Schwab Target 2015 Index Fund
Statement of Assets and Liabilities
As of September 30, 2016; unaudited
| Assets |
| Investments in affiliated underlying funds, at value (cost $1,665,388) | | $1,666,167 |
| Investments in unaffiliated issuers, at value (cost $32,528) | + | 32,528 |
| Total investments, at value (cost $1,697,916) | | 1,698,695 |
| Receivables: | | |
| Dividends | + | 14 |
| Total assets | | 1,698,709 |
| Liabilities |
| Payables: | | |
| Investment adviser fees | | 29 |
| Shareholder service fees | + | 52 |
| Total liabilities | | 81 |
| Net Assets |
| Total assets | | 1,698,709 |
| Total liabilities | – | 81 |
| Net assets | | $1,698,628 |
| Net Assets by Source | | |
| Capital received from investors | | 1,695,424 |
| Net investment income not yet distributed | | 2,425 |
| Net unrealized capital appreciation | | 779 |
| Net Asset Value (NAV) by Shares Class | |
| Share Class | Net Assets | ÷ | Shares
Outstanding | = | NAV |
| Investor Shares | $1,598,493 | | 159,640 | | $10.01 |
| Institutional Shares | $100,135 | | 10,001 | | $10.01 |
| | | | | | |
Schwab Target Index Funds | Semiannual Report
Schwab Target 2015 Index Fund
Statement of Operations
For the period August 25, 2016* through September 30, 2016; unaudited
| Investment Income |
| Dividends received from affiliated underlying funds | | $2,486 |
| Interest | + | 24 |
| Total investment income | | 2,510 |
| Expenses |
| Investment adviser and administrator fees | | 95 |
| Shareholder service fees: | | |
| Investor Shares | + | 55 |
| Total expenses | | 150 |
| Expense reduction by CSIM | – | 65 |
| Net expenses | – | 85 |
| Net investment income | | 2,425 |
| Realized and Unrealized Gains (Losses) |
| Net change in unrealized appreciation (depreciation) on affiliated underlying funds | + | 779 |
| Net realized and unrealized gains | | 779 |
| Increase in net assets resulting from operations | | $3,204 |
| * | Commencement of operations. |
Schwab Target Index Funds | Semiannual Report
Schwab Target 2015 Index Fund
Statement of Changes in Net Assets
For the current period only. Because the fund commenced operations on August 25, 2016, it has no prior report period
Figures for the current period are unaudited
| Operations |
| | 8/25/16*-9/30/16 |
| Net investment income | | $2,425 |
| Net change in unrealized appreciation (depreciation) | + | 779 |
| Increase in net assets from operations | | 3,204 |
| Transactions in Fund Shares | |
| | | 8/25/16*-9/30/16 |
| | | SHARES | VALUE |
| Shares Sold | | | |
| Investor Shares | | 159,640 | $1,595,414 |
| Institutional Shares | + | 10,001 | 100,010 |
| Total shares sold | | 169,641 | $1,695,424 |
| Net transactions in fund shares | | 169,641 | $1,695,424 |
| Shares Outstanding and Net Assets | |
| | | 8/25/16*-9/30/16 |
| | | SHARES | NET ASSETS |
| Beginning of period | | — | $— |
| Total increase | + | 169,641 | 1,698,628 |
| End of period | | 169,641 | $1,698,628 |
| Net investment income not yet distributed | | | $2,425 |
| * | Commencement of operations. |
Schwab Target Index Funds | Semiannual Report
Schwab Target 2020 Index Fund
Financial Statements
Financial Highlights
| Investor Shares | 8/25/16 1–
9/30/16* | | | | | |
| Per-Share Data |
| Net asset value at beginning of period | $10.00 | | | | | |
| Income (loss) from investment operations: | | | | | | |
| Net investment income (loss)2 | 0.02 | | | | | |
| Net realized and unrealized gains (losses) | (0.01) 3 | | | | | |
| Total from investment operations | 0.01 | | | | | |
| Net asset value at end of period | $10.01 | | | | | |
| Total return | 0.10% 4 | | | | | |
| Ratios/Supplemental Data |
| Ratios to average net assets: | | | | | | |
| Net operating expenses5 | 0.08% 6 | | | | | |
| Gross operating expenses5 | 0.13% 6 | | | | | |
| Net investment income (loss) | 1.71% 6 | | | | | |
| Portfolio turnover rate | 0% 4 | | | | | |
| Net assets, end of period (x 1,000) | $741 | | | | | |
| |
| Institutional Shares | 8/25/16 1–
9/30/16* | | | | | |
| Per-Share Data |
| Net asset value at beginning of period | $10.00 | | | | | |
| Income (loss) from investment operations: | | | | | | |
| Net investment income (loss)2 | 0.02 | | | | | |
| Net realized and unrealized gains (losses) | 0.00 7 | | | | | |
| Total from investment operations | 0.02 | | | | | |
| Net asset value at end of period | $10.02 | | | | | |
| Total return | 0.20% 4 | | | | | |
| Ratios/Supplemental Data |
| Ratios to average net assets: | | | | | | |
| Net operating expenses5 | 0.03% 6 | | | | | |
| Gross operating expenses5 | 0.08% 6 | | | | | |
| Net investment income (loss) | 2.03% 6 | | | | | |
| Portfolio turnover rate | 0% 4 | | | | | |
| Net assets, end of period (x 1,000) | $100 | | | | | |
1
Commencement of operations.
2
Calculated based on the average shares outstanding during the period.
3
The per share amount does not accord with the change in aggregate gains and losses in securities during the period because of the timing of sales and repurchases of fund shares in relation to fluctuating market values.
4
Not annualized.
5
The expenses incurred by underlying funds in which the fund invests are not included in this ratio.
6
Annualized.
7
Per-share amount was less than $0.005.
Schwab Target Index Funds | Semiannual Report
Schwab Target 2020 Index Fund
Portfolio Holdings as of September 30, 2016 (Unaudited)
This section shows all the securities in the fund's portfolio and their values as of the report date.
The fund files its complete schedule of portfolio holdings with the SEC for the first and third quarters of each fiscal year on Form N-Q. The fund's Form N-Q is available on the SEC's website at www.sec.gov and may be viewed and copied at the SEC's Public Reference Room in Washington, D.C. Call 1-800-SEC-0330 for information on the operation of the Public Reference Room. The fund also makes available its complete schedule of portfolio holdings 15 to 20 days after calendar quarters on the fund's website at www.csimfunds.com/schwabfunds_prospectus.
| Holdings by Category | Cost ($) | Value ($) |
| 98.2% | Other Investment Companies | 824,993 | 825,459 |
| 3.1% | Short-Term Investments | 26,191 | 26,191 |
| 101.3% | Total Investments | 851,184 | 851,650 |
| (1.3%) | Other Assets and Liabilities, Net | | (10,939) |
| 100.0% | Net Assets | | 840,711 |
| Security | Number
of Shares | Value ($) |
| Other Investment Companies 98.2% of net assets |
| |
| U.S. Stocks 35.9% |
| Large-Cap 33.4% |
| Schwab U.S. Large-Cap ETF (a) | 5,438 | 280,710 |
| Small-Cap 2.5% |
| Schwab U.S. Small-Cap ETF (a) | 362 | 20,833 |
| | | 301,543 |
| |
| International Stocks 14.7% |
| Developed-Market Large-Cap 13.9% |
| Schwab International Equity ETF (a) | 4,067 | 117,089 |
| Emerging-Market 0.8% |
| Schwab Emerging Markets Equity ETF (a) | 283 | 6,526 |
| | | 123,615 |
| |
| Real Assets 1.5% |
| Real Estate 1.5% |
| Schwab U.S. REIT ETF (a) | 292 | 12,454 |
| |
| Fixed Income 42.9% |
| Inflation-Protected Bond 2.8% |
| Schwab U.S. TIPS ETF (a) | 418 | 23,859 |
| Intermediate-Term Bond 35.3% |
| Schwab U.S. Aggregate Bond ETF (a) | 5,535 | 297,064 |
| Treasury Bond 4.8% |
| Schwab Short-Term U.S. Treasury ETF (a) | 786 | 39,921 |
| | | 360,844 |
| |
| Security | Number
of Shares | Value ($) |
| Money Market Fund 3.2% |
| Schwab Variable Share Price Money Fund, Ultra Shares 0.53% (a)(b) | 26,995 | 27,003 |
| Total Other Investment Companies |
| (Cost $824,993) | | 825,459 |
Issuer
Rate, Maturity Date | Face
Amount ($) | Value ($) |
| Short-Term Investments 3.1% of net assets |
| |
| Time Deposits 3.1% |
| Australia & New Zealand Banking Group Ltd. |
| 0.15%, 10/03/16 (c) | 24,838 | 24,838 |
| Brown Brothers Harriman |
| 0.15%, 10/03/16 (c) | 1,353 | 1,353 |
| Total Short-Term Investments |
| (Cost $26,191) | | 26,191 |
End of Investments.
At 09/30/16, the tax basis cost of the fund's investments was $851,184 and the unrealized appreciation and depreciation were $965 and ($499) respectively, with a net unrealized appreciation of $466.
| (a) | Issuer is affiliated with the fund's investment adviser. |
| (b) | The rate shown is the 7-day yield. |
| (c) | The rate shown is the current daily overnight rate. |
| | |
| ETF — | Exchange-traded fund |
| REIT — | Real Estate Investment Trust |
| TIPS — | Treasury Inflation Protected Securities |
The following is a summary of the inputs used to value the fund’s investments as of September 30, 2016 (see financial note 2(a) for additional information):
| Description | Quoted Prices in
Active Markets for
Identical Assets
(Level 1) | Other Significant
Observable Inputs
(Level 2) | Significant
Unobservable Inputs
(Level 3) | Total | |
| Other Investment Companies1 | $825,459 | $— | $— | $825,459 | |
Schwab Target Index Funds | Semiannual Report
Schwab Target 2020 Index Fund
Portfolio Holdings as of September 30, 2016 (Unaudited) (continued)
| Description | Quoted Prices in
Active Markets for
Identical Assets
(Level 1) | Other Significant
Observable Inputs
(Level 2) | Significant
Unobservable Inputs
(Level 3) | Total | |
| Short-Term Investments1 | — | 26,191 | — | 26,191 | |
| Total | $825,459 | $26,191 | $— | $851,650 | |
| 1 | As categorized in Portfolio Holdings. |
The fund’s policy is to recognize transfers between Level 1, Level 2 and Level 3 as of the beginning of the fiscal year. There were no transfers between Level 1, Level 2 and Level 3 for the period ended September 30, 2016.
Schwab Target Index Funds | Semiannual Report
Schwab Target 2020 Index Fund
Statement of Assets and Liabilities
As of September 30, 2016; unaudited
| Assets |
| Investments in affiliated underlying funds, at value (cost $824,993) | | $825,459 |
| Investments in unaffiliated issuers, at value (cost $26,191) | + | 26,191 |
| Total investments, at value (cost $851,184) | | 851,650 |
| Receivables: | | |
| Fund shares sold | | 10,000 |
| Dividends | + | 4 |
| Total assets | | 861,654 |
| Liabilities |
| Payables: | | |
| Investments bought | | 20,912 |
| Investment adviser fees | | 13 |
| Shareholder service fees | + | 18 |
| Total liabilities | | 20,943 |
| Net Assets |
| Total assets | | 861,654 |
| Total liabilities | – | 20,943 |
| Net assets | | $840,711 |
| Net Assets by Source | | |
| Capital received from investors | | 839,326 |
| Net investment income not yet distributed | | 919 |
| Net unrealized capital appreciation | | 466 |
| Net Asset Value (NAV) by Shares Class | |
| Share Class | Net Assets | ÷ | Shares
Outstanding | = | NAV |
| Investor Shares | $740,551 | | 73,951 | | $10.01 |
| Institutional Shares | $100,160 | | 10,001 | | $10.02 |
| | | | | | |
Schwab Target Index Funds | Semiannual Report
Schwab Target 2020 Index Fund
Statement of Operations
For the period August 25, 2016* through September 30, 2016; unaudited
| Investment Income |
| Dividends received from affiliated underlying funds | | $948 |
| Interest | + | 7 |
| Total investment income | | 955 |
| Expenses |
| Investment adviser and administrator fees | | 42 |
| Shareholder service fees: | | |
| Investor Shares | + | 21 |
| Total expenses | | 63 |
| Expense reduction by CSIM and its affiliates | – | 27 |
| Net expenses | – | 36 |
| Net investment income | | 919 |
| Realized and Unrealized Gains (Losses) |
| Net change in unrealized appreciation (depreciation) on affiliated underlying funds | + | 466 |
| Net realized and unrealized gains | | 466 |
| Increase in net assets resulting from operations | | $1,385 |
| * | Commencement of operations. |
Schwab Target Index Funds | Semiannual Report
Schwab Target 2020 Index Fund
Statement of Changes in Net Assets
For the current period only. Because the fund commenced operations on August 25, 2016, it has no prior report period
Figures for the current period are unaudited
| Operations |
| | 8/25/16*-9/30/16 |
| Net investment income | | $919 |
| Net change in unrealized appreciation (depreciation) | + | 466 |
| Increase in net assets from operations | | 1,385 |
| Transactions in Fund Shares | |
| | | 8/25/16*-9/30/16 |
| | | SHARES | VALUE |
| Shares Sold | | | |
| Investor Shares | | 73,961 | $739,416 |
| Institutional Shares | + | 10,001 | 100,010 |
| Total shares sold | | 83,962 | $839,426 |
| Shares Redeemed | | | |
| Investor Shares | | (10) | ($100) |
| Institutional Shares | + | — | — |
| Total shares redeemed | | (10) | ($100) |
| Net transactions in fund shares | | 83,952 | $839,326 |
| Shares Outstanding and Net Assets | |
| | | 8/25/16*-9/30/16 |
| | | SHARES | NET ASSETS |
| Beginning of period | | — | $— |
| Total increase | + | 83,952 | 840,711 |
| End of period | | 83,952 | $840,711 |
| Net investment income not yet distributed | | | $919 |
| * | Commencement of operations. |
Schwab Target Index Funds | Semiannual Report
Schwab Target 2025 Index Fund
Financial Statements
Financial Highlights
| Investor Shares | 8/25/16 1–
9/30/16* | | | | | |
| Per-Share Data |
| Net asset value at beginning of period | $10.00 | | | | | |
| Income (loss) from investment operations: | | | | | | |
| Net investment income (loss)2 | 0.02 | | | | | |
| Net realized and unrealized gains (losses) | 0.00 3 | | | | | |
| Total from investment operations | 0.02 | | | | | |
| Net asset value at end of period | $10.02 | | | | | |
| Total return | 0.20% 4 | | | | | |
| Ratios/Supplemental Data |
| Ratios to average net assets: | | | | | | |
| Net operating expenses5 | 0.08% 6 | | | | | |
| Gross operating expenses5 | 0.13% 6 | | | | | |
| Net investment income (loss) | 2.00% 6 | | | | | |
| Portfolio turnover rate | 4% 4 | | | | | |
| Net assets, end of period (x 1,000) | $2,623 | | | | | |
| |
| Institutional Shares | 8/25/16 1–
9/30/16* | | | | | |
| Per-Share Data |
| Net asset value at beginning of period | $10.00 | | | | | |
| Income (loss) from investment operations: | | | | | | |
| Net investment income (loss)2 | 0.02 | | | | | |
| Net realized and unrealized gains (losses) | (0.01) 7 | | | | | |
| Total from investment operations | 0.01 | | | | | |
| Net asset value at end of period | $10.01 | | | | | |
| Total return | 0.10% 4 | | | | | |
| Ratios/Supplemental Data |
| Ratios to average net assets: | | | | | | |
| Net operating expenses5 | 0.03% 6 | | | | | |
| Gross operating expenses5 | 0.08% 6 | | | | | |
| Net investment income (loss) | 2.20% 6 | | | | | |
| Portfolio turnover rate | 4% 4 | | | | | |
| Net assets, end of period (x 1,000) | $100 | | | | | |
1
Commencement of operations.
2
Calculated based on the average shares outstanding during the period.
3
Per-share amount was less than $0.005.
4
Not annualized.
5
The expenses incurred by underlying funds in which the fund invests are not included in this ratio.
6
Annualized.
7
The per share amount does not accord with the change in aggregate gains and losses in securities during the period because of the timing of sales and repurchases of fund shares in relation to fluctuating market values.
Schwab Target Index Funds | Semiannual Report
Schwab Target 2025 Index Fund
Portfolio Holdings as of September 30, 2016 (Unaudited)
This section shows all the securities in the fund's portfolio and their values as of the report date.
The fund files its complete schedule of portfolio holdings with the SEC for the first and third quarters of each fiscal year on Form N-Q. The fund's Form N-Q is available on the SEC's website at www.sec.gov and may be viewed and copied at the SEC's Public Reference Room in Washington, D.C. Call 1-800-SEC-0330 for information on the operation of the Public Reference Room. The fund also makes available its complete schedule of portfolio holdings 15 to 20 days after calendar quarters on the fund's website at www.csimfunds.com/schwabfunds_prospectus.
| Holdings by Category | Cost ($) | Value ($) |
| 98.2% | Other Investment Companies | 2,668,157 | 2,672,499 |
| 2.1% | Short-Term Investment | 57,805 | 57,805 |
| 100.3% | Total Investments | 2,725,962 | 2,730,304 |
| (0.3%) | Other Assets and Liabilities, Net | | (6,881) |
| 100.0% | Net Assets | | 2,723,423 |
| Security | Number
of Shares | Value ($) |
| Other Investment Companies 98.2% of net assets |
| |
| U.S. Stocks 42.9% |
| Large-Cap 39.5% |
| Schwab U.S. Large-Cap ETF (a) | 20,842 | 1,075,864 |
| Small-Cap 3.4% |
| Schwab U.S. Small-Cap ETF (a) | 1,582 | 91,044 |
| | | 1,166,908 |
| |
| International Stocks 18.6% |
| Developed-Market Large-Cap 17.1% |
| Schwab International Equity ETF (a) | 16,155 | 465,102 |
| Emerging-Market 1.5% |
| Schwab Emerging Markets Equity ETF (a) | 1,767 | 40,747 |
| | | 505,849 |
| |
| Real Assets 1.9% |
| Real Estate 1.9% |
| Schwab U.S. REIT ETF (a) | 1,186 | 50,583 |
| |
| Fixed Income 33.0% |
| Inflation-Protected Bond 0.8% |
| Schwab U.S. TIPS ETF (a) | 372 | 21,234 |
| Intermediate-Term Bond 29.6% |
| Schwab U.S. Aggregate Bond ETF (a) | 15,049 | 807,680 |
| Security | Number
of Shares | Value ($) |
| Treasury Bond 2.6% |
| Schwab Short-Term U.S. Treasury ETF (a) | 1,383 | 70,242 |
| | | 899,156 |
| |
| Money Market Fund 1.8% |
| Schwab Variable Share Price Money Fund, Ultra Shares 0.53% (a)(b) | 49,988 | 50,003 |
| Total Other Investment Companies |
| (Cost $2,668,157) | | 2,672,499 |
Issuer
Rate, Maturity Date | Face
Amount ($) | Value ($) |
| Short-Term Investment 2.1% of net assets |
| |
| Time Deposit 2.1% |
| Sumitomo Mitsui Banking Corp. |
| 0.15%, 10/03/16 (c) | 57,805 | 57,805 |
| Total Short-Term Investment |
| (Cost $57,805) | | 57,805 |
End of Investments.
At 09/30/16, the tax basis cost of the fund's investments was $2,725,974 and the unrealized appreciation and depreciation were $5,035 and ($705) respectively, with a net unrealized appreciation of $4,330.
| (a) | Issuer is affiliated with the fund's investment adviser. |
| (b) | The rate shown is the 7-day yield. |
| (c) | The rate shown is the current daily overnight rate. |
| | |
| ETF — | Exchange-traded fund |
| REIT — | Real Estate Investment Trust |
| TIPS — | Treasury Inflation Protected Securities |
The following is a summary of the inputs used to value the fund’s investments as of September 30, 2016 (see financial note 2(a) for additional information):
| Description | Quoted Prices in
Active Markets for
Identical Assets
(Level 1) | Other Significant
Observable Inputs
(Level 2) | Significant
Unobservable Inputs
(Level 3) | Total | |
| Other Investment Companies1 | $2,672,499 | $— | $— | $2,672,499 | |
| Short-Term Investment1 | — | 57,805 | — | 57,805 | |
| Total | $2,672,499 | $57,805 | $— | $2,730,304 | |
| 1 | As categorized in Portfolio Holdings. |
The fund’s policy is to recognize transfers between Level 1, Level 2 and Level 3 as of the beginning of the fiscal year. There were no transfers between Level 1, Level 2 and Level 3 for the period ended September 30, 2016.
Schwab Target Index Funds | Semiannual Report
Schwab Target 2025 Index Fund
Statement of Assets and Liabilities
As of September 30, 2016; unaudited
| Assets |
| Investments in affiliated underlying funds, at value (cost $2,668,157) | | $2,672,499 |
| Investments in unaffiliated issuers, at value (cost $57,805) | + | 57,805 |
| Total investments, at value (cost $2,725,962) | | 2,730,304 |
| Receivables: | | |
| Fund shares sold | | 10,324 |
| Dividends | + | 5 |
| Total assets | | 2,740,633 |
| Liabilities |
| Payables: | | |
| Investments bought | | 17,125 |
| Investment adviser fees | | 34 |
| Shareholder service fees | + | 51 |
| Total liabilities | | 17,210 |
| Net Assets |
| Total assets | | 2,740,633 |
| Total liabilities | – | 17,210 |
| Net assets | | $2,723,423 |
| Net Assets by Source | | |
| Capital received from investors | | 2,716,566 |
| Net investment income not yet distributed | | 2,397 |
| Net realized capital gains | | 118 |
| Net unrealized capital appreciation | | 4,342 |
| Net Asset Value (NAV) by Shares Class | |
| Share Class | Net Assets | ÷ | Shares
Outstanding | = | NAV |
| Investor Shares | $2,623,267 | | 261,869 | | $10.02 |
| Institutional Shares | $100,156 | | 10,001 | | $10.01 |
| | | | | | |
Schwab Target Index Funds | Semiannual Report
Schwab Target 2025 Index Fund
Statement of Operations
For the period August 25, 2016* through September 30, 2016; unaudited
| Investment Income |
| Dividends received from affiliated underlying funds | | $2,464 |
| Interest | + | 24 |
| Total investment income | | 2,488 |
| Expenses |
| Investment adviser and administrator fees | | 96 |
| Shareholder service fees: | | |
| Investor Shares | + | 54 |
| Total expenses | | 150 |
| Expense reduction by CSIM | – | 59 |
| Net expenses | – | 91 |
| Net investment income | | 2,397 |
| Realized and Unrealized Gains (Losses) |
| Net realized gains on sales of affiliated underlying funds | | 118 |
| Net change in unrealized appreciation (depreciation) on affiliated underlying funds | + | 4,342 |
| Net realized and unrealized gains | | 4,460 |
| Increase in net assets resulting from operations | | $6,857 |
| * | Commencement of operations. |
Schwab Target Index Funds | Semiannual Report
Schwab Target 2025 Index Fund
Statement of Changes in Net Assets
For the current period only. Because the fund commenced operations on August 25, 2016, it has no prior report period
Figures for the current period are unaudited
| Operations |
| | 8/25/16*-9/30/16 |
| Net investment income | | $2,397 |
| Net realized gains | | 118 |
| Net change in unrealized appreciation (depreciation) | + | 4,342 |
| Increase in net assets from operations | | 6,857 |
| Transactions in Fund Shares | |
| | | 8/25/16*-9/30/16 |
| | | SHARES | VALUE |
| Shares Sold | | | |
| Investor Shares | | 262,857 | $2,626,432 |
| Institutional Shares | + | 10,001 | 100,010 |
| Total shares sold | | 272,858 | $2,726,442 |
| Shares Redeemed | | | |
| Investor Shares | | (988) | ($9,876) |
| Institutional Shares | + | — | — |
| Total shares redeemed | | (988) | ($9,876) |
| Net transactions in fund shares | | 271,870 | $2,716,566 |
| Shares Outstanding and Net Assets | |
| | | 8/25/16*-9/30/16 |
| | | SHARES | NET ASSETS |
| Beginning of period | | — | $— |
| Total increase | + | 271,870 | 2,723,423 |
| End of period | | 271,870 | $2,723,423 |
| Net investment income not yet distributed | | | $2,397 |
| * | Commencement of operations. |
Schwab Target Index Funds | Semiannual Report
Schwab Target 2030 Index Fund
Financial Statements
Financial Highlights
| Investor Shares | 8/25/16 1–
9/30/16* | | | | | |
| Per-Share Data |
| Net asset value at beginning of period | $10.00 | | | | | |
| Income (loss) from investment operations: | | | | | | |
| Net investment income (loss)2 | 0.02 | | | | | |
| Net realized and unrealized gains (losses) | (0.01) | | | | | |
| Total from investment operations | 0.01 | | | | | |
| Net asset value at end of period | $10.01 | | | | | |
| Total return | 0.10% 3 | | | | | |
| Ratios/Supplemental Data |
| Ratios to average net assets: | | | | | | |
| Net operating expenses4 | 0.08% 5 | | | | | |
| Gross operating expenses4 | 0.13% 5 | | | | | |
| Net investment income (loss) | 2.63% 5 | | | | | |
| Portfolio turnover rate | 0% 3 | | | | | |
| Net assets, end of period (x 1,000) | $2,063 | | | | | |
| |
| Institutional Shares | 8/25/16 1–
9/30/16* | | | | | |
| Per-Share Data |
| Net asset value at beginning of period | $10.00 | | | | | |
| Income (loss) from investment operations: | | | | | | |
| Net investment income (loss)2 | 0.02 | | | | | |
| Net realized and unrealized gains (losses) | (0.00) 6 | | | | | |
| Total from investment operations | 0.02 | | | | | |
| Net asset value at end of period | $10.02 | | | | | |
| Total return | 0.20% 3 | | | | | |
| Ratios/Supplemental Data |
| Ratios to average net assets: | | | | | | |
| Net operating expenses4 | 0.03% 5 | | | | | |
| Gross operating expenses4 | 0.08% 5 | | | | | |
| Net investment income (loss) | 2.18% 5 | | | | | |
| Portfolio turnover rate | 0% 3 | | | | | |
| Net assets, end of period (x 1,000) | $131 | | | | | |
1
Commencement of operations.
2
Calculated based on the average shares outstanding during the period.
3
Not annualized.
4
The expenses incurred by underlying funds in which the fund invests are not included in this ratio.
5
Annualized.
6
Per-share amount was less than $0.005.
Schwab Target Index Funds | Semiannual Report
Schwab Target 2030 Index Fund
Portfolio Holdings as of September 30, 2016 (Unaudited)
This section shows all the securities in the fund's portfolio and their values as of the report date.
The fund files its complete schedule of portfolio holdings with the SEC for the first and third quarters of each fiscal year on Form N-Q. The fund's Form N-Q is available on the SEC's website at www.sec.gov and may be viewed and copied at the SEC's Public Reference Room in Washington, D.C. Call 1-800-SEC-0330 for information on the operation of the Public Reference Room. The fund also makes available its complete schedule of portfolio holdings 15 to 20 days after calendar quarters on the fund's website at www.csimfunds.com/schwabfunds_prospectus.
| Holdings by Category | Cost ($) | Value ($) |
| 97.8% | Other Investment Companies | 2,149,880 | 2,146,741 |
| 2.9% | Short-Term Investment | 63,012 | 63,012 |
| 100.7% | Total Investments | 2,212,892 | 2,209,753 |
| (0.7%) | Other Assets and Liabilities, Net | | (15,946) |
| 100.0% | Net Assets | | 2,193,807 |
| Security | Number
of Shares | Value ($) |
| Other Investment Companies 97.8% of net assets |
| |
| U.S. Stocks 47.6% |
| Large-Cap 43.4% |
| Schwab U.S. Large-Cap ETF (a) | 18,459 | 952,854 |
| Small-Cap 4.2% |
| Schwab U.S. Small-Cap ETF (a) | 1,604 | 92,310 |
| | | 1,045,164 |
| |
| International Stocks 21.7% |
| Developed-Market Large-Cap 19.6% |
| Schwab International Equity ETF (a) | 14,898 | 428,913 |
| Emerging-Market 2.1% |
| Schwab Emerging Markets Equity ETF (a) | 2,014 | 46,443 |
| | | 475,356 |
| |
| Real Assets 2.3% |
| Real Estate 2.3% |
| Schwab U.S. REIT ETF (a) | 1,186 | 50,583 |
| |
| Fixed Income 25.5% |
| Intermediate-Term Bond 24.0% |
| Schwab U.S. Aggregate Bond ETF (a) | 9,810 | 526,503 |
| Security | Number
of Shares | Value ($) |
| Treasury Bond 1.5% |
| Schwab Short-Term U.S. Treasury ETF (a) | 672 | 34,131 |
| | | 560,634 |
| |
| Money Market Fund 0.7% |
| Schwab Variable Share Price Money Fund, Ultra Shares 0.53% (a)(b) | 15,000 | 15,004 |
| Total Other Investment Companies |
| (Cost $2,149,880) | | 2,146,741 |
Issuer
Rate, Maturity Date | Face
Amount ($) | Value ($) |
| Short-Term Investment 2.9% of net assets |
| |
| Time Deposit 2.9% |
| Sumitomo Mitsui Banking Corp. |
| 0.15%, 10/03/16 (c) | 63,012 | 63,012 |
| Total Short-Term Investment |
| (Cost $63,012) | | 63,012 |
End of Investments.
At 09/30/16, the tax basis cost of the fund's investments was $2,212,892 and the unrealized appreciation and depreciation were $3,264 and ($6,403) respectively, with a net unrealized depreciation of ($3,139).
| (a) | Issuer is affiliated with the fund's investment adviser. |
| (b) | The rate shown is the 7-day yield. |
| (c) | The rate shown is the current daily overnight rate. |
| | |
| ETF — | Exchange-traded fund |
| REIT — | Real Estate Investment Trust |
The following is a summary of the inputs used to value the fund’s investments as of September 30, 2016 (see financial note 2(a) for additional information):
| Description | Quoted Prices in
Active Markets for
Identical Assets
(Level 1) | Other Significant
Observable Inputs
(Level 2) | Significant
Unobservable Inputs
(Level 3) | Total | |
| Other Investment Companies1 | $2,146,741 | $— | $— | $2,146,741 | |
| Short-Term Investment1 | — | 63,012 | — | 63,012 | |
| Total | $2,146,741 | $63,012 | $— | $2,209,753 | |
| 1 | As categorized in Portfolio Holdings. |
The fund’s policy is to recognize transfers between Level 1, Level 2 and Level 3 as of the beginning of the fiscal year. There were no transfers between Level 1, Level 2 and Level 3 for the period ended September 30, 2016.
Schwab Target Index Funds | Semiannual Report
Schwab Target 2030 Index Fund
Statement of Assets and Liabilities
As of September 30, 2016; unaudited
| Assets |
| Investments in affiliated underlying funds, at value (cost $2,149,880) | | $2,146,741 |
| Investments in unaffiliated issuers, at value (cost $63,012) | + | 63,012 |
| Total investments, at value (cost $2,212,892) | | 2,209,753 |
| Receivables: | | |
| Fund shares sold | | 25,000 |
| Dividends | + | 3 |
| Total assets | | 2,234,756 |
| Liabilities |
| Payables: | | |
| Investments bought | | 40,826 |
| Investment adviser fees | | 47 |
| Shareholder service fees | + | 76 |
| Total liabilities | | 40,949 |
| Net Assets |
| Total assets | | 2,234,756 |
| Total liabilities | – | 40,949 |
| Net assets | | $2,193,807 |
| Net Assets by Source | | |
| Capital received from investors | | 2,192,533 |
| Net investment income not yet distributed | | 4,413 |
| Net unrealized capital depreciation | | (3,139) |
| Net Asset Value (NAV) by Shares Class | |
| Share Class | Net Assets | ÷ | Shares
Outstanding | = | NAV |
| Investor Shares | $2,062,782 | | 205,987 | | $10.01 |
| Institutional Shares | $131,025 | | 13,083 | | $10.02 |
| | | | | | |
Schwab Target Index Funds | Semiannual Report
Schwab Target 2030 Index Fund
Statement of Operations
For the period August 25, 2016* through September 30, 2016; unaudited
| Investment Income |
| Dividends received from affiliated underlying funds | | $4,513 |
| Interest | + | 30 |
| Total investment income | | 4,543 |
| Expenses |
| Investment adviser and administrator fees | | 136 |
| Shareholder service fees: | | |
| Investor Shares | + | 80 |
| Total expenses | | 216 |
| Expense reduction by CSIM | – | 86 |
| Net expenses | – | 130 |
| Net investment income | | 4,413 |
| Realized and Unrealized Gains (Losses) |
| Net change in unrealized appreciation (depreciation) on affiliated underlying funds | + | (3,139) |
| Net realized and unrealized losses | | (3,139) |
| Increase in net assets resulting from operations | | $1,274 |
| * | Commencement of operations. |
Schwab Target Index Funds | Semiannual Report
Schwab Target 2030 Index Fund
Statement of Changes in Net Assets
For the current period only. Because the fund commenced operations on August 25, 2016, it has no prior report period
Figures for the current period are unaudited
| Operations |
| | 8/25/16*-9/30/16 |
| Net investment income | | $4,413 |
| Net change in unrealized appreciation (depreciation) | + | (3,139) |
| Increase in net assets from operations | | 1,274 |
| Transactions in Fund Shares | |
| | | 8/25/16*-9/30/16 |
| | | SHARES | VALUE |
| Shares Sold | | | |
| Investor Shares | | 206,307 | $2,064,727 |
| Institutional Shares | + | 13,083 | 131,010 |
| Total shares sold | | 219,390 | $2,195,737 |
| Shares Redeemed | | | |
| Investor Shares | | (320) | ($3,204) |
| Institutional Shares | + | — | — |
| Total shares redeemed | | (320) | ($3,204) |
| Net transactions in fund shares | | 219,070 | $2,192,533 |
| Shares Outstanding and Net Assets | |
| | | 8/25/16*-9/30/16 |
| | | SHARES | NET ASSETS |
| Beginning of period | | — | $— |
| Total increase | + | 219,070 | 2,193,807 |
| End of period | | 219,070 | $2,193,807 |
| Net investment income not yet distributed | | | $4,413 |
| * | Commencement of operations. |
Schwab Target Index Funds | Semiannual Report
Schwab Target 2035 Index Fund
Financial Statements
Financial Highlights
| Investor Shares | 8/25/16 1–
9/30/16* | | | | | |
| Per-Share Data |
| Net asset value at beginning of period | $10.00 | | | | | |
| Income (loss) from investment operations: | | | | | | |
| Net investment income (loss)2 | 0.03 | | | | | |
| Net realized and unrealized gains (losses) | (0.02) 3 | | | | | |
| Total from investment operations | 0.01 | | | | | |
| Net asset value at end of period | $10.01 | | | | | |
| Total return | 0.10% 4 | | | | | |
| Ratios/Supplemental Data |
| Ratios to average net assets: | | | | | | |
| Net operating expenses5 | 0.08% 6 | | | | | |
| Gross operating expenses5 | 0.13% 6 | | | | | |
| Net investment income (loss) | 2.90% 6 | | | | | |
| Portfolio turnover rate | 7% 4 | | | | | |
| Net assets, end of period (x 1,000) | $2,427 | | | | | |
| |
| Institutional Shares | 8/25/16 1–
9/30/16* | | | | | |
| Per-Share Data |
| Net asset value at beginning of period | $10.00 | | | | | |
| Income (loss) from investment operations: | | | | | | |
| Net investment income (loss)2 | 0.02 | | | | | |
| Net realized and unrealized gains (losses) | (0.01) 3 | | | | | |
| Total from investment operations | 0.01 | | | | | |
| Net asset value at end of period | $10.01 | | | | | |
| Total return | 0.10% 4 | | | | | |
| Ratios/Supplemental Data |
| Ratios to average net assets: | | | | | | |
| Net operating expenses5 | 0.03% 6 | | | | | |
| Gross operating expenses5 | 0.08% 6 | | | | | |
| Net investment income (loss) | 2.32% 6 | | | | | |
| Portfolio turnover rate | 7% 4 | | | | | |
| Net assets, end of period (x 1,000) | $100 | | | | | |
1
Commencement of operations.
2
Calculated based on the average shares outstanding during the period.
3
The per share amount does not accord with the change in aggregate gains and losses in securities during the period because of the timing of sales and repurchases of fund shares in relation to fluctuating market values.
4
Not annualized.
5
The expenses incurred by underlying funds in which the fund invests are not included in this ratio.
6
Annualized.
Schwab Target Index Funds | Semiannual Report
Schwab Target 2035 Index Fund
Portfolio Holdings as of September 30, 2016 (Unaudited)
This section shows all the securities in the fund's portfolio and their values as of the report date.
The fund files its complete schedule of portfolio holdings with the SEC for the first and third quarters of each fiscal year on Form N-Q. The fund's Form N-Q is available on the SEC's website at www.sec.gov and may be viewed and copied at the SEC's Public Reference Room in Washington, D.C. Call 1-800-SEC-0330 for information on the operation of the Public Reference Room. The fund also makes available its complete schedule of portfolio holdings 15 to 20 days after calendar quarters on the fund's website at www.csimfunds.com/schwabfunds_prospectus.
| Holdings by Category | Cost ($) | Value ($) |
| 97.9% | Other Investment Companies | 2,462,788 | 2,473,080 |
| 8.2% | Short-Term Investments | 208,676 | 208,676 |
| 106.1% | Total Investments | 2,671,464 | 2,681,756 |
| (6.1%) | Other Assets and Liabilities, Net | | (155,031) |
| 100.0% | Net Assets | | 2,526,725 |
| Security | Number
of Shares | Value ($) |
| Other Investment Companies 97.9% of net assets |
| |
| U.S. Stocks 51.6% |
| Large-Cap 46.5% |
| Schwab U.S. Large-Cap ETF (a) | 22,774 | 1,175,594 |
| Small-Cap 5.1% |
| Schwab U.S. Small-Cap ETF (a) | 2,226 | 128,106 |
| | | 1,303,700 |
| |
| International Stocks 24.4% |
| Developed-Market Large-Cap 21.7% |
| Schwab International Equity ETF (a) | 19,043 | 548,248 |
| Emerging-Market 2.7% |
| Schwab Emerging Markets Equity ETF (a) | 2,967 | 68,419 |
| | | 616,667 |
| |
| Real Assets 2.7% |
| Real Estate 2.7% |
| Schwab U.S. REIT ETF (a) | 1,605 | 68,454 |
| |
| Fixed Income 19.2% |
| Intermediate-Term Bond 18.2% |
| Schwab U.S. Aggregate Bond ETF (a) | 8,545 | 458,610 |
| Security | Number
of Shares | Value ($) |
| Treasury Bond 1.0% |
| Schwab Short-Term U.S. Treasury ETF (a) | 505 | 25,649 |
| | | 484,259 |
| Total Other Investment Companies |
| (Cost $2,462,788) | | 2,473,080 |
Issuer
Rate, Maturity Date | Face
Amount ($) | Value ($) |
| Short-Term Investments 8.2% of net assets |
| |
| Time Deposits 8.2% |
| BNP Paribas |
| 0.15%, 10/03/16 (b) | 85,769 | 85,769 |
| Sumitomo Mitsui Banking Corp. |
| 0.15%, 10/03/16 (b) | 122,907 | 122,907 |
| Total Short-Term Investments |
| (Cost $208,676) | | 208,676 |
End of Investments.
At 09/30/16, the tax basis cost of the fund's investments was $2,671,464 and the unrealized appreciation and depreciation were $11,134 and ($842) respectively, with a net unrealized appreciation of $10,292.
| (a) | Issuer is affiliated with the fund's investment adviser. |
| (b) | The rate shown is the current daily overnight rate. |
| | |
| ETF — | Exchange-traded fund |
| REIT — | Real Estate Investment Trust |
The following is a summary of the inputs used to value the fund’s investments as of September 30, 2016 (see financial note 2(a) for additional information):
| Description | Quoted Prices in
Active Markets for
Identical Assets
(Level 1) | Other Significant
Observable Inputs
(Level 2) | Significant
Unobservable Inputs
(Level 3) | Total | |
| Other Investment Companies1 | $2,473,080 | $— | $— | $2,473,080 | |
| Short-Term Investments1 | — | 208,676 | — | 208,676 | |
| Total | $2,473,080 | $208,676 | $— | $2,681,756 | |
| 1 | As categorized in Portfolio Holdings. |
The fund’s policy is to recognize transfers between Level 1, Level 2 and Level 3 as of the beginning of the fiscal year. There were no transfers between Level 1, Level 2 and Level 3 for the period ended September 30, 2016.
Schwab Target Index Funds | Semiannual Report
Schwab Target 2035 Index Fund
Statement of Assets and Liabilities
As of September 30, 2016; unaudited
| Assets |
| Investments in affiliated underlying funds, at value (cost $2,462,788) | | $2,473,080 |
| Investments in unaffiliated issuers, at value (cost $208,676) | + | 208,676 |
| Total investments, at value (cost $2,671,464) | | 2,681,756 |
| Receivables: | | |
| Fund shares sold | + | 55,577 |
| Total assets | | 2,737,333 |
| Liabilities |
| Payables: | | |
| Investments bought | | 210,520 |
| Investment adviser fees | | 34 |
| Shareholder service fees | + | 54 |
| Total liabilities | | 210,608 |
| Net Assets |
| Total assets | | 2,737,333 |
| Total liabilities | – | 210,608 |
| Net assets | | $2,526,725 |
| Net Assets by Source | | |
| Capital received from investors | | 2,512,847 |
| Net investment income not yet distributed | | 3,536 |
| Net realized capital gains | | 50 |
| Net unrealized capital appreciation | | 10,292 |
| Net Asset Value (NAV) by Shares Class | |
| Share Class | Net Assets | ÷ | Shares
Outstanding | = | NAV |
| Investor Shares | $2,426,612 | | 242,389 | | $10.01 |
| Institutional Shares | $100,113 | | 10,001 | | $10.01 |
| | | | | | |
Schwab Target Index Funds | Semiannual Report
Schwab Target 2035 Index Fund
Statement of Operations
For the period August 25, 2016* through September 30, 2016; unaudited
| Investment Income |
| Dividends received from affiliated underlying funds | | $3,606 |
| Interest | + | 24 |
| Total investment income | | 3,630 |
| Expenses |
| Investment adviser and administrator fees | | 99 |
| Shareholder service fees: | | |
| Investor Shares | + | 57 |
| Total expenses | | 156 |
| Expense reduction by CSIM and its affiliates | – | 62 |
| Net expenses | – | 94 |
| Net investment income | | 3,536 |
| Realized and Unrealized Gains (Losses) |
| Net realized gains on sales of affiliated underlying funds | | 50 |
| Net change in unrealized appreciation (depreciation) on affiliated underlying funds | + | 10,292 |
| Net realized and unrealized gains | | 10,342 |
| Increase in net assets resulting from operations | | $13,878 |
| * | Commencement of operations. |
Schwab Target Index Funds | Semiannual Report
Schwab Target 2035 Index Fund
Statement of Changes in Net Assets
For the current period only. Because the fund commenced operations on August 25, 2016, it has no prior report period
Figures for the current period are unaudited
| Operations |
| | 8/25/16*-9/30/16 |
| Net investment income | | $3,536 |
| Net realized gains | | 50 |
| Net change in unrealized appreciation (depreciation) | + | 10,292 |
| Increase in net assets from operations | | 13,878 |
| Transactions in Fund Shares | |
| | | 8/25/16*-9/30/16 |
| | | SHARES | VALUE |
| Shares Sold | | | |
| Investor Shares | | 242,437 | $2,413,314 |
| Institutional Shares | + | 10,001 | 100,010 |
| Total shares sold | | 252,438 | $2,513,324 |
| Shares Redeemed | | | |
| Investor Shares | | (48) | ($477) |
| Institutional Shares | + | — | — |
| Total shares redeemed | | (48) | ($477) |
| Net transactions in fund shares | | 252,390 | $2,512,847 |
| Shares Outstanding and Net Assets | |
| | | 8/25/16*-9/30/16 |
| | | SHARES | NET ASSETS |
| Beginning of period | | — | $— |
| Total increase | + | 252,390 | 2,526,725 |
| End of period | | 252,390 | $2,526,725 |
| Net investment income not yet distributed | | | $3,536 |
| * | Commencement of operations. |
Schwab Target Index Funds | Semiannual Report
Schwab Target 2040 Index Fund
Financial Statements
Financial Highlights
| Investor Shares | 8/25/16 1–
9/30/16* | | | | | |
| Per-Share Data |
| Net asset value at beginning of period | $10.00 | | | | | |
| Income (loss) from investment operations: | | | | | | |
| Net investment income (loss)2 | 0.02 | | | | | |
| Net realized and unrealized gains (losses) | (0.01) 3 | | | | | |
| Total from investment operations | 0.01 | | | | | |
| Net asset value at end of period | $10.01 | | | | | |
| Total return | 0.10% 4 | | | | | |
| Ratios/Supplemental Data |
| Ratios to average net assets: | | | | | | |
| Net operating expenses5 | 0.08% 6 | | | | | |
| Gross operating expenses5 | 0.13% 6 | | | | | |
| Net investment income (loss) | 2.67% 6 | | | | | |
| Portfolio turnover rate | 0% 4 | | | | | |
| Net assets, end of period (x 1,000) | $1,510 | | | | | |
| |
| Institutional Shares | 8/25/16 1–
9/30/16* | | | | | |
| Per-Share Data |
| Net asset value at beginning of period | $10.00 | | | | | |
| Income (loss) from investment operations: | | | | | | |
| Net investment income (loss)2 | 0.02 | | | | | |
| Net realized and unrealized gains (losses) | (0.01) 3 | | | | | |
| Total from investment operations | 0.01 | | | | | |
| Net asset value at end of period | $10.01 | | | | | |
| Total return | 0.10% 4 | | | | | |
| Ratios/Supplemental Data |
| Ratios to average net assets: | | | | | | |
| Net operating expenses5 | 0.03% 6 | | | | | |
| Gross operating expenses5 | 0.08% 6 | | | | | |
| Net investment income (loss) | 2.34% 6 | | | | | |
| Portfolio turnover rate | 0% 4 | | | | | |
| Net assets, end of period (x 1,000) | $100 | | | | | |
1
Commencement of operations.
2
Calculated based on the average shares outstanding during the period.
3
The per share amount does not accord with the change in aggregate gains and losses in securities during the period because of the timing of sales and repurchases of fund shares in relation to fluctuating market values.
4
Not annualized.
5
The expenses incurred by underlying funds in which the fund invests are not included in this ratio.
6
Annualized.
Schwab Target Index Funds | Semiannual Report
Schwab Target 2040 Index Fund
Portfolio Holdings as of September 30, 2016 (Unaudited)
This section shows all the securities in the fund's portfolio and their values as of the report date.
The fund files its complete schedule of portfolio holdings with the SEC for the first and third quarters of each fiscal year on Form N-Q. The fund's Form N-Q is available on the SEC's website at www.sec.gov and may be viewed and copied at the SEC's Public Reference Room in Washington, D.C. Call 1-800-SEC-0330 for information on the operation of the Public Reference Room. The fund also makes available its complete schedule of portfolio holdings 15 to 20 days after calendar quarters on the fund's website at www.csimfunds.com/schwabfunds_prospectus.
| Holdings by Category | Cost ($) | Value ($) |
| 98.5% | Other Investment Companies | 1,585,605 | 1,586,740 |
| 1.5% | Short-Term Investment | 24,080 | 24,080 |
| 100.0% | Total Investments | 1,609,685 | 1,610,820 |
| (0.0%) | Other Assets and Liabilities, Net | | (625) |
| 100.0% | Net Assets | | 1,610,195 |
| Security | Number
of Shares | Value ($) |
| Other Investment Companies 98.5% of net assets |
| |
| U.S. Stocks 55.2% |
| Large-Cap 49.3% |
| Schwab U.S. Large-Cap ETF (a) | 15,373 | 793,554 |
| Small-Cap 5.9% |
| Schwab U.S. Small-Cap ETF (a) | 1,653 | 95,130 |
| | | 888,684 |
| |
| International Stocks 27.1% |
| Developed-Market Large-Cap 23.8% |
| Schwab International Equity ETF (a) | 13,289 | 382,590 |
| Emerging-Market 3.3% |
| Schwab Emerging Markets Equity ETF (a) | 2,325 | 53,615 |
| | | 436,205 |
| |
| Real Assets 3.1% |
| Real Estate 3.1% |
| Schwab U.S. REIT ETF (a) | 1,173 | 50,029 |
| |
| Fixed Income 13.1% |
| Intermediate-Term Bond 12.5% |
| Schwab U.S. Aggregate Bond ETF (a) | 3,766 | 202,121 |
| Security | Number
of Shares | Value ($) |
| Treasury Bond 0.6% |
| Schwab Short-Term U.S. Treasury ETF (a) | 191 | 9,701 |
| | | 211,822 |
| Total Other Investment Companies |
| (Cost $1,585,605) | | 1,586,740 |
Issuer
Rate, Maturity Date | Face
Amount ($) | Value ($) |
| Short-Term Investment 1.5% of net assets |
| |
| Time Deposit 1.5% |
| Australia & New Zealand Banking Group Ltd. |
| 0.15%, 10/03/16 (b) | 24,080 | 24,080 |
| Total Short-Term Investment |
| (Cost $24,080) | | 24,080 |
End of Investments.
At 09/30/16, the tax basis cost of the fund's investments was $1,609,685 and the unrealized appreciation and depreciation were $3,047 and ($1,912) respectively, with a net unrealized appreciation of $1,135.
| (a) | Issuer is affiliated with the fund's investment adviser. |
| (b) | The rate shown is the current daily overnight rate. |
| | |
| ETF — | Exchange-traded fund |
| REIT — | Real Estate Investment Trust |
The following is a summary of the inputs used to value the fund’s investments as of September 30, 2016 (see financial note 2(a) for additional information):
| Description | Quoted Prices in
Active Markets for
Identical Assets
(Level 1) | Other Significant
Observable Inputs
(Level 2) | Significant
Unobservable Inputs
(Level 3) | Total | |
| Other Investment Companies1 | $1,586,740 | $— | $— | $1,586,740 | |
| Short-Term Investment1 | — | 24,080 | — | 24,080 | |
| Total | $1,586,740 | $24,080 | $— | $1,610,820 | |
| 1 | As categorized in Portfolio Holdings. |
The fund’s policy is to recognize transfers between Level 1, Level 2 and Level 3 as of the beginning of the fiscal year. There were no transfers between Level 1, Level 2 and Level 3 for the period ended September 30, 2016.
Schwab Target Index Funds | Semiannual Report
Schwab Target 2040 Index Fund
Statement of Assets and Liabilities
As of September 30, 2016; unaudited
| Assets |
| Investments in affiliated underlying funds, at value (cost $1,585,605) | | $1,586,740 |
| Investments in unaffiliated issuers, at value (cost $24,080) | + | 24,080 |
| Total investments, at value (cost $1,609,685) | | 1,610,820 |
| Receivables: | | |
| Fund shares sold | + | 31,820 |
| Total assets | | 1,642,640 |
| Liabilities |
| Payables: | | |
| Investments bought | | 32,371 |
| Investment adviser fees | | 28 |
| Shareholder service fees | + | 46 |
| Total liabilities | | 32,445 |
| Net Assets |
| Total assets | | 1,642,640 |
| Total liabilities | – | 32,445 |
| Net assets | | $1,610,195 |
| Net Assets by Source | | |
| Capital received from investors | | 1,606,211 |
| Net investment income not yet distributed | | 2,849 |
| Net unrealized capital appreciation | | 1,135 |
| Net Asset Value (NAV) by Shares Class | |
| Share Class | Net Assets | ÷ | Shares
Outstanding | = | NAV |
| Investor Shares | $1,510,041 | | 150,812 | | $10.01 |
| Institutional Shares | $100,154 | | 10,001 | | $10.01 |
| | | | | | |
Schwab Target Index Funds | Semiannual Report
Schwab Target 2040 Index Fund
Statement of Operations
For the period August 25, 2016* through September 30, 2016; unaudited
| Investment Income |
| Dividends received from affiliated underlying funds | | $2,917 |
| Interest | + | 12 |
| Total investment income | | 2,929 |
| Expenses |
| Investment adviser and administrator fees | | 86 |
| Shareholder service fees: | | |
| Investor Shares | + | 49 |
| Total expenses | | 135 |
| Expense reduction by CSIM | – | 55 |
| Net expenses | – | 80 |
| Net investment income | | 2,849 |
| Realized and Unrealized Gains (Losses) |
| Net change in unrealized appreciation (depreciation) on affiliated underlying funds | + | 1,135 |
| Net realized and unrealized gains | | 1,135 |
| Increase in net assets resulting from operations | | $3,984 |
| * | Commencement of operations. |
Schwab Target Index Funds | Semiannual Report
Schwab Target 2040 Index Fund
Statement of Changes in Net Assets
For the current period only. Because the fund commenced operations on August 25, 2016, it has no prior report period
Figures for the current period are unaudited
| Operations |
| | 8/25/16*-9/30/16 |
| Net investment income | | $2,849 |
| Net change in unrealized appreciation (depreciation) | + | 1,135 |
| Increase in net assets from operations | | 3,984 |
| Transactions in Fund Shares | |
| | | 8/25/16*-9/30/16 |
| | | SHARES | VALUE |
| Shares Sold | | | |
| Investor Shares | | 150,816 | $1,506,240 |
| Institutional Shares | + | 10,001 | 100,010 |
| Total shares sold | | 160,817 | $1,606,250 |
| Shares Redeemed | | | |
| Investor Shares | | (4) | ($39) |
| Institutional Shares | + | — | — |
| Total shares redeemed | | (4) | ($39) |
| Net transactions in fund shares | | 160,813 | $1,606,211 |
| Shares Outstanding and Net Assets | |
| | | 8/25/16*-9/30/16 |
| | | SHARES | NET ASSETS |
| Beginning of period | | — | $— |
| Total increase | + | 160,813 | 1,610,195 |
| End of period | | 160,813 | $1,610,195 |
| Net investment income not yet distributed | | | $2,849 |
| * | Commencement of operations. |
Schwab Target Index Funds | Semiannual Report
Schwab Target 2045 Index Fund
Financial Statements
Financial Highlights
| Investor Shares | 8/25/16 1–
9/30/16* | | | | | |
| Per-Share Data |
| Net asset value at beginning of period | $10.00 | | | | | |
| Income (loss) from investment operations: | | | | | | |
| Net investment income (loss)2 | 0.03 | | | | | |
| Net realized and unrealized gains (losses) | (0.02) 3 | | | | | |
| Total from investment operations | 0.01 | | | | | |
| Net asset value at end of period | $10.01 | | | | | |
| Total return | 0.10% 4 | | | | | |
| Ratios/Supplemental Data |
| Ratios to average net assets: | | | | | | |
| Net operating expenses5 | 0.08% 6 | | | | | |
| Gross operating expenses5 | 0.13% 6 | | | | | |
| Net investment income (loss) | 2.85% 6 | | | | | |
| Portfolio turnover rate | 1% 4 | | | | | |
| Net assets, end of period (x 1,000) | $1,186 | | | | | |
| |
| Institutional Shares | 8/25/16 1–
9/30/16* | | | | | |
| Per-Share Data |
| Net asset value at beginning of period | $10.00 | | | | | |
| Income (loss) from investment operations: | | | | | | |
| Net investment income (loss)2 | 0.02 | | | | | |
| Net realized and unrealized gains (losses) | (0.01) 3 | | | | | |
| Total from investment operations | 0.01 | | | | | |
| Net asset value at end of period | $10.01 | | | | | |
| Total return | 0.10% 4 | | | | | |
| Ratios/Supplemental Data |
| Ratios to average net assets: | | | | | | |
| Net operating expenses5 | 0.03% 6 | | | | | |
| Gross operating expenses5 | 0.08% 6 | | | | | |
| Net investment income (loss) | 2.36% 6 | | | | | |
| Portfolio turnover rate | 1% 4 | | | | | |
| Net assets, end of period (x 1,000) | $100 | | | | | |
1
Commencement of operations.
2
Calculated based on the average shares outstanding during the period.
3
The per share amount does not accord with the change in aggregate gains and losses in securities during the period because of the timing of sales and repurchases of fund shares in relation to fluctuating market values.
4
Not annualized.
5
The expenses incurred by underlying funds in which the fund invests are not included in this ratio.
6
Annualized.
Schwab Target Index Funds | Semiannual Report
Schwab Target 2045 Index Fund
Portfolio Holdings as of September 30, 2016 (Unaudited)
This section shows all the securities in the fund's portfolio and their values as of the report date.
The fund files its complete schedule of portfolio holdings with the SEC for the first and third quarters of each fiscal year on Form N-Q. The fund's Form N-Q is available on the SEC's website at www.sec.gov and may be viewed and copied at the SEC's Public Reference Room in Washington, D.C. Call 1-800-SEC-0330 for information on the operation of the Public Reference Room. The fund also makes available its complete schedule of portfolio holdings 15 to 20 days after calendar quarters on the fund's website at www.csimfunds.com/schwabfunds_prospectus.
| Holdings by Category | Cost ($) | Value ($) |
| 99.0% | Other Investment Companies | 1,271,925 | 1,272,900 |
| 1.0% | Short-Term Investment | 13,469 | 13,469 |
| 100.0% | Total Investments | 1,285,394 | 1,286,369 |
| 0.0% | Other Assets and Liabilities, Net | | 43 |
| 100.0% | Net Assets | | 1,286,412 |
| Security | Number
of Shares | Value ($) |
| Other Investment Companies 99.0% of net assets |
| |
| U.S. Stocks 57.3% |
| Large-Cap 50.9% |
| Schwab U.S. Large-Cap ETF (a) | 12,680 | 654,542 |
| Small-Cap 6.4% |
| Schwab U.S. Small-Cap ETF (a) | 1,433 | 82,469 |
| | | 737,011 |
| |
| International Stocks 28.8% |
| Developed-Market Large-Cap 25.0% |
| Schwab International Equity ETF (a) | 11,175 | 321,728 |
| Emerging-Market 3.8% |
| Schwab Emerging Markets Equity ETF (a) | 2,098 | 48,380 |
| | | 370,108 |
| |
| Real Assets 3.3% |
| Real Estate 3.3% |
| Schwab U.S. REIT ETF (a) | 1,005 | 42,863 |
| |
| Fixed Income 9.6% |
| Intermediate-Term Bond 9.2% |
| Schwab U.S. Aggregate Bond ETF (a) | 2,189 | 117,484 |
| Security | Number
of Shares | Value ($) |
| Treasury Bond 0.4% |
| Schwab Short-Term U.S. Treasury ETF (a) | 107 | 5,434 |
| | | 122,918 |
| Total Other Investment Companies |
| (Cost $1,271,925) | | 1,272,900 |
Issuer
Rate, Maturity Date | Face
Amount ($) | Value ($) |
| Short-Term Investment 1.0% of net assets |
| |
| Time Deposit 1.0% |
| Brown Brothers Harriman |
| 0.15%, 10/03/16 (b) | 13,469 | 13,469 |
| Total Short-Term Investment |
| (Cost $13,469) | | 13,469 |
End of Investments.
At 09/30/16, the tax basis cost of the fund's investments was $1,285,397 and the unrealized appreciation and depreciation were $3,135 and ($2,163) respectively, with a net unrealized appreciation of $972.
| (a) | Issuer is affiliated with the fund's investment adviser. |
| (b) | The rate shown is the current daily overnight rate. |
| | |
| ETF — | Exchange-traded fund |
| REIT — | Real Estate Investment Trust |
The following is a summary of the inputs used to value the fund’s investments as of September 30, 2016 (see financial note 2(a) for additional information):
| Description | Quoted Prices in
Active Markets for
Identical Assets
(Level 1) | Other Significant
Observable Inputs
(Level 2) | Significant
Unobservable Inputs
(Level 3) | Total | |
| Other Investment Companies1 | $1,272,900 | $— | $— | $1,272,900 | |
| Short-Term Investment1 | — | 13,469 | — | 13,469 | |
| Total | $1,272,900 | $13,469 | $— | $1,286,369 | |
| 1 | As categorized in Portfolio Holdings. |
The fund’s policy is to recognize transfers between Level 1, Level 2 and Level 3 as of the beginning of the fiscal year. There were no transfers between Level 1, Level 2 and Level 3 for the period ended September 30, 2016.
Schwab Target Index Funds | Semiannual Report
Schwab Target 2045 Index Fund
Statement of Assets and Liabilities
As of September 30, 2016; unaudited
| Assets |
| Investments in affiliated underlying funds, at value (cost $1,271,925) | | $1,272,900 |
| Investments in unaffiliated issuers, at value (cost $13,469) | + | 13,469 |
| Total investments, at value (cost $1,285,394) | | 1,286,369 |
| Receivables: | | |
| Fund shares sold | + | 7,809 |
| Total assets | | 1,294,178 |
| Liabilities |
| Payables: | | |
| Investments bought | | 7,703 |
| Investment adviser fees | | 24 |
| Shareholder service fees | + | 39 |
| Total liabilities | | 7,766 |
| Net Assets |
| Total assets | | 1,294,178 |
| Total liabilities | – | 7,766 |
| Net assets | | $1,286,412 |
| Net Assets by Source | | |
| Capital received from investors | | 1,282,774 |
| Net investment income not yet distributed | | 2,656 |
| Net realized capital gains | | 7 |
| Net unrealized capital appreciation | | 975 |
| Net Asset Value (NAV) by Shares Class | |
| Share Class | Net Assets | ÷ | Shares
Outstanding | = | NAV |
| Investor Shares | $1,186,256 | | 118,476 | | $10.01 |
| Institutional Shares | $100,156 | | 10,001 | | $10.01 |
| | | | | | |
Schwab Target Index Funds | Semiannual Report
Schwab Target 2045 Index Fund
Statement of Operations
For the period August 25, 2016* through September 30, 2016; unaudited
| Investment Income |
| Dividends received from affiliated underlying funds | | $2,715 |
| Interest | + | 10 |
| Total investment income | | 2,725 |
| Expenses |
| Investment adviser and administrator fees | | 76 |
| Shareholder service fees: | | |
| Investor Shares | + | 43 |
| Total expenses | | 119 |
| Expense reduction by CSIM | – | 50 |
| Net expenses | – | 69 |
| Net investment income | | 2,656 |
| Realized and Unrealized Gains (Losses) |
| Net realized gains on sales of affiliated underlying funds | | 7 |
| Net change in unrealized appreciation (depreciation) on affiliated underlying funds | + | 975 |
| Net realized and unrealized gains | | 982 |
| Increase in net assets resulting from operations | | $3,638 |
| * | Commencement of operations. |
Schwab Target Index Funds | Semiannual Report
Schwab Target 2045 Index Fund
Statement of Changes in Net Assets
For the current period only. Because the fund commenced operations on August 25, 2016, it has no prior report period
Figures for the current period are unaudited
| Operations |
| | 8/25/16*-9/30/16 |
| Net investment income | | $2,656 |
| Net realized gains | | 7 |
| Net change in unrealized appreciation (depreciation) | + | 975 |
| Increase in net assets from operations | | 3,638 |
| Transactions in Fund Shares | |
| | | 8/25/16*-9/30/16 |
| | | SHARES | VALUE |
| Shares Sold | | | |
| Investor Shares | | 120,522 | $1,203,358 |
| Institutional Shares | + | 10,001 | 100,010 |
| Total shares sold | | 130,523 | $1,303,368 |
| Shares Redeemed | | | |
| Investor Shares | | (2,046) | ($20,594) |
| Institutional Shares | + | — | — |
| Total shares redeemed | | (2,046) | ($20,594) |
| Net transactions in fund shares | | 128,477 | $1,282,774 |
| Shares Outstanding and Net Assets | |
| | | 8/25/16*-9/30/16 |
| | | SHARES | NET ASSETS |
| Beginning of period | | — | $— |
| Total increase | + | 128,477 | 1,286,412 |
| End of period | | 128,477 | $1,286,412 |
| Net investment income not yet distributed | | | $2,656 |
| * | Commencement of operations. |
Schwab Target Index Funds | Semiannual Report
Schwab Target 2050 Index Fund
Financial Statements
Financial Highlights
| Investor Shares | 8/25/16 1–
9/30/16* | | | | | |
| Per-Share Data |
| Net asset value at beginning of period | $10.00 | | | | | |
| Income (loss) from investment operations: | | | | | | |
| Net investment income (loss)2 | 0.03 | | | | | |
| Net realized and unrealized gains (losses) | (0.02) 3 | | | | | |
| Total from investment operations | 0.01 | | | | | |
| Net asset value at end of period | $10.01 | | | | | |
| Total return | 0.10% 4 | | | | | |
| Ratios/Supplemental Data |
| Ratios to average net assets: | | | | | | |
| Net operating expenses5 | 0.08% 6 | | | | | |
| Gross operating expenses5 | 0.13% 6 | | | | | |
| Net investment income (loss) | 2.68% 6 | | | | | |
| Portfolio turnover rate | 8% 4 | | | | | |
| Net assets, end of period (x 1,000) | $728 | | | | | |
| |
| Institutional Shares | 8/25/16 1–
9/30/16* | | | | | |
| Per-Share Data |
| Net asset value at beginning of period | $10.00 | | | | | |
| Income (loss) from investment operations: | | | | | | |
| Net investment income (loss)2 | 0.02 | | | | | |
| Net realized and unrealized gains (losses) | (0.00) 3,7 | | | | | |
| Total from investment operations | 0.02 | | | | | |
| Net asset value at end of period | $10.02 | | | | | |
| Total return | 0.20% 4 | | | | | |
| Ratios/Supplemental Data |
| Ratios to average net assets: | | | | | | |
| Net operating expenses5 | 0.03% 6 | | | | | |
| Gross operating expenses5 | 0.08% 6 | | | | | |
| Net investment income (loss) | 2.38% 6 | | | | | |
| Portfolio turnover rate | 8% 4 | | | | | |
| Net assets, end of period (x 1,000) | $100 | | | | | |
1
Commencement of operations.
2
Calculated based on the average shares outstanding during the period.
3
The per share amount does not accord with the change in aggregate gains and losses in securities during the period because of the timing of sales and repurchases of fund shares in relation to fluctuating market values.
4
Not annualized.
5
The expenses incurred by underlying funds in which the fund invests are not included in this ratio.
6
Annualized.
7
Per-share amount was less than $0.005.
Schwab Target Index Funds | Semiannual Report
Schwab Target 2050 Index Fund
Portfolio Holdings as of September 30, 2016 (Unaudited)
This section shows all the securities in the fund's portfolio and their values as of the report date.
The fund files its complete schedule of portfolio holdings with the SEC for the first and third quarters of each fiscal year on Form N-Q. The fund's Form N-Q is available on the SEC's website at www.sec.gov and may be viewed and copied at the SEC's Public Reference Room in Washington, D.C. Call 1-800-SEC-0330 for information on the operation of the Public Reference Room. The fund also makes available its complete schedule of portfolio holdings 15 to 20 days after calendar quarters on the fund's website at www.csimfunds.com/schwabfunds_prospectus.
| Holdings by Category | Cost ($) | Value ($) |
| 99.2% | Other Investment Companies | 820,206 | 821,474 |
| 0.9% | Short-Term Investment | 7,269 | 7,269 |
| 100.1% | Total Investments | 827,475 | 828,743 |
| (0.1%) | Other Assets and Liabilities, Net | | (676) |
| 100.0% | Net Assets | | 828,067 |
| Security | Number
of Shares | Value ($) |
| Other Investment Companies 99.2% of net assets |
| |
| U.S. Stocks 58.6% |
| Large-Cap 51.8% |
| Schwab U.S. Large-Cap ETF (a) | 8,309 | 428,911 |
| Small-Cap 6.8% |
| Schwab U.S. Small-Cap ETF (a) | 984 | 56,629 |
| | | 485,540 |
| |
| International Stocks 29.9% |
| Developed-Market Large-Cap 25.9% |
| Schwab International Equity ETF (a) | 7,464 | 214,888 |
| Emerging-Market 4.0% |
| Schwab Emerging Markets Equity ETF (a) | 1,432 | 33,022 |
| | | 247,910 |
| |
| Real Assets 3.5% |
| Real Estate 3.5% |
| Schwab U.S. REIT ETF (a) | 675 | 28,789 |
| |
| Fixed Income 7.2% |
| Intermediate-Term Bond 6.9% |
| Schwab U.S. Aggregate Bond ETF (a) | 1,063 | 57,051 |
| Security | Number
of Shares | Value ($) |
| Treasury Bond 0.3% |
| Schwab Short-Term U.S. Treasury ETF (a) | 43 | 2,184 |
| | | 59,235 |
| Total Other Investment Companies |
| (Cost $820,206) | | 821,474 |
Issuer
Rate, Maturity Date | Face
Amount ($) | Value ($) |
| Short-Term Investment 0.9% of net assets |
| |
| Time Deposit 0.9% |
| Brown Brothers Harriman |
| 0.15%, 10/03/16 (b) | 7,269 | 7,269 |
| Total Short-Term Investment |
| (Cost $7,269) | | 7,269 |
End of Investments.
At 09/30/16, the tax basis cost of the fund's investments was $828,043 and the unrealized appreciation and depreciation were $1,682 and ($982), respectively, with a net unrealized appreciation of $700.
| (a) | Issuer is affiliated with the fund's investment adviser. |
| (b) | The rate shown is the current daily overnight rate. |
| | |
| ETF — | Exchange-traded fund |
| REIT — | Real Estate Investment Trust |
The following is a summary of the inputs used to value the fund’s investments as of September 30, 2016 (see financial note 2(a) for additional information):
| Description | Quoted Prices in
Active Markets for
Identical Assets
(Level 1) | Other Significant
Observable Inputs
(Level 2) | Significant
Unobservable Inputs
(Level 3) | Total | |
| Other Investment Companies1 | $821,474 | $— | $— | $821,474 | |
| Short-Term Investment1 | — | 7,269 | — | 7,269 | |
| Total | $821,474 | $7,269 | $— | $828,743 | |
| 1 | As categorized in Portfolio Holdings. |
The fund’s policy is to recognize transfers between Level 1, Level 2 and Level 3 as of the beginning of the fiscal year. There were no transfers between Level 1, Level 2 and Level 3 for the period ended September 30, 2016.
Schwab Target Index Funds | Semiannual Report
Schwab Target 2050 Index Fund
Statement of Assets and Liabilities
As of September 30, 2016; unaudited
| Assets |
| Investments in affiliated underlying funds, at value (cost $820,206) | | $821,474 |
| Investments in unaffiliated issuers, at value (cost $7,269) | + | 7,269 |
| Total investments, at value (cost $827,475) | | 828,743 |
| Receivables: | | |
| Fund shares sold | + | 8,206 |
| Total assets | | 836,949 |
| Liabilities |
| Payables: | | |
| Investments bought | | 8,841 |
| Investment adviser fees | | 16 |
| Shareholder service fees | + | 25 |
| Total liabilities | | 8,882 |
| Net Assets |
| Total assets | | 836,949 |
| Total liabilities | – | 8,882 |
| Net assets | | $828,067 |
| Net Assets by Source | | |
| Capital received from investors | | 825,632 |
| Net investment income not yet distributed | | 1,734 |
| Net realized capital losses | | (567) |
| Net unrealized capital appreciation | | 1,268 |
| Net Asset Value (NAV) by Shares Class | |
| Share Class | Net Assets | ÷ | Shares
Outstanding | = | NAV |
| Investor Shares | $727,905 | | 72,689 | | $10.01 |
| Institutional Shares | $100,162 | | 10,001 | | $10.02 |
| | | | | | |
Schwab Target Index Funds | Semiannual Report
Schwab Target 2050 Index Fund
Statement of Operations
For the period August 25, 2016* through September 30, 2016; unaudited
| Investment Income |
| Dividends received from affiliated underlying funds | | $1,773 |
| Interest | + | 7 |
| Total investment income | | 1,780 |
| Expenses |
| Investment adviser and administrator fees | | 53 |
| Shareholder service fees: | | |
| Investor Shares | + | 28 |
| Total expenses | | 81 |
| Expense reduction by CSIM | – | 35 |
| Net expenses | – | 46 |
| Net investment income | | 1,734 |
| Realized and Unrealized Gains (Losses) |
| Net realized losses on sales of affiliated underlying funds | | (567) |
| Net change in unrealized appreciation (depreciation) on affiliated underlying funds | + | 1,268 |
| Net realized and unrealized gains | | 701 |
| Increase in net assets resulting from operations | | $2,435 |
| * | Commencement of operations. |
Schwab Target Index Funds | Semiannual Report
Schwab Target 2050 Index Fund
Statement of Changes in Net Assets
For the current period only. Because the fund commenced operations on August 25, 2016, it has no prior report period
Figures for the current period are unaudited
| Operations |
| | 8/25/16*-9/30/16 |
| Net investment income | | $1,734 |
| Net realized losses | | (567) |
| Net change in unrealized appreciation (depreciation) | + | 1,268 |
| Increase in net assets from operations | | 2,435 |
| Transactions in Fund Shares | |
| | | 8/25/16*-9/30/16 |
| | | SHARES | VALUE |
| Shares Sold | | | |
| Investor Shares | | 78,310 | $781,940 |
| Institutional Shares | + | 10,001 | 100,010 |
| Total shares sold | | 88,311 | $881,950 |
| Shares Redeemed | | | |
| Investor Shares | | (5,621) | ($56,318) |
| Institutional Shares | + | — | — |
| Total shares redeemed | | (5,621) | ($56,318) |
| Net transactions in fund shares | | 82,690 | $825,632 |
| Shares Outstanding and Net Assets | |
| | | 8/25/16*-9/30/16 |
| | | SHARES | NET ASSETS |
| Beginning of period | | — | $— |
| Total increase | + | 82,690 | 828,067 |
| End of period | | 82,690 | $828,067 |
| Net investment income not yet distributed | | | $1,734 |
| * | Commencement of operations. |
Schwab Target Index Funds | Semiannual Report
Schwab Target 2055 Index Fund
Financial Statements
Financial Highlights
| Investor Shares | 8/25/16 1–
9/30/16* | | | | | |
| Per-Share Data |
| Net asset value at beginning of period | $10.00 | | | | | |
| Income (loss) from investment operations: | | | | | | |
| Net investment income (loss)2 | 0.02 | | | | | |
| Net realized and unrealized gains (losses) | 0.00 3 | | | | | |
| Total from investment operations | 0.02 | | | | | |
| Net asset value at end of period | $10.02 | | | | | |
| Total return | 0.20% 4 | | | | | |
| Ratios/Supplemental Data |
| Ratios to average net assets: | | | | | | |
| Net operating expenses5 | 0.08% 6 | | | | | |
| Gross operating expenses5 | 0.13% 6 | | | | | |
| Net investment income (loss) | 2.37% 6 | | | | | |
| Portfolio turnover rate | 0% 4 | | | | | |
| Net assets, end of period (x 1,000) | $510 | | | | | |
| |
| Institutional Shares | 8/25/16 1–
9/30/16* | | | | | |
| Per-Share Data |
| Net asset value at beginning of period | $10.00 | | | | | |
| Income (loss) from investment operations: | | | | | | |
| Net investment income (loss)2 | 0.02 | | | | | |
| Net realized and unrealized gains (losses) | 0.00 3 | | | | | |
| Total from investment operations | 0.02 | | | | | |
| Net asset value at end of period | $10.02 | | | | | |
| Total return | 0.20% 4 | | | | | |
| Ratios/Supplemental Data |
| Ratios to average net assets: | | | | | | |
| Net operating expenses5 | 0.03% 6 | | | | | |
| Gross operating expenses5 | 0.08% 6 | | | | | |
| Net investment income (loss) | 2.40% 6 | | | | | |
| Portfolio turnover rate | 0% 4 | | | | | |
| Net assets, end of period (x 1,000) | $100 | | | | | |
1
Commencement of operations.
2
Calculated based on the average shares outstanding during the period.
3
Per-share amount was less than $0.005.
4
Not annualized.
5
The expenses incurred by underlying funds in which the fund invests are not included in this ratio.
6
Annualized.
Schwab Target Index Funds | Semiannual Report
Schwab Target 2055 Index Fund
Portfolio Holdings as of September 30, 2016 (Unaudited)
This section shows all the securities in the fund's portfolio and their values as of the report date.
The fund files its complete schedule of portfolio holdings with the SEC for the first and third quarters of each fiscal year on Form N-Q. The fund's Form N-Q is available on the SEC's website at www.sec.gov and may be viewed and copied at the SEC's Public Reference Room in Washington, D.C. Call 1-800-SEC-0330 for information on the operation of the Public Reference Room. The fund also makes available its complete schedule of portfolio holdings 15 to 20 days after calendar quarters on the fund's website at www.csimfunds.com/schwabfunds_prospectus.
| Holdings by Category | Cost ($) | Value ($) |
| 99.5% | Other Investment Companies | 606,056 | 606,350 |
| 0.7% | Short-Term Investment | 4,439 | 4,439 |
| 100.2% | Total Investments | 610,495 | 610,789 |
| (0.2%) | Other Assets and Liabilities, Net | | (1,075) |
| 100.0% | Net Assets | | 609,714 |
| Security | Number
of Shares | Value ($) |
| Other Investment Companies 99.5% of net assets |
| |
| U.S. Stocks 59.9% |
| Large-Cap 52.7% |
| Schwab U.S. Large-Cap ETF (a) | 6,227 | 321,438 |
| Small-Cap 7.2% |
| Schwab U.S. Small-Cap ETF (a) | 761 | 43,795 |
| | | 365,233 |
| |
| International Stocks 30.8% |
| Developed-Market Large-Cap 26.5% |
| Schwab International Equity ETF (a) | 5,619 | 161,771 |
| Emerging-Market 4.3% |
| Schwab Emerging Markets Equity ETF (a) | 1,121 | 25,850 |
| | | 187,621 |
| |
| Real Assets 3.9% |
| Real Estate 3.9% |
| Schwab U.S. REIT ETF (a) | 562 | 23,970 |
| |
| Fixed Income 4.9% |
| Intermediate-Term Bond 4.7% |
| Schwab U.S. Aggregate Bond ETF (a) | 535 | 28,713 |
| Security | Number
of Shares | Value ($) |
| Treasury Bond 0.2% |
| Schwab Short-Term U.S. Treasury ETF (a) | 16 | 813 |
| | | 29,526 |
| Total Other Investment Companies |
| (Cost $606,056) | | 606,350 |
Issuer
Rate, Maturity Date | Face
Amount ($) | Value ($) |
| Short-Term Investment 0.7% of net assets |
| |
| Time Deposit 0.7% |
| Brown Brothers Harriman |
| 0.15%, 10/03/16 (b) | 4,439 | 4,439 |
| Total Short-Term Investment |
| (Cost $4,439) | | 4,439 |
End of Investments.
At 09/30/16, the tax basis cost of the fund's investments was $610,495 and the unrealized appreciation and depreciation were $1,317 and ($1,023) respectively, with a net unrealized appreciation of $294.
| (a) | Issuer is affiliated with the fund's investment adviser. |
| (b) | The rate shown is the current daily overnight rate. |
| | |
| ETF — | Exchange-traded fund |
| REIT — | Real Estate Investment Trust |
The following is a summary of the inputs used to value the fund’s investments as of September 30, 2016 (see financial note 2(a) for additional information):
| Description | Quoted Prices in
Active Markets for
Identical Assets
(Level 1) | Other Significant
Observable Inputs
(Level 2) | Significant
Unobservable Inputs
(Level 3) | Total | |
| Other Investment Companies1 | $606,350 | $— | $— | $606,350 | |
| Short-Term Investment1 | — | 4,439 | — | 4,439 | |
| Total | $606,350 | $4,439 | $— | $610,789 | |
| 1 | As categorized in Portfolio Holdings. |
The fund’s policy is to recognize transfers between Level 1, Level 2 and Level 3 as of the beginning of the fiscal year. There were no transfers between Level 1, Level 2 and Level 3 for the period ended September 30, 2016.
Schwab Target Index Funds | Semiannual Report
Schwab Target 2055 Index Fund
Statement of Assets and Liabilities
As of September 30, 2016; unaudited
| Assets |
| Investments in affiliated underlying funds, at value (cost $606,056) | | $606,350 |
| Investments in unaffiliated issuers, at value (cost $4,439) | + | 4,439 |
| Total investments, at value (cost $610,495) | | 610,789 |
| Receivables: | | |
| Fund shares sold | + | 1,897 |
| Total assets | | 612,686 |
| Liabilities |
| Payables: | | |
| Investments bought | | 2,943 |
| Investment adviser fees | | 12 |
| Shareholder service fees | + | 17 |
| Total liabilities | | 2,972 |
| Net Assets |
| Total assets | | 612,686 |
| Total liabilities | – | 2,972 |
| Net assets | | $609,714 |
| Net Assets by Source | | |
| Capital received from investors | | 608,254 |
| Net investment income not yet distributed | | 1,166 |
| Net unrealized capital appreciation | | 294 |
| Net Asset Value (NAV) by Shares Class | |
| Share Class | Net Assets | ÷ | Shares
Outstanding | = | NAV |
| Investor Shares | $509,520 | | 50,866 | | $10.02 |
| Institutional Shares | $100,194 | | 10,001 | | $10.02 |
| | | | | | |
Schwab Target Index Funds | Semiannual Report
Schwab Target 2055 Index Fund
Statement of Operations
For the period August 25, 2016* through September 30, 2016; unaudited
| Investment Income |
| Dividends received from affiliated underlying funds | | $1,196 |
| Interest | + | 3 |
| Total investment income | | 1,199 |
| Expenses |
| Investment adviser and administrator fees | | 39 |
| Shareholder service fees: | | |
| Investor Shares | + | 19 |
| Total expenses | | 58 |
| Expense reduction by CSIM | – | 25 |
| Net expenses | – | 33 |
| Net investment income | | 1,166 |
| Realized and Unrealized Gains (Losses) |
| Net change in unrealized appreciation (depreciation) on affiliated underlying funds | + | 294 |
| Net realized and unrealized gains | | 294 |
| Increase in net assets resulting from operations | | $1,460 |
| * | Commencement of operations. |
Schwab Target Index Funds | Semiannual Report
Schwab Target 2055 Index Fund
Statement of Changes in Net Assets
For the current period only. Because the fund commenced operations on August 25, 2016, it has no prior report period
Figures for the current period are unaudited
| Operations |
| | 8/25/16*-9/30/16 |
| Net investment income | | $1,166 |
| Net change in unrealized appreciation (depreciation) | + | 294 |
| Increase in net assets from operations | | 1,460 |
| Transactions in Fund Shares | |
| | | 8/25/16*-9/30/16 |
| | | SHARES | VALUE |
| Shares Sold | | | |
| Investor Shares | | 50,866 | $508,244 |
| Institutional Shares | + | 10,001 | 100,010 |
| Total shares sold | | 60,867 | $608,254 |
| Net transactions in fund shares | | 60,867 | $608,254 |
| Shares Outstanding and Net Assets | |
| | | 8/25/16*-9/30/16 |
| | | SHARES | NET ASSETS |
| Beginning of period | | — | $— |
| Total increase | + | 60,867 | 609,714 |
| End of period | | 60,867 | $609,714 |
| Net investment income not yet distributed | | | $1,166 |
| * | Commencement of operations. |
Schwab Target Index Funds | Semiannual Report
Schwab Target 2060 Index Fund
Financial Statements
Financial Highlights
| Investor Shares | 8/25/16 1–
9/30/16* | | | | | |
| Per-Share Data |
| Net asset value at beginning of period | $10.00 | | | | | |
| Income (loss) from investment operations: | | | | | | |
| Net investment income (loss)2 | 0.03 | | | | | |
| Net realized and unrealized gains (losses) | (0.01) | | | | | |
| Total from investment operations | 0.02 | | | | | |
| Net asset value at end of period | $10.02 | | | | | |
| Total return | 0.20% 3 | | | | | |
| Ratios/Supplemental Data |
| Ratios to average net assets: | | | | | | |
| Net operating expenses4 | 0.08% 5 | | | | | |
| Gross operating expenses4 | 0.13% 5 | | | | | |
| Net investment income (loss) | 2.65% 5 | | | | | |
| Portfolio turnover rate | 0% 3 | | | | | |
| Net assets, end of period (x 1,000) | $545 | | | | | |
| |
| Select Shares | 8/25/16 1–
9/30/16* | | | | | |
| Per-Share Data |
| Net asset value at beginning of period | $10.00 | | | | | |
| Income (loss) from investment operations: | | | | | | |
| Net investment income (loss)2 | 0.02 | | | | | |
| Net realized and unrealized gains (losses) | (0.00) 6 | | | | | |
| Total from investment operations | 0.02 | | | | | |
| Net asset value at end of period | $10.02 | | | | | |
| Total return | 0.20% 3 | | | | | |
| Ratios/Supplemental Data |
| Ratios to average net assets: | | | | | | |
| Net operating expenses4 | 0.03% 5 | | | | | |
| Gross operating expenses4 | 0.08% 5 | | | | | |
| Net investment income (loss) | 2.38% 5 | | | | | |
| Portfolio turnover rate | 0% 3 | | | | | |
| Net assets, end of period (x 1,000) | $100 | | | | | |
1
Commencement of operations.
2
Calculated based on the average shares outstanding during the period.
3
Not annualized.
4
The expenses incurred by underlying funds in which the fund invests are not included in this ratio.
5
Annualized.
6
Per-share amount was less than $0.005.
Schwab Target Index Funds | Semiannual Report
Schwab Target 2060 Index Fund
Portfolio Holdings as of September 30, 2016 (Unaudited)
This section shows all the securities in the fund's portfolio and their values as of the report date.
The fund files its complete schedule of portfolio holdings with the SEC for the first and third quarters of each fiscal year on Form N-Q. The fund's Form N-Q is available on the SEC's website at www.sec.gov and may be viewed and copied at the SEC's Public Reference Room in Washington, D.C. Call 1-800-SEC-0330 for information on the operation of the Public Reference Room. The fund also makes available its complete schedule of portfolio holdings 15 to 20 days after calendar quarters on the fund's website at www.csimfunds.com/schwabfunds_prospectus.
| Holdings by Category | Cost ($) | Value ($) |
| 99.4% | Other Investment Companies | 642,123 | 641,683 |
| 0.8% | Short-Term Investment | 4,699 | 4,699 |
| 100.2% | Total Investments | 646,822 | 646,382 |
| (0.2%) | Other Assets and Liabilities, Net | | (970) |
| 100.0% | Net Assets | | 645,412 |
| Security | Number
of Shares | Value ($) |
| Other Investment Companies 99.4% of net assets |
| |
| U.S. Stocks 60.3% |
| Large-Cap 53.0% |
| Schwab U.S. Large-Cap ETF (a) | 6,632 | 342,344 |
| Small-Cap 7.3% |
| Schwab U.S. Small-Cap ETF (a) | 816 | 46,961 |
| | | 389,305 |
| |
| International Stocks 31.1% |
| Developed-Market Large-Cap 26.7% |
| Schwab International Equity ETF (a) | 5,999 | 172,711 |
| Emerging-Market 4.4% |
| Schwab Emerging Markets Equity ETF (a) | 1,221 | 28,157 |
| | | 200,868 |
| |
| Real Assets 3.6% |
| Real Estate 3.6% |
| Schwab U.S. REIT ETF (a) | 543 | 23,159 |
| |
| Fixed Income 4.4% |
| Corporate Bond 4.3% |
| Schwab U.S. Aggregate Bond ETF (a) | 515 | 27,640 |
| Security | Number
of Shares | Value ($) |
| Treasury Bond 0.1% |
| Schwab Short-Term U.S. Treasury ETF (a) | 14 | 711 |
| | | 28,351 |
| Total Other Investment Companies |
| (Cost $642,123) | | 641,683 |
Issuer
Rate, Maturity Date | Face
Amount ($) | Value ($) |
| Short-Term Investment 0.8% of net assets |
| |
| Time Deposit 0.8% |
| Brown Brothers Harriman |
| 0.15%, 10/03/16 (b) | 4,699 | 4,699 |
| Total Short-Term Investment |
| (Cost $4,699) | | 4,699 |
End of Investments.
At 09/30/16, the tax basis cost of the fund's investments was $646,822 and the unrealized appreciation and depreciation were $1,289 and ($1,729) respectively, with a net unrealized depreciation of ($440).
| (a) | Issuer is affiliated with the fund's investment adviser. |
| (b) | The rate shown is the current daily overnight rate. |
| | |
| ETF — | Exchange-traded fund |
| REIT — | Real Estate Investment Trust |
The following is a summary of the inputs used to value the fund’s investments as of September 30, 2016 (see financial note 2(a) for additional information):
| Description | Quoted Prices in
Active Markets for
Identical Assets
(Level 1) | Other Significant
Observable Inputs
(Level 2) | Significant
Unobservable Inputs
(Level 3) | Total | |
| Other Investment Companies1 | $641,683 | $— | $— | $641,683 | |
| Short-Term Investment1 | — | 4,699 | — | 4,699 | |
| Total | $641,683 | $4,699 | $— | $646,382 | |
| 1 | As categorized in Portfolio Holdings. |
The fund’s policy is to recognize transfers between Level 1, Level 2 and Level 3 as of the beginning of the fiscal year. There were no transfers between Level 1, Level 2 and Level 3 for the period ended September 30, 2016.
Schwab Target Index Funds | Semiannual Report
Schwab Target 2060 Index Fund
Statement of Assets and Liabilities
As of September 30, 2016; unaudited
| Assets |
| Investments in affiliated underlying funds, at value (cost $642,123) | | $641,683 |
| Investments in unaffiliated issuers, at value (cost $4,699) | + | 4,699 |
| Total investments, at value (cost $646,822) | | 646,382 |
| Receivables: | | |
| Fund shares sold | + | 7,426 |
| Total assets | | 653,808 |
| Liabilities |
| Payables: | | |
| Investments bought | | 8,363 |
| Investment adviser fees | | 14 |
| Shareholder service fees | + | 19 |
| Total liabilities | | 8,396 |
| Net Assets |
| Total assets | | 653,808 |
| Total liabilities | – | 8,396 |
| Net assets | | $645,412 |
| Net Assets by Source | | |
| Capital received from investors | | 644,450 |
| Net investment income not yet distributed | | 1,402 |
| Net unrealized capital depreciation | | (440) |
| Net Asset Value (NAV) by Shares Class | |
| Share Class | Net Assets | ÷ | Shares
Outstanding | = | NAV |
| Investor Shares | $545,217 | | 54,425 | | $10.02 |
| Select Shares | $100,195 | | 10,001 | | $10.02 |
| | | | | | |
Schwab Target Index Funds | Semiannual Report
Schwab Target 2060 Index Fund
Statement of Operations
For the period August 25, 2016* through September 30, 2016; unaudited
| Investment Income |
| Dividends received from affiliated underlying funds | | $1,435 |
| Interest | + | 3 |
| Total investment income | | 1,438 |
| Expenses |
| Investment adviser and administrator fees | | 43 |
| Shareholder service fees: | | |
| Investor Shares | + | 22 |
| Total expenses | | 65 |
| Expense reduction by CSIM | – | 29 |
| Net expenses | – | 36 |
| Net investment income | | 1,402 |
| Realized and Unrealized Gains (Losses) |
| Net change in unrealized appreciation (depreciation) on affiliated underlying funds | + | (440) |
| Net realized and unrealized losses | | (440) |
| Increase in net assets resulting from operations | | $962 |
| * | Commencement of operations. |
Schwab Target Index Funds | Semiannual Report
Schwab Target 2060 Index Fund
Statement of Changes in Net Assets
For the current period only. Because the fund commenced operations on August 25, 2016, it has no prior report period
Figures for the current period are unaudited
| Operations |
| | 8/25/16*-9/30/16 |
| Net investment income | | $1,402 |
| Net change in unrealized appreciation (depreciation) | + | (440) |
| Increase in net assets from operations | | 962 |
| Transactions in Fund Shares | |
| | | 8/25/16*-9/30/16 |
| | | SHARES | VALUE |
| Shares Sold | | | |
| Investor Shares | | 54,425 | $544,440 |
| Institutional Shares | + | 10,001 | 100,010 |
| Total shares sold | | 64,426 | $644,450 |
| Net transactions in fund shares | | 64,426 | $644,450 |
| Shares Outstanding and Net Assets | |
| | | 8/25/16*-9/30/16 |
| | | SHARES | NET ASSETS |
| Beginning of period | | — | $— |
| Total increase | + | 64,426 | 645,412 |
| End of period | | 64,426 | $645,412 |
| Net investment income not yet distributed | | | $1,402 |
| * | Commencement of operations. |
Schwab Target Index Funds | Semiannual Report
Schwab Target Index Funds
Financial Notes, unaudited
1. Business Structure of the Funds:
Each of the funds in this report is a series of Schwab Capital Trust (the trust), a no-load, open-end management investment company. The trust is organized as a Massachusetts business trust and is registered under the Investment Company Act of 1940, as amended (the 1940 Act). The list below shows all the funds in the trust as of the end of the period, including the funds discussed in this report, which are highlighted:
| SCHWAB CAPITAL TRUST (ORGANIZED MAY 7, 1993) |
| Schwab Target 2010 Index Fund | Schwab Small-Cap Equity Fund™ |
| Schwab Target 2015 Index Fund | Schwab Hedged Equity Fund™ |
| Schwab Target 2020 Index Fund | Schwab Health Care Fund™ |
| Schwab Target 2025 Index Fund | Schwab ® International Core Equity Fund |
| Schwab Target 2030 Index Fund | Schwab Target 2010 Fund |
| Schwab Target 2035 Index Fund | Schwab Target 2015 Fund |
| Schwab Target 2040 Index Fund | Schwab Target 2020 Fund |
| Schwab Target 2045 Index Fund | Schwab Target 2025 Fund |
| Schwab Target 2050 Index Fund | Schwab Target 2030 Fund |
| Schwab Target 2055 Index Fund | Schwab Target 2035 Fund |
| Schwab Target 2060 Index Fund | Schwab Target 2040 Fund |
| Schwab ® S&P 500 Index Fund | Schwab Target 2045 Fund |
| Schwab Small-Cap Index Fund® | Schwab Target 2050 Fund |
| Schwab Total Stock Market Index Fund® | Schwab Target 2055 Fund |
| Schwab International Index Fund® | Schwab Target 2060 Fund |
| Schwab MarketTrack All Equity Portfolio™ | Schwab Fundamental US Large Company Index Fund |
| Schwab MarketTrack Growth Portfolio™ | Schwab Fundamental US Small Company Index Fund |
| Schwab MarketTrack Balanced Portfolio™ | Schwab Fundamental International Large Company Index Fund |
| Schwab MarketTrack Conservative Portfolio™ | Schwab Fundamental International Small Company Index Fund |
| Laudus Small-Cap MarketMasters Fund™ | Schwab Fundamental Emerging Markets Large Company Index Fund |
| Laudus International MarketMasters Fund™ | Schwab Fundamental Global Real Estate Index Fund |
| Schwab Balanced Fund | Schwab ® Monthly Income Fund - Moderate Payout |
| Schwab Core Equity Fund™ | Schwab ® Monthly Income Fund - Enhanced Payout |
| Schwab Dividend Equity Fund™ | Schwab ® Monthly Income Fund - Maximum Payout |
| Schwab Large-Cap Growth Fund™ | |
The Schwab Target Index Funds are “funds of funds.” Each of the funds seeks to achieve its investment objective by investing primarily in affiliated Schwab exchange-traded funds (ETFs). The funds may also invest in affiliated Schwab and Laudus mutual funds and unaffiliated third-party ETFs and mutual funds (all such ETFs and mutual funds referred to as underlying funds), in accordance with their target portfolio allocation. Each fund may also invest directly in equity and fixed-income securities, and cash equivalents, including money market securities.
Each fund in this report offers two share classes: Investor Shares and Institutional Shares. Shares are bought and sold at closing net asset value per share (NAV), which is the price for all outstanding shares of a fund or share class, as applicable. Each share has a par value of 1/1,000 of a cent, and the funds’ Board of Trustees (the Board) may authorize the issuance of as many shares as necessary.
The funds commenced operations on August 25, 2016.
Each fund maintains its own account for purposes of holding assets and accounting, and is considered a separate entity for tax purposes. Within its account, each fund may also keep certain assets in segregated accounts, as required by securities law.
2. Significant Accounting Policies:
The following is a summary of the significant accounting policies the funds use in their preparation of financial statements. The funds follow the investment company accounting and reporting guidance of the Financial Accounting Standards Board Accounting Standard Codification Topic 946 Financial Services — Investment Companies. The accounting policies are in conformity with accounting principles generally accepted in the United States of America (GAAP).
Schwab Target Index Funds | Semiannual Report
Schwab Target Index Funds
Financial Notes, unaudited (continued)
2. Significant Accounting Policies (continued):
The financial statements of the funds should be read in conjunction with the underlying funds’ financial statements. For more information about the underlying funds’ operations and policies, please refer to those funds’ semiannual and annual reports, which are filed and available on the U.S. Securities and Exchange Commission’s (SEC) website at www.sec.gov or at the SEC’s Public Reference Room in Washington D.C.
(a) Security Valuation:
Under procedures approved by the Board, the investment adviser has formed a Pricing Committee to administer the pricing and valuation of portfolio securities and other assets and to ensure that prices used for internal purposes or provided by third parties reasonably reflect fair market value. Among other things, these procedures allow the funds to utilize independent pricing services, quotations from securities and financial instrument dealers and other market sources to determine fair value.
The funds value the securities in their portfolios every business day. The funds use the following policies to value various types of securities:
• Underlying funds: Mutual funds are valued at their respective NAVs. ETFs traded on a recognized securities exchange are valued at the last reported sale price that day or the official closing price, if applicable.
• Securities for which no quoted value is available: The Board has adopted procedures to fair value each fund’s securities when market prices are not “readily available” or are unreliable. For example, a fund may fair value a security when it is de-listed or its trading is halted or suspended; when a security’s primary pricing source is unable or unwilling to provide a price; or when a security’s primary trading market is closed during regular market hours. Each fund makes fair value determinations in good faith in accordance with the fund’s valuation procedures. The Pricing Committee considers a number of factors, including unobservable market inputs when arriving at fair value. The Pricing Committee may employ techniques such as the review of related or comparable assets or liabilities, related market activities, recent transactions, market multiples, book values, transactional back-testing, disposition analysis and other relevant information. The Pricing Committee regularly reviews these inputs and assumptions to calibrate the valuations. Due to the subjective and variable nature of fair value pricing, there can be no assurance that a fund could obtain the fair value assigned to the security upon the sale of such security. The Board convenes on a regular basis to review fair value determinations made by the funds pursuant to the valuation procedures.
• Short-term securities (60 days or less to maturity): A short-term security may be valued at its amortized cost when it approximates the security’s market value.
In accordance with the authoritative guidance on fair value measurements and disclosures under GAAP, the funds disclose the fair value of their investments in a hierarchy that prioritizes the significant inputs to valuation techniques used to measure the fair value. The hierarchy gives the highest priority to valuations based upon unadjusted quoted prices in active markets for identical assets or liabilities (Level 1 measurements) and the lowest priority to valuations based upon unobservable inputs that are significant to the valuation (Level 3 measurements). If inputs used to measure the financial instruments fall within different levels of the hierarchy, the categorization is based on the lowest level input that is significant to the valuation. If the funds determine that either the volume and/or level of activity for an asset or liability has significantly decreased (from normal conditions for that asset or liability) or price quotations or observable inputs are not associated with orderly transactions, increased analysis and management judgment will be required to estimate fair value.
The three levels of the fair value hierarchy are as follows:
• Level 1—quoted prices in active markets for identical securities—Investments whose values are based on quoted market prices in active markets, and whose values are therefore classified as Level 1 prices, include active listed equities and ETFs. Investments in mutual funds are valued daily at their NAVs, and investments in ETFs are valued daily at the last reported sale price or the official closing price, which are classified as Level 1 prices, without consideration to the classification level of the specific investments held by an underlying fund.
• Level 2—other significant observable inputs (including quoted prices for similar securities, interest rates, prepayment speeds, credit risk, etc.)—Investments that trade in markets that are not considered to be active, but whose values are based on quoted market prices, dealer quotations or valuations provided by alternative pricing sources supported by observable inputs are classified as Level 2 prices. These generally include U.S. government and sovereign obligations, most government agency securities, investment-grade corporate bonds, certain mortgage products, less liquid listed equities, and state, municipal and provincial obligations.
Schwab Target Index Funds | Semiannual Report
Schwab Target Index Funds
Financial Notes, unaudited (continued)
2. Significant Accounting Policies (continued):
• Level 3—significant unobservable inputs (including the funds’ own assumptions in determining the fair value of investments)—Investments whose values are classified as Level 3 prices have significant unobservable inputs, as they may trade infrequently or not at all. When observable prices are not available for these securities, the funds use one or more valuation techniques for which sufficient and reliable data is available. The inputs used by the funds in estimating the value of Level 3 prices may include the original transaction price, quoted prices for similar securities or assets in active markets, completed or pending third-party transactions in the underlying investment or comparable issuers, and changes in financial ratios or cash flows. Level 3 prices may also be adjusted to reflect illiquidity and/or non-transferability, with the amount of such discount estimated by the funds in the absence of market information. Assumptions used by the funds due to the lack of observable inputs may significantly impact the resulting fair value and therefore the funds’ results of operations.
The inputs or methodology used for valuing securities are not necessarily an indication of the risk associated with investing in those securities.
The levels associated with valuing the funds’ investments as of September 30, 2016 are disclosed in the Portfolio Holdings.
(b) Accounting Policies for certain Portfolio Investments (if held):
Cash Management Transactions: The funds may subscribe to the Brown Brothers Harriman & Co. (BBH) Cash Management Service Sweep (CMS Sweep). The BBH CMS Sweep is an investment product that automatically sweeps the funds’ cash balances into overnight offshore time deposits with either the BBH Grand Cayman branch or a branch of a pre-approved commercial bank. This fully automated program allows the funds to earn interest on cash balances. Excess cash invested with deposit institutions domiciled outside of the U.S., as with any offshore deposit, may be subject to sovereign actions in the jurisdiction of the deposit institution including, but not limited to, freeze, seizure or diminution. The funds bear the risk associated with the repayment of principal and payment of interest on such instruments by the institution with which the deposit is ultimately placed. Balances in the CMS Sweep are accounted for on a cost basis, which approximates market value.
(c) Security Transactions:
Security transactions are recorded as of the date the order to buy or sell the security is executed. Realized gains and losses from security transactions are based on the identified costs of the securities involved.
(d) Investment Income:
Interest income is recorded as it accrues. Dividends and distributions from portfolio securities and underlying funds are recorded on the date they are effective (the ex-dividend date), although the funds record certain foreign security dividends on the day they learn of the ex-dividend date. Any distributions from underlying funds are recorded in accordance with the character of the distributions as designated by the underlying funds.
(e) Expenses:
Pursuant to the Investment Advisory Agreement (Advisory Agreement) between Charles Schwab Investment Management, Inc. (CSIM or the investment adviser) and the funds, the investment adviser will pay the operating expenses of each fund, including the cost of transfer agency, custody, fund administration, legal, audit and other services, but excluding shareholder servicing fees, acquired fund fees and expenses, interest expense, taxes, any brokerage expenses and extraordinary or non-routine expenses.
(f) Distributions to Shareholders:
The funds make distributions from net investment income and net realized capital gains, if any, once a year.
(g) Accounting Estimates:
The accounting policies described in this report conform to GAAP. Notwithstanding this, shareholders should understand that in order to follow these principles, fund management has to make estimates and assumptions that affect the information reported in the financial statements. It’s possible that once the results are known, they may turn out to be different from these estimates and these differences may be material.
Schwab Target Index Funds | Semiannual Report
Schwab Target Index Funds
Financial Notes, unaudited (continued)
2. Significant Accounting Policies (continued):
(h) Federal Income Taxes:
The funds intend to meet federal income and excise tax requirements for regulated investment companies under subchapter M of the Internal Revenue Code, as amended. Accordingly, the funds distribute substantially all of their net investment income and net realized capital gains, if any, to their respective shareholders each year. As long as a fund meets the tax requirements, it is not required to pay federal income tax.
(i) Indemnification:
Under the funds’ organizational documents, the officers and trustees are indemnified against certain liabilities arising out of the performance of their duties to the funds. In addition, in the normal course of business the funds enter into contracts with their vendors and others that provide general indemnifications. The funds’ maximum exposure under these arrangements is unknown as this would involve future claims that may be made against the funds. However, based on experience, the funds expect the risk of loss attributable to these arrangements to be remote.
3. Risk Factors:
Investing in the funds may involve certain risks, as discussed in the funds’ prospectus, including, but not limited to, those described below. Any of these risks could cause an investor to lose money.
Asset Allocation Risk. The funds are subject to asset allocation risk, which is the risk that the selection of the underlying funds and the allocation of a fund’s assets among the various asset classes and market segments will cause the fund to underperform other funds with a similar investment objective.
Conflicts of Interest Risk. The investment adviser’s authority to select and substitute underlying funds from a variety of affiliated and unaffiliated ETFs and mutual funds may create a conflict of interest because the fees paid to it by some underlying funds are higher than the fees paid by other underlying funds. The investment adviser also may have an incentive to select an affiliated underlying fund for other reasons, including to increase assets under management or to support new investment strategies. In addition, other conflicts of interest may exist where the best interests of the affiliated underlying fund may not be aligned with those of the fund or vice versa. However, the investment adviser is a fiduciary to the fund and is legally obligated to act in the fund’s best interests when selecting underlying funds.
Market Risk. Stock and bond markets rise and fall daily. As with any investment whose performance is tied to these markets, the value of an investment in the funds will fluctuate, which means that an investor could lose money.
ETF Risk. When a fund invests in an ETF, it will bear a proportionate share of the ETF’s expenses. In addition, lack of liquidity in the market for an ETF’s shares can result in its value being more volatile than the underlying portfolio of securities. Although ETFs are listed on national securities exchanges, there can be no assurance that an active trading market for such ETF shares will develop or be maintained. If an active market is not maintained, the fund may experience difficulty in buying or selling ETF shares. In addition, th market price of ETF shares may deviate, sometimes significantly, from net asset value, particularly during periods of market volatility. Certain ETFs that seek to track the performance of their benchmark indices may not fully replicate their index and may hold securities not included in the index, which may not produce the intended results.
Direct Investment Risk. The funds may invest a portion of their assets directly in equity and fixed income securities, ETFs, and cash equivalents, including money market securities. A fund’s direct investment in these securities is subject to the same or similar risks as an underlying fund’s investment in the same security.
Underlying Fund Investment Risk. The value of your investment in the funds is based primarily on the prices of the underlying funds that the fund purchases. In turn, the price of each underlying fund is based on the value of its securities. The funds are subject to the performance and expenses of the underlying funds in which they invest. Before investing in the funds, investors should assess the risks associated with the underlying funds in which the funds may invest and the types of investments made by those underlying funds. These risks include any combination of the risks described below, although a fund’s exposure to a particular risk will be proportionate to the fund's overall asset allocation and underlying fund allocation.
• Investment Risk. The funds may experience losses with respect to their investment in an underlying fund. Further, there is no guarantee that an underlying fund will be able to achieve its objective.
• Fixed Income Risk. Interest rates rise and fall over time, which will affect an underlying fund’s yield and share price. Because interest rates in the United States and other countries are at, or near, historically low levels, a change in a central bank’s monetary policy or improving economic conditions, among other things, may result in an increase in interest rates. A rise in
Schwab Target Index Funds | Semiannual Report
Schwab Target Index Funds
Financial Notes, unaudited (continued)
3. Risk Factors (continued):
interest rates could cause an underlying fund’s shares price to fall. The credit quality of a portfolio investment could also cause an underlying fund’s share price to fall. An underlying fund could lose money if the issuer or guarantor of a portfolio investment or the counterparty to a derivatives contract fails to make timely principal or interest payments or otherwise honor its obligations. Fixed income securities may be paid off earlier or later than expected. Either situation could cause an underlying fund to hold securities paying lower-than-market rates of interest, which could hurt the fund’s yield or share price. Below investment-grade bonds (junk bonds) involve greater credit risk, are more volatile, involve greater risk of price declines and may be more susceptible to economic downturns than investment-grade securities.
• Equity Risk. The prices of equity securities rise and fall daily. These price movements may result from factors affecting individual companies, industries or the securities market as a whole. In addition, the equity market tends to move in cycles, which may cause stock prices to fall over short or extended periods of time.
• Large-, Mid- and Small-Cap Risk. Stocks of different market capitalizations tend to go in and out of favor based on market and economic conditions. Historically, small- and mid-cap stocks tend to be more volatile than large-cap stocks, and small-cap stocks have been riskier than large- and mid-cap stocks. During a period when stocks of a particular market capitalization fall behind other types of investments—bonds or stocks of another capitalization range, for instance—underlying fund’s large-, mid- or small-cap holdings could reduce performance.
• Money Market Fund Risk. The funds may invest in underlying money market funds that either seek to maintain a stable $1 net asset value (“stable share price money market funds”) or have a share price that fluctuates (“variable share price money market funds”). Although an underlying stable share price money market fund seeks to maintain a stable $1 net asset value, it is possible to lose money by investing in such a money market fund. Because the share price of an underlying variable share price money market fund will fluctuate, when the fund sells the shares it owns they may be worth more or less than what the fund originally paid for them. In addition, neither type of money market fund is designed to offer capital appreciation. Effective October 14, 2016, certain underlying money market funds may impose a fee upon the sale of shares if such fund’s liquidity falls below required minimum standards.
• Foreign Investment Risk. An underlying fund’s investments in securities of foreign issuers may involve certain risks that are greater than those associated with investments in securities of U.S. issuers. These include risks of adverse changes in foreign economic, political, regulatory and other conditions; changes in currency exchange rates or exchange control regulations (including limitations on currency movements and exchanges); the imposition of economic sanctions or other government restrictions; differing accounting, auditing, financial reporting and legal standards and practices; differing securities market structures; and higher transaction costs. These risks may negatively impact the value of liquidity of the underlying fund’s investments, and could impair the underlying fund’s ability to meet its investment objective or invest in accordance with its investment strategy.
• Emerging Markets Risk. Emerging market countries may be more likely to experience political turmoil or rapid changes in market or economic conditions than more developed countries. Emerging market countries often have less uniformity in accounting and reporting requirements and greater risk associated with the custody of securities. In addition, the financial stability of issuers (including governments) in emerging market countries may be more precarious than in other countries. As a result, there will tend to be an increased risk of price volatility associated with an underlying fund’s investments in emerging market countries and, at times, it may be difficult to value such investments.
• Derivatives Risk. An underlying fund’s use of derivative instruments involves risks different from, or possibly greater than, the risks associated with investing directly in securities and other traditional investments. An underlying fund’s use of derivatives could reduce the underlying fund's performance, increase volatility and could cause an underlying fund to lose more than the initial amount invested. In addition, investments in derivatives may involve leverage, which means a small percentage of assets invested in derivatives can have a disproportionately large impact on an underlying fund. However, these risks are less severe when the underlying fund uses derivatives for hedging rather than to enhance the underlying fund’s returns or as a substitute for a position or security.
• Leverage Risk. Certain underlying fund transactions, such as derivatives, short sales, reverse repurchase agreements, and mortgage dollar rolls, may give rise to a form of leverage and may expose an underlying fund to greater risk. Leverage tends to magnify the effect of any decrease or increase in the value of an underlying fund’s portfolio securities, which means even a small amount of leverage can have a disproportionately large impact on the underlying fund.
• Liquidity Risk. An underlying fund may be unable to sell certain securities, such as illiquid securities, readily at a favorable time or price, or an underlying fund may have to sell them at a loss.
Schwab Target Index Funds | Semiannual Report
Schwab Target Index Funds
Financial Notes, unaudited (continued)
3. Risk Factors (continued):
• Portfolio Turnover Risk. Certain of the underlying funds may buy and sell portfolio securities actively. If they do, their portfolio turnover rate and transaction costs will rise, which may lower the underlying fund’s performance and may increase the likelihood of capital gain distributions.
Please refer to the funds’ prospectus for a more complete description of the principal risks of investing in the funds.
4. Affiliates and Affiliated Transactions:
Charles Schwab Investment Management, Inc. (CSIM or the investment adviser), a wholly owned subsidiary of The Charles Schwab Corporation, serves as each fund’s investment adviser and administrator pursuant to an Investment Advisory and Administration Agreement between CSIM and the trust.
For its advisory and administrative services to the funds, CSIM is entitled to receive an annual fee of 0.08%, payable monthly, based on a percentage of each fund’s average daily net assets.
The Board has adopted a Shareholder Servicing Plan (the Plan) on behalf of the funds. The Plan enables each fund to bear expenses relating to the provision by financial intermediaries, including Charles Schwab & Co., Inc. (a broker-dealer affiliate of CSIM, Schwab) (together, “service providers”), of certain account maintenance, customer liaison and shareholder services to the current shareholders of the funds.
Pursuant to the Plan, each fund’s Investor Shares are subject to an annual shareholder servicing fee up to 0.05%. Each fund’s Institutional Shares are not subject to any fee under the Plan. The shareholder servicing fee paid to a particular service provider is made pursuant to its written agreement with Schwab, as distributor of the funds (or, in the case of payments made to Schwab acting as a service provider, pursuant to Schwab’s written agreement with the funds), and a fund will pay no more than 0.05% of the average annual daily net asset value of the fund’s Investor Shares owned by shareholders holding shares through such service provider. Payments under the Plan are made as described above without regard to whether the fee is more or less than the service provider’s actual cost of providing the services, and if more, such excess may be retained as profit by the service provider.
Although these agreements specify certain fees for these services, CSIM and its affiliates have made an additional agreement with the funds, for so long as CSIM serves as the investment adviser to the funds, which may only be amended or terminated with the approval of the Board, to maintain the “net operating expenses” of each of the funds (including shareholder servicing fees and acquired fund fees and expenses, but excluding interest, taxes and certain non-routine expenses) as follows:
| Investor Shares | 0.13% |
| Institutional Shares | 0.08% |
The funds may engage in certain transactions involving related parties. Pursuant to an exemptive order issued by the SEC, the funds may invest in other related funds. As of September 30, 2016, each Schwab Target Index Fund’s ownership percentages of other related funds' shares are:
| Underlying Funds | Schwab
Target
2010
Index
Fund | Schwab
Target
2015
Index
Fund | Schwab
Target
2020
Index
Fund | Schwab
Target
2025
Index
Fund | Schwab
Target
2030
Index
Fund | Schwab
Target
2035
Index
Fund | Schwab
Target
2040
Index
Fund | Schwab
Target
2045
Index
Fund | Schwab
Target
2050
Index
Fund | Schwab
Target
2055
Index
Fund | Schwab
Target
2060
Index
Fund |
| Schwab Emerging Markets Equity ETF | —% | —% | 0.0%* | 0.0%* | 0.0%* | 0.0%* | 0.0%* | 0.0%* | 0.0%* | 0.0%* | 0.0%* |
| Schwab International Equity ETF | 0.0%* | 0.0%* | 0.0%* | 0.0%* | 0.0%* | 0.0%* | 0.0%* | 0.0%* | 0.0%* | 0.0%* | 0.0%* |
| Schwab Short-Term U.S. Treasury ETF | 0.0%* | 0.0%* | 0.0%* | 0.0%* | 0.0%* | 0.0%* | 0.0%* | 0.0%* | 0.0%* | 0.0%* | 0.0%* |
| Schwab U.S. Aggregate Bond ETF | 0.0%* | 0.0%* | 0.0%* | 0.0%* | 0.0%* | 0.0%* | 0.0%* | 0.0%* | 0.0%* | 0.0%* | 0.0%* |
| Schwab U.S. Large-Cap ETF | 0.0%* | 0.0%* | 0.0%* | 0.0%* | 0.0%* | 0.0%* | 0.0%* | 0.0%* | 0.0%* | 0.0%* | 0.0%* |
| Schwab U.S. REIT ETF | 0.0%* | 0.0%* | 0.0%* | 0.0%* | 0.0%* | 0.0%* | 0.0%* | 0.0%* | 0.0%* | 0.0%* | 0.0%* |
| Schwab U.S. Small-Cap ETF | 0.0%* | 0.0%* | 0.0%* | 0.0%* | 0.0%* | 0.0%* | 0.0%* | 0.0%* | 0.0%* | 0.0%* | 0.0%* |
| Schwab U.S. TIPS ETF | 0.0%* | 0.0%* | 0.0%* | 0.0%* | —% | —% | —% | —% | —% | —% | —% |
| Schwab Variable Share Price Money Fund, Ultra Shares | 0.0%* | 0.0%* | 0.0%* | 0.0%* | 0.0%* | —% | —% | —% | —% | —% | —% |
Schwab Target Index Funds | Semiannual Report
Schwab Target Index Funds
Financial Notes, unaudited (continued)
4. Affiliates and Affiliated Transactions (continued):
Below is a summary of the funds’ transactions with their affiliated underlying funds during the period ended September 30, 2016:
Schwab Target 2010 Index Fund:
| Underlying Funds | Balance
of Shares
Held at
8/25/16(a) | Gross
Purchases | Gross
Sales | Balance
of Shares
Held at
9/30/16 | Market
Value
at
9/30/16 | | Realized
Gains (Losses)
8/25/16(a)
to 9/30/16 | | Distributions
Received*
8/25/16(a)
to 9/30/16 |
| Schwab International Equity ETF | — | 1,346 | — | 1,346 | $38,751 | | $— | | $— |
| Schwab Short-Term U.S. Treasury ETF | — | 663 | — | 663 | 33,674 | | — | | 23 |
| Schwab U.S. Aggregate Bond ETF | — | 3,035 | — | 3,035 | 162,889 | | — | | 304 |
| Schwab U.S. Large-Cap ETF | — | 1,948 | — | 1,948 | 100,556 | | — | | 354 |
| Schwab U.S. REIT ETF | — | 100 | — | 100 | 4,265 | | — | | 23 |
| Schwab U.S. Small-Cap ETF | — | 114 | — | 114 | 6,561 | | — | | 21 |
| Schwab U.S. TIPS ETF | — | 440 | — | 440 | 25,115 | | — | | — |
| Schwab Variable Share Price Money Fund, Ultra Shares | — | 16,000 | — | 16,000 | 16,004 | | — | | 6 |
| Total | | | | | $387,815 | | $ — | | $731 |
Schwab Target 2015 Index Fund:
| Underlying Funds | Balance
of Shares
Held at
8/25/16(a) | Gross
Purchases | Gross
Sales | Balance
of Shares
Held at
9/30/16 | Market
Value
at
9/30/16 | | Realized
Gains (Losses)
8/25/16(a)
to 9/30/16 | | Distributions
Received*
8/25/16(a)
to 9/30/16 |
| Schwab U.S. Large-Cap ETF | — | 6,011 | — | 6,011 | $173,057 | | $— | | $1,259 |
| Schwab U.S. Small-Cap ETF | — | 2,652 | — | 2,652 | 134,695 | | — | | 75 |
| Schwab International Equity ETF | — | 12,571 | — | 12,571 | 674,686 | | — | | — |
| Schwab U.S. REIT ETF | — | 8,733 | — | 8,733 | 450,798 | | — | | 82 |
| Schwab U.S. Aggregate Bond ETF | — | 464 | — | 464 | 19,789 | | — | | 976 |
| Schwab U.S. TIPS ETF | — | 524 | — | 524 | 30,156 | | — | | — |
| Schwab Short-Term U.S. Treasury ETF | — | 1,804 | — | 1,804 | 102,972 | | — | | 71 |
| Schwab Variable Share Price Money Fund, Ultra Shares | — | 79,990 | — | 79,990 | 80,014 | | — | | 23 |
| Total | | | | | $1,666,167 | | $— | | $2,486 |
Schwab Target 2020 Index Fund:
| Underlying Funds | Balance
of Shares
Held at
8/25/16(a) | Gross
Purchases | Gross
Sales | Balance
of Shares
Held at
9/30/16 | Market
Value
at
9/30/16 | | Realized
Gains (Losses)
8/25/16(a)
to 9/30/16 | | Distributions
Received*
8/25/16(a)
to 9/30/16 |
| Schwab Emerging Markets Equity ETF | — | 283 | — | 283 | $6,526 | | $— | | $— |
| Schwab International Equity ETF | — | 4,067 | — | 4,067 | 117,089 | | — | | — |
| Schwab Short-Term U.S. Treasury ETF | — | 786 | — | 786 | 39,921 | | — | | 14 |
| Schwab U.S. Aggregate Bond ETF | — | 5,535 | — | 5,535 | 297,064 | | — | | 288 |
| Schwab U.S. Large-Cap ETF | — | 5,438 | — | 5,438 | 280,710 | | — | | 566 |
| Schwab U.S. REIT ETF | — | 292 | — | 292 | 12,454 | | — | | 35 |
| Schwab U.S. Small-Cap ETF | — | 362 | — | 362 | 20,833 | | — | | 39 |
| Schwab U.S. TIPS ETF | — | 418 | — | 418 | 23,859 | | — | | — |
| Schwab Variable Share Price Money Fund, Ultra Shares | — | 26,995 | — | 26,995 | 27,003 | | — | | 6 |
| Total | | | | | $825,459 | | $— | | $948 |
Schwab Target Index Funds | Semiannual Report
Schwab Target Index Funds
Financial Notes, unaudited (continued)
4. Affiliates and Affiliated Transactions (continued):
Schwab Target 2025 Index Fund:
| Underlying Funds | Balance
of Shares
Held at
8/25/16(a) | Gross
Purchases | Gross
Sales | Balance
of Shares
Held at
9/30/16 | Market
Value
at
9/30/16 | | Realized
Gains (Losses)
8/25/16(a)
to 9/30/16 | | Distributions
Received*
8/25/16(a)
to 9/30/16 |
| Schwab Emerging Markets Equity ETF | — | 1,767 | — | 1,767 | $40,747 | | $ — | | $ — |
| Schwab International Equity ETF | — | 16,155 | — | 16,155 | 465,102 | | — | | — |
| Schwab Short-Term U.S. Treasury ETF | — | 1,383 | — | 1,383 | 70,242 | | — | | 13 |
| Schwab U.S. Aggregate Bond ETF | — | 15,632 | (583) | 15,049 | 807,680 | | (10 ) | | 397 |
| Schwab U.S. Large-Cap ETF | — | 21,635 | (793) | $20,842 | 1,075,864 | | 128 | | $1,779 |
| Schwab U.S. REIT ETF | — | 1,186 | — | 1,186 | 50,583 | | — | | 130 |
| Schwab U.S. Small-Cap ETF | — | 1,582 | — | 1,582 | 91,044 | | — | | 138 |
| Schwab U.S. TIPS ETF | — | 372 | — | 372 | 21,234 | | — | | — |
| Schwab Variable Share Price Money Fund, Ultra Shares | — | 49,988 | — | 49,988 | 50,003 | | — | | 7 |
| Total | | | | | $2,672,499 | | $118 | | $2,464 |
Schwab Target 2030 Index Fund:
| Underlying Funds | Balance
of Shares
Held at
8/25/16(a) | Gross
Purchases | Gross
Sales | Balance
of Shares
Held at
9/30/16 | Market
Value
at
9/30/16 | | Realized
Gains (Losses)
8/25/16(a)
to 9/30/16 | | Distributions
Received*
8/25/16(a)
to 9/30/16 |
| Schwab Emerging Markets Equity ETF | — | 2,014 | — | 2,014 | $46,443 | | $ — | | $ — |
| Schwab International Equity ETF | — | 14,898 | — | 14,898 | 428,913 | | — | | — |
| Schwab Short-Term U.S. Treasury ETF | — | 672 | — | 672 | 34,131 | | — | | 17 |
| Schwab U.S. Aggregate Bond ETF | — | 9,810 | — | 9,810 | 526,503 | | — | | 718 |
| Schwab U.S. Large-Cap ETF | — | 18,459 | — | 18,459 | 952,854 | | — | | 3,216 |
| Schwab U.S. REIT ETF | — | 1,186 | — | 1,186 | 50,583 | | — | | 268 |
| Schwab U.S. Small-Cap ETF | — | 1,604 | — | 1,604 | 92,310 | | — | | 288 |
| Schwab Variable Share Price Money Fund, Ultra Shares | — | 15,000 | — | 15,000 | 15,004 | | — | | 6 |
| Total | | | | | $2,146,741 | | $ — | | $4,513 |
Schwab Target 2035 Index Fund:
| Underlying Funds | Balance
of Shares
Held at
8/25/16(a) | Gross
Purchases | Gross
Sales | Balance
of Shares
Held at
9/30/16 | Market
Value
at
9/30/16 | | Realized
Gains (Losses)
8/25/16(a)
to 9/30/16 | | Distributions
Received*
8/25/16(a)
to 9/30/16 |
| Schwab Emerging Markets Equity ETF | — | 3,080 | (113) | 2,967 | $68,419 | | ($7) | | $— |
| Schwab International Equity ETF | — | 19,767 | (724) | 19,043 | 548,248 | | (122) | | — |
| Schwab Short-Term U.S. Treasury ETF | — | 524 | (19) | 505 | 25,649 | | (1) | | 5 |
| Schwab U.S. Aggregate Bond ETF | — | 9,003 | (458) | 8,545 | 458,610 | | (10) | | 260 |
| Schwab U.S. Large-Cap ETF | — | 23,985 | (1,211) | 22,774 | 1,175,594 | | 193 | | 2,806 |
| Schwab U.S. REIT ETF | — | 1,663 | (58) | 1,605 | 68,454 | | (5) | | 255 |
| Schwab U.S. Small-Cap ETF | — | 2,309 | (83) | 2,226 | 128,106 | | 2 | | 280 |
| Total | | | | | $2,473,080 | | $50 | | $3,606 |
Schwab Target Index Funds | Semiannual Report
Schwab Target Index Funds
Financial Notes, unaudited (continued)
4. Affiliates and Affiliated Transactions (continued):
Schwab Target 2040 Index Fund:
| Underlying Funds | Balance
of Shares
Held at
8/25/16(a) | Gross
Purchases | Gross
Sales | Balance
of Shares
Held at
9/30/16 | Market
Value
at
9/30/16 | | Realized
Gains (Losses)
8/25/16(a)
to 9/30/16 | | Distributions
Received*
8/25/16(a)
to 9/30/16 |
| Schwab Emerging Markets Equity ETF | — | 2,325 | — | 2,325 | $53,615 | | $ — | | $ — |
| Schwab International Equity ETF | — | 13,289 | — | 13,289 | 382,590 | | — | | — |
| Schwab Short-Term U.S. Treasury ETF | — | 191 | — | 191 | 9,701 | | — | | 3 |
| Schwab U.S. Aggregate Bond ETF | — | 3,766 | — | 3,766 | 202,121 | | — | | 168 |
| Schwab U.S. Large-Cap ETF | — | 15,373 | — | 15,373 | 793,554 | | — | | 2,276 |
| Schwab U.S. REIT ETF | — | 1,173 | — | 1,173 | 50,029 | | — | | 221 |
| Schwab U.S. Small-Cap ETF | — | 1,653 | — | 1,653 | 95,130 | | — | | 249 |
| Total | | | | | $1,586,740 | | $ — | | $2,917 |
Schwab Target 2045 Index Fund:
| Underlying Funds | Balance
of Shares
Held at
8/25/16(a) | Gross
Purchases | Gross
Sales | Balance
of Shares
Held at
9/30/16 | Market
Value
at
9/30/16 | | Realized
Gains (Losses)
8/25/16(a)
to 9/30/16 | | Distributions
Received*
8/25/16(a)
to 9/30/16 |
| Schwab Emerging Markets Equity ETF | — | 2,149 | (51) | 2,098 | $48,380 | | $6 | | $ — |
| Schwab International Equity ETF | — | 11,308 | (133) | 11,175 | 321,728 | | 1 | | — |
| Schwab Short-Term U.S. Treasury ETF | — | 107 | — | 107 | 5,434 | | — | | 2 |
| Schwab U.S. Aggregate Bond ETF | — | 2,189 | — | 2,189 | 117,484 | | — | | 141 |
| Schwab U.S. Large-Cap ETF | — | 12,721 | (41) | 12,680 | 654,542 | | — | | 2,110 |
| Schwab U.S. REIT ETF | — | 1,005 | — | 1,005 | 42,863 | | — | | 217 |
| Schwab U.S. Small-Cap ETF | — | 1,433 | — | 1,433 | 82,469 | | — | | 245 |
| Total | | | | | $1,272,900 | | $7 | | $2,715 |
Schwab Target 2050 Index Fund:
| Underlying Funds | Balance
of Shares
Held at
8/25/16(a) | Gross
Purchases | Gross
Sales | Balance
of Shares
Held at
9/30/16 | Market
Value
at
9/30/16 | | Realized
Gains (Losses)
8/25/16(a)
to 9/30/16 | | Distributions
Received*
8/25/16(a)
to 9/30/16 |
| Schwab Emerging Markets Equity ETF | — | 1,516 | (84) | 1,432 | $33,022 | | ($29) | | $ — |
| Schwab International Equity ETF | — | 7,906 | (442) | 7,464 | 214,888 | | (131) | | — |
| Schwab Short-Term U.S. Treasury ETF | — | 43 | — | 43 | 2,184 | | — | | 1 |
| Schwab U.S. Aggregate Bond ETF | — | 1,137 | (74) | 1,063 | 57,051 | | (14) | | 72 |
| Schwab U.S. Large-Cap ETF | — | 8,849 | (540) | 8,309 | 428,911 | | (318) | | 1,391 |
| Schwab U.S. REIT ETF | — | 726 | (51) | 675 | 28,789 | | (46) | | 144 |
| Schwab U.S. Small-Cap ETF | — | 1,047 | (63) | 984 | 56,629 | | (29) | | 165 |
| Total | | | | | $821,474 | | ($567) | | $1,773 |
Schwab Target Index Funds | Semiannual Report
Schwab Target Index Funds
Financial Notes, unaudited (continued)
4. Affiliates and Affiliated Transactions (continued):
Schwab Target 2055 Index Fund:
| Underlying Funds | Balance
of Shares
Held at
8/25/16(a) | Gross
Purchases | Gross
Sales | Balance
of Shares
Held at
9/30/16 | Market
Value
at
9/30/16 | | Realized
Gains (Losses)
8/25/16(a)
to 9/30/16 | | Distributions
Received*
8/25/16(a)
to 9/30/16 |
| Schwab Emerging Markets Equity ETF | — | 1,121 | — | 1,121 | $25,850 | | $— | | $— |
| Schwab International Equity ETF | — | 5,619 | — | 5,619 | 161,771 | | — | | — |
| Schwab Short-Term U.S. Treasury ETF | — | 16 | — | 16 | 813 | | — | | 1 |
| Schwab U.S. Aggregate Bond ETF | — | 535 | — | 535 | 28,713 | | — | | 39 |
| Schwab U.S. Large-Cap ETF | — | 6,227 | — | 6,227 | 321,438 | | — | | 943 |
| Schwab U.S. REIT ETF | — | 562 | — | 562 | 23,970 | | — | | 98 |
| Schwab U.S. Small-Cap ETF | — | 761 | — | 761 | 43,795 | | — | | 115 |
| Total | | | | | $606,350 | | $— | | $1,196 |
Schwab Target 2060 Index Fund:
| Underlying Funds | Balance
of Shares
Held at
8/25/16(a) | Gross
Purchases | Gross
Sales | Balance
of Shares
Held at
9/30/16 | Market
Value
at
9/30/16 | | Realized
Gains (Losses)
8/25/16(a)
to 9/30/16 | | Distributions
Received*
8/25/16(a)
to 9/30/16 |
| Schwab Emerging Markets Equity ETF | — | 1,221 | — | 1,221 | $28,157 | | $— | | $— |
| Schwab International Equity ETF | — | 5,999 | — | 5,999 | 172,711 | | — | | — |
| Schwab Short-Term U.S. Treasury ETF | — | 14 | — | 14 | 711 | | — | | 1 |
| Schwab U.S. Aggregate Bond ETF | — | 515 | — | 515 | 27,640 | | — | | 35 |
| Schwab U.S. Large-Cap ETF | — | 6,632 | — | 6,632 | 342,344 | | — | | 1,137 |
| Schwab U.S. REIT ETF | — | 543 | — | 543 | 23,159 | | — | | 120 |
| Schwab U.S. Small-Cap ETF | — | 816 | — | 816 | 46,961 | | — | | 142 |
| Total | | | | | $641,683 | | $— | | $1,435 |
| * | Distributions received include distributions from net investment income and capital gains, if any, from the underlying funds. |
| (a) | Commencement of operations. |
Pursuant to an exemptive order issued by the SEC, the funds may enter into interfund borrowing and lending transactions with other funds in the Fund Complex (for definition refer to Trustees and Officers section). All loans are for temporary or emergency purposes and the interest rate to be charged will be the average of the overnight repurchase agreement rate and the short-term bank loan rate. All loans are subject to numerous conditions designed to ensure fair and equitable treatment of all participating funds/portfolios. The interfund lending facility is subject to the oversight and periodic review by the Board. The funds had no interfund borrowing or lending activity during the period.
Schwab Target Index Funds | Semiannual Report
Schwab Target Index Funds
Financial Notes, unaudited (continued)
4. Affiliates and Affiliated Transactions (continued):
Certain accounts or CSIM affiliates may from time to time own (beneficially) or control a significant percentage of a fund’s shares. As of September 30, 2016, shareholder ownership of each fund’s outstanding shares was as follows:
| | CSIM Affiliated
Ownership %* | Number of Unaffiliated
Shareholder Accounts
Greater than 10% |
| Schwab Target 2010 Index Fund | 100% | - |
| Schwab Target 2015 Index Fund | 24% | 2 (owning 53% and 14%) |
| Schwab Target 2020 Index Fund | 48% | 1 (owning 13%) |
| Schwab Target 2025 Index Fund | 15% | 3 (owning 16%, 13% and 10%) |
| Schwab Target 2030 Index Fund | 18% | 3 (owning 19%, 11% and 11%) |
| Schwab Target 2035 Index Fund | 16% | 2 (owning 18% and 12%) |
| Schwab Target 2040 Index Fund | 25% | 2 (owning 19% and 12%) |
| Schwab Target 2045 Index Fund | 31% | 1 (owning 17%) |
| Schwab Target 2050 Index Fund | 48% | - |
| Schwab Target 2055 Index Fund | 66% | 1 (owning 10%) |
| Schwab Target 2060 Index Fund | 62% | 1 (owning 16%) |
| * | The CSIM affiliated ownership percentage is related to seed capital invested on the first day of operations to assist the funds in meeting their investment objectives, overtime this ownership percentage is expected to decrease. |
5. Board of Trustees:
The Board may include people who are officers and/or directors of CSIM or its affiliates. Federal securities law limits the percentage of such “interested persons” who may serve on a trust’s board, and the trust was in compliance with these limitations throughout the report period. The funds do not pay any interested or non-interested trustees (independent trustees). The independent trustees are paid by CSIM. For information regarding the trustees, please refer to the Trustees and Officers table at the end of this report.
6. Borrowing from Banks:
Effective October 6, 2016, the funds became participants with other U.S. registered investment companies managed by CSIM in a joint, syndicated, committed $555 million line of credit (The Credit Facility), which matures on October 5, 2017. Under the terms of the Credit Facility, in addition to the interest charged on any borrowings by a fund, each fund pays a commitment fee of 0.15% per annum on its proportionate share of the unused portion of the Credit Facility.
The funds also have access to custodian overdraft facilities. A fund may have utilized the overdraft facility and incurred an interest expense, which is disclosed on the fund’s Statement of Operations, if any. The interest expense is determined based on a negotiated rate above the current Federal Funds Rate.
Schwab Target Index Funds | Semiannual Report
Schwab Target Index Funds
Financial Notes, unaudited (continued)
7. Purchases and Sales/Maturities of Investment Securities:
For the period ended September 30, 2016, purchases and sales/maturities of securities (excluding short-term obligations) were as follows:
| | Purchases of Securities | Sales/Maturities of Securities |
| Schwab Target 2010 Index Fund | $388,078 | $— |
| Schwab Target 2015 Index Fund | 1,665,388 | — |
| Schwab Target 2020 Index Fund | 824,992 | — |
| Schwab Target 2025 Index Fund | 2,740,559 | 72,516 |
| Schwab Target 2030 Index Fund | 2,149,880 | — |
| Schwab Target 2035 Index Fund | 2,581,721 | 118,981 |
| Schwab Target 2040 Index Fund | 1,585,605 | — |
| Schwab Target 2045 Index Fund | 1,279,133 | 7,214 |
| Schwab Target 2050 Index Fund | 873,103 | 52,328 |
| Schwab Target 2055 Index Fund | 606,056 | — |
| Schwab Target 2060 Index Fund | 642,122 | — |
8. Subsequent Events:
Management has determined there are no subsequent events or transactions through the date the financial statements were issued that would have materially impacted the financial statements as presented.
Schwab Target Index Funds | Semiannual Report
Schwab Target Index Funds
Investment Advisory Agreement Approval
Initial Approval of Investment Advisory Agreement
The Board of Trustees (the Board or the Trustees, as appropriate) called and held a meeting on June 1, 2016, in part, for the purpose of considering whether to appoint Charles Schwab Investment Management, Inc. (CSIM) as investment adviser to Schwab Target 2010 Index Fund, Schwab Target 2015 Index Fund, Schwab Target 2020 Index Fund, Schwab Target 2025 Index Fund, Schwab Target 2030 Index Fund, Schwab Target 2035 Index Fund, Schwab Target 2040 Index Fund, Schwab Target 2045 Index Fund, Schwab Target 2050 Index Fund, Schwab Target 2055 Index Fund Schwab Target 2060 Index Fund (the Funds) under the investment advisory agreement between Schwab Capital Trust (the Trust) and CSIM (the Agreement). In preparation for the meeting, the Board reviewed a variety of materials provided by CSIM with respect to the services to be provided to the Funds under the Agreement. In recognition of the fact that the Funds had not yet commenced operations, the Board also took into account the detailed information about other funds within the Trust that the Board reviews during the course of each year, including information that relates to fund operations and fund performance. The Independent Trustees receive advice from independent counsel to the Independent Trustees. In addition, the Independent Trustees met in executive session outside the presence of fund management and participated in question and answer sessions with representatives of CSIM.
At the meeting on June 1, 2016, the Board, including a majority of the Independent Trustees, approved the Agreement with respect to the Funds. The Board’s approval was based on consideration and evaluation of a variety of specific factors discussed at this meeting and/or at prior meetings of the Board, including:
| 1. | the nature, extent and quality of the services to be provided to the Funds under the Agreement, including the resources CSIM and its affiliates will dedicate to the Funds; |
| 2. | CSIM’s investment performance in managing other funds having relevant investment objectives and strategies; |
| 3. | the Funds’ estimated expenses and how those expenses compare to those of certain other comparable mutual funds; |
| 4. | the profitability of CSIM and its affiliates, including Charles Schwab & Co., Inc. (“Schwab”), with respect to management of other similar funds, including both direct and indirect benefits accruing to CSIM and its affiliates; and |
| 5. | the extent to which economies of scale would be realized as the Funds grow and whether fee levels in the Agreement relating to the Funds reflect those economies of scale for the benefit of Fund investors. |
Nature, Extent and Quality of Services. The Board considered the nature, extent and quality of the services to be provided by
CSIM to the Fund and the resources CSIM and its affiliates will dedicate to the Funds. In this regard, the Trustees evaluated, among other things, CSIM’s experience, track record, compliance program, resources dedicated to hiring and retaining qualified personnel, and information security resources. The Trustees also considered Schwab’s wide range of products, services, and channel alternatives such as investment research tools and Internet access and an array of account features that benefit the Funds and certain of their shareholders. The Trustees also considered Schwab’s reputation as a full service brokerage firm and its overall financial condition. Finally, the Trustees considered that the vast majority of the Funds’ shareholders are also brokerage clients of Schwab. Based on this evaluation, the Board concluded, within the context of its full deliberations that the nature, extent and quality of services to be provided by CSIM to the Funds and the resources CSIM and its affiliates will dedicate to the Funds supported approval of the Agreement with respect to the Funds.
Fund Performance. With regard to Fund performance, since the Funds had not commenced operations and therefore did not have any performance of their own, the Board considered performance of other funds advised by CSIM having comparable investment objectives in determining whether to approve the Agreement with respect to the Funds. The Trustees also considered both risk and shareholder risk expectations for the Funds. Based on this evaluation the Board concluded, within the context of its full deliberations, that the performance of CSIM supported approval of the Agreement with respect to the Funds.
Fund Expenses. With respect to the Funds’ expenses, the Trustees considered the rate of compensation called for by the Agreement, and the Funds’ estimated net operating expense ratio in comparison to those of other comparable mutual funds. The Trustees also considered CSIM’s and Schwab’s commitment to waive management and other fees to prevent total Fund expenses from exceeding a specified cap. The Trustees also considered CSIM’s contractual commitment to keep each Fund’s expense cap for so long as CSIM serves as the adviser to such Fund. Following such evaluation, the Board concluded, within the context of its full deliberations, that the expenses of the Fund are reasonable and supported approval of the Agreement with respect to the Funds.
Profitability. With regard to profitability, the Trustees considered the compensation flowing to CSIM and its affiliates directly or indirectly. The Trustees also considered any other benefits to be derived by CSIM from its relationship with the Funds. The Trustees considered whether the compensation and profitability under the Agreement and other service agreements were reasonable and justified in light of the quality of all services rendered to the Funds by CSIM and its affiliates.
Schwab Target Index Funds | Semiannual Report
Schwab Target Index Funds
Based on this evaluation, the Board concluded, within the context of its full deliberations, that the expected profitability of CSIM, albeit uncertain, is reasonable and supported approval of the Agreement with respect to the Funds.
Economies of Scale. Recognizing that the Funds had not yet commenced operations and had no assets, the Trustees considered the possible development of any economies of scale through various efficiencies that may result from increases in the Funds’ assets and whether those could be expected to be passed along to the Funds’ shareholders. Based on this evaluation, the Board concluded, within the context of its full deliberations, that the Funds may be expected to obtain reasonable benefit from economies of scale if such economies develop.
In the course of their deliberations, the Trustees did not identify any particular information or factor that was all important or controlling. Based on the Trustees’ deliberation and their evaluation of the information described above, the Board, including a majority of the Independent Trustees, unanimously approved the Agreement as it relates to the Funds and concluded that the compensation under the Agreement relating to the Funds is fair and reasonable in light of such services and expenses and such other matters as the Trustees have considered to be relevant in the exercise of their reasonable judgment.
Schwab Target Index Funds | Semiannual Report
Schwab Target Index Funds
Trustees and Officers
The tables below give information about the trustees and officers of Schwab Capital Trust, which includes the funds covered in this report. The “Fund Complex” includes The Charles Schwab Family of Funds, Schwab Capital Trust, Schwab Investments, Schwab Annuity Portfolios, Schwab Strategic Trust and Laudus Trust. The Fund Complex includes 108 funds.
The address for all trustees and officers is 211 Main Street, San Francisco, CA 94105. You can find more information about the trustees and officers in the funds’ Statement of Additional Information, which is available free by calling 1-877-824-5615.
| Independent Trustees |
Name, Year of Birth, and
Position(s) with the trust
(Terms of office, and
length of Time Served1) | Principal Occupations
During the Past Five Years | Number of
Portfolios in
Fund Complex
Overseen by
the Trustee | Other Directorships |
Robert W. Burns
1959
Trustee
(Trustee of Schwab Strategic Trust since 2009; The Charles Schwab Family of Funds, Schwab Investments, Schwab Capital Trust, Schwab Annuity Portfolios and Laudus Trust since 2016) | Retired/Private Investor (Jan. 2009 – present). Formerly, Managing Director, Pacific Investment Management Company, LLC (PIMCO) and President, PIMCO Funds. | 108 | Director, PS Business Parks, Inc. (2005 – 2012) |
John F. Cogan
1947
Trustee
(Trustee of The Charles Schwab Family of Funds, Schwab Investments, Schwab Capital Trust and Schwab Annuity Portfolios since 2008; Laudus Trust since 2010; Schwab Strategic Trust since 2016) | Senior Fellow, The Hoover Institution at Stanford University (Oct. 1979 – present); Senior Fellow, Stanford Institute for Economic Policy Research (2000 – present); Professor of Public Policy, Stanford University (1994 – 2015). | 108 | Director, Gilead Sciences, Inc. (2005 – present) |
Stephen Timothy Kochis
1946
Trustee
(Trustee of Schwab Strategic Trust since 2012; The Charles Schwab Family of Funds, Schwab Investments, Schwab Capital Trust, Schwab Annuity Portfolios and Laudus Trust since 2016) | CEO and Owner, Kochis Global (wealth management consulting) (May 2012 – present); Chairman and CEO, Aspiriant, LLC (wealth management) (Jan. 2008 – Apr. 2012). | 108 | None |
David L. Mahoney
1954
Trustee
(Trustee of The Charles Schwab Family of Funds, Schwab Investments, Schwab Capital Trust, Schwab Annuity Portfolios and Laudus Trust since 2011; Schwab Strategic Trust since 2016) | Private Investor. | 108 | Director, Symantec Corporation (2003 – present)
Director, Corcept Therapeutics Incorporated (2004 – present)
Director, Adamas Pharmaceuticals, Inc. (2009 – present) |
Schwab Target Index Funds | Semiannual Report
Schwab Target Index Funds
| Independent Trustees (continued) |
Name, Year of Birth, and
Position(s) with the trust
(Terms of office, and
length of Time Served1) | Principal Occupations
During the Past Five Years | Number of
Portfolios in
Fund Complex
Overseen by
the Trustee | Other Directorships |
Kiran M. Patel
1948
Trustee
(Trustee of The Charles Schwab Family of Funds, Schwab Investments, Schwab Capital Trust, Schwab Annuity Portfolios and Laudus Trust since 2011; Schwab Strategic Trust since 2016) | Retired. Executive Vice President and General Manager of Small Business Group, Intuit, Inc. (financial software and services firm for consumers and small businesses) (Dec. 2008 – Sept. 2013). | 108 | Director, KLA-Tencor Corporation (2008 – present) |
Kimberly S. Patmore
1956
Trustee
(Trustee of The Charles Schwab Family of Funds, Schwab Investments, Schwab Capital Trust, Schwab Annuity Portfolios, Schwab Strategic Trust and Laudus Trust since 2016) | Consultant, Patmore Management Consulting (management consulting) (2008 – present). | 108 | None |
Charles A. Ruffel
1956
Trustee
(Trustee of Schwab Strategic Trust since 2009; The Charles Schwab Family of Funds, Schwab Investments, Schwab Capital Trust, Schwab Annuity Portfolios and Laudus Trust since 2015) | Co-Chief Executive Officer, Kudu Investment Management, LLC (financial services) (Jan. 2015 – present); Partner, Kudu Advisors, LLC (financial services) (June 2008 – Jan. 2015); Advisor, Asset International, Inc. (publisher of financial services information) (Aug. 2008 – Jan. 2015). | 108 | None |
Gerald B. Smith
1950
Trustee
(Trustee of The Charles Schwab Family of Funds, Schwab Investments, Schwab Capital Trust and Schwab Annuity Portfolios since 2000; Laudus Trust since 2010; Schwab Strategic Trust since 2016) | Chairman, Chief Executive Officer and Founder of Smith Graham & Co. (investment advisors) (Mar. 1990 – present). | 108 | Director, Eaton (2012 – present)
Director and Chairman of the Audit Committee, Oneok Partners LP (2003 – 2013)
Director, Oneok, Inc. (2009 – 2013)
Lead Independent Director, Board of Cooper Industries (2002 – 2012) |
Joseph H. Wender
1944
Trustee
(Trustee of The Charles Schwab Family of Funds, Schwab Investments, Schwab Capital Trust and Schwab Annuity Portfolios since 2008; Laudus Trust since 2010; Schwab Strategic Trust since 2016) | Senior Consultant, Goldman Sachs & Co., Inc. (investment banking and securities firm) (Jan. 2008 – present); Partner, Colgin Partners, LLC (vineyards) (Feb. 1998 – present). | 108 | Board Member and Chairman of the Audit Committee, Ionis Pharmaceuticals (1994 – present)
Lead Independent Director and Chair of Audit Committee, OUTFRONT Media Inc. (2014 – present) |
Schwab Target Index Funds | Semiannual Report
Schwab Target Index Funds
| Interested Trustees |
Name, Year of Birth, and
Position(s) with the trust
(Terms of office, and
length of Time Served1) | Principal Occupations
During the Past Five Years | Number of
Portfolios in
Fund Complex
Overseen by
the Trustee | Other Directorships |
Walter W. Bettinger II2
1960
Chairman and Trustee
(Trustee of The Charles Schwab Family of Funds, Schwab Investments, Schwab Capital Trust and Schwab Annuity Portfolios since 2008; Schwab Strategic Trust since 2009; Laudus Trust since 2010) | Director, President and Chief Executive Officer, The Charles Schwab Corporation (Oct. 2008 – present); President and Chief Executive Officer (Oct. 2008 – present), Director (May 2008 – present), Charles Schwab & Co., Inc.; Director, Charles Schwab Bank (Apr. 2006 – present); and Director, Schwab Holdings, Inc. (May 2008 – present). | 108 | Director, The Charles Schwab Corporation (2008 – present) |
Marie A. Chandoha2
1961
Trustee
(Trustee of The Charles Schwab Family of Funds, Schwab Investments, Schwab Capital Trust, Schwab Annuity Portfolios, Schwab Strategic Trust and Laudus Trust since 2016) | Director, President and Chief Executive Officer (Dec. 2010 – present), Chief Investment Officer (Sept. 2010 – Oct. 2011), Charles Schwab Investment Management, Inc.; Trustee (Jan. 2016 – present), President, Chief Executive Officer (Dec. 2010 – present), and Chief Investment Officer (Sept. 2010 – Oct. 2011), Schwab Funds, Laudus Funds and Schwab ETFs; Director, Charles Schwab Worldwide Funds plc and Charles Schwab Asset Management (Ireland) Limited (Jan. 2011 – present); Global Head of Fixed Income Business Division, BlackRock, Inc. (formerly Barclays Global Investors) (Mar. 2007 – Aug. 2010). | 108 | None |
Joseph R. Martinetto2
1962
Trustee
(Trustee of The Charles Schwab Family of Funds, Schwab Investments, Schwab Capital Trust, Schwab Annuity Portfolios, Schwab Strategic Trust and Laudus Trust since 2016) | Senior Executive Vice President and Chief Financial Officer, The Charles Schwab Corporation and Charles Schwab & Co., Inc. (July 2015 – present); Executive Vice President and Chief Financial Officer of The Charles Schwab Corporation and Charles Schwab & Co., Inc. (May 2007 – July 2015); Director, Charles Schwab & Co., Inc. (May 2007 – present); Director (Apr. 2010 – present) and Chief Executive Officer (July 2013 – Apr. 2015), Charles Schwab Bank; Director, Executive Vice President and Chief Financial Officer, Schwab Holdings, Inc. (May 2007 – present). | 108 | None |
| Officers of the Trust |
Name, Year of Birth, and Position(s) with the trust
(Terms of office, and length of Time Served3) | Principal Occupations During the Past Five Years |
Marie A. Chandoha
1961
President and Chief Executive Officer
(Officer of The Charles Schwab Family of Funds, Schwab Investments, Schwab Capital Trust, Schwab Annuity Portfolios, Schwab Strategic Trust and Laudus Trust since 2010) | Director, President and Chief Executive Officer (Dec. 2010 – present), Chief Investment Officer (Sept. 2010 – Oct. 2011), Charles Schwab Investment Management, Inc.; Trustee (Jan. 2016 – present), President, Chief Executive Officer (Dec. 2010 – present), and Chief Investment Officer (Sept. 2010 – Oct. 2011), Schwab Funds, Laudus Funds and Schwab ETFs; Director, Charles Schwab Worldwide Funds plc and Charles Schwab Asset Management (Ireland) Limited (Jan. 2011 – present); Global Head of Fixed Income Business Division, BlackRock, Inc. (formerly Barclays Global Investors) (Mar. 2007 – Aug. 2010). |
Mark Fischer
1970
Treasurer and Chief Financial Officer
(Officer of The Charles Schwab Family of Funds, Schwab Investments, Schwab Capital Trust, Schwab Annuity Portfolios, Schwab Strategic Trust and Laudus Trust since 2013) | Treasurer and Chief Financial Officer, Schwab Funds, Laudus Funds and Schwab ETFs (Jan. 2016 – present); Assistant Treasurer, Schwab Funds and Laudus Funds (Dec. 2013 – Dec. 2015), Schwab ETFs (Nov. 2013 – Dec. 2015); Vice President, Charles Schwab Investment Management, Inc. (Oct. 2013 – present); Executive Director, J.P. Morgan Investor Services (Apr. 2011 – Sept. 2013); Assistant Treasurer, Massachusetts Financial Service Investment Management (May 2005 – Mar. 2011). |
Schwab Target Index Funds | Semiannual Report
Schwab Target Index Funds
| Officers of the Trust (continued) |
Name, Year of Birth, and Position(s) with the trust
(Terms of office, and length of Time Served3) | Principal Occupations During the Past Five Years |
George Pereira
1964
Senior Vice President and Chief Operating Officer
(Officer of The Charles Schwab Family of Funds, Schwab Investments, Schwab Capital Trust and Schwab Annuity Portfolios since 2004; Laudus Trust since 2006; Schwab Strategic Trust since 2009) | Senior Vice President and Chief Financial Officer (Nov. 2004 – present), Chief Operating Officer (Jan. 2011 – present), Charles Schwab Investment Management, Inc.; Senior Vice President and Chief Operating Officer (Jan. 2016 – present), Treasurer and Chief Financial Officer, Laudus Funds (June 2006 – Dec. 2015); Treasurer and Principal Financial Officer, Schwab Funds (Nov. 2004 – Dec. 2015) and Schwab ETFs (Oct. 2009 – Dec. 2015); Director, Charles Schwab Worldwide Funds plc and Charles Schwab Asset Management (Ireland) Limited (Apr. 2005 – present). |
Omar Aguilar
1970
Senior Vice President and Chief Investment Officer – Equities and Multi-Asset Strategies
(Officer of The Charles Schwab Family of Funds, Schwab Investments, Schwab Capital Trust, Schwab Annuity Portfolios, Schwab Strategic Trust and Laudus Trust since 2011) | Senior Vice President and Chief Investment Officer – Equities and Multi-Asset Strategies, Charles Schwab Investment Management, Inc. (Apr. 2011 – present); Senior Vice President and Chief Investment Officer – Equities, Schwab Funds, Laudus Funds and Schwab ETFs (June 2011 – present); Head of the Portfolio Management Group and Vice President of Portfolio Management, Financial Engines, Inc. (May 2009 – Apr. 2011); Head of Quantitative Equity, ING Investment Management (July 2004 – Jan. 2009). |
Brett Wander
1961
Senior Vice President and Chief Investment Officer – Fixed Income
(Officer of The Charles Schwab Family of Funds, Schwab Investments, Schwab Capital Trust, Schwab Annuity Portfolios, Schwab Strategic Trust and Laudus Trust since 2011) | Senior Vice President and Chief Investment Officer – Fixed Income, Charles Schwab Investment Management, Inc. (Apr. 2011 – present); Senior Vice President and Chief Investment Officer – Fixed Income, Schwab Funds, Laudus Funds and Schwab ETFs (June 2011 – present); Senior Managing Director, Global Head of Active Fixed-Income Strategies, State Street Global Advisors (Jan. 2008 – Oct. 2010); Director of Alpha Strategies Loomis, Sayles & Company (Apr. 2006 – Jan. 2008). |
David Lekich
1964
Chief Legal Officer and Secretary, Schwab Funds and Schwab ETFs
Vice President and Assistant Clerk, Laudus Funds
(Officer of The Charles Schwab Family of Funds, Schwab Investments, Schwab Capital Trust, Schwab Annuity Portfolios, Schwab Strategic Trust and Laudus Trust since 2011) | Senior Vice President (Sept. 2011 – present), Vice President (Mar. 2004 – Sept. 2011), Charles Schwab & Co., Inc.; Senior Vice President and Chief Counsel (Sept. 2011 – present), Vice President (Jan. 2011 – Sept. 2011), Charles Schwab Investment Management, Inc.; Secretary (Apr. 2011 – present) and Chief Legal Officer (Dec. 2011 – present), Schwab Funds; Vice President and Assistant Clerk, Laudus Funds (Apr. 2011 – present); Secretary (May 2011 – present) and Chief Legal Officer (Nov. 2011 – present), Schwab ETFs. |
Catherine MacGregor
1964
Vice President and Assistant Secretary, Schwab Funds and Schwab ETFs
Chief Legal Officer, Vice President and Clerk, Laudus Funds
(Officer of The Charles Schwab Family of Funds, Schwab Investments, Schwab Capital Trust, Schwab Annuity Portfolios and Laudus Trust since 2005; Schwab Strategic Trust since 2009) | Vice President, Charles Schwab & Co., Inc., Charles Schwab Investment Management, Inc. (July 2005 – present); Vice President (Dec. 2005 – present), Chief Legal Officer and Clerk (Mar. 2007 – present), Laudus Funds; Vice President (Nov. 2005 – present) and Assistant Secretary (June 2007 – present), Schwab Funds; Vice President and Assistant Secretary, Schwab ETFs (Oct. 2009 – present). |
| 1 | Each Trustee shall hold office until the election and qualification of his or her successor, or until he or she dies, resigns or is removed. The retirement policy requires that each independent trustee retire by December 31 of the year in which the Trustee turns 74 or the Trustee’s twentieth year of service as an independent trustee on any trust in the Fund Complex, whichever occurs first. |
| 2 | Mr. Bettinger, Ms. Chandoha, and Mr. Martinetto are Interested Trustees because they own stock of The Charles Schwab Corporation, the parent company of the investment adviser. |
| 3 | The President, Treasurer and Secretary/Clerk hold office until their respective successors are chosen and qualified or until he or she sooner dies, resigns, is removed or becomes disqualified. Each of the other officers serves at the pleasure of the Board. |
Schwab Target Index Funds | Semiannual Report
Schwab Target Index Funds
asset allocation The practice of dividing a portfolio among different asset classes, with each asset class assigned a particular percentage.
asset class A group of securities with similar structure and basic characteristics. Stocks, bonds and cash are the three main examples of asset classes.
Bloomberg Barclays U.S. Aggregate Bond Index A broad-based benchmark that measures the investment grade, U.S. dollar-denominated, fixed-rate taxable bond market, including Treasuries, government-related and corporate securities, mortgage-backed securities (agency fixed-rate and hybrid ARM pass-throughs), asset-backed securities, and commercial mortgage-backed securities.
Bloomberg Barclays U.S. Aggregate Intermediate Bond Index An index that represents securities that are SEC-registered, taxable, and dollar denominated. The index covers the U.S. investment grade fixed rate bond market, with index components for government and corporate securities, mortgage pass-through securities, and asset-backed securities.
Bloomberg Barclays U.S. Government/Credit: 1 – 5 Years Index An index that includes investment-grade government and corporate bonds that are denominated in U.S. dollars and have maturities of one to five years. Bonds are represented in the index in proportion to their market value.
Bloomberg Barclays U.S. TIPS (Treasury Inflation-Protected Securities) Index An index that measures the performance of fixed income securities with fixed-rate coupon payments that adjust for inflation, as measured by the Consumer Price Index for All Urban Consumers.
Bloomberg Barclays U.S. Treasury Bills 1 – 3 Months Index An index that includes all publicly issued zero-coupon U.S. Treasury Bills that have a remaining maturity of less than 3 months and more than 1 month, are rated investment grade, and have $250 million or more of outstanding face value.
bond A security representing a loan from the investor to the issuer. A bond typically pays interest at a fixed rate (the coupon rate) until a specified date (the maturity date), at which time the issuer returns the money borrowed (principal or face value) to the bondholder. Because of their structure, bonds are sometimes called “fixed income securities” or “debt securities.”
An individual bond is subject to the credit risk of the issuer. Changes in interest rates can affect a bond’s market value prior to call or maturity. There is no guarantee that a bond’s yield to call or maturity will provide a positive return over the rate of inflation.
bond fund A bond fund is subject to the same credit, interest rate, and inflation risks as bonds. In addition, a bond fund incurs ongoing fees and expenses. A bond fund’s net asset value will fluctuate with the price of the underlying bonds and the portfolio turnover activity; return of principal is not guaranteed.
cap, capitalization See “market cap.”
capital gain, capital loss the difference between the amount paid for an investment and its value at a later time. If the investment has been sold, the capital gain or loss is considered a realized gain or loss. If the investment is still held, the capital gain or loss is considered unrealized appreciation or depreciation.
Citigroup Non-U.S. Dollar World Government Bond Index An index that measures the total rate of return performance for the government bonds of 23 countries, excluding the U.S., with a remaining maturity of at least one year.
Dow Jones U.S. Total Stock Market Index An index that measures all U.S. equity securities with readily available prices.
expense ratio The amount that is taken from a mutual fund’s assets each year to cover the fund’s operating expenses. An expense ratio of 0.50% means that a fund’s expenses amount to half of one percent of its average net assets a year.
FTSE EPRA/NAREIT Global Index An index that is designed to provide a diverse representation of publicly traded equity real estate investment trusts (REITs) and listed property companies worldwide.
market cap, market capitalization The value of a company as determined by the total value of all shares of its stock outstanding.
MSCI EAFE (Europe, Australasia, Far East) Index A free float-adjusted market capitalization index that is designed to measure the equity market performance of developed markets, excluding the U.S. & Canada. The Net version of the index reflects reinvested dividends net of withholding taxes, but reflects no deductions for expenses or other taxes; returns are calculated applying dividend withholding rates applicable to non-resident persons who do not benefit from double taxation treaties.
MSCI Emerging Markets Index A free float-adjusted market capitalization index that is designed to measure equity market performance of emerging markets. The Net version of the index reflects reinvested dividends net of withholding taxes, but reflects no deductions for expenses or other taxes; returns are calculated applying dividend withholding rates applicable to non-resident persons who do not benefit from double taxation treaties.
net asset value (NAV) The value of one share of a mutual fund. NAV is calculated by taking the fund’s total assets, subtracting liabilities, and dividing by the number of shares outstanding.
outstanding shares, shares outstanding When speaking of a company or mutual fund, indicates all shares currently held by investors.
Russell 2000 Index An index that measures the performance of the small-cap segment of the U.S. equity universe. It includes approximately 2000 of the smallest securities based on a combination of their market cap and current index membership.
S&P 500 Index A market capitalization index that is designed to measure the performance of 500 leading publicly held companies in leading industries of the U.S. economy.
stock A share of ownership, or equity, in the issuing company.
Target 2010 Passive Composite Index A custom blended index developed by CSIM based on the Target 2010 Index Fund’s asset allocation glide schedule and will become more conservative as time elapses. Effective August 18, 2016, the composite is derived using the following portion allocations: 25.2% Dow Jones U.S. Large Cap Total Stock Market Index, 1.6% Dow Jones U.S. Small Cap Total Stock Market Index, 9.6% FTSE Developed ex-U.S. Index (Net), 1.1% Dow Jones U.S. Select REIT Index, 8.4% Bloomberg Barclays U.S. 1-3 Year Treasury Bond Index, 40.8% Bloomberg Barclays U.S. Aggregate Bond Index, 6.2% Bloomberg Barclays U.S. Treasury Inflation Protected
Schwab Target Index Funds | Semiannual Report
Schwab Target Index Funds
Securities (TIPS) Index, 7.0% Bloomberg Barclays 1-3 Month U.S. Treasury Bill Index. The components that make up the composite index may vary over time. The composite index represents target allocations for 2016. Percentages listed may not total to 100% due to rounding.
Target 2015 Passive Composite Index A custom blended index developed by CSIM based on the Target 2015 Index Fund’s asset allocation glide schedule and will become more conservative as time elapses. Effective August 18, 2016, the composite is derived using the following portion allocations: 26.5% Dow Jones U.S. Large Cap Total Stock Market Index, 1.8% Dow Jones U.S. Small Cap Total Stock Market Index, 10.2% FTSE Developed ex-U.S. Index (Net), 1.2% Dow Jones U.S. Select REIT Index, 8.0% Bloomberg Barclays U.S. 1-3 Year Treasury Bond Index, 39.7% Bloomberg Barclays U.S. Aggregate Bond Index, 6.0% Bloomberg Barclays U.S. Treasury Inflation Protected Securities (TIPS) Index, 6.6% Bloomberg Barclays 1-3 Month U.S. Treasury Bill Index. The components that make up the composite index may vary over time. The composite index represents target allocations for 2016. Percentages listed may not total to 100% due to rounding.
Target 2020 Passive Composite Index A custom blended index developed by CSIM based on the Target 2020 Index Fund’s asset allocation glide schedule and will become more conservative as time elapses. Effective August 18, 2016, the composite is derived using the following portion allocations: 33.2% Dow Jones U.S. Large Cap Total Stock Market Index, 2.5% Dow Jones U.S. Small Cap Total Stock Market Index, 13.8% FTSE Developed ex-U.S. Index (Net), 0.9% FTSE Emerging Index (Net), 1.5% Dow Jones U.S. Select REIT Index, 4.8% Bloomberg Barclays U.S. 1-3 Year Treasury Bond Index, 35.4% Bloomberg Barclays U.S. Aggregate Bond Index, 2.9% Bloomberg Barclays U.S. Treasury Inflation Protected Securities (TIPS) Index, 5.0% Bloomberg Barclays 1-3 Month U.S. Treasury Bill Index. The components that make up the composite index may vary over time. The composite index represents target allocations for 2016. Percentages listed may not total to 100% due to rounding.
Target 2025 Passive Composite Index A custom blended index developed by CSIM based on the Target 2025 Index Fund’s asset allocation glide schedule and will become more conservative as time elapses. Effective August 18, 2016, the composite is derived using the following portion allocations: 39.4% Dow Jones U.S. Large Cap Total Stock Market Index, 3.4% Dow Jones U.S. Small Cap Total Stock Market Index, 17.0% FTSE Developed ex-U.S. Index (Net), 1.5% FTSE Emerging Index (Net), 1.9% Dow Jones U.S. Select REIT Index, 2.6% Bloomberg Barclays U.S. 1-3 Year Treasury Bond Index, 29.8% Bloomberg Barclays U.S. Aggregate Bond Index, 0.8% Bloomberg Barclays U.S. Treasury Inflation Protected Securities (TIPS) Index, 3.7% Bloomberg Barclays 1-3 Month U.S. Treasury Bill Index. The components that make up the composite index may vary over time. The composite index represents target allocations for 2016. Percentages listed may not total to 100% due to rounding.
Target 2030 Passive Composite Index A custom blended index developed by CSIM based on the Target 2030 Index Fund’s asset allocation glide schedule and will become more conservative as time elapses. Effective August 18, 2016, the composite is derived using the following portion allocations: 43.4% Dow Jones U.S. Large Cap Total Stock Market Index, 4.2% Dow Jones U.S. Small Cap Total Stock Market Index, 19.6% FTSE Developed ex-U.S. Index (Net), 2.1% FTSE Emerging Index (Net), 2.3% Dow Jones U.S. Select REIT Index, 1.6% Bloomberg Barclays U.S. 1-3 Year Treasury Bond Index, 24.0% Bloomberg Barclays U.S. Aggregate Bond Index, 2.8% Bloomberg Barclays 1-3 Month U.S. Treasury Bill Index. The components that make up the composite index may vary over time. The composite index represents target allocations for 2016. Percentages listed may not total to 100% due to rounding.
Target 2035 Passive Composite Index A custom blended index developed by CSIM based on the Target 2030 Index Fund’s asset allocation glide schedule and will become more conservative as time elapses. Effective August 18, 2016, the composite is derived using the following portion allocations: 46.5% Dow Jones U.S. Large Cap Total Stock Market Index, 5.1% Dow Jones U.S. Small Cap Total Stock Market Index, 21.7% FTSE Developed ex-U.S. Index (Net), 2.7% FTSE Emerging Index (Net), 2.7% Dow Jones U.S. Select REIT Index, 1.0% Bloomberg Barclays U.S. 1-3 Year Treasury Bond Index, 18.1% Bloomberg Barclays U.S. Aggregate Bond Index, 2.1% Bloomberg Barclays 1-3 Month U.S. Treasury Bill Index. The components that make up the composite index may vary over time. The composite index represents target allocations for 2016. Percentages listed may not total to 100% due to rounding.
Target 2040 Passive Composite Index A custom blended index developed by CSIM based on the Target 2040 Index Fund’s asset allocation glide schedule and will become more conservative as time elapses. Effective August 18, 2016, the composite is derived using the following portion allocations: 49.3% Dow Jones U.S. Large Cap Total Stock Market Index, 5.9% Dow Jones U.S. Small Cap Total Stock Market Index, 23.8% FTSE Developed ex-U.S. Index (Net), 3.3% FTSE Emerging Index (Net), 3.1% Dow Jones U.S. Select REIT Index, 0.6% Bloomberg Barclays U.S. 1-3 Year Treasury Bond Index, 12.5% Bloomberg Barclays U.S. Aggregate Bond Index, 1.5% Bloomberg Barclays 1-3 Month U.S. Treasury Bill Index. The components that make up the composite index may vary over time. The composite index represents target allocations for 2016. Percentages listed may not total to 100% due to rounding.
Target 2045 Passive Composite Index A custom blended index developed by CSIM based on the Target 2045 Index Fund’s asset allocation glide schedule and will become more conservative as time elapses. Effective August 18, 2016, the composite is derived using the following portion allocations: 50.9% Dow Jones U.S. Large Cap Total Stock Market Index, 6.5% Dow Jones U.S. Small Cap Total Stock Market Index, 25.0% FTSE Developed ex-U.S. Index (Net), 3.8% FTSE Emerging Index (Net), 3.4% Dow Jones U.S. Select REIT Index, 0.4% Bloomberg Barclays U.S. 1-3 Year Treasury Bond Index, 9.1% Bloomberg Barclays U.S. Aggregate Bond Index, 1.1% Bloomberg Barclays 1-3 Month U.S. Treasury Bill Index. The components that make up the composite index may vary over time. The composite index represents target allocations for 2016. Percentages listed may not total to 100% due to rounding.
Target 2050 Passive Composite Index A custom blended index developed by CSIM based on the Target 2050 Index Fund’s asset allocation glide schedule and will become more conservative as time elapses. Effective August 18, 2016, the composite is derived using the following portion allocations: 51.9% Dow Jones U.S. Large Cap Total Stock Market Index, 6.8% Dow Jones U.S. Small Cap Total Stock Market Index, 25.8% FTSE Developed ex-U.S. Index (Net), 4.1% FTSE Emerging Index (Net), 3.5% Dow Jones U.S. Select REIT Index, 0.3% Bloomberg Barclays U.S. 1-3 Year Treasury Bond Index, 6.9% Bloomberg Barclays U.S. Aggregate Bond Index, 0.8% Bloomberg Barclays 1-3 Month U.S. Treasury Bill Index. The components that make up the composite index may vary over time. The composite index represents target allocations for 2016. Percentages listed may not total to 100% due to rounding.
Target 2055 Passive Composite Index A custom blended index developed by CSIM based on the Target 2055 Index Fund’s asset allocation glide schedule and will become more conservative as time elapses. Effective August 18, 2016, the composite is derived using the following portion allocations: 52.8% Dow Jones U.S. Large Cap Total Stock Market Index, 7.2% Dow Jones U.S. Small Cap Total Stock Market Index, 26.6% FTSE Developed ex-U.S. Index (Net), 4.3% FTSE Emerging Index (Net), 3.7% Dow Jones U.S. Select REIT Index, 0.2%
Schwab Target Index Funds | Semiannual Report
Schwab Target Index Funds
Bloomberg Barclays U.S. 1-3 Year Treasury Bond Index, 4.8% Bloomberg Barclays U.S. Aggregate Bond Index, 0.6% Bloomberg Barclays 1-3 Month U.S. Treasury Bill Index. The components that make up the composite index may vary over time. The composite index represents target allocations for 2016. Percentages listed may not total to 100% due to rounding.
Target 2060 Passive Composite Index A custom blended index developed by CSIM based on the Target 2060 Index Fund’s asset allocation glide schedule and will become more conservative as time elapses. Effective August 18, 2016, the composite is derived using the following portion allocations: 53.0% Dow Jones U.S. Large Cap Total Stock Market Index, 7.2% Dow Jones U.S. Small Cap Total Stock Market Index, 26.7% FTSE Developed ex-U.S. Index (Net), 4.4% FTSE Emerging Index (Net), 3.7% Dow Jones U.S. Select REIT Index, 0.2% Bloomberg Barclays U.S. 1-3 Year Treasury Bond Index, 4.3%
Bloomberg Barclays U.S. Aggregate Bond Index, 0.5% Bloomberg Barclays 1-3 Month U.S. Treasury Bill Index. The components that make up the composite index may vary over time. The composite index represents target allocations for 2016. Percentages listed may not total to 100% due to rounding.
total return The percentage that an investor would have earned or lost on an investment in the fund assuming dividends and distributions were reinvested.
weighted average For mutual funds, an average that gives the same weight to each security as the security represents in the fund’s portfolio.
yield The income paid out by an investment, expressed as a percentage of the investment’s market value.
Schwab Target Index Funds | Semiannual Report
Schwab Target Index Funds
Our straightforward approach sets us apart.
As one of the nation’s largest asset managers, our goal is to provide investors with a diverse selection of foundational products that aim to deliver consistent performance at a competitive cost. The list below shows all currently available Schwab Funds.
An investor should consider a fund’s investment objectives, risks, charges and expenses carefully before investing or sending money. This and other important information can be found in the fund’s prospectus. Please call 1-877-824-5615 for a prospectus and brochure for any Schwab Fund. Please read the prospectus carefully before you invest. This report must be preceded or accompanied by a current prospectus.
Proxy Voting Policies, Procedures and Results
A description of the proxy voting policies and procedures used to determine how to vote proxies on behalf of the funds is available without charge, upon request, by visiting the Schwab Funds’ website at www.csimfunds.com/schwabfunds_prospectus, the SEC’s website at www.sec.gov, or by contacting Schwab Funds at 1-877-824-5615.
Information regarding how a fund voted proxies relating to portfolio securities during the most recent twelve-month period ended June 30 is available, without charge, by visiting the fund’s website at www.csimfunds.com/schwabfunds_prospectus or the SEC’s website at www.sec.gov.
The Schwab Funds Family®
Stock Funds
Schwab Core Equity Fund™
Schwab Dividend Equity Fund™
Schwab Large-Cap Growth Fund™
Schwab Small-Cap Equity Fund™
Schwab Hedged Equity Fund™
Schwab Health Care Fund™
Schwab® International Core Equity Fund
Schwab Fundamental US Large Company Index Fund
Schwab Fundamental US Small Company Index Fund
Schwab Fundamental International Large Company Index Fund
Schwab Fundamental International Small Company Index Fund
Schwab Fundamental Emerging Markets Large Company Index Fund
Schwab Fundamental Global Real Estate Index Fund
Schwab Global Real Estate Fund™
Schwab® S&P 500 Index Fund
Schwab 1000 Index® Fund
Schwab Small-Cap Index Fund®
Schwab Total Stock Market Index Fund®
Schwab International Index Fund®
Asset Allocation Funds
Schwab Balanced Fund™
Schwab MarketTrack All Equity Portfolio™
Schwab MarketTrack Growth Portfolio™
Schwab MarketTrack Balanced Portfolio™
Schwab MarketTrack Conservative Portfolio™
Schwab Target Funds
Schwab Target Index Funds
Schwab® Monthly Income Fund – Moderate Payout
Schwab® Monthly Income Fund – Enhanced Payout
Schwab® Monthly Income Fund – Maximum Payout
Bond Funds
Schwab Short-Term Bond Market Fund™
Schwab Intermediate-Term Bond Fund™
Schwab Total Bond Market Fund™
Schwab GNMA Fund™
Schwab® Treasury Inflation Protected Securities Index Fund
Schwab Tax-Free Bond Fund™
Schwab California Tax-Free Bond Fund™
Schwab Money Funds
Schwab offers an array of money market funds1. Choose from taxable or tax-advantaged alternatives. Some are linked to your eligible Schwab account to “sweep” cash balances automatically, subject to availability, when you’re between investments. Or, for your larger cash reserves, choose one of our Value Advantage Investments®.
Investment Adviser
Charles Schwab Investment Management, Inc.
211 Main Street, San Francisco, CA 94105
Funds
Schwab Funds®
1-877-824-5615
© 2016 Charles Schwab & Co., Inc. All rights reserved.
Member SIPC®
Printed on recycled paper.
| 1 | You could lose money by investing in a money market fund. All Schwab Money Funds with the exception of Schwab Variable Share Price Money Fund seek to preserve the value of your investment at $1.00 per share, but cannot guarantee they will do so. Effective October 14, 2016, all Schwab Money Funds with the exception of Schwab Government Money Fund, Schwab Retirement Government Money Fund, Schwab U.S. Treasury Money Fund, Schwab Treasury Obligations Money Fund and Schwab Government Money Market Portfolio may impose a fee upon the sale of your shares or may temporarily suspend your ability to sell shares if the fund’s liquidity falls below required minimums because of market conditions or other factors. An investment in a money market fund is not insured or guaranteed by the Federal Deposit Insurance Corporation or any other government agency. The money market fund's sponsor has no legal obligation to provide financial support to the fund, and you should not expect that the sponsor will provide financial support to the fund at any time. |
This page is intentionally left blank.
Item 2: Code of Ethics.
Not applicable to this semi-annual report.
Item 3: Audit Committee Financial Expert.
Not applicable to this semi-annual report.
Item 4: Principal Accountant Fees and Services.
Not applicable to this semi-annual report.
Item 5: Audit Committee of Listed Registrants.
Not applicable.
Item 6: Schedule of Investments.
The schedules of investments are included as part of the report to shareholders filed under Item 1 of this Form.
Item 7: Disclosure of Proxy Voting Policies and Procedures for Closed-End Management Investment Companies.
Not applicable.
Item 8: Portfolio Managers of Closed-End Management Investment Companies.
Not applicable.
Item 9: Purchases of Equity Securities by Closed-End Management Investment Company and Affiliated Purchasers.
Not applicable.
Item 10: Submission of Matters to a Vote of Security Holders.
Not applicable.
Item 11: Controls and Procedures.
| (a) | Based on their evaluation of Registrant’s disclosure controls and procedures, as of a date within 90 days of the filing date, Registrant’s Chief Executive Officer, Marie Chandoha and Registrant’s Chief Financial Officer, Mark Fischer, have concluded that Registrant’s disclosure controls and procedures are: (i) reasonably designed to ensure that information required to be disclosed in this report is appropriately communicated to Registrant’s officers to allow timely decisions regarding disclosures required in this report; (ii) reasonably designed to ensure that information required to be disclosed in this report is recorded, processed, summarized and reported in a timely manner; and (iii) are effective in achieving the goals described in (i) and (ii) above. |
| (b) | There have been no changes in Registrant’s internal control over financial reporting that the above officers believe to have materially affected, or to be reasonably likely to materially affect, Registrant’s internal control over financial reporting. |
Item 12: Exhibits.
| | |
| (a) | | (1) Code of ethics – not applicable to this semi-annual report. |
| |
| | (2) Separate certifications for Registrant’s principal executive officer and principal financial officer, as required by Rule 30a-2(a) under the 1940 Act, are attached. |
| |
| | (3) Not applicable. |
| |
| (b) | | A certification for Registrant’s principal executive officer and principal financial officer, as required by Rule 30a-2(b) under the 1940 Act, is attached. This certification is being furnished to the Securities and Exchange Commission solely pursuant to 18 U.S.C. section 1350 and is not being filed as part of the Form N-CSRS with the Commission. |
Pursuant to the requirements of the Securities Exchange Act of 1934 and the Investment Company Act of 1940, the registrant has duly caused this report to be signed on its behalf by the undersigned, thereunto duly authorized.
| | |
| (Registrant) Schwab Capital Trust |
| |
| By: | | /s/ Marie Chandoha |
| | Marie Chandoha |
| | Chief Executive Officer |
| |
| Date: | | November 8, 2016 |
Pursuant to the requirements of the Securities Exchange Act of 1934 and the Investment Company Act of 1940, this report has been signed below by the following persons on behalf of the registrant and in the capacities and on the dates indicated.
| | |
| By: | | /s/ Marie Chandoha |
| | Marie Chandoha |
| | Chief Executive Officer |
| |
| Date: | | November 8, 2016 |
| |
| By: | | /s/ Mark Fischer |
| | Mark Fischer |
| | Chief Financial Officer |
| |
| Date: | | November 8, 2016 |