Table of Contents
UNITED STATES
SECURITIES AND EXCHANGE COMMISSION
Washington, D.C. 20549
FORMN-CSR
CERTIFIED SHAREHOLDER REPORT OF REGISTERED
MANAGEMENT INVESTMENT COMPANIES
Investment Company Act file number:811-07704
Schwab Capital Trust – Schwab Fundamental Global Real Estate Index Fund
(Exact name of registrant as specified in charter)
211 Main Street, San Francisco, California 94105
(Address of principal executive offices) (Zip code)
Jonathan de St. Paer
Schwab Capital Trust
211 Main Street, San Francisco, California 94105
(Name and address of agent for service)
Registrant’s telephone number, including area code: (415)636-7000
Date of fiscal year end: February 28
Date of reporting period: February 28, 2019
| Item 1: | Report(s) to Shareholders. |
Table of Contents

| New Notice Regarding Shareholder Report Delivery Options |
| Beginning on January 1, 2021, paper copies of a fund’s shareholder reports will no longer be sent by mail, unless you specifically request paper copies of the reports from a fund or from your financial intermediary (such as a bank or broker-dealer). Instead, the reports will be made available on a fund’s websitewww.schwabfunds.com/schwabfunds_prospectus, and you will be notified by mail each time a report is posted and the mailing will provide a website link to access the report. You will continue to receive other fund regulatory documents (such as prospectuses or supplements) in paper unless you have elected to receive all fund documents electronically as described below. |
| If you would like to continue to receive a fund’s future shareholder reports in paper free of charge after January 1, 2021, you can make that request: (1) by contacting your financial intermediary, if you invest through a financial intermediary; or (2) if you invest directly with a fund, by calling 1-800-407-0256. |
| If you already receive shareholder reports and other fund documents electronically, you will not be affected by this change and you need not take any action. If you do not receive shareholder reports and other fund documents electronically but would like to do so, contact your financial intermediary or, if you invest directly with the funds, call 1-800-407-0256. |
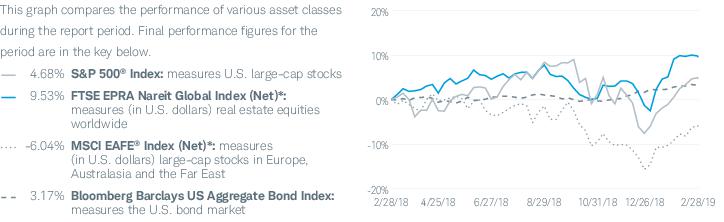
| Total Returns for the 12 Months Ended February 28, 2019 | |
| Schwab Fundamental Global Real Estate Index Fund (Ticker Symbol: SFREX) | 6.91%1 |
| Russell RAFITM Global Select Real Estate Index (Net)2 | 6.35% |
| FTSE EPRA Nareit Global Index (Net)2 | 9.53% |
| Fund Category: Morningstar Global Real Estate3 | 8.22% |
| Performance Details | pages 8-10 |
| 1 | Total return for the report period presented in the table differs from the return in the Financial Highlights. The total return presented in the above table is calculated based on the net asset value (NAV) at which shareholder transactions were processed. The total return presented in the Financial Highlights section of the report is calculated in the same manner, but also takes into account certain adjustments that are necessary under generally accepted accounting principles required in the annual and semiannual reports. |
| 2 | The net version of the index reflects reinvested dividends net of withholding taxes, but reflects no deductions for expenses or other taxes. |
| 3 | Source for category information: Morningstar, Inc. The Morningstar Category return represents all active and index mutual funds within the category as of the report date. |

President and CEO of
Charles Schwab Investment
Management, Inc. and the
fund covered in this report.
| 1 | The Thomson Reuters Lipper Fund Awards, granted annually, highlight funds and fund companies that have excelled in delivering consistently strong risk-adjusted performance relative to their peers. The Lipper Fund Awards are based on the Lipper Leader for Consistent Return rating, which is a risk-adjusted performance measure calculated over 36, 60 and 120 months. The fund with the highest Lipper Leader for Consistent Return (Effective Return) value in each eligible classification wins the Lipper Fund Award. For more information, see www.lipperfundawards.com. Although Lipper makes reasonable efforts to ensure the accuracy and reliability of the data contained herein, the accuracy is not guaranteed by Lipper. |

| * | The net version of the index reflects reinvested dividends net of withholding taxes, but reflects no deductions for expenses or other taxes. |
 | Christopher Bliss, CFA, Vice President and Head of the Passive Equity Team, leads the portfolio management team for Schwab’s passive equity mutual funds and ETFs. He also has overall responsibility for all aspects of the management of the fund. Prior to joining CSIM in 2016, Mr. Bliss spent 12 years at BlackRock (formerly Barclays Global Investors) managing and leading institutional index teams, most recently as a Managing Director and Head of Americas Institutional Index team. Prior to BlackRock, he worked as an equity analyst and portfolio manager for Harris Bretall and before that, as a research analyst for JP Morgan. |
 | Chuck Craig, CFA, Senior Portfolio Manager, is responsible for the day-to-day co-management of the fund. Prior to joining CSIM in 2012, Mr. Craig worked at Guggenheim Funds (formerly Claymore Group), where he spent more than five years as a managing director of portfolio management and supervision, and three years as vice president of product research and development. Prior to that, he worked as an equity research analyst at First Trust Portfolios (formerly Niké Securities), and a trader and analyst at PMA Securities, Inc. |
 | Jane Qin, Portfolio Manager, is responsible for the day-to-day co-management of the fund. Prior to joining CSIM in 2012, Ms. Qin spent more than four years at The Bank of New York Mellon Corporation. During that time, Ms. Qin spent more than two years as an associate equity portfolio manager and nearly two years as a performance analyst. She also worked at Wells Fargo Funds Management as a mutual fund analyst and at CIGNA Reinsurance in the Risk Management group as a risk analyst. |
 | David Rios, Portfolio Manager, is responsible for the day-to-day co-management of the fund. He joined CSIM in 2008 and became a Portfolio Manager in 2014. Prior to this role, Mr. Rios served as an Associate Portfolio Manager on the Schwab Equity Index Strategies team for four years. His first role with CSIM was as a trade operation specialist. He also previously worked as a senior fund accountant at Investors Bank & Trust (subsequently acquired by State Street Corporation). |
| 1 | Total return for the report period above differs from the return in the Financial Highlights. The total return presented above is calculated based on the net asset value (NAV) at which shareholder transactions were processed. The total return presented in the Financial Highlights section of the report is calculated in the same manner, but also takes into account certain adjustments that are necessary under generally accepted accounting principles required in the annual and semiannual reports. |
| 2 | The net version of the index reflects reinvested dividends net of withholding taxes, but reflects no deductions for expenses or other taxes. |
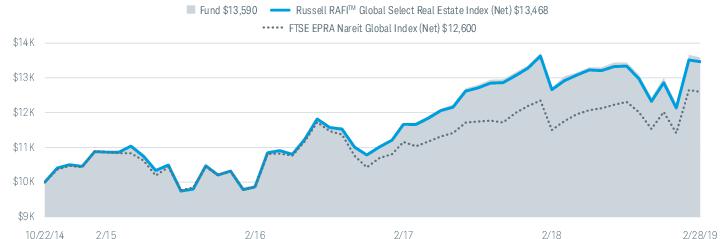
| Fund and Inception Date | 1 Year | 3 Years | Since Inception |
| Fund: Schwab Fundamental Global Real Estate Index Fund (10/22/14) | 6.91%2 | 11.22% | 7.30% |
| Russell RAFITM Global Select Real Estate Index (Net)3 | 6.35% | 10.93% | 7.07% |
| FTSE EPRA Nareit Global Index (Net)3 | 9.53% | 8.55% | 5.45% |
| Fund Category: Morningstar Global Real Estate4 | 8.22% | 8.15% | N/A |
| Fund Expense Ratio5: 0.39% | |||
| 1 | Performance does not reflect the deduction of taxes that a shareholder would pay on fund distributions or on the redemption of fund shares. |
| 2 | Total return for the report period presented in the table differs from the return in the Financial Highlights. The total return presented in the above table is calculated based on the net asset value (NAV) at which shareholder transactions were processed. The total return presented in the Financial Highlights section of the report is calculated in the same manner, but also takes into account certain adjustments that are necessary under generally accepted accounting principles required in the annual and semiannual reports. |
| 3 | The net version of the index reflects reinvested dividends net of withholding taxes, but reflects no deductions for expenses or other taxes. |
| 4 | Source for category information: Morningstar, Inc. The Morningstar Category return represents all active and index mutual funds within the category as of the report date. |
| 5 | As stated in the prospectus. |
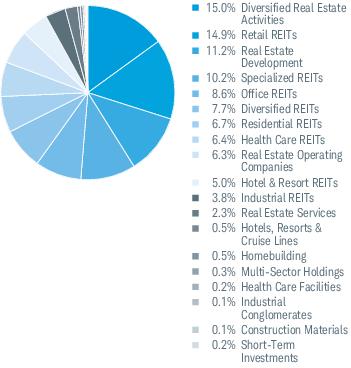
| Number of Holdings | 315 |
| Weighted Average Market Cap (millions) | $16,407 |
| Price/Earnings Ratio (P/E) | 13.0 |
| Price/Book Ratio (P/B) | 1.3 |
| Portfolio Turnover Rate | 16% |
| 1 | Excludes derivatives. |
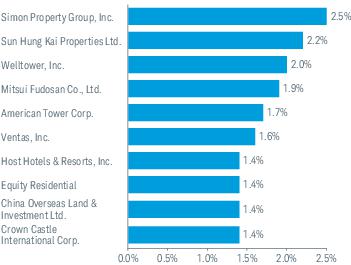
| 2 | This list is not a recommendation of any security by the investment adviser. |
| 3 | The percentage may differ from the Portfolio Holdings because the above calculation is based on a percentage of total investments, excluding derivatives, whereas the calculation in the Portfolio Holdings is based on a percentage of net assets. |
| Expense Ratio (Annualized)1 | Beginning Account Value at 9/1/18 | Ending Account Value (Net of Expenses) at 2/28/19 | Expenses Paid During Period 9/1/18-2/28/192 | |
| Schwab Fundamental Global Real Estate Index Fund | ||||
| Actual Return | 0.39% | $1,000.00 | $1,011.90 | $1.95 |
| Hypothetical 5% Return | 0.39% | $1,000.00 | $1,022.87 | $1.96 |
| 1 | Based on the most recent six-month expense ratio; may differ from the expense ratio provided in the Financial Highlights which covers a 12-month period. |
| 2 | Expenses for the fund are equal to its annualized expense ratio, multiplied by the average account value over the period, multiplied by the 181 days of the period, and divided by the 365 days of the fiscal year. |
| 3/1/18– 2/28/19 | 3/1/17– 2/28/18 | 3/1/16– 2/28/17 | 3/1/15– 2/29/16 | 10/22/141– 2/28/15 | ||
| Per-Share Data | ||||||
| Net asset value at beginning of period | $11.24 | $10.73 | $9.53 | $10.74 | $10.00 | |
| Income (loss) from investment operations: | ||||||
| Net investment income (loss)2 | 0.37 | 0.34 | 0.29 | 0.27 | 0.10 | |
| Net realized and unrealized gains (losses) | 0.38 | 0.59 | 1.42 | (1.21) | 0.75 | |
| Total from investment operations | 0.75 | 0.93 | 1.71 | (0.94) | 0.85 | |
| Less distributions: | ||||||
| Distributions from net investment income | (0.44) | (0.39) | (0.43) | (0.27) | (0.11) | |
| Distributions from net realized gains | (0.12) | (0.03) | (0.08) | — | (0.00)3 | |
| Total distributions | (0.56) | (0.42) | (0.51) | (0.27) | (0.11) | |
| Net asset value at end of period | $11.43 | $11.24 | $10.73 | $9.53 | $10.74 | |
| Total return | 7.00% | 8.69% | 18.26% | (8.91%) | 8.57%4 | |
| Ratios/Supplemental Data | ||||||
| Ratios to average net assets: | ||||||
| Total expenses | 0.39% | 0.43%5 | 0.91% | 0.89% | 2.58%6 | |
| Net operating expenses | N/A7 | 0.41%5 | 0.49% | 0.50%8 | 0.13%6,9 | |
| Net investment income (loss) | 3.32% | 3.01% | 2.72% | 2.65% | 2.62%6 | |
| Portfolio turnover rate | 16% | 13% | 23% | 26% | 4%4 | |
| Net assets, end of period (x 1,000,000) | $190 | $158 | $93 | $84 | $105 | |
| Security | Number of Shares | Value ($) |
| Common Stock99.5% of net assets | ||
| Australia 4.9% | ||
| Charter Hall Retail REIT | 46,717 | 150,773 |
| Cromwell Property Group | 220,872 | 173,277 |
| Dexus | 93,794 | 800,621 |
| Goodman Group | 121,724 | 1,107,159 |
| LendLease Group | 162,889 | 1,488,815 |
| Mirvac Group | 684,453 | 1,250,879 |
| Scentre Group | 651,898 | 1,792,995 |
| Stockland | 542,234 | 1,348,564 |
| The GPT Group | 169,576 | 704,227 |
| Vicinity Centres | 306,580 | 535,692 |
| 9,353,002 | ||
| Austria 0.4% | ||
| CA Immobilien Anlagen AG | 5,765 | 194,624 |
| IMMOFINANZ AG * | 14,083 | 348,961 |
| S IMMO AG | 9,030 | 170,891 |
| 714,476 | ||
| Belgium 0.3% | ||
| Befimmo S.A. | 2,782 | 151,242 |
| Cofinimmo S.A. | 2,782 | 361,373 |
| 512,615 | ||
| Brazil 0.5% | ||
| BR Malls Participacoes S.A. | 132,022 | 470,635 |
| Cyrela Brazil Realty S.A. Empreendimentos e Participacoes | 118,989 | 541,701 |
| 1,012,336 | ||
| Canada 3.4% | ||
| Allied Properties Real Estate Investment Trust | 8,050 | 293,689 |
| Artis Real Estate Investment Trust | 40,353 | 326,577 |
| Boardwalk Real Estate Investment Trust | 8,280 | 259,043 |
| Canadian Apartment Properties REIT | 11,241 | 429,241 |
| Chartwell Retirement Residences | 25,600 | 291,804 |
| Choice Properties Real Estate Investment Trust | 14,100 | 144,756 |
| Colliers International Group, Inc. | 2,369 | 161,858 |
| Cominar Real Estate Investment Trust | 52,893 | 481,521 |
| Crombie Real Estate Investment Trust | 21,300 | 224,824 |
| Dream Global Real Estate Investment Trust | 15,977 | 164,511 |
| Dream Office Real Estate Investment Trust | 28,469 | 537,600 |
| First Capital Realty, Inc. | 21,385 | 348,088 |
| FirstService Corp. | 2,500 | 217,049 |
| Granite Real Estate Investment Trust | 4,748 | 222,436 |
| H&R Real Estate Investment Trust | 53,171 | 917,598 |
| Northview Apartment Real Estate Investment Trust | 5,900 | 124,416 |
| Security | Number of Shares | Value ($) |
| RioCan Real Estate Investment Trust | 47,449 | 906,469 |
| SmartCentres Real Estate Investment Trust | 18,289 | 469,195 |
| 6,520,675 | ||
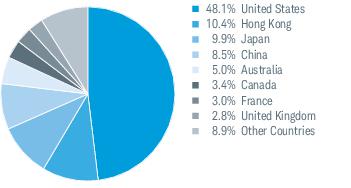
| China 8.4% | ||
| Agile Group Holdings Ltd. | 473,000 | 591,066 |
| BBMG Corp., Class H | 461,000 | 169,221 |
| Beijing Capital Land Ltd., Class H | 246,000 | 103,080 |
| China Aoyuan Property Group Ltd. | 185,000 | 145,278 |
| China Evergrande Group | 364,000 | 1,123,054 |
| China Jinmao Holdings Group Ltd. | 1,214,000 | 589,124 |
| China Overseas Grand Oceans Group Ltd. | 284,000 | 111,679 |
| China Overseas Land & Investment Ltd. | 726,000 | 2,674,684 |
| China Resources Land Ltd. | 462,000 | 1,723,528 |
| China SCE Group Holdings Ltd. | 279,000 | 109,833 |
| China South City Holdings Ltd. | 1,194,000 | 199,140 |
| China Vanke Co., Ltd., Class H | 191,100 | 724,717 |
| CIFI Holdings Group Co., Ltd. | 470,000 | 306,198 |
| Country Garden Holdings Co., Ltd. | 696,000 | 915,579 |
| Country Garden Services Holdings Co., Ltd. * | 31,264 | 51,358 |
| Fantasia Holdings Group Co., Ltd. | 726,000 | 113,627 |
| Future Land Development Holdings Ltd. | 230,000 | 197,831 |
| Greentown China Holdings Ltd. | 320,000 | 272,033 |
| Guangzhou R&F Properties Co., Ltd., Class H | 397,800 | 743,787 |
| Hopson Development Holdings Ltd. | 172,000 | 159,039 |
| KWG Property Holdings Ltd. * | 244,500 | 229,941 |
| Logan Property Holdings Co., Ltd. | 116,000 | 164,853 |
| Longfor Group Holdings Ltd. | 220,500 | 653,644 |
| Poly Property Group Co., Ltd. | 867,000 | 326,701 |
| Powerlong Real Estate Holdings Ltd. | 447,000 | 208,598 |
| Shenzhen Investment Ltd. | 1,032,000 | 385,060 |
| Shimao Property Holdings Ltd. | 363,000 | 857,304 |
| Sino-Ocean Group Holding Ltd. | 1,156,500 | 540,816 |
| SOHO China Ltd. * | 978,000 | 417,711 |
| Sunac China Holdings Ltd. | 125,000 | 522,057 |
| Yuexiu Property Co., Ltd. | 2,392,000 | 551,303 |
| Yuzhou Properties Co., Ltd. | 327,503 | 159,872 |
| 16,041,716 | ||
| France 3.0% | ||
| Covivio | 5,122 | 518,515 |
| Gecina S.A. | 3,554 | 526,291 |
| ICADE | 6,194 | 527,346 |
| Klepierre S.A. | 24,620 | 858,882 |
| Mercialys S.A. | 11,908 | 173,841 |
| Nexity S.A. | 9,530 | 464,815 |
| Unibail-Rodamco-Westfield | 16,542 | 2,663,329 |
| 5,733,019 | ||
| Security | Number of Shares | Value ($) |
| Germany 1.8% | ||
| Deutsche Euroshop AG | 4,498 | 133,342 |
| Deutsche Wohnen SE | 15,469 | 719,886 |
| LEG Immobilien AG | 5,003 | 557,815 |
| TAG Immobilien AG | 13,686 | 318,270 |
| TLG Immobilien AG | 5,421 | 157,355 |
| Vonovia SE | 32,708 | 1,583,113 |
| 3,469,781 | ||
| Hong Kong 10.4% | ||
| CK Asset Holdings Ltd. | 297,500 | 2,468,371 |
| Great Eagle Holdings Ltd. | 52,493 | 260,233 |
| Hang Lung Group Ltd. | 210,000 | 659,899 |
| Hang Lung Properties Ltd. | 325,000 | 767,336 |
| Henderson Land Development Co., Ltd. | 126,697 | 716,352 |
| Hongkong Land Holdings Ltd. | 129,741 | 930,574 |
| Hopewell Holdings Ltd. | 46,000 | 211,562 |
| Hysan Development Co., Ltd. | 51,500 | 271,957 |
| K Wah International Holdings Ltd. | 311,000 | 167,537 |
| Kerry Properties Ltd. | 152,000 | 635,026 |
| Link REIT | 120,500 | 1,362,996 |
| New World Development Co., Ltd. | 1,466,842 | 2,341,909 |
| Road King Infrastructure Ltd. | 67,000 | 128,079 |
| Shui On Land Ltd. | 875,000 | 218,535 |
| Sino Land Co., Ltd. | 426,063 | 793,205 |
| Sun Hung Kai Properties Ltd. | 250,000 | 4,144,938 |
| Swire Properties Ltd. | 104,000 | 417,474 |
| The Wharf Holdings Ltd. | 426,000 | 1,332,612 |
| Wharf Real Estate Investment Co., Ltd. | 98,200 | 689,483 |
| Wheelock & Co., Ltd. | 181,000 | 1,226,537 |
| 19,744,615 | ||
| Japan 9.8% | ||
| Activia Properties, Inc. | 37 | 154,189 |
| Advance Residence Investment Corp. | 96 | 266,995 |
| Aeon Mall Co., Ltd. | 23,400 | 381,547 |
| Daito Trust Construction Co., Ltd. | 15,980 | 2,214,608 |
| Daiwa House REIT Investment Corp. | 48 | 107,009 |
| Frontier Real Estate Investment Corp. | 40 | 165,110 |
| GLP J-REIT | 173 | 180,587 |
| Hulic Co., Ltd. | 29,000 | 267,051 |
| Japan Excellent, Inc. | 127 | 175,547 |
| Japan Hotel REIT Investment Corp. | 157 | 121,214 |
| Japan Prime Realty Investment Corp. | 68 | 266,840 |
| Japan Real Estate Investment Corp. | 102 | 590,601 |
| Japan Retail Fund Investment Corp. | 303 | 611,226 |
| Kenedix Office Investment Corp. | 37 | 246,916 |
| Leopalace21 Corp. | 132,700 | 287,677 |
| Mitsubishi Estate Co., Ltd. | 148,400 | 2,549,257 |
| Mitsui Fudosan Co., Ltd. | 152,500 | 3,618,955 |
| Nippon Accommodations Fund, Inc. | 39 | 193,917 |
| Nippon Building Fund, Inc. | 109 | 709,740 |
| Nippon Prologis REIT, Inc. | 97 | 206,305 |
| Nomura Real Estate Holdings, Inc. | 36,100 | 684,148 |
| Nomura Real Estate Master Fund, Inc. | 236 | 323,304 |
| Open House Co., Ltd. | 2,300 | 81,402 |
| Orix JREIT, Inc. | 144 | 236,042 |
| Relo Group, Inc. | 7,200 | 188,508 |
| Starts Corp., Inc. | 7,800 | 170,188 |
| Sumitomo Realty & Development Co., Ltd. | 54,500 | 2,039,942 |
| Tokyo Tatemono Co., Ltd. | 38,700 | 449,846 |
| Security | Number of Shares | Value ($) |
| Tokyu Fudosan Holdings Corp. | 145,000 | 802,530 |
| United Urban Investment Corp. | 230 | 356,733 |
| 18,647,934 | ||
| Netherlands 0.3% | ||
| Eurocommercial Properties N.V. CVA | 6,968 | 203,533 |
| NSI N.V. | 3,684 | 153,577 |
| Wereldhave N.V. | 6,465 | 188,433 |
| 545,543 | ||
| Philippines 0.4% | ||
| Ayala Land, Inc. | 481,100 | 409,215 |
| SM Prime Holdings, Inc. | 453,600 | 335,990 |
| 745,205 | ||
| Singapore 1.9% | ||
| Ascendas Real Estate Investment Trust | 226,900 | 469,511 |
| CapitaLand Commercial Trust | 122,700 | 175,962 |
| CapitaLand Ltd. | 392,700 | 991,993 |
| CapitaLand Mall Trust | 233,400 | 414,172 |
| Fortune Real Estate Investment Trust | 135,400 | 168,954 |
| Mapletree Commercial Trust | 91,900 | 120,193 |
| Mapletree Industrial Trust | 118,305 | 175,094 |
| Mapletree Logistics Trust | 183,640 | 187,391 |
| Mapletree North Asia Commercial Trust | 194,600 | 179,648 |
| Suntec Real Estate Investment Trust | 128,100 | 182,447 |
| UOL Group Ltd. | 66,080 | 323,640 |
| Yanlord Land Group Ltd. | 233,500 | 239,612 |
| 3,628,617 | ||
| South Africa 0.6% | ||
| Growthpoint Properties Ltd. | 345,738 | 598,300 |
| Redefine Properties Ltd. | 591,258 | 406,533 |
| Vukile Property Fund Ltd. | 99,434 | 141,950 |
| 1,146,783 | ||
| Sweden 0.9% | ||
| Castellum AB | 23,670 | 431,025 |
| Fabege AB | 18,835 | 252,879 |
| Hemfosa Fastigheter AB | 16,368 | 139,794 |
| Kungsleden AB | 15,481 | 115,613 |
| LE Lundbergfortagen AB, B Shares | 19,899 | 613,390 |
| Nyfosa AB * | 16,248 | 93,818 |
| Wihlborgs Fastigheter AB | 14,852 | 197,005 |
| 1,843,524 | ||
| Switzerland 0.9% | ||
| Allreal Holding AG * | 2,321 | 372,930 |
| Mobimo Holding AG | 934 | 221,813 |
| PSP Swiss Property AG | 3,039 | 309,122 |
| Swiss Prime Site AG | 9,294 | 783,460 |
| 1,687,325 | ||
| Taiwan 0.5% | ||
| Farglory Land Development Co., Ltd. | 134,000 | 160,264 |
| Highwealth Construction Corp. | 266,700 | 412,672 |
| Huaku Development Co., Ltd. | 68,000 | 153,668 |
| Ruentex Development Co., Ltd. | 116,280 | 182,842 |
| 909,446 | ||
| Security | Number of Shares | Value ($) |
| United Arab Emirates 0.3% | ||
| Aldar Properties PJSC | 388,974 | 188,322 |
| Emaar Properties PJSC | 262,080 | 350,111 |
| 538,433 | ||
| United Kingdom 2.8% | ||
| Derwent London plc | 6,415 | 277,996 |
| Etalon Group plc | 63,697 | 140,133 |
| Grainger plc | 57,197 | 187,382 |
| Great Portland Estates plc | 12,976 | 130,986 |
| Hammerson plc | 89,916 | 455,504 |
| Hansteen Holdings plc | 79,493 | 103,327 |
| Intu Properties plc | 270,880 | 411,171 |
| Land Securities Group plc | 109,063 | 1,302,491 |
| McCarthy & Stone plc | 132,731 | 217,595 |
| Savills plc | 31,557 | 372,174 |
| Segro plc | 60,879 | 533,927 |
| St. Modwen Properties plc | 29,979 | 162,327 |
| The British Land Co., plc | 97,731 | 782,185 |
| The Unite Group plc | 17,187 | 208,644 |
| 5,285,842 | ||
| United States 48.0% | ||
| Acadia Realty Trust | 6,577 | 187,379 |
| Alexander & Baldwin, Inc. * | 5,763 | 132,146 |
| Alexandria Real Estate Equities, Inc. | 5,332 | 724,565 |
| American Campus Communities, Inc. | 14,934 | 672,926 |
| American Homes 4 Rent, Class A | 9,049 | 197,630 |
| American Tower Corp. | 18,390 | 3,239,398 |
| Apartment Investment & Management Co., Class A | 15,739 | 770,109 |
| Apple Hospitality REIT, Inc. | 34,854 | 574,394 |
| Ashford Hospitality Trust, Inc. | 47,512 | 254,664 |
| AvalonBay Communities, Inc. | 9,522 | 1,853,267 |
| Boston Properties, Inc. | 17,352 | 2,302,437 |
| Brandywine Realty Trust | 28,688 | 450,975 |
| Brixmor Property Group, Inc. | 57,684 | 1,007,163 |
| Camden Property Trust | 8,769 | 860,151 |
| CBL & Associates Properties, Inc. | 156,479 | 334,865 |
| CBRE Group, Inc., Class A * | 29,952 | 1,490,412 |
| Chesapeake Lodging Trust | 9,300 | 280,116 |
| Colony Capital, Inc. | 22,918 | 127,424 |
| Columbia Property Trust, Inc. | 24,748 | 535,299 |
| CoreCivic, Inc. | 49,548 | 1,049,427 |
| CorePoint Lodging, Inc. | 4,617 | 64,499 |
| Corporate Office Properties Trust | 14,886 | 386,887 |
| Cousins Properties, Inc. | 14,560 | 138,611 |
| Crown Castle International Corp. | 22,507 | 2,672,706 |
| CubeSmart | 11,238 | 344,332 |
| CyrusOne, Inc. | 4,151 | 206,886 |
| DiamondRock Hospitality Co. | 38,895 | 415,788 |
| Digital Realty Trust, Inc. | 13,814 | 1,562,640 |
| Douglas Emmett, Inc. | 11,944 | 461,038 |
| Duke Realty Corp. | 31,842 | 941,568 |
| EastGroup Properties, Inc. | 2,270 | 239,848 |
| EPR Properties | 5,770 | 423,980 |
| Equinix, Inc. | 3,172 | 1,343,342 |
| Equity Commonwealth | 14,571 | 475,743 |
| Equity LifeStyle Properties, Inc. | 5,365 | 582,854 |
| Equity Residential | 36,589 | 2,696,243 |
| Essex Property Trust, Inc. | 3,695 | 1,034,009 |
| Extra Space Storage, Inc. | 6,476 | 621,307 |
| Federal Realty Investment Trust | 5,374 | 717,913 |
| First Industrial Realty Trust, Inc. | 7,745 | 259,612 |
| Franklin Street Properties Corp. | 26,510 | 191,932 |
| Security | Number of Shares | Value ($) |
| Gaming & Leisure Properties, Inc. | 13,640 | 496,223 |
| HCP, Inc. | 77,054 | 2,370,952 |
| Healthcare Realty Trust, Inc. | 12,205 | 386,288 |
| Healthcare Trust of America, Inc., Class A | 13,590 | 387,179 |
| Hersha Hospitality Trust | 9,359 | 176,417 |
| Highwoods Properties, Inc. | 11,783 | 545,671 |
| Hospitality Properties Trust | 42,375 | 1,147,091 |
| Host Hotels & Resorts, Inc. | 138,686 | 2,719,632 |
| Hudson Pacific Properties, Inc. | 6,755 | 224,401 |
| Investors Real Estate Trust | 3,215 | 194,122 |
| Invitation Homes, Inc. | 6,461 | 148,603 |
| Iron Mountain, Inc. | 55,718 | 1,973,532 |
| Jones Lang LaSalle, Inc. | 7,158 | 1,181,929 |
| Kennedy-Wilson Holdings, Inc. | 6,196 | 128,753 |
| Kilroy Realty Corp. | 6,367 | 469,312 |
| Kimco Realty Corp. | 60,291 | 1,060,519 |
| Kite Realty Group Trust | 12,757 | 200,795 |
| Lamar Advertising Co., Class A | 9,361 | 726,133 |
| Lexington Realty Trust | 42,082 | 390,942 |
| Liberty Property Trust | 16,595 | 785,441 |
| Life Storage, Inc. | 3,549 | 346,382 |
| Mack-Cali Realty Corp. | 22,009 | 462,409 |
| Medical Properties Trust, Inc. | 22,685 | 413,548 |
| Mid-America Apartment Communities, Inc. | 7,738 | 801,502 |
| National Health Investors, Inc. | 2,193 | 171,120 |
| National Retail Properties, Inc. | 10,012 | 521,625 |
| New Senior Investment Group, Inc. | 30,725 | 158,541 |
| Office Properties Income Trust | 7,385 | 225,316 |
| Omega Healthcare Investors, Inc. | 17,705 | 635,610 |
| Outfront Media, Inc. | 37,875 | 849,915 |
| Paramount Group, Inc. | 22,825 | 327,767 |
| Park Hotels & Resorts, Inc. | 23,122 | 722,331 |
| Pebblebrook Hotel Trust | 22,476 | 719,457 |
| Pennsylvania Real Estate Investment Trust | 23,426 | 144,070 |
| Piedmont Office Realty Trust, Inc., Class A | 30,362 | 621,510 |
| Prologis, Inc. | 36,253 | 2,539,885 |
| PS Business Parks, Inc. | 1,681 | 247,393 |
| Public Storage | 9,130 | 1,930,904 |
| QTS Realty Trust, Inc., Class A | 2,986 | 124,606 |
| Realogy Holdings Corp. | 44,182 | 600,875 |
| Realty Income Corp. | 15,269 | 1,056,004 |
| Regency Centers Corp. | 7,792 | 508,428 |
| Retail Opportunity Investments Corp. | 5,890 | 101,131 |
| Retail Properties of America, Inc., Class A | 45,013 | 560,862 |
| Retail Value, Inc. | 4,049 | 126,045 |
| RLJ Lodging Trust | 29,119 | 540,740 |
| RPT Realty | 14,459 | 183,340 |
| Ryman Hospitality Properties, Inc. | 5,440 | 440,586 |
| Sabra Health Care REIT, Inc. | 12,394 | 224,579 |
| SBA Communications Corp. * | 3,640 | 657,238 |
| Senior Housing Properties Trust | 52,744 | 683,035 |
| Seritage Growth Properties, Class A | 2,627 | 115,982 |
| Simon Property Group, Inc. | 26,076 | 4,723,928 |
| SITE Centers Corp. | 40,285 | 537,805 |
| SL Green Realty Corp. | 10,731 | 973,516 |
| Spirit MTA REIT | 5,526 | 40,616 |
| Spirit Realty Capital, Inc. | 11,972 | 462,598 |
| STAG Industrial, Inc. | 4,386 | 121,404 |
| STORE Capital Corp. | 6,697 | 217,452 |
| Summit Hotel Properties, Inc. | 12,886 | 146,772 |
| Sun Communities, Inc. | 4,202 | 477,221 |
| Sunstone Hotel Investors, Inc. | 36,564 | 550,288 |
| Security | Number of Shares | Value ($) |
| Tanger Factory Outlet Centers, Inc. | 14,852 | 320,655 |
| Taubman Centers, Inc. | 9,978 | 532,626 |
| The GEO Group, Inc. | 26,281 | 597,104 |
| The Howard Hughes Corp. * | 1,291 | 143,792 |
| The Macerich Co. | 18,101 | 789,204 |
| Tier REIT, Inc. | 8,140 | 197,395 |
| UDR, Inc. | 21,170 | 940,371 |
| Uniti Group, Inc. | 23,876 | 230,165 |
| Urban Edge Properties | 9,597 | 186,374 |
| Ventas, Inc. | 47,649 | 2,989,975 |
| VEREIT, Inc. | 119,992 | 956,336 |
| Vornado Realty Trust | 20,826 | 1,401,798 |
| Washington Prime Group, Inc. | 99,979 | 577,879 |
| Washington Real Estate Investment Trust | 10,289 | 272,556 |
| Weingarten Realty Investors | 16,474 | 474,616 |
| Welltower, Inc. | 51,341 | 3,815,150 |
| WP Carey, Inc. | 10,491 | 774,970 |
| Wyndham Destinations, Inc. | 22,573 | 1,016,462 |
| Xenia Hotels & Resorts, Inc. | 27,234 | 531,880 |
| 91,304,064 | ||
| Total Common Stock | ||
| (Cost $176,336,661) | 189,384,951 | |
| Rights0.0% of net assets | ||
| China 0.0% | ||
| China Aoyuan Group Ltd. expires 03/04/19 *(a) | 2,176 | — |
| Total Rights | ||
| (Cost $—) | — | |
| Security Rate, Maturity Date | Face Amount Local Currency | Value ($) |
| Short-Term Investments0.2% of net assets | ||
| Time Deposits 0.2% | ||
| BNP Paribas | ||
| Euro | ||
| (0.57%), 03/01/19(b) | 17,085 | 19,433 |
| Brown Brothers Harriman | ||
| Australian Dollar | ||
| 0.76%, 03/01/19(b) | 118,002 | 83,705 |
| Canadian Dollar | ||
| 0.82%, 03/01/19(b) | 7,493 | 5,694 |
| Security Rate, Maturity Date | Face Amount Local Currency | Value ($) |
| Hong Kong Dollar | ||
| 0.36%, 03/01/19(b) | 66,995 | 8,535 |
| Pound Sterling | ||
| 0.36%, 03/01/19(b) | 67 | 88 |
| Singapore Dollar | ||
| 0.80%, 03/01/19(b) | 13,539 | 10,014 |
| South African Rand | ||
| 5.14%, 03/01/19(b) | 198,259 | 14,067 |
| Swedish Krona | ||
| (0.55%), 03/01/19(b) | 1,612 | 175 |
| Swiss Franc | ||
| (1.44%), 03/01/19(b) | 215 | 215 |
| JPMorgan Chase Bank | ||
| U.S. Dollar | ||
| 1.75%, 03/01/19(b) | 32,414 | 32,414 |
| Sumitomo Mitsui Banking Corp. | ||
| Japanese Yen | ||
| (0.27%), 03/01/19(b) | 20,899,633 | 187,500 |
| Total Short-Term Investments | ||
| (Cost $361,840) | 361,840 | |
| Number of Contracts | Notional Amount ($) | Current Value/ Unrealized Appreciation (Depreciation) ($) | ||
| Futures Contracts | ||||
| Long | ||||
| S&P 500 Index, e-mini, expires 03/15/19 | 2 | 278,470 | 744 | |
| MSCI Emerging Markets Index, expires 03/15/19 | 4 | 209,340 | (4,628) | |
| MSCI EAFE Index, expires 03/15/19 | 2 | 186,900 | (484) | |
| Net Unrealized Depreciation | (4,368) | |||
| * | Non-income producing security. |
| (a) | Fair-valued by management using significant unobservable inputs in accordance with procedures approved by fund’s Board of Trustees. |
| (b) | The rate shown is the current daily overnight rate. |
| CVA — | Dutch Certificate |
| REIT — | Real Estate Investment Trust |
| Description | Quoted Prices in Active Markets for Identical Assets (Level 1) | Other Significant Observable Inputs (Level 2) | Significant Unobservable Inputs (Level 3) | Total | |
| Assets | |||||
| Common Stock1 | $98,837,075 | $— | $— | $98,837,075 | |
| Australia | — | 9,353,002 | — | 9,353,002 | |
| Austria | 194,624 | 519,852 | — | 714,476 | |
| Belgium | 361,373 | 151,242 | — | 512,615 | |
| China | — | 16,041,716 | — | 16,041,716 | |
| France | 518,515 | 5,214,504 | — | 5,733,019 | |
| Germany | — | 3,469,781 | — | 3,469,781 | |
| Hong Kong | — | 19,744,615 | — | 19,744,615 | |
| Japan | — | 18,647,934 | — | 18,647,934 | |
| Netherlands | 357,110 | 188,433 | — | 545,543 | |
| Philippines | — | 745,205 | — | 745,205 | |
| Singapore | 168,954 | 3,459,663 | — | 3,628,617 | |
| South Africa | 141,950 | 1,004,833 | — | 1,146,783 | |
| Sweden | 93,818 | 1,749,706 | — | 1,843,524 | |
| Switzerland | — | 1,687,325 | — | 1,687,325 | |
| Taiwan | — | 909,446 | — | 909,446 | |
| United Arab Emirates | — | 538,433 | — | 538,433 | |
| United Kingdom | 648,437 | 4,637,405 | — | 5,285,842 | |
| Rights1 | |||||
| China | — | — | —* | — | |
| Short-Term Investments1 | — | 361,840 | — | 361,840 | |
| Futures Contracts2 | 744 | — | — | 744 | |
| Liabilities | |||||
| Futures Contracts2 | (5,112) | — | — | (5,112) | |
| Total | $101,317,488 | $88,424,935 | $— | $189,742,423 |
| * | Level 3 amount shown includes securities determined to have no value at February 28, 2019. |
| 1 | As categorized in Portfolio Holdings. |
| 2 | Futures contracts are valued at unrealized appreciation or depreciation. |
| Assets | ||
| Investments in unaffiliated issuers, at value (cost $176,698,501) | $189,746,791 | |
| Foreign currency, at value (cost $34,422) | 34,411 | |
| Deposit with broker for futures contracts | 85,600 | |
| Receivables: | ||
| Investments sold | 333,064 | |
| Dividends | 211,942 | |
| Fund shares sold | 183,701 | |
| Foreign tax reclaims | 35,011 | |
| Prepaid expenses | + | 16,151 |
| Total assets | 190,646,671 | |
| Liabilities | ||
| Payables: | ||
| Investments bought | 259,536 | |
| Investment adviser fees | 56,814 | |
| Fund shares redeemed | 91,087 | |
| Variation margin on futures contracts | + | 5,161 |
| Total liabilities | 412,598 | |
| Net Assets | ||
| Total assets | 190,646,671 | |
| Total liabilities | – | 412,598 |
| Net assets | $190,234,073 | |
| Net Assets by Source | ||
| Capital received from investors | 180,714,808 | |
| Total distributable earnings1 | 9,519,265 | |
| Net Asset Value (NAV) | ||||
| Net Assets | ÷ | Shares Outstanding | = | NAV |
| $190,234,073 | 16,649,287 | $11.43 | ||
| 1 | The SEC eliminated the requirement to disclose total distributable earnings (loss) by each of its components as previously disclosed as the previous presentation did not provide insight into the tax implications of distributions (see financial note 9 for additional information). |
| Investment Income | ||
| Dividends (net of foreign withholding tax of $296,229) | $6,534,478 | |
| Interest | + | 9,661 |
| Total investment income | 6,544,139 | |
| Expenses | ||
| Investment adviser fees | 687,810 | |
| Total expenses | – | 687,810 |
| Net investment income | 5,856,329 | |
| Realized and Unrealized Gains (Losses) | ||
| Net realized losses on investments | (434,962) | |
| Net realized losses on futures contracts | (11,693) | |
| Net realized losses on foreign currency transactions | + | (12,230) |
| Net realized losses | (458,885) | |
| Net change in unrealized appreciation (depreciation) on investments (net of change in foreign capital gains tax of ($1,371)) | 5,774,127 | |
| Net change in unrealized appreciation (depreciation) on futures contracts | 12,506 | |
| Net change in unrealized appreciation (depreciation) on foreign currency translations | + | (7,551) |
| Net change in unrealized appreciation (depreciation) | + | 5,779,082 |
| Net realized and unrealized gains | 5,320,197 | |
| Increase in net assets resulting from operations | $11,176,526 | |
| Operations | ||||
| 3/1/18-2/28/19 | 3/1/17-2/28/18 | |||
| Net investment income | $5,856,329 | $3,420,714 | ||
| Net realized gains (losses) | (458,885) | 2,056,339 | ||
| Net change in unrealized appreciation (depreciation) | + | 5,779,082 | 2,023,137 | |
| Increase in net assets from operations | 11,176,526 | 7,500,190 | ||
| Distributions to Shareholders1 | ||||
| Total distributions | ($8,781,234) | ($4,174,000) | ||
| Transactions in Fund Shares | ||||||||
| 3/1/18-2/28/19 | 3/1/17-2/28/18 | |||||||
| SHARES | VALUE | SHARES | VALUE | |||||
| Shares sold | 6,151,264 | $69,415,729 | 7,075,682 | $80,763,586 | ||||
| Shares reinvested | 630,628 | 6,879,385 | 280,696 | 3,217,737 | ||||
| Shares redeemed | + | (4,222,676) | (46,815,739) | (1,899,092) | (21,552,849) | |||
| Net transactions in fund shares | 2,559,216 | $29,479,375 | 5,457,286 | $62,428,474 | ||||
| Shares Outstanding and Net Assets | ||||||||
| 3/1/18-2/28/19 | 3/1/17-2/28/18 | |||||||
| SHARES | NET ASSETS | SHARES | NET ASSETS | |||||
| Beginning of period | 14,090,071 | $158,359,406 | 8,632,785 | $92,604,742 | ||||
| Total increase | + | 2,559,216 | 31,874,667 | 5,457,286 | 65,754,664 | |||
| End of period2 | 16,649,287 | $190,234,073 | 14,090,071 | $158,359,406 | ||||
| 1 | For the period ended February 28, 2018, the fund distributed to shareholders $3,812,190 from net investment income and $361,810 from net realized gains. The SEC eliminated the requirement to disclose distributions to shareholders from net investment income and from net realized gains in 2018 (see financial note 9 for additional information). |
| 2 | End of period - Net assets include distributions in excess of net investment income of ($1,056,494) at February 28, 2018. The SEC eliminated the requirement to disclose undistributed net investment income in 2018. |
| SCHWAB CAPITAL TRUST (ORGANIZED MAY 7, 1993) | |
| Schwab Fundamental Global Real Estate Index Fund | Schwab Target 2010 Fund |
| Schwab Fundamental US Large Company Index Fund | Schwab Target 2015 Fund |
| Schwab Fundamental US Small Company Index Fund | Schwab Target 2020 Fund |
| Schwab Fundamental International Large Company Index Fund | Schwab Target 2025 Fund |
| Schwab Fundamental International Small Company Index Fund | Schwab Target 2030 Fund |
| Schwab Fundamental Emerging Markets Large Company Index Fund | Schwab Target 2035 Fund |
| Schwab S&P 500 Index Fund | Schwab Target 2040 Fund |
| Schwab Small-Cap Index Fund | Schwab Target 2045 Fund |
| Schwab Total Stock Market Index Fund | Schwab Target 2050 Fund |
| Schwab U.S. Large-Cap Growth Index Fund | Schwab Target 2055 Fund |
| Schwab U.S. Large-Cap Value Index Fund | Schwab Target 2060 Fund |
| Schwab U.S. Mid-Cap Index Fund | Schwab Monthly Income Fund — Moderate Payout |
| Schwab International Index Fund | Schwab Monthly Income Fund — Enhanced Payout |
| Schwab MarketTrack All Equity Portfolio™ | Schwab Monthly Income Fund — Maximum Payout |
| Schwab MarketTrack Growth Portfolio™ | Schwab Target 2010 Index Fund |
| Schwab MarketTrack Balanced Portfolio™ | Schwab Target 2015 Index Fund |
| Schwab MarketTrack Conservative Portfolio™ | Schwab Target 2020 Index Fund |
| Laudus International MarketMasters Fund™ | Schwab Target 2025 Index Fund |
| Schwab Balanced Fund | Schwab Target 2030 Index Fund |
| Schwab Core Equity Fund | Schwab Target 2035 Index Fund |
| Schwab Dividend Equity Fund | Schwab Target 2040 Index Fund |
| Schwab Large-Cap Growth Fund | Schwab Target 2045 Index Fund |
| Schwab Small-Cap Equity Fund | Schwab Target 2050 Index Fund |
| Schwab Hedged Equity Fund | Schwab Target 2055 Index Fund |
| Schwab Health Care Fund | Schwab Target 2060 Index Fund |
| Schwab International Core Equity Fund | |
2. Significant Accounting Policies:
3. Risk Factors:
4. Affiliates and Affiliated Transactions:
5. Board of Trustees:
7. Derivatives:
8. Purchases and Sales of Investment Securities:
| Purchases of Securities | Sales of Securities |
| $61,095,427 | $28,872,115 |
9. Federal Income Taxes:
| Tax cost | $182,488,286 |
| Gross unrealized appreciation | $17,804,568 |
| Gross unrealized depreciation | (10,550,431) |
| Net unrealized appreciation (depreciation) | $7,254,137 |
| Undistributed ordinary income | $1,783,269 |
| Undistributed long-term capital gains | 487,567 |
| Net unrealized appreciation (depreciation) on investments | 7,254,137 |
| Net other unrealized appreciation (depreciation) | (5,708) |
| Total | $9,519,265 |
| Current period distributions | |
| Ordinary income | $6,879,644 |
| Long-term capital gains | 1,901,590 |
| Prior period distributions | |
| Ordinary income | $3,812,190 |
| Long-term capital gains | 361,810 |
10. Subsequent Events:
San Francisco, California
April 16, 2019
| Independent Trustees | |||
| Name, Year of Birth, and Position(s) with the trust (Terms of office, and length of Time Served1) | Principal Occupations During the Past Five Years | Number of Portfolios in Fund Complex Overseen by the Trustee | Other Directorships |
| Robert W. Burns 1959 Trustee (Trustee of Schwab Strategic Trust since 2009; The Charles Schwab Family of Funds, Schwab Investments, Schwab Capital Trust, Schwab Annuity Portfolios and Laudus Trust since 2016) | Retired/Private Investor (Jan. 2009 – present). Formerly, Managing Director, Pacific Investment Management Company, LLC (PIMCO) (investment management firm) and President, PIMCO Funds. | 98 | None |
| John F. Cogan 1947 Trustee (Trustee of The Charles Schwab Family of Funds, Schwab Investments, Schwab Capital Trust and Schwab Annuity Portfolios since 2008; Laudus Trust since 2010; Schwab Strategic Trust since 2016) | Senior Fellow (Oct. 1979 – present), The Hoover Institution at Stanford University (public policy think tank); Senior Fellow (2000 – present), Stanford Institute for Economic Policy Research; Professor of Public Policy (1994 – 2015), Stanford University. | 98 | Director (2005 – present), Gilead Sciences, Inc. |
| Nancy F. Heller 1956 Trustee (Trustee of The Charles Schwab Family of Funds, Schwab Investments, Schwab Capital Trust, Schwab Annuity Portfolios, Schwab Strategic Trust and Laudus Trust since 2018) | President and Chairman (2014 – 2016), TIAA Charitable (financial services); Senior Managing Director (2003 – 2016), TIAA (financial services). | 98 | None |
| Stephen Timothy Kochis 1946 Trustee (Trustee of Schwab Strategic Trust since 2012; The Charles Schwab Family of Funds, Schwab Investments, Schwab Capital Trust, Schwab Annuity Portfolios and Laudus Trust since 2016) | CEO and Owner (May 2012 – present), Kochis Global (wealth management consulting). | 98 | None |
| Independent Trustees (continued) | |||
| Name, Year of Birth, and Position(s) with the trust (Terms of office, and length of Time Served1) | Principal Occupations During the Past Five Years | Number of Portfolios in Fund Complex Overseen by the Trustee | Other Directorships |
| David L. Mahoney 1954 Trustee (Trustee of The Charles Schwab Family of Funds, Schwab Investments, Schwab Capital Trust, Schwab Annuity Portfolios and Laudus Trust since 2011; Schwab Strategic Trust since 2016) | Private Investor. | 98 | Director (2003 – present), Symantec Corporation Director (2004 – present), Corcept Therapeutics Incorporated Director (2009 – present), Adamas Pharmaceuticals, Inc. |
| Jane P. Moncreiff 1961 Trustee (Trustee of The Charles Schwab Family of Funds, Schwab Investments, Schwab Capital Trust, Schwab Annuity Portfolios, Schwab Strategic Trust and Laudus Trust since 2019) | Chief Investment Officer (2009-2017), CareGroup Healthcare System, Inc. (healthcare). | 98 | None |
| Kiran M. Patel 1948 Trustee (Trustee of The Charles Schwab Family of Funds, Schwab Investments, Schwab Capital Trust, Schwab Annuity Portfolios and Laudus Trust since 2011; Schwab Strategic Trust since 2016) | Retired. Executive Vice President and General Manager of Small Business Group (Dec. 2008 – Sept. 2013), Intuit, Inc. (financial software and services firm for consumers and small businesses). | 98 | Director (2008 – present), KLA-Tencor Corporation |
| Kimberly S. Patmore 1956 Trustee (Trustee of The Charles Schwab Family of Funds, Schwab Investments, Schwab Capital Trust, Schwab Annuity Portfolios, Schwab Strategic Trust and Laudus Trust since 2016) | Consultant (2008 – present), Patmore Management Consulting (management consulting). | 98 | None |
| Gerald B. Smith 1950 Trustee (Trustee of The Charles Schwab Family of Funds, Schwab Investments, Schwab Capital Trust and Schwab Annuity Portfolios since 2000; Laudus Trust since 2010; Schwab Strategic Trust since 2016) | Chairman, Chief Executive Officer and Founder (Mar. 1990 – present), Smith Graham & Co. (investment advisors). | 98 | Director (2012 – present), Eaton |
| Interested Trustees | |||
| Name, Year of Birth, and Position(s) with the trust (Terms of office, and length of Time Served1) | Principal Occupations During the Past Five Years | Number of Portfolios in Fund Complex Overseen by the Trustee | Other Directorships |
| Walter W. Bettinger II2 1960 Chairman and Trustee (Trustee of The Charles Schwab Family of Funds, Schwab Investments, Schwab Capital Trust and Schwab Annuity Portfolios since 2008; Schwab Strategic Trust since 2009; Laudus Trust since 2010) | Director, President and Chief Executive Officer (Oct. 2008 – present), The Charles Schwab Corporation; President and Chief Executive Officer (Oct. 2008 – present) and Director (May 2008 – present), Charles Schwab & Co., Inc.; Director (Apr. 2006 – present), Charles Schwab Bank; Director (Nov. 2017 – present), Charles Schwab Premier Bank; Director (May 2008 – present) and President and Chief Executive Officer (Aug. 2017 – present), Schwab Holdings, Inc.; Director (July 2016 – present), Charles Schwab Investment Management, Inc. | 98 | Director (2008 – present), The Charles Schwab Corporation |
| Jonathan de St. Paer2 1973 Trustee (Trustee of The Charles Schwab Family of Funds, Schwab Investments, Schwab Capital Trust, Schwab Annuity Portfolios, Schwab Strategic Trust and Laudus Trust since 2019) | Director and Chief Executive Officer (Apr. 2019 – present) and President (Oct. 2018 – present) Charles Schwab Investment Management, Inc.; Trustee and Chief Executive Officer (Apr. 2019 – present) and President (Nov. 2018 – present), Schwab Funds, Laudus Funds and Schwab ETFs; Director (Apr. 2019 – present), Charles Schwab Worldwide Funds plc and Charles Schwab Asset Management (Ireland) Limited; Senior Vice President (Apr. 2019 – present), Senior Vice President – Strategy and Product Development (CSIM) (Jan. 2014 – Mar. 2019), and Vice President (Jan. 2009 – Dec. 2013), Charles Schwab & Co., Inc. | 98 | None |
| Joseph R. Martinetto2 1962 Trustee (Trustee of The Charles Schwab Family of Funds, Schwab Investments, Schwab Capital Trust, Schwab Annuity Portfolios, Schwab Strategic Trust and Laudus Trust since 2016) | Chief Operating Officer (Feb. 2018 – present) and Senior Executive Vice President (July 2015 – Feb. 2018), The Charles Schwab Corporation; Senior Executive Vice President (July 2015 – present), Charles Schwab & Co., Inc.; Chief Financial Officer (July 2015 – Aug. 2017) and Executive Vice President and Chief Financial Officer (May 2007 – July 2015), The Charles Schwab Corporation and Charles Schwab & Co., Inc.; Director (May 2007 – present), Charles Schwab & Co., Inc.; Director (Apr. 2010 – present) and Chief Executive Officer (July 2013 – Apr. 2015), Charles Schwab Bank; Director (Nov. 2017 – present), Charles Schwab Premier Bank; Director (May 2007 – present), Chief Financial Officer (May 2007 – Aug. 2017), Senior Executive Vice President (Feb. 2016 – present), and Executive Vice President (May 2007 – Feb. 2016), Schwab Holdings, Inc. | 98 | None |
| Officers of the Trust | |
| Name, Year of Birth, and Position(s) with the trust (Terms of office, and length of Time Served3) | Principal Occupations During the Past Five Years |
| Jonathan de St. Paer 1973 President and Chief Executive Officer (Officer of The Charles Schwab Family of Funds, Schwab Investments, Schwab Capital Trust, Schwab Annuity Portfolios, Schwab Strategic Trust and Laudus Trust since 2018) | Director and Chief Executive Officer (Apr. 2019 – present) and President (Oct. 2018 – present) Charles Schwab Investment Management, Inc.; Trustee and Chief Executive Officer (Apr. 2019 – present) and President (Nov. 2018 – present), Schwab Funds, Laudus Funds and Schwab ETFs; Director (Apr. 2019 – present), Charles Schwab Worldwide Funds plc and Charles Schwab Asset Management (Ireland) Limited; Senior Vice President (Apr. 2019 – present), Senior Vice President – Strategy and Product Development (CSIM) (Jan. 2014 – Mar. 2019), and Vice President (Jan. 2009 – Dec. 2013), Charles Schwab & Co., Inc. |
| Officers of the Trust (continued) | |
| Name, Year of Birth, and Position(s) with the trust (Terms of office, and length of Time Served3) | Principal Occupations During the Past Five Years |
| Mark Fischer 1970 Treasurer and Chief Financial Officer (Officer of The Charles Schwab Family of Funds, Schwab Investments, Schwab Capital Trust, Schwab Annuity Portfolios, Schwab Strategic Trust and Laudus Trust since 2013) | Treasurer and Chief Financial Officer (Jan. 2016 – present), Schwab Funds, Laudus Funds and Schwab ETFs; Assistant Treasurer (Dec. 2013 – Dec. 2015), Schwab Funds and Laudus Funds; Assistant Treasurer (Nov. 2013 – Dec. 2015), Schwab ETFs; Vice President (Oct. 2013 – present), Charles Schwab Investment Management, Inc.; Executive Director (Apr. 2011 – Sept. 2013), J.P. Morgan Investor Services; Assistant Treasurer (May 2005 – Mar. 2011), Massachusetts Financial Service Investment Management. |
| George Pereira 1964 Senior Vice President and Chief Operating Officer (Officer of The Charles Schwab Family of Funds, Schwab Investments, Schwab Capital Trust and Schwab Annuity Portfolios since 2004; Laudus Trust since 2006; Schwab Strategic Trust since 2009) | Senior Vice President and Chief Financial Officer (Nov. 2004 – present) and Chief Operating Officer (Jan. 2011 – present), Charles Schwab Investment Management, Inc.; Senior Vice President and Chief Operating Officer (Jan. 2016 – present), Schwab Funds, Laudus Funds and Schwab ETFs; Treasurer and Chief Financial Officer (June 2006 – Dec. 2015), Laudus Funds; Treasurer and Principal Financial Officer (Nov. 2004 – Dec. 2015), Schwab Funds; Treasurer and Principal Financial Officer (Oct. 2009 – Dec. 2015), Schwab ETFs; Director (Apr. 2005 – present), Charles Schwab Worldwide Funds plc and Charles Schwab Asset Management (Ireland) Limited. |
| Omar Aguilar 1970 Senior Vice President and Chief Investment Officer – Equities and Multi-Asset Strategies (Officer of The Charles Schwab Family of Funds, Schwab Investments, Schwab Capital Trust, Schwab Annuity Portfolios, Schwab Strategic Trust and Laudus Trust since 2011) | Senior Vice President and Chief Investment Officer – Equities and Multi-Asset Strategies (Apr. 2011 – present), Charles Schwab Investment Management, Inc.; Senior Vice President and Chief Investment Officer – Equities and Multi-Asset Strategies (June 2011 – present), Schwab Funds, Laudus Funds and Schwab ETFs; Head of the Portfolio Management Group and Vice President of Portfolio Management (May 2009 – Apr. 2011), Financial Engines, Inc. (investment management firm); Head of Quantitative Equity (July 2004 – Jan. 2009), ING Investment Management. |
| Brett Wander 1961 Senior Vice President and Chief Investment Officer – Fixed Income (Officer of The Charles Schwab Family of Funds, Schwab Investments, Schwab Capital Trust, Schwab Annuity Portfolios, Schwab Strategic Trust and Laudus Trust since 2011) | Senior Vice President and Chief Investment Officer – Fixed Income (Apr. 2011 – present), Charles Schwab Investment Management, Inc.; Senior Vice President and Chief Investment Officer – Fixed Income (June 2011 – present), Schwab Funds, Laudus Funds and Schwab ETFs; Senior Managing Director, Global Head of Active Fixed-Income Strategies (Jan. 2008 – Oct. 2010), State Street Global Advisors; Director of Alpha Strategies (Apr. 2006 – Jan. 2008), Loomis, Sayles & Company (investment management firm). |
| David Lekich 1964 Chief Legal Officer and Secretary, Schwab Funds and Schwab ETFs Vice President and Assistant Clerk, Laudus Funds (Officer of The Charles Schwab Family of Funds, Schwab Investments, Schwab Capital Trust, Schwab Annuity Portfolios, Schwab Strategic Trust and Laudus Trust since 2011) | Senior Vice President (Sept. 2011 – present) and Vice President (Mar. 2004 – Sept. 2011), Charles Schwab & Co., Inc.; Senior Vice President and Chief Counsel (Sept. 2011 – present) and Vice President (Jan. 2011 – Sept. 2011), Charles Schwab Investment Management, Inc.; Secretary (Apr. 2011 – present) and Chief Legal Officer (Dec. 2011 – present), Schwab Funds; Vice President and Assistant Clerk (Apr. 2011 – present), Laudus Funds; Secretary (May 2011 – present) and Chief Legal Officer (Nov. 2011 – present), Schwab ETFs. |
| Catherine MacGregor 1964 Vice President and Assistant Secretary, Schwab Funds and Schwab ETFs Chief Legal Officer, Vice President and Clerk, Laudus Funds (Officer of The Charles Schwab Family of Funds, Schwab Investments, Schwab Capital Trust, Schwab Annuity Portfolios and Laudus Trust since 2005; Schwab Strategic Trust since 2009) | Vice President (July 2005 – present), Charles Schwab & Co., Inc.; Vice President (Sept. 2005 – present), Charles Schwab Investment Management, Inc.; Vice President (Dec. 2005 – present) and Chief Legal Officer and Clerk (Mar. 2007 – present), Laudus Funds; Vice President (Nov. 2005 – present) and Assistant Secretary (June 2007 – present), Schwab Funds; Vice President and Assistant Secretary (Oct. 2009 – present), Schwab ETFs. |
| 1 | Each Trustee shall hold office until the election and qualification of his or her successor, or until he or she dies, resigns or is removed. The retirement policy requires that each independent trustee retire by December 31 of the year in which the Trustee turns 74 or the Trustee’s twentieth year of service as an independent trustee on any trust in the Fund Complex, whichever occurs first. |
| 2 | Mr. Bettinger, Mr. de St. Paer and Mr. Martinetto are Interested Trustees. Mr. Bettinger is an Interested Trustee because he owns stock of The Charles Schwab Corporation (CSC), the parent company of Charles Schwab Investment Management, Inc. (CSIM), the investment adviser for the trusts in the Fund Complex, is an employee and director of Charles Schwab & Co., Inc. (CS&Co), the principal underwriter for The Charles Schwab Family of Funds, Schwab Investments, Schwab Capital Trust, Schwab Annuity Portfolios and Laudus Trust, and is a director of CSIM. Mr. de St. Paer is an Interested Trustee because he owns stock of CSC and is an employee and director of CSIM. Mr. Martinetto is an Interested Trustee because he owns stock of CSC and is an employee and director of CS&Co. |
| 3 | The President, Treasurer and Secretary/Clerk hold office until their respective successors are chosen and qualified or until he or she sooner dies, resigns, is removed or becomes disqualified. Each of the other officers serves at the pleasure of the Board. |
THIS IS NOT PART OF THE SHAREHOLDER REPORT
INFORMATION.
The Schwab Funds Family®
Member SIPC®
Printed on recycled paper.
| ¹ | State, local, and the Federal Alternative Minimum Tax may apply. Capital gains are not exempt from Federal Taxation. |
| ² | You could lose money by investing in the Schwab Money Funds. All Schwab Money Funds with the exception of Schwab Variable Share Price Money Fund seek to preserve the value of your investment at $1.00 per share, but cannot guarantee they will do so. Because the share price of Schwab Variable Share Price Money Fund will fluctuate, when you sell your shares they may be worth more or less than what you originally paid for them. All Schwab Money Funds with the exception of Schwab Government Money Fund, Schwab Retirement Government Money Fund, Schwab U.S. Treasury Money Fund, Schwab Treasury Obligations Money Fund and Schwab Government Money Market Portfolio may impose a fee upon the sale of your shares or may temporarily suspend your ability to sell shares if the Fund’s liquidity falls below required minimums because of market conditions or other factors. An investment in the Schwab Money Funds is not insured or guaranteed by the Federal Deposit Insurance Corporation or any other government agency. The Schwab Money Funds’ sponsor has no legal obligation to provide financial support to the Funds, and you should not expect that the sponsor will provide financial support to the Funds at any time. |
00227488
Table of Contents
| Item 2: | Code of Ethics. |
| (a) | Registrant has adopted a code of ethics that applies to its principal executive officer, principal financial officer, and any other persons who perform a similar function, regardless of whether these individuals are employed by Registrant or a third party. |
| (c) | During the period covered by the report, no amendments were made to the provisions of this code of ethics. |
| (d) | During the period covered by the report, Registrant did not grant any waivers, including implicit waivers, from the provisions of this code of ethics. |
| (f)(1) | Registrant has filed this code of ethics as an exhibit pursuant to Item 12(a)(1) of FormN-CSR. |
| Item 3: | Audit Committee Financial Expert. |
Registrant’s Board of Trustees has determined that Kiran M. Patel and Kimberly S. Patmore, each currently serving on its audit, compliance and valuation committee, are each an “audit committee financial expert,” as such term is defined in Item 3 of FormN-CSR. Each member of Registrant’s audit, compliance and valuation committee is “independent” under the standards set forth in Item 3 of FormN-CSR.
The designation of each of Mr. Patel and Ms. Patmore as an “audit committee financial expert” pursuant to Item 3 of FormN-CSR does not (i) impose upon such individual any duties, obligations, or liability that are greater than the duties, obligations and liability imposed upon such individual as a member of Registrant’s audit, compliance and valuation committee or Board of Trustees in the absence of such designation; and (ii) affect the duties, obligations or liability of any other member of Registrant’s audit, compliance and valuation committee or Board of Trustees.
| Item 4: | Principal Accountant Fees and Services. |
Registrant is composed offifty-one operational series. One series has a fiscalyear-end of February 28, whose annual financial statements are reported in Item 1, eleven series have a fiscalyear-end of March 31,thirty-six series have a fiscalyear-end of October 31, and three series have a fiscalyear-end of December 31. Principal accountant fees disclosed in Items 4(a)-(d) and
Table of Contents
4(g) include fees billed for services rendered tofifty-two operational series during 2018/2019 and forty-nine operational series during 2017/2018, based on their respective 2018/2019 and 2017/2018 fiscal years, as applicable.
The following table presents fees billed by the principal accountant in each of the last two fiscal years for the services rendered to the Funds:
| (a) Audit Fees | (b) Audit-Related Fees1 | (c) Tax Fees2 | (d) All Other Fees3 | |||||||||||||||||||||||||
Fiscal Year | Fiscal Year 2017/2018 | Fiscal Year 2018/2019 | Fiscal Year 2017/2018 | Fiscal Year 2018/2019 | Fiscal Year 2017/2018 | Fiscal Year 2018/2019 | Fiscal Year 2017/2018 | |||||||||||||||||||||
| $1,473,405 | $ | 1,404,027 | $ | 84,840 | $ | 90,000 | $ | 190,626 | $ | 169,346 | $ | 0 | $ | 0 | ||||||||||||||
| 1 | The nature of the services includes assurance and related services reasonably related to the performance of the audit of financial statements not included in Audit Fees. |
| 2 | The nature of the services includes tax compliance, tax advice and tax planning. |
| 3 | The nature of the services include agreed upon procedures relating to Charles Schwab Investment Management., Inc.’s, (“CSIM”) expenses for purposes of Section 15(c) of the Investment Company Act of 1940. |
| (e) | (1) | Registrant’s audit, compliance and valuation committee does not havepre-approval policies and procedures as described in paragraph (c)(7) of Rule2-01 of RegulationS-X. | ||
| (2) | There were no services described in each of paragraphs (b) through (d) above (including services required to be approved by Registrant’s audit, compliance and valuation committee pursuant to paragraph (c)(7)(ii) of Rule2-01 of RegulationS-X) that were approved by Registrant’s audit, compliance and valuation committee pursuant to paragraph (c)(7)(i)(C) of Rule2-01 of RegulationS-X. | |||
(f) Not applicable.
(g) Below are the aggregatenon-audit fees billed in each of the last two fiscal years by Registrant’s principal accountant for services rendered to Registrant, to Registrant’s investment adviser, and to any entity controlling, controlled by, or under common control with Registrant’s investment adviser that provides ongoing services to Registrant.
2018/2019: $275,466 2017/2018: $259,346
Table of Contents
| (h) | During the past fiscal year, allnon-audit services provided by Registrant’s principal accountant to either Registrant’s investment adviser or to any entity controlling, controlled by, or under common control with Registrant’s investment adviser that provides ongoing services to Registrant werepre-approved. Included in the audit, compliance and valuation committee’spre-approval was the review and consideration as to whether the provision of thesenon-audit services is compatible with maintaining the principal accountant’s independence. |
| Item 5: | Audit Committee of Listed Registrants. |
Not applicable.
| Item 6: | Schedule of Investments. |
The schedule of investments is included as part of the report to shareholders filed under Item 1 of this Form.
| Item 7: | Disclosure of Proxy Voting Policies and Procedures forClosed-End Management Investment Companies. |
Not applicable.
| Item 8: | Portfolio Managers ofClosed-End Management Investment Companies. |
Not applicable.
| Item 9: | Purchases of Equity Securities byClosed-End Management Investment Company and Affiliated Purchasers. |
Not applicable.
| Item 10: | Submission of Matters to a Vote of Security Holders. |
Not applicable.
Table of Contents
| Item 11: | Controls and Procedures. |
| (a) | Based on their evaluation of Registrant’s disclosure controls and procedures, as of a date within 90 days of the filing date, Registrant’s Chief Executive Officer, Jonathan de St. Paer and Registrant’s Chief Financial Officer, Mark Fischer, have concluded that Registrant’s disclosure controls and procedures are: (i) reasonably designed to ensure that information required to be disclosed in this report is appropriately communicated to Registrant’s officers to allow timely decisions regarding disclosures required in this report; (ii) reasonably designed to ensure that information required to be disclosed in this report is recorded, processed, summarized and reported in a timely manner; and (iii) are effective in achieving the goals described in (i) and (ii) above. |
| (b) | During the period covered by this report, there have been no changes in Registrant’s internal control over financial reporting that the above officers believe to have materially affected, or to be reasonably likely to materially affect, Registrant’s internal control over financial reporting. |
| Item 12: | Exhibits. |
| (a) | (1) Registrant’s code of ethics (that is the subject of the disclosure required by Item 2(a)) is attached. |
| (2) | Separate certifications for Registrant’s principal executive officer and principal financial officer, as required by Rule30a-2(a) under the 1940 Act, are attached. |
| (3) | Not applicable. |
| (b) | A certification for Registrant’s principal executive officer and principal financial officer, as required by Rule30a-2(b) under the 1940 Act, is attached. This certification is being furnished to the Securities and Exchange Commission solely pursuant to 18 U.S.C. section 1350 and is not being filed as part of the FormN-CSR with the Commission. |
Pursuant to the requirements of the Securities Exchange Act of 1934 and the Investment Company Act of 1940, the registrant has duly caused this report to be signed on its behalf by the undersigned, thereunto duly authorized.
Table of Contents
(Registrant)Schwab Capital Trust
| By: | /s/ Jonathan de St. Paer | |
| Jonathan de St. Paer | ||
| Chief Executive Officer | ||
| Date: | April 16, 2019 | |
Pursuant to the requirements of the Securities Exchange Act of 1934 and the Investment Company Act of 1940, this report has been signed below by the following persons on behalf of the registrant and in the capacities and on the dates indicated.
| By: | /s/ Jonathan de St. Paer | |
| Jonathan de St. Paer | ||
| Chief Executive Officer | ||
| Date: | April 16, 2019 | |
| By: | /s/ Mark Fischer | |
| Mark Fischer | ||
| Chief Financial Officer | ||
| Date: | April 16, 2019 | |