UNITED STATES
SECURITIES AND EXCHANGE COMMISSION
Washington, D.C. 20549
FORM N-CSR
CERTIFIED SHAREHOLDER REPORT OF REGISTERED
MANAGEMENT INVESTMENT COMPANIES
Investment Company Act file number: 811-07704
Schwab Capital Trust
(Exact name of registrant as specified in charter)
211 Main Street, San Francisco, California 94105
(Address of principal executive offices) (Zip code)
Omar Aguilar
Schwab Capital Trust
211 Main Street, San Francisco, California 94105
(Name and address of agent for service)
Registrant’s telephone number, including area code: (415) 636-7000
Date of fiscal year end: October 31
Date of reporting period: October 31, 2023
Item 1: Report(s) to Shareholders.
Annual Report | October 31, 2023
Schwab International Opportunities Fund
This page is intentionally left blank.
Schwab International Opportunities Fund
Fund investment adviser: Charles Schwab Investment Management, Inc., dba Schwab Asset Management®
Distributor: Charles Schwab & Co., Inc. (Schwab)
The Sector/Industry classifications in this report use the Global Industry Classification Standard (GICS) which was developed by and is the exclusive property of MSCI Inc. (MSCI) and Standard & Poor’s (S&P). GICS is a service mark of MSCI and S&P and has been licensed for use by Schwab.
Schwab International Opportunities Fund | Annual Report1
Schwab International Opportunities Fund
The performance data quoted represents past performance. Past performance does not guarantee future results. Investment returns and principal value of an investment will fluctuate so that an investor’s shares may be worth more or less than their original cost. Current performance may be lower or higher than performance data quoted. To obtain performance information current to the most recent month end, please visit www.schwabassetmanagement.com/schwabfunds_prospectus.
Total Return for the 12 Months Ended October 31, 2023 |
Schwab International Opportunities Fund1 (Ticker Symbol: SWMIX) | |
| |
Fund Category: Morningstar Foreign Large Growth4 | |
| |
All total returns on this page assume dividends and distributions were reinvested. Index figures do not include trading and management costs, which would lower performance. Indices are unmanaged and cannot be invested in directly. Performance results less than one year are not annualized.
For index definitions, please see the Glossary.
Fund expenses may have been partially absorbed by the investment adviser and its affiliates. Without these reductions, the fund’s total return would have been lower. Performance does not reflect the deduction of taxes that a shareholder would pay on fund distributions or on the redemption of fund shares.
Foreign securities can involve risks such as political and economic instability and currency risk. These risks may be greater in emerging markets.
1
The fund’s performance relative to the index may be affected by fair-value pricing and timing differences in foreign exchange calculations. See financial note 2 for more information.
2
Total return for the report period presented in the table differs from the return in the Financial Highlights. The total return presented in the above table is calculated based on the net asset value (NAV) at which shareholder transactions were processed. The total return presented in the Financial Highlights section of the report is calculated in the same manner, but also takes into account certain adjustments that are necessary under generally accepted accounting principles required in the annual and semiannual reports.
3
The net version of the index reflects reinvested dividends net of withholding taxes but reflects no deductions for expenses or other taxes.
4
Source for category information: Morningstar, Inc. The Morningstar Category return represents all active and index mutual funds and ETFs within the category as of the report date.
2
Schwab International Opportunities Fund | Annual Report
Schwab International Opportunities Fund
The Investment Environment
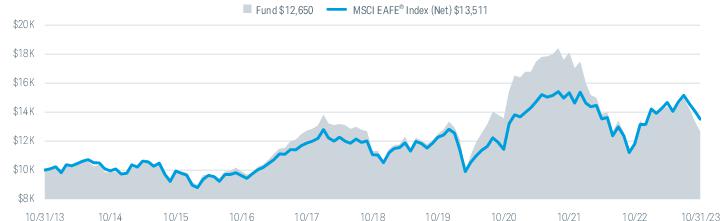
For the 12-month reporting period ended October 31, 2023, international equity markets posted positive returns while U.S. equity markets were mixed. U.S. stocks were volatile for the first half of the reporting period as inflation remained elevated, the U.S. Federal Reserve (Fed) continued to raise interest rates, and the failure of three U.S. regional banks in early March raised concerns about the stability of the banking sector. Despite these headwinds, as inflation began to ease, U.S. stocks staged a relatively steady upswing through August driven primarily by performance of the “Magnificent Seven” (Alphabet, Inc., Amazon.com, Inc., Apple, Inc., Meta Platforms, Inc., Microsoft Corp., NVIDIA Corp., and Tesla, Inc.). U.S. stocks, particularly dividend paying stocks, began to falter over the final two months of the reporting period as soaring U.S. Treasury yields offered investors attractive alternatives to stocks. Outside the U.S., the ongoing war between Russia and Ukraine and the Israel-Hamas war that broke out following Hamas’ attack on Israel in early October weighed on the global economy. The U.S. dollar, as measured against a basket of international currencies, generally weakened until mid-July, when it hit a reporting-period low, then began to rise but ended the reporting period weaker than where it began. For the reporting period, the S&P 500® Index, a bellwether for the overall U.S. stock market, returned 10.14%. Outside the U.S., the MSCI EAFE® Index (Net)*, a broad measure of developed international equity performance, returned 14.40% and the MSCI Emerging Markets Index (Net)* returned 10.80% for the reporting period.
Economies around the world grew out of sync as they wrestled with record levels of government debt, rising geopolitical tensions, and weak productivity gains that stifled economic growth. The U.S. economy continued to show unexpected resiliency. Surprisingly robust job growth and strong consumer spending helped propel U.S. gross domestic product (GDP) to a 5.2% annualized growth rate for the third quarter of 2023, up from roughly 2% over the prior three quarters. Oil prices were volatile, ranging from a high of $92 per barrel at the beginning of the reporting period to a low of $66 and ending the period at just over $80 per barrel. Eurozone GDP growth contracted slightly in the fourth quarter of 2022 driven by manufacturing pressures and headwinds related to oil and commodity prices, was flat for the first quarter of 2023, expanded slightly for the second quarter of 2023 bolstered by a moderation in inflationary pressures, and contracted slightly for the third quarter of 2023 as financing conditions remained tight. The
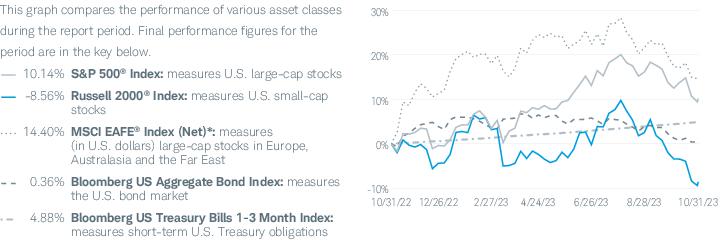
Asset Class Performance Comparison % returns during the 12 months ended October 31, 2023
Index figures assume dividends and distributions were reinvested. Index figures do not include trading and management costs, which would lower performance. Indices are unmanaged and cannot be invested in directly. Performance results less than one year are not annualized. Past performance is not a guarantee of future results.
For index definitions, please see the Glossary.
Data source: Index provider websites and Schwab Asset Management.
Nothing in this report represents a recommendation of a security by the investment adviser.
Management views may have changed since the report date.
*
The net version of the index reflects reinvested dividends net of withholding taxes but reflects no deductions for expenses or other taxes.
Schwab International Opportunities Fund | Annual Report3
Schwab International Opportunities Fund
The Investment Environment (continued)
United Kingdom posted small gains in GDP growth throughout the reporting period, with household consumption expenditures and manufacturing output among key growth drivers. In Japan, following flat GDP growth in the fourth quarter of 2022, GDP rose for the first two quarters of 2023, primarily on rising exports and falling imports. Among emerging markets, China’s GDP grew throughout the reporting period as the government’s various policies seeking to help the economy have offset the impact of a prolonged property crisis and weak trade. India’s GDP grew in the fourth quarter of 2022 and the first two quarters of 2023, driven primarily by robust performance of the services sector along with strong consumer demand and increased government spending.
In its efforts to lower inflation, the Fed raised interest rates six times during the reporting period, increasing the federal funds rate from a range of 3.00% to 3.25% to a range of 5.25% to 5.50%. At its meetings in June, September, and October, the Fed maintained the then current rates, citing robust economic activity, strong—though moderating—job gains, and low unemployment while acknowledging tighter financial and credit conditions for households and businesses. The Fed also maintained its program to reduce the assets held on its balance sheet, though its balance sheet temporarily spiked in March 2023 when the Fed supported banks after the failure of three U.S. regional banks. Despite the spike, balance sheet assets declined over the reporting period. Central banks outside the United States also battled with persistently high, albeit waning, inflation. After raising rates eight times during the reporting period, the European Central Bank held its rate steady at its October meeting as inflation and pricing pressures finally showed signs of easing. Similarly, the Bank of England maintained its key official bank rate at its September meeting, after seven rate hikes during the reporting period, leaving borrowing costs at a 15-year high. In contrast, the Bank of Japan continued to uphold its short-term interest rate target of -0.1%, unchanged since 2016, despite inflationary pressures but relaxed its yield control policy. Monetary policies in emerging markets were mixed. Central banks in India, Indonesia, Mexico, Pakistan, and Russia all raised their rates two or more times over the reporting period. In contrast, both Brazil and China cut their key interest rate twice during the reporting period.
4
Schwab International Opportunities Fund | Annual Report
Schwab International Opportunities Fund
| John Greves, CFA, Managing Director and Head of Multi-Asset Strategies for Schwab Asset Management, is responsible for the day-to-day co-management of the fund. Prior to joining Schwab in 2016, Mr. Greves worked at Russell Investment Management Company (Russell Investments) for 13 years, most recently as a portfolio manager for multi-asset solutions where he managed multiple target date funds, chaired the multi-asset advisory team, and co-authored papers on glide path methodology and benchmarking. Prior to that, he served in several roles for Russell Investments including associate portfolio manager for multi-asset solutions and senior portfolio analyst for multi-asset solutions. |
| Tony Creasy, CFA, Senior Portfolio Manager for Schwab Asset Management, is responsible for the day-to-day co-management of the fund. Prior to his current role, he was a portfolio manager on the Multi-Asset Strategies Team, responsible for the daily management of several multi-asset portfolios. He also spent several years as lead analyst on the Schwab Asset Management Investment Manager Research Team. Prior to that, Mr. Creasy was an institutional investment analyst for Schwab’s retirement investment services group, providing mutual fund analysis to support the Schwab Focus List™. |
| David Rios, Portfolio Manager for Schwab Asset Management, is responsible for the day-to-day management of the portion of the fund that is invested in accordance with a particular index. Prior to this role, Mr. Rios was an associate portfolio manager on the equity index strategies team for four years. His first role with Schwab Asset Management was as a trade operations specialist. Prior to joining Schwab in 2008, Mr. Rios was a senior fund accountant at Investors Bank & Trust (subsequently acquired by State Street Corporation). |
Schwab International Opportunities Fund | Annual Report5
Schwab International Opportunities Fund
The Schwab International Opportunities Fund (the fund) uses a multi-manager strategy. Charles Schwab Investment Management, Inc., dba Schwab Asset Management—the fund’s investment adviser—selects investment subadvisers with strong long-term track records to manage a portion of the fund’s assets. In addition to selecting investment subadvisers and allocating assets among them, Schwab Asset Management is responsible for managing a portion of the fund in accordance with an index and monitoring and coordinating the overall management of the fund. Each subadviser’s and Schwab Asset Management’s portfolio is compared to its respective comparative index that reflects its individual process and philosophy. These comparative indices may differ from the fund’s comparative index.
Market Highlights. For the 12-month reporting period ended October 31, 2023, international equity markets posted positive returns while U.S. equity markets were mixed. U.S. stocks were volatile for the first half of the reporting period as inflation remained elevated, the U.S. Federal Reserve (Fed) continued to raise interest rates, and the failure of three U.S. regional banks in early March raised concerns about the stability of the banking sector. Despite these headwinds, as inflation began to ease, U.S. stocks staged a relatively steady upswing through August driven primarily by performance of the “Magnificent Seven” (Alphabet, Inc., Amazon.com, Inc., Apple, Inc., Meta Platforms, Inc., Microsoft Corp., NVIDIA Corp., and Tesla, Inc.). U.S. stocks, particularly dividend paying stocks, began to falter over the final two months of the reporting period as soaring U.S. Treasury yields offered investors attractive alternatives to stocks. Outside the U.S., the ongoing war between Russia and Ukraine and the Israel-Hamas war that broke out following Hamas’ attack on Israel in early October weighed on the global economy. The U.S. dollar, as measured against a basket of international currencies, generally weakened until mid-July, when it hit a reporting-period low, then began to rise but ended the reporting period weaker than where it began.
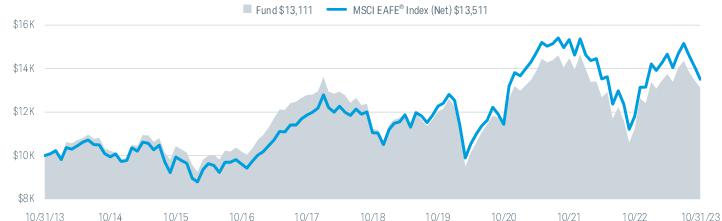
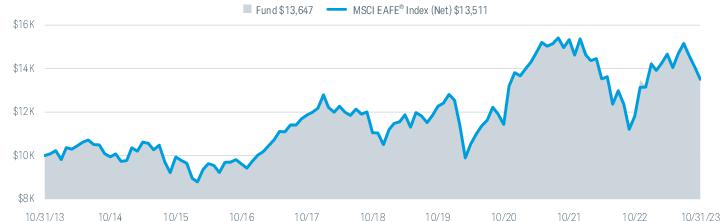
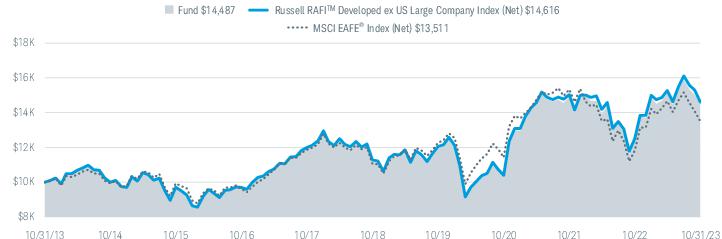
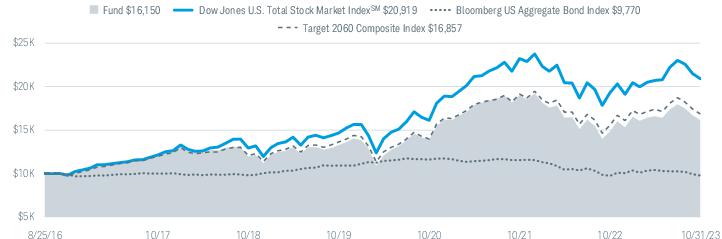
Performance. For the 12-month period ended October 31, 2023, the fund returned 7.15%1, underperforming the fund’s comparative index, the MSCI EAFE® Index (Net) (the index), which returned 14.40%2.
Positioning and Strategies. Over the 12-month reporting period, three of the fund’s active subadvisers posted negative returns and two of the fund’s active subadvisers posted positive returns.
Effective September 26, 2023, Mondrian Investment Partners Limited (Mondrian) was removed as a subadviser. Assets managed by Mondrian were reallocated to Columbia Management Investment Advisers, LLC (Columbia). For the period of November 1, 2022, through September 26, 2023, Mondrian posted a negative return and underperformed its comparative index. Stock selection in the consumer discretionary and information technology sectors detracted from relative return while allocation in the real estate and industrials sectors contributed to relative return. From a regional perspective, allocation in stocks from Luxembourg and stock selection in Japan detracted from relative return and stock selection in the United Kingdom and allocation in Israeli stocks contributed to relative return.
Effective October 10, 2023, Columbia began managing a portion of the fund. For the period of October 10, 2023, through October 31, 2023, Columbia posted a negative return and underperformed its comparative index. Stock selection in the financials and industrials sectors detracted from relative return and allocation in the energy and industrials sectors contributed to relative return. From a regional perspective, stock selection in the Netherlands and Canada detracted from relative return while allocations in Canada and the Netherlands contributed to relative return.
American Century Investment Management, Inc. posted a negative return and underperformed its comparative index. Stock selection in the information technology and materials sectors detracted from relative return while stock selection in the real estate and consumer staples sectors contributed to relative return. From a regional perspective, allocation in Brazilian stocks and stock selection within South Korea detracted from relative return and stock selection in India and Thailand contributed to relative performance.
Baillie Gifford Overseas Limited posted a positive return but underperformed its comparative index. Stock selection in the communication services sector and allocation in the consumer discretionary sector contributed to relative return while stock selection in the health care and financials sectors detracted from relative return. From a regional perspective, allocation in stocks from Luxembourg and stock selection in Italy contributed to relative return and stock selection in the Netherlands and Germany detracted from relative return.
Harris Associates L.P. also posted a positive return and underperformed its comparative index. Stock selection in the consumer discretionary and information technology sectors contributed to relative return while stock selection in the financials and industrials sectors detracted from relative return. From a regional perspective, stock selection in Germany and allocation in Chinese stocks contributed to relative return and stock selection in France and allocation to Japanese stocks detracted from relative return.
Schwab Asset Management seeks to track the performance of the FTSE Developed ex US Quality Factor Index. The fund’s allocation to Schwab Asset Management performed in line with this objective.
1
Total return for the report period above differs from the return in the Financial Highlights. The total return presented above is calculated based on the net asset value (NAV) at which shareholder transactions were processed. The total return presented in the Financial Highlights section of the report is calculated in the same manner, but also takes into account certain adjustments that are necessary under generally accepted accounting principles required in the annual and semiannual reports.
2
The net version of the index reflects reinvested dividends net of withholding taxes but reflects no deductions for expenses or other taxes.
6
Schwab International Opportunities Fund | Annual Report
Schwab International Opportunities Fund
Performance and Fund Facts as of October 31, 2023
The performance data quoted represents past performance. Past performance does not guarantee future results. Investment returns and principal value of an investment will fluctuate so that an investor’s shares may be worth more or less than their original cost. Current performance may be lower or higher than performance data quoted. To obtain performance information current to the most recent month end, please visit www.schwabassetmanagement.com/schwabfunds_prospectus.
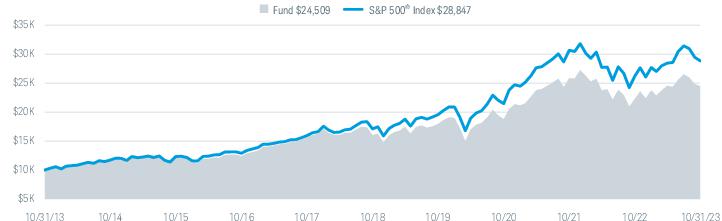
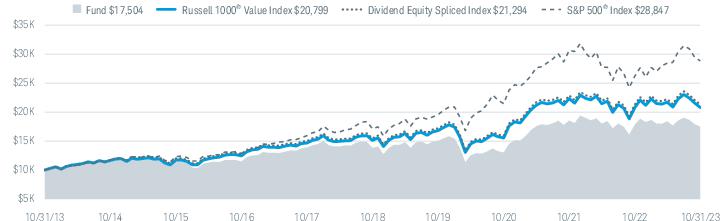
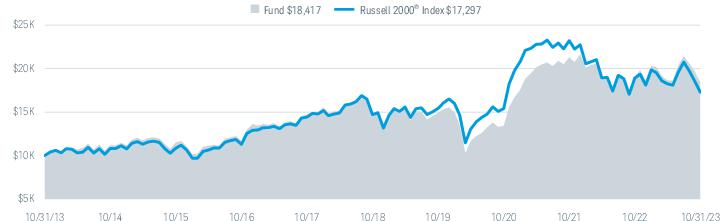
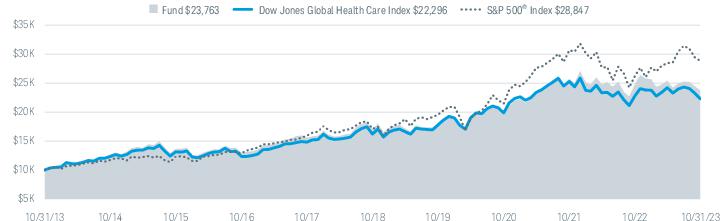
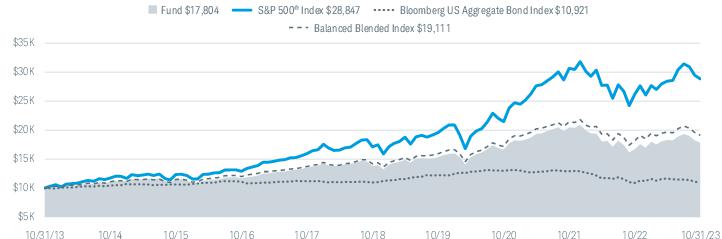
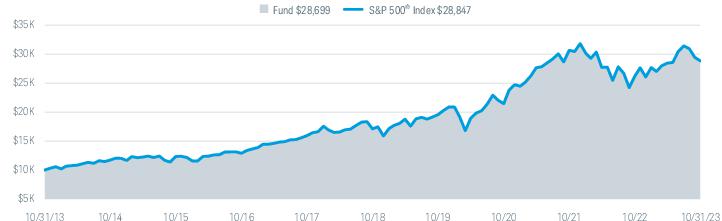
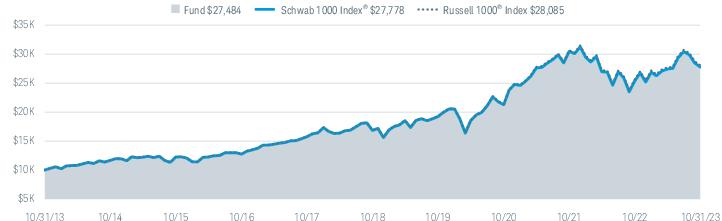
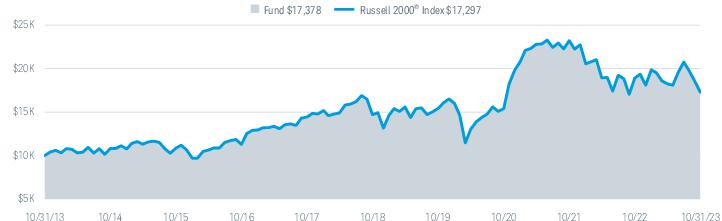
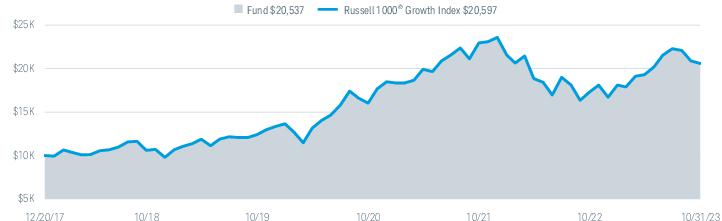
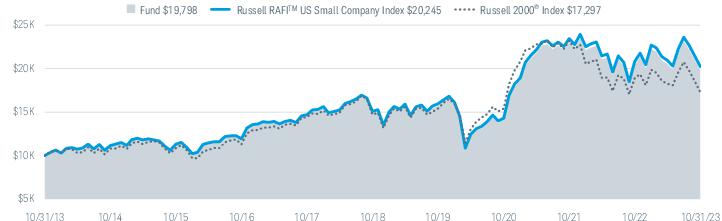
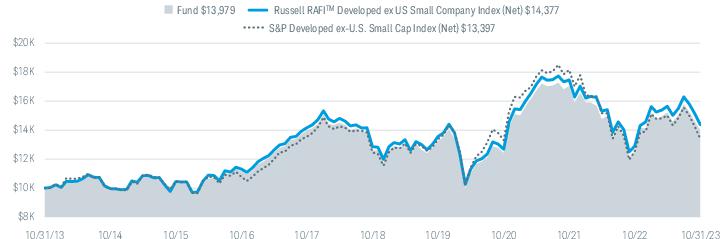
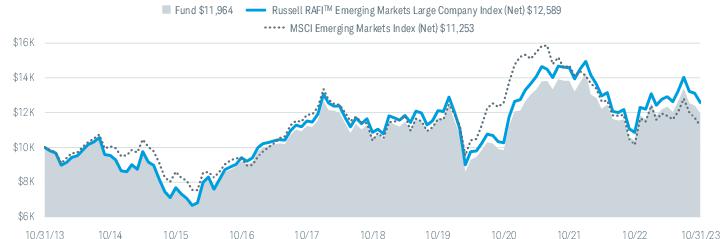
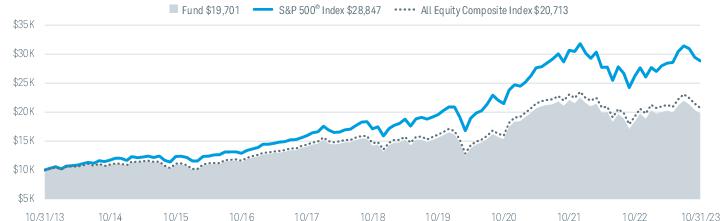
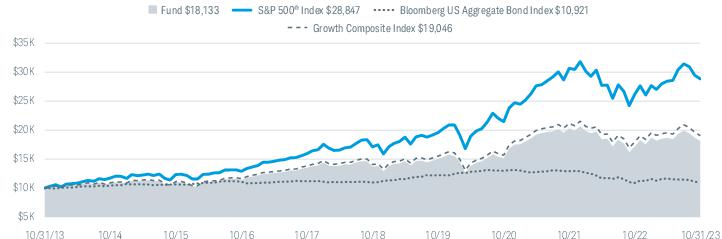
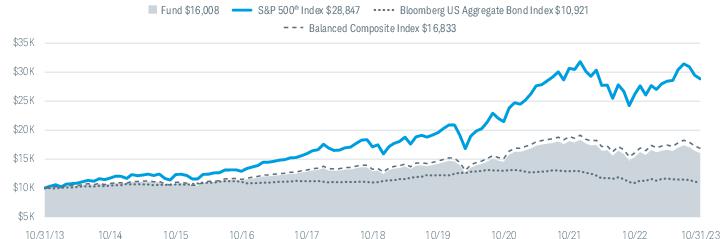
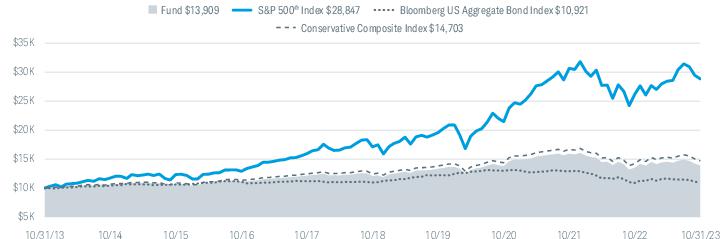
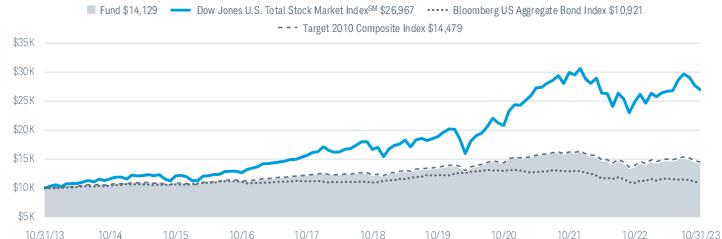
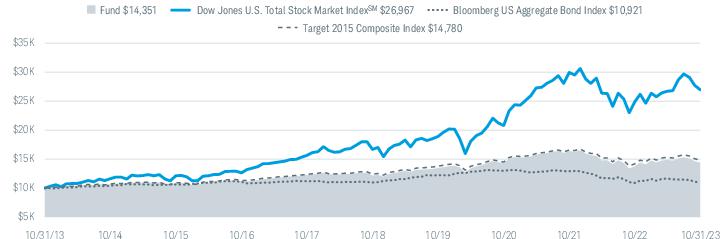
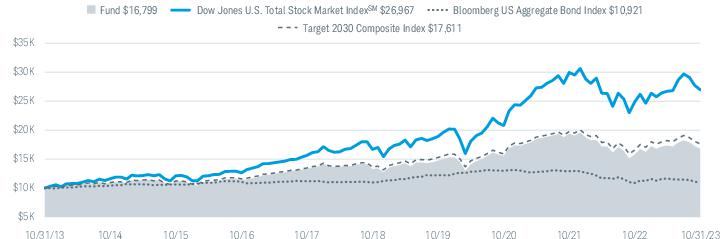
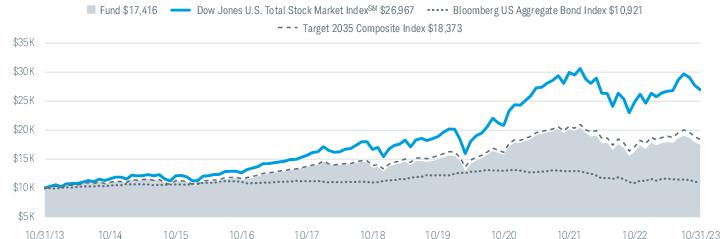
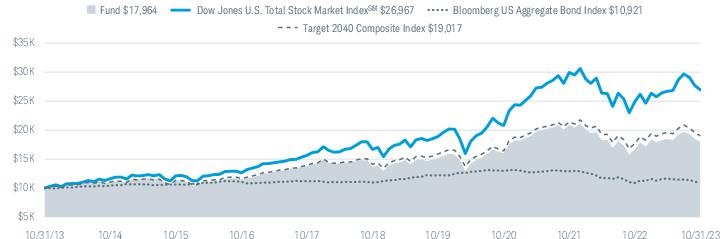
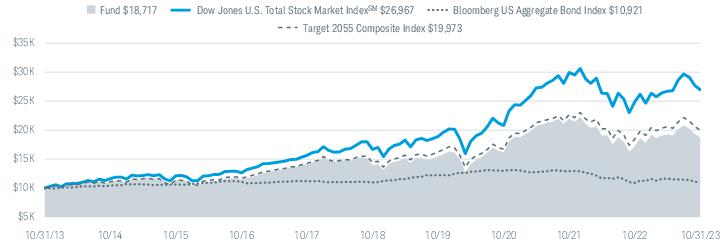
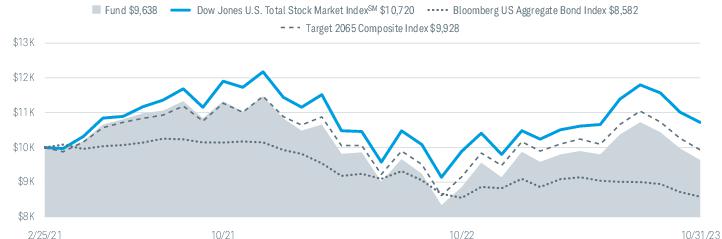
Performance of Hypothetical $10,000 Investment (October 31, 2013 – October 31, 2023)1,2,3
Average Annual Total Returns1,3
| | | |
Fund: Schwab International Opportunities Fund (4/2/04)2 | | | |
| | | |
Fund Category: Morningstar Foreign Large Growth6 | | | |
Fund Expense Ratio7: 0.84% |
All total returns on this page assume dividends and distributions were reinvested. Index figures do not include trading and management costs, which would lower performance. Indices are unmanaged and cannot be invested in directly. Performance results less than one year are not annualized.
For index definitions, please see the Glossary.
1
Fund expenses may have been partially absorbed by the investment adviser and its affiliates. Without these reductions, the fund’s returns would have been lower. These returns do not reflect the deduction of taxes that a shareholder would pay on fund distributions or the redemption of fund shares.
2
The fund commenced operations on October 16, 1996 which became the Schwab International Opportunities Fund (formerly Laudus International MarketMasters Fund) Investor Shares. The Investor Shares were consolidated into Select Shares on February 26, 2019. The performance presented is that of the former Select Shares which commenced operations on April 2, 2004.
3
The fund’s performance relative to the index may be affected by fair-value pricing. See financial note 2 for more information.
4
Total return for the report period presented in the table differs from the return in the Financial Highlights. The total return presented in the above table is calculated based on the net asset value (NAV) at which shareholder transactions were processed. The total return presented in the Financial Highlights section of the report is calculated in the same manner, but also takes into account certain adjustments that are necessary under generally accepted accounting principles required in the annual and semiannual reports.
5
The net version of the index reflects reinvested dividends net of withholding taxes but reflects no deductions for expenses or other taxes.
6
Source for category information: Morningstar, Inc. The Morningstar Category return represents all active and index mutual funds and ETFs within the category as of the report date.
7
As stated in the prospectus. Reflects the total annual fund operating expenses without contractual fee waivers. For actual expense ratios during the period, refer to the financial highlights section of the financial statements.
Schwab International Opportunities Fund | Annual Report7
Schwab International Opportunities Fund
Performance and Fund Facts as of October 31, 2023 (continued)
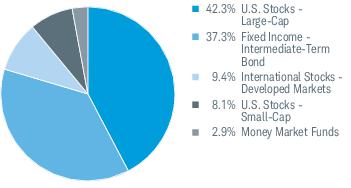
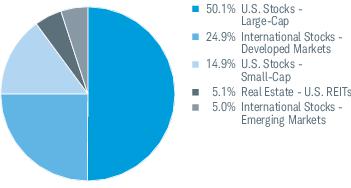
Investment Managers and Allocations1
| | |
Charles Schwab Investment Management, Inc., dba Schwab Asset Management2 | International Large-Cap Developed | |
American Century Investment Management, Inc. | International Small-Cap Growth | |
| International Large-Cap Value | |
Columbia Management Investment Advisers, LLC3 | International All-Cap Blend | |
Baillie Gifford Overseas Limited | | |
| | |
1
For more information about each of the investment manager’s investment styles, refer to the fund’s prospectus.
2
Schwab Asset Management manages a portion of the fund by primarily investing in stocks that are included in the FTSE Developed ex US Quality Factor Index. The Schwab International Opportunities Fund has been developed solely by Schwab Asset Management. Index Ownership – The fund is not in any way connected to or sponsored, endorsed, sold or promoted by the London Stock Exchange Group plc and its group undertakings (collectively, the LSE Group). FTSE Russell is a trading name of certain of the LSE Group companies. All rights in the FTSE Developed ex US Quality Factor Index (the Index) vest in the relevant LSE Group company which owns the Index. “FTSE®” is a trade mark of the relevant LSE Group company and is used by any other LSE Group company under license.
3
Columbia Management Investment Advisers, LLC began managing fund assets on October 10, 2023.
4
Schwab Asset Management can allocate a portion of the fund to particular market sectors, such as emerging markets, utilizing securities, exchange-traded funds (ETFs) and/or other registered investment companies and may also directly manage additional portions of the fund during transitions between investment managers. Schwab Asset Management also manages the cash portion of the fund.
8
Schwab International Opportunities Fund | Annual Report
Schwab International Opportunities Fund
Performance and Fund Facts as of October 31, 2023 (continued)
| |
Weighted Average Market Cap (millions) | |
Price/Earnings Ratio (P/E) | |
| |
| |
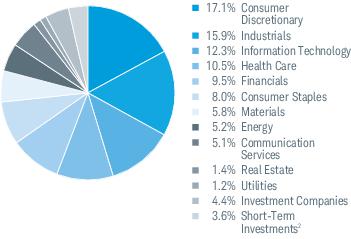
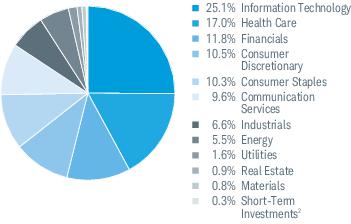
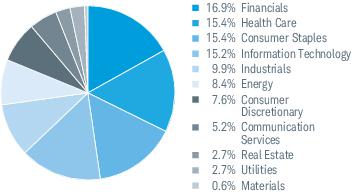
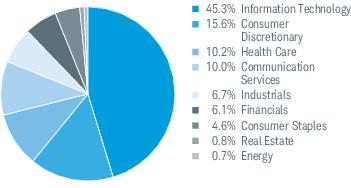
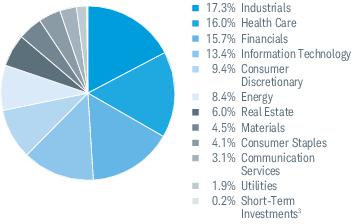
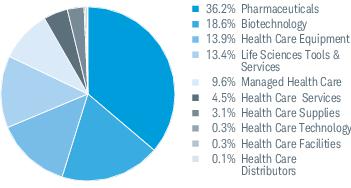
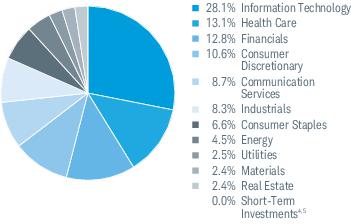
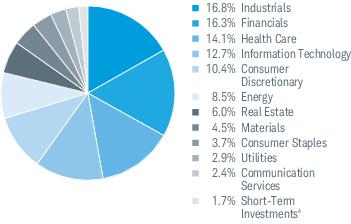
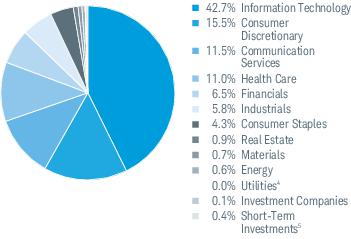
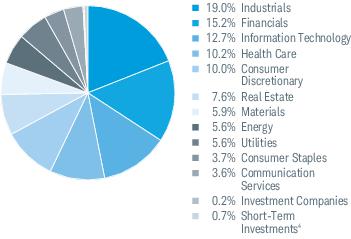
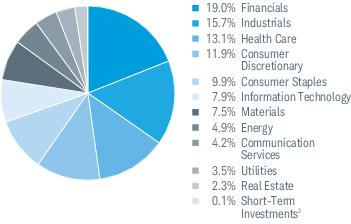
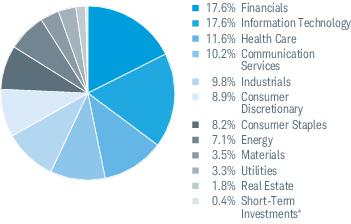
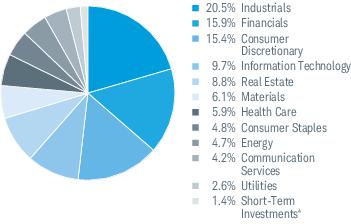
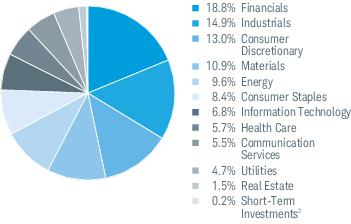
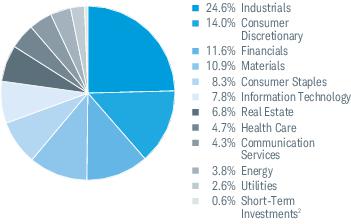
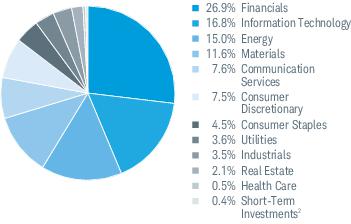
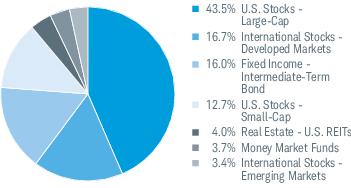
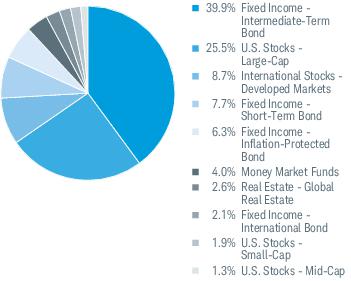
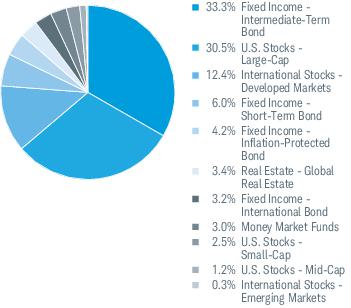
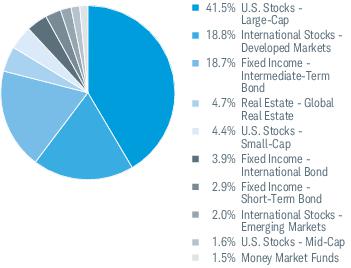
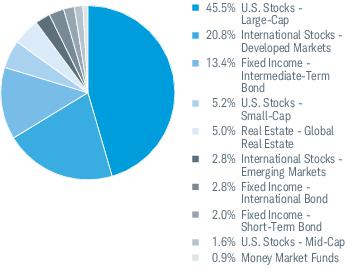
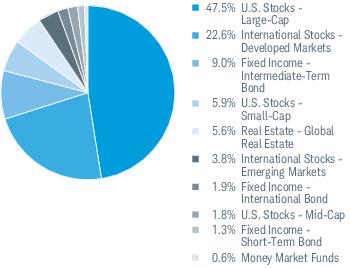
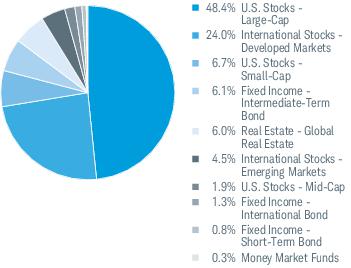
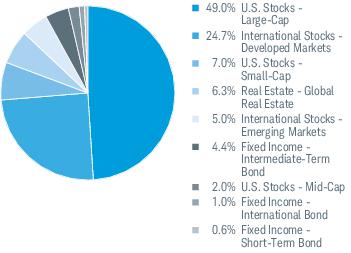
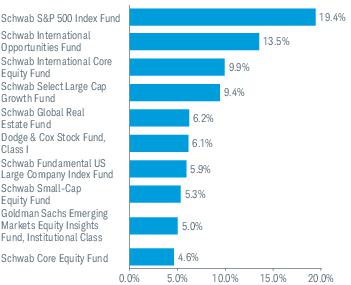
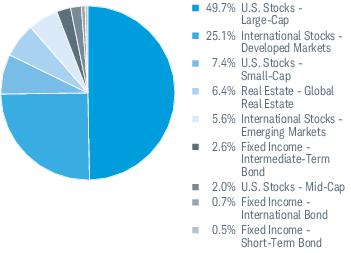
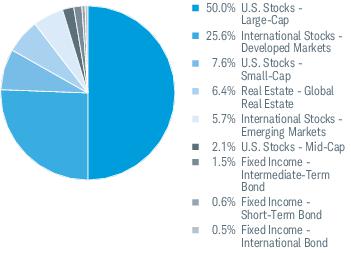
Sector Weightings % of Investments1
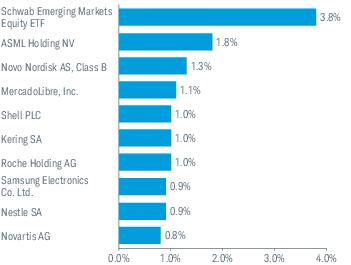
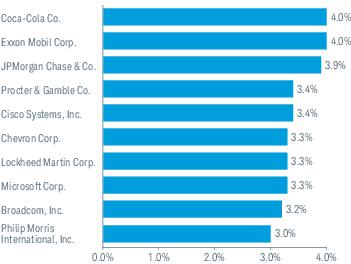
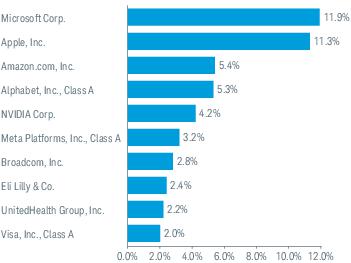
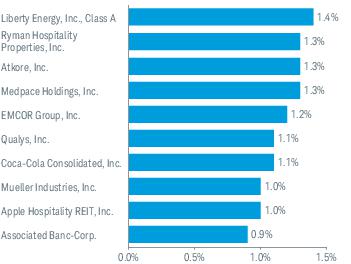
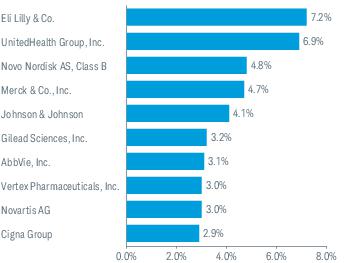
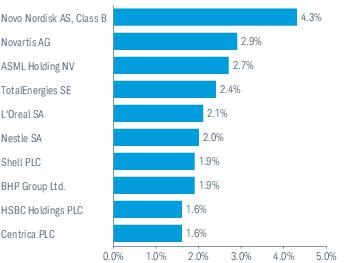
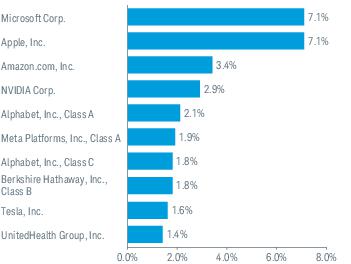
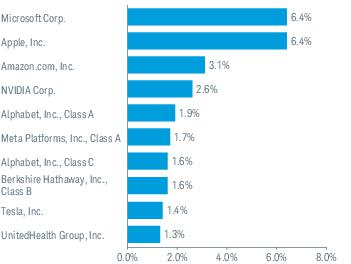
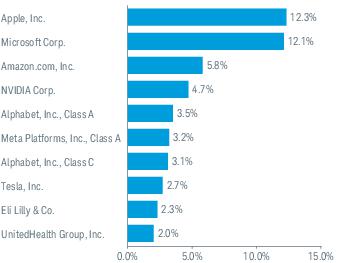
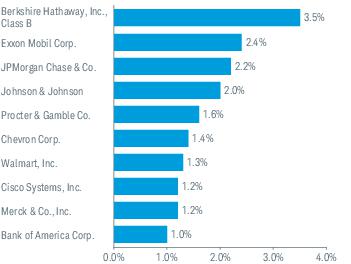
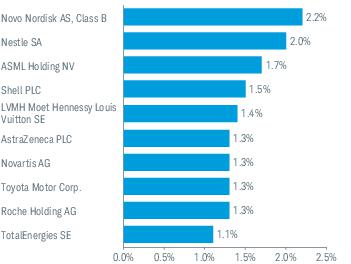
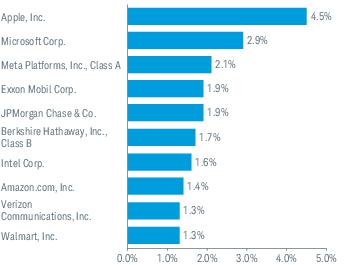
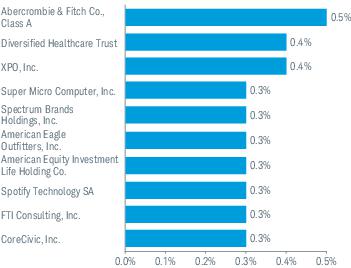
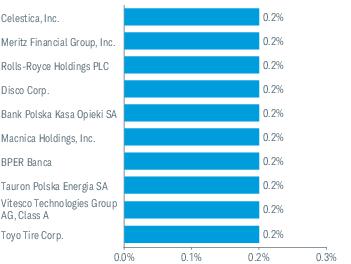
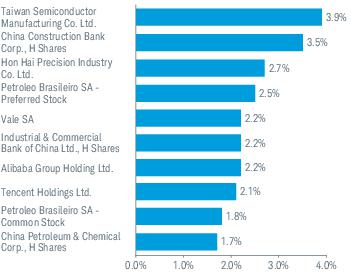
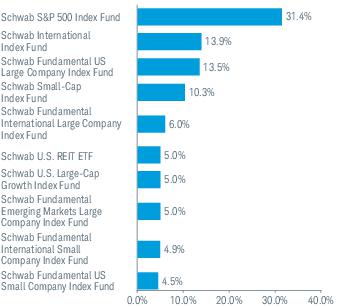
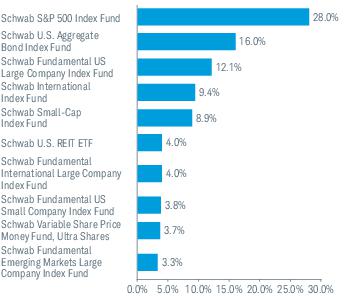
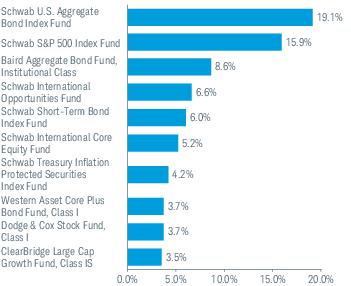
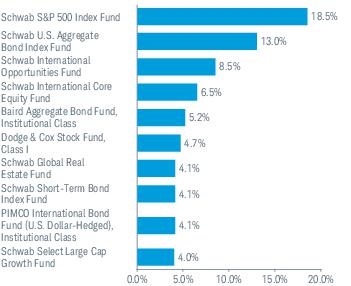
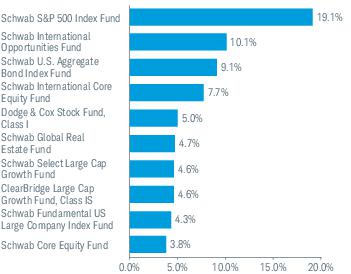
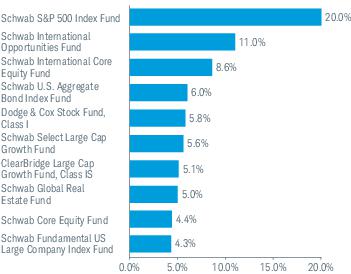
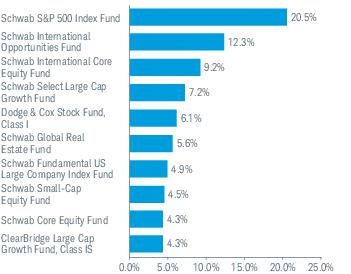
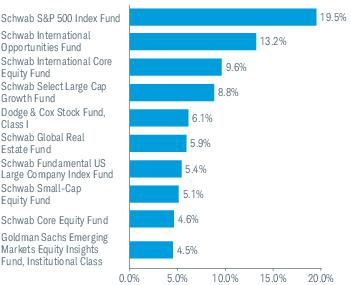
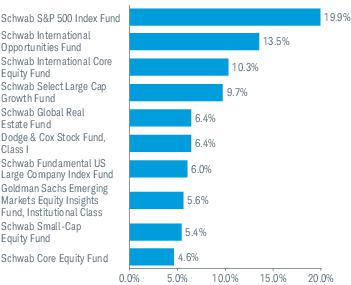
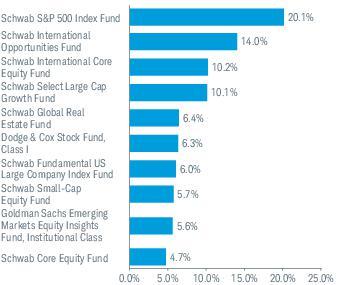
Top Equity Holdings % of Net Assets3
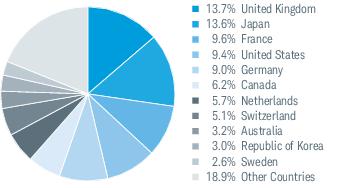
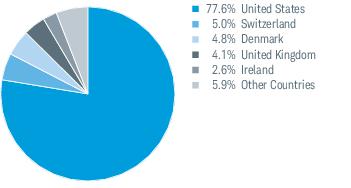
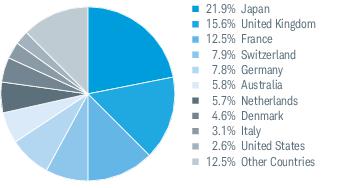
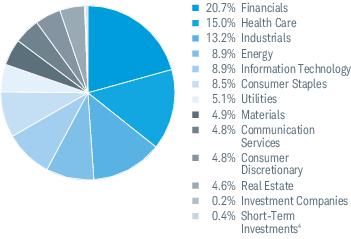
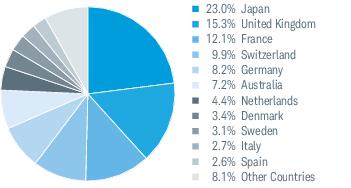
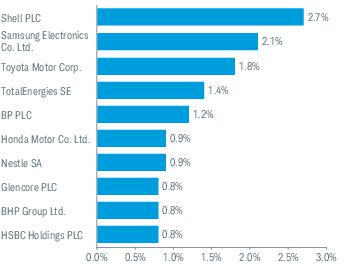
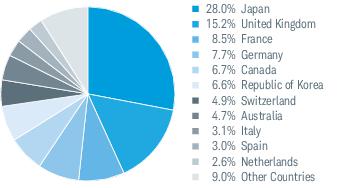
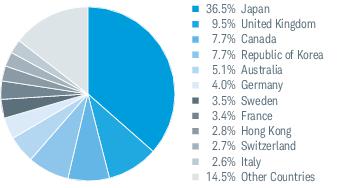
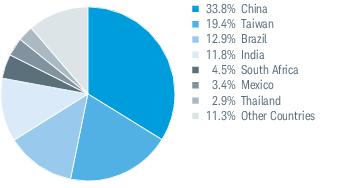
Top Country Weightings % of Investments4
Portfolio holdings may have changed since the report date.
Source of Sector Classification: S&P and MSCI.
International investments are subject to additional risks such as currency fluctuation, geopolitical risk and the potential for illiquid markets. Investing in emerging markets may accentuate these risks.
2
Includes the fund’s position(s) in money market mutual funds registered under the Investment Company Act of 1940, as amended.
3
This list is not a recommendation of any security by the investment adviser.
4
The percentage may differ from the Portfolio Holdings because the above calculation is based on a percentage of total investments, excluding derivatives, whereas the calculation in the Portfolio Holdings is based on a percentage of net assets.
Schwab International Opportunities Fund | Annual Report9
Schwab International Opportunities Fund
Fund Expenses (Unaudited)
Examples for a $1,000 Investment
As a fund shareholder, you may incur two types of costs: (1) transaction costs; and (2) ongoing costs, including management fees, transfer agent and shareholder services fees, and other fund expenses.
The expense examples below are intended to help you understand your ongoing cost (in dollars) of investing in the fund and to compare this cost with the ongoing cost of investing in other mutual funds. These examples are based on an investment of $1,000 invested for six months beginning May 1, 2023 and held through October 31, 2023.
The Actual Return line in the table below provide information about actual account values and actual expenses. You may use this information, together with the amount you invested, to estimate the expenses that you paid over the period. To do so, simply divide your account value by $1,000 (for example, an $8,600 account value ÷ $1,000 = 8.6), then multiply the result by the number given for the fund under the heading entitled “Expenses Paid During Period.”
The Hypothetical Return line in the table below provide information about hypothetical account values and hypothetical expenses based on the fund’s actual expense ratio and an assumed return of 5% per year before expenses. Because the return used is not an actual return, it may not be used to estimate the actual ending account value or expenses you paid for the period.
You may use this information to compare the ongoing costs of investing in the fund and other funds. To do so, compare this 5% hypothetical example with the 5% hypothetical examples that appear in the shareholder reports of the other funds.
Please note that the expenses shown in the table are meant to highlight your ongoing costs only and do not reflect any transactional costs. Therefore, the hypothetical return line of the table is useful in comparing ongoing costs only and will not help you determine the relative total costs of owning different funds. In addition, if these transactional costs were included, your costs would have been higher.
| | BEGINNING
ACCOUNT VALUE
AT 5/1/23 | ENDING
ACCOUNT VALUE
(NET OF EXPENSES)
AT 10/31/23 | EXPENSES PAID
DURING PERIOD
|
Schwab International Opportunities Fund | | | | |
| | | | |
| | | | |
| Based on the most recent six-month expense ratio; may differ from the expense ratio provided in the Financial Highlights. |
| Excludes acquired fund fees and expenses, which are indirect expenses incurred by the fund through its investments in underlying funds. Acquired fund fees and expenses were less than 0.01% during the period May 1, 2023 through October 31, 2023 (see financial note 4, Expense Limitation, for additional information). |
| Expenses for the fund are equal to its annualized expense ratio, multiplied by the average account value over the period, multiplied by the 184 days in the period, and divided by the 365 days in the fiscal year. |
10
Schwab International Opportunities Fund | Annual Report
Schwab International Opportunities Fund
Financial Statements
| | | | | | |
|
Net asset value at beginning of period | | | | | | |
Income (loss) from investment operations: | | | | | | |
Net investment income (loss)2 | | | | | | |
Net realized and unrealized gains (losses) | | | | | | |
Total from investment operations | | | | | | |
| | | | | | |
Distributions from net investment income | | | | | | |
Distributions from net realized gains | | | | | | |
| | | | | | |
Net asset value at end of period | | | | | | |
| | | | | | |
|
Ratios to average net assets: | | | | | | |
| | | | | | |
| | | | | | |
Net investment income (loss) | | | | | | |
| | | | | | |
Net assets, end of period (x 1,000,000) | | | | | | |
| Effective February 26, 2019, the Investor Share class, and the Select Share class were consolidated into a single class of shares of the fund. The financial history as shown in the financial highlights is that of the former Select Shares. |
| Calculated based on the average shares outstanding during the period. |
| Per-share amount was less than $0.005. |
| Ratio excludes less than 0.01% of acquired fund fees and expenses, which are indirect expenses incurred by the fund through its investments in underlying funds and are subject to a contractual expense limitation (see financial note 4, Expense Limitation, for additional information). |
| Effective February 25, 2022, the net operating expense limitation was lowered from 1.25% to 0.86%. The ratio presented for the period ended October 31, 2022 is a blended ratio. |
| Ratio includes less than 0.005% of non-routine proxy expenses. |
| |
Schwab International Opportunities Fund | Annual Report11
Schwab International Opportunities Fund
Portfolio Holdings as of October 31, 2023
This section shows all the securities in the fund’s portfolio and their values as of the report date.
The fund files its complete schedule of portfolio holdings with the U.S. Securities and Exchange Commission (SEC) for the first and third quarters of each fiscal year on Form N-PORT Part F. The fund’s Form N-PORT Part F is available on the SEC’s website at www.sec.gov. You can also obtain this information at no cost on the fund’s website at www.schwabassetmanagement.com/schwabfunds_prospectus, by calling 1-866-414-6349, or by sending an email request to orders@mysummaryprospectus.com. The fund also makes available its complete schedule of portfolio holdings 15 to 20 days after calendar quarters on the fund’s website.
| | |
COMMON STOCKS 90.7% OF NET ASSETS |
|
|
| | |
| | |
| | |
| | |
| | |
| | |
| | |
| | |
| | |
| | |
| | |
| | |
Cleanaway Waste Management Ltd. | | |
| | |
| | |
| | |
| | |
| | |
| | |
Flight Centre Travel Group Ltd. | | |
Fortescue Metals Group Ltd. | | |
| | |
Harvey Norman Holdings Ltd. | | |
| | |
| | |
| | |
| | |
Insurance Australia Group Ltd. | | |
James Hardie Industries PLC * | | |
| | |
| | |
Magellan Financial Group Ltd. | | |
| | |
| | |
| | |
| | |
Northern Star Resources Ltd. | | |
| | |
| | |
| | |
| | |
Pinnacle Investment Management Group Ltd. | | |
Platinum Asset Management Ltd. | | |
| | |
| | |
| | |
| | |
| | |
| | |
| | |
| | |
Seven Group Holdings Ltd. | | |
Star Entertainment Group Ltd. * | | |
| | |
| | |
| | |
| | |
| | |
| | |
| | |
| | |
| | |
| | |
|
|
| | |
| | |
| | |
| | |
| | |
| | |
| | |
| | |
|
|
| | |
| | |
| | |
| | |
| | |
| | |
|
|
| | |
| | |
| | |
| | |
| | |
|
|
Alamos Gold, Inc., Class A | | |
Alimentation Couche-Tard, Inc. | | |
| | |
| | |
Boyd Group Services, Inc. | | |
Brookfield Asset Management Ltd., Class A | | |
Brookfield Infrastructure Corp., Class A | | |
| | |
Canadian National Railway Co. | | |
Canadian Natural Resources Ltd. | | |
Canadian Pacific Kansas City Ltd. | | |
| | |
| | |
| | |
| | |
Constellation Software, Inc. | | |
Descartes Systems Group, Inc. * | | |
12
Schwab International Opportunities Fund | Annual Report
Schwab International Opportunities Fund
Portfolio Holdings as of October 31, 2023 (continued)
| | |
| | |
| | |
| | |
Finning International, Inc. | | |
| | |
| | |
| | |
| | |
| | |
| | |
| | |
| | |
Magna International, Inc. | | |
| | |
| | |
| | |
| | |
Pan American Silver Corp. | | |
Precision Drilling Corp. * | | |
| | |
| | |
| | |
| | |
| | |
| | |
| | |
| | |
| | |
| | |
| | |
Wheaton Precious Metals Corp. | | |
| | |
| | |
|
|
Alibaba Group Holding Ltd. * | | |
| | |
| | |
| | |
PDD Holdings, Inc., ADR * | | |
| | |
Tongcheng Travel Holdings Ltd. * | | |
Vipshop Holdings Ltd., ADR * | | |
Xtep International Holdings Ltd. | | |
| | |
|
|
AP Moller - Maersk AS, Class A | | |
AP Moller - Maersk AS, Class B | | |
| | |
| | |
| | |
| | |
| | |
| | |
| | |
| | |
| | |
| | |
| | |
| | |
| | |
|
| | |
|
| | |
| | |
| | |
| | |
| | |
| | |
| | |
| | |
| | |
|
|
| | |
| | |
| | |
| | |
| | |
| | |
| | |
| | |
| | |
| | |
| | |
| | |
| | |
| | |
| | |
| | |
| | |
| | |
| | |
| | |
| | |
Gaztransport Et Technigaz SA | | |
| | |
| | |
| | |
| | |
La Francaise des Jeux SAEM | | |
| | |
| | |
LVMH Moet Hennessy Louis Vuitton SE | | |
| | |
| | |
| | |
| | |
| | |
| | |
| | |
| | |
| | |
| | |
| | |
| | |
| | |
Ubisoft Entertainment SA * | | |
| | |
| | |
| | |
| | |
|
|
| | |
| | |
| | |
Schwab International Opportunities Fund | Annual Report13
Schwab International Opportunities Fund
Portfolio Holdings as of October 31, 2023 (continued)
| | |
| | |
| | |
Bayerische Motoren Werke AG | | |
| | |
| | |
Carl Zeiss Meditec AG, Bearer Shares | | |
| | |
| | |
CTS Eventim AG & Co. KGaA | | |
| | |
| | |
| | |
| | |
| | |
DWS Group GmbH & Co. KGaA | | |
| | |
| | |
| | |
Fresenius Medical Care AG & Co. KGaA | | |
| | |
| | |
| | |
| | |
| | |
| | |
| | |
| | |
| | |
| | |
| | |
| | |
| | |
| | |
| | |
| | |
| | |
| | |
| | |
| | |
Telefonica Deutschland Holding AG | | |
| | |
| | |
| | |
| | |
|
|
| | |
National Bank of Greece SA * | | |
| | |
|
|
| | |
|
|
AAC Technologies Holdings, Inc. | | |
| | |
Budweiser Brewing Co. APAC Ltd. | | |
Cathay Pacific Airways Ltd. * | | |
Chow Tai Fook Jewellery Group Ltd. | | |
| | |
CK Infrastructure Holdings Ltd. | | |
| | |
| | |
| | |
Hong Kong & China Gas Co. Ltd. | | |
| | |
Johnson Electric Holdings Ltd. | | |
| | |
| | |
L'Occitane International SA | | |
| | |
| | |
Nexteer Automotive Group Ltd. | | |
| | |
Orient Overseas International Ltd. | | |
Power Assets Holdings Ltd. | | |
| | |
Samsonite International SA * | | |
| | |
SITC International Holdings Co. Ltd. | | |
Sun Hung Kai Properties Ltd. | | |
Techtronic Industries Co. Ltd. | | |
| | |
Vitasoy International Holdings Ltd. | | |
| | |
| | |
Xinyi Glass Holdings Ltd. | | |
Yue Yuen Industrial Holdings Ltd. | | |
| | |
|
|
| | |
| | |
Kalyan Jewellers India Ltd. | | |
| | |
Max Healthcare Institute Ltd. | | |
| | |
Prestige Estates Projects Ltd. | | |
| | |
| | |
| | |
| | |
|
|
Ace Hardware Indonesia Tbk. PT | | |
Bank Mandiri Persero Tbk. PT | | |
| | |
|
|
Bank of Ireland Group PLC | | |
Flutter Entertainment PLC * | | |
| | |
| | |
| | |
Ryanair Holdings PLC, ADR * | | |
| | |
|
|
| | |
| | |
| | |
| | |
Bezeq The Israeli Telecommunication Corp. Ltd. | | |
Big Shopping Centers Ltd. * | | |
| | |
Check Point Software Technologies Ltd. * | | |
| | |
| | |
| | |
14
Schwab International Opportunities Fund | Annual Report
Schwab International Opportunities Fund
Portfolio Holdings as of October 31, 2023 (continued)
| | |
| | |
Fattal Holdings 1998 Ltd. * | | |
| | |
| | |
| | |
| | |
Mivne Real Estate KD Ltd. | | |
| | |
| | |
| | |
SolarEdge Technologies, Inc. * | | |
| | |
Teva Pharmaceutical Industries Ltd. * | | |
Tower Semiconductor Ltd. * | | |
| | |
|
|
| | |
| | |
| | |
| | |
| | |
| | |
| | |
| | |
| | |
| | |
| | |
| | |
| | |
Terna - Rete Elettrica Nazionale | | |
| | |
|
|
| | |
| | |
| | |
| | |
| | |
| | |
| | |
| | |
| | |
| | |
| | |
| | |
| | |
| | |
| | |
| | |
| | |
| | |
Bandai Namco Holdings, Inc. | | |
BayCurrent Consulting, Inc. | | |
| | |
| | |
Canon Marketing Japan, Inc. | | |
| | |
| | |
Chubu Electric Power Co., Inc. | | |
Chugai Pharmaceutical Co. Ltd. | | |
Chugoku Electric Power Co., Inc. | | |
| | |
Cosmo Energy Holdings Co. Ltd. | | |
Cosmos Pharmaceutical Corp. | | |
Dai Nippon Printing Co. Ltd. | | |
| | |
| | |
| | |
| | |
Daito Trust Construction Co. Ltd. | | |
| | |
| | |
| | |
Electric Power Development Co. Ltd. | | |
| | |
| | |
| | |
| | |
| | |
| | |
| | |
| | |
Furukawa Electric Co. Ltd. | | |
| | |
GMO Payment Gateway, Inc. | | |
| | |
| | |
GungHo Online Entertainment, Inc. | | |
Hakuhodo DY Holdings, Inc. | | |
| | |
Harmonic Drive Systems, Inc. | | |
| | |
| | |
| | |
| | |
| | |
| | |
| | |
| | |
Information Services International-Dentsu Ltd. | | |
| | |
| | |
Internet Initiative Japan, Inc. | | |
Invincible Investment Corp. | | |
Isetan Mitsukoshi Holdings Ltd. | | |
| | |
| | |
Itochu Techno-Solutions Corp. | | |
| | |
| | |
Japan Airport Terminal Co. Ltd. | | |
Japan Aviation Electronics Industry Ltd. | | |
| | |
| | |
| | |
| | |
| | |
| | |
| | |
| | |
| | |
| | |
Kansai Electric Power Co., Inc. | | |
| | |
Kawasaki Kisen Kaisha Ltd. | | |
| | |
| | |
| | |
| | |
| | |
Kintetsu Group Holdings Co. Ltd. | | |
Kobayashi Pharmaceutical Co. Ltd. | | |
| | |
Schwab International Opportunities Fund | Annual Report15
Schwab International Opportunities Fund
Portfolio Holdings as of October 31, 2023 (continued)
| | |
Koei Tecmo Holdings Co. Ltd. | | |
Koito Manufacturing Co. Ltd. | | |
| | |
| | |
| | |
| | |
Kotobuki Spirits Co. Ltd. | | |
Kurita Water Industries Ltd. | | |
| | |
| | |
Kyushu Electric Power Co., Inc. * | | |
| | |
| | |
| | |
| | |
| | |
| | |
| | |
| | |
| | |
| | |
McDonald's Holdings Co. Japan Ltd. | | |
Mebuki Financial Group, Inc. | | |
| | |
| | |
| | |
Mitsubishi Chemical Group Corp. | | |
| | |
Mitsubishi Electric Corp. | | |
Mitsubishi Gas Chemical Co., Inc. | | |
Mitsubishi Logistics Corp. | | |
| | |
Mitsubishi UFJ Financial Group, Inc. | | |
| | |
| | |
Mitsui Mining & Smelting Co. Ltd. | | |
| | |
| | |
| | |
| | |
| | |
Murata Manufacturing Co. Ltd. | | |
| | |
| | |
| | |
| | |
| | |
| | |
| | |
Nihon M&A Center Holdings, Inc. | | |
| | |
| | |
Nippon Sanso Holdings Corp. | | |
| | |
| | |
| | |
Nippon Telegraph & Telephone Corp. | | |
| | |
Nishi-Nippon Railroad Co. Ltd. | | |
| | |
Nisshin Seifun Group, Inc. | | |
Nissin Foods Holdings Co. Ltd. | | |
| | |
| | |
| | |
| | |
| | |
| | |
| | |
| | |
| | |
| | |
OBIC Business Consultants Co. Ltd. | | |
| | |
| | |
| | |
Ono Pharmaceutical Co. Ltd. | | |
Open House Group Co. Ltd. | | |
| | |
| | |
| | |
| | |
| | |
| | |
| | |
| | |
| | |
| | |
Pola Orbis Holdings, Inc. | | |
| | |
Recruit Holdings Co. Ltd. | | |
| | |
| | |
| | |
| | |
| | |
Rohto Pharmaceutical Co. Ltd. | | |
| | |
| | |
| | |
| | |
| | |
Santen Pharmaceutical Co. Ltd. | | |
| | |
| | |
| | |
Sega Sammy Holdings, Inc. | | |
| | |
Sekisui Chemical Co. Ltd. | | |
| | |
| | |
Shikoku Electric Power Co., Inc. | | |
| | |
| | |
| | |
| | |
Shin-Etsu Chemical Co. Ltd. | | |
Shinko Electric Industries Co. Ltd. | | |
| | |
Ship Healthcare Holdings, Inc. | | |
SHO-BOND Holdings Co. Ltd. | | |
| | |
| | |
| | |
Sohgo Security Services Co. Ltd. | | |
| | |
Square Enix Holdings Co. Ltd. | | |
Stanley Electric Co. Ltd. | | |
| | |
| | |
| | |
Sumitomo Bakelite Co. Ltd. | | |
Sumitomo Chemical Co. Ltd. | | |
Sumitomo Electric Industries Ltd. | | |
| | |
Suntory Beverage & Food Ltd. | | |
| | |
16
Schwab International Opportunities Fund | Annual Report
Schwab International Opportunities Fund
Portfolio Holdings as of October 31, 2023 (continued)
| | |
| | |
| | |
| | |
Takeda Pharmaceutical Co. Ltd. | | |
| | |
| | |
| | |
| | |
| | |
| | |
| | |
Tohoku Electric Power Co., Inc. | | |
| | |
Tokyo Electric Power Co. Holdings, Inc. * | | |
| | |
| | |
Tokyo Ohka Kogyo Co. Ltd. | | |
| | |
| | |
| | |
| | |
| | |
| | |
| | |
| | |
| | |
| | |
| | |
| | |
| | |
| | |
| | |
| | |
| | |
| | |
| | |
| | |
|
|
| | |
|
|
| | |
|
|
Corp. Inmobiliaria Vesta SAB de CV | | |
Gruma SAB de CV, B Shares | | |
| | |
| | |
|
|
| | |
| | |
| | |
| | |
| | |
| | |
BE Semiconductor Industries NV | | |
| | |
| | |
| | |
| | |
| | |
| | |
| | |
| | |
| | |
| | |
Koninklijke Ahold Delhaize NV | | |
| | |
| | |
| | |
| | |
| | |
| | |
| | |
| | |
|
|
| | |
| | |
| | |
Fisher & Paykel Healthcare Corp. Ltd. | | |
| | |
| | |
| | |
SKYCITY Entertainment Group Ltd. | | |
| | |
| | |
|
|
| | |
AutoStore Holdings Ltd. * | | |
| | |
| | |
| | |
| | |
| | |
| | |
| | |
| | |
| | |
| | |
|
|
Copa Holdings SA, Class A | | |
|
|
| | |
|
|
EDP - Energias de Portugal SA | | |
| | |
| | |
| | |
|
|
| | |
| | |
Celltrion Healthcare Co. Ltd. | | |
| | |
| | |
| | |
| | |
| | |
| | |
| | |
Schwab International Opportunities Fund | Annual Report17
Schwab International Opportunities Fund
Portfolio Holdings as of October 31, 2023 (continued)
| | |
| | |
Hankook Tire & Technology Co. Ltd. | | |
| | |
Hanwha Aerospace Co. Ltd. | | |
HD Hyundai Infracore Co. Ltd. | | |
| | |
| | |
| | |
Hyundai Engineering & Construction Co. Ltd. | | |
| | |
Hyundai Mipo Dockyard Co. Ltd. * | | |
| | |
| | |
| | |
| | |
KEPCO Plant Service & Engineering Co. Ltd. | | |
| | |
Korea Aerospace Industries Ltd. | | |
Korean Air Lines Co. Ltd. | | |
| | |
| | |
Kumho Petrochemical Co. Ltd. | | |
| | |
| | |
| | |
| | |
| | |
LOTTE Fine Chemical Co. Ltd. | | |
| | |
| | |
| | |
| | |
| | |
| | |
People & Technology, Inc. | | |
| | |
| | |
Samsung Electronics Co. Ltd. | | |
Samsung Engineering Co. Ltd. * | | |
| | |
| | |
| | |
| | |
| | |
| | |
| | |
|
|
| | |
| | |
| | |
| | |
DFI Retail Group Holdings Ltd. | | |
Frasers Logistics & Commercial Trust | | |
| | |
Hutchison Port Holdings Trust, Class U | | |
Jardine Cycle & Carriage Ltd. | | |
Jardine Matheson Holdings Ltd. | | |
| | |
| | |
Mapletree Industrial Trust | | |
Mapletree Logistics Trust | | |
Mapletree Pan Asia Commercial Trust | | |
| | |
| | |
| | |
| | |
| | |
| | |
Singapore Telecommunications Ltd. | | |
Suntec Real Estate Investment Trust | | |
| | |
Wilmar International Ltd. | | |
| | |
|
|
Aspen Pharmacare Holdings Ltd. | | |
| | |
Impala Platinum Holdings Ltd. | | |
| | |
|
|
ACS Actividades de Construccion y Servicios SA | | |
| | |
| | |
Cia de Distribucion Integral Logista Holdings SA | | |
Corp. ACCIONA Energias Renovables SA | | |
| | |
| | |
| | |
Industria de Diseno Textil SA | | |
International Consolidated Airlines Group SA * | | |
| | |
| | |
| | |
|
|
| | |
| | |
| | |
| | |
| | |
| | |
| | |
| | |
| | |
H & M Hennes & Mauritz AB, B Shares | | |
| | |
| | |
| | |
| | |
| | |
| | |
| | |
| | |
| | |
| | |
Swedish Orphan Biovitrum AB * | | |
| | |
Telefonaktiebolaget LM Ericsson, B Shares | | |
| | |
| | |
| | |
| | |
| | |
|
18
Schwab International Opportunities Fund | Annual Report
Schwab International Opportunities Fund
Portfolio Holdings as of October 31, 2023 (continued)
| | |
|
| | |
| | |
| | |
| | |
| | |
Chocoladefabriken Lindt & Spruengli AG | | |
Chocoladefabriken Lindt & Spruengli AG, Participation Certificates | | |
Cie Financiere Richemont SA, Class A | | |
| | |
| | |
| | |
| | |
| | |
| | |
| | |
Kuehne & Nagel International AG | | |
| | |
Logitech International SA | | |
| | |
| | |
| | |
Partners Group Holding AG | | |
| | |
Roche Holding AG, Bearer Shares | | |
| | |
| | |
Schindler Holding AG, Participation Certificates | | |
| | |
| | |
| | |
| | |
Swatch Group AG, Bearer Shares | | |
| | |
| | |
| | |
| | |
| | |
|
|
| | |
Gold Circuit Electronics Ltd. | | |
| | |
Poya International Co. Ltd. | | |
Taiwan Semiconductor Manufacturing Co. Ltd. | | |
| | |
| | |
|
|
| | |
| | |
| | |
| | |
| | |
| | |
| | |
| | |
| | |
B&M European Value Retail SA | | |
| | |
Berkeley Group Holdings PLC | | |
| | |
| | |
British American Tobacco PLC | | |
| | |
| | |
| | |
| | |
| | |
| | |
| | |
| | |
| | |
| | |
| | |
| | |
Dechra Pharmaceuticals PLC | | |
| | |
| | |
| | |
| | |
| | |
| | |
| | |
| | |
| | |
| | |
| | |
| | |
| | |
| | |
Hikma Pharmaceuticals PLC | | |
| | |
| | |
| | |
| | |
InterContinental Hotels Group PLC | | |
Intermediate Capital Group PLC | | |
| | |
| | |
| | |
| | |
| | |
Liberty Global PLC, Class A * | | |
Liberty Global PLC, Class C * | | |
| | |
| | |
| | |
| | |
| | |
| | |
| | |
Reckitt Benckiser Group PLC | | |
| | |
| | |
| | |
| | |
Rolls-Royce Holdings PLC * | | |
| | |
| | |
| | |
| | |
| | |
| | |
| | |
| | |
| | |
| | |
| | |
| | |
| | |
Schwab International Opportunities Fund | Annual Report19
Schwab International Opportunities Fund
Portfolio Holdings as of October 31, 2023 (continued)
| | |
United Utilities Group PLC | | |
| | |
| | |
| | |
| | |
| | |
|
|
ACADIA Pharmaceuticals, Inc. * | | |
| | |
Ginkgo Bioworks Holdings, Inc. * | | |
| | |
| | |
Jazz Pharmaceuticals PLC * | | |
| | |
| | |
| | |
Sage Therapeutics, Inc. * | | |
| | |
| | |
Total Common Stocks
(Cost $842,622,110) | |
|
PREFERRED STOCKS 0.6% OF NET ASSETS |
|
|
Bayerische Motoren Werke AG | | |
| | |
| | |
| | |
|
|
| | |
| | |
Samsung Electronics Co. Ltd. | | |
| | |
Total Preferred Stocks
(Cost $6,521,090) | |
|
WARRANTS 0.0% OF NET ASSETS |
|
|
Constellation Software, Inc. |
| | |
| |
| | |
INVESTMENT COMPANIES 4.4% OF NET ASSETS |
|
|
| | |
Schwab Emerging Markets Equity ETF (c) | | |
| | |
Total Investment Companies
(Cost $50,551,165) | |
| | |
SHORT-TERM INVESTMENTS 3.5% OF NET ASSETS |
|
|
State Street Institutional U.S. Government Money Market Fund, Premier Class 5.30% (d) | | |
Total Short-Term Investments
(Cost $32,619,487) | |
Total Investments in Securities
(Cost $932,313,852) | |
| | | CURRENT VALUE/
UNREALIZED
DEPRECIATION
($) |
|
| | | |
MSCI EAFE Index, expires 12/15/23 | | | |
20
Schwab International Opportunities Fund | Annual Report
Schwab International Opportunities Fund
Portfolio Holdings as of October 31, 2023 (continued)
| | | AMOUNT OF CURRENCY TO BE RECEIVED | | AMOUNT OF CURRENCY TO BE DELIVERED | UNREALIZED
APPRECIATION
(DEPRECIATION)
($) |
FORWARD FOREIGN CURRENCY EXCHANGE CONTRACTS |
| | | | | | |
| | | | | | |
| | | | | | |
| | | | | | |
| | | | | | |
| | | | | | |
| | | | | | |
| | | | | | |
| | | | | | |
| | | | | | |
| | | | | | |
| | | | | | |
| | | | | | |
| | | | | | |
| | | | | | |
| | | | | | |
| | | | | | |
Net Unrealized Appreciation on Forward Foreign Currency Exchange Contracts | |
| Non-income producing security. |
| Security is traded on separate exchanges for the same issuer. |
| Fair valued using significant unobservable inputs (see financial note 2(a), Securities for which no quoted value is available, for additional information). |
| Issuer is affiliated with the fund’s investment adviser. |
| The rate shown is the annualized 7-day yield. |
| American Depositary Receipt |
| |
| |
| Real Estate Investment Trust |
| |
| |
| |
| |
| |
| |
| |
| |
| |
| |
| |
Below is a summary of the fund’s transactions with affiliated issuers during the period ended October 31, 2023:
| | | | | NET CHANGE IN UNREALIZED APPRECIATION (DEPRECIATION) | | BALANCE OF SHARES HELD AT 10/31/23 | |
INVESTMENT COMPANIES 3.8% OF NET ASSETS |
|
|
Schwab Emerging Markets Equity ETF | | | | | | | | |
| Distributions received include distributions from net investment income and capital gains, if any, from the underlying fund. |
Schwab International Opportunities Fund | Annual Report21
Schwab International Opportunities Fund
Portfolio Holdings as of October 31, 2023 (continued)
The following is a summary of the inputs used to value the fund’s investments as of October 31, 2023 (see financial note 2(a) for additional information):
| QUOTED PRICES IN
ACTIVE MARKETS FOR
IDENTICAL ASSETS
(LEVEL 1) | OTHER SIGNIFICANT
OBSERVABLE INPUTS
(LEVEL 2) | SIGNIFICANT
UNOBSERVABLE INPUTS
(LEVEL 3) | |
| | | | |
| | | | |
| | | | |
| | | | |
| | | | |
| | | | |
| | | | |
| | | | |
| | | | |
| | | | |
| | | | |
| | | | |
| | | | |
| | | | |
| | | | |
| | | | |
| | | | |
| | | | |
| | | | |
| | | | |
| | | | |
| | | | |
| | | | |
| | | | |
| | | | |
| | | | |
| | | | |
| | | | |
| | | | |
| | | | |
| | | | |
| | | | |
Forward Foreign Currency Exchange Contracts2 | | | | |
| | | | |
Forward Foreign Currency Exchange Contracts2 | | | | |
| | | | |
| | | | |
| As categorized in the Portfolio Holdings. |
| Futures contracts and forward foreign currency exchange contracts are reported at cumulative unrealized appreciation or depreciation. |
22
Schwab International Opportunities Fund | Annual Report
Schwab International Opportunities Fund
Statement of Assets and Liabilities
As of October 31, 2023
|
Investments in securities, at value - affiliated (cost $45,166,700) | | |
Investments in securities, at value - unaffiliated (cost $887,147,152) | | |
Foreign currency, at value (cost $696,840) | | |
Deposit with broker for futures contracts | | |
| | |
| | |
| | |
| | |
| | |
Variation margin on future contracts | | |
Unrealized appreciation on forward foreign currency exchange contracts | | |
| | |
| | |
|
|
| | |
| | |
Foreign capital gains tax | | |
Investment adviser and administrator fees | | |
IRS compliance fee for foreign withholding tax claims | | |
| | |
| | |
Unrealized depreciation on forward foreign currency exchange contracts | | |
| | |
| | |
| | |
|
|
Capital received from investors | | |
| | |
| | |
Schwab International Opportunities Fund | Annual Report23
Schwab International Opportunities Fund
Statement of Operations
For the period November 1, 2022 through October 31, 2023 |
|
Dividends received from securities - unaffiliated (net of foreign withholding tax of $2,170,996) | | |
Dividends received from securities - affiliated | | |
IRS compliance fee for foreign withholding tax claims | | |
| | |
| | |
|
|
Investment adviser and administrator fees | | |
| | |
| | |
Portfolio accounting fees | | |
| | |
| | |
| | |
Independent trustees’ fees | | |
| | |
| | |
| | |
| | |
| | |
| | |
|
REALIZED AND UNREALIZED GAINS (LOSSES) |
Net realized losses on sales of securities - affiliated | | |
Net realized losses on sales of securities - unaffiliated (net of foreign capital gains tax paid of $331,608) | | |
Net realized gains on futures contracts | | |
Net realized losses on foreign currency transactions | | |
| | |
Net change in unrealized appreciation (depreciation) on securities - affiliated | | |
Net change in unrealized appreciation (depreciation) on securities - unaffiliated (net of change in foreign capital gains tax of ($130,905)) | | |
Net change in unrealized appreciation (depreciation) on futures contracts | | |
Net change in unrealized appreciation (depreciation) on forward foreign currency exchange contracts | | |
Net change in unrealized appreciation (depreciation) on foreign currency translations | | |
Net change in unrealized appreciation (depreciation) | | |
Net realized and unrealized gains | | |
Increase in net assets resulting from operations | | |
| Includes professional fees of $4,023 associated with the filing of foreign withholding tax claims in the European Union and $20,000 associated with preparing the filing of a closing agreement with the IRS, fees are deemed to be non-contingent and non-routine expenses of the fund (see financial notes 2(d) and 4 for additional information). |
24
Schwab International Opportunities Fund | Annual Report
Schwab International Opportunities Fund
Statement of Changes in Net Assets
For the current and prior report periods
|
| | |
| | | |
Net realized gains (losses) | | | |
Net change in unrealized appreciation (depreciation) | | | |
Increase (decrease) in net assets resulting from operations | | | |
|
DISTRIBUTIONS TO SHAREHOLDERS |
| | | |
TRANSACTIONS IN FUND SHARES |
| | |
| | | | | |
| | | | | |
| | | | | |
| | | | | |
Net transactions in fund shares | | | | | |
|
SHARES OUTSTANDING AND NET ASSETS |
| | |
| | | | | |
| | | | | |
Total increase (decrease) | | | | | |
| | | | | |
Schwab International Opportunities Fund | Annual Report25
Schwab International Opportunities Fund
1. Business Structure of the Fund:
Schwab International Opportunities Fund is a series of Schwab Capital Trust (the trust), a no-load, open-end management investment company. The trust is organized as a Massachusetts business trust and is registered under the Investment Company Act of 1940, as amended (the 1940 Act). The list below shows all the funds in the trust as of the end of the period, including the fund discussed in this report, which is highlighted:
|
Schwab International Opportunities Fund | |
Schwab S&P 500 Index Fund | |
Schwab Small-Cap Index Fund® | |
Schwab Total Stock Market Index Fund® | |
Schwab U.S. Large-Cap Growth Index Fund | |
Schwab U.S. Large-Cap Value Index Fund | Schwab Fundamental US Large Company Index Fund |
Schwab U.S. Mid-Cap Index Fund | Schwab Fundamental US Small Company Index Fund |
Schwab International Index Fund® | Schwab Fundamental International Large Company Index Fund |
Schwab MarketTrack All Equity Portfolio™ | Schwab Fundamental International Small Company Index Fund |
Schwab MarketTrack Growth Portfolio™ | Schwab Fundamental Emerging Markets Large Company Index Fund |
Schwab MarketTrack Balanced Portfolio™ | Schwab Fundamental Global Real Estate Index Fund |
Schwab MarketTrack Conservative Portfolio™ | Schwab Target 2010 Index Fund |
| Schwab Target 2015 Index Fund |
| Schwab Target 2020 Index Fund |
Schwab Dividend Equity Fund | Schwab Target 2025 Index Fund |
Schwab Large-Cap Growth Fund | Schwab Target 2030 Index Fund |
Schwab Small-Cap Equity Fund | Schwab Target 2035 Index Fund |
| Schwab Target 2040 Index Fund |
Schwab International Core Equity Fund | Schwab Target 2045 Index Fund |
| Schwab Target 2050 Index Fund |
| Schwab Target 2055 Index Fund |
| Schwab Target 2060 Index Fund |
| Schwab Target 2065 Index Fund |
| Schwab Monthly Income Fund – Target Payout |
| Schwab Monthly Income Fund – Flexible Payout |
| Schwab Monthly Income Fund – Income Payout |
The fund offers one share class. Shares are bought and sold at closing net asset value per share (NAV), which is the price for all outstanding shares of the fund. Each share has a par value of 1/1,000 of a cent, and the fund’s Board of Trustees (the Board) may authorize the issuance of as many shares as necessary.
The fund maintains its own account for purposes of holding assets and accounting, and is considered a separate entity for tax purposes. Within its account, the fund may also keep certain assets in segregated accounts, as required by securities law. The "Fund Complex" includes The Charles Schwab Family of Funds, Schwab Capital Trust, Schwab Investments, Schwab Annuity Portfolios, Schwab Strategic Trust and Laudus Trust.
2. Significant Accounting Policies:The following is a summary of the significant accounting policies the fund uses in its preparation of financial statements. The fund follows the investment company accounting and reporting guidance of the Financial Accounting Standards Board (FASB) Accounting Standard Codification Topic 946 Financial Services — Investment Companies. The accounting policies are in conformity with accounting principles generally accepted in the United States of America (GAAP).
The fund may invest in mutual funds and exchange-traded funds (ETFs), which are referred to as "underlying funds". For more information about the underlying funds’ operations and policies, please refer to those funds’ semiannual and annual reports, which are filed with the U.S. Securities and Exchange Commission (SEC) and are available on the SEC’s website at www.sec.gov.
26
Schwab International Opportunities Fund | Annual Report
Schwab International Opportunities Fund
Financial Notes (continued)
2. Significant Accounting Policies (continued):
(a) Security Valuation:
Pursuant to Rule 2a-5 under the 1940 Act, the Board has designated authority to a Valuation Designee, the fund’s investment adviser, to make fair valuation determinations under adopted procedures, subject to Board oversight. The investment adviser has formed a Pricing Committee to administer the pricing and valuation of portfolio securities and other assets and liabilities as well as to ensure that prices used for internal purposes or provided by third parties reasonably reflect fair value. The Valuation Designee may utilize independent pricing services, quotations from securities and financial instrument dealers and other market sources to determine fair value.
Securities held in the fund’s portfolio are valued every business day. The following valuation policies and procedures are used by the Valuation Designee to value various types of securities:
• Securities traded on an exchange or over-the-counter: Traded securities are valued at the closing value for the day, or, on days when no closing value has been reported, at the mean of the most recent bid and ask quotes. Securities that are primarily traded on foreign exchanges are valued at the official closing price or the last sales price on the exchange where the securities are principally traded with these values then translated into U.S. dollars at the current exchange rate, unless these securities are fair valued as discussed below.
• Foreign equity security fair valuation: The Valuation Designee has adopted procedures to fair value foreign equity securities that are traded in markets that close prior to the valuation of the fund’s holdings. By fair valuing securities whose prices may have been affected by events occurring after the close of trading, the Valuation Designee seeks to establish prices that investors might expect to realize upon the current sales of these securities. This methodology is designed to deter “arbitrage” market timers, who seek to exploit delays between the change in the value of the fund’s portfolio holdings and the NAV of the fund’s shares and seeks to help ensure that the prices at which the fund’s shares are purchased and redeemed are fair and do not result in dilution of shareholder interest or other harm to shareholders. When fair value pricing is used at the open or close of a reporting period, it may cause a temporary divergence between the return of the fund and that of its comparative index or benchmark.
• Futures contracts and forward foreign currency exchange contracts (forwards): Futures contracts are valued at their settlement prices as of the close of their exchanges. Forwards are valued based on that day’s forward exchange rates or by using an interpolated forward exchange rate for contracts with interim settlement dates.
• Mutual funds: Mutual funds are valued at their respective NAVs.
• Securities for which no quoted value is available: The Valuation Designee has adopted procedures to fair value the fund’s securities when market prices are not “readily available” or are unreliable. For example, a security may be fair valued when it’s de-listed or its trading is halted or suspended; when a security’s primary pricing source is unable or unwilling to provide a price; or when a security’s primary trading market is closed during regular market hours. Fair value determinations are made in good faith in accordance with adopted valuation procedures. The Valuation Designee considers a number of factors, including unobservable market inputs, when arriving at fair value. The Valuation Designee may employ methods such as the review of related or comparable assets or liabilities, related market activities, recent transactions, market multiples, book values, transactional back-testing, disposition analysis and other relevant information. Due to the subjective and variable nature of fair value pricing, there can be no assurance that the fund could obtain the fair value assigned to the security upon the sale of such security.
In accordance with the authoritative guidance on fair value measurements and disclosures under GAAP, the fund discloses the fair value of its investments in a hierarchy that prioritizes the significant inputs to valuation methods used to measure the fair value. The hierarchy gives the highest priority to valuations based upon unadjusted quoted prices in active markets for identical assets or liabilities (Level 1 measurements) and the lowest priority to valuations based upon unobservable inputs that are significant to the valuation (Level 3 measurements). If inputs used to measure the financial instruments fall within different levels of the hierarchy, the categorization is based on the lowest level input that is significant to the valuation. If it is determined that either the volume and/or level of activity for an asset or liability has significantly decreased (from normal conditions for that asset or liability) or price quotations or observable inputs are not associated with orderly transactions, increased analysis and the Valuation Designee’s judgment will be required to estimate fair value.
Schwab International Opportunities Fund | Annual Report27
Schwab International Opportunities Fund
Financial Notes (continued)
2. Significant Accounting Policies (continued):
The three levels of the fair value hierarchy are as follows:
• Level 1 — quoted prices in active markets for identical investments — Investments whose values are based on quoted market prices in active markets. These generally include active listed equities, mutual funds, ETFs and futures contracts. Mutual funds and ETFs are classified as Level 1 prices, without consideration to the classification level of the underlying securities held, which could be Level 1, Level 2 or Level 3 in the fair value hierarchy.
• Level 2 — other significant observable inputs (including quoted prices for similar securities, interest rates, prepayment speeds, credit risk, etc.) — Investments that trade in markets that are not considered to be active, but whose values are based on quoted market prices, dealer quotations or valuations provided by alternative pricing sources supported by observable inputs are classified as Level 2 prices. These generally include U.S. government and sovereign obligations, most government agency securities, investment-grade corporate bonds, certain mortgage products, less liquid listed equities, and state, municipal and provincial obligations. In addition, international securities whose markets close hours before the valuation of the fund’s holdings may require fair valuations due to significant movement in the U.S. markets occurring after the daily close of the foreign markets. The Valuation Designee has approved a vendor that calculates fair valuations of international equity securities based on a number of factors that appear to correlate to the movements in the U.S. markets.
• Level 3 — significant unobservable inputs (including the Valuation Designee’s assumptions in determining the fair value of investments) — Investments whose values are classified as Level 3 prices have significant unobservable inputs, as they may trade infrequently or not at all. When observable prices are not readily available for these securities, one or more valuation methods are used for which sufficient and reliable data is available. The inputs used in estimating the value of Level 3 prices may include the original transaction price, quoted prices for similar securities or assets in active markets, completed or pending third-party transactions in the underlying investment or comparable issuers, and changes in financial ratios or cash flows. Level 3 prices may also be adjusted to reflect illiquidity and/or non-transferability, with the amount of such discount estimated in the absence of market information. Assumptions used due to the lack of observable inputs may significantly impact the resulting fair value and therefore the fund’s results of operations.
The inputs or methodology used for valuing securities are not necessarily an indication of the risk associated with investing in those securities.
The levels associated with valuing the fund’s investments as of October 31, 2023, are disclosed in the fund’s Portfolio Holdings.
(b) Accounting Policies for certain Portfolio Investments (if held):
Futures Contracts: Futures contracts are instruments that represent an agreement between two parties that obligates one party to buy, and the other party to sell, specific instruments at an agreed upon price on a stipulated future date. The fund must give the broker a deposit of cash and/or securities (initial margin) whenever it enters into a futures contract. The amount of the deposit may vary from one contract to another. Subsequent payments (variation margin) are made or received by the fund depending on the daily fluctuations in the value of the futures contract and are accounted for as unrealized appreciation or depreciation until the contract is closed, at which time the gains or losses are realized. Futures contracts are traded publicly on exchanges, and their value may change daily.
Forward Foreign Currency Exchange Contracts (forwards): Forwards are contracts to buy and sell a currency at a set price on a future date. The value of the forwards is accounted for as unrealized appreciation or depreciation until the contracts settle, at which time the gains or losses are realized.
Securities Lending: Under the trust’s Securities Lending Program, the fund (lender) may make short-term loans of its securities to another party (borrower) to generate additional revenue for the fund. The borrower pledges collateral in the form of cash, securities issued or fully guaranteed by the U.S. government or foreign governments, or letters of credit issued by a bank. Collateral at the individual loan level is required to be maintained on a daily marked-to-market basis in an amount at least equal to the current value of the securities loaned. The lending agent provides the fund with indemnification against borrower default (the borrower fails to return the security on loan) reducing the risk of loss as a result of default. The cash collateral of securities loaned is currently invested in money market portfolios operating pursuant to Rule 2a-7 under the 1940 Act. The fund bears the risk of loss with respect to the investment of cash collateral. The terms of the securities lending agreement allow the fund or the lending agent to terminate any loan at any given time and the securities must be returned within the earlier of the standard trade settlement period or the specified time period under the relevant securities lending agreement. Securities lending income, as disclosed in the fund’s Statement of Operations, if applicable, represents the income earned from the investment of the cash collateral plus any fees paid by borrowers, less the fees paid to the lending agent and broker rebates which are subject to adjustments pursuant to the securities lending agreement. On loans not collateralized by cash, a fee is received from the borrower, and is allocated between the fund and
28
Schwab International Opportunities Fund | Annual Report
Schwab International Opportunities Fund
Financial Notes (continued)
2. Significant Accounting Policies (continued):
the lending agent. The aggregate fair value of securities loaned will not at any time exceed one-third of the total assets of the fund, including collateral received from the loan. Securities lending fees paid to the unaffiliated lending agents start at 9% of gross lending revenue, with subsequent breakpoints to a low of 5%. In this context, the gross lending revenue equals the income received from the investment of cash collateral and fees paid by borrowers less any rebates paid to the borrowers. Any expenses charged by the cash collateral fund are in addition to these fees. All remaining revenue is retained by the fund, as applicable. No portion of lending revenue is paid to or retained by the investment adviser or any of its affiliates.
As of October 31, 2023, the fund had no securities on loan.
Passive Foreign Investment Companies: The fund may own shares in certain foreign corporations that meet the Internal Revenue Code definition of a Passive Foreign Investment Company (PFIC). The fund may elect for tax purposes to mark-to-market annually the shares of each PFIC lot held and would be required to distribute as ordinary income to shareholders any such marked-to- market gains (as well as any gains realized on sale).
Central Securities Depositories Regulation: The Central Securities Depositories Regulation (CSDR) introduced measures for the authorization and supervision of European Union Central Security Depositories and created a common set of prudential, organizational, and conduct of business standards at a European level. CSDR is designed to support securities settlement and operational aspects of securities settlement, including the provision of shorter settlement periods; mandatory buy-ins; and cash penalties, to prevent and address settlement fails. CSDR measures are aimed to prevent settlement fails by ensuring that all transaction details are provided to facilitate settlement, as well as further incentivizing timely settlement by imposing cash penalty fines and buy-ins. The fund may be subject to pay cash penalties and may also receive cash penalties with certain counterparties in instances where there are settlement fails. These cash penalties are included in net realized gains (losses) on sales of securities in the fund’s Statement of Operations, if any.
(c) Security Transactions:
Security transactions are recorded as of the date the order to buy or sell the security is executed. Realized gains and losses from security transactions are based on the identified costs of the securities involved.
Assets and liabilities denominated in foreign currencies are reported in U.S. dollars. For assets and liabilities held on a given date, the dollar value is based on market exchange rates in effect on that date. Transactions involving foreign currencies, including purchases, sales, income receipts and expense payments, are calculated using exchange rates in effect on the transaction date. Realized foreign exchange gains or losses arise from sales of foreign currencies, currency gains or losses realized between the trade and settlement dates on securities transactions and the differences between the recorded amounts of dividends, interest, and foreign withholding taxes and the U.S. dollar equivalent of the amounts actually received or paid. Net unrealized foreign exchange appreciation or depreciation arises from changes in foreign exchange rates on foreign denominated assets and liabilities other than investments in securities held at the end of the reporting period. These realized and unrealized foreign exchange gains or losses are reported in foreign currency transactions or translations in the fund’s Statement of Operations, if any. The fund does not isolate the portion of the fluctuations on investments resulting from changes in foreign currency exchange rates from the fluctuations in market prices of investments held. Such fluctuations are included with the net realized and unrealized gain or loss from investments ,if any.
Gains realized by the fund on the sale of securities in certain foreign countries may be subject to non-U.S. taxes. In those instances, the fund records a liability based on unrealized gains to provide for potential non-U.S. taxes payable upon the sale of these securities.
When the fund closes out a futures contract position, it calculates the difference between the value of the position at the beginning and at the end of the contract, and records a realized gain or loss accordingly.
(d) Investment Income:
Interest income is recorded as it accrues. Dividends, in the form of cash or non-cash income such as in the form of additional securities, and distributions from portfolio securities and underlying funds are recorded on the date they are effective (the ex-dividend date), although the fund records certain foreign security dividends on the date the ex-dividend date is confirmed. Any distributions from underlying funds are recorded in accordance with the character of the distributions as designated by the underlying funds.
Income received from foreign sources may result in withholding tax. Withholding taxes are accrued at the same time as the related income if the tax rate is fixed and known, unless a tax withheld is reclaimable from the local tax authorities in which case it is recorded as receivable. If the tax rate is not known or estimable, such expense or reclaim receivable is recorded when the net proceeds are received.
Schwab International Opportunities Fund | Annual Report29
Schwab International Opportunities Fund
Financial Notes (continued)
2. Significant Accounting Policies (continued):
The fund filed claims to recover taxes previously withheld in certain European Union countries on the basis that those countries had purportedly violated certain provisions in the Treaty on the Functioning of the European Union. These filings are subject to various administrative and judicial proceedings within these countries, and all professional fees associated with these filings have been paid by the investment adviser. The professional fees related to European Union foreign withholding tax claims are non-contingent and non-routine fees which are subject to repayment to the investment adviser (see financial note 4 for additional information).
For U.S. income tax purposes, European Union reclaims received reduce the amounts of foreign taxes that the fund passes through to its shareholders. If European Union reclaims received exceed foreign withholding taxes paid, the fund will evaluate the requirements for entering into a closing agreement with the Internal Revenue Service (IRS) to address any prior years’ U.S. income tax liabilities attributable to fund shareholders resulting from the recovery of foreign taxes. The closing agreement would result in the fund paying an IRS compliance fee, on behalf of its shareholders, representing the estimated tax savings generated from foreign tax credits claimed by fund shareholders on their tax returns in prior years. During the period ended October 31, 2023, it was determined that the fund is expected to seek a closing agreement with the IRS.
The fund will pay a compliance fee to the IRS, on behalf of its shareholders, representing the estimated tax savings generated from foreign tax credits claimed by fund shareholders on their tax returns in prior years. The fund has recorded contra income for the estimated IRS compliance fee for foreign withholding tax claims and a liability for professional fees associated with the filing of the closing agreement with the IRS, which is disclosed in the fund’s Statement of Operations and Statement of Assets and Liabilities. The actual IRS compliance fee may differ from the estimate and that difference may be material. There were professional fees related to the preparation of the closing agreement to be filed with the IRS, those fees are non-routine expenses and are paid by the fund and not the adviser, during the period ended October 31, 2023, those fees were $20,000, as shown as Professional fees in the fund’s Statement of Operations.
(e) Expenses:
Expenses that are specific to the fund are charged directly to the fund. Expenses that are common to more than one fund in the trusts generally are allocated among those funds in proportion to their average daily net assets.
(f) Distributions to Shareholders:
The fund makes distributions from net investment income and net realized capital gains, if any, once a year. To receive a distribution, you must be a registered shareholder on the record date. Distributions are paid to shareholders on the payable date.
(g) Accounting Estimates:
The accounting policies described in this report conform to GAAP. Notwithstanding this, shareholders should understand that in order to follow these principles, fund management has to make estimates and assumptions that affect the information reported in the financial statements. It’s possible that once the results are known, they may turn out to be different from these estimates and these differences may be material.
(h) Federal Income Taxes:
The fund intends to meet federal income and excise tax requirements for regulated investment companies under subchapter M of the Internal Revenue Code, as amended. Accordingly, the fund distributes substantially all of its net investment income and net realized capital gains, if any, to its shareholders each year. As long as the fund meets the tax requirements, it is not required to pay federal income tax.
(i) Foreign Taxes:
The fund may be subject to foreign taxes (a portion of which may be reclaimable) on income, corporate events, foreign currency exchanges and capital gains on investments. All foreign taxes are recorded in accordance with the applicable foreign tax regulations and rates that exist in foreign markets in which the fund invests. These foreign taxes, if any, are paid by the fund and are disclosed in the fund’s Statement of Operations. Foreign taxes accrued as of October 31, 2023, if any, are reflected in the fund’s Statement of Assets and Liabilities.
30
Schwab International Opportunities Fund | Annual Report
Schwab International Opportunities Fund
Financial Notes (continued)
2. Significant Accounting Policies (continued):
(j) Indemnification:
Under the fund’s organizational documents, the officers and trustees are indemnified against certain liabilities arising out of the performance of their duties to the fund. In addition, in the normal course of business the fund enters into contracts with its vendors and others that provide general indemnifications. The fund’s maximum exposure under these arrangements is unknown as this would involve future claims that may be made against the fund. However, based on experience, the fund expects the risk of loss attributable to these arrangements to be remote.
(k) Regulatory Update:
Effective January 24, 2023, the SEC adopted rule and form amendments to require mutual funds and ETFs to transmit concise and visually engaging streamlined annual and semiannual reports to shareholders that highlight key information deemed important for retail investors to assess and monitor their fund investments. Other information, including financial statements, will no longer appear in a streamlined shareholder report but must be available online, delivered free of charge upon request, and filed on a semiannual basis on Form N-CSR. The rule and form amendments have a compliance date of July 24, 2024. At this time, management is evaluating the impact of these rule and form amendment changes on the content of the current shareholder report and the newly created annual and semiannual streamlined shareholder reports.
3. Risk Factors:Investing in the fund may involve certain risks, as discussed in the fund’s prospectus, including, but not limited to, those described below. Any of these risks could cause an investor to lose money.
Market Risk. Financial markets rise and fall in response to a variety of factors, sometimes rapidly and unpredictably. Markets may be impacted by economic, political, regulatory and other conditions, including economic sanctions and other government actions. In addition, the occurrence of global events, such as war, terrorism, environmental disasters, natural disasters and epidemics, may also negatively affect the financial markets. As with any investment whose performance is tied to these markets, the value of an investment in the fund will fluctuate, which means that an investor could lose money over short or long periods.
Investment Style Risk. Schwab Asset Management may attempt to reduce the impact of the performance of any given investment style by allocating to investment managers who invest in both value and growth style stocks. But whenever value stocks fall out of favor with investors, they may underperform growth stocks, and vice versa.
The portion of the fund that is invested in accordance with a particular index follows the securities included in that index during upturns as well as downturns. The fund does not take steps to reduce market exposure or to lessen the effects of a declining market with respect to this portion. In addition, because of the fund’s expenses, the fund’s performance with respect to this portion may be below that of the index. Errors relating to the index may occur from time to time and may not be identified by the index provider for a period of time. In addition, market disruptions could cause delays in the index’s rebalancing schedule. Such errors and/or market disruptions may result in losses for the fund.
Multi-Manager Risk. Schwab Asset Management and each investment manager makes investment decisions independently, and it is possible that the investment styles of Schwab Asset Management and the investment managers may not complement one another. As a result, the fund’s exposure to a given stock, industry or investment style could unintentionally be smaller or larger than if the fund had a single manager.
Management Risk. The portion of the fund that is actively managed is subject to the risk that its investment adviser and investment managers will select investments or allocate assets in a manner that could cause the fund to underperform or otherwise not meet its investment objective. Poor stock selection or a focus on securities in a particular sector may cause the fund to underperform its benchmark or other funds with a similar investment objective.
Equity Risk. The prices of equity securities rise and fall daily. These price movements may result from factors affecting individual companies, industries or the securities market as a whole. In addition, equity markets tend to move in cycles, which may cause stock prices to fall over short or extended periods of time.
Market Capitalization Risk. Securities issued by companies of different market capitalizations tend to go in and out of favor based on market and economic conditions. During a period when securities of a particular market capitalization fall behind other types of investments, the fund’s performance could be impacted.
Large-Cap Company Risk. Large-cap companies are generally more mature and the securities issued by these companies may not be able to reach the same levels of growth as the securities issued by small- or mid-cap companies.
Schwab International Opportunities Fund | Annual Report31
Schwab International Opportunities Fund
Financial Notes (continued)
3. Risk Factors (continued):
Mid-Cap Company Risk. Mid-cap companies may be more vulnerable to adverse business or economic events than larger, more established companies and the value of securities issued by these companies may move sharply.
Small-Cap Company Risk. Securities issued by small-cap companies may be riskier than those issued by larger companies, and their prices may move sharply, especially during market upturns and downturns.
Foreign Investment Risk. The fund’s investments in securities of foreign issuers involve certain risks that may be greater than those associated with investments in securities of U.S. issuers. These include risks of adverse changes in foreign economic, political, regulatory and other conditions; changes in currency exchange rates or exchange control regulations (including limitations on currency movements and exchanges); the imposition of economic sanctions or other government restrictions; differing accounting, auditing, financial reporting and legal standards and practices; differing securities market structures; and higher transaction costs. These risks may negatively impact the value or liquidity of the fund’s investments, and could impair the fund’s ability to meet its investment objective or invest in accordance with its investment strategy. There is a risk that investments in securities denominated in, and/or receiving revenues in, foreign currencies will decline in value relative to the U.S. dollar or, in the case of hedging positions, that the U.S. dollar will decline in value relative to the currency hedged, resulting in the dollar value of the fund’s investment being adversely affected. Foreign securities may also include investments in variable interest entities (VIEs) structures, which are created by China-based operating companies in jurisdictions outside of China to obtain indirect financing due to Chinese regulations that prohibit non-Chinese ownership of those companies. To the extent the fund’s investments in a single country or a limited number of countries represent a large percentage of the fund’s assets, the fund’s performance may be adversely affected by the economic, political, regulatory and social conditions in those countries, and the fund’s price may be more volatile than the price of a fund that is geographically diversified.
Emerging Markets Risk. Emerging market countries may be more likely to experience political turmoil or rapid changes in market or economic conditions than more developed countries. Emerging market countries often have less uniformity in accounting, auditing, financial reporting and recordkeeping requirements and greater risk associated with the custody of securities. In addition, the financial stability of issuers (including governments) in emerging market countries may be more precarious than in developed countries. As a result, there may be an increased risk of illiquidity and price volatility associated with the fund’s investments in emerging market countries, which may be magnified by currency fluctuations relative to the U.S. dollar, and, at times, it may be difficult to value such investments.
Currency Risk. As a result of the fund’s investments in securities denominated in, and/or receiving revenues in, foreign currencies, the fund will be subject to currency risk. This is the risk that those currencies will decline in value relative to the U.S. dollar. If such an event occurs, the dollar value of an investment in the fund would be adversely affected.
Sampling Index Tracking Risk. The portion of the fund that is invested in accordance with a particular index may not fully replicate the index and may hold securities not included in the index. As a result, the fund is subject to the risk that Schwab Asset Management’s investment management strategy, the implementation of which is subject to a number of constraints, may not produce the intended results. Because Schwab Asset Management utilizes a sampling approach the portion of the fund it manages may not track the return of the index as well as it would if the fund purchased all of the securities in the index.
Derivatives Risk. The fund may use derivatives to enhance returns or hedge against market declines. Examples of derivatives are options, futures, options on futures and swaps. An option is the right, but not the obligation, to buy or sell an instrument at a specific price on or before a specific date. A future is an agreement to buy or sell a financial instrument at a specific price on a specific day. A swap is an agreement whereby two parties agree to exchange payment streams calculated in relation to a rate, index, instrument or certain securities and a predetermined amount. A credit default swap is an agreement in which the seller agrees to make a payment to the buyer in the event of a specified credit event in exchange for a fixed payment or series of fixed payments.
The fund’s use of derivative instruments involves risks different from, or possibly greater than, the risks associated with investing directly in securities and other traditional investments. Certain of these risks, such as liquidity risk, market risk and management risk are discussed elsewhere in this section. The fund’s use of derivatives is also subject to credit risk, leverage risk, lack of availability risk, valuation risk, correlation risk and tax risk. Credit risk is the risk that the counterparty to a derivatives transaction may not fulfill its obligations. Leverage risk is the risk that a small percentage of assets invested in derivatives can have a disproportionately large impact on the fund. Lack of availability risk is the risk that suitable derivative transactions may not be available in all circumstances for risk management or other purposes. Valuation risk is the risk that a particular derivative may be valued incorrectly. Correlation risk is the risk that changes in the value of the derivative may not correlate perfectly with the underlying asset, rate or index. Tax risk is the risk that the use of derivatives may cause the fund to realize higher amounts of short-term capital gains. The fund’s use of derivatives could reduce the fund’s performance, increase its volatility, and could cause the fund to lose more than the initial
32
Schwab International Opportunities Fund | Annual Report
Schwab International Opportunities Fund
Financial Notes (continued)
3. Risk Factors (continued):
amount invested. The use of derivatives, that are subject to regulation by the Commodity Futures Trading Commission (CFTC), could cause the fund to become a commodity pool, which would require the fund to comply with certain CFTC rules.The fund’s use of derivatives also could create a risk of counterparty default under certain transactions, risks that the fund would need to liquidate portfolio positions when it may not be advantageous to do so in order to meet margin and payment obligations, and legal risks relating to insufficient documentation, insufficient capacity or authority of a counterparty, or legality or enforceability of a contract.
Liquidity Risk. The fund may be unable to sell certain securities, such as illiquid securities, readily at a favorable time or price, or the fund may have to sell them at a loss.
Securities Lending Risk. Securities lending involves the risk of loss of rights in, or delay in recovery of, the loaned securities if the borrower fails to return the security loaned or becomes insolvent.
Please refer to the fund’s prospectus for a more complete description of the principal risks of investing in the fund.
4. Affiliates and Affiliated Transactions:Investment Adviser
Charles Schwab Investment Management, Inc., dba Schwab Asset Management, a wholly owned subsidiary of The Charles Schwab Corporation, serves as the fund’s investment adviser and administrator pursuant to an Investment Advisory and Administration Agreement between the investment adviser and the trust. The fund’s subadvisers also provide day-to-day portfolio management services to the fund, subject to the supervision of the investment adviser.
For its advisory and administrative services to the fund, the investment adviser is entitled to receive an annual fee, payable monthly, equal to 0.63% of the fund’s average daily net assets. The investment adviser (not the fund) pays a portion of the advisory fees it receives to the subadvisers in return for their portfolio management services.
Shareholder Servicing
The Board has adopted a Shareholder Servicing Plan (the Plan) on behalf of the fund. The Plan enables the fund to bear expenses relating to the provision by financial intermediaries, including Charles Schwab & Co., Inc. (Schwab), a broker-dealer affiliate of the investment adviser, (together, service providers), of certain account maintenance, customer liaison and shareholder services to the current shareholders of the fund.
Pursuant to the Plan, the fund’s shares are subject to an annual shareholder servicing fee up to 0.20%. The shareholder servicing fee paid to a particular service provider is made pursuant to its written agreement with Schwab, as distributor of the fund (or, in the case of payments made to Schwab acting as a service provider, pursuant to Schwab’s written agreement with the fund). Payments under the Plan are made as described above without regard to whether the fee is more or less than the service provider’s actual cost of providing the services, and if more, such excess may be retained as profit by the service provider.
Expense Limitation
Although these agreements specify certain fees for these services, the investment adviser and its affiliates have made an additional agreement with the fund, for so long as the investment adviser serves as the investment adviser to the fund, in which the agreement may only be amended or terminated with the approval of the Board, to limit the total annual fund operating expenses charged (including acquired fund fees and expenses, which are indirect expenses incurred by the fund through its investments in underlying funds), excluding interest, taxes and certain non-routine expenses to 0.86%.
Schwab International Opportunities Fund | Annual Report33
Schwab International Opportunities Fund
Financial Notes (continued)
4. Affiliates and Affiliated Transactions (continued):
Investments from Affiliates
Certain funds in the Fund Complex may own shares of other funds in the Fund Complex. The table below reflects the percentage of shares of the fund in this report that are owned by other funds in the Fund Complex as of October 31, 2023, as applicable:
Investments in Affiliates
The fund may engage in certain transactions involving related parties. Pursuant to an exemptive order issued by the SEC, the fund may invest in other related funds. As of October 31, 2023, the fund’s ownership percentage of other related fund’s shares is as follows:
Schwab Emerging Markets Equity ETF | |
Other Affiliated Transactions
The professional fees related to European Union foreign withholding tax claims discussed in financial note 2(d) are non-contingent and non-routine fees. The investment adviser agreed to pay these professional fees, on behalf of the fund, subject to reimbursement by the fund to the extent the fund is able to successfully recover taxes withheld in the future.
During the period ended October 31, 2023, the professional fees related to the filing of foreign withholding claims incurred by the fund and paid by the investment adviser were $4,023, as shown as Professional fees in the fund’s Statement of Operations.
During the period ended October 31, 2023, the fund recovered previously withheld foreign taxes from Sweden and France. The payments received by the fund amounted to $2,343,033, which includes $85,081 of interest income, and is recorded as Dividends received from securities — unaffiliated in the fund’s Statement of Operations. The investment adviser paid upfront professional fees associated with recovering these foreign taxes in the amount of $3,884, which has been reimbursed to the investment adviser by the fund and is recorded as Dividends received from securities - unaffiliated in the fund’s Statement of Operations.
As of October 31, 2023, the balance of professional fees related to foreign withholding tax claims subject to future reimbursement by the fund to the investment adviser was $1,679.
No other amounts for additional foreign withholding tax claims are reflected in the financial statements due to the uncertainty surrounding the ultimate resolution of proceedings, the likelihood of receipt of these claims, and the potential timing of payment.
Interfund Transactions
The fund’s investment adviser or subadvisers may engage in transactions with certain other funds they manage in accordance with procedures adopted by the Board pursuant to Rule 17a-7 under the 1940 Act. When a fund is seeking to sell a security that another is seeking to buy, an interfund transaction can allow both funds to benefit by reducing transaction costs. This practice is limited to funds that share the same investment adviser, subadviser, trustees and/or officers. For the period ended October 31, 2023, the fund’s purchases and sales of securities with other funds managed by the investment adviser or subadvisers was $35,089,878 and $40,088,300 respectively, and includes realized losses of $4,895,269.
34
Schwab International Opportunities Fund | Annual Report
Schwab International Opportunities Fund
Financial Notes (continued)
4. Affiliates and Affiliated Transactions (continued):
Interfund Borrowing and Lending
Pursuant to an exemptive order issued by the SEC, the fund may enter into interfund borrowing and lending transactions with other funds in the Fund Complex. All loans are for temporary or emergency purposes and the interest rate to be charged will be the average of the overnight repurchase agreement rate and the short-term bank loan rate. All loans are subject to numerous conditions designed to ensure fair and equitable treatment of all participating funds. The interfund lending facility is subject to the oversight and periodic review by the Board. The fund had no interfund borrowing or lending activity during the period.
5. Board of Trustees:The Board may include people who are officers and/or directors of the investment adviser or its affiliates. Federal securities law limits the percentage of such “interested persons” who may serve on a trust’s board, and the trust was in compliance with these limitations throughout the report period. The fund did not pay any of these interested persons for their services as trustees, but did pay non-interested persons (independent trustees), as noted in the fund’s Statement of Operations. For information regarding the trustees, please refer to the Trustees and Officers table at the end of this report.
6. Borrowing from Banks:During the period, the fund was a participant with other funds in the Fund Complex in a joint, syndicated, committed $1 billion line of credit (the Syndicated Credit Facility), which matured on September 28, 2023. On September 28, 2023, the Syndicated Credit Facility was amended to run for a new 364 day period with the line of credit amount remaining unchanged, maturing on September 26, 2024. Under the terms of the Syndicated Credit Facility, in addition to the interest charged on any borrowings by the fund, the fund paid a commitment fee of 0.15% per annum on the fund’s proportionate share of the unused portion of the Syndicated Credit Facility.
During the period, the fund was a participant with other funds in the Fund Complex in a joint, unsecured, uncommitted $400 million line of credit (the Uncommitted Credit Facility) with State Street Bank and Trust Company, which matured on September 28, 2023. On September 28, 2023, the Uncommitted Credit Facility was amended to run for a new 364 day period with the line of credit amount remaining unchanged, maturing on September 26, 2024. Under the terms of the Uncommitted Credit Facility, the fund pays interest on the amount the fund borrows. There were no borrowings by the fund from either line of credit during the period.
The fund also has access to custodian overdraft facilities. The fund may have utilized the overdraft facility and incurred an interest expense, which is disclosed in the fund’s Statement of Operations, if any. The interest expense is determined based on a negotiated rate above the current Federal Funds Rate.
7. Purchases and Sales of Investment Securities:For the period ended October 31, 2023, purchases and sales of securities (excluding short-term obligations) were as follows:
8. Derivatives:The fund entered into equity index futures contracts during the report period. The fund invested in futures contracts to equitize available cash. The value and variation margin for futures contracts held at October 31, 2023, if any, are presented in the fund’s Portfolio Holdings and Statement of Assets and Liabilities, respectively. The net realized gains (losses) and net change in unrealized appreciation (depreciation) on futures contracts are presented in the Statement of Operations, if any. Refer to financial note 2(b) for the fund’s accounting policies with respect to futures contracts and financial note 3 for disclosures concerning the risks of investing in futures contracts. During the period ended October 31, 2023, the month-end average notional amounts of futures contracts held by the fund and the month-end average number of contracts held were $23,967,260 and 234, respectively.
Schwab International Opportunities Fund | Annual Report35
Schwab International Opportunities Fund
Financial Notes (continued)
8. Derivatives (continued):
The fund invested in forwards in connection with the purchase and sale of portfolio securities to minimize the uncertainty of changes in future foreign currency exchange rates and to hedge exposure to certain currencies. Refer to financial note 2(b) for the fund’s accounting policies with respect to forwards and financial note 3 for disclosures concerning the risks of investing in forwards. During the period ended October 31, 2023, the month-end average forward foreign currency notional amount and the month-end average unrealized appreciation were $3,288,048 and $2,097, respectively.
As of October 31, 2023, the derivatives contracts held by the fund, categorized by primary risk exposure, were:
| |
Equity Index Futures Contracts1 | |
Forward Foreign Currency Exchange Contracts2 | |
| |
Equity Index Futures Contracts3 | |
Forward Foreign Currency Exchange Contracts4 | |
| Includes cumulative unrealized appreciation of futures contracts as reported in the Portfolio Holdings. Only current day’s variation margin on futures contracts is reported within the Statement of Assets and Liabilities. |
| Statement of Assets and Liabilities location: Unrealized appreciation on forward foreign currency exchange contracts. |
| Includes cumulative unrealized depreciation of futures contracts as reported in the Portfolio Holdings. Only current day’s variation margin on futures contracts is reported within the Statement of Assets and Liabilities. |
| Statement of Assets and Liabilities location: Unrealized depreciation on forward foreign currency exchange contracts. |
The effects of the derivatives held by the fund in the Statement of Operations for the period ended October 31, 2023 were:
Equity Index Futures Contracts | |
| |
Net change in unrealized appreciation (depreciation)2 | |
Forward Foreign Currency Exchange Contracts | |
| |
Net change in unrealized appreciation (depreciation)2 | |
| Statement of Operations location: Net realized gains on futures contracts and net realized gains on forward foreign currency exchange contracts. |
| Statement of Operations location: Net change in unrealized appreciation (depreciation) on futures contracts and net change in unrealized appreciation (depreciation) on forward foreign currency exchange contracts. |
The fund’s forwards are entered into pursuant to International Swaps and Derivatives Association, Inc. (ISDA) agreements which govern certain terms of derivative transactions. ISDA agreements typically contain, among other things, master netting provisions in the event of a default or other termination event. Master netting provisions allow the fund and the counterparty, in the event of a default or other termination event, to offset payable and receivable amounts for each party related to derivative contracts to one net amount payable by either the fund or the counterparty. The fund’s forwards, which are reported gross in the Statement of Assets and Liabilities, are presented in the table below. The following table presents the fund’s forwards, net of amounts available for offset under a master netting agreement and net of any related collateral received by the fund for assets and pledged by the fund for liabilities as of October 31, 2023.
| GROSS AMOUNTS OF ASSETS PRESENTED IN THE STATEMENT OF ASSETS AND LIABILITIES | FINANCIAL INSTRUMENTS AVAILABLE FOR OFFSET | | |
| | | | |
| | | | |
| | | | |
| | | | |
36
Schwab International Opportunities Fund | Annual Report
Schwab International Opportunities Fund
Financial Notes (continued)
8. Derivatives (continued):
| GROSS AMOUNTS OF LIABILITIES PRESENTED IN THE STATEMENT OF ASSETS AND LIABILITIES | FINANCIAL INSTRUMENTS AVAILABLE FOR OFFSET | | |
| | | | |
| | | | |
| | | | |
| | | | |
| | | | |
| Represents the net amount due from/due to the counterparty in the event of default. |
9. Federal Income Taxes:As of October 31, 2023, the tax basis cost of the fund’s investments and gross unrealized appreciation and depreciation were as follows:
| | GROSS UNREALIZED
APPRECIATION | GROSS UNREALIZED
DEPRECIATION | NET UNREALIZED
APPRECIATION
(DEPRECIATION) |
| | | | |
| | | | |
| | | | |
As of October 31, 2023, the components of distributable earnings on a tax basis were as follows:
UNDISTRIBUTED
ORDINARY
INCOME | NET UNREALIZED
APPRECIATION
(DEPRECIATION)
ON INVESTMENTS | NET OTHER UNREALIZED
APPRECIATION
(DEPRECIATION) | CAPITAL LOSS
CARRYFORWARDS AND OTHER LOSSES | |
| | | | |
The primary differences between book basis and tax basis unrealized appreciation or unrealized depreciation of investments are the tax deferral of losses on wash sales, the realization for tax purposes of unrealized appreciation or depreciation on futures contracts, and the realization for tax purposes of unrealized appreciation on investments in PFICs. The tax cost of the fund’s investments, disclosed above, have been adjusted from their book amounts to reflect these unrealized appreciation or depreciation differences, as applicable.
Capital loss carryforwards have no expiration and may be used to offset future realized capital gains for federal income tax purposes. As of October 31, 2023, the fund had capital loss carryforwards of $75,359,635.
The tax basis components of distributions paid during the current and prior fiscal years were as follows:
| CURRENT FISCAL YEAR END DISTRIBUTIONS | PRIOR FISCAL YEAR END DISTRIBUTIONS |
| | | | |
| | | | |
Distributions paid to shareholders are based on net investment income and net realized gains determined on a tax basis, which may differ from net investment income and net realized gains for financial reporting purposes. These differences reflect the differing character of certain income items and net realized gains and losses for financial statement and tax purposes, and may result in reclassification among certain capital accounts in the financial statements. The fund may also designate a portion of the amount paid to redeeming shareholders as a distribution for tax purposes.
Permanent book and tax basis differences may result in reclassifications between components of net assets as required. The adjustments will have no impact on net assets or the results of operations.
Schwab International Opportunities Fund | Annual Report37
Schwab International Opportunities Fund
Financial Notes (continued)
9. Federal Income Taxes (continued):
As of October 31, 2023, management has reviewed the tax positions for open periods (for federal purposes, three years from the date of filing and for state purposes, four years from the date of filing) as applicable to the fund, and has determined that no provision for income tax is required in the fund’s financial statements. The fund recognizes interest and penalties, if any, related to unrecognized tax benefits as income tax expense in the fund’s Statement of Operations. During the fiscal year ended October 31, 2023, the fund did not incur any interest or penalties.
10. Subsequent Events:Management has determined there are no subsequent events or transactions through the date the financial statements were issued that would have materially impacted the financial statements as presented.
38
Schwab International Opportunities Fund | Annual Report
Schwab International Opportunities Fund
Report of Independent Registered Public Accounting Firm
To the Board of Trustees of Schwab Capital Trust and Shareholders of Schwab International Opportunities Fund:
Opinion on the Financial Statements and Financial Highlights
We have audited the accompanying statement of assets and liabilities, including the portfolio holdings, of the Schwab International Opportunities Fund (the “Fund”), one of the funds constituting Schwab Capital Trust, as of October 31, 2023, the related statement of operations for the year then ended, the statements of changes in net assets for each of the two years in the period then ended, the financial highlights for each of the four years in the period then ended, and the related notes. In our opinion, the financial statements and financial highlights present fairly, in all material respects, the financial position of the Fund as of October 31, 2023, and the results of its operations for the year then ended, the changes in its net assets for each of the two years in the period then ended, and the financial highlights for each of the four years in the period then ended in conformity with accounting principles generally accepted in the United States of America. The financial highlights for the year ended October 31, 2019 were audited by other auditors, whose report, dated December 16, 2019, expressed an unqualified opinion on such financial highlights.
Basis for Opinion
These financial statements and financial highlights are the responsibility of the Fund’s management. Our responsibility is to express an opinion on the Fund’s financial statements and financial highlights based on our audits. We are a public accounting firm registered with the Public Company Accounting Oversight Board (United States) (PCAOB) and are required to be independent with respect to the Fund in accordance with the U.S. federal securities laws and the applicable rules and regulations of the Securities and Exchange Commission and the PCAOB.
We conducted our audits in accordance with the standards of the PCAOB. Those standards require that we plan and perform the audit to obtain reasonable assurance about whether the financial statements and financial highlights are free of material misstatement, whether due to error or fraud. The Fund is not required to have, nor were we engaged to perform, an audit of its internal control over financial reporting. As part of our audits, we are required to obtain an understanding of internal control over financial reporting but not for the purpose of expressing an opinion on the effectiveness of the Fund’s internal control over financial reporting. Accordingly, we express no such opinion.
Our audits included performing procedures to assess the risks of material misstatement of the financial statements and financial highlights, whether due to error or fraud, and performing procedures that respond to those risks. Such procedures included examining, on a test basis, evidence regarding the amounts and disclosures in the financial statements and financial highlights. Our audits also included evaluating the accounting principles used and significant estimates made by management, as well as evaluating the overall presentation of the financial statements and financial highlights. Our procedures included confirmation of securities owned as of October 31, 2023, by correspondence with the custodian and brokers; when replies were not received from brokers, we performed other auditing procedures. We believe that our audits provide a reasonable basis for our opinion.
Deloitte & Touche LLP
Denver, Colorado
December 15, 2023
We have served as the auditor of one or more investment companies in the Schwab Funds Complex since 2020.
Schwab International Opportunities Fund | Annual Report39
Schwab International Opportunities Fund
Other Federal Tax Information (unaudited)
The fund may elect to pass through, under section 853(a) of the Internal Revenue Code, the foreign tax credit of $0 to its shareholders for the fiscal year ended October 31, 2023. The respective foreign source income on the fund is $26,056,612.
For the fiscal year ended October 31, 2023, the fund designates $11,432,583 of the dividend distributions as qualified dividends for the purposes of the maximum rate under section 1(h)(11) of the Internal Revenue Code. Shareholders will be notified in January 2024 via IRS Form 1099 of the amounts for use in preparing their 2023 income tax return.
Under section 852(b)(3)(C) of the Internal Revenue Code, the fund hereby designates $26,256,614 as long-term capital gain dividends for the fiscal year ended October 31, 2023.
40
Schwab International Opportunities Fund | Annual Report
Schwab International Opportunities Fund
Liquidity Risk Management Program (unaudited)
The fund has adopted and implemented a liquidity risk management program (the “program”) as required by Rule 22e-4 under the Investment Company Act of 1940, as amended. The fund’s Board of Trustees (the “Board”) has designated the fund’s investment adviser, Charles Schwab Investment Management, Inc., dba Schwab Asset Management, as the administrator of the program. Personnel of the investment adviser or its affiliates conduct the day-to-day operation of the program.
Under the program, the investment adviser manages a fund’s liquidity risk, which is the risk that the fund could not meet shareholder redemption requests without significant dilution of remaining shareholders’ interests in the fund. The program is reasonably designed to assess and manage a fund’s liquidity risk, taking into consideration the fund’s investment strategy and the liquidity of its portfolio investments during normal and reasonably foreseeable stressed conditions; its historical redemption history and shareholder concentrations; and its cash holdings and access to other funding sources, including the custodian overdraft facility and lines of credit. The investment adviser’s process of determining the degree of liquidity of each fund’s investments is supported by third-party liquidity assessment vendors.
The fund’s Board reviewed a report at its meeting held on September 19, 2023 prepared by the investment adviser regarding the operation and effectiveness of the program for the period June 1, 2022, through May 31, 2023, which included individual fund liquidity metrics. The report summarized the operation of the program and the information and factors considered by the investment adviser in assessing whether the program has been adequately and effectively implemented with respect to a fund. In addition, the investment adviser provided its assessment that the program had been operating effectively in managing the fund’s liquidity risk.
Schwab International Opportunities Fund | Annual Report41
Schwab International Opportunities Fund
Approval of Renewal of Investment Advisory and Sub-Advisory Agreements and New Sub-Advisory Agreement
The Investment Company Act of 1940, as amended (the 1940 Act), requires that the initial approval and/or continuation of a fund’s investment advisory agreement must be specifically approved (1) by the vote of the trustees or by a vote of the shareholders of the fund, and (2) by the vote of a majority of the trustees who are not parties to the investment advisory agreement or “interested persons” of any party thereto (the Independent Trustees), cast in person at a meeting called for the purpose of voting on such approval. In connection with such approvals, the fund’s trustees must request and evaluate, and the investment adviser is required to furnish, such information as may be reasonably necessary to evaluate the terms of the investment advisory agreement.
Approval of Renewal of Investment Advisory Agreement and Sub-Advisory Agreement
The Board of Trustees (the Board or the Trustees, as appropriate) calls and holds one or more meetings each year that are dedicated, in whole or in part, to considering whether to renew the investment advisory and administration agreement between Schwab Capital Trust (the Trust) and Charles Schwab Investment Management, Inc. (dba Schwab Asset Management) (the investment adviser) with respect to the existing funds in the Trust, including Schwab International Opportunities Fund (the Fund), and the individual sub-advisory agreements between the investment adviser and American Century Investment Management, Inc., Baillie Gifford Overseas Limited (Baillie Gifford), Harris Associates L.P. (Harris), and Mondrian Investment Partners Limited (Mondrian) relating to the Fund (each, a Sub-Adviser and collectively, the Sub-Advisers). Such investment advisory and administration agreement and sub-advisory agreements are collectively referred to herein as the Agreements. The Trustees also review certain other agreements pursuant to which the investment adviser provides investment advisory services to certain other registered investment companies. In preparation for the meeting(s), the Board requests and reviews a wide variety of materials provided by the investment adviser and the Sub-Advisers, including information about their affiliates, personnel, business goals and priorities, profitability, third-party oversight, corporate structure and operations. As part of the renewal process, the Independent Trustees’ legal counsel, on behalf of the Independent Trustees, sends an information request letter to the investment adviser and the investment adviser sends an information request letter to each of the Sub-Advisers seeking certain relevant information. The responses by the investment adviser and the Sub-Advisers are provided to the Trustees in the Board materials for their review prior to their meeting, and the Trustees are provided with the opportunity to request any additional materials. The Board also receives data provided by an independent provider of
investment company data. This information is in addition to the detailed information about the Fund that the Board reviews during the course of each year, including information that relates to the Fund’s operations and performance, legal and compliance matters, risk management, portfolio turnover, and sales and marketing activity. In considering the renewal, the Independent Trustees receive advice from Independent Trustees’ legal counsel, including a memorandum regarding the responsibilities of trustees for the approval of investment advisory agreements. In addition, the Independent Trustees participate in question and answer sessions with representatives of the investment adviser and meet in executive session outside the presence of Fund management. The Board also discusses with the investment adviser the Fund’s operations and the investment adviser’s ability, consistent with the “manager of managers” structure of the Fund, to (i) identify and recommend to the Trustees sub-advisers for the Fund, (ii) monitor and oversee the performance and investment capabilities of each Sub-Adviser, and (iii) recommend the termination and/or replacement of a Sub-Adviser when appropriate.
The Board, including a majority of the Independent Trustees, considered information relating specifically to the continuance of the Agreements with respect to the Fund at meetings held on April 27, 2023 and June 7, 2023, and approved the renewal of the Agreements with respect to the Fund for an additional one-year term at the meeting on June 7, 2023 called for the purpose of voting on such approval.
The Board’s approval of the continuance of the Agreements with respect to the Fund was based on consideration and evaluation of a variety of specific factors discussed at these meetings and at prior meetings, including:
1.
the nature, extent and quality of the services provided to the Fund under the Agreements, including the resources of the investment adviser and its affiliates, and the Sub-Advisers, dedicated to the Fund;
2.
the Fund’s investment performance and how it compared to that of certain other comparable mutual funds and benchmark data;
3.
the Fund’s expenses and how those expenses compared to those of certain other similar mutual funds;
4.
the profitability of the investment adviser and its affiliates, including Charles Schwab & Co., Inc. (Schwab), with respect to the Fund, including both direct and indirect benefits accruing to the investment adviser and its affiliates, as well as the profitability of the Sub-Advisers; and
42
Schwab International Opportunities Fund | Annual Report
Schwab International Opportunities Fund
5.
the extent to which economies of scale would be realized as the Fund grows and whether fee levels in the Agreements reflect those economies of scale for the benefit of Fund investors.
Nature, Extent and Quality of Services. The Board considered the nature, extent and quality of the services provided to the Fund and the resources of the investment adviser and its affiliates and the Sub-Advisers dedicated to the Fund. In this regard, the Trustees evaluated, among other things, the investment adviser’s and the Sub-Advisers’ experience, track record, compliance program, resources dedicated to hiring and retaining skilled personnel and specialized talent, and information security resources. The Trustees also considered information provided by the investment adviser and the Sub-Advisers relating to the services and support provided with respect to the Fund’s portfolio management team, portfolio strategy, and internal investment guidelines, as well as trading infrastructure, liquidity management, product design and analysis, shareholder communications, securities valuation, and vendor and risk oversight. The Trustees also considered investments the investment adviser has made in its infrastructure, including modernizing the investment adviser’s technology and use of data, increasing expertise in key areas (including portfolio management and trade operations), and improving business continuity, cybersecurity, due diligence, risk management processes, and information security programs, which are designed to provide enhanced services to the Fund and its shareholders. The Trustees considered Schwab’s overall financial condition and its reputation as a full service brokerage firm as well as the wide range of products, services and account features that benefit Funds shareholders who are brokerage clients of Schwab. The Board also considered the nature, extent and quality of the sub-advisory services provided by the Sub-Advisers to the Fund and the resources each dedicates to the Fund. Following such evaluation, the Board concluded, within the context of its full deliberations, that the nature, extent and quality of services provided by the investment adviser and the Sub-Advisers to the Fund and the resources of the investment adviser, its affiliates, and the Sub-Advisers dedicated to the Fund supported renewal of the Agreements with respect to the Fund.
Fund Performance. The Board considered the Fund’s performance in determining whether to renew the Agreements with respect to the Fund. Specifically, the Trustees considered the Fund’s performance relative to a peer category of other mutual funds and an applicable benchmark index, in light of total return and the market environment, as well as in consideration of the Fund’s investment style and strategy. As part of this review, the Trustees considered the composition of the peer category, selection criteria and the reputation of the independent provider of investment company data who prepared the peer category analysis. In addition, the Trustees considered whether irrespective of relative performance, each Sub-Adviser’s absolute performance was consistent with expectations for such Sub-Adviser’s unique investment
methodology. The Trustees further considered the level of Fund performance in the context of their review of Fund expenses and adviser and Sub-Adviser profitability discussed below and also noted that the Board and a designated committee of the Board review performance throughout the year. Following such evaluation, the Board concluded, within the context of its full deliberations, that the performance of the Fund supported renewal of the Agreements with respect to the Fund.
Fund Expenses. With respect to the Fund’s expenses, the Trustees considered the rate of compensation called for by the Agreement and the Fund’s operating expense ratio, in each case, in comparison to those of other similar mutual funds, such peer groups and comparisons having been selected and calculated by an independent provider of investment company data. The investment adviser reported to the Board, and the Board took into account, the risk assumed by the investment adviser in the development of the Fund and provision of services as well as the competitive marketplace for financial products. The Trustees considered the effects of the investment adviser’s and Schwab’s practice of waiving certain fees to prevent total annual operating expenses of the Fund from exceeding a specified cap. The Trustees also considered the investment adviser’s contractual commitment to limit the total annual operating expenses of the Fund for so long as the investment adviser serves as the adviser to the Fund. The Trustees also considered fees charged by the investment adviser and the Sub-Advisers to other mutual funds and to other types of accounts, but, with respect to such other types of accounts, accorded less weight to such comparisons due to the different legal, regulatory, compliance and operating features of mutual funds as compared to these other types of accounts, and any differences in the nature and scope of the services the investment adviser provides to these other accounts, as well as differences in the market for these types of accounts. Following such evaluation, the Board concluded, within the context of its full deliberations, that the expenses of the Fund are reasonable and supported renewal of the Agreement with respect to the Fund.
Profitability. The Trustees considered the compensation flowing to the investment adviser and its affiliates, directly or indirectly and reviewed profitability on a pre-tax basis, without regard to distribution expenses. The Trustees reviewed the profitability of the investment adviser relating to the Schwab fund complex as a whole, noting the benefits to Fund shareholders of being part of the Schwab fund complex, including the allocations of certain costs across the Fund and other funds in the complex. The Trustees also considered any other benefits derived by the investment adviser from its relationship with the Fund, such as whether, by virtue of its management of the Fund, the investment adviser obtains investment information or other research resources that aid it in providing advisory services to other clients. The Trustees considered whether the compensation and profitability with respect to the Fund under the Agreements and other service agreements were reasonable in light of the quality of all
Schwab International Opportunities Fund | Annual Report43
Schwab International Opportunities Fund
services rendered to the Fund by the investment adviser and its affiliates. The Trustees noted that the investment adviser continues to invest substantial sums in its business in order to provide enhanced research capabilities, services and systems to benefit the Fund.
In addition, the Trustees also considered the compensation received by each Sub-Adviser, directly or indirectly. The Trustees also considered any other benefits derived by each Sub-Adviser from its relationship with the Fund, such as whether, by virtue of its management of the Fund, such Sub-Adviser obtains investment information or other research resources that aid it in providing advisory services to other clients. With respect to each Sub-Adviser, the Trustees considered whether the compensation and profitability under the applicable Agreement were reasonable and justified in light of the quality of all services rendered to the Fund by such Sub-Adviser, and its affiliates. The Board also considered the profitability of each Sub-Adviser with respect to the sub-advisory services it provides to the Fund, although, when doing so, the Board took into account the fact that the Sub-Advisers are compensated by the investment adviser, and not by the Fund directly, and such compensation with respect to any Sub-Adviser reflects an arms-length negotiation between the Sub-Adviser and the investment adviser. Based on this evaluation, the Board concluded, within the context of its full deliberations, that the profitability of the investment adviser and the Sub-Advisers is reasonable and supported renewal of the Agreements with respect to the Fund.
Economies of Scale. Although the Trustees recognized the difficulty of determining economies of scale with precision, and although the Fund does not have breakpoints in its advisory fees, the Trustees considered the potential existence of any economies of scale and whether those are passed along to the Fund’s shareholders through (i) the enhancement of services provided to the Fund in return for fees paid, including through investments by the investment adviser in the investment adviser’s infrastructure, including modernizing the investment adviser’s technology and use of data, increasing expertise and capabilities in key areas (including portfolio and trade operations), and improving business continuity, cybersecurity, due diligence and information security programs, which are designed to provide enhanced services to the Fund and its shareholders; (ii) graduated investment advisory fee schedules or unitary fee structures, fee waivers, or expense caps by the investment adviser and its affiliates for those funds in the Schwab fund complex with such features; and (iii) pricing the Fund to scale and keeping overall expenses down as the Fund grows. The Trustees acknowledged that, the investment adviser has invested in its infrastructure, as discussed above, over time and that the investment adviser’s internal costs of providing investment management, technology, administrative, legal and compliance services to the Fund continue to increase as a result of regulatory or other developments. The Trustees considered that the investment adviser and its affiliates employ contractual expense caps to protect shareholders from higher
fees, including, for example, when fund assets are relatively small. Based on this evaluation, the Board concluded, within the context of its full deliberations, that the Fund obtains reasonable benefits from economies of scale.
* * * * * * * * * * * * * * * * * * * * * * * * * * * * * * * * * * * * * * * *
In the course of their deliberations, the Trustees may have accorded different weights to various factors and did not identify any particular information or factor that was all important or controlling. Based on the Trustees’ deliberation and their evaluation of the information described above, the Board, including all of the Independent Trustees, approved the continuation of the Agreements with respect to the Fund and concluded that the compensation under the Agreements with respect to the Fund is fair and reasonable in light of the services provided and the related expenses borne by the investment adviser and its affiliates and such other matters as the Trustees considered to be relevant in the exercise of their reasonable judgment.
Approval of New Sub-Advisory Agreement
At a meeting of the Board held on September 20 2023, the investment adviser recommended, and the Trustees, including a majority of the Independent Trustees, approved (i) the termination of the sub-advisory agreement between the investment adviser and Mondrian, pursuant to which Mondrian served as sub-adviser to the Fund; and (ii) a new investment sub-advisory agreement between the investment adviser and Columbia Management Investment Advisers, LLC (Columbia) (New Sub-Advisory Agreement), pursuant to which Columbia was appointed as a sub-adviser to the Fund, each to take effect on September 26, 2023.
The Board was provided with materials related to Columbia in advance of the meeting. The materials and related discussions included, but were not limited to, the following information about Columbia: (a) quality of investment management and other services; (b) investment management personnel; (c) operations and financial condition; (d) brokerage practices (including any soft dollar arrangements) and other investment strategies; (e) compliance systems; (f) policies on, and compliance procedures for, personal securities transactions; (g) reputation, expertise and resources; and (h) performance with respect to similar accounts managed by Columbia. In addition, the Board was provided with information about the level of the sub- advisory fees to be paid to Columbia, and comparable fees paid to Columbia for managing similar accounts. In considering the proposed New Sub-Advisory Agreement, the Independent Trustees received advice from independent legal counsel to the Independent Trustees.
In its consideration of the approval of the New Sub-Advisory Agreement, the Board considered a variety of factors, including:
1.
the nature, extent and quality of the services to be provided
44
Schwab International Opportunities Fund | Annual Report
Schwab International Opportunities Fund
to the Fund under the New Sub-Advisory Agreement and, including the resources Columbia to be dedicated to the Fund;
2.
Columbia’s investment performance in providing advisory or sub-advisory services with respect to similar accounts;
3.
the Fund’s expenses and how those expenses would be impacted by the engagement of Columbia as sub-adviser;
4.
the profitability of the investment adviser and its affiliates, including Schwab, with respect to the Fund in light of the sub-advisory fees proposed to be paid to Columbia, including both direct and indirect benefits accruing to the investment adviser and its affiliates; and
5.
the extent to which economies of scale may be realized as the Fund grows and whether fee levels in the New Sub-Advisory Agreement reflect the economies of scale.
Nature, Extent and Quality of Services. The Board considered the nature, extent and quality of the sub-advisory services to be provided by Columbia to the Fund and the resources Columbia will dedicate to the Fund. In this regard, the Trustees considered the information provided by Columbia with respect to its history, reputation, expertise, qualifications of its personnel, and experience in managing the type of strategies for which Columbia was being engaged. The Board also considered reports regarding the search process undertaken by the investment adviser that led to the identification of Columbia by the investment adviser as a well-qualified sub-adviser to the Fund with an investment style consistent with the Fund’s investment objective, strategies and characteristics. The Trustees also considered the evaluation by the Fund’s Chief Compliance Officer of Columbia’s compliance program. Following such evaluation, the Board concluded, within the context of its full deliberations, that the nature, extent and quality of services to be provided by Columbia to the Fund and the resources of Columbia to be dedicated to the Fund supported approval of the New Sub-Advisory Agreement.
Investment Performance. The Board considered Columbia’s investment performance in determining whether to approve the New Sub-Advisory Agreement. Specifically, the Trustees considered Columbia’s relative performance in providing investment advisory services to similar accounts. Following such evaluation, the Board concluded, within the context of its full deliberations, that the investment performance of Columbia supported approval of the New Sub-Advisory Agreement.
Fund Expenses. When considering the fees to be paid to Columbia, the Trustees took into account the fact that Columbia will be compensated by the investment adviser, and not by the Fund, and that the fees paid to Columbia would not impact the fees paid by the Fund to the investment adviser. The Trustees also considered fees charged by Columbia to
comparable sub-advised accounts. The Board considered the investment adviser’s statements that the fees to be paid to Columbia are reasonable in light of the anticipated quality of services to be provided by Columbia. Following such evaluation, the Board concluded, within the context of its full deliberations, that the fees to be paid to Columbia are reasonable and supported approval of the New Sub-Advisory Agreement.
Profitability. With respect to the profitability of the investment adviser, the Trustees considered projected profitability to the investment adviser before and after the appointment of Columbia as a new sub-adviser. Based on this evaluation, the Board concluded, within the context of its full deliberations, that the expected profitability the investment adviser supported approval of the New Sub-Advisory Agreement. The Trustees took into account the fact that Columbia will be compensated by the investment adviser, and not by the Fund directly, and that the compensation paid to Columbia reflects an arms-length negotiation between the investment adviser and Columbia.
Economies of Scale. Although the Trustees recognized the difficulty of determining economies of scale with precision, the Trustees considered the potential existence of any economies of scale and whether those are passed along to the Fund’s shareholders through graduated investment advisory and sub-advisory fee schedules or other means, including any fee waivers by the investment adviser and its affiliates. In connection with its evaluation, the Board took into account the fact that the existing contractual investment advisory and proposed sub-advisory fee schedules relating to the Fund include lower fees at higher graduated asset levels and that the investment adviser had contractually agreed to waive investment advisory and other fees to prevent total Fund expenses from exceeding a specified cap. Based on this evaluation, the Board concluded, within the context of its full deliberations, that the Fund obtains reasonable benefits from economies of scale.
* * * * * * * * * * * * * * * * * * * * * * * * * * * * * * * * * * * * * * * *
In the course of their deliberations, the Trustees may have accorded different weights to various factors and did not identify any particular information or factor that was all important or controlling. Based on the Trustees’ deliberation and their evaluation of the information described above, the Board, including a majority of the Independent Trustees, approved the New Sub-Advisory Agreement for an initial two-year term and concluded that the compensation under the Sub-Advisory Agreement is fair and reasonable in light of such services, and such other matters as the Trustees considered to be relevant in the exercise of their reasonable judgment.
Schwab International Opportunities Fund | Annual Report45
Schwab International Opportunities Fund
Trustees and Officers
The tables below give information about the trustees and officers of Schwab Capital Trust, which includes the fund covered in this report. The “Fund Complex” includes The Charles Schwab Family of Funds, Schwab Capital Trust, Schwab Investments, Schwab Annuity Portfolios, Schwab Strategic Trust and Laudus Trust. The Fund Complex includes 106 funds.
The address for all trustees and officers is 211 Main Street, San Francisco, CA 94105. You can find more information about the trustees and officers in the fund’s Statement of Additional Information, which is available free by calling 1-877-824-5615.
|
Name, Year of Birth, and Position(s) with the trust (Terms of office, and length of Time Served1) | Principal Occupations During the Past Five Years | Number of Portfolios in Fund Complex Overseen by the Trustee | |
Michael J. Beer 1961 Trustee (Trustee of The Charles Schwab Family of Funds, Schwab Investments, Schwab Capital Trust, Schwab Annuity Portfolios, Schwab Strategic Trust and Laudus Trust since 2022) | Retired. Director, President and Chief Executive Officer (Dec. 2016 – Sept. 2019), Principal Funds (investment management). | | Director (2016 – 2019), Principal Funds, Inc. |
Robert W. Burns 1959 Trustee (Trustee of Schwab Strategic Trust since 2009; The Charles Schwab Family of Funds, Schwab Investments, Schwab Capital Trust, Schwab Annuity Portfolios and Laudus Trust since 2016) | Retired/Private Investor. | | |
Nancy F. Heller 1956 Trustee (Trustee of The Charles Schwab Family of Funds, Schwab Investments, Schwab Capital Trust, Schwab Annuity Portfolios, Schwab Strategic Trust and Laudus Trust since 2018) | | | |
David L. Mahoney 1954 Trustee (Trustee of The Charles Schwab Family of Funds, Schwab Investments, Schwab Capital Trust, Schwab Annuity Portfolios and Laudus Trust since 2011; Schwab Strategic Trust since 2016) | | | Director (2004 – present), Corcept Therapeutics Incorporated Director (2009 – 2021), Adamas Pharmaceuticals, Inc. Director (2003 – 2019), Symantec Corporation |
Jane P. Moncreiff 1961 Trustee (Trustee of The Charles Schwab Family of Funds, Schwab Investments, Schwab Capital Trust, Schwab Annuity Portfolios, Schwab Strategic Trust and Laudus Trust since 2019) | Consultant (2018 – present), Fulham Advisers LLC (management consulting); Chief Investment Officer (2009 – 2017), CareGroup Healthcare System, Inc. (healthcare). | | |
46
Schwab International Opportunities Fund | Annual Report
Schwab International Opportunities Fund
Independent Trustees (continued) |
Name, Year of Birth, and Position(s) with the trust (Terms of office, and length of Time Served1) | Principal Occupations During the Past Five Years | Number of Portfolios in Fund Complex Overseen by the Trustee | |
Kimberly S. Patmore 1956 Trustee (Trustee of The Charles Schwab Family of Funds, Schwab Investments, Schwab Capital Trust, Schwab Annuity Portfolios, Schwab Strategic Trust and Laudus Trust since 2016) | Consultant (2008 – present), Patmore Management Consulting (management consulting). | | |
J. Derek Penn 1957 Trustee (Trustee of The Charles Schwab Family of Funds, Schwab Investments, Schwab Capital Trust, Schwab Annuity Portfolios, Schwab Strategic Trust and Laudus Trust since 2021) | Head of Equity Sales and Trading (2006 – 2018), BNY Mellon (financial services). | | |
|
Name, Year of Birth, and Position(s) with the trust (Terms of office, and length of Time Served1) | Principal Occupations During the Past Five Years | Number of Portfolios in Fund Complex Overseen by the Trustee | |
Walter W. Bettinger II2 1960 Chairman and Trustee (Trustee of The Charles Schwab Family of Funds, Schwab Investments, Schwab Capital Trust and Schwab Annuity Portfolios since 2008; Schwab Strategic Trust since 2009; Laudus Trust since 2010) | Co-Chairman of the Board (July 2022 – present), Director and Chief Executive Officer (Oct. 2008 – present) and President (Feb. 2007 – Oct. 2021), The Charles Schwab Corporation; President and Chief Executive Officer (Oct. 2008 – Oct. 2021) and Director (May 2008 – Oct. 2021), Charles Schwab & Co., Inc.; Co-Chairman of the Board (July 2022 – present) and Director (Apr. 2006 – present), Charles Schwab Bank, SSB; Co-Chairman of the Board (July 2022 – present) and Director (Nov. 2017 – present), Charles Schwab Premier Bank, SSB; Co-Chairman of the Board (July 2022 – present) and Director (July 2019 – present), Charles Schwab Trust Bank; Director (May 2008 – present), Chief Executive Officer (Aug. 2017 – present) and President (Aug. 2017 – Nov. 2021), Schwab Holdings, Inc.; Manager (Sept. 2023 – present), TD Ameritrade Holding LLC; Director (Oct. 2020 – Aug. 2023), TD Ameritrade Holding Corporation; Director (July 2016 – Oct. 2021), Charles Schwab Investment Management, Inc. | | Director (2008 – present), The Charles Schwab Corporation |
Richard A. Wurster2 1973 Trustee (Trustee of The Charles Schwab Family of Funds, Schwab Investments, Schwab Capital Trust, Schwab Annuity Portfolios, Schwab Strategic Trust and Laudus Trust since 2022) | President (Oct. 2021 – present) and Executive Vice President – Schwab Asset Management Solutions (Apr. 2019 – Oct. 2021), The Charles Schwab Corporation; President, Director (Oct. 2021 – present), Executive Vice President – Schwab Asset Management Solutions (July 2019 – Oct. 2021) and Senior Vice President – Advisory (May 2016 – July 2019), Charles Schwab & Co., Inc.; President (Nov. 2021 – present), Schwab Holdings, Inc.; Director (Oct. 2021 – present) and Chief Executive Officer (Nov. 2019 – Jan. 2022), Charles Schwab Investment Management, Inc.; Director, Chief Executive Officer and President (Mar. 2018 – Oct. 2022), Charles Schwab Investment Advisory, Inc.; Chief Executive Officer (July 2016 – Apr. 2018) and President (Mar. 2017 – Apr. 2018), ThomasPartners, Inc.; Chief Executive Officer (July 2016 – Apr. 2018), Windhaven Investment Management, Inc. | | |
Schwab International Opportunities Fund | Annual Report47
Schwab International Opportunities Fund
|
Name, Year of Birth, and Position(s) with the trust (Terms of office, and length of Time Served3) | Principal Occupations During the Past Five Years |
Omar Aguilar 1970 Chief Executive Officer, President and Chief Investment Officer (Officer of The Charles Schwab Family of Funds, Schwab Investments, Schwab Capital Trust, Schwab Annuity Portfolios, Schwab Strategic Trust and Laudus Trust since 2011) | Chief Executive Officer (Jan. 2022 – present), President (Oct. 2023 – present), (Chief Investment Officer (Apr. 2011 – present) and Senior Vice President (Apr. 2011 – Jan. 2022), Charles Schwab Investment Management, Inc.; Director, Chief Executive Officer and President (Oct. 2022 – present), Charles Schwab Investment Advisory, Inc.; Chief Executive Officer (Sept. 2023 – present), President (Oct. 2023 – present), Chief Investment Officer (June 2011 – present) and Vice President (June 2011 – Sept. 2023), Schwab Funds, Laudus Trust and Schwab ETFs. |
Mark Fischer 1970 Chief Operating Officer (Officer of The Charles Schwab Family of Funds, Schwab Investments, Schwab Capital Trust, Schwab Annuity Portfolios, Schwab Strategic Trust and Laudus Trust since 2013) | Chief Operating Officer (Dec. 2020 – present) and Treasurer and Chief Financial Officer (Jan. 2016 – Dec. 2022), Schwab Funds, Laudus Trust and Schwab ETFs; Chief Financial Officer (Mar. 2020 – present), Chief Operating Officer (Oct. 2023 – present), Managing Director (Mar. 2023 – present) and Vice President (Oct. 2013 – Mar. 2023), Charles Schwab Investment Management, Inc. |
Dana Smith 1965 Treasurer and Chief Financial Officer (Officer of The Charles Schwab Family of Funds, Schwab Investments, Schwab Capital Trust, Schwab Annuity Portfolios, Schwab Strategic Trust and Laudus Trust since 2023) | Treasurer and Chief Financial Officer (Jan. 2023 – present) and Assistant Treasurer (Dec. 2015 – Dec. 2022), Schwab Funds, Laudus Trust and Schwab ETFs; Managing Director (Mar. 2023 – present), Vice President (Mar. 2022 – Mar. 2023) and Director (Oct. 2015 – Mar. 2022), Charles Schwab Investment Management, Inc.; Managing Director (May 2022 – present) and Vice President (Apr. 2022 – May 2022), Charles Schwab & Co., Inc. |
Patrick Cassidy 1964 Vice President and Chief Investment Officer (Officer of The Charles Schwab Family of Funds, Schwab Investments, Schwab Capital Trust, Schwab Annuity Portfolios, Schwab Strategic Trust and Laudus Trust since 2018) | Chief Investment Officer (Oct. 2023 – present) and Vice President (Feb. 2018 – present), Schwab Funds, Laudus Trust and Schwab ETFs; Managing Director (Mar. 2023 – present), Chief Investment Officer (Oct. 2023 – present), and Senior Vice President (Oct. 2012 – Mar. 2023), Charles Schwab Investment Management, Inc. |
William P. McMahon, Jr. 1972 Vice President and Chief Investment Officer (Officer of The Charles Schwab Family of Funds, Schwab Investments, Schwab Capital Trust, Schwab Annuity Portfolios, Schwab Strategic Trust and Laudus Trust since 2021) | Managing Director (Mar. 2023 – present), Senior Vice President (Jan. 2020 – Mar. 2023) and Chief Investment Officer (Jan. 2020 – present) Charles Schwab Investment Management, Inc.; Vice President and Chief Investment Officer (June 2021 – present), Schwab Funds, Laudus Trust and Schwab ETFs; Senior Vice President and Chief Investment Officer – ThomasPartners Strategies (Apr. 2018 – Dec. 2019), Charles Schwab Investment Advisory, Inc.; Senior Vice President and Chief Investment Officer (May 2001 – Apr. 2018), ThomasPartners, Inc. |
Catherine MacGregor 1964 Chief Legal Officer and Secretary, Schwab Funds and Schwab ETFs Chief Legal Officer, Vice President and Clerk, Laudus Trust (Officer of The Charles Schwab Family of Funds, Schwab Investments, Schwab Capital Trust, Schwab Annuity Portfolios and Laudus Trust since 2005; Schwab Strategic Trust since 2009) | Chief Legal Officer (Mar. 2022 – present), Managing Director (Mar. 2023 – present) and Vice President (Sept. 2005 – Mar. 2023), Charles Schwab Investment Management, Inc.; Managing Director (May 2022 – present) and Vice President (Aug. 2005 – May 2022), Charles Schwab & Co., Inc.; Vice President (Dec. 2005 – present) and Chief Legal Officer and Clerk (Mar. 2007 – present), Laudus Trust; Chief Legal Officer and Secretary (Oct. 2021 – present), Vice President (Nov. 2005 – Oct. 2021) and Assistant Secretary (June 2007 – Oct. 2021), Schwab Funds; Chief Legal Officer and Secretary (Oct. 2021 – present), Vice President and Assistant Secretary (Oct. 2009 – Oct. 2021), Schwab ETFs. |
1
Each Trustee shall hold office until the election and qualification of his or her successor, or until he or she dies, resigns or is removed. The retirement policy requires that each independent trustee retire by December 31 of the year in which the Trustee turns 74 or the Trustee’s twentieth year of service as an independent trustee on any trust in the Fund Complex, whichever occurs first.
2
Mr. Bettinger and Mr. Wurster are Interested Trustees. Mr. Bettinger and Mr. Wurster are Interested Trustees because each owns stock of The Charles Schwab Corporation (CSC), the parent company of Charles Schwab Investment Management, Inc., the investment adviser for the trusts in the Fund Complex, and is an employee of Charles Schwab & Co., Inc. (Schwab), the principal underwriter for The Charles Schwab Family of Funds, Schwab Investments, Schwab Capital Trust, Schwab Annuity Portfolios and Laudus Trust.
3
The President, Treasurer and Secretary/Clerk hold office until their respective successors are chosen and qualified or until he or she sooner dies, resigns, is removed or becomes disqualified. Each of the other officers serves at the pleasure of the Board.
48
Schwab International Opportunities Fund | Annual Report
Schwab International Opportunities Fund
asset allocation The practice of dividing a portfolio among different asset classes, with each asset class assigned a particular percentage.
asset class A group of securities with similar structure and basic characteristics. Stocks, bonds and cash are the three main examples of asset classes.
Bloomberg US Aggregate Bond Index An index that is a broad-based benchmark measuring the performance of the U.S. investment grade, taxable bond market, including U.S. Treasuries, government-related and corporate bonds, mortgage pass-through securities, commercial mortgage-backed securities, and asset-backed securities that are publicly available for sale in the United States. To be eligible for inclusion in the index, securities must be fixed rate, non-convertible, U.S. dollar-denominated with at least $300 million or more of outstanding face value and have one or more years remaining to maturity. The index excludes certain types of securities, including tax-exempt state and local government series bonds, structured notes embedded with swaps or other special features, private placements, floating rate securities, inflation-linked bonds and Eurobonds. The index is market capitalization weighted and the securities in the index are updated on the last business day of each month.
Bloomberg US Treasury Bills 1–3 Month Index An index that includes all publicly issued zero-coupon U.S. Treasury Bills that have a remaining maturity of less than 3 months but more than 1 month, are rated investment grade and have $300 million or more of outstanding face value. It excludes zero-coupon STRIPS.
bond A security representing a loan from the investor to the issuer. A bond typically pays interest at a fixed rate (the coupon rate) until a specified date (the maturity date), at which time the issuer returns the money borrowed (principal or face value) to the bondholder. Because of their structure, bonds are sometimes called “fixed-income securities” or “debt securities.”
An individual bond is subject to the credit risk of the issuer. Changes in interest rates can affect a bond’s market value prior to call or maturity. There is no guarantee that a bond’s yield to call or maturity will provide a positive return over the rate of inflation.
bond fund A bond fund is subject to the same credit, interest rate, and inflation risks as bonds. In addition, a bond fund incurs ongoing fees and expenses. A bond fund’s net asset value will fluctuate with the price of the underlying bonds and the portfolio turnover activity; return of principal is not guaranteed.
cap, capitalization See “market cap.”
capital gain, capital loss the difference between the amount paid for an investment and its value at a later time. If the investment has been sold, the capital gain or loss is considered a realized gain or loss. If the investment is still held, the capital gain or loss is considered unrealized appreciation or depreciation.
expense ratio The amount that is taken from a mutual fund’s assets each year to cover the fund’s operating expenses. An expense ratio of 0.50% means that a fund’s expenses amount to half of one percent of its average net assets a year.
market cap, market capitalization The value of a company as determined by the total value of all shares of its stock outstanding.
MSCI EAFE Index (Net) A free float-adjusted market capitalization index that is designed to measure the equity market performance of developed markets in Europe, Australasia, and the Far East. The Net version of the index reflects reinvested dividends net of withholding taxes, but reflects no deductions for expenses or other taxes; returns are calculated applying dividend withholding rates applicable to non-resident persons who do not benefit from double taxation treaties.
MSCI Emerging Markets Index (Net) A free float-adjusted market capitalization weighted index that is designed to measure equity market performance in the global emerging markets. This series approximates the minimum possible dividend reinvestment. The returns are calculated applying dividend withholding rates applicable to non-resident persons who do not benefit from double taxation treaties.
net asset value (NAV) The value of one share of a mutual fund. NAV is calculated by taking the fund’s total assets, subtracting liabilities, and dividing by the number of shares outstanding.
outstanding shares, shares outstanding When speaking of a company or mutual fund, indicates all shares currently held by investors.
price-to-book ratio (P/B) The market price of a company’s stock compared with its “book value.” A mutual fund’s P/B is the weighted average of the P/B of all stocks in the fund’s portfolio.
price-to-earnings ratio (P/E) The market price of a company’s stock compared with earnings over the past year. A mutual fund’s P/E is the weighted average of the P/E of all stocks in the fund’s portfolio.
restricted and illiquid securities Restricted securities are securities that are subject to legal restrictions on their sale. Restricted securities generally can be sold in privately negotiated transactions, pursuant to an exemption from registration under the Securities Act of 1933 (the 1933 Act), or in a registered public offering. Certain restricted securities, such as Section 4(a)(2) commercial paper and Rule 144A securities under the 1933 Act, may be considered to be liquid if they meet the criteria for liquidity established by the Board. Illiquid securities generally are any securities that cannot be disposed of promptly and in the ordinary course of business at approximately the amount at which a fund has valued the instruments. The liquidity of a fund’s investments is monitored under the supervision and direction of the Board. Investments currently not considered liquid include repurchase agreements not maturing within seven days and certain restricted securities.
return on equity (ROE) The average yearly rate of return for each dollar of investors’ money, measured over the past five years.
Russell 2000 Index An index that measures the performance of the 2,000 smallest companies in the Russell 3000 Index. The Russell 3000 Index measures the performance of the largest 3,000 U.S. companies representing approximately 98% of the investable U.S. equity market.
S&P 500 Index An index that is designed to measure the performance of 500 leading publicly traded companies from a broad range of industries.
stock A share of ownership, or equity, in the issuing company.
total return The percentage that an investor would have earned or lost on an investment in the fund assuming dividends and distributions were reinvested.
weighted average For mutual funds, an average that gives the same weight to each security as the security represents in the fund’s portfolio.
yield The income paid out by an investment, expressed as a percentage of the investment’s market value.
Schwab International Opportunities Fund | Annual Report49
Schwab International Opportunities Fund
Schwab Asset Management
With a straightforward lineup of core products and solutions for building the foundation of a portfolio, Schwab Asset Management advocates for investors of all sizes with a steadfast focus on lowering costs and reducing unnecessary complexity. The list below shows all currently available Schwab Funds®.
Investors should carefully consider information contained in the prospectus, or if available, the summary prospectus, including investment objectives, risks, charges and expenses before investing. Please call 1-877-824-5615 for a prospectus for any Schwab Fund. Please read the prospectus carefully before you invest. This report must be preceded or accompanied by a current prospectus.
Proxy Voting Policies, Procedures and Results
A description of the proxy voting policies and procedures used to determine how to vote proxies on behalf of the funds is available without charge, upon request, by visiting the Schwab Funds’ website at www.schwabassetmanagement.com/schwabfunds_prospectus, the SEC’s website at www.sec.gov, or by contacting Schwab Funds at 1-877-824-5615.
Information regarding how a fund voted proxies relating to portfolio securities during the most recent twelve-month period ended June 30 is available, without charge, by visiting the fund’s website at www.schwabassetmanagement.com/schwabfunds_prospectus or the SEC’s website at www.sec.gov.
Schwab Funds
Equity Funds
Schwab Core Equity Fund
Schwab Dividend Equity Fund
Schwab Large-Cap Growth Fund
Schwab Small-Cap Equity Fund
Schwab Health Care Fund
Schwab International Core Equity Fund
Schwab International Opportunities Fund
Schwab Select Large Cap Growth Fund
Schwab Fundamental US Large Company Index Fund
Schwab Fundamental US Small Company Index Fund
Schwab Fundamental International Large Company Index Fund
Schwab Fundamental International Small Company Index Fund
Schwab Fundamental Emerging Markets Large Company Index Fund
Schwab Fundamental Global Real Estate Index Fund
Schwab Global Real Estate Fund
Schwab S&P 500 Index Fund
Schwab 1000 Index® Fund
Schwab Small-Cap Index Fund®
Schwab Total Stock Market Index Fund®
Schwab U.S. Large-Cap Growth Index Fund
Schwab U.S. Large-Cap Value Index Fund
Schwab U.S. Mid-Cap Index Fund
Schwab International Index Fund®
Asset Allocation Funds
Schwab Balanced Fund
Schwab MarketTrack Portfolios®
Schwab Target Funds
Schwab Target Index Funds
Schwab Monthly Income Funds
Bond Funds
Schwab Treasury Inflation Protected Securities Index Fund
Schwab U.S. Aggregate Bond Index Fund
Schwab Short-Term Bond Index Fund
Schwab Tax-Free Bond Fund1
Schwab California Tax-Free Bond Fund1
Schwab Opportunistic Municipal Bond Fund
Schwab Money Funds2
Schwab provides a broad choice of taxable and tax-exempt money market funds for both retail and institutional client types. ���
Investment Adviser
Charles Schwab Investment Management, Inc., dba Schwab Asset Management
211 Main Street, San Francisco, CA 94105
Funds
Schwab Funds
1-877-824-5615
© 2023 Charles Schwab & Co., Inc. All rights reserved.
Member SIPC®
Printed on recycled paper.
¹
State, local, and the Federal Alternative Minimum Tax may apply. Capital gains are not exempt from Federal Taxation.
²
You could lose money by investing in the Schwab Money Funds. All Schwab Money Funds with the exception of Schwab Variable Share Price Money Fund seek to preserve the value of your investment at $1.00 per share, but cannot guarantee they will do so. Because the share price of Schwab Variable Share Price Money Fund will fluctuate, when you sell your shares they may be worth more or less than what you originally paid for them. All Schwab Money Funds with the exception of Schwab Government Money Fund, Schwab Retirement Government Money Fund, Schwab U.S. Treasury Money Fund, Schwab Treasury Obligations Money Fund and Schwab Government Money Market Portfolio may impose a fee upon the sale of your shares if the Fund’s Board determines that the fee is in the best interests of the Fund. An investment in the Schwab Money Funds is not insured or guaranteed by the Federal Deposit Insurance Corporation or any other government agency. The Schwab Money Funds’ sponsor has no legal obligation to provide financial support to the Funds, and you should not expect that the sponsor will provide financial support to the Funds at any time.
This page is intentionally left blank.
Annual Report | October 31, 2023
Schwab Active Equity Funds
Schwab Core Equity Fund
Schwab Dividend Equity Fund
Schwab Large-Cap Growth Fund
Schwab Small-Cap Equity Fund
Schwab Health Care Fund
Schwab International Core Equity Fund
This page is intentionally left blank.
Schwab Active Equity Funds
Fund investment adviser: Charles Schwab Investment Management, Inc., dba Schwab Asset Management®
Distributor: Charles Schwab & Co., Inc. (Schwab)
The Sector/Industry classifications in this report use the Global Industry Classification Standard (GICS) which was developed by and is the exclusive property of MSCI Inc. (MSCI) and Standard & Poor’s (S&P). GICS is a service mark of MSCI and S&P and has been licensed for use by Schwab. The Industry classifications used in the Portfolio Holdings are sub-categories of Sector classifications.
Schwab Active Equity Funds | Annual Report1
Schwab Active Equity Funds
The performance data quoted represents past performance. Past performance does not guarantee future results. Investment returns and principal value of an investment will fluctuate so that an investor’s shares may be worth more or less than their original cost. Current performance may be lower or higher than performance data quoted. To obtain performance information current to the most recent month end, please visit www.schwabassetmanagement.com/schwabfunds_prospectus.
Total Return for the 12 Months Ended October 31, 2023 |
Schwab Core Equity Fund (Ticker Symbol: SWANX) | |
| |
Fund Category: Morningstar Large Blend1 | |
| |
| |
Schwab Dividend Equity Fund2 (Ticker Symbol: SWDSX) | |
Russell 1000® Value Index | |
Fund Category: Morningstar Large Value1 | |
| |
| |
Schwab Large-Cap Growth Fund (Ticker Symbol: SWLSX) | |
Russell 1000® Growth Index | |
Fund Category: Morningstar Large Growth1 | |
| |
| |
Schwab Small-Cap Equity Fund (Ticker Symbol: SWSCX) | |
| |
Fund Category: Morningstar Small Blend1 | |
| |
| |
Schwab Health Care Fund2 (Ticker Symbol: SWHFX) | |
Dow Jones Global Health Care Index | |
Fund Category: Morningstar Health1 | |
| |
| |
Schwab International Core Equity Fund2 (Ticker Symbol: SICNX) | |
| |
Fund Category: Morningstar Foreign Large Blend1 | |
| |
All total returns on this page assume dividends and distributions were reinvested. Index figures do not include trading and management costs, which would lower performance. Indices are unmanaged and cannot be invested in directly. Performance results less than one year are not annualized.
For index definitions, please see the Glossary.
Fund expenses may have been partially absorbed by the investment adviser and its affiliates. Without these reductions, a fund’s total return would have been lower. Performance does not reflect the deduction of taxes that a shareholder would pay on fund distributions or on the redemption of fund shares.
1
Source for category information: Morningstar, Inc. The Morningstar Category return represents all active and index mutual funds and ETFs within the category as of the report date.
2
The fund’s performance relative to the index may be affected by fair-value pricing and timing differences in foreign exchange calculations. See financial note 2 for more information.
3
The net version of the index reflects reinvested dividends net of withholding taxes but reflects no deductions for expenses or other taxes.
2
Schwab Active Equity Funds | Annual Report
Schwab Active Equity Funds
The Investment Environment
For the 12-month reporting period ended October 31, 2023, U.S. equity markets were mixed, and international equity markets posted positive returns. U.S. stocks were volatile for the first half of the reporting period as inflation remained elevated, the U.S. Federal Reserve (Fed) continued to raise interest rates, and the failure of three U.S. regional banks in early March raised concerns about the stability of the banking sector. Despite these headwinds, as inflation began to ease, U.S. stocks staged a relatively steady upswing through August driven primarily by performance of the “Magnificent Seven” (Alphabet, Inc., Amazon.com, Inc., Apple, Inc., Meta Platforms, Inc., Microsoft Corp., NVIDIA Corp., and Tesla, Inc.). U.S. stocks, particularly dividend paying stocks, began to falter over the final two months of the reporting period as soaring U.S. Treasury yields offered investors attractive alternatives to stocks. Outside the U.S., the ongoing war between Russia and Ukraine and the Israel-Hamas war that broke out following Hamas’ attack on Israel in early October weighed on the global economy. The U.S. dollar, as measured against a basket of international currencies, generally weakened until mid-July, when it hit a reporting-period low, then began to rise but ended the reporting period weaker than where it began. For the reporting period, the S&P 500® Index, a bellwether for the overall U.S. stock market, returned 10.14%. U.S. large-cap stocks outperformed U.S. small-cap stocks, with the Russell 1000® Index and the Russell 2000® Index returning 9.48% and -8.56%, respectively. Among U.S. large-cap stocks, growth stocks outperformed value stocks, with the Russell 1000® Growth Index and the Russell 1000® Value Index returning 18.95% and 0.13%, respectively. Outside the U.S., the MSCI EAFE® Index (Net)*, a broad measure of developed international equity performance, returned 14.40% for the reporting period.
Economies around the world grew out of sync as they wrestled with record levels of government debt, rising geopolitical tensions, and weak productivity gains that stifled economic growth. The U.S. economy continued to show unexpected resiliency. Surprisingly robust job growth and strong consumer spending helped propel U.S. gross domestic product (GDP) to a 5.2% annualized growth rate for the third quarter of 2023, up from roughly 2% over the prior three quarters. Inflation remained above the Fed’s historical 2% target over the reporting period but declined between November 2022 and June 2023 as rents and wage growth eased, profit margins declined, and monetary policy remained restrictive before ticking up slightly in July 2023 through September 2023. The unemployment rate remained low throughout the period despite inflationary pressures but did rise slightly in August and October. An
Asset Class Performance Comparison % returns during the 12 months ended October 31, 2023
Index figures assume dividends and distributions were reinvested. Index figures do not include trading and management costs, which would lower performance. Indices are unmanaged and cannot be invested in directly. Performance results less than one year are not annualized. Past performance is not a guarantee of future results.
For index definitions, please see the Glossary.
Data source: Index provider websites and Schwab Asset Management.
Nothing in this report represents a recommendation of a security by the investment adviser.
Management views may have changed since the report date.
*
The net version of the index reflects reinvested dividends net of withholding taxes but reflects no deductions for expenses or other taxes.
Schwab Active Equity Funds | Annual Report3
Schwab Active Equity Funds
The Investment Environment (continued)
increase in the labor force participation rate (the proportion of working-age Americans who have a job or are looking for one) in August and strike activity in October were large contributors to the increase in unemployment in the last three months of the reporting period.
Oil prices were volatile, ranging from a high of $92 per barrel at the beginning of the reporting period to a low of $66 and ending the period at just over $80 per barrel. Eurozone GDP growth contracted slightly in the fourth quarter of 2022 driven by manufacturing pressures and headwinds related to oil and commodity prices, was flat for the first quarter of 2023, expanded slightly for the second quarter of 2023 bolstered by a moderation in inflationary pressures, and contracted slightly for the third quarter of 2023 as financing conditions remained tight. The United Kingdom posted small gains in GDP growth throughout the reporting period, with household consumption expenditures and manufacturing output among key growth drivers. In Japan, following flat GDP growth in the fourth quarter of 2022, GDP rose for the first two quarters of 2023, primarily on rising exports and falling imports. Among emerging markets, China’s GDP grew throughout the reporting period as the government’s various policies seeking to help the economy have offset the impact of a prolonged property crisis and weak trade. India’s GDP grew in the fourth quarter of 2022 and the first two quarters of 2023, driven primarily by robust performance of the services sector along with strong consumer demand and increased government spending.
In its efforts to lower inflation, the Fed raised interest rates six times during the reporting period, increasing the federal funds rate from a range of 3.00% to 3.25% to a range of 5.25% to 5.50%. At its meetings in June, September, and October, the Fed maintained the then current rates, citing robust economic activity, strong—though moderating—job gains, and low unemployment while acknowledging tighter financial and credit conditions for households and businesses. The Fed also maintained its program to reduce the assets held on its balance sheet, though its balance sheet temporarily spiked in March 2023 when the Fed supported banks after the failure of three U.S. regional banks. Despite the spike, balance sheet assets declined over the reporting period. Central banks outside the United States also battled with persistently high, albeit waning, inflation. After raising rates eight times during the reporting period, the European Central Bank held its rate steady at its October meeting as inflation and pricing pressures finally showed signs of easing. Similarly, the Bank of England maintained its key official bank rate at its September meeting, after seven rate hikes during the reporting period, leaving borrowing costs at a 15-year high. In contrast, the Bank of Japan continued to uphold its short-term interest rate target of -0.1%, unchanged since 2016, despite inflationary pressures but relaxed its yield control policy.
4
Schwab Active Equity Funds | Annual Report
Schwab Active Equity Funds
| Bill McMahon, CFA, Managing Director and Chief Investment Officer of Active Equity Strategies for Schwab Asset Management, is responsible for investment management, research, and portfolio construction for Schwab Asset Management’s active equity strategies and solutions. He is responsible for the day-to-day co-management of the Schwab Large-Cap Growth Fund, Schwab Core Equity Fund, and Schwab Dividend Equity Fund. Mr. McMahon has more than 20 years of experience in the financial services industry. Prior to his current role, Mr. McMahon was an SVP in Charles Schwab Investment Advisory, Inc. (CSIA), serving as CIO and as a member of the portfolio management team for the ThomasPartners Strategies. Mr. McMahon co-founded ThomasPartners, Inc. in 2001 and served as partner of the firm until its acquisition by the Charles Schwab Corporation in 2012 and subsequent merger with CSIA in 2018. Mr. McMahon began his career at State Street Corporation, with the latter half of his tenure with State Street Global Advisors. |
| Iain Clayton, CFA, FRM, Senior Portfolio Manager and Head of Quantitative Portfolio Management for Schwab Asset Management, is responsible for the day-to-day co-management of the Schwab Core Equity Fund, Schwab International Core Equity Fund, Schwab Small-Cap Equity Fund, and Schwab Health Care Fund. Mr. Clayton also leads Schwab Asset Management’s quantitative investment management team. Prior to joining Schwab in 2013, Mr. Clayton spent more than five years at SSI Investment Management where he was a portfolio manager and the director of quantitative research. In these roles, Mr. Clayton co-managed multiple investment strategies and developed quantitative models and valuation approaches. From 2004 to 2008, he worked as a portfolio manager and director at RCM Capital Management (now known as Allianz Global Investors) and helped manage various equity portfolios and developed fundamental-based stock selection models. Prior to that, he was a vice president at Eureka Investment Advisors for almost three years and also served as a senior quantitative analyst and assistant portfolio manager. He has also worked as a quantitative research analyst at RCM Capital Management. |
| Brian Hillburn, CFA, Senior Portfolio Manager and the Director of Fundamental Research for Schwab Asset Management, is responsible for the day-to-day co-management of the Schwab Core Equity Fund. Mr. Hillburn also provides fundamental equity research coverage for the ThomasPartners Strategies and the Schwab Active Equity Funds. Previously, Mr. Hillburn was a senior equity research analyst for the ThomasPartners Strategies at Schwab Asset Management. Prior to joining the ThomasPartners Strategies, Mr. Hillburn was an equity analyst at Rockland Trust, and earlier positions include equity research analysis roles on mutual fund teams at Wells Capital and Morgan Stanley Investment Management. |
| Wei Li, Ph.D., CFA, Senior Portfolio Manager for Schwab Asset Management, is responsible for the day-to-day co-management of the Schwab International Core Equity Fund, Schwab Dividend Equity Fund, Schwab Small-Cap Equity Fund, and Schwab Health Care Fund. Prior to joining Schwab in 2012, Ms. Li spent more than 10 years at Barclays Global Investors (now known as BlackRock) where she held a number of positions. From 2001 to 2009, she worked in various roles in the global advanced active group, including portfolio management and quantitative research for both U.S. and international equity markets. After 2009, she worked in the defined contribution research and product development area for almost two years. |
| Gretchen Novak, CFA, Senior Portfolio Manager for Schwab Asset Management, is responsible for the day-to-day co-management of the Schwab Large-Cap Growth Fund. Ms. Novak also provides fundamental equity research coverage of certain industry sectors for the ThomasPartners Strategies and the Schwab Active Equity Funds. Previously, Ms. Novak was a director and senior equity research analyst for the ThomasPartners Strategies at Schwab Asset Management. Prior to joining the ThomasPartners Strategies, Ms. Novak was a senior portfolio manager at Mazama Capital Management, Inc., where she oversaw the equity research and portfolio management of the firm’s consumer discretionary and staples sectors. Prior to Mazama Capital, Ms. Novak was an equity analyst at Cramer Rosenthal McGlynn, LLC. |
| Jim Serhant, CFA, Senior Portfolio Manager for Schwab Asset Management, is responsible for the day-to-day co-management of the Schwab Dividend Equity Fund and the ThomasPartners Balanced Strategies. Mr. Serhant also provides fundamental equity research coverage of certain industry sectors for the ThomasPartners Strategies and the Schwab Active Equity Funds. Prior to joining Schwab in 2016, Mr. Serhant was an executive vice president at Hartford Investment Management where he was the head of high yield and a senior portfolio manager, overseeing the credit research and portfolio management of the firm’s high yield strategies. Previously, he was a fixed income analyst at Delaware Investments and JP Morgan. |
Schwab Active Equity Funds | Annual Report5
Schwab Active Equity Funds
Fund Management (continued)
| Holly Emerson, CFA, Senior Portfolio Manager for Schwab Asset Management, is responsible for the day-to-day co-management of the Schwab Large-Cap Growth Fund and Schwab Small-Cap Equity Fund. Prior to joining Schwab in 2014, Ms. Emerson spent nearly 10 years at Algert Coldiron Investors LLC (now known as Algert Global), a quantitative market-neutral hedge fund manager. She held a number of positions at Algert, including assistant portfolio manager and director of operations. In her various roles, she acted as the lead portfolio manager for the Canadian fund, conducted macroeconomic research, and managed relationships with prime brokerage investment banks. |
6
Schwab Active Equity Funds | Annual Report
Schwab Core Equity Fund as of October 31, 2023
The Schwab Core Equity Fund (the fund) seeks long-term capital growth. To pursue its investment objective, the fund invests primarily in U.S. stocks. Under normal circumstances, the fund pursues its goal by investing at least 80% of its net assets (including, for this purpose, any borrowings for investment purposes) in equity securities of U.S. companies. The fund typically invests in common stocks of U.S. companies that have market capitalizations of approximately $500 million or more at the time of purchase. To aid its stock selection, the fund uses Schwab Equity Ratings® and employs a research-driven, “bottom-up” approach focusing primarily on individual securities. For more information concerning the fund’s investment objective, strategies, and risks, please see the fund’s prospectus.
Market Highlights. For the 12-month reporting period ended October 31, 2023, U.S. equity markets were mixed, and international equity markets posted positive returns. U.S. stocks were volatile for the first half of the reporting period as inflation remained elevated, the U.S. Federal Reserve (Fed) continued to raise interest rates, and the failure of three U.S. regional banks in early March raised concerns about the stability of the banking sector. Despite these headwinds, as inflation began to ease, U.S. stocks staged a relatively steady upswing through August driven primarily by performance of the “Magnificent Seven” (Alphabet, Inc., Amazon.com, Inc., Apple, Inc., Meta Platforms, Inc., Microsoft Corp., NVIDIA Corp., and Tesla, Inc.). U.S. stocks, particularly dividend paying stocks, began to falter over the final two months of the reporting period as soaring U.S. Treasury yields offered investors attractive alternatives to stocks. Outside the U.S., the ongoing war between Russia and Ukraine and the Israel-Hamas war that broke out following Hamas’ attack on Israel in early October weighed on the global economy. U.S. large-cap stocks outperformed U.S. small-cap stocks and among U.S. large-cap stocks, growth stocks outperformed value stocks.
Performance. The fund returned 9.99% for the 12-month reporting period ended October 31, 2023, underperforming the S&P 500® Index (the index), which the fund uses for performance comparisons. The index returned 10.14% for the reporting period.
Positioning and Strategies. The fund’s investment in PayPal Holdings, Inc., which offers online payment solutions, detracted the most from the total return of the fund. The fund’s holdings of PayPal represented an average weight of approximately 2% of the fund’s investments and returned approximately -38% for the reporting period. PayPal’s performance was impacted by slowing revenue growth and margin contraction.
The fund’s investment in Fidelity National Information Services, Inc., a payment services provider, also detracted from the total return of the fund. The fund’s holdings of Fidelity National represented an average weight of approximately 2% of the fund’s investments and returned approximately -39% for the reporting period. Fidelity National’s performance was impacted by weakness in its merchant solutions segment and its banking solution segment’s exposure to regional banks.
The fund’s investment in Microsoft Corp., which develops, manufactures, licenses, sells, and supports software products, contributed the most to the total return of the fund. The fund’s holdings of Microsoft represented an average weight of approximately 8% of the fund’s investments and returned approximately 47% for the reporting period. Microsoft benefitted from its positions in the fast-growing cloud and artificial intelligence (AI) fields which drove income and valuation over the period.
The fund’s investment in Meta Platforms, Inc., a social technology company, also contributed to the total return of the fund. The fund’s Class A holdings of Meta represented an average weight of approximately 2% of the fund’s investments and returned approximately 223% for the reporting period. Meta benefitted from its position in AI, improvement in its advertising revenue growth, and its financial discipline and cost control.
Management views and portfolio holdings may have changed since the report date.
Schwab Active Equity Funds | Annual Report7
Performance and Fund Facts as of October 31, 2023
The performance data quoted represents past performance. Past performance does not guarantee future results. Investment returns and principal value of an investment will fluctuate so that an investor’s shares may be worth more or less than their original cost. Current performance may be lower or higher than performance data quoted. To obtain performance information current to the most recent month end, please visit www.schwabassetmanagement.com/schwabfunds_prospectus.
Performance of Hypothetical $10,000 Investment (October 31, 2013 – October 31, 2023)1
Average Annual Total Returns1
| | | |
Fund: Schwab Core Equity Fund (7/1/96) | | | |
| | | |
Fund Category: Morningstar Large Blend2 | | | |
Fund Expense Ratio3: 0.73% |
All total returns on this page assume dividends and distributions were reinvested. Index figures do not include trading and management costs, which would lower performance. Indices are unmanaged and cannot be invested in directly. Performance results less than one year are not annualized.
For index definitions, please see the Glossary.
1
Fund expenses may have been partially absorbed by the investment adviser and its affiliates. Without these reductions, the fund’s returns would have been lower. These returns do not reflect the deduction of taxes that a shareholder would pay on fund distributions or the redemption of fund shares.
2
Source for category information: Morningstar, Inc. The Morningstar Category return represents all active and index mutual funds and ETFs within the category as of the report date.
3
As stated in the prospectus. Reflects the total annual fund operating expenses without contractual fee waivers. For actual expense ratios during the period, refer to the financial highlights section of the financial statements.
8
Schwab Active Equity Funds | Annual Report
Performance and Fund Facts as of October 31, 2023 (continued)
| |
Weighted Average Market Cap (millions) | |
Price/Earnings Ratio (P/E) | |
| |
| |
Sector Weightings % of Investments1
Top Equity Holdings % of Net Assets3
Portfolio holdings may have changed since the report date.
Source of Sector Classification: S&P and MSCI.
1
The percentage may differ from the Portfolio Holdings because the above calculation is based on a percentage of total investments, whereas the calculation in the Portfolio Holdings is based on a percentage of net assets.
2
Includes the fund’s position(s) in money market mutual funds registered under the Investment Company Act of 1940, as amended.
3
This list is not a recommendation of any security by the investment adviser.
Schwab Active Equity Funds | Annual Report9
Schwab Dividend Equity Fund as of October 31, 2023
The Schwab Dividend Equity Fund (the fund) seeks current income and capital appreciation. Under normal circumstances, the fund invests at least 80% of its net assets (including, for this purpose, any borrowings for investment purposes) in dividend paying common and preferred stocks. The fund uses Schwab Equity Ratings® to aid its U.S. stock selection and Schwab Equity Ratings International® to aid its international stock selection and employs a research-driven, “bottom-up” approach focusing primarily on individual securities. For more information concerning the fund’s investment objective, strategies, and risks, please see the fund’s prospectus.
Market Highlights. For the 12-month reporting period ended October 31, 2023, U.S. equity markets were mixed, and international equity markets posted positive returns. U.S. stocks were volatile for the first half of the reporting period as inflation remained elevated, the U.S. Federal Reserve (Fed) continued to raise interest rates, and the failure of three U.S. regional banks in early March raised concerns about the stability of the banking sector. Despite these headwinds, as inflation began to ease, U.S. stocks staged a relatively steady upswing through August driven primarily by performance of the “Magnificent Seven” (Alphabet, Inc., Amazon.com, Inc., Apple, Inc., Meta Platforms, Inc., Microsoft Corp., NVIDIA Corp., and Tesla, Inc.). U.S. stocks, particularly dividend paying stocks, began to falter over the final two months of the reporting period as soaring U.S. Treasury yields offered investors attractive alternatives to stocks. Outside the U.S., the ongoing war between Russia and Ukraine and the Israel-Hamas war that broke out following Hamas’ attack on Israel in early October weighed on the global economy. U.S. large-cap stocks outperformed U.S. small-cap stocks and among U.S. large-cap stocks, growth stocks outperformed value stocks. The U.S. dollar, as measured against a basket of international currencies, generally weakened until mid-July, when it hit a reporting-period low, then began to rise but ended the reporting period weaker than where it began. Performance of dividend paying stocks was mixed over the reporting period with a few very large market-capitalization stocks being the largest driver of market returns.
Performance. The fund returned -1.74% for the 12-month reporting period ended October 31, 2023, underperforming the Russell 1000® Value Index (the index), which the fund uses for performance comparisons. The index returned 0.13% for the reporting period.
As of October 31, 2023, the fund’s dividend yield was 2.39%, lower than the 2.70% dividend yield of the index. As of October 31, 2023, the fund’s 30-Day SEC yield was 2.35%.
Positioning and Strategies. The fund’s investment in Pfizer, Inc., a pharmaceutical company, detracted the most from the total return of the fund. The fund’s holdings of Pfizer represented an average weight of approximately 2% of the fund’s investments and returned approximately -32% for the reporting period. Despite high single-digit revenue growth in its base business, Pfizer’s performance was impacted by declining earnings due to erosion of revenue related to lower COVID-19 vaccine and therapeutics demand, stubbornly high costs incurred during the pandemic, and its agreement to buy Seagen, Inc., a biotechnology company and early-stage developer of monoclonal antibody-based drugs to treat cancer and related diseases.
The fund’s investment in Chevron Corp., which produces and transports crude oil and natural gas, as well as refines, markets, and distributes fuels, also detracted from the total return of the fund. The fund’s holdings of Chevron represented an average weight of approximately 3% of the fund’s investments and returned approximately -17% for the reporting period. Chevron’s performance was impacted by lower oil and natural gas prices that reduced earnings. Chevron also acquired PDC Energy, Inc. and announced a deal to acquire Hess Corp.
The fund’s investment in Broadcom, Inc., which provides semiconductors products, contributed the most to the total return of the fund. The fund’s holdings of Broadcom represented an average weight of approximately 3% of the fund’s investments and returned approximately 84% for the reporting period. Broadcom benefitted from strong earnings and the roll out of artificial intelligence (AI) across platforms that has created demand for Broadcom’s AI networking capabilities.
The fund’s investment in Microsoft Corp., which develops, manufactures, licenses, sells, and supports software products, also contributed to the total return of the fund. The fund’s holdings of Microsoft represented an average weight of approximately 3% of the fund’s investments and returned approximately 47% for the reporting period. Microsoft benefitted from its positions in the fast-growing cloud and artificial intelligence (AI) fields which drove income and valuation over the period.
Management views and portfolio holdings may have changed since the report date.
10
Schwab Active Equity Funds | Annual Report
Schwab Dividend Equity Fund
Performance and Fund Facts as of October 31, 2023
The performance data quoted represents past performance. Past performance does not guarantee future results. Investment returns and principal value of an investment will fluctuate so that an investor’s shares may be worth more or less than their original cost. Current performance may be lower or higher than performance data quoted. To obtain performance information current to the most recent month end, please visit www.schwabassetmanagement.com/schwabfunds_prospectus.
Performance of Hypothetical $10,000 Investment (October 31, 2013 – October 31, 2023)1,2
Average Annual Total Returns1,2
| | | |
Fund: Schwab Dividend Equity Fund (9/2/03) | | | |
Russell 1000® Value Index | | | |
Dividend Equity Spliced Index | | | |
| | | |
Fund Category: Morningstar Large Value3 | | | |
Fund Expense Ratios4: Net 0.89%; Gross 0.90% |
All total returns on this page assume dividends and distributions were reinvested. Index figures do not include trading and management costs, which would lower performance. Indices are unmanaged and cannot be invested in directly. Performance results less than one year are not annualized.
The first index listed for the fund is the fund’s primary benchmark, as shown in the prospectus. Additional indices shown are provided for comparative purposes.
For index definitions, please see the Glossary.
1
Fund expenses may have been partially absorbed by the investment adviser and its affiliates. Without these reductions, the fund’s returns would have been lower. These returns do not reflect the deduction of taxes that a shareholder would pay on fund distributions or the redemption of fund shares.
2
The fund’s performance relative to the index may be affected by fair-value pricing. See financial note 2 for more information.
3
Source for category information: Morningstar, Inc. The Morningstar Category return represents all active and index mutual funds and ETFs within the category as of the report date.
4
As stated in the prospectus. Net Expense: Expenses reduced by a contractual fee waiver in effect for so long as Schwab Asset Management serves as the investment adviser to the fund. Gross Expense: Does not reflect the effect of contractual fee waivers. For actual expense ratios during the period, refer to the financial highlights section of the financial statements.
Schwab Active Equity Funds | Annual Report11
Schwab Dividend Equity Fund
Performance and Fund Facts as of October 31, 2023 (continued)
| |
Weighted Average Market Cap (millions) | |
Price/Earnings Ratio (P/E) | |
| |
| |
Sector Weightings % of Investments1
Top Equity Holdings % of Net Assets2
Portfolio holdings may have changed since the report date.
Source of Sector Classification: S&P and MSCI.
1
The percentage may differ from the Portfolio Holdings because the above calculation is based on a percentage of total investments, whereas the calculation in the Portfolio Holdings is based on a percentage of net assets.
2
This list is not a recommendation of any security by the investment adviser.
12
Schwab Active Equity Funds | Annual Report
Schwab Large-Cap Growth Fund as of October 31, 2023
The Schwab Large-Cap Growth Fund (the fund) seeks long-term capital growth. To pursue its investment objective, the fund invests primarily in U.S. common stocks. Under normal circumstances, the fund invests at least 80% of its net assets (including, for this purpose, any borrowings for investment purposes) in large-cap stocks of U.S. companies. To aid its stock selection, the fund uses Schwab Equity Ratings® and employs a research-driven, “bottom-up” approach focusing primarily on individual securities. For more information concerning the fund’s investment objective, strategies, and risks, please see the fund’s prospectus.
Market Highlights. For the 12-month reporting period ended October 31, 2023, U.S. equity markets were mixed, and international equity markets posted positive returns. U.S. stocks were volatile for the first half of the reporting period as inflation remained elevated, the U.S. Federal Reserve (Fed) continued to raise interest rates, and the failure of three U.S. regional banks in early March raised concerns about the stability of the banking sector. Despite these headwinds, as inflation began to ease, U.S. stocks staged a relatively steady upswing through August driven primarily by performance of the “Magnificent Seven” (Alphabet, Inc., Amazon.com, Inc., Apple, Inc., Meta Platforms, Inc., Microsoft Corp., NVIDIA Corp., and Tesla, Inc.). U.S. stocks, particularly dividend paying stocks, began to falter over the final two months of the reporting period as soaring U.S. Treasury yields offered investors attractive alternatives to stocks. Outside the U.S., the ongoing war between Russia and Ukraine and the Israel-Hamas war that broke out following Hamas’ attack on Israel in early October weighed on the global economy. U.S. large-cap stocks outperformed U.S. small-cap stocks and among U.S. large-cap stocks, growth stocks outperformed value stocks.
Performance. The fund returned 19.37% for the 12-month reporting period ended October 31, 2023, outperforming the Russell 1000® Growth Index (the index), which the fund uses for performance comparisons. The index returned 18.95% for the reporting period.
Positioning and Strategies. The fund’s investment in Microsoft Corp., which develops, manufactures, licenses, sells, and supports software products, contributed the most to the total return of the fund. The fund’s holdings of Microsoft represented an average weight of approximately 12% of the fund’s investments and returned approximately 47% for the reporting period. Microsoft benefitted from its positions in the fast-growing cloud and artificial intelligence (AI) fields which drove income and valuation over the period.
The fund’s investment in NVIDIA Corp., which designs, develops, and markets three-dimensional (3D) graphics processors and related software, also contributed to the total return of the fund. The fund’s holdings of NVIDIA represented an average weight of approximately 3% of the fund’s investments and returned approximately 202% for the reporting period. NVIDIA also benefitted from its position in the fast-growing AI field.
The fund’s investment in Moderna, Inc., a biotechnology company, detracted the most from the total return of the fund. The fund’s holdings of Moderna represented an average weight of less than 1% of the fund’s investments and returned approximately -56% for the reporting period. Moderna’s performance was impacted by declining earnings due to erosion of revenue related to lower COVID-19 vaccine demand and delays in trials and the launch of flu and RSV vaccines. The fund sold its position in Moderna in late October, prior to the end of the reporting period.
The fund’s investment in Tesla, Inc., a multinational automotive and clean energy company, also detracted from the total return of the fund. The fund’s holdings of Tesla represented an average weight of approximately 2% of the fund’s investments and returned approximately -12% for the reporting period. Tesla’s performance was impacted by disappointing unit sales and deteriorating profit margins relative to high expectations.
Management views and portfolio holdings may have changed since the report date.
Schwab Active Equity Funds | Annual Report13
Schwab Large-Cap Growth Fund
Performance and Fund Facts as of October 31, 2023
The performance data quoted represents past performance. Past performance does not guarantee future results. Investment returns and principal value of an investment will fluctuate so that an investor’s shares may be worth more or less than their original cost. Current performance may be lower or higher than performance data quoted. To obtain performance information current to the most recent month end, please visit www.schwabassetmanagement.com/schwabfunds_prospectus.
Performance of Hypothetical $10,000 Investment (October 31, 2013 – October 31, 2023)1
Average Annual Total Returns1
| | | |
Fund: Schwab Large-Cap Growth Fund (10/3/05) | | | |
Russell 1000® Growth Index | | | |
Fund Category: Morningstar Large Growth2 | | | |
Fund Expense Ratios3: Net 0.99%; Gross 1.02% |
All total returns on this page assume dividends and distributions were reinvested. Index figures do not include trading and management costs, which would lower performance. Indices are unmanaged and cannot be invested in directly. Performance results less than one year are not annualized.
For index definitions, please see the Glossary.
1
Fund expenses may have been partially absorbed by the investment adviser and its affiliates. Without these reductions, the fund’s returns would have been lower. These returns do not reflect the deduction of taxes that a shareholder would pay on fund distributions or the redemption of fund shares.
2
Source for category information: Morningstar, Inc. The Morningstar Category return represents all active and index mutual funds and ETFs within the category as of the report date.
3
As stated in the prospectus. Net Expense: Expenses reduced by a contractual fee waiver in effect for so long as Schwab Asset Management serves as the investment adviser to the fund. Gross Expense: Does not reflect the effect of contractual fee waivers. For actual expense ratios during the period, refer to the financial highlights section of the financial statements.
14
Schwab Active Equity Funds | Annual Report
Schwab Large-Cap Growth Fund
Performance and Fund Facts as of October 31, 2023 (continued)
| |
Weighted Average Market Cap (millions) | |
Price/Earnings Ratio (P/E) | |
| |
| |
Sector Weightings % of Investments2
Top Equity Holdings % of Net Assets3
Portfolio holdings may have changed since the report date.
Source of Sector Classification: S&P and MSCI.
2
The percentage may differ from the Portfolio Holdings because the above calculation is based on a percentage of total investments, excluding derivatives, whereas the calculation in the Portfolio Holdings is based on a percentage of net assets.
3
This list is not a recommendation of any security by the investment adviser.
Schwab Active Equity Funds | Annual Report15
Schwab Small-Cap Equity Fund as of October 31, 2023
The Schwab Small-Cap Equity Fund (the fund) seeks long-term capital growth. Under normal circumstances, the fund invests at least 80% of its net assets (including, for this purpose, any borrowings for investment purposes) in small-cap equity securities. To aid its stock selection, the fund uses Schwab Equity Ratings®. For more information concerning the fund’s investment objective, strategies, and risks, please see the fund’s prospectus.
Market Highlights. For the 12-month reporting period ended October 31, 2023, U.S. equity markets were mixed, and international equity markets posted positive returns. U.S. stocks were volatile for the first half of the reporting period as inflation remained elevated, the U.S. Federal Reserve (Fed) continued to raise interest rates, and the failure of three U.S. regional banks in early March raised concerns about the stability of the banking sector. Despite these headwinds, as inflation began to ease, U.S. stocks staged a relatively steady upswing through August driven primarily by performance of the “Magnificent Seven” (Alphabet, Inc., Amazon.com, Inc., Apple, Inc., Meta Platforms, Inc., Microsoft Corp., NVIDIA Corp., and Tesla, Inc.). U.S. stocks, particularly dividend paying stocks, began to falter over the final two months of the reporting period as soaring U.S. Treasury yields offered investors attractive alternatives to stocks. Outside the U.S., the ongoing war between Russia and Ukraine and the Israel-Hamas war that broke out following Hamas’ attack on Israel in early October weighed on the global economy. U.S. large-cap stocks outperformed U.S. small-cap stocks and among U.S. large-cap stocks, growth stocks outperformed value stocks.
Performance. The fund returned -3.68% for the 12-month reporting period ended October 31, 2023, outperforming the Russell 2000® Index (the index), which the fund uses for performance comparisons. The index returned -8.56% for the reporting period.
Positioning and Strategies. The fund’s investment in Super Micro Computer, Inc., which offers wholesale distribution of computers, computer equipment, and computer software, contributed the most to the total return of the fund. The fund’s holdings of Super Micro Computer represented an average weight of less than 1% of the fund’s investments and returned approximately 244% for the reporting period. Super Micro Computer benefitted from record levels of engagement in their new generation artificial intelligence (AI) applications.
The fund’s investment in Sterling Infrastructure, Inc., a civil construction company, also contributed to the total return of the fund. The fund’s holdings of Sterling Infrastructure represented an average weight of less than 1% of the fund’s investments and returned approximately 170% for the reporting period. Sterling Infrastructure benefitted from government infrastructure spending, AI data centers, and reshoring.
The fund’s investment in Associated Banc-Corp., which provides a full range of commercial banking services for retail customers, detracted the most from the total return of the fund. The fund’s holdings of Associated Banc-Corp. represented an average weight of approximately 1% of the fund’s investments and returned approximately -30% for the reporting period. Associated Banc-Corp.’s performance was impacted by the failure of three U.S. regional banks in early March which raised concerns about the stability of the banking sector.
The fund’s investment in CommScope Holdings Co., Inc., which through its subsidiaries provides end-to-end solutions connecting technology and wireless and wired networks, also detracted from the total return of the fund. The fund’s holdings of CommScope Holdings represented an average weight of less than 1% of the fund’s investments and returned approximately -89% for the reporting period. CommScope Holdings’ performance fell as customer spending on network infrastructure was delayed as a result of macroeconomic concerns and the timing of government subsidies.
Management views and portfolio holdings may have changed since the report date.
16
Schwab Active Equity Funds | Annual Report
Schwab Small-Cap Equity Fund
Performance and Fund Facts as of October 31, 2023
The performance data quoted represents past performance. Past performance does not guarantee future results. Investment returns and principal value of an investment will fluctuate so that an investor’s shares may be worth more or less than their original cost. Current performance may be lower or higher than performance data quoted. To obtain performance information current to the most recent month end, please visit www.schwabassetmanagement.com/schwabfunds_prospectus.
Performance of Hypothetical $10,000 Investment (October 31, 2013 – October 31, 2023)1
Average Annual Total Returns1
| | | |
Fund: Schwab Small-Cap Equity Fund (7/1/03) | | | |
| | | |
Fund Category: Morningstar Small Blend2 | | | |
Fund Expense Ratio3: 1.09% |
All total returns on this page assume dividends and distributions were reinvested. Index figures do not include trading and management costs, which would lower performance. Indices are unmanaged and cannot be invested in directly. Performance results less than one year are not annualized.
For index definitions, please see the Glossary.
1
Fund expenses may have been partially absorbed by the investment adviser and its affiliates. Without these reductions, the fund’s returns would have been lower. These returns do not reflect the deduction of taxes that a shareholder would pay on fund distributions or the redemption of fund shares.
2
Source for category information: Morningstar, Inc. The Morningstar Category return represents all active and index mutual funds and ETFs within the category as of the report date.
3
As stated in the prospectus. Reflects the total annual fund operating expenses without contractual fee waivers. For actual expense ratios during the period, refer to the financial highlights section of the financial statements.
Schwab Active Equity Funds | Annual Report17
Schwab Small-Cap Equity Fund
Performance and Fund Facts as of October 31, 2023 (continued)
| |
Weighted Average Market Cap (millions) | |
Price/Earnings Ratio (P/E) | |
| |
| |
Sector Weightings % of Investments2
Top Equity Holdings % of Net Assets4
Portfolio holdings may have changed since the report date.
Source of Sector Classification: S&P and MSCI.
Small-company stocks are subject to greater volatility than many other asset classes.
2
The percentage may differ from the Portfolio Holdings because the above calculation is based on a percentage of total investments, excluding derivatives, whereas the calculation in the Portfolio Holdings is based on a percentage of net assets.
3
Includes the fund’s position(s) in money market mutual funds registered under the Investment Company Act of 1940, as amended.
4
This list is not a recommendation of any security by the investment adviser.
18
Schwab Active Equity Funds | Annual Report
Schwab Health Care Fund as of October 31, 2023
The Schwab Health Care Fund (the fund) seeks long-term capital growth. To pursue its goal, the fund primarily invests in equity securities issued by companies in the health care sector. The fund uses Schwab Equity Ratings® to aid its U.S. stock selection and Schwab Equity Ratings International® to aid its international stock selection. For more information concerning the fund’s investment objective, strategies, and risks, please see the fund’s prospectus.
Market Highlights. For the 12-month reporting period ended October 31, 2023, U.S. equity markets were mixed, and international equity markets posted positive returns. U.S. stocks were volatile for the first half of the reporting period as inflation remained elevated, the U.S. Federal Reserve (Fed) continued to raise interest rates, and the failure of three U.S. regional banks in early March raised concerns about the stability of the banking sector. Despite these headwinds, as inflation began to ease, U.S. stocks staged a relatively steady upswing through August driven primarily by performance of the “Magnificent Seven” (Alphabet, Inc., Amazon.com, Inc., Apple, Inc., Meta Platforms, Inc., Microsoft Corp., NVIDIA Corp., and Tesla, Inc.). U.S. stocks, particularly dividend paying stocks, began to falter over the final two months of the reporting period as soaring U.S. Treasury yields offered investors attractive alternatives to stocks. Outside the U.S., the ongoing war between Russia and Ukraine and the Israel-Hamas war that broke out following Hamas’ attack on Israel in early October weighed on the global economy. U.S. large-cap stocks outperformed U.S. small-cap stocks and among U.S. large-cap stocks, growth stocks outperformed value stocks. The U.S. dollar, as measured against a basket of international currencies, generally weakened until mid-July, when it hit a reporting-period low, then began to rise but ended the reporting period weaker than where it began.
Performance. The fund returned -4.04% for the 12-month reporting period ended October 31, 2023, underperforming the Dow Jones Global Health Care Index (the index), which the fund uses for performance comparisons. The index returned -2.01% for the reporting period.
Positioning and Strategies. The fund’s investment in Bristol-Myers Squibb Co., a global biopharmaceutical company, detracted the most from the total return of the fund. The fund’s holdings of Bristol-Myers Squibb represented an average weight of approximately 3% of the fund’s investments and returned approximately -31% for the reporting period. Bristol-Myers Squibb performance has declined as investors see a softer landing for the economy.
The fund’s investment in Pfizer, Inc., a pharmaceutical company, also detracted from the total return of the fund. The fund’s holdings of Pfizer represented an average weight of approximately 2% of the fund’s investments and returned approximately -32% for the reporting period. Despite high revenue growth in its base business, Pfizer’s performance was impacted by declining earnings due to erosion of revenue related to lower COVID-19 vaccine and therapeutics demand, stubbornly high costs incurred during the pandemic, and its agreement to buy Seagen, Inc., a biotechnology company and early-stage developer of monoclonal antibody-based drugs to treat cancer and related diseases.
The fund’s investment in Eli Lilly & Co., which manufactures and distributes pharmaceuticals, contributed the most to the total return of the fund. The fund’s holdings of Eli Lilly represented an average weight of approximately 4% of the fund’s investments and returned approximately 55% for the reporting period. Eli Lilly benefited from demand for its Type 2 diabetes and weight loss drugs.
The fund’s investment in Novo Nordisk AS, which develops, produces, and markets pharmaceutical products, also contributed to the total return of the fund. The fund’s Class B holdings of Novo Nordisk represented an average weight of approximately 4% of the fund’s investments and returned approximately 79% in U.S. dollar terms for the reporting period. Novo Nordisk also benefited from demand for its Type 2 diabetes and weight loss drugs.
Management views and portfolio holdings may have changed since the report date.
Schwab Active Equity Funds | Annual Report19
Performance and Fund Facts as of October 31, 2023
The performance data quoted represents past performance. Past performance does not guarantee future results. Investment returns and principal value of an investment will fluctuate so that an investor’s shares may be worth more or less than their original cost. Current performance may be lower or higher than performance data quoted. To obtain performance information current to the most recent month end, please visit www.schwabassetmanagement.com/schwabfunds_prospectus.
Performance of Hypothetical $10,000 Investment (October 31, 2013 – October 31, 2023)1,2
Average Annual Total Returns1,2
| | | |
Fund: Schwab Health Care Fund (7/3/00) | | | |
Dow Jones Global Health Care Index | | | |
| | | |
Fund Category: Morningstar Health3 | | | |
Fund Expense Ratio4: 0.80% |
All total returns on this page assume dividends and distributions were reinvested. Index figures do not include trading and management costs, which would lower performance. Indices are unmanaged and cannot be invested in directly. Performance results less than one year are not annualized.
The first index listed for the fund is the fund’s primary benchmark, as shown in the prospectus. Additional indices shown are provided for comparative purposes.
For index definitions, please see the Glossary.
Since the Schwab Health Care Fund focuses its investments on companies involved in a specific sector, this fund may involve a greater degree of risk than an investment in mutual funds that do not concentrate their investments.
1
Fund expenses may have been partially absorbed by the investment adviser and its affiliates. Without these reductions, the fund’s returns would have been lower. These returns do not reflect the deduction of taxes that a shareholder would pay on fund distributions or the redemption of fund shares.
2
The fund’s performance relative to the index may be affected by fair-value pricing. See financial note 2 for more information.
3
Source for category information: Morningstar, Inc. The Morningstar Category return represents all active and index mutual funds and ETFs within the category as of the report date.
4
As stated in the prospectus. Reflects the total annual fund operating expenses without contractual fee waivers. For actual expense ratios during the period, refer to the financial highlights section of the financial statements.
20
Schwab Active Equity Funds | Annual Report
Performance and Fund Facts as of October 31, 2023 (continued)
| |
Weighted Average Market Cap (millions) | |
Price/Earnings Ratio (P/E) | |
| |
| |
Industry Weightings % of Investments
Top Equity Holdings % of Net Assets1
Top Country Weightings % of Investments2
Portfolio holdings may have changed since the report date.
Source of Industry Classification: S&P and MSCI.
1
This list is not a recommendation of any security by the investment adviser.
2
The percentage may differ from the Portfolio Holdings because the above calculation is based on a percentage of total investments, whereas the calculation in the Portfolio Holdings is based on a percentage of net assets.
Schwab Active Equity Funds | Annual Report21
Schwab International Core Equity Fund as of October 31, 2023
The Schwab International Core Equity Fund (the fund) seeks long-term capital growth. To pursue its investment objective, the fund invests primarily in the stocks of publicly traded companies located in developed market countries excluding the United States, however, the fund may also invest in stocks issued by companies located in emerging markets. To aid its stock selection, the fund uses Schwab Equity Ratings International®. For more information concerning the fund’s investment objective, strategies, and risks, please see the fund’s prospectus.
Market Highlights. For the 12-month reporting period ended October 31, 2023, U.S. equity markets were mixed, and international equity markets posted positive returns. U.S. stocks were volatile for the first half of the reporting period as inflation remained elevated, the U.S. Federal Reserve (Fed) continued to raise interest rates, and the failure of three U.S. regional banks in early March raised concerns about the stability of the banking sector. Despite these headwinds, as inflation began to ease, U.S. stocks staged a relatively steady upswing through August driven primarily by performance of the “Magnificent Seven” (Alphabet, Inc., Amazon.com, Inc., Apple, Inc., Meta Platforms, Inc., Microsoft Corp., NVIDIA Corp., and Tesla, Inc.). U.S. stocks, particularly dividend paying stocks, began to falter over the final two months of the reporting period as soaring U.S. Treasury yields offered investors attractive alternatives to stocks. Outside the U.S., the ongoing war between Russia and Ukraine and the Israel-Hamas war that broke out following Hamas’ attack on Israel in early October weighed on the global economy. U.S. large-cap stocks outperformed U.S. small-cap stocks and among U.S. large-cap stocks, growth stocks outperformed value stocks. The U.S. dollar, as measured against a basket of international currencies, generally weakened until mid-July, when it hit a reporting-period low, then began to rise but ended the reporting period weaker than where it began.
Performance. The fund returned 16.74% for the 12-month reporting period ended October 31, 2023, outperforming the MSCI EAFE® Index (Net) (the index), which the fund uses for performance comparisons. The index returned 14.40%1 for the reporting period.
Positioning and Strategies. The fund’s investment in Novo Nordisk AS, which develops, produces, and markets pharmaceuticals, contributed the most to the total return of the fund. The fund’s Class B holdings of Novo Nordisk represented an average weight of approximately 4% of the fund’s investments and returned approximately 79% in U.S. dollar terms for the reporting period. Novo Nordisk also benefited from demand for its Type 2 diabetes and weight loss drugs.
The fund’s investment in HSBC Holdings PLC, which provides a variety of international banking and financial services, also contributed to the total return of the fund. The fund’s holdings of HSBC Holdings represented an average weight of approximately 2% of the fund’s investments and returned approximately 48% in U.S. dollar terms for the reporting period. HSBC Holdings benefited from strong first quarter of 2023 results that exceeded estimates as well as a share buyback.
The fund’s investment in Roche Holding AG, which through its subsidiaries develops and manufactures pharmaceutical and diagnostic products, detracted the most from the total return of the fund. The fund’s holdings of Roche Holding represented an average weight of approximately 2% of the fund’s investments and returned approximately -20% in U.S. dollar terms for the reporting period. Despite demand for its new medicines growing, Roche Holding’s performance was impacted by declining revenue related to lower COVID-19 vaccine and therapeutics demand.
The fund’s investment in Doosan Bobcat, Inc., which manufactures construction equipment, also detracted from the total return of the fund. The fund purchased its position in Doosan Bobcat in June 2023. The fund’s holdings of Doosan Bobcat represented an average weight of less than 1% of the fund’s investments and returned approximately -30% in U.S. dollar terms while held by the fund. Doosan Bobcat benefitted before July 2023 from a jump in net income as North American prices rose but declined after that due to concerns about slowdown in earnings.
Management views and portfolio holdings may have changed since the report date.
1
The net version of the index reflects reinvested dividends net of withholding taxes but reflects no deductions for expenses or other taxes.
22
Schwab Active Equity Funds | Annual Report
Schwab International Core Equity Fund
Performance and Fund Facts as of October 31, 2023
The performance data quoted represents past performance. Past performance does not guarantee future results. Investment returns and principal value of an investment will fluctuate so that an investor’s shares may be worth more or less than their original cost. Current performance may be lower or higher than performance data quoted. To obtain performance information current to the most recent month end, please visit www.schwabassetmanagement.com/schwabfunds_prospectus.
Performance of Hypothetical $10,000 Investment (October 31, 2013 – October 31, 2023)1,2
Average Annual Total Returns1,2
| | | |
Fund: Schwab International Core Equity Fund (5/30/08) | | | |
| | | |
Fund Category: Morningstar Foreign Large Blend4 | | | |
Fund Expense Ratios5: Net 0.86%; Gross 0.89% |
All total returns on this page assume dividends and distributions were reinvested. Index figures do not include trading and management costs, which would lower performance. Indices are unmanaged and cannot be invested in directly. Performance results less than one year are not annualized.
For index definitions, please see the Glossary.
1
Fund expenses may have been partially absorbed by the investment adviser and its affiliates. Without these reductions, the fund’s returns would have been lower. These returns do not reflect the deduction of taxes that a shareholder would pay on fund distributions or the redemption of fund shares.
2
The fund’s performance relative to the index may be affected by fair-value pricing. See financial note 2 for more information.
3
The net version of the index reflects reinvested dividends net of withholding taxes but reflects no deductions for expenses or other taxes.
4
Source for category information: Morningstar, Inc. The Morningstar Category return represents all active and index mutual funds and ETFs within the category as of the report date.
5
As stated in the prospectus. Net Expense: Expenses reduced by a contractual fee waiver in effect for so long as Schwab Asset Management serves as the investment adviser to the fund. Gross Expense: Does not reflect the effect of contractual fee waivers. For actual expense ratios during the period, refer to the financial highlights section of the financial statements.
Schwab Active Equity Funds | Annual Report23
Schwab International Core Equity Fund
Performance and Fund Facts as of October 31, 2023 (continued)
| |
Weighted Average Market Cap (millions) | |
Price/Earnings Ratio (P/E) | |
| |
| |
Sector Weightings % of Investments
Top Equity Holdings % of Net Assets2
Top Country Weightings % of Investments3
Portfolio holdings may have changed since the report date.
Source of Sector Classification: S&P and MSCI.
International investments are subject to additional risks such as currency fluctuation, geopolitical risk and the potential for illiquid markets.
1
Includes the fund’s position(s) in money market mutual funds registered under the Investment Company Act of 1940, as amended.
2
This list is not a recommendation of any security by the investment adviser.
3
The percentage may differ from the Portfolio Holdings because the above calculation is based on a percentage of total investments, whereas the calculation in the Portfolio Holdings is based on a percentage of net assets.
24
Schwab Active Equity Funds | Annual Report
Schwab Active Equity Funds
Fund Expenses (Unaudited)
Examples for a $1,000 Investment
As a fund shareholder, you may incur two types of costs: (1) transaction costs; and (2) ongoing costs, including management fees, transfer agent and shareholder services fees, and other fund expenses.
The expense examples below are intended to help you understand your ongoing cost (in dollars) of investing in a fund and to compare this cost with the ongoing cost of investing in other mutual funds. These examples are based on an investment of $1,000 invested for six months beginning May 1, 2023 and held through October 31, 2023.
Actual Return lines in the table below provide information about actual account values and actual expenses. You may use this information, together with the amount you invested, to estimate the expenses that you paid over the period. To do so, simply divide your account value by $1,000 (for example, an $8,600 account value ÷ $1,000 = 8.6), then multiply the result by the number given for your fund under the heading entitled “Expenses Paid During Period.”
Hypothetical Return lines in the table below provide information about hypothetical account values and hypothetical expenses based on a fund’s actual expense ratio and an assumed return of 5% per year before expenses. Because the return used is not an actual return, it may not be used to estimate the actual ending account value or expenses you paid for the period.
You may use this information to compare the ongoing costs of investing in a fund and other funds. To do so, compare this 5% hypothetical example with the 5% hypothetical examples that appear in the shareholder reports of the other funds.
Please note that the expenses shown in the table are meant to highlight your ongoing costs only and do not reflect any transactional costs. Therefore, the hypothetical return lines of the table are useful in comparing ongoing costs only and will not help you determine the relative total costs of owning different funds. In addition, if these transactional costs were included, your costs would have been higher.
| | BEGINNING
ACCOUNT VALUE
AT 5/1/23 | ENDING
ACCOUNT VALUE
(NET OF EXPENSES)
AT 10/31/23 | EXPENSES PAID
DURING PERIOD
|
| | | | |
| | | | |
| | | | |
Schwab Dividend Equity Fund | | | | |
| | | | |
| | | | |
Schwab Large-Cap Growth Fund | | | | |
| | | | |
| | | | |
Schwab Small-Cap Equity Fund | | | | |
| | | | |
| | | | |
| | | | |
| | | | |
| | | | |
Schwab International Core Equity Fund | | | | |
| | | | |
| | | | |
| Based on the most recent six-month expense ratio; may differ from the expense ratio provided in the Financial Highlights. |
| Expenses for each fund are equal to its annualized expense ratio, multiplied by the average account value over the period, multiplied by the 184 days in the period, and divided by the 365 days in the fiscal year. |
Schwab Active Equity Funds | Annual Report25
Financial Statements
| | | | | | |
|
Net asset value at beginning of period | | | | | | |
Income (loss) from investment operations: | | | | | | |
Net investment income (loss)1 | | | | | | |
Net realized and unrealized gains (losses) | | | | | | |
Total from investment operations | | | | | | |
| | | | | | |
Distributions from net investment income | | | | | | |
Distributions from net realized gains | | | | | | |
| | | | | | |
Net asset value at end of period | | | | | | |
| | | | | | |
|
Ratios to average net assets: | | | | | | |
| | | | | | |
| | | | | | |
Net investment income (loss) | | | | | | |
| | | | | | |
Net assets, end of period (x 1,000,000) | | | | | | |
| Calculated based on the average shares outstanding during the period. |
| Ratio includes less than 0.005% of non-routine proxy expenses. |
26
Schwab Active Equity Funds | Annual Report
Portfolio Holdings as of October 31, 2023
This section shows all the securities in the fund’s portfolio and their values as of the report date.
The fund files its complete schedule of portfolio holdings with the U.S. Securities and Exchange Commission (SEC) for the first and third quarters of each fiscal year on Form N-PORT Part F. The fund’s Form N-PORT Part F is available on the SEC’s website at www.sec.gov. You can also obtain this information at no cost on the fund’s website at www.schwabassetmanagement.com/schwabfunds_prospectus, by calling 1-866-414-6349, or by sending an email request to orders@mysummaryprospectus.com. The fund also makes available its complete schedule of portfolio holdings 15 to 20 days after the end of the month on the fund’s website.
| | |
COMMON STOCKS 99.7% OF NET ASSETS |
|
|
| | |
|
|
| | |
| | |
| | |
| | |
| | |
| | |
| | |
|
Commercial & Professional Services 2.2% |
Republic Services, Inc., Class A | | |
| | |
| | |
|
Consumer Discretionary Distribution & Retail 7.2% |
| | |
| | |
| | |
| | |
|
|
| | |
| | |
| | |
|
Consumer Staples Distribution & Retail 2.6% |
| | |
| | |
| | |
|
|
| | |
| | |
| | |
|
Equity Real Estate Investment Trusts (REITs) 0.9% |
| | |
|
|
Berkshire Hathaway, Inc., Class B * | | |
| | |
Fidelity National Information Services, Inc. | | |
| | |
| | |
| | |
| | |
|
Food, Beverage & Tobacco 4.9% |
| | |
Constellation Brands, Inc., Class A | | |
| | |
| | |
|
Health Care Equipment & Services 7.8% |
| | |
Boston Scientific Corp. * | | |
| | |
Intuitive Surgical, Inc. * | | |
| | |
| | |
|
Household & Personal Products 2.8% |
Estee Lauder Cos., Inc., Class A | | |
| | |
L'Oreal SA, Sponsored ADR | | |
| | |
|
|
| | |
|
Media & Entertainment 9.6% |
Alphabet, Inc., Class A * | | |
Meta Platforms, Inc., Class A * | | |
| | |
|
Pharmaceuticals, Biotechnology & Life Sciences 9.2% |
| | |
| | |
| | |
Roche Holding AG, Sponsored ADR | | |
Thermo Fisher Scientific, Inc. | | |
| | |
| | |
|
Semiconductors & Semiconductor Equipment 4.9% |
ASML Holding NV NY Registry Shares | | |
| | |
| | |
|
Software & Services 12.2% |
| | |
| | |
| | |
Schwab Active Equity Funds | Annual Report27
Portfolio Holdings as of October 31, 2023 (continued)
| | |
| | |
| | |
|
Technology Hardware & Equipment 8.0% |
| | |
|
|
| | |
Total Common Stocks
(Cost $850,015,084) | |
| | |
SHORT-TERM INVESTMENTS 0.3% OF NET ASSETS |
|
|
State Street Institutional U.S. Government Money Market Fund, Premier Class 5.30% (a) | | |
Total Short-Term Investments
(Cost $3,670,593) | |
Total Investments in Securities
(Cost $853,685,677) | |
| Non-income producing security. |
| The rate shown is the annualized 7-day yield. |
| American Depositary Receipt |
The following is a summary of the inputs used to value the fund’s investments as of October 31, 2023 (see financial note 2(a) for additional information):
| QUOTED PRICES IN
ACTIVE MARKETS FOR
IDENTICAL ASSETS
(LEVEL 1) | OTHER SIGNIFICANT
OBSERVABLE INPUTS
(LEVEL 2) | SIGNIFICANT
UNOBSERVABLE INPUTS
(LEVEL 3) | |
| | | | |
| | | | |
| | | | |
| | | | |
| As categorized in the Portfolio Holdings. |
28
Schwab Active Equity Funds | Annual Report
Statement of Assets and Liabilities
As of October 31, 2023
|
Investments in securities, at value - unaffiliated (cost $853,685,677) | | |
| | |
| | |
| | |
| | |
Income from securities on loan | | |
| | |
| | |
|
|
| | |
Investment adviser and administrator fees | | |
| | |
| | |
| | |
| | |
| | |
|
|
Capital received from investors | | |
Total distributable earnings | | |
| | |
Schwab Active Equity Funds | Annual Report29
Statement of Operations
For the period November 1, 2022 through October 31, 2023 |
|
Dividends received from securities - unaffiliated (net of foreign withholding tax of $132,691) | | |
| | |
| | |
|
|
Investment adviser and administrator fees | | |
| | |
| | |
Portfolio accounting fees | | |
| | |
| | |
| | |
Independent trustees’ fees | | |
| | |
| | |
| | |
| | |
| | |
| | |
| | |
|
REALIZED AND UNREALIZED GAINS (LOSSES) |
Net realized gains on sales of securities - unaffiliated | | |
Net change in unrealized appreciation (depreciation) on securities - unaffiliated | | |
Net realized and unrealized gains | | |
Increase in net assets resulting from operations | | |
| Proxy fees are non-routine expenses (see financial note 4 for additional information). |
30
Schwab Active Equity Funds | Annual Report
Statement of Changes in Net Assets
For the current and prior report periods
|
| | |
| | | |
| | | |
Net change in unrealized appreciation (depreciation) | | | |
Increase (decrease) in net assets resulting from operations | | | |
|
DISTRIBUTIONS TO SHAREHOLDERS |
| | | |
TRANSACTIONS IN FUND SHARES |
| | |
| | | | | |
| | | | | |
| | | | | |
| | | | | |
Net transactions in fund shares | | | | | |
|
SHARES OUTSTANDING AND NET ASSETS |
| | |
| | | | | |
| | | | | |
Total increase (decrease) | | | | | |
| | | | | |
Schwab Active Equity Funds | Annual Report31
Schwab Dividend Equity Fund
Financial Statements
| | | | | | |
|
Net asset value at beginning of period | | | | | | |
Income (loss) from investment operations: | | | | | | |
Net investment income (loss)1 | | | | | | |
Net realized and unrealized gains (losses) | | | | | | |
Total from investment operations | | | | | | |
| | | | | | |
Distributions from net investment income | | | | | | |
Distributions from net realized gains | | | | | | |
| | | | | | |
Net asset value at end of period | | | | | | |
| | | | | | |
|
Ratios to average net assets: | | | | | | |
| | | | | | |
| | | | | | |
Net investment income (loss) | | | | | | |
| | | | | | |
Net assets, end of period (x 1,000) | | | | | | |
| Calculated based on the average shares outstanding during the period. |
| Ratio includes less than 0.005% of non-routine proxy expenses. |
32
Schwab Active Equity Funds | Annual Report
Schwab Dividend Equity Fund
Portfolio Holdings as of October 31, 2023
This section shows all the securities in the fund’s portfolio and their values as of the report date.
The fund files its complete schedule of portfolio holdings with the U.S. Securities and Exchange Commission (SEC) for the first and third quarters of each fiscal year on Form N-PORT Part F. The fund’s Form N-PORT Part F is available on the SEC’s website at www.sec.gov. You can also obtain this information at no cost on the fund’s website at www.schwabassetmanagement.com/schwabfunds_prospectus, by calling 1-866-414-6349, or by sending an email request to orders@mysummaryprospectus.com. The fund also makes available its complete schedule of portfolio holdings 15 to 20 days after the end of the month on the fund’s website.
| | |
COMMON STOCKS 99.9% OF NET ASSETS |
|
|
| | |
| | |
| | |
| | |
|
|
| | |
| | |
Illinois Tool Works, Inc. | | |
| | |
| | |
| | |
| | |
| | |
|
Consumer Discretionary Distribution & Retail 5.3% |
| | |
| | |
| | |
| | |
|
|
| | |
|
Consumer Staples Distribution & Retail 2.7% |
| | |
|
|
| | |
| | |
| | |
| | |
|
Equity Real Estate Investment Trusts (REITs) 2.7% |
| | |
Lamar Advertising Co., Class A | | |
| | |
| | |
|
|
| | |
Fidelity National Information Services, Inc. | | |
| | |
| | |
| | |
|
| | |
Food, Beverage & Tobacco 8.1% |
| | |
| | |
Philip Morris International, Inc. | | |
| | |
|
Health Care Equipment & Services 7.8% |
| | |
| | |
| | |
| | |
| | |
|
Household & Personal Products 4.5% |
| | |
| | |
| | |
|
|
| | |
|
|
| | |
|
Media & Entertainment 3.0% |
| | |
| | |
| | |
|
Pharmaceuticals, Biotechnology & Life Sciences 7.7% |
| | |
| | |
| | |
| | |
| | |
|
Semiconductors & Semiconductor Equipment 3.2% |
| | |
|
|
| | |
International Business Machines Corp. | | |
| | |
| | |
|
Schwab Active Equity Funds | Annual Report33
Schwab Dividend Equity Fund
Portfolio Holdings as of October 31, 2023 (continued)
| | |
Technology Hardware & Equipment 4.4% |
| | |
| | |
| | |
|
Telecommunication Services 2.2% |
| | |
Verizon Communications, Inc. | | |
| | |
|
|
United Parcel Service, Inc., Class B | | |
|
| | |
|
| | |
| | |
| | |
Total Common Stocks
(Cost $398,239,586) | |
Total Investments in Securities
(Cost $398,239,586) | |
The following is a summary of the inputs used to value the fund’s investments as of October 31, 2023 (see financial note 2(a) for additional information):
| QUOTED PRICES IN
ACTIVE MARKETS FOR
IDENTICAL ASSETS
(LEVEL 1) | OTHER SIGNIFICANT
OBSERVABLE INPUTS
(LEVEL 2) | SIGNIFICANT
UNOBSERVABLE INPUTS
(LEVEL 3) | |
| | | | |
| | | | |
Pharmaceuticals, Biotechnology & Life Sciences | | | | |
| | | | |
| As categorized in the Portfolio Holdings. |
34
Schwab Active Equity Funds | Annual Report
Schwab Dividend Equity Fund
Statement of Assets and Liabilities
As of October 31, 2023
|
Investments in securities, at value - unaffiliated (cost $398,239,586) | | |
| | |
| | |
| | |
| | |
| | |
| | |
| | |
|
|
| | |
| | |
Investment adviser and administrator fees | | |
| | |
| | |
| | |
| | |
|
|
Capital received from investors | | |
Total distributable earnings | | |
| | |
Schwab Active Equity Funds | Annual Report35
Schwab Dividend Equity Fund
Statement of Operations
For the period November 1, 2022 through October 31, 2023 |
|
Dividends received from securities - unaffiliated (net of foreign withholding tax of $94,231) | | |
Interest received from securities - unaffiliated | | |
| | |
|
|
Investment adviser and administrator fees | | |
| | |
| | |
Portfolio accounting fees | | |
| | |
| | |
Independent trustees’ fees | | |
| | |
| | |
| | |
| | |
| | |
| | |
| | |
|
REALIZED AND UNREALIZED GAINS (LOSSES) |
Net realized gains on sales of securities - unaffiliated | | |
Net realized gains on foreign currency transactions | | |
| | |
Net change in unrealized appreciation (depreciation) on securities - unaffiliated | | |
Net change in unrealized appreciation (depreciation) on foreign currency translations | | |
Net change in unrealized appreciation (depreciation) | | |
Net realized and unrealized losses | | |
Decrease in net assets resulting from operations | | |
36
Schwab Active Equity Funds | Annual Report
Schwab Dividend Equity Fund
Statement of Changes in Net Assets
For the current and prior report periods
|
| | |
| | | |
| | | |
Net change in unrealized appreciation (depreciation) | | | |
Decrease in net assets from operations | | | |
|
DISTRIBUTIONS TO SHAREHOLDERS |
| | | |
TRANSACTIONS IN FUND SHARES |
| | |
| | | | | |
| | | | | |
| | | | | |
| | | | | |
Net transactions in fund shares | | | | | |
|
SHARES OUTSTANDING AND NET ASSETS |
| | |
| | | | | |
| | | | | |
| | | | | |
| | | | | |
Schwab Active Equity Funds | Annual Report37
Schwab Large-Cap Growth Fund
Financial Statements
| | | | | | |
|
Net asset value at beginning of period | | | | | | |
Income (loss) from investment operations: | | | | | | |
Net investment income (loss)1 | | | | | | |
Net realized and unrealized gains (losses) | | | | | | |
Total from investment operations | | | | | | |
| | | | | | |
Distributions from net investment income | | | | | | |
Distributions from net realized gains | | | | | | |
| | | | | | |
Net asset value at end of period | | | | | | |
| | | | | | |
|
Ratios to average net assets: | | | | | | |
| | | | | | |
| | | | | | |
Net investment income (loss) | | | | | | |
| | | | | | |
Net assets, end of period (x 1,000) | | | | | | |
| Calculated based on the average shares outstanding during the period. |
| Per-share amount was less than $0.005. |
| Ratio includes less than 0.005% of non-routine proxy expenses. |
38
Schwab Active Equity Funds | Annual Report
Schwab Large-Cap Growth Fund
Portfolio Holdings as of October 31, 2023
This section shows all the securities in the fund’s portfolio and their values as of the report date.
The fund files its complete schedule of portfolio holdings with the U.S. Securities and Exchange Commission (SEC) for the first and third quarters of each fiscal year on Form N-PORT Part F. The fund’s Form N-PORT Part F is available on the SEC’s website at www.sec.gov. You can also obtain this information at no cost on the fund’s website at www.schwabassetmanagement.com/schwabfunds_prospectus, by calling 1-866-414-6349, or by sending an email request to orders@mysummaryprospectus.com. The fund also makes available its complete schedule of portfolio holdings 15 to 20 days after the end of the month on the fund’s website.
| | |
COMMON STOCKS 94.1% OF NET ASSETS |
|
Automobiles & Components 1.2% |
| | |
|
|
| | |
Illinois Tool Works, Inc. | | |
| | |
| | |
| | |
| | |
| | |
|
Commercial & Professional Services 1.5% |
| | |
Republic Services, Inc., Class A | | |
| | |
|
Consumer Discretionary Distribution & Retail 8.0% |
| | |
| | |
O'Reilly Automotive, Inc. * | | |
| | |
| | |
|
Consumer Durables & Apparel 1.9% |
| | |
| | |
| | |
|
|
| | |
| | |
| | |
| | |
|
Consumer Staples Distribution & Retail 1.4% |
| | |
|
|
| | |
|
Equity Real Estate Investment Trusts (REITs) 0.8% |
| | |
| | |
| | |
|
| | |
|
Interactive Brokers Group, Inc., Class A | | |
Mastercard, Inc., Class A | | |
| | |
| | |
| | |
|
Food, Beverage & Tobacco 2.9% |
Constellation Brands, Inc., Class A | | |
| | |
| | |
Philip Morris International, Inc. | | |
| | |
|
Health Care Equipment & Services 4.9% |
Edwards Lifesciences Corp. * | | |
IDEXX Laboratories, Inc. * | | |
Intuitive Surgical, Inc. * | | |
| | |
| | |
|
|
| | |
|
Media & Entertainment 9.4% |
Alphabet, Inc., Class A * | | |
Meta Platforms, Inc., Class A * | | |
| | |
| | |
|
Pharmaceuticals, Biotechnology & Life Sciences 4.7% |
| | |
Thermo Fisher Scientific, Inc. | | |
| | |
| | |
|
Semiconductors & Semiconductor Equipment 8.9% |
Advanced Micro Devices, Inc. * | | |
ASML Holding NV NY Registry Shares | | |
| | |
| | |
| | |
|
Software & Services 22.4% |
| | |
| | |
| | |
| | |
| | |
| | |
Schwab Active Equity Funds | Annual Report39
Schwab Large-Cap Growth Fund
Portfolio Holdings as of October 31, 2023 (continued)
| | |
| | |
Palo Alto Networks, Inc. * | | |
| | |
| | |
| | |
|
Technology Hardware & Equipment 11.3% |
| | |
Total Common Stocks
(Cost $137,917,111) | |
Total Investments in Securities
(Cost $137,917,111) | |
| | | CURRENT VALUE/
UNREALIZED
DEPRECIATION
($) |
|
| | | |
S&P 500 Index, e-mini, expires 12/15/23 | | | |
| Non-income producing security. |
| American Depositary Receipt |
The following is a summary of the inputs used to value the fund’s investments as of October 31, 2023 (see financial note 2(a) for additional information):
| QUOTED PRICES IN
ACTIVE MARKETS FOR
IDENTICAL ASSETS
(LEVEL 1) | OTHER SIGNIFICANT
OBSERVABLE INPUTS
(LEVEL 2) | SIGNIFICANT
UNOBSERVABLE INPUTS
(LEVEL 3) | |
| | | | |
| | | | |
| | | | |
| | | | |
| | | | |
| As categorized in the Portfolio Holdings. |
| Futures contracts are reported at cumulative unrealized appreciation or depreciation. |
40
Schwab Active Equity Funds | Annual Report
Schwab Large-Cap Growth Fund
Statement of Assets and Liabilities
As of October 31, 2023
|
Investments in securities, at value - unaffiliated (cost $137,917,111) | | |
| | |
Deposit with broker for futures contracts | | |
| | |
| | |
| | |
Variation margin on future contracts | | |
| | |
| | |
| | |
|
|
| | |
| | |
Investment adviser and administrator fees | | |
| | |
| | |
| | |
| | |
|
|
Capital received from investors | | |
Total distributable earnings | | |
| | |
Schwab Active Equity Funds | Annual Report41
Schwab Large-Cap Growth Fund
Statement of Operations
For the period November 1, 2022 through October 31, 2023 |
|
Dividends received from securities - unaffiliated (net of foreign withholding tax of $5,592) | | |
Interest received from securities - unaffiliated | | |
| | |
| | |
|
|
Investment adviser and administrator fees | | |
| | |
Portfolio accounting fees | | |
| | |
| | |
| | |
Independent trustees’ fees | | |
| | |
| | |
| | |
| | |
| | |
| | |
| | |
|
REALIZED AND UNREALIZED GAINS (LOSSES) |
Net realized losses on sales of securities - unaffiliated | | |
Net realized gains on futures contracts | | |
| | |
Net change in unrealized appreciation (depreciation) on securities - unaffiliated | | |
Net change in unrealized appreciation (depreciation) on futures contracts | | |
Net change in unrealized appreciation (depreciation) | | |
Net realized and unrealized gains | | |
Increase in net assets resulting from operations | | |
42
Schwab Active Equity Funds | Annual Report
Schwab Large-Cap Growth Fund
Statement of Changes in Net Assets
For the current and prior report periods
|
| | |
Net investment income (loss) | | | |
Net realized gains (losses) | | | |
Net change in unrealized appreciation (depreciation) | | | |
Increase (decrease) in net assets resulting from operations | | | |
|
DISTRIBUTIONS TO SHAREHOLDERS |
| | | |
TRANSACTIONS IN FUND SHARES |
| | |
| | | | | |
| | | | | |
| | | | | |
| | | | | |
Net transactions in fund shares | | | | | |
|
SHARES OUTSTANDING AND NET ASSETS |
| | |
| | | | | |
| | | | | |
Total increase (decrease) | | | | | |
| | | | | |
Schwab Active Equity Funds | Annual Report43
Schwab Small-Cap Equity Fund
Financial Statements
| | | | | | |
|
Net asset value at beginning of period | | | | | | |
Income (loss) from investment operations: | | | | | | |
Net investment income (loss)1 | | | | | | |
Net realized and unrealized gains (losses) | | | | | | |
Total from investment operations | | | | | | |
| | | | | | |
Distributions from net investment income | | | | | | |
Distributions from net realized gains | | | | | | |
| | | | | | |
Net asset value at end of period | | | | | | |
| | | | | | |
|
Ratios to average net assets: | | | | | | |
| | | | | | |
| | | | | | |
Net investment income (loss) | | | | | | |
| | | | | | |
Net assets, end of period (x 1,000) | | | | | | |
| Calculated based on the average shares outstanding during the period. |
| The per share amount does not accord with the change in aggregate gains and losses in securities during the period because of the timing of fund transactions in relation to fluctuating market values. |
| Ratio includes less than 0.005% of non-routine proxy expenses. |
44
Schwab Active Equity Funds | Annual Report
Schwab Small-Cap Equity Fund
Portfolio Holdings as of October 31, 2023
This section shows all the securities in the fund’s portfolio and their values as of the report date.
The fund files its complete schedule of portfolio holdings with the U.S. Securities and Exchange Commission (SEC) for the first and third quarters of each fiscal year on Form N-PORT Part F. The fund’s Form N-PORT Part F is available on the SEC’s website at www.sec.gov. You can also obtain this information at no cost on the fund’s website at www.schwabassetmanagement.com/schwabfunds_prospectus, by calling 1-866-414-6349, or by sending an email request to orders@mysummaryprospectus.com. The fund also makes available its complete schedule of portfolio holdings 15 to 20 days after the end of the month on the fund’s website.
| | |
COMMON STOCKS 96.1% OF NET ASSETS |
|
Automobiles & Components 2.1% |
| | |
American Axle & Manufacturing Holdings, Inc. * | | |
Fox Factory Holding Corp. * | | |
Goodyear Tire & Rubber Co. * | | |
Modine Manufacturing Co. * | | |
| | |
| | |
Winnebago Industries, Inc. | | |
| | |
|
|
| | |
| | |
| | |
| | |
| | |
Enterprise Financial Services Corp. | | |
| | |
Great Southern Bancorp, Inc. | | |
| | |
HomeTrust Bancshares, Inc. | | |
International Bancshares Corp. | | |
| | |
Metropolitan Bank Holding Corp. * | | |
OceanFirst Financial Corp. | | |
| | |
Peapack-Gladstone Financial Corp. | | |
| | |
| | |
Republic Bancorp, Inc., Class A | | |
| | |
| | |
| | |
| | |
| | |
| | |
Western New England Bancorp, Inc. | | |
| | |
|
|
| | |
| | |
| | |
| | |
Applied Industrial Technologies, Inc. | | |
Array Technologies, Inc. * | | |
| | |
| | |
| | |
| | |
| | |
| | |
| | |
| | |
| | |
Helios Technologies, Inc. | | |
| | |
| | |
| | |
| | |
| | |
| | |
| | |
Preformed Line Products Co. | | |
| | |
Shoals Technologies Group, Inc., Class A * | | |
Simpson Manufacturing Co., Inc. | | |
| | |
Sterling Infrastructure, Inc. * | | |
| | |
Thermon Group Holdings, Inc. * | | |
Titan International, Inc. * | | |
| | |
| | |
| | |
Watts Water Technologies, Inc., Class A | | |
| | |
|
Commercial & Professional Services 2.6% |
| | |
Casella Waste Systems, Inc., Class A * | | |
| | |
| | |
ExlService Holdings, Inc. * | | |
| | |
| | |
| | |
| | |
| | |
| | |
| | |
| | |
|
Consumer Discretionary Distribution & Retail 1.8% |
| | |
Build-A-Bear Workshop, Inc. | | |
| | |
| | |
| | |
| | |
| | |
| | |
| | |
|
Consumer Durables & Apparel 1.5% |
| | |
| | |
Schwab Active Equity Funds | Annual Report45
Schwab Small-Cap Equity Fund
Portfolio Holdings as of October 31, 2023 (continued)
| | |
Malibu Boats, Inc., Class A * | | |
MasterCraft Boat Holdings, Inc. * | | |
| | |
| | |
Solo Brands, Inc., Class A * | | |
| | |
| | |
|
|
| | |
| | |
Dave & Buster's Entertainment, Inc. * | | |
| | |
| | |
Hilton Grand Vacations, Inc. * | | |
Inspired Entertainment, Inc. * | | |
International Game Technology PLC | | |
| | |
| | |
SeaWorld Entertainment, Inc. * | | |
| | |
Target Hospitality Corp. * | | |
Texas Roadhouse, Inc., Class A | | |
| | |
|
Consumer Staples Distribution & Retail 0.9% |
| | |
BJ's Wholesale Club Holdings, Inc. * | | |
| | |
| | |
|
|
California Resources Corp. | | |
| | |
| | |
| | |
| | |
| | |
Equitrans Midstream Corp. | | |
Liberty Energy, Inc., Class A | | |
Magnolia Oil & Gas Corp., Class A | | |
| | |
| | |
Par Pacific Holdings, Inc. * | | |
Patterson-UTI Energy, Inc. | | |
PBF Energy, Inc., Class A | | |
| | |
| | |
| | |
Southwestern Energy Co. * | | |
| | |
Teekay Tankers Ltd., Class A | | |
U.S. Silica Holdings, Inc. * | | |
| | |
| | |
|
Equity Real Estate Investment Trusts (REITs) 5.7% |
American Assets Trust, Inc. | | |
Apple Hospitality REIT, Inc. | | |
Armada Hoffler Properties, Inc. | | |
| | |
| | |
| | |
DiamondRock Hospitality Co. | | |
| | |
EastGroup Properties, Inc. | | |
Empire State Realty Trust, Inc., Class A | | |
| | |
Ryman Hospitality Properties, Inc. | | |
Sabra Health Care REIT, Inc. | | |
| | |
Tanger Factory Outlet Centers, Inc. | | |
| | |
| | |
| | |
|
|
Donnelley Financial Solutions, Inc. * | | |
| | |
Enova International, Inc. * | | |
| | |
| | |
Federal Agricultural Mortgage Corp., Class C | | |
Jackson Financial, Inc., Class A | | |
| | |
| | |
NMI Holdings, Inc., Class A * | | |
| | |
Oportun Financial Corp. * | | |
| | |
| | |
Regional Management Corp. | | |
StepStone Group, Inc., Class A | | |
| | |
| | |
Victory Capital Holdings, Inc., Class A | | |
Virtus Investment Partners, Inc. | | |
| | |
|
Food, Beverage & Tobacco 2.5% |
| | |
Coca-Cola Consolidated, Inc. | | |
National Beverage Corp. * | | |
| | |
| | |
| | |
| | |
|
Health Care Equipment & Services 4.2% |
| | |
AirSculpt Technologies, Inc. *(a) | | |
AMN Healthcare Services, Inc. * | | |
| | |
| | |
| | |
| | |
| | |
Hims & Hers Health, Inc. * | | |
| | |
Inspire Medical Systems, Inc. * | | |
Lantheus Holdings, Inc. * | | |
| | |
Merit Medical Systems, Inc. * | | |
OmniAb, Inc., Class A *(b) | | |
OmniAb, Inc., Class B *(b) | | |
Option Care Health, Inc. * | | |
OraSure Technologies, Inc. * | | |
| | |
| | |
46
Schwab Active Equity Funds | Annual Report
Schwab Small-Cap Equity Fund
Portfolio Holdings as of October 31, 2023 (continued)
| | |
Utah Medical Products, Inc. | | |
| | |
| | |
| | |
| | |
|
Household & Personal Products 0.5% |
| | |
| | |
Nature's Sunshine Products, Inc. * | | |
| | |
|
|
American Equity Investment Life Holding Co. | | |
CNO Financial Group, Inc. | | |
| | |
Genworth Financial, Inc., Class A * | | |
| | |
Kinsale Capital Group, Inc. | | |
| | |
|
|
| | |
Alpha Metallurgical Resources, Inc. | | |
| | |
| | |
| | |
| | |
Constellium SE, Class A * | | |
| | |
| | |
| | |
| | |
| | |
| | |
Rayonier Advanced Materials, Inc. * | | |
| | |
| | |
| | |
|
Media & Entertainment 2.1% |
AMC Networks, Inc., Class A * | | |
| | |
Entravision Communications Corp., Class A | | |
| | |
| | |
| | |
iHeartMedia, Inc., Class A * | | |
| | |
| | |
| | |
| | |
| | |
|
Pharmaceuticals, Biotechnology & Life Sciences 11.2% |
| | |
ACADIA Pharmaceuticals, Inc. * | | |
Agios Pharmaceuticals, Inc. * | | |
| | |
Amicus Therapeutics, Inc. * | | |
Amneal Pharmaceuticals, Inc. * | | |
Amphastar Pharmaceuticals, Inc. * | | |
| | |
Amylyx Pharmaceuticals, Inc. * | | |
ANI Pharmaceuticals, Inc. * | | |
Arcus Biosciences, Inc. * | | |
Arrowhead Pharmaceuticals, Inc. * | | |
| | |
Assertio Holdings, Inc. * | | |
Aurinia Pharmaceuticals, Inc. * | | |
Beam Therapeutics, Inc. * | | |
| | |
Cara Therapeutics, Inc. * | | |
Catalyst Pharmaceuticals, Inc. * | | |
Collegium Pharmaceutical, Inc. * | | |
Deciphera Pharmaceuticals, Inc. * | | |
Denali Therapeutics, Inc. * | | |
Dynavax Technologies Corp. * | | |
Eagle Pharmaceuticals, Inc. * | | |
| | |
Fate Therapeutics, Inc. * | | |
Halozyme Therapeutics, Inc. * | | |
Harmony Biosciences Holdings, Inc. * | | |
Harvard Bioscience, Inc. * | | |
| | |
Ironwood Pharmaceuticals, Inc., Class A * | | |
Karuna Therapeutics, Inc. * | | |
Kiniksa Pharmaceuticals Ltd., Class A * | | |
Ligand Pharmaceuticals, Inc. * | | |
| | |
| | |
| | |
| | |
| | |
Nurix Therapeutics, Inc. * | | |
Organogenesis Holdings, Inc., Class A * | | |
Phibro Animal Health Corp., Class A | | |
Prestige Consumer Healthcare, Inc. * | | |
| | |
Rigel Pharmaceuticals, Inc. * | | |
| | |
Travere Therapeutics, Inc. * | | |
Vanda Pharmaceuticals, Inc. * | | |
| | |
| | |
Vir Biotechnology, Inc. * | | |
| | |
| | |
|
Real Estate Management & Development 0.1% |
| | |
|
Semiconductors & Semiconductor Equipment 2.3% |
| | |
| | |
Axcelis Technologies, Inc. * | | |
| | |
Lattice Semiconductor Corp. * | | |
| | |
| | |
| | |
| | |
| | |
|
|
| | |
| | |
Alarm.com Holdings, Inc. * | | |
Schwab Active Equity Funds | Annual Report47
Schwab Small-Cap Equity Fund
Portfolio Holdings as of October 31, 2023 (continued)
| | |
| | |
| | |
| | |
CommVault Systems, Inc. * | | |
| | |
| | |
| | |
| | |
| | |
| | |
| | |
Sprinklr, Inc., Class A * | | |
Sprout Social, Inc., Class A * | | |
| | |
| | |
Weave Communications, Inc. * | | |
| | |
| | |
Zeta Global Holdings Corp., Class A * | | |
| | |
| | |
|
Technology Hardware & Equipment 4.0% |
Arlo Technologies, Inc. * | | |
| | |
| | |
| | |
CommScope Holding Co., Inc. * | | |
| | |
| | |
| | |
| | |
| | |
Super Micro Computer, Inc. * | | |
Vishay Intertechnology, Inc. | | |
| | |
| | |
|
Telecommunication Services 0.8% |
Iridium Communications, Inc. | | |
Liberty Latin America Ltd., Class A * | | |
| | |
| | |
|
|
| | |
| | |
| | |
Hub Group, Inc., Class A * | | |
| | |
| | |
Radiant Logistics, Inc. * | | |
| | |
|
|
Chesapeake Utilities Corp. | | |
Clearway Energy, Inc., Class A | | |
Consolidated Water Co. Ltd. | | |
Genie Energy Ltd., Class B | | |
New Jersey Resources Corp. | | |
| | |
Via Renewables, Inc., Class A | | |
| | |
Total Common Stocks
(Cost $461,210,267) | |
| | |
SHORT-TERM INVESTMENTS 0.2% OF NET ASSETS |
|
|
State Street Institutional U.S. Government Money Market Fund, Premier Class 5.30% (c)(d) | | |
Total Short-Term Investments
(Cost $901,550) | |
Total Investments in Securities
(Cost $462,111,817) | |
| | | CURRENT VALUE/
UNREALIZED
DEPRECIATION
($) |
|
| | | |
Russell 2000 Index, e-mini, expires 12/15/23 | | | |
| Non-income producing security. |
| All or a portion of this security is on loan. Securities on loan were valued at $886,296. |
| Fair valued using significant unobservable inputs (see financial note 2(a), Securities for which no quoted value is available, for additional information). |
| The rate shown is the annualized 7-day yield. |
| Security purchased with cash collateral received for securities on loan. |
| Real Estate Investment Trust |
48
Schwab Active Equity Funds | Annual Report
Schwab Small-Cap Equity Fund
Portfolio Holdings as of October 31, 2023 (continued)
The following is a summary of the inputs used to value the fund’s investments as of October 31, 2023 (see financial note 2(a) for additional information):
| QUOTED PRICES IN
ACTIVE MARKETS FOR
IDENTICAL ASSETS
(LEVEL 1) | OTHER SIGNIFICANT
OBSERVABLE INPUTS
(LEVEL 2) | SIGNIFICANT
UNOBSERVABLE INPUTS
(LEVEL 3) | |
| | | | |
| | | | |
Health Care Equipment & Services | | | | |
| | | | |
| | | | |
| | | | |
| | | | |
| Level 3 amount shown includes securities determined to have no value at October 31, 2023. |
| As categorized in the Portfolio Holdings. |
| Futures contracts are reported at cumulative unrealized appreciation or depreciation. |
Schwab Active Equity Funds | Annual Report49
Schwab Small-Cap Equity Fund
Statement of Assets and Liabilities
As of October 31, 2023
|
Investments in securities, at value - unaffiliated (cost $462,111,817) including securities on loan of $886,296 | | |
| | |
Deposit with broker for futures contracts | | |
| | |
Variation margin on future contracts | | |
| | |
| | |
| | |
Income from securities on loan | | |
| | |
| | |
|
|
Collateral held for securities on loan | | |
| | |
Investment adviser and administrator fees | | |
| | |
| | |
| | |
| | |
| | |
|
|
Capital received from investors | | |
| | |
| | |
50
Schwab Active Equity Funds | Annual Report
Schwab Small-Cap Equity Fund
Statement of Operations
For the period November 1, 2022 through October 31, 2023 |
|
Dividends received from securities - unaffiliated (net of foreign withholding tax of $17,107) | | |
Interest received from securities - unaffiliated | | |
| | |
| | |
|
|
Investment adviser and administrator fees | | |
| | |
Portfolio accounting fees | | |
| | |
| | |
| | |
Independent trustees’ fees | | |
| | |
| | |
| | |
| | |
| | |
| | |
| | |
| | |
|
REALIZED AND UNREALIZED GAINS (LOSSES) |
Net realized losses on sales of securities - unaffiliated | | |
Net realized losses on futures contracts | | |
| | |
Net change in unrealized appreciation (depreciation) on securities - unaffiliated | | |
Net change in unrealized appreciation (depreciation) on futures contracts | | |
Net change in unrealized appreciation (depreciation) | | |
Net realized and unrealized losses | | |
Decrease in net assets resulting from operations | | |
| Proxy fees are non-routine expenses (see financial note 4 for additional information). |
Schwab Active Equity Funds | Annual Report51
Schwab Small-Cap Equity Fund
Statement of Changes in Net Assets
For the current and prior report periods
|
| | |
| | | |
Net realized gains (losses) | | | |
Net change in unrealized appreciation (depreciation) | | | |
Decrease in net assets from operations | | | |
|
DISTRIBUTIONS TO SHAREHOLDERS |
| | | |
TRANSACTIONS IN FUND SHARES |
| | |
| | | | | |
| | | | | |
| | | | | |
| | | | | |
Net transactions in fund shares | | | | | |
|
SHARES OUTSTANDING AND NET ASSETS |
| | |
| | | | | |
| | | | | |
Total increase (decrease) | | | | | |
| | | | | |
52
Schwab Active Equity Funds | Annual Report
Financial Statements
| | | | | | |
|
Net asset value at beginning of period | | | | | | |
Income (loss) from investment operations: | | | | | | |
Net investment income (loss)1 | | | | | | |
Net realized and unrealized gains (losses) | | | | | | |
Total from investment operations | | | | | | |
| | | | | | |
Distributions from net investment income | | | | | | |
Distributions from net realized gains | | | | | | |
| | | | | | |
Net asset value at end of period | | | | | | |
| | | | | | |
|
Ratios to average net assets: | | | | | | |
| | | | | | |
| | | | | | |
Net investment income (loss) | | | | | | |
| | | | | | |
Net assets, end of period (x 1,000) | | | | | | |
| Calculated based on the average shares outstanding during the period. |
| Ratio includes less than 0.005% of non-routine proxy expenses. |
Schwab Active Equity Funds | Annual Report53
Portfolio Holdings as of October 31, 2023
This section shows all the securities in the fund’s portfolio and their values as of the report date.
The fund files its complete schedule of portfolio holdings with the U.S. Securities and Exchange Commission (SEC) for the first and third quarters of each fiscal year on Form N-PORT Part F. The fund’s Form N-PORT Part F is available on the SEC’s website at www.sec.gov. You can also obtain this information at no cost on the fund’s website at www.schwabassetmanagement.com/schwabfunds_prospectus, by calling 1-866-414-6349, or by sending an email request to orders@mysummaryprospectus.com. The fund also makes available its complete schedule of portfolio holdings 15 to 20 days after the end of the month on the fund’s website.
| | |
COMMON STOCKS 99.2% OF NET ASSETS |
|
|
| | |
| | |
| | |
|
|
| | |
|
|
| | |
|
|
| | |
| | |
| | |
| | |
|
|
| | |
|
|
| | |
| | |
Ono Pharmaceutical Co. Ltd. | | |
| | |
| | |
| | |
|
|
| | |
| | |
| | |
|
|
| | |
| | |
| | |
| | |
|
|
| | |
| | |
Agilent Technologies, Inc. | | |
| | |
| | |
| | |
| | |
Amphastar Pharmaceuticals, Inc. * | | |
| | |
| | |
BioMarin Pharmaceutical, Inc. * | | |
Boston Scientific Corp. * | | |
| | |
| | |
| | |
| | |
| | |
| | |
| | |
Edwards Lifesciences Corp. * | | |
Elanco Animal Health, Inc. * | | |
| | |
| | |
| | |
Halozyme Therapeutics, Inc. * | | |
| | |
| | |
| | |
| | |
Intuitive Surgical, Inc. * | | |
| | |
Jazz Pharmaceuticals PLC * | | |
| | |
Lantheus Holdings, Inc. * | | |
| | |
| | |
| | |
Merit Medical Systems, Inc. * | | |
Mettler-Toledo International, Inc. * | | |
Option Care Health, Inc. * | | |
| | |
Prestige Consumer Healthcare, Inc. * | | |
| | |
Regeneron Pharmaceuticals, Inc. * | | |
| | |
Thermo Fisher Scientific, Inc. | | |
United Therapeutics Corp. * | | |
| | |
Veeva Systems, Inc., Class A * | | |
| | |
Vertex Pharmaceuticals, Inc. * | | |
Zimmer Biomet Holdings, Inc. | | |
| | |
| | |
Total Common Stocks
(Cost $518,680,148) | |
Total Investments in Securities
(Cost $518,680,148) | |
| Non-income producing security. |
54
Schwab Active Equity Funds | Annual Report
Portfolio Holdings as of October 31, 2023 (continued)
The following is a summary of the inputs used to value the fund’s investments as of October 31, 2023 (see financial note 2(a) for additional information):
| QUOTED PRICES IN
ACTIVE MARKETS FOR
IDENTICAL ASSETS
(LEVEL 1) | OTHER SIGNIFICANT
OBSERVABLE INPUTS
(LEVEL 2) | SIGNIFICANT
UNOBSERVABLE INPUTS
(LEVEL 3) | |
| | | | |
| | | | |
| | | | |
| | | | |
| | | | |
| | | | |
| | | | |
| | | | |
| | | | |
| | | | |
| As categorized in the Portfolio Holdings. |
Schwab Active Equity Funds | Annual Report55
Statement of Assets and Liabilities
As of October 31, 2023
|
Investments in securities, at value - unaffiliated (cost $518,680,148) | | |
| | |
Foreign currency, at value (cost $424,903) | | |
| | |
| | |
| | |
| | |
| | |
| | |
| | |
|
|
| | |
| | |
| | |
Investment adviser and administrator fees | | |
| | |
| | |
| | |
| | |
|
|
Capital received from investors | | |
Total distributable earnings | | |
| | |
56
Schwab Active Equity Funds | Annual Report
Statement of Operations
For the period November 1, 2022 through October 31, 2023 |
|
Dividends received from securities - unaffiliated (net of foreign withholding tax of $331,623) | | |
Interest received from securities - unaffiliated | | |
| | |
| | |
|
|
Investment adviser and administrator fees | | |
| | |
| | |
| | |
| | |
Portfolio accounting fees | | |
| | |
Independent trustees’ fees | | |
| | |
| | |
| | |
| | |
| | |
| | |
| | |
|
REALIZED AND UNREALIZED GAINS (LOSSES) |
Net realized gains on sales of securities - unaffiliated | | |
Net realized gains on foreign currency transactions | | |
| | |
Net change in unrealized appreciation (depreciation) on securities - unaffiliated | | |
Net change in unrealized appreciation (depreciation) on foreign currency translations | | |
Net change in unrealized appreciation (depreciation) | | |
Net realized and unrealized losses | | |
Decrease in net assets resulting from operations | | |
| Proxy fees are non-routine expenses (see financial note 4 for additional information). |
Schwab Active Equity Funds | Annual Report57
Statement of Changes in Net Assets
For the current and prior report periods
|
| | |
| | | |
| | | |
Net change in unrealized appreciation (depreciation) | | | |
Decrease in net assets from operations | | | |
|
DISTRIBUTIONS TO SHAREHOLDERS |
| | | |
TRANSACTIONS IN FUND SHARES |
| | |
| | | | | |
| | | | | |
| | | | | |
| | | | | |
Net transactions in fund shares | | | | | |
|
SHARES OUTSTANDING AND NET ASSETS |
| | |
| | | | | |
| | | | | |
Total increase (decrease) | | | | | |
| | | | | |
58
Schwab Active Equity Funds | Annual Report
Schwab International Core Equity Fund
Financial Statements
| | | | | | |
|
Net asset value at beginning of period | | | | | | |
Income (loss) from investment operations: | | | | | | |
Net investment income (loss)1 | | | | | | |
Net realized and unrealized gains (losses) | | | | | | |
Total from investment operations | | | | | | |
| | | | | | |
Distributions from net investment income | | | | | | |
Net asset value at end of period | | | | | | |
| | | | | | |
|
Ratios to average net assets: | | | | | | |
| | | | | | |
| | | | | | |
Net investment income (loss) | | | | | | |
| | | | | | |
Net assets, end of period (x 1,000) | | | | | | |
| Calculated based on the average shares outstanding during the period. |
| Ratio includes less than 0.005% of non-routine proxy expenses. |
Schwab Active Equity Funds | Annual Report59
Schwab International Core Equity Fund
Portfolio Holdings as of October 31, 2023
This section shows all the securities in the fund’s portfolio and their values as of the report date.
The fund files its complete schedule of portfolio holdings with the U.S. Securities and Exchange Commission (SEC) for the first and third quarters of each fiscal year on Form N-PORT Part F. The fund’s Form N-PORT Part F is available on the SEC’s website at www.sec.gov. You can also obtain this information at no cost on the fund’s website at www.schwabassetmanagement.com/schwabfunds_prospectus, by calling 1-866-414-6349, or by sending an email request to orders@mysummaryprospectus.com. The fund also makes available its complete schedule of portfolio holdings 15 to 20 days after the end of the month on the fund’s website.
| | |
COMMON STOCKS 97.6% OF NET ASSETS |
|
|
| | |
| | |
| | |
| | |
Fortescue Metals Group Ltd. | | |
National Australia Bank Ltd. | | |
| | |
| | |
| | |
| | |
| | |
| | |
|
|
| | |
| | |
| | |
|
|
| | |
|
|
| | |
| | |
| | |
| | |
|
|
COSCO SHIPPING Holdings Co. Ltd., H Shares | | |
| | |
| | |
|
|
| | |
| | |
| | |
|
|
| | |
| | |
| | |
| | |
| | |
| | |
| | |
LVMH Moet Hennessy Louis Vuitton SE | | |
| | |
| | |
| | |
| | |
| | |
|
|
| | |
Bayerische Motoren Werke AG | | |
| | |
| | |
| | |
| | |
| | |
| | |
| | |
|
|
| | |
|
|
China CITIC Bank Corp. Ltd., H Shares | | |
| | |
PetroChina Co. Ltd., H Shares | | |
| | |
|
|
Check Point Software Technologies Ltd. * | | |
|
|
Assicurazioni Generali SpA | | |
| | |
| | |
| | |
| | |
|
|
| | |
BayCurrent Consulting, Inc. | | |
| | |
Dai-ichi Life Holdings, Inc. | | |
| | |
| | |
| | |
| | |
| | |
| | |
| | |
Japan Exchange Group, Inc. | | |
Japan Post Insurance Co. Ltd. | | |
| | |
| | |
| | |
| | |
| | |
60
Schwab Active Equity Funds | Annual Report
Schwab International Core Equity Fund
Portfolio Holdings as of October 31, 2023 (continued)
| | |
| | |
Nippon Building Fund, Inc. | | |
NIPPON EXPRESS HOLDINGS, Inc. | | |
| | |
Ono Pharmaceutical Co. Ltd. | | |
| | |
| | |
Recruit Holdings Co. Ltd. | | |
Renesas Electronics Corp. * | | |
Sega Sammy Holdings, Inc. | | |
| | |
| | |
Shin-Etsu Chemical Co. Ltd. | | |
| | |
| | |
Sumitomo Mitsui Financial Group, Inc. | | |
Suntory Beverage & Food Ltd. | | |
| | |
| | |
| | |
| | |
| | |
| | |
|
|
| | |
| | |
Koninklijke Ahold Delhaize NV | | |
| | |
| | |
|
|
| | |
| | |
| | |
|
|
| | |
| | |
Samsung Electronics Co. Ltd. | | |
| | |
|
|
Jardine Cycle & Carriage Ltd. | | |
Jardine Matheson Holdings Ltd. | | |
| | |
|
|
Banco Bilbao Vizcaya Argentaria SA | | |
| | |
| | |
Industria de Diseno Textil SA | | |
| | |
|
|
| | |
| | |
| | |
| | |
| | |
| | |
|
| | |
|
| | |
| | |
| | |
| | |
| | |
| | |
| | |
|
|
Taiwan Semiconductor Manufacturing Co. Ltd. | | |
|
|
| | |
| | |
| | |
| | |
| | |
| | |
| | |
| | |
Hikma Pharmaceuticals PLC | | |
| | |
| | |
| | |
| | |
Land Securities Group PLC | | |
Legal & General Group PLC | | |
| | |
| | |
| | |
| | |
| | |
| | |
| | |
| | |
Total Common Stocks
(Cost $451,174,280) | |
Schwab Active Equity Funds | Annual Report61
Schwab International Core Equity Fund
Portfolio Holdings as of October 31, 2023 (continued)
| | |
SHORT-TERM INVESTMENTS 2.6% OF NET ASSETS |
|
|
State Street Institutional U.S. Government Money Market Fund, Premier Class 5.30% (b) | | |
State Street Institutional U.S. Government Money Market Fund, Premier Class 5.30% (b)(c) | | |
| | |
Total Short-Term Investments
(Cost $13,386,612) | |
Total Investments in Securities
(Cost $464,560,892) | |
| Non-income producing security. |
| All or a portion of this security is on loan. Securities on loan were valued at $3,370,826. |
| The rate shown is the annualized 7-day yield. |
| Security purchased with cash collateral received for securities on loan. |
| Global Depositary Receipt |
The following is a summary of the inputs used to value the fund’s investments as of October 31, 2023 (see financial note 2(a) for additional information):
| QUOTED PRICES IN
ACTIVE MARKETS FOR
IDENTICAL ASSETS
(LEVEL 1) | OTHER SIGNIFICANT
OBSERVABLE INPUTS
(LEVEL 2) | SIGNIFICANT
UNOBSERVABLE INPUTS
(LEVEL 3) | |
| | | | |
| | | | |
| | | | |
| | | | |
| | | | |
| | | | |
| | | | |
| | | | |
| | | | |
| As categorized in the Portfolio Holdings. |
62
Schwab Active Equity Funds | Annual Report
Schwab International Core Equity Fund
Statement of Assets and Liabilities
As of October 31, 2023
|
Investments in securities, at value - unaffiliated (cost $464,560,892) including securities on loan of $3,370,826 | | |
Foreign currency, at value (cost $640,180) | | |
| | |
| | |
| | |
| | |
Income from securities on loan | | |
| | |
| | |
|
|
Collateral held for securities on loan | | |
| | |
Investment adviser and administrator fees | | |
IRS compliance fee for foreign withholding tax claims | | |
| | |
| | |
| | |
| | |
| | |
|
|
Capital received from investors | | |
| | |
| | |
Schwab Active Equity Funds | Annual Report63
Schwab International Core Equity Fund
Statement of Operations
For the period November 1, 2022 through October 31, 2023 |
|
Dividends received from securities - unaffiliated (net of foreign withholding tax of $1,570,723) | | |
IRS compliance fee for foreign withholding tax claims | | |
| | |
| | |
|
|
Investment adviser and administrator fees | | |
| | |
| | |
| | |
Portfolio accounting fees | | |
| | |
| | |
| | |
Independent trustees’ fees | | |
| | |
| | |
| | |
| | |
| | |
|
REALIZED AND UNREALIZED GAINS (LOSSES) |
Net realized gains on sales of securities - unaffiliated | | |
Net realized losses on foreign currency transactions | | |
| | |
Net change in unrealized appreciation (depreciation) on securities - unaffiliated | | |
Net change in unrealized appreciation (depreciation) on foreign currency translations | | |
Net change in unrealized appreciation (depreciation) | | |
Net realized and unrealized gains | | |
Increase in net assets resulting from operations | | |
| Includes professional fees of $4,179 associated with the filing of foreign withholding tax claims in the European Union and $20,000 associated with preparing the filing of a closing agreement with the IRS, fees are deemed to be non-contingent and non-routine expenses of the fund (see financial notes 2(d) and 4 for additional information). |
64
Schwab Active Equity Funds | Annual Report
Schwab International Core Equity Fund
Statement of Changes in Net Assets
For the current and prior report periods
|
| | |
| | | |
Net realized gains (losses) | | | |
Net change in unrealized appreciation (depreciation) | | | |
Increase (decrease) in net assets resulting from operations | | | |
|
DISTRIBUTIONS TO SHAREHOLDERS |
| | | |
TRANSACTIONS IN FUND SHARES |
| | |
| | | | | |
| | | | | |
| | | | | |
| | | | | |
Net transactions in fund shares | | | | | |
|
SHARES OUTSTANDING AND NET ASSETS |
| | |
| | | | | |
| | | | | |
Total increase (decrease) | | | | | |
| | | | | |
Schwab Active Equity Funds | Annual Report65
Schwab Active Equity Funds
1. Business Structure of the Funds:
Each of the funds in this report is a series of Schwab Capital Trust (the trust), a no-load, open-end management investment company. The trust is organized as a Massachusetts business trust and is registered under the Investment Company Act of 1940, as amended (the 1940 Act). The list below shows all the funds in the trust as of the end of the period, including the funds discussed in this report, which are highlighted:
|
| |
Schwab Dividend Equity Fund | |
Schwab Large-Cap Growth Fund | |
Schwab Small-Cap Equity Fund | |
| |
Schwab International Core Equity Fund | Schwab Fundamental US Large Company Index Fund |
Schwab S&P 500 Index Fund | Schwab Fundamental US Small Company Index Fund |
Schwab Small-Cap Index Fund® | Schwab Fundamental International Large Company Index Fund |
Schwab Total Stock Market Index Fund® | Schwab Fundamental International Small Company Index Fund |
Schwab U.S. Large-Cap Growth Index Fund | Schwab Fundamental Emerging Markets Large Company Index Fund |
Schwab U.S. Large-Cap Value Index Fund | Schwab Fundamental Global Real Estate Index Fund |
Schwab U.S. Mid-Cap Index Fund | Schwab Target 2010 Index Fund |
Schwab International Index Fund® | Schwab Target 2015 Index Fund |
Schwab MarketTrack All Equity Portfolio™ | Schwab Target 2020 Index Fund |
Schwab MarketTrack Growth Portfolio™ | Schwab Target 2025 Index Fund |
Schwab MarketTrack Balanced Portfolio™ | Schwab Target 2030 Index Fund |
Schwab MarketTrack Conservative Portfolio™ | Schwab Target 2035 Index Fund |
Schwab International Opportunities Fund | Schwab Target 2040 Index Fund |
| Schwab Target 2045 Index Fund |
| Schwab Target 2050 Index Fund |
| Schwab Target 2055 Index Fund |
| Schwab Target 2060 Index Fund |
| Schwab Target 2065 Index Fund |
| Schwab Monthly Income Fund - Target Payout |
| Schwab Monthly Income Fund - Flexible Payout |
| Schwab Monthly Income Fund - Income Payout |
Each fund in this report offers one share class. Shares are bought and sold at closing net asset value per share (NAV), which is the price for all outstanding shares of a fund. Each share has a par value of 1/1,000 of a cent, and the funds’ Board of Trustees (the Board) may authorize the issuance of as many shares as necessary.
Each fund maintains its own account for purposes of holding assets and accounting, and is considered a separate entity for tax purposes. Within its account, each fund may also keep certain assets in segregated accounts, as required by securities law. The "Fund Complex" includes The Charles Schwab Family of Funds, Schwab Capital Trust, Schwab Investments, Schwab Annuity Portfolios, Schwab Strategic Trust and Laudus Trust.
2. Significant Accounting Policies:The following is a summary of the significant accounting policies the funds use in their preparation of financial statements. The funds follow the investment company accounting and reporting guidance of the Financial Accounting Standards Board (FASB) Accounting Standard Codification Topic 946 Financial Services — Investment Companies. The accounting policies are in conformity with accounting principles generally accepted in the United States of America (GAAP).
The funds may invest in certain mutual funds and exchange-traded funds (ETFs), which are referred to as "underlying funds". For more information about the underlying funds’ operations and policies, please refer to those funds’ semiannual and annual reports, which are filed with the U.S. Securities and Exchange Commission (SEC) and are available on the SEC’s website at www.sec.gov.
66
Schwab Active Equity Funds | Annual Report
Schwab Active Equity Funds
Financial Notes (continued)
2. Significant Accounting Policies (continued):
(a) Security Valuation:
Pursuant to Rule 2a-5 under the 1940 Act, the Board has designated authority to a Valuation Designee, the funds’ investment adviser, to make fair valuation determinations under adopted procedures, subject to Board oversight. The investment adviser has formed a Pricing Committee to administer the pricing and valuation of portfolio securities and other assets and liabilities as well as to ensure that prices used for internal purposes or provided by third parties reasonably reflect fair value. The Valuation Designee may utilize independent pricing services, quotations from securities and financial instrument dealers and other market sources to determine fair value.
Securities held in the funds’ portfolio are valued every business day. The following valuation policies and procedures are used by the Valuation Designee to value various types of securities:
• Securities traded on an exchange or over-the-counter: Traded securities are valued at the closing value for the day, or, on days when no closing value has been reported, at the mean of the most recent bid and ask quotes. Securities that are primarily traded on foreign exchanges are valued at the official closing price or the last sales price on the exchange where the securities are principally traded with these values then translated into U.S. dollars at the current exchange rate, unless these securities are fair valued as discussed below.
• Foreign equity security fair valuation: The Valuation Designee has adopted procedures to fair value foreign equity securities that are traded in markets that close prior to the valuation of a fund’s holdings. By fair valuing securities whose prices may have been affected by events occurring after the close of trading, the Valuation Designee seeks to establish prices that investors might expect to realize upon the current sales of these securities. This methodology is designed to deter “arbitrage” market timers, who seek to exploit delays between the change in the value of a fund’s portfolio holdings and the NAV of a fund’s shares and seeks to help ensure that the prices at which a fund’s shares are purchased and redeemed are fair and do not result in dilution of shareholder interest or other harm to shareholders. When fair value pricing is used at the open or close of a reporting period, it may cause a temporary divergence between the return of a fund and that of its comparative index or benchmark.
• Futures contracts: Futures contracts are valued at their settlement prices as of the close of their exchanges.
• Mutual funds: Mutual funds are valued at their respective NAVs.
• Securities for which no quoted value is available: The Valuation Designee has adopted procedures to fair value a fund’s securities when market prices are not “readily available” or are unreliable. For example, a security may be fair valued when it’s de-listed or its trading is halted or suspended; when a security’s primary pricing source is unable or unwilling to provide a price; or when a security’s primary trading market is closed during regular market hours. Fair value determinations are made in good faith in accordance with adopted valuation procedures. The Valuation Designee considers a number of factors, including unobservable market inputs, when arriving at fair value. The Valuation Designee may employ methods such as the review of related or comparable assets or liabilities, related market activities, recent transactions, market multiples, book values, transactional back-testing, disposition analysis and other relevant information. Due to the subjective and variable nature of fair value pricing, there can be no assurance that a fund could obtain the fair value assigned to the security upon the sale of such security.
In accordance with the authoritative guidance on fair value measurements and disclosures under GAAP, the funds disclose the fair value of their investments in a hierarchy that prioritizes the significant inputs to valuation methods used to measure the fair value. The hierarchy gives the highest priority to valuations based upon unadjusted quoted prices in active markets for identical assets or liabilities (Level 1 measurements) and the lowest priority to valuations based upon unobservable inputs that are significant to the valuation (Level 3 measurements). If inputs used to measure the financial instruments fall within different levels of the hierarchy, the categorization is based on the lowest level input that is significant to the valuation. If it is determined that either the volume and/or level of activity for an asset or liability has significantly decreased (from normal conditions for that asset or liability) or price quotations or observable inputs are not associated with orderly transactions, increased analysis and the Valuation Designee’s judgment will be required to estimate fair value.
The three levels of the fair value hierarchy are as follows:
• Level 1 — quoted prices in active markets for identical investments — Investments whose values are based on quoted market prices in active markets. These generally include active listed equities, mutual funds, ETFs and futures contracts. Mutual funds and ETFs are classified as Level 1 prices, without consideration to the classification level of the underlying securities held which could be Level 1, Level 2 or Level 3 in the fair value hierarchy.
Schwab Active Equity Funds | Annual Report67
Schwab Active Equity Funds
Financial Notes (continued)
2. Significant Accounting Policies (continued):
• Level 2 — other significant observable inputs (including quoted prices for similar securities, interest rates, prepayment speeds, credit risk, etc.) — Investments that trade in markets that are not considered to be active, but whose values are based on quoted market prices, dealer quotations or valuations provided by alternative pricing sources supported by observable inputs are classified as Level 2 prices. These generally include U.S. government and sovereign obligations, most government agency securities, investment-grade corporate bonds, certain mortgage products, less liquid listed equities, and state, municipal and provincial obligations. In addition, international securities whose markets close hours before the valuation of a fund’s holdings may require fair valuations due to significant movement in the U.S. markets occurring after the daily close of foreign markets. The Valuation Designee has approved a vendor that calculates fair valuations of international equity securities based on a number of factors that appear to correlate to the movements in the U.S. markets.
• Level 3 — significant unobservable inputs (including the Valuation Designee’s assumptions in determining the fair value of investments) — Investments whose values are classified as Level 3 prices have significant unobservable inputs, as they may trade infrequently or not at all. When observable prices are not readily available for these securities, one or more valuation methods are used for which sufficient and reliable data is available. The inputs used in estimating the value of Level 3 prices may include the original transaction price, quoted prices for similar securities or assets in active markets, completed or pending third-party transactions in the underlying investment or comparable issuers, and changes in financial ratios or cash flows. Level 3 prices may also be adjusted to reflect illiquidity and/or non-transferability, with the amount of such discount estimated in the absence of market information. Assumptions used due to the lack of observable inputs may significantly impact the resulting fair value and therefore a fund’s results of operations.
The inputs or methodology used for valuing securities are not necessarily an indication of the risk associated with investing in those securities.
The levels associated with valuing the funds’ investments as of October 31, 2023, are disclosed in each fund’s Portfolio Holdings.
(b) Accounting Policies for certain Portfolio Investments (if held):
Futures Contracts: Futures contracts are instruments that represent an agreement between two parties that obligates one party to buy, and the other party to sell, specific instruments at an agreed upon price on a stipulated future date. A fund must give the broker a deposit of cash and/or securities (initial margin) whenever it enters into a futures contract. The amount of the deposit may vary from one contract to another. Subsequent payments (variation margin) are made or received by a fund depending on the daily fluctuations in the value of the futures contract and are accounted for as unrealized appreciation or depreciation until the contract is closed, at which time the gains or losses are realized. Futures contracts are traded publicly on exchanges, and their value may change daily.
Securities Lending: Under the trust’s Securities Lending Program, a fund (lender) may make short-term loans of its securities to another party (borrower) to generate additional revenue for the fund. The borrower pledges collateral in the form of cash, securities issued or fully guaranteed by the U.S. government or foreign governments, or letters of credit issued by a bank. Collateral at the individual loan level is required to be maintained on a daily marked-to-market basis in an amount at least equal to the current value of the securities loaned. The lending agent provides a fund with indemnification against borrower default (the borrower fails to return the security on loan) reducing the risk of loss as a result of default. The cash collateral of securities loaned is currently invested in money market portfolios operating pursuant to Rule 2a-7 under the 1940 Act. Each fund bears the risk of loss with respect to the investment of cash collateral. The terms of the securities lending agreement allow the funds or the lending agent to terminate any loan at any given time and the securities must be returned within the earlier of the standard trade settlement period or the specified time period under the relevant securities lending agreement. Securities lending income, as disclosed in each fund’s Statement of Operations, if applicable, represents the income earned from the investment of the cash collateral plus any fees paid by borrowers, less the fees paid to the lending agent and broker rebates which are subject to adjustments pursuant to the securities lending agreement. On loans not collateralized by cash, a fee is received from the borrower, and is allocated between a fund and the lending agent. The aggregate fair value of securities loaned will not at any time exceed one-third of the total assets of a fund, including collateral received from the loan. Securities lending fees paid to the unaffiliated lending agents start at 9% of gross lending revenue, with subsequent breakpoints to a low of 5%. In this context, the gross lending revenue equals the income received from the investment of cash collateral and fees paid by borrowers less any rebates paid to the borrowers. Any expenses charged by the cash collateral fund are in addition to these fees. All remaining revenue is retained by the fund, as applicable. No portion of lending revenue is paid to or retained by the investment adviser or any of its affiliates.
As of October 31, 2023, Schwab Small-Cap Equity Fund and Schwab International Core Equity Fund had securities on loan, all of which were classified as common stocks. The value of the securities on loan and the related collateral as of October 31, 2023, are disclosed in the fund’s Portfolio Holdings and Statement of Assets and Liabilities.
68
Schwab Active Equity Funds | Annual Report
Schwab Active Equity Funds
Financial Notes (continued)
2. Significant Accounting Policies (continued):
Cash Investments: The funds, except for Schwab Core Equity Fund and Schwab International Core Equity Fund, may invest a portion of their assets in cash. Cash includes cash bank balances in an interest-bearing demand deposit account with maturity on demand by the funds.
Passive Foreign Investment Companies: Certain funds may own shares in certain foreign corporations that meet the Internal Revenue Code, as amended, definition of a Passive Foreign Investment Company (PFIC). The funds may elect for tax purposes to mark-to-market annually the shares of each PFIC lot held and would be required to distribute as ordinary income to shareholders any such marked-to-market gains (as well as any gains realized on sale).
Central Securities Depositories Regulation: The Central Securities Depositories Regulation (CSDR) introduced measures for the authorization and supervision of European Union Central Security Depositories and created a common set of prudential, organizational, and conduct of business standards at a European level. CSDR is designed to support securities settlement and operational aspects of securities settlement, including the provision of shorter settlement periods; mandatory buy-ins; and cash penalties, to prevent and address settlement fails. CSDR measures are aimed to prevent settlement fails by ensuring that all transaction details are provided to facilitate settlement, as well as further incentivizing timely settlement by imposing cash penalty fines and buy-ins. The Schwab Dividend Equity Fund, Schwab Health Care Fund and Schwab International Core Equity Fund may be subject to pay cash penalties and may also receive cash penalties with certain counterparties in instances where there are settlement fails. These cash penalties are included in net realized gains (losses) on sales of securities in each fund’s Statement of Operations, if any.
(c) Security Transactions:
Security transactions are recorded as of the date the order to buy or sell the security is executed. Realized gains and losses from security transactions are based on the identified costs of the securities involved.
Assets and liabilities denominated in foreign currencies are reported in U.S. dollars. For assets and liabilities held on a given date, the dollar value is based on market exchange rates in effect on that date. Transactions involving foreign currencies, including purchases, sales, income receipts and expense payments, are calculated using exchange rates in effect on the transaction date. Realized foreign exchange gains or losses arise from sales of foreign currencies, currency gains or losses realized between the trade and settlement dates on securities transactions and the differences between the recorded amounts of dividends, interest, and foreign withholding taxes and the U.S. dollar equivalent of the amounts actually received or paid. Net unrealized foreign exchange appreciation or depreciation arises from changes in foreign exchange rates on foreign denominated assets and liabilities other than investments in securities held at the end of the reporting period. These realized and unrealized foreign exchange gains or losses are reported in foreign currency transactions or translations, if any, in each fund’s Statement of Operations. The funds do not isolate the portion of the fluctuations on investments resulting from changes in foreign currency exchange rates from the fluctuations in market prices of investments held. Such fluctuations are included with the net realized and unrealized gain or loss from investments, if any.
Gains realized by the funds on the sale of securities in certain foreign countries may be subject to non-U.S. taxes. In those instances, the funds record a liability based on unrealized gains to provide for potential non-U.S. taxes payable upon the sale of these securities.
When a fund closes out a futures contract position, it calculates the difference between the value of the position at the beginning and at the end of the contract, and records a realized gain or loss accordingly.
(d) Investment Income:
Interest income is recorded as it accrues. Dividends, in the form of cash or non-cash income such as in the form of additional securities, and distributions from portfolio securities and underlying funds are recorded on the date they are effective (the ex-dividend date), although the funds record certain foreign security dividends on the date the ex-dividend date is confirmed. Any distributions from underlying funds are recorded in accordance with the character of the distributions as designated by the underlying funds.
Income received from foreign sources may result in withholding tax. Withholding taxes are accrued at the same time as the related income if the tax rate is fixed and known, unless a tax withheld is reclaimable from the local tax authorities in which case it is recorded as receivable. If the tax rate is not known or estimable, such expense or reclaim receivable is recorded when the net proceeds are received.
Schwab Active Equity Funds | Annual Report69
Schwab Active Equity Funds
Financial Notes (continued)
2. Significant Accounting Policies (continued):
The Schwab International Core Equity Fund filed claims to recover taxes previously withheld in certain European Union countries on the basis that those countries had purportedly violated certain provisions in the Treaty on the Functioning of the European Union. These filings are subject to various administrative and judicial proceedings within these countries, and all professional fees associated with these filings have been paid by the investment adviser. The professional fees related to European Union foreign withholding tax claims are non-contingent and non-routine fees which are subject to repayment to the investment adviser (see financial note 4 for additional information).
For U.S. income tax purposes, European Union reclaims received reduce the amounts of foreign taxes that the fund passes through to its shareholders. If European Union reclaims received exceed foreign withholding taxes paid, the Schwab International Core Equity Fund will evaluate the requirements for entering into a closing agreement with the Internal Revenue Service (IRS) to address any prior years’ U.S. income tax liabilities attributable to fund shareholders resulting from the recovery of foreign taxes. The closing agreement would result in the fund paying an IRS compliance fee, on behalf of its shareholders, representing the estimated tax savings generated from foreign tax credits claimed by fund shareholders on their tax returns in prior years. During the period ended October 31, 2023, it was determined that the Schwab International Core Equity Fund is expected to seek a closing agreement with the IRS.
The Schwab International Core Equity Fund will pay a compliance fee to the IRS, on behalf of its shareholders, representing the estimated tax savings generated from foreign tax credits claimed by fund shareholders on their tax returns in prior years. The Schwab International Core Equity Fund has recorded contra income for the estimated IRS compliance fee for foreign withholding tax claims and a liability for professional fees associated with the filing of the closing agreement with the IRS, which is disclosed in the fund’s Statement of Operations and Statement of Assets and Liabilities. The actual IRS compliance fee may differ from the estimate and that difference may be material. There were professional fees related to the preparation of the closing agreement to be filed with the IRS, those fees are non-routine expenses and are paid by the Schwab International Core Equity Fund and not the adviser, during the period ended October 31, 2023, those fees were $20,000, as shown as Professional fees in the fund’s Statement of Operations.
(e) Expenses:
Expenses that are specific to a fund are charged directly to the fund. Expenses that are common to more than one fund in the trusts generally are allocated among those funds in proportion to their average daily net assets.
(f) Distributions to Shareholders:
The funds make distributions from net investment income, if any, once a year, with the exception of Schwab Dividend Equity Fund which typically pays quarterly distributions. The funds make distributions from net realized capital gains, if any, once a year. To receive a distribution, you must be a registered shareholder on the record date. Distributions are paid to shareholders on the payable date.
(g) Accounting Estimates:
The accounting policies described in this report conform to GAAP. Notwithstanding this, shareholders should understand that in order to follow these principles, fund management has to make estimates and assumptions that affect the information reported in the financial statements. It’s possible that once the results are known, they may turn out to be different from these estimates and these differences may be material.
(h) Federal Income Taxes:
The funds intend to meet federal income and excise tax requirements for regulated investment companies under subchapter M of the Internal Revenue Code, as amended. Accordingly, the funds distribute substantially all of their net investment income and net realized capital gains, if any, to their respective shareholders each year. As long as a fund meets the tax requirements, it is not required to pay federal income tax.
(i) Foreign Taxes:
The funds may be subject to foreign taxes (a portion of which may be reclaimable) on income, corporate events, foreign currency exchanges and capital gains on investments. All foreign taxes are recorded in accordance with the applicable foreign tax regulations and rates that exist in foreign markets in which the funds invest. These foreign taxes, if any, are paid by the funds and are disclosed in each fund’s Statement of Operations. Foreign taxes accrued as of October 31, 2023, if any, are reflected in each fund’s Statement of Assets and Liabilities.
70
Schwab Active Equity Funds | Annual Report
Schwab Active Equity Funds
Financial Notes (continued)
2. Significant Accounting Policies (continued):
(j) Indemnification:
Under the funds’ organizational documents, the officers and trustees are indemnified against certain liabilities arising out of the performance of their duties to the funds. In addition, in the normal course of business the funds enter into contracts with their vendors and others that provide general indemnifications. The funds’ maximum exposure under these arrangements is unknown as this would involve future claims that may be made against the funds. However, based on experience, the funds expect the risk of loss attributable to these arrangements to be remote.
(k) Regulatory Update:
Effective January 24, 2023, the SEC adopted rule and form amendments to require mutual funds and ETFs to transmit concise and visually engaging streamlined annual and semiannual reports to shareholders that highlight key information deemed important for retail investors to assess and monitor their fund investments. Other information, including financial statements, will no longer appear in a streamlined shareholder report but must be available online, delivered free of charge upon request, and filed on a semiannual basis on Form N-CSR. The rule and form amendments have a compliance date of July 24, 2024. At this time, management is evaluating the impact of these rule and form amendment changes on the content of the current shareholder report and the newly created annual and semiannual streamlined shareholder reports.
3. Risk Factors:Investing in the funds may involve certain risks, as discussed in the funds’ prospectus, including, but not limited to, those described below. Any of these risks could cause an investor to lose money.
Market Risk. Financial markets rise and fall in response to a variety of factors, sometimes rapidly and unpredictably. Markets may be impacted by economic, political, regulatory and other conditions, including economic sanctions and other government actions. In addition, the occurrence of global events, such as war, terrorism, environmental disasters, natural disasters and epidemics, may also negatively affect the financial markets. As with any investment whose performance is tied to these markets, the value of an investment in a fund will fluctuate, which means that an investor could lose money over short or long periods.
Equity Risk. The prices of equity securities rise and fall daily. These price movements may result from factors affecting individual companies, industries or the securities market as a whole. In addition, equity markets tend to move in cycles, which may cause stock prices to fall over short or extended periods of time.
Management Risk. The investment techniques, risk analyses and portfolio optimization process the investment adviser may use in constructing the fund’s portfolio do not assure successful investment outcomes. Securities selected with the assistance of the investment process may be negatively impacted by factors or events not foreseen in developing the process. The portfolio optimization process and Schwab Equity Ratings and Schwab Equity International Ratings may not adequately take into account certain factors or may rely on inaccurate data inputs, may contain design flaws or faulty assumptions, and may rely on incomplete or inaccurate data inputs. The fund’s investment adviser may make investment decisions using historical information that may not produce the desired results in the future. As a result, a fund may have a lower return than if it were managed using another process or strategy.
Market Capitalization Risk. Securities issued by companies of different market capitalizations tend to go in and out of favor based on market and economic conditions. During a period when securities of a particular market capitalization fall behind other types of investments, a fund’s performance could be impacted.
Large-Cap Company Risk. Large-cap companies are generally more mature and the securities issued by these companies may not be able to reach the same levels of growth as the securities issued by small- or mid-cap companies.
Mid-Cap Company Risk. Mid-cap companies may be more vulnerable to adverse business or economic events than larger, more established companies and the value of securities issued by these companies may move sharply.
Small-Cap Company Risk. Securities issued by small-cap companies may be riskier than those issued by larger companies, and their prices may move sharply, especially during market upturns and downturns.
Growth Investing Risk. Growth stocks can be volatile. Growth companies usually invest a high portion of earnings in their businesses and may lack the dividends of value stocks that can cushion stock prices in a falling market. The prices of growth stocks are based largely on projections of the issuer’s future earnings and revenues. If a company’s earnings or revenues fall short of expectations, its stock price may fall dramatically. Growth stocks may also be more expensive relative to their earnings or assets compared to value or other stocks.
Schwab Active Equity Funds | Annual Report71
Schwab Active Equity Funds
Financial Notes (continued)
3. Risk Factors (continued):
Dividend Paying Stock Risk. To the extent that a fund invests in dividend paying stocks, the fund’s performance will correlate with the performance of the dividend paying stock segment of the stock market, and the fund may underperform funds that do not limit their investments to dividend paying stocks. If stocks held by a fund reduce or stop paying dividends, the fund’s ability to generate income may be affected.
Derivatives Risk. The principal type of derivative used by a fund is a futures contract. A futures contract is an agreement to buy or sell a financial instrument at a specific price on a specific day. The use of derivatives that are subject to regulation by the Commodity Futures Trading Commission (CFTC), could cause a fund to become a commodity pool, which would require the fund to comply with certain CFTC rules. A fund’s use of derivative instruments involves risks different from, or possibly greater than, the risks associated with investing directly in securities and other traditional investments. Certain of these risks, such as liquidity risk, market risk and management risk, are discussed elsewhere in this section. A fund’s use of derivatives is also subject to lack of availability risk, counterparty risk, leverage risk, valuation risk, correlation risk and tax risk. Lack of availability risk is the risk that suitable derivative transactions may not be available in all circumstances for risk management or other purposes. Counterparty risk is the risk that the counterparty to a derivatives transaction may not fulfill its obligations either because the financial condition of the counterparty declines, or because the counterparty is otherwise unable or unwilling to perform under the contract. Leverage risk is the risk that a small percentage of assets invested in derivatives can have a disproportionately large impact on a fund. Valuation risk is the risk that a particular derivative may be valued incorrectly. Correlation risk is the risk that changes in the value of the derivative may not correlate perfectly with the underlying asset, rate or index. Tax risk is the risk that the use of derivatives may cause a fund to realize higher amounts of short-term capital gains. A fund’s use of derivatives could reduce the fund’s performance, increase its volatility, and could cause the fund to lose more than the initial amount invested. The fund’s use of derivatives also could create a risk of counterparty default under certain transactions, risks that the fund would need to liquidate portfolio positions when it may not be advantageous to do so in order to meet margin and payment obligations, and legal risks relating to insufficient documentation, insufficient capacity or authority of a counterparty, or legality or enforceability of a contract.
Liquidity Risk. A fund may be unable to sell certain securities, such as illiquid securities, readily at a favorable time or price, or the fund may have to sell them at a loss.
Exchange-Traded Fund (ETF) Risk. When a fund invests in an ETF, it will bear a proportionate share of the ETF’s expenses. In addition, lack of liquidity in the market for an ETF’s shares can result in its value being more volatile than the underlying portfolio of securities.
REITs Risk. A fund’s investments in real estate investment trusts (REITs) will be subject to the risks associated with the direct ownership of real estate, including fluctuations in the value of underlying properties, defaults by borrowers or tenants, changes in interest rates and risks related to general or local economic conditions. REITs are also subject to certain additional risks; for example, REITs are dependent upon specialized management skills and cash flows, and may have their investments in relatively few properties, a small geographic area or a single property type. Failure of a company to qualify as a REIT under federal tax law may have adverse consequences on a fund. In addition, REITs have their own expenses, and a fund will bear a proportionate share of those expenses.
Foreign Investment Risk. A fund’s investments in securities of foreign issuers involve certain risks that may be greater than those associated with investments in securities of U.S. issuers. These include risks of adverse changes in foreign economic, political, regulatory and other conditions; changes in currency exchange rates or exchange control regulations (including limitations on currency movements and exchanges); the imposition of economic sanctions or other government restrictions; differing accounting, auditing, financial reporting and legal standards and practices; differing securities market structures; and higher transaction costs. These risks may negatively impact the value or liquidity of a fund’s investments and could impair the fund’s ability to meet its investment objective or invest in accordance with its investment strategy. There is a risk that investments in securities denominated in, and/or receiving revenues in, foreign currencies will decline in value relative to the U.S. dollar. Foreign securities may also include American Depositary Receipts (ADRs), Global Depositary Receipts (GDRs) and European Depositary Receipts (EDRs), which may be less liquid than the underlying shares in their primary trading market, and GDRs in particular, many of which are issued by companies in emerging markets, may be more volatile. To the extent a fund’s investments in a single country or a limited number of countries represent a large percentage of the fund’s assets, the fund’s performance may be adversely affected by the economic, political, regulatory and social conditions in those countries, and the fund’s price may be more volatile than the price of a fund that is geographically diversified.
Emerging Markets Risk. Emerging market countries may be more likely to experience political turmoil or rapid changes in market or economic conditions than more developed countries. Emerging market countries often have less uniformity in accounting, auditing, financial reporting and recordkeeping requirements and greater risk associated with the custody of securities. In addition, the
72
Schwab Active Equity Funds | Annual Report
Schwab Active Equity Funds
Financial Notes (continued)
3. Risk Factors (continued):
financial stability of issuers (including governments) in emerging market countries may be more precarious than in developed countries. As a result, there may be an increased risk of illiquidity and price volatility associated with a fund’s investments in emerging market countries, which may be magnified by currency fluctuations relative to the U.S. dollar, and, at times, it may be difficult to value such investments.
Concentration Risk. The investments of certain funds are concentrated in issuers doing business in the same sector, and therefore, the companies in which a fund invests will be affected by many of the same factors, such as legislative or regulatory changes, intense competition for market share and other competitive challenges. In addition, a fund is subject to the risks that stocks of these companies may underperform other segments of the equity market or stock market as a whole and are likely to have above-average volatility.
Securities Lending Risk. Securities lending involves the risk of loss of rights in, or delay in recovery of, the loaned securities if the borrower fails to return the security loaned or becomes insolvent.
Portfolio Turnover Risk. The funds buy and sell portfolio securities actively. This may cause a fund’s portfolio turnover rate and transaction costs to rise, which may lower a fund’s performance and may increase the likelihood of capital gains distributions.
Please refer to the funds’ prospectus for a more complete description of the principal risks of investing in the funds.
4. Affiliates and Affiliated Transactions:Investment Adviser
Charles Schwab Investment Management, Inc., dba Schwab Asset Management, a wholly owned subsidiary of The Charles Schwab Corporation, serves as each fund’s investment adviser and administrator pursuant to the Investment Advisory and Administration Agreement between the investment adviser and the trust.
For its advisory and administrative services to the funds, the investment adviser is entitled to receive an annual fee, payable monthly, based on a percentage of each fund’s average daily net assets as follows:
% OF AVERAGE DAILY NET ASSETS | | SCHWAB DIVIDEND EQUITY FUND | SCHWAB LARGE-CAP GROWTH FUND | SCHWAB SMALL-CAP EQUITY FUND | SCHWAB INTERNATIONAL CORE EQUITY FUND |
| | | | | |
% OF AVERAGE DAILY NET ASSETS | |
| |
$500 million to $1 billion | |
| |
For the period ended October 31, 2023, the aggregate advisory fee paid to the investment adviser by the Schwab Health Care Fund was 0.53%, as a percentage of the fund’s average daily net assets.
Shareholder Servicing
The Board has adopted a Shareholder Servicing Plan (the Plan) on behalf of the funds. The Plan enables each fund to bear expenses relating to the provision by financial intermediaries, including Charles Schwab & Co., Inc. (Schwab), a broker-dealer affiliate of the investment adviser (together, service providers), of certain account maintenance, customer liaison and shareholder services to the current shareholders of the funds.
Pursuant to the Plan, each fund’s shares are subject to an annual shareholder servicing fee up to 0.25%. The shareholder servicing fee paid to a particular service provider is made pursuant to its written agreement with Schwab, as distributor of the funds (or, in the case of payments made to Schwab acting as a service provider, pursuant to Schwab’s written agreement with the funds). Payments under the Plan are made as described above without regard to whether the fee is more or less than the service provider’s actual cost of providing the services, and if more, such excess may be retained as profit by the service provider.
Schwab Active Equity Funds | Annual Report73
Schwab Active Equity Funds
Financial Notes (continued)
4. Affiliates and Affiliated Transactions (continued):
Expense Limitation
The investment adviser and its affiliates have made an additional agreement with the funds, for so long as the investment adviser serves as the investment adviser to the funds, in which the agreement may only be amended or terminated with the approval of the Board, to limit the total annual fund operating expenses charged, excluding interest, taxes and certain non-routine expenses (expense limitation). The below expense limitation also excludes paying acquired fund fees and expenses, which are indirect expenses incurred by the funds through their investments in underlying funds. The expense limitation as a percentage of average daily net assets is as follows:
| SCHWAB DIVIDEND EQUITY FUND | SCHWAB LARGE-CAP GROWTH FUND | SCHWAB SMALL-CAP EQUITY FUND | | SCHWAB INTERNATIONAL CORE EQUITY FUND |
| | | | | |
Investments from Affiliates
Certain funds in the Fund Complex may own shares of other funds in the Fund Complex. The table below reflects the percentages of shares of each fund in this report that are owned by other funds in the Fund Complex as of October 31, 2023, as applicable:
| |
| | SCHWAB SMALL-CAP EQUITY FUND | SCHWAB INTERNATIONAL CORE EQUITY FUND |
| | | |
| | | |
| | | |
| | | |
| | | |
| | | |
| | | |
| | | |
| | | |
| | | |
| | | |
| | | |
| | | |
Other Affiliated Transactions
The professional fees related to European Union foreign withholding tax claims discussed in financial note 2(d) are non-contingent and non-routine fees. The investment adviser agreed to pay these professional fees, on behalf of the Schwab International Core Equity Fund, subject to reimbursement by the fund to the extent the fund is able to successfully recover taxes withheld in the future.
During the period ended October 31, 2023, the professional fees related to the filing of foreign withholding claims incurred by the Schwab International Core Equity Fund and paid by the investment adviser were $4,179, as shown as Professional fees in the fund’s Statement of Operations.
During the period ended October 31, 2023, the Schwab International Core Equity Fund recovered previously withheld foreign taxes from Sweden. The payments received by Schwab International Core Equity Fund amounted to $455,245, and is recorded as Dividends received from securities — unaffiliated in the fund’s Statement of Operations. The investment adviser paid upfront professional fees associated with recovering these foreign taxes in the amount of $4,162, which has been reimbursed to the investment adviser by the Schwab International Core Equity Fund and is recorded as Dividends received from securities - unaffiliated in the fund’s Statement of Operations.
74
Schwab Active Equity Funds | Annual Report
Schwab Active Equity Funds
Financial Notes (continued)
4. Affiliates and Affiliated Transactions (continued):
As of October 31, 2023, the balance of professional fees related to foreign withholding tax claims subject to future reimbursement by the Schwab International Core Equity Fund to the investment adviser was $2,275.
No other amounts for additional foreign withholding tax claims are reflected in the financial statements due to the uncertainty surrounding the ultimate resolution of proceedings, the likelihood of receipt of these claims, and the potential timing of payment.
Interfund Borrowing and Lending
Pursuant to an exemptive order issued by the SEC, the funds may enter into interfund borrowing and lending transactions with other funds in the Fund Complex. All loans are for temporary or emergency purposes and the interest rate to be charged will be the average of the overnight repurchase agreement rate and the short-term bank loan rate. All loans are subject to numerous conditions designed to ensure fair and equitable treatment of all participating funds. The interfund lending facility is subject to the oversight and periodic review by the Board. The funds had no interfund borrowing or lending activity during the period.
5. Board of Trustees:The Board may include people who are officers and/or directors of the investment adviser or its affiliates. Federal securities law limits the percentage of such “interested persons” who may serve on a trust’s board, and the trust was in compliance with these limitations throughout the report period. The funds did not pay any of these interested persons for their services as trustees, but they did pay non-interested persons (independent trustees), as noted in each fund’s Statement of Operations. For information regarding the trustees, please refer to the Trustees and Officers table at the end of this report.
6. Borrowing from Banks:During the period, the funds were participants with other funds in the Fund Complex in a joint, syndicated, committed $1 billion line of credit (the Syndicated Credit Facility), which matured on September 28, 2023. On September 28, 2023, the Syndicated Credit Facility was amended to run for a new 364 day period with the line of credit amount remaining unchanged, maturing on September 26, 2024. Under the terms of the Syndicated Credit Facility, in addition to the interest charged on any borrowings by a fund, each fund paid a commitment fee of 0.15% per annum on the funds’ proportionate share of the unused portion of the Syndicated Credit Facility.
During the period, the funds were participants with other funds in the Fund Complex in a joint, unsecured, uncommitted $400 million line of credit (the Uncommitted Credit Facility), with State Street Bank and Trust Company, which matured on September 28, 2023. On September 28, 2023, the Uncommitted Credit Facility was amended to run for a new 364 day period with the line of credit amount remaining unchanged, maturing on September 26, 2024. Under the terms of the Uncommitted Credit Facility, each fund pays interest on the amount a fund borrows. There were no borrowings by any of the funds from either line of credit during the period.
The funds also have access to custodian overdraft facilities. A fund may have utilized the overdraft facility and incurred an interest expense, which is disclosed in each fund’s Statement of Operations, if any. The interest expense is determined based on a negotiated rate above the current Federal Funds Rate.
7. Derivatives:Certain funds entered into equity index futures contracts during the report period. The funds invested in futures contracts to equitize available cash. The value and variation margin for futures contracts held at October 31, 2023, if any, are presented in each fund’s Portfolio Holdings and Statement of Assets and Liabilities, respectively. The net realized gains (losses) and net change in unrealized appreciation (depreciation) on futures contracts, if any, are presented in each fund’s Statement of Operations. Refer to
Schwab Active Equity Funds | Annual Report75
Schwab Active Equity Funds
Financial Notes (continued)
7. Derivatives (continued):
financial note 2(b) for the funds’ accounting policies with respect to futures contracts and financial note 3 for disclosures concerning the risks of investing in futures contracts. During the period ended October 31, 2023, the month-end average notional amounts of futures contracts held by the funds and the month-end average number of contracts held were as follows:
| | |
| | |
Schwab Dividend Equity Fund | | |
Schwab Large-Cap Growth Fund | | |
Schwab Small-Cap Equity Fund | | |
| | |
Schwab International Core Equity Fund | | |
8. Purchases and Sales of Investment Securities:For the period ended October 31, 2023, purchases and sales of securities (excluding short-term obligations) were as follows:
| | |
| | |
Schwab Dividend Equity Fund | | |
Schwab Large-Cap Growth Fund | | |
Schwab Small-Cap Equity Fund | | |
| | |
Schwab International Core Equity Fund | | |
9. Federal Income Taxes:As of October 31, 2023, the tax basis cost of the funds’ investments and gross unrealized appreciation and depreciation were as follows:
| | GROSS UNREALIZED
APPRECIATION | GROSS UNREALIZED
DEPRECIATION | NET UNREALIZED
APPRECIATION
(DEPRECIATION) |
| | | | |
Schwab Dividend Equity Fund | | | | |
Schwab Large-Cap Growth Fund | | | | |
Schwab Small-Cap Equity Fund | | | | |
| | | | |
Schwab International Core Equity Fund | | | | |
| | | | |
| | | | |
76
Schwab Active Equity Funds | Annual Report
Schwab Active Equity Funds
Financial Notes (continued)
9. Federal Income Taxes (continued):
As of October 31, 2023, the components of distributable earnings on a tax basis were as follows:
| UNDISTRIBUTED
ORDINARY
INCOME | UNDISTRIBUTED
LONG-TERM
CAPITAL GAINS | NET UNREALIZED
APPRECIATION
(DEPRECIATION)
ON INVESTMENTS | NET OTHER UNREALIZED
APPRECIATION
(DEPRECIATION) | CAPITAL LOSS
CARRYFORWARDS
AND OTHER LOSSES | |
| | | | | | |
Schwab Dividend Equity Fund | | | | | | |
Schwab Large-Cap Growth Fund | | | | | | |
Schwab Small-Cap Equity Fund | | | | | | |
| | | | | | |
Schwab International Core Equity Fund | | | | | | |
The primary differences between book basis and tax basis unrealized appreciation or unrealized depreciation of investments are the tax deferral of losses on wash sales, the realization for tax purposes of unrealized appreciation or depreciation on futures contracts, the realization for tax purposes of unrealized appreciation on investments in PFICs and partnership investments. The tax cost of the funds’ investments, disclosed above, have been adjusted from their book amounts to reflect these unrealized appreciation or depreciation differences, as applicable.
Capital loss carryforwards have no expiration and may be used to offset future realized capital gains for federal income tax purposes. As of October 31, 2023, the funds had capital loss carryforwards available as follows:
| |
| |
Schwab Dividend Equity Fund | |
Schwab Large-Cap Growth Fund | |
Schwab Small-Cap Equity Fund | |
| |
Schwab International Core Equity Fund | |
For the fiscal year ended October 31, 2023 the Schwab International Core Equity Fund had capital loss carryforwards utilized of $5,001,738.
For tax purposes, late-year ordinary losses may be deferred and treated as occurring on the first day of the following fiscal year. For the fiscal year ended October 31, 2023, the Schwab Large-Cap Growth Fund had late-year ordinary losses deferred of $67,945.
The tax basis components of distributions paid during the current and prior fiscal years were as follows:
| CURRENT FISCAL YEAR END DISTRIBUTIONS | PRIOR FISCAL YEAR END DISTRIBUTIONS |
| | | | |
| | | | |
Schwab Dividend Equity Fund | | | | |
Schwab Large-Cap Growth Fund | | | | |
Schwab Small-Cap Equity Fund | | | | |
| | | | |
Schwab International Core Equity Fund | | | | |
Distributions paid to shareholders are based on net investment income and net realized gains determined on a tax basis, which may differ from net investment income and net realized gains for financial reporting purposes. These differences reflect the differing character of certain income items and net realized gains and losses for financial statement and tax purposes, and may result in reclassification among certain capital accounts in the financial statements. The funds may also designate a portion of the amount paid to redeeming shareholders as a distribution for tax purposes.
Permanent book and tax basis differences may result in reclassifications between components of net assets as required. The adjustments will have no impact on net assets or the results of operations.
Schwab Active Equity Funds | Annual Report77
Schwab Active Equity Funds
Financial Notes (continued)
9. Federal Income Taxes (continued):
As of October 31, 2023, management has reviewed the tax positions for open periods (for federal purposes, three years from the date of filing and for state purposes, four years from the date of filing) as applicable to the funds, and has determined that no provision for income tax is required in the funds’ financial statements. The funds recognize interest and penalties, if any, related to unrecognized tax benefits as income tax expense in each fund’s Statement of Operations. During the fiscal year ended October 31, 2023, the funds did not incur any interest or penalties.
10. Subsequent Events:Management has determined there are no subsequent events or transactions through the date the financial statements were issued that would have materially impacted the financial statements as presented.
78
Schwab Active Equity Funds | Annual Report
Schwab Active Equity Funds
Report of Independent Registered Public Accounting Firm
To the Board of Trustees of Schwab Capital Trust and Shareholders of Schwab Core Equity Fund, Schwab Dividend Equity Fund, Schwab Large-Cap Growth Fund, Schwab Small-Cap Equity Fund, Schwab Health Care Fund, and Schwab International Core Equity Fund:
Opinion on the Financial Statements and Financial Highlights
We have audited the accompanying statements of assets and liabilities, including the portfolio holdings, of Schwab Core Equity Fund, Schwab Dividend Equity Fund, Schwab Large-Cap Growth Fund, Schwab Small-Cap Equity Fund, Schwab Health Care Fund, and Schwab International Core Equity Fund (the “Funds”) six of the funds constituting Schwab Capital Trust, as of October 31, 2023, the related statements of operations for the year then ended, the statements of changes in net assets for each of the two years in the period then ended, the financial highlights for each of the four years in the period then ended, and the related notes. In our opinion, the financial statements and financial highlights present fairly, in all material respects, the financial position of each of the Funds constituting Schwab Capital Trust as of October 31, 2023, and the results of their operations for the year then ended, the changes in their net assets for each of the two years in the period then ended, and the financial highlights for each of the four years in the period then ended in conformity with accounting principles generally accepted in the United States of America. The financial highlights for the year ended October 31, 2019 were audited by other auditors, whose report, dated December 16, 2019, expressed an unqualified opinion on such financial highlights.
Basis for Opinion
These financial statements and financial highlights are the responsibility of the Funds’ management. Our responsibility is to express an opinion on the Funds’ financial statements and financial highlights based on our audits. We are a public accounting firm registered with the Public Company Accounting Oversight Board (United States) (PCAOB) and are required to be independent with respect to the Funds in accordance with the U.S. federal securities laws and the applicable rules and regulations of the Securities and Exchange Commission and the PCAOB.
We conducted our audits in accordance with the standards of the PCAOB. Those standards require that we plan and perform the audit to obtain reasonable assurance about whether the financial statements and financial highlights are free of material misstatement, whether due to error or fraud. The Funds are not required to have, nor were we engaged to perform, an audit of their internal control over financial reporting. As part of our audits we are required to obtain an understanding of internal control over financial reporting but not for the purpose of expressing an opinion on the effectiveness of the Funds’ internal control over financial reporting. Accordingly, we express no such opinion.
Our audits included performing procedures to assess the risks of material misstatement of the financial statements and financial highlights, whether due to error or fraud, and performing procedures that respond to those risks. Such procedures included examining, on a test basis, evidence regarding the amounts and disclosures in the financial statements and financial highlights. Our audits also included evaluating the accounting principles used and significant estimates made by management, as well as evaluating the overall presentation of the financial statements and financial highlights. Our procedures included confirmation of securities owned as of October 31, 2023, by correspondence with the custodian and brokers; when replies were not received from brokers, we performed other auditing procedures. We believe that our audits provide a reasonable basis for our opinion.
Deloitte & Touche LLP
Denver, Colorado
December 15, 2023
We have served as the auditor of one or more investment companies in the Schwab Funds Complex since 2020.
Schwab Active Equity Funds | Annual Report79
Schwab Active Equity Funds
Other Federal Tax Information (unaudited)
Schwab International Core Equity Fund may elect to pass through under section 853(a) of the Internal Revenue Code the foreign tax credit of $840,955 to its shareholders for the fiscal year ended October 31, 2023. The respective foreign source income on the fund is $19,955,139.
For corporate shareholders, the following percentage of the funds’ dividend distributions paid during the fiscal year ended October 31, 2023, qualify for the corporate dividends received deduction:
| |
| |
Schwab Dividend Equity Fund | |
Schwab Large-Cap Growth Fund | |
Schwab Small-Cap Equity Fund | |
| |
Schwab International Core Equity Fund | |
For the fiscal year ended October 31, 2023, the funds designate the following amounts of the dividend distributions as qualified dividends for the purpose of the maximum rate under section 1(h)(11) of the Internal Revenue Code. Shareholders will be notified in January 2024 via IRS Form 1099 of the amounts for use in preparing their 2023 income tax return.
| |
Schwab Dividend Equity Fund | |
Schwab Large-Cap Growth Fund | |
Schwab Small-Cap Equity Fund | |
| |
Schwab International Core Equity Fund | |
Under section 852(b)(3)(C) of the Internal Revenue Code, certain funds designate the following amounts as long-term capital gain dividends for the fiscal year ended October 31, 2023:
| |
Schwab Dividend Equity Fund | |
Schwab Large-Cap Growth Fund | |
Schwab Small-Cap Equity Fund | |
| |
Schwab International Core Equity Fund | |
80
Schwab Active Equity Funds | Annual Report
Schwab Active Equity Funds
Liquidity Risk Management Program (unaudited)
The funds have adopted and implemented a liquidity risk management program (the “program”) as required by Rule 22e-4 under the Investment Company Act of 1940, as amended. The funds’ Board of Trustees (the “Board”) has designated the funds’ investment adviser, Charles Schwab Investment Management, Inc., dba Schwab Asset Management, as the administrator of the program. Personnel of the investment adviser or its affiliates conduct the day-to-day operation of the program.
Under the program, the investment adviser manages a fund’s liquidity risk, which is the risk that the fund could not meet shareholder redemption requests without significant dilution of remaining shareholders’ interests in the fund. The program is reasonably designed to assess and manage a fund’s liquidity risk, taking into consideration the fund’s investment strategy and the liquidity of its portfolio investments during normal and reasonably foreseeable stressed conditions; its historical redemption history and shareholder concentrations; and its cash holdings and access to other funding sources, including the custodian overdraft facility and lines of credit. The investment adviser’s process of determining the degree of liquidity of each fund’s investments is supported by third-party liquidity assessment vendors.
The funds’ Board reviewed a report at its meeting held on September 19, 2023 prepared by the investment adviser regarding the operation and effectiveness of the program for the period June 1, 2022, through May 31, 2023, which included individual fund liquidity risk metrics. The report summarized the operation of the program and the information and factors considered by the investment adviser in assessing whether the program has been adequately and effectively implemented with respect to a fund. In addition, the investment adviser provided its assessment that the program had been operating effectively in managing each fund’s liquidity risk.
Schwab Active Equity Funds | Annual Report81
Schwab Active Equity Funds
Investment Advisory Agreement Approval
The Investment Company Act of 1940, as amended (the 1940 Act), requires that the continuation of a fund’s investment advisory agreement must be specifically approved (1) by the vote of the trustees or by a vote of the shareholders of the fund, and (2) by the vote of a majority of the trustees who are not parties to the investment advisory agreement or “interested persons” of any party thereto (the Independent Trustees), cast in person at a meeting called for the purpose of voting on such approval. In connection with such approvals, the fund’s trustees must request and evaluate, and the investment adviser is required to furnish, such information as may be reasonably necessary to evaluate the terms of the investment advisory agreement.
The Board of Trustees (the Board or the Trustees, as appropriate) calls and holds one or more meetings each year that are dedicated, in whole or in part, to considering whether to renew the investment advisory and administration agreement (the Agreement) between Schwab Capital Trust (the Trust) and Charles Schwab Investment Management, Inc. (dba Schwab Asset Management) (the investment adviser) with respect to the existing funds in the Trust, including Schwab Core Equity Fund, Schwab Dividend Equity Fund, Schwab Large-Cap Growth Fund, Schwab Small-Cap Equity Fund, Schwab Health Care Fund and Schwab International Core Equity Fund (each, a Fund and collectively, the Funds), and to review certain other agreements pursuant to which the investment adviser provides investment advisory services to certain other registered investment companies. In preparation for the meeting(s), the Board requests and reviews a wide variety of materials provided by the investment adviser, including information about the investment adviser’s affiliates, personnel, business goals and priorities, profitability, third-party oversight, corporate structure and operations. As part of the renewal process, the Independent Trustees’ legal counsel, on behalf of the Independent Trustees, sends an information request letter to the investment adviser seeking certain relevant information. The responses by the investment adviser are provided to the Trustees in the Board materials for their review prior to their meeting, and the Trustees are provided with the opportunity to request any additional materials. The Board also receives data provided by an independent provider of investment company data. This information is in addition to the detailed information about the Funds that the Board reviews during the course of each year, including information that relates to the Funds’ operations and performance, legal and compliance matters, risk management, portfolio turnover, and sales and marketing activity. In considering the renewal, the Independent Trustees receive advice from Independent Trustees’ legal counsel, including a memorandum regarding the responsibilities of trustees for the approval of investment advisory agreements. In addition, the Independent Trustees participate in question and answer
sessions with representatives of the investment adviser and meet in executive session outside the presence of Fund management.
The Board, including a majority of the Independent Trustees, considered information specifically relating to the continuance of the Agreement with respect to the Funds at meetings held on April 27, 2023 and June 7, 2023, and approved the renewal of the Agreement with respect to the Funds for an additional one-year term at the meeting on June 7, 2023 called for the purpose of voting on such approval.
The Board’s approval of the continuance of the Agreement with respect to the Funds was based on consideration and evaluation of a variety of specific factors discussed at these meetings and at prior meetings, including:
1.
the nature, extent and quality of the services provided to each Fund under the Agreement, including the resources of the investment adviser and its affiliates dedicated to the Funds;
2.
each Fund’s investment performance and how it compared to that of certain other comparable mutual funds and benchmark data;
3.
each Fund’s expenses and how those expenses compared to those of certain other similar mutual funds;
4.
the profitability of the investment adviser and its affiliates, including Charles Schwab & Co., Inc. (Schwab), with respect to each Fund, including both direct and indirect benefits accruing to the investment adviser and its affiliates; and
5.
the extent to which economies of scale would be realized as each Fund grows and whether fee levels in the Agreement reflect those economies of scale for the benefit of Fund investors.
Nature, Extent and Quality of Services. The Board considered the nature, extent and quality of the services provided by the investment adviser to the Funds and the resources of the investment adviser and its affiliates dedicated to the Funds. In this regard, the Trustees evaluated, among other things, the investment adviser’s experience, track record, compliance program, resources dedicated to hiring and retaining skilled personnel and specialized talent, and information security resources. The Trustees also considered information provided by the investment adviser relating to services and support provided with respect to each Fund’s portfolio management team, portfolio strategy, and internal investment guidelines, as well as trading infrastructure, liquidity management, product design and analysis, shareholder communications, securities valuation, and vendor and risk oversight. The Trustees also considered investments the investment adviser has made in its infrastructure, including modernizing the investment adviser’s
82
Schwab Active Equity Funds | Annual Report
Schwab Active Equity Funds
technology and use of data, increasing expertise in key areas (including portfolio management and trade operations), and improving business continuity, cybersecurity, due diligence, risk management processes, and information security programs, which are designed to provide enhanced services to the Funds and their shareholders. The Trustees considered Schwab’s overall financial condition and its reputation as a full service brokerage firm, as well as the wide range of products, services and account features that benefit Fund shareholders who are brokerage clients of Schwab. Following such evaluation, the Board concluded, within the context of its full deliberations, that the nature, extent and quality of services provided by the investment adviser to the Funds and the resources of the investment adviser and its affiliates dedicated to the Funds supported renewal of the Agreement with respect to the Funds.
Fund Performance. The Board considered each Fund’s performance in determining whether to renew the Agreement with respect to such Fund. Specifically, the Trustees considered each Fund’s performance relative to a peer category of other mutual funds and applicable indices/benchmarks, in light of total return and the market environment, as well as in consideration of each Fund’s investment style and strategy. As part of this review, the Trustees considered the composition of the peer category, selection criteria and the reputation of the independent provider of investment company data who prepared the peer category analysis. The Trustees further considered the level of Fund performance in the context of their review of Fund expenses and the investment adviser’s profitability discussed below and also noted that the Board and a designated committee of the Board review performance throughout the year. Although Schwab Dividend Equity Fund and Schwab International Core Equity Fund each had performance that ranked in the fourth quartile of a relevant peer group for more than one performance period considered, the Board concluded that other factors relevant to performance supported renewal of the Agreement with respect to each Fund, including that the underperformance was attributable, to a significant extent, to investment decisions by the investment adviser that were reasonable and consistent with each Fund’s investment objective and policies and that the investment adviser had taken steps designed to help improve performance. Following such evaluation, the Board concluded, within the context of its full deliberations, that the performance of each Fund supported renewal of the Agreement with respect to such Fund.
Fund Expenses. With respect to each Fund’s expenses, the Trustees considered the rate of compensation called for by the Agreement and each Fund’s operating expense ratio, in each case, in comparison to those of other similar mutual funds, such peer groups and comparisons having been selected and calculated by an independent provider of investment company data. The investment adviser reported to the Board, and the Board took into account, the risk assumed by the investment
adviser in the development of the Funds and provision of services as well as the competitive marketplace for financial products. The Trustees also considered the investment adviser’s contractual commitment to limit the total annual operating expenses of each Fund for so long as it serves as the adviser to the Fund. The Trustees also considered fees charged by the investment adviser to other mutual funds and to other types of accounts, but, with respect to such other types of accounts, accorded less weight to such comparisons due to the different legal, regulatory, compliance and operating features of mutual funds as compared to these other types of accounts, and any differences in the nature and scope of the services the investment adviser provides to these other accounts, and any differences in the market for these types of accounts. Following such evaluation, the Board concluded, within the context of its full deliberations, that the expenses of each Fund are reasonable and supported renewal of the Agreement with respect to such Fund.
Profitability. The Trustees considered the compensation flowing to the investment adviser and its affiliates, directly or indirectly and reviewed profitability on a pre-tax basis, without regard to distribution expenses. The Trustees reviewed the profitability of the investment adviser relating to the Schwab fund complex as a whole, noting the benefits to Fund shareholders of being part of the Schwab fund complex, including the allocations of certain costs across the Funds and other funds in the complex. The Trustees also considered any other benefits derived by the investment adviser from its relationship with the Funds, such as whether, by virtue of its management of the Funds, the investment adviser obtains investment information or other research resources that aid it in providing advisory services to other clients. The Trustees considered whether the compensation and profitability with respect to the Funds under the Agreement and other service agreements were reasonable in light of the quality of all services rendered to the Funds by the investment adviser and its affiliates. The Trustees noted that the investment adviser continues to invest substantial sums in its business in order to provide enhanced research capabilities, services, and systems to benefit the Funds. Based on this evaluation, the Board concluded, within the context of its full deliberations, that the profitability of the investment adviser with respect to each Fund is reasonable and supported renewal of the Agreement with respect to such Fund.
Economies of Scale. Although the Trustees recognized the difficulty of determining economies of scale with precision, and although the Funds do not have breakpoints in their advisory fees, the Trustees considered the potential existence of any economies of scale and whether those are passed along to a Fund’s shareholders through (i) the enhancement of services provided to the Funds in return for fees paid, including through investments by the investment adviser in its infrastructure, including modernizing the investment adviser’s technology and use of data, increasing expertise and capabilities in key areas (including portfolio and trade operations), and improving
Schwab Active Equity Funds | Annual Report83
Schwab Active Equity Funds
business continuity, cybersecurity, due diligence and information security programs, which are designed to provide enhanced services to the Funds and their shareholders; and (ii) pricing a fund to scale and keeping overall expenses down as the fund grows. The Trustees acknowledged that the investment adviser has invested in its infrastructure, as discussed above, over time and that the investment adviser’s internal costs of providing investment management, technology, administrative, legal and compliance services to the Funds continue to increase as a result of regulatory or other developments. The Trustees considered that the investment adviser and its affiliates employ contractual expense caps to protect shareholders from higher fees, including for example, when fund assets are relatively small. Based on this evaluation, the Board concluded, within the context of its full deliberations, that each Fund obtains reasonable benefits from economies of scale.
* * * * * * * * * * * * * * * * * * * * * * * * * * * * * * * * * * * * * * * *
In the course of their deliberations, the Trustees may have accorded different weights to various factors and did not identify any particular information or factor that was all important or controlling. Based on the Trustees’ deliberation and their evaluation of the information described above, the Board, including all of the Independent Trustees, approved the continuation of the Agreement with respect to the Funds and concluded that the compensation under the Agreement with respect to the Funds is fair and reasonable in light of the services provided and the related expenses borne by the investment adviser and its affiliates and such other matters as the Trustees considered to be relevant in the exercise of their reasonable judgment.
84
Schwab Active Equity Funds | Annual Report
Schwab Active Equity Funds
Trustees and Officers
The tables below give information about the trustees and officers of Schwab Capital Trust, which includes the funds covered in this report. The “Fund Complex” includes The Charles Schwab Family of Funds, Schwab Capital Trust, Schwab Investments, Schwab Annuity Portfolios, Schwab Strategic Trust and Laudus Trust. The Fund Complex includes 106 funds.
The address for all trustees and officers is 211 Main Street, San Francisco, CA 94105. You can find more information about the trustees and officers in the funds’ Statement of Additional Information, which is available free by calling 1-877-824-5615.
|
Name, Year of Birth, and Position(s) with the trust (Terms of office, and length of Time Served1) | Principal Occupations During the Past Five Years | Number of Portfolios in Fund Complex Overseen by the Trustee | |
Michael J. Beer 1961 Trustee (Trustee of The Charles Schwab Family of Funds, Schwab Investments, Schwab Capital Trust, Schwab Annuity Portfolios, Schwab Strategic Trust and Laudus Trust since 2022) | Retired. Director, President and Chief Executive Officer (Dec. 2016 – Sept. 2019), Principal Funds (investment management). | | Director (2016 – 2019), Principal Funds, Inc. |
Robert W. Burns 1959 Trustee (Trustee of Schwab Strategic Trust since 2009; The Charles Schwab Family of Funds, Schwab Investments, Schwab Capital Trust, Schwab Annuity Portfolios and Laudus Trust since 2016) | Retired/Private Investor. | | |
Nancy F. Heller 1956 Trustee (Trustee of The Charles Schwab Family of Funds, Schwab Investments, Schwab Capital Trust, Schwab Annuity Portfolios, Schwab Strategic Trust and Laudus Trust since 2018) | | | |
David L. Mahoney 1954 Trustee (Trustee of The Charles Schwab Family of Funds, Schwab Investments, Schwab Capital Trust, Schwab Annuity Portfolios and Laudus Trust since 2011; Schwab Strategic Trust since 2016) | | | Director (2004 – present), Corcept Therapeutics Incorporated Director (2009 – 2021), Adamas Pharmaceuticals, Inc. Director (2003 – 2019), Symantec Corporation |
Jane P. Moncreiff 1961 Trustee (Trustee of The Charles Schwab Family of Funds, Schwab Investments, Schwab Capital Trust, Schwab Annuity Portfolios, Schwab Strategic Trust and Laudus Trust since 2019) | Consultant (2018 – present), Fulham Advisers LLC (management consulting); Chief Investment Officer (2009 – 2017), CareGroup Healthcare System, Inc. (healthcare). | | |
Schwab Active Equity Funds | Annual Report85
Schwab Active Equity Funds
Independent Trustees (continued) |
Name, Year of Birth, and Position(s) with the trust (Terms of office, and length of Time Served1) | Principal Occupations During the Past Five Years | Number of Portfolios in Fund Complex Overseen by the Trustee | |
Kimberly S. Patmore 1956 Trustee (Trustee of The Charles Schwab Family of Funds, Schwab Investments, Schwab Capital Trust, Schwab Annuity Portfolios, Schwab Strategic Trust and Laudus Trust since 2016) | Consultant (2008 – present), Patmore Management Consulting (management consulting). | | |
J. Derek Penn 1957 Trustee (Trustee of The Charles Schwab Family of Funds, Schwab Investments, Schwab Capital Trust, Schwab Annuity Portfolios, Schwab Strategic Trust and Laudus Trust since 2021) | Head of Equity Sales and Trading (2006 – 2018), BNY Mellon (financial services). | | |
|
Name, Year of Birth, and Position(s) with the trust (Terms of office, and length of Time Served1) | Principal Occupations During the Past Five Years | Number of Portfolios in Fund Complex Overseen by the Trustee | |
Walter W. Bettinger II2 1960 Chairman and Trustee (Trustee of The Charles Schwab Family of Funds, Schwab Investments, Schwab Capital Trust and Schwab Annuity Portfolios since 2008; Schwab Strategic Trust since 2009; Laudus Trust since 2010) | Co-Chairman of the Board (July 2022 – present), Director and Chief Executive Officer (Oct. 2008 – present) and President (Feb. 2007 – Oct. 2021), The Charles Schwab Corporation; President and Chief Executive Officer (Oct. 2008 – Oct. 2021) and Director (May 2008 – Oct. 2021), Charles Schwab & Co., Inc.; Co-Chairman of the Board (July 2022 – present) and Director (Apr. 2006 – present), Charles Schwab Bank, SSB; Co-Chairman of the Board (July 2022 – present) and Director (Nov. 2017 – present), Charles Schwab Premier Bank, SSB; Co-Chairman of the Board (July 2022 – present) and Director (July 2019 – present), Charles Schwab Trust Bank; Director (May 2008 – present), Chief Executive Officer (Aug. 2017 – present) and President (Aug. 2017 – Nov. 2021), Schwab Holdings, Inc.; Manager (Sept. 2023 – present), TD Ameritrade Holding LLC; Director (Oct. 2020 – Aug. 2023), TD Ameritrade Holding Corporation; Director (July 2016 – Oct. 2021), Charles Schwab Investment Management, Inc. | | Director (2008 – present), The Charles Schwab Corporation |
Richard A. Wurster2 1973 Trustee (Trustee of The Charles Schwab Family of Funds, Schwab Investments, Schwab Capital Trust, Schwab Annuity Portfolios, Schwab Strategic Trust and Laudus Trust since 2022) | President (Oct. 2021 – present) and Executive Vice President – Schwab Asset Management Solutions (Apr. 2019 – Oct. 2021), The Charles Schwab Corporation; President, Director (Oct. 2021 – present), Executive Vice President – Schwab Asset Management Solutions (July 2019 – Oct. 2021) and Senior Vice President – Advisory (May 2016 – July 2019), Charles Schwab & Co., Inc.; President (Nov. 2021 – present), Schwab Holdings, Inc.; Director (Oct. 2021 – present) and Chief Executive Officer (Nov. 2019 – Jan. 2022), Charles Schwab Investment Management, Inc.; Director, Chief Executive Officer and President (Mar. 2018 – Oct. 2022), Charles Schwab Investment Advisory, Inc.; Chief Executive Officer (July 2016 – Apr. 2018) and President (Mar. 2017 – Apr. 2018), ThomasPartners, Inc.; Chief Executive Officer (July 2016 – Apr. 2018), Windhaven Investment Management, Inc. | | |
86
Schwab Active Equity Funds | Annual Report
Schwab Active Equity Funds
|
Name, Year of Birth, and Position(s) with the trust (Terms of office, and length of Time Served3) | Principal Occupations During the Past Five Years |
Omar Aguilar 1970 Chief Executive Officer, President and Chief Investment Officer (Officer of The Charles Schwab Family of Funds, Schwab Investments, Schwab Capital Trust, Schwab Annuity Portfolios, Schwab Strategic Trust and Laudus Trust since 2011) | Chief Executive Officer (Jan. 2022 – present), President (Oct. 2023 – present), (Chief Investment Officer (Apr. 2011 – present) and Senior Vice President (Apr. 2011 – Jan. 2022), Charles Schwab Investment Management, Inc.; Director, Chief Executive Officer and President (Oct. 2022 – present), Charles Schwab Investment Advisory, Inc.; Chief Executive Officer (Sept. 2023 – present), President (Oct. 2023 – present), Chief Investment Officer (June 2011 – present) and Vice President (June 2011 – Sept. 2023), Schwab Funds, Laudus Trust and Schwab ETFs. |
Mark Fischer 1970 Chief Operating Officer (Officer of The Charles Schwab Family of Funds, Schwab Investments, Schwab Capital Trust, Schwab Annuity Portfolios, Schwab Strategic Trust and Laudus Trust since 2013) | Chief Operating Officer (Dec. 2020 – present) and Treasurer and Chief Financial Officer (Jan. 2016 – Dec. 2022), Schwab Funds, Laudus Trust and Schwab ETFs; Chief Financial Officer (Mar. 2020 – present), Chief Operating Officer (Oct. 2023 – present), Managing Director (Mar. 2023 – present) and Vice President (Oct. 2013 – Mar. 2023), Charles Schwab Investment Management, Inc. |
Dana Smith 1965 Treasurer and Chief Financial Officer (Officer of The Charles Schwab Family of Funds, Schwab Investments, Schwab Capital Trust, Schwab Annuity Portfolios, Schwab Strategic Trust and Laudus Trust since 2023) | Treasurer and Chief Financial Officer (Jan. 2023 – present) and Assistant Treasurer (Dec. 2015 – Dec. 2022), Schwab Funds, Laudus Trust and Schwab ETFs; Managing Director (Mar. 2023 – present), Vice President (Mar. 2022 – Mar. 2023) and Director (Oct. 2015 – Mar. 2022), Charles Schwab Investment Management, Inc.; Managing Director (May 2022 – present) and Vice President (Apr. 2022 – May 2022), Charles Schwab & Co., Inc. |
Patrick Cassidy 1964 Vice President and Chief Investment Officer (Officer of The Charles Schwab Family of Funds, Schwab Investments, Schwab Capital Trust, Schwab Annuity Portfolios, Schwab Strategic Trust and Laudus Trust since 2018) | Chief Investment Officer (Oct. 2023 – present) and Vice President (Feb. 2018 – present), Schwab Funds, Laudus Trust and Schwab ETFs; Managing Director (Mar. 2023 – present), Chief Investment Officer (Oct. 2023 – present), and Senior Vice President (Oct. 2012 – Mar. 2023), Charles Schwab Investment Management, Inc. |
William P. McMahon, Jr. 1972 Vice President and Chief Investment Officer (Officer of The Charles Schwab Family of Funds, Schwab Investments, Schwab Capital Trust, Schwab Annuity Portfolios, Schwab Strategic Trust and Laudus Trust since 2021) | Managing Director (Mar. 2023 – present), Senior Vice President (Jan. 2020 – Mar. 2023) and Chief Investment Officer (Jan. 2020 – present) Charles Schwab Investment Management, Inc.; Vice President and Chief Investment Officer (June 2021 – present), Schwab Funds, Laudus Trust and Schwab ETFs; Senior Vice President and Chief Investment Officer – ThomasPartners Strategies (Apr. 2018 – Dec. 2019), Charles Schwab Investment Advisory, Inc.; Senior Vice President and Chief Investment Officer (May 2001 – Apr. 2018), ThomasPartners, Inc. |
Catherine MacGregor 1964 Chief Legal Officer and Secretary, Schwab Funds and Schwab ETFs Chief Legal Officer, Vice President and Clerk, Laudus Trust (Officer of The Charles Schwab Family of Funds, Schwab Investments, Schwab Capital Trust, Schwab Annuity Portfolios and Laudus Trust since 2005; Schwab Strategic Trust since 2009) | Chief Legal Officer (Mar. 2022 – present), Managing Director (Mar. 2023 – present) and Vice President (Sept. 2005 – Mar. 2023), Charles Schwab Investment Management, Inc.; Managing Director (May 2022 – present) and Vice President (Aug. 2005 – May 2022), Charles Schwab & Co., Inc.; Vice President (Dec. 2005 – present) and Chief Legal Officer and Clerk (Mar. 2007 – present), Laudus Trust; Chief Legal Officer and Secretary (Oct. 2021 – present), Vice President (Nov. 2005 – Oct. 2021) and Assistant Secretary (June 2007 – Oct. 2021), Schwab Funds; Chief Legal Officer and Secretary (Oct. 2021 – present), Vice President and Assistant Secretary (Oct. 2009 – Oct. 2021), Schwab ETFs. |
1
Each Trustee shall hold office until the election and qualification of his or her successor, or until he or she dies, resigns or is removed. The retirement policy requires that each independent trustee retire by December 31 of the year in which the Trustee turns 74 or the Trustee’s twentieth year of service as an independent trustee on any trust in the Fund Complex, whichever occurs first.
2
Mr. Bettinger and Mr. Wurster are Interested Trustees. Mr. Bettinger and Mr. Wurster are Interested Trustees because each owns stock of The Charles Schwab Corporation (CSC), the parent company of Charles Schwab Investment Management, Inc., the investment adviser for the trusts in the Fund Complex, and is an employee of Charles Schwab & Co., Inc. (Schwab), the principal underwriter for The Charles Schwab Family of Funds, Schwab Investments, Schwab Capital Trust, Schwab Annuity Portfolios and Laudus Trust.
3
The President, Treasurer and Secretary/Clerk hold office until their respective successors are chosen and qualified or until he or she sooner dies, resigns, is removed or becomes disqualified. Each of the other officers serves at the pleasure of the Board.
Schwab Active Equity Funds | Annual Report87
Schwab Active Equity Funds
asset allocation The practice of dividing a portfolio among different asset classes, with each asset class assigned a particular percentage.
asset class A group of securities with similar structure and basic characteristics. Stocks, bonds and cash are the three main examples of asset classes.
Bloomberg US Aggregate Bond Index An index that is a broad-based benchmark measuring the performance of the U.S. investment grade, taxable bond market, including U.S. Treasuries, government-related and corporate bonds, mortgage pass-through securities, commercial mortgage-backed securities, and asset-backed securities that are publicly available for sale in the United States. To be eligible for inclusion in the index, securities must be fixed rate, non-convertible, U.S. dollar-denominated with at least $300 million or more of outstanding face value and have one or more years remaining to maturity. The index excludes certain types of securities, including tax-exempt state and local government series bonds, structured notes embedded with swaps or other special features, private placements, floating rate securities, inflation-linked bonds and Eurobonds. The index is market capitalization weighted and the securities in the index are updated on the last business day of each month.
Bloomberg US Treasury Bills 1–3 Month Index An index that includes all publicly issued zero-coupon U.S. Treasury Bills that have a remaining maturity of less than 3 months but more than 1 month, are rated investment grade and have $300 million or more of outstanding face value. It excludes zero-coupon STRIPS.
bond A security representing a loan from the investor to the issuer. A bond typically pays interest at a fixed rate (the coupon rate) until a specified date (the maturity date), at which time the issuer returns the money borrowed (principal or face value) to the bondholder. Because of their structure, bonds are sometimes called “fixed-income securities” or “debt securities.”
An individual bond is subject to the credit risk of the issuer. Changes in interest rates can affect a bond’s market value prior to call or maturity. There is no guarantee that a bond’s yield to call or maturity will provide a positive return over the rate of inflation.
bond fund A bond fund is subject to the same credit, interest rate, and inflation risks as bonds. In addition, a bond fund incurs ongoing fees and expenses. A bond fund’s net asset value will fluctuate with the price of the underlying bonds and the portfolio turnover activity; return of principal is not guaranteed.
cap, capitalization See “market cap.”
capital gain, capital loss the difference between the amount paid for an investment and its value at a later time. If the investment has been sold, the capital gain or loss is considered a realized gain or loss. If the investment is still held, the capital gain or loss is considered unrealized appreciation or depreciation.
Dividend Equity Spliced Index An internally calculated index, comprised of the S&P 500 Index from inception of the Schwab Dividend Equity Fund until the close of business on February 27, 2015, and the Russell 1000 Value Index thereafter.
Dow Jones Global Health Care Index An index that measures the performance of healthcare providers, researchers, and supplies producers around the world. The index is quoted in U.S. dollars.
expense ratio The amount that is taken from a mutual fund’s assets each year to cover the fund’s operating expenses. An expense ratio of 0.50% means that a fund’s expenses amount to half of one percent of its average net assets a year.
market cap, market capitalization The value of a company as determined by the total value of all shares of its stock outstanding.
MSCI EAFE Index (Net) A free float-adjusted market capitalization index that is designed to measure the equity market performance of developed markets in Europe, Australasia, and the Far East. The Net version of the index reflects reinvested dividends net of withholding taxes, but reflects no deductions for expenses or other taxes; returns are calculated applying dividend withholding rates applicable to non-resident persons who do not benefit from double taxation treaties.
net asset value (NAV) The value of one share of a mutual fund. NAV is calculated by taking the fund’s total assets, subtracting liabilities, and dividing by the number of shares outstanding.
outstanding shares, shares outstanding When speaking of a company or mutual fund, indicates all shares currently held by investors.
price-to-book ratio (P/B) The market price of a company’s stock compared with its “book value.” A mutual fund’s P/B is the weighted average of the P/B of all stocks in the fund’s portfolio.
price-to-earnings ratio (P/E) The market price of a company’s stock compared with earnings over the past year. A mutual fund’s P/E is the weighted average of the P/E of all stocks in the fund’s portfolio.
return on equity (ROE) The average yearly rate of return for each dollar of investors’ money, measured over the past five years.
Russell 1000 Growth Index An index that measures the performance of those Russell 1000 Index companies with higher price-to-book ratios and higher forecasted growth values.
Russell 1000 Index An index that measures the performance of the 1,000 largest companies in the Russell 3000 Index, and represents approximately 92% of the total market capitalization of the Russell 3000 Index. The Russell 3000 Index measures the performance of the largest 3,000 U.S. companies representing approximately 98% of the investable U.S. equity market.
Russell 1000 Value Index An index that measures the performance of the large-cap value segment of the U.S. equity universe. It includes those Russell 1000 Index companies with lower price-to-book ratios and lower expected growth values.
Russell 2000 Index An index that measures the performance of the 2,000 smallest companies in the Russell 3000 Index. The Russell 3000 Index measures the performance of the largest 3,000 U.S. companies representing approximately 98% of the investable U.S. equity market.
S&P 500 Index An index that is designed to measure the performance of 500 leading publicly traded companies from a broad range of industries.
stock A share of ownership, or equity, in the issuing company.
total return The percentage that an investor would have earned or lost on an investment in the fund assuming dividends and distributions were reinvested.
weighted average For mutual funds, an average that gives the same weight to each security as the security represents in the fund’s portfolio.
yield The income paid out by an investment, expressed as a percentage of the investment’s market value.
88
Schwab Active Equity Funds | Annual Report
Schwab Active Equity Funds
Schwab Asset Management
With a straightforward lineup of core products and solutions for building the foundation of a portfolio, Schwab Asset Management advocates for investors of all sizes with a steadfast focus on lowering costs and reducing unnecessary complexity. The list below shows all currently available Schwab Funds®.
Investors should carefully consider information contained in the prospectus, or if available, the summary prospectus, including investment objectives, risks, charges and expenses before investing. Please call 1-877-824-5615 for a prospectus for any Schwab Fund. Please read the prospectus carefully before you invest. This report must be preceded or accompanied by a current prospectus.
Proxy Voting Policies, Procedures and Results
A description of the proxy voting policies and procedures used to determine how to vote proxies on behalf of the funds is available without charge, upon request, by visiting the Schwab Funds’ website at www.schwabassetmanagement.com/schwabfunds_prospectus, the SEC’s website at www.sec.gov, or by contacting Schwab Funds at 1-877-824-5615.
Information regarding how a fund voted proxies relating to portfolio securities during the most recent twelve-month period ended June 30 is available, without charge, by visiting the fund’s website at www.schwabassetmanagement.com/schwabfunds_prospectus or the SEC’s website at www.sec.gov.
Schwab Funds
Equity Funds
Schwab Core Equity Fund
Schwab Dividend Equity Fund
Schwab Large-Cap Growth Fund
Schwab Small-Cap Equity Fund
Schwab Health Care Fund
Schwab International Core Equity Fund
Schwab International Opportunities Fund
Schwab Select Large Cap Growth Fund
Schwab Fundamental US Large Company Index Fund
Schwab Fundamental US Small Company Index Fund
Schwab Fundamental International Large Company Index Fund
Schwab Fundamental International Small Company Index Fund
Schwab Fundamental Emerging Markets Large Company Index Fund
Schwab Fundamental Global Real Estate Index Fund
Schwab Global Real Estate Fund
Schwab S&P 500 Index Fund
Schwab 1000 Index® Fund
Schwab Small-Cap Index Fund®
Schwab Total Stock Market Index Fund®
Schwab U.S. Large-Cap Growth Index Fund
Schwab U.S. Large-Cap Value Index Fund
Schwab U.S. Mid-Cap Index Fund
Schwab International Index Fund®
Asset Allocation Funds
Schwab Balanced Fund
Schwab MarketTrack Portfolios®
Schwab Target Funds
Schwab Target Index Funds
Schwab Monthly Income Funds
Bond Funds
Schwab Treasury Inflation Protected Securities Index Fund
Schwab U.S. Aggregate Bond Index Fund
Schwab Short-Term Bond Index Fund
Schwab Tax-Free Bond Fund1
Schwab California Tax-Free Bond Fund1
Schwab Opportunistic Municipal Bond Fund
Schwab Money Funds2
Schwab provides a broad choice of taxable and tax-exempt money market funds for both retail and institutional client types.
Investment Adviser
Charles Schwab Investment Management, Inc., dba Schwab Asset Management
211 Main Street, San Francisco, CA 94105
Funds
Schwab Funds
1-877-824-5615
© 2023 Charles Schwab & Co., Inc. All rights reserved.
Member SIPC®
Printed on recycled paper.
¹
State, local, and the Federal Alternative Minimum Tax may apply. Capital gains are not exempt from Federal Taxation.
²
You could lose money by investing in the Schwab Money Funds. All Schwab Money Funds with the exception of Schwab Variable Share Price Money Fund seek to preserve the value of your investment at $1.00 per share, but cannot guarantee they will do so. Because the share price of Schwab Variable Share Price Money Fund will fluctuate, when you sell your shares they may be worth more or less than what you originally paid for them. All Schwab Money Funds with the exception of Schwab Government Money Fund, Schwab Retirement Government Money Fund, Schwab U.S. Treasury Money Fund, Schwab Treasury Obligations Money Fund and Schwab Government Money Market Portfolio may impose a fee upon the sale of your shares if the Fund’s Board determines that the fee is in the best interests of the Fund. An investment in the Schwab Money Funds is not insured or guaranteed by the Federal Deposit Insurance Corporation or any other government agency. The Schwab Money Funds’ sponsor has no legal obligation to provide financial support to the Funds, and you should not expect that the sponsor will provide financial support to the Funds at any time.
This page is intentionally left blank.
Annual Report | October 31, 2023
Schwab Balanced Fund
This page is intentionally left blank.
Fund investment adviser: Charles Schwab Investment Management, Inc., dba Schwab Asset Management®
Distributor: Charles Schwab & Co., Inc. (Schwab)
Schwab Balanced Fund | Annual Report1
The performance data quoted represents past performance. Past performance does not guarantee future results. Investment returns and principal value of an investment will fluctuate so that an investor’s shares may be worth more or less than their original cost. Current performance may be lower or higher than performance data quoted. To obtain performance information current to the most recent month end, please visit www.schwabassetmanagement.com/schwabfunds_prospectus.
Total Return for the 12 Months Ended October 31, 2023 |
Schwab Balanced Fund (Ticker Symbol: SWOBX) | |
| |
Fund Category: Morningstar Moderate Allocation1 | |
| |
All total returns on this page assume dividends and distributions were reinvested. Index figures do not include trading and management costs, which would lower performance. Indices are unmanaged and cannot be invested in directly. Performance results less than one year are not annualized.
The components that make up the composite index may vary over time. For index definition, please see the Glossary.
Fund expenses may have been partially absorbed by the investment adviser and its affiliates. Without these reductions, the fund’s total return would have been lower. Performance does not reflect the deduction of taxes that a shareholder would pay on fund distributions or on the redemption of fund shares.
1
Source for category information: Morningstar, Inc. The Morningstar Category return represents all active and index mutual funds and ETFs within the category as of the report date.
2
Schwab Balanced Fund | Annual Report
The Investment Environment
For the 12-month reporting period ended October 31, 2023, U.S. equity markets were mixed, and international equity markets posted positive returns. U.S. stocks were volatile for the first half of the reporting period as inflation remained elevated, the U.S. Federal Reserve (Fed) continued to raise interest rates, and the failure of three U.S. regional banks in early March raised concerns about the stability of the banking sector. Despite these headwinds, as inflation began to ease, U.S. stocks staged a relatively steady upswing through August driven primarily by performance of the “Magnificent Seven” (Alphabet, Inc., Amazon.com, Inc., Apple, Inc., Meta Platforms, Inc., Microsoft Corp., NVIDIA Corp., and Tesla, Inc.). U.S. stocks, particularly dividend paying stocks, began to falter over the final two months of the reporting period as soaring U.S. Treasury yields offered investors attractive alternatives to stocks. Outside the U.S., the ongoing war between Russia and Ukraine and the Israel-Hamas war that broke out following Hamas’ attack on Israel in early October weighed on the global economy. The U.S. dollar, as measured against a basket of international currencies, generally weakened until mid-July, when it hit a reporting-period low, then began to rise but ended the reporting period weaker than where it began. For the reporting period, the S&P 500® Index, a bellwether for the overall U.S. stock market, returned 10.14%. U.S. large-cap stocks outperformed U.S. small-cap stocks, with the Russell 1000® Index and the Russell 2000® Index returning 9.48% and -8.56%, respectively. Among U.S. large-cap stocks, growth stocks outperformed value stocks, with the Russell 1000® Growth Index and the Russell 1000® Value Index returning 18.95% and 0.13%, respectively. Outside the U.S., the MSCI EAFE® Index (Net)*, a broad measure of developed international equity performance, returned 14.40% and the MSCI Emerging Markets Index (Net)* returned 10.80%. U.S. and international bonds were relatively weak as economic uncertainty and rising interest rates over much of the period drove yields up and bond prices down. (Bond yields and bond prices typically move in opposite directions.) The Bloomberg US Aggregate Bond Index returned 0.36% and the FTSE non–US Dollar World Government Bond Index returned 1.32%.
Economies around the world grew out of sync as they wrestled with record levels of government debt, rising geopolitical tensions, and weak productivity gains that stifled economic growth. The U.S. economy continued to show unexpected resiliency. Surprisingly robust job growth and strong consumer spending helped propel U.S. gross domestic product (GDP) to a 5.2% annualized growth rate for the third quarter of 2023, up from roughly 2% over the prior three quarters. Inflation remained above the Fed’s historical 2% target over the reporting period but declined
Asset Class Performance Comparison % returns during the 12 months ended October 31, 2023
Index figures assume dividends and distributions were reinvested. Index figures do not include trading and management costs, which would lower performance. Indices are unmanaged and cannot be invested in directly. Performance results less than one year are not annualized. Past performance is not a guarantee of future results.
For index definitions, please see the Glossary.
Data source: Index provider websites and Schwab Asset Management.
Nothing in this report represents a recommendation of a security by the investment adviser.
Management views may have changed since the report date.
*
The net version of the index reflects reinvested dividends net of withholding taxes but reflects no deductions for expenses or other taxes.
Schwab Balanced Fund | Annual Report3
The Investment Environment (continued)
between November 2022 and June 2023 as rents and wage growth eased, profit margins declined, and monetary policy remained restrictive before ticking up slightly in July 2023 through September 2023. The unemployment rate remained low throughout the period despite inflationary pressures but did rise slightly in August and October. An increase in the labor force participation rate (the proportion of working-age Americans who have a job or are looking for one) in August and strike activity in October were large contributors to the increase in unemployment in the last three months of the reporting period.
Oil prices were volatile, ranging from a high of $92 per barrel at the beginning of the reporting period to a low of $66 and ending the period at just over $80 per barrel. Eurozone GDP growth contracted slightly in the fourth quarter of 2022 driven by manufacturing pressures and headwinds related to oil and commodity prices, was flat for the first quarter of 2023, expanded slightly for the second quarter of 2023 bolstered by a moderation in inflationary pressures, and contracted slightly for the third quarter of 2023 as financing conditions remained tight. The United Kingdom posted small gains in GDP growth throughout the reporting period, with household consumption expenditures and manufacturing output among key growth drivers. In Japan, following flat GDP growth in the fourth quarter of 2022, GDP rose for the first two quarters of 2023, primarily on rising exports and falling imports. Among emerging markets, China’s GDP grew throughout the reporting period as the government’s various policies seeking to help the economy have offset the impact of a prolonged property crisis and weak trade. India’s GDP grew in the fourth quarter of 2022 and the first two quarters of 2023, driven primarily by robust performance of the services sector along with strong consumer demand and increased government spending.
In its efforts to lower inflation, the Fed raised interest rates six times during the reporting period, increasing the federal funds rate from a range of 3.00% to 3.25% to a range of 5.25% to 5.50%. At its meetings in June, September, and October, the Fed maintained the then current rates, citing robust economic activity, strong—though moderating—job gains, and low unemployment while acknowledging tighter financial and credit conditions for households and businesses. The Fed also maintained its program to reduce the assets held on its balance sheet, though its balance sheet temporarily spiked in March 2023 when the Fed supported banks after the failure of three U.S. regional banks. Despite the spike, balance sheet assets declined over the reporting period. Central banks outside the United States also battled with persistently high, albeit waning, inflation. After raising rates eight times during the reporting period, the European Central Bank held its rate steady at its October meeting as inflation and pricing pressures finally showed signs of easing. Similarly, the Bank of England maintained its key official bank rate at its September meeting, after seven rate hikes during the reporting period, leaving borrowing costs at a 15-year high. In contrast, the Bank of Japan continued to uphold its short-term interest rate target of -0.1%, unchanged since 2016, despite inflationary pressures but relaxed its yield control policy. Monetary policies in emerging markets were mixed. Central banks in India, Indonesia, Mexico, Pakistan, and Russia all raised their rates two or more times over the reporting period. In contrast, both Brazil and China cut their key interest rate twice during the reporting period.
Among bond markets, shorter-term bonds generally outperformed longer-term bonds, and bond markets generally weakened over the second half of the reporting period. There were a few short-lived market-moving events over the reporting period. The failure of three U.S. regional banks in early March raised concerns about the stability of the banking sector. In addition, debt ceiling negotiations during the second quarter of 2023 created fear that the federal government could default on its obligations and on August 1, 2023, Fitch Ratings downgraded long-term U.S. debt from AAA to AA+ after indicating earlier in the year that a country refusing to pay its debts in a timely way was not entitled to a AAA rating. The U.S. Treasury increased auctions of U.S. Treasury securities over the reporting period and higher borrowing costs as a result of rising interest rates contributed to growth in the U.S. budget deficit. U.S. Treasury yields were volatile over the first half of the reporting period but rose sharply over the second half. The yield on the 10-year U.S. Treasury rose from 4.10% to 4.88% over the reporting period, briefly touching 5% in October—a level not seen since 2007. The yield on the three-month U.S. Treasury climbed from 4.22% to 5.59%, resulting in the yield curve inverting for a large portion of the reporting period. Outside the U.S., bond yields generally followed a similar trajectory.
4
Schwab Balanced Fund | Annual Report
| Zifan Tang, Ph.D., CFA, Senior Portfolio Manager for Schwab Asset Management, is responsible for the co-management of the fund. Prior to joining Schwab in 2012, Ms. Tang was a product manager at Thomson Reuters and from 1997 to 2009 worked as a portfolio manager at Barclays Global Investors (now known as BlackRock). |
| Drew Hayes, CFA, Portfolio Manager for Schwab Asset Management, is responsible for the co-management of the fund. Mr. Hayes has been with Schwab since 2006. Before becoming a portfolio manager, he spent seven years as a senior fixed income specialist for Schwab Wealth Advisory, Inc. Prior to that, he worked as a bond investment specialist for two years and as a registered representative for two years for Charles Schwab & Co., Inc. |
| Patrick Kwok, CFA, Portfolio Manager for Schwab Asset Management, is responsible for the co-management of the fund. Previously, Mr. Kwok served as an associate portfolio manager from 2012 to 2016. Prior to that, he worked as a fund administration manager, where he was responsible for oversight of sub-advisers, trading, cash management, and fund administration supporting the Charles Schwab Trust Bank Collective Investment Trusts and multi-asset Schwab Funds. Prior to joining Schwab Asset Management in 2008, Mr. Kwok spent two years as an asset operations specialist at Charles Schwab Trust Company. He also worked for one year at State Street Bank & Trust as a portfolio accountant and pricing specialist. |
Schwab Balanced Fund | Annual Report5
The Schwab Balanced Fund (the fund) seeks capital growth and income. To pursue its goal, the fund generally invests in a diversified group of other affiliated Schwab Funds in accordance with its target portfolio allocation. Normally, the fund invests 55% to 65% of its assets in equity securities (including stocks and equity funds) and 35% to 45% in fixed-income securities (including bonds and fixed-income funds), and cash and cash equivalents (including money market funds). This allocation is designed to provide a mix of the growth opportunities of stock investing with the income opportunities of bonds and other fixed-income securities. For more information concerning the fund’s investment objective, strategies, and risks, please see the fund’s prospectus.
Market Highlights. For the 12-month reporting period ended October 31, 2023, U.S. equity markets were mixed, and international equity markets posted positive returns. U.S. stocks were volatile for the first half of the reporting period as inflation remained elevated, the U.S. Federal Reserve (Fed) continued to raise interest rates, and the failure of three U.S. regional banks in early March raised concerns about the stability of the banking sector. Despite these headwinds, as inflation began to ease, U.S. stocks staged a relatively steady upswing through August driven primarily by performance of the “Magnificent Seven” (Alphabet, Inc., Amazon.com, Inc., Apple, Inc., Meta Platforms, Inc., Microsoft Corp., NVIDIA Corp., and Tesla, Inc.). U.S. stocks, particularly dividend paying stocks, began to falter over the final two months of the reporting period as soaring U.S. Treasury yields offered investors attractive alternatives to stocks. Outside the U.S., the ongoing war between Russia and Ukraine and the Israel-Hamas war that broke out following Hamas’ attack on Israel in early October weighed on the global economy. U.S. large-cap stocks outperformed U.S. small-cap stocks and among U.S. large-cap stocks, growth stocks outperformed value stocks. U.S. and international bonds were relatively weak as economic uncertainty and rising interest rates over much of the period drove yields up and bond prices down. (Bond yields and bond prices typically move in opposite directions.) The U.S. dollar, as measured against a basket of international currencies, generally weakened until mid-July, when it hit a reporting-period low, then began to rise but ended the reporting period weaker than where it began.
Performance. For the 12-month reporting period ended October 31, 2023, the fund returned 6.74%. The fund’s internally calculated comparative index, the Balanced Blended Index (the index), returned 5.24%.
Positioning and Strategies. Over the reporting period, the fund’s asset allocations were broadly in line with those of the index.
The fund’s U.S. large-cap equity allocations contributed the most to the total return of the fund. The Schwab Select Large Cap Growth Fund was the largest contributor to the total return of the fund, returning approximately 23% for the reporting period. The comparative index, the S&P 500® Index, returned approximately 10% for the reporting period. The Schwab Core Equity Fund also contributed to the total return of the fund, returning approximately 10% for the reporting period.
The fund’s international equity allocation also contributed to the total return of the fund. The Schwab International Opportunities Fund returned approximately 7% for the reporting period, underperforming its comparative index, the MSCI EAFE® Index (Net)1.
The fund’s U.S. small-cap equity allocation detracted the most from the total return of the fund. The Schwab Small-Cap Equity Fund returned approximately -4% for the reporting period, outperforming its comparative index, the Russell 2000® Index, which returned approximately -9% for the reporting period.
The fund’s fixed-income allocation also detracted from the total return of the fund. The Schwab U.S. Aggregate Bond Index Fund returned less than 1% for the reporting period and generally tracked its comparative index, the Bloomberg US Aggregate Bond Index.
Management views and portfolio holdings may have changed since the report date.
1
The net version of the index reflects reinvested dividends net of withholding taxes but reflects no deductions for expenses or other taxes.
6
Schwab Balanced Fund | Annual Report
Performance and Fund Facts as of October 31, 2023
The performance data quoted represents past performance. Past performance does not guarantee future results. Investment returns and principal value of an investment will fluctuate so that an investor’s shares may be worth more or less than their original cost. Current performance may be lower or higher than performance data quoted. To obtain performance information current to the most recent month end, please visit www.schwabassetmanagement.com/schwabfunds_prospectus.
Performance of Hypothetical $10,000 Investment (October 31, 2013 – October 31, 2023)1
Average Annual Total Returns1
| | | |
Fund: Schwab Balanced Fund (11/18/96) | | | |
| | | |
Bloomberg US Aggregate Bond Index | | | |
| | | |
Fund Category: Morningstar Moderate Allocation2 | | | |
Fund Expense Ratios3: Net 0.49%; Gross 0.52% |
All total returns on this page assume dividends and distributions were reinvested. Index figures do not include trading and management costs, which would lower performance. Indices are unmanaged and cannot be invested in directly. Performance results less than one year are not annualized.
For index definitions, please see the Glossary.
1
Fund expenses may have been partially absorbed by the investment adviser and its affiliates. Without these reductions, the fund’s returns would have been lower. These returns do not reflect the deduction of taxes that a shareholder would pay on fund distributions or the redemption of fund shares.
2
Source for category information: Morningstar, Inc. The Morningstar Category return represents all active and index mutual funds and ETFs within the category as of the report date.
3
As stated in the prospectus. Includes 0.49% of acquired fund fees and expenses (AFFE), which are indirect expenses incurred by the fund through its investments in the underlying funds. Net Expense: Expenses reduced by a contractual fee waiver in effect for so long as Schwab Asset Management serves as the investment adviser to the fund. Gross Expense: Does not reflect the effect of contractual fee waivers. For actual expense ratios during the period, not including AFFE, refer to the financial highlights section of the financial statements.
Schwab Balanced Fund | Annual Report7
Performance and Fund Facts as of October 31, 2023 (continued)
Asset Class Weightings % of Investments1
Top Holdings % of Net Assets2,3
Portfolio holdings may have changed since the report date.
Small-company stocks are subject to greater volatility than many other asset classes.
1
The percentage may differ from the Portfolio Holdings because the above calculation is based on a percentage of total investments, whereas the calculation in the Portfolio Holdings is based on a percentage of net assets.
2
This list is not a recommendation of any security by the investment adviser.
3
The holdings listed exclude any temporary liquidity investments.
8
Schwab Balanced Fund | Annual Report
Fund Expenses (Unaudited)
Examples for a $1,000 Investment
As a fund shareholder, you may incur two types of costs: (1) transaction costs; and (2) ongoing costs, including transfer agent fees and other fund expenses.
The expense examples below are intended to help you understand your ongoing cost (in dollars) of investing in the fund and to compare this cost with the ongoing cost of investing in other mutual funds. These examples are based on an investment of $1,000 invested for six months beginning May 1, 2023 and held through October 31, 2023.
The Actual Return line in the table below provide information about actual account values and actual expenses. You may use this information, together with the amount you invested, to estimate the expenses that you paid over the period. To do so, simply divide your account value by $1,000 (for example, an $8,600 account value ÷ $1,000 = 8.6), then multiply the result by the number given for the fund under the heading entitled “Expenses Paid During Period.”
The Hypothetical Return line in the table below provide information about hypothetical account values and hypothetical expenses based on the fund’s actual expense ratio and an assumed return of 5% per year before expenses. Because the return used is not an actual return, it may not be used to estimate the actual ending account value or expenses you paid for the period.
You may use this information to compare the ongoing costs of investing in the fund and other funds. To do so, compare this 5% hypothetical example with the 5% hypothetical examples that appear in the shareholder reports of the other funds.
Please note that the expenses shown in the table are meant to highlight your ongoing costs only and do not reflect any transactional costs. Therefore, the hypothetical return line of the table is useful in comparing ongoing costs only and will not help you determine the relative total costs of owning different funds. In addition, if these transactional costs were included, your costs would have been higher.
| | | BEGINNING
ACCOUNT VALUE
AT 5/1/23 | ENDING
ACCOUNT VALUE
(NET OF EXPENSES)
AT 10/31/23 | EXPENSES PAID
DURING PERIOD
| EFFECTIVE
EXPENSES PAID
DURING PERIOD
|
| | | | | | |
| | | | | | |
| | | | | | |
| Based on the most recent six-month expense ratio. |
| Excludes acquired fund fees and expenses, which are indirect expenses incurred by the fund through its investments in underlying funds. |
| Based on the most recent six-month acquired fund fees and expenses and the expense ratio; may differ from the acquired fund fees and expenses and the expense ratio in the prospectus. |
| Includes acquired fund fees and expenses, which are indirect expenses incurred by the fund through its investments in underlying funds. |
| Expenses for each fund are equal to its annualized expense ratio, multiplied by the average account value over the period, multiplied by the 184 days in the period, and divided by the 365 days in the fiscal year. |
Schwab Balanced Fund | Annual Report9
Financial Statements
| | | | | | |
|
Net asset value at beginning of period | | | | | | |
Income (loss) from investment operations: | | | | | | |
Net investment income (loss)1 | | | | | | |
Net realized and unrealized gains (losses) | | | | | | |
Total from investment operations | | | | | | |
| | | | | | |
Distributions from net investment income | | | | | | |
Distributions from net realized gains | | | | | | |
| | | | | | |
Net asset value at end of period | | | | | | |
| | | | | | |
|
Ratios to average net assets: | | | | | | |
| | | | | | |
Gross operating expenses2 | | | | | | |
Net investment income (loss) | | | | | | |
| | | | | | |
Net assets, end of period (x 1,000) | | | | | | |
| Calculated based on the average shares outstanding during the period. |
| Ratio excludes acquired fund fees and expenses, which are indirect expenses incurred by the fund through its investments in underlying funds. |
| Ratio includes less than 0.005% of non-routine proxy expenses. |
10
Schwab Balanced Fund | Annual Report
Portfolio Holdings as of October 31, 2023
This section shows all the securities in the fund’s portfolio and their values as of the report date, including a summary of the fund’s transactions with its affiliated underlying funds during the period.
The fund files its complete schedule of portfolio holdings with the U.S. Securities and Exchange Commission (SEC) for the first and third quarters of each fiscal year on Form N-PORT Part F. The fund’s Form N-PORT Part F is available on the SEC’s website at www.sec.gov. You can also obtain this information at no cost on the fund’s website at www.schwabassetmanagement.com/schwabfunds_prospectus, by calling 1-866-414-6349, or by sending an email request to orders@mysummaryprospectus.com. The fund also makes available its complete schedule of portfolio holdings 15 to 20 days after the end of the month on the fund’s website.
| | | | | NET CHANGE IN UNREALIZED APPRECIATION (DEPRECIATION) | | BALANCE OF SHARES HELD AT 10/31/23 | |
AFFILIATED UNDERLYING FUNDS 99.7% OF NET ASSETS |
|
|
|
| | | | | | | | |
Schwab Select Large Cap Growth Fund * | | | | | | | | |
| | | | | | | | |
|
Schwab Small-Cap Equity Fund | | | | | | | | |
| | | | | | | | |
|
International Stocks 9.4% |
|
Schwab International Opportunities Fund | | | | | | | | |
|
|
Intermediate-Term Bond 37.2% |
Schwab U.S. Aggregate Bond Index Fund | | | | | | | | |
|
|
Schwab Variable Share Price Money Fund, | | | | | | | | |
Total Affiliated Underlying Funds
(Cost $617,553,213) | | | | | | | | |
|
UNAFFILIATED UNDERLYING FUNDS 0.2% OF NET ASSETS |
|
|
State Street Institutional U.S. Government Money Market Fund, Premier Class, | | | | | | | | |
Total Unaffiliated Underlying Funds
(Cost $1,339,502) | | | | | | | | |
Total Investments in Securities
(Cost $618,892,715) | | | | | | | | |
| Non-income producing security. |
| Distributions received include distributions from net investment income and capital gains, if any, from the underlying funds. Amounts shown are only presented for affiliated underlying funds, which are presented in the corresponding line-item in the Statement of Operations, if applicable (See financial note 2(c) for additional information). |
| The rate shown is the annualized 7-day yield. |
At October 31, 2023, all of the fund’s investment securities were classified as Level 1 (see financial note 2(a) for additional
information).
Schwab Balanced Fund | Annual Report11
Statement of Assets and Liabilities
As of October 31, 2023
|
Investments in securities, at value - affiliated (cost $617,553,213) | | |
Investments in securities, at value - unaffiliated (cost $1,339,502) | | |
| | |
| | |
| | |
| | |
Due from investment adviser | | |
| | |
| | |
|
|
| | |
| | |
| | |
| | |
| | |
| | |
|
|
Capital received from investors | | |
| | |
| | |
12
Schwab Balanced Fund | Annual Report
Statement of Operations
For the period November 1, 2022 through October 31, 2023 |
|
Dividends received from securities - affiliated | | |
Dividends received from securities - unaffiliated | | |
| | |
|
|
| | |
| | |
| | |
Portfolio accounting fees | | |
| | |
Independent trustees’ fees | | |
| | |
| | |
| | |
| | |
| | |
| | |
|
REALIZED AND UNREALIZED GAINS (LOSSES) |
Realized capital gain distributions received from underlying funds - affiliated | | |
Net realized losses on sales of securities - affiliated | | |
| | |
Net change in unrealized appreciation (depreciation) on securities - affiliated | | |
Net realized and unrealized gains | | |
Increase in net assets resulting from operations | | |
Schwab Balanced Fund | Annual Report13
Statement of Changes in Net Assets
For the current and prior report periods
|
| | |
| | | |
| | | |
Net change in unrealized appreciation (depreciation) | | | |
Increase (decrease) in net assets resulting from operations | | | |
|
DISTRIBUTIONS TO SHAREHOLDERS |
| | | |
TRANSACTIONS IN FUND SHARES |
| | |
| | | | | |
| | | | | |
| | | | | |
| | | | | |
Net transactions in fund shares | | | | | |
|
SHARES OUTSTANDING AND NET ASSETS |
| | |
| | | | | |
| | | | | |
Total increase (decrease) | | | | | |
| | | | | |
14
Schwab Balanced Fund | Annual Report
1. Business Structure of the Fund:
Schwab Balanced Fund is a series of Schwab Capital Trust (the trust), a no-load, open-end management investment company. The trust is organized as a Massachusetts business trust and is registered under the Investment Company Act of 1940, as amended (the 1940 Act). The list below shows all the funds in the trust as of the end of the period, including the fund discussed in this report, which is highlighted:
|
| |
Schwab S&P 500 Index Fund | |
Schwab Small-Cap Index Fund® | |
Schwab Total Stock Market Index Fund® | |
Schwab U.S. Large-Cap Growth Index Fund | |
Schwab U.S. Large-Cap Value Index Fund | Schwab Fundamental US Large Company Index Fund |
Schwab U.S. Mid-Cap Index Fund | Schwab Fundamental US Small Company Index Fund |
Schwab International Index Fund® | Schwab Fundamental International Large Company Index Fund |
Schwab MarketTrack All Equity Portfolio™ | Schwab Fundamental International Small Company Index Fund |
Schwab MarketTrack Growth Portfolio™ | Schwab Fundamental Emerging Markets Large Company Index Fund |
Schwab MarketTrack Balanced Portfolio™ | Schwab Fundamental Global Real Estate Index Fund |
Schwab MarketTrack Conservative Portfolio™ | Schwab Target 2010 Index Fund |
Schwab International Opportunities Fund | Schwab Target 2015 Index Fund |
| Schwab Target 2020 Index Fund |
Schwab Dividend Equity Fund | Schwab Target 2025 Index Fund |
Schwab Large-Cap Growth Fund | Schwab Target 2030 Index Fund |
Schwab Small-Cap Equity Fund | Schwab Target 2035 Index Fund |
| Schwab Target 2040 Index Fund |
Schwab International Core Equity Fund | Schwab Target 2045 Index Fund |
| Schwab Target 2050 Index Fund |
| Schwab Target 2055 Index Fund |
| Schwab Target 2060 Index Fund |
| Schwab Target 2065 Index Fund |
| Schwab Monthly Income Fund – Target Payout |
| Schwab Monthly Income Fund – Flexible Payout |
| Schwab Monthly Income Fund – Income Payout |
The Schwab Balanced Fund is a “fund of funds” because it invests in other mutual funds or exchange-traded funds (ETFs). The fund seeks to achieve its investment objective by generally investing in a diversified group of other affiliated Schwab Funds but may also invest in other unaffiliated mutual funds or ETFs (referred to herein, together with Schwab Funds, as the underlying funds). The fund invests in accordance with its target portfolio allocation.
The fund offers one share class. Shares are bought and sold at closing net asset value per share (NAV), which is the price for all outstanding shares of the fund. Each share has a par value of 1/1,000 of a cent, and the fund’s Board of Trustees (the Board) may authorize the issuance of as many shares as necessary.
The fund maintains its own account for purposes of holding assets and accounting, and is considered a separate entity for tax purposes. Within its account, the fund may also keep certain assets in segregated accounts, as required by securities law. The "Fund Complex" includes The Charles Schwab Family of Funds, Schwab Capital Trust, Schwab Investments, Schwab Annuity Portfolios, Schwab Strategic Trust and Laudus Trust.
2. Significant Accounting Policies:The following is a summary of the significant accounting policies the fund uses in its preparation of financial statements. The fund follows the investment company accounting and reporting guidance of the Financial Accounting Standards Board (FASB) Accounting Standard Codification Topic 946 Financial Services — Investment Companies. The accounting policies are in conformity with accounting principles generally accepted in the United States of America (GAAP).
The financial statements of the fund should be read in conjunction with the underlying funds’ financial statements. For more information about the underlying funds’ operations and policies, please refer to those funds’ semiannual and annual reports, which are filed with the U.S. Securities and Exchange Commission (SEC) and are available on the SEC’s website at www.sec.gov.
Schwab Balanced Fund | Annual Report15
Financial Notes (continued)
2. Significant Accounting Policies (continued):
(a) Security Valuation:
Pursuant to Rule 2a-5 under the 1940 Act, the Board has designated authority to a Valuation Designee, the fund’s investment adviser, to make fair valuation determinations under adopted procedures, subject to Board oversight. The investment adviser has formed a Pricing Committee to administer the pricing and valuation of portfolio securities and other assets and liabilities as well as to ensure that prices used for internal purposes or provided by third parties reasonably reflect fair value. The Valuation Designee may utilize independent pricing services, quotations from securities and financial instrument dealers and other market sources to determine fair value.
Securities held in the fund’s portfolio are valued every business day. The following valuation policies and procedures are used by the Valuation Designee to value various types of securities:
• Mutual funds: Mutual funds are valued at their respective NAVs.
• Securities for which no quoted value is available: The Valuation Designee has adopted procedures to fair value the fund’s securities when market prices are not “readily available” or are unreliable. For example, a security may be fair valued when it’s de-listed or its trading is halted or suspended; when a security’s primary pricing source is unable or unwilling to provide a price; or when a security’s primary trading market is closed during regular market hours. Fair value determinations are made in good faith in accordance with adopted valuation procedures. The Valuation Designee considers a number of factors, including unobservable market inputs, when arriving at fair value. The Valuation Designee may employ methods such as the review of related or comparable assets or liabilities, related market activities, recent transactions, market multiples, book values, transactional back-testing, disposition analysis and other relevant information. Due to the subjective and variable nature of fair value pricing, there can be no assurance that the fund could obtain the fair value assigned to the security upon the sale of such security.
In accordance with the authoritative guidance on fair value measurements and disclosures under GAAP, the fund discloses the fair value of its investments in a hierarchy that prioritizes the significant inputs to valuation methods used to measure the fair value. The hierarchy gives the highest priority to valuations based upon unadjusted quoted prices in active markets for identical assets or liabilities (Level 1 measurements) and the lowest priority to valuations based upon unobservable inputs that are significant to the valuation (Level 3 measurements). If inputs used to measure the financial instruments fall within different levels of the hierarchy, the categorization is based on the lowest level input that is significant to the valuation. If it is determined that either the volume and/or level of activity for an asset or liability has significantly decreased (from normal conditions for that asset or liability) or price quotations or observable inputs are not associated with orderly transactions, increased analysis and the Valuation Designee’s judgment will be required to estimate fair value.
The three levels of the fair value hierarchy are as follows:
• Level 1 — quoted prices in active markets for identical investments —Investments whose values are based on quoted market prices in active markets. These generally include active listed equities, mutual funds, ETFs and futures contracts. Mutual funds and ETFs are classified as Level 1 prices, without consideration to the classification level of the underlying securities held which could be Level 1, Level 2 or Level 3 in the fair value hierarchy.
• Level 2 — other significant observable inputs (including quoted prices for similar securities, interest rates, prepayment speeds, credit risk, etc.) — Investments that trade in markets that are not considered to be active, but whose values are based on quoted market prices, dealer quotations or valuations provided by alternative pricing sources supported by observable inputs are classified as Level 2 prices. These generally include U.S. government and sovereign obligations, most government agency securities, investment-grade corporate bonds, certain mortgage products, less liquid listed equities, and state, municipal and provincial obligations.
• Level 3 — significant unobservable inputs (including the Valuation Designee’s assumptions in determining the fair value of investments) — Investments whose values are classified as Level 3 prices have significant unobservable inputs, as they may trade infrequently or not at all. When observable prices are not readily available for these securities, one or more valuation methods are used for which sufficient and reliable data is available. The inputs used in estimating the value of Level 3 prices may include the original transaction price, quoted prices for similar securities or assets in active markets, completed or pending third-party transactions in the underlying investment or comparable issuers, and changes in financial ratios or cash flows. Level 3 prices may also be adjusted to reflect illiquidity and/or non-transferability, with the amount of such discount estimated in the absence of market information. Assumptions used due to the lack of observable inputs may significantly impact the resulting fair value and therefore the fund’s results of operations.
16
Schwab Balanced Fund | Annual Report
Financial Notes (continued)
2. Significant Accounting Policies (continued):
The inputs or methodology used for valuing securities are not necessarily an indication of the risk associated with investing in those securities.
The levels associated with valuing the fund’s investments as of October 31, 2023, are disclosed in the fund’s Portfolio Holdings.
(b) Security Transactions:
Security transactions are recorded as of the date the order to buy or sell the security is executed. Realized gains and losses from security transactions are based on the identified costs of the securities involved.
(c) Investment Income:
Interest income is recorded as it accrues. Dividends and distributions from portfolio securities and underlying funds are recorded on the date they are effective (the ex-dividend date). Any distributions from underlying funds are recorded in accordance with the character of the distributions as designated by the underlying funds.
(d) Expenses:
Expenses that are specific to the fund are charged directly to the fund. Expenses that are common to more than one fund in the trusts generally are allocated among those funds in proportion to their average daily net assets. The fund bears its share of the acquired fund fees and expenses of the underlying funds, which are indirect expenses incurred by the fund through its investments in the underlying funds. Such expenses are reflected in the net asset values of the underlying funds.
(e) Distributions to Shareholders:
The fund makes distributions from net investment income and net realized capital gains, if any, once a year. To receive a distribution, you must be a registered shareholder on the record date. Distributions are paid to shareholders on the payable date.
(f) Accounting Estimates:
The accounting policies described in this report conform to GAAP. Notwithstanding this, shareholders should understand that in order to follow these principles, fund management has to make estimates and assumptions that affect the information reported in the financial statements. It’s possible that once the results are known, they may turn out to be different from these estimates and these differences may be material.
(g) Federal Income Taxes:
The fund intends to meet federal income and excise tax requirements for regulated investment companies under subchapter M of the Internal Revenue Code, as amended. Accordingly, the fund distributes substantially all of its net investment income and net realized capital gains, if any, to its shareholders each year. As long as the fund meets the tax requirements, it is not required to pay federal income tax.
(h) Indemnification:
Under the fund’s organizational documents, the officers and trustees are indemnified against certain liabilities arising out of the performance of their duties to the fund. In addition, in the normal course of business the fund enters into contracts with its vendors and others that provide general indemnifications. The fund’s maximum exposure under these arrangements is unknown as this would involve future claims that may be made against the fund. However, based on experience, the fund expects the risk of loss attributable to these arrangements to be remote.
(i) Regulatory Update:
Effective January 24, 2023, the SEC adopted rule and form amendments to require mutual funds and ETFs to transmit concise and visually engaging streamlined annual and semiannual reports to shareholders that highlight key information deemed important for retail investors to assess and monitor their fund investments. Other information, including financial statements, will no longer appear in a streamlined shareholder report but must be available online, delivered free of charge upon request, and filed on a semiannual basis on Form N-CSR. The rule and form amendments have a compliance date of July 24, 2024. At this time, management is evaluating the impact of these rule and form amendment changes on the content of the current shareholder report and the newly created annual and semiannual streamlined shareholder reports.
Schwab Balanced Fund | Annual Report17
Financial Notes (continued)
Investing in the fund may involve certain risks, as discussed in the fund’s prospectus, including, but not limited to, those described below. Any of these risks could cause an investor to lose money.
Asset Allocation Risk. The fund is subject to the risk that the selection of the underlying funds and the allocation of the fund’s assets among the various asset classes and market segments may cause the fund to underperform other funds with a similar investment objective. The fund is not managed to maximize tax efficiency for taxable shareholder accounts. Investors should consider whether the fund is an appropriate investment in light of their current financial position and retirement needs.
Conflicts of Interest Risk. The investment adviser’s authority to select and substitute underlying funds from a variety of affiliated and unaffiliated mutual funds and ETFs may create a conflict of interest because the fees paid to it and its affiliates by some underlying funds are higher than the fees paid by other underlying funds. The investment adviser also may have an incentive to select an affiliated underlying fund for other reasons, including to increase assets under management or to support new investment strategies. In addition, other conflicts of interest may exist where the best interests of the affiliated underlying fund may not be aligned with those of the fund. However, the investment adviser is a fiduciary to the fund and is legally obligated to act in the fund’s best interests when selecting underlying funds.
Market Risk. Financial markets rise and fall in response to a variety of factors, sometimes rapidly and unpredictably. Markets may be impacted by economic, political, regulatory and other conditions, including economic sanctions and other government actions. In addition, the occurrence of global events, such as war, terrorism, environmental disasters, natural disasters and epidemics, may also negatively affect the financial markets. As with any investment whose performance is tied to these markets, the value of an investment in the fund will fluctuate, which means that an investor could lose money over short or long periods.
Direct Investment Risk. The fund may invest directly in cash, cash equivalents and equity and fixed-income securities, including money market securities, to maintain its allocations. The fund’s direct investment in these securities is subject to the same or similar risks as an underlying fund’s investment in the same securities.
Underlying Fund Investment Risk. Before investing in the fund, investors should assess the risks associated with the underlying funds in which the fund may invest, which include any combination of the risks described below.
• Investment Risk. The fund may experience losses with respect to its investment in an underlying fund. Further, there is no guarantee that an underlying fund will be able to achieve its objective.
• Management Risk. Generally, the underlying funds are actively managed mutual funds. Any actively managed mutual fund is subject to the risk that its investment adviser (or subadviser(s)) will select or allocate assets that could cause the fund to underperform or otherwise not meet its objective. An underlying fund’s adviser applies its own investment techniques and risk analyses in making investment decisions for the underlying fund, but there can be no guarantee that they will produce the desired results.
• Equity Risk. The prices of equity securities rise and fall daily. These price movements may result from factors affecting individual companies, industries or the securities market as a whole. In addition, equity markets tend to move in cycles, which may cause stock prices to fall over short or extended periods of time.
• Market Capitalization Risk. Securities issued by companies of different market capitalizations tend to go in and out of favor based on market and economic conditions. During a period when securities of a particular market capitalization fall behind other types of investments, an underlying fund’s performance could be impacted.
• Growth Investing Risk. An underlying fund’s investments in growth stocks can be volatile. Growth companies usually invest a high portion of earnings in their businesses and may lack the dividends of value stocks that can cushion stock prices in a falling market. The prices of growth stocks are based largely on projections of the issuer’s future earnings and revenues. If a company’s earnings or revenues fall short of expectations, its stock price may fall dramatically. Growth stocks may also be more expensive relative to their earnings or assets compared to value or other stocks.
• Fixed-Income Risk. Interest rates rise and fall over time, which will affect an underlying fund’s yield and share price. A change in a central bank’s monetary policy or economic conditions, among other things, may result in a change in interest rates. A rise in interest rates could cause an underlying fund’s share price to fall. The credit quality of a portfolio investment could also cause an underlying fund’s share price to fall. An underlying fund could lose money if the issuer or guarantor of a portfolio investment or the counterparty to a derivatives contract fails to make timely principal or interest payments or otherwise honor its obligations. Fixed-income securities may be paid off earlier or later than expected. Either situation could cause an
18
Schwab Balanced Fund | Annual Report
Financial Notes (continued)
3. Risk Factors (continued):
underlying fund to hold securities paying lower-than-market rates of interest, which could hurt an underlying fund’s yield or share price. Below investment-grade bonds (junk bonds) involve greater credit risk, are more volatile, involve greater risk of price declines and may be more susceptible to economic downturns than investment-grade securities.
• ETF Risk. When an underlying fund invests in an ETF, it will bear a proportionate share of the ETF’s expenses. In addition, lack of liquidity in the market for an ETF’s shares can result in its value being more volatile than the underlying portfolio of securities.
• Money Market Fund Risk. The fund may invest in underlying money market funds that either seek to maintain a stable $1.00 net asset value (“stable share price money market funds”) or that have a share price that fluctuates (“variable share price money market funds”). Although an underlying stable share price money market fund seeks to maintain a stable $1.00 net asset value, it is possible to lose money by investing in such a money market fund. Because the share price of an underlying variable share price money market fund will fluctuate, when the fund sells the shares it owns they may be worth more or less than what the fund originally paid for them. In addition, neither type of money market fund is designed to offer capital appreciation. Certain underlying money market funds may impose a fee upon the sale of shares or may temporarily suspend the ability to sell shares if such fund’s liquidity falls below required minimums.
• Foreign Investment Risk. An underlying fund’s investments in securities of foreign issuers involve certain risks that may be greater than those associated with investments in securities of U.S. issuers. These include risks of adverse changes in foreign economic, political, regulatory and other conditions; changes in currency exchange rates or exchange control regulations (including limitations on currency movements and exchanges); the imposition of economic sanctions or other government restrictions; differing accounting, auditing, financial reporting and legal standards and practices; differing securities market structures; and higher transaction costs. These risks may negatively impact the value or liquidity of an underlying fund’s investments, and could impair the underlying fund’s ability to meet its investment objective or invest in accordance with its investment strategy. There is a risk that investments in securities denominated in, and/or receiving revenues in, foreign currencies will decline in value relative to the U.S. dollar.
• Emerging Markets Risk. Emerging market countries may be more likely to experience political turmoil or rapid changes in market or economic conditions than more developed countries. Emerging market countries often have less uniformity in accounting, auditing, financial reporting and recordkeeping requirements and greater risk associated with the custody of securities. In addition, the financial stability of issuers (including governments) in emerging market countries may be more precarious than in developed countries. As a result, there may be an increased risk of illiquidity and price volatility associated with an underlying fund’s investments in emerging market countries, which may be magnified by currency fluctuations relative to the U.S. dollar, and, at times, it may be difficult to value such investments.
• Derivatives Risk. An underlying fund may use derivatives to enhance returns or hedge against market declines. Examples of derivatives are options, futures, options on futures and swaps. An option is the right, but not the obligation, to buy or sell an instrument at a specific price on or before a specific date. A future is an agreement to buy or sell a financial instrument at a specific price on a specific day. A swap is an agreement whereby two parties agree to exchange payment streams calculated in relation to a rate, index, instrument or certain securities and a predetermined amount. A credit default swap is an agreement in which the seller agrees to make a payment to the buyer in the event of a specified credit event in exchange for a fixed payment or series of fixed payments.
An underlying fund’s use of derivative instruments involves risks different from, or possibly greater than, the risks associated with investing directly in securities and other traditional investments. Certain of these risks, such as leverage risk, liquidity risk, market risk and management risk are discussed elsewhere in this section. An underlying fund’s use of derivatives is also subject to lack of availability risk, valuation risk, correlation risk and tax risk. Lack of availability risk is the risk that suitable derivative transactions may not be available in all circumstances for risk management or other purposes. Valuation risk is the risk that a particular derivative may be valued incorrectly. Correlation risk is the risk that changes in the value of the derivative may not correlate perfectly with the underlying asset, rate or index. Tax risk is the risk that the use of derivatives may cause an underlying fund to realize higher amounts of short-term capital gains. An underlying fund’s use of derivatives could reduce the underlying fund’s performance, increase its volatility, and could cause the underlying fund to lose more than the initial amount invested. The use of derivatives that are subject to regulation by the Commodity Futures Trading Commission (CFTC) by an underlying fund could cause the fund to become a commodity pool, which would require the fund to comply with certain CFTC rules. An underlying fund’s use of derivatives also could create a risk of counterparty default under certain transactions, risks that the fund would need to liquidate portfolio positions when it may not be advantageous to do so in order to meet margin and payment obligations, and legal risks relating to insufficient documentation, insufficient capacity or authority of a counterparty, or legality or enforceability of a contract.
Schwab Balanced Fund | Annual Report19
Financial Notes (continued)
3. Risk Factors (continued):
• Leverage Risk. Certain underlying fund transactions, such as derivatives transactions, short sales, reverse repurchase agreements, and mortgage dollar rolls, may give rise to a form of leverage and may expose an underlying fund to greater risk. Leverage tends to magnify the effect of any decrease or increase in the value of an underlying fund’s portfolio securities, which means even a small amount of leverage can have a disproportionately large impact on the underlying fund.
• Liquidity Risk. An underlying fund may be unable to sell certain securities, such as illiquid securities, readily at a favorable time or price, or the underlying fund may have to sell them at a loss.
• Portfolio Turnover Risk. Certain of the underlying funds may buy and sell portfolio securities actively. If they do, their portfolio turnover rate and transaction costs will rise, which may lower the underlying fund’s performance and may increase the likelihood of capital gains distributions.
• Securities Lending Risk. An underlying fund may lend its portfolio securities to brokers, dealers, and other financial institutions. Securities lending involves the risk of loss of rights in, or delay in recovery of, the loaned securities if the borrower fails to return the security loaned or becomes insolvent.
• Mortgage-Backed and Mortgage Pass-Through Securities Risk. Mortgage-backed securities tend to increase in value less than other debt securities when interest rates decline, but are subject to similar or greater risk of decline in market value during periods of rising interest rates. Certain of the mortgage-backed securities in which an underlying fund may invest are issued or guaranteed by agencies or instrumentalities of the U.S. government but are not backed by the full faith and credit of the U.S. government. There can be no assurance that the U.S. government would provide financial support to its agencies or instrumentalities where it was not obligated to do so which can cause an underlying fund to lose money or underperform. The risks of investing in mortgage-backed securities include, among others, interest rate risk, credit risk, prepayment risk and extension risk. Transactions in mortgage pass-through securities often occur through to-be-announced (TBA) transactions. An underlying fund could lose money or underperform if a TBA counterparty defaults or goes bankrupt.
• Mortgage Dollar Rolls Risk. Mortgage dollar rolls are transactions in which an underlying fund sells mortgage-backed securities to a dealer and simultaneously agrees to repurchase similar securities in the future at a predetermined price. An underlying fund’s mortgage dollar rolls could lose money if the price of the mortgage-backed securities sold falls below the agreed upon repurchase price, or if the counterparty is unable to honor the agreement.
Please refer to the fund’s prospectus for a more complete description of the principal risks of investing in the fund.
4. Affiliates and Affiliated Transactions:Investment Adviser
Charles Schwab Investment Management, Inc., dba Schwab Asset Management, a wholly owned subsidiary of The Charles Schwab Corporation, serves as the fund’s investment adviser and administrator pursuant to an Investment Advisory and Administration Agreement between the investment adviser and the trust. The investment adviser does not receive a fee for the services it performs for the fund. However, the investment adviser is entitled to receive an annual management fee from each of the affiliated Schwab Funds that serve as underlying funds.
Shareholder Servicing
The Board has adopted a Shareholder Servicing Plan (the Plan) on behalf of the fund. The Plan enables the fund to bear expenses relating to the provision by financial intermediaries, including Charles Schwab & Co., Inc., a broker-dealer affiliate of the investment adviser (together, service providers), of certain account maintenance, customer liaison and shareholder services to the current shareholders of the fund. The fund is not subject to any fee under the Plan.
Expense Limitation
The investment adviser and its affiliates have agreed with the fund, for so long as the investment adviser serves as the investment adviser to the fund, in which the agreement may only be amended or terminated with the approval of the Board, to limit the total annual fund operating expenses charged, excluding interest, taxes and certain non-routine expenses to 0.00%.
The agreement to limit the fund’s total expenses charged is limited to the fund’s direct operating expenses and, therefore, does not apply to acquired fund fees and expenses, which are indirect expenses incurred by the fund through its investments in the underlying funds.
20
Schwab Balanced Fund | Annual Report
Financial Notes (continued)
4. Affiliates and Affiliated Transactions (continued):
Investments in Affiliates
The fund may engage in certain transactions involving related parties. Pursuant to an exemptive order issued by the SEC, the fund may invest in other related funds. As of October 31, 2023, the fund’s ownership percentages of other related funds’ shares are as follows:
| |
Schwab International Opportunities Fund | |
Schwab Select Large Cap Growth Fund | |
Schwab Small-Cap Equity Fund | |
Schwab U.S. Aggregate Bond Index Fund | |
Schwab Variable Share Price Money Fund, Ultra Shares | |
Interfund Borrowing and Lending
Pursuant to an exemptive order issued by the SEC, the fund may enter into interfund borrowing and lending transactions with other funds in the Fund Complex. All loans are for temporary or emergency purposes and the interest rate to be charged will be the average of the overnight repurchase agreement rate and the short-term bank loan rate. All loans are subject to numerous conditions designed to ensure fair and equitable treatment of all participating funds. The interfund lending facility is subject to the oversight and periodic review by the Board. The fund had no interfund borrowing or lending activity during the period.
5. Board of Trustees:The Board may include people who are officers and/or directors of the investment adviser or its affiliates. Federal securities law limits the percentage of such “interested persons” who may serve on a trust’s board, and the trust was in compliance with these limitations throughout the report period. The fund did not pay any of these interested persons for their services as trustees, but did pay non-interested persons (independent trustees), as noted in the fund’s Statement of Operations. For information regarding the trustees, please refer to the Trustees and Officers table at the end of this report.
6. Borrowing from Banks:During the period, the fund was a participant with other funds in the Fund Complex in a joint, syndicated, committed $1 billion line of credit (the Syndicated Credit Facility), which matured on September 28, 2023. On September 28, 2023, the Syndicated Credit Facility was amended to run for a new 364 day period with the line of credit amount remaining unchanged, maturing on September 26, 2024. Under the terms of the Syndicated Credit Facility, in addition to the interest charged on any borrowings by the fund, the fund paid a commitment fee of 0.15% per annum on the fund’s proportionate share of the unused portion of the Syndicated Credit Facility.
During the period, the fund was a participant with other funds in the Fund Complex in a joint, unsecured, uncommitted $400 million line of credit (the Uncommitted Credit Facility), with State Street Bank and Trust Company, which matured on September 28, 2023. On September 28, 2023, the Uncommitted Credit Facility was amended to run for a new 364 day period with the line of credit amount remaining unchanged, maturing on September 26, 2024. Under the terms of the Uncommitted Credit Facility, the fund pays interest on the amount it borrows. There were no borrowings by the fund from either line of credit during the period.
The fund also has access to custodian overdraft facilities. The fund may have utilized the overdraft facility and incurred an interest expense, which is disclosed in the fund’s Statement of Operations, if any. The interest expense is determined based on a negotiated rate above the current Federal Funds Rate.
7. Purchases and Sales of Investment Securities:For the period ended October 31, 2023, purchases and sales of securities (excluding short-term obligations) were as follows:
Schwab Balanced Fund | Annual Report21
Financial Notes (continued)
As of October 31, 2023, the tax basis cost of the fund’s investments and gross unrealized appreciation and depreciation were as follows:
| | GROSS UNREALIZED
APPRECIATION | GROSS UNREALIZED
DEPRECIATION | NET UNREALIZED
APPRECIATION
(DEPRECIATION) |
| | | | |
| | | | |
| | | | |
As of October 31, 2023, the components of distributable earnings on a tax basis were as follows:
UNDISTRIBUTED
ORDINARY
INCOME | UNDISTRIBUTED
LONG-TERM
CAPITAL GAINS | NET UNREALIZED
APPRECIATION
(DEPRECIATION)
ON INVESTMENTS | |
| | | |
The primary difference between book basis and tax basis unrealized appreciation or unrealized depreciation of investments is the tax deferral of losses on wash sales. The tax cost of the fund’s investments, disclosed above, have been adjusted from their book amounts to reflect these unrealized appreciation or depreciation differences, as applicable.
The tax basis components of distributions paid during the current and prior fiscal years were as follows:
| CURRENT FISCAL YEAR END DISTRIBUTIONS | PRIOR FISCAL YEAR END DISTRIBUTIONS |
| | | | |
| | | | |
Distributions paid to shareholders are based on net investment income and net realized gains determined on a tax basis, which may differ from net investment income and net realized gains for financial reporting purposes. These differences reflect the differing character of certain income items and net realized gains and losses for financial statement and tax purposes, and may result in reclassification among certain capital accounts in the financial statements. The fund may also designate a portion of the amount paid to redeeming shareholders as a distribution for tax purposes.
Permanent book and tax basis differences may result in reclassifications between components of net assets as required. The adjustments will have no impact on net assets or the results of operations.
As of October 31, 2023, management has reviewed the tax positions for open periods (for federal purposes, three years from the date of filing and for state purposes, four years from the date of filing) as applicable to the fund, and has determined that no provision for income tax is required in the fund’s financial statements. The fund recognizes interest and penalties, if any, related to unrecognized tax benefits as income tax expense in the fund’s Statement of Operations. During the fiscal year ended October 31, 2023, the fund did not incur any interest or penalties.
9. Subsequent Events:Management has determined there are no subsequent events or transactions through the date the financial statements were issued that would have materially impacted the financial statements as presented.
22
Schwab Balanced Fund | Annual Report
Report of Independent Registered Public Accounting Firm
To the Board of Trustees of Schwab Capital Trust and Shareholders of Schwab Balanced Fund:
Opinion on the Financial Statements and Financial Highlights
We have audited the accompanying statement of assets and liabilities, including the portfolio holdings, of Schwab Balanced Fund (the “Fund”), one of the funds constituting Schwab Capital Trust, as of October 31, 2023, the related statement of operations for the year then ended, the statements of changes in net assets for each of the two years in the period then ended, the financial highlights for each of the four years in the period then ended, and the related notes. In our opinion, the financial statements and financial highlights present fairly, in all material respects, the financial position of the Fund as of October 31, 2023, and the results of its operations for the year then ended, the changes in its net assets for each of the two years in the period then ended, and the financial highlights for each of the four years in the period then ended in conformity with accounting principles generally accepted in the United States of America. The financial highlights for the year ended October 31, 2019 were audited by other auditors, whose report, dated December 16, 2019, expressed an unqualified opinion on such financial highlights.
Basis for Opinion
These financial statements and financial highlights are the responsibility of the Fund’s management. Our responsibility is to express an opinion on the Fund’s financial statements and financial highlights based on our audits. We are a public accounting firm registered with the Public Company Accounting Oversight Board (United States) (PCAOB) and are required to be independent with respect to the Fund in accordance with the U.S. federal securities laws and the applicable rules and regulations of the Securities and Exchange Commission and the PCAOB.
We conducted our audits in accordance with the standards of the PCAOB. Those standards require that we plan and perform the audit to obtain reasonable assurance about whether the financial statements and financial highlights are free of material misstatement, whether due to error or fraud. The Fund is not required to have, nor were we engaged to perform, an audit of its internal control over financial reporting. As part of our audits, we are required to obtain an understanding of internal control over financial reporting but not for the purpose of expressing an opinion on the effectiveness of the Fund’s internal control over financial reporting. Accordingly, we express no such opinion.
Our audits included performing procedures to assess the risks of material misstatement of the financial statements and financial highlights, whether due to error or fraud, and performing procedures that respond to those risks. Such procedures included examining, on a test basis, evidence regarding the amounts and disclosures in the financial statements and financial highlights. Our audits also included evaluating the accounting principles used and significant estimates made by management, as well as evaluating the overall presentation of the financial statements and financial highlights. Our procedures included confirmation of securities owned as of October 31, 2023, by correspondence with the custodian and transfer agent. We believe that our audits provide a reasonable basis for our opinion.
Deloitte & Touche LLP
Denver, Colorado
December 15, 2023
We have served as the auditor of one or more investment companies in the Schwab Funds Complex since 2020.
Schwab Balanced Fund | Annual Report23
Other Federal Tax Information (unaudited)
Schwab Balanced Fund may elect to pass on the benefits of the foreign tax credit of $23,992 to its shareholders for the fiscal year ended October 31, 2023. The respective foreign source income on the fund is $582,628.
For corporate shareholders, 17.09% of the fund’s dividend distributions paid during the fiscal year ended October 31, 2023, qualify for the corporate dividends received deduction.
For the fiscal year ended October 31, 2023, the fund designates $1,903,669 of the dividend distributions as qualified dividends for the purposes of the maximum rate under section 1(h)(11) of the Internal Revenue Code. Shareholders will be notified in January 2024 via IRS Form 1099 of the amounts for use in preparing their 2023 income tax return.
Under section 852(b)(3)(C) of the Internal Revenue Code, the fund hereby designates $47,133,224 as long-term capital gain dividends for the fiscal year ended October 31, 2023.
For the fiscal year ended October 31, 2023, the fund designates $25,280 as dividends eligible for the 20% qualified business income deduction under section 199A of the Internal Revenue Code. Shareholders will be notified in January 2024 via IRS Form 1099 of the amounts for use in preparing their 2023 income tax return.
For the fiscal year ended October 31, 2023, the fund designates 41.14% of dividend income as business interest income under section 163(j) of the Internal Revenue Code.
24
Schwab Balanced Fund | Annual Report
Liquidity Risk Management Program (unaudited)
The fund has adopted and implemented a liquidity risk management program (the “program”) as required by Rule 22e-4 under the Investment Company Act of 1940, as amended. The fund’s Board of Trustees (the “Board”) has designated the fund’s investment adviser, Charles Schwab Investment Management, Inc., dba Schwab Asset Management, as the administrator of the program. Personnel of the investment adviser or its affiliates conduct the day-to-day operation of the program.
Under the program, the investment adviser manages a fund’s liquidity risk, which is the risk that the fund could not meet shareholder redemption requests without significant dilution of remaining shareholders’ interests in the fund. The program is reasonably designed to assess and manage a fund’s liquidity risk, taking into consideration the fund’s investment strategy and the liquidity of its portfolio investments during normal and reasonably foreseeable stressed conditions; its historical redemption history and shareholder concentrations; and its cash holdings and access to other funding sources, including the custodian overdraft facility and lines of credit. The investment adviser’s process of determining the degree of liquidity of each fund’s investments is supported by third-party liquidity assessment vendors.
The fund’s Board reviewed a report at its meeting held on September 19, 2023 prepared by the investment adviser regarding the operation and effectiveness of the program for the period June 1, 2022, through May 31, 2023, which included individual fund liquidity metrics. The report summarized the operation of the program and the information and factors considered by the investment adviser in assessing whether the program has been adequately and effectively implemented with respect to a fund. In addition, the investment adviser provided its assessment that the program had been operating effectively in managing the fund’s liquidity risk.
Schwab Balanced Fund | Annual Report25
Investment Advisory Agreement Approval
The Investment Company Act of 1940, as amended (the 1940 Act), requires that the continuation of a fund’s investment advisory agreement must be specifically approved (1) by the vote of the trustees or by a vote of the shareholders of the fund, and (2) by the vote of a majority of the trustees who are not parties to the investment advisory agreement or “interested persons” of any party thereto (the Independent Trustees), cast in person at a meeting called for the purpose of voting on such approval. In connection with such approvals, the fund’s trustees must request and evaluate, and the investment adviser is required to furnish, such information as may be reasonably necessary to evaluate the terms of the investment advisory agreement.
The Board of Trustees (the Board or the Trustees, as appropriate) calls and holds one or more meetings each year that are dedicated, in whole or in part, to considering whether to renew the investment advisory and administration agreement (the Agreement) between Schwab Capital Trust (the Trust) and Charles Schwab Investment Management, Inc. (dba Schwab Asset Management) (the investment adviser) with respect to the existing funds in the Trust, including Schwab Balanced Fund (the Fund), and to review certain other agreements pursuant to which the investment adviser provides investment advisory services to certain other registered investment companies. In preparation for the meeting(s), the Board requests and reviews a wide variety of materials provided by the investment adviser, including information about the investment adviser’s affiliates, personnel, business goals and priorities, profitability, third-party oversight, corporate structure and operations. As part of the renewal process, the Independent Trustees’ legal counsel, on behalf of the Independent Trustees, sends an information request letter to the investment adviser seeking certain relevant information. The responses by the investment adviser are provided to the Trustees in the Board materials for their review prior to their meeting, and the Trustees are provided with the opportunity to request any additional materials. The Board also receives data provided by an independent provider of investment company data. This information is in addition to the detailed information about the Fund that the Board reviews during the course of each year, including information that relates to the Fund’s operations and performance, legal and compliance matters, risk management, portfolio turnover, and sales and marketing activity. In considering the renewal, the Independent Trustees receive advice from Independent Trustees’ legal counsel, including a memorandum regarding the responsibilities of trustees for the approval of investment advisory agreements. In addition, the Independent Trustees participate in question and answer sessions with representatives of the investment adviser and meet in executive session outside the presence of Fund management.
The Board, including a majority of the Independent Trustees, considered information specifically relating to the continuance of the Agreement with respect to the Fund at meetings held on April 27, 2023 and June 7, 2023, and approved the renewal of the Agreement with respect to the Fund for an additional one-year term at the meeting on June 7, 2023 called for the purpose of voting on such approval.
The Board’s approval of the continuance of the Agreement with respect to the Fund was based on consideration and evaluation of a variety of specific factors discussed at these meetings and at prior meetings, including:
1.
the nature, extent and quality of the services provided to the Fund under the Agreement, including the resources of the investment adviser and its affiliates dedicated to the Fund;
2.
the Fund’s investment performance and how it compared to that of certain other comparable mutual funds and benchmark data;
3.
the Fund’s expenses and how those expenses compared to those of certain other similar mutual funds;
4.
the profitability of the investment adviser and its affiliates, including Charles Schwab & Co., Inc. (Schwab), with respect to the Fund, including both direct and indirect benefits accruing to the investment adviser and its affiliates; and
5.
the extent to which economies of scale would be realized as the Fund grows and whether fee levels in the Agreement reflect those economies of scale for the benefit of Fund investors.
Nature, Extent and Quality of Services. The Board considered the nature, extent and quality of the services provided by the investment adviser to the Fund and the resources of the investment adviser and its affiliates dedicated to the Fund. In this regard, the Trustees evaluated, among other things, the investment adviser’s experience, track record, compliance program, resources dedicated to hiring and retaining skilled personnel and specialized talent, and information security resources. The Trustees also considered information provided by the investment adviser relating to services and support provided with respect to the Fund’s portfolio management team, portfolio strategy, and internal investment guidelines, as well as trading infrastructure, liquidity management, product design and analysis, shareholder communications, securities valuation, and vendor and risk oversight. The Trustees also considered investments the investment adviser has made in its infrastructure, including modernizing the investment adviser’s technology and use of data, increasing expertise in key areas (including portfolio management and trade operations), and improving business continuity, cybersecurity, due diligence, risk
26
Schwab Balanced Fund | Annual Report
management processes, and information security programs, which are designed to provide enhanced services to the Fund and its shareholders. The Trustees considered Schwab’s overall financial condition and its reputation as a full service brokerage firm as well as the wide range of products, services and account features that benefit Fund shareholders who are brokerage clients of Schwab. Following such evaluation, the Board concluded, within the context of its full deliberations, that the nature, extent and quality of services provided by the investment adviser to the Fund and the resources of the investment adviser and its affiliates dedicated to the Fund supported renewal of the Agreement with respect to the Fund.
Fund Performance. The Board considered the Fund’s performance in determining whether to renew the Agreement with respect to the Fund. Specifically, the Trustees considered the Fund’s performance relative to a peer category of other mutual funds and applicable indices/benchmarks, in light of total return and the market environment, as well as in consideration of the Fund’s investment style and strategy. As part of this review, the Trustees considered the composition of the peer category, selection criteria and the reputation of the independent provider of investment company data who prepared the peer category analysis. In evaluating the performance of the Fund, the Trustees considered the risk profile for the Fund and the appropriateness of the benchmark used to compare the performance of the Fund. The Trustees further considered the level of Fund performance in the context of their review of Fund expenses and the investment adviser’s profitability discussed below and also noted that the Board and a designated committee of the Board review performance throughout the year. Following such evaluation, the Board concluded, within the context of its full deliberations, that the performance of the Fund supported renewal of the Agreement with respect to the Fund.
Fund Expenses. With respect to the Fund’s expenses, the Trustees considered the rate of compensation called for by the Agreement and the Fund’s operating expense ratio, in each case, in comparison to those of other similar mutual funds, such peer groups and comparisons having been selected and calculated by an independent provider of investment company data. The investment adviser reported to the Board, and the Board took into account, the risk assumed by the investment adviser in the development of the Fund and provision of services as well as the competitive marketplace for financial products. The Trustees also considered the investment adviser’s contractual commitment to limit the total annual operating expenses of the Fund for so long as it serves as the investment adviser to the Fund. The Trustees also considered fees charged by the investment adviser to other mutual funds and to other types of accounts, but, with respect to such other types of accounts, accorded less weight to such comparisons due to the different legal, regulatory, compliance and operating features of mutual funds as compared to these other types of accounts, and any differences in the nature and scope of the services the investment adviser provides to these other
accounts and any differences in the market for these types of accounts. The Trustees noted that shareholders of the Fund indirectly pay their pro rata share of the fees and expenses of the underlying funds in which the Fund invests. Following such evaluation, the Board concluded, within the context of its full deliberations, that the expenses of the Fund are reasonable and supported renewal of the Agreement with respect to the Fund.
Profitability. The Trustees considered the compensation flowing to the investment adviser and its affiliates, directly or indirectly and reviewed profitability on a pre-tax basis, without regard to distribution expenses. The Trustees reviewed the profitability of the investment adviser relating to the Schwab fund complex as a whole, noting the benefits to Fund shareholders of being part of the Schwab fund complex, including the allocations of certain costs across the Fund and other funds in the complex. The Trustees considered that the investment adviser is not charging any management fees at the Fund level; it being understood that there is a management fee at the underlying fund level. The Trustees also considered any other benefits derived by the investment adviser from its relationship with the Fund, such as whether, by virtue of its management of the Fund, the investment adviser obtains investment information or other research resources that aid it in providing advisory services to other clients. Also, because the Fund invests a portion of its assets in other funds within the Schwab fund complex, the Trustees considered that the investment adviser indirectly benefits from the Fund’s investments in other underlying funds managed by the investment adviser. The Trustees considered whether the compensation and profitability with respect to the Fund under the Agreement and other service agreements were reasonable in light of the quality of all services rendered to the Fund by the investment adviser and its affiliates. The Trustees noted that the investment adviser continues to invest substantial sums in its business in order to provide enhanced research capabilities, services and systems to benefit the Fund. Based on this evaluation, the Board concluded, within the context of its full deliberations, that the profitability of the investment adviser is reasonable and supported renewal of the Agreement with respect to the Fund.
Economies of Scale. Although the Trustees recognized the difficulty of determining economies of scale with precision, the Trustees considered the potential existence of any economies of scale and whether those are passed along to the Fund’s shareholders through (i) the enhancement of services provided to the Fund in return for fees paid, including through investments by the investment adviser in its infrastructure, including modernizing the investment adviser’s technology and use of data, increasing expertise and capabilities in key areas (including portfolio and trade operations), and improving business continuity, cybersecurity, due diligence and information security programs, which are designed to provide enhanced services to the Fund and its shareholders; and (ii) pricing a fund to scale and keeping overall expenses down
Schwab Balanced Fund | Annual Report27
as the fund grows. The Trustees acknowledged that, the investment adviser has invested in its infrastructure, as discussed above, over time and that the investment adviser’s internal costs of providing investment management, technology, administrative, legal and compliance services to the Fund continue to increase as a result of regulatory or other developments. The Trustees considered that the investment adviser and its affiliates employ contractual expense caps to protect shareholders from higher fees, including for example, when fund assets are relatively small. Based on this evaluation, the Board concluded, within the context of its full deliberations, that the Fund obtains reasonable benefits from economies of scale.
* * * * * * * * * * * * * * * * * * * * * * * * * * * * * * * * * * * * * * * *
In the course of their deliberations, the Trustees may have accorded different weights to various factors and did not identify any particular information or factor that was all important or controlling. Based on the Trustees’ deliberation and their evaluation of the information described above, the Board, including all of the Independent Trustees, approved the continuation of the Agreement with respect to the Fund and concluded that the compensation under the Agreement with respect to the Fund is fair and reasonable in light of the services provided and the related expenses borne by the investment adviser and its affiliates and such other matters as the Trustees considered to be relevant in the exercise of their reasonable judgment.
28
Schwab Balanced Fund | Annual Report
Trustees and Officers
The tables below give information about the trustees and officers of Schwab Capital Trust, which includes the fund covered in this report. The “Fund Complex” includes The Charles Schwab Family of Funds, Schwab Capital Trust, Schwab Investments, Schwab Annuity Portfolios, Schwab Strategic Trust and Laudus Trust. The Fund Complex includes 106 funds.
The address for all trustees and officers is 211 Main Street, San Francisco, CA 94105. You can find more information about the trustees and officers in the fund’s Statement of Additional Information, which is available free by calling 1-877-824-5615.
|
Name, Year of Birth, and Position(s) with the trust (Terms of office, and length of Time Served1) | Principal Occupations During the Past Five Years | Number of Portfolios in Fund Complex Overseen by the Trustee | |
Michael J. Beer 1961 Trustee (Trustee of The Charles Schwab Family of Funds, Schwab Investments, Schwab Capital Trust, Schwab Annuity Portfolios, Schwab Strategic Trust and Laudus Trust since 2022) | Retired. Director, President and Chief Executive Officer (Dec. 2016 – Sept. 2019), Principal Funds (investment management). | | Director (2016 – 2019), Principal Funds, Inc. |
Robert W. Burns 1959 Trustee (Trustee of Schwab Strategic Trust since 2009; The Charles Schwab Family of Funds, Schwab Investments, Schwab Capital Trust, Schwab Annuity Portfolios and Laudus Trust since 2016) | Retired/Private Investor. | | |
Nancy F. Heller 1956 Trustee (Trustee of The Charles Schwab Family of Funds, Schwab Investments, Schwab Capital Trust, Schwab Annuity Portfolios, Schwab Strategic Trust and Laudus Trust since 2018) | | | |
David L. Mahoney 1954 Trustee (Trustee of The Charles Schwab Family of Funds, Schwab Investments, Schwab Capital Trust, Schwab Annuity Portfolios and Laudus Trust since 2011; Schwab Strategic Trust since 2016) | | | Director (2004 – present), Corcept Therapeutics Incorporated Director (2009 – 2021), Adamas Pharmaceuticals, Inc. Director (2003 – 2019), Symantec Corporation |
Jane P. Moncreiff 1961 Trustee (Trustee of The Charles Schwab Family of Funds, Schwab Investments, Schwab Capital Trust, Schwab Annuity Portfolios, Schwab Strategic Trust and Laudus Trust since 2019) | Consultant (2018 – present), Fulham Advisers LLC (management consulting); Chief Investment Officer (2009 – 2017), CareGroup Healthcare System, Inc. (healthcare). | | |
Schwab Balanced Fund | Annual Report29
Independent Trustees (continued) |
Name, Year of Birth, and Position(s) with the trust (Terms of office, and length of Time Served1) | Principal Occupations During the Past Five Years | Number of Portfolios in Fund Complex Overseen by the Trustee | |
Kimberly S. Patmore 1956 Trustee (Trustee of The Charles Schwab Family of Funds, Schwab Investments, Schwab Capital Trust, Schwab Annuity Portfolios, Schwab Strategic Trust and Laudus Trust since 2016) | Consultant (2008 – present), Patmore Management Consulting (management consulting). | | |
J. Derek Penn 1957 Trustee (Trustee of The Charles Schwab Family of Funds, Schwab Investments, Schwab Capital Trust, Schwab Annuity Portfolios, Schwab Strategic Trust and Laudus Trust since 2021) | Head of Equity Sales and Trading (2006 – 2018), BNY Mellon (financial services). | | |
|
Name, Year of Birth, and Position(s) with the trust (Terms of office, and length of Time Served1) | Principal Occupations During the Past Five Years | Number of Portfolios in Fund Complex Overseen by the Trustee | |
Walter W. Bettinger II2 1960 Chairman and Trustee (Trustee of The Charles Schwab Family of Funds, Schwab Investments, Schwab Capital Trust and Schwab Annuity Portfolios since 2008; Schwab Strategic Trust since 2009; Laudus Trust since 2010) | Co-Chairman of the Board (July 2022 – present), Director and Chief Executive Officer (Oct. 2008 – present) and President (Feb. 2007 – Oct. 2021), The Charles Schwab Corporation; President and Chief Executive Officer (Oct. 2008 – Oct. 2021) and Director (May 2008 – Oct. 2021), Charles Schwab & Co., Inc.; Co-Chairman of the Board (July 2022 – present) and Director (Apr. 2006 – present), Charles Schwab Bank, SSB; Co-Chairman of the Board (July 2022 – present) and Director (Nov. 2017 – present), Charles Schwab Premier Bank, SSB; Co-Chairman of the Board (July 2022 – present) and Director (July 2019 – present), Charles Schwab Trust Bank; Director (May 2008 – present), Chief Executive Officer (Aug. 2017 – present) and President (Aug. 2017 – Nov. 2021), Schwab Holdings, Inc.; Manager (Sept. 2023 – present), TD Ameritrade Holding LLC; Director (Oct. 2020 – Aug. 2023), TD Ameritrade Holding Corporation; Director (July 2016 – Oct. 2021), Charles Schwab Investment Management, Inc. | | Director (2008 – present), The Charles Schwab Corporation |
Richard A. Wurster2 1973 Trustee (Trustee of The Charles Schwab Family of Funds, Schwab Investments, Schwab Capital Trust, Schwab Annuity Portfolios, Schwab Strategic Trust and Laudus Trust since 2022) | President (Oct. 2021 – present) and Executive Vice President – Schwab Asset Management Solutions (Apr. 2019 – Oct. 2021), The Charles Schwab Corporation; President, Director (Oct. 2021 – present), Executive Vice President – Schwab Asset Management Solutions (July 2019 – Oct. 2021) and Senior Vice President – Advisory (May 2016 – July 2019), Charles Schwab & Co., Inc.; President (Nov. 2021 – present), Schwab Holdings, Inc.; Director (Oct. 2021 – present) and Chief Executive Officer (Nov. 2019 – Jan. 2022), Charles Schwab Investment Management, Inc.; Director, Chief Executive Officer and President (Mar. 2018 – Oct. 2022), Charles Schwab Investment Advisory, Inc.; Chief Executive Officer (July 2016 – Apr. 2018) and President (Mar. 2017 – Apr. 2018), ThomasPartners, Inc.; Chief Executive Officer (July 2016 – Apr. 2018), Windhaven Investment Management, Inc. | | |
30
Schwab Balanced Fund | Annual Report
|
Name, Year of Birth, and Position(s) with the trust (Terms of office, and length of Time Served3) | Principal Occupations During the Past Five Years |
Omar Aguilar 1970 Chief Executive Officer, President and Chief Investment Officer (Officer of The Charles Schwab Family of Funds, Schwab Investments, Schwab Capital Trust, Schwab Annuity Portfolios, Schwab Strategic Trust and Laudus Trust since 2011) | Chief Executive Officer (Jan. 2022 – present), President (Oct. 2023 – present), (Chief Investment Officer (Apr. 2011 – present) and Senior Vice President (Apr. 2011 – Jan. 2022), Charles Schwab Investment Management, Inc.; Director, Chief Executive Officer and President (Oct. 2022 – present), Charles Schwab Investment Advisory, Inc.; Chief Executive Officer (Sept. 2023 – present), President (Oct. 2023 – present), Chief Investment Officer (June 2011 – present) and Vice President (June 2011 – Sept. 2023), Schwab Funds, Laudus Trust and Schwab ETFs. |
Mark Fischer 1970 Chief Operating Officer (Officer of The Charles Schwab Family of Funds, Schwab Investments, Schwab Capital Trust, Schwab Annuity Portfolios, Schwab Strategic Trust and Laudus Trust since 2013) | Chief Operating Officer (Dec. 2020 – present) and Treasurer and Chief Financial Officer (Jan. 2016 – Dec. 2022), Schwab Funds, Laudus Trust and Schwab ETFs; Chief Financial Officer (Mar. 2020 – present), Chief Operating Officer (Oct. 2023 – present), Managing Director (Mar. 2023 – present) and Vice President (Oct. 2013 – Mar. 2023), Charles Schwab Investment Management, Inc. |
Dana Smith 1965 Treasurer and Chief Financial Officer (Officer of The Charles Schwab Family of Funds, Schwab Investments, Schwab Capital Trust, Schwab Annuity Portfolios, Schwab Strategic Trust and Laudus Trust since 2023) | Treasurer and Chief Financial Officer (Jan. 2023 – present) and Assistant Treasurer (Dec. 2015 – Dec. 2022), Schwab Funds, Laudus Trust and Schwab ETFs; Managing Director (Mar. 2023 – present), Vice President (Mar. 2022 – Mar. 2023) and Director (Oct. 2015 – Mar. 2022), Charles Schwab Investment Management, Inc.; Managing Director (May 2022 – present) and Vice President (Apr. 2022 – May 2022), Charles Schwab & Co., Inc. |
Patrick Cassidy 1964 Vice President and Chief Investment Officer (Officer of The Charles Schwab Family of Funds, Schwab Investments, Schwab Capital Trust, Schwab Annuity Portfolios, Schwab Strategic Trust and Laudus Trust since 2018) | Chief Investment Officer (Oct. 2023 – present) and Vice President (Feb. 2018 – present), Schwab Funds, Laudus Trust and Schwab ETFs; Managing Director (Mar. 2023 – present), Chief Investment Officer (Oct. 2023 – present), and Senior Vice President (Oct. 2012 – Mar. 2023), Charles Schwab Investment Management, Inc. |
William P. McMahon, Jr. 1972 Vice President and Chief Investment Officer (Officer of The Charles Schwab Family of Funds, Schwab Investments, Schwab Capital Trust, Schwab Annuity Portfolios, Schwab Strategic Trust and Laudus Trust since 2021) | Managing Director (Mar. 2023 – present), Senior Vice President (Jan. 2020 – Mar. 2023) and Chief Investment Officer (Jan. 2020 – present) Charles Schwab Investment Management, Inc.; Vice President and Chief Investment Officer (June 2021 – present), Schwab Funds, Laudus Trust and Schwab ETFs; Senior Vice President and Chief Investment Officer – ThomasPartners Strategies (Apr. 2018 – Dec. 2019), Charles Schwab Investment Advisory, Inc.; Senior Vice President and Chief Investment Officer (May 2001 – Apr. 2018), ThomasPartners, Inc. |
Catherine MacGregor 1964 Chief Legal Officer and Secretary, Schwab Funds and Schwab ETFs Chief Legal Officer, Vice President and Clerk, Laudus Trust (Officer of The Charles Schwab Family of Funds, Schwab Investments, Schwab Capital Trust, Schwab Annuity Portfolios and Laudus Trust since 2005; Schwab Strategic Trust since 2009) | Chief Legal Officer (Mar. 2022 – present), Managing Director (Mar. 2023 – present) and Vice President (Sept. 2005 – Mar. 2023), Charles Schwab Investment Management, Inc.; Managing Director (May 2022 – present) and Vice President (Aug. 2005 – May 2022), Charles Schwab & Co., Inc.; Vice President (Dec. 2005 – present) and Chief Legal Officer and Clerk (Mar. 2007 – present), Laudus Trust; Chief Legal Officer and Secretary (Oct. 2021 – present), Vice President (Nov. 2005 – Oct. 2021) and Assistant Secretary (June 2007 – Oct. 2021), Schwab Funds; Chief Legal Officer and Secretary (Oct. 2021 – present), Vice President and Assistant Secretary (Oct. 2009 – Oct. 2021), Schwab ETFs. |
1
Each Trustee shall hold office until the election and qualification of his or her successor, or until he or she dies, resigns or is removed. The retirement policy requires that each independent trustee retire by December 31 of the year in which the Trustee turns 74 or the Trustee’s twentieth year of service as an independent trustee on any trust in the Fund Complex, whichever occurs first.
2
Mr. Bettinger and Mr. Wurster are Interested Trustees. Mr. Bettinger and Mr. Wurster are Interested Trustees because each owns stock of The Charles Schwab Corporation (CSC), the parent company of Charles Schwab Investment Management, Inc., the investment adviser for the trusts in the Fund Complex, and is an employee of Charles Schwab & Co., Inc. (Schwab), the principal underwriter for The Charles Schwab Family of Funds, Schwab Investments, Schwab Capital Trust, Schwab Annuity Portfolios and Laudus Trust.
3
The President, Treasurer and Secretary/Clerk hold office until their respective successors are chosen and qualified or until he or she sooner dies, resigns, is removed or becomes disqualified. Each of the other officers serves at the pleasure of the Board.
Schwab Balanced Fund | Annual Report31
asset allocation The practice of dividing a portfolio among different asset classes, with each asset class assigned a particular percentage.
asset class A group of securities with similar structure and basic characteristics. Stocks, bonds and cash are the three main examples of asset classes.
Balanced Blended Index A custom blended index developed by Schwab Asset Management that, effective February 1, 2022, is composed of 41.5% S&P 500 Index, 8.5% Russell 2000 Index, 10.0% MSCI EAFE Index (Net), 37.0% Bloomberg US Aggregate Bond Index, and 3.0% Bloomberg US Treasury Bills 1-3 Month Index. From January 29, 2019 through January 31, 2022, the composite was composed of 50% S&P 500 Index, 10% Russell 2000 Index, 37% Bloomberg US Aggregate Bond Index, and 3% Bloomberg US Treasury Bills 1-3 Month Index. From August 1, 2013 through January 28, 2019, the composite was composed of 50% S&P 500 Index, 10% Russell 2000 Index, 25% Bloomberg US Aggregate Bond Index, 12% Bloomberg US Intermediate Aggregate Bond Index and 3% Bloomberg US Treasury Bills 1-3 Month Index. Prior to August 1, 2013 the Balanced Blended Index was composed of 60% S&P 500 Index and 40% Bloomberg US Aggregate Bond Index. Percentages listed may not total to 100% due to rounding.
Bloomberg US Aggregate Bond Index An index that is a broad-based benchmark measuring the performance of the U.S. investment grade, taxable bond market, including U.S. Treasuries, government-related and corporate bonds, mortgage pass-through securities, commercial mortgage-backed securities, and asset-backed securities that are publicly available for sale in the United States. To be eligible for inclusion in the index, securities must be fixed rate, non-convertible, U.S. dollar-denominated with at least $300 million or more of outstanding face value and have one or more years remaining to maturity. The index excludes certain types of securities, including tax-exempt state and local government series bonds, structured notes embedded with swaps or other special features, private placements, floating rate securities, inflation-linked bonds and Eurobonds. The index is market capitalization weighted and the securities in the index are updated on the last business day of each month.
Bloomberg US Intermediate Aggregate Bond Index An index that represents securities that are SEC-registered, taxable, and dollar denominated. The index covers the U.S. investment grade fixed rate bond market, with index components for government and corporate securities, mortgage pass-through securities, and asset-backed securities.
Bloomberg US Treasury Bills 1–3 Month Index An index that includes all publicly issued zero-coupon U.S. Treasury Bills that have a remaining maturity of less than 3 months but more than 1 month, are rated investment grade and have $300 million or more of outstanding face value. It excludes zero-coupon STRIPS.
bond A security representing a loan from the investor to the issuer. A bond typically pays interest at a fixed rate (the coupon rate) until a specified date (the maturity date), at which time the issuer returns the money borrowed (principal or face value) to the bondholder. Because of their structure, bonds are sometimes called “fixed-income securities” or “debt securities.”
An individual bond is subject to the credit risk of the issuer. Changes in interest rates can affect a bond’s market value prior to call or maturity. There is no guarantee that a bond’s yield to call or maturity will provide a positive return over the rate of inflation.
bond fund A bond fund is subject to the same credit, interest rate, and inflation risks as bonds. In addition, a bond fund incurs ongoing fees and expenses. A bond fund’s net asset value will fluctuate with the price of the underlying bonds and the portfolio turnover activity; return of principal is not guaranteed.
cap, capitalization See “market cap.”
capital gain, capital loss the difference between the amount paid for an investment and its value at a later time. If the investment has been sold, the capital gain or loss is considered a realized gain or loss. If the investment is still held, the capital gain or loss is considered unrealized appreciation or depreciation.
expense ratio The amount that is taken from a mutual fund’s assets each year to cover the fund’s operating expenses. An expense ratio of 0.50% means that a fund’s expenses amount to half of one percent of its average net assets a year.
FTSE non-US Dollar World Government Bond Index A market capitalization index that measures the total rate of return performance for the government bonds of 22 countries, excluding the U.S., with a remaining maturity of at least 1 year.
market cap, market capitalization The value of a company as determined by the total value of all shares of its stock outstanding.
MSCI EAFE Index (Net) A free float-adjusted market capitalization index that is designed to measure the equity market performance of developed markets in Europe, Australasia, and the Far East. The Net version of the index reflects reinvested dividends net of withholding taxes, but reflects no deductions for expenses or other taxes; returns are calculated applying dividend withholding rates applicable to non-resident persons who do not benefit from double taxation treaties.
MSCI Emerging Markets Index (Net) A free float-adjusted market capitalization weighted index that is designed to measure equity market performance in the global emerging markets. This series approximates the minimum possible dividend reinvestment. The returns are calculated applying dividend withholding rates applicable to non-resident persons who do not benefit from double taxation treaties.
net asset value (NAV) The value of one share of a mutual fund. NAV is calculated by taking the fund’s total assets, subtracting liabilities, and dividing by the number of shares outstanding.
outstanding shares, shares outstanding When speaking of a company or mutual fund, indicates all shares currently held by investors.
price-to-book ratio (P/B) The market price of a company’s stock compared with its “book value.” A mutual fund’s P/B is the weighted average of the P/B of all stocks in the fund’s portfolio.
price-to-earnings ratio (P/E) The market price of a company’s stock compared with earnings over the past year. A mutual fund’s P/E is the weighted average of the P/E of all stocks in the fund’s portfolio.
return on equity (ROE) The average yearly rate of return for each dollar of investors’ money, measured over the past five years.
Russell 1000 Growth Index An index that measures the performance of those Russell 1000 Index companies with higher price-to-book ratios and higher forecasted growth values.
32
Schwab Balanced Fund | Annual Report
Russell 1000 Index An index that measures the performance of the 1,000 largest companies in the Russell 3000 Index, and represents approximately 92% of the total market capitalization of the Russell 3000 Index. The Russell 3000 Index measures the performance of the largest 3,000 U.S. companies representing approximately 98% of the investable U.S. equity market.
Russell 1000 Value Index An index that measures the performance of the large-cap value segment of the U.S. equity universe. It includes those Russell 1000 Index companies with lower price-to-book ratios and lower expected growth values.
Russell 2000 Index An index that measures the performance of the 2,000 smallest companies in the Russell 3000 Index. The Russell 3000 Index measures the performance of the largest 3,000 U.S. companies representing approximately 98% of the investable U.S. equity market.
S&P 500 Index An index that is designed to measure the performance of 500 leading publicly traded companies from a broad range of industries.
stock A share of ownership, or equity, in the issuing company.
total return The percentage that an investor would have earned or lost on an investment in the fund assuming dividends and distributions were reinvested.
weighted average For mutual funds, an average that gives the same weight to each security as the security represents in the fund’s portfolio.
yield The income paid out by an investment, expressed as a percentage of the investment’s market value.
Schwab Balanced Fund | Annual Report33
Schwab Asset Management
With a straightforward lineup of core products and solutions for building the foundation of a portfolio, Schwab Asset Management advocates for investors of all sizes with a steadfast focus on lowering costs and reducing unnecessary complexity. The list below shows all currently available Schwab Funds®.
Investors should carefully consider information contained in the prospectus, or if available, the summary prospectus, including investment objectives, risks, charges and expenses before investing. Please call 1-877-824-5615 for a prospectus for any Schwab Fund. Please read the prospectus carefully before you invest. This report must be preceded or accompanied by a current prospectus.
Proxy Voting Policies, Procedures and Results
A description of the proxy voting policies and procedures used to determine how to vote proxies on behalf of the funds is available without charge, upon request, by visiting the Schwab Funds’ website at www.schwabassetmanagement.com/schwabfunds_prospectus, the SEC’s website at www.sec.gov, or by contacting Schwab Funds at 1-877-824-5615.
Information regarding how a fund voted proxies relating to portfolio securities during the most recent twelve-month period ended June 30 is available, without charge, by visiting the fund’s website at www.schwabassetmanagement.com/schwabfunds_prospectus or the SEC’s website at www.sec.gov.
Schwab Funds
Equity Funds
Schwab Core Equity Fund
Schwab Dividend Equity Fund
Schwab Large-Cap Growth Fund
Schwab Small-Cap Equity Fund
Schwab Health Care Fund
Schwab International Core Equity Fund
Schwab International Opportunities Fund
Schwab Select Large Cap Growth Fund
Schwab Fundamental US Large Company Index Fund
Schwab Fundamental US Small Company Index Fund
Schwab Fundamental International Large Company Index Fund
Schwab Fundamental International Small Company Index Fund
Schwab Fundamental Emerging Markets Large Company Index Fund
Schwab Fundamental Global Real Estate Index Fund
Schwab Global Real Estate Fund
Schwab S&P 500 Index Fund
Schwab 1000 Index® Fund
Schwab Small-Cap Index Fund®
Schwab Total Stock Market Index Fund®
Schwab U.S. Large-Cap Growth Index Fund
Schwab U.S. Large-Cap Value Index Fund
Schwab U.S. Mid-Cap Index Fund
Schwab International Index Fund®
Asset Allocation Funds
Schwab Balanced Fund
Schwab MarketTrack Portfolios®
Schwab Target Funds
Schwab Target Index Funds
Schwab Monthly Income Funds
Bond Funds
Schwab Treasury Inflation Protected Securities Index Fund
Schwab U.S. Aggregate Bond Index Fund
Schwab Short-Term Bond Index Fund
Schwab Tax-Free Bond Fund1
Schwab California Tax-Free Bond Fund1
Schwab Opportunistic Municipal Bond Fund
Schwab Money Funds2
Schwab provides a broad choice of taxable and tax-exempt money market funds for both retail and institutional client types.
Investment Adviser
Charles Schwab Investment Management, Inc., dba Schwab Asset Management
211 Main Street, San Francisco, CA 94105
Funds
Schwab Funds
1-877-824-5615
© 2023 Charles Schwab & Co., Inc. All rights reserved.
Member SIPC®
Printed on recycled paper.
¹
State, local, and the Federal Alternative Minimum Tax may apply. Capital gains are not exempt from Federal Taxation.
²
You could lose money by investing in the Schwab Money Funds. All Schwab Money Funds with the exception of Schwab Variable Share Price Money Fund seek to preserve the value of your investment at $1.00 per share, but cannot guarantee they will do so. Because the share price of Schwab Variable Share Price Money Fund will fluctuate, when you sell your shares they may be worth more or less than what you originally paid for them. All Schwab Money Funds with the exception of Schwab Government Money Fund, Schwab Retirement Government Money Fund, Schwab U.S. Treasury Money Fund, Schwab Treasury Obligations Money Fund and Schwab Government Money Market Portfolio may impose a fee upon the sale of your shares if the Fund’s Board determines that the fee is in the best interests of the Fund. An investment in the Schwab Money Funds is not insured or guaranteed by the Federal Deposit Insurance Corporation or any other government agency. The Schwab Money Funds’ sponsor has no legal obligation to provide financial support to the Funds, and you should not expect that the sponsor will provide financial support to the Funds at any time.
This page is intentionally left blank.
Annual Report | October 31, 2023
Schwab Equity Index Funds®
Schwab S&P 500 Index Fund
Schwab 1000 Index® Fund
Schwab Small-Cap Index Fund®
Schwab Total Stock Market Index Fund®
Schwab U.S. Large-Cap Growth
Index Fund
Schwab U.S. Large-Cap Value
Index Fund
Schwab U.S. Mid-Cap Index Fund
Schwab International Index Fund®
This page is intentionally left blank.
Eight cost-efficient ways to tap into the power of the stock market for long-term growth potential.
Fund investment adviser: Charles Schwab Investment Management, Inc., dba Schwab Asset Management®
Distributor: Charles Schwab & Co., Inc. (Schwab)
The Sector/Industry classifications in this report use the Global Industry Classification Standard (GICS) which was developed by and is the exclusive property of MSCI Inc. (MSCI) and Standard & Poor’s (S&P). GICS is a service mark of MSCI and S&P and has been licensed for use by Schwab. The Industry classifications used in the Portfolio Holdings are sub-categories of Sector classifications.
Schwab Equity Index Funds | Annual Report1
Schwab Equity Index Funds
The performance data quoted represents past performance. Past performance does not guarantee future results. Investment returns and principal value of an investment will fluctuate so that an investor’s shares may be worth more or less than their original cost. Current performance may be lower or higher than performance data quoted. To obtain performance information current to the most recent month end, please visit www.schwabassetmanagement.com/schwabfunds_prospectus.
Total Return for the 12 Months Ended October 31, 2023 |
Schwab S&P 500 Index Fund (Ticker Symbol: SWPPX) | |
| |
Fund Category: Morningstar Large Blend1 | |
| |
| |
Schwab 1000 Index Fund (Ticker Symbol: SNXFX) | |
| |
| |
Fund Category: Morningstar Large Blend1 | |
| |
| |
Schwab Small-Cap Index Fund (Ticker Symbol: SWSSX) | |
| |
Fund Category: Morningstar Small Blend1 | |
| |
| |
Schwab Total Stock Market Index Fund (Ticker Symbol: SWTSX) | |
Dow Jones U.S. Total Stock Market IndexSM | |
Fund Category: Morningstar Large Blend1 | |
| |
Total Return for the 12 Months Ended October 31, 2023 |
| |
Schwab U.S. Large-Cap Growth Index Fund (Ticker Symbol: SWLGX) | |
Russell 1000® Growth Index | |
Fund Category: Morningstar Large Growth1 | |
| |
| |
Schwab U.S. Large-Cap Value Index Fund (Ticker Symbol: SWLVX) | |
Russell 1000® Value Index | |
Fund Category: Morningstar Large Value1 | |
| |
| |
Schwab U.S. Mid-Cap Index Fund (Ticker Symbol: SWMCX) | |
| |
Fund Category: Morningstar Mid-Cap Blend1 | |
| |
| |
Schwab International Index Fund2 (Ticker Symbol: SWISX) | |
| |
Fund Category: Morningstar Foreign Large Blend1 | |
| |
All total returns on this page assume dividends and distributions were reinvested. Index figures do not include trading and management costs, which would lower performance. Indices are unmanaged and cannot be invested in directly. Performance results less than one year are not annualized.
For index definitions, please see the Glossary.
Performance does not reflect the deduction of taxes that a shareholder would pay on fund distributions or on the redemption of fund shares.
1
Source for category information: Morningstar, Inc. The Morningstar Category return represents all active and index mutual funds and ETFs within the category as of the report date.
2
The fund’s performance relative to the index may be affected by fair-value pricing and timing differences in foreign exchange calculations. See financial note 2 for more information.
3
The net version of the index reflects reinvested dividends net of withholding taxes but reflects no deductions for expenses or other taxes.
2
Schwab Equity Index Funds | Annual Report
Schwab Equity Index Funds
The Investment Environment
For the 12-month reporting period ended October 31, 2023, U.S. equity markets were mixed, and international equity markets posted positive returns. U.S. stocks were volatile for the first half of the reporting period as inflation remained elevated, the U.S. Federal Reserve (Fed) continued to raise interest rates, and the failure of three U.S. regional banks in early March raised concerns about the stability of the banking sector. Despite these headwinds, as inflation began to ease, U.S. stocks staged a relatively steady upswing through August driven primarily by performance of the “Magnificent Seven” (Alphabet, Inc., Amazon.com, Inc., Apple, Inc., Meta Platforms, Inc., Microsoft Corp., NVIDIA Corp., and Tesla, Inc.). U.S. stocks, particularly dividend paying stocks, began to falter over the final two months of the reporting period as soaring U.S. Treasury yields offered investors attractive alternatives to stocks. Outside the U.S., the ongoing war between Russia and Ukraine and the Israel-Hamas war that broke out following Hamas’ attack on Israel in early October weighed on the global economy. The U.S. dollar, as measured against a basket of international currencies, generally weakened until mid-July, when it hit a reporting-period low, then began to rise but ended the reporting period weaker than where it began. For the reporting period, the S&P 500® Index, a bellwether for the overall U.S. stock market, returned 10.14%. U.S. large-cap stocks outperformed U.S. small-cap stocks, with the Russell 1000® Index and the Russell 2000® Index returning 9.48% and -8.56%, respectively. Among U.S. large-cap stocks, growth stocks outperformed value stocks, with the Russell 1000® Growth Index and the Russell 1000® Value Index returning 18.95% and 0.13%, respectively. Outside the U.S., the MSCI EAFE® Index (Net)*, a broad measure of developed international equity performance, returned 14.40% for the reporting period.
Economies around the world grew out of sync as they wrestled with record levels of government debt, rising geopolitical tensions, and weak productivity gains that stifled economic growth. The U.S. economy continued to show unexpected resiliency. Surprisingly robust job growth and strong consumer spending helped propel U.S. gross domestic product (GDP) to a 5.2% annualized growth rate for the third quarter of 2023, up from roughly 2% over the prior three quarters. Inflation remained above the Fed’s historical 2% target over the reporting period but declined between November 2022 and June 2023 as rents and wage growth eased, profit margins declined, and monetary policy remained restrictive before ticking up slightly in July 2023 through September 2023. The unemployment rate remained low throughout the period despite inflationary pressures but did rise slightly in August and October. An
Asset Class Performance Comparison % returns during the 12 months ended October 31, 2023
Index figures assume dividends and distributions were reinvested. Index figures do not include trading and management costs, which would lower performance. Indices are unmanaged and cannot be invested in directly. Performance results less than one year are not annualized. Past performance is not a guarantee of future results.
For index definitions, please see the Glossary.
Data source: Index provider websites and Schwab Asset Management.
Nothing in this report represents a recommendation of a security by the investment adviser.
Management views may have changed since the report date.
*
The net version of the index reflects reinvested dividends net of withholding taxes but reflects no deductions for expenses or other taxes.
Schwab Equity Index Funds | Annual Report3
Schwab Equity Index Funds
The Investment Environment (continued)
increase in the labor force participation rate (the proportion of working-age Americans who have a job or are looking for one) in August and strike activity in October were large contributors to the increase in unemployment in the last three months of the reporting period.
Oil prices were volatile, ranging from a high of $92 per barrel at the beginning of the reporting period to a low of $66 and ending the period at just over $80 per barrel. Eurozone GDP growth contracted slightly in the fourth quarter of 2022 driven by manufacturing pressures and headwinds related to oil and commodity prices, was flat for the first quarter of 2023, expanded slightly for the second quarter of 2023 bolstered by a moderation in inflationary pressures, and contracted slightly for the third quarter of 2023 as financing conditions remained tight. The United Kingdom posted small gains in GDP growth throughout the reporting period, with household consumption expenditures and manufacturing output among key growth drivers. In Japan, following flat GDP growth in the fourth quarter of 2022, GDP rose for the first two quarters of 2023, primarily on rising exports and falling imports. Among emerging markets, China’s GDP grew throughout the reporting period as the government’s various policies seeking to help the economy have offset the impact of a prolonged property crisis and weak trade. India’s GDP grew in the fourth quarter of 2022 and the first two quarters of 2023, driven primarily by robust performance of the services sector along with strong consumer demand and increased government spending.
In its efforts to lower inflation, the Fed raised interest rates six times during the reporting period, increasing the federal funds rate from a range of 3.00% to 3.25% to a range of 5.25% to 5.50%. At its meetings in June, September, and October, the Fed maintained the then current rates, citing robust economic activity, strong—though moderating—job gains, and low unemployment while acknowledging tighter financial and credit conditions for households and businesses. The Fed also maintained its program to reduce the assets held on its balance sheet, though its balance sheet temporarily spiked in March 2023 when the Fed supported banks after the failure of three U.S. regional banks. Despite the spike, balance sheet assets declined over the reporting period. Central banks outside the United States also battled with persistently high, albeit waning, inflation. After raising rates eight times during the reporting period, the European Central Bank held its rate steady at its October meeting as inflation and pricing pressures finally showed signs of easing. Similarly, the Bank of England maintained its key official bank rate at its September meeting, after seven rate hikes during the reporting period, leaving borrowing costs at a 15-year high. In contrast, the Bank of Japan continued to uphold its short-term interest rate target of -0.1%, unchanged since 2016, despite inflationary pressures but relaxed its yield control policy.
4
Schwab Equity Index Funds | Annual Report
Schwab Equity Index Funds
| Christopher Bliss, CFA, Managing Director and Head of Passive Equity Strategies for Schwab Asset Management, is responsible for overseeing the investment process and portfolio management of investment strategies for passive equity Schwab Funds and Schwab ETFs, and Schwab Personalized Indexing™ separately managed accounts. Before joining Schwab in 2016, Mr. Bliss spent 12 years at BlackRock (formerly Barclays Global Investors) managing and leading institutional index teams, most recently as a managing director and the head of the Americas institutional index team. In this role, Mr. Bliss was responsible for overseeing a team of portfolio managers managing domestic, developed international and emerging markets index strategies. Prior to BlackRock, he worked as an equity analyst and portfolio manager for Harris Bretall and before that, as a research analyst for JP Morgan. |
| Jeremy Brown, CFA, Senior Portfolio Manager for Schwab Asset Management, is responsible for the day-to-day co-management of the funds, except for the Schwab International Index Fund. Prior to joining Schwab in 2017, Mr. Brown spent six years with ALPS Advisors, Inc. in Denver, most recently as a senior analyst on the ETF portfolio management and research team where he performed portfolio management, trading, and analytics/research functions for ALPS ETFs and passive funds. Additionally, Mr. Brown led a number of investment research, commentary, industry trend analysis, and sales and marketing support initiatives. |
| Ferian Juwono, CFA, Senior Portfolio Manager for Schwab Asset Management, is responsible for the oversight and day-to-day co-management of the funds, except for the Schwab International Index Fund. Prior to joining Schwab in 2010, Mr. Juwono worked at BlackRock (formerly Barclays Global Investors) where he spent more than three years as a portfolio manager, managing equity index funds for institutional clients, and two years as a senior business analyst. Prior to that, Mr. Juwono worked for more than four years as a senior financial analyst with Union Bank of California. |
| David Rios, Portfolio Manager for Schwab Asset Management, is responsible for the day-to-day co-management of the Schwab International Index Fund. Prior to this role, Mr. Rios was an associate portfolio manager on the equity index strategies team for four years. His first role with Schwab Asset Management was as a trade operations specialist. Prior to joining Schwab in 2008, Mr. Rios was a senior fund accountant at Investors Bank & Trust (subsequently acquired by State Street Corporation). |
| Agnes Zau, CFA, Portfolio Manager for Schwab Asset Management, is responsible for the day-to-day co-management of the funds, except for the Schwab International Index Fund. Prior to joining Schwab in 2018, Ms. Zau was at BlackRock for three years, most recently as a multi-asset portfolio investment consultant where she advised institutional clients on asset allocation and strategy, constructed risk decomposition and portfolio optimization, and conducted scenario analyses for the core multi-asset target risk strategies. She spent the preceding three years as a derivatives specialist at Mellon Capital. |
Schwab Equity Index Funds | Annual Report5
Schwab S&P 500 Index Fund as of October 31, 2023
The Schwab S&P 500 Index Fund’s (the fund) goal is to track the total return of the S&P 500® Index (the index). The index includes the stocks of 500 leading U.S. publicly traded companies from a broad range of industries. The fund generally will seek to replicate the performance of the index by giving the same weight to a given stock as the index does. For more information concerning the fund’s investment objective, strategies, and risks, please see the fund’s prospectus.
Market Highlights. For the 12-month reporting period ended October 31, 2023, U.S. equity markets were mixed, and international equity markets posted positive returns. U.S. stocks were volatile for the first half of the reporting period as inflation remained elevated, the U.S. Federal Reserve (Fed) continued to raise interest rates, and the failure of three U.S. regional banks in early March raised concerns about the stability of the banking sector. Despite these headwinds, as inflation began to ease, U.S. stocks staged a relatively steady upswing through August driven primarily by performance of the “Magnificent Seven” (Alphabet, Inc., Amazon.com, Inc., Apple, Inc., Meta Platforms, Inc., Microsoft Corp., NVIDIA Corp., and Tesla, Inc.). U.S. stocks, particularly dividend paying stocks, began to falter over the final two months of the reporting period as soaring U.S. Treasury yields offered investors attractive alternatives to stocks. Outside the U.S., the ongoing war between Russia and Ukraine and the Israel-Hamas war that broke out following Hamas’ attack on Israel in early October weighed on the global economy. U.S. large-cap stocks outperformed U.S. small-cap stocks and among U.S. large-cap stocks, growth stocks outperformed value stocks.Within the index, stocks in the communication services and information technology sectors were the top performers, while stocks in the utilities and real estate sectors underperformed.
Performance. The fund generally tracked the index for the reporting period. The fund returned 10.11% for the 12-month reporting period ended October 31, 2023, compared with the index, which returned 10.14%. Differences between the return of the fund and the return of the index may be attributable to, among other things, the operational and transactional costs incurred by the fund and not the index.
Contributors and Detractors. The health care sector detracted the most from the total return of the fund. Health care stocks represented an average weight of approximately 14% of the fund’s investments and returned approximately -5% for the reporting period. One example from this sector is Pfizer, Inc., a pharmaceutical company, which represented an average weight of less than 1% of the fund’s investments and returned approximately -32% for the reporting period.
The financials sector also detracted from the total return of the fund, representing an average weight of approximately 11% of the fund’s investments and returning approximately -2% for the reporting period.
The information technology sector contributed the most to the total return of the fund. Information technology stocks represented an average weight of approximately 29% of the fund’s investments and returned approximately 29% for the reporting period. One example from this sector is Microsoft Corp., which develops, manufactures, licenses, sells, and supports software products. The fund’s holdings of Microsoft Corp. represented an average weight of approximately 6% of the fund’s investments and returned approximately 47% for the reporting period.
The communication services sector also contributed to the total return of the fund, representing an average weight of approximately 8% of the fund’s investments and returning approximately 36% for the reporting period.
Management views and portfolio holdings may have changed since the report date.
6
Schwab Equity Index Funds | Annual Report
Schwab S&P 500 Index Fund
Performance and Fund Facts as of October 31, 2023
The performance data quoted represents past performance. Past performance does not guarantee future results. Investment returns and principal value of an investment will fluctuate so that an investor’s shares may be worth more or less than their original cost. Current performance may be lower or higher than performance data quoted. To obtain performance information current to the most recent month end, please visit www.schwabassetmanagement.com/schwabfunds_prospectus.
Performance of Hypothetical $10,000 Investment (October 31, 2013 – October 31, 2023)1
Average Annual Total Returns1
| | | |
Fund: Schwab S&P 500 Index Fund (5/19/97) | | | |
| | | |
Fund Category: Morningstar Large Blend2 | | | |
Fund Expense Ratio3: 0.02% |
All total returns on this page assume dividends and distributions were reinvested. Index figures do not include trading and management costs, which would lower performance. Indices are unmanaged and cannot be invested in directly. Performance results less than one year are not annualized.
For index definitions, please see the Glossary.
Index ownership – “Standard & Poor’s®,” “S&P®,” and “S&P 500®” are registered trademarks of Standard & Poor’s Financial Services LLC (S&P), and “Dow Jones®” is a registered trademark of Dow Jones Trademark Holdings LLC (Dow Jones) and have been licensed for use by S&P Dow Jones Indices LLC and its affiliates and sublicensed for certain purposes by Charles Schwab Investment Management, Inc. The “S&P 500® Index” is a product of S&P Dow Jones Indices LLC or its affiliates, and has been licensed for use by Charles Schwab Investment Management, Inc. The Schwab S&P 500 Index Fund is not sponsored, endorsed, sold or promoted by S&P Dow Jones Indices LLC, Dow Jones, S&P, or their respective affiliates, and neither S&P Dow Jones Indices LLC, Dow Jones, S&P, nor their respective affiliates make any representation regarding the advisability of investing in the fund.
1
Performance does not reflect the deduction of taxes that a shareholder would pay on fund distributions or the redemption of fund shares.
2
Source for category information: Morningstar, Inc. The Morningstar Category return represents all active and index mutual funds and ETFs within the category as of the report date.
3
As stated in the prospectus.
Schwab Equity Index Funds | Annual Report7
Schwab S&P 500 Index Fund
Performance and Fund Facts as of October 31, 2023 (continued)
| |
Weighted Average Market Cap (millions) | |
Price/Earnings Ratio (P/E) | |
| |
| |
Sector Weightings % of Investments3
Top Equity Holdings % of Net Assets6
Portfolio holdings may have changed since the report date.
Source of Sector Classification: S&P and MSCI.
2
Portfolio turnover rate excludes in-kind transactions.
3
The percentage may differ from the Portfolio Holdings because the above calculation is based on a percentage of total investments, excluding derivatives, whereas the calculation in the Portfolio Holdings is based on a percentage of net assets.
5
Includes the fund’s position(s) in money market mutual funds registered under the Investment Company Act of 1940, as amended.
6
This list is not a recommendation of any security by the investment adviser.
8
Schwab Equity Index Funds | Annual Report
Schwab 1000 Index Fund as of October 31, 2023
The Schwab 1000 Index Fund’s (the fund) goal is to match the total return of the Schwab 1000 Index® (the index). The index is a float-adjusted market capitalization weighted index that includes the 1,000 largest stocks of publicly traded companies in the United States, with size being determined by market capitalization (total market value of all shares outstanding). The fund generally will seek to replicate the performance of the index by giving the same weight to a given stock as the index does. For more information concerning the fund’s investment objective, strategies, and risks, please see the fund’s prospectus.
Market Highlights. For the 12-month reporting period ended October 31, 2023, U.S. equity markets were mixed, and international equity markets posted positive returns. U.S. stocks were volatile for the first half of the reporting period as inflation remained elevated, the U.S. Federal Reserve (Fed) continued to raise interest rates, and the failure of three U.S. regional banks in early March raised concerns about the stability of the banking sector. Despite these headwinds, as inflation began to ease, U.S. stocks staged a relatively steady upswing through August driven primarily by performance of the “Magnificent Seven” (Alphabet, Inc., Amazon.com, Inc., Apple, Inc., Meta Platforms, Inc., Microsoft Corp., NVIDIA Corp., and Tesla, Inc.). U.S. stocks, particularly dividend paying stocks, began to falter over the final two months of the reporting period as soaring U.S. Treasury yields offered investors attractive alternatives to stocks. Outside the U.S., the ongoing war between Russia and Ukraine and the Israel-Hamas war that broke out following Hamas’ attack on Israel in early October weighed on the global economy. U.S. large-cap stocks outperformed U.S. small-cap stocks and among U.S. large-cap stocks, growth stocks outperformed value stocks. Within the index, stocks in the communication services and information technology sectors were the top performers, while stocks in the utilities and real estate sectors underperformed.
Performance. The fund generally tracked the index for the reporting period. The fund returned 9.35% for the 12-month reporting period ended October 31, 2023, compared with the index, which returned 9.39%. Differences between the return of the fund and the return of the index may be attributable to, among other things, the operational and transactional costs incurred by the fund and not the index.
Contributors and Detractors. The health care sector detracted the most from the total return of the fund. Health care stocks represented an average weight of approximately 14% of the fund’s investments and returned approximately -5% for the reporting period. One example from this sector is Pfizer, Inc., a pharmaceutical company, which represented an average weight of less than 1% of the fund’s investments and returned approximately -32% for the reporting period.
The financials sector also detracted from the total return of the fund, representing an average weight of approximately 11% of the fund’s investments and returning approximately -2% for the reporting period.
The information technology sector contributed the most to the total return of the fund. Information technology stocks represented an average weight of approximately 28% of the fund’s investments and returned approximately 28% for the reporting period. One example from this sector is Microsoft Corp., which develops, manufactures, licenses, sells, and supports software products. The fund’s holdings of Microsoft Corp. represented an average weight of approximately 6% of the fund’s investments and returned approximately 47% for the reporting period.
The communication services sector also contributed to the total return of the fund, representing an average weight of approximately 8% of the fund’s investments and returning approximately 33% for the reporting period.
Management views and portfolio holdings may have changed since the report date.
Schwab Equity Index Funds | Annual Report9
Performance and Fund Facts as of October 31, 2023
The performance data quoted represents past performance. Past performance does not guarantee future results. Investment returns and principal value of an investment will fluctuate so that an investor’s shares may be worth more or less than their original cost. Current performance may be lower or higher than performance data quoted. To obtain performance information current to the most recent month end, please visit www.schwabassetmanagement.com/schwabfunds_prospectus.
Performance of Hypothetical $10,000 Investment (October 31, 2013 – October 31, 2023)1
Average Annual Total Returns1
| | | |
Fund: Schwab 1000 Index Fund (4/2/91) | | | |
| | | |
| | | |
Fund Category: Morningstar Large Blend2 | | | |
Fund Expense Ratio3: 0.05% |
All total returns on this page assume dividends and distributions were reinvested. Index figures do not include trading and management costs, which would lower performance. Indices are unmanaged and cannot be invested in directly. Performance results less than one year are not annualized.
For index definitions, please see the Glossary.
1
Performance does not reflect the deduction of taxes that a shareholder would pay on fund distributions or the redemption of fund shares.
2
Source for category information: Morningstar, Inc. The Morningstar Category return represents all active and index mutual funds and ETFs within the category as of the report date.
3
As stated in the prospectus.
10
Schwab Equity Index Funds | Annual Report
Performance and Fund Facts as of October 31, 2023 (continued)
| |
Weighted Average Market Cap (millions) | |
Price/Earnings Ratio (P/E) | |
| |
| |
Sector Weightings % of Investments4
Top Equity Holdings % of Net Assets6
Portfolio holdings may have changed since the report date.
Source of Sector Classification: S&P and MSCI.
2
As a result of the Schwab 1000 Index®’s once per year reconstitution and the effects of certain corporate actions, the fund may hold more or less than 1,000 securities.
3
Portfolio turnover rate excludes in-kind transactions.
4
The percentage may differ from the Portfolio Holdings because the above calculation is based on a percentage of total investments, excluding derivatives, whereas the calculation in the Portfolio Holdings is based on a percentage of net assets.
5
Includes the fund’s position(s) in money market mutual funds registered under the Investment Company Act of 1940, as amended.
6
This list is not a recommendation of any security by the investment adviser.
Schwab Equity Index Funds | Annual Report11
Schwab Small-Cap Index Fund as of October 31, 2023
The Schwab Small-Cap Index Fund’s (the fund) goal is to track the performance of a benchmark index that measures the total return of small-capitalization U.S. stocks. To pursue its goal, the fund generally invests in stocks that are included in the Russell 2000® Index (the index). The fund generally will seek to replicate the performance of the index by giving the same weight to a given stock as the index does. For more information concerning the fund’s investment objective, strategies, and risks, please see the fund’s prospectus.
Market Highlights. For the 12-month reporting period ended October 31, 2023, U.S. equity markets were mixed, and international equity markets posted positive returns. U.S. stocks were volatile for the first half of the reporting period as inflation remained elevated, the U.S. Federal Reserve (Fed) continued to raise interest rates, and the failure of three U.S. regional banks in early March raised concerns about the stability of the banking sector. Despite these headwinds, as inflation began to ease, U.S. stocks staged a relatively steady upswing through August driven primarily by performance of the “Magnificent Seven” (Alphabet, Inc., Amazon.com, Inc., Apple, Inc., Meta Platforms, Inc., Microsoft Corp., NVIDIA Corp., and Tesla, Inc.). U.S. stocks, particularly dividend paying stocks, began to falter over the final two months of the reporting period as soaring U.S. Treasury yields offered investors attractive alternatives to stocks. Outside the U.S., the ongoing war between Russia and Ukraine and the Israel-Hamas war that broke out following Hamas’ attack on Israel in early October weighed on the global economy. U.S. large-cap stocks outperformed U.S. small-cap stocks and among U.S. large-cap stocks, growth stocks outperformed value stocks. Within the index, stocks in the energy and industrials sectors were the top performers, while stocks in the health care and financials sectors underperformed.
Performance. The fund generally tracked the index for the reporting period. The fund returned -8.47% for the 12-month reporting period ended October 31, 2023, compared with the index, which returned -8.56%.
Contributors and Detractors. The energy sector contributed the most to the total return of the fund. Energy stocks represented an average weight of approximately 7% of the fund’s investments and returned approximately 7% for the reporting period. One example from this sector is Weatherford International PLC which provides oilfield equipment and services. The fund’s holdings of Weatherford International PLC represented an average weight of less than 1% of the fund’s investments and returned approximately 123% for the reporting period.
The industrials sector also contributed to the total return of the fund, representing an average weight of approximately 16% of the fund’s investments and returning approximately 2% for the reporting period.
The health care sector detracted the most from the total return of the fund. Health care stocks represented an average weight of approximately 16% of the fund’s investments and returned approximately -22% for the reporting period. One example from this sector is Intellia Therapeutics, Inc., a biotechnology company. The fund’s holdings of Intellia Therapeutics, Inc. represented an average weight of less than 1% of the fund’s investment and returned approximately -53% for the reporting period.
The financials sector also detracted from the total return of the fund, representing an average weight of approximately 16% of the fund’s investments and returning approximately -18% for the reporting period.
Management views and portfolio holdings may have changed since the report date.
12
Schwab Equity Index Funds | Annual Report
Schwab Small-Cap Index Fund
Performance and Fund Facts as of October 31, 2023
The performance data quoted represents past performance. Past performance does not guarantee future results. Investment returns and principal value of an investment will fluctuate so that an investor’s shares may be worth more or less than their original cost. Current performance may be lower or higher than performance data quoted. To obtain performance information current to the most recent month end, please visit www.schwabassetmanagement.com/schwabfunds_prospectus.
Performance of Hypothetical $10,000 Investment (October 31, 2013 – October 31, 2023)1
Average Annual Total Returns1
| | | |
Fund: Schwab Small-Cap Index Fund (5/19/97) | | | |
| | | |
Fund Category: Morningstar Small Blend2 | | | |
Fund Expense Ratio3: 0.04% |
All total returns on this page assume dividends and distributions were reinvested. Index figures do not include trading and management costs, which would lower performance. Indices are unmanaged and cannot be invested in directly. Performance results less than one year are not annualized.
For index definitions, please see the Glossary.
Index ownership – “Russell 2000®” is a registered mark of the Frank Russell Company (Russell) and has been licensed for use by the Schwab Small-Cap Index Fund. The Schwab Small-Cap Index Fund is not sponsored, endorsed, sold or promoted by Russell and Russell makes no representation regarding the advisability of investing in the fund.
1
Performance does not reflect the deduction of taxes that a shareholder would pay on fund distributions or the redemption of fund shares.
2
Source for category information: Morningstar, Inc. The Morningstar Category return represents all active and index mutual funds and ETFs within the category as of the report date.
3
As stated in the prospectus.
Schwab Equity Index Funds | Annual Report13
Schwab Small-Cap Index Fund
Performance and Fund Facts as of October 31, 2023 (continued)
| |
Weighted Average Market Cap (millions) | |
Price/Earnings Ratio (P/E) | |
| |
| |
Sector Weightings % of Investments3
Top Equity Holdings % of Net Assets5
Portfolio holdings may have changed since the report date.
Source of Sector Classification: S&P and MSCI.
Small-company stocks are subject to greater volatility than many other asset classes.
2
Portfolio turnover rate excludes in-kind transactions.
3
The percentage may differ from the Portfolio Holdings because the above calculation is based on a percentage of total investments, excluding derivatives, whereas the calculation in the Portfolio Holdings is based on a percentage of net assets.
4
Includes the fund’s position(s) in money market mutual funds registered under the Investment Company Act of 1940, as amended.
5
This list is not a recommendation of any security by the investment adviser.
14
Schwab Equity Index Funds | Annual Report
Schwab Total Stock Market Index Fund as of October 31, 2023
The Schwab Total Stock Market Index Fund’s (the fund) goal is to track the total return of the entire U.S. stock market, as measured by the Dow Jones U.S. Total Stock Market IndexSM (the index). The index is designed to measure all publicly traded stocks of companies headquartered in the United States for which pricing information is readily available. The fund uses a sampling investment approach that involves investing in a representative sample of securities included in the index that, when taken together, are expected to perform similarly to the index as a whole. Due to the use of representative sampling, the fund may not hold all of the securities in the index. For more information concerning the fund’s investment objective, strategies, and risks, please see the fund’s prospectus.
Market Highlights. For the 12-month reporting period ended October 31, 2023, U.S. equity markets were mixed, and international equity markets posted positive returns. U.S. stocks were volatile for the first half of the reporting period as inflation remained elevated, the U.S. Federal Reserve (Fed) continued to raise interest rates, and the failure of three U.S. regional banks in early March raised concerns about the stability of the banking sector. Despite these headwinds, as inflation began to ease, U.S. stocks staged a relatively steady upswing through August driven primarily by performance of the “Magnificent Seven” (Alphabet, Inc., Amazon.com, Inc., Apple, Inc., Meta Platforms, Inc., Microsoft Corp., NVIDIA Corp., and Tesla, Inc.). U.S. stocks, particularly dividend paying stocks, began to falter over the final two months of the reporting period as soaring U.S. Treasury yields offered investors attractive alternatives to stocks. Outside the U.S., the ongoing war between Russia and Ukraine and the Israel-Hamas war that broke out following Hamas’ attack on Israel in early October weighed on the global economy. U.S. large-cap stocks outperformed U.S. small-cap stocks and among U.S. large-cap stocks, growth stocks outperformed value stocks. Within the index, stocks in the communication services and information technology sectors were the top performers, while stocks in the utilities and real estate sectors underperformed.
Performance. The fund tracked the index for the reporting period. The fund returned 8.38% for the 12-month reporting period ended October 31, 2023, compared with the index, which returned 8.39%. Differences between the return of the fund and the return of the index may be attributable to, among other things, the operational and transactional costs incurred by the fund and not the index.
Contributors and Detractors. The health care sector detracted the most from the total return of the fund. The health care sector represented an average weight of approximately 14% of the fund’s investments and returned approximately -6% for the reporting period. One example from this sector is Pfizer, Inc., a pharmaceutical company, which represented an average weight of less than 1% of the fund’s investments and returned approximately -32% for the reporting period.
The financials sector also detracted from the total return of the fund, representing an average weight of approximately 11% of the fund’s investments and returning approximately -3% for the reporting period.
The information technology sector contributed the most to the total return of the fund. The information technology sector represented an average weight of approximately 27% of the fund’s investments and returned approximately 27% for the reporting period. One example from this sector is Microsoft Corp., which develops manufactures, licenses, sells, and supports software products. The fund’s holdings of Microsoft Corp. represented an average weight of approximately 5% of the fund’s investments and returned approximately 47% for the reporting period.
The communication services sector also contributed to the total return of the fund, representing an average weight of approximately 8% of the fund’s investments and returning approximately 32% for the reporting period.
Management views and portfolio holdings may have changed since the report date.
Schwab Equity Index Funds | Annual Report15
Schwab Total Stock Market Index Fund
Performance and Fund Facts as of October 31, 2023
The performance data quoted represents past performance. Past performance does not guarantee future results. Investment returns and principal value of an investment will fluctuate so that an investor’s shares may be worth more or less than their original cost. Current performance may be lower or higher than performance data quoted. To obtain performance information current to the most recent month end, please visit www.schwabassetmanagement.com/schwabfunds_prospectus.
Performance of Hypothetical $10,000 Investment (October 31, 2013 – October 31, 2023)1
Average Annual Total Returns1
| | | |
Fund: Schwab Total Stock Market Index Fund (6/1/99) | | | |
Dow Jones U.S. Total Stock Market IndexSM | | | |
Fund Category: Morningstar Large Blend2 | | | |
Fund Expense Ratio3: 0.03% |
All total returns on this page assume dividends and distributions were reinvested. Index figures do not include trading and management costs, which would lower performance. Indices are unmanaged and cannot be invested in directly. Performance results less than one year are not annualized.
For index definitions, please see the Glossary.
Index ownership – “Standard & Poor’s®” and “S&P®” are registered trademarks of Standard & Poor’s Financial Services LLC (S&P), and “Dow Jones®” is a registered trademark of Dow Jones Trademark Holdings LLC (Dow Jones) and have been licensed for use by S&P Dow Jones Indices LLC and its affiliates and sublicensed for certain purposes by Charles Schwab Investment Management, Inc. The “Dow Jones U.S. Total Stock Market IndexSM” is a product of S&P Dow Jones Indices LLC or its affiliates, and has been licensed for use by Charles Schwab Investment Management, Inc. The Schwab Total Stock Market Index Fund is not sponsored, endorsed, sold or promoted by S&P Dow Jones Indices LLC, Dow Jones, S&P, or their respective affiliates, and neither S&P Dow Jones Indices LLC, Dow Jones, S&P, nor their respective affiliates make any representation regarding the advisability of investing in the fund.
1
Performance does not reflect the deduction of taxes that a shareholder would pay on fund distributions or the redemption of fund shares.
2
Source for category information: Morningstar, Inc. The Morningstar Category return represents all active and index mutual funds and ETFs within the category as of the report date.
3
As stated in the prospectus.
16
Schwab Equity Index Funds | Annual Report
Schwab Total Stock Market Index Fund
Performance and Fund Facts as of October 31, 2023 (continued)
| |
Weighted Average Market Cap (millions) | |
Price/Earnings Ratio (P/E) | |
| |
| |
Sector Weightings % of Investments2
Top Equity Holdings % of Net Assets4
Portfolio holdings may have changed since the report date.
Source of Sector Classification: S&P and MSCI.
2
The percentage may differ from the Portfolio Holdings because the above calculation is based on a percentage of total investments, excluding derivatives, whereas the calculation in the Portfolio Holdings is based on a percentage of net assets.
3
Includes the fund’s position(s) in money market mutual funds registered under the Investment Company Act of 1940, as amended.
4
This list is not a recommendation of any security by the investment adviser.
Schwab Equity Index Funds | Annual Report17
Schwab U.S. Large-Cap Growth Index Fund as of October 31, 2023
The Schwab U.S. Large-Cap Growth Index Fund’s (the fund) goal is to track the performance of a benchmark index that measures the total return of large-capitalization U.S. growth stocks. To pursue its goal, the fund generally invests in stocks that are included in the Russell 1000® Growth Index (the index). The fund generally will seek to replicate the performance of the index by giving the same weight to a given stock as the index does. For more information concerning the fund’s investment objective, strategies, and risks, please see the fund’s prospectus.
Market Highlights. For the 12-month reporting period ended October 31, 2023, U.S. equity markets were mixed, and international equity markets posted positive returns. U.S. stocks were volatile for the first half of the reporting period as inflation remained elevated, the U.S. Federal Reserve (Fed) continued to raise interest rates, and the failure of three U.S. regional banks in early March raised concerns about the stability of the banking sector. Despite these headwinds, as inflation began to ease, U.S. stocks staged a relatively steady upswing through August driven primarily by performance of the “Magnificent Seven” (Alphabet, Inc., Amazon.com, Inc., Apple, Inc., Meta Platforms, Inc., Microsoft Corp., NVIDIA Corp., and Tesla, Inc.). U.S. stocks, particularly dividend paying stocks, began to falter over the final two months of the reporting period as soaring U.S. Treasury yields offered investors attractive alternatives to stocks. Outside the U.S., the ongoing war between Russia and Ukraine and the Israel-Hamas war that broke out following Hamas’ attack on Israel in early October weighed on the global economy. U.S. large-cap stocks outperformed U.S. small-cap stocks and among U.S. large-cap stocks, growth stocks outperformed value stocks. Within the index, stocks in the communication services and information technology sectors were the top performers, while stocks in the utilities and real estate sectors underperformed.
Performance. The fund generally tracked the index for the reporting period. The fund returned 18.89% during the 12-month reporting period ended October 31, 2023, compared with the index, which returned 18.95%. Differences between the return of the fund and the return of the index may be attributable to, among other things, the operational and transactional costs incurred by the fund and not the index.
Contributors and Detractors. The energy sector detracted the most from the total return of the fund. Energy stocks represented an average weight of approximately 1% of the fund’s investments and returned approximately -5% for the reporting period. One example from this sector is Occidental Petroleum Corp., which explores for, develops, produces, and markets crude oil and natural gas. The fund’s holdings of Occidental Petroleum Corp. represented an average weight of less than 1% of the fund’s investments and returned approximately -22% for the reporting period.
The utilities sector also detracted from the total return of the fund, representing an average weight of less than 1% of the fund’s investments and returning approximately -13% for the reporting period.
The information technology sector contributed the most to the total return of the fund. Information technology stocks represented an average weight of approximately 46% of the fund’s investments and returned approximately 32% for the reporting period. One example from this sector is Microsoft Corp, which develops, manufactures, licenses, sells, and supports software products. The fund’s holdings of Microsoft Corp. represented an average weight of approximately 11% of the fund’s investments and returned approximately 47% for the reporting period.
The communication services sector also contributed to the total return of the fund, representing an average weight of approximately 9% of the fund’s investments and returning approximately 35% for the reporting period.
Management views and portfolio holdings may have changed since the report date.
18
Schwab Equity Index Funds | Annual Report
Schwab U.S. Large-Cap Growth Index Fund
Performance and Fund Facts as of October 31, 2023
The performance data quoted represents past performance. Past performance does not guarantee future results. Investment returns and principal value of an investment will fluctuate so that an investor’s shares may be worth more or less than their original cost. Current performance may be lower or higher than performance data quoted. To obtain performance information current to the most recent month end, please visit www.schwabassetmanagement.com/schwabfunds_prospectus.
Performance of Hypothetical $10,000 Investment (December 20, 2017 – October 31, 2023)1
| | | |
Fund: Schwab U.S. Large-Cap Growth Index Fund (12/20/17) | | | |
Russell 1000® Growth Index | | | |
Fund Category: Morningstar Large Growth2 | | | |
Fund Expense Ratio3: 0.035% |
All total returns on this page assume dividends and distributions were reinvested. Index figures do not include trading and management costs, which would lower performance. Indices are unmanaged and cannot be invested in directly. Performance results less than one year are not annualized.
For index definitions, please see the Glossary.
Index ownership – The Russell 1000® Growth Index is a registered mark of the Frank Russell Company (Russell) and has been licensed for use by the Schwab U.S. Large-Cap Growth Index Fund. The Schwab U.S. Large-Cap Growth Index Fund is not sponsored, endorsed, sold or promoted by Russell and Russell makes no representation regarding the advisability of investing in the fund.
1
Performance does not reflect the deduction of taxes that a shareholder would pay on fund distributions or the redemption of fund shares.
2
Source for category information: Morningstar, Inc. The Morningstar Category return represents all active and index mutual funds and ETFs within the category as of the report date.
3
As stated in the prospectus.
Schwab Equity Index Funds | Annual Report19
Schwab U.S. Large-Cap Growth Index Fund
Performance and Fund Facts as of October 31, 2023 (continued)
| |
Weighted Average Market Cap (millions) | |
Price/Earnings Ratio (P/E) | |
| |
| |
Sector Weightings % of Investments3
Top Equity Holdings % of Net Assets6
Portfolio holdings may have changed since the report date.
Source of Sector Classification: S&P and MSCI.
2
Portfolio turnover rate excludes in-kind transactions.
3
The percentage may differ from the Portfolio Holdings because the above calculation is based on a percentage of total investments, excluding derivatives, whereas the calculation in the Portfolio Holdings is based on a percentage of net assets.
5
Includes the fund’s position(s) in money market mutual funds registered under the Investment Company Act of 1940, as amended.
6
This list is not a recommendation of any security by the investment adviser.
20
Schwab Equity Index Funds | Annual Report
Schwab U.S. Large-Cap Value Index Fund as of October 31, 2023
The Schwab U.S. Large-Cap Value Index Fund’s (the fund) goal is to track the performance of a benchmark index that measures the total return of large-capitalization U.S. value stocks. To pursue its goal, the fund generally invests in stocks that are included in the Russell 1000® Value Index (the index). The fund generally will seek to replicate the performance of the index by giving the same weight to a given stock as the index does. For more information concerning the fund’s investment objective, strategies, and risks, please see the fund’s prospectus.
Market Highlights. For the 12-month reporting period ended October 31, 2023, U.S. equity markets were mixed, and international equity markets posted positive returns. U.S. stocks were volatile for the first half of the reporting period as inflation remained elevated, the U.S. Federal Reserve (Fed) continued to raise interest rates, and the failure of three U.S. regional banks in early March raised concerns about the stability of the banking sector. Despite these headwinds, as inflation began to ease, U.S. stocks staged a relatively steady upswing through August driven primarily by performance of the “Magnificent Seven” (Alphabet, Inc., Amazon.com, Inc., Apple, Inc., Meta Platforms, Inc., Microsoft Corp., NVIDIA Corp., and Tesla, Inc.). U.S. stocks, particularly dividend paying stocks, began to falter over the final two months of the reporting period as soaring U.S. Treasury yields offered investors attractive alternatives to stocks. Outside the U.S., the ongoing war between Russia and Ukraine and the Israel-Hamas war that broke out following Hamas’ attack on Israel in early October weighed on the global economy. U.S. large-cap stocks outperformed U.S. small-cap stocks and among U.S. large-cap stocks, growth stocks outperformed value stocks. Within the index, stocks in the communication services and information technology sectors were the top performers, while stocks in the health care and utilities sectors underperformed.
Performance. The fund generally tracked the index for the reporting period. The fund returned 0.11% during the 12-month reporting period ended October 31, 2023, compared with the index, which returned 0.13%. Differences between the return of the fund and the return of the index may be attributable to, among other things, the operational and transactional costs incurred by the fund and not the index.
Contributors and Detractors. The health care sector detracted the most from the total return of the fund. Health care stocks represented an average weight of approximately 16% of the fund’s investments and returned approximately -10% for the reporting period. One example from this sector is Pfizer, Inc., a pharmaceutical company, which represented an average weight of approximately 1% of the fund’s investments and returned approximately -32% for the reporting period.
The financials sector also detracted from the total return of the fund, representing an average weight of approximately 20% of the fund’s investments and returning approximately -3% for the reporting period.
The communication services sector contributed the most to the total return of the fund. Communication services stocks represented an average weight of approximately 7% of the fund’s investments and returned approximately 30% for the reporting period. One example from this sector is Meta Platforms, Inc., a social technology company. The fund’s Class A holdings of Meta Platforms, Inc. represented an average weight of approximately 1% of the fund’s investments and returned approximately 210% for the reporting period. The fund’s investment in Meta Platforms, Inc. was sold prior to the end of the reporting period.
The industrials sector also contributed to the total return of the fund, representing an average weight of approximately 12% of the fund’s investments and returning approximately 7% for the reporting period.
Management views and portfolio holdings may have changed since the report date.
Schwab Equity Index Funds | Annual Report21
Schwab U.S. Large-Cap Value Index Fund
Performance and Fund Facts as of October 31, 2023
The performance data quoted represents past performance. Past performance does not guarantee future results. Investment returns and principal value of an investment will fluctuate so that an investor’s shares may be worth more or less than their original cost. Current performance may be lower or higher than performance data quoted. To obtain performance information current to the most recent month end, please visit www.schwabassetmanagement.com/schwabfunds_prospectus.
Performance of Hypothetical $10,000 Investment (December 20, 2017 – October 31, 2023)1
| | | |
Fund: Schwab U.S. Large-Cap Value Index Fund (12/20/17) | | | |
Russell 1000® Value Index | | | |
Fund Category: Morningstar Large Value2 | | | |
Fund Expense Ratio3: 0.035% |
All total returns on this page assume dividends and distributions were reinvested. Index figures do not include trading and management costs, which would lower performance. Indices are unmanaged and cannot be invested in directly. Performance results less than one year are not annualized.
For index definitions, please see the Glossary.
Index ownership – The Russell 1000® Value Index is a registered mark of the Frank Russell Company (Russell) and has been licensed for use by the Schwab U.S. Large-Cap Value Index Fund. The Schwab U.S. Large-Cap Value Index Fund is not sponsored, endorsed, sold or promoted by Russell and Russell makes no representation regarding the advisability of investing in the fund.
1
Performance does not reflect the deduction of taxes that a shareholder would pay on fund distributions or the redemption of fund shares.
2
Source for category information: Morningstar, Inc. The Morningstar Category return represents all active and index mutual funds and ETFs within the category as of the report date.
3
As stated in the prospectus.
22
Schwab Equity Index Funds | Annual Report
Schwab U.S. Large-Cap Value Index Fund
Performance and Fund Facts as of October 31, 2023 (continued)
| |
Weighted Average Market Cap (millions) | |
Price/Earnings Ratio (P/E) | |
| |
| |
Sector Weightings % of Investments3
Top Equity Holdings % of Net Assets5
Portfolio holdings may have changed since the report date.
Source of Sector Classification: S&P and MSCI.
2
Portfolio turnover rate excludes in-kind transactions.
3
The percentage may differ from the Portfolio Holdings because the above calculation is based on a percentage of total investments, excluding derivatives, whereas the calculation in the Portfolio Holdings is based on a percentage of net assets.
4
Includes the fund’s position(s) in money market mutual funds registered under the Investment Company Act of 1940, as amended.
5
This list is not a recommendation of any security by the investment adviser.
Schwab Equity Index Funds | Annual Report23
Schwab U.S. Mid-Cap Index Fund as of October 31, 2023
The Schwab U.S. Mid-Cap Index Fund’s (the fund) goal is to track the performance of a benchmark index that measures the total return of mid-capitalization U.S. stocks. To pursue its goal, the fund generally invests in securities that are included in the Russell Midcap® Index (the index). The fund generally will seek to replicate the performance of the index by giving the same weight to a given security as the index does. For more information concerning the fund’s investment objective, strategies, and risks, please see the fund’s prospectus.
Market Highlights. For the 12-month reporting period ended October 31, 2023, U.S. equity markets were mixed, and international equity markets posted positive returns. U.S. stocks were volatile for the first half of the reporting period as inflation remained elevated, the U.S. Federal Reserve (Fed) continued to raise interest rates, and the failure of three U.S. regional banks in early March raised concerns about the stability of the banking sector. Despite these headwinds, as inflation began to ease, U.S. stocks staged a relatively steady upswing through August driven primarily by performance of the “Magnificent Seven” (Alphabet, Inc., Amazon.com, Inc., Apple, Inc., Meta Platforms, Inc., Microsoft Corp., NVIDIA Corp., and Tesla, Inc.). U.S. stocks, particularly dividend paying stocks, began to falter over the final two months of the reporting period as soaring U.S. Treasury yields offered investors attractive alternatives to stocks. Outside the U.S., the ongoing war between Russia and Ukraine and the Israel-Hamas war that broke out following Hamas’ attack on Israel in early October weighed on the global economy. U.S. large-cap stocks outperformed U.S. small-cap stocks and among U.S. large-cap stocks, growth stocks outperformed value stocks. Within the index, stocks in the industrials and information technology sectors were the top performers, while stocks in the health care and financials sectors underperformed.
Performance. The fund generally tracked the index for the reporting period. The fund returned -1.03% during the 12-month reporting period ended October 31, 2023, compared with the index, which returned -1.01%. Differences between the return of the fund and the return of the index may be attributable to, among other things, the operational and transactional costs incurred by the fund and not the index.
Contributors and Detractors. The health care sector detracted the most from the total return of the fund. Health care stocks represented an average weight of approximately 11% of the fund’s investments and returned approximately -10% for the reporting period. One example from this sector is Illumina, Inc., which develops, manufactures and markets integrated systems for the large-scale analysis of genetic variation and biological function. The fund’s holdings of Illumina, Inc. represented an average weight of less than 1% of the fund’s investments and returned approximately -46% for the reporting period.
The financials sector also detracted from the total return of the fund, representing an average weight of approximately 13% of the fund’s investments and returning approximately -6% for the reporting period.
The industrials sector contributed the most to the total return of the fund. Industrials stocks represented an average weight of approximately 17% of the fund’s investments and returned approximately 11% for the reporting period. One example from this sector is TransDigm Group, Inc., which designs, produces, and supplies highly engineered aerospace systems, subsystems, and component parts, for nearly all aircraft currently in service. The fund’s holdings of TransDigm Group, Inc. represented an average weight of less than 1% of the fund’s investments and returned approximately 44% for the reporting period.
The information technology sector also contributed to the total return of the fund, representing an average weight of approximately 16% of the fund’s investments and returning approximately 3% for the reporting period.
Management views and portfolio holdings may have changed since the report date.
24
Schwab Equity Index Funds | Annual Report
Schwab U.S. Mid-Cap Index Fund
Performance and Fund Facts as of October 31, 2023
The performance data quoted represents past performance. Past performance does not guarantee future results. Investment returns and principal value of an investment will fluctuate so that an investor’s shares may be worth more or less than their original cost. Current performance may be lower or higher than performance data quoted. To obtain performance information current to the most recent month end, please visit www.schwabassetmanagement.com/schwabfunds_prospectus.
Performance of Hypothetical $10,000 Investment (December 20, 2017 – October 31, 2023)1
| | | |
Fund: Schwab U.S. Mid-Cap Index Fund (12/20/17) | | | |
| | | |
Fund Category: Morningstar Mid-Cap Blend2 | | | |
Fund Expense Ratio3: 0.04% |
All total returns on this page assume dividends and distributions were reinvested. Index figures do not include trading and management costs, which would lower performance. Indices are unmanaged and cannot be invested in directly. Performance results less than one year are not annualized.
For index definitions, please see the Glossary.
Index ownership – The Russell Midcap® Index is a registered mark of the Frank Russell Company (Russell) and has been licensed for use by the Schwab U.S. Mid-Cap Index Fund. The Schwab U.S. Mid-Cap Index Fund is not sponsored, endorsed, sold or promoted by Russell and Russell makes no representation regarding the advisability of investing in the fund.
1
Performance does not reflect the deduction of taxes that a shareholder would pay on fund distributions or the redemption of fund shares.
2
Source for category information: Morningstar, Inc. The Morningstar Category return represents all active and index mutual funds and ETFs within the category as of the report date.
3
As stated in the prospectus.
Schwab Equity Index Funds | Annual Report25
Schwab U.S. Mid-Cap Index Fund
Performance and Fund Facts as of October 31, 2023 (continued)
| |
Weighted Average Market Cap (millions) | |
Price/Earnings Ratio (P/E) | |
| |
| |
Sector Weightings % of Investments3
Top Equity Holdings % of Net Assets5
Portfolio holdings may have changed since the report date.
Source of Sector Classification: S&P and MSCI.
2
Portfolio turnover rate excludes in-kind transactions.
3
The percentage may differ from the Portfolio Holdings because the above calculation is based on a percentage of total investments, excluding derivatives, whereas the calculation in the Portfolio Holdings is based on a percentage of net assets.
4
Includes the fund’s position(s) in money market mutual funds registered under the Investment Company Act of 1940, as amended.
5
This list is not a recommendation of any security by the investment adviser.
26
Schwab Equity Index Funds | Annual Report
Schwab International Index Fund as of October 31, 2023
The Schwab International Index Fund’s (the fund) goal is to track the performance of a benchmark index that measures the total return of large, publicly traded non-U.S. companies from countries with developed equity markets outside of the United States. To purse its goal, the fund generally invests in stocks that are included in the MSCI EAFE® Index (the index). The index includes stocks from developed markets in Europe, Australasia and the Far East. The fund generally will seek to replicate the performance of the index by giving the same weight to a given stock as the index does. For more information concerning the fund’s investment objective, strategies, and risks, please see the fund’s prospectus.
Market Highlights. For the 12-month reporting period ended October 31, 2023, U.S. equity markets were mixed, and international equity markets posted positive returns. U.S. stocks were volatile for the first half of the reporting period as inflation remained elevated, the U.S. Federal Reserve (Fed) continued to raise interest rates, and the failure of three U.S. regional banks in early March raised concerns about the stability of the banking sector. Despite these headwinds, as inflation began to ease, U.S. stocks staged a relatively steady upswing through August driven primarily by performance of the “Magnificent Seven” (Alphabet, Inc., Amazon.com, Inc., Apple, Inc., Meta Platforms, Inc., Microsoft Corp., NVIDIA Corp., and Tesla, Inc.). U.S. stocks, particularly dividend paying stocks, began to falter over the final two months of the reporting period as soaring U.S. Treasury yields offered investors attractive alternatives to stocks. Outside the U.S., the ongoing war between Russia and Ukraine and the Israel-Hamas war that broke out following Hamas’ attack on Israel in early October weighed on the global economy. U.S. large-cap stocks outperformed U.S. small-cap stocks and among U.S. large-cap stocks, growth stocks outperformed value stocks. The U.S. dollar, as measured against a basket of international currencies, generally weakened until mid-July, when it hit a reporting-period low, then began to rise but ended the reporting period weaker than where it began.
Performance. The fund generally tracked the index for the reporting period. The fund returned 15.30% for the 12-month reporting period ended October 31, 2023, compared with the index, which returned 14.40%1. Fair valuation of the fund’s holdings contributed to the fund’s relative performance.2
Contributors and Detractors. Stocks from Japan contributed the most to the total return of the fund. Japanese stocks represented an average weight of approximately 22% of the fund’s investments and returned approximately 17% in U.S. dollar terms for the reporting period. One example from this market is Mitsubishi UFJ Financial Group, Inc., which provides a variety of financial and investment services. The fund’s holdings of Mitsubishi UFJ Financial Group, Inc. represented an average weight of less than 1% of the fund’s investments and returned approximately 83% in U.S. dollar terms for the reporting period.
Stocks from France also contributed to the total return of the fund, representing an average weight of approximately 12% of the fund’s investments and returning approximately 19% in U.S. dollar terms for the reporting period.
Stocks from Israel detracted the most from the total return of the fund. Israeli stocks represented an average weight of less than 1% of the fund’s investments and returned approximately -17% in U.S. dollar terms for the reporting period. One example from this market is Bank Leumi Le-Israel BM, a full-service commercial bank, which represented an average weight of less than 1% of the fund’s investments and returned approximately -30% in U.S. dollar terms for the reporting period.
Stocks from Finland also detracted from the total return of the fund, representing an average weight of approximately 1% of the fund’s investments and returning approximately -6% in U.S. dollar terms for the reporting period.
Management views and portfolio holdings may have changed since the report date.
1
The net version of the index reflects reinvested dividends net of withholding taxes but reflects no deductions for expenses or other taxes.
2
Typically, the securities in the index are valued using foreign exchange rates obtained at the close of the London foreign currency exchange (11:00 AM EST). Securities in the fund, however, are valued using foreign exchange rates obtained at the close of the New York foreign currency exchange (4:00 PM EST). This difference in closing times can result in different foreign currency exchange rates between the two exchanges, and thus different foreign currency exchange rates used in the valuation of the index’s and fund’s securities.
Schwab Equity Index Funds | Annual Report27
Schwab International Index Fund
Performance and Fund Facts as of October 31, 2023
The performance data quoted represents past performance. Past performance does not guarantee future results. Investment returns and principal value of an investment will fluctuate so that an investor’s shares may be worth more or less than their original cost. Current performance may be lower or higher than performance data quoted. To obtain performance information current to the most recent month end, please visit www.schwabassetmanagement.com/schwabfunds_prospectus.
Performance of Hypothetical $10,000 Investment (October 31, 2013 – October 31, 2023)1,2
Average Annual Total Returns1,2
| | | |
Fund: Schwab International Index Fund (5/19/97) | | | |
| | | |
Fund Category: Morningstar Foreign Large Blend4 | | | |
Fund Expense Ratio5: 0.06% |
All total returns on this page assume dividends and distributions were reinvested. Index figures do not include trading and management costs, which would lower performance. Indices are unmanaged and cannot be invested in directly. Performance results less than one year are not annualized.
For index definitions, please see the Glossary.
Index ownership – “MSCI EAFE®” is a registered mark of MSCI and has been licensed for use by the Schwab International Index Fund. The Schwab International Index Fund is not sponsored, endorsed, sold or promoted by MSCI and MSCI bears no liability with respect to the fund. The Statement of Additional Information contains a more detailed description of the limited relationship MSCI has with the fund.
1
Performance does not reflect the deduction of taxes that a shareholder would pay on fund distributions or the redemption of fund shares.
2
The fund’s performance relative to the index may be affected by fair-value pricing. See financial note 2 for more information.
3
The net version of the index reflects reinvested dividends net of withholding taxes but reflects no deductions for expenses or other taxes.
4
Source for category information: Morningstar, Inc. The Morningstar Category return represents all active and index mutual funds and ETFs within the category as of the report date.
5
As stated in the prospectus.
28
Schwab Equity Index Funds | Annual Report
Schwab International Index Fund
Performance and Fund Facts as of October 31, 2023 (continued)
| |
Weighted Average Market Cap (millions) | |
Price/Earnings Ratio (P/E) | |
| |
| |
Sector Weightings % of Investments1
Top Equity Holdings % of Net Assets3
Top Country Weightings % of Investments4
Portfolio holdings may have changed since the report date.
Source of Sector Classification: S&P and MSCI.
International investments are subject to additional risks such as currency fluctuation, geopolitical risk and the potential for illiquid markets.
2
Includes the fund’s position(s) in money market mutual funds registered under the Investment Company Act of 1940, as amended.
3
This list is not a recommendation of any security by the investment adviser.
4
The percentage may differ from the Portfolio Holdings because the above calculation is based on a percentage of total investments, excluding derivatives, whereas the calculation in the Portfolio Holdings is based on a percentage of net assets.
Schwab Equity Index Funds | Annual Report29
Schwab Equity Index Funds
Fund Expenses (Unaudited)
Examples for a $1,000 Investment
As a fund shareholder, you may incur two types of costs: (1) transaction costs; and (2) ongoing costs, including management fees.
The expense examples below are intended to help you understand your ongoing cost (in dollars) of investing in a fund and to compare this cost with the ongoing cost of investing in other mutual funds. These examples are based on an investment of $1,000 invested for six months beginning May 1, 2023 and held through October 31, 2023.
Actual Return lines in the table below provide information about actual account values and actual expenses. You may use this information, together with the amount you invested, to estimate the expenses that you paid over the period. To do so, simply divide your account value by $1,000 (for example, an $8,600 account value ÷ $1,000 = 8.6), then multiply the result by the number given for your fund under the heading entitled “Expenses Paid During Period.”
Hypothetical Return lines in the table below provide information about hypothetical account values and hypothetical expenses based on a fund’s actual expense ratio and an assumed return of 5% per year before expenses. Because the return used is not an actual return, it may not be used to estimate the actual ending account value or expenses you paid for the period.
You may use this information to compare the ongoing costs of investing in a fund and other funds. To do so, compare this 5% hypothetical example with the 5% hypothetical examples that appear in the shareholder reports of the other funds.
Please note that the expenses shown in the table are meant to highlight your ongoing costs only and do not reflect any transactional costs. Therefore, the hypothetical return lines of the table are useful in comparing ongoing costs only and will not help you determine the relative total costs of owning different funds. In addition, if these transactional costs were included, your costs would have been higher.
| | BEGINNING
ACCOUNT VALUE
AT 5/1/23 | ENDING
ACCOUNT VALUE
(NET OF EXPENSES)
AT 10/31/23 | EXPENSES PAID
DURING PERIOD
|
Schwab S&P 500 Index Fund | | | | |
| | | | |
| | | | |
| | | | |
| | | | |
| | | | |
Schwab Small-Cap Index Fund | | | | |
| | | | |
| | | | |
Schwab Total Stock Market Index Fund | | | | |
| | | | |
| | | | |
Schwab U.S. Large-Cap Growth Index Fund | | | | |
| | | | |
| | | | |
Schwab U.S. Large-Cap Value Index Fund | | | | |
| | | | |
| | | | |
Schwab U.S. Mid-Cap Index Fund | | | | |
| | | | |
| | | | |
Schwab International Index Fund | | | | |
| | | | |
| | | | |
| Based on the most recent six-month expense ratio. |
| Expenses for each fund are equal to its annualized expense ratio, multiplied by the average account value over the period, multiplied by the 184 days in the period, and divided by the 365 days in the fiscal year. |
30
Schwab Equity Index Funds | Annual Report
Schwab S&P 500 Index Fund
Financial Statements
| | | | | | |
|
Net asset value at beginning of period | | | | | | |
Income (loss) from investment operations: | | | | | | |
Net investment income (loss)1 | | | | | | |
Net realized and unrealized gains (losses) | | | | | | |
Total from investment operations | | | | | | |
| | | | | | |
Distributions from net investment income | | | | | | |
Distributions from net realized gains | | | | | | |
| | | | | | |
Net asset value at end of period | | | | | | |
| | | | | | |
|
Ratios to average net assets: | | | | | | |
| | | | | | |
Net investment income (loss) | | | | | | |
| | | | | | |
Net assets, end of period (x 1,000,000) | | | | | | |
| Calculated based on the average shares outstanding during the period. |
| Ratio includes less than 0.005% of non-routine proxy expenses. |
| Effective December 20, 2018, the annual operating expense ratio was reduced to 0.02%. The ratio presented for period ended October 31, 2019 is a blended ratio. |
| Portfolio turnover rate excludes in-kind transactions. |
Schwab Equity Index Funds | Annual Report31
Schwab S&P 500 Index Fund
Portfolio Holdings as of October 31, 2023
This section shows all the securities in the fund’s portfolio and their values as of the report date.
The fund files its complete schedule of portfolio holdings with the U.S. Securities and Exchange Commission (SEC) for the first and third quarters of each fiscal year on Form N-PORT Part F. The fund’s Form N-PORT Part F is available on the SEC’s website at www.sec.gov. You can also obtain this information at no cost on the fund’s website at www.schwabassetmanagement.com/schwabfunds_prospectus, by calling 1-866-414-6349, or by sending an email request to orders@mysummaryprospectus.com. The fund also makes available its complete schedule of portfolio holdings 15 to 20 days after the end of the month on the fund’s website.
| | |
COMMON STOCKS 99.6% OF NET ASSETS |
|
Automobiles & Components 1.9% |
| | |
| | |
| | |
| | |
| | |
| | |
|
|
| | |
| | |
Citizens Financial Group, Inc. | | |
| | |
| | |
Huntington Bancshares, Inc. | | |
| | |
| | |
| | |
PNC Financial Services Group, Inc. | | |
| | |
| | |
| | |
| | |
| | |
| | |
|
|
| | |
| | |
| | |
| | |
| | |
| | |
| | |
| | |
| | |
| | |
| | |
| | |
| | |
| | |
| | |
| | |
| | |
| | |
Honeywell International, Inc. | | |
| | |
| | |
Huntington Ingalls Industries, Inc. | | |
| | |
Illinois Tool Works, Inc. | | |
| | |
Johnson Controls International PLC | | |
| | |
L3Harris Technologies, Inc. | | |
| | |
| | |
| | |
| | |
| | |
| | |
| | |
| | |
| | |
Rockwell Automation, Inc. | | |
| | |
| | |
Stanley Black & Decker, Inc. | | |
| | |
| | |
| | |
| | |
Westinghouse Air Brake Technologies Corp. | | |
| | |
| | |
| | |
|
Commercial & Professional Services 1.3% |
Automatic Data Processing, Inc. | | |
Broadridge Financial Solutions, Inc. | | |
Ceridian HCM Holding, Inc. * | | |
| | |
| | |
| | |
| | |
| | |
| | |
| | |
Republic Services, Inc., Class A | | |
| | |
| | |
| | |
Verisk Analytics, Inc., Class A | | |
| | |
| | |
|
Consumer Discretionary Distribution & Retail 5.6% |
| | |
| | |
| | |
| | |
| | |
| | |
| | |
| | |
| | |
| | |
| | |
O'Reilly Automotive, Inc. * | | |
32
Schwab Equity Index Funds | Annual Report
Schwab S&P 500 Index Fund
Portfolio Holdings as of October 31, 2023 (continued)
| | |
| | |
| | |
| | |
| | |
| | |
| | |
|
Consumer Durables & Apparel 0.9% |
| | |
| | |
| | |
| | |
Lululemon Athletica, Inc. * | | |
Mohawk Industries, Inc. * | | |
| | |
| | |
| | |
Ralph Lauren Corp., Class A | | |
| | |
| | |
| | |
| | |
|
|
| | |
| | |
Caesars Entertainment, Inc. * | | |
| | |
Chipotle Mexican Grill, Inc., Class A * | | |
| | |
| | |
| | |
Hilton Worldwide Holdings, Inc. | | |
| | |
Marriott International, Inc., Class A | | |
| | |
MGM Resorts International * | | |
Norwegian Cruise Line Holdings Ltd. * | | |
Royal Caribbean Cruises Ltd. * | | |
| | |
| | |
| | |
| | |
|
Consumer Staples Distribution & Retail 1.9% |
| | |
| | |
| | |
| | |
| | |
| | |
Walgreens Boots Alliance, Inc. | | |
| | |
| | |
|
|
| | |
Baker Hughes Co., Class A | | |
| | |
| | |
| | |
| | |
| | |
| | |
| | |
| | |
| | |
| | |
| | |
| | |
| | |
| | |
Occidental Petroleum Corp. | | |
| | |
| | |
Pioneer Natural Resources Co. | | |
| | |
| | |
| | |
| | |
| | |
|
Equity Real Estate Investment Trusts (REITs) 2.2% |
Alexandria Real Estate Equities, Inc. | | |
| | |
AvalonBay Communities, Inc. | | |
| | |
| | |
| | |
Digital Realty Trust, Inc. | | |
| | |
| | |
Essex Property Trust, Inc. | | |
Extra Space Storage, Inc. | | |
Federal Realty Investment Trust | | |
Healthpeak Properties, Inc. | | |
Host Hotels & Resorts, Inc. | | |
| | |
| | |
| | |
Mid-America Apartment Communities, Inc. | | |
| | |
| | |
| | |
| | |
SBA Communications Corp., Class A | | |
Simon Property Group, Inc. | | |
| | |
| | |
VICI Properties, Inc., Class A | | |
| | |
| | |
| | |
|
|
| | |
Ameriprise Financial, Inc. | | |
Bank of New York Mellon Corp. | | |
Berkshire Hathaway, Inc., Class B * | | |
| | |
| | |
Capital One Financial Corp. | | |
Cboe Global Markets, Inc. | | |
| | |
| | |
Discover Financial Services | | |
FactSet Research Systems, Inc. | | |
Fidelity National Information Services, Inc. | | |
| | |
Schwab Equity Index Funds | Annual Report33
Schwab S&P 500 Index Fund
Portfolio Holdings as of October 31, 2023 (continued)
| | |
FleetCor Technologies, Inc. * | | |
| | |
| | |
Goldman Sachs Group, Inc. | | |
Intercontinental Exchange, Inc. | | |
| | |
Jack Henry & Associates, Inc. | | |
MarketAxess Holdings, Inc. | | |
Mastercard, Inc., Class A | | |
| | |
| | |
| | |
| | |
| | |
| | |
Raymond James Financial, Inc. | | |
| | |
| | |
| | |
| | |
| | |
| | |
|
Food, Beverage & Tobacco 3.2% |
| | |
Archer-Daniels-Midland Co. | | |
Brown-Forman Corp., Class B | | |
| | |
| | |
| | |
| | |
Constellation Brands, Inc., Class A | | |
| | |
| | |
| | |
| | |
| | |
| | |
| | |
Lamb Weston Holdings, Inc. | | |
McCormick & Co., Inc. - Non Voting Shares | | |
Molson Coors Beverage Co., Class B | | |
Mondelez International, Inc., Class A | | |
| | |
| | |
Philip Morris International, Inc. | | |
Tyson Foods, Inc., Class A | | |
| | |
|
Health Care Equipment & Services 5.6% |
| | |
| | |
Baxter International, Inc. | | |
| | |
Boston Scientific Corp. * | | |
| | |
| | |
| | |
| | |
| | |
| | |
| | |
| | |
| | |
Edwards Lifesciences Corp. * | | |
| | |
| | |
GE HealthCare Technologies, Inc. | | |
| | |
| | |
| | |
| | |
IDEXX Laboratories, Inc. * | | |
| | |
Intuitive Surgical, Inc. * | | |
Laboratory Corp. of America Holdings | | |
| | |
| | |
Molina Healthcare, Inc. * | | |
| | |
| | |
| | |
| | |
| | |
| | |
Universal Health Services, Inc., Class B | | |
Zimmer Biomet Holdings, Inc. | | |
| | |
|
Household & Personal Products 1.6% |
Church & Dwight Co., Inc. | | |
| | |
| | |
Estee Lauder Cos., Inc., Class A | | |
| | |
| | |
| | |
| | |
|
|
| | |
| | |
American International Group, Inc. | | |
| | |
Arch Capital Group Ltd. * | | |
| | |
| | |
| | |
| | |
Cincinnati Financial Corp. | | |
| | |
| | |
Hartford Financial Services Group, Inc. | | |
| | |
Marsh & McLennan Cos., Inc. | | |
| | |
Principal Financial Group, Inc. | | |
| | |
Prudential Financial, Inc. | | |
| | |
| | |
| | |
| | |
|
|
Air Products & Chemicals, Inc. | | |
| | |
| | |
| | |
34
Schwab Equity Index Funds | Annual Report
Schwab S&P 500 Index Fund
Portfolio Holdings as of October 31, 2023 (continued)
| | |
| | |
| | |
CF Industries Holdings, Inc. | | |
| | |
| | |
| | |
| | |
| | |
| | |
| | |
International Flavors & Fragrances, Inc. | | |
| | |
| | |
LyondellBasell Industries NV, Class A | | |
Martin Marietta Materials, Inc. | | |
| | |
| | |
| | |
Packaging Corp. of America | | |
| | |
| | |
| | |
| | |
| | |
| | |
| | |
|
Media & Entertainment 7.7% |
Alphabet, Inc., Class A * | | |
Alphabet, Inc., Class C * | | |
Charter Communications, Inc., Class A * | | |
| | |
| | |
| | |
Interpublic Group of Cos., Inc. | | |
Live Nation Entertainment, Inc. * | | |
| | |
Meta Platforms, Inc., Class A * | | |
| | |
| | |
| | |
Paramount Global, Class B (b) | | |
Take-Two Interactive Software, Inc. * | | |
| | |
Warner Bros Discovery, Inc. * | | |
| | |
|
Pharmaceuticals, Biotechnology & Life Sciences 7.5% |
| | |
Agilent Technologies, Inc. | | |
| | |
| | |
Bio-Rad Laboratories, Inc., Class A * | | |
| | |
| | |
| | |
Charles River Laboratories International, Inc. * | | |
| | |
| | |
| | |
| | |
| | |
| | |
| | |
| | |
| | |
Mettler-Toledo International, Inc. * | | |
| | |
| | |
Regeneron Pharmaceuticals, Inc. * | | |
| | |
Thermo Fisher Scientific, Inc. | | |
Vertex Pharmaceuticals, Inc. * | | |
| | |
| | |
West Pharmaceutical Services, Inc. | | |
| | |
| | |
|
Real Estate Management & Development 0.1% |
CBRE Group, Inc., Class A * | | |
| | |
| | |
|
Semiconductors & Semiconductor Equipment 7.2% |
Advanced Micro Devices, Inc. * | | |
| | |
| | |
| | |
| | |
| | |
| | |
| | |
| | |
Microchip Technology, Inc. | | |
| | |
Monolithic Power Systems, Inc. | | |
| | |
| | |
| | |
| | |
| | |
| | |
SolarEdge Technologies, Inc. * | | |
| | |
| | |
| | |
|
Software & Services 12.0% |
| | |
| | |
Akamai Technologies, Inc. * | | |
| | |
| | |
Cadence Design Systems, Inc. * | | |
Cognizant Technology Solutions Corp., Class A | | |
| | |
| | |
| | |
| | |
| | |
International Business Machines Corp. | | |
| | |
| | |
| | |
Palo Alto Networks, Inc. * | | |
| | |
Schwab Equity Index Funds | Annual Report35
Schwab S&P 500 Index Fund
Portfolio Holdings as of October 31, 2023 (continued)
| | |
| | |
| | |
| | |
| | |
Tyler Technologies, Inc. * | | |
| | |
| | |
|
Technology Hardware & Equipment 8.8% |
| | |
| | |
| | |
| | |
| | |
| | |
| | |
Hewlett Packard Enterprise Co. | | |
| | |
| | |
Keysight Technologies, Inc. * | | |
| | |
| | |
Seagate Technology Holdings PLC | | |
| | |
Teledyne Technologies, Inc. * | | |
| | |
| | |
Zebra Technologies Corp., Class A * | | |
| | |
|
Telecommunication Services 0.9% |
| | |
| | |
Verizon Communications, Inc. | | |
| | |
|
|
| | |
American Airlines Group, Inc. * | | |
CH Robinson Worldwide, Inc. | | |
| | |
| | |
Expeditors International of Washington, Inc. | | |
| | |
JB Hunt Transport Services, Inc. | | |
| | |
Old Dominion Freight Line, Inc. | | |
| | |
| | |
United Airlines Holdings, Inc. * | | |
United Parcel Service, Inc., Class B | | |
| | |
|
|
| | |
| | |
| | |
American Electric Power Co., Inc. | | |
| | |
American Water Works Co., Inc. | | |
| | |
| | |
| | |
Consolidated Edison, Inc. | | |
Constellation Energy Corp. | | |
| | |
| | |
| | |
| | |
| | |
| | |
| | |
| | |
| | |
| | |
| | |
| | |
| | |
Pinnacle West Capital Corp. | | |
| | |
Public Service Enterprise Group, Inc. | | |
| | |
| | |
| | |
| | |
| | |
Total Common Stocks
(Cost $33,807,512,884) | |
| | |
SHORT-TERM INVESTMENTS 0.0% OF NET ASSETS |
|
|
State Street Institutional U.S. Government Money Market Fund, Premier Class 5.30% (c)(d) | | |
Total Short-Term Investments
(Cost $4,306,500) | |
Total Investments in Securities
(Cost $33,811,819,384) | |
| | | CURRENT VALUE/
UNREALIZED
DEPRECIATION
($) |
|
| | | |
S&P 500 Index, e-mini, expires 12/15/23 | | | |
| Non-income producing security. |
| Issuer is affiliated with the fund’s investment adviser. |
| All or a portion of this security is on loan. Securities on loan were valued at $4,164,864. |
| The rate shown is the annualized 7-day yield. |
| Security purchased with cash collateral received for securities on loan. |
36
Schwab Equity Index Funds | Annual Report
Schwab S&P 500 Index Fund
Portfolio Holdings as of October 31, 2023 (continued)
Below is a summary of the fund’s transactions with affiliated issuers during the period ended October 31, 2023:
| | | | | NET CHANGE IN UNREALIZED APPRECIATION (DEPRECIATION) | | BALANCE OF SHARES HELD AT 10/31/23 | |
COMMON STOCKS 0.2% OF NET ASSETS |
|
|
| | | | | | | | |
The following is a summary of the inputs used to value the fund’s investments as of October 31, 2023 (see financial note 2(a) for additional information):
| QUOTED PRICES IN
ACTIVE MARKETS FOR
IDENTICAL ASSETS
(LEVEL 1) | OTHER SIGNIFICANT
OBSERVABLE INPUTS
(LEVEL 2) | SIGNIFICANT
UNOBSERVABLE INPUTS
(LEVEL 3) | |
| | | | |
| | | | |
| | | | |
| | | | |
| | | | |
| | | | |
| As categorized in the Portfolio Holdings. |
| Futures contracts are reported at cumulative unrealized appreciation or depreciation. |
Schwab Equity Index Funds | Annual Report37
Schwab S&P 500 Index Fund
Statement of Assets and Liabilities
As of October 31, 2023
|
Investments in securities, at value - affiliated (cost $96,876,976) | | |
Investments in securities, at value - unaffiliated (cost $33,714,942,408) including securities on loan of $4,164,864 | | |
| | |
Deposit with broker for futures contracts | | |
| | |
| | |
| | |
Variation margin on future contracts | | |
Income from securities on loan | | |
| | |
|
|
Collateral held for securities on loan | | |
| | |
| | |
| | |
| | |
| | |
|
|
Capital received from investors | | |
Total distributable earnings | | |
| | |
38
Schwab Equity Index Funds | Annual Report
Schwab S&P 500 Index Fund
Statement of Operations
For the period November 1, 2022 through October 31, 2023 |
|
Dividends received from securities - unaffiliated (net of foreign withholding tax of $291,377) | | |
Interest received from securities - unaffiliated | | |
Dividends received from securities - affiliated | | |
| | |
| | |
|
|
| | |
| | |
| | |
| | |
|
REALIZED AND UNREALIZED GAINS (LOSSES) |
Net realized losses on sales of securities - affiliated | | |
Net realized losses on sales of securities - unaffiliated | | |
Net realized gains on sales of in-kind redemptions - unaffiliated | | |
Net realized gains on futures contracts | | |
| | |
Net change in unrealized appreciation (depreciation) on securities - affiliated | | |
Net change in unrealized appreciation (depreciation) on securities - unaffiliated | | |
Net change in unrealized appreciation (depreciation) on futures contracts | | |
Net change in unrealized appreciation (depreciation) | | |
Net realized and unrealized gains | | |
Increase in net assets resulting from operations | | |
| Proxy fees are non-routine expenses (see financial note 2(e) for additional information). |
Schwab Equity Index Funds | Annual Report39
Schwab S&P 500 Index Fund
Statement of Changes in Net Assets
For the current and prior report periods
|
| | |
| | | |
| | | |
Net change in unrealized appreciation (depreciation) | | | |
Increase (decrease) in net assets resulting from operations | | | |
|
DISTRIBUTIONS TO SHAREHOLDERS |
| | | |
TRANSACTIONS IN FUND SHARES |
| | |
| | | | | |
| | | | | |
| | | | | |
| | | | | |
Net transactions in fund shares | | | | | |
|
SHARES OUTSTANDING AND NET ASSETS |
| | |
| | | | | |
| | | | | |
Total increase (decrease) | | | | | |
| | | | | |
40
Schwab Equity Index Funds | Annual Report
Financial Statements
| | | | | | |
|
Net asset value at beginning of period | | | | | | |
Income (loss) from investment operations: | | | | | | |
Net investment income (loss)1 | | | | | | |
Net realized and unrealized gains (losses) | | | | | | |
Total from investment operations | | | | | | |
| | | | | | |
Distributions from net investment income | | | | | | |
Distributions from net realized gains | | | | | | |
| | | | | | |
Net asset value at end of period | | | | | | |
| | | | | | |
|
Ratios to average net assets: | | | | | | |
| | | | | | |
Net investment income (loss) | | | | | | |
| | | | | | |
Net assets, end of period (x 1,000,000) | | | | | | |
| Calculated based on the average shares outstanding during the period. |
| Ratio includes less than 0.005% of non-routine proxy expenses. |
| Portfolio turnover rate excludes in-kind transactions. |
Schwab Equity Index Funds | Annual Report41
Portfolio Holdings as of October 31, 2023
This section shows all the securities in the fund’s portfolio and their values as of the report date.
The fund files its complete schedule of portfolio holdings with the U.S. Securities and Exchange Commission (SEC) for the first and third quarters of each fiscal year on Form N-PORT Part F. The fund’s Form N-PORT Part F is available on the SEC’s website at www.sec.gov. You can also obtain this information at no cost on the fund’s website at www.schwabassetmanagement.com/schwabfunds_prospectus, by calling 1-866-414-6349, or by sending an email request to orders@mysummaryprospectus.com. The fund also makes available its complete schedule of portfolio holdings 15 to 20 days after the end of the month on the fund’s website.
| | |
COMMON STOCKS 99.4% OF NET ASSETS |
|
Automobiles & Components 1.8% |
| | |
| | |
| | |
| | |
Fox Factory Holding Corp. * | | |
| | |
| | |
| | |
| | |
| | |
Rivian Automotive, Inc., Class A * | | |
| | |
| | |
| | |
|
|
| | |
| | |
| | |
| | |
Citizens Financial Group, Inc. | | |
Columbia Banking System, Inc. | | |
| | |
Commerce Bancshares, Inc. | | |
Cullen/Frost Bankers, Inc. | | |
| | |
| | |
First Citizens BancShares, Inc., Class A | | |
| | |
| | |
Huntington Bancshares, Inc. | | |
| | |
| | |
| | |
New York Community Bancorp, Inc. | | |
| | |
Pinnacle Financial Partners, Inc. | | |
PNC Financial Services Group, Inc. | | |
| | |
Prosperity Bancshares, Inc. | | |
| | |
| | |
| | |
| | |
| | |
| | |
| | |
| | |
| | |
| | |
| | |
| | |
| | |
|
|
| | |
| | |
| | |
| | |
Advanced Drainage Systems, Inc. | | |
| | |
| | |
| | |
| | |
Allison Transmission Holdings, Inc. | | |
| | |
| | |
Applied Industrial Technologies, Inc. | | |
| | |
| | |
AZEK Co., Inc., Class A * | | |
Beacon Roofing Supply, Inc. * | | |
| | |
| | |
Builders FirstSource, Inc. * | | |
| | |
| | |
| | |
| | |
| | |
Comfort Systems USA, Inc. | | |
Core & Main, Inc., Class A * | | |
| | |
| | |
| | |
| | |
| | |
| | |
| | |
| | |
| | |
| | |
| | |
| | |
| | |
| | |
| | |
Fortune Brands Innovations, Inc. | | |
Franklin Electric Co., Inc. | | |
| | |
| | |
| | |
| | |
| | |
| | |
Honeywell International, Inc. | | |
| | |
| | |
42
Schwab Equity Index Funds | Annual Report
Portfolio Holdings as of October 31, 2023 (continued)
| | |
Huntington Ingalls Industries, Inc. | | |
| | |
Illinois Tool Works, Inc. | | |
| | |
| | |
Johnson Controls International PLC | | |
L3Harris Technologies, Inc. | | |
Lennox International, Inc. | | |
| | |
Lincoln Electric Holdings, Inc. | | |
| | |
| | |
| | |
| | |
MSC Industrial Direct Co., Inc., Class A | | |
| | |
| | |
| | |
| | |
| | |
| | |
| | |
| | |
| | |
| | |
| | |
| | |
| | |
| | |
Rockwell Automation, Inc. | | |
| | |
Sensata Technologies Holding PLC | | |
Simpson Manufacturing Co., Inc. | | |
SiteOne Landscape Supply, Inc. * | | |
| | |
Stanley Black & Decker, Inc. | | |
| | |
| | |
| | |
| | |
| | |
| | |
| | |
| | |
| | |
Vertiv Holdings Co., Class A | | |
| | |
Watts Water Technologies, Inc., Class A | | |
WESCO International, Inc. | | |
Westinghouse Air Brake Technologies Corp. | | |
WillScot Mobile Mini Holdings Corp. * | | |
| | |
| | |
| | |
Zurn Elkay Water Solutions Corp. | | |
| | |
|
Commercial & Professional Services 1.5% |
Automatic Data Processing, Inc. | | |
Booz Allen Hamilton Holding Corp., Class A | | |
Broadridge Financial Solutions, Inc. | | |
CACI International, Inc., Class A * | | |
Casella Waste Systems, Inc., Class A * | | |
| | |
Ceridian HCM Holding, Inc. * | | |
| | |
| | |
| | |
| | |
Dun & Bradstreet Holdings, Inc. | | |
| | |
ExlService Holdings, Inc. * | | |
| | |
| | |
| | |
| | |
| | |
| | |
| | |
| | |
| | |
| | |
| | |
Paylocity Holding Corp. * | | |
| | |
Republic Services, Inc., Class A | | |
| | |
| | |
Science Applications International Corp. | | |
SS&C Technologies Holdings, Inc. | | |
| | |
| | |
| | |
| | |
Verisk Analytics, Inc., Class A | | |
| | |
| | |
| | |
|
Consumer Discretionary Distribution & Retail 5.3% |
| | |
Asbury Automotive Group, Inc. * | | |
| | |
| | |
| | |
| | |
Burlington Stores, Inc. * | | |
| | |
| | |
Dick's Sporting Goods, Inc. | | |
| | |
| | |
| | |
| | |
Floor & Decor Holdings, Inc., Class A * | | |
GameStop Corp., Class A *(a) | | |
| | |
| | |
Lithia Motors, Inc., Class A | | |
| | |
| | |
| | |
Ollie's Bargain Outlet Holdings, Inc. * | | |
O'Reilly Automotive, Inc. * | | |
Penske Automotive Group, Inc. | | |
| | |
| | |
| | |
| | |
| | |
Schwab Equity Index Funds | Annual Report43
Portfolio Holdings as of October 31, 2023 (continued)
| | |
| | |
| | |
| | |
| | |
| | |
|
Consumer Durables & Apparel 1.1% |
| | |
| | |
| | |
| | |
| | |
| | |
| | |
| | |
| | |
| | |
Lululemon Athletica, Inc. * | | |
| | |
| | |
Mohawk Industries, Inc. * | | |
| | |
| | |
| | |
| | |
| | |
| | |
Ralph Lauren Corp., Class A | | |
| | |
Skechers USA, Inc., Class A * | | |
| | |
Taylor Morrison Home Corp., Class A * | | |
Tempur Sealy International, Inc. | | |
| | |
| | |
| | |
| | |
| | |
| | |
|
|
| | |
| | |
| | |
| | |
| | |
Bright Horizons Family Solutions, Inc. * | | |
Caesars Entertainment, Inc. * | | |
| | |
Chipotle Mexican Grill, Inc., Class A * | | |
Choice Hotels International, Inc. | | |
| | |
| | |
| | |
DoorDash, Inc., Class A * | | |
DraftKings, Inc., Class A * | | |
| | |
| | |
| | |
Hilton Grand Vacations, Inc. * | | |
Hilton Worldwide Holdings, Inc. | | |
Hyatt Hotels Corp., Class A | | |
| | |
| | |
Marriott International, Inc., Class A | | |
| | |
| | |
MGM Resorts International * | | |
Norwegian Cruise Line Holdings Ltd. * | | |
Planet Fitness, Inc., Class A * | | |
Royal Caribbean Cruises Ltd. * | | |
Service Corp. International | | |
| | |
Texas Roadhouse, Inc., Class A | | |
| | |
| | |
Wyndham Hotels & Resorts, Inc. | | |
| | |
| | |
| | |
|
Consumer Staples Distribution & Retail 1.8% |
Albertsons Cos., Inc., Class A | | |
BJ's Wholesale Club Holdings, Inc. * | | |
Casey's General Stores, Inc. | | |
| | |
| | |
| | |
| | |
Performance Food Group Co. * | | |
| | |
| | |
U.S. Foods Holding Corp. * | | |
Walgreens Boots Alliance, Inc. | | |
| | |
| | |
|
|
| | |
| | |
| | |
Baker Hughes Co., Class A | | |
| | |
| | |
| | |
| | |
| | |
| | |
| | |
| | |
| | |
| | |
| | |
| | |
| | |
| | |
| | |
| | |
| | |
| | |
| | |
Magnolia Oil & Gas Corp., Class A | | |
| | |
| | |
| | |
| | |
New Fortress Energy, Inc. | | |
| | |
| | |
Occidental Petroleum Corp. | | |
| | |
| | |
44
Schwab Equity Index Funds | Annual Report
Portfolio Holdings as of October 31, 2023 (continued)
| | |
Patterson-UTI Energy, Inc. | | |
PBF Energy, Inc., Class A | | |
Permian Resources Corp., Class A | | |
| | |
Pioneer Natural Resources Co. | | |
| | |
| | |
| | |
Southwestern Energy Co. * | | |
| | |
| | |
| | |
| | |
| | |
| | |
Weatherford International PLC * | | |
| | |
| | |
|
Equity Real Estate Investment Trusts (REITs) 2.4% |
| | |
Alexandria Real Estate Equities, Inc. | | |
American Homes 4 Rent, Class A | | |
| | |
Americold Realty Trust, Inc. | | |
Apartment Income REIT Corp. | | |
AvalonBay Communities, Inc. | | |
| | |
Brixmor Property Group, Inc. | | |
| | |
| | |
| | |
Digital Realty Trust, Inc. | | |
EastGroup Properties, Inc. | | |
| | |
Equity LifeStyle Properties, Inc. | | |
| | |
Essex Property Trust, Inc. | | |
Extra Space Storage, Inc. | | |
Federal Realty Investment Trust | | |
First Industrial Realty Trust, Inc. | | |
Gaming & Leisure Properties, Inc. | | |
Healthcare Realty Trust, Inc., Class A | | |
Healthpeak Properties, Inc. | | |
Host Hotels & Resorts, Inc. | | |
| | |
| | |
| | |
| | |
| | |
Lamar Advertising Co., Class A | | |
Medical Properties Trust, Inc. | | |
Mid-America Apartment Communities, Inc. | | |
| | |
Omega Healthcare Investors, Inc. | | |
| | |
| | |
| | |
| | |
| | |
Rexford Industrial Realty, Inc. | | |
Ryman Hospitality Properties, Inc. | | |
SBA Communications Corp., Class A | | |
Simon Property Group, Inc. | | |
Spirit Realty Capital, Inc. | | |
| | |
| | |
| | |
| | |
| | |
| | |
VICI Properties, Inc., Class A | | |
| | |
| | |
| | |
| | |
| | |
|
|
Affiliated Managers Group, Inc. | | |
| | |
| | |
| | |
| | |
Ameriprise Financial, Inc. | | |
Annaly Capital Management, Inc. | | |
Apollo Global Management, Inc. | | |
Ares Management Corp., Class A | | |
Bank of New York Mellon Corp. | | |
Berkshire Hathaway, Inc., Class B * | | |
| | |
| | |
| | |
Blue Owl Capital, Inc., Class A | | |
Capital One Financial Corp. | | |
| | |
Cboe Global Markets, Inc. | | |
| | |
| | |
Coinbase Global, Inc., Class A * | | |
Corebridge Financial, Inc. | | |
Credit Acceptance Corp. * | | |
Discover Financial Services | | |
| | |
| | |
| | |
| | |
FactSet Research Systems, Inc. | | |
Fidelity National Information Services, Inc. | | |
| | |
FleetCor Technologies, Inc. * | | |
| | |
| | |
Goldman Sachs Group, Inc. | | |
Houlihan Lokey, Inc., Class A | | |
Interactive Brokers Group, Inc., Class A | | |
Intercontinental Exchange, Inc. | | |
| | |
Jack Henry & Associates, Inc. | | |
Janus Henderson Group PLC | | |
Jefferies Financial Group, Inc. | | |
| | |
LPL Financial Holdings, Inc. | | |
MarketAxess Holdings, Inc. | | |
Mastercard, Inc., Class A | | |
| | |
| | |
| | |
| | |
| | |
| | |
| | |
Schwab Equity Index Funds | Annual Report45
Portfolio Holdings as of October 31, 2023 (continued)
| | |
| | |
| | |
Raymond James Financial, Inc. | | |
| | |
| | |
Robinhood Markets, Inc., Class A * | | |
| | |
| | |
SoFi Technologies, Inc. * | | |
Starwood Property Trust, Inc. | | |
| | |
| | |
| | |
| | |
| | |
Tradeweb Markets, Inc., Class A | | |
| | |
| | |
| | |
| | |
| | |
|
Food, Beverage & Tobacco 3.0% |
| | |
Archer-Daniels-Midland Co. | | |
Brown-Forman Corp., Class B | | |
| | |
| | |
| | |
| | |
Coca-Cola Consolidated, Inc. | | |
| | |
Constellation Brands, Inc., Class A | | |
Darling Ingredients, Inc. * | | |
| | |
| | |
| | |
| | |
| | |
| | |
| | |
| | |
| | |
Lamb Weston Holdings, Inc. | | |
| | |
McCormick & Co., Inc. - Non Voting Shares | | |
Molson Coors Beverage Co., Class B | | |
Mondelez International, Inc., Class A | | |
| | |
National Beverage Corp. * | | |
| | |
Philip Morris International, Inc. | | |
| | |
| | |
Tyson Foods, Inc., Class A | | |
| | |
| | |
|
Health Care Equipment & Services 5.4% |
| | |
Acadia Healthcare Co., Inc. * | | |
| | |
| | |
Baxter International, Inc. | | |
| | |
| | |
Boston Scientific Corp. * | | |
| | |
| | |
| | |
| | |
| | |
| | |
| | |
| | |
| | |
| | |
Edwards Lifesciences Corp. * | | |
| | |
| | |
| | |
| | |
GE HealthCare Technologies, Inc. | | |
Globus Medical, Inc., Class A * | | |
| | |
| | |
| | |
| | |
| | |
| | |
IDEXX Laboratories, Inc. * | | |
Inspire Medical Systems, Inc. * | | |
| | |
Intuitive Surgical, Inc. * | | |
Laboratory Corp. of America Holdings | | |
Lantheus Holdings, Inc. * | | |
| | |
| | |
| | |
Molina Healthcare, Inc. * | | |
| | |
Option Care Health, Inc. * | | |
| | |
| | |
| | |
| | |
| | |
Shockwave Medical, Inc. * | | |
| | |
| | |
| | |
| | |
| | |
| | |
Universal Health Services, Inc., Class B | | |
Veeva Systems, Inc., Class A * | | |
Zimmer Biomet Holdings, Inc. | | |
| | |
|
Household & Personal Products 1.5% |
| | |
Church & Dwight Co., Inc. | | |
| | |
| | |
| | |
| | |
Estee Lauder Cos., Inc., Class A | | |
| | |
| | |
| | |
| | |
46
Schwab Equity Index Funds | Annual Report
Portfolio Holdings as of October 31, 2023 (continued)
| | |
Reynolds Consumer Products, Inc. | | |
| | |
|
|
| | |
| | |
American Financial Group, Inc. | | |
American International Group, Inc. | | |
| | |
Arch Capital Group Ltd. * | | |
| | |
| | |
Axis Capital Holdings Ltd. | | |
| | |
| | |
Cincinnati Financial Corp. | | |
| | |
Erie Indemnity Co., Class A | | |
| | |
Fidelity National Financial, Inc. | | |
First American Financial Corp. | | |
| | |
Hartford Financial Services Group, Inc. | | |
Kinsale Capital Group, Inc. | | |
| | |
| | |
| | |
Marsh & McLennan Cos., Inc. | | |
| | |
Old Republic International Corp. | | |
| | |
Principal Financial Group, Inc. | | |
| | |
Prudential Financial, Inc. | | |
Reinsurance Group of America, Inc. | | |
RenaissanceRe Holdings Ltd. | | |
| | |
Ryan Specialty Holdings, Inc., Class A * | | |
Selective Insurance Group, Inc. | | |
| | |
| | |
| | |
| | |
| | |
|
|
Air Products & Chemicals, Inc. | | |
| | |
| | |
| | |
| | |
| | |
| | |
| | |
Axalta Coating Systems Ltd. * | | |
| | |
| | |
| | |
| | |
CF Industries Holdings, Inc. | | |
| | |
| | |
| | |
| | |
| | |
| | |
| | |
| | |
| | |
| | |
| | |
| | |
| | |
| | |
Graphic Packaging Holding Co. | | |
| | |
International Flavors & Fragrances, Inc. | | |
| | |
| | |
| | |
LyondellBasell Industries NV, Class A | | |
Martin Marietta Materials, Inc. | | |
| | |
| | |
| | |
| | |
| | |
Packaging Corp. of America | | |
| | |
Reliance Steel & Aluminum Co. | | |
| | |
| | |
| | |
| | |
| | |
| | |
| | |
Summit Materials, Inc., Class A * | | |
| | |
| | |
| | |
| | |
| | |
|
Media & Entertainment 7.4% |
Alphabet, Inc., Class A * | | |
Alphabet, Inc., Class C * | | |
Charter Communications, Inc., Class A * | | |
| | |
| | |
Endeavor Group Holdings, Inc., Class A | | |
| | |
| | |
Interpublic Group of Cos., Inc. | | |
Liberty Broadband Corp., Class C * | | |
Liberty Media Corp.-Liberty Formula One, Class C * | | |
Liberty Media Corp.-Liberty SiriusXM, Class C * | | |
Live Nation Entertainment, Inc. * | | |
| | |
Meta Platforms, Inc., Class A * | | |
| | |
New York Times Co., Class A | | |
| | |
Nexstar Media Group, Inc., Class A | | |
| | |
Paramount Global, Class B | | |
Schwab Equity Index Funds | Annual Report47
Portfolio Holdings as of October 31, 2023 (continued)
| | |
Pinterest, Inc., Class A * | | |
| | |
| | |
Sirius XM Holdings, Inc. (a) | | |
| | |
Take-Two Interactive Software, Inc. * | | |
| | |
Trade Desk, Inc., Class A * | | |
| | |
Warner Bros Discovery, Inc. * | | |
Warner Music Group Corp., Class A | | |
ZoomInfo Technologies, Inc., Class A * | | |
| | |
|
Pharmaceuticals, Biotechnology & Life Sciences 7.3% |
10X Genomics, Inc., Class A * | | |
| | |
ACADIA Pharmaceuticals, Inc. * | | |
Agilent Technologies, Inc. | | |
| | |
Alnylam Pharmaceuticals, Inc. * | | |
| | |
Apellis Pharmaceuticals, Inc. * | | |
| | |
| | |
BioMarin Pharmaceutical, Inc. * | | |
Bio-Rad Laboratories, Inc., Class A * | | |
| | |
| | |
| | |
| | |
| | |
Charles River Laboratories International, Inc. * | | |
| | |
Elanco Animal Health, Inc. * | | |
| | |
| | |
| | |
| | |
Halozyme Therapeutics, Inc. * | | |
| | |
| | |
Intra-Cellular Therapies, Inc. * | | |
Ionis Pharmaceuticals, Inc. * | | |
| | |
Jazz Pharmaceuticals PLC * | | |
| | |
Karuna Therapeutics, Inc. * | | |
| | |
| | |
Mettler-Toledo International, Inc. * | | |
| | |
| | |
Neurocrine Biosciences, Inc. * | | |
| | |
| | |
| | |
Regeneron Pharmaceuticals, Inc. * | | |
| | |
| | |
| | |
Royalty Pharma PLC, Class A | | |
Sarepta Therapeutics, Inc. * | | |
| | |
| | |
Thermo Fisher Scientific, Inc. | | |
| | |
United Therapeutics Corp. * | | |
| | |
Vertex Pharmaceuticals, Inc. * | | |
| | |
| | |
West Pharmaceutical Services, Inc. | | |
| | |
| | |
|
Real Estate Management & Development 0.2% |
CBRE Group, Inc., Class A * | | |
| | |
Jones Lang LaSalle, Inc. * | | |
Zillow Group, Inc., Class C * | | |
| | |
|
Semiconductors & Semiconductor Equipment 6.7% |
Advanced Micro Devices, Inc. * | | |
Allegro MicroSystems, Inc. * | | |
| | |
| | |
| | |
Axcelis Technologies, Inc. * | | |
| | |
| | |
| | |
| | |
| | |
GLOBALFOUNDRIES, Inc. *(a) | | |
| | |
| | |
| | |
Lattice Semiconductor Corp. * | | |
MACOM Technology Solutions Holdings, Inc. * | | |
| | |
Microchip Technology, Inc. | | |
| | |
| | |
Monolithic Power Systems, Inc. | | |
| | |
| | |
| | |
| | |
| | |
| | |
| | |
| | |
| | |
SolarEdge Technologies, Inc. * | | |
| | |
| | |
| | |
| | |
| | |
|
Software & Services 12.3% |
| | |
| | |
Akamai Technologies, Inc. * | | |
| | |
| | |
AppLovin Corp., Class A * | | |
| | |
Atlassian Corp., Class A * | | |
48
Schwab Equity Index Funds | Annual Report
Portfolio Holdings as of October 31, 2023 (continued)
| | |
| | |
Bentley Systems, Inc., Class B | | |
| | |
Cadence Design Systems, Inc. * | | |
CCC Intelligent Solutions Holdings, Inc. * | | |
Cloudflare, Inc., Class A * | | |
Cognizant Technology Solutions Corp., Class A | | |
Confluent, Inc., Class A * | | |
Crowdstrike Holdings, Inc., Class A * | | |
| | |
DocuSign, Inc., Class A * | | |
Dolby Laboratories, Inc., Class A | | |
DoubleVerify Holdings, Inc. * | | |
| | |
| | |
| | |
| | |
| | |
| | |
| | |
| | |
| | |
| | |
| | |
Guidewire Software, Inc. * | | |
| | |
Informatica, Inc., Class A * | | |
International Business Machines Corp. | | |
| | |
Manhattan Associates, Inc. * | | |
| | |
| | |
| | |
| | |
| | |
| | |
Palantir Technologies, Inc., Class A * | | |
Palo Alto Networks, Inc. * | | |
Procore Technologies, Inc. * | | |
| | |
| | |
| | |
| | |
| | |
| | |
Smartsheet, Inc., Class A * | | |
Snowflake, Inc., Class A * | | |
| | |
| | |
| | |
| | |
| | |
| | |
Tyler Technologies, Inc. * | | |
| | |
| | |
| | |
| | |
| | |
| | |
Zoom Video Communications, Inc., Class A * | | |
| | |
| | |
| | |
|
Technology Hardware & Equipment 8.3% |
Advanced Energy Industries, Inc. | | |
| | |
| | |
| | |
Arrow Electronics, Inc. * | | |
| | |
| | |
| | |
| | |
| | |
| | |
| | |
| | |
Dell Technologies, Inc., Class C | | |
| | |
| | |
Hewlett Packard Enterprise Co. | | |
| | |
Insight Enterprises, Inc. * | | |
| | |
| | |
| | |
Keysight Technologies, Inc. * | | |
| | |
| | |
| | |
| | |
Pure Storage, Inc., Class A * | | |
Seagate Technology Holdings PLC | | |
Super Micro Computer, Inc. * | | |
| | |
| | |
Teledyne Technologies, Inc. * | | |
| | |
| | |
| | |
| | |
Zebra Technologies Corp., Class A * | | |
| | |
|
Telecommunication Services 0.9% |
| | |
| | |
Iridium Communications, Inc. | | |
Liberty Global PLC, Class C * | | |
| | |
Verizon Communications, Inc. | | |
| | |
|
|
| | |
American Airlines Group, Inc. * | | |
Avis Budget Group, Inc. * | | |
CH Robinson Worldwide, Inc. | | |
| | |
| | |
Expeditors International of Washington, Inc. | | |
| | |
| | |
Hertz Global Holdings, Inc. * | | |
Schwab Equity Index Funds | Annual Report49
Portfolio Holdings as of October 31, 2023 (continued)
| | |
JB Hunt Transport Services, Inc. | | |
| | |
| | |
Knight-Swift Transportation Holdings, Inc. | | |
| | |
| | |
| | |
Old Dominion Freight Line, Inc. | | |
| | |
| | |
| | |
Uber Technologies, Inc. * | | |
U-Haul Holding Co. - Non Voting | | |
| | |
United Airlines Holdings, Inc. * | | |
United Parcel Service, Inc., Class B | | |
| | |
| | |
|
|
| | |
| | |
| | |
American Electric Power Co., Inc. | | |
American Water Works Co., Inc. | | |
| | |
| | |
| | |
| | |
Consolidated Edison, Inc. | | |
Constellation Energy Corp. | | |
| | |
| | |
| | |
| | |
| | |
Essential Utilities, Inc. | | |
| | |
| | |
| | |
| | |
| | |
| | |
| | |
| | |
| | |
| | |
| | |
| | |
Pinnacle West Capital Corp. | | |
Portland General Electric Co. | | |
| | |
| | |
Public Service Enterprise Group, Inc. | | |
| | |
| | |
Southwest Gas Holdings, Inc. | | |
| | |
| | |
| | |
| | |
| | |
Total Common Stocks
(Cost $3,321,129,676) | |
| | |
SHORT-TERM INVESTMENTS 0.5% OF NET ASSETS |
|
|
State Street Institutional U.S. Government Money Market Fund, Premier Class 5.30% (d) | | |
State Street Institutional U.S. Government Money Market Fund, Premier Class 5.30% (d)(e) | | |
| | |
Total Short-Term Investments
(Cost $63,946,859) | |
Total Investments in Securities
(Cost $3,385,076,535) | |
| | | CURRENT VALUE/
UNREALIZED
DEPRECIATION
($) |
|
| | | |
S&P 500 Index, e-mini, expires 12/15/23 | | | |
| Non-income producing security. |
| All or a portion of this security is on loan. Securities on loan were valued at $5,448,948. |
| Issuer is affiliated with the fund’s investment adviser. |
| Fair valued using significant unobservable inputs (see financial note 2(a), Securities for which no quoted value is available, for additional information). |
| The rate shown is the annualized 7-day yield. |
| Security purchased with cash collateral received for securities on loan. |
| Real Estate Investment Trust |
Below is a summary of the fund’s transactions with affiliated issuers during the period ended October 31, 2023:
| | | | | NET CHANGE IN UNREALIZED APPRECIATION (DEPRECIATION) | | BALANCE OF SHARES HELD AT 10/31/23 | |
COMMON STOCKS 0.2% OF NET ASSETS |
|
|
| | | | | | | | |
50
Schwab Equity Index Funds | Annual Report
Portfolio Holdings as of October 31, 2023 (continued)
The following is a summary of the inputs used to value the fund’s investments as of October 31, 2023 (see financial note 2(a) for additional information):
| QUOTED PRICES IN
ACTIVE MARKETS FOR
IDENTICAL ASSETS
(LEVEL 1) | OTHER SIGNIFICANT
OBSERVABLE INPUTS
(LEVEL 2) | SIGNIFICANT
UNOBSERVABLE INPUTS
(LEVEL 3) | |
| | | | |
| | | | |
Telecommunication Services | | | | |
| | | | |
| | | | |
| | | | |
| | | | |
| As categorized in the Portfolio Holdings. |
| Futures contracts are reported at cumulative unrealized appreciation or depreciation. |
Schwab Equity Index Funds | Annual Report51
Statement of Assets and Liabilities
As of October 31, 2023
|
Investments in securities, at value - affiliated (cost $4,378,393) | | |
Investments in securities, at value - unaffiliated (cost $3,380,698,142) including securities on loan of $5,448,948 | | |
Deposit with broker for futures contracts | | |
| | |
| | |
| | |
Variation margin on future contracts | | |
Income from securities on loan | | |
| | |
|
|
Collateral held for securities on loan | | |
| | |
| | |
| | |
| | |
| | |
| | |
|
|
Capital received from investors | | |
Total distributable earnings | | |
| | |
52
Schwab Equity Index Funds | Annual Report
Statement of Operations
For the period November 1, 2022 through October 31, 2023 |
|
Dividends received from securities - unaffiliated (net of foreign withholding tax of $54,987) | | |
Dividends received from securities - affiliated | | |
Interest received from securities - unaffiliated | | |
| | |
| | |
|
|
| | |
| | |
| | |
|
REALIZED AND UNREALIZED GAINS (LOSSES) |
Net realized losses on sales of securities - affiliated | | |
Net realized losses on sales of securities - unaffiliated | | |
Net realized gains on sales of in-kind redemptions - unaffiliated | | |
Net realized gains on futures contracts | | |
| | |
Net change in unrealized appreciation (depreciation) on securities - affiliated | | |
Net change in unrealized appreciation (depreciation) on securities - unaffiliated | | |
Net change in unrealized appreciation (depreciation) on futures contracts | | |
Net change in unrealized appreciation (depreciation) | | |
Net realized and unrealized gains | | |
Increase in net assets resulting from operations | | |
Schwab Equity Index Funds | Annual Report53
Statement of Changes in Net Assets
For the current and prior report periods
|
| | |
| | | |
| | | |
Net change in unrealized appreciation (depreciation) | | | |
Increase (decrease) in net assets resulting from operations | | | |
|
DISTRIBUTIONS TO SHAREHOLDERS |
| | | |
TRANSACTIONS IN FUND SHARES |
| | |
| | | | | |
| | | | | |
| | | | | |
| | | | | |
Net transactions in fund shares | | | | | |
|
SHARES OUTSTANDING AND NET ASSETS |
| | |
| | | | | |
| | | | | |
Total increase (decrease) | | | | | |
| | | | | |
54
Schwab Equity Index Funds | Annual Report
Schwab Small-Cap Index Fund
Financial Statements
| | | | | | |
|
Net asset value at beginning of period | | | | | | |
Income (loss) from investment operations: | | | | | | |
Net investment income (loss)1 | | | | | | |
Net realized and unrealized gains (losses) | | | | | | |
Total from investment operations | | | | | | |
| | | | | | |
Distributions from net investment income | | | | | | |
Distributions from net realized gains | | | | | | |
| | | | | | |
Net asset value at end of period | | | | | | |
| | | | | | |
|
Ratios to average net assets: | | | | | | |
| | | | | | |
Net investment income (loss) | | | | | | |
| | | | | | |
Net assets, end of period (x 1,000,000) | | | | | | |
| Calculated based on the average shares outstanding during the period. |
| Ratio includes less than 0.005% of non-routine proxy expenses. |
| Effective December 20, 2018, the annual operating expense ratio was reduced to 0.04%. The ratio presented for period ended October 31, 2019 is a blended ratio. |
| Portfolio turnover rate excludes in-kind transactions. |
Schwab Equity Index Funds | Annual Report55
Schwab Small-Cap Index Fund
Portfolio Holdings as of October 31, 2023
This section shows all the securities in the fund’s portfolio and their values as of the report date.
The fund files its complete schedule of portfolio holdings with the U.S. Securities and Exchange Commission (SEC) for the first and third quarters of each fiscal year on Form N-PORT Part F. The fund’s Form N-PORT Part F is available on the SEC’s website at www.sec.gov. You can also obtain this information at no cost on the fund’s website at www.schwabassetmanagement.com/schwabfunds_prospectus, by calling 1-866-414-6349, or by sending an email request to orders@mysummaryprospectus.com. The fund also makes available its complete schedule of portfolio holdings 15 to 20 days after the end of the month on the fund’s website.
| | |
COMMON STOCKS 99.5% OF NET ASSETS |
|
Automobiles & Components 1.5% |
| | |
American Axle & Manufacturing Holdings, Inc. * | | |
Atmus Filtration Technologies, Inc. *(a) | | |
Cooper-Standard Holdings, Inc. * | | |
| | |
| | |
| | |
Fox Factory Holding Corp. * | | |
| | |
Goodyear Tire & Rubber Co. * | | |
| | |
| | |
Livewire Group, Inc., Class A * | | |
Luminar Technologies, Inc., Class A *(a) | | |
Modine Manufacturing Co. * | | |
| | |
| | |
Standard Motor Products, Inc. | | |
| | |
| | |
Winnebago Industries, Inc. | | |
| | |
| | |
| | |
|
|
| | |
| | |
Amalgamated Financial Corp. | | |
| | |
American National Bankshares, Inc. | | |
| | |
| | |
| | |
| | |
Atlantic Union Bankshares Corp. | | |
| | |
| | |
| | |
| | |
| | |
| | |
| | |
Bank of NT Butterfield & Son Ltd. | | |
| | |
| | |
Bankwell Financial Group, Inc. | | |
| | |
| | |
| | |
| | |
Berkshire Hills Bancorp, Inc. | | |
| | |
| | |
Blue Ridge Bankshares, Inc. | | |
Bridgewater Bancshares, Inc. * | | |
| | |
Burke & Herbert Financial Services Corp. | | |
Business First Bancshares, Inc. | | |
| | |
| | |
| | |
| | |
| | |
| | |
Capital City Bank Group, Inc. | | |
Capitol Federal Financial, Inc. | | |
Capstar Financial Holdings, Inc. | | |
Carter Bankshares, Inc. * | | |
| | |
Central Pacific Financial Corp. | | |
Central Valley Community Bancorp | | |
| | |
ChoiceOne Financial Services, Inc. | | |
Citizens & Northern Corp. | | |
Citizens Financial Services, Inc. | | |
| | |
| | |
| | |
Coastal Financial Corp. * | | |
Codorus Valley Bancorp, Inc. | | |
| | |
Columbia Financial, Inc. * | | |
Community Bank System, Inc. | | |
Community Trust Bancorp, Inc. | | |
| | |
CrossFirst Bankshares, Inc. * | | |
Customers Bancorp, Inc. * | | |
| | |
Dime Community Bancshares, Inc. | | |
| | |
| | |
| | |
Enterprise Financial Services Corp. | | |
Equity Bancshares, Inc., Class A | | |
Esquire Financial Holdings, Inc. | | |
| | |
| | |
Farmers & Merchants Bancorp, Inc. | | |
Farmers National Banc Corp. | | |
| | |
Fidelity D&D Bancorp, Inc. | | |
Financial Institutions, Inc. | | |
| | |
| | |
First Bancorp/Southern Pines NC | | |
| | |
| | |
| | |
First Business Financial Services, Inc. | | |
56
Schwab Equity Index Funds | Annual Report
Schwab Small-Cap Index Fund
Portfolio Holdings as of October 31, 2023 (continued)
| | |
First Commonwealth Financial Corp. | | |
First Community Bankshares, Inc. | | |
| | |
| | |
First Financial Bankshares, Inc. | | |
| | |
| | |
First Interstate BancSystem, Inc., Class A | | |
| | |
First Mid Bancshares, Inc. | | |
First of Long Island Corp. | | |
First Western Financial, Inc. * | | |
| | |
| | |
| | |
| | |
| | |
German American Bancorp, Inc. | | |
| | |
Great Southern Bancorp, Inc. | | |
Greene County Bancorp, Inc. | | |
Guaranty Bancshares, Inc. | | |
| | |
| | |
| | |
| | |
Heartland Financial USA, Inc. | | |
| | |
| | |
| | |
Hingham Institution For Savings | | |
| | |
| | |
| | |
HomeTrust Bancshares, Inc. | | |
| | |
| | |
| | |
| | |
Independent Bank Group, Inc. | | |
International Bancshares Corp. | | |
John Marshall Bancorp, Inc. | | |
| | |
| | |
| | |
| | |
Live Oak Bancshares, Inc. | | |
| | |
| | |
MainStreet Bancshares, Inc. | | |
| | |
Metrocity Bankshares, Inc. | | |
Metropolitan Bank Holding Corp. * | | |
| | |
| | |
Midland States Bancorp, Inc. | | |
MidWestOne Financial Group, Inc. | | |
| | |
National Bank Holdings Corp., Class A | | |
National Bankshares, Inc. (a) | | |
| | |
| | |
| | |
Northeast Community Bancorp, Inc. | | |
| | |
| | |
Northwest Bancshares, Inc. | | |
| | |
| | |
| | |
OceanFirst Financial Corp. | | |
| | |
| | |
| | |
Orange County Bancorp, Inc. | | |
| | |
Orrstown Financial Services, Inc. | | |
Pacific Premier Bancorp, Inc. | | |
| | |
| | |
| | |
| | |
| | |
Peapack-Gladstone Financial Corp. | | |
Penns Woods Bancorp, Inc. | | |
| | |
Peoples Financial Services Corp. | | |
| | |
| | |
Ponce Financial Group, Inc. * | | |
| | |
| | |
| | |
| | |
Provident Financial Services, Inc. | | |
| | |
| | |
Red River Bancshares, Inc. | | |
| | |
Republic Bancorp, Inc., Class A | | |
| | |
Sandy Spring Bancorp, Inc. | | |
Seacoast Banking Corp. of Florida | | |
ServisFirst Bancshares, Inc. | | |
| | |
| | |
Simmons First National Corp., Class A | | |
| | |
South Plains Financial, Inc. | | |
Southern First Bancshares, Inc. * | | |
Southern Missouri Bancorp, Inc. | | |
Southern States Bancshares, Inc. | | |
Southside Bancshares, Inc. | | |
| | |
| | |
| | |
Stock Yards Bancorp, Inc. | | |
Summit Financial Group, Inc. | | |
Texas Capital Bancshares, Inc. * | | |
Third Coast Bancshares, Inc. * | | |
| | |
| | |
| | |
| | |
| | |
| | |
| | |
| | |
| | |
United Community Banks, Inc. | | |
| | |
| | |
USCB Financial Holdings, Inc. * | | |
| | |
| | |
Virginia National Bankshares Corp. (a) | | |
Schwab Equity Index Funds | Annual Report57
Schwab Small-Cap Index Fund
Portfolio Holdings as of October 31, 2023 (continued)
| | |
| | |
Washington Trust Bancorp, Inc. | | |
| | |
| | |
| | |
| | |
| | |
|
|
| | |
| | |
| | |
| | |
| | |
| | |
| | |
Albany International Corp., Class A | | |
| | |
Alta Equipment Group, Inc. | | |
Ameresco, Inc., Class A * | | |
American Woodmark Corp. * | | |
Amprius Technologies, Inc. *(a) | | |
| | |
| | |
Applied Industrial Technologies, Inc. | | |
Archer Aviation, Inc., Class A *(a) | | |
| | |
| | |
Array Technologies, Inc. * | | |
| | |
| | |
| | |
| | |
Babcock & Wilcox Enterprises, Inc. * | | |
| | |
Beacon Roofing Supply, Inc. * | | |
| | |
Bloom Energy Corp., Class A * | | |
| | |
BlueLinx Holdings, Inc. * | | |
| | |
Bowman Consulting Group Ltd., Class A * | | |
Brookfield Business Corp., Class A | | |
| | |
| | |
| | |
Comfort Systems USA, Inc. | | |
Commercial Vehicle Group, Inc. * | | |
Concrete Pumping Holdings, Inc. * | | |
Construction Partners, Inc., Class A * | | |
| | |
Custom Truck One Source, Inc. * | | |
Desktop Metal, Inc., Class A *(a) | | |
Distribution Solutions Group, Inc. * | | |
| | |
Dragonfly Energy Holdings Corp. *(a) | | |
| | |
| | |
| | |
| | |
| | |
Energy Vault Holdings, Inc. *(a) | | |
Enerpac Tool Group Corp., Class A | | |
| | |
| | |
| | |
| | |
| | |
Eos Energy Enterprises, Inc. *(a) | | |
| | |
| | |
| | |
| | |
| | |
| | |
| | |
Franklin Electric Co., Inc. | | |
| | |
| | |
FuelCell Energy, Inc. *(a) | | |
| | |
Gencor Industries, Inc. * | | |
Gibraltar Industries, Inc. * | | |
| | |
| | |
| | |
GrafTech International Ltd. | | |
Granite Construction, Inc. | | |
Great Lakes Dredge & Dock Corp. * | | |
| | |
| | |
H&E Equipment Services, Inc. | | |
Helios Technologies, Inc. | | |
| | |
| | |
Hillman Solutions Corp. * | | |
Hudson Technologies, Inc. * | | |
| | |
Hyster-Yale Materials Handling, Inc. | | |
| | |
| | |
| | |
Janus International Group, Inc. * | | |
| | |
John Bean Technologies Corp. | | |
| | |
| | |
| | |
| | |
Kratos Defense & Security Solutions, Inc. * | | |
| | |
| | |
| | |
| | |
| | |
| | |
Masonite International Corp. * | | |
| | |
Mayville Engineering Co., Inc. * | | |
| | |
Microvast Holdings, Inc. * | | |
| | |
| | |
| | |
| | |
Mueller Water Products, Inc., Class A | | |
| | |
National Presto Industries, Inc. | | |
NEXTracker, Inc., Class A * | | |
| | |
| | |
| | |
| | |
| | |
58
Schwab Equity Index Funds | Annual Report
Schwab Small-Cap Index Fund
Portfolio Holdings as of October 31, 2023 (continued)
| | |
| | |
| | |
| | |
| | |
Preformed Line Products Co. | | |
| | |
| | |
Quanex Building Products Corp. | | |
| | |
Resideo Technologies, Inc. * | | |
| | |
| | |
Rush Enterprises, Inc., Class A | | |
Rush Enterprises, Inc., Class B | | |
| | |
Shoals Technologies Group, Inc., Class A * | | |
| | |
Simpson Manufacturing Co., Inc. | | |
| | |
Southland Holdings, Inc. *(a) | | |
| | |
Standex International Corp. | | |
| | |
Sterling Infrastructure, Inc. * | | |
| | |
| | |
| | |
Terran Orbital Corp. *(a) | | |
Textainer Group Holdings Ltd. | | |
Thermon Group Holdings, Inc. * | | |
Titan International, Inc. * | | |
| | |
TPI Composites, Inc. *(a) | | |
| | |
| | |
| | |
| | |
| | |
| | |
| | |
| | |
| | |
Virgin Galactic Holdings, Inc. *(a) | | |
| | |
Watts Water Technologies, Inc., Class A | | |
Willis Lease Finance Corp. * | | |
| | |
Zurn Elkay Water Solutions Corp. | | |
| | |
|
Commercial & Professional Services 4.2% |
| | |
| | |
ACV Auctions, Inc., Class A * | | |
| | |
Aris Water Solutions, Inc., Class A | | |
| | |
| | |
Barrett Business Services, Inc. | | |
Blacksky Technology, Inc. *(a) | | |
BrightView Holdings, Inc. * | | |
| | |
Casella Waste Systems, Inc., Class A * | | |
| | |
CECO Environmental Corp. * | | |
| | |
| | |
CompX International, Inc. | | |
| | |
| | |
| | |
CSG Systems International, Inc. | | |
| | |
| | |
| | |
ExlService Holdings, Inc. * | | |
| | |
| | |
FiscalNote Holdings, Inc. *(a) | | |
Forrester Research, Inc. * | | |
| | |
| | |
Healthcare Services Group, Inc. | | |
Heidrick & Struggles International, Inc. | | |
| | |
HireRight Holdings Corp. * | | |
| | |
Huron Consulting Group, Inc. * | | |
| | |
| | |
| | |
| | |
| | |
Kelly Services, Inc., Class A | | |
| | |
| | |
LanzaTech Global, Inc. *(a) | | |
| | |
Li-Cycle Holdings Corp. *(a) | | |
Liquidity Services, Inc. * | | |
Matthews International Corp., Class A | | |
| | |
| | |
| | |
Montrose Environmental Group, Inc. * | | |
| | |
| | |
| | |
| | |
Performant Financial Corp. * | | |
| | |
| | |
| | |
Resources Connection, Inc. | | |
| | |
| | |
| | |
| | |
| | |
| | |
| | |
| | |
| | |
Verra Mobility Corp., Class A * | | |
| | |
| | |
| | |
| | |
|
Consumer Discretionary Distribution & Retail 2.6% |
1-800-Flowers.com, Inc., Class A * | | |
| | |
Abercrombie & Fitch Co., Class A * | | |
Academy Sports & Outdoors, Inc. | | |
Schwab Equity Index Funds | Annual Report59
Schwab Small-Cap Index Fund
Portfolio Holdings as of October 31, 2023 (continued)
| | |
American Eagle Outfitters, Inc. | | |
America's Car-Mart, Inc. * | | |
| | |
Asbury Automotive Group, Inc. * | | |
| | |
Big 5 Sporting Goods Corp. (a) | | |
| | |
Boot Barn Holdings, Inc. * | | |
| | |
Build-A-Bear Workshop, Inc. | | |
| | |
Camping World Holdings, Inc., Class A | | |
| | |
| | |
| | |
| | |
| | |
ContextLogic, Inc., Class A *(a) | | |
Designer Brands, Inc., Class A | | |
Destination XL Group, Inc. * | | |
| | |
Duluth Holdings, Inc., Class B * | | |
| | |
| | |
| | |
| | |
| | |
| | |
| | |
Haverty Furniture Cos., Inc. | | |
| | |
| | |
| | |
Lazydays Holdings, Inc. * | | |
| | |
| | |
| | |
National Vision Holdings, Inc. * | | |
| | |
OneWater Marine, Inc., Class A * | | |
| | |
| | |
Qurate Retail, Inc., Class B * | | |
Rent the Runway, Inc., Class A * | | |
| | |
Sally Beauty Holdings, Inc. * | | |
Savers Value Village, Inc. * | | |
| | |
| | |
| | |
Sonic Automotive, Inc., Class A | | |
Sportsman's Warehouse Holdings, Inc. * | | |
Stitch Fix, Inc., Class A * | | |
| | |
Tile Shop Holdings, Inc. * | | |
| | |
Torrid Holdings, Inc. *(a) | | |
| | |
| | |
Warby Parker, Inc., Class A * | | |
| | |
| | |
| | |
| | |
|
| | |
Consumer Durables & Apparel 2.9% |
| | |
Allbirds, Inc., Class A * | | |
| | |
| | |
| | |
Century Communities, Inc. | | |
| | |
Cricut, Inc., Class A (a) | | |
Dream Finders Homes, Inc., Class A * | | |
| | |
Ethan Allen Interiors, Inc. | | |
| | |
| | |
| | |
G-III Apparel Group Ltd. * | | |
| | |
Green Brick Partners, Inc. * | | |
| | |
| | |
| | |
Hovnanian Enterprises, Inc., Class A * | | |
Installed Building Products, Inc. | | |
| | |
| | |
Johnson Outdoors, Inc., Class A | | |
| | |
| | |
| | |
| | |
| | |
| | |
| | |
| | |
| | |
Malibu Boats, Inc., Class A * | | |
| | |
MasterCraft Boat Holdings, Inc. * | | |
| | |
| | |
| | |
| | |
Purple Innovation, Inc., Class A (a) | | |
| | |
| | |
Smith & Wesson Brands, Inc. | | |
Snap One Holdings Corp. * | | |
Solo Brands, Inc., Class A * | | |
| | |
| | |
| | |
Taylor Morrison Home Corp., Class A * | | |
Topgolf Callaway Brands Corp. * | | |
| | |
| | |
United Homes Group, Inc. * | | |
| | |
| | |
Vizio Holding Corp., Class A * | | |
VOXX International Corp., Class A * | | |
Wolverine World Wide, Inc. | | |
| | |
|
|
| | |
Accel Entertainment, Inc., Class A * | | |
60
Schwab Equity Index Funds | Annual Report
Schwab Small-Cap Index Fund
Portfolio Holdings as of October 31, 2023 (continued)
| | |
Adtalem Global Education, Inc. * | | |
| | |
Biglari Holdings, Inc., Class B * | | |
| | |
| | |
Bluegreen Vacations Holding Corp., Class A | | |
| | |
Brinker International, Inc. * | | |
Carriage Services, Inc., Class A | | |
Carrols Restaurant Group, Inc. * | | |
| | |
| | |
| | |
| | |
| | |
Cracker Barrel Old Country Store, Inc. | | |
Dave & Buster's Entertainment, Inc. * | | |
| | |
| | |
| | |
El Pollo Loco Holdings, Inc. * | | |
European Wax Center, Inc., Class A * | | |
| | |
First Watch Restaurant Group, Inc. * | | |
| | |
Full House Resorts, Inc. * | | |
Global Business Travel Group I *(a) | | |
Golden Entertainment, Inc. | | |
Graham Holdings Co., Class B | | |
Hilton Grand Vacations, Inc. * | | |
Inspired Entertainment, Inc. * | | |
International Game Technology PLC | | |
| | |
| | |
Kura Sushi USA, Inc., Class A * | | |
| | |
Life Time Group Holdings, Inc. * | | |
| | |
Lincoln Educational Services Corp. * | | |
Lindblad Expeditions Holdings, Inc. * | | |
Monarch Casino & Resort, Inc. | | |
Mondee Holdings, Inc., Class A *(a) | | |
| | |
| | |
| | |
ONE Group Hospitality, Inc. * | | |
OneSpaWorld Holdings Ltd. * | | |
Papa John's International, Inc. | | |
| | |
| | |
Portillo's, Inc., Class A * | | |
| | |
RCI Hospitality Holdings, Inc. | | |
Red Robin Gourmet Burgers, Inc. * | | |
Red Rock Resorts, Inc., Class A | | |
Rover Group, Inc., Class A * | | |
Rush Street Interactive, Inc. * | | |
| | |
SeaWorld Entertainment, Inc. * | | |
Shake Shack, Inc., Class A * | | |
Six Flags Entertainment Corp. * | | |
Strategic Education, Inc. | | |
| | |
| | |
Sweetgreen, Inc., Class A * | | |
Target Hospitality Corp. * | | |
| | |
| | |
Universal Technical Institute, Inc. * | | |
| | |
Xponential Fitness, Inc., Class A * | | |
| | |
|
Consumer Staples Distribution & Retail 0.6% |
| | |
| | |
| | |
Ingles Markets, Inc., Class A | | |
Natural Grocers by Vitamin Cottage, Inc. | | |
| | |
| | |
Sprouts Farmers Market, Inc. * | | |
United Natural Foods, Inc. * | | |
Village Super Market, Inc., Class A | | |
| | |
| | |
|
|
| | |
| | |
| | |
Atlas Energy Solutions, Inc., Class A | | |
| | |
| | |
| | |
| | |
California Resources Corp. | | |
| | |
Centrus Energy Corp., Class A * | | |
| | |
| | |
| | |
Clean Energy Fuels Corp. * | | |
| | |
| | |
| | |
| | |
Crescent Energy Co., Class A | | |
| | |
Delek U.S. Holdings, Inc. | | |
| | |
| | |
Diamond Offshore Drilling, Inc. * | | |
| | |
| | |
| | |
Earthstone Energy, Inc., Class A * | | |
| | |
| | |
| | |
| | |
Equitrans Midstream Corp. | | |
Evolution Petroleum Corp. | | |
Excelerate Energy, Inc., Class A | | |
Expro Group Holdings NV * | | |
| | |
Forum Energy Technologies, Inc. * | | |
| | |
| | |
Granite Ridge Resources, Inc. | | |
| | |
| | |
| | |
Helix Energy Solutions Group, Inc. * | | |
Schwab Equity Index Funds | Annual Report61
Schwab Small-Cap Index Fund
Portfolio Holdings as of October 31, 2023 (continued)
| | |
| | |
| | |
International Seaways, Inc. | | |
Kinetik Holdings, Inc., Class A | | |
KLX Energy Services Holdings, Inc. *(a) | | |
Kodiak Gas Services, Inc. * | | |
| | |
Liberty Energy, Inc., Class A | | |
Magnolia Oil & Gas Corp., Class A | | |
Mammoth Energy Services, Inc. * | | |
| | |
| | |
| | |
NACCO Industries, Inc., Class A | | |
Newpark Resources, Inc. * | | |
| | |
| | |
Nordic American Tankers Ltd. | | |
| | |
Oceaneering International, Inc. * | | |
Oil States International, Inc. * | | |
Overseas Shipholding Group, Inc., Class A * | | |
Par Pacific Holdings, Inc. * | | |
Patterson-UTI Energy, Inc. | | |
PBF Energy, Inc., Class A | | |
| | |
Permian Resources Corp., Class A | | |
PrimeEnergy Resources Corp. * | | |
ProFrac Holding Corp., Class A * | | |
| | |
Ranger Energy Services, Inc. | | |
REX American Resources Corp. * | | |
Riley Exploration Permian, Inc. | | |
| | |
| | |
| | |
| | |
SEACOR Marine Holdings, Inc. * | | |
| | |
Select Water Solutions, Inc. | | |
| | |
SilverBow Resources, Inc. * | | |
Sitio Royalties Corp., Class A | | |
| | |
Solaris Oilfield Infrastructure, Inc., Class A | | |
| | |
| | |
Teekay Tankers Ltd., Class A | | |
| | |
TETRA Technologies, Inc. * | | |
| | |
U.S. Silica Holdings, Inc. * | | |
| | |
| | |
| | |
Verde Clean Fuels, Inc. *(a) | | |
| | |
| | |
| | |
| | |
Weatherford International PLC * | | |
| | |
| | |
|
| | |
Equity Real Estate Investment Trusts (REITs) 5.4% |
| | |
Alexander & Baldwin, Inc. | | |
| | |
Alpine Income Property Trust, Inc. | | |
American Assets Trust, Inc. | | |
Apartment Investment & Management Co., Class A * | | |
Apple Hospitality REIT, Inc. | | |
Armada Hoffler Properties, Inc. | | |
Braemar Hotels & Resorts, Inc. | | |
| | |
Broadstone Net Lease, Inc. | | |
| | |
| | |
CBL & Associates Properties, Inc. | | |
| | |
| | |
| | |
| | |
Community Healthcare Trust, Inc. | | |
| | |
| | |
DiamondRock Hospitality Co. | | |
Diversified Healthcare Trust | | |
| | |
Easterly Government Properties, Inc., Class A | | |
| | |
Empire State Realty Trust, Inc., Class A | | |
| | |
Essential Properties Realty Trust, Inc. | | |
| | |
Four Corners Property Trust, Inc. | | |
| | |
Gladstone Commercial Corp. | | |
| | |
Global Medical REIT, Inc. | | |
| | |
Hersha Hospitality Trust, Class A | | |
Hudson Pacific Properties, Inc. | | |
Independence Realty Trust, Inc. | | |
Innovative Industrial Properties, Inc. | | |
InvenTrust Properties Corp. | | |
| | |
| | |
| | |
| | |
| | |
National Health Investors, Inc. | | |
| | |
NexPoint Diversified Real Estate Trust | | |
NexPoint Residential Trust, Inc. | | |
Office Properties Income Trust | | |
One Liberty Properties, Inc. | | |
| | |
| | |
| | |
| | |
| | |
Phillips Edison & Co., Inc. | | |
| | |
Piedmont Office Realty Trust, Inc., Class A | | |
Plymouth Industrial REIT, Inc. | | |
Postal Realty Trust, Inc., Class A | | |
| | |
62
Schwab Equity Index Funds | Annual Report
Schwab Small-Cap Index Fund
Portfolio Holdings as of October 31, 2023 (continued)
| | |
Retail Opportunity Investments Corp. | | |
| | |
| | |
Ryman Hospitality Properties, Inc. | | |
Sabra Health Care REIT, Inc. | | |
| | |
| | |
| | |
| | |
| | |
| | |
Summit Hotel Properties, Inc. | | |
Sunstone Hotel Investors, Inc. | | |
Tanger Factory Outlet Centers, Inc. | | |
| | |
| | |
| | |
Universal Health Realty Income Trust | | |
| | |
| | |
| | |
Xenia Hotels & Resorts, Inc. | | |
| | |
|
|
| | |
| | |
| | |
| | |
A-Mark Precious Metals, Inc. | | |
Angel Oak Mortgage REIT, Inc. (a) | | |
Apollo Commercial Real Estate Finance, Inc. | | |
Arbor Realty Trust, Inc. (a) | | |
Ares Commercial Real Estate Corp. | | |
ARMOUR Residential REIT, Inc. | | |
Artisan Partners Asset Management, Inc., Class A | | |
AssetMark Financial Holdings, Inc. * | | |
Atlanticus Holdings Corp. * | | |
| | |
AvidXchange Holdings, Inc. * | | |
B Riley Financial, Inc. (a) | | |
Bakkt Holdings, Inc. *(a) | | |
Banco Latinoamericano de Comercio Exterior SA, Class E | | |
| | |
Blackstone Mortgage Trust, Inc., Class A (a) | | |
Bread Financial Holdings, Inc. | | |
Brightsphere Investment Group, Inc. | | |
BrightSpire Capital, Inc., Class A | | |
| | |
| | |
Cass Information Systems, Inc. | | |
Chicago Atlantic Real Estate Finance, Inc. | | |
| | |
Claros Mortgage Trust, Inc. | | |
| | |
Compass Diversified Holdings | | |
Consumer Portfolio Services, Inc. * | | |
Diamond Hill Investment Group, Inc. | | |
Donnelley Financial Solutions, Inc. * | | |
| | |
Ellington Financial, Inc. | | |
| | |
| | |
Encore Capital Group, Inc. * | | |
Enova International, Inc. * | | |
| | |
| | |
Federal Agricultural Mortgage Corp., Class C | | |
Finance of America Cos., Inc., Class A * | | |
| | |
| | |
Forge Global Holdings, Inc. * | | |
Franklin BSP Realty Trust, Inc. | | |
GCM Grosvenor, Inc., Class A | | |
Granite Point Mortgage Trust, Inc. | | |
Green Dot Corp., Class A * | | |
Hamilton Lane, Inc., Class A | | |
Hannon Armstrong Sustainable Infrastructure Capital, Inc. | | |
I3 Verticals, Inc., Class A * | | |
International Money Express, Inc. * | | |
Invesco Mortgage Capital, Inc. | | |
Jackson Financial, Inc., Class A | | |
KKR Real Estate Finance Trust, Inc. | | |
Ladder Capital Corp. REIT, Class A | | |
| | |
| | |
| | |
| | |
| | |
| | |
| | |
| | |
| | |
| | |
NerdWallet, Inc., Class A * | | |
New York Mortgage Trust, Inc. | | |
| | |
Nexpoint Real Estate Finance, Inc. | | |
NMI Holdings, Inc., Class A * | | |
| | |
Open Lending Corp., Class A * | | |
| | |
Orchid Island Capital, Inc. | | |
| | |
Pagseguro Digital Ltd., Class A * | | |
Patria Investments Ltd., Class A | | |
| | |
| | |
| | |
PennyMac Financial Services, Inc. | | |
PennyMac Mortgage Investment Trust | | |
Perella Weinberg Partners, Class A | | |
| | |
PJT Partners, Inc., Class A | | |
| | |
Priority Technology Holdings, Inc. * | | |
| | |
| | |
| | |
| | |
Regional Management Corp. | | |
| | |
Repay Holdings Corp., Class A * | | |
Sculptor Capital Management, Inc., Class A | | |
Security National Financial Corp., Class A * | | |
Schwab Equity Index Funds | Annual Report63
Schwab Small-Cap Index Fund
Portfolio Holdings as of October 31, 2023 (continued)
| | |
Silvercrest Asset Management Group, Inc., Class A | | |
StepStone Group, Inc., Class A | | |
| | |
| | |
| | |
TPG RE Finance Trust, Inc. | | |
Two Harbors Investment Corp. | | |
Upstart Holdings, Inc. *(a) | | |
| | |
Velocity Financial, Inc. * | | |
Victory Capital Holdings, Inc., Class A | | |
Virtus Investment Partners, Inc. | | |
| | |
Waterstone Financial, Inc. | | |
| | |
| | |
| | |
|
Food, Beverage & Tobacco 1.8% |
| | |
| | |
| | |
| | |
| | |
| | |
| | |
Coca-Cola Consolidated, Inc. | | |
| | |
Duckhorn Portfolio, Inc. * | | |
| | |
Fresh Del Monte Produce, Inc. | | |
Hain Celestial Group, Inc. * | | |
Hostess Brands, Inc., Class A * | | |
Ispire Technology, Inc. *(a) | | |
| | |
John B Sanfilippo & Son, Inc. | | |
| | |
| | |
| | |
| | |
National Beverage Corp. * | | |
| | |
Seneca Foods Corp., Class A * | | |
| | |
| | |
| | |
| | |
Turning Point Brands, Inc. | | |
| | |
| | |
| | |
| | |
| | |
| | |
| | |
| | |
|
Health Care Equipment & Services 6.0% |
23andMe Holding Co., Class A * | | |
| | |
| | |
AdaptHealth Corp., Class A * | | |
| | |
| | |
AirSculpt Technologies, Inc. *(a) | | |
| | |
Alignment Healthcare, Inc. * | | |
Alphatec Holdings, Inc. * | | |
American Well Corp., Class A * | | |
AMN Healthcare Services, Inc. * | | |
| | |
Apollo Medical Holdings, Inc. * | | |
| | |
| | |
| | |
| | |
Aveanna Healthcare Holdings, Inc. * | | |
| | |
| | |
| | |
Brookdale Senior Living, Inc. * | | |
Butterfly Network, Inc. *(a) | | |
| | |
| | |
Castle Biosciences, Inc. * | | |
| | |
| | |
Community Health Systems, Inc. * | | |
Computer Programs & Systems, Inc. * | | |
| | |
| | |
Cross Country Healthcare, Inc. * | | |
| | |
| | |
Definitive Healthcare Corp., Class A * | | |
| | |
| | |
| | |
| | |
Evolent Health, Inc., Class A * | | |
| | |
| | |
| | |
| | |
| | |
| | |
| | |
Hims & Hers Health, Inc. * | | |
| | |
InfuSystem Holdings, Inc. * | | |
| | |
Innovage Holding Corp. *(a) | | |
| | |
| | |
| | |
| | |
iRhythm Technologies, Inc. * | | |
| | |
KORU Medical Systems, Inc. * | | |
Lantheus Holdings, Inc. * | | |
| | |
LifeStance Health Group, Inc. * | | |
| | |
Merit Medical Systems, Inc. * | | |
| | |
| | |
| | |
National HealthCare Corp. | | |
| | |
| | |
| | |
| | |
NextGen Healthcare, Inc. * | | |
OmniAb, Inc., Class A *(b) | | |
64
Schwab Equity Index Funds | Annual Report
Schwab Small-Cap Index Fund
Portfolio Holdings as of October 31, 2023 (continued)
| | |
OmniAb, Inc., Class B *(b) | | |
| | |
| | |
| | |
Option Care Health, Inc. * | | |
OraSure Technologies, Inc. * | | |
Orchestra BioMed Holdings, Inc. *(a) | | |
| | |
| | |
| | |
| | |
P3 Health Partners, Inc. * | | |
| | |
| | |
Pediatrix Medical Group, Inc. * | | |
| | |
| | |
| | |
Privia Health Group, Inc. * | | |
PROCEPT BioRobotics Corp. * | | |
| | |
| | |
Pulse Biosciences, Inc. * | | |
Quipt Home Medical Corp. * | | |
| | |
| | |
| | |
| | |
Select Medical Holdings Corp. | | |
Semler Scientific, Inc. * | | |
| | |
| | |
| | |
Silk Road Medical, Inc. * | | |
| | |
| | |
| | |
| | |
Tactile Systems Technology, Inc. * | | |
| | |
TransMedics Group, Inc. * | | |
Treace Medical Concepts, Inc. * | | |
U.S. Physical Therapy, Inc. | | |
| | |
Utah Medical Products, Inc. | | |
| | |
| | |
Vicarious Surgical, Inc. * | | |
Viemed Healthcare, Inc. * | | |
| | |
| | |
| | |
|
Household & Personal Products 1.3% |
| | |
| | |
Central Garden & Pet Co. * | | |
Central Garden & Pet Co., Class A * | | |
Edgewell Personal Care Co. | | |
| | |
| | |
| | |
| | |
| | |
Nature's Sunshine Products, Inc. * | | |
Nu Skin Enterprises, Inc., Class A | | |
| | |
| | |
USANA Health Sciences, Inc. * | | |
Waldencast PLC, Class A *(a) | | |
| | |
| | |
|
|
Ambac Financial Group, Inc. * | | |
American Coastal Insurance Corp., Class C *(a) | | |
American Equity Investment Life Holding Co. | | |
| | |
Argo Group International Holdings Ltd. | | |
BRP Group, Inc., Class A * | | |
CNO Financial Group, Inc. | | |
| | |
Donegal Group, Inc., Class A | | |
| | |
| | |
| | |
F&G Annuities & Life, Inc. | | |
Fidelis Insurance Holdings Ltd. * | | |
Genworth Financial, Inc., Class A * | | |
GoHealth, Inc., Class A * | | |
Goosehead Insurance, Inc., Class A * | | |
Greenlight Capital Re Ltd., Class A * | | |
| | |
| | |
Horace Mann Educators Corp. | | |
| | |
James River Group Holdings Ltd. | | |
Kingsway Financial Services, Inc. * | | |
| | |
| | |
| | |
| | |
National Western Life Group, Inc., Class A | | |
| | |
Oscar Health, Inc., Class A * | | |
| | |
| | |
Safety Insurance Group, Inc. | | |
Selective Insurance Group, Inc. | | |
| | |
| | |
Skyward Specialty Insurance Group, Inc. * | | |
Stewart Information Services Corp. | | |
| | |
| | |
| | |
Universal Insurance Holdings, Inc. | | |
| | |
|
|
5E Advanced Materials, Inc. * | | |
| | |
Alpha Metallurgical Resources, Inc. | | |
| | |
| | |
| | |
| | |
| | |
| | |
| | |
Schwab Equity Index Funds | Annual Report65
Schwab Small-Cap Index Fund
Portfolio Holdings as of October 31, 2023 (continued)
| | |
Caledonia Mining Corp. PLC | | |
Carpenter Technology Corp. | | |
| | |
| | |
| | |
| | |
| | |
Compass Minerals International, Inc. | | |
Constellium SE, Class A * | | |
| | |
Core Molding Technologies, Inc. * | | |
| | |
Danimer Scientific, Inc. *(a) | | |
| | |
| | |
| | |
| | |
| | |
Haynes International, Inc. | | |
| | |
| | |
| | |
| | |
| | |
| | |
| | |
| | |
| | |
| | |
| | |
| | |
| | |
| | |
| | |
Minerals Technologies, Inc. | | |
| | |
NioCorp Developments Ltd. * | | |
Novagold Resources, Inc. * | | |
| | |
| | |
| | |
| | |
| | |
| | |
Perpetua Resources Corp. * | | |
| | |
| | |
PureCycle Technologies, Inc. *(a) | | |
| | |
Ramaco Resources, Inc., Class A | | |
Ramaco Resources, Inc., Class B | | |
Ranpak Holdings Corp., Class A * | | |
Rayonier Advanced Materials, Inc. * | | |
| | |
Schnitzer Steel Industries, Inc., Class A | | |
Sensient Technologies Corp. | | |
| | |
Summit Materials, Inc., Class A * | | |
| | |
| | |
| | |
| | |
| | |
| | |
| | |
U.S. Lime & Minerals, Inc. | | |
| | |
| | |
| | |
Worthington Industries, Inc. | | |
| | |
|
Media & Entertainment 1.8% |
Advantage Solutions, Inc. * | | |
AMC Networks, Inc., Class A * | | |
Atlanta Braves Holdings, Inc., Class C * | | |
Boston Omaha Corp., Class A * | | |
| | |
| | |
| | |
| | |
Cinemark Holdings, Inc. * | | |
Clear Channel Outdoor Holdings, Inc. * | | |
| | |
| | |
| | |
Entravision Communications Corp., Class A | | |
Eventbrite, Inc., Class A * | | |
EverQuote, Inc., Class A * | | |
EW Scripps Co., Class A * | | |
| | |
Gambling.com Group Ltd. * | | |
| | |
| | |
| | |
iHeartMedia, Inc., Class A * | | |
| | |
Integral Ad Science Holding Corp. * | | |
John Wiley & Sons, Inc., Class A | | |
Lions Gate Entertainment Corp., Class A * | | |
| | |
Madison Square Garden Entertainment Corp., Class A * | | |
| | |
| | |
MediaAlpha, Inc., Class A * | | |
Nextdoor Holdings, Inc. * | | |
| | |
| | |
PubMatic, Inc., Class A * | | |
| | |
| | |
| | |
| | |
| | |
Sphere Entertainment Co. * | | |
Stagwell, Inc., Class A * | | |
| | |
| | |
| | |
| | |
Townsquare Media, Inc., Class A | | |
| | |
| | |
Urban One, Inc., Class A * | | |
| | |
Vivid Seats, Inc., Class A * | | |
| | |
| | |
| | |
ZipRecruiter, Inc., Class A * | | |
| | |
|
66
Schwab Equity Index Funds | Annual Report
Schwab Small-Cap Index Fund
Portfolio Holdings as of October 31, 2023 (continued)
| | |
Pharmaceuticals, Biotechnology & Life Sciences 8.3% |
| | |
4D Molecular Therapeutics, Inc. * | | |
| | |
| | |
ACADIA Pharmaceuticals, Inc. * | | |
| | |
Aclaris Therapeutics, Inc. * | | |
Acrivon Therapeutics, Inc. * | | |
Actinium Pharmaceuticals, Inc. *(a) | | |
Adaptive Biotechnologies Corp. * | | |
| | |
| | |
Aerovate Therapeutics, Inc. * | | |
| | |
Agios Pharmaceuticals, Inc. * | | |
Akero Therapeutics, Inc. * | | |
Akoya Biosciences, Inc. * | | |
Aldeyra Therapeutics, Inc. * | | |
| | |
| | |
| | |
Allogene Therapeutics, Inc. * | | |
| | |
Alpine Immune Sciences, Inc. * | | |
| | |
ALX Oncology Holdings, Inc. *(a) | | |
Amicus Therapeutics, Inc. * | | |
Amneal Pharmaceuticals, Inc. * | | |
Amphastar Pharmaceuticals, Inc. * | | |
Amylyx Pharmaceuticals, Inc. * | | |
| | |
Anavex Life Sciences Corp. * | | |
ANI Pharmaceuticals, Inc. * | | |
Anika Therapeutics, Inc. * | | |
| | |
Apogee Therapeutics, Inc. * | | |
Arbutus Biopharma Corp. * | | |
| | |
Arcturus Therapeutics Holdings, Inc. * | | |
Arcus Biosciences, Inc. * | | |
Arcutis Biotherapeutics, Inc. * | | |
| | |
Arrowhead Pharmaceuticals, Inc. * | | |
ARS Pharmaceuticals, Inc. *(a) | | |
| | |
Assertio Holdings, Inc. * | | |
Astria Therapeutics, Inc. * | | |
Atara Biotherapeutics, Inc. * | | |
Atea Pharmaceuticals, Inc. * | | |
| | |
Aurinia Pharmaceuticals, Inc. * | | |
| | |
Avidity Biosciences, Inc. * | | |
| | |
Axsome Therapeutics, Inc. * | | |
Beam Therapeutics, Inc. * | | |
| | |
BioCryst Pharmaceuticals, Inc. * | | |
| | |
BioLife Solutions, Inc. * | | |
| | |
| | |
BioVie, Inc., Class A *(a) | | |
Bioxcel Therapeutics, Inc. *(a) | | |
| | |
Blueprint Medicines Corp. * | | |
| | |
| | |
| | |
| | |
Cara Therapeutics, Inc. * | | |
| | |
Caribou Biosciences, Inc. * | | |
Carisma Therapeutics, Inc. (a) | | |
Cassava Sciences, Inc. *(a) | | |
Catalyst Pharmaceuticals, Inc. * | | |
| | |
Celldex Therapeutics, Inc. * | | |
Century Therapeutics, Inc. * | | |
Cerevel Therapeutics Holdings, Inc. * | | |
Citius Pharmaceuticals, Inc. * | | |
| | |
Cogent Biosciences, Inc. * | | |
Coherus Biosciences, Inc. * | | |
Collegium Pharmaceutical, Inc. * | | |
Compass Therapeutics, Inc. * | | |
Corcept Therapeutics, Inc. * | | |
| | |
Crinetics Pharmaceuticals, Inc. * | | |
| | |
| | |
Cullinan Oncology, Inc. * | | |
Cymabay Therapeutics, Inc. * | | |
Cytek Biosciences, Inc. * | | |
| | |
Day One Biopharmaceuticals, Inc. * | | |
Deciphera Pharmaceuticals, Inc. * | | |
Denali Therapeutics, Inc. * | | |
Design Therapeutics, Inc. * | | |
| | |
Dynavax Technologies Corp. * | | |
Dyne Therapeutics, Inc. * | | |
Eagle Pharmaceuticals, Inc. * | | |
Edgewise Therapeutics, Inc. * | | |
| | |
Emergent BioSolutions, Inc. * | | |
Enanta Pharmaceuticals, Inc. * | | |
Enliven Therapeutics, Inc. *(a) | | |
Entrada Therapeutics, Inc. * | | |
| | |
| | |
| | |
| | |
EyePoint Pharmaceuticals, Inc. * | | |
Fate Therapeutics, Inc. * | | |
Fennec Pharmaceuticals, Inc. *(a) | | |
| | |
Foghorn Therapeutics, Inc. * | | |
| | |
| | |
| | |
| | |
| | |
Halozyme Therapeutics, Inc. * | | |
Harmony Biosciences Holdings, Inc. * | | |
| | |
Harvard Bioscience, Inc. * | | |
Heron Therapeutics, Inc. * | | |
| | |
| | |
| | |
Ideaya Biosciences, Inc. * | | |
| | |
| | |
Immuneering Corp., Class A *(a) | | |
Schwab Equity Index Funds | Annual Report67
Schwab Small-Cap Index Fund
Portfolio Holdings as of October 31, 2023 (continued)
| | |
| | |
| | |
| | |
| | |
| | |
| | |
| | |
Intellia Therapeutics, Inc. * | | |
Intercept Pharmaceuticals, Inc. * | | |
Intra-Cellular Therapies, Inc. * | | |
Iovance Biotherapeutics, Inc. * | | |
Ironwood Pharmaceuticals, Inc., Class A * | | |
iTeos Therapeutics, Inc. * | | |
Janux Therapeutics, Inc. * | | |
KalVista Pharmaceuticals, Inc. * | | |
Karyopharm Therapeutics, Inc. * | | |
Keros Therapeutics, Inc. * | | |
Kezar Life Sciences, Inc. * | | |
Kiniksa Pharmaceuticals Ltd., Class A * | | |
| | |
| | |
| | |
Kymera Therapeutics, Inc. * | | |
Larimar Therapeutics, Inc. * | | |
Lexicon Pharmaceuticals, Inc. * | | |
Ligand Pharmaceuticals, Inc. * | | |
Lineage Cell Therapeutics, Inc. * | | |
| | |
Longboard Pharmaceuticals, Inc. * | | |
Lyell Immunopharma, Inc. * | | |
| | |
Madrigal Pharmaceuticals, Inc. * | | |
| | |
Marinus Pharmaceuticals, Inc. * | | |
| | |
| | |
Merrimack Pharmaceuticals, Inc. * | | |
Mersana Therapeutics, Inc. * | | |
| | |
| | |
Mineralys Therapeutics, Inc. * | | |
Mirum Pharmaceuticals, Inc. * | | |
Monte Rosa Therapeutics, Inc. *(a) | | |
| | |
| | |
NanoString Technologies, Inc. *(a) | | |
Nautilus Biotechnology, Inc. * | | |
NGM Biopharmaceuticals, Inc. * | | |
| | |
| | |
Nurix Therapeutics, Inc. * | | |
Nuvalent, Inc., Class A * | | |
| | |
Nuvectis Pharma, Inc. *(a) | | |
Ocean Biomedical, Inc. *(a) | | |
Ocular Therapeutix, Inc. * | | |
Olema Pharmaceuticals, Inc. * | | |
Omega Therapeutics, Inc. *(a) | | |
| | |
| | |
| | |
Organogenesis Holdings, Inc., Class A * | | |
ORIC Pharmaceuticals, Inc. * | | |
Outlook Therapeutics, Inc. * | | |
Ovid therapeutics, Inc. * | | |
Pacific Biosciences of California, Inc. * | | |
Pacira BioSciences, Inc. * | | |
| | |
PDS Biotechnology Corp. *(a) | | |
| | |
Phathom Pharmaceuticals, Inc. * | | |
Phibro Animal Health Corp., Class A | | |
Pliant Therapeutics, Inc. * | | |
PMV Pharmaceuticals, Inc. * | | |
Point Biopharma Global, Inc. * | | |
Poseida Therapeutics, Inc., Class A * | | |
| | |
Prelude Therapeutics, Inc. * | | |
Prestige Consumer Healthcare, Inc. * | | |
Prime Medicine, Inc. *(a) | | |
| | |
Protagonist Therapeutics, Inc. * | | |
Protalix BioTherapeutics, Inc. *(a) | | |
| | |
| | |
| | |
| | |
| | |
| | |
RAPT Therapeutics, Inc. * | | |
Recursion Pharmaceuticals, Inc., Class A * | | |
| | |
Relay Therapeutics, Inc. * | | |
Reneo Pharmaceuticals, Inc. * | | |
| | |
Revance Therapeutics, Inc. * | | |
REVOLUTION Medicines, Inc. * | | |
Rhythm Pharmaceuticals, Inc. * | | |
Rigel Pharmaceuticals, Inc. * | | |
Rocket Pharmaceuticals, Inc. * | | |
Sage Therapeutics, Inc. * | | |
Sagimet Biosciences, Inc., Class A * | | |
Sana Biotechnology, Inc. * | | |
Sangamo Therapeutics, Inc. * | | |
| | |
Scholar Rock Holding Corp. * | | |
| | |
scPharmaceuticals, Inc. *(a) | | |
| | |
Selecta Biosciences, Inc. * | | |
Seres Therapeutics, Inc. * | | |
| | |
| | |
SpringWorks Therapeutics, Inc. * | | |
Stoke Therapeutics, Inc. * | | |
Summit Therapeutics, Inc. *(a) | | |
Supernus Pharmaceuticals, Inc. * | | |
| | |
Syndax Pharmaceuticals, Inc. * | | |
Tango Therapeutics, Inc. * | | |
Taro Pharmaceutical Industries Ltd. * | | |
Tarsus Pharmaceuticals, Inc. * | | |
Tenaya Therapeutics, Inc. * | | |
Terns Pharmaceuticals, Inc. * | | |
| | |
Theravance Biopharma, Inc. * | | |
Theseus Pharmaceuticals, Inc. *(a) | | |
Third Harmonic Bio, Inc. * | | |
Travere Therapeutics, Inc. * | | |
Trevi Therapeutics, Inc. * | | |
Turnstone Biologics Corp. * | | |
| | |
Tyra Biosciences, Inc. *(a) | | |
| | |
Vanda Pharmaceuticals, Inc. * | | |
68
Schwab Equity Index Funds | Annual Report
Schwab Small-Cap Index Fund
Portfolio Holdings as of October 31, 2023 (continued)
| | |
| | |
Vaxxinity, Inc., Class A * | | |
Ventyx Biosciences, Inc. * | | |
Vera Therapeutics, Inc., Class A * | | |
| | |
| | |
Verrica Pharmaceuticals, Inc. *(a) | | |
Verve Therapeutics, Inc. * | | |
Vigil Neuroscience, Inc. * | | |
Viking Therapeutics, Inc. * | | |
Vir Biotechnology, Inc. * | | |
Viridian Therapeutics, Inc. * | | |
| | |
Voyager Therapeutics, Inc. * | | |
WaVe Life Sciences Ltd. * | | |
X4 Pharmaceuticals, Inc. * | | |
| | |
Xeris Biopharma Holdings, Inc. * | | |
| | |
Y-mAbs Therapeutics, Inc. * | | |
Zentalis Pharmaceuticals, Inc. * | | |
Zevra Therapeutics, Inc. *(a) | | |
Zura Bio Ltd., Class A *(a) | | |
| | |
| | |
|
Real Estate Management & Development 0.7% |
American Realty Investors, Inc. * | | |
Anywhere Real Estate, Inc. * | | |
| | |
Cushman & Wakefield PLC * | | |
DigitalBridge Group, Inc. | | |
| | |
| | |
| | |
| | |
Kennedy-Wilson Holdings, Inc. | | |
| | |
Maui Land & Pineapple Co., Inc. * | | |
Newmark Group, Inc., Class A | | |
Opendoor Technologies, Inc. * | | |
RE/MAX Holdings, Inc., Class A | | |
| | |
| | |
| | |
Stratus Properties, Inc. * | | |
| | |
Transcontinental Realty Investors, Inc. * | | |
| | |
|
Semiconductors & Semiconductor Equipment 2.8% |
ACM Research, Inc., Class A * | | |
| | |
Alpha & Omega Semiconductor Ltd. * | | |
| | |
| | |
| | |
Axcelis Technologies, Inc. * | | |
| | |
| | |
Credo Technology Group Holding Ltd. * | | |
| | |
| | |
| | |
| | |
indie Semiconductor, Inc., Class A * | | |
| | |
| | |
Kulicke & Soffa Industries, Inc. | | |
MACOM Technology Solutions Holdings, Inc. * | | |
Maxeon Solar Technologies Ltd. * | | |
| | |
Navitas Semiconductor Corp., Class A * | | |
| | |
| | |
| | |
| | |
| | |
| | |
| | |
Silicon Laboratories, Inc. * | | |
| | |
SkyWater Technology, Inc. * | | |
SMART Global Holdings, Inc. * | | |
| | |
| | |
Ultra Clean Holdings, Inc. * | | |
Veeco Instruments, Inc. * | | |
| | |
|
|
| | |
| | |
| | |
| | |
| | |
Alarm.com Holdings, Inc. * | | |
Alkami Technology, Inc. * | | |
Altair Engineering, Inc., Class A * | | |
American Software, Inc., Class A | | |
Amplitude, Inc., Class A * | | |
Appfolio, Inc., Class A * | | |
| | |
Applied Digital Corp. *(a) | | |
| | |
Aurora Innovation, Inc. * | | |
| | |
BigBear.ai Holdings, Inc. *(a) | | |
BigCommerce Holdings, Inc. * | | |
| | |
| | |
| | |
| | |
| | |
| | |
C3.ai, Inc., Class A *(a) | | |
| | |
| | |
| | |
Clear Secure, Inc., Class A | | |
CommVault Systems, Inc. * | | |
Consensus Cloud Solutions, Inc. * | | |
| | |
| | |
| | |
| | |
| | |
| | |
DigitalOcean Holdings, Inc. * | | |
| | |
E2open Parent Holdings, Inc. * | | |
| | |
| | |
Schwab Equity Index Funds | Annual Report69
Schwab Small-Cap Index Fund
Portfolio Holdings as of October 31, 2023 (continued)
| | |
Enfusion, Inc., Class A * | | |
| | |
| | |
| | |
| | |
Expensify, Inc., Class A * | | |
| | |
Freshworks, Inc., Class A * | | |
Grid Dynamics Holdings, Inc. * | | |
| | |
Information Services Group, Inc. | | |
Instructure Holdings, Inc. * | | |
| | |
| | |
| | |
| | |
| | |
LiveRamp Holdings, Inc. * | | |
| | |
Marathon Digital Holdings, Inc. *(a) | | |
| | |
| | |
MicroStrategy, Inc., Class A *(a) | | |
| | |
| | |
| | |
| | |
| | |
| | |
| | |
| | |
| | |
PowerSchool Holdings, Inc., Class A * | | |
| | |
| | |
| | |
| | |
Rackspace Technology, Inc. * | | |
| | |
| | |
| | |
| | |
Sapiens International Corp. NV | | |
SEMrush Holdings, Inc., Class A * | | |
| | |
SoundHound AI, Inc., Class A *(a) | | |
| | |
Sprinklr, Inc., Class A * | | |
Sprout Social, Inc., Class A * | | |
| | |
Squarespace, Inc., Class A * | | |
| | |
| | |
Thoughtworks Holding, Inc. * | | |
| | |
| | |
Varonis Systems, Inc., Class B * | | |
| | |
| | |
Viant Technology, Inc., Class A * | | |
Weave Communications, Inc. * | | |
| | |
| | |
| | |
Zeta Global Holdings Corp., Class A * | | |
| | |
| | |
|
| | |
Technology Hardware & Equipment 4.1% |
| | |
| | |
Advanced Energy Industries, Inc. | | |
Aeva Technologies, Inc. * | | |
Akoustis Technologies, Inc. * | | |
Arlo Technologies, Inc. * | | |
| | |
| | |
| | |
| | |
| | |
Benchmark Electronics, Inc. | | |
| | |
| | |
| | |
Climb Global Solutions, Inc. | | |
CommScope Holding Co., Inc. * | | |
| | |
Comtech Telecommunications Corp. | | |
| | |
| | |
| | |
| | |
Digi International, Inc. * | | |
| | |
| | |
| | |
Evolv Technologies Holdings, Inc. * | | |
| | |
| | |
FARO Technologies, Inc. * | | |
| | |
| | |
| | |
Insight Enterprises, Inc. * | | |
| | |
| | |
| | |
| | |
Kimball Electronics, Inc. * | | |
| | |
| | |
Lightwave Logic, Inc. *(a) | | |
| | |
Methode Electronics, Inc. | | |
| | |
Mirion Technologies, Inc., Class A * | | |
Napco Security Technologies, Inc. | | |
| | |
| | |
| | |
| | |
| | |
| | |
| | |
| | |
Presto Automation, Inc. * | | |
Ribbon Communications, Inc. * | | |
Richardson Electronics Ltd. | | |
| | |
| | |
| | |
| | |
Super Micro Computer, Inc. * | | |
| | |
| | |
70
Schwab Equity Index Funds | Annual Report
Schwab Small-Cap Index Fund
Portfolio Holdings as of October 31, 2023 (continued)
| | |
| | |
Vishay Intertechnology, Inc. | | |
Vishay Precision Group, Inc. * | | |
| | |
| | |
| | |
|
Telecommunication Services 0.6% |
| | |
AST SpaceMobile, Inc., Class A *(a) | | |
| | |
Bandwidth, Inc., Class A * | | |
Charge Enterprises, Inc. * | | |
Cogent Communications Holdings, Inc. | | |
Consolidated Communications Holdings, Inc. * | | |
EchoStar Corp., Class A * | | |
| | |
| | |
| | |
Liberty Latin America Ltd., Class C * | | |
Lumen Technologies, Inc. * | | |
| | |
Shenandoah Telecommunications Co. | | |
| | |
Telephone & Data Systems, Inc. | | |
| | |
| | |
|
|
Air Transport Services Group, Inc. * | | |
| | |
| | |
Blade Air Mobility, Inc. * | | |
| | |
Covenant Logistics Group, Inc., Class A | | |
| | |
Eagle Bulk Shipping, Inc. (a) | | |
| | |
Frontier Group Holdings, Inc. * | | |
FTAI Infrastructure, Inc. | | |
Genco Shipping & Trading Ltd. | | |
| | |
Hawaiian Holdings, Inc. * | | |
| | |
| | |
Hub Group, Inc., Class A * | | |
| | |
| | |
| | |
| | |
PAM Transportation Services, Inc. * | | |
Pangaea Logistics Solutions Ltd. | | |
Radiant Logistics, Inc. * | | |
| | |
| | |
| | |
| | |
Sun Country Airlines Holdings, Inc. * | | |
TuSimple Holdings, Inc., Class A * | | |
Universal Logistics Holdings, Inc. | | |
| | |
| | |
|
| | |
|
| | |
Altus Power, Inc., Class A * | | |
American States Water Co. | | |
Artesian Resources Corp., Class A | | |
| | |
| | |
Brookfield Infrastructure Corp., Class A | | |
| | |
California Water Service Group | | |
Chesapeake Utilities Corp. | | |
Consolidated Water Co. Ltd. | | |
Genie Energy Ltd., Class B | | |
Global Water Resources, Inc. | | |
| | |
| | |
Montauk Renewables, Inc. * | | |
New Jersey Resources Corp. | | |
Northwest Natural Holding Co. | | |
Northwestern Energy Group, Inc. | | |
| | |
| | |
| | |
| | |
Portland General Electric Co. | | |
| | |
| | |
| | |
Southwest Gas Holdings, Inc. | | |
| | |
Sunnova Energy International, Inc. *(a) | | |
| | |
| | |
| | |
Total Common Stocks
(Cost $4,356,954,456) | |
|
RIGHTS 0.0% OF NET ASSETS |
|
Consumer Discretionary Distribution & Retail 0.0% |
Lazydays Holdings, Inc. expires 11/14/23 strike USD 6.40 *(a)(b) | | |
|
Pharmaceuticals, Biotechnology & Life Sciences 0.0% |
Aduro Biotech, Inc. CVR *(b) | | |
| | |
Jounce Therapeutics, Inc. CVR *(b) | | |
Tobira Therapeutics, Inc. CVR *(b) | | |
| | |
Total Rights
(Cost $2,055) | |
Schwab Equity Index Funds | Annual Report71
Schwab Small-Cap Index Fund
Portfolio Holdings as of October 31, 2023 (continued)
| | |
SHORT-TERM INVESTMENTS 1.7% OF NET ASSETS |
|
|
State Street Institutional U.S. Government Money Market Fund, Premier Class 5.30% (c)(d) | | |
Total Short-Term Investments
(Cost $82,018,212) | |
Total Investments in Securities
(Cost $4,438,974,723) | |
| | | CURRENT VALUE/
UNREALIZED
DEPRECIATION
($) |
|
| | | |
Russell 2000 Index, e-mini, expires 12/15/23 | | | |
| Non-income producing security. |
| All or a portion of this security is on loan. Securities on loan were valued at $79,372,143. |
| Fair valued using significant unobservable inputs (see financial note 2(a), Securities for which no quoted value is available, for additional information). |
| The rate shown is the annualized 7-day yield. |
| Security purchased with cash collateral received for securities on loan. |
| |
| Real Estate Investment Trust |
| |
The following is a summary of the inputs used to value the fund’s investments as of October 31, 2023 (see financial note 2(a) for additional information):
| QUOTED PRICES IN
ACTIVE MARKETS FOR
IDENTICAL ASSETS
(LEVEL 1) | OTHER SIGNIFICANT
OBSERVABLE INPUTS
(LEVEL 2) | SIGNIFICANT
UNOBSERVABLE INPUTS
(LEVEL 3) | |
| | | | |
| | | | |
Health Care Equipment & Services | | | | |
Pharmaceuticals, Biotechnology & Life Sciences | | | | |
| | | | |
Consumer Discretionary Distribution & Retail | | | | |
Pharmaceuticals, Biotechnology & Life Sciences | | | | |
| | | | |
| | | | |
| | | | |
| | | | |
| Level 3 amount shown includes securities determined to have no value at October 31, 2023. |
| As categorized in the Portfolio Holdings. |
| Futures contracts are reported at cumulative unrealized appreciation or depreciation. |
72
Schwab Equity Index Funds | Annual Report
Schwab Small-Cap Index Fund
Statement of Assets and Liabilities
As of October 31, 2023
|
Investments in securities, at value - unaffiliated (cost $4,438,974,723) including securities on loan of $79,372,143 | | |
| | |
Deposit with broker for futures contracts | | |
| | |
| | |
| | |
Income from securities on loan | | |
Variation margin on future contracts | | |
| | |
|
|
Collateral held for securities on loan | | |
| | |
| | |
| | |
| | |
| | |
| | |
|
|
Capital received from investors | | |
Total distributable earnings | | |
| | |
Schwab Equity Index Funds | Annual Report73
Schwab Small-Cap Index Fund
Statement of Operations
For the period November 1, 2022 through October 31, 2023 |
|
Dividends received from securities - unaffiliated (net of foreign withholding tax of $113,840) | | |
Interest received from securities - unaffiliated | | |
| | |
| | |
|
|
| | |
| | |
| | |
|
REALIZED AND UNREALIZED GAINS (LOSSES) |
Net realized losses on sales of securities - unaffiliated | | |
Net realized gains on sales of in-kind redemptions - unaffiliated | | |
Net realized losses on futures contracts | | |
| | |
Net change in unrealized appreciation (depreciation) on securities - unaffiliated | | |
Net change in unrealized appreciation (depreciation) on futures contracts | | |
Net change in unrealized appreciation (depreciation) | | |
Net realized and unrealized losses | | |
Decrease in net assets resulting from operations | | |
74
Schwab Equity Index Funds | Annual Report
Schwab Small-Cap Index Fund
Statement of Changes in Net Assets
For the current and prior report periods
|
| | |
| | | |
Net realized gains (losses) | | | |
Net change in unrealized appreciation (depreciation) | | | |
Decrease in net assets from operations | | | |
|
DISTRIBUTIONS TO SHAREHOLDERS |
| | | |
TRANSACTIONS IN FUND SHARES |
| | |
| | | | | |
| | | | | |
| | | | | |
| | | | | |
Net transactions in fund shares | | | | | |
|
SHARES OUTSTANDING AND NET ASSETS |
| | |
| | | | | |
| | | | | |
Total increase (decrease) | | | | | |
| | | | | |
Schwab Equity Index Funds | Annual Report75
Schwab Total Stock Market Index Fund
Financial Statements
| | | | | | |
|
Net asset value at beginning of period | | | | | | |
Income (loss) from investment operations: | | | | | | |
Net investment income (loss)1 | | | | | | |
Net realized and unrealized gains (losses) | | | | | | |
Total from investment operations | | | | | | |
| | | | | | |
Distributions from net investment income | | | | | | |
Distributions from net realized gains | | | | | | |
| | | | | | |
Net asset value at end of period | | | | | | |
| | | | | | |
|
Ratios to average net assets: | | | | | | |
| | | | | | |
Net investment income (loss) | | | | | | |
| | | | | | |
Net assets, end of period (x 1,000,000) | | | | | | |
| Calculated based on the average shares outstanding during the period. |
| Ratio includes less than 0.005% of non-routine proxy expenses. |
76
Schwab Equity Index Funds | Annual Report
Schwab Total Stock Market Index Fund
Portfolio Holdings as of October 31, 2023
This section shows all the securities in the fund’s portfolio and their values as of the report date.
The fund files its complete schedule of portfolio holdings with the U.S. Securities and Exchange Commission (SEC) for the first and third quarters of each fiscal year on Form N-PORT Part F. The fund’s Form N-PORT Part F is available on the SEC’s website at www.sec.gov. You can also obtain this information at no cost on the fund’s website at www.schwabassetmanagement.com/schwabfunds_prospectus, by calling 1-866-414-6349, or by sending an email request to orders@mysummaryprospectus.com. The fund also makes available its complete schedule of portfolio holdings 15 to 20 days after the end of the month on the fund’s website.
| | |
COMMON STOCKS 99.5% OF NET ASSETS |
|
Automobiles & Components 1.8% |
| | |
American Axle & Manufacturing Holdings, Inc. * | | |
| | |
Atmus Filtration Technologies, Inc. *(a) | | |
| | |
| | |
| | |
Cooper-Standard Holdings, Inc. * | | |
| | |
| | |
Envirotech Vehicles, Inc. * | | |
Faraday Future Intelligent Electric, Inc. *(a) | | |
| | |
| | |
Fox Factory Holding Corp. * | | |
| | |
| | |
| | |
| | |
Goodyear Tire & Rubber Co. * | | |
| | |
| | |
| | |
| | |
| | |
Luminar Technologies, Inc., Class A *(a) | | |
Mobileye Global, Inc., Class A * | | |
Modine Manufacturing Co. * | | |
Motorcar Parts of America, Inc. * | | |
Mullen Automotive, Inc. * | | |
| | |
| | |
QuantumScape Corp., Class A * | | |
Rivian Automotive, Inc., Class A * | | |
| | |
Standard Motor Products, Inc. | | |
| | |
Strattec Security Corp. * | | |
Superior Industries International, Inc. * | | |
| | |
| | |
| | |
Winnebago Industries, Inc. | | |
| | |
| | |
| | |
| | |
|
| | |
|
1895 Bancorp of Wisconsin, Inc. * | | |
| | |
| | |
Affinity Bancshares, Inc. * | | |
Amalgamated Financial Corp. | | |
| | |
American National Bankshares, Inc. | | |
| | |
AmeriServ Financial, Inc. | | |
| | |
| | |
| | |
Atlantic Union Bankshares Corp. | | |
Auburn National BanCorp, Inc. | | |
| | |
| | |
| | |
| | |
| | |
| | |
| | |
| | |
Bank of the James Financial Group, Inc. | | |
| | |
| | |
| | |
| | |
Bankwell Financial Group, Inc. | | |
| | |
| | |
| | |
| | |
| | |
Berkshire Hills Bancorp, Inc. | | |
| | |
Blue Ridge Bankshares, Inc. | | |
| | |
| | |
Bridgewater Bancshares, Inc. * | | |
Broadway Financial Corp. * | | |
| | |
Burke & Herbert Financial Services Corp. | | |
Business First Bancshares, Inc. | | |
| | |
| | |
| | |
| | |
| | |
| | |
| | |
Capital City Bank Group, Inc. | | |
Capitol Federal Financial, Inc. | | |
Capstar Financial Holdings, Inc. | | |
Carter Bankshares, Inc. * | | |
Schwab Equity Index Funds | Annual Report77
Schwab Total Stock Market Index Fund
Portfolio Holdings as of October 31, 2023 (continued)
| | |
| | |
| | |
CB Financial Services, Inc. | | |
Central Pacific Financial Corp. | | |
Central Valley Community Bancorp | | |
| | |
| | |
ChoiceOne Financial Services, Inc. | | |
| | |
Citizens & Northern Corp. | | |
Citizens Community Bancorp, Inc. | | |
Citizens Financial Group, Inc. | | |
Citizens Financial Services, Inc. | | |
| | |
| | |
| | |
| | |
Coastal Financial Corp. * | | |
Codorus Valley Bancorp, Inc. | | |
| | |
Columbia Banking System, Inc. | | |
Columbia Financial, Inc. * | | |
| | |
Commerce Bancshares, Inc. | | |
Community Bank System, Inc. | | |
Community Trust Bancorp, Inc. | | |
Community West Bancshares | | |
| | |
CrossFirst Bankshares, Inc. * | | |
Cullen/Frost Bankers, Inc. | | |
| | |
Customers Bancorp, Inc. * | | |
| | |
Dime Community Bancshares, Inc. | | |
Eagle Bancorp Montana, Inc. | | |
| | |
| | |
| | |
| | |
| | |
Enterprise Financial Services Corp. | | |
Equity Bancshares, Inc., Class A | | |
Esquire Financial Holdings, Inc. | | |
| | |
| | |
Farmers & Merchants Bancorp, Inc. | | |
Farmers National Banc Corp. | | |
| | |
Fidelity D&D Bancorp, Inc. (a) | | |
| | |
Financial Institutions, Inc. | | |
| | |
| | |
| | |
| | |
First Bancorp/Southern Pines NC | | |
| | |
| | |
| | |
First Business Financial Services, Inc. | | |
| | |
First Citizens BancShares, Inc., Class A | | |
First Commonwealth Financial Corp. | | |
First Community Bankshares, Inc. | | |
| | |
| | |
First Financial Bankshares, Inc. | | |
| | |
| | |
First Financial Northwest, Inc. | | |
| | |
First Guaranty Bancshares, Inc. | | |
| | |
| | |
| | |
First Interstate BancSystem, Inc., Class A | | |
| | |
First Mid Bancshares, Inc. | | |
| | |
| | |
First of Long Island Corp. | | |
First Savings Financial Group, Inc. | | |
First Seacoast Bancorp, Inc. * | | |
First U.S. Bancshares, Inc. | | |
| | |
First Western Financial, Inc. * | | |
| | |
| | |
| | |
| | |
Franklin Financial Services Corp. | | |
| | |
| | |
| | |
German American Bancorp, Inc. | | |
| | |
Great Southern Bancorp, Inc. | | |
Greene County Bancorp, Inc. | | |
Guaranty Bancshares, Inc. | | |
| | |
| | |
| | |
Hawthorn Bancshares, Inc. | | |
| | |
Heartland Financial USA, Inc. | | |
| | |
| | |
| | |
Hingham Institution For Savings | | |
| | |
| | |
| | |
| | |
HomeTrust Bancshares, Inc. | | |
| | |
| | |
Huntington Bancshares, Inc. | | |
| | |
| | |
| | |
Independent Bank Group, Inc. | | |
International Bancshares Corp. | | |
| | |
John Marshall Bancorp, Inc. | | |
| | |
| | |
| | |
| | |
| | |
| | |
| | |
| | |
Live Oak Bancshares, Inc. | | |
| | |
| | |
78
Schwab Equity Index Funds | Annual Report
Schwab Total Stock Market Index Fund
Portfolio Holdings as of October 31, 2023 (continued)
| | |
| | |
| | |
MainStreet Bancshares, Inc. | | |
| | |
| | |
Metrocity Bankshares, Inc. | | |
Metropolitan Bank Holding Corp. * | | |
| | |
| | |
Midland States Bancorp, Inc. | | |
MidWestOne Financial Group, Inc. | | |
| | |
National Bank Holdings Corp., Class A | | |
National Bankshares, Inc. | | |
| | |
New York Community Bancorp, Inc. | | |
| | |
| | |
Northeast Community Bancorp, Inc. | | |
| | |
| | |
Northwest Bancshares, Inc. | | |
| | |
| | |
| | |
OceanFirst Financial Corp. | | |
| | |
| | |
| | |
Old Point Financial Corp. | | |
| | |
| | |
Orange County Bancorp, Inc. | | |
| | |
Orrstown Financial Services, Inc. | | |
Pacific Premier Bancorp, Inc. | | |
| | |
| | |
| | |
| | |
| | |
| | |
| | |
| | |
Peapack-Gladstone Financial Corp. | | |
Penns Woods Bancorp, Inc. | | |
Peoples Bancorp of North Carolina, Inc. | | |
| | |
Peoples Financial Services Corp. | | |
Pinnacle Financial Partners, Inc. | | |
| | |
| | |
PNC Financial Services Group, Inc. | | |
Ponce Financial Group, Inc. * | | |
| | |
| | |
| | |
| | |
| | |
Prosperity Bancshares, Inc. | | |
Provident Bancorp, Inc. * | | |
Provident Financial Holdings, Inc. | | |
Provident Financial Services, Inc. | | |
| | |
| | |
Red River Bancshares, Inc. | | |
| | |
| | |
| | |
Republic Bancorp, Inc., Class A | | |
Richmond Mutual BanCorp, Inc. | | |
| | |
| | |
Sandy Spring Bancorp, Inc. | | |
| | |
Seacoast Banking Corp. of Florida | | |
ServisFirst Bancshares, Inc. | | |
| | |
| | |
Simmons First National Corp., Class A | | |
| | |
Sound Financial Bancorp, Inc. | | |
South Plains Financial, Inc. | | |
Southern California Bancorp * | | |
Southern First Bancshares, Inc. * | | |
Southern Missouri Bancorp, Inc. | | |
Southern States Bancshares, Inc. | | |
Southside Bancshares, Inc. | | |
| | |
| | |
| | |
Stock Yards Bancorp, Inc. | | |
Summit Financial Group, Inc. | | |
| | |
| | |
| | |
Territorial Bancorp, Inc. | | |
Texas Capital Bancshares, Inc. * | | |
Third Coast Bancshares, Inc. * | | |
| | |
| | |
| | |
| | |
| | |
| | |
| | |
| | |
| | |
| | |
| | |
| | |
| | |
United Community Banks, Inc. | | |
United Security Bancshares | | |
| | |
| | |
USCB Financial Holdings, Inc. * | | |
| | |
| | |
Virginia National Bankshares Corp. | | |
| | |
Washington Trust Bancorp, Inc. | | |
| | |
| | |
| | |
| | |
| | |
| | |
Western New England Bancorp, Inc. | | |
| | |
| | |
| | |
Schwab Equity Index Funds | Annual Report79
Schwab Total Stock Market Index Fund
Portfolio Holdings as of October 31, 2023 (continued)
| | |
| | |
| | |
|
|
| | |
| | |
| | |
| | |
| | |
| | |
| | |
Advanced Drainage Systems, Inc. | | |
| | |
| | |
| | |
| | |
AgEagle Aerial Systems, Inc. * | | |
| | |
| | |
Albany International Corp., Class A | | |
| | |
| | |
Allison Transmission Holdings, Inc. | | |
| | |
Alta Equipment Group, Inc. | | |
Ameresco, Inc., Class A * | | |
American Superconductor Corp. * | | |
American Woodmark Corp. * | | |
| | |
Amprius Technologies, Inc. *(a) | | |
| | |
| | |
Applied Industrial Technologies, Inc. | | |
Archer Aviation, Inc., Class A *(a) | | |
| | |
| | |
Armstrong World Industries, Inc. | | |
Array Technologies, Inc. * | | |
| | |
| | |
| | |
| | |
| | |
AZEK Co., Inc., Class A * | | |
| | |
Babcock & Wilcox Enterprises, Inc. * | | |
| | |
Beacon Roofing Supply, Inc. * | | |
| | |
| | |
Bloom Energy Corp., Class A * | | |
| | |
BlueLinx Holdings, Inc. * | | |
| | |
| | |
Bowman Consulting Group Ltd., Class A * | | |
| | |
Builders FirstSource, Inc. * | | |
| | |
| | |
| | |
| | |
| | |
ChargePoint Holdings, Inc. *(a) | | |
| | |
| | |
| | |
| | |
Comfort Systems USA, Inc. | | |
Commercial Vehicle Group, Inc. * | | |
Concrete Pumping Holdings, Inc. * | | |
Construction Partners, Inc., Class A * | | |
Core & Main, Inc., Class A * | | |
CPI Aerostructures, Inc. * | | |
| | |
| | |
| | |
| | |
Custom Truck One Source, Inc. * | | |
| | |
Desktop Metal, Inc., Class A *(a) | | |
Distribution Solutions Group, Inc. * | | |
| | |
| | |
| | |
| | |
| | |
| | |
| | |
| | |
| | |
| | |
| | |
| | |
Energy Vault Holdings, Inc. *(a) | | |
Enerpac Tool Group Corp., Class A | | |
| | |
| | |
| | |
Eos Energy Enterprises, Inc. * | | |
| | |
| | |
| | |
| | |
| | |
| | |
| | |
| | |
| | |
| | |
Flux Power Holdings, Inc. * | | |
| | |
Fortune Brands Innovations, Inc. | | |
Franklin Electric Co., Inc. | | |
FreightCar America, Inc. * | | |
| | |
| | |
FuelCell Energy, Inc. *(a) | | |
Gates Industrial Corp. PLC * | | |
| | |
Gencor Industries, Inc. * | | |
| | |
| | |
| | |
Gibraltar Industries, Inc. * | | |
| | |
| | |
| | |
| | |
GrafTech International Ltd. | | |
| | |
Granite Construction, Inc. | | |
Great Lakes Dredge & Dock Corp. * | | |
| | |
| | |
80
Schwab Equity Index Funds | Annual Report
Schwab Total Stock Market Index Fund
Portfolio Holdings as of October 31, 2023 (continued)
| | |
H&E Equipment Services, Inc. | | |
| | |
| | |
Helios Technologies, Inc. | | |
| | |
| | |
| | |
Hillman Solutions Corp. * | | |
Honeywell International, Inc. | | |
| | |
| | |
Hudson Technologies, Inc. * | | |
Huntington Ingalls Industries, Inc. | | |
| | |
Hydrofarm Holdings Group, Inc. * | | |
| | |
Hyster-Yale Materials Handling, Inc. | | |
| | |
| | |
| | |
| | |
Illinois Tool Works, Inc. | | |
| | |
| | |
Innovative Solutions & Support, Inc. * | | |
| | |
Intuitive Machines, Inc. * | | |
| | |
Janus International Group, Inc. * | | |
| | |
John Bean Technologies Corp. | | |
Johnson Controls International PLC | | |
| | |
| | |
| | |
| | |
Kratos Defense & Security Solutions, Inc. * | | |
KULR Technology Group, Inc. * | | |
L B Foster Co., Class A * | | |
L3Harris Technologies, Inc. | | |
Lennox International, Inc. | | |
| | |
| | |
Lincoln Electric Holdings, Inc. | | |
| | |
| | |
LS Starrett Co., Class A * | | |
| | |
| | |
Manitex International, Inc. * | | |
| | |
Markforged Holding Corp. * | | |
| | |
Masonite International Corp. * | | |
| | |
| | |
| | |
Mayville Engineering Co., Inc. * | | |
| | |
MDU Resources Group, Inc. | | |
| | |
| | |
Microvast Holdings, Inc. * | | |
| | |
| | |
Momentus, Inc., Class A *(a) | | |
| | |
| | |
| | |
MSC Industrial Direct Co., Inc., Class A | | |
| | |
Mueller Water Products, Inc., Class A | | |
| | |
National Presto Industries, Inc. | | |
Nauticus Robotics, Inc. *(a) | | |
| | |
| | |
NEXTracker, Inc., Class A * | | |
| | |
| | |
| | |
| | |
| | |
| | |
| | |
| | |
Ocean Power Technologies, Inc. * | | |
| | |
Optex Systems Holdings, Inc. * | | |
Orion Energy Systems, Inc. * | | |
Orion Group Holdings, Inc. * | | |
| | |
| | |
| | |
| | |
| | |
| | |
| | |
| | |
Perma-Pipe International Holdings, Inc. * | | |
| | |
| | |
| | |
Preformed Line Products Co. | | |
| | |
| | |
Quanex Building Products Corp. | | |
| | |
| | |
| | |
| | |
Resideo Technologies, Inc. * | | |
| | |
| | |
Rockwell Automation, Inc. | | |
| | |
Rush Enterprises, Inc., Class A | | |
Rush Enterprises, Inc., Class B | | |
Sarcos Technology & Robotics Corp. * | | |
Sensata Technologies Holding PLC | | |
| | |
Shoals Technologies Group, Inc., Class A * | | |
| | |
Simpson Manufacturing Co., Inc. | | |
SiteOne Landscape Supply, Inc. * | | |
| | |
| | |
Southland Holdings, Inc. *(a) | | |
Spirit AeroSystems Holdings, Inc., Class A * | | |
| | |
Standex International Corp. | | |
Stanley Black & Decker, Inc. | | |
Schwab Equity Index Funds | Annual Report81
Schwab Total Stock Market Index Fund
Portfolio Holdings as of October 31, 2023 (continued)
| | |
| | |
Sterling Infrastructure, Inc. * | | |
| | |
| | |
| | |
| | |
| | |
| | |
| | |
| | |
| | |
Terran Orbital Corp. *(a) | | |
| | |
Thermon Group Holdings, Inc. * | | |
| | |
Titan International, Inc. * | | |
| | |
| | |
| | |
| | |
| | |
| | |
| | |
| | |
| | |
| | |
| | |
| | |
| | |
| | |
| | |
| | |
| | |
| | |
| | |
Vertiv Holdings Co., Class A | | |
| | |
Virgin Galactic Holdings, Inc. * | | |
| | |
| | |
| | |
Watts Water Technologies, Inc., Class A | | |
WESCO International, Inc. | | |
Westinghouse Air Brake Technologies Corp. | | |
Westwater Resources, Inc. * | | |
Willis Lease Finance Corp. * | | |
WillScot Mobile Mini Holdings Corp. * | | |
| | |
| | |
| | |
| | |
Zurn Elkay Water Solutions Corp. | | |
| | |
|
Commercial & Professional Services 1.7% |
| | |
| | |
| | |
ACV Auctions, Inc., Class A * | | |
| | |
| | |
ARC Document Solutions, Inc. | | |
Aris Water Solutions, Inc., Class A | | |
| | |
| | |
| | |
Automatic Data Processing, Inc. | | |
Barrett Business Services, Inc. | | |
| | |
Blacksky Technology, Inc. *(a) | | |
Booz Allen Hamilton Holding Corp., Class A | | |
| | |
BrightView Holdings, Inc. * | | |
| | |
Broadridge Financial Solutions, Inc. | | |
CACI International, Inc., Class A * | | |
Casella Waste Systems, Inc., Class A * | | |
| | |
CECO Environmental Corp. * | | |
Ceridian HCM Holding, Inc. * | | |
| | |
| | |
| | |
| | |
| | |
| | |
| | |
| | |
| | |
CSG Systems International, Inc. | | |
| | |
| | |
Driven Brands Holdings, Inc. * | | |
Dun & Bradstreet Holdings, Inc. | | |
| | |
| | |
| | |
ExlService Holdings, Inc. * | | |
| | |
| | |
FiscalNote Holdings, Inc. * | | |
Forrester Research, Inc. * | | |
| | |
| | |
| | |
| | |
| | |
Healthcare Services Group, Inc. | | |
Heidrick & Struggles International, Inc. | | |
| | |
HireRight Holdings Corp. * | | |
| | |
| | |
Huron Consulting Group, Inc. * | | |
| | |
| | |
| | |
| | |
| | |
| | |
Kelly Services, Inc., Class A | | |
| | |
Knightscope, Inc., Class A * | | |
| | |
LanzaTech Global, Inc. *(a) | | |
| | |
| | |
Liquidity Services, Inc. * | | |
| | |
| | |
Matthews International Corp., Class A | | |
| | |
82
Schwab Equity Index Funds | Annual Report
Schwab Total Stock Market Index Fund
Portfolio Holdings as of October 31, 2023 (continued)
| | |
| | |
| | |
Montrose Environmental Group, Inc. * | | |
| | |
| | |
| | |
Odyssey Marine Exploration, Inc., Class B * | | |
| | |
| | |
| | |
| | |
| | |
Paylocity Holding Corp. * | | |
Performant Financial Corp. * | | |
Perma-Fix Environmental Services, Inc. * | | |
| | |
| | |
| | |
Quest Resource Holding Corp. * | | |
| | |
| | |
Republic Services, Inc., Class A | | |
Resources Connection, Inc. | | |
| | |
| | |
Science Applications International Corp. | | |
| | |
| | |
SS&C Technologies Holdings, Inc. | | |
| | |
| | |
| | |
| | |
| | |
| | |
| | |
| | |
| | |
| | |
| | |
| | |
| | |
| | |
Verisk Analytics, Inc., Class A | | |
Verra Mobility Corp., Class A * | | |
| | |
| | |
| | |
| | |
Where Food Comes From, Inc. * | | |
| | |
| | |
|
Consumer Discretionary Distribution & Retail 5.2% |
1-800-Flowers.com, Inc., Class A * | | |
| | |
| | |
Abercrombie & Fitch Co., Class A * | | |
Academy Sports & Outdoors, Inc. | | |
| | |
| | |
| | |
American Eagle Outfitters, Inc. | | |
America's Car-Mart, Inc. * | | |
| | |
| | |
| | |
Asbury Automotive Group, Inc. * | | |
| | |
| | |
| | |
Barnes & Noble Education, Inc. * | | |
| | |
| | |
Big 5 Sporting Goods Corp. (a) | | |
| | |
Boot Barn Holdings, Inc. * | | |
Brilliant Earth Group, Inc., Class A * | | |
| | |
Build-A-Bear Workshop, Inc. | | |
Burlington Stores, Inc. * | | |
| | |
Camping World Holdings, Inc., Class A | | |
| | |
| | |
Carvana Co., Class A *(a) | | |
| | |
| | |
| | |
| | |
| | |
Container Store Group, Inc. * | | |
ContextLogic, Inc., Class A *(a) | | |
Designer Brands, Inc., Class A | | |
Destination XL Group, Inc. * | | |
Dick's Sporting Goods, Inc. | | |
| | |
Duluth Holdings, Inc., Class B * | | |
| | |
| | |
| | |
| | |
| | |
| | |
Floor & Decor Holdings, Inc., Class A * | | |
| | |
GameStop Corp., Class A *(a) | | |
| | |
| | |
| | |
| | |
Groupon, Inc., Class A *(a) | | |
Grove Collaborative Holdings *(a) | | |
| | |
| | |
Haverty Furniture Cos., Inc. | | |
| | |
| | |
| | |
| | |
| | |
| | |
Lazydays Holdings, Inc. * | | |
| | |
Lithia Motors, Inc., Class A | | |
| | |
LL Flooring Holdings, Inc. * | | |
| | |
| | |
| | |
| | |
| | |
Schwab Equity Index Funds | Annual Report83
Schwab Total Stock Market Index Fund
Portfolio Holdings as of October 31, 2023 (continued)
| | |
National Vision Holdings, Inc. * | | |
| | |
| | |
Ollie's Bargain Outlet Holdings, Inc. * | | |
OneWater Marine, Inc., Class A * | | |
O'Reilly Automotive, Inc. * | | |
| | |
Penske Automotive Group, Inc. | | |
Petco Health & Wellness Co., Inc., Class A * | | |
| | |
| | |
| | |
Rent the Runway, Inc., Class A * | | |
| | |
| | |
| | |
RumbleON, Inc., Class B *(a) | | |
Sally Beauty Holdings, Inc. * | | |
Savers Value Village, Inc. * | | |
| | |
| | |
| | |
Sonic Automotive, Inc., Class A | | |
Sportsman's Warehouse Holdings, Inc. * | | |
Stitch Fix, Inc., Class A * | | |
Tandy Leather Factory, Inc. * | | |
| | |
Tile Shop Holdings, Inc. * | | |
| | |
| | |
| | |
| | |
| | |
| | |
| | |
Victoria's Secret & Co. * | | |
| | |
Warby Parker, Inc., Class A * | | |
| | |
| | |
| | |
| | |
| | |
| | |
|
Consumer Durables & Apparel 1.2% |
| | |
Allbirds, Inc., Class A * | | |
American Outdoor Brands, Inc. * | | |
| | |
| | |
Bassett Furniture Industries, Inc. | | |
| | |
| | |
| | |
| | |
| | |
Century Communities, Inc. | | |
| | |
| | |
Cricut, Inc., Class A (a) | | |
| | |
| | |
| | |
| | |
| | |
| | |
| | |
Dream Finders Homes, Inc., Class A * | | |
| | |
Ethan Allen Interiors, Inc. | | |
| | |
Flexsteel Industries, Inc. | | |
| | |
| | |
| | |
G-III Apparel Group Ltd. * | | |
| | |
Green Brick Partners, Inc. * | | |
Hamilton Beach Brands Holding Co., Class A | | |
| | |
| | |
| | |
| | |
Hovnanian Enterprises, Inc., Class A * | | |
Installed Building Products, Inc. | | |
| | |
| | |
Johnson Outdoors, Inc., Class A | | |
| | |
| | |
Lakeland Industries, Inc. | | |
| | |
| | |
| | |
| | |
| | |
| | |
Levi Strauss & Co., Class A | | |
| | |
| | |
| | |
| | |
Lululemon Athletica, Inc. * | | |
| | |
Malibu Boats, Inc., Class A * | | |
| | |
MasterCraft Boat Holdings, Inc. * | | |
| | |
| | |
| | |
Mohawk Industries, Inc. * | | |
| | |
| | |
| | |
| | |
| | |
Peloton Interactive, Inc., Class A * | | |
| | |
| | |
Purple Innovation, Inc., Class A | | |
| | |
Ralph Lauren Corp., Class A | | |
| | |
Skechers USA, Inc., Class A * | | |
| | |
Smith & Wesson Brands, Inc. | | |
Snap One Holdings Corp. * | | |
Solo Brands, Inc., Class A * | | |
| | |
| | |
| | |
Superior Group of Cos., Inc. | | |
84
Schwab Equity Index Funds | Annual Report
Schwab Total Stock Market Index Fund
Portfolio Holdings as of October 31, 2023 (continued)
| | |
| | |
Taylor Morrison Home Corp., Class A * | | |
Tempur Sealy International, Inc. | | |
| | |
| | |
Topgolf Callaway Brands Corp. * | | |
| | |
| | |
Tupperware Brands Corp. *(a) | | |
Under Armour, Inc., Class A * | | |
| | |
United Homes Group, Inc. * | | |
Universal Electronics, Inc. * | | |
| | |
| | |
| | |
Vizio Holding Corp., Class A * | | |
VOXX International Corp., Class A * | | |
| | |
Wolverine World Wide, Inc. | | |
| | |
| | |
| | |
|
|
Accel Entertainment, Inc., Class A * | | |
| | |
Adtalem Global Education, Inc. * | | |
| | |
American Public Education, Inc. * | | |
| | |
| | |
| | |
Biglari Holdings, Inc., Class B * | | |
| | |
| | |
Bluegreen Vacations Holding Corp., Class A | | |
| | |
| | |
| | |
Bright Horizons Family Solutions, Inc. * | | |
Brinker International, Inc. * | | |
Caesars Entertainment, Inc. * | | |
Canterbury Park Holding Corp. | | |
| | |
Carriage Services, Inc., Class A | | |
Carrols Restaurant Group, Inc. * | | |
| | |
| | |
| | |
| | |
Chipotle Mexican Grill, Inc., Class A * | | |
Choice Hotels International, Inc. | | |
| | |
| | |
| | |
Cracker Barrel Old Country Store, Inc. | | |
| | |
Dave & Buster's Entertainment, Inc. * | | |
| | |
| | |
| | |
DoorDash, Inc., Class A * | | |
DraftKings, Inc., Class A * | | |
| | |
| | |
Dutch Bros, Inc., Class A *(a) | | |
El Pollo Loco Holdings, Inc. * | | |
European Wax Center, Inc., Class A * | | |
| | |
| | |
First Watch Restaurant Group, Inc. * | | |
Flanigan's Enterprises, Inc. | | |
| | |
Full House Resorts, Inc. * | | |
| | |
Global Business Travel Group I *(a) | | |
Golden Entertainment, Inc. | | |
Graham Holdings Co., Class B | | |
Grand Canyon Education, Inc. * | | |
| | |
Hall of Fame Resort & Entertainment Co. *(a) | | |
Hilton Grand Vacations, Inc. * | | |
Hilton Worldwide Holdings, Inc. | | |
Hyatt Hotels Corp., Class A | | |
| | |
Inspired Entertainment, Inc. * | | |
| | |
| | |
Kura Sushi USA, Inc., Class A * | | |
| | |
| | |
Life Time Group Holdings, Inc. * | | |
| | |
Lincoln Educational Services Corp. * | | |
Lindblad Expeditions Holdings, Inc. * | | |
Marriott International, Inc., Class A | | |
Marriott Vacations Worldwide Corp. | | |
| | |
MGM Resorts International * | | |
| | |
Monarch Casino & Resort, Inc. | | |
Mondee Holdings, Inc., Class A *(a) | | |
| | |
| | |
| | |
Norwegian Cruise Line Holdings Ltd. * | | |
ONE Group Hospitality, Inc. * | | |
OneSpaWorld Holdings Ltd. * | | |
Papa John's International, Inc. | | |
Penn Entertainment, Inc. * | | |
| | |
Planet Fitness, Inc., Class A * | | |
Playa Hotels & Resorts NV * | | |
| | |
Portillo's, Inc., Class A * | | |
| | |
Rave Restaurant Group, Inc. * | | |
RCI Hospitality Holdings, Inc. | | |
Red Robin Gourmet Burgers, Inc. * | | |
Red Rock Resorts, Inc., Class A | | |
| | |
Rover Group, Inc., Class A * | | |
Royal Caribbean Cruises Ltd. * | | |
Rush Street Interactive, Inc. * | | |
| | |
SeaWorld Entertainment, Inc. * | | |
Service Corp. International | | |
Shake Shack, Inc., Class A * | | |
Six Flags Entertainment Corp. * | | |
| | |
| | |
Strategic Education, Inc. | | |
Schwab Equity Index Funds | Annual Report85
Schwab Total Stock Market Index Fund
Portfolio Holdings as of October 31, 2023 (continued)
| | |
| | |
Sweetgreen, Inc., Class A * | | |
Target Hospitality Corp. * | | |
Texas Roadhouse, Inc., Class A | | |
| | |
| | |
Universal Technical Institute, Inc. * | | |
| | |
| | |
| | |
| | |
Wyndham Hotels & Resorts, Inc. | | |
| | |
Xponential Fitness, Inc., Class A * | | |
| | |
| | |
|
Consumer Staples Distribution & Retail 1.8% |
Albertsons Cos., Inc., Class A | | |
| | |
BJ's Wholesale Club Holdings, Inc. * | | |
Casey's General Stores, Inc. | | |
| | |
| | |
| | |
| | |
Grocery Outlet Holding Corp. * | | |
| | |
Ingles Markets, Inc., Class A | | |
| | |
Natural Grocers by Vitamin Cottage, Inc. | | |
Performance Food Group Co. * | | |
| | |
| | |
Sprouts Farmers Market, Inc. * | | |
| | |
| | |
U.S. Foods Holding Corp. * | | |
United Natural Foods, Inc. * | | |
Village Super Market, Inc., Class A | | |
Walgreens Boots Alliance, Inc. | | |
| | |
| | |
| | |
|
|
Adams Resources & Energy, Inc. | | |
| | |
American Resources Corp. * | | |
| | |
| | |
| | |
| | |
| | |
Atlas Energy Solutions, Inc., Class A | | |
Baker Hughes Co., Class A | | |
| | |
| | |
| | |
California Resources Corp. | | |
| | |
Centrus Energy Corp., Class A * | | |
| | |
| | |
| | |
| | |
| | |
| | |
| | |
Clean Energy Fuels Corp. * | | |
| | |
| | |
| | |
| | |
| | |
| | |
| | |
Crescent Energy Co., Class A | | |
| | |
Delek U.S. Holdings, Inc. | | |
| | |
| | |
Diamond Offshore Drilling, Inc. * | | |
| | |
| | |
| | |
| | |
| | |
Earthstone Energy, Inc., Class A * | | |
| | |
| | |
| | |
| | |
| | |
Equitrans Midstream Corp. | | |
Evolution Petroleum Corp. | | |
Excelerate Energy, Inc., Class A | | |
Expro Group Holdings NV * | | |
| | |
Forum Energy Technologies, Inc. * | | |
Geospace Technologies Corp. * | | |
| | |
Granite Ridge Resources, Inc. | | |
| | |
Gulf Island Fabrication, Inc. * | | |
| | |
| | |
| | |
Helix Energy Solutions Group, Inc. * | | |
| | |
| | |
| | |
HighPeak Energy, Inc. (a) | | |
Houston American Energy Corp. *(a) | | |
Independence Contract Drilling, Inc. *(a) | | |
International Seaways, Inc. | | |
| | |
Kinetik Holdings, Inc., Class A | | |
KLX Energy Services Holdings, Inc. *(a) | | |
Kodiak Gas Services, Inc. * | | |
| | |
Liberty Energy, Inc., Class A | | |
| | |
Magnolia Oil & Gas Corp., Class A | | |
Mammoth Energy Services, Inc. * | | |
| | |
| | |
| | |
| | |
| | |
NACCO Industries, Inc., Class A | | |
Natural Gas Services Group, Inc. * | | |
86
Schwab Equity Index Funds | Annual Report
Schwab Total Stock Market Index Fund
Portfolio Holdings as of October 31, 2023 (continued)
| | |
New Fortress Energy, Inc. | | |
Newpark Resources, Inc. * | | |
| | |
Nine Energy Service, Inc. * | | |
| | |
| | |
| | |
Occidental Petroleum Corp. | | |
Oceaneering International, Inc. * | | |
Oil States International, Inc. * | | |
| | |
OPAL Fuels, Inc., Class A * | | |
Overseas Shipholding Group, Inc., Class A * | | |
| | |
Par Pacific Holdings, Inc. * | | |
Patterson-UTI Energy, Inc. | | |
PBF Energy, Inc., Class A | | |
| | |
Permian Resources Corp., Class A | | |
| | |
| | |
Pioneer Natural Resources Co. | | |
PrimeEnergy Resources Corp. * | | |
| | |
ProFrac Holding Corp., Class A * | | |
| | |
| | |
Ranger Energy Services, Inc. | | |
REX American Resources Corp. * | | |
Riley Exploration Permian, Inc. | | |
| | |
| | |
| | |
| | |
SEACOR Marine Holdings, Inc. * | | |
Select Water Solutions, Inc. | | |
SilverBow Resources, Inc. * | | |
Sitio Royalties Corp., Class A | | |
| | |
| | |
Solaris Oilfield Infrastructure, Inc., Class A | | |
Southwestern Energy Co. * | | |
| | |
| | |
| | |
| | |
TETRA Technologies, Inc. * | | |
| | |
| | |
| | |
U.S. Silica Holdings, Inc. * | | |
| | |
| | |
| | |
| | |
| | |
| | |
| | |
| | |
Weatherford International PLC * | | |
| | |
| | |
| | |
|
| | |
Equity Real Estate Investment Trusts (REITs) 2.6% |
| | |
| | |
Alexander & Baldwin, Inc. | | |
| | |
Alexandria Real Estate Equities, Inc. | | |
Alpine Income Property Trust, Inc. | | |
American Assets Trust, Inc. | | |
American Homes 4 Rent, Class A | | |
| | |
Americold Realty Trust, Inc. | | |
Apartment Income REIT Corp. | | |
Apartment Investment & Management Co., Class A * | | |
Apple Hospitality REIT, Inc. | | |
Armada Hoffler Properties, Inc. | | |
Ashford Hospitality Trust, Inc. * | | |
AvalonBay Communities, Inc. | | |
Bluerock Homes Trust, Inc. * | | |
| | |
Braemar Hotels & Resorts, Inc. | | |
| | |
Brixmor Property Group, Inc. | | |
Broadstone Net Lease, Inc. | | |
| | |
| | |
| | |
CBL & Associates Properties, Inc. | | |
| | |
| | |
| | |
| | |
Community Healthcare Trust, Inc. | | |
| | |
| | |
Creative Media & Community Trust Corp. | | |
| | |
| | |
| | |
DiamondRock Hospitality Co. | | |
Digital Realty Trust, Inc. | | |
Diversified Healthcare Trust | | |
| | |
Easterly Government Properties, Inc., Class A | | |
EastGroup Properties, Inc. | | |
| | |
Empire State Realty Trust, Inc., Class A | | |
| | |
| | |
| | |
Equity LifeStyle Properties, Inc. | | |
| | |
Essential Properties Realty Trust, Inc. | | |
Essex Property Trust, Inc. | | |
Extra Space Storage, Inc. | | |
| | |
Federal Realty Investment Trust | | |
First Industrial Realty Trust, Inc. | | |
Four Corners Property Trust, Inc. | | |
Franklin Street Properties Corp., Class C | | |
Gaming & Leisure Properties, Inc. | | |
| | |
Gladstone Commercial Corp. | | |
Schwab Equity Index Funds | Annual Report87
Schwab Total Stock Market Index Fund
Portfolio Holdings as of October 31, 2023 (continued)
| | |
| | |
Global Medical REIT, Inc. | | |
| | |
Global Self Storage, Inc. | | |
Healthcare Realty Trust, Inc., Class A | | |
Healthpeak Properties, Inc. | | |
Hersha Hospitality Trust, Class A | | |
Highwoods Properties, Inc. | | |
Host Hotels & Resorts, Inc. | | |
Hudson Pacific Properties, Inc. | | |
Independence Realty Trust, Inc. | | |
Industrial Logistics Properties Trust | | |
Innovative Industrial Properties, Inc. | | |
InvenTrust Properties Corp. | | |
| | |
| | |
| | |
| | |
| | |
| | |
Lamar Advertising Co., Class A | | |
| | |
| | |
| | |
Medical Properties Trust, Inc. | | |
Mid-America Apartment Communities, Inc. | | |
Modiv Industrial, Inc., Class C | | |
National Health Investors, Inc. | | |
National Storage Affiliates Trust | | |
| | |
New Century Financial Corp. *(b) | | |
NexPoint Diversified Real Estate Trust | | |
NexPoint Residential Trust, Inc. | | |
| | |
Office Properties Income Trust | | |
Omega Healthcare Investors, Inc. | | |
One Liberty Properties, Inc. | | |
| | |
| | |
| | |
Park Hotels & Resorts, Inc. | | |
| | |
| | |
Phillips Edison & Co., Inc. | | |
| | |
Piedmont Office Realty Trust, Inc., Class A | | |
Plymouth Industrial REIT, Inc. | | |
Postal Realty Trust, Inc., Class A | | |
| | |
Presidio Property Trust, Inc., Class A | | |
| | |
| | |
| | |
| | |
| | |
Retail Opportunity Investments Corp. | | |
Rexford Industrial Realty, Inc. | | |
| | |
| | |
Ryman Hospitality Properties, Inc. | | |
Sabra Health Care REIT, Inc. | | |
| | |
| | |
SBA Communications Corp., Class A | | |
| | |
Simon Property Group, Inc. | | |
| | |
| | |
SL Green Realty Corp. (a) | | |
Spirit Realty Capital, Inc. | | |
| | |
| | |
Summit Hotel Properties, Inc. | | |
| | |
Sunstone Hotel Investors, Inc. | | |
Tanger Factory Outlet Centers, Inc. | | |
| | |
| | |
| | |
| | |
Universal Health Realty Income Trust | | |
| | |
| | |
| | |
VICI Properties, Inc., Class A | | |
| | |
| | |
| | |
| | |
| | |
Xenia Hotels & Resorts, Inc. | | |
| | |
|
|
| | |
ACRES Commercial Realty Corp. | | |
| | |
Affiliated Managers Group, Inc. | | |
| | |
AG Mortgage Investment Trust, Inc. | | |
| | |
| | |
| | |
| | |
A-Mark Precious Metals, Inc. | | |
| | |
Ameriprise Financial, Inc. | | |
Angel Oak Mortgage REIT, Inc. (a) | | |
Annaly Capital Management, Inc. | | |
Apollo Commercial Real Estate Finance, Inc. | | |
Apollo Global Management, Inc. | | |
Arbor Realty Trust, Inc. (a) | | |
Ares Commercial Real Estate Corp. | | |
Ares Management Corp., Class A | | |
Arlington Asset Investment Corp., Class A * | | |
ARMOUR Residential REIT, Inc. (a) | | |
Artisan Partners Asset Management, Inc., Class A | | |
AssetMark Financial Holdings, Inc. * | | |
Associated Capital Group, Inc., Class A | | |
Atlanticus Holdings Corp. * | | |
| | |
AvidXchange Holdings, Inc. * | | |
| | |
Bakkt Holdings, Inc. *(a) | | |
Bank of New York Mellon Corp. | | |
| | |
Berkshire Hathaway, Inc., Class B * | | |
| | |
| | |
88
Schwab Equity Index Funds | Annual Report
Schwab Total Stock Market Index Fund
Portfolio Holdings as of October 31, 2023 (continued)
| | |
Blackstone Mortgage Trust, Inc., Class A (a) | | |
| | |
| | |
Blue Owl Capital, Inc., Class A | | |
| | |
Bread Financial Holdings, Inc. | | |
Bridge Investment Group Holdings, Inc., Class A | | |
Brightsphere Investment Group, Inc. | | |
BrightSpire Capital, Inc., Class A | | |
| | |
| | |
Capital One Financial Corp. | | |
| | |
Cass Information Systems, Inc. | | |
Cboe Global Markets, Inc. | | |
| | |
Cherry Hill Mortgage Investment Corp. | | |
Chicago Atlantic Real Estate Finance, Inc. | | |
| | |
Claros Mortgage Trust, Inc. | | |
| | |
| | |
Coinbase Global, Inc., Class A * | | |
Consumer Portfolio Services, Inc. * | | |
Corebridge Financial, Inc. | | |
Credit Acceptance Corp. * | | |
Diamond Hill Investment Group, Inc. | | |
Discover Financial Services | | |
Donnelley Financial Solutions, Inc. * | | |
| | |
Ellington Financial, Inc. (a) | | |
Ellington Residential Mortgage REIT | | |
| | |
Encore Capital Group, Inc. * | | |
Enova International, Inc. * | | |
| | |
| | |
Euronet Worldwide, Inc. * | | |
| | |
| | |
| | |
FactSet Research Systems, Inc. | | |
Federal Agricultural Mortgage Corp., Class C | | |
| | |
Fidelity National Information Services, Inc. | | |
Finance of America Cos., Inc., Class A * | | |
| | |
| | |
FleetCor Technologies, Inc. * | | |
| | |
Forge Global Holdings, Inc. * | | |
Franklin BSP Realty Trust, Inc. | | |
| | |
GCM Grosvenor, Inc., Class A | | |
| | |
Goldman Sachs Group, Inc. | | |
Granite Point Mortgage Trust, Inc. | | |
| | |
Green Dot Corp., Class A * | | |
| | |
| | |
Guild Holdings Co., Class A | | |
Hamilton Lane, Inc., Class A | | |
Hannon Armstrong Sustainable Infrastructure Capital, Inc. | | |
| | |
Houlihan Lokey, Inc., Class A | | |
I3 Verticals, Inc., Class A * | | |
Interactive Brokers Group, Inc., Class A | | |
Intercontinental Exchange, Inc. | | |
International Money Express, Inc. * | | |
| | |
Invesco Mortgage Capital, Inc. | | |
Jack Henry & Associates, Inc. | | |
Jackson Financial, Inc., Class A | | |
Janus Henderson Group PLC | | |
Jefferies Financial Group, Inc. | | |
Katapult Holdings, Inc. * | | |
| | |
KKR Real Estate Finance Trust, Inc. | | |
Ladder Capital Corp. REIT, Class A | | |
| | |
| | |
| | |
loanDepot, Inc., Class A * | | |
LPL Financial Holdings, Inc. | | |
Lument Finance Trust, Inc. | | |
Manhattan Bridge Capital, Inc. | | |
MarketAxess Holdings, Inc. | | |
| | |
Mastercard, Inc., Class A | | |
Medallion Financial Corp. | | |
| | |
| | |
| | |
| | |
| | |
| | |
| | |
| | |
| | |
| | |
| | |
| | |
| | |
| | |
NerdWallet, Inc., Class A * | | |
New York Mortgage Trust, Inc. | | |
| | |
Nexpoint Real Estate Finance, Inc. | | |
Nicholas Financial, Inc. * | | |
NMI Holdings, Inc., Class A * | | |
| | |
| | |
| | |
Open Lending Corp., Class A * | | |
Oportun Financial Corp. * | | |
Oppenheimer Holdings, Inc., Class A | | |
| | |
Orchid Island Capital, Inc. (a) | | |
| | |
Paymentus Holdings, Inc., Class A * | | |
| | |
| | |
| | |
PennyMac Financial Services, Inc. | | |
PennyMac Mortgage Investment Trust | | |
Perella Weinberg Partners, Class A | | |
Schwab Equity Index Funds | Annual Report89
Schwab Total Stock Market Index Fund
Portfolio Holdings as of October 31, 2023 (continued)
| | |
| | |
PJT Partners, Inc., Class A | | |
| | |
Priority Technology Holdings, Inc. * | | |
| | |
| | |
Raymond James Financial, Inc. | | |
| | |
| | |
Regional Management Corp. | | |
| | |
Repay Holdings Corp., Class A * | | |
| | |
Robinhood Markets, Inc., Class A * | | |
Rocket Cos., Inc., Class A * | | |
| | |
| | |
| | |
Safeguard Scientifics, Inc. * | | |
Sculptor Capital Management, Inc., Class A | | |
Security National Financial Corp., Class A * | | |
| | |
| | |
Shift4 Payments, Inc., Class A * | | |
Silvercrest Asset Management Group, Inc., Class A | | |
| | |
SoFi Technologies, Inc. * | | |
Starwood Property Trust, Inc. | | |
| | |
StepStone Group, Inc., Class A | | |
| | |
| | |
| | |
| | |
| | |
| | |
| | |
TPG RE Finance Trust, Inc. | | |
| | |
Tradeweb Markets, Inc., Class A | | |
Two Harbors Investment Corp. | | |
U.S. Global Investors, Inc., Class A | | |
Upstart Holdings, Inc. *(a) | | |
| | |
| | |
Velocity Financial, Inc. * | | |
Victory Capital Holdings, Inc., Class A | | |
Virtu Financial, Inc., Class A | | |
Virtus Investment Partners, Inc. | | |
| | |
| | |
| | |
Waterstone Financial, Inc. | | |
Western Asset Mortgage Capital Corp. | | |
| | |
Westwood Holdings Group, Inc. | | |
| | |
| | |
| | |
| | |
|
| | |
Food, Beverage & Tobacco 2.9% |
| | |
| | |
Archer-Daniels-Midland Co. | | |
| | |
| | |
Boston Beer Co., Inc., Class A * | | |
| | |
Brown-Forman Corp., Class B | | |
| | |
| | |
| | |
| | |
| | |
| | |
Coca-Cola Consolidated, Inc. | | |
| | |
Constellation Brands, Inc., Class A | | |
Darling Ingredients, Inc. * | | |
Duckhorn Portfolio, Inc. * | | |
| | |
| | |
Fresh Del Monte Produce, Inc. | | |
| | |
| | |
Hain Celestial Group, Inc. * | | |
| | |
| | |
Hostess Brands, Inc., Class A * | | |
| | |
| | |
| | |
John B Sanfilippo & Son, Inc. | | |
| | |
| | |
| | |
Lamb Weston Holdings, Inc. | | |
| | |
Lifecore Biomedical, Inc. * | | |
| | |
| | |
McCormick & Co., Inc. - Non Voting Shares | | |
| | |
| | |
Molson Coors Beverage Co., Class B | | |
Mondelez International, Inc., Class A | | |
| | |
National Beverage Corp. * | | |
| | |
Philip Morris International, Inc. | | |
| | |
| | |
Real Good Food Co., Inc. * | | |
| | |
| | |
Seneca Foods Corp., Class A * | | |
| | |
| | |
Splash Beverage Group, Inc. * | | |
Tootsie Roll Industries, Inc. | | |
| | |
Turning Point Brands, Inc. | | |
Tyson Foods, Inc., Class A | | |
| | |
| | |
| | |
90
Schwab Equity Index Funds | Annual Report
Schwab Total Stock Market Index Fund
Portfolio Holdings as of October 31, 2023 (continued)
| | |
Vintage Wine Estates, Inc. * | | |
| | |
| | |
| | |
Whole Earth Brands, Inc. * | | |
| | |
| | |
| | |
|
Health Care Equipment & Services 5.5% |
23andMe Holding Co., Class A * | | |
| | |
Acadia Healthcare Co., Inc. * | | |
Accelerate Diagnostics, Inc. *(a) | | |
| | |
| | |
AdaptHealth Corp., Class A * | | |
| | |
| | |
| | |
AirSculpt Technologies, Inc. * | | |
| | |
| | |
Alignment Healthcare, Inc. * | | |
Alphatec Holdings, Inc. * | | |
| | |
American Well Corp., Class A * | | |
AMN Healthcare Services, Inc. * | | |
| | |
Apollo Medical Holdings, Inc. * | | |
| | |
| | |
| | |
| | |
| | |
| | |
| | |
Aveanna Healthcare Holdings, Inc. * | | |
| | |
| | |
Baxter International, Inc. | | |
| | |
| | |
| | |
BioSig Technologies, Inc. * | | |
Bioventus, Inc., Class A * | | |
Boston Scientific Corp. * | | |
Brookdale Senior Living, Inc. * | | |
| | |
| | |
| | |
Castle Biosciences, Inc. * | | |
| | |
| | |
| | |
| | |
| | |
| | |
| | |
Clover Health Investments Corp., Class A * | | |
Community Health Systems, Inc. * | | |
Computer Programs & Systems, Inc. * | | |
| | |
| | |
| | |
Cross Country Healthcare, Inc. * | | |
| | |
| | |
| | |
| | |
| | |
| | |
Definitive Healthcare Corp., Class A * | | |
| | |
| | |
| | |
| | |
Doximity, Inc., Class A * | | |
Edwards Lifesciences Corp. * | | |
| | |
| | |
| | |
| | |
| | |
| | |
| | |
| | |
| | |
| | |
| | |
Evolent Health, Inc., Class A * | | |
| | |
| | |
| | |
GE HealthCare Technologies, Inc. | | |
| | |
| | |
Globus Medical, Inc., Class A * | | |
GoodRx Holdings, Inc., Class A * | | |
| | |
| | |
| | |
| | |
| | |
| | |
| | |
| | |
| | |
Hims & Hers Health, Inc. * | | |
| | |
| | |
| | |
| | |
IDEXX Laboratories, Inc. * | | |
| | |
InfuSystem Holdings, Inc. * | | |
Innovage Holding Corp. *(a) | | |
Inspire Medical Systems, Inc. * | | |
| | |
| | |
Integra LifeSciences Holdings Corp. * | | |
Intuitive Surgical, Inc. * | | |
| | |
| | |
iRhythm Technologies, Inc. * | | |
| | |
| | |
KORU Medical Systems, Inc. * | | |
Laboratory Corp. of America Holdings | | |
Lantheus Holdings, Inc. * | | |
| | |
| | |
| | |
LifeStance Health Group, Inc. * | | |
| | |
Schwab Equity Index Funds | Annual Report91
Schwab Total Stock Market Index Fund
Portfolio Holdings as of October 31, 2023 (continued)
| | |
| | |
| | |
| | |
Merit Medical Systems, Inc. * | | |
Milestone Scientific, Inc. * | | |
| | |
Molina Healthcare, Inc. * | | |
| | |
National HealthCare Corp. | | |
| | |
| | |
| | |
| | |
| | |
NextGen Healthcare, Inc. * | | |
| | |
OmniAb, Inc., Class A *(b) | | |
OmniAb, Inc., Class B *(b) | | |
| | |
| | |
| | |
Option Care Health, Inc. * | | |
OraSure Technologies, Inc. * | | |
Orchestra BioMed Holdings, Inc. *(a) | | |
| | |
| | |
| | |
| | |
P3 Health Partners, Inc. * | | |
| | |
| | |
| | |
Pediatrix Medical Group, Inc. * | | |
| | |
| | |
| | |
| | |
| | |
Privia Health Group, Inc. * | | |
PROCEPT BioRobotics Corp. * | | |
| | |
| | |
| | |
| | |
Pulse Biosciences, Inc. * | | |
| | |
| | |
| | |
| | |
| | |
| | |
| | |
| | |
| | |
Select Medical Holdings Corp. | | |
Semler Scientific, Inc. * | | |
Senseonics Holdings, Inc. * | | |
Sensus Healthcare, Inc. * | | |
| | |
Shockwave Medical, Inc. * | | |
| | |
| | |
Silk Road Medical, Inc. * | | |
| | |
| | |
Sonida Senior Living, Inc. * | | |
| | |
| | |
| | |
| | |
Streamline Health Solutions, Inc. * | | |
| | |
| | |
| | |
Tabula Rasa HealthCare, Inc. * | | |
Tactile Systems Technology, Inc. * | | |
| | |
Tandem Diabetes Care, Inc. * | | |
| | |
| | |
| | |
| | |
TransMedics Group, Inc. * | | |
Treace Medical Concepts, Inc. * | | |
U.S. Physical Therapy, Inc. | | |
| | |
| | |
Universal Health Services, Inc., Class B | | |
Utah Medical Products, Inc. | | |
| | |
Veeva Systems, Inc., Class A * | | |
| | |
| | |
| | |
Zimmer Biomet Holdings, Inc. | | |
| | |
| | |
| | |
| | |
|
Household & Personal Products 1.4% |
| | |
| | |
Central Garden & Pet Co. * | | |
Central Garden & Pet Co., Class A * | | |
Church & Dwight Co., Inc. | | |
| | |
| | |
| | |
Edgewell Personal Care Co. | | |
| | |
| | |
Estee Lauder Cos., Inc., Class A | | |
| | |
| | |
| | |
| | |
| | |
| | |
Natural Alternatives International, Inc. * | | |
Natural Health Trends Corp. | | |
Nature's Sunshine Products, Inc. * | | |
Nu Skin Enterprises, Inc., Class A | | |
| | |
| | |
Reynolds Consumer Products, Inc. | | |
Spectrum Brands Holdings, Inc. | | |
| | |
USANA Health Sciences, Inc. * | | |
| | |
| | |
|
92
Schwab Equity Index Funds | Annual Report
Schwab Total Stock Market Index Fund
Portfolio Holdings as of October 31, 2023 (continued)
| | |
|
| | |
| | |
Ambac Financial Group, Inc. * | | |
American Coastal Insurance Corp., Class C *(a) | | |
American Equity Investment Life Holding Co. | | |
American Financial Group, Inc. | | |
American International Group, Inc. | | |
| | |
| | |
Arch Capital Group Ltd. * | | |
Argo Group International Holdings Ltd. | | |
| | |
| | |
| | |
Axis Capital Holdings Ltd. | | |
Brighthouse Financial, Inc. * | | |
| | |
BRP Group, Inc., Class A * | | |
| | |
Cincinnati Financial Corp. | | |
Citizens, Inc., Class A *(a) | | |
| | |
CNO Financial Group, Inc. | | |
| | |
Donegal Group, Inc., Class A | | |
| | |
| | |
| | |
Erie Indemnity Co., Class A | | |
| | |
F&G Annuities & Life, Inc. | | |
Fidelity National Financial, Inc. | | |
First American Financial Corp. | | |
Genworth Financial, Inc., Class A * | | |
| | |
GoHealth, Inc., Class A * | | |
Goosehead Insurance, Inc., Class A * | | |
Greenlight Capital Re Ltd., Class A * | | |
| | |
Hallmark Financial Services, Inc. * | | |
Hanover Insurance Group, Inc. | | |
Hartford Financial Services Group, Inc. | | |
| | |
Heritage Insurance Holdings, Inc. * | | |
Hippo Holdings, Inc. *(a) | | |
Horace Mann Educators Corp. | | |
| | |
| | |
James River Group Holdings Ltd. | | |
| | |
Kingsway Financial Services, Inc. * | | |
Kinsale Capital Group, Inc. | | |
| | |
| | |
| | |
| | |
| | |
Marsh & McLennan Cos., Inc. | | |
| | |
| | |
| | |
| | |
| | |
National Western Life Group, Inc., Class A | | |
| | |
Old Republic International Corp. | | |
Oscar Health, Inc., Class A * | | |
| | |
| | |
Principal Financial Group, Inc. | | |
| | |
| | |
Prudential Financial, Inc. | | |
Reinsurance Group of America, Inc. | | |
RenaissanceRe Holdings Ltd. | | |
| | |
| | |
Ryan Specialty Holdings, Inc., Class A * | | |
Safety Insurance Group, Inc. | | |
Selective Insurance Group, Inc. | | |
| | |
| | |
Skyward Specialty Insurance Group, Inc. * | | |
Stewart Information Services Corp. | | |
| | |
| | |
| | |
| | |
Universal Insurance Holdings, Inc. | | |
| | |
| | |
White Mountains Insurance Group Ltd. | | |
| | |
| | |
|
|
| | |
Air Products & Chemicals, Inc. | | |
| | |
| | |
Alpha Metallurgical Resources, Inc. | | |
| | |
| | |
| | |
| | |
| | |
| | |
| | |
| | |
| | |
| | |
| | |
| | |
Axalta Coating Systems Ltd. * | | |
| | |
| | |
| | |
| | |
Carpenter Technology Corp. | | |
| | |
| | |
CF Industries Holdings, Inc. | | |
| | |
| | |
| | |
| | |
Schwab Equity Index Funds | Annual Report93
Schwab Total Stock Market Index Fund
Portfolio Holdings as of October 31, 2023 (continued)
| | |
| | |
| | |
Compass Minerals International, Inc. | | |
| | |
Core Molding Technologies, Inc. * | | |
| | |
| | |
| | |
Danimer Scientific, Inc. *(a) | | |
| | |
| | |
| | |
| | |
| | |
| | |
| | |
Flotek Industries, Inc. * | | |
| | |
| | |
Friedman Industries, Inc. | | |
| | |
| | |
Ginkgo Bioworks Holdings, Inc. *(a) | | |
| | |
Graphic Packaging Holding Co. | | |
| | |
| | |
Haynes International, Inc. | | |
| | |
| | |
| | |
Hycroft Mining Holding Corp. * | | |
Idaho Strategic Resources, Inc. * | | |
| | |
| | |
International Flavors & Fragrances, Inc. | | |
| | |
| | |
| | |
| | |
| | |
| | |
| | |
| | |
Loop Industries, Inc. *(a) | | |
| | |
| | |
LyondellBasell Industries NV, Class A | | |
Martin Marietta Materials, Inc. | | |
| | |
| | |
| | |
Mercer International, Inc. | | |
Minerals Technologies, Inc. | | |
| | |
| | |
| | |
| | |
| | |
Northern Technologies International Corp. | | |
| | |
| | |
| | |
| | |
| | |
| | |
| | |
Packaging Corp. of America | | |
| | |
| | |
| | |
| | |
PureCycle Technologies, Inc. *(a) | | |
| | |
Ramaco Resources, Inc., Class A | | |
Ramaco Resources, Inc., Class B | | |
Ranpak Holdings Corp., Class A * | | |
Rayonier Advanced Materials, Inc. * | | |
Reliance Steel & Aluminum Co. | | |
| | |
| | |
| | |
Schnitzer Steel Industries, Inc., Class A | | |
| | |
| | |
Sensient Technologies Corp. | | |
| | |
| | |
| | |
Solitario Resources Corp. * | | |
| | |
| | |
| | |
Summit Materials, Inc., Class A * | | |
| | |
| | |
| | |
| | |
| | |
| | |
| | |
| | |
| | |
U.S. Lime & Minerals, Inc. | | |
| | |
Universal Stainless & Alloy Products, Inc. * | | |
| | |
| | |
| | |
| | |
| | |
Worthington Industries, Inc. | | |
| | |
|
Media & Entertainment 7.2% |
Advantage Solutions, Inc. * | | |
Alphabet, Inc., Class A * | | |
Alphabet, Inc., Class C * | | |
Altice USA, Inc., Class A * | | |
AMC Entertainment Holdings, Inc., Class A * | | |
AMC Networks, Inc., Class A * | | |
Arena Group Holdings, Inc. * | | |
Atlanta Braves Holdings, Inc., Class C * | | |
Boston Omaha Corp., Class A * | | |
| | |
| | |
| | |
| | |
| | |
94
Schwab Equity Index Funds | Annual Report
Schwab Total Stock Market Index Fund
Portfolio Holdings as of October 31, 2023 (continued)
| | |
Charter Communications, Inc., Class A * | | |
Cinemark Holdings, Inc. * | | |
Clear Channel Outdoor Holdings, Inc. * | | |
| | |
| | |
Cumulus Media, Inc., Class A * | | |
| | |
| | |
| | |
DISH Network Corp., Class A * | | |
| | |
| | |
Endeavor Group Holdings, Inc., Class A | | |
Entravision Communications Corp., Class A | | |
Eventbrite, Inc., Class A * | | |
EverQuote, Inc., Class A * | | |
EW Scripps Co., Class A * | | |
| | |
| | |
| | |
| | |
| | |
Getty Images Holdings, Inc. *(a) | | |
Golden Matrix Group, Inc. * | | |
| | |
| | |
| | |
| | |
iHeartMedia, Inc., Class A * | | |
| | |
Integral Ad Science Holding Corp. * | | |
Interpublic Group of Cos., Inc. | | |
| | |
John Wiley & Sons, Inc., Class A | | |
| | |
Liberty Broadband Corp., Class C * | | |
Liberty Media Corp.-Liberty Formula One, Class C * | | |
Liberty Media Corp.-Liberty Live, Class C * | | |
Liberty Media Corp.-Liberty SiriusXM, Class C * | | |
Lions Gate Entertainment Corp., Class A * | | |
Live Nation Entertainment, Inc. * | | |
| | |
Madison Square Garden Entertainment Corp., Class A * | | |
Madison Square Garden Sports Corp. * | | |
| | |
| | |
| | |
| | |
MediaAlpha, Inc., Class A * | | |
Meta Platforms, Inc., Class A * | | |
National CineMedia, Inc. *(a) | | |
| | |
New York Times Co., Class A | | |
| | |
Nexstar Media Group, Inc., Class A | | |
Nextdoor Holdings, Inc. * | | |
| | |
| | |
| | |
Paramount Global, Class B | | |
Pinterest, Inc., Class A * | | |
| | |
| | |
| | |
| | |
PubMatic, Inc., Class A * | | |
| | |
Reading International, Inc., Class B * | | |
| | |
| | |
| | |
| | |
Saga Communications, Inc., Class A | | |
| | |
| | |
| | |
Sirius XM Holdings, Inc. (a) | | |
| | |
| | |
Sphere Entertainment Co. * | | |
Stagwell, Inc., Class A * | | |
Take-Two Interactive Software, Inc. * | | |
| | |
| | |
| | |
| | |
Townsquare Media, Inc., Class A | | |
Trade Desk, Inc., Class A * | | |
| | |
| | |
Troika Media Group, Inc. * | | |
| | |
| | |
Urban One, Inc., Class A * | | |
| | |
Vivid Seats, Inc., Class A * | | |
| | |
Warner Bros Discovery, Inc. * | | |
Warner Music Group Corp., Class A | | |
| | |
| | |
| | |
| | |
ZipRecruiter, Inc., Class A * | | |
ZoomInfo Technologies, Inc., Class A * | | |
| | |
|
Pharmaceuticals, Biotechnology & Life Sciences 7.4% |
10X Genomics, Inc., Class A * | | |
180 Life Sciences Corp. * | | |
4D Molecular Therapeutics, Inc. * | | |
| | |
| | |
| | |
Abeona Therapeutics, Inc. * | | |
| | |
ACADIA Pharmaceuticals, Inc. * | | |
AcelRx Pharmaceuticals, Inc. * | | |
| | |
Achieve Life Sciences, Inc. * | | |
Aclaris Therapeutics, Inc. * | | |
Acrivon Therapeutics, Inc. * | | |
Actinium Pharmaceuticals, Inc. *(a) | | |
Acumen Pharmaceuticals, Inc. * | | |
Adaptive Biotechnologies Corp. * | | |
Schwab Equity Index Funds | Annual Report95
Schwab Total Stock Market Index Fund
Portfolio Holdings as of October 31, 2023 (continued)
| | |
| | |
Adverum Biotechnologies, Inc. * | | |
Aerovate Therapeutics, Inc. * | | |
| | |
Agilent Technologies, Inc. | | |
Agios Pharmaceuticals, Inc. * | | |
Akebia Therapeutics, Inc. * | | |
Akero Therapeutics, Inc. * | | |
Akoya Biosciences, Inc. * | | |
Alaunos Therapeutics, Inc. * | | |
Aldeyra Therapeutics, Inc. * | | |
| | |
Aligos Therapeutics, Inc. * | | |
| | |
| | |
Allogene Therapeutics, Inc. * | | |
Alnylam Pharmaceuticals, Inc. * | | |
Alpine Immune Sciences, Inc. * | | |
| | |
ALX Oncology Holdings, Inc. *(a) | | |
| | |
| | |
Amicus Therapeutics, Inc. * | | |
Amneal Pharmaceuticals, Inc. * | | |
Amphastar Pharmaceuticals, Inc. * | | |
Amylyx Pharmaceuticals, Inc. * | | |
| | |
Anavex Life Sciences Corp. * | | |
ANI Pharmaceuticals, Inc. * | | |
Anika Therapeutics, Inc. * | | |
Anixa Biosciences, Inc. * | | |
| | |
| | |
Apellis Pharmaceuticals, Inc. * | | |
Apogee Therapeutics, Inc. * | | |
Applied Therapeutics, Inc. * | | |
AquaBounty Technologies, Inc. * | | |
Aquestive Therapeutics, Inc. * | | |
Arbutus Biopharma Corp. * | | |
| | |
| | |
Arcturus Therapeutics Holdings, Inc. * | | |
Arcus Biosciences, Inc. * | | |
Arcutis Biotherapeutics, Inc. * | | |
| | |
Arrowhead Pharmaceuticals, Inc. * | | |
ARS Pharmaceuticals, Inc. *(a) | | |
| | |
Assembly Biosciences, Inc. * | | |
Assertio Holdings, Inc. * | | |
Astria Therapeutics, Inc. * | | |
Atara Biotherapeutics, Inc. * | | |
Atea Pharmaceuticals, Inc. * | | |
Atossa Therapeutics, Inc. * | | |
| | |
| | |
| | |
| | |
| | |
Avidity Biosciences, Inc. * | | |
| | |
| | |
| | |
Axsome Therapeutics, Inc. * | | |
| | |
Beam Therapeutics, Inc. * | | |
| | |
BioCryst Pharmaceuticals, Inc. * | | |
| | |
| | |
| | |
BioLife Solutions, Inc. * | | |
BioMarin Pharmaceutical, Inc. * | | |
| | |
Bionano Genomics, Inc. *(a) | | |
Biora Therapeutics, Inc. * | | |
Bio-Rad Laboratories, Inc., Class A * | | |
| | |
| | |
BioVie, Inc., Class A *(a) | | |
Black Diamond Therapeutics, Inc. * | | |
| | |
Blueprint Medicines Corp. * | | |
Bolt Biotherapeutics, Inc. * | | |
BrainStorm Cell Therapeutics, Inc. * | | |
| | |
| | |
| | |
| | |
| | |
| | |
Capricor Therapeutics, Inc. * | | |
Cara Therapeutics, Inc. * | | |
| | |
| | |
Caribou Biosciences, Inc. * | | |
Carisma Therapeutics, Inc. (a) | | |
Cassava Sciences, Inc. *(a) | | |
| | |
Catalyst Pharmaceuticals, Inc. * | | |
| | |
Celldex Therapeutics, Inc. * | | |
| | |
Cerevel Therapeutics Holdings, Inc. * | | |
Champions Oncology, Inc. * | | |
Charles River Laboratories International, Inc. * | | |
| | |
| | |
Cidara Therapeutics, Inc. * | | |
Citius Pharmaceuticals, Inc. * | | |
Clearside Biomedical, Inc. * | | |
| | |
Cogent Biosciences, Inc. * | | |
Cognition Therapeutics, Inc. * | | |
Coherus Biosciences, Inc. * | | |
Collegium Pharmaceutical, Inc. * | | |
Compass Therapeutics, Inc. * | | |
Corbus Pharmaceuticals Holdings, Inc. * | | |
Corcept Therapeutics, Inc. * | | |
| | |
Corvus Pharmaceuticals, Inc. * | | |
Crinetics Pharmaceuticals, Inc. * | | |
CRISPR Therapeutics AG *(b) | | |
| | |
| | |
Cullinan Oncology, Inc. * | | |
| | |
Cymabay Therapeutics, Inc. * | | |
Cyteir Therapeutics, Inc. * | | |
Cytek Biosciences, Inc. * | | |
| | |
CytomX Therapeutics, Inc. * | | |
| | |
| | |
Day One Biopharmaceuticals, Inc. * | | |
96
Schwab Equity Index Funds | Annual Report
Schwab Total Stock Market Index Fund
Portfolio Holdings as of October 31, 2023 (continued)
| | |
Deciphera Pharmaceuticals, Inc. * | | |
Denali Therapeutics, Inc. * | | |
| | |
DiaMedica Therapeutics, Inc. * | | |
Dianthus Therapeutics, Inc. * | | |
| | |
| | |
Dyadic International, Inc. * | | |
Dynavax Technologies Corp. * | | |
Dyne Therapeutics, Inc. * | | |
Eagle Pharmaceuticals, Inc. * | | |
Edgewise Therapeutics, Inc. * | | |
| | |
Eiger BioPharmaceuticals, Inc. * | | |
Elanco Animal Health, Inc. * | | |
Eledon Pharmaceuticals, Inc. * | | |
| | |
Elicio Operating Co., Inc. * | | |
Enanta Pharmaceuticals, Inc. * | | |
Enliven Therapeutics, Inc. *(a) | | |
Entrada Therapeutics, Inc. * | | |
| | |
| | |
Esperion Therapeutics, Inc. * | | |
Eton Pharmaceuticals, Inc. * | | |
| | |
| | |
| | |
| | |
EyePoint Pharmaceuticals, Inc. * | | |
Foghorn Therapeutics, Inc. * | | |
| | |
Frequency Therapeutics, Inc. * | | |
Fulcrum Therapeutics, Inc. * | | |
| | |
Gain Therapeutics, Inc. * | | |
Galectin Therapeutics, Inc. * | | |
| | |
| | |
| | |
| | |
| | |
| | |
| | |
| | |
| | |
Greenwich Lifesciences, Inc. * | | |
Halozyme Therapeutics, Inc. * | | |
Harmony Biosciences Holdings, Inc. * | | |
| | |
Harvard Bioscience, Inc. * | | |
Heron Therapeutics, Inc. * | | |
| | |
Homology Medicines, Inc. * | | |
| | |
| | |
| | |
Ideaya Biosciences, Inc. * | | |
| | |
| | |
| | |
Immuneering Corp., Class A *(a) | | |
| | |
| | |
| | |
| | |
| | |
| | |
| | |
| | |
| | |
| | |
| | |
Inovio Pharmaceuticals, Inc. * | | |
| | |
| | |
| | |
Intellia Therapeutics, Inc. * | | |
Intercept Pharmaceuticals, Inc. * | | |
Intra-Cellular Therapies, Inc. * | | |
| | |
Ionis Pharmaceuticals, Inc. * | | |
Iovance Biotherapeutics, Inc. * | | |
| | |
Ironwood Pharmaceuticals, Inc., Class A * | | |
iTeos Therapeutics, Inc. * | | |
Janux Therapeutics, Inc. * | | |
Jasper Therapeutics, Inc. * | | |
Jazz Pharmaceuticals PLC * | | |
| | |
KalVista Pharmaceuticals, Inc. * | | |
Karuna Therapeutics, Inc. * | | |
Keros Therapeutics, Inc. * | | |
Kezar Life Sciences, Inc. * | | |
| | |
Kiniksa Pharmaceuticals Ltd., Class A * | | |
Kinnate Biopharma, Inc. * | | |
| | |
| | |
| | |
| | |
Kymera Therapeutics, Inc. * | | |
| | |
Larimar Therapeutics, Inc. * | | |
Lexicon Pharmaceuticals, Inc. * | | |
Ligand Pharmaceuticals, Inc. * | | |
Lineage Cell Therapeutics, Inc. * | | |
| | |
| | |
Longboard Pharmaceuticals, Inc. * | | |
Lyell Immunopharma, Inc. * | | |
Lyra Therapeutics, Inc. * | | |
| | |
Madrigal Pharmaceuticals, Inc. * | | |
| | |
Maravai LifeSciences Holdings, Inc., Class A * | | |
Marinus Pharmaceuticals, Inc. * | | |
| | |
| | |
| | |
| | |
| | |
Merrimack Pharmaceuticals, Inc. * | | |
Mersana Therapeutics, Inc. * | | |
| | |
Mettler-Toledo International, Inc. * | | |
| | |
Mind Medicine MindMed, Inc. * | | |
Mineralys Therapeutics, Inc. * | | |
MiNK Therapeutics, Inc. * | | |
Mirati Therapeutics, Inc. * | | |
Miromatrix Medical, Inc. * | | |
Mirum Pharmaceuticals, Inc. * | | |
| | |
Schwab Equity Index Funds | Annual Report97
Schwab Total Stock Market Index Fund
Portfolio Holdings as of October 31, 2023 (continued)
| | |
Moleculin Biotech, Inc. * | | |
Monte Rosa Therapeutics, Inc. * | | |
| | |
| | |
| | |
| | |
Nautilus Biotechnology, Inc. * | | |
Nektar Therapeutics, Class A * | | |
Neurocrine Biosciences, Inc. * | | |
| | |
| | |
NRX Pharmaceuticals, Inc. * | | |
Nurix Therapeutics, Inc. * | | |
Nuvalent, Inc., Class A * | | |
Nuvectis Pharma, Inc. *(a) | | |
Ocean Biomedical, Inc. *(a) | | |
| | |
Ocular Therapeutix, Inc. * | | |
| | |
Olema Pharmaceuticals, Inc. * | | |
Omega Therapeutics, Inc. * | | |
| | |
| | |
Oncternal Therapeutics, Inc. * | | |
| | |
| | |
Organogenesis Holdings, Inc., Class A * | | |
| | |
ORIC Pharmaceuticals, Inc. * | | |
Ovid therapeutics, Inc. * | | |
Pacific Biosciences of California, Inc. * | | |
Pacira BioSciences, Inc. * | | |
Palatin Technologies, Inc. * | | |
| | |
PDS Biotechnology Corp. *(a) | | |
| | |
| | |
| | |
Perspective Therapeutics, Inc. * | | |
| | |
PharmaCyte Biotech, Inc. * | | |
Phathom Pharmaceuticals, Inc. * | | |
Phibro Animal Health Corp., Class A | | |
Pliant Therapeutics, Inc. * | | |
PMV Pharmaceuticals, Inc. * | | |
Point Biopharma Global, Inc. * | | |
Poseida Therapeutics, Inc., Class A * | | |
Praxis Precision Medicines, Inc. * | | |
| | |
Prelude Therapeutics, Inc. * | | |
Prestige Consumer Healthcare, Inc. * | | |
Prime Medicine, Inc. *(a) | | |
| | |
| | |
Protagonist Therapeutics, Inc. * | | |
| | |
| | |
Puma Biotechnology, Inc. * | | |
| | |
| | |
| | |
Quince Therapeutics, Inc. * | | |
| | |
Rani Therapeutics Holdings, Inc., Class A * | | |
Rapid Micro Biosystems, Inc., Class A * | | |
| | |
RAPT Therapeutics, Inc. * | | |
Recursion Pharmaceuticals, Inc., Class A * | | |
Regeneron Pharmaceuticals, Inc. * | | |
| | |
Regulus Therapeutics, Inc. * | | |
Relay Therapeutics, Inc. * | | |
Relmada Therapeutics, Inc. * | | |
Reneo Pharmaceuticals, Inc. * | | |
| | |
| | |
| | |
Revance Therapeutics, Inc. * | | |
Reviva Pharmaceuticals Holdings, Inc. *(a) | | |
REVOLUTION Medicines, Inc. * | | |
| | |
| | |
Rhythm Pharmaceuticals, Inc. * | | |
Rigel Pharmaceuticals, Inc. * | | |
Rocket Pharmaceuticals, Inc. * | | |
| | |
Royalty Pharma PLC, Class A | | |
SAB Biotherapeutics, Inc. * | | |
Sage Therapeutics, Inc. * | | |
Sana Biotechnology, Inc. * | | |
Sangamo Therapeutics, Inc. * | | |
Sarepta Therapeutics, Inc. * | | |
| | |
Scholar Rock Holding Corp. * | | |
| | |
scPharmaceuticals, Inc. * | | |
| | |
| | |
Seelos Therapeutics, Inc. * | | |
| | |
Selecta Biosciences, Inc. * | | |
SELLAS Life Sciences Group, Inc. * | | |
Sera Prognostics, Inc., Class A * | | |
Seres Therapeutics, Inc. * | | |
| | |
| | |
| | |
Solid Biosciences, Inc. * | | |
| | |
| | |
Spero Therapeutics, Inc. * | | |
SpringWorks Therapeutics, Inc. * | | |
Spruce Biosciences, Inc. * | | |
Standard BioTools, Inc. * | | |
Stoke Therapeutics, Inc. * | | |
Summit Therapeutics, Inc. *(a) | | |
Supernus Pharmaceuticals, Inc. * | | |
| | |
Syndax Pharmaceuticals, Inc. * | | |
| | |
Syros Pharmaceuticals, Inc. * | | |
Tango Therapeutics, Inc. * | | |
Tarsus Pharmaceuticals, Inc. * | | |
Taysha Gene Therapies, Inc. * | | |
Tenaya Therapeutics, Inc. * | | |
Terns Pharmaceuticals, Inc. * | | |
| | |
| | |
Theravance Biopharma, Inc. * | | |
Theriva Biologics, Inc. * | | |
Thermo Fisher Scientific, Inc. | | |
Theseus Pharmaceuticals, Inc. *(a) | | |
98
Schwab Equity Index Funds | Annual Report
Schwab Total Stock Market Index Fund
Portfolio Holdings as of October 31, 2023 (continued)
| | |
Third Harmonic Bio, Inc. * | | |
| | |
Travere Therapeutics, Inc. * | | |
Trevi Therapeutics, Inc. * | | |
| | |
| | |
Ultragenyx Pharmaceutical, Inc. * | | |
| | |
United Therapeutics Corp. * | | |
UNITY Biotechnology, Inc. * | | |
Vanda Pharmaceuticals, Inc. * | | |
| | |
| | |
Vaxxinity, Inc., Class A *(a) | | |
Ventyx Biosciences, Inc. * | | |
Vera Therapeutics, Inc., Class A * | | |
| | |
| | |
| | |
Verrica Pharmaceuticals, Inc. *(a) | | |
Vertex Pharmaceuticals, Inc. * | | |
Verve Therapeutics, Inc. * | | |
| | |
Vigil Neuroscience, Inc. * | | |
Viking Therapeutics, Inc. * | | |
Vir Biotechnology, Inc. * | | |
Viracta Therapeutics, Inc. * | | |
Viridian Therapeutics, Inc. * | | |
| | |
Voyager Therapeutics, Inc. * | | |
| | |
WaVe Life Sciences Ltd. * | | |
Werewolf Therapeutics, Inc. * | | |
West Pharmaceutical Services, Inc. | | |
X4 Pharmaceuticals, Inc. * | | |
| | |
| | |
Xeris Biopharma Holdings, Inc. * | | |
Xilio Therapeutics, Inc. * | | |
| | |
Y-mAbs Therapeutics, Inc. * | | |
Zentalis Pharmaceuticals, Inc. * | | |
Zevra Therapeutics, Inc. * | | |
| | |
Zura Bio Ltd., Class A *(a) | | |
| | |
|
Real Estate Management & Development 0.2% |
Altisource Portfolio Solutions SA * | | |
| | |
Anywhere Real Estate, Inc. * | | |
CBRE Group, Inc., Class A * | | |
| | |
| | |
Cushman & Wakefield PLC * | | |
DigitalBridge Group, Inc. | | |
| | |
| | |
| | |
| | |
| | |
| | |
Howard Hughes Holdings, Inc. * | | |
| | |
Jones Lang LaSalle, Inc. * | | |
Kennedy-Wilson Holdings, Inc. | | |
| | |
| | |
Maui Land & Pineapple Co., Inc. * | | |
Newmark Group, Inc., Class A | | |
Offerpad Solutions, Inc. * | | |
Opendoor Technologies, Inc. * | | |
Rafael Holdings, Inc., Class B * | | |
RE/MAX Holdings, Inc., Class A | | |
| | |
| | |
Seritage Growth Properties, Class A * | | |
| | |
Stratus Properties, Inc. * | | |
| | |
WeWork, Inc., Class A *(a) | | |
Zillow Group, Inc., Class C * | | |
| | |
|
Semiconductors & Semiconductor Equipment 6.5% |
ACM Research, Inc., Class A * | | |
Advanced Micro Devices, Inc. * | | |
| | |
Allegro MicroSystems, Inc. * | | |
Alpha & Omega Semiconductor Ltd. * | | |
| | |
| | |
| | |
| | |
| | |
| | |
Axcelis Technologies, Inc. * | | |
| | |
| | |
| | |
| | |
| | |
Credo Technology Group Holding Ltd. * | | |
| | |
| | |
| | |
| | |
Everspin Technologies, Inc. * | | |
| | |
| | |
| | |
| | |
| | |
indie Semiconductor, Inc., Class A * | | |
| | |
| | |
| | |
| | |
Kulicke & Soffa Industries, Inc. | | |
| | |
Lattice Semiconductor Corp. * | | |
MACOM Technology Solutions Holdings, Inc. * | | |
| | |
| | |
| | |
Microchip Technology, Inc. | | |
| | |
| | |
Monolithic Power Systems, Inc. | | |
Navitas Semiconductor Corp., Class A * | | |
| | |
| | |
Schwab Equity Index Funds | Annual Report99
Schwab Total Stock Market Index Fund
Portfolio Holdings as of October 31, 2023 (continued)
| | |
| | |
| | |
| | |
| | |
| | |
| | |
| | |
| | |
| | |
| | |
| | |
Rigetti Computing, Inc. * | | |
| | |
Silicon Laboratories, Inc. * | | |
| | |
SkyWater Technology, Inc. * | | |
| | |
SMART Global Holdings, Inc. * | | |
SolarEdge Technologies, Inc. * | | |
| | |
| | |
| | |
| | |
Trio-Tech International * | | |
Ultra Clean Holdings, Inc. * | | |
| | |
Veeco Instruments, Inc. * | | |
| | |
| | |
|
Software & Services 12.0% |
| | |
| | |
| | |
| | |
| | |
| | |
| | |
Akamai Technologies, Inc. * | | |
Alarm.com Holdings, Inc. * | | |
Alkami Technology, Inc. * | | |
Altair Engineering, Inc., Class A * | | |
| | |
American Software, Inc., Class A | | |
Amplitude, Inc., Class A * | | |
| | |
Appfolio, Inc., Class A * | | |
| | |
| | |
AppLovin Corp., Class A * | | |
| | |
| | |
| | |
Atlassian Corp., Class A * | | |
| | |
Aurora Innovation, Inc. * | | |
| | |
| | |
Backblaze, Inc., Class A * | | |
Bentley Systems, Inc., Class B | | |
BigCommerce Holdings, Inc. * | | |
| | |
| | |
| | |
Blend Labs, Inc., Class A * | | |
| | |
| | |
| | |
| | |
C3.ai, Inc., Class A *(a) | | |
Cadence Design Systems, Inc. * | | |
| | |
CCC Intelligent Solutions Holdings, Inc. * | | |
| | |
| | |
| | |
Clear Secure, Inc., Class A | | |
Clearwater Analytics Holdings, Inc., Class A * | | |
Cloudflare, Inc., Class A * | | |
Cognizant Technology Solutions Corp., Class A | | |
CommVault Systems, Inc. * | | |
Computer Task Group, Inc. * | | |
Confluent, Inc., Class A * | | |
Consensus Cloud Solutions, Inc. * | | |
| | |
| | |
Crowdstrike Holdings, Inc., Class A * | | |
| | |
| | |
| | |
| | |
| | |
DecisionPoint Systems, Inc. * | | |
| | |
| | |
DigitalOcean Holdings, Inc. * | | |
DocuSign, Inc., Class A * | | |
Dolby Laboratories, Inc., Class A | | |
| | |
DoubleVerify Holdings, Inc. * | | |
| | |
| | |
| | |
| | |
E2open Parent Holdings, Inc. * | | |
| | |
| | |
| | |
| | |
Enfusion, Inc., Class A * | | |
| | |
| | |
| | |
| | |
| | |
Expensify, Inc., Class A * | | |
| | |
| | |
| | |
| | |
Freshworks, Inc., Class A * | | |
| | |
| | |
| | |
| | |
| | |
Grid Dynamics Holdings, Inc. * | | |
Guidewire Software, Inc. * | | |
| | |
HashiCorp, Inc., Class A * | | |
| | |
Informatica, Inc., Class A * | | |
Information Services Group, Inc. | | |
100
Schwab Equity Index Funds | Annual Report
Schwab Total Stock Market Index Fund
Portfolio Holdings as of October 31, 2023 (continued)
| | |
Instructure Holdings, Inc. * | | |
| | |
| | |
| | |
International Business Machines Corp. | | |
| | |
| | |
| | |
| | |
| | |
| | |
LiveRamp Holdings, Inc. * | | |
| | |
Manhattan Associates, Inc. * | | |
Marathon Digital Holdings, Inc. *(a) | | |
| | |
| | |
| | |
| | |
MicroStrategy, Inc., Class A * | | |
| | |
| | |
| | |
| | |
| | |
| | |
| | |
| | |
| | |
| | |
| | |
| | |
| | |
| | |
| | |
| | |
Palantir Technologies, Inc., Class A * | | |
Palo Alto Networks, Inc. * | | |
Park City Group, Inc. (a) | | |
| | |
| | |
| | |
PowerSchool Holdings, Inc., Class A * | | |
Procore Technologies, Inc. * | | |
| | |
| | |
| | |
| | |
| | |
Quantum Computing, Inc. *(a) | | |
Rackspace Technology, Inc. * | | |
| | |
| | |
| | |
Research Solutions, Inc. * | | |
| | |
RingCentral, Inc., Class A * | | |
| | |
| | |
| | |
| | |
SecureWorks Corp., Class A * | | |
SEMrush Holdings, Inc., Class A * | | |
SentinelOne, Inc., Class A * | | |
| | |
Smartsheet, Inc., Class A * | | |
Smith Micro Software, Inc. * | | |
| | |
Snowflake, Inc., Class A * | | |
| | |
SoundHound AI, Inc., Class A *(a) | | |
| | |
| | |
Sprinklr, Inc., Class A * | | |
Sprout Social, Inc., Class A * | | |
| | |
Squarespace, Inc., Class A * | | |
| | |
Synchronoss Technologies, Inc. * | | |
| | |
| | |
| | |
| | |
| | |
Thoughtworks Holding, Inc. * | | |
| | |
| | |
Tyler Technologies, Inc. * | | |
| | |
| | |
| | |
Varonis Systems, Inc., Class B * | | |
| | |
| | |
| | |
Viant Technology, Inc., Class A * | | |
| | |
Weave Communications, Inc. * | | |
| | |
| | |
| | |
| | |
| | |
Zeta Global Holdings Corp., Class A * | | |
Zoom Video Communications, Inc., Class A * | | |
| | |
| | |
| | |
|
Technology Hardware & Equipment 8.1% |
| | |
| | |
Advanced Energy Industries, Inc. | | |
| | |
| | |
Akoustis Technologies, Inc. * | | |
| | |
| | |
Applied Optoelectronics, Inc. * | | |
| | |
Arlo Technologies, Inc. * | | |
Arrow Electronics, Inc. * | | |
| | |
| | |
| | |
| | |
| | |
| | |
| | |
| | |
Benchmark Electronics, Inc. | | |
Boxlight Corp., Class A * | | |
| | |
| | |
Schwab Equity Index Funds | Annual Report101
Schwab Total Stock Market Index Fund
Portfolio Holdings as of October 31, 2023 (continued)
| | |
| | |
| | |
| | |
| | |
ClearSign Technologies Corp. * | | |
Climb Global Solutions, Inc. | | |
Coda Octopus Group, Inc. * | | |
| | |
| | |
CommScope Holding Co., Inc. * | | |
| | |
Comtech Telecommunications Corp. | | |
| | |
| | |
| | |
| | |
| | |
| | |
Dell Technologies, Inc., Class C | | |
Digi International, Inc. * | | |
| | |
| | |
Evolv Technologies Holdings, Inc. * | | |
| | |
| | |
| | |
FARO Technologies, Inc. * | | |
Focus Universal, Inc. *(a) | | |
Frequency Electronics, Inc. | | |
| | |
| | |
Hewlett Packard Enterprise Co. | | |
| | |
| | |
| | |
| | |
| | |
Insight Enterprises, Inc. * | | |
| | |
| | |
| | |
| | |
| | |
| | |
| | |
| | |
Keysight Technologies, Inc. * | | |
Kimball Electronics, Inc. * | | |
| | |
| | |
| | |
LightPath Technologies, Inc., Class A * | | |
Lightwave Logic, Inc. *(a) | | |
| | |
Lumentum Holdings, Inc. * | | |
| | |
Methode Electronics, Inc. | | |
| | |
Mirion Technologies, Inc., Class A * | | |
| | |
| | |
| | |
Napco Security Technologies, Inc. | | |
| | |
| | |
| | |
| | |
| | |
| | |
| | |
| | |
| | |
| | |
| | |
| | |
| | |
| | |
| | |
Presto Automation, Inc. * | | |
Pure Storage, Inc., Class A * | | |
| | |
| | |
Research Frontiers, Inc. * | | |
| | |
Ribbon Communications, Inc. * | | |
Richardson Electronics Ltd. | | |
| | |
| | |
| | |
Seagate Technology Holdings PLC | | |
| | |
| | |
Super Micro Computer, Inc. * | | |
| | |
| | |
Teledyne Technologies, Inc. * | | |
TransAct Technologies, Inc. * | | |
| | |
| | |
| | |
| | |
| | |
| | |
Vishay Intertechnology, Inc. | | |
Vishay Precision Group, Inc. * | | |
| | |
| | |
| | |
Wrap Technologies, Inc. *(a) | | |
| | |
Zebra Technologies Corp., Class A * | | |
| | |
|
Telecommunication Services 0.9% |
| | |
AST SpaceMobile, Inc., Class A *(a) | | |
| | |
| | |
Bandwidth, Inc., Class A * | | |
Cogent Communications Holdings, Inc. | | |
Consolidated Communications Holdings, Inc. * | | |
EchoStar Corp., Class A * | | |
Frontier Communications Parent, Inc. * | | |
| | |
| | |
| | |
| | |
Iridium Communications, Inc. | | |
Liberty Global PLC, Class C * | | |
Liberty Latin America Ltd., Class C * | | |
Lumen Technologies, Inc. * | | |
NII Holdings, Inc. Escrow *(b) | | |
| | |
102
Schwab Equity Index Funds | Annual Report
Schwab Total Stock Market Index Fund
Portfolio Holdings as of October 31, 2023 (continued)
| | |
Shenandoah Telecommunications Co. | | |
| | |
| | |
Telephone & Data Systems, Inc. | | |
| | |
| | |
| | |
Verizon Communications, Inc. | | |
| | |
|
|
Air Transport Services Group, Inc. * | | |
| | |
| | |
American Airlines Group, Inc. * | | |
| | |
Avis Budget Group, Inc. * | | |
Blade Air Mobility, Inc. * | | |
CH Robinson Worldwide, Inc. | | |
Covenant Logistics Group, Inc., Class A | | |
| | |
| | |
| | |
Eagle Bulk Shipping, Inc. (a) | | |
Expeditors International of Washington, Inc. | | |
| | |
| | |
Frontier Group Holdings, Inc. * | | |
FTAI Infrastructure, Inc. | | |
Genco Shipping & Trading Ltd. | | |
| | |
Hawaiian Holdings, Inc. * | | |
| | |
Hertz Global Holdings, Inc. * | | |
Hub Group, Inc., Class A * | | |
JB Hunt Transport Services, Inc. | | |
| | |
| | |
| | |
Knight-Swift Transportation Holdings, Inc. | | |
| | |
| | |
| | |
| | |
| | |
| | |
Old Dominion Freight Line, Inc. | | |
PAM Transportation Services, Inc. * | | |
Pangaea Logistics Solutions Ltd. | | |
Radiant Logistics, Inc. * | | |
| | |
| | |
| | |
Schneider National, Inc., Class B | | |
| | |
| | |
| | |
Sun Country Airlines Holdings, Inc. * | | |
Surf Air Mobility, Inc. * | | |
TuSimple Holdings, Inc., Class A * | | |
Uber Technologies, Inc. * | | |
| | |
U-Haul Holding Co. - Non Voting | | |
| | |
| | |
United Airlines Holdings, Inc. * | | |
United Parcel Service, Inc., Class B | | |
Universal Logistics Holdings, Inc. | | |
| | |
| | |
| | |
|
|
| | |
| | |
| | |
Altus Power, Inc., Class A * | | |
| | |
American Electric Power Co., Inc. | | |
American States Water Co. | | |
American Water Works Co., Inc. | | |
Artesian Resources Corp., Class A | | |
| | |
| | |
| | |
| | |
| | |
California Water Service Group | | |
| | |
Chesapeake Utilities Corp. | | |
Clearway Energy, Inc., Class C | | |
| | |
Consolidated Edison, Inc. | | |
Consolidated Water Co. Ltd. | | |
Constellation Energy Corp. | | |
| | |
| | |
| | |
| | |
| | |
Essential Utilities, Inc. | | |
| | |
| | |
| | |
| | |
Genie Energy Ltd., Class B | | |
Global Water Resources, Inc. | | |
Hawaiian Electric Industries, Inc. | | |
| | |
| | |
| | |
Montauk Renewables, Inc. * | | |
| | |
New Jersey Resources Corp. | | |
| | |
| | |
Northwest Natural Holding Co. | | |
Northwestern Energy Group, Inc. | | |
| | |
| | |
| | |
| | |
| | |
| | |
Pinnacle West Capital Corp. | | |
| | |
Portland General Electric Co. | | |
| | |
Public Service Enterprise Group, Inc. | | |
| | |
| | |
| | |
Schwab Equity Index Funds | Annual Report103
Schwab Total Stock Market Index Fund
Portfolio Holdings as of October 31, 2023 (continued)
| | |
| | |
| | |
Southwest Gas Holdings, Inc. | | |
| | |
Spruce Power Holding Corp. * | | |
Sunnova Energy International, Inc. *(a) | | |
| | |
| | |
Via Renewables, Inc., Class A | | |
| | |
| | |
| | |
| | |
| | |
Total Common Stocks
(Cost $9,941,574,595) | |
|
RIGHTS 0.0% OF NET ASSETS |
|
Consumer Discretionary Distribution & Retail 0.0% |
Lazydays Holdings, Inc. expires 11/14/23 strike USD 6.40 *(a)(b) | | |
|
Pharmaceuticals, Biotechnology & Life Sciences 0.0% |
Aduro Biotech, Inc. CVR *(b) | | |
F-star Therapeutics, Inc. Agonist CVR *(b) | | |
F-star Therapeutics, Inc. Antagonist CVR *(b) | | |
| | |
Magenta Therapeutics, Inc. CVR *(b) | | |
Pardes Biosciences, Inc. CVR *(b) | | |
Satsuma Pharmaceuticals, Inc. CVR *(b) | | |
| | |
Surface Oncology, Inc. CVR *(b) | | |
Zynerba Pharmaceuticals, Inc. CVR *(b) | | |
| | |
Total Rights
(Cost $15,683) | |
| | |
SHORT-TERM INVESTMENTS 0.2% OF NET ASSETS |
|
|
State Street Institutional U.S. Government Money Market Fund, Premier Class 5.30% (d)(e) | | |
Total Short-Term Investments
(Cost $25,205,384) | |
Total Investments in Securities
(Cost $9,966,795,662) | |
| | | CURRENT VALUE/
UNREALIZED
DEPRECIATION
($) |
|
| | | |
Russell 2000 Index, e-mini, expires 12/15/23 | | | |
S&P 500 Index, e-mini, expires 12/15/23 | | | |
| | | |
| Non-income producing security. |
| All or a portion of this security is on loan. Securities on loan were valued at $24,469,112. |
| Fair valued using significant unobservable inputs (see financial note 2(a), Securities for which no quoted value is available, for additional information). |
| Issuer is affiliated with the fund’s investment adviser. |
| The rate shown is the annualized 7-day yield. |
| Security purchased with cash collateral received for securities on loan. |
| |
| Real Estate Investment Trust |
| |
Below is a summary of the fund’s transactions with affiliated issuers during the period ended October 31, 2023:
| | | | | NET CHANGE IN UNREALIZED APPRECIATION (DEPRECIATION) | | BALANCE OF SHARES HELD AT 10/31/23 | |
COMMON STOCKS 0.2% OF NET ASSETS |
|
|
| | | | | | | | |
104
Schwab Equity Index Funds | Annual Report
Schwab Total Stock Market Index Fund
Portfolio Holdings as of October 31, 2023 (continued)
The following is a summary of the inputs used to value the fund’s investments as of October 31, 2023 (see financial note 2(a) for additional information):
| QUOTED PRICES IN
ACTIVE MARKETS FOR
IDENTICAL ASSETS
(LEVEL 1) | OTHER SIGNIFICANT
OBSERVABLE INPUTS
(LEVEL 2) | SIGNIFICANT
UNOBSERVABLE INPUTS
(LEVEL 3) | |
| | | | |
| | | | |
Equity Real Estate Investment Trusts (REITs) | | | | |
Health Care Equipment & Services | | | | |
Pharmaceuticals, Biotechnology & Life Sciences | | | | |
| | | | |
Telecommunication Services | | | | |
| | | | |
Consumer Discretionary Distribution & Retail | | | | |
Pharmaceuticals, Biotechnology & Life Sciences | | | | |
| | | | |
| | | | |
| | | | |
| | | | |
| Level 3 amount shown includes securities determined to have no value at October 31, 2023. |
| As categorized in the Portfolio Holdings. |
| Futures contracts are reported at cumulative unrealized appreciation or depreciation. |
Schwab Equity Index Funds | Annual Report105
Schwab Total Stock Market Index Fund
Statement of Assets and Liabilities
As of October 31, 2023
|
Investments in securities, at value - affiliated (cost $24,261,759) | | |
Investments in securities, at value - unaffiliated (cost $9,942,533,903) including securities on loan of $24,469,112 | | |
| | |
Deposit with broker for futures contracts | | |
| | |
| | |
| | |
Variation margin on future contracts | | |
Income from securities on loan | | |
| | |
|
|
Collateral held for securities on loan | | |
| | |
| | |
| | |
| | |
| | |
|
|
Capital received from investors | | |
Total distributable earnings | | |
| | |
106
Schwab Equity Index Funds | Annual Report
Schwab Total Stock Market Index Fund
Statement of Operations
For the period November 1, 2022 through October 31, 2023 |
|
Dividends received from securities - unaffiliated (net of foreign withholding tax of $81,196) | | |
Interest received from securities - unaffiliated | | |
Dividends received from securities - affiliated | | |
| | |
| | |
|
|
| | |
| | |
| | |
| | |
|
REALIZED AND UNREALIZED GAINS (LOSSES) |
Net realized losses on sales of securities - affiliated | | |
Net realized losses on sales of securities - unaffiliated | | |
Net realized gains on futures contracts | | |
| | |
Net change in unrealized appreciation (depreciation) on securities - affiliated | | |
Net change in unrealized appreciation (depreciation) on securities - unaffiliated | | |
Net change in unrealized appreciation (depreciation) on futures contracts | | |
Net change in unrealized appreciation (depreciation) | | |
Net realized and unrealized gains | | |
Increase in net assets resulting from operations | | |
| Proxy fees are non-routine expenses (see financial note 2(e) for additional information). |
Schwab Equity Index Funds | Annual Report107
Schwab Total Stock Market Index Fund
Statement of Changes in Net Assets
For the current and prior report periods
|
| | |
| | | |
| | | |
Net change in unrealized appreciation (depreciation) | | | |
Increase (decrease) in net assets resulting from operations | | | |
|
DISTRIBUTIONS TO SHAREHOLDERS |
| | | |
TRANSACTIONS IN FUND SHARES |
| | |
| | | | | |
| | | | | |
| | | | | |
| | | | | |
Net transactions in fund shares | | | | | |
|
SHARES OUTSTANDING AND NET ASSETS |
| | |
| | | | | |
| | | | | |
Total increase (decrease) | | | | | |
| | | | | |
108
Schwab Equity Index Funds | Annual Report
Schwab U.S. Large-Cap Growth Index Fund
Financial Statements
| | | | | | |
|
Net asset value at beginning of period | | | | | | |
Income (loss) from investment operations: | | | | | | |
Net investment income (loss)1 | | | | | | |
Net realized and unrealized gains (losses) | | | | | | |
Total from investment operations | | | | | | |
| | | | | | |
Distributions from net investment income | | | | | | |
Distributions from net realized gains | | | | | | |
| | | | | | |
Net asset value at end of period | | | | | | |
| | | | | | |
|
Ratios to average net assets: | | | | | | |
| | | | | | |
Net investment income (loss) | | | | | | |
| | | | | | |
Net assets, end of period (x 1,000,000) | | | | | | |
| Calculated based on the average shares outstanding during the period. |
| Ratio includes less than 0.0005% of non-routine proxy expenses. |
| Effective December 20, 2018, the annual operating expense ratio was reduced to 0.035%. The ratio presented for period ended October 31, 2019 is a blended ratio. |
| Portfolio turnover rate excludes in-kind transactions. |
Schwab Equity Index Funds | Annual Report109
Schwab U.S. Large-Cap Growth Index Fund
Portfolio Holdings as of October 31, 2023
This section shows all the securities in the fund’s portfolio and their values as of the report date.
The fund files its complete schedule of portfolio holdings with the U.S. Securities and Exchange Commission (SEC) for the first and third quarters of each fiscal year on Form N-PORT Part F. The fund’s Form N-PORT Part F is available on the SEC’s website at www.sec.gov. You can also obtain this information at no cost on the fund’s website at www.schwabassetmanagement.com/schwabfunds_prospectus, by calling 1-866-414-6349, or by sending an email request to orders@mysummaryprospectus.com. The fund also makes available its complete schedule of portfolio holdings 15 to 20 days after the end of the month on the fund’s website.
| | |
COMMON STOCKS 99.3% OF NET ASSETS |
|
Automobiles & Components 2.7% |
| | |
|
|
First Citizens BancShares, Inc., Class A | | |
NU Holdings Ltd., Class A * | | |
| | |
|
|
| | |
Advanced Drainage Systems, Inc. | | |
| | |
Allison Transmission Holdings, Inc. | | |
Armstrong World Industries, Inc. | | |
| | |
| | |
| | |
| | |
ChargePoint Holdings, Inc. * | | |
| | |
| | |
| | |
| | |
| | |
| | |
| | |
Honeywell International, Inc. | | |
| | |
| | |
Illinois Tool Works, Inc. | | |
Lincoln Electric Holdings, Inc. | | |
| | |
| | |
| | |
| | |
Rockwell Automation, Inc. | | |
SiteOne Landscape Supply, Inc. * | | |
Spirit AeroSystems Holdings, Inc., Class A * | | |
| | |
| | |
| | |
| | |
| | |
| | |
Vertiv Holdings Co., Class A | | |
| | |
WillScot Mobile Mini Holdings Corp. * | | |
| | |
| | |
| | |
|
| | |
Commercial & Professional Services 1.8% |
Automatic Data Processing, Inc. | | |
Booz Allen Hamilton Holding Corp., Class A | | |
Broadridge Financial Solutions, Inc. | | |
Ceridian HCM Holding, Inc. * | | |
| | |
| | |
| | |
| | |
| | |
| | |
| | |
| | |
| | |
| | |
Paylocity Holding Corp. * | | |
| | |
| | |
| | |
Verisk Analytics, Inc., Class A | | |
| | |
| | |
|
Consumer Discretionary Distribution & Retail 9.2% |
| | |
| | |
| | |
Burlington Stores, Inc. * | | |
| | |
| | |
Dick's Sporting Goods, Inc. | | |
| | |
| | |
| | |
Floor & Decor Holdings, Inc., Class A * | | |
| | |
| | |
| | |
Ollie's Bargain Outlet Holdings, Inc. * | | |
O'Reilly Automotive, Inc. * | | |
| | |
| | |
| | |
| | |
| | |
| | |
| | |
Victoria's Secret & Co. * | | |
| | |
| | |
| | |
|
110
Schwab Equity Index Funds | Annual Report
Schwab U.S. Large-Cap Growth Index Fund
Portfolio Holdings as of October 31, 2023 (continued)
| | |
Consumer Durables & Apparel 0.7% |
| | |
| | |
| | |
Lululemon Athletica, Inc. * | | |
| | |
| | |
Peloton Interactive, Inc., Class A * | | |
| | |
Skechers USA, Inc., Class A * | | |
| | |
Tempur Sealy International, Inc. | | |
| | |
| | |
| | |
|
|
| | |
| | |
Bright Horizons Family Solutions, Inc. * | | |
Caesars Entertainment, Inc. * | | |
| | |
Chipotle Mexican Grill, Inc., Class A * | | |
Choice Hotels International, Inc. | | |
| | |
| | |
| | |
DoorDash, Inc., Class A * | | |
DraftKings, Inc., Class A * | | |
| | |
Grand Canyon Education, Inc. * | | |
| | |
Hilton Worldwide Holdings, Inc. | | |
| | |
Marriott International, Inc., Class A | | |
| | |
Norwegian Cruise Line Holdings Ltd. * | | |
Planet Fitness, Inc., Class A * | | |
Royal Caribbean Cruises Ltd. * | | |
Service Corp. International | | |
| | |
Texas Roadhouse, Inc., Class A | | |
| | |
| | |
| | |
| | |
Wyndham Hotels & Resorts, Inc. | | |
| | |
| | |
| | |
|
Consumer Staples Distribution & Retail 1.8% |
Albertsons Cos., Inc., Class A | | |
BJ's Wholesale Club Holdings, Inc. * | | |
Casey's General Stores, Inc. | | |
| | |
| | |
Performance Food Group Co. * | | |
| | |
| | |
| | |
|
| | |
|
| | |
| | |
| | |
| | |
| | |
New Fortress Energy, Inc. | | |
| | |
| | |
| | |
| | |
| | |
|
Equity Real Estate Investment Trusts (REITs) 0.8% |
| | |
| | |
| | |
Equity LifeStyle Properties, Inc. | | |
| | |
Lamar Advertising Co., Class A | | |
| | |
SBA Communications Corp., Class A | | |
Simon Property Group, Inc. | | |
| | |
| | |
| | |
|
|
| | |
Ameriprise Financial, Inc. | | |
Apollo Global Management, Inc. | | |
Ares Management Corp., Class A | | |
| | |
| | |
Blue Owl Capital, Inc., Class A | | |
| | |
Euronet Worldwide, Inc. * | | |
FactSet Research Systems, Inc. | | |
| | |
FleetCor Technologies, Inc. * | | |
Houlihan Lokey, Inc., Class A | | |
Jack Henry & Associates, Inc. | | |
| | |
LPL Financial Holdings, Inc. | | |
MarketAxess Holdings, Inc. | | |
Mastercard, Inc., Class A | | |
| | |
| | |
| | |
| | |
Rocket Cos., Inc., Class A * | | |
| | |
Shift4 Payments, Inc., Class A * | | |
| | |
| | |
| | |
Tradeweb Markets, Inc., Class A | | |
| | |
| | |
| | |
| | |
| | |
| | |
|
Schwab Equity Index Funds | Annual Report111
Schwab U.S. Large-Cap Growth Index Fund
Portfolio Holdings as of October 31, 2023 (continued)
| | |
Food, Beverage & Tobacco 1.7% |
Boston Beer Co., Inc., Class A * | | |
Brown-Forman Corp., Class B | | |
| | |
| | |
Constellation Brands, Inc., Class A | | |
| | |
| | |
Lamb Weston Holdings, Inc. | | |
| | |
| | |
| | |
|
Health Care Equipment & Services 4.3% |
| | |
| | |
| | |
| | |
| | |
| | |
| | |
| | |
| | |
| | |
Doximity, Inc., Class A * | | |
Edwards Lifesciences Corp. * | | |
| | |
| | |
GE HealthCare Technologies, Inc. | | |
Globus Medical, Inc., Class A * | | |
| | |
| | |
IDEXX Laboratories, Inc. * | | |
Inspire Medical Systems, Inc. * | | |
| | |
Intuitive Surgical, Inc. * | | |
| | |
| | |
Molina Healthcare, Inc. * | | |
| | |
| | |
| | |
Shockwave Medical, Inc. * | | |
| | |
Tandem Diabetes Care, Inc. * | | |
| | |
Veeva Systems, Inc., Class A * | | |
| | |
|
Household & Personal Products 0.8% |
Church & Dwight Co., Inc. | | |
| | |
Estee Lauder Cos., Inc., Class A | | |
| | |
| | |
| | |
| | |
|
|
Arch Capital Group Ltd. * | | |
| | |
Brighthouse Financial, Inc. * | | |
| | |
| | |
| | |
Kinsale Capital Group, Inc. | | |
| | |
Marsh & McLennan Cos., Inc. | | |
| | |
| | |
RenaissanceRe Holdings Ltd. | | |
| | |
Ryan Specialty Holdings, Inc., Class A * | | |
| | |
| | |
|
|
Ardagh Metal Packaging SA | | |
| | |
Axalta Coating Systems Ltd. * | | |
| | |
| | |
| | |
Ginkgo Bioworks Holdings, Inc. * | | |
Graphic Packaging Holding Co. | | |
| | |
| | |
| | |
| | |
| | |
| | |
| | |
| | |
| | |
|
Media & Entertainment 11.4% |
Alphabet, Inc., Class A * | | |
Alphabet, Inc., Class C * | | |
| | |
Charter Communications, Inc., Class A * | | |
Liberty Broadband Corp., Class C * | | |
Live Nation Entertainment, Inc. * | | |
| | |
Meta Platforms, Inc., Class A * | | |
| | |
Nexstar Media Group, Inc., Class A | | |
Pinterest, Inc., Class A * | | |
| | |
| | |
| | |
| | |
| | |
Trade Desk, Inc., Class A * | | |
ZoomInfo Technologies, Inc., Class A * | | |
| | |
|
Pharmaceuticals, Biotechnology & Life Sciences 6.7% |
10X Genomics, Inc., Class A * | | |
| | |
Agilent Technologies, Inc. | | |
Alnylam Pharmaceuticals, Inc. * | | |
| | |
Apellis Pharmaceuticals, Inc. * | | |
BioMarin Pharmaceutical, Inc. * | | |
| | |
| | |
| | |
| | |
| | |
| | |
112
Schwab Equity Index Funds | Annual Report
Schwab U.S. Large-Cap Growth Index Fund
Portfolio Holdings as of October 31, 2023 (continued)
| | |
| | |
| | |
Ionis Pharmaceuticals, Inc. * | | |
| | |
Jazz Pharmaceuticals PLC * | | |
Karuna Therapeutics, Inc. * | | |
Maravai LifeSciences Holdings, Inc., Class A * | | |
| | |
| | |
Mettler-Toledo International, Inc. * | | |
| | |
Neurocrine Biosciences, Inc. * | | |
Regeneron Pharmaceuticals, Inc. * | | |
| | |
| | |
Sarepta Therapeutics, Inc. * | | |
| | |
| | |
Thermo Fisher Scientific, Inc. | | |
Ultragenyx Pharmaceutical, Inc. * | | |
Vertex Pharmaceuticals, Inc. * | | |
| | |
West Pharmaceutical Services, Inc. | | |
| | |
| | |
|
Real Estate Management & Development 0.1% |
| | |
|
Semiconductors & Semiconductor Equipment 9.0% |
Advanced Micro Devices, Inc. * | | |
Allegro MicroSystems, Inc. * | | |
| | |
| | |
| | |
| | |
| | |
| | |
Lattice Semiconductor Corp. * | | |
Microchip Technology, Inc. | | |
Monolithic Power Systems, Inc. | | |
| | |
| | |
| | |
| | |
| | |
| | |
|
Software & Services 20.5% |
| | |
| | |
| | |
| | |
AppLovin Corp., Class A * | | |
Atlassian Corp., Class A * | | |
| | |
Bentley Systems, Inc., Class B | | |
Cadence Design Systems, Inc. * | | |
Cloudflare, Inc., Class A * | | |
Confluent, Inc., Class A * | | |
Crowdstrike Holdings, Inc., Class A * | | |
| | |
DocuSign, Inc., Class A * | | |
DoubleVerify Holdings, Inc. * | | |
| | |
| | |
| | |
| | |
| | |
| | |
| | |
| | |
| | |
| | |
| | |
| | |
| | |
HashiCorp, Inc., Class A * | | |
| | |
Informatica, Inc., Class A * | | |
| | |
Manhattan Associates, Inc. * | | |
| | |
| | |
| | |
| | |
| | |
| | |
| | |
Palantir Technologies, Inc., Class A * | | |
Palo Alto Networks, Inc. * | | |
| | |
Procore Technologies, Inc. * | | |
| | |
RingCentral, Inc., Class A * | | |
| | |
SentinelOne, Inc., Class A * | | |
| | |
Smartsheet, Inc., Class A * | | |
Snowflake, Inc., Class A * | | |
| | |
| | |
| | |
| | |
Tyler Technologies, Inc. * | | |
| | |
| | |
| | |
| | |
| | |
| | |
| | |
|
Technology Hardware & Equipment 13.1% |
| | |
| | |
| | |
| | |
| | |
| | |
Keysight Technologies, Inc. * | | |
| | |
| | |
Pure Storage, Inc., Class A * | | |
| | |
| | |
Zebra Technologies Corp., Class A * | | |
| | |
|
Schwab Equity Index Funds | Annual Report113
Schwab U.S. Large-Cap Growth Index Fund
Portfolio Holdings as of October 31, 2023 (continued)
| | |
Telecommunication Services 0.0% |
Iridium Communications, Inc. | | |
|
|
American Airlines Group, Inc. * | | |
Avis Budget Group, Inc. * | | |
CH Robinson Worldwide, Inc. | | |
| | |
| | |
Expeditors International of Washington, Inc. | | |
JB Hunt Transport Services, Inc. | | |
| | |
| | |
Old Dominion Freight Line, Inc. | | |
| | |
Uber Technologies, Inc. * | | |
| | |
U-Haul Holding Co. - Non Voting | | |
| | |
United Parcel Service, Inc., Class B | | |
| | |
|
|
| | |
| | |
| | |
Total Common Stocks
(Cost $1,039,349,985) | |
|
INVESTMENT COMPANIES 0.2% OF NET ASSETS |
|
|
iShares Russell 1000 Growth ETF | | |
Total Investment Companies
(Cost $2,082,758) | |
| | |
SHORT-TERM INVESTMENTS 0.4% OF NET ASSETS |
|
|
State Street Institutional U.S. Government Money Market Fund, Premier Class 5.30% (b) | | |
State Street Institutional U.S. Government Money Market Fund, Premier Class 5.30% (b)(c) | | |
| | |
Total Short-Term Investments
(Cost $5,396,334) | |
Total Investments in Securities
(Cost $1,046,829,077) | |
| | | CURRENT VALUE/
UNREALIZED
DEPRECIATION
($) |
|
| | | |
S&P 500 Index, e-mini, expires 12/15/23 | | | |
| Non-income producing security. |
| All or a portion of this security is on loan. Securities on loan were valued at $22,113. |
| The rate shown is the annualized 7-day yield. |
| Security purchased with cash collateral received for securities on loan. |
| American Depositary Receipt |
| |
Below is a summary of the fund’s transactions with affiliated issuers during the period ended October 31, 2023:
| | | | | NET CHANGE IN UNREALIZED APPRECIATION (DEPRECIATION) | | BALANCE OF SHARES HELD AT 10/31/23 | |
COMMON STOCKS 0.0% OF NET ASSETS |
|
|
| | | | | | | | |
114
Schwab Equity Index Funds | Annual Report
Schwab U.S. Large-Cap Growth Index Fund
Portfolio Holdings as of October 31, 2023 (continued)
The following is a summary of the inputs used to value the fund’s investments as of October 31, 2023 (see financial note 2(a) for additional information):
| QUOTED PRICES IN
ACTIVE MARKETS FOR
IDENTICAL ASSETS
(LEVEL 1) | OTHER SIGNIFICANT
OBSERVABLE INPUTS
(LEVEL 2) | SIGNIFICANT
UNOBSERVABLE INPUTS
(LEVEL 3) | |
| | | | |
| | | | |
| | | | |
| | | | |
| | | | |
| | | | |
| | | | |
| As categorized in the Portfolio Holdings. |
| Futures contracts are reported at cumulative unrealized appreciation or depreciation. |
Schwab Equity Index Funds | Annual Report115
Schwab U.S. Large-Cap Growth Index Fund
Statement of Assets and Liabilities
As of October 31, 2023
|
Investments in securities, at value - unaffiliated (cost $1,046,829,077) including securities on loan of $22,113 | | |
| | |
Deposit with broker for futures contracts | | |
| | |
| | |
| | |
Variation margin on future contracts | | |
Income from securities on loan | | |
| | |
|
|
Collateral held for securities on loan | | |
| | |
| | |
| | |
| | |
| | |
| | |
|
|
Capital received from investors | | |
Total distributable earnings | | |
| | |
116
Schwab Equity Index Funds | Annual Report
Schwab U.S. Large-Cap Growth Index Fund
Statement of Operations
For the period November 1, 2022 through October 31, 2023 |
|
Dividends received from securities - unaffiliated (net of foreign withholding tax of $681) | | |
Dividends received from securities - affiliated | | |
| | |
| | |
|
|
| | |
| | |
| | |
|
REALIZED AND UNREALIZED GAINS (LOSSES) |
Net realized losses on sales of securities - affiliated | | |
Net realized losses on sales of securities - unaffiliated | | |
Net realized gains on sales of in-kind redemptions - unaffiliated | | |
Net realized gains on futures contracts | | |
| | |
Net change in unrealized appreciation (depreciation) on securities - affiliated | | |
Net change in unrealized appreciation (depreciation) on securities - unaffiliated | | |
Net change in unrealized appreciation (depreciation) on futures contracts | | |
Net change in unrealized appreciation (depreciation) | | |
Net realized and unrealized gains | | |
Increase in net assets resulting from operations | | |
Schwab Equity Index Funds | Annual Report117
Schwab U.S. Large-Cap Growth Index Fund
Statement of Changes in Net Assets
For the current and prior report periods
|
| | |
| | | |
| | | |
Net change in unrealized appreciation (depreciation) | | | |
Increase (decrease) in net assets resulting from operations | | | |
|
DISTRIBUTIONS TO SHAREHOLDERS |
| | | |
TRANSACTIONS IN FUND SHARES |
| | |
| | | | | |
| | | | | |
| | | | | |
| | | | | |
Net transactions in fund shares | | | | | |
|
SHARES OUTSTANDING AND NET ASSETS |
| | |
| | | | | |
| | | | | |
| | | | | |
| | | | | |
118
Schwab Equity Index Funds | Annual Report
Schwab U.S. Large-Cap Value Index Fund
Financial Statements
| | | | | | |
|
Net asset value at beginning of period | | | | | | |
Income (loss) from investment operations: | | | | | | |
Net investment income (loss)1 | | | | | | |
Net realized and unrealized gains (losses) | | | | | | |
Total from investment operations | | | | | | |
| | | | | | |
Distributions from net investment income | | | | | | |
Distributions from net realized gains | | | | | | |
| | | | | | |
Net asset value at end of period | | | | | | |
| | | | | | |
|
Ratios to average net assets: | | | | | | |
| | | | | | |
Net investment income (loss) | | | | | | |
| | | | | | |
Net assets, end of period (x 1,000) | | | | | | |
| Calculated based on the average shares outstanding during the period. |
| Ratio includes less than 0.0005% of non-routine proxy expenses. |
| Effective December 20, 2018, the annual operating expense ratio was reduced to 0.035%. The ratio presented for period ended October 31, 2019 is a blended ratio. |
| Portfolio turnover rate excludes in-kind transactions. |
Schwab Equity Index Funds | Annual Report119
Schwab U.S. Large-Cap Value Index Fund
Portfolio Holdings as of October 31, 2023
This section shows all the securities in the fund’s portfolio and their values as of the report date.
The fund files its complete schedule of portfolio holdings with the U.S. Securities and Exchange Commission (SEC) for the first and third quarters of each fiscal year on Form N-PORT Part F. The fund’s Form N-PORT Part F is available on the SEC’s website at www.sec.gov. You can also obtain this information at no cost on the fund’s website at www.schwabassetmanagement.com/schwabfunds_prospectus, by calling 1-866-414-6349, or by sending an email request to orders@mysummaryprospectus.com. The fund also makes available its complete schedule of portfolio holdings 15 to 20 days after the end of the month on the fund’s website.
| | |
COMMON STOCKS 99.3% OF NET ASSETS |
|
Automobiles & Components 0.8% |
| | |
| | |
| | |
| | |
| | |
| | |
| | |
| | |
| | |
QuantumScape Corp., Class A * | | |
Rivian Automotive, Inc., Class A * | | |
| | |
| | |
|
|
| | |
| | |
| | |
| | |
Citizens Financial Group, Inc. | | |
Columbia Banking System, Inc. | | |
| | |
Commerce Bancshares, Inc. | | |
Cullen/Frost Bankers, Inc. | | |
| | |
| | |
First Citizens BancShares, Inc., Class A | | |
| | |
| | |
| | |
Huntington Bancshares, Inc. | | |
| | |
| | |
| | |
New York Community Bancorp, Inc. | | |
NU Holdings Ltd., Class A * | | |
Pinnacle Financial Partners, Inc. | | |
PNC Financial Services Group, Inc. | | |
| | |
Prosperity Bancshares, Inc. | | |
| | |
| | |
| | |
| | |
| | |
| | |
| | |
| | |
| | |
| | |
|
| | |
|
| | |
| | |
| | |
| | |
| | |
| | |
| | |
Allison Transmission Holdings, Inc. | | |
| | |
Armstrong World Industries, Inc. | | |
AZEK Co., Inc., Class A * | | |
| | |
Builders FirstSource, Inc. * | | |
| | |
| | |
| | |
| | |
| | |
Core & Main, Inc., Class A * | | |
| | |
| | |
| | |
| | |
| | |
| | |
| | |
| | |
| | |
| | |
| | |
| | |
| | |
| | |
Fortune Brands Innovations, Inc. | | |
Gates Industrial Corp. PLC * | | |
| | |
| | |
| | |
| | |
| | |
| | |
| | |
Honeywell International, Inc. | | |
| | |
| | |
Huntington Ingalls Industries, Inc. | | |
| | |
Illinois Tool Works, Inc. | | |
| | |
| | |
Johnson Controls International PLC | | |
L3Harris Technologies, Inc. | | |
Lennox International, Inc. | | |
Lincoln Electric Holdings, Inc. | | |
| | |
| | |
120
Schwab Equity Index Funds | Annual Report
Schwab U.S. Large-Cap Value Index Fund
Portfolio Holdings as of October 31, 2023 (continued)
| | |
MDU Resources Group, Inc. | | |
| | |
| | |
MSC Industrial Direct Co., Inc., Class A | | |
| | |
| | |
| | |
| | |
| | |
| | |
| | |
| | |
| | |
| | |
| | |
| | |
| | |
| | |
Sensata Technologies Holding PLC | | |
SiteOne Landscape Supply, Inc. * | | |
| | |
Spirit AeroSystems Holdings, Inc., Class A * | | |
Stanley Black & Decker, Inc. | | |
| | |
| | |
| | |
| | |
| | |
| | |
| | |
Vertiv Holdings Co., Class A | | |
| | |
WESCO International, Inc. | | |
Westinghouse Air Brake Technologies Corp. | | |
WillScot Mobile Mini Holdings Corp. * | | |
| | |
| | |
| | |
|
Commercial & Professional Services 1.2% |
Automatic Data Processing, Inc. | | |
Broadridge Financial Solutions, Inc. | | |
CACI International, Inc., Class A * | | |
Ceridian HCM Holding, Inc. * | | |
| | |
| | |
| | |
| | |
Driven Brands Holdings, Inc. * | | |
Dun & Bradstreet Holdings, Inc. | | |
| | |
| | |
| | |
| | |
| | |
| | |
| | |
| | |
| | |
| | |
Republic Services, Inc., Class A | | |
| | |
Science Applications International Corp. | | |
SS&C Technologies Holdings, Inc. | | |
| | |
| | |
| | |
| | |
| | |
| | |
| | |
| | |
|
Consumer Discretionary Distribution & Retail 1.0% |
| | |
| | |
| | |
| | |
| | |
| | |
Dick's Sporting Goods, Inc. | | |
| | |
| | |
GameStop Corp., Class A *(a) | | |
| | |
| | |
| | |
Lithia Motors, Inc., Class A | | |
| | |
| | |
| | |
| | |
| | |
Ollie's Bargain Outlet Holdings, Inc. * | | |
O'Reilly Automotive, Inc. * | | |
Penske Automotive Group, Inc. | | |
Petco Health & Wellness Co., Inc., Class A * | | |
| | |
| | |
| | |
Victoria's Secret & Co. * | | |
| | |
| | |
| | |
|
Consumer Durables & Apparel 1.4% |
| | |
| | |
| | |
| | |
| | |
| | |
| | |
| | |
| | |
| | |
Mohawk Industries, Inc. * | | |
| | |
| | |
| | |
| | |
| | |
| | |
Ralph Lauren Corp., Class A | | |
Skechers USA, Inc., Class A * | | |
| | |
Tempur Sealy International, Inc. | | |
| | |
| | |
Under Armour, Inc., Class A * | | |
| | |
| | |
| | |
|
Schwab Equity Index Funds | Annual Report121
Schwab U.S. Large-Cap Value Index Fund
Portfolio Holdings as of October 31, 2023 (continued)
| | |
|
| | |
| | |
| | |
Bright Horizons Family Solutions, Inc. * | | |
Caesars Entertainment, Inc. * | | |
| | |
| | |
| | |
DoorDash, Inc., Class A * | | |
| | |
Grand Canyon Education, Inc. * | | |
| | |
Hilton Worldwide Holdings, Inc. | | |
Hyatt Hotels Corp., Class A | | |
| | |
Marriott Vacations Worldwide Corp. | | |
| | |
MGM Resorts International * | | |
| | |
Norwegian Cruise Line Holdings Ltd. * | | |
Penn Entertainment, Inc. * | | |
Planet Fitness, Inc., Class A * | | |
Royal Caribbean Cruises Ltd. * | | |
Service Corp. International | | |
| | |
| | |
Wyndham Hotels & Resorts, Inc. | | |
| | |
| | |
| | |
|
Consumer Staples Distribution & Retail 1.9% |
Albertsons Cos., Inc., Class A | | |
BJ's Wholesale Club Holdings, Inc. * | | |
Casey's General Stores, Inc. | | |
| | |
Grocery Outlet Holding Corp. * | | |
| | |
Performance Food Group Co. * | | |
U.S. Foods Holding Corp. * | | |
Walgreens Boots Alliance, Inc. | | |
| | |
| | |
|
|
| | |
| | |
| | |
Baker Hughes Co., Class A | | |
| | |
| | |
| | |
| | |
| | |
| | |
| | |
| | |
| | |
| | |
| | |
| | |
| | |
| | |
| | |
| | |
| | |
| | |
Occidental Petroleum Corp. | | |
| | |
| | |
| | |
Pioneer Natural Resources Co. | | |
| | |
| | |
Southwestern Energy Co. * | | |
| | |
| | |
| | |
| | |
|
Equity Real Estate Investment Trusts (REITs) 4.3% |
| | |
Alexandria Real Estate Equities, Inc. | | |
American Homes 4 Rent, Class A | | |
Americold Realty Trust, Inc. | | |
Apartment Income REIT Corp. | | |
AvalonBay Communities, Inc. | | |
| | |
Brixmor Property Group, Inc. | | |
| | |
| | |
| | |
| | |
Digital Realty Trust, Inc. | | |
EastGroup Properties, Inc. | | |
| | |
| | |
Equity LifeStyle Properties, Inc. | | |
| | |
Essex Property Trust, Inc. | | |
Extra Space Storage, Inc. | | |
Federal Realty Investment Trust | | |
First Industrial Realty Trust, Inc. | | |
Gaming & Leisure Properties, Inc. | | |
Healthcare Realty Trust, Inc., Class A | | |
Healthpeak Properties, Inc. | | |
Highwoods Properties, Inc. | | |
Host Hotels & Resorts, Inc. | | |
| | |
| | |
| | |
| | |
Lamar Advertising Co., Class A | | |
Medical Properties Trust, Inc. | | |
Mid-America Apartment Communities, Inc. | | |
National Storage Affiliates Trust | | |
| | |
Omega Healthcare Investors, Inc. | | |
Park Hotels & Resorts, Inc. | | |
| | |
| | |
| | |
| | |
| | |
Rexford Industrial Realty, Inc. | | |
SBA Communications Corp., Class A | | |
Simon Property Group, Inc. | | |
Spirit Realty Capital, Inc. | | |
| | |
| | |
| | |
| | |
122
Schwab Equity Index Funds | Annual Report
Schwab U.S. Large-Cap Value Index Fund
Portfolio Holdings as of October 31, 2023 (continued)
| | |
VICI Properties, Inc., Class A | | |
| | |
| | |
| | |
| | |
| | |
|
|
Affiliated Managers Group, Inc. | | |
| | |
| | |
| | |
| | |
Annaly Capital Management, Inc. | | |
Bank of New York Mellon Corp. | | |
Berkshire Hathaway, Inc., Class B * | | |
| | |
| | |
Blue Owl Capital, Inc., Class A | | |
Capital One Financial Corp. | | |
| | |
Cboe Global Markets, Inc. | | |
| | |
| | |
Coinbase Global, Inc., Class A * | | |
Corebridge Financial, Inc. | | |
Credit Acceptance Corp. * | | |
Discover Financial Services | | |
Euronet Worldwide, Inc. * | | |
| | |
Fidelity National Information Services, Inc. | | |
| | |
FleetCor Technologies, Inc. * | | |
| | |
| | |
Goldman Sachs Group, Inc. | | |
Houlihan Lokey, Inc., Class A | | |
Interactive Brokers Group, Inc., Class A | | |
Intercontinental Exchange, Inc. | | |
| | |
Jack Henry & Associates, Inc. | | |
Janus Henderson Group PLC | | |
Jefferies Financial Group, Inc. | | |
| | |
| | |
| | |
| | |
| | |
| | |
| | |
| | |
| | |
| | |
| | |
Raymond James Financial, Inc. | | |
| | |
Robinhood Markets, Inc., Class A * | | |
Rocket Cos., Inc., Class A * | | |
| | |
| | |
| | |
SoFi Technologies, Inc. * | | |
Starwood Property Trust, Inc. | | |
| | |
| | |
| | |
| | |
| | |
| | |
| | |
Tradeweb Markets, Inc., Class A | | |
| | |
Virtu Financial, Inc., Class A | | |
| | |
| | |
| | |
| | |
| | |
|
Food, Beverage & Tobacco 4.4% |
| | |
Archer-Daniels-Midland Co. | | |
Boston Beer Co., Inc., Class A * | | |
Brown-Forman Corp., Class B | | |
| | |
| | |
| | |
| | |
Constellation Brands, Inc., Class A | | |
Darling Ingredients, Inc. * | | |
| | |
| | |
| | |
| | |
| | |
| | |
| | |
| | |
| | |
| | |
Lamb Weston Holdings, Inc. | | |
McCormick & Co., Inc. - Non Voting Shares | | |
Molson Coors Beverage Co., Class B | | |
Mondelez International, Inc., Class A | | |
| | |
Philip Morris International, Inc. | | |
| | |
| | |
| | |
Tyson Foods, Inc., Class A | | |
| | |
| | |
|
Health Care Equipment & Services 6.7% |
| | |
Acadia Healthcare Co., Inc. * | | |
| | |
| | |
Baxter International, Inc. | | |
| | |
Boston Scientific Corp. * | | |
| | |
| | |
| | |
| | |
| | |
| | |
| | |
| | |
Doximity, Inc., Class A * | | |
| | |
| | |
| | |
| | |
Schwab Equity Index Funds | Annual Report123
Schwab U.S. Large-Cap Value Index Fund
Portfolio Holdings as of October 31, 2023 (continued)
| | |
GE HealthCare Technologies, Inc. | | |
Globus Medical, Inc., Class A * | | |
| | |
| | |
| | |
| | |
| | |
Integra LifeSciences Holdings Corp. * | | |
Laboratory Corp. of America Holdings | | |
| | |
| | |
Molina Healthcare, Inc. * | | |
| | |
| | |
| | |
| | |
| | |
| | |
Tandem Diabetes Care, Inc. * | | |
| | |
| | |
| | |
| | |
Universal Health Services, Inc., Class B | | |
Zimmer Biomet Holdings, Inc. | | |
| | |
|
Household & Personal Products 2.2% |
Church & Dwight Co., Inc. | | |
| | |
| | |
Estee Lauder Cos., Inc., Class A | | |
| | |
| | |
| | |
| | |
Reynolds Consumer Products, Inc. | | |
Spectrum Brands Holdings, Inc. | | |
| | |
|
|
| | |
| | |
American Financial Group, Inc. | | |
American International Group, Inc. | | |
| | |
Arch Capital Group Ltd. * | | |
| | |
| | |
| | |
Axis Capital Holdings Ltd. | | |
Brighthouse Financial, Inc. * | | |
| | |
| | |
Cincinnati Financial Corp. | | |
| | |
| | |
Fidelity National Financial, Inc. | | |
First American Financial Corp. | | |
| | |
Hanover Insurance Group, Inc. | | |
Hartford Financial Services Group, Inc. | | |
| | |
| | |
| | |
| | |
| | |
Marsh & McLennan Cos., Inc. | | |
| | |
Old Republic International Corp. | | |
| | |
Principal Financial Group, Inc. | | |
| | |
Prudential Financial, Inc. | | |
Reinsurance Group of America, Inc. | | |
RenaissanceRe Holdings Ltd. | | |
| | |
| | |
| | |
| | |
White Mountains Insurance Group Ltd. | | |
| | |
| | |
|
|
Air Products & Chemicals, Inc. | | |
| | |
| | |
| | |
| | |
Ardagh Metal Packaging SA | | |
| | |
| | |
Axalta Coating Systems Ltd. * | | |
| | |
| | |
| | |
CF Industries Holdings, Inc. | | |
| | |
| | |
| | |
| | |
| | |
| | |
| | |
| | |
| | |
| | |
| | |
| | |
Ginkgo Bioworks Holdings, Inc. *(a) | | |
Graphic Packaging Holding Co. | | |
| | |
International Flavors & Fragrances, Inc. | | |
| | |
| | |
| | |
LyondellBasell Industries NV, Class A | | |
Martin Marietta Materials, Inc. | | |
| | |
| | |
| | |
| | |
| | |
| | |
Packaging Corp. of America | | |
| | |
Reliance Steel & Aluminum Co. | | |
| | |
| | |
| | |
| | |
| | |
| | |
124
Schwab Equity Index Funds | Annual Report
Schwab U.S. Large-Cap Value Index Fund
Portfolio Holdings as of October 31, 2023 (continued)
| | |
| | |
| | |
| | |
| | |
| | |
| | |
| | |
|
Media & Entertainment 2.9% |
AMC Entertainment Holdings, Inc., Class A * | | |
| | |
| | |
DISH Network Corp., Class A * | | |
| | |
| | |
| | |
Interpublic Group of Cos., Inc. | | |
Liberty Broadband Corp., Class C * | | |
Liberty Media Corp.-Liberty Formula One, Class C * | | |
Liberty Media Corp.-Liberty Live, Class C * | | |
Liberty Media Corp.-Liberty SiriusXM, Class C * | | |
Live Nation Entertainment, Inc. * | | |
Madison Square Garden Sports Corp. * | | |
| | |
New York Times Co., Class A | | |
| | |
Nexstar Media Group, Inc., Class A | | |
| | |
Paramount Global, Class B | | |
| | |
Sirius XM Holdings, Inc. (a) | | |
Take-Two Interactive Software, Inc. * | | |
| | |
| | |
Warner Bros Discovery, Inc. * | | |
ZoomInfo Technologies, Inc., Class A * | | |
| | |
|
Pharmaceuticals, Biotechnology & Life Sciences 8.3% |
Agilent Technologies, Inc. | | |
Alnylam Pharmaceuticals, Inc. * | | |
| | |
| | |
| | |
| | |
BioMarin Pharmaceutical, Inc. * | | |
Bio-Rad Laboratories, Inc., Class A * | | |
| | |
| | |
| | |
Charles River Laboratories International, Inc. * | | |
| | |
Elanco Animal Health, Inc. * | | |
| | |
| | |
| | |
| | |
| | |
| | |
| | |
Ionis Pharmaceuticals, Inc. * | | |
| | |
Jazz Pharmaceuticals PLC * | | |
| | |
| | |
Karuna Therapeutics, Inc. * | | |
Maravai LifeSciences Holdings, Inc., Class A * | | |
| | |
Mirati Therapeutics, Inc. * | | |
| | |
| | |
| | |
| | |
| | |
Regeneron Pharmaceuticals, Inc. * | | |
| | |
| | |
| | |
Royalty Pharma PLC, Class A | | |
| | |
Thermo Fisher Scientific, Inc. | | |
United Therapeutics Corp. * | | |
Vertex Pharmaceuticals, Inc. * | | |
| | |
| | |
|
Real Estate Management & Development 0.3% |
CBRE Group, Inc., Class A * | | |
| | |
Howard Hughes Holdings, Inc. * | | |
Jones Lang LaSalle, Inc. * | | |
Zillow Group, Inc., Class C * | | |
| | |
|
Semiconductors & Semiconductor Equipment 3.5% |
Advanced Micro Devices, Inc. * | | |
| | |
| | |
| | |
| | |
| | |
GLOBALFOUNDRIES, Inc. *(a) | | |
| | |
| | |
| | |
Microchip Technology, Inc. | | |
| | |
| | |
| | |
| | |
| | |
| | |
| | |
| | |
| | |
| | |
| | |
|
|
Akamai Technologies, Inc. * | | |
| | |
| | |
AppLovin Corp., Class A * | | |
| | |
Bentley Systems, Inc., Class B | | |
| | |
CCC Intelligent Solutions Holdings, Inc. * | | |
Schwab Equity Index Funds | Annual Report125
Schwab U.S. Large-Cap Value Index Fund
Portfolio Holdings as of October 31, 2023 (continued)
| | |
Cognizant Technology Solutions Corp., Class A | | |
Dolby Laboratories, Inc., Class A | | |
| | |
| | |
| | |
| | |
Guidewire Software, Inc. * | | |
HashiCorp, Inc., Class A * | | |
Informatica, Inc., Class A * | | |
International Business Machines Corp. | | |
| | |
| | |
| | |
| | |
| | |
| | |
| | |
| | |
| | |
SentinelOne, Inc., Class A * | | |
| | |
Tyler Technologies, Inc. * | | |
| | |
| | |
| | |
Zoom Video Communications, Inc., Class A * | | |
| | |
|
Technology Hardware & Equipment 2.5% |
| | |
Arrow Electronics, Inc. * | | |
| | |
| | |
| | |
| | |
| | |
| | |
| | |
| | |
| | |
Hewlett Packard Enterprise Co. | | |
| | |
| | |
| | |
| | |
Keysight Technologies, Inc. * | | |
| | |
Lumentum Holdings, Inc. * | | |
| | |
| | |
Pure Storage, Inc., Class A * | | |
| | |
Teledyne Technologies, Inc. * | | |
| | |
| | |
| | |
| | |
| | |
Zebra Technologies Corp., Class A * | | |
| | |
|
Telecommunication Services 1.9% |
| | |
Frontier Communications Parent, Inc. * | | |
| | |
| | |
Iridium Communications, Inc. | | |
| | |
Verizon Communications, Inc. | | |
| | |
|
|
| | |
American Airlines Group, Inc. * | | |
Avis Budget Group, Inc. * | | |
CH Robinson Worldwide, Inc. | | |
| | |
| | |
Expeditors International of Washington, Inc. | | |
| | |
| | |
Hertz Global Holdings, Inc. * | | |
JB Hunt Transport Services, Inc. | | |
| | |
Knight-Swift Transportation Holdings, Inc. | | |
| | |
| | |
Old Dominion Freight Line, Inc. | | |
| | |
| | |
Schneider National, Inc., Class B | | |
| | |
| | |
U-Haul Holding Co. - Non Voting | | |
| | |
United Airlines Holdings, Inc. * | | |
United Parcel Service, Inc., Class B | | |
| | |
| | |
|
|
| | |
| | |
| | |
American Electric Power Co., Inc. | | |
American Water Works Co., Inc. | | |
| | |
| | |
Brookfield Renewable Corp., Class A | | |
| | |
Clearway Energy, Inc., Class C | | |
| | |
Consolidated Edison, Inc. | | |
Constellation Energy Corp. | | |
| | |
| | |
| | |
| | |
| | |
Essential Utilities, Inc. | | |
| | |
| | |
| | |
| | |
Hawaiian Electric Industries, Inc. | | |
| | |
| | |
| | |
| | |
| | |
126
Schwab Equity Index Funds | Annual Report
Schwab U.S. Large-Cap Value Index Fund
Portfolio Holdings as of October 31, 2023 (continued)
| | |
| | |
| | |
Pinnacle West Capital Corp. | | |
| | |
Public Service Enterprise Group, Inc. | | |
| | |
| | |
| | |
| | |
| | |
| | |
| | |
Total Common Stocks
(Cost $515,864,535) | |
|
INVESTMENT COMPANIES 0.2% OF NET ASSETS |
|
|
iShares Russell 1000 Value ETF | | |
Total Investment Companies
(Cost $941,349) | |
| | |
SHORT-TERM INVESTMENTS 0.4% OF NET ASSETS |
|
|
State Street Institutional U.S. Government Money Market Fund, Premier Class 5.30% (d) | | |
State Street Institutional U.S. Government Money Market Fund, Premier Class 5.30% (d)(e) | | |
| | |
Total Short-Term Investments
(Cost $2,584,923) | |
Total Investments in Securities
(Cost $519,390,807) | |
| | | CURRENT VALUE/
UNREALIZED
DEPRECIATION
($) |
|
| | | |
S&P 500 Index, e-mini, expires 12/15/23 | | | |
| Non-income producing security. |
| All or a portion of this security is on loan. Securities on loan were valued at $533,609. |
| Issuer is affiliated with the fund’s investment adviser. |
| Fair valued using significant unobservable inputs (see financial note 2(a), Securities for which no quoted value is available, for additional information). |
| The rate shown is the annualized 7-day yield. |
| Security purchased with cash collateral received for securities on loan. |
| American Depositary Receipt |
| |
| Real Estate Investment Trust |
Below is a summary of the fund’s transactions with affiliated issuers during the period ended October 31, 2023:
| | | | | NET CHANGE IN UNREALIZED APPRECIATION (DEPRECIATION) | | BALANCE OF SHARES HELD AT 10/31/23 | |
COMMON STOCKS 0.4% OF NET ASSETS |
|
|
| | | | | | | | |
Schwab Equity Index Funds | Annual Report127
Schwab U.S. Large-Cap Value Index Fund
Portfolio Holdings as of October 31, 2023 (continued)
The following is a summary of the inputs used to value the fund’s investments as of October 31, 2023 (see financial note 2(a) for additional information):
| QUOTED PRICES IN
ACTIVE MARKETS FOR
IDENTICAL ASSETS
(LEVEL 1) | OTHER SIGNIFICANT
OBSERVABLE INPUTS
(LEVEL 2) | SIGNIFICANT
UNOBSERVABLE INPUTS
(LEVEL 3) | |
| | | | |
| | | | |
Telecommunication Services | | | | |
| | | | |
| | | | |
| | | | |
| | | | |
| | | | |
| As categorized in the Portfolio Holdings. |
| Futures contracts are reported at cumulative unrealized appreciation or depreciation. |
128
Schwab Equity Index Funds | Annual Report
Schwab U.S. Large-Cap Value Index Fund
Statement of Assets and Liabilities
As of October 31, 2023
|
Investments in securities, at value - affiliated (cost $2,307,597) | | |
Investments in securities, at value - unaffiliated (cost $517,083,210) including securities on loan of $533,609 | | |
Deposit with broker for futures contracts | | |
| | |
| | |
| | |
Variation margin on future contracts | | |
| | |
Income from securities on loan | | |
| | |
|
|
Collateral held for securities on loan | | |
| | |
| | |
| | |
| | |
| | |
| | |
|
|
Capital received from investors | | |
Total distributable earnings | | |
| | |
Schwab Equity Index Funds | Annual Report129
Schwab U.S. Large-Cap Value Index Fund
Statement of Operations
For the period November 1, 2022 through October 31, 2023 |
|
Dividends received from securities - unaffiliated (net of foreign withholding tax of $1,907) | | |
Dividends received from securities - affiliated | | |
| | |
| | |
|
|
| | |
| | |
| | |
|
REALIZED AND UNREALIZED GAINS (LOSSES) |
Net realized losses on sales of securities - affiliated | | |
Net realized losses on sales of securities - unaffiliated | | |
Net realized gains on sales of in-kind redemptions - unaffiliated | | |
Net realized losses on futures contracts | | |
| | |
Net change in unrealized appreciation (depreciation) on securities - affiliated | | |
Net change in unrealized appreciation (depreciation) on securities - unaffiliated | | |
Net change in unrealized appreciation (depreciation) on futures contracts | | |
Net change in unrealized appreciation (depreciation) | | |
Net realized and unrealized losses | | |
Increase in net assets resulting from operations | | |
130
Schwab Equity Index Funds | Annual Report
Schwab U.S. Large-Cap Value Index Fund
Statement of Changes in Net Assets
For the current and prior report periods
|
| | |
| | | |
| | | |
Net change in unrealized appreciation (depreciation) | | | |
Increase (decrease) in net assets resulting from operations | | | |
|
DISTRIBUTIONS TO SHAREHOLDERS |
| | | |
TRANSACTIONS IN FUND SHARES |
| | |
| | | | | |
| | | | | |
| | | | | |
| | | | | |
Net transactions in fund shares | | | | | |
|
SHARES OUTSTANDING AND NET ASSETS |
| | |
| | | | | |
| | | | | |
Total increase (decrease) | | | | | |
| | | | | |
Schwab Equity Index Funds | Annual Report131
Schwab U.S. Mid-Cap Index Fund
Financial Statements
| | | | | | |
|
Net asset value at beginning of period | | | | | | |
Income (loss) from investment operations: | | | | | | |
Net investment income (loss)1 | | | | | | |
Net realized and unrealized gains (losses) | | | | | | |
Total from investment operations | | | | | | |
| | | | | | |
Distributions from net investment income | | | | | | |
Distributions from net realized gains | | | | | | |
| | | | | | |
Net asset value at end of period | | | | | | |
| | | | | | |
|
Ratios to average net assets: | | | | | | |
| | | | | | |
Net investment income (loss) | | | | | | |
| | | | | | |
Net assets, end of period (x 1,000,000) | | | | | | |
| Calculated based on the average shares outstanding during the period. |
| Ratio includes less than 0.005% of non-routine proxy expenses. |
| Effective December 20, 2018, the annual operating expense ratio was reduced to 0.04%. The ratio presented for period ended October 31, 2019 is a blended ratio. |
| Portfolio turnover rate excludes in-kind transactions. |
132
Schwab Equity Index Funds | Annual Report
Schwab U.S. Mid-Cap Index Fund
Portfolio Holdings as of October 31, 2023
This section shows all the securities in the fund’s portfolio and their values as of the report date.
The fund files its complete schedule of portfolio holdings with the U.S. Securities and Exchange Commission (SEC) for the first and third quarters of each fiscal year on Form N-PORT Part F. The fund’s Form N-PORT Part F is available on the SEC’s website at www.sec.gov. You can also obtain this information at no cost on the fund’s website at www.schwabassetmanagement.com/schwabfunds_prospectus, by calling 1-866-414-6349, or by sending an email request to orders@mysummaryprospectus.com. The fund also makes available its complete schedule of portfolio holdings 15 to 20 days after the end of the month on the fund’s website.
| | |
COMMON STOCKS 99.5% OF NET ASSETS |
|
Automobiles & Components 0.8% |
| | |
| | |
| | |
| | |
| | |
| | |
| | |
QuantumScape Corp., Class A * | | |
Rivian Automotive, Inc., Class A * | | |
| | |
| | |
|
|
| | |
| | |
Citizens Financial Group, Inc. | | |
Columbia Banking System, Inc. | | |
| | |
Commerce Bancshares, Inc. | | |
Cullen/Frost Bankers, Inc. | | |
| | |
| | |
First Citizens BancShares, Inc., Class A | | |
| | |
| | |
| | |
Huntington Bancshares, Inc. | | |
| | |
| | |
New York Community Bancorp, Inc. | | |
NU Holdings Ltd., Class A * | | |
Pinnacle Financial Partners, Inc. | | |
| | |
Prosperity Bancshares, Inc. | | |
| | |
| | |
| | |
| | |
| | |
| | |
| | |
|
|
| | |
| | |
Advanced Drainage Systems, Inc. | | |
| | |
| | |
| | |
| | |
Allison Transmission Holdings, Inc. | | |
| | |
| | |
Armstrong World Industries, Inc. | | |
| | |
AZEK Co., Inc., Class A * | | |
Builders FirstSource, Inc. * | | |
| | |
| | |
| | |
ChargePoint Holdings, Inc. *(a) | | |
| | |
Core & Main, Inc., Class A * | | |
| | |
| | |
| | |
| | |
| | |
| | |
| | |
| | |
| | |
| | |
| | |
Fortune Brands Innovations, Inc. | | |
Gates Industrial Corp. PLC * | | |
| | |
| | |
| | |
| | |
| | |
| | |
| | |
Huntington Ingalls Industries, Inc. | | |
| | |
| | |
| | |
Lennox International, Inc. | | |
Lincoln Electric Holdings, Inc. | | |
| | |
| | |
MDU Resources Group, Inc. | | |
| | |
| | |
MSC Industrial Direct Co., Inc., Class A | | |
| | |
| | |
| | |
| | |
| | |
| | |
| | |
| | |
| | |
| | |
| | |
| | |
Rockwell Automation, Inc. | | |
Sensata Technologies Holding PLC | | |
SiteOne Landscape Supply, Inc. * | | |
| | |
Schwab Equity Index Funds | Annual Report133
Schwab U.S. Mid-Cap Index Fund
Portfolio Holdings as of October 31, 2023 (continued)
| | |
Spirit AeroSystems Holdings, Inc., Class A * | | |
Stanley Black & Decker, Inc. | | |
| | |
| | |
| | |
| | |
| | |
| | |
| | |
| | |
| | |
Vertiv Holdings Co., Class A | | |
| | |
WESCO International, Inc. | | |
Westinghouse Air Brake Technologies Corp. | | |
WillScot Mobile Mini Holdings Corp. * | | |
| | |
| | |
| | |
| | |
|
Commercial & Professional Services 4.6% |
Booz Allen Hamilton Holding Corp., Class A | | |
Broadridge Financial Solutions, Inc. | | |
CACI International, Inc., Class A * | | |
Ceridian HCM Holding, Inc. * | | |
| | |
| | |
| | |
| | |
| | |
Driven Brands Holdings, Inc. * | | |
Dun & Bradstreet Holdings, Inc. | | |
| | |
| | |
| | |
| | |
| | |
| | |
| | |
| | |
| | |
| | |
| | |
Paylocity Holding Corp. * | | |
| | |
Republic Services, Inc., Class A | | |
| | |
| | |
Science Applications International Corp. | | |
SS&C Technologies Holdings, Inc. | | |
| | |
| | |
| | |
Verisk Analytics, Inc., Class A | | |
| | |
| | |
|
Consumer Discretionary Distribution & Retail 3.3% |
| | |
| | |
| | |
| | |
| | |
Burlington Stores, Inc. * | | |
| | |
| | |
Dick's Sporting Goods, Inc. | | |
| | |
| | |
| | |
Floor & Decor Holdings, Inc., Class A * | | |
GameStop Corp., Class A *(a) | | |
| | |
| | |
| | |
Lithia Motors, Inc., Class A | | |
| | |
| | |
| | |
| | |
Ollie's Bargain Outlet Holdings, Inc. * | | |
Penske Automotive Group, Inc. | | |
Petco Health & Wellness Co., Inc., Class A * | | |
| | |
| | |
| | |
| | |
| | |
| | |
Victoria's Secret & Co. * | | |
| | |
| | |
| | |
|
Consumer Durables & Apparel 2.6% |
| | |
| | |
| | |
| | |
| | |
| | |
| | |
| | |
| | |
| | |
| | |
| | |
Mohawk Industries, Inc. * | | |
| | |
| | |
Peloton Interactive, Inc., Class A * | | |
| | |
| | |
| | |
Ralph Lauren Corp., Class A | | |
Skechers USA, Inc., Class A * | | |
| | |
Tempur Sealy International, Inc. | | |
| | |
| | |
Under Armour, Inc., Class A * | | |
| | |
| | |
| | |
| | |
|
134
Schwab Equity Index Funds | Annual Report
Schwab U.S. Mid-Cap Index Fund
Portfolio Holdings as of October 31, 2023 (continued)
| | |
|
| | |
| | |
| | |
Bright Horizons Family Solutions, Inc. * | | |
Caesars Entertainment, Inc. * | | |
| | |
| | |
Choice Hotels International, Inc. | | |
| | |
| | |
| | |
DoorDash, Inc., Class A * | | |
DraftKings, Inc., Class A * | | |
| | |
Grand Canyon Education, Inc. * | | |
| | |
Hilton Worldwide Holdings, Inc. | | |
Hyatt Hotels Corp., Class A | | |
Marriott Vacations Worldwide Corp. | | |
MGM Resorts International * | | |
| | |
Norwegian Cruise Line Holdings Ltd. * | | |
Penn Entertainment, Inc. * | | |
Planet Fitness, Inc., Class A * | | |
Royal Caribbean Cruises Ltd. * | | |
Service Corp. International | | |
Texas Roadhouse, Inc., Class A | | |
| | |
| | |
| | |
| | |
Wyndham Hotels & Resorts, Inc. | | |
| | |
| | |
| | |
|
Consumer Staples Distribution & Retail 1.3% |
Albertsons Cos., Inc., Class A | | |
BJ's Wholesale Club Holdings, Inc. * | | |
Casey's General Stores, Inc. | | |
| | |
Grocery Outlet Holding Corp. * | | |
| | |
Performance Food Group Co. * | | |
U.S. Foods Holding Corp. * | | |
Walgreens Boots Alliance, Inc. | | |
| | |
|
|
| | |
| | |
| | |
Baker Hughes Co., Class A | | |
| | |
| | |
| | |
| | |
| | |
| | |
| | |
| | |
| | |
| | |
| | |
| | |
New Fortress Energy, Inc. | | |
| | |
| | |
| | |
| | |
| | |
Southwestern Energy Co. * | | |
| | |
| | |
| | |
| | |
| | |
|
Equity Real Estate Investment Trusts (REITs) 7.0% |
| | |
Alexandria Real Estate Equities, Inc. | | |
American Homes 4 Rent, Class A | | |
Americold Realty Trust, Inc. | | |
Apartment Income REIT Corp. | | |
AvalonBay Communities, Inc. | | |
| | |
Brixmor Property Group, Inc. | | |
| | |
| | |
| | |
Digital Realty Trust, Inc. | | |
EastGroup Properties, Inc. | | |
| | |
Equity LifeStyle Properties, Inc. | | |
| | |
Essex Property Trust, Inc. | | |
Extra Space Storage, Inc. | | |
Federal Realty Investment Trust | | |
First Industrial Realty Trust, Inc. | | |
Gaming & Leisure Properties, Inc. | | |
Healthcare Realty Trust, Inc., Class A | | |
Healthpeak Properties, Inc. | | |
Highwoods Properties, Inc. | | |
Host Hotels & Resorts, Inc. | | |
| | |
| | |
| | |
| | |
Lamar Advertising Co., Class A | | |
Medical Properties Trust, Inc. | | |
Mid-America Apartment Communities, Inc. | | |
National Storage Affiliates Trust | | |
| | |
Omega Healthcare Investors, Inc. | | |
Park Hotels & Resorts, Inc. | | |
| | |
| | |
| | |
Rexford Industrial Realty, Inc. | | |
SBA Communications Corp., Class A | | |
Simon Property Group, Inc. | | |
Spirit Realty Capital, Inc. | | |
| | |
| | |
| | |
| | |
VICI Properties, Inc., Class A | | |
| | |
| | |
| | |
Schwab Equity Index Funds | Annual Report135
Schwab U.S. Mid-Cap Index Fund
Portfolio Holdings as of October 31, 2023 (continued)
| | |
| | |
| | |
|
|
Affiliated Managers Group, Inc. | | |
| | |
| | |
| | |
Ameriprise Financial, Inc. | | |
Annaly Capital Management, Inc. | | |
Apollo Global Management, Inc. | | |
Ares Management Corp., Class A | | |
Bank of New York Mellon Corp. | | |
| | |
Blue Owl Capital, Inc., Class A | | |
| | |
Cboe Global Markets, Inc. | | |
Coinbase Global, Inc., Class A * | | |
Corebridge Financial, Inc. | | |
Credit Acceptance Corp. * | | |
Discover Financial Services | | |
| | |
Euronet Worldwide, Inc. * | | |
| | |
FactSet Research Systems, Inc. | | |
Fidelity National Information Services, Inc. | | |
FleetCor Technologies, Inc. * | | |
| | |
| | |
Houlihan Lokey, Inc., Class A | | |
Interactive Brokers Group, Inc., Class A | | |
| | |
Jack Henry & Associates, Inc. | | |
Janus Henderson Group PLC | | |
Jefferies Financial Group, Inc. | | |
| | |
| | |
LPL Financial Holdings, Inc. | | |
MarketAxess Holdings, Inc. | | |
| | |
| | |
| | |
| | |
| | |
| | |
| | |
Raymond James Financial, Inc. | | |
| | |
Robinhood Markets, Inc., Class A * | | |
Rocket Cos., Inc., Class A * | | |
| | |
Shift4 Payments, Inc., Class A * | | |
| | |
SoFi Technologies, Inc. * | | |
Starwood Property Trust, Inc. | | |
| | |
| | |
| | |
| | |
| | |
| | |
| | |
Tradeweb Markets, Inc., Class A | | |
| | |
Virtu Financial, Inc., Class A | | |
| | |
| | |
| | |
| | |
| | |
| | |
|
Food, Beverage & Tobacco 1.9% |
Boston Beer Co., Inc., Class A * | | |
Brown-Forman Corp., Class B | | |
| | |
| | |
| | |
| | |
Darling Ingredients, Inc. * | | |
| | |
| | |
| | |
| | |
| | |
| | |
Lamb Weston Holdings, Inc. | | |
McCormick & Co., Inc. - Non Voting Shares | | |
Molson Coors Beverage Co., Class B | | |
| | |
| | |
| | |
Tyson Foods, Inc., Class A | | |
| | |
| | |
|
Health Care Equipment & Services 5.1% |
Acadia Healthcare Co., Inc. * | | |
| | |
| | |
| | |
Baxter International, Inc. | | |
| | |
| | |
| | |
| | |
| | |
| | |
| | |
| | |
Doximity, Inc., Class A * | | |
| | |
| | |
| | |
Globus Medical, Inc., Class A * | | |
| | |
| | |
| | |
IDEXX Laboratories, Inc. * | | |
Inspire Medical Systems, Inc. * | | |
| | |
Integra LifeSciences Holdings Corp. * | | |
Laboratory Corp. of America Holdings | | |
| | |
Molina Healthcare, Inc. * | | |
| | |
| | |
| | |
| | |
| | |
| | |
| | |
136
Schwab Equity Index Funds | Annual Report
Schwab U.S. Mid-Cap Index Fund
Portfolio Holdings as of October 31, 2023 (continued)
| | |
Shockwave Medical, Inc. * | | |
| | |
Tandem Diabetes Care, Inc. * | | |
| | |
| | |
| | |
Universal Health Services, Inc., Class B | | |
Veeva Systems, Inc., Class A * | | |
Zimmer Biomet Holdings, Inc. | | |
| | |
|
Household & Personal Products 0.5% |
Church & Dwight Co., Inc. | | |
| | |
| | |
| | |
Reynolds Consumer Products, Inc. | | |
Spectrum Brands Holdings, Inc. | | |
| | |
|
|
| | |
| | |
American Financial Group, Inc. | | |
Arch Capital Group Ltd. * | | |
| | |
| | |
| | |
Axis Capital Holdings Ltd. | | |
Brighthouse Financial, Inc. * | | |
| | |
Cincinnati Financial Corp. | | |
| | |
| | |
Fidelity National Financial, Inc. | | |
First American Financial Corp. | | |
| | |
Hanover Insurance Group, Inc. | | |
Hartford Financial Services Group, Inc. | | |
| | |
Kinsale Capital Group, Inc. | | |
| | |
| | |
| | |
Old Republic International Corp. | | |
| | |
Principal Financial Group, Inc. | | |
Prudential Financial, Inc. | | |
Reinsurance Group of America, Inc. | | |
RenaissanceRe Holdings Ltd. | | |
| | |
Ryan Specialty Holdings, Inc., Class A * | | |
| | |
| | |
White Mountains Insurance Group Ltd. | | |
| | |
| | |
|
|
| | |
| | |
| | |
| | |
Ardagh Metal Packaging SA | | |
| | |
| | |
| | |
Axalta Coating Systems Ltd. * | | |
| | |
| | |
| | |
CF Industries Holdings, Inc. | | |
| | |
| | |
| | |
| | |
| | |
| | |
| | |
| | |
| | |
Ginkgo Bioworks Holdings, Inc. *(a) | | |
Graphic Packaging Holding Co. | | |
| | |
International Flavors & Fragrances, Inc. | | |
| | |
| | |
LyondellBasell Industries NV, Class A | | |
Martin Marietta Materials, Inc. | | |
| | |
| | |
| | |
| | |
| | |
Packaging Corp. of America | | |
| | |
Reliance Steel & Aluminum Co. | | |
| | |
| | |
| | |
| | |
| | |
| | |
| | |
| | |
| | |
| | |
| | |
| | |
| | |
|
Media & Entertainment 3.5% |
AMC Entertainment Holdings, Inc., Class A * | | |
| | |
DISH Network Corp., Class A * | | |
| | |
| | |
| | |
Interpublic Group of Cos., Inc. | | |
Liberty Broadband Corp., Class C * | | |
Liberty Media Corp.-Liberty Formula One, Class C * | | |
Liberty Media Corp.-Liberty Live, Class C * | | |
Liberty Media Corp.-Liberty SiriusXM, Class C * | | |
Live Nation Entertainment, Inc. * | | |
Madison Square Garden Sports Corp. * | | |
| | |
New York Times Co., Class A | | |
| | |
Nexstar Media Group, Inc., Class A | | |
Schwab Equity Index Funds | Annual Report137
Schwab U.S. Mid-Cap Index Fund
Portfolio Holdings as of October 31, 2023 (continued)
| | |
| | |
Paramount Global, Class B | | |
Pinterest, Inc., Class A * | | |
| | |
| | |
| | |
Sirius XM Holdings, Inc. (a) | | |
| | |
Take-Two Interactive Software, Inc. * | | |
| | |
Trade Desk, Inc., Class A * | | |
| | |
Warner Bros Discovery, Inc. * | | |
ZoomInfo Technologies, Inc., Class A * | | |
| | |
|
Pharmaceuticals, Biotechnology & Life Sciences 5.2% |
10X Genomics, Inc., Class A * | | |
Agilent Technologies, Inc. | | |
Alnylam Pharmaceuticals, Inc. * | | |
Apellis Pharmaceuticals, Inc. * | | |
| | |
| | |
| | |
BioMarin Pharmaceutical, Inc. * | | |
Bio-Rad Laboratories, Inc., Class A * | | |
| | |
| | |
| | |
Charles River Laboratories International, Inc. * | | |
Elanco Animal Health, Inc. * | | |
| | |
| | |
| | |
| | |
| | |
| | |
Ionis Pharmaceuticals, Inc. * | | |
| | |
Jazz Pharmaceuticals PLC * | | |
Karuna Therapeutics, Inc. * | | |
Maravai LifeSciences Holdings, Inc., Class A * | | |
| | |
Mettler-Toledo International, Inc. * | | |
Mirati Therapeutics, Inc. * | | |
| | |
Neurocrine Biosciences, Inc. * | | |
| | |
| | |
| | |
| | |
| | |
| | |
Royalty Pharma PLC, Class A | | |
Sarepta Therapeutics, Inc. * | | |
| | |
| | |
Ultragenyx Pharmaceutical, Inc. * | | |
United Therapeutics Corp. * | | |
| | |
| | |
West Pharmaceutical Services, Inc. | | |
| | |
|
| | |
Real Estate Management & Development 0.7% |
CBRE Group, Inc., Class A * | | |
| | |
Howard Hughes Holdings, Inc. * | | |
Jones Lang LaSalle, Inc. * | | |
Zillow Group, Inc., Class C * | | |
| | |
|
Semiconductors & Semiconductor Equipment 2.6% |
Allegro MicroSystems, Inc. * | | |
| | |
| | |
| | |
| | |
GLOBALFOUNDRIES, Inc. *(a) | | |
Lattice Semiconductor Corp. * | | |
| | |
Microchip Technology, Inc. | | |
| | |
Monolithic Power Systems, Inc. | | |
| | |
| | |
| | |
| | |
| | |
| | |
| | |
|
|
Akamai Technologies, Inc. * | | |
| | |
| | |
| | |
AppLovin Corp., Class A * | | |
| | |
Bentley Systems, Inc., Class B | | |
| | |
CCC Intelligent Solutions Holdings, Inc. * | | |
Cloudflare, Inc., Class A * | | |
Cognizant Technology Solutions Corp., Class A | | |
Confluent, Inc., Class A * | | |
Crowdstrike Holdings, Inc., Class A * | | |
| | |
DocuSign, Inc., Class A * | | |
Dolby Laboratories, Inc., Class A | | |
DoubleVerify Holdings, Inc. * | | |
| | |
| | |
| | |
| | |
| | |
| | |
| | |
| | |
| | |
| | |
| | |
| | |
Guidewire Software, Inc. * | | |
HashiCorp, Inc., Class A * | | |
| | |
Informatica, Inc., Class A * | | |
| | |
Manhattan Associates, Inc. * | | |
138
Schwab Equity Index Funds | Annual Report
Schwab U.S. Mid-Cap Index Fund
Portfolio Holdings as of October 31, 2023 (continued)
| | |
| | |
| | |
| | |
| | |
| | |
| | |
Palantir Technologies, Inc., Class A * | | |
| | |
Procore Technologies, Inc. * | | |
| | |
RingCentral, Inc., Class A * | | |
SentinelOne, Inc., Class A * | | |
Smartsheet, Inc., Class A * | | |
| | |
| | |
| | |
Tyler Technologies, Inc. * | | |
| | |
| | |
| | |
Zoom Video Communications, Inc., Class A * | | |
| | |
| | |
|
Technology Hardware & Equipment 3.5% |
| | |
Arrow Electronics, Inc. * | | |
| | |
| | |
| | |
| | |
| | |
| | |
| | |
| | |
Hewlett Packard Enterprise Co. | | |
| | |
| | |
| | |
| | |
Keysight Technologies, Inc. * | | |
| | |
Lumentum Holdings, Inc. * | | |
| | |
Pure Storage, Inc., Class A * | | |
| | |
Teledyne Technologies, Inc. * | | |
| | |
| | |
| | |
| | |
| | |
Zebra Technologies Corp., Class A * | | |
| | |
|
Telecommunication Services 0.1% |
Frontier Communications Parent, Inc. * | | |
| | |
Iridium Communications, Inc. | | |
| | |
|
|
| | |
American Airlines Group, Inc. * | | |
| | |
Avis Budget Group, Inc. * | | |
CH Robinson Worldwide, Inc. | | |
| | |
Expeditors International of Washington, Inc. | | |
| | |
Hertz Global Holdings, Inc. * | | |
JB Hunt Transport Services, Inc. | | |
| | |
Knight-Swift Transportation Holdings, Inc. | | |
| | |
| | |
Old Dominion Freight Line, Inc. | | |
| | |
| | |
Schneider National, Inc., Class B | | |
| | |
| | |
U-Haul Holding Co. - Non Voting | | |
United Airlines Holdings, Inc. * | | |
| | |
| | |
|
|
| | |
| | |
| | |
American Water Works Co., Inc. | | |
| | |
| | |
Brookfield Renewable Corp., Class A | | |
| | |
Clearway Energy, Inc., Class C | | |
| | |
Consolidated Edison, Inc. | | |
Constellation Energy Corp. | | |
| | |
| | |
| | |
Essential Utilities, Inc. | | |
| | |
| | |
| | |
Hawaiian Electric Industries, Inc. | | |
| | |
| | |
| | |
| | |
| | |
| | |
Pinnacle West Capital Corp. | | |
| | |
Public Service Enterprise Group, Inc. | | |
| | |
| | |
| | |
| | |
| | |
Total Common Stocks
(Cost $1,026,813,129) | |
|
Schwab Equity Index Funds | Annual Report139
Schwab U.S. Mid-Cap Index Fund
Portfolio Holdings as of October 31, 2023 (continued)
| | |
INVESTMENT COMPANIES 0.1% OF NET ASSETS |
|
|
iShares Russell Mid-Cap ETF | | |
Total Investment Companies
(Cost $1,665,135) | |
| | |
SHORT-TERM INVESTMENTS 0.8% OF NET ASSETS |
|
|
State Street Institutional U.S. Government Money Market Fund, Premier Class 5.30% (c) | | |
State Street Institutional U.S. Government Money Market Fund, Premier Class 5.30% (c)(d) | | |
| | |
Total Short-Term Investments
(Cost $7,976,041) | |
Total Investments in Securities
(Cost $1,036,454,305) | |
| | | CURRENT VALUE/
UNREALIZED
APPRECIATION
($) |
|
| | | |
S&P 400 Mid-Cap Index, e-mini, expires 12/15/23 | | | |
| Non-income producing security. |
| All or a portion of this security is on loan. Securities on loan were valued at $2,161,996. |
| Fair valued using significant unobservable inputs (see financial note 2(a), Securities for which no quoted value is available, for additional information). |
| The rate shown is the annualized 7-day yield. |
| Security purchased with cash collateral received for securities on loan. |
| American Depositary Receipt |
| |
| Real Estate Investment Trust |
The following is a summary of the inputs used to value the fund’s investments as of October 31, 2023 (see financial note 2(a) for additional information):
| QUOTED PRICES IN
ACTIVE MARKETS FOR
IDENTICAL ASSETS
(LEVEL 1) | OTHER SIGNIFICANT
OBSERVABLE INPUTS
(LEVEL 2) | SIGNIFICANT
UNOBSERVABLE INPUTS
(LEVEL 3) | |
| | | | |
| | | | |
Telecommunication Services | | | | |
| | | | |
| | | | |
| | | | |
| | | | |
| As categorized in the Portfolio Holdings. |
| Futures contracts are reported at cumulative unrealized appreciation or depreciation. |
140
Schwab Equity Index Funds | Annual Report
Schwab U.S. Mid-Cap Index Fund
Statement of Assets and Liabilities
As of October 31, 2023
|
Investments in securities, at value - unaffiliated (cost $1,036,454,305) including securities on loan of $2,161,996 | | |
Deposit with broker for futures contracts | | |
| | |
| | |
| | |
Variation margin on future contracts | | |
| | |
Income from securities on loan | | |
| | |
|
|
Collateral held for securities on loan | | |
| | |
| | |
| | |
| | |
| | |
| | |
|
|
Capital received from investors | | |
| | |
| | |
Schwab Equity Index Funds | Annual Report141
Schwab U.S. Mid-Cap Index Fund
Statement of Operations
For the period November 1, 2022 through October 31, 2023 |
|
Dividends received from securities - unaffiliated (net of foreign withholding tax of $7,318) | | |
| | |
| | |
|
|
| | |
| | |
| | |
|
REALIZED AND UNREALIZED GAINS (LOSSES) |
Net realized losses on sales of securities - unaffiliated | | |
Net realized gains on sales of in-kind redemptions - unaffiliated | | |
Net realized losses on futures contracts | | |
| | |
Net change in unrealized appreciation (depreciation) on securities - unaffiliated | | |
Net change in unrealized appreciation (depreciation) on futures contracts | | |
Net change in unrealized appreciation (depreciation) | | |
Net realized and unrealized losses | | |
Decrease in net assets resulting from operations | | |
142
Schwab Equity Index Funds | Annual Report
Schwab U.S. Mid-Cap Index Fund
Statement of Changes in Net Assets
For the current and prior report periods
|
| | |
| | | |
Net realized gains (losses) | | | |
Net change in unrealized appreciation (depreciation) | | | |
Decrease in net assets from operations | | | |
|
DISTRIBUTIONS TO SHAREHOLDERS |
| | | |
TRANSACTIONS IN FUND SHARES |
| | |
| | | | | |
| | | | | |
| | | | | |
| | | | | |
Net transactions in fund shares | | | | | |
|
SHARES OUTSTANDING AND NET ASSETS |
| | |
| | | | | |
| | | | | |
| | | | | |
| | | | | |
Schwab Equity Index Funds | Annual Report143
Schwab International Index Fund
Financial Statements
| | | | | | |
|
Net asset value at beginning of period | | | | | | |
Income (loss) from investment operations: | | | | | | |
Net investment income (loss)1 | | | | | | |
Net realized and unrealized gains (losses) | | | | | | |
Total from investment operations | | | | | | |
| | | | | | |
Distributions from net investment income | | | | | | |
Net asset value at end of period | | | | | | |
| | | | | | |
|
Ratios to average net assets: | | | | | | |
| | | | | | |
Net investment income (loss) | | | | | | |
| | | | | | |
Net assets, end of period (x 1,000,000) | | | | | | |
| Calculated based on the average shares outstanding during the period. |
| Ratio includes less than 0.005% of non-routine proxy expenses. |
144
Schwab Equity Index Funds | Annual Report
Schwab International Index Fund
Portfolio Holdings as of October 31, 2023
This section shows all the securities in the fund’s portfolio and their values as of the report date.
The fund files its complete schedule of portfolio holdings with the U.S. Securities and Exchange Commission (SEC) for the first and third quarters of each fiscal year on Form N-PORT Part F. The fund’s Form N-PORT Part F is available on the SEC’s website at www.sec.gov. You can also obtain this information at no cost on the fund’s website at www.schwabassetmanagement.com/schwabfunds_prospectus, by calling 1-866-414-6349, or by sending an email request to orders@mysummaryprospectus.com. The fund also makes available its complete schedule of portfolio holdings 15 to 20 days after the end of the month on the fund’s website.
| | |
COMMON STOCKS 98.6% OF NET ASSETS |
|
|
| | |
| | |
| | |
| | |
| | |
| | |
| | |
| | |
| | |
| | |
| | |
Commonwealth Bank of Australia | | |
| | |
| | |
| | |
| | |
Fortescue Metals Group Ltd. | | |
| | |
| | |
| | |
| | |
Insurance Australia Group Ltd. | | |
James Hardie Industries PLC * | | |
| | |
| | |
| | |
| | |
| | |
| | |
National Australia Bank Ltd. | | |
Northern Star Resources Ltd. | | |
| | |
| | |
| | |
| | |
| | |
| | |
| | |
| | |
| | |
| | |
| | |
| | |
| | |
| | |
| | |
| | |
| | |
| | |
Treasury Wine Estates Ltd. (a) | | |
| | |
Washington H Soul Pattinson & Co. Ltd. | | |
| | |
| | |
| | |
| | |
Woodside Energy Group Ltd. | | |
| | |
| | |
| | |
|
|
| | |
| | |
| | |
| | |
| | |
|
|
| | |
| | |
| | |
| | |
| | |
Groupe Bruxelles Lambert NV | | |
| | |
| | |
| | |
| | |
| | |
| | |
| | |
| | |
|
|
AP Moller - Maersk AS, Class A | | |
AP Moller - Maersk AS, Class B | | |
| | |
| | |
| | |
| | |
| | |
| | |
| | |
| | |
| | |
| | |
| | |
| | |
| | |
| | |
| | |
|
|
| | |
| | |
| | |
| | |
Schwab Equity Index Funds | Annual Report145
Schwab International Index Fund
Portfolio Holdings as of October 31, 2023 (continued)
| | |
| | |
| | |
| | |
| | |
| | |
| | |
| | |
| | |
| | |
|
|
| | |
| | |
| | |
| | |
| | |
| | |
| | |
| | |
| | |
| | |
| | |
| | |
| | |
| | |
| | |
| | |
| | |
Cie Generale des Etablissements Michelin SCA | | |
| | |
| | |
| | |
| | |
| | |
| | |
| | |
| | |
| | |
| | |
| | |
| | |
| | |
| | |
| | |
| | |
| | |
| | |
La Francaise des Jeux SAEM | | |
| | |
| | |
LVMH Moet Hennessy Louis Vuitton SE | | |
| | |
| | |
| | |
| | |
| | |
| | |
| | |
| | |
| | |
| | |
| | |
| | |
| | |
| | |
| | |
| | |
| | |
Unibail-Rodamco-Westfield * | | |
| | |
| | |
| | |
| | |
| | |
| | |
| | |
|
|
| | |
| | |
| | |
| | |
Bayerische Motoren Werke AG | | |
| | |
| | |
| | |
Carl Zeiss Meditec AG, Bearer Shares | | |
| | |
| | |
| | |
| | |
| | |
| | |
| | |
| | |
| | |
| | |
| | |
| | |
Fresenius Medical Care AG & Co. KGaA | | |
| | |
| | |
| | |
| | |
| | |
| | |
| | |
| | |
| | |
| | |
| | |
| | |
Muenchener Rueckversicherungs-Gesellschaft AG in Muenchen | | |
| | |
| | |
| | |
| | |
| | |
| | |
| | |
| | |
| | |
| | |
| | |
| | |
| | |
Telefonica Deutschland Holding AG | | |
| | |
| | |
| | |
146
Schwab Equity Index Funds | Annual Report
Schwab International Index Fund
Portfolio Holdings as of October 31, 2023 (continued)
| | |
| | |
| | |
|
|
| | |
BOC Hong Kong Holdings Ltd. | | |
Budweiser Brewing Co. APAC Ltd. | | |
| | |
CK Hutchison Holdings Ltd. | | |
CK Infrastructure Holdings Ltd. | | |
| | |
| | |
Futu Holdings Ltd., ADR * | | |
Galaxy Entertainment Group Ltd. | | |
Hang Lung Properties Ltd. | | |
| | |
Henderson Land Development Co. Ltd. | | |
| | |
Hong Kong & China Gas Co. Ltd. | | |
Hong Kong Exchanges & Clearing Ltd. | | |
Hongkong Land Holdings Ltd. | | |
Jardine Matheson Holdings Ltd. | | |
| | |
| | |
New World Development Co. Ltd. | | |
Power Assets Holdings Ltd. | | |
| | |
| | |
SITC International Holdings Co. Ltd. | | |
Sun Hung Kai Properties Ltd. | | |
Swire Pacific Ltd., A Shares | | |
| | |
Techtronic Industries Co. Ltd. | | |
| | |
Wharf Real Estate Investment Co. Ltd. | | |
Xinyi Glass Holdings Ltd. | | |
| | |
|
|
| | |
Bank of Ireland Group PLC | | |
Flutter Entertainment PLC * | | |
| | |
| | |
| | |
| | |
|
|
| | |
| | |
| | |
Check Point Software Technologies Ltd. * | | |
| | |
| | |
| | |
| | |
Israel Discount Bank Ltd., A Shares | | |
Mizrahi Tefahot Bank Ltd. | | |
| | |
| | |
Teva Pharmaceutical Industries Ltd., ADR * | | |
| | |
| | |
| | |
|
|
| | |
Assicurazioni Generali SpA | | |
| | |
| | |
| | |
| | |
| | |
| | |
FinecoBank Banca Fineco SpA | | |
Infrastrutture Wireless Italiane SpA | | |
| | |
Mediobanca Banca di Credito Finanziario SpA (b) | | |
| | |
| | |
| | |
| | |
Recordati Industria Chimica e Farmaceutica SpA | | |
| | |
| | |
| | |
| | |
Terna - Rete Elettrica Nazionale | | |
| | |
| | |
|
|
| | |
| | |
| | |
| | |
| | |
| | |
Asahi Group Holdings Ltd. | | |
| | |
| | |
| | |
| | |
Bandai Namco Holdings, Inc. | | |
BayCurrent Consulting, Inc. | | |
| | |
| | |
| | |
| | |
Central Japan Railway Co. | | |
| | |
Chubu Electric Power Co., Inc. | | |
Chugai Pharmaceutical Co. Ltd. | | |
Concordia Financial Group Ltd. | | |
| | |
Dai Nippon Printing Co. Ltd. | | |
| | |
Dai-ichi Life Holdings, Inc. | | |
| | |
| | |
Daito Trust Construction Co. Ltd. | | |
Daiwa House Industry Co. Ltd. | | |
Daiwa House REIT Investment Corp. | | |
Daiwa Securities Group, Inc. | | |
| | |
| | |
Schwab Equity Index Funds | Annual Report147
Schwab International Index Fund
Portfolio Holdings as of October 31, 2023 (continued)
| | |
| | |
| | |
| | |
| | |
| | |
| | |
| | |
| | |
| | |
| | |
GMO Payment Gateway, Inc. | | |
Hakuhodo DY Holdings, Inc. | | |
| | |
Hankyu Hanshin Holdings, Inc. | | |
| | |
| | |
Hitachi Construction Machinery Co. Ltd. | | |
| | |
| | |
| | |
| | |
| | |
| | |
| | |
Iida Group Holdings Co. Ltd. | | |
| | |
| | |
| | |
| | |
Japan Exchange Group, Inc. | | |
Japan Metropolitan Fund Invest | | |
| | |
Japan Post Holdings Co. Ltd. | | |
Japan Post Insurance Co. Ltd. | | |
Japan Real Estate Investment Corp. | | |
| | |
| | |
| | |
| | |
Kansai Electric Power Co., Inc. | | |
| | |
Kawasaki Kisen Kaisha Ltd. | | |
| | |
| | |
Keisei Electric Railway Co. Ltd. | | |
Kenedix Office Investment Corp. | | |
| | |
| | |
Kintetsu Group Holdings Co. Ltd. | | |
| | |
Kobayashi Pharmaceutical Co. Ltd. | | |
| | |
Koei Tecmo Holdings Co. Ltd. | | |
Koito Manufacturing Co. Ltd. | | |
| | |
| | |
| | |
| | |
Kurita Water Industries Ltd. | | |
| | |
| | |
| | |
| | |
| | |
| | |
| | |
| | |
| | |
| | |
| | |
McDonald's Holdings Co. Japan Ltd. | | |
| | |
| | |
| | |
Mitsubishi Chemical Group Corp. | | |
| | |
Mitsubishi Electric Corp. | | |
Mitsubishi Estate Co. Ltd. | | |
Mitsubishi HC Capital, Inc. | | |
Mitsubishi Heavy Industries Ltd. | | |
Mitsubishi UFJ Financial Group, Inc. | | |
| | |
| | |
| | |
| | |
Mizuho Financial Group, Inc. | | |
| | |
MS&AD Insurance Group Holdings, Inc. | | |
Murata Manufacturing Co. Ltd. | | |
| | |
| | |
| | |
| | |
| | |
Nippon Building Fund, Inc. | | |
NIPPON EXPRESS HOLDINGS, Inc. | | |
Nippon Paint Holdings Co. Ltd. | | |
Nippon Prologis REIT, Inc. * | | |
Nippon Sanso Holdings Corp. | | |
| | |
Nippon Telegraph & Telephone Corp. | | |
| | |
| | |
| | |
Nissin Foods Holdings Co. Ltd. | | |
| | |
| | |
| | |
Nomura Real Estate Holdings, Inc. | | |
Nomura Real Estate Master Fund, Inc. * | | |
Nomura Research Institute Ltd. | | |
| | |
| | |
| | |
Odakyu Electric Railway Co. Ltd. | | |
| | |
| | |
| | |
Ono Pharmaceutical Co. Ltd. | | |
Open House Group Co. Ltd. | | |
| | |
| | |
| | |
| | |
| | |
| | |
Pan Pacific International Holdings Corp. | | |
| | |
| | |
| | |
Recruit Holdings Co. Ltd. | | |
Renesas Electronics Corp. * | | |
| | |
| | |
148
Schwab Equity Index Funds | Annual Report
Schwab International Index Fund
Portfolio Holdings as of October 31, 2023 (continued)
| | |
| | |
| | |
| | |
| | |
| | |
Sekisui Chemical Co. Ltd. | | |
| | |
Seven & i Holdings Co. Ltd. | | |
| | |
| | |
| | |
| | |
| | |
Shin-Etsu Chemical Co. Ltd. | | |
| | |
| | |
Shizuoka Financial Group, Inc. | | |
| | |
| | |
| | |
| | |
| | |
Square Enix Holdings Co. Ltd. | | |
| | |
| | |
Sumitomo Chemical Co. Ltd. | | |
| | |
Sumitomo Electric Industries Ltd. | | |
Sumitomo Metal Mining Co. Ltd. | | |
Sumitomo Mitsui Financial Group, Inc. | | |
Sumitomo Mitsui Trust Holdings, Inc. | | |
Sumitomo Realty & Development Co. Ltd. | | |
Suntory Beverage & Food Ltd. | | |
| | |
| | |
| | |
| | |
Takeda Pharmaceutical Co. Ltd. | | |
| | |
| | |
| | |
| | |
| | |
Tokio Marine Holdings, Inc. | | |
Tokyo Electric Power Co. Holdings, Inc. * | | |
| | |
| | |
| | |
| | |
| | |
| | |
| | |
| | |
| | |
| | |
| | |
| | |
| | |
| | |
| | |
| | |
| | |
| | |
| | |
| | |
| | |
| | |
| | |
| | |
| | |
| | |
|
|
| | |
| | |
| | |
| | |
| | |
| | |
| | |
| | |
BE Semiconductor Industries NV | | |
Coca-Cola Europacific Partners PLC | | |
| | |
| | |
| | |
| | |
| | |
| | |
| | |
Koninklijke Ahold Delhaize NV | | |
| | |
| | |
| | |
| | |
| | |
| | |
| | |
| | |
| | |
|
|
Auckland International Airport Ltd. | | |
| | |
Fisher & Paykel Healthcare Corp. Ltd. | | |
| | |
| | |
| | |
| | |
|
|
| | |
| | |
| | |
| | |
Gjensidige Forsikring ASA | | |
| | |
| | |
| | |
| | |
| | |
| | |
| | |
| | |
|
|
EDP - Energias de Portugal SA | | |
| | |
| | |
Schwab Equity Index Funds | Annual Report149
Schwab International Index Fund
Portfolio Holdings as of October 31, 2023 (continued)
| | |
| | |
| | |
|
|
| | |
CapitaLand Integrated Commercial Trust | | |
CapitaLand Investment Ltd. | | |
| | |
| | |
| | |
Grab Holdings Ltd., Class A * | | |
Jardine Cycle & Carriage Ltd. | | |
| | |
| | |
Mapletree Logistics Trust | | |
Mapletree Pan Asia Commercial Trust | | |
Oversea-Chinese Banking Corp. Ltd. | | |
| | |
| | |
| | |
| | |
| | |
Singapore Technologies Engineering Ltd. | | |
Singapore Telecommunications Ltd. | | |
United Overseas Bank Ltd. | | |
| | |
Wilmar International Ltd. | | |
| | |
|
|
| | |
ACS Actividades de Construccion y Servicios SA | | |
| | |
| | |
Banco Bilbao Vizcaya Argentaria SA | | |
| | |
| | |
| | |
Corp. ACCIONA Energias Renovables SA | | |
| | |
| | |
| | |
| | |
| | |
Industria de Diseno Textil SA | | |
| | |
| | |
| | |
| | |
| | |
|
|
| | |
| | |
| | |
| | |
| | |
| | |
| | |
| | |
| | |
| | |
| | |
| | |
Fastighets AB Balder, B Shares * | | |
| | |
H & M Hennes & Mauritz AB, B Shares (b) | | |
| | |
| | |
| | |
Industrivarden AB, A Shares | | |
Industrivarden AB, C Shares | | |
| | |
Investment AB Latour, B Shares | | |
| | |
L E Lundbergforetagen AB, B Shares | | |
| | |
Nibe Industrier AB, B Shares | | |
| | |
| | |
| | |
| | |
| | |
Skandinaviska Enskilda Banken AB, A Shares | | |
| | |
| | |
Svenska Cellulosa AB SCA, B Shares | | |
Svenska Handelsbanken AB, A Shares | | |
| | |
Swedish Orphan Biovitrum AB * | | |
| | |
Telefonaktiebolaget LM Ericsson, B Shares | | |
| | |
| | |
| | |
| | |
| | |
|
|
| | |
| | |
| | |
| | |
| | |
Banque Cantonale Vaudoise | | |
| | |
| | |
Chocoladefabriken Lindt & Spruengli AG | | |
Chocoladefabriken Lindt & Spruengli AG, Participation Certificates | | |
Cie Financiere Richemont SA, Class A | | |
| | |
| | |
| | |
| | |
| | |
| | |
| | |
| | |
Kuehne & Nagel International AG | | |
Logitech International SA | | |
| | |
| | |
| | |
150
Schwab Equity Index Funds | Annual Report
Schwab International Index Fund
Portfolio Holdings as of October 31, 2023 (continued)
| | |
Partners Group Holding AG | | |
| | |
Roche Holding AG, Bearer Shares | | |
| | |
| | |
Schindler Holding AG, Participation Certificates | | |
| | |
| | |
| | |
| | |
| | |
| | |
Swatch Group AG, Bearer Shares | | |
| | |
| | |
| | |
| | |
| | |
| | |
| | |
Zurich Insurance Group AG | | |
| | |
|
|
| | |
| | |
| | |
| | |
| | |
| | |
Associated British Foods PLC | | |
| | |
| | |
| | |
| | |
| | |
| | |
Berkeley Group Holdings PLC | | |
| | |
British American Tobacco PLC | | |
| | |
| | |
| | |
| | |
| | |
| | |
| | |
| | |
| | |
| | |
| | |
| | |
| | |
| | |
| | |
| | |
| | |
| | |
Hikma Pharmaceuticals PLC | | |
| | |
| | |
| | |
InterContinental Hotels Group PLC | | |
| | |
| | |
| | |
| | |
| | |
| | |
Land Securities Group PLC | | |
Legal & General Group PLC | | |
| | |
London Stock Exchange Group PLC | | |
| | |
| | |
| | |
| | |
| | |
| | |
| | |
| | |
| | |
| | |
Phoenix Group Holdings PLC | | |
| | |
Reckitt Benckiser Group PLC | | |
| | |
| | |
| | |
Rolls-Royce Holdings PLC * | | |
| | |
| | |
| | |
| | |
| | |
| | |
| | |
Spirax-Sarco Engineering PLC | | |
| | |
| | |
| | |
| | |
| | |
| | |
United Utilities Group PLC | | |
| | |
| | |
| | |
| | |
| | |
Total Common Stocks
(Cost $6,328,980,208) | |
|
PREFERRED STOCKS 0.4% OF NET ASSETS |
|
|
Bayerische Motoren Werke AG | | |
| | |
| | |
Porsche Automobil Holding SE | | |
| | |
| | |
| | |
Total Preferred Stocks
(Cost $40,544,576) | |
Schwab Equity Index Funds | Annual Report151
Schwab International Index Fund
Portfolio Holdings as of October 31, 2023 (continued)
| | |
SHORT-TERM INVESTMENTS 0.1% OF NET ASSETS |
|
|
State Street Institutional U.S. Government Money Market Fund, Premier Class 5.30% (c)(d) | | |
Total Short-Term Investments
(Cost $8,238,215) | |
Total Investments in Securities
(Cost $6,377,762,999) | |
| | | CURRENT VALUE/
UNREALIZED
DEPRECIATION
($) |
|
| | | |
MSCI EAFE Index, expires 12/15/23 | | | |
| Non-income producing security. |
| Fair valued using significant unobservable inputs (see financial note 2(a), Securities for which no quoted value is available, for additional information). |
| All or a portion of this security is on loan. Securities on loan were valued at $7,996,851. |
| The rate shown is the annualized 7-day yield. |
| Security purchased with cash collateral received for securities on loan. |
| American Depositary Receipt |
| |
| Global Depositary Receipt |
| Real Estate Investment Trust |
152
Schwab Equity Index Funds | Annual Report
Schwab International Index Fund
Portfolio Holdings as of October 31, 2023 (continued)
The following is a summary of the inputs used to value the fund’s investments as of October 31, 2023 (see financial note 2(a) for additional information):
| QUOTED PRICES IN
ACTIVE MARKETS FOR
IDENTICAL ASSETS
(LEVEL 1) | OTHER SIGNIFICANT
OBSERVABLE INPUTS
(LEVEL 2) | SIGNIFICANT
UNOBSERVABLE INPUTS
(LEVEL 3) | |
| | | | |
| | | | |
| | | | |
| | | | |
| | | | |
| | | | |
| | | | |
| | | | |
| | | | |
| | | | |
| | | | |
| | | | |
| | | | |
| | | | |
| | | | |
| | | | |
| | | | |
| | | | |
| Level 3 amount shown includes securities determined to have no value at October 31, 2023. |
| As categorized in the Portfolio Holdings. |
| Futures contracts are reported at cumulative unrealized appreciation or depreciation. |
Schwab Equity Index Funds | Annual Report153
Schwab International Index Fund
Statement of Assets and Liabilities
As of October 31, 2023
|
Investments in securities, at value - unaffiliated (cost $6,377,762,999) including securities on loan of $7,996,851 | | |
| | |
Foreign currency, at value (cost $9,443,735) | | |
Deposit with broker for futures contracts | | |
| | |
| | |
| | |
| | |
Variation margin on future contracts | | |
Income from securities on loan | | |
| | |
|
|
Collateral held for securities on loan | | |
| | |
| | |
| | |
| | |
| | |
| | |
|
|
Capital received from investors | | |
Total distributable earnings | | |
| | |
154
Schwab Equity Index Funds | Annual Report
Schwab International Index Fund
Statement of Operations
For the period November 1, 2022 through October 31, 2023 |
|
Dividends received from securities - unaffiliated (net of foreign withholding tax of $29,240,437) | | |
| | |
| | |
|
|
| | |
| | |
| | |
| | |
| | |
| | |
|
REALIZED AND UNREALIZED GAINS (LOSSES) |
Net realized losses on sales of securities - unaffiliated | | |
Net realized gains on futures contracts | | |
Net realized losses on foreign currency transactions | | |
| | |
Net change in unrealized appreciation (depreciation) on securities - unaffiliated | | |
Net change in unrealized appreciation (depreciation) on futures contracts | | |
Net change in unrealized appreciation (depreciation) on foreign currency translations | | |
Net change in unrealized appreciation (depreciation) | | |
Net realized and unrealized gains | | |
Increase in net assets resulting from operations | | |
| Professional fees associated with the filing of foreign withholding tax claims in the European Union are deemed to be non-contingent and non-routine expenses of the fund (see financial notes 2(d) and 4 for additional information). |
Schwab Equity Index Funds | Annual Report155
Schwab International Index Fund
Statement of Changes in Net Assets
For the current and prior report periods
|
| | |
| | | |
| | | |
Net change in unrealized appreciation (depreciation) | | | |
Increase (decrease) in net assets resulting from operations | | | |
|
DISTRIBUTIONS TO SHAREHOLDERS |
| | | |
TRANSACTIONS IN FUND SHARES |
| | |
| | | | | |
| | | | | |
| | | | | |
| | | | | |
Net transactions in fund shares | | | | | |
|
SHARES OUTSTANDING AND NET ASSETS |
| | |
| | | | | |
| | | | | |
Total increase (decrease) | | | | | |
| | | | | |
156
Schwab Equity Index Funds | Annual Report
Schwab Equity Index Funds
1. Business Structure of the Funds:
Each of the funds in this report is a series of Schwab Capital Trust, except Schwab 1000 Index Fund, which is a series of Schwab Investments. Both Schwab Capital Trust and Schwab Investments (the trusts) are no-load, open-end management investment companies. Each trust is organized as a Massachusetts business trust and is registered under the Investment Company Act of 1940, as amended (the 1940 Act). The list below shows all the funds in the trusts as of the end of the period, including the funds discussed in this report, which are highlighted:
|
Schwab S&P 500 Index Fund | |
Schwab Small-Cap Index Fund | |
Schwab Total Stock Market Index Fund | |
Schwab U.S. Large-Cap Growth Index Fund | |
Schwab U.S. Large-Cap Value Index Fund | |
Schwab U.S. Mid-Cap Index Fund | Schwab Fundamental US Large Company Index Fund |
Schwab International Index Fund | Schwab Fundamental US Small Company Index Fund |
Schwab MarketTrack All Equity Portfolio™ | Schwab Fundamental International Large Company Index Fund |
Schwab MarketTrack Growth Portfolio™ | Schwab Fundamental International Small Company Index Fund |
Schwab MarketTrack Balanced Portfolio™ | Schwab Fundamental Emerging Markets Large Company Index Fund |
Schwab MarketTrack Conservative Portfolio™ | Schwab Fundamental Global Real Estate Index Fund |
Schwab International Opportunities Fund | Schwab Target 2010 Index Fund |
| Schwab Target 2015 Index Fund |
| Schwab Target 2020 Index Fund |
Schwab Dividend Equity Fund | Schwab Target 2025 Index Fund |
Schwab Large-Cap Growth Fund | Schwab Target 2030 Index Fund |
Schwab Small-Cap Equity Fund | Schwab Target 2035 Index Fund |
| Schwab Target 2040 Index Fund |
Schwab International Core Equity Fund | Schwab Target 2045 Index Fund |
| Schwab Target 2050 Index Fund |
| Schwab Target 2055 Index Fund |
| Schwab Target 2060 Index Fund |
| Schwab Target 2065 Index Fund |
| Schwab Monthly Income Fund – Target Payout |
| Schwab Monthly Income Fund – Flexible Payout |
| Schwab Monthly Income Fund – Income Payout |
| |
|
| Schwab Tax-Free Bond Fund |
Schwab Treasury Inflation Protected Securities Index Fund | Schwab California Tax-Free Bond Fund |
Schwab U.S. Aggregate Bond Index Fund | Schwab Opportunistic Municipal Bond Fund |
Schwab Short-Term Bond Index Fund | Schwab Global Real Estate Fund |
Each fund in this report offers one share class. Shares are bought and sold at closing net asset value per share (NAV), which is the price for all outstanding shares of a fund. Each share has a par value of 1/1,000 of a cent, and the funds’ Board of Trustees (the Board) may authorize the issuance of as many shares as necessary.
Each fund maintains its own account for purposes of holding assets and accounting, and is considered a separate entity for tax purposes. Within its account, each fund may also keep certain assets in segregated accounts, as required by securities law. The "Fund Complex" includes The Charles Schwab Family of Funds, Schwab Capital Trust, Schwab Investments, Schwab Annuity Portfolios, Schwab Strategic Trust and Laudus Trust.
2. Significant Accounting Policies:The following is a summary of the significant accounting policies the funds use in their preparation of financial statements. The funds follow the investment company accounting and reporting guidance of the Financial Accounting Standards Board (FASB) Accounting Standard Codification Topic 946 Financial Services — Investment Companies. The accounting policies are in conformity with accounting principles generally accepted in the United States of America (GAAP).
Schwab Equity Index Funds | Annual Report157
Schwab Equity Index Funds
Financial Notes (continued)
2. Significant Accounting Policies (continued):
The funds may invest in certain mutual funds and exchange-traded funds (ETFs), which are referred to as "underlying funds". For more information about the underlying funds’ operations and policies, please refer to those funds’ semiannual and annual reports, which are filed with the U.S. Securities and Exchange Commission (SEC) and are available on the SEC’s website at www.sec.gov.
(a) Security Valuation:
Pursuant to Rule 2a-5 under the 1940 Act, the Board has designated authority to a Valuation Designee, the funds’ investment adviser, to make fair valuation determinations under adopted procedures, subject to Board oversight. The investment adviser has formed a Pricing Committee to administer the pricing and valuation of portfolio securities and other assets and liabilities as well as to ensure that prices used for internal purposes or provided by third parties reasonably reflect fair value. The Valuation Designee may utilize independent pricing services, quotations from securities and financial instrument dealers and other market sources to determine fair value.
Securities held in the funds’ portfolio are valued every business day. The following valuation policies and procedures are used by the Valuation Designee to value various types of securities:
• Securities traded on an exchange or over-the-counter: Traded securities are valued at the closing value for the day, or, on days when no closing value has been reported, at the mean of the most recent bid and ask quotes. Securities that are primarily traded on foreign exchanges are valued at the official closing price or the last sales price on the exchange where the securities are principally traded with these values then translated into U.S. dollars at the current exchange rate, unless these securities are fair valued as discussed below.
• Foreign equity security fair valuation: The Valuation Designee has adopted procedures to fair value foreign equity securities that are traded in markets that close prior to the valuation of a fund’s holdings. By fair valuing securities whose prices may have been affected by events occurring after the close of trading, the Valuation Designee seeks to establish prices that investors might expect to realize upon the current sales of these securities. This methodology is designed to deter “arbitrage” market timers, who seek to exploit delays between the change in the value of a fund’s portfolio holdings and the NAV of a fund’s shares and seeks to help ensure that the prices at which a fund’s shares are purchased and redeemed are fair and do not result in dilution of shareholder interest or other harm to shareholders. When fair value pricing is used at the open or close of a reporting period, it may cause a temporary divergence between the return of a fund and that of its comparative index or benchmark.
• Futures contracts: Futures contracts are valued at their settlement prices as of the close of their exchanges.
• Mutual funds: Mutual funds are valued at their respective NAVs.
• Securities for which no quoted value is available: The Valuation Designee has adopted procedures to fair value a fund’s securities when market prices are not “readily available” or are unreliable. For example, a security may be fair valued when it’s de-listed or its trading is halted or suspended; when a security’s primary pricing source is unable or unwilling to provide a price; or when a security’s primary trading market is closed during regular market hours. Fair value determinations are made in good faith in accordance with adopted valuation procedures. The Valuation Designee considers a number of factors, including unobservable market inputs, when arriving at fair value. The Valuation Designee may employ methods such as the review of related or comparable assets or liabilities, related market activities, recent transactions, market multiples, book values, transactional back-testing, disposition analysis and other relevant information. Due to the subjective and variable nature of fair value pricing, there can be no assurance that a fund could obtain the fair value assigned to the security upon the sale of such security.
In accordance with the authoritative guidance on fair value measurements and disclosures under GAAP, the funds disclose the fair value of their investments in a hierarchy that prioritizes the significant inputs to valuation methods used to measure the fair value. The hierarchy gives the highest priority to valuations based upon unadjusted quoted prices in active markets for identical assets or liabilities (Level 1 measurements) and the lowest priority to valuations based upon unobservable inputs that are significant to the valuation (Level 3 measurements). If inputs used to measure the financial instruments fall within different levels of the hierarchy, the categorization is based on the lowest level input that is significant to the valuation. If it is determined that either the volume and/or level of activity for an asset or liability has significantly decreased (from normal conditions for that asset or liability) or price quotations or observable inputs are not associated with orderly transactions, increased analysis and the Valuation Designee’s judgment will be required to estimate fair value.
158
Schwab Equity Index Funds | Annual Report
Schwab Equity Index Funds
Financial Notes (continued)
2. Significant Accounting Policies (continued):
The three levels of the fair value hierarchy are as follows:
• Level 1 — quoted prices in active markets for identical investments — Investments whose values are based on quoted market prices in active markets. These generally include active listed equities, mutual funds, ETFs and futures contracts. Mutual funds and ETFs are classified as Level 1 prices, without consideration to the classification level of the underlying securities held which could be Level 1, Level 2, or Level 3 in the fair value hierarchy.
• Level 2 — other significant observable inputs (including quoted prices for similar securities, interest rates, prepayment speeds, credit risk, etc.) — Investments that trade in markets that are not considered to be active, but whose values are based on quoted market prices, dealer quotations or valuations provided by alternative pricing sources supported by observable inputs are classified as Level 2 prices. These generally include U.S. government and sovereign obligations, most government agency securities, investment-grade corporate bonds, certain mortgage products, less liquid listed equities, and state, municipal and provincial obligations. In addition, international securities whose markets close hours before the valuation of a fund’s holdings may require fair valuations due to significant movement in the U.S. markets occurring after the daily close of foreign markets. The Valuation Designee has approved a vendor that calculates fair valuations of international equity securities based on a number of factors that appear to correlate to the movements in the U.S. markets.
• Level 3 — significant unobservable inputs (including the Valuation Designee’s assumptions in determining the fair value of investments) — Investments whose values are classified as Level 3 prices have significant unobservable inputs, as they may trade infrequently or not at all. When observable prices are not readily available for these securities, one or more valuation methods are used for which sufficient and reliable data is available. The inputs used in estimating the value of Level 3 prices may include the original transaction price, quoted prices for similar securities or assets in active markets, completed or pending third-party transactions in the underlying investment or comparable issuers, and changes in financial ratios or cash flows. Level 3 prices may also be adjusted to reflect illiquidity and/or non-transferability, with the amount of such discount estimated in the absence of market information. Assumptions used due to the lack of observable inputs may significantly impact the resulting fair value and therefore a fund’s results of operations.
The inputs or methodology used for valuing securities are not necessarily an indication of the risk associated with investing in those securities.
The levels associated with valuing the funds’ investments as of October 31, 2023 are disclosed in each fund’s Portfolio Holdings.
(b) Accounting Policies for certain Portfolio Investments (if held):
Futures Contracts: Futures contracts are instruments that represent an agreement between two parties that obligates one party to buy, and the other party to sell, specific instruments at an agreed upon price on a stipulated future date. A fund must give the broker a deposit of cash and/or securities (initial margin) whenever it enters into a futures contract. The amount of the deposit may vary from one contract to another. Subsequent payments (variation margin) are made or received by a fund depending on the daily fluctuations in the value of the futures contract and are accounted for as unrealized appreciation or depreciation until the contract is closed, at which time the gains or losses are realized. Futures contracts are traded publicly on exchanges, and their value may change daily.
Securities Lending: Under the trusts’ Securities Lending Program, a fund (lender), may make short-term loans of its securities to another party (borrower) to generate additional revenue for the fund. The borrower pledges collateral in the form of cash, securities issued or fully guaranteed by the U.S. government or foreign governments, or letters of credit issued by a bank. Collateral at the individual loan level is required to be maintained on a daily marked-to-market basis in an amount at least equal to the current value of the securities loaned. The lending agent provides a fund with indemnification against borrower default (the borrower fails to return the security on loan) reducing the risk of loss as a result of default. The cash collateral of securities loaned is currently invested in money market portfolios operating pursuant to Rule 2a-7 under the 1940 Act. Each fund bears the risk of loss with respect to the investment of cash collateral. The terms of the securities lending agreement allow the funds or the lending agent to terminate any loan at any given time and the securities must be returned within the earlier of the standard trade settlement period or the specified time period under the relevant securities lending agreement. Securities lending income, as disclosed in each fund’s Statement of Operations, if applicable, represents the income earned from the investment of the cash collateral plus any fees paid by borrowers, less the fees paid to the lending agent and broker rebates which are subject to adjustments pursuant to the securities lending agreement. On loans not collateralized by cash, a fee is received from the borrower, and is allocated between a fund and the lending agent. The aggregate fair value of securities loaned will not at any time exceed one-third of the total assets of a fund, including collateral received from the loan. Securities lending fees paid to the unaffiliated lending agents start at 9% of gross lending revenue, with subsequent breakpoints to a low of 5%. In this context, the gross lending revenue equals the income received from the investment of cash collateral and fees paid by borrowers less any rebates paid to the borrowers. Any expenses charged by the
Schwab Equity Index Funds | Annual Report159
Schwab Equity Index Funds
Financial Notes (continued)
2. Significant Accounting Policies (continued):
cash collateral fund are in addition to these fees. All remaining revenue is retained by the fund, as applicable. No portion of lending revenue is paid to or retained by the investment adviser or any of its affiliates.
As of October 31, 2023, Schwab 1000 Index Fund, Schwab Small-Cap Index Fund, Schwab Total Stock Market Index Fund, Schwab U.S. Large-Cap Growth Index Fund, Schwab U.S. Large-Cap Value Index Fund, Schwab U.S. Mid-Cap Index Fund and Schwab International Index Fund had securities on loan, all of which were classified as common stocks. The value of the securities on loan and the related collateral as of October 31, 2023, if any, are disclosed in each fund’s Portfolio Holdings and Statement of Assets and Liabilities.
Cash Investments: The funds may invest a portion of their assets in cash. Cash includes cash bank balances in an interest-bearing demand deposit account with maturity on demand by the funds.
Passive Foreign Investment Companies: Certain funds may own shares in certain foreign corporations that meet the Internal Revenue Code, as amended, definition of a Passive Foreign Investment Company (PFIC). The funds may elect for tax purposes to mark-to-market annually the shares of each PFIC lot held and would be required to distribute as ordinary income to shareholders any such marked-to-market gains (as well as any gains realized on sale).
Central Securities Depositories Regulation: The Central Securities Depositories Regulation (CSDR) introduced measures for the authorization and supervision of European Union Central Security Depositories and created a common set of prudential, organizational, and conduct of business standards at a European level. CSDR is designed to support securities settlement and operational aspects of securities settlement, including the provision of shorter settlement periods; mandatory buy-ins; and cash penalties, to prevent and address settlement fails. CSDR measures are aimed to prevent settlement fails by ensuring that all transaction details are provided to facilitate settlement, as well as further incentivizing timely settlement by imposing cash penalty fines and buy-ins. The Schwab International Index Fund may be subject to pay cash penalties and may also receive cash penalties with certain counterparties in instances where there are settlement fails. These cash penalties are included in net realized gains (losses) on sales of securities in the Schwab International Index Fund’s Statement of Operations, if any.
(c) Security Transactions:
Security transactions are recorded as of the date the order to buy or sell the security is executed. Realized gains and losses from security transactions are based on the identified costs of the securities involved.
Assets and liabilities denominated in foreign currencies are reported in U.S. dollars. For assets and liabilities held on a given date, the dollar value is based on market exchange rates in effect on that date. Transactions involving foreign currencies, including purchases, sales, income receipts and expense payments, are calculated using exchange rates in effect on the transaction date. Realized foreign exchange gains or losses arise from sales of foreign currencies, currency gains or losses realized between the trade and settlement dates on securities transactions and the difference between the recorded amounts of dividends, interest, and foreign withholding taxes and the U.S. dollar equivalent of the amounts actually received or paid. Net unrealized foreign exchange appreciation or depreciation arises from changes in foreign exchange rates on foreign denominated assets and liabilities other than investments in securities held at the end of the reporting period. These realized and unrealized foreign exchange gains or losses are reported in foreign currency transactions or translations in each fund’s Statement of Operations, if any. The funds do not isolate the portion of the fluctuations on investments resulting from changes in foreign currency exchange rates from the fluctuations in market prices of investments held. Such fluctuations are included with the net realized and unrealized gain or loss from investments, if any.
Gains realized by the funds on the sale of securities in certain foreign countries may be subject to non-U.S. taxes. In those instances, the funds record a liability based on unrealized gains to provide for potential non-U.S. taxes payable upon the sale of these securities.
When a fund closes out a futures contract position, it calculates the difference between the value of the position at the beginning and at the end of the contract, and records a realized gain or loss accordingly.
(d) Investment Income:
Interest income is recorded as it accrues. Dividends, in the form of cash or non-cash income such as in the form of additional securities, and distributions from portfolio securities and underlying funds are recorded on the date they are effective (the ex-dividend date), although the funds record certain foreign security dividends on the date the ex-dividend date is confirmed. Any distributions from underlying funds are recorded in accordance with the character of the distributions as designated by the underlying funds.
160
Schwab Equity Index Funds | Annual Report
Schwab Equity Index Funds
Financial Notes (continued)
2. Significant Accounting Policies (continued):
Income received from foreign sources may result in withholding tax. Withholding taxes are accrued at the same time as the related income if the tax rate is fixed and known, unless a tax withheld is reclaimable from the local tax authorities in which case it is recorded as receivable. If the tax rate is not known or estimable, such expense or reclaim receivable is recorded when the net proceeds are received.
The Schwab International Index Fund filed claims to recover taxes previously withheld in certain European Union countries on the basis that those countries had purportedly violated certain provisions in the Treaty on the Functioning of the European Union. These filings are subject to various administrative and judicial proceedings within these countries, and all professional fees associated with these filings have been paid by the investment adviser. The professional fees related to European Union foreign withholding tax claims are non-contingent and non-routine fees which are subject to repayment to the investment adviser (see financial note 4 for additional information).
For U.S. income tax purposes, European Union reclaims received reduce the amounts of foreign taxes that the fund passes through to its shareholders. If European Union reclaims received exceed foreign withholding taxes paid, the Schwab International Index Fund will evaluate the requirements for entering into a closing agreement with the Internal Revenue Service (IRS) to address any prior years’ U.S. income tax liabilities attributable to fund shareholders resulting from the recovery of foreign taxes. The closing agreement would result in the fund paying a compliance fee to the IRS, on behalf of its shareholders, representing the estimated tax savings generated from foreign tax credits claimed by fund shareholders on their tax returns in prior years. During the period ended October 31, 2023, the Schwab International Index Fund did not incur any compliance fees.
(e) Expenses:
Pursuant to an Amended and Restated Investment Advisory and Administration Agreement (Advisory Agreement) between the investment adviser and each trust, the investment adviser pays the operating expenses of each fund, excluding acquired fund fees and expenses, taxes, any brokerage expenses, and extraordinary or non-routine expenses. Taxes, any brokerage expenses and extraordinary or non-routine expenses that are specific to a fund are charged directly to the fund. Acquired fund fees and expenses are indirect expenses incurred by a fund through its investments in underlying funds. Such expenses are reflected in the net asset values of the underlying funds.
(f) Distributions to Shareholders:
The funds make distributions from net investment income and net realized capital gains, if any, once a year. To receive a distribution, you must be a registered shareholder on the record date. Distributions are paid to shareholders on the payable date.
(g) Accounting Estimates:
The accounting policies described in this report conform to GAAP. Notwithstanding this, shareholders should understand that in order to follow these principles, fund management has to make estimates and assumptions that affect the information reported in the financial statements. It’s possible that once the results are known, they may turn out to be different from these estimates and these differences may be material.
(h) Federal Income Taxes:
The funds intend to meet federal income and excise tax requirements for regulated investment companies under subchapter M of the Internal Revenue Code, as amended. Accordingly, the funds distribute substantially all of their net investment income and net realized capital gains, if any, to their respective shareholders each year. As long as a fund meets the tax requirements, it is not required to pay federal income tax.
(i) Foreign Taxes:
The funds may be subject to foreign taxes (a portion of which may be reclaimable) on income, corporate events, foreign currency exchanges and capital gains on investments. All foreign taxes are recorded in accordance with the applicable foreign tax regulations and rates that exist in foreign markets in which the funds invest. These foreign taxes, if any, are paid by the funds and are disclosed in each fund’s Statement of Operations. Foreign taxes accrued as of October 31, 2023, if any, are reflected in each fund’s Statement of Assets and Liabilities.
Schwab Equity Index Funds | Annual Report161
Schwab Equity Index Funds
Financial Notes (continued)
2. Significant Accounting Policies (continued):
(j) Indemnification:
Under the funds’ organizational documents, the officers and trustees are indemnified against certain liabilities arising out of the performance of their duties to the funds. In addition, in the normal course of business the funds enter into contracts with their vendors and others that provide general indemnifications. The funds’ maximum exposure under these arrangements is unknown as this would involve future claims that may be made against the funds. However, based on experience, the funds expect the risk of loss attributable to these arrangements to be remote.
(k) Regulatory Update:
Effective January 24, 2023, the SEC adopted rule and form amendments to require mutual funds and ETFs to transmit concise and visually engaging streamlined annual and semiannual reports to shareholders that highlight key information deemed important for retail investors to assess and monitor their fund investments. Other information, including financial statements, will no longer appear in a streamlined shareholder report but must be available online, delivered free of charge upon request, and filed on a semiannual basis on Form N-CSR. The rule and form amendments have a compliance date of July 24, 2024. At this time, management is evaluating the impact of these rule and form amendment changes on the content of the current shareholder report and the newly created annual and semiannual streamlined shareholder reports.
3. Risk Factors:Investing in the funds may involve certain risks, as discussed in the funds’ prospectuses, including, but not limited to, those described below. Any of these risks could cause an investor to lose money.
Market Risk. Financial markets rise and fall in response to a variety of factors, sometimes rapidly and unpredictably. Markets may be impacted by economic, political, regulatory and other conditions, including economic sanctions and other government actions. In addition, the occurrence of global events, such as war, terrorism, environmental disasters, natural disasters and epidemics, may also negatively affect the financial markets. As with any investment whose performance is tied to these markets, the value of an investment in a fund will fluctuate, which means that an investor could lose money over short or long periods.
Equity Risk. The prices of equity securities rise and fall daily. These price movements may result from factors affecting individual companies, industries or the securities market as a whole. In addition, equity markets tend to move in cycles, which may cause stock prices to fall over short or extended periods of time.
Investment Style Risk. The funds are index funds. Therefore, each fund follows the securities included in its respective index during upturns as well as downturns. Because of its indexing strategy, a fund does not take steps to reduce market exposure or to lessen the effects of a declining market. In addition, because of a fund’s expenses, a fund’s performance may be below that of the index. Errors relating to the index may occur from time to time and may not be identified by the index provider for a period of time. In addition, market disruptions could cause delays in an index’s rebalancing schedule. Such errors and/or market disruptions may result in losses for a fund.
Tracking Error Risk. As index funds, each fund seeks to track the performance of its respective index, although it may not be successful in doing so. The divergence between the performance of a fund and the index, positive or negative, is called “tracking error.” Tracking error can be caused by many factors and it may be significant.
Sampling Index Tracking Risk. To the extent a fund uses sampling techniques, a fund will not fully replicate its index and may hold securities not included in the index. As a result, a fund will be subject to the risk that the investment adviser’s investment strategy, the implementation of which is subject to a number of constraints, may not produce the intended results. If a fund utilizes a sampling approach, it may not track the return of the index as well as it would if the fund purchased all of the securities in the index.
Concentration Risk. To the extent that a fund’s or its respective index’s portfolio is concentrated in the securities of issuers in a particular market, industry, group of industries, sector, country or asset class, the fund may be adversely affected by the performance of those securities, may be subject to increased price volatility and may be more vulnerable to adverse economic, market, political or regulatory occurrences affecting that market, industry, group of industries, sector, country or asset class.
Market Capitalization Risk. Securities issued by companies of different market capitalizations tend to go in and out of favor based on market and economic conditions. During a period when securities of a particular market capitalization fall behind other types of investments, the fund’s performance could be impacted.
Large-Cap Company Risk. Large-cap companies are generally more mature and the securities issued by these companies may not be able to reach the same levels of growth as the securities issued by small- or mid-cap companies.
162
Schwab Equity Index Funds | Annual Report
Schwab Equity Index Funds
Financial Notes (continued)
3. Risk Factors (continued):
Mid-Cap Company Risk. Mid-cap companies may be more vulnerable to adverse business or economic events than larger, more established companies and the value of securities issued by these companies may move sharply.
Small-Cap Company Risk. Securities issued by small-cap companies may be riskier than those issued by larger companies, and their prices may move sharply, especially during market upturns and downturns.
Growth Investing Risk. Growth stocks can be volatile. Growth companies usually invest a high portion of earnings in their businesses and may lack the dividends of value stocks that can cushion stock prices in a falling market. The prices of growth stocks are based largely on projections of the issuer’s future earnings and revenues. If a company’s earnings or revenues fall short of expectations, its stock price may fall dramatically. Growth stocks may also be more expensive relative to their earnings or assets compared to value or other stocks.
Value Investing Risk. Certain funds emphasize a “value” style of investing, which targets undervalued companies with characteristics for improved valuations. This style of investing is subject to the risk that the valuations never improve or that the returns on “value” securities may not move in tandem with the returns on other styles of investing or the stock market in general.
Foreign Investment Risk. A fund’s investments in securities of foreign issuers involve certain risks that may be greater than those associated with investments in securities of U.S. issuers. These include risks of adverse changes in foreign economic, political, regulatory and other conditions; changes in currency exchange rates or exchange control regulations (including limitations on currency movements and exchanges); the imposition of economic sanctions or other government restrictions; differing accounting, auditing, financial reporting and legal standards and practices; differing securities market structures; and higher transaction costs. These risks may negatively impact the value or liquidity of a fund’s investments, and could impair the fund’s ability to meet its investment objective or invest in accordance with its investment strategy. There is a risk that investments in securities denominated in, and/or receiving revenues in, foreign currencies will decline in value relative to the U.S. dollar. Foreign securities also include American Depositary Receipts, Global Depositary Receipts (GDRs) and European Depositary Receipts, which may be less liquid than the underlying shares in their primary trading market, and GDRs, in particular, many of which are issued by companies in emerging markets, may be more volatile. To the extent a fund’s investments in a single country or a limited number of countries represent a large percentage of the fund’s assets, the fund’s performance may be adversely affected by the economic, political, regulatory and social conditions in those countries, and the fund’s price may be more volatile than the price of a fund that is geographically diversified.
Derivatives Risk. A fund may use derivatives to enhance returns or hedge against market declines. Examples of derivatives are futures and options on futures. An option is the right to buy or sell an instrument at a specific price before a specific date. A future is an agreement to buy or sell a financial instrument at a specific price on a specific day. The use of derivatives that are subject to regulation by the Commodity Futures Trading Commission (CFTC) could cause a fund to become a commodity pool, which would require the fund to comply with certain CFTC rules.
A fund’s use of derivative instruments involves risks different from, or possibly greater than, the risks associated with investing directly in securities and other traditional investments. Certain of these risks, such as liquidity risk and market risk, are discussed elsewhere in this section. A fund’s use of derivatives is also subject to lack of availability risk, credit risk, leverage risk, valuation risk, correlation risk and tax risk. Lack of availability risk is the risk that suitable derivative transactions may not be available in all circumstances for risk management or other purposes. Credit risk is the risk that the counterparty to a derivatives transaction may not fulfill its obligations. Leverage risk is the risk that a small percentage of assets invested in derivatives can have a disproportionately large impact on a fund. Valuation risk is the risk that a particular derivative may be valued incorrectly. Correlation risk is the risk that changes in the value of the derivative may not correlate perfectly with the underlying asset, rate or index. Tax risk is the risk that the use of derivatives may cause a fund to realize higher amounts of short-term capital gains. A fund’s use of derivatives could reduce the fund’s performance, increase its volatility and cause the fund to lose more than the initial amount invested. A fund’s use of derivatives also could create a risk of counterparty default under certain transactions, risks that the fund would need to liquidate portfolio positions when it may not be advantageous to do so in order to meet margin and payment obligations, and legal risks relating to insufficient documentation, insufficient capacity or authority of a counterparty, or legality or enforceability of a contract.
Liquidity Risk. A fund may be unable to sell certain securities, such as illiquid securities, readily at a favorable time or price, or the fund may have to sell them at a loss.
Securities Lending Risk. Securities lending involves the risk of loss of rights in, or delay in recovery of, the loaned securities if the borrower fails to return the security loaned or becomes insolvent.
Please refer to the funds’ prospectus for a more complete description of the principal risks of investing in the funds.
Schwab Equity Index Funds | Annual Report163
Schwab Equity Index Funds
Financial Notes (continued)
4. Affiliates and Affiliated Transactions:
Investment Adviser
Charles Schwab Investment Management Inc., dba Schwab Asset Management, a wholly owned subsidiary of The Charles Schwab Corporation, serves as each fund’s investment adviser and administrator pursuant to an Advisory Agreement between the investment adviser and each trust.
For its advisory and administrative services to the funds, the investment adviser is entitled to receive an annual fee, payable monthly, based on a percentage of each fund’s average daily net assets as follows:
| | SCHWAB SMALL-CAP INDEX FUND | SCHWAB TOTAL STOCK MARKET INDEX FUND | SCHWAB U.S. LARGE-CAP GROWTH INDEX FUND | SCHWAB U.S. LARGE-CAP VALUE INDEX FUND | SCHWAB U.S. MID-CAP INDEX FUND | SCHWAB INTERNATIONAL INDEX FUND |
| | | | | | | |
Investments from Affiliates
Certain funds in the Fund Complex may own shares of other funds in the Fund Complex. The table below reflects the percentages of shares of each fund in this report that are owned by other funds in the Fund Complex as of October 31, 2023, as applicable:
| |
| | SCHWAB SMALL-CAP INDEX FUND | SCHWAB U.S. LARGE-CAP GROWTH INDEX FUND | SCHWAB U.S. MID-CAP INDEX FUND | SCHWAB INTERNATIONAL INDEX FUND |
Schwab MarketTrack All Equity Portfolio | | | | | |
Schwab MarketTrack Balanced Portfolio | | | | | |
Schwab MarketTrack Conservative Portfolio | | | | | |
Schwab MarketTrack Growth Portfolio | | | | | |
| | | | | |
| | | | | |
| | | | | |
| | | | | |
| | | | | |
| | | | | |
| | | | | |
| | | | | |
| | | | | |
| | | | | |
| | | | | |
| | | | | |
Other Affiliated Transactions
The professional fees related to European Union foreign withholding tax claims discussed in financial note 2(d) are non-contingent and non-routine fees. The investment adviser agreed to pay these professional fees, on behalf of the Schwab International Index Fund, subject to reimbursement by the fund to the extent the fund is able to successfully recover taxes withheld in the future.
During the period ended October 31, 2023, the professional fees incurred by the Schwab International Index Fund and paid by the investment adviser were $18,786, as shown as Professional fees in the fund’s Statement of Operations.
164
Schwab Equity Index Funds | Annual Report
Schwab Equity Index Funds
Financial Notes (continued)
4. Affiliates and Affiliated Transactions (continued):
During the period ended October 31, 2023, the Schwab International Index Fund recovered previously withheld foreign taxes from Sweden. The payments received by Schwab International Index Fund amounted to $778,755 and is recorded as Dividends received from securities — unaffiliated in the Statement of Operations. The investment adviser paid upfront professional fees associated with recovering these foreign taxes in the amount of $19,449, which has been reimbursed to the investment adviser by the Schwab International Index Fund and is recorded as Dividends received from securities — unaffiliated in the fund’s Statement of Operations.
As of October 31, 2023, the balance of professional fees related to foreign withholding tax claims subject to future reimbursement by the Schwab International Index Fund to the investment adviser was $16,792.
No other amounts for additional foreign withholding tax claims are reflected in the financial statements due to the uncertainty surrounding the ultimate resolution of proceedings, the likelihood of receipt of these claims, and the potential timing of payment.
Interfund Transactions
The funds may engage in direct transactions with certain other funds in the Fund Complex in accordance with procedures adopted by the Board pursuant to Rule 17a-7 under the 1940 Act. When one fund is seeking to sell a security that another is seeking to buy, an interfund transaction can allow both funds to benefit by reducing transaction costs. This practice is limited to funds that share the same investment adviser, trustees and/or officers. For the period ended October 31, 2023, each fund’s purchases and sales of securities with other funds in the Fund Complex as well as any realized gains (losses) were as follows:
| | | |
Schwab S&P 500 Index Fund | | | |
| | | |
Schwab Small-Cap Index Fund | | | |
Schwab Total Stock Market Index Fund | | | |
Schwab U.S. Large-Cap Growth Index Fund | | | |
Schwab U.S. Large-Cap Value Index Fund | | | |
Schwab U.S. Mid-Cap Index Fund | | | |
Schwab International Index Fund | | | |
| | | |
Interfund Borrowing and Lending
Pursuant to an exemptive order issued by the SEC, the funds may enter into interfund borrowing and lending transactions with other funds in the Fund Complex. All loans are for temporary or emergency purposes and the interest rate to be charged will be the average of the overnight repurchase agreement rate and the short-term bank loan rate. All loans are subject to numerous conditions designed to ensure fair and equitable treatment of all participating funds. The interfund lending facility is subject to the oversight and periodic review by the Board. The funds had no interfund borrowing or lending activity during the period.
5. Board of Trustees:The Board may include people who are officers and/or directors of the investment adviser or its affiliates. Federal securities law limits the percentage of such “interested persons” who may serve on a trust’s board, and the trusts were in compliance with these limitations throughout the report period. The funds did not pay any interested persons or non-interested persons (independent trustees). The independent trustees are paid by the investment adviser. For information regarding the trustees, please refer to the Trustees and Officers table at the end of this report.
6. Borrowing from Banks:During the period, the funds were participants with other funds in the Fund Complex in a joint, syndicated, committed $1 billion line of credit (the Syndicated Credit Facility), which matured on September 28, 2023. On September 28, 2023, the Syndicated Credit Facility was amended to run for a new 364 day period with the line of credit amount remaining unchanged, maturing on September 26, 2024. Under the terms of the Syndicated Credit Facility, in addition to the investment adviser paying the interest charged on any borrowings by a fund, the investment adviser paid a commitment fee of 0.15% per annum on the funds’ proportionate share of the unused portion of the Syndicated Credit Facility.
Schwab Equity Index Funds | Annual Report165
Schwab Equity Index Funds
Financial Notes (continued)
6. Borrowing from Banks (continued):
During the period, the funds were participants with other funds in the Fund Complex in a joint, unsecured, uncommitted $400 million line of credit (the Uncommitted Credit Facility), with State Street Bank and Trust Company, which matured on September 28, 2023. On September 28, 2023, the Uncommitted Credit Facility was amended to run for a new 364 day period with the line of credit amount remaining unchanged, maturing on September 26, 2024. Under the terms of the Uncommitted Credit Facility, the investment adviser pays interest on the amount a fund borrows. There were no borrowings by any of the funds from either line of credit during the period.
The funds also have access to custodian overdraft facilities. A fund may have utilized the overdraft facility and incurred an interest expense, which is paid by the investment adviser. The interest expense is determined based on a negotiated rate above the current Federal Funds Rate.
7. Derivatives:The funds entered into equity index futures contracts during the report period. The funds invested in futures contracts to equitize available cash. The value and variation margin for futures contracts held at October 31, 2023, if any, are presented in each fund’s Portfolio Holdings and Statement of Assets and Liabilities, respectively. The net realized gains (losses) and net change in unrealized appreciation (depreciation) on futures contracts are presented in each fund’s Statement of Operations, if any. Refer to financial note 2(b) for the funds’ accounting policies with respect to futures contracts and financial note 3 for disclosures concerning the risks of investing in futures contracts. During the period ended October 31, 2023, the month-end average notional amounts of futures contracts held by the funds and the month-end average number of contracts held were as follows:
| | |
Schwab S&P 500 Index Fund | | |
| | |
Schwab Small-Cap Index Fund | | |
Schwab Total Stock Market Index Fund | | |
Schwab U.S. Large-Cap Growth Index Fund | | |
Schwab U.S. Large-Cap Value Index Fund | | |
Schwab U.S. Mid-Cap Index Fund | | |
Schwab International Index Fund | | |
8. Purchases and Sales of Investment Securities:For the period ended October 31, 2023, purchases and sales of securities (excluding in-kind transactions and short-term obligations) were as follows:
| | |
Schwab S&P 500 Index Fund | | |
| | |
Schwab Small-Cap Index Fund | | |
Schwab Total Stock Market Index Fund | | |
Schwab U.S. Large-Cap Growth Index Fund | | |
Schwab U.S. Large-Cap Value Index Fund | | |
Schwab U.S. Mid-Cap Index Fund | | |
Schwab International Index Fund | | |
166
Schwab Equity Index Funds | Annual Report
Schwab Equity Index Funds
Financial Notes (continued)
8. Purchases and Sales of Investment Securities (continued):
During the period ended October 31, 2023, the following funds had transactions in connection with in-kind transactions:
| IN-KIND PURCHASES
OF SECURITIES | IN-KIND SALES
OF SECURITIES |
Schwab S&P 500 Index Fund | | |
| | |
Schwab Small-Cap Index Fund | | |
Schwab U.S. Large-Cap Growth Index Fund | | |
Schwab U.S. Large-Cap Value Index Fund | | |
Schwab U.S. Mid-Cap Index Fund | | |
For the period ended October 31, 2023, where applicable, the funds realized net capital gains or losses resulting from in-kind redemptions. Because such gains or losses are not taxable to the funds and are not distributed to existing fund shareholders, the gains or losses are reclassified from accumulated net realized gains or losses to capital received from investors at the end of the funds’ tax year. These reclassifications have no effect on net assets or net asset values per share. The net realized gains or losses on sales of in-kind redemptions for the period ended October 31, 2023, are disclosed in the funds’ Statements of Operations, if any.
9. Federal Income Taxes:As of October 31, 2023, the tax basis cost of the funds’ investments and gross unrealized appreciation and depreciation were as follows:
| | GROSS UNREALIZED
APPRECIATION | GROSS UNREALIZED
DEPRECIATION | NET UNREALIZED
APPRECIATION
(DEPRECIATION) |
Schwab S&P 500 Index Fund | | | | |
| | | | |
Schwab Small-Cap Index Fund | | | | |
Schwab Total Stock Market Index Fund | | | | |
Schwab U.S. Large-Cap Growth Index Fund | | | | |
Schwab U.S. Large-Cap Value Index Fund | | | | |
Schwab U.S. Mid-Cap Index Fund | | | | |
Schwab International Index Fund | | | | |
| | | | |
| | | | |
As of October 31, 2023, the components of distributable earnings on a tax basis were as follows:
| UNDISTRIBUTED
ORDINARY
INCOME | NET UNREALIZED
APPRECIATION
(DEPRECIATION)
ON INVESTMENTS | NET OTHER UNREALIZED
APPRECIATION
(DEPRECIATION) | CAPITAL LOSS
CARRYFORWARDS
AND OTHER LOSSES | |
Schwab S&P 500 Index Fund | | | | | |
| | | | | |
Schwab Small-Cap Index Fund | | | | | |
Schwab Total Stock Market Index Fund | | | | | |
Schwab U.S. Large-Cap Growth Index Fund | | | | | |
Schwab U.S. Large-Cap Value Index Fund | | | | | |
Schwab U.S. Mid-Cap Index Fund | | | | | |
Schwab International Index Fund | | | | | |
Schwab Equity Index Funds | Annual Report167
Schwab Equity Index Funds
Financial Notes (continued)
9. Federal Income Taxes (continued):
The primary differences between book basis and tax basis unrealized appreciation or unrealized depreciation of investments are the tax deferral of losses on wash sales, the realization for tax purposes of unrealized appreciation or depreciation on futures contracts, the realization for tax purposes of unrealized appreciation on investments in PFICs and partnership investments. The tax cost of the funds’ investments, disclosed above, have been adjusted from their book amounts to reflect these unrealized appreciation or depreciation differences, as applicable.
Capital loss carryforwards have no expiration and may be used to offset future realized capital gains for federal income tax purposes. As of October 31, 2023, the funds had capital loss carryforwards available as follows:
| |
Schwab S&P 500 Index Fund | |
| |
Schwab Small-Cap Index Fund | |
Schwab Total Stock Market Index Fund | |
Schwab U.S. Large-Cap Growth Index Fund | |
Schwab U.S. Large-Cap Value Index Fund | |
Schwab U.S. Mid-Cap Index Fund | |
Schwab International Index Fund | |
The tax basis components of distributions paid during the current and prior fiscal years were as follows:
| CURRENT FISCAL YEAR END DISTRIBUTIONS | PRIOR FISCAL YEAR END DISTRIBUTIONS |
| | | | |
Schwab S&P 500 Index Fund | | | | |
| | | | |
Schwab Small-Cap Index Fund | | | | |
Schwab Total Stock Market Index Fund | | | | |
Schwab U.S. Large-Cap Growth Index Fund | | | | |
Schwab U.S. Large-Cap Value Index Fund | | | | |
Schwab U.S. Mid-Cap Index Fund | | | | |
Schwab International Index Fund | | | | |
Distributions paid to shareholders are based on net investment income and net realized gains determined on a tax basis, which may differ from net investment income and net realized gains for financial reporting purposes. These differences reflect the differing character of certain income items and net realized gains and losses for financial statement and tax purposes, and may result in reclassification among certain capital accounts in the financial statements. The funds may also designate a portion of the amount paid to redeeming shareholders as a distribution for tax purposes.
Permanent book and tax basis differences may result in reclassifications between components of net assets as required. The adjustments will have no impact on net assets or the results of operations.
As of October 31, 2023, management has reviewed the tax positions for open periods (for federal purposes, three years from the date of filing and for state purposes, four years from the date of filing) as applicable to the funds, and has determined that no provision for income tax is required in the funds’ financial statements. The funds recognize interest and penalties, if any, related to unrecognized tax benefits as income tax expense in each fund’s Statement of Operations. During the fiscal year ended October 31, 2023, the funds did not incur any interest or penalties.
10. Subsequent Events:Management has determined there are no subsequent events or transactions through the date the financial statements were issued that would have materially impacted the financial statements as presented.
168
Schwab Equity Index Funds | Annual Report
Schwab Equity Index Funds
Report of Independent Registered Public Accounting Firm
To the Board of Trustees of Schwab Investments and Schwab Capital Trust and Shareholders of Schwab 1000 Index Fund, Schwab S&P 500 Index Fund, Schwab Small-Cap Index Fund, Schwab Total Stock Market Index Fund, Schwab U.S. Large-Cap Growth Index Fund, Schwab U.S. Large-Cap Value Index Fund, Schwab U.S. Mid-Cap Index Fund, and Schwab International Index Fund:
Opinion on the Financial Statements and Financial Highlights
We have audited the accompanying statements of assets and liabilities, including the portfolio holdings, of Schwab 1000 Index Fund, one of the funds constituting Schwab Investments, and Schwab S&P 500 Index Fund, Schwab Small-Cap Index Fund, Schwab Total Stock Market Index Fund, Schwab U.S. Large-Cap Growth Index Fund, Schwab U.S. Large-Cap Value Index Fund, Schwab U.S. Mid-Cap Index Fund, and Schwab International Index Fund, seven of the funds constituting Schwab Capital Trust, (collectively, the “Funds”) as of October 31, 2023, the related statements of operations for the year then ended, the statements of changes in net assets for each of the two years in the period then ended, the financial highlights for each of the four years in the period then ended, and the related notes. In our opinion, the financial statements and financial highlights present fairly, in all material respects, the financial position of each of the Funds constituting the Schwab Investments and the Schwab Capital Trust as of October 31, 2023, and the results of their operations for the year then ended, the changes in their net assets for each of the two years in the period then ended, and the financial highlights for each of the four years in the period then ended in conformity with accounting principles generally accepted in the United States of America. The financial highlights for the year ended October 31, 2019 were audited by other auditors, whose report, dated December 16, 2019, expressed an unqualified opinion on such financial highlights.
Basis for Opinion
These financial statements and financial highlights are the responsibility of the Funds’ management. Our responsibility is to express an opinion on the Funds’ financial statements and financial highlights based on our audits. We are a public accounting firm registered with the Public Company Accounting Oversight Board (United States) (PCAOB) and are required to be independent with respect to the Funds in accordance with the U.S. federal securities laws and the applicable rules and regulations of the Securities and Exchange Commission and the PCAOB.
We conducted our audits in accordance with the standards of the PCAOB. Those standards require that we plan and perform the audit to obtain reasonable assurance about whether the financial statements and financial highlights are free of material misstatement, whether due to error or fraud. The Funds are not required to have, nor were we engaged to perform, an audit of their internal control over financial reporting. As part of our audits, we are required to obtain an understanding of internal control over financial reporting but not for the purpose of expressing an opinion on the effectiveness of the Funds’ internal control over financial reporting. Accordingly, we express no such opinion.
Our audits included performing procedures to assess the risks of material misstatement of the financial statements and financial highlights, whether due to error or fraud, and performing procedures that respond to those risks. Such procedures included examining, on a test basis, evidence regarding the amounts and disclosures in the financial statements and financial highlights. Our audits also included evaluating the accounting principles used and significant estimates made by management, as well as evaluating the overall presentation of the financial statements and financial highlights. Our procedures included confirmation of securities owned as of October 31, 2023, by correspondence with the custodian and brokers; when replies were not received from brokers, we performed other auditing procedures. We believe that our audits provide a reasonable basis for our opinion.
Deloitte & Touche LLP
Denver, Colorado
December 15, 2023
We have served as the auditor of one or more investment companies in the Schwab Funds Complex since 2020.
Schwab Equity Index Funds | Annual Report169
Schwab Equity Index Funds
Other Federal Tax Information (unaudited)
Schwab International Index Fund may elect to pass through under section 853(a) of the Internal Revenue Code the foreign tax credit of $20,565,478 to its shareholders for the fiscal year ended October 31, 2023. The respective foreign source income on the fund is $285,732,023.
For corporate shareholders, the following percentage of the funds’ dividend distributions paid during the fiscal year ended October 31, 2023, qualify for the corporate dividends received deduction:
| |
Schwab S&P 500 Index Fund | |
| |
Schwab Small-Cap Index Fund | |
Schwab Total Stock Market Index Fund | |
Schwab U.S. Large-Cap Growth Index Fund | |
Schwab U.S. Large-Cap Value Index Fund | |
Schwab U.S. Mid-Cap Index Fund | |
Schwab International Index Fund | |
For the fiscal year ended October 31, 2023, the funds designate the following amounts of the dividend distributions as qualified dividends for the purpose of the maximum rate under 1(h)(11) of the Internal Revenue Code. Shareholders will be notified in January 2024 via IRS Form 1099 of the amounts for use in preparing their 2023 income tax return.
Schwab S&P 500 Index Fund | |
| |
Schwab Small-Cap Index Fund | |
Schwab Total Stock Market Index Fund | |
Schwab U.S. Large-Cap Growth Index Fund | |
Schwab U.S. Large-Cap Value Index Fund | |
Schwab U.S. Mid-Cap Index Fund | |
Schwab International Index Fund | |
Under section 852(b)(3)(C) of the Internal Revenue Code, the funds hereby designate the following amounts as long-term capital gain dividends for the fiscal year ended October 31, 2023:
Schwab S&P 500 Index Fund | |
| |
Schwab Small-Cap Index Fund | |
Schwab Total Stock Market Index Fund | |
Schwab U.S. Large-Cap Growth Index Fund | |
Schwab U.S. Large-Cap Value Index Fund | |
Schwab U.S. Mid-Cap Index Fund | |
Schwab International Index Fund | |
For the fiscal year ended October 31, 2023, the funds designate the following amounts as dividends eligible for the 20% qualified business income deduction under section 199A of the Internal Revenue Code. Shareholders will be notified in January 2024 via IRS Form 1099 of the amounts for use in preparing their 2023 income tax return.
Schwab S&P 500 Index Fund | |
| |
Schwab Small-Cap Index Fund | |
Schwab Total Stock Market Index Fund | |
Schwab U.S. Large-Cap Growth Index Fund | |
Schwab U.S. Large-Cap Value Index Fund | |
Schwab U.S. Mid-Cap Index Fund | |
Schwab International Index Fund | |
170
Schwab Equity Index Funds | Annual Report
Schwab Equity Index Funds
Liquidity Risk Management Program (unaudited)
The funds have adopted and implemented a liquidity risk management program (the “program”) as required by Rule 22e-4 under the Investment Company Act of 1940, as amended. The funds’ Board of Trustees (the “Board”) has designated the funds’ investment adviser, Charles Schwab Investment Management, Inc., dba Schwab Asset Management, as the administrator of the program. Personnel of the investment adviser or its affiliates conduct the day-to-day operation of the program.
Under the program, the investment adviser manages a fund’s liquidity risk, which is the risk that the fund could not meet shareholder redemption requests without significant dilution of remaining shareholders’ interests in the fund. The program is reasonably designed to assess and manage a fund’s liquidity risk, taking into consideration the fund’s investment strategy and the liquidity of its portfolio investments during normal and reasonably foreseeable stressed conditions; its historical redemption history and shareholder concentrations; and its cash holdings and access to other funding sources, including the custodian overdraft facility and lines of credit. The investment adviser’s process of determining the degree of liquidity of each fund’s investments is supported by third-party liquidity assessment vendors.
The funds’ Board reviewed a report at its meeting held on September 19, 2023 prepared by the investment adviser regarding the operation and effectiveness of the program for the period June 1, 2022, through May 31, 2023, which included individual fund liquidity risk metrics. The report summarized the operation of the program and the information and factors considered by the investment adviser in assessing whether the program has been adequately and effectively implemented with respect to a fund. In addition, the investment adviser provided its assessment that the program had been operating effectively in managing each fund’s liquidity risk.
Schwab Equity Index Funds | Annual Report171
Schwab Equity Index Funds
Investment Advisory Agreement Approval
The Investment Company Act of 1940, as amended (the 1940 Act), requires that the continuation of a fund’s investment advisory agreement must be specifically approved (1) by the vote of the trustees or by a vote of the shareholders of the fund, and (2) by the vote of a majority of the trustees who are not parties to the investment advisory agreement or “interested persons” of any party thereto (the Independent Trustees), cast in person at a meeting called for the purpose of voting on such approval. In connection with such approvals, the fund’s trustees must request and evaluate, and the investment adviser is required to furnish, such information as may be reasonably necessary to evaluate the terms of the investment advisory agreement.
The Board of Trustees (the Board or the Trustees, as appropriate) calls and holds one or more meetings each year that are dedicated, in whole or in part, to considering whether to renew the amended and restated investment advisory and administration agreements (the Agreements) between Schwab Capital Trust and Schwab Investments (collectively, the Trusts) and Charles Schwab Investment Management, Inc. (dba Schwab Asset Management) (the investment adviser) with respect to the existing funds in the Trusts, including Schwab S&P 500 Index Fund, Schwab 1000 Index Fund, Schwab Small-Cap Index Fund, Schwab Total Stock Market Index Fund, Schwab International Index Fund, Schwab U.S. Large-Cap Growth Index Fund, Schwab U.S. Large-Cap Value Index Fund, and Schwab U.S. Mid-Cap Index Fund (each, a Fund and collectively, the Funds), and to review certain other agreements pursuant to which the investment adviser provides investment advisory services to certain other registered investment companies. In preparation for the meeting(s), the Board requests and reviews a wide variety of materials provided by the investment adviser, including information about the investment adviser’s affiliates, personnel, business goals and priorities, profitability, third-party oversight, corporate structure and operations. As part of the renewal process, the Independent Trustees’ legal counsel, on behalf of the Independent Trustees, sends an information request letter to the investment adviser seeking certain relevant information. The responses by the investment adviser are provided to the Trustees in the Board materials for their review prior to their meeting, and the Trustees are provided with the opportunity to request any additional materials. The Board also receives data provided by an independent provider of investment company data. This information is in addition to the detailed information about the Funds that the Board reviews during the course of each year, including information that relates to the Funds’ operations and performance, legal and compliance matters, risk management, portfolio turnover, and sales and marketing activity. In considering the renewal, the Independent Trustees receive advice from Independent Trustees’ legal counsel, including a memorandum regarding the responsibilities of
trustees for the approval of investment advisory agreements. In addition, the Independent Trustees participate in question and answer sessions with representatives of the investment adviser and meet in executive session outside the presence of Fund management.
The Board, including a majority of the Independent Trustees, considered information specifically relating to the continuance of the Agreements with respect to the Funds at meetings held on April 27, 2023 and June 7, 2023, and approved the renewal of the Agreements with respect to the Funds for an additional one-year term at the meeting on June 7, 2023 called for the purpose of voting on such approval.
The Board’s approval of the continuance of the Agreements with respect to the Funds was based on consideration and evaluation of a variety of specific factors discussed at these meetings and at prior meetings, including:
1.
the nature, extent and quality of the services provided to each Fund under the Agreements, including the resources of the investment adviser and its affiliates dedicated to the Funds;
2.
each Fund’s investment performance and how it compared to that of certain other comparable mutual funds and benchmark data;
3.
each Fund’s expenses and how those expenses compared to those of certain other similar mutual funds;
4.
the profitability of the investment adviser and its affiliates, including Charles Schwab & Co., Inc. (Schwab), with respect to each Fund, including both direct and indirect benefits accruing to the investment adviser and its affiliates; and
5.
the extent to which economies of scale would be realized as each Fund grows and whether fee levels in the Agreements reflect those economies of scale for the benefit of Fund investors.
Nature, Extent and Quality of Services. The Board considered the nature, extent and quality of the services provided by the investment adviser to the Funds and the resources of the investment adviser and its affiliates dedicated to the Funds. In this regard, the Trustees evaluated, among other things, the investment adviser’s experience, track record, compliance program, resources dedicated to hiring and retaining skilled personnel and specialized talent, and information security resources. The Trustees also considered information provided by the investment adviser relating to services and support provided with respect to each Fund’s portfolio management team, portfolio strategy, and internal investment guidelines, as well as trading infrastructure, liquidity management, product design and analysis, shareholder communications, securities valuation, and vendor and risk oversight. The Trustees also
172
Schwab Equity Index Funds | Annual Report
Schwab Equity Index Funds
considered investments the investment adviser has made in its infrastructure, including modernizing the investment adviser’s technology and use of data, increasing expertise in key areas (including portfolio management and trade operations), and improving business continuity, cybersecurity, due diligence, risk management processes, and information security programs, which are designed to provide enhanced services to the Funds and their shareholders. The Trustees considered Schwab’s overall financial condition and its reputation as a full service brokerage firm, as well as the wide range of products, services, and account features that benefit Fund shareholders who are brokerage clients of Schwab. Following such evaluation, the Board concluded, within the context of its full deliberations, that the nature, extent and quality of services provided by the investment adviser to the Funds and the resources of the investment adviser and its affiliates dedicated to the Funds supported renewal of the Agreements with respect to the Funds.
Fund Performance. The Board considered each Fund’s performance in determining whether to renew the Agreements with respect to such Fund. Specifically, the Trustees considered each Fund’s performance relative to a peer category of other mutual funds and applicable indices/benchmarks, in light of total return and the market environment, as well as in consideration of each Fund’s investment style and strategy. As part of this review, the Trustees considered the composition of the peer category, selection criteria and the reputation of the independent provider of investment company data who prepared the peer category analysis. In evaluating the performance of each Fund, the Trustees considered the risk profile for such Fund and such Fund’s demonstrated performance in tracking its benchmark index. The Trustees further considered the level of Fund performance in the context of their review of Fund expenses and the investment adviser’s profitability discussed below and also noted that the Board and a designated committee of the Board review performance throughout the year. Although Schwab Small-Cap Index Fund had performance that ranked in the fourth quartile of a relevant peer group for more than one performance period considered, the Board concluded that other factors relevant to performance supported renewal of the Agreement with respect to the Fund, including that the underperformance was attributable, to a significant extent, to investment decisions by the investment adviser that were reasonable and consistent with the Fund’s investment objective and policies and that the investment adviser had taken steps designed to help improve performance. Following such evaluation, the Board concluded, within the context of its full deliberations, that the performance of each Fund supported renewal of the Agreements with respect to such Fund.
Fund Expenses. With respect to each Fund’s expenses, the Trustees considered the rate of compensation called for by the Agreements, and each Fund’s operating expense ratio, in each case, in comparison to those of other similar mutual funds,
such peer groups and comparisons having been selected and calculated by an independent provider of investment company data. The investment adviser reported to the Board, and the Board took into account, the risk assumed by the investment adviser in the development of the Funds and provision of services as well as the competitive marketplace for financial products. The Trustees also considered fees charged by the investment adviser to ETFs, other mutual funds and to other types of accounts, but, with respect to such other types of accounts, accorded less weight to such comparisons due to the different legal, regulatory, compliance and operating features of mutual funds as compared to these other types of accounts, and any differences in the nature and scope of the services the investment adviser provides to these other accounts, as well as differences in the market for these types of accounts. Following such evaluation, the Board concluded, within the context of its full deliberations, that the expenses of each Fund are reasonable and supported renewal of the Agreements with respect to such Fund.
Profitability. The Trustees considered the compensation flowing to the investment adviser and its affiliates, directly or indirectly and reviewed profitability on a pre-tax basis, without regard to distribution expenses. The Trustees reviewed the profitability of the investment adviser relating to the Schwab fund complex as a whole, noting the benefits to Fund shareholders of being part of the Schwab fund complex, including the allocations of certain costs across the Funds and other funds in the complex. The Trustees also considered any other benefits derived by the investment adviser from its relationship with the Funds, such as whether, by virtue of its management of the Funds, the investment adviser obtains investment information or other research resources that aid it in providing advisory services to other clients. The Trustees considered whether the compensation and profitability with respect to the Funds under the Agreements and other service agreements were reasonable in light of the quality of all services rendered to the Funds by the investment adviser and its affiliates. The Trustees noted that the investment adviser continues to invest substantial sums in its business in order to provide enhanced research capabilities, services and systems to benefit the Funds. Based on this evaluation, the Board concluded, within the context of its full deliberations, that the profitability of the investment adviser with respect to each Fund is reasonable and supported renewal of the Agreements with respect to such Fund.
Economies of Scale. Although the Trustees recognized the difficulty of determining economies of scale with precision, and although the Funds do not have any breakpoints in their advisory fees, the Trustees considered the potential existence of any economies of scale by way of the relatively low advisory fee and unitary fee structure of the Funds and whether those are passed along to a Fund’s shareholders through (i) the enhancement of services provided to the Funds in return for fees paid, including through investments by the investment adviser in its infrastructure, including modernizing the
Schwab Equity Index Funds | Annual Report173
Schwab Equity Index Funds
investment adviser’s technology and use of data, increasing expertise and capabilities in key areas (including portfolio and trade operations), and improving business continuity, cybersecurity, due diligence and information security programs, which are designed to provide enhanced services to the Funds and their shareholders; and (ii) pricing a fund to scale and keeping overall expenses down as the fund grows. The Trustees acknowledged that the investment adviser has invested in its infrastructure, as discussed above, over time and that the investment adviser’s internal costs of providing investment management, technology, administrative, legal and compliance services to the Funds continue to increase as a result of regulatory or other developments. Based on this evaluation, the Board concluded, within the context of its full deliberations, that each Fund obtains reasonable benefits from economies of scale.
* * * * * * * * * * * * * * * * * * * * * * * * * * * * * * * * * * * * * * * *
In the course of their deliberations, the Trustees may have accorded different weights to various factors and did not identify any particular information or factor that was all important or controlling. Based on the Trustees’ deliberation and their evaluation of the information described above, the Board, including all of the Independent Trustees, approved the continuation of the Agreements with respect to the Funds and concluded that the compensation under the Agreements with respect to the Funds is fair and reasonable in light of the services provided and the related expenses borne by the investment adviser and its affiliates and such other matters as the Trustees considered to be relevant in the exercise of their reasonable judgment.
174
Schwab Equity Index Funds | Annual Report
Schwab Equity Index Funds
Trustees and Officers
The tables below give information about the trustees and officers of Schwab Capital Trust and Schwab Investments, which includes the funds covered in this report. The “Fund Complex” includes The Charles Schwab Family of Funds, Schwab Capital Trust, Schwab Investments, Schwab Annuity Portfolios, Schwab Strategic Trust and Laudus Trust. The Fund Complex includes 106 funds.
The address for all trustees and officers is 211 Main Street, San Francisco, CA 94105. You can find more information about the trustees and officers in the funds’ Statement of Additional Information, which is available free by calling 1-877-824-5615.
|
Name, Year of Birth, and Position(s) with the trust (Terms of office, and length of Time Served1) | Principal Occupations During the Past Five Years | Number of Portfolios in Fund Complex Overseen by the Trustee | |
Michael J. Beer 1961 Trustee (Trustee of The Charles Schwab Family of Funds, Schwab Investments, Schwab Capital Trust, Schwab Annuity Portfolios, Schwab Strategic Trust and Laudus Trust since 2022) | Retired. Director, President and Chief Executive Officer (Dec. 2016 – Sept. 2019), Principal Funds (investment management). | | Director (2016 – 2019), Principal Funds, Inc. |
Robert W. Burns 1959 Trustee (Trustee of Schwab Strategic Trust since 2009; The Charles Schwab Family of Funds, Schwab Investments, Schwab Capital Trust, Schwab Annuity Portfolios and Laudus Trust since 2016) | Retired/Private Investor. | | |
Nancy F. Heller 1956 Trustee (Trustee of The Charles Schwab Family of Funds, Schwab Investments, Schwab Capital Trust, Schwab Annuity Portfolios, Schwab Strategic Trust and Laudus Trust since 2018) | | | |
David L. Mahoney 1954 Trustee (Trustee of The Charles Schwab Family of Funds, Schwab Investments, Schwab Capital Trust, Schwab Annuity Portfolios and Laudus Trust since 2011; Schwab Strategic Trust since 2016) | | | Director (2004 – present), Corcept Therapeutics Incorporated Director (2009 – 2021), Adamas Pharmaceuticals, Inc. Director (2003 – 2019), Symantec Corporation |
Jane P. Moncreiff 1961 Trustee (Trustee of The Charles Schwab Family of Funds, Schwab Investments, Schwab Capital Trust, Schwab Annuity Portfolios, Schwab Strategic Trust and Laudus Trust since 2019) | Consultant (2018 – present), Fulham Advisers LLC (management consulting); Chief Investment Officer (2009 – 2017), CareGroup Healthcare System, Inc. (healthcare). | | |
Schwab Equity Index Funds | Annual Report175
Schwab Equity Index Funds
Independent Trustees (continued) |
Name, Year of Birth, and Position(s) with the trust (Terms of office, and length of Time Served1) | Principal Occupations During the Past Five Years | Number of Portfolios in Fund Complex Overseen by the Trustee | |
Kimberly S. Patmore 1956 Trustee (Trustee of The Charles Schwab Family of Funds, Schwab Investments, Schwab Capital Trust, Schwab Annuity Portfolios, Schwab Strategic Trust and Laudus Trust since 2016) | Consultant (2008 – present), Patmore Management Consulting (management consulting). | | |
J. Derek Penn 1957 Trustee (Trustee of The Charles Schwab Family of Funds, Schwab Investments, Schwab Capital Trust, Schwab Annuity Portfolios, Schwab Strategic Trust and Laudus Trust since 2021) | Head of Equity Sales and Trading (2006 – 2018), BNY Mellon (financial services). | | |
|
Name, Year of Birth, and Position(s) with the trust (Terms of office, and length of Time Served1) | Principal Occupations During the Past Five Years | Number of Portfolios in Fund Complex Overseen by the Trustee | |
Walter W. Bettinger II2 1960 Chairman and Trustee (Trustee of The Charles Schwab Family of Funds, Schwab Investments, Schwab Capital Trust and Schwab Annuity Portfolios since 2008; Schwab Strategic Trust since 2009; Laudus Trust since 2010) | Co-Chairman of the Board (July 2022 – present), Director and Chief Executive Officer (Oct. 2008 – present) and President (Feb. 2007 – Oct. 2021), The Charles Schwab Corporation; President and Chief Executive Officer (Oct. 2008 – Oct. 2021) and Director (May 2008 – Oct. 2021), Charles Schwab & Co., Inc.; Co-Chairman of the Board (July 2022 – present) and Director (Apr. 2006 – present), Charles Schwab Bank, SSB; Co-Chairman of the Board (July 2022 – present) and Director (Nov. 2017 – present), Charles Schwab Premier Bank, SSB; Co-Chairman of the Board (July 2022 – present) and Director (July 2019 – present), Charles Schwab Trust Bank; Director (May 2008 – present), Chief Executive Officer (Aug. 2017 – present) and President (Aug. 2017 – Nov. 2021), Schwab Holdings, Inc.; Manager (Sept. 2023 – present), TD Ameritrade Holding LLC; Director (Oct. 2020 – Aug. 2023), TD Ameritrade Holding Corporation; Director (July 2016 – Oct. 2021), Charles Schwab Investment Management, Inc. | | Director (2008 – present), The Charles Schwab Corporation |
Richard A. Wurster2 1973 Trustee (Trustee of The Charles Schwab Family of Funds, Schwab Investments, Schwab Capital Trust, Schwab Annuity Portfolios, Schwab Strategic Trust and Laudus Trust since 2022) | President (Oct. 2021 – present) and Executive Vice President – Schwab Asset Management Solutions (Apr. 2019 – Oct. 2021), The Charles Schwab Corporation; President, Director (Oct. 2021 – present), Executive Vice President – Schwab Asset Management Solutions (July 2019 – Oct. 2021) and Senior Vice President – Advisory (May 2016 – July 2019), Charles Schwab & Co., Inc.; President (Nov. 2021 – present), Schwab Holdings, Inc.; Director (Oct. 2021 – present) and Chief Executive Officer (Nov. 2019 – Jan. 2022), Charles Schwab Investment Management, Inc.; Director, Chief Executive Officer and President (Mar. 2018 – Oct. 2022), Charles Schwab Investment Advisory, Inc.; Chief Executive Officer (July 2016 – Apr. 2018) and President (Mar. 2017 – Apr. 2018), ThomasPartners, Inc.; Chief Executive Officer (July 2016 – Apr. 2018), Windhaven Investment Management, Inc. | | |
176
Schwab Equity Index Funds | Annual Report
Schwab Equity Index Funds
|
Name, Year of Birth, and Position(s) with the trust (Terms of office, and length of Time Served3) | Principal Occupations During the Past Five Years |
Omar Aguilar 1970 Chief Executive Officer, President and Chief Investment Officer (Officer of The Charles Schwab Family of Funds, Schwab Investments, Schwab Capital Trust, Schwab Annuity Portfolios, Schwab Strategic Trust and Laudus Trust since 2011) | Chief Executive Officer (Jan. 2022 – present), President (Oct. 2023 – present), (Chief Investment Officer (Apr. 2011 – present) and Senior Vice President (Apr. 2011 – Jan. 2022), Charles Schwab Investment Management, Inc.; Director, Chief Executive Officer and President (Oct. 2022 – present), Charles Schwab Investment Advisory, Inc.; Chief Executive Officer (Sept. 2023 – present), President (Oct. 2023 – present), Chief Investment Officer (June 2011 – present) and Vice President (June 2011 – Sept. 2023), Schwab Funds, Laudus Trust and Schwab ETFs. |
Mark Fischer 1970 Chief Operating Officer (Officer of The Charles Schwab Family of Funds, Schwab Investments, Schwab Capital Trust, Schwab Annuity Portfolios, Schwab Strategic Trust and Laudus Trust since 2013) | Chief Operating Officer (Dec. 2020 – present) and Treasurer and Chief Financial Officer (Jan. 2016 – Dec. 2022), Schwab Funds, Laudus Trust and Schwab ETFs; Chief Financial Officer (Mar. 2020 – present), Chief Operating Officer (Oct. 2023 – present), Managing Director (Mar. 2023 – present) and Vice President (Oct. 2013 – Mar. 2023), Charles Schwab Investment Management, Inc. |
Dana Smith 1965 Treasurer and Chief Financial Officer (Officer of The Charles Schwab Family of Funds, Schwab Investments, Schwab Capital Trust, Schwab Annuity Portfolios, Schwab Strategic Trust and Laudus Trust since 2023) | Treasurer and Chief Financial Officer (Jan. 2023 – present) and Assistant Treasurer (Dec. 2015 – Dec. 2022), Schwab Funds, Laudus Trust and Schwab ETFs; Managing Director (Mar. 2023 – present), Vice President (Mar. 2022 – Mar. 2023) and Director (Oct. 2015 – Mar. 2022), Charles Schwab Investment Management, Inc.; Managing Director (May 2022 – present) and Vice President (Apr. 2022 – May 2022), Charles Schwab & Co., Inc. |
Patrick Cassidy 1964 Vice President and Chief Investment Officer (Officer of The Charles Schwab Family of Funds, Schwab Investments, Schwab Capital Trust, Schwab Annuity Portfolios, Schwab Strategic Trust and Laudus Trust since 2018) | Chief Investment Officer (Oct. 2023 – present) and Vice President (Feb. 2018 – present), Schwab Funds, Laudus Trust and Schwab ETFs; Managing Director (Mar. 2023 – present), Chief Investment Officer (Oct. 2023 – present), and Senior Vice President (Oct. 2012 – Mar. 2023), Charles Schwab Investment Management, Inc. |
William P. McMahon, Jr. 1972 Vice President and Chief Investment Officer (Officer of The Charles Schwab Family of Funds, Schwab Investments, Schwab Capital Trust, Schwab Annuity Portfolios, Schwab Strategic Trust and Laudus Trust since 2021) | Managing Director (Mar. 2023 – present), Senior Vice President (Jan. 2020 – Mar. 2023) and Chief Investment Officer (Jan. 2020 – present) Charles Schwab Investment Management, Inc.; Vice President and Chief Investment Officer (June 2021 – present), Schwab Funds, Laudus Trust and Schwab ETFs; Senior Vice President and Chief Investment Officer – ThomasPartners Strategies (Apr. 2018 – Dec. 2019), Charles Schwab Investment Advisory, Inc.; Senior Vice President and Chief Investment Officer (May 2001 – Apr. 2018), ThomasPartners, Inc. |
Catherine MacGregor 1964 Chief Legal Officer and Secretary, Schwab Funds and Schwab ETFs Chief Legal Officer, Vice President and Clerk, Laudus Trust (Officer of The Charles Schwab Family of Funds, Schwab Investments, Schwab Capital Trust, Schwab Annuity Portfolios and Laudus Trust since 2005; Schwab Strategic Trust since 2009) | Chief Legal Officer (Mar. 2022 – present), Managing Director (Mar. 2023 – present) and Vice President (Sept. 2005 – Mar. 2023), Charles Schwab Investment Management, Inc.; Managing Director (May 2022 – present) and Vice President (Aug. 2005 – May 2022), Charles Schwab & Co., Inc.; Vice President (Dec. 2005 – present) and Chief Legal Officer and Clerk (Mar. 2007 – present), Laudus Trust; Chief Legal Officer and Secretary (Oct. 2021 – present), Vice President (Nov. 2005 – Oct. 2021) and Assistant Secretary (June 2007 – Oct. 2021), Schwab Funds; Chief Legal Officer and Secretary (Oct. 2021 – present), Vice President and Assistant Secretary (Oct. 2009 – Oct. 2021), Schwab ETFs. |
1
Each Trustee shall hold office until the election and qualification of his or her successor, or until he or she dies, resigns or is removed. The retirement policy requires that each independent trustee retire by December 31 of the year in which the Trustee turns 74 or the Trustee’s twentieth year of service as an independent trustee on any trust in the Fund Complex, whichever occurs first.
2
Mr. Bettinger and Mr. Wurster are Interested Trustees. Mr. Bettinger and Mr. Wurster are Interested Trustees because each owns stock of The Charles Schwab Corporation (CSC), the parent company of Charles Schwab Investment Management, Inc., the investment adviser for the trusts in the Fund Complex, and is an employee of Charles Schwab & Co., Inc. (Schwab), the principal underwriter for The Charles Schwab Family of Funds, Schwab Investments, Schwab Capital Trust, Schwab Annuity Portfolios and Laudus Trust.
3
The President, Treasurer and Secretary/Clerk hold office until their respective successors are chosen and qualified or until he or she sooner dies, resigns, is removed or becomes disqualified. Each of the other officers serves at the pleasure of the Board.
Schwab Equity Index Funds | Annual Report177
Schwab Equity Index Funds
asset allocation The practice of dividing a portfolio among different asset classes, with each asset class assigned a particular percentage.
asset class A group of securities with similar structure and basic characteristics. Stocks, bonds and cash are the three main examples of asset classes.
Bloomberg US Aggregate Bond Index An index that is a broad-based benchmark measuring the performance of the U.S. investment grade, taxable bond market, including U.S. Treasuries, government-related and corporate bonds, mortgage pass-through securities, commercial mortgage-backed securities, and asset-backed securities that are publicly available for sale in the United States. To be eligible for inclusion in the index, securities must be fixed rate, non-convertible, U.S. dollar-denominated with at least $300 million or more of outstanding face value and have one or more years remaining to maturity. The index excludes certain types of securities, including tax-exempt state and local government series bonds, structured notes embedded with swaps or other special features, private placements, floating rate securities, inflation-linked bonds and Eurobonds. The index is market capitalization weighted and the securities in the index are updated on the last business day of each month.
Bloomberg US Treasury Bills 1–3 Month Index An index that includes all publicly issued zero-coupon U.S. Treasury Bills that have a remaining maturity of less than 3 months but more than 1 month, are rated investment grade and have $300 million or more of outstanding face value. It excludes zero-coupon STRIPS.
bond A security representing a loan from the investor to the issuer. A bond typically pays interest at a fixed rate (the coupon rate) until a specified date (the maturity date), at which time the issuer returns the money borrowed (principal or face value) to the bondholder. Because of their structure, bonds are sometimes called “fixed-income securities” or “debt securities.”
An individual bond is subject to the credit risk of the issuer. Changes in interest rates can affect a bond’s market value prior to call or maturity. There is no guarantee that a bond’s yield to call or maturity will provide a positive return over the rate of inflation.
bond fund A bond fund is subject to the same credit, interest rate, and inflation risks as bonds. In addition, a bond fund incurs ongoing fees and expenses. A bond fund’s net asset value will fluctuate with the price of the underlying bonds and the portfolio turnover activity; return of principal is not guaranteed.
cap, capitalization See “market cap.”
capital gain, capital loss the difference between the amount paid for an investment and its value at a later time. If the investment has been sold, the capital gain or loss is considered a realized gain or loss. If the investment is still held, the capital gain or loss is considered unrealized appreciation or depreciation.
Dow Jones U.S. Total Stock Market Index An index which includes all U.S. equity issues with readily available prices. The index is a float-adjusted market capitalization weighted index that reflects the shares of securities actually available to investors in the marketplace.
expense ratio The amount that is taken from a mutual fund’s assets each year to cover the fund’s operating expenses. An expense ratio of 0.50% means that a fund’s expenses amount to half of one percent of its average net assets a year.
market cap, market capitalization The value of a company as determined by the total value of all shares of its stock outstanding.
MSCI EAFE Index (Net) A free float-adjusted market capitalization index that is designed to measure the equity market performance of developed markets in Europe, Australasia, and the Far East. The Net version of the index reflects reinvested dividends net of withholding taxes, but reflects no deductions for expenses or other taxes; returns are calculated applying dividend withholding rates applicable to non-resident persons who do not benefit from double taxation treaties.
net asset value (NAV) The value of one share of a mutual fund. NAV is calculated by taking the fund’s total assets, subtracting liabilities, and dividing by the number of shares outstanding.
outstanding shares, shares outstanding When speaking of a company or mutual fund, indicates all shares currently held by investors.
price-to-book ratio (P/B) The market price of a company’s stock compared with its “book value.” A mutual fund’s P/B is the weighted average of the P/B of all stocks in the fund’s portfolio.
price-to-earnings ratio (P/E) The market price of a company’s stock compared with earnings over the past year. A mutual fund’s P/E is the weighted average of the P/E of all stocks in the fund’s portfolio.
restricted and illiquid securities Restricted securities are securities that are subject to legal restrictions on their sale. Restricted securities generally can be sold in privately negotiated transactions, pursuant to an exemption from registration under the Securities Act of 1933 (the 1933 Act), or in a registered public offering. Certain restricted securities, such as Section 4(a)(2) commercial paper and Rule 144A securities under the 1933 Act, may be considered to be liquid if they meet the criteria for liquidity established by the Board. Illiquid securities generally are any securities that cannot be disposed of promptly and in the ordinary course of business at approximately the amount at which a fund has valued the instruments. The liquidity of a fund’s investments is monitored under the supervision and direction of the Board. Investments currently not considered liquid include repurchase agreements not maturing within seven days and certain restricted securities.
return on equity (ROE) The average yearly rate of return for each dollar of investors’ money, measured over the past five years.
Russell 1000 Growth Index An index that measures the performance of those Russell 1000 Index companies with higher price-to-book ratios and higher forecasted growth values.
Russell 1000 Index An index that measures the performance of the 1,000 largest companies in the Russell 3000 Index, and represents approximately 92% of the total market capitalization of the Russell 3000 Index. The Russell 3000 Index measures the performance of the largest 3,000 U.S. companies representing approximately 98% of the investable U.S. equity market.
Russell 1000 Value Index An index that measures the performance of the large-cap value segment of the U.S. equity universe. It includes those Russell 1000 Index companies with lower price-to-book ratios and lower expected growth values.
Russell 2000 Index An index that measures the performance of the 2,000 smallest companies in the Russell 3000 Index. The Russell 3000 Index measures the performance of the largest 3,000 U.S. companies representing approximately 98% of the investable U.S. equity market.
178
Schwab Equity Index Funds | Annual Report
Schwab Equity Index Funds
Russell Midcap Index An index that measures the performance of the mid-cap segment of the U.S. equity universe. The Russell Midcap Index is a subset of the Russell 1000 Index. It includes approximately 800 of the smallest securities based on a combination of their market cap and current index membership.
S&P 500 Index An index that is designed to measure the performance of 500 leading publicly traded companies from a broad range of industries.
Schwab 1000 Index A float-adjusted market capitalization weighted index developed by Charles Schwab & Co., Inc. that represents the performance of the largest 1,000 publicly traded companies in the United States. As a result of corporate actions, the index may be comprised of more or less than 1,000 securities.
stock A share of ownership, or equity, in the issuing company.
total return The percentage that an investor would have earned or lost on an investment in the fund assuming dividends and distributions were reinvested.
weighted average For mutual funds, an average that gives the same weight to each security as the security represents in the fund’s portfolio.
yield The income paid out by an investment, expressed as a percentage of the investment’s market value.
Schwab Equity Index Funds | Annual Report179
Schwab Equity Index Funds
Schwab Asset Management
With a straightforward lineup of core products and solutions for building the foundation of a portfolio, Schwab Asset Management advocates for investors of all sizes with a steadfast focus on lowering costs and reducing unnecessary complexity. The list below shows all currently available Schwab Funds®.
Investors should carefully consider information contained in the prospectus, or if available, the summary prospectus, including investment objectives, risks, charges and expenses before investing. Please call 1-877-824-5615 for a prospectus for any Schwab Fund. Please read the prospectus carefully before you invest. This report must be preceded or accompanied by a current prospectus.
Proxy Voting Policies, Procedures and Results
A description of the proxy voting policies and procedures used to determine how to vote proxies on behalf of the funds is available without charge, upon request, by visiting the Schwab Funds’ website at www.schwabassetmanagement.com/schwabfunds_prospectus, the SEC’s website at www.sec.gov, or by contacting Schwab Funds at 1-877-824-5615.
Information regarding how a fund voted proxies relating to portfolio securities during the most recent twelve-month period ended June 30 is available, without charge, by visiting the fund’s website at www.schwabassetmanagement.com/schwabfunds_prospectus or the SEC’s website at www.sec.gov.
Schwab Funds
Equity Funds
Schwab Core Equity Fund
Schwab Dividend Equity Fund
Schwab Large-Cap Growth Fund
Schwab Small-Cap Equity Fund
Schwab Health Care Fund
Schwab International Core Equity Fund
Schwab International Opportunities Fund
Schwab Select Large Cap Growth Fund
Schwab Fundamental US Large Company Index Fund
Schwab Fundamental US Small Company Index Fund
Schwab Fundamental International Large Company Index Fund
Schwab Fundamental International Small Company Index Fund
Schwab Fundamental Emerging Markets Large Company Index Fund
Schwab Fundamental Global Real Estate Index Fund
Schwab Global Real Estate Fund
Schwab S&P 500 Index Fund
Schwab 1000 Index® Fund
Schwab Small-Cap Index Fund®
Schwab Total Stock Market Index Fund®
Schwab U.S. Large-Cap Growth Index Fund
Schwab U.S. Large-Cap Value Index Fund
Schwab U.S. Mid-Cap Index Fund
Schwab International Index Fund®
Asset Allocation Funds
Schwab Balanced Fund
Schwab MarketTrack Portfolios®
Schwab Target Funds
Schwab Target Index Funds
Schwab Monthly Income Funds
Bond Funds
Schwab Treasury Inflation Protected Securities Index Fund
Schwab U.S. Aggregate Bond Index Fund
Schwab Short-Term Bond Index Fund
Schwab Tax-Free Bond Fund1
Schwab California Tax-Free Bond Fund1
Schwab Opportunistic Municipal Bond Fund
Schwab Money Funds2
Schwab provides a broad choice of taxable and tax-exempt money market funds for both retail and institutional client types.
Investment Adviser
Charles Schwab Investment Management, Inc., dba Schwab Asset Management
211 Main Street, San Francisco, CA 94105
Funds
Schwab Funds
1-877-824-5615
© 2023 Charles Schwab & Co., Inc. All rights reserved.
Member SIPC®
Printed on recycled paper.
¹
State, local, and the Federal Alternative Minimum Tax may apply. Capital gains are not exempt from Federal Taxation.
²
You could lose money by investing in the Schwab Money Funds. All Schwab Money Funds with the exception of Schwab Variable Share Price Money Fund seek to preserve the value of your investment at $1.00 per share, but cannot guarantee they will do so. Because the share price of Schwab Variable Share Price Money Fund will fluctuate, when you sell your shares they may be worth more or less than what you originally paid for them. All Schwab Money Funds with the exception of Schwab Government Money Fund, Schwab Retirement Government Money Fund, Schwab U.S. Treasury Money Fund, Schwab Treasury Obligations Money Fund and Schwab Government Money Market Portfolio may impose a fee upon the sale of your shares if the Fund’s Board determines that the fee is in the best interests of the Fund. An investment in the Schwab Money Funds is not insured or guaranteed by the Federal Deposit Insurance Corporation or any other government agency. The Schwab Money Funds’ sponsor has no legal obligation to provide financial support to the Funds, and you should not expect that the sponsor will provide financial support to the Funds at any time.
This page is intentionally left blank.
Annual Report | October 31, 2023
Schwab Fundamental Index* Funds
Schwab Fundamental
US Large Company Index Fund
Schwab Fundamental
US Small Company Index Fund
Schwab Fundamental International
Large Company Index Fund
Schwab Fundamental International
Small Company Index Fund
Schwab Fundamental Emerging Markets
Large Company Index Fund
*
SCHWAB is a registered trademark of Charles Schwab & Co., Inc.
FUNDAMENTAL INDEX is a registered trademark of Research Affiliates LLC.
This page is intentionally left blank.
Schwab Fundamental Index Funds
Fund investment adviser: Charles Schwab Investment Management, Inc., dba Schwab Asset Management®
Distributor: Charles Schwab & Co., Inc. (Schwab)
The Sector/Industry classifications in this report use the Global Industry Classification Standard (GICS) which was developed by and is the exclusive property of MSCI Inc. (MSCI) and Standard & Poor’s (S&P). GICS is a service mark of MSCI and S&P and has been licensed for use by Schwab. The Industry classifications used in the Portfolio Holdings are sub-categories of Sector classifications.
Schwab Fundamental Index Funds | Annual Report1
Schwab Fundamental Index Funds
The performance data quoted represents past performance. Past performance does not guarantee future results. Investment returns and principal value of an investment will fluctuate so that an investor’s shares may be worth more or less than their original cost. Current performance may be lower or higher than performance data quoted. To obtain performance information current to the most recent month end, please visit www.schwabassetmanagement.com/schwabfunds_prospectus.
Total Return for the 12 Months Ended October 31, 2023 |
Schwab Fundamental US Large Company Index Fund (Ticker Symbol: SFLNX) | |
Russell RAFITM US Large Company Index | |
| |
Fund Category: Morningstar Large Value1 | |
| |
| |
Schwab Fundamental US Small Company Index Fund (Ticker Symbol: SFSNX) | |
Russell RAFITM US Small Company Index | |
| |
Fund Category: Morningstar Small Blend1 | |
| |
| |
Schwab Fundamental International Large Company Index Fund2 (Ticker Symbol: SFNNX) | |
Russell RAFITM Developed ex US Large Company Index | |
| |
Fund Category: Morningstar Foreign Large Value1 | |
| |
Total Return for the 12 Months Ended October 31, 2023 |
| |
Schwab Fundamental International Small Company Index Fund2 (Ticker Symbol: SFILX) | |
Russell RAFITM Developed ex US Small Company Index | |
S&P Developed ex-U.S. Small Cap Index (Net)3 | |
Fund Category: Morningstar Foreign Small/Mid Value1 | |
| |
| |
Schwab Fundamental Emerging Markets Large Company Index Fund2 (Ticker Symbol: SFENX) | |
Russell RAFITM Emerging Markets Large Company Index | |
MSCI Emerging Markets Index (Net)3 | |
Fund Category: Morningstar Diversified Emerging Markets1 | |
| |
All total returns on this page assume dividends and distributions were reinvested. Index figures do not include trading and management costs, which would lower performance. Indices are unmanaged and cannot be invested in directly. Performance results less than one year are not annualized.
The first index listed for each fund is the fund’s primary benchmark, as shown in the prospectus. Additional indices shown are provided for comparative purposes.
For index definitions, please see the Glossary.
Performance does not reflect the deduction of taxes that a shareholder would pay on fund distributions or on the redemption of fund shares.
Index ownership — The funds are not in any way sponsored, endorsed, sold or promoted by Frank Russell Company (Russell), by the London Stock Exchange Group companies (LSEG), or by Research Affiliates LLC (RA) (collectively the Licensor Parties), and none of the Licensor Parties make any warranty or representation whatsoever, expressly or impliedly, either as to the results to be obtained from the use of the Russell RAFITM Index Series (the Indices) or otherwise. The Indices are compiled and calculated by Russell in conjunction with RA. None of the Licensor Parties shall be liable (whether in negligence or otherwise) to any person for any error in the Indices and none of the Licensor Parties shall be under any obligation to advise any person of any error therein. “Russell®” is a trademark of Russell. The trade names “Research Affiliates®”, “Fundamental Index®” and “RAFI®” are registered trademarks of RA. Charles Schwab Investment Management, Inc. has obtained full license from Russell to use the Indices. For full disclaimer please see the funds’ statement of additional information.
1
Source for category information: Morningstar, Inc. The Morningstar Category return represents all active and index mutual funds and ETFs within the category as of the report date.
2
The fund’s performance relative to the index may be affected by fair-value pricing and timing differences in foreign exchange calculations. See financial note 2 for more information.
3
The net version of the index reflects reinvested dividends net of withholding taxes but reflects no deductions for expenses or other taxes.
2
Schwab Fundamental Index Funds | Annual Report
Schwab Fundamental Index Funds
The Investment Environment
For the 12-month reporting period ended October 31, 2023, U.S. equity markets were mixed, and international equity markets posted positive returns. U.S. stocks were volatile for the first half of the reporting period as inflation remained elevated, the U.S. Federal Reserve (Fed) continued to raise interest rates, and the failure of three U.S. regional banks in early March raised concerns about the stability of the banking sector. Despite these headwinds, as inflation began to ease, U.S. stocks staged a relatively steady upswing through August driven primarily by performance of the “Magnificent Seven” (Alphabet, Inc., Amazon.com, Inc., Apple, Inc., Meta Platforms, Inc., Microsoft Corp., NVIDIA Corp., and Tesla, Inc.). U.S. stocks, particularly dividend paying stocks, began to falter over the final two months of the reporting period as soaring U.S. Treasury yields offered investors attractive alternatives to stocks. Outside the U.S., the ongoing war between Russia and Ukraine and the Israel-Hamas war that broke out following Hamas’ attack on Israel in early October weighed on the global economy. The U.S. dollar, as measured against a basket of international currencies, generally weakened until mid-July, when it hit a reporting-period low, then began to rise but ended the reporting period weaker than where it began. For the reporting period, the S&P 500® Index, a bellwether for the overall U.S. stock market, returned 10.14%. U.S. large-cap stocks outperformed U.S. small-cap stocks, with the Russell 1000® Index and the Russell 2000® Index returning 9.48% and -8.56%, respectively. Among U.S. large-cap stocks, growth stocks outperformed value stocks, with the Russell 1000® Growth Index and the Russell 1000® Value Index returning 18.95% and 0.13%, respectively. Outside the U.S., the MSCI EAFE® Index (Net)*, a broad measure of developed international equity performance, returned 14.40% and the MSCI Emerging Markets Index (Net)* returned 10.80% for the reporting period.
Economies around the world grew out of sync as they wrestled with record levels of government debt, rising geopolitical tensions, and weak productivity gains that stifled economic growth. The U.S. economy continued to show unexpected resiliency. Surprisingly robust job growth and strong consumer spending helped propel U.S. gross domestic product (GDP) to a 5.2% annualized growth rate for the third quarter of 2023, up from roughly 2% over the prior three quarters. Inflation remained above the Fed’s historical 2% target over the reporting period but declined between November 2022 and June 2023 as rents and wage growth eased, profit margins declined, and monetary policy remained restrictive before ticking up slightly in July 2023 through September 2023. The unemployment rate
Asset Class Performance Comparison % returns during the 12 months ended October 31, 2023
Index figures assume dividends and distributions were reinvested. Index figures do not include trading and management costs, which would lower performance. Indices are unmanaged and cannot be invested in directly. Performance results less than one year are not annualized. Past performance is not a guarantee of future results.
For index definitions, please see the Glossary.
Data source: Index provider websites and Schwab Asset Management.
Nothing in this report represents a recommendation of a security by the investment adviser.
Management views may have changed since the report date.
*
The net version of the index reflects reinvested dividends net of withholding taxes but reflects no deductions for expenses or other taxes.
Schwab Fundamental Index Funds | Annual Report3
Schwab Fundamental Index Funds
The Investment Environment (continued)
remained low throughout the period despite inflationary pressures but did rise slightly in August and October. An increase in the labor force participation rate (the proportion of working-age Americans who have a job or are looking for one) in August and strike activity in October were large contributors to the increase in unemployment in the last three months of the reporting period.
Oil prices were volatile, ranging from a high of $92 per barrel at the beginning of the reporting period to a low of $66 and ending the period at just over $80 per barrel. Eurozone GDP growth contracted slightly in the fourth quarter of 2022 driven by manufacturing pressures and headwinds related to oil and commodity prices, was flat for the first quarter of 2023, expanded slightly for the second quarter of 2023 bolstered by a moderation in inflationary pressures, and contracted slightly for the third quarter of 2023 as financing conditions remained tight. The United Kingdom posted small gains in GDP growth throughout the reporting period, with household consumption expenditures and manufacturing output among key growth drivers. In Japan, following flat GDP growth in the fourth quarter of 2022, GDP rose for the first two quarters of 2023, primarily on rising exports and falling imports. Among emerging markets, China’s GDP grew throughout the reporting period as the government’s various policies seeking to help the economy have offset the impact of a prolonged property crisis and weak trade. India’s GDP grew in the fourth quarter of 2022 and the first two quarters of 2023, driven primarily by robust performance of the services sector along with strong consumer demand and increased government spending.
In its efforts to lower inflation, the Fed raised interest rates six times during the reporting period, increasing the federal funds rate from a range of 3.00% to 3.25% to a range of 5.25% to 5.50%. At its meetings in June, September, and October, the Fed maintained the then current rates, citing robust economic activity, strong—though moderating—job gains, and low unemployment while acknowledging tighter financial and credit conditions for households and businesses. The Fed also maintained its program to reduce the assets held on its balance sheet, though its balance sheet temporarily spiked in March 2023 when the Fed supported banks after the failure of three U.S. regional banks. Despite the spike, balance sheet assets declined over the reporting period. Central banks outside the United States also battled with persistently high, albeit waning, inflation. After raising rates eight times during the reporting period, the European Central Bank held its rate steady at its October meeting as inflation and pricing pressures finally showed signs of easing. Similarly, the Bank of England maintained its key official bank rate at its September meeting, after seven rate hikes during the reporting period, leaving borrowing costs at a 15-year high. In contrast, the Bank of Japan continued to uphold its short-term interest rate target of -0.1%, unchanged since 2016, despite inflationary pressures but relaxed its yield control policy. Monetary policies in emerging markets were mixed. Central banks in India, Indonesia, Mexico, Pakistan, and Russia all raised their rates two or more times over the reporting period. In contrast, both Brazil and China cut their key interest rates twice during the period.
4
Schwab Fundamental Index Funds | Annual Report
Schwab Fundamental Index Funds
| Christopher Bliss, CFA, Managing Director and Head of Passive Equity Strategies for Schwab Asset Management, is responsible for overseeing the investment process and portfolio management of investment strategies for passive equity Schwab Funds and Schwab ETFs, and Schwab Personalized Indexing™ separately managed accounts. Before joining Schwab in 2016, Mr. Bliss spent 12 years at BlackRock (formerly Barclays Global Investors) managing and leading institutional index teams, most recently as a managing director and the head of the Americas institutional index team. In this role, Mr. Bliss was responsible for overseeing a team of portfolio managers managing domestic, developed international and emerging markets index strategies. Prior to BlackRock, he worked as an equity analyst and portfolio manager for Harris Bretall and before that, as a research analyst for JP Morgan. |
| Jeremy Brown, CFA, Senior Portfolio Manager for Schwab Asset Management, is responsible for the day-to-day co-management of the Schwab Fundamental US Large Company Index Fund and Schwab Fundamental US Small Company Index Fund. Prior to joining Schwab in 2017, Mr. Brown spent six years with ALPS Advisors, Inc. in Denver, most recently as a senior analyst on the ETF portfolio management and research team where he performed portfolio management, trading, and analytics/research functions for ALPS ETFs and passive funds. Additionally, Mr. Brown led a number of investment research, commentary, industry trend analysis, and sales and marketing support initiatives. |
| Ferian Juwono, CFA, Senior Portfolio Manager for Schwab Asset Management, is responsible for the oversight and day-to-day co-management of the Schwab Fundamental US Large Company Index Fund and Schwab Fundamental US Small Company Index Fund. Prior to joining Schwab in 2010, Mr. Juwono worked at BlackRock (formerly Barclays Global Investors) where he spent more than three years as a portfolio manager, managing equity index funds for institutional clients, and two years as a senior business analyst. Prior to that, Mr. Juwono worked for more than four years as a senior financial analyst with Union Bank of California. |
| David Rios, Portfolio Manager for Schwab Asset Management, is responsible for the day-to-day co-management of the Schwab Fundamental International Large Company Index Fund, Schwab Fundamental International Small Company Index Fund, and Schwab Fundamental Emerging Markets Large Company Index Fund. Prior to this role, Mr. Rios was an associate portfolio manager on the equity index strategies team for four years. His first role with Schwab Asset Management was as a trade operations specialist. Prior to joining Schwab in 2008, Mr. Rios was a senior fund accountant at Investors Bank & Trust (subsequently acquired by State Street Corporation). |
| Agnes Zau, CFA, Portfolio Manager for Schwab Asset Management, is responsible for the day-to-day co-management of the Schwab Fundamental US Large Company Index Fund and Schwab Fundamental US Small Company Index Fund. Prior to joining Schwab in 2018, Ms. Zau was at BlackRock for three years, most recently as a multi-asset portfolio investment consultant where she advised institutional clients on asset allocation and strategy, constructed risk decomposition and portfolio optimization, and conducted scenario analyses for the core multi-asset target risk strategies. She spent the preceding three years as a derivatives specialist at Mellon Capital. |
Schwab Fundamental Index Funds | Annual Report5
Schwab Fundamental US Large Company Index Fund as of October 31, 2023
The Schwab Fundamental US Large Company Index Fund (the fund) seeks investment results that correspond generally (before fees and expenses) to the total return of the Russell RAFITM US Large Company Index (the index). The index measures the performance of the large company size segment by fundamental overall company scores, which are created using as the universe the U.S. companies in the FTSE Global Total Cap Index. To pursue its investment objective, the fund uses a replication investment approach and generally gives the same weight to a given stock as the index does. For more information concerning the fund’s investment objective, strategies, and risks, please see the fund’s prospectus.
Market Highlights. For the 12-month reporting period ended October 31, 2023, U.S. equity markets were mixed, and international equity markets posted positive returns. U.S. stocks were volatile for the first half of the reporting period as inflation remained elevated, the U.S. Federal Reserve (Fed) continued to raise interest rates, and the failure of three U.S. regional banks in early March raised concerns about the stability of the banking sector. Despite these headwinds, as inflation began to ease, U.S. stocks staged a relatively steady upswing through August driven primarily by performance of the “Magnificent Seven” (Alphabet, Inc., Amazon.com, Inc., Apple, Inc., Meta Platforms, Inc., Microsoft Corp., NVIDIA Corp., and Tesla, Inc.). U.S. stocks, particularly dividend paying stocks, began to falter over the final two months of the reporting period as soaring U.S. Treasury yields offered investors attractive alternatives to stocks. Outside the U.S., the ongoing war between Russia and Ukraine and the Israel-Hamas war that broke out following Hamas’ attack on Israel in early October weighed on the global economy. U.S. large-cap stocks outperformed U.S. small-cap stocks and among U.S. large-cap stocks, growth stocks outperformed value stocks.
Performance. The fund generally tracked the index for the reporting period. The fund returned 4.48% for the 12-month reporting period ended October 31, 2023, while the index returned 4.69%. Differences between the return of the fund and the return of the index may be attributable to, among other things, the operational and transactional costs incurred by the fund and not the index.
Contributors and Detractors. The health care sector detracted the most from the total return of the fund. Health care stocks represented an average weight of approximately 12% of the fund’s investments and returned approximately -7% for the reporting period. One example from this sector is Pfizer, Inc., a pharmaceutical company, which represented an average weight of less than 1% of the fund’s investments and returned approximately -32% for the reporting period.
The financials sector also detracted from the total return of the fund, representing an average weight of approximately 17% of the fund’s investments and returning approximately -3% for the reporting period.
The information technology sector contributed the most to the total return of the fund. Information technology stocks represented an average weight of approximately 18% of the fund’s investments and returned approximately 21% for the reporting period. One example from this sector is Microsoft Corp., which develops, manufactures, licenses, sells, and supports software products. The fund’s holdings of Microsoft Corp. represented an average weight of approximately 2% of the fund’s investments and returned approximately 47% for the reporting period.
The communication services sector also contributed to the total return of the fund, representing an average weight of approximately 9% of the fund’s investments and returning approximately 21% for the reporting period.
Management views and portfolio holdings may have changed since the report date.
6
Schwab Fundamental Index Funds | Annual Report
Schwab Fundamental US Large Company Index Fund
Performance and Fund Facts as of October 31, 2023
The performance data quoted represents past performance. Past performance does not guarantee future results. Investment returns and principal value of an investment will fluctuate so that an investor’s shares may be worth more or less than their original cost. Current performance may be lower or higher than performance data quoted. To obtain performance information current to the most recent month end, please visit www.schwabassetmanagement.com/schwabfunds_prospectus.
Performance of Hypothetical $10,000 Investment (October 31, 2013 – October 31, 2023)1
Average Annual Total Returns1
| | | |
Fund: Schwab Fundamental US Large Company Index Fund (4/2/07) | | | |
Russell RAFITM US Large Company Index | | | |
| | | |
Fund Category: Morningstar Large Value2 | | | |
Fund Expense Ratio3: 0.25% |
All total returns on this page assume dividends and distributions were reinvested. Index figures do not include trading and management costs, which would lower performance. Indices are unmanaged and cannot be invested in directly. Performance results less than one year are not annualized.
The first index listed for the fund is the fund’s primary benchmark, as shown in the prospectus. Additional indices shown are provided for comparative purposes.
For index definitions, please see the Glossary.
Index ownership – The Schwab Fundamental US Large Company Index Fund is not in any way sponsored, endorsed, sold or promoted by Frank Russell Company (Russell), by the London Stock Exchange Group companies (LSEG), or by Research Affiliates LLC (RA) (collectively the Licensor Parties), and none of the Licensor Parties make any warranty or representation whatsoever, expressly or impliedly, either as to the results to be obtained from the use of the Russell RAFITM US Large Company Index (the Index) or otherwise. The Index is compiled and calculated by Russell in conjunction with RA. None of the Licensor Parties shall be liable (whether in negligence or otherwise) to any person for any error in the Index and none of the Licensor Parties shall be under any obligation to advise any person of any error therein. “Russell®” is a trademark of Russell. The trade names “Research Affiliates®”, “Fundamental Index®” and “RAFI®” are registered trademarks of RA. Charles Schwab Investment Management, Inc. has obtained full license from Russell to use the Index. For full disclaimer please see the fund’s statement of additional information.
1
Performance does not reflect the deduction of taxes that a shareholder would pay on fund distributions or the redemption of fund shares.
2
Source for category information: Morningstar, Inc. The Morningstar Category return represents all active and index mutual funds and ETFs within the category as of the report date.
3
As stated in the prospectus.
Schwab Fundamental Index Funds | Annual Report7
Schwab Fundamental US Large Company Index Fund
Performance and Fund Facts as of October 31, 2023 (continued)
| |
Weighted Average Market Cap (millions) | |
Price/Earnings Ratio (P/E) | |
| |
| |
Sector Weightings % of Investments3
Top Equity Holdings % of Net Assets5
Portfolio holdings may have changed since the report date.
Source of Sector Classification: S&P and MSCI.
2
Portfolio turnover rate excludes in-kind transactions.
3
The percentage may differ from the Portfolio Holdings because the above calculation is based on a percentage of total investments, excluding derivatives, whereas the calculation in the Portfolio Holdings is based on a percentage of net assets.
4
Includes the fund’s position(s) in money market mutual funds registered under the Investment Company Act of 1940, as amended.
5
This list is not a recommendation of any security by the investment adviser.
8
Schwab Fundamental Index Funds | Annual Report
Schwab Fundamental US Small Company Index Fund as of October 31, 2023
The Schwab Fundamental US Small Company Index Fund (the fund) seeks investment results that correspond generally (before fees and expenses) to the total return of the Russell RAFITM US Small Company Index (the index). The index measures the performance of the small company size segment by fundamental overall company scores, which are created using as the universe the U.S. companies in the FTSE Global Total Cap Index. To pursue its investment objective, the fund uses a replication investment approach and generally gives the same weight to a given stock as the index does. For more information concerning the fund’s investment objective, strategies, and risks, please see the fund’s prospectus.
Market Highlights. For the 12-month reporting period ended October 31, 2023, U.S. equity markets were mixed, and international equity markets posted positive returns. U.S. stocks were volatile for the first half of the reporting period as inflation remained elevated, the U.S. Federal Reserve (Fed) continued to raise interest rates, and the failure of three U.S. regional banks in early March raised concerns about the stability of the banking sector. Despite these headwinds, as inflation began to ease, U.S. stocks staged a relatively steady upswing through August driven primarily by performance of the “Magnificent Seven” (Alphabet, Inc., Amazon.com, Inc., Apple, Inc., Meta Platforms, Inc., Microsoft Corp., NVIDIA Corp., and Tesla, Inc.). U.S. stocks, particularly dividend paying stocks, began to falter over the final two months of the reporting period as soaring U.S. Treasury yields offered investors attractive alternatives to stocks. Outside the U.S., the ongoing war between Russia and Ukraine and the Israel-Hamas war that broke out following Hamas’ attack on Israel in early October weighed on the global economy. U.S. large-cap stocks outperformed U.S. small-cap stocks and among U.S. large-cap stocks, growth stocks outperformed value stocks.
Performance. The fund generally tracked the index for the reporting period. The fund returned -3.04% for the 12-month reporting period ended October 31, 2023, while the index returned -2.84%. Differences between the return of the fund and the return of the index may be attributable to, among other things, the operational and transactional costs incurred by the fund and not the index.
Contributors and Detractors. The financials sector detracted the most from the total return of the fund. Financials stocks represented an average weight of approximately 15% of the fund’s investments and returned approximately -15% for the reporting period. One example from this sector is PacWest Bancorp, a bank holding company, which represented an average weight of less than 1% of the fund’s investments and returned approximately -71% for the reporting period.
The real estate sector also detracted from the total return of the fund, representing an average weight of approximately 8% of the fund’s investments and returning approximately -13% for the reporting period.
The industrials sector contributed the most to the total return of the fund. Industrials stocks represented an average weight of approximately 20% of the fund’s investments and returned approximately 11% for the reporting period. One example from this sector is XPO, Inc., which provides logistics services. The fund’s holdings of XPO, Inc. represented an average weight of less than 1% of the fund’s investments and returned approximately 138% for the reporting period.
The energy sector also contributed to the total return of the fund, representing an average weight of approximately 5% of the fund’s investments and returning approximately 17% for the reporting period.
Management views and portfolio holdings may have changed since the report date.
Schwab Fundamental Index Funds | Annual Report9
Schwab Fundamental US Small Company Index Fund
Performance and Fund Facts as of October 31, 2023
The performance data quoted represents past performance. Past performance does not guarantee future results. Investment returns and principal value of an investment will fluctuate so that an investor’s shares may be worth more or less than their original cost. Current performance may be lower or higher than performance data quoted. To obtain performance information current to the most recent month end, please visit www.schwabassetmanagement.com/schwabfunds_prospectus.
Performance of Hypothetical $10,000 Investment (October 31, 2013 – October 31, 2023)1
Average Annual Total Returns1
| | | |
Fund: Schwab Fundamental US Small Company Index Fund (4/2/07) | | | |
Russell RAFITM US Small Company Index | | | |
| | | |
Fund Category: Morningstar Small Blend2 | | | |
Fund Expense Ratio3: 0.25% |
All total returns on this page assume dividends and distributions were reinvested. Index figures do not include trading and management costs, which would lower performance. Indices are unmanaged and cannot be invested in directly. Performance results less than one year are not annualized.
The first index listed for the fund is the fund’s primary benchmark, as shown in the prospectus. Additional indices shown are provided for comparative purposes.
For index definitions, please see the Glossary.
Index ownership – The Schwab Fundamental US Small Company Index Fund is not in any way sponsored, endorsed, sold or promoted by Frank Russell Company (Russell), by the London Stock Exchange Group companies (LSEG), or by Research Affiliates LLC (RA) (collectively the Licensor Parties), and none of the Licensor Parties make any warranty or representation whatsoever, expressly or impliedly, either as to the results to be obtained from the use of the Russell RAFITM US Small Company Index (the Index) or otherwise. The Index is compiled and calculated by Russell in conjunction with RA. None of the Licensor Parties shall be liable (whether in negligence or otherwise) to any person for any error in the Index and none of the Licensor Parties shall be under any obligation to advise any person of any error therein. “Russell®” is a trademark of Russell. The trade names “Research Affiliates®”, “Fundamental Index®” and “RAFI®” are registered trademarks of RA. Charles Schwab Investment Management, Inc. has obtained full license from Russell to use the Index. For full disclaimer please see the fund’s statement of additional information.
1
Performance does not reflect the deduction of taxes that a shareholder would pay on fund distributions or the redemption of fund shares.
2
Source for category information: Morningstar, Inc. The Morningstar Category return represents all active and index mutual funds and ETFs within the category as of the report date.
3
As stated in the prospectus.
10
Schwab Fundamental Index Funds | Annual Report
Schwab Fundamental US Small Company Index Fund
Performance and Fund Facts as of October 31, 2023 (continued)
| |
Weighted Average Market Cap (millions) | |
Price/Earnings Ratio (P/E) | |
| |
| |
Sector Weightings % of Investments3
Top Equity Holdings % of Net Assets5
Portfolio holdings may have changed since the report date.
Source of Sector Classification: S&P and MSCI.
Small-company stocks are subject to greater volatility than many other asset classes.
2
Portfolio turnover rate excludes in-kind transactions.
3
The percentage may differ from the Portfolio Holdings because the above calculation is based on a percentage of total investments, excluding derivatives, whereas the calculation in the Portfolio Holdings is based on a percentage of net assets.
4
Includes the fund’s position(s) in money market mutual funds registered under the Investment Company Act of 1940, as amended.
5
This list is not a recommendation of any security by the investment adviser.
Schwab Fundamental Index Funds | Annual Report11
Schwab Fundamental International Large Company Index Fund as of October 31, 2023
The Schwab Fundamental International Large Company Index Fund (the fund) seeks investment results that correspond generally (before fees and expenses) to the total return of the Russell RAFITM Developed ex US Large Company Index (the index). The index measures the performance of the large company size segment by fundamental overall company scores, which are created using as the universe the developed ex U.S. companies in the FTSE Global Total Cap Index. To pursue its investment objective, the fund uses a replication investment approach and generally gives the same weight to a given stock as the index does. For more information concerning the fund’s investment objective, strategies, and risks, please see the fund’s prospectus.
Market Highlights. For the 12-month reporting period ended October 31, 2023, U.S. equity markets were mixed, and international equity markets posted positive returns. U.S. stocks were volatile for the first half of the reporting period as inflation remained elevated, the U.S. Federal Reserve (Fed) continued to raise interest rates, and the failure of three U.S. regional banks in early March raised concerns about the stability of the banking sector. Despite these headwinds, as inflation began to ease, U.S. stocks staged a relatively steady upswing through August driven primarily by performance of the “Magnificent Seven” (Alphabet, Inc., Amazon.com, Inc., Apple, Inc., Meta Platforms, Inc., Microsoft Corp., NVIDIA Corp., and Tesla, Inc.). U.S. stocks, particularly dividend paying stocks, began to falter over the final two months of the reporting period as soaring U.S. Treasury yields offered investors attractive alternatives to stocks. Outside the U.S., the ongoing war between Russia and Ukraine and the Israel-Hamas war that broke out following Hamas’ attack on Israel in early October weighed on the global economy. U.S. large-cap stocks outperformed U.S. small-cap stocks and among U.S. large-cap stocks, growth stocks outperformed value stocks. The U.S. dollar, as measured against a basket of international currencies, generally weakened until mid-July, when it hit a reporting-period low, then began to rise but ended the reporting period weaker than where it began.
Performance. The fund generally tracked the index for the reporting period. The fund returned 17.40% for the 12-month reporting period ended October 31, 2023, while the index returned 16.82%1. Fair valuation of the fund’s holdings contributed to the fund’s relative performance.2
Contributors and Detractors. Stocks from Japan contributed the most to the total return of the fund. Japanese stocks represented an average weight of approximately 27% of the fund’s investments and returned approximately 24% in U.S. dollar terms for the reporting period. One example from this market is Toyota Motor Corp., which manufactures, sells, leases, and repairs passenger cars, trucks, buses, and their related parts worldwide. The fund’s holdings of Toyota Motor Corp. represented an average weight of approximately 1% of the fund’s investments and returned approximately 27% in U.S. dollar terms for the reporting period.
Stocks from the United Kingdom also contributed to the total return of the fund, representing an average weight of approximately 15% of the fund’s investments and returning approximately 14% in U.S. dollar terms for the reporting period.
Stocks from Israel detracted from the total return of the fund. Israeli stocks represented an average weight of less than 1% of the fund’s investments and returned approximately -22% in U.S. dollar terms for the reporting period. One example from this market is Bank Leumi Le-Israel BM, a full-service commercial bank, which represented an average weight of less than 1% of the fund’s investments and returned approximately -30% in U.S. dollar terms for the reporting period.
While there were no additional markets that detracted from the total return of the fund, stocks from New Zealand were the smallest contributor to the total return of the fund, representing an average weight of less than 1% of the fund’s investments and returning approximately -2% in U.S. dollar terms for the reporting period.
Management views and portfolio holdings may have changed since the report date.
1
The net version of the index reflects reinvested dividends net of withholding taxes but reflects no deductions for expenses or other taxes.
2
Typically, the securities in the index are valued using foreign exchange rates obtained at the close of the London foreign currency exchange (11:00 AM EST). Securities in the fund, however, are valued using foreign exchange rates obtained at the close of the New York foreign currency exchange (4:00 PM EST). This difference in closing times can result in different foreign currency exchange rates between the two exchanges, and thus different foreign currency exchange rates used in the valuation of the index’s and fund’s securities.
12
Schwab Fundamental Index Funds | Annual Report
Schwab Fundamental International Large Company Index Fund
Performance and Fund Facts as of October 31, 2023
The performance data quoted represents past performance. Past performance does not guarantee future results. Investment returns and principal value of an investment will fluctuate so that an investor’s shares may be worth more or less than their original cost. Current performance may be lower or higher than performance data quoted. To obtain performance information current to the most recent month end, please visit www.schwabassetmanagement.com/schwabfunds_prospectus.
Performance of Hypothetical $10,000 Investment (October 31, 2013 – October 31, 2023)1,2,3
Average Annual Total Returns1,3
| | | |
Fund: Schwab Fundamental International Large Company Index Fund (4/2/07) | | | |
Russell RAFITM Developed ex US Large Company Index (Net)2 | | | |
| | | |
Fund Category: Morningstar Foreign Large Value4 | | | |
Fund Expense Ratio5: 0.25% |
All total returns on this page assume dividends and distributions were reinvested. Index figures do not include trading and management costs, which would lower performance. Indices are unmanaged and cannot be invested in directly. Performance results less than one year are not annualized.
The first index listed for the fund is the fund’s primary benchmark, as shown in the prospectus. Additional indices shown are provided for comparative purposes.
For index definitions, please see the Glossary.
Index ownership – The Schwab Fundamental International Large Company Index Fund is not in any way sponsored, endorsed, sold or promoted by Frank Russell Company (Russell), by the London Stock Exchange Group companies (LSEG), or by Research Affiliates LLC (RA) (collectively the Licensor Parties), and none of the Licensor Parties make any warranty or representation whatsoever, expressly or impliedly, either as to the results to be obtained from the use of the Russell RAFITM Developed ex US Large Company Index (the Index) or otherwise. The Index is compiled and calculated by Russell in conjunction with RA. None of the Licensor Parties shall be liable (whether in negligence or otherwise) to any person for any error in the Index and none of the Licensor Parties shall be under any obligation to advise any person of any error therein. “Russell®” is a trademark of Russell. The trade names “Research Affiliates®”, “Fundamental Index®” and “RAFI®” are registered trademarks of RA. Charles Schwab Investment Management, Inc. has obtained full license from Russell to use the Index. For full disclaimer please see the fund’s statement of additional information.
1
Performance does not reflect the deduction of taxes that a shareholder would pay on fund distributions or the redemption of fund shares.
2
The net version of the index reflects reinvested dividends net of withholding taxes but reflects no deductions for expenses or other taxes.
3
The fund’s performance relative to the index may be affected by fair-value pricing. See financial note 2 for more information.
4
Source for category information: Morningstar, Inc. The Morningstar Category return represents all active and index mutual funds and ETFs within the category as of the report date.
5
As stated in the prospectus.
Schwab Fundamental Index Funds | Annual Report13
Schwab Fundamental International Large Company Index Fund
Performance and Fund Facts as of October 31, 2023 (continued)
| |
Weighted Average Market Cap (millions) | |
Price/Earnings Ratio (P/E) | |
| |
| |
Sector Weightings % of Investments1
Top Equity Holdings % of Net Assets3
Top Country Weightings % of Investments4
Portfolio holdings may have changed since the report date.
Source of Sector Classification: S&P and MSCI.
International investments are subject to additional risks such as currency fluctuation, geopolitical risk and the potential for illiquid markets.
2
Includes the fund’s position(s) in money market mutual funds registered under the Investment Company Act of 1940, as amended.
3
This list is not a recommendation of any security by the investment adviser.
4
The percentage may differ from the Portfolio Holdings because the above calculation is based on a percentage of total investments, excluding derivatives, whereas the calculation in the Portfolio Holdings is based on a percentage of net assets.
14
Schwab Fundamental Index Funds | Annual Report
Schwab Fundamental International Small Company Index Fund as of October 31, 2023
The Schwab Fundamental International Small Company Index Fund (the fund) seeks investment results that correspond generally (before fees and expenses) to the total return of the Russell RAFITM Developed ex US Small Company Index (the index). The index measures the performance of the small company size segment by fundamental overall company scores, which are created using as the universe the developed ex U.S. companies in the FTSE Global Total Cap Index. To pursue its investment objective, the fund uses a replication investment approach and generally gives the same weight to a given stock as the index does. For more information concerning the fund’s investment objective, strategies, and risks, please see the fund’s prospectus.
Market Highlights. For the 12-month reporting period ended October 31, 2023, U.S. equity markets were mixed, and international equity markets posted positive returns. U.S. stocks were volatile for the first half of the reporting period as inflation remained elevated, the U.S. Federal Reserve (Fed) continued to raise interest rates, and the failure of three U.S. regional banks in early March raised concerns about the stability of the banking sector. Despite these headwinds, as inflation began to ease, U.S. stocks staged a relatively steady upswing through August driven primarily by performance of the “Magnificent Seven” (Alphabet, Inc., Amazon.com, Inc., Apple, Inc., Meta Platforms, Inc., Microsoft Corp., NVIDIA Corp., and Tesla, Inc.). U.S. stocks, particularly dividend paying stocks, began to falter over the final two months of the reporting period as soaring U.S. Treasury yields offered investors attractive alternatives to stocks. Outside the U.S., the ongoing war between Russia and Ukraine and the Israel-Hamas war that broke out following Hamas’ attack on Israel in early October weighed on the global economy. U.S. large-cap stocks outperformed U.S. small-cap stocks and among U.S. large-cap stocks, growth stocks outperformed value stocks. The U.S. dollar, as measured against a basket of international currencies, generally weakened until mid-July, when it hit a reporting-period low, then began to rise but ended the reporting period weaker than where it began.
Performance. The fund generally tracked the index for the reporting period. The fund returned 11.76% for the 12-month reporting period ended October 31, 2023, while the index returned 11.44%1. Fair valuation of the fund’s holdings contributed to the fund’s relative performance.2
Contributors and Detractors. Stocks from Japan contributed the most to the total return of the fund. Japanese stocks represented an average weight of approximately 35% of the fund’s investments and returned approximately 18% in U.S. dollar terms for the reporting period. One example from this market is Disco Corp., which manufactures abrasive and precision industrial machinery for cutting and grinding purposes. The fund’s holdings of Disco Corp. represented an average weight of less than 1% of the fund’s investments and returned approximately 119% in U.S. dollar terms for the reporting period.
Stocks from the United Kingdom also contributed to the total return of the fund, representing an average weight of approximately 9% of the fund’s investments and returning approximately 12% in U.S. dollar terms for the reporting period.
Stocks from Israel detracted the most from the total return of the fund. Israeli stocks represented an average weight of approximately 1% of the fund’s investments and returned approximately -28% in U.S. dollar terms for the reporting period. One example from this market is Israel Corp. Ltd., a public investment company, which represented an average weight of less than 1% of the fund’s investments and returned approximately -51% in U.S. dollar terms for the reporting period.
Stocks from France also detracted from the total return of the fund, representing an average weight of approximately 4% of the fund’s investments and returning approximately -6% in U.S. dollar terms for the reporting period.
Management views and portfolio holdings may have changed since the report date.
1
The net version of the index reflects reinvested dividends net of withholding taxes but reflects no deductions for expenses or other taxes.
2
Typically, the securities in the index are valued using foreign exchange rates obtained at the close of the London foreign currency exchange (11:00 AM EST). Securities in the fund, however, are valued using foreign exchange rates obtained at the close of the New York foreign currency exchange (4:00 PM EST). This difference in closing times can result in different foreign currency exchange rates between the two exchanges, and thus different foreign currency exchange rates used in the valuation of the index’s and fund’s securities.
Schwab Fundamental Index Funds | Annual Report15
Schwab Fundamental International Small Company Index Fund
Performance and Fund Facts as of October 31, 2023
The performance data quoted represents past performance. Past performance does not guarantee future results. Investment returns and principal value of an investment will fluctuate so that an investor’s shares may be worth more or less than their original cost. Current performance may be lower or higher than performance data quoted. To obtain performance information current to the most recent month end, please visit www.schwabassetmanagement.com/schwabfunds_prospectus.
Performance of Hypothetical $10,000 Investment (October 31, 2013 – October 31, 2023)1,2,3
Average Annual Total Returns1,3
| | | |
Fund: Schwab Fundamental International Small Company Index Fund (1/31/08) | | | |
Russell RAFITM Developed ex US Small Company Index (Net)2 | | | |
S&P Developed ex-U.S. Small Cap Index (Net)2 | | | |
Fund Category: Morningstar Foreign Small/Mid Value4 | | | |
Fund Expense Ratio5: 0.39% |
All total returns on this page assume dividends and distributions were reinvested. Index figures do not include trading and management costs, which would lower performance. Indices are unmanaged and cannot be invested in directly. Performance results less than one year are not annualized.
The first index listed for the fund is the fund’s primary benchmark, as shown in the prospectus. Additional indices shown are provided for comparative purposes.
For index definitions, please see the Glossary.
Index ownership – The Schwab Fundamental International Small Company Index Fund is not in any way sponsored, endorsed, sold or promoted by Frank Russell Company (Russell), by the London Stock Exchange Group companies (LSEG), or by Research Affiliates LLC (RA) (collectively the Licensor Parties), and none of the Licensor Parties make any warranty or representation whatsoever, expressly or impliedly, either as to the results to be obtained from the use of the Russell RAFITM Developed ex US Small Company Index (the Index) or otherwise. The Index is compiled and calculated by Russell in conjunction with RA. None of the Licensor Parties shall be liable (whether in negligence or otherwise) to any person for any error in the Index and none of the Licensor Parties shall be under any obligation to advise any person of any error therein. “Russell®” is a trademark of Russell. The trade names “Research Affiliates®”, “Fundamental Index®” and “RAFI®” are registered trademarks of RA. Charles Schwab Investment Management, Inc. has obtained full license from Russell to use the Index. For full disclaimer please see the fund’s statement of additional information.
1
Performance does not reflect the deduction of taxes that a shareholder would pay on fund distributions or the redemption of fund shares.
2
The net version of the index reflects reinvested dividends net of withholding taxes but reflects no deductions for expenses or other taxes.
3
The fund’s performance relative to the index may be affected by fair-value pricing. See financial note 2 for more information.
4
Source for category information: Morningstar, Inc. The Morningstar Category return represents all active and index mutual funds and ETFs within the category as of the report date.
5
As stated in the prospectus.
16
Schwab Fundamental Index Funds | Annual Report
Schwab Fundamental International Small Company Index Fund
Performance and Fund Facts as of October 31, 2023 (continued)
| |
Weighted Average Market Cap (millions) | |
Price/Earnings Ratio (P/E) | |
| |
| |
Sector Weightings % of Investments1
Top Equity Holdings % of Net Assets3
Top Country Weightings % of Investments4
Portfolio holdings may have changed since the report date.
Source of Sector Classification: S&P and MSCI.
Small-company stocks are subject to greater volatility than many other asset classes.
International investments are subject to additional risks such as currency fluctuation, geopolitical risk and the potential for illiquid markets.
2
Includes the fund’s position(s) in money market mutual funds registered under the Investment Company Act of 1940, as amended.
3
This list is not a recommendation of any security by the investment adviser.
4
The percentage may differ from the Portfolio Holdings because the above calculation is based on a percentage of total investments, excluding derivatives, whereas the calculation in the Portfolio Holdings is based on a percentage of net assets.
Schwab Fundamental Index Funds | Annual Report17
Schwab Fundamental Emerging Markets Large Company Index Fund as of October 31, 2023
The Schwab Fundamental Emerging Markets Large Company Index Fund (the fund) seeks investment results that correspond generally (before fees and expenses) to the total return of the Russell RAFITM Emerging Markets Large Company Index (the index). The index measures the performance of the large company size segment by fundamental overall company scores, which are created using as the universe the emerging markets companies in the FTSE Global Total Cap Index. To pursue its investment objective, the fund invests in a representative sample of securities included in the index which, when taken together, are expected to perform similarly to the index as a whole. Due to the use of sampling techniques, the fund may not hold all of the securities in the index. For more information concerning the fund’s investment objective, strategies, and risks, please see the fund’s prospectus.
Market Highlights. For the 12-month reporting period ended October 31, 2023, U.S. equity markets were mixed, and international equity markets posted positive returns. U.S. stocks were volatile for the first half of the reporting period as inflation remained elevated, the U.S. Federal Reserve (Fed) continued to raise interest rates, and the failure of three U.S. regional banks in early March raised concerns about the stability of the banking sector. Despite these headwinds, as inflation began to ease, U.S. stocks staged a relatively steady upswing through August driven primarily by performance of the “Magnificent Seven” (Alphabet, Inc., Amazon.com, Inc., Apple, Inc., Meta Platforms, Inc., Microsoft Corp., NVIDIA Corp., and Tesla, Inc.). U.S. stocks, particularly dividend paying stocks, began to falter over the final two months of the reporting period as soaring U.S. Treasury yields offered investors attractive alternatives to stocks. Outside the U.S., the ongoing war between Russia and Ukraine and the Israel-Hamas war that broke out following Hamas’ attack on Israel in early October weighed on the global economy. U.S. large-cap stocks outperformed U.S. small-cap stocks and among U.S. large-cap stocks, growth stocks outperformed value stocks. The U.S. dollar, as measured against a basket of international currencies, generally weakened until mid-July, when it hit a reporting-period low, then began to rise but ended the reporting period weaker than where it began.
Performance. The fund generally tracked the index for the reporting period. The fund returned 15.14% for the 12-month reporting period ended October 31, 2023, while the index returned 15.90%1. Differences between the return of the fund and the return of the index may be attributable to, among other things, the operational and transactional costs incurred by the fund and not the index.
Contributors and Detractors. Stocks from Saudi Arabia detracted the most from the total return of the fund. Stocks from Saudi Arabia represented an average weight of approximately 2% of the fund’s investments and returned approximately -12% in U.S. dollar terms for the reporting period. One example from this market is Saudi Electricity Co., which generates and distributes electricity. The fund’s holdings of Saudi Electricity Co. represented an average weight of less than 1% of the fund’s investments and returned approximately -32% in U.S. dollar terms for the reporting period.
Stocks from the United Arab Emirates also detracted from the total return of the fund, representing an average weight of approximately 1% of the fund’s investments and returning approximately -14% in U.S. dollar terms for the reporting period.
Stocks from China contributed the most to the total return of the fund. Chinese stocks represented an average weight of approximately 35% of the fund’s investments and returned approximately 22% in U.S. dollar terms for the reporting period. One example from this market is China Petroleum & Chemical Corp., a petroleum manufacturing company. The fund’s Class H holdings of China Petroleum & Chemical Corp. represented an average weight of approximately 2% of the fund’s investments and returned approximately 40% in U.S. dollar terms for the reporting period.
Stocks from Taiwan also contributed to the total return of the fund, representing an average weight of approximately 19% of the fund’s investments and returning approximately 26% in U.S. dollar terms for the reporting period.
Management views and portfolio holdings may have changed since the report date.
1
The net version of the index reflects reinvested dividends net of withholding taxes but reflects no deductions for expenses or other taxes.
18
Schwab Fundamental Index Funds | Annual Report
Schwab Fundamental Emerging Markets Large Company Index Fund
Performance and Fund Facts as of October 31, 2023
The performance data quoted represents past performance. Past performance does not guarantee future results. Investment returns and principal value of an investment will fluctuate so that an investor’s shares may be worth more or less than their original cost. Current performance may be lower or higher than performance data quoted. To obtain performance information current to the most recent month end, please visit www.schwabassetmanagement.com/schwabfunds_prospectus.
Performance of Hypothetical $10,000 Investment (October 31, 2013 – October 31, 2023)1,2,3
Average Annual Total Returns1,3
| | | |
Fund: Schwab Fundamental Emerging Markets Large Company Index Fund (1/31/08) | | | |
Russell RAFITM Emerging Markets Large Company Index (Net)2 | | | |
MSCI Emerging Markets Index (Net)2 | | | |
Fund Category: Morningstar Diversified Emerging Markets4 | | | |
Fund Expense Ratio5: 0.39% |
All total returns on this page assume dividends and distributions were reinvested. Index figures do not include trading and management costs, which would lower performance. Indices are unmanaged and cannot be invested in directly. Performance results less than one year are not annualized.
The first index listed for the fund is the fund’s primary benchmark, as shown in the prospectus. Additional indices shown are provided for comparative purposes.
For index definitions, please see the Glossary.
Index ownership – The Schwab Fundamental Emerging Markets Large Company Index Fund is not in any way sponsored, endorsed, sold or promoted by Frank Russell Company (Russell), by the London Stock Exchange Group companies (LSEG), or by Research Affiliates LLC (RA) (collectively the Licensor Parties), and none of the Licensor Parties make any warranty or representation whatsoever, expressly or impliedly, either as to the results to be obtained from the use of the Russell RAFITM Emerging Markets Large Company Index (the Index) or otherwise. The Index is compiled and calculated by Russell in conjunction with RA. None of the Licensor Parties shall be liable (whether in negligence or otherwise) to any person for any error in the Index and none of the Licensor Parties shall be under any obligation to advise any person of any error therein. “Russell®” is a trademark of Russell. The trade names “Research Affiliates®”, “Fundamental Index®” and “RAFI®” are registered trademarks of RA. Charles Schwab Investment Management, Inc. has obtained full license from Russell to use the Index. For full disclaimer please see the fund’s statement of additional information.
1
Performance does not reflect the deduction of taxes that a shareholder would pay on fund distributions or the redemption of fund shares.
2
The net version of the index reflects reinvested dividends net of withholding taxes but reflects no deductions for expenses or other taxes.
3
The fund’s performance relative to the index may be affected by fair-value pricing. See financial note 2 for more information.
4
Source for category information: Morningstar, Inc. The Morningstar Category return represents all active and index mutual funds and ETFs within the category as of the report date.
5
As stated in the prospectus.
Schwab Fundamental Index Funds | Annual Report19
Schwab Fundamental Emerging Markets Large Company Index Fund
Performance and Fund Facts as of October 31, 2023 (continued)
| |
Weighted Average Market Cap (millions) | |
Price/Earnings Ratio (P/E) | |
| |
| |
Sector Weightings % of Investments1
Top Equity Holdings % of Net Assets3
Top Country Weightings % of Investments4
Portfolio holdings may have changed since the report date.
Source of Sector Classification: S&P and MSCI.
International investments are subject to additional risks such as currency fluctuation, geopolitical risk and the potential for illiquid markets. Investing in emerging markets may accentuate these risks.
2
Includes the fund’s position(s) in money market mutual funds registered under the Investment Company Act of 1940, as amended.
3
This list is not a recommendation of any security by the investment adviser.
4
The percentage may differ from the Portfolio Holdings because the above calculation is based on a percentage of total investments, excluding derivatives, whereas the calculation in the Portfolio Holdings is based on a percentage of net assets.
20
Schwab Fundamental Index Funds | Annual Report
Schwab Fundamental Index Funds
Fund Expenses (Unaudited)
Examples for a $1,000 Investment
As a fund shareholder, you may incur two types of costs: (1) transaction costs; and (2) ongoing costs, including management fees.
The expense examples below are intended to help you understand your ongoing cost (in dollars) of investing in a fund and to compare this cost with the ongoing cost of investing in other mutual funds. These examples are based on an investment of $1,000 invested for six months beginning May 1, 2023 and held through October 31, 2023.
Actual Return lines in the table below provide information about actual account values and actual expenses. You may use this information, together with the amount you invested, to estimate the expenses that you paid over the period. To do so, simply divide your account value by $1,000 (for example, an $8,600 account value ÷ $1,000 = 8.6), then multiply the result by the number given for your fund under the heading entitled “Expenses Paid During Period.”
Hypothetical Return lines in the table below provide information about hypothetical account values and hypothetical expenses based on a fund’s actual expense ratio and an assumed return of 5% per year before expenses. Because the return used is not an actual return, it may not be used to estimate the actual ending account value or expenses you paid for the period.
You may use this information to compare the ongoing costs of investing in a fund and other funds. To do so, compare this 5% hypothetical example with the 5% hypothetical examples that appear in the shareholder reports of the other funds.
Please note that the expenses shown in the table are meant to highlight your ongoing costs only and do not reflect any transactional costs. Therefore, the hypothetical return lines of the table are useful in comparing ongoing costs only and will not help you determine the relative total costs of owning different funds. In addition, if these transactional costs were included, your costs would have been higher.
| | BEGINNING
ACCOUNT VALUE
AT 5/1/23 | ENDING
ACCOUNT VALUE
(NET OF EXPENSES)
AT 10/31/23 | EXPENSES PAID
DURING PERIOD
|
Schwab Fundamental US Large Company Index Fund | | | | |
| | | | |
| | | | |
Schwab Fundamental US Small Company Index Fund | | | | |
| | | | |
| | | | |
Schwab Fundamental International Large Company Index Fund | | | | |
| | | | |
| | | | |
Schwab Fundamental International Small Company Index Fund | | | | |
| | | | |
| | | | |
Schwab Fundamental Emerging Markets Large Company Index Fund | | | | |
| | | | |
| | | | |
| Based on the most recent six-month expense ratio. |
| Expenses for each fund are equal to its annualized expense ratio, multiplied by the average account value over the period, multiplied by the 184 days in the period, and divided by the 365 days in the fiscal year. |
Schwab Fundamental Index Funds | Annual Report21
Schwab Fundamental US Large Company Index Fund
Financial Statements
| | | | | | |
|
Net asset value at beginning of period | | | | | | |
Income (loss) from investment operations: | | | | | | |
Net investment income (loss)1 | | | | | | |
Net realized and unrealized gains (losses) | | | | | | |
Total from investment operations | | | | | | |
| | | | | | |
Distributions from net investment income | | | | | | |
Distributions from net realized gains | | | | | | |
| | | | | | |
Net asset value at end of period | | | | | | |
| | | | | | |
|
Ratios to average net assets: | | | | | | |
| | | | | | |
Net investment income (loss) | | | | | | |
| | | | | | |
Net assets, end of period (x 1,000,000) | | | | | | |
| Calculated based on the average shares outstanding during the period. |
| Ratio includes less than 0.005% of non-routine proxy expenses. |
| Portfolio turnover rate excludes in-kind transactions. |
22
Schwab Fundamental Index Funds | Annual Report
Schwab Fundamental US Large Company Index Fund
Portfolio Holdings as of October 31, 2023
This section shows all the securities in the fund’s portfolio and their values as of the report date.
The fund files its complete schedule of portfolio holdings with the U.S. Securities and Exchange Commission (SEC) for the first and third quarters of each fiscal year on Form N-PORT Part F. The fund’s Form N-PORT Part F is available on the SEC’s website at www.sec.gov. You can also obtain this information at no cost on the fund’s website at www.schwabassetmanagement.com/schwabfunds_prospectus, by calling 1-866-414-6349, or by sending an email request to orders@mysummaryprospectus.com. The fund also makes available its complete schedule of portfolio holdings 15 to 20 days after the end of the month on the fund’s website.
| | |
COMMON STOCKS 99.5% OF NET ASSETS |
|
Automobiles & Components 1.4% |
| | |
| | |
| | |
| | |
| | |
| | |
| | |
| | |
Goodyear Tire & Rubber Co. * | | |
| | |
| | |
| | |
| | |
| | |
| | |
|
|
| | |
| | |
Citizens Financial Group, Inc. | | |
| | |
| | |
| | |
| | |
| | |
Huntington Bancshares, Inc. | | |
| | |
| | |
| | |
New York Community Bancorp, Inc. | | |
PNC Financial Services Group, Inc. | | |
| | |
| | |
| | |
| | |
| | |
| | |
| | |
| | |
|
|
| | |
| | |
| | |
| | |
| | |
| | |
| | |
| | |
Allison Transmission Holdings, Inc. | | |
| | |
| | |
| | |
| | |
| | |
| | |
| | |
| | |
| | |
| | |
| | |
| | |
| | |
| | |
| | |
| | |
| | |
| | |
| | |
Fortune Brands Innovations, Inc. | | |
| | |
| | |
| | |
| | |
Honeywell International, Inc. | | |
| | |
| | |
Huntington Ingalls Industries, Inc. | | |
| | |
Illinois Tool Works, Inc. | | |
| | |
| | |
Johnson Controls International PLC | | |
L3Harris Technologies, Inc. | | |
Lennox International, Inc. | | |
Lincoln Electric Holdings, Inc. | | |
| | |
| | |
| | |
MDU Resources Group, Inc. | | |
| | |
MSC Industrial Direct Co., Inc., Class A | | |
| | |
| | |
| | |
| | |
| | |
| | |
| | |
| | |
| | |
| | |
| | |
| | |
Resideo Technologies, Inc. * | | |
Rockwell Automation, Inc. | | |
| | |
Sensata Technologies Holding PLC | | |
| | |
Spirit AeroSystems Holdings, Inc., Class A * | | |
Schwab Fundamental Index Funds | Annual Report23
Schwab Fundamental US Large Company Index Fund
Portfolio Holdings as of October 31, 2023 (continued)
| | |
Stanley Black & Decker, Inc. | | |
| | |
| | |
| | |
| | |
| | |
| | |
| | |
| | |
WESCO International, Inc. | | |
Westinghouse Air Brake Technologies Corp. | | |
| | |
| | |
| | |
|
Commercial & Professional Services 1.2% |
| | |
| | |
Automatic Data Processing, Inc. | | |
Booz Allen Hamilton Holding Corp., Class A | | |
Broadridge Financial Solutions, Inc. | | |
CACI International, Inc., Class A * | | |
| | |
| | |
| | |
| | |
| | |
| | |
| | |
| | |
| | |
| | |
| | |
Republic Services, Inc., Class A | | |
| | |
Science Applications International Corp. | | |
SS&C Technologies Holdings, Inc. | | |
| | |
| | |
Verisk Analytics, Inc., Class A | | |
| | |
| | |
| | |
|
Consumer Discretionary Distribution & Retail 4.2% |
Academy Sports & Outdoors, Inc. | | |
| | |
| | |
Asbury Automotive Group, Inc. * | | |
| | |
| | |
| | |
| | |
| | |
Burlington Stores, Inc. * | | |
| | |
Dick's Sporting Goods, Inc. | | |
| | |
| | |
| | |
| | |
| | |
| | |
| | |
| | |
Lithia Motors, Inc., Class A | | |
| | |
| | |
| | |
| | |
| | |
| | |
O'Reilly Automotive, Inc. * | | |
Penske Automotive Group, Inc. | | |
| | |
| | |
| | |
| | |
| | |
| | |
| | |
| | |
|
Consumer Durables & Apparel 1.6% |
| | |
| | |
| | |
| | |
| | |
| | |
| | |
| | |
| | |
| | |
| | |
Lululemon Athletica, Inc. * | | |
| | |
| | |
Mohawk Industries, Inc. * | | |
| | |
| | |
| | |
| | |
| | |
| | |
Ralph Lauren Corp., Class A | | |
Skechers USA, Inc., Class A * | | |
| | |
Taylor Morrison Home Corp., Class A * | | |
Tempur Sealy International, Inc. | | |
| | |
| | |
| | |
| | |
| | |
|
|
| | |
| | |
| | |
Chipotle Mexican Grill, Inc., Class A * | | |
| | |
| | |
| | |
| | |
Hilton Worldwide Holdings, Inc. | | |
| | |
Marriott International, Inc., Class A | | |
| | |
MGM Resorts International * | | |
Penn Entertainment, Inc. * | | |
24
Schwab Fundamental Index Funds | Annual Report
Schwab Fundamental US Large Company Index Fund
Portfolio Holdings as of October 31, 2023 (continued)
| | |
Royal Caribbean Cruises Ltd. * | | |
Service Corp. International | | |
| | |
| | |
| | |
| | |
| | |
| | |
|
Consumer Staples Distribution & Retail 3.4% |
BJ's Wholesale Club Holdings, Inc. * | | |
Casey's General Stores, Inc. | | |
| | |
| | |
| | |
| | |
Performance Food Group Co. * | | |
| | |
Sprouts Farmers Market, Inc. * | | |
| | |
| | |
U.S. Foods Holding Corp. * | | |
United Natural Foods, Inc. * | | |
Walgreens Boots Alliance, Inc. | | |
| | |
| | |
|
|
| | |
| | |
Baker Hughes Co., Class A | | |
| | |
| | |
| | |
| | |
Delek U.S. Holdings, Inc. | | |
| | |
| | |
| | |
Equitrans Midstream Corp. | | |
| | |
| | |
| | |
| | |
| | |
| | |
| | |
| | |
| | |
| | |
Occidental Petroleum Corp. | | |
| | |
| | |
PBF Energy, Inc., Class A | | |
| | |
| | |
Pioneer Natural Resources Co. | | |
| | |
Southwestern Energy Co. * | | |
| | |
| | |
| | |
| | |
| | |
| | |
|
| | |
Equity Real Estate Investment Trusts (REITs) 1.7% |
Alexandria Real Estate Equities, Inc. | | |
| | |
AvalonBay Communities, Inc. | | |
| | |
Brixmor Property Group, Inc. | | |
| | |
| | |
Digital Realty Trust, Inc. | | |
| | |
| | |
Essex Property Trust, Inc. | | |
Extra Space Storage, Inc. | | |
Gaming & Leisure Properties, Inc. | | |
Healthpeak Properties, Inc. | | |
Host Hotels & Resorts, Inc. | | |
| | |
| | |
| | |
Lamar Advertising Co., Class A | | |
Medical Properties Trust, Inc. | | |
Mid-America Apartment Communities, Inc. | | |
Omega Healthcare Investors, Inc. | | |
Park Hotels & Resorts, Inc. | | |
| | |
| | |
| | |
| | |
SBA Communications Corp., Class A | | |
| | |
Simon Property Group, Inc. | | |
SL Green Realty Corp. (a) | | |
| | |
| | |
| | |
VICI Properties, Inc., Class A | | |
| | |
| | |
| | |
| | |
| | |
|
|
Affiliated Managers Group, Inc. | | |
| | |
| | |
| | |
Ameriprise Financial, Inc. | | |
Annaly Capital Management, Inc. | | |
Apollo Global Management, Inc. | | |
Bank of New York Mellon Corp. | | |
Berkshire Hathaway, Inc., Class A * | | |
Berkshire Hathaway, Inc., Class B * | | |
| | |
| | |
Bread Financial Holdings, Inc. | | |
Capital One Financial Corp. | | |
| | |
Cboe Global Markets, Inc. | | |
| | |
| | |
| | |
Coinbase Global, Inc., Class A * | | |
Discover Financial Services | | |
| | |
Schwab Fundamental Index Funds | Annual Report25
Schwab Fundamental US Large Company Index Fund
Portfolio Holdings as of October 31, 2023 (continued)
| | |
| | |
Fidelity National Information Services, Inc. | | |
| | |
FleetCor Technologies, Inc. * | | |
| | |
| | |
Goldman Sachs Group, Inc. | | |
Intercontinental Exchange, Inc. | | |
| | |
Jack Henry & Associates, Inc. | | |
Janus Henderson Group PLC | | |
Jefferies Financial Group, Inc. | | |
| | |
| | |
LPL Financial Holdings, Inc. | | |
Mastercard, Inc., Class A | | |
| | |
| | |
| | |
| | |
| | |
| | |
| | |
| | |
| | |
| | |
| | |
Raymond James Financial, Inc. | | |
| | |
| | |
| | |
| | |
Starwood Property Trust, Inc. | | |
| | |
| | |
| | |
| | |
| | |
| | |
| | |
|
Food, Beverage & Tobacco 3.4% |
| | |
Archer-Daniels-Midland Co. | | |
| | |
| | |
| | |
Coca-Cola Europacific Partners PLC | | |
| | |
Constellation Brands, Inc., Class A | | |
Darling Ingredients, Inc. * | | |
| | |
| | |
| | |
| | |
| | |
| | |
| | |
| | |
| | |
Lamb Weston Holdings, Inc. | | |
McCormick & Co., Inc. - Non Voting Shares | | |
Molson Coors Beverage Co., Class B | | |
Mondelez International, Inc., Class A | | |
| | |
| | |
| | |
Philip Morris International, Inc. | | |
| | |
Tyson Foods, Inc., Class A | | |
| | |
| | |
|
Health Care Equipment & Services 6.1% |
| | |
| | |
Baxter International, Inc. | | |
| | |
Boston Scientific Corp. * | | |
| | |
| | |
| | |
| | |
| | |
| | |
| | |
| | |
| | |
Edwards Lifesciences Corp. * | | |
| | |
| | |
| | |
| | |
| | |
| | |
IDEXX Laboratories, Inc. * | | |
Intuitive Surgical, Inc. * | | |
Laboratory Corp. of America Holdings | | |
| | |
| | |
Molina Healthcare, Inc. * | | |
| | |
| | |
| | |
| | |
| | |
| | |
| | |
| | |
| | |
Universal Health Services, Inc., Class B | | |
Zimmer Biomet Holdings, Inc. | | |
| | |
|
Household & Personal Products 1.3% |
Church & Dwight Co., Inc. | | |
| | |
| | |
Estee Lauder Cos., Inc., Class A | | |
| | |
| | |
| | |
|
|
| | |
| | |
American Financial Group, Inc. | | |
American International Group, Inc. | | |
| | |
Arch Capital Group Ltd. * | | |
| | |
26
Schwab Fundamental Index Funds | Annual Report
Schwab Fundamental US Large Company Index Fund
Portfolio Holdings as of October 31, 2023 (continued)
| | |
| | |
| | |
| | |
| | |
Cincinnati Financial Corp. | | |
CNO Financial Group, Inc. | | |
| | |
Fidelity National Financial, Inc. | | |
First American Financial Corp. | | |
Genworth Financial, Inc., Class A * | | |
| | |
Hanover Insurance Group, Inc. | | |
Hartford Financial Services Group, Inc. | | |
| | |
| | |
| | |
| | |
Marsh & McLennan Cos., Inc. | | |
| | |
Old Republic International Corp. | | |
| | |
Principal Financial Group, Inc. | | |
| | |
Prudential Financial, Inc. | | |
Reinsurance Group of America, Inc. | | |
RenaissanceRe Holdings Ltd. | | |
| | |
| | |
| | |
| | |
| | |
|
|
Air Products & Chemicals, Inc. | | |
| | |
| | |
| | |
| | |
Axalta Coating Systems Ltd. * | | |
| | |
| | |
| | |
CF Industries Holdings, Inc. | | |
| | |
| | |
| | |
| | |
| | |
| | |
| | |
| | |
| | |
| | |
| | |
| | |
Graphic Packaging Holding Co. | | |
| | |
International Flavors & Fragrances, Inc. | | |
| | |
| | |
| | |
| | |
LyondellBasell Industries NV, Class A | | |
Martin Marietta Materials, Inc. | | |
| | |
| | |
| | |
| | |
| | |
| | |
Packaging Corp. of America | | |
| | |
Reliance Steel & Aluminum Co. | | |
| | |
| | |
| | |
| | |
| | |
| | |
| | |
| | |
| | |
| | |
|
Media & Entertainment 7.1% |
Alphabet, Inc., Class A * | | |
Alphabet, Inc., Class C * | | |
Charter Communications, Inc., Class A * | | |
| | |
DISH Network Corp., Class A * | | |
| | |
| | |
Interpublic Group of Cos., Inc. | | |
Liberty Media Corp.-Liberty Live, Class C * | | |
Liberty Media Corp.-Liberty SiriusXM, Class C * | | |
Meta Platforms, Inc., Class A * | | |
| | |
| | |
Nexstar Media Group, Inc., Class A | | |
| | |
Paramount Global, Class B | | |
Take-Two Interactive Software, Inc. * | | |
| | |
| | |
Warner Bros Discovery, Inc. * | | |
| | |
|
Pharmaceuticals, Biotechnology & Life Sciences 5.5% |
| | |
Agilent Technologies, Inc. | | |
| | |
| | |
| | |
| | |
| | |
| | |
| | |
| | |
| | |
| | |
| | |
| | |
Jazz Pharmaceuticals PLC * | | |
| | |
| | |
Mettler-Toledo International, Inc. * | | |
| | |
| | |
| | |
| | |
Regeneron Pharmaceuticals, Inc. * | | |
| | |
Schwab Fundamental Index Funds | Annual Report27
Schwab Fundamental US Large Company Index Fund
Portfolio Holdings as of October 31, 2023 (continued)
| | |
Thermo Fisher Scientific, Inc. | | |
United Therapeutics Corp. * | | |
Vertex Pharmaceuticals, Inc. * | | |
| | |
| | |
West Pharmaceutical Services, Inc. | | |
| | |
| | |
|
Real Estate Management & Development 0.2% |
Anywhere Real Estate, Inc. * | | |
CBRE Group, Inc., Class A * | | |
DigitalBridge Group, Inc. | | |
Jones Lang LaSalle, Inc. * | | |
| | |
|
Semiconductors & Semiconductor Equipment 4.6% |
Advanced Micro Devices, Inc. * | | |
| | |
| | |
| | |
| | |
| | |
| | |
| | |
| | |
Microchip Technology, Inc. | | |
| | |
| | |
| | |
| | |
| | |
| | |
| | |
| | |
| | |
| | |
| | |
|
|
| | |
| | |
Akamai Technologies, Inc. * | | |
| | |
| | |
| | |
Cadence Design Systems, Inc. * | | |
Check Point Software Technologies Ltd. * | | |
Cognizant Technology Solutions Corp., Class A | | |
| | |
| | |
| | |
| | |
International Business Machines Corp. | | |
| | |
| | |
| | |
| | |
| | |
Palo Alto Networks, Inc. * | | |
| | |
| | |
| | |
| | |
| | |
| | |
| | |
|
Technology Hardware & Equipment 7.2% |
| | |
| | |
| | |
Arrow Electronics, Inc. * | | |
| | |
| | |
| | |
| | |
| | |
| | |
| | |
Hewlett Packard Enterprise Co. | | |
| | |
Insight Enterprises, Inc. * | | |
| | |
| | |
Keysight Technologies, Inc. * | | |
| | |
| | |
| | |
Seagate Technology Holdings PLC | | |
| | |
| | |
Teledyne Technologies, Inc. * | | |
| | |
Vishay Intertechnology, Inc. | | |
| | |
| | |
Zebra Technologies Corp., Class A * | | |
| | |
|
Telecommunication Services 3.1% |
| | |
Liberty Global PLC, Class C * | | |
Lumen Technologies, Inc. * | | |
Telephone & Data Systems, Inc. | | |
| | |
Verizon Communications, Inc. | | |
| | |
|
|
Avis Budget Group, Inc. * | | |
CH Robinson Worldwide, Inc. | | |
| | |
| | |
Expeditors International of Washington, Inc. | | |
| | |
| | |
JB Hunt Transport Services, Inc. | | |
Knight-Swift Transportation Holdings, Inc. | | |
| | |
| | |
Old Dominion Freight Line, Inc. | | |
| | |
| | |
Uber Technologies, Inc. * | | |
| | |
United Airlines Holdings, Inc. * | | |
United Parcel Service, Inc., Class B | | |
28
Schwab Fundamental Index Funds | Annual Report
Schwab Fundamental US Large Company Index Fund
Portfolio Holdings as of October 31, 2023 (continued)
| | |
| | |
ZIM Integrated Shipping Services Ltd. (a) | | |
| | |
|
|
| | |
| | |
| | |
American Electric Power Co., Inc. | | |
American Water Works Co., Inc. | | |
| | |
| | |
| | |
| | |
Consolidated Edison, Inc. | | |
Constellation Energy Corp. | | |
| | |
| | |
| | |
| | |
| | |
| | |
| | |
| | |
| | |
| | |
| | |
| | |
| | |
| | |
| | |
Pinnacle West Capital Corp. | | |
Portland General Electric Co. | | |
| | |
Public Service Enterprise Group, Inc. | | |
| | |
| | |
Southwest Gas Holdings, Inc. | | |
| | |
| | |
| | |
| | |
| | |
Total Common Stocks
(Cost $4,456,023,704) | |
| | |
SHORT-TERM INVESTMENTS 0.4% OF NET ASSETS |
|
|
State Street Institutional U.S. Government Money Market Fund, Premier Class 5.30% (c) | | |
State Street Institutional U.S. Government Money Market Fund, Premier Class 5.30% (c)(d) | | |
| | |
Total Short-Term Investments
(Cost $28,679,491) | |
Total Investments in Securities
(Cost $4,484,703,195) | |
| | | CURRENT VALUE/
UNREALIZED
DEPRECIATION
($) |
|
| | | |
S&P 500 Index, e-mini, expires 12/15/23 | | | |
| Non-income producing security. |
| All or a portion of this security is on loan. Securities on loan were valued at $2,345,929. |
| Issuer is affiliated with the fund’s investment adviser. |
| The rate shown is the annualized 7-day yield. |
| Security purchased with cash collateral received for securities on loan. |
| American Depositary Receipt |
Below is a summary of the fund’s transactions with affiliated issuers during the period ended October 31, 2023:
| | | | | NET CHANGE IN UNREALIZED APPRECIATION (DEPRECIATION) | | BALANCE OF SHARES HELD AT 10/31/23 | |
COMMON STOCKS 0.1% OF NET ASSETS |
|
|
| | | | | | | | |
Schwab Fundamental Index Funds | Annual Report29
Schwab Fundamental US Large Company Index Fund
Portfolio Holdings as of October 31, 2023 (continued)
The following is a summary of the inputs used to value the fund’s investments as of October 31, 2023 (see financial note 2(a) for additional information):
| QUOTED PRICES IN
ACTIVE MARKETS FOR
IDENTICAL ASSETS
(LEVEL 1) | OTHER SIGNIFICANT
OBSERVABLE INPUTS
(LEVEL 2) | SIGNIFICANT
UNOBSERVABLE INPUTS
(LEVEL 3) | |
| | | | |
| | | | |
| | | | |
| | | | |
| | | | |
| | | | |
| As categorized in the Portfolio Holdings. |
| Futures contracts are reported at cumulative unrealized appreciation or depreciation. |
30
Schwab Fundamental Index Funds | Annual Report
Schwab Fundamental US Large Company Index Fund
Statement of Assets and Liabilities
As of October 31, 2023
|
Investments in securities, at value - affiliated (cost $4,122,487) | | |
Investments in securities, at value - unaffiliated (cost $4,480,580,708) including securities on loan of $2,345,929 | | |
Deposit with broker for futures contracts | | |
| | |
| | |
| | |
Variation margin on future contracts | | |
Income from securities on loan | | |
| | |
|
|
Collateral held for securities on loan | | |
| | |
| | |
| | |
| | |
| | |
|
|
Capital received from investors | | |
Total distributable earnings | | |
| | |
Schwab Fundamental Index Funds | Annual Report31
Schwab Fundamental US Large Company Index Fund
Statement of Operations
For the period November 1, 2022 through October 31, 2023 |
|
Dividends received from securities - unaffiliated (net of foreign withholding tax of $66,860) | | |
Interest received from securities - unaffiliated | | |
Dividends received from securities - affiliated | | |
| | |
| | |
|
|
| | |
| | |
| | |
| | |
|
REALIZED AND UNREALIZED GAINS (LOSSES) |
Net realized losses on sales of securities - affiliated | | |
Net realized losses on sales of securities - unaffiliated | | |
Net realized gains on sales of in-kind redemptions - unaffiliated | | |
Net realized gains on futures contracts | | |
| | |
Net change in unrealized appreciation (depreciation) on securities - affiliated | | |
Net change in unrealized appreciation (depreciation) on securities - unaffiliated | | |
Net change in unrealized appreciation (depreciation) on futures contracts | | |
Net change in unrealized appreciation (depreciation) | | |
Net realized and unrealized gains | | |
Increase in net assets resulting from operations | | |
| Proxy fees are non-routine expenses (see financial note 2(e) for additional information). |
32
Schwab Fundamental Index Funds | Annual Report
Schwab Fundamental US Large Company Index Fund
Statement of Changes in Net Assets
For the current and prior report periods
|
| | |
| | | |
| | | |
Net change in unrealized appreciation (depreciation) | | | |
Increase (decrease) in net assets resulting from operations | | | |
|
DISTRIBUTIONS TO SHAREHOLDERS |
| | | |
TRANSACTIONS IN FUND SHARES |
| | |
| | | | | |
| | | | | |
| | | | | |
| | | | | |
Net transactions in fund shares | | | | | |
|
SHARES OUTSTANDING AND NET ASSETS |
| | |
| | | | | |
| | | | | |
Total increase (decrease) | | | | | |
| | | | | |
Schwab Fundamental Index Funds | Annual Report33
Schwab Fundamental US Small Company Index Fund
Financial Statements
| | | | | | |
|
Net asset value at beginning of period | | | | | | |
Income (loss) from investment operations: | | | | | | |
Net investment income (loss)1 | | | | | | |
Net realized and unrealized gains (losses) | | | | | | |
Total from investment operations | | | | | | |
| | | | | | |
Distributions from net investment income | | | | | | |
Distributions from net realized gains | | | | | | |
| | | | | | |
Net asset value at end of period | | | | | | |
| | | | | | |
|
Ratios to average net assets: | | | | | | |
| | | | | | |
Net investment income (loss) | | | | | | |
| | | | | | |
Net assets, end of period (x 1,000,000) | | | | | | |
| Calculated based on the average shares outstanding during the period. |
| Ratio includes less than 0.005% of non-routine proxy expenses. |
| Portfolio turnover rate excludes in-kind transactions. |
34
Schwab Fundamental Index Funds | Annual Report
Schwab Fundamental US Small Company Index Fund
Portfolio Holdings as of October 31, 2023
This section shows all the securities in the fund’s portfolio and their values as of the report date.
The fund files its complete schedule of portfolio holdings with the U.S. Securities and Exchange Commission (SEC) for the first and third quarters of each fiscal year on Form N-PORT Part F. The fund’s Form N-PORT Part F is available on the SEC’s website at www.sec.gov. You can also obtain this information at no cost on the fund’s website at www.schwabassetmanagement.com/schwabfunds_prospectus, by calling 1-866-414-6349, or by sending an email request to orders@mysummaryprospectus.com. The fund also makes available its complete schedule of portfolio holdings 15 to 20 days after the end of the month on the fund’s website.
| | |
COMMON STOCKS 99.7% OF NET ASSETS |
|
Automobiles & Components 1.4% |
American Axle & Manufacturing Holdings, Inc. * | | |
Cooper-Standard Holdings, Inc. * | | |
| | |
Fox Factory Holding Corp. * | | |
| | |
| | |
Modine Manufacturing Co. * | | |
| | |
Standard Motor Products, Inc. | | |
| | |
| | |
Winnebago Industries, Inc. | | |
| | |
|
|
| | |
| | |
| | |
| | |
| | |
| | |
Bank of NT Butterfield & Son Ltd. | | |
| | |
| | |
| | |
| | |
| | |
| | |
Capitol Federal Financial, Inc. | | |
| | |
Central Pacific Financial Corp. | | |
| | |
Columbia Banking System, Inc. | | |
Commerce Bancshares, Inc. | | |
Community Bank System, Inc. | | |
| | |
Cullen/Frost Bankers, Inc. | | |
Customers Bancorp, Inc. * | | |
| | |
| | |
| | |
Enterprise Financial Services Corp. | | |
| | |
First Bancorp/Southern Pines NC | | |
| | |
First Citizens BancShares, Inc., Class A | | |
First Commonwealth Financial Corp. | | |
| | |
First Financial Bankshares, Inc. | | |
| | |
First Interstate BancSystem, Inc., Class A | | |
| | |
| | |
| | |
| | |
| | |
| | |
| | |
Heartland Financial USA, Inc. | | |
| | |
| | |
| | |
| | |
| | |
Independent Bank Group, Inc. | | |
International Bancshares Corp. | | |
| | |
| | |
| | |
| | |
Northwest Bancshares, Inc. | | |
OceanFirst Financial Corp. | | |
| | |
| | |
Pacific Premier Bancorp, Inc. | | |
| | |
| | |
| | |
Pinnacle Financial Partners, Inc. | | |
| | |
Prosperity Bancshares, Inc. | | |
Provident Financial Services, Inc. | | |
| | |
| | |
Sandy Spring Bancorp, Inc. | | |
Simmons First National Corp., Class A | | |
Southside Bancshares, Inc. | | |
| | |
Texas Capital Bancshares, Inc. * | | |
| | |
| | |
| | |
| | |
| | |
| | |
United Community Banks, Inc. | | |
| | |
| | |
| | |
Washington Trust Bancorp, Inc. | | |
| | |
| | |
| | |
| | |
| | |
| | |
| | |
|
Schwab Fundamental Index Funds | Annual Report35
Schwab Fundamental US Small Company Index Fund
Portfolio Holdings as of October 31, 2023 (continued)
| | |
|
| | |
| | |
Advanced Drainage Systems, Inc. | | |
| | |
Albany International Corp., Class A | | |
American Woodmark Corp. * | | |
| | |
| | |
Applied Industrial Technologies, Inc. | | |
| | |
| | |
Armstrong World Industries, Inc. | | |
| | |
| | |
AZEK Co., Inc., Class A * | | |
| | |
| | |
Beacon Roofing Supply, Inc. * | | |
| | |
| | |
Comfort Systems USA, Inc. | | |
Construction Partners, Inc., Class A * | | |
Core & Main, Inc., Class A * | | |
| | |
| | |
| | |
| | |
| | |
| | |
| | |
Enerpac Tool Group Corp., Class A | | |
| | |
| | |
| | |
| | |
| | |
Franklin Electric Co., Inc. | | |
| | |
Gates Industrial Corp. PLC * | | |
| | |
| | |
Gibraltar Industries, Inc. * | | |
| | |
| | |
GrafTech International Ltd. | | |
Granite Construction, Inc. | | |
Great Lakes Dredge & Dock Corp. * | | |
| | |
| | |
H&E Equipment Services, Inc. | | |
| | |
| | |
| | |
Hillman Solutions Corp. * | | |
| | |
John Bean Technologies Corp. | | |
| | |
| | |
| | |
Kratos Defense & Security Solutions, Inc. * | | |
| | |
| | |
Masonite International Corp. * | | |
| | |
| | |
| | |
| | |
| | |
Mueller Water Products, Inc., Class A | | |
| | |
National Presto Industries, Inc. | | |
| | |
| | |
| | |
| | |
Quanex Building Products Corp. | | |
| | |
| | |
Rush Enterprises, Inc., Class A | | |
| | |
Simpson Manufacturing Co., Inc. | | |
SiteOne Landscape Supply, Inc. * | | |
| | |
Standex International Corp. | | |
Sterling Infrastructure, Inc. * | | |
| | |
| | |
Textainer Group Holdings Ltd. | | |
| | |
TPI Composites, Inc. *(a) | | |
| | |
| | |
| | |
| | |
| | |
Vertiv Holdings Co., Class A | | |
| | |
Watts Water Technologies, Inc., Class A | | |
WillScot Mobile Mini Holdings Corp. * | | |
| | |
Zurn Elkay Water Solutions Corp. | | |
| | |
|
Commercial & Professional Services 5.8% |
| | |
Barrett Business Services, Inc. | | |
BrightView Holdings, Inc. * | | |
| | |
Casella Waste Systems, Inc., Class A * | | |
| | |
Ceridian HCM Holding, Inc. * | | |
| | |
| | |
| | |
| | |
| | |
| | |
CSG Systems International, Inc. | | |
| | |
Dun & Bradstreet Holdings, Inc. | | |
| | |
| | |
ExlService Holdings, Inc. * | | |
| | |
| | |
| | |
Healthcare Services Group, Inc. | | |
Heidrick & Struggles International, Inc. | | |
| | |
Huron Consulting Group, Inc. * | | |
| | |
| | |
| | |
36
Schwab Fundamental Index Funds | Annual Report
Schwab Fundamental US Small Company Index Fund
Portfolio Holdings as of October 31, 2023 (continued)
| | |
Kelly Services, Inc., Class A | | |
| | |
| | |
Matthews International Corp., Class A | | |
| | |
| | |
| | |
| | |
| | |
| | |
| | |
Resources Connection, Inc. | | |
| | |
| | |
| | |
| | |
| | |
| | |
| | |
| | |
| | |
Verra Mobility Corp., Class A * | | |
| | |
|
Consumer Discretionary Distribution & Retail 4.9% |
1-800-Flowers.com, Inc., Class A * | | |
| | |
Abercrombie & Fitch Co., Class A * | | |
American Eagle Outfitters, Inc. | | |
America's Car-Mart, Inc. * | | |
| | |
Big 5 Sporting Goods Corp. (a) | | |
Boot Barn Holdings, Inc. * | | |
| | |
| | |
Camping World Holdings, Inc., Class A | | |
| | |
| | |
| | |
| | |
Container Store Group, Inc. * | | |
ContextLogic, Inc., Class A *(a) | | |
Designer Brands, Inc., Class A | | |
| | |
| | |
| | |
Floor & Decor Holdings, Inc., Class A * | | |
GameStop Corp., Class A *(a) | | |
| | |
| | |
Haverty Furniture Cos., Inc. | | |
| | |
| | |
LL Flooring Holdings, Inc. * | | |
| | |
| | |
| | |
National Vision Holdings, Inc. * | | |
Ollie's Bargain Outlet Holdings, Inc. * | | |
| | |
Petco Health & Wellness Co., Inc., Class A * | | |
| | |
| | |
Sally Beauty Holdings, Inc. * | | |
| | |
| | |
| | |
| | |
Sonic Automotive, Inc., Class A | | |
Stitch Fix, Inc., Class A * | | |
| | |
| | |
| | |
Victoria's Secret & Co. * | | |
| | |
| | |
| | |
| | |
|
Consumer Durables & Apparel 4.0% |
| | |
| | |
| | |
Century Communities, Inc. | | |
| | |
| | |
Ethan Allen Interiors, Inc. | | |
| | |
G-III Apparel Group Ltd. * | | |
| | |
| | |
Installed Building Products, Inc. | | |
| | |
| | |
| | |
| | |
| | |
| | |
| | |
| | |
Peloton Interactive, Inc., Class A * | | |
| | |
| | |
Smith & Wesson Brands, Inc. | | |
| | |
| | |
| | |
| | |
Topgolf Callaway Brands Corp. * | | |
Tupperware Brands Corp. *(a) | | |
Under Armour, Inc., Class A * | | |
| | |
Wolverine World Wide, Inc. | | |
| | |
| | |
|
|
| | |
Adtalem Global Education, Inc. * | | |
| | |
Arcos Dorados Holdings, Inc., Class A | | |
| | |
| | |
| | |
Bright Horizons Family Solutions, Inc. * | | |
Brinker International, Inc. * | | |
Caesars Entertainment, Inc. * | | |
Carriage Services, Inc., Class A | | |
| | |
Choice Hotels International, Inc. | | |
| | |
Cracker Barrel Old Country Store, Inc. | | |
Dave & Buster's Entertainment, Inc. * | | |
Schwab Fundamental Index Funds | Annual Report37
Schwab Fundamental US Small Company Index Fund
Portfolio Holdings as of October 31, 2023 (continued)
| | |
| | |
| | |
DoorDash, Inc., Class A * | | |
| | |
| | |
Graham Holdings Co., Class B | | |
Grand Canyon Education, Inc. * | | |
Hilton Grand Vacations, Inc. * | | |
Hyatt Hotels Corp., Class A | | |
International Game Technology PLC | | |
| | |
| | |
| | |
Marriott Vacations Worldwide Corp. | | |
Norwegian Cruise Line Holdings Ltd. * | | |
Papa John's International, Inc. | | |
| | |
Planet Fitness, Inc., Class A * | | |
Red Rock Resorts, Inc., Class A | | |
| | |
SeaWorld Entertainment, Inc. * | | |
Six Flags Entertainment Corp. * | | |
Strategic Education, Inc. | | |
| | |
Texas Roadhouse, Inc., Class A | | |
| | |
| | |
| | |
Wyndham Hotels & Resorts, Inc. | | |
| | |
|
Consumer Staples Distribution & Retail 0.9% |
| | |
| | |
Grocery Outlet Holding Corp. * | | |
Ingles Markets, Inc., Class A | | |
| | |
| | |
| | |
|
|
| | |
| | |
| | |
| | |
California Resources Corp. | | |
| | |
| | |
| | |
| | |
| | |
| | |
| | |
| | |
| | |
| | |
Diamond Offshore Drilling, Inc. * | | |
| | |
| | |
| | |
| | |
| | |
| | |
| | |
Helix Energy Solutions Group, Inc. * | | |
International Seaways, Inc. | | |
| | |
| | |
Liberty Energy, Inc., Class A | | |
Magnolia Oil & Gas Corp., Class A | | |
| | |
| | |
Oceaneering International, Inc. * | | |
Oil States International, Inc. * | | |
Par Pacific Holdings, Inc. * | | |
Patterson-UTI Energy, Inc. | | |
Permian Resources Corp., Class A | | |
| | |
| | |
| | |
| | |
Select Water Solutions, Inc. | | |
| | |
| | |
| | |
Teekay Tankers Ltd., Class A | | |
| | |
| | |
Tsakos Energy Navigation Ltd. | | |
| | |
Weatherford International PLC * | | |
| | |
|
Equity Real Estate Investment Trusts (REITs) 8.1% |
| | |
| | |
Alexander & Baldwin, Inc. | | |
American Assets Trust, Inc. | | |
American Homes 4 Rent, Class A | | |
Americold Realty Trust, Inc. | | |
Apartment Income REIT Corp. | | |
Apple Hospitality REIT, Inc. | | |
Ashford Hospitality Trust, Inc. * | | |
| | |
Broadstone Net Lease, Inc. | | |
CBL & Associates Properties, Inc. (a) | | |
| | |
| | |
| | |
| | |
| | |
DiamondRock Hospitality Co. | | |
Diversified Healthcare Trust | | |
| | |
Easterly Government Properties, Inc., Class A | | |
EastGroup Properties, Inc. | | |
| | |
Empire State Realty Trust, Inc., Class A | | |
| | |
| | |
Equity LifeStyle Properties, Inc. | | |
Essential Properties Realty Trust, Inc. | | |
Federal Realty Investment Trust | | |
First Industrial Realty Trust, Inc. | | |
Four Corners Property Trust, Inc. | | |
| | |
| | |
Healthcare Realty Trust, Inc., Class A | | |
Highwoods Properties, Inc. | | |
| | |
Hudson Pacific Properties, Inc. | | |
Independence Realty Trust, Inc. | | |
Industrial Logistics Properties Trust | | |
38
Schwab Fundamental Index Funds | Annual Report
Schwab Fundamental US Small Company Index Fund
Portfolio Holdings as of October 31, 2023 (continued)
| | |
| | |
| | |
| | |
| | |
| | |
| | |
National Health Investors, Inc. | | |
National Storage Affiliates Trust | | |
| | |
Office Properties Income Trust | | |
| | |
| | |
| | |
Phillips Edison & Co., Inc. | | |
| | |
Piedmont Office Realty Trust, Inc., Class A | | |
| | |
| | |
Retail Opportunity Investments Corp. | | |
Rexford Industrial Realty, Inc. | | |
| | |
| | |
Ryman Hospitality Properties, Inc. | | |
Sabra Health Care REIT, Inc. | | |
| | |
Spirit Realty Capital, Inc. | | |
| | |
| | |
Sunstone Hotel Investors, Inc. | | |
Tanger Factory Outlet Centers, Inc. | | |
| | |
| | |
| | |
| | |
Xenia Hotels & Resorts, Inc. | | |
| | |
|
|
A-Mark Precious Metals, Inc. | | |
Apollo Commercial Real Estate Finance, Inc. | | |
Arbor Realty Trust, Inc. (a) | | |
Ares Management Corp., Class A | | |
Artisan Partners Asset Management, Inc., Class A | | |
B Riley Financial, Inc. (a) | | |
| | |
Blackstone Mortgage Trust, Inc., Class A (a) | | |
| | |
Brightsphere Investment Group, Inc. | | |
BrightSpire Capital, Inc., Class A | | |
| | |
| | |
Compass Diversified Holdings | | |
Corebridge Financial, Inc. | | |
Credit Acceptance Corp. * | | |
Diamond Hill Investment Group, Inc. | | |
Donnelley Financial Solutions, Inc. * | | |
Encore Capital Group, Inc. * | | |
Enova International, Inc. * | | |
| | |
Euronet Worldwide, Inc. * | | |
| | |
FactSet Research Systems, Inc. | | |
| | |
| | |
Granite Point Mortgage Trust, Inc. | | |
Green Dot Corp., Class A * | | |
Hannon Armstrong Sustainable Infrastructure Capital, Inc. | | |
Houlihan Lokey, Inc., Class A | | |
Interactive Brokers Group, Inc., Class A | | |
Jackson Financial, Inc., Class A | | |
KKR Real Estate Finance Trust, Inc. | | |
Ladder Capital Corp. REIT, Class A | | |
| | |
MarketAxess Holdings, Inc. | | |
| | |
| | |
| | |
| | |
| | |
New York Mortgage Trust, Inc. | | |
NMI Holdings, Inc., Class A * | | |
Pagseguro Digital Ltd., Class A * | | |
| | |
PennyMac Financial Services, Inc. | | |
PennyMac Mortgage Investment Trust | | |
| | |
PJT Partners, Inc., Class A | | |
| | |
| | |
| | |
StepStone Group, Inc., Class A | | |
| | |
| | |
TPG RE Finance Trust, Inc. | | |
| | |
Tradeweb Markets, Inc., Class A | | |
Two Harbors Investment Corp. | | |
Virtu Financial, Inc., Class A | | |
Virtus Investment Partners, Inc. | | |
| | |
| | |
| | |
| | |
| | |
|
Food, Beverage & Tobacco 2.6% |
| | |
| | |
Boston Beer Co., Inc., Class A * | | |
Brown-Forman Corp., Class B | | |
| | |
| | |
Coca-Cola Consolidated, Inc. | | |
| | |
Fresh Del Monte Produce, Inc. | | |
Hain Celestial Group, Inc. * | | |
Hostess Brands, Inc., Class A * | | |
| | |
John B Sanfilippo & Son, Inc. | | |
| | |
| | |
National Beverage Corp. * | | |
| | |
| | |
Seneca Foods Corp., Class A * | | |
| | |
| | |
| | |
Schwab Fundamental Index Funds | Annual Report39
Schwab Fundamental US Small Company Index Fund
Portfolio Holdings as of October 31, 2023 (continued)
| | |
| | |
| | |
|
Health Care Equipment & Services 4.0% |
Acadia Healthcare Co., Inc. * | | |
AdaptHealth Corp., Class A * | | |
| | |
| | |
AMN Healthcare Services, Inc. * | | |
| | |
Brookdale Senior Living, Inc. * | | |
Community Health Systems, Inc. * | | |
| | |
Cross Country Healthcare, Inc. * | | |
| | |
| | |
| | |
| | |
| | |
| | |
| | |
Globus Medical, Inc., Class A * | | |
| | |
| | |
| | |
| | |
| | |
Integra LifeSciences Holdings Corp. * | | |
| | |
| | |
Merit Medical Systems, Inc. * | | |
| | |
| | |
National HealthCare Corp. | | |
| | |
NextGen Healthcare, Inc. * | | |
OmniAb, Inc., Class A *(b) | | |
OmniAb, Inc., Class B *(b) | | |
| | |
| | |
Option Care Health, Inc. * | | |
| | |
Pediatrix Medical Group, Inc. * | | |
| | |
| | |
| | |
| | |
Select Medical Holdings Corp. | | |
| | |
U.S. Physical Therapy, Inc. | | |
| | |
Veeva Systems, Inc., Class A * | | |
| | |
| | |
| | |
|
Household & Personal Products 1.5% |
| | |
Central Garden & Pet Co., Class A * | | |
| | |
Edgewell Personal Care Co. | | |
| | |
| | |
| | |
| | |
Nu Skin Enterprises, Inc., Class A | | |
| | |
Reynolds Consumer Products, Inc. | | |
Spectrum Brands Holdings, Inc. | | |
USANA Health Sciences, Inc. * | | |
| | |
| | |
|
|
Ambac Financial Group, Inc. * | | |
American Equity Investment Life Holding Co. | | |
Argo Group International Holdings Ltd. | | |
Axis Capital Holdings Ltd. | | |
Brighthouse Financial, Inc. * | | |
| | |
| | |
| | |
Horace Mann Educators Corp. | | |
James River Group Holdings Ltd. | | |
| | |
| | |
| | |
| | |
Safety Insurance Group, Inc. | | |
Selective Insurance Group, Inc. | | |
| | |
Stewart Information Services Corp. | | |
| | |
Universal Insurance Holdings, Inc. | | |
White Mountains Insurance Group Ltd. | | |
| | |
|
|
| | |
Alpha Metallurgical Resources, Inc. | | |
| | |
| | |
| | |
| | |
| | |
| | |
| | |
| | |
Carpenter Technology Corp. | | |
| | |
| | |
| | |
Compass Minerals International, Inc. | | |
Constellium SE, Class A * | | |
| | |
| | |
| | |
| | |
| | |
| | |
| | |
| | |
| | |
| | |
| | |
| | |
| | |
| | |
Mercer International, Inc. | | |
Minerals Technologies, Inc. | | |
| | |
| | |
40
Schwab Fundamental Index Funds | Annual Report
Schwab Fundamental US Small Company Index Fund
Portfolio Holdings as of October 31, 2023 (continued)
| | |
| | |
| | |
| | |
| | |
| | |
| | |
Schnitzer Steel Industries, Inc., Class A | | |
| | |
Sensient Technologies Corp. | | |
| | |
| | |
Summit Materials, Inc., Class A * | | |
| | |
| | |
| | |
| | |
| | |
| | |
| | |
Worthington Industries, Inc. | | |
| | |
|
Media & Entertainment 3.4% |
AMC Entertainment Holdings, Inc., Class A * | | |
AMC Networks, Inc., Class A * | | |
| | |
| | |
| | |
| | |
Cinemark Holdings, Inc. * | | |
Clear Channel Outdoor Holdings, Inc. * | | |
EW Scripps Co., Class A * | | |
| | |
| | |
| | |
iHeartMedia, Inc., Class A * | | |
John Wiley & Sons, Inc., Class A | | |
Liberty Broadband Corp., Class C * | | |
Liberty Media Corp.-Liberty Formula One, Class C * | | |
Lions Gate Entertainment Corp., Class A * | | |
Madison Square Garden Entertainment Corp., Class A * | | |
| | |
New York Times Co., Class A | | |
Pinterest, Inc., Class A * | | |
| | |
| | |
| | |
| | |
Sirius XM Holdings, Inc. (a) | | |
Sphere Entertainment Co. * | | |
| | |
| | |
| | |
Trade Desk, Inc., Class A * | | |
| | |
| | |
| | |
| | |
ZoomInfo Technologies, Inc., Class A * | | |
| | |
|
| | |
Pharmaceuticals, Biotechnology & Life Sciences 2.0% |
| | |
| | |
BioMarin Pharmaceutical, Inc. * | | |
Bio-Rad Laboratories, Inc., Class A * | | |
| | |
| | |
Charles River Laboratories International, Inc. * | | |
Corcept Therapeutics, Inc. * | | |
Elanco Animal Health, Inc. * | | |
Emergent BioSolutions, Inc. * | | |
| | |
| | |
Halozyme Therapeutics, Inc. * | | |
| | |
| | |
| | |
| | |
Neurocrine Biosciences, Inc. * | | |
Prestige Consumer Healthcare, Inc. * | | |
| | |
Royalty Pharma PLC, Class A | | |
| | |
Supernus Pharmaceuticals, Inc. * | | |
| | |
|
Real Estate Management & Development 0.8% |
| | |
Cushman & Wakefield PLC * | | |
| | |
| | |
Howard Hughes Holdings, Inc. * | | |
Kennedy-Wilson Holdings, Inc. | | |
| | |
Newmark Group, Inc., Class A | | |
Opendoor Technologies, Inc. * | | |
| | |
Zillow Group, Inc., Class C * | | |
| | |
|
Semiconductors & Semiconductor Equipment 2.0% |
| | |
Axcelis Technologies, Inc. * | | |
| | |
| | |
| | |
| | |
| | |
| | |
GLOBALFOUNDRIES, Inc. *(a) | | |
| | |
Kulicke & Soffa Industries, Inc. | | |
Lattice Semiconductor Corp. * | | |
Magnachip Semiconductor Corp. * | | |
Monolithic Power Systems, Inc. | | |
| | |
| | |
| | |
| | |
Silicon Laboratories, Inc. * | | |
SMART Global Holdings, Inc. * | | |
SolarEdge Technologies, Inc. * | | |
| | |
Ultra Clean Holdings, Inc. * | | |
Schwab Fundamental Index Funds | Annual Report41
Schwab Fundamental US Small Company Index Fund
Portfolio Holdings as of October 31, 2023 (continued)
| | |
| | |
| | |
| | |
|
|
| | |
Alarm.com Holdings, Inc. * | | |
AppLovin Corp., Class A * | | |
Bentley Systems, Inc., Class B | | |
| | |
| | |
CommVault Systems, Inc. * | | |
Consensus Cloud Solutions, Inc. * | | |
Dolby Laboratories, Inc., Class A | | |
| | |
| | |
| | |
| | |
| | |
| | |
| | |
Guidewire Software, Inc. * | | |
| | |
LiveRamp Holdings, Inc. * | | |
Manhattan Associates, Inc. * | | |
Palantir Technologies, Inc., Class A * | | |
| | |
| | |
| | |
| | |
| | |
Rackspace Technology, Inc. * | | |
RingCentral, Inc., Class A * | | |
| | |
Snowflake, Inc., Class A * | | |
| | |
| | |
| | |
| | |
Tyler Technologies, Inc. * | | |
| | |
| | |
| | |
Zoom Video Communications, Inc., Class A * | | |
| | |
|
Technology Hardware & Equipment 3.8% |
| | |
Advanced Energy Industries, Inc. | | |
| | |
| | |
Benchmark Electronics, Inc. | | |
| | |
| | |
CommScope Holding Co., Inc. * | | |
Comtech Telecommunications Corp. | | |
| | |
| | |
| | |
| | |
| | |
| | |
| | |
| | |
Lumentum Holdings, Inc. * | | |
| | |
Methode Electronics, Inc. | | |
| | |
| | |
| | |
| | |
| | |
| | |
Pure Storage, Inc., Class A * | | |
| | |
| | |
| | |
Super Micro Computer, Inc. * | | |
| | |
| | |
| | |
| | |
| | |
|
Telecommunication Services 0.9% |
| | |
Cogent Communications Holdings, Inc. | | |
Consolidated Communications Holdings, Inc. * | | |
EchoStar Corp., Class A * | | |
Frontier Communications Parent, Inc. * | | |
| | |
Iridium Communications, Inc. | | |
Liberty Latin America Ltd., Class C * | | |
Shenandoah Telecommunications Co. | | |
| | |
|
|
Air Transport Services Group, Inc. * | | |
| | |
American Airlines Group, Inc. * | | |
| | |
| | |
Covenant Logistics Group, Inc., Class A | | |
| | |
| | |
| | |
Genco Shipping & Trading Ltd. | | |
Golden Ocean Group Ltd. (a) | | |
| | |
Hub Group, Inc., Class A * | | |
| | |
| | |
| | |
| | |
| | |
| | |
| | |
Schneider National, Inc., Class B | | |
| | |
| | |
Star Bulk Carriers Corp. (a) | | |
U-Haul Holding Co. - Non Voting | | |
| | |
| | |
|
|
| | |
American States Water Co. | | |
Atlantica Sustainable Infrastructure PLC | | |
| | |
42
Schwab Fundamental Index Funds | Annual Report
Schwab Fundamental US Small Company Index Fund
Portfolio Holdings as of October 31, 2023 (continued)
| | |
| | |
California Water Service Group | | |
Chesapeake Utilities Corp. | | |
Clearway Energy, Inc., Class C | | |
Essential Utilities, Inc. | | |
Hawaiian Electric Industries, Inc. | | |
| | |
| | |
New Jersey Resources Corp. | | |
Northwest Natural Holding Co. | | |
Northwestern Energy Group, Inc. | | |
| | |
| | |
| | |
| | |
ReNew Energy Global PLC, Class A * | | |
| | |
| | |
| | |
| | |
Total Common Stocks
(Cost $1,363,689,288) | |
| | |
SHORT-TERM INVESTMENTS 1.4% OF NET ASSETS |
|
|
State Street Institutional U.S. Government Money Market Fund, Premier Class 5.30% (c) | | |
State Street Institutional U.S. Government Money Market Fund, Premier Class 5.30% (c)(d) | | |
| | |
Total Short-Term Investments
(Cost $22,166,033) | |
Total Investments in Securities
(Cost $1,385,855,321) | |
| | | CURRENT VALUE/
UNREALIZED
DEPRECIATION
($) |
|
| | | |
Russell 2000 Index, e-mini, expires 12/15/23 | | | |
| Non-income producing security. |
| All or a portion of this security is on loan. Securities on loan were valued at $13,638,856. |
| Fair valued using significant unobservable inputs (see financial note 2(a), Securities for which no quoted value is available, for additional information). |
| The rate shown is the annualized 7-day yield. |
| Security purchased with cash collateral received for securities on loan. |
| Real Estate Investment Trust |
Schwab Fundamental Index Funds | Annual Report43
Schwab Fundamental US Small Company Index Fund
Portfolio Holdings as of October 31, 2023 (continued)
The following is a summary of the inputs used to value the fund’s investments as of October 31, 2023 (see financial note 2(a) for additional information):
| QUOTED PRICES IN
ACTIVE MARKETS FOR
IDENTICAL ASSETS
(LEVEL 1) | OTHER SIGNIFICANT
OBSERVABLE INPUTS
(LEVEL 2) | SIGNIFICANT
UNOBSERVABLE INPUTS
(LEVEL 3) | |
| | | | |
| | | | |
Equity Real Estate Investment Trusts (REITs) | | | | |
Health Care Equipment & Services | | | | |
Telecommunication Services | | | | |
| | | | |
| | | | |
| | | | |
| | | | |
| Level 3 amount shown includes securities determined to have no value at October 31, 2023. |
| As categorized in the Portfolio Holdings. |
| Futures contracts are reported at cumulative unrealized appreciation or depreciation. |
44
Schwab Fundamental Index Funds | Annual Report
Schwab Fundamental US Small Company Index Fund
Statement of Assets and Liabilities
As of October 31, 2023
|
Investments in securities, at value - unaffiliated (cost $1,385,855,321) including securities on loan of $13,638,856 | | |
Deposit with broker for futures contracts | | |
| | |
| | |
| | |
Variation margin on future contracts | | |
Income from securities on loan | | |
| | |
|
|
Collateral held for securities on loan | | |
| | |
| | |
| | |
| | |
| | |
| | |
|
|
Capital received from investors | | |
Total distributable earnings | | |
| | |
Schwab Fundamental Index Funds | Annual Report45
Schwab Fundamental US Small Company Index Fund
Statement of Operations
For the period November 1, 2022 through October 31, 2023 |
|
Dividends received from securities - unaffiliated (net of foreign withholding tax of $16,405) | | |
Interest received from securities - unaffiliated | | |
| | |
| | |
|
|
| | |
| | |
| | |
|
REALIZED AND UNREALIZED GAINS (LOSSES) |
Net realized losses on sales of securities - unaffiliated | | |
Net realized gains on sales of in-kind redemptions - unaffiliated | | |
Net realized losses on futures contracts | | |
| | |
Net change in unrealized appreciation (depreciation) on securities - unaffiliated | | |
Net change in unrealized appreciation (depreciation) on futures contracts | | |
Net change in unrealized appreciation (depreciation) | | |
Net realized and unrealized losses | | |
Decrease in net assets resulting from operations | | |
46
Schwab Fundamental Index Funds | Annual Report
Schwab Fundamental US Small Company Index Fund
Statement of Changes in Net Assets
For the current and prior report periods
|
| | |
| | | |
| | | |
Net change in unrealized appreciation (depreciation) | | | |
Decrease in net assets from operations | | | |
|
DISTRIBUTIONS TO SHAREHOLDERS |
| | | |
TRANSACTIONS IN FUND SHARES |
| | |
| | | | | |
| | | | | |
| | | | | |
| | | | | |
Net transactions in fund shares | | | | | |
|
SHARES OUTSTANDING AND NET ASSETS |
| | |
| | | | | |
| | | | | |
Total increase (decrease) | | | | | |
| | | | | |
Schwab Fundamental Index Funds | Annual Report47
Schwab Fundamental International Large Company Index Fund
Financial Statements
| | | | | | |
|
Net asset value at beginning of period | | | | | | |
Income (loss) from investment operations: | | | | | | |
Net investment income (loss)1 | | | | | | |
Net realized and unrealized gains (losses) | | | | | | |
Total from investment operations | | | | | | |
| | | | | | |
Distributions from net investment income | | | | | | |
Net asset value at end of period | | | | | | |
| | | | | | |
|
Ratios to average net assets: | | | | | | |
| | | | | | |
Net investment income (loss) | | | | | | |
| | | | | | |
Net assets, end of period (x 1,000,000) | | | | | | |
| Calculated based on the average shares outstanding during the period. |
| Ratio includes less than 0.005% of non-routine proxy expenses. |
48
Schwab Fundamental Index Funds | Annual Report
Schwab Fundamental International Large Company Index Fund
Portfolio Holdings as of October 31, 2023
This section shows all the securities in the fund’s portfolio and their values as of the report date.
The fund files its complete schedule of portfolio holdings with the U.S. Securities and Exchange Commission (SEC) for the first and third quarters of each fiscal year on Form N-PORT Part F. The fund’s Form N-PORT Part F is available on the SEC’s website at www.sec.gov. You can also obtain this information at no cost on the fund’s website at www.schwabassetmanagement.com/schwabfunds_prospectus, by calling 1-866-414-6349, or by sending an email request to orders@mysummaryprospectus.com. The fund also makes available its complete schedule of portfolio holdings 15 to 20 days after the end of the month on the fund’s website.
| | |
COMMON STOCKS 98.1% OF NET ASSETS |
|
|
| | |
| | |
| | |
| | |
| | |
| | |
| | |
| | |
| | |
| | |
| | |
| | |
Commonwealth Bank of Australia | | |
| | |
| | |
| | |
| | |
Fortescue Metals Group Ltd. | | |
| | |
| | |
Insurance Australia Group Ltd. | | |
James Hardie Industries PLC * | | |
| | |
| | |
| | |
| | |
| | |
| | |
| | |
National Australia Bank Ltd. | | |
| | |
| | |
| | |
| | |
| | |
| | |
| | |
| | |
| | |
| | |
| | |
| | |
| | |
| | |
Treasury Wine Estates Ltd. (a) | | |
| | |
| | |
Woodside Energy Group Ltd. | | |
| | |
| | |
| | |
|
| | |
|
| | |
| | |
| | |
Raiffeisen Bank International AG * | | |
| | |
| | |
| | |
|
|
| | |
| | |
| | |
Groupe Bruxelles Lambert NV | | |
| | |
| | |
| | |
| | |
| | |
| | |
|
|
| | |
Algonquin Power & Utilities Corp. | | |
Alimentation Couche-Tard, Inc. | | |
| | |
| | |
| | |
| | |
| | |
| | |
| | |
Bausch Health Cos., Inc. * | | |
| | |
Canadian Imperial Bank of Commerce | | |
Canadian National Railway Co. | | |
Canadian Natural Resources Ltd. | | |
Canadian Pacific Kansas City Ltd. | | |
Canadian Tire Corp. Ltd., Class A | | |
| | |
| | |
| | |
Constellation Software, Inc. | | |
Crescent Point Energy Corp. | | |
| | |
| | |
| | |
Fairfax Financial Holdings Ltd. | | |
Finning International, Inc. | | |
First Quantum Minerals Ltd. | | |
| | |
| | |
| | |
| | |
| | |
Schwab Fundamental Index Funds | Annual Report49
Schwab Fundamental International Large Company Index Fund
Portfolio Holdings as of October 31, 2023 (continued)
| | |
| | |
| | |
| | |
| | |
| | |
| | |
| | |
| | |
| | |
Magna International, Inc. | | |
| | |
| | |
| | |
| | |
| | |
| | |
| | |
| | |
| | |
| | |
| | |
Restaurant Brands International, Inc. | | |
RioCan Real Estate Investment Trust | | |
| | |
| | |
| | |
| | |
| | |
| | |
Teck Resources Ltd., Class B | | |
| | |
| | |
| | |
| | |
| | |
| | |
West Fraser Timber Co. Ltd. | | |
Wheaton Precious Metals Corp. | | |
| | |
| | |
|
|
AP Moller - Maersk AS, Class A | | |
AP Moller - Maersk AS, Class B | | |
| | |
| | |
| | |
| | |
| | |
| | |
| | |
| | |
| | |
| | |
| | |
|
|
| | |
| | |
| | |
| | |
| | |
| | |
| | |
| | |
| | |
| | |
| | |
| | |
| | |
| | |
| | |
| | |
| | |
| | |
|
|
| | |
| | |
| | |
| | |
| | |
| | |
| | |
| | |
| | |
| | |
| | |
| | |
| | |
| | |
| | |
Casino Guichard Perrachon SA *(b) | | |
| | |
Cie Generale des Etablissements Michelin SCA | | |
| | |
| | |
| | |
| | |
| | |
| | |
| | |
| | |
| | |
| | |
Eutelsat Communications SACA (b) | | |
| | |
| | |
| | |
| | |
| | |
| | |
LVMH Moet Hennessy Louis Vuitton SE | | |
| | |
| | |
| | |
| | |
| | |
| | |
| | |
| | |
| | |
| | |
| | |
| | |
| | |
| | |
| | |
| | |
| | |
| | |
Unibail-Rodamco-Westfield * | | |
| | |
50
Schwab Fundamental Index Funds | Annual Report
Schwab Fundamental International Large Company Index Fund
Portfolio Holdings as of October 31, 2023 (continued)
| | |
| | |
| | |
| | |
| | |
| | |
|
|
| | |
| | |
| | |
| | |
| | |
Bayerische Motoren Werke AG | | |
| | |
| | |
| | |
| | |
| | |
| | |
| | |
| | |
| | |
| | |
| | |
| | |
| | |
| | |
Fresenius Medical Care AG & Co. KGaA | | |
| | |
| | |
| | |
| | |
| | |
| | |
| | |
| | |
| | |
| | |
| | |
| | |
| | |
| | |
| | |
Muenchener Rueckversicherungs-Gesellschaft AG in Muenchen | | |
| | |
| | |
| | |
| | |
| | |
| | |
| | |
| | |
| | |
| | |
Telefonica Deutschland Holding AG | | |
| | |
| | |
| | |
| | |
| | |
| | |
|
| | |
|
| | |
BOC Hong Kong Holdings Ltd. | | |
| | |
CK Hutchison Holdings Ltd. | | |
| | |
Galaxy Entertainment Group Ltd. | | |
| | |
Henderson Land Development Co. Ltd. | | |
Hong Kong & China Gas Co. Ltd. | | |
Hong Kong Exchanges & Clearing Ltd. | | |
Hongkong Land Holdings Ltd. | | |
Jardine Matheson Holdings Ltd. | | |
| | |
| | |
| | |
New World Development Co. Ltd. | | |
Orient Overseas International Ltd. | | |
| | |
| | |
| | |
Sun Hung Kai Properties Ltd. | | |
Swire Pacific Ltd., A Shares | | |
Swire Pacific Ltd., B Shares | | |
Techtronic Industries Co. Ltd. | | |
| | |
Wharf Real Estate Investment Co. Ltd. | | |
Xinyi Glass Holdings Ltd. | | |
| | |
|
|
Bank of Ireland Group PLC | | |
| | |
| | |
| | |
|
|
| | |
| | |
| | |
Israel Discount Bank Ltd., A Shares | | |
Teva Pharmaceutical Industries Ltd. * | | |
| | |
|
|
| | |
Assicurazioni Generali SpA | | |
| | |
| | |
| | |
| | |
| | |
| | |
| | |
| | |
| | |
Mediobanca Banca di Credito Finanziario SpA (b) | | |
| | |
| | |
| | |
| | |
| | |
| | |
Schwab Fundamental Index Funds | Annual Report51
Schwab Fundamental International Large Company Index Fund
Portfolio Holdings as of October 31, 2023 (continued)
| | |
| | |
Terna - Rete Elettrica Nazionale | | |
| | |
| | |
| | |
|
|
| | |
| | |
| | |
| | |
| | |
| | |
| | |
| | |
| | |
Asahi Group Holdings Ltd. | | |
| | |
| | |
Bandai Namco Holdings, Inc. | | |
| | |
| | |
| | |
Central Japan Railway Co. | | |
Chubu Electric Power Co., Inc. | | |
Chugai Pharmaceutical Co. Ltd. | | |
Chugoku Electric Power Co., Inc. | | |
Coca-Cola Bottlers Japan Holdings, Inc. | | |
| | |
Concordia Financial Group Ltd. | | |
Cosmo Energy Holdings Co. Ltd. | | |
Dai Nippon Printing Co. Ltd. | | |
| | |
| | |
| | |
Dai-ichi Life Holdings, Inc. | | |
| | |
| | |
Daito Trust Construction Co. Ltd. | | |
Daiwa House Industry Co. Ltd. | | |
Daiwa Securities Group, Inc. | | |
Daiwabo Holdings Co. Ltd. | | |
| | |
| | |
| | |
| | |
| | |
| | |
| | |
| | |
| | |
Electric Power Development Co. Ltd. | | |
| | |
| | |
| | |
| | |
| | |
| | |
| | |
| | |
Furukawa Electric Co. Ltd. | | |
| | |
Hakuhodo DY Holdings, Inc. | | |
Hankyu Hanshin Holdings, Inc. | | |
| | |
| | |
| | |
| | |
Hitachi Construction Machinery Co. Ltd. | | |
| | |
Hokkaido Electric Power Co., Inc. | | |
| | |
| | |
| | |
| | |
Iida Group Holdings Co. Ltd. | | |
| | |
| | |
Isetan Mitsukoshi Holdings Ltd. | | |
| | |
| | |
Itoham Yonekyu Holdings, Inc. | | |
| | |
J Front Retailing Co. Ltd. | | |
Japan Exchange Group, Inc. | | |
Japan Post Holdings Co. Ltd. | | |
Japan Post Insurance Co. Ltd. | | |
| | |
| | |
| | |
| | |
| | |
| | |
| | |
| | |
Kansai Electric Power Co., Inc. | | |
| | |
Kawasaki Heavy Industries Ltd. | | |
Kawasaki Kisen Kaisha Ltd. | | |
| | |
| | |
| | |
| | |
| | |
Kintetsu Group Holdings Co. Ltd. | | |
| | |
| | |
Koito Manufacturing Co. Ltd. | | |
| | |
| | |
| | |
| | |
| | |
Kurita Water Industries Ltd. | | |
| | |
Kyushu Electric Power Co., Inc. * | | |
| | |
| | |
| | |
| | |
| | |
| | |
| | |
| | |
| | |
| | |
| | |
| | |
Mitsubishi Chemical Group Corp. | | |
| | |
Mitsubishi Electric Corp. | | |
Mitsubishi Estate Co. Ltd. | | |
Mitsubishi Gas Chemical Co., Inc. | | |
Mitsubishi Heavy Industries Ltd. | | |
Mitsubishi Materials Corp. | | |
| | |
52
Schwab Fundamental Index Funds | Annual Report
Schwab Fundamental International Large Company Index Fund
Portfolio Holdings as of October 31, 2023 (continued)
| | |
Mitsubishi Shokuhin Co. Ltd. | | |
Mitsubishi UFJ Financial Group, Inc. | | |
| | |
| | |
| | |
Mitsui Mining & Smelting Co. Ltd. | | |
| | |
Mizuho Financial Group, Inc. | | |
Morinaga Milk Industry Co. Ltd. | | |
MS&AD Insurance Group Holdings, Inc. | | |
Murata Manufacturing Co. Ltd. | | |
| | |
| | |
| | |
| | |
| | |
| | |
| | |
| | |
| | |
| | |
Nippon Electric Glass Co. Ltd. | | |
Nippon Light Metal Holdings Co. Ltd. | | |
Nippon Paper Industries Co. Ltd. * | | |
| | |
Nippon Telegraph & Telephone Corp. | | |
| | |
| | |
| | |
Nisshin Seifun Group, Inc. | | |
Nissin Foods Holdings Co. Ltd. | | |
| | |
| | |
| | |
| | |
| | |
| | |
Nomura Real Estate Holdings, Inc. | | |
Nomura Research Institute Ltd. | | |
| | |
| | |
| | |
| | |
| | |
| | |
Ono Pharmaceutical Co. Ltd. | | |
| | |
| | |
| | |
| | |
| | |
| | |
Pan Pacific International Holdings Corp. | | |
| | |
Penta-Ocean Construction Co. Ltd. | | |
| | |
Recruit Holdings Co. Ltd. | | |
Renesas Electronics Corp. * | | |
| | |
| | |
| | |
| | |
| | |
| | |
| | |
| | |
Santen Pharmaceutical Co. Ltd. | | |
| | |
| | |
| | |
| | |
| | |
| | |
Sekisui Chemical Co. Ltd. | | |
| | |
Seven & i Holdings Co. Ltd. | | |
| | |
| | |
Shikoku Electric Power Co., Inc. | | |
| | |
| | |
| | |
| | |
Shin-Etsu Chemical Co. Ltd. | | |
| | |
| | |
| | |
| | |
| | |
Sohgo Security Services Co. Ltd. | | |
| | |
| | |
| | |
Stanley Electric Co. Ltd. | | |
| | |
| | |
Sumitomo Chemical Co. Ltd. | | |
| | |
Sumitomo Electric Industries Ltd. | | |
Sumitomo Forestry Co. Ltd. | | |
Sumitomo Heavy Industries Ltd. | | |
Sumitomo Metal Mining Co. Ltd. | | |
Sumitomo Mitsui Financial Group, Inc. | | |
Sumitomo Mitsui Trust Holdings, Inc. | | |
Sumitomo Realty & Development Co. Ltd. | | |
Sumitomo Rubber Industries Ltd. | | |
| | |
Suntory Beverage & Food Ltd. | | |
| | |
| | |
| | |
| | |
| | |
| | |
| | |
| | |
Takeda Pharmaceutical Co. Ltd. | | |
| | |
| | |
| | |
| | |
| | |
| | |
| | |
Tohoku Electric Power Co., Inc. | | |
Tokio Marine Holdings, Inc. | | |
| | |
Tokyo Electric Power Co. Holdings, Inc. * | | |
| | |
| | |
| | |
Tokyu Fudosan Holdings Corp. | | |
| | |
| | |
| | |
| | |
Schwab Fundamental Index Funds | Annual Report53
Schwab Fundamental International Large Company Index Fund
Portfolio Holdings as of October 31, 2023 (continued)
| | |
| | |
Toyo Seikan Group Holdings Ltd. | | |
| | |
| | |
| | |
| | |
| | |
| | |
| | |
| | |
| | |
| | |
| | |
| | |
| | |
| | |
| | |
| | |
| | |
| | |
| | |
| | |
|
|
| | |
| | |
| | |
| | |
| | |
| | |
| | |
| | |
| | |
| | |
| | |
| | |
| | |
Koninklijke Ahold Delhaize NV | | |
| | |
| | |
| | |
| | |
| | |
| | |
| | |
| | |
| | |
|
|
| | |
| | |
| | |
|
|
| | |
| | |
| | |
| | |
| | |
| | |
| | |
| | |
| | |
| | |
|
| | |
|
| | |
| | |
PGE Polska Grupa Energetyczna SA * | | |
Powszechna Kasa Oszczednosci Bank Polski SA * | | |
Powszechny Zaklad Ubezpieczen SA | | |
| | |
|
|
EDP - Energias de Portugal SA | | |
| | |
| | |
| | |
|
|
| | |
BNK Financial Group, Inc. | | |
| | |
| | |
| | |
| | |
| | |
Doosan Enerbility Co. Ltd. * | | |
| | |
GS Engineering & Construction Corp. | | |
| | |
Hana Financial Group, Inc. | | |
Hankook Tire & Technology Co. Ltd. | | |
| | |
| | |
| | |
| | |
HD Korea Shipbuilding & Offshore Engineering Co. Ltd. * | | |
| | |
Hyundai Engineering & Construction Co. Ltd. | | |
| | |
Hyundai Marine & Fire Insurance Co. Ltd. | | |
| | |
| | |
| | |
| | |
| | |
| | |
Korea Electric Power Corp. * | | |
| | |
| | |
Korean Air Lines Co. Ltd. | | |
| | |
Kumho Petrochemical Co. Ltd. | | |
| | |
| | |
| | |
| | |
| | |
| | |
| | |
| | |
| | |
| | |
| | |
Posco International Corp. | | |
54
Schwab Fundamental Index Funds | Annual Report
Schwab Fundamental International Large Company Index Fund
Portfolio Holdings as of October 31, 2023 (continued)
| | |
| | |
Samsung Electro-Mechanics Co. Ltd. | | |
Samsung Electronics Co. Ltd. | | |
Samsung Fire & Marine Insurance Co. Ltd. | | |
Samsung Life Insurance Co. Ltd. | | |
| | |
| | |
Shinhan Financial Group Co. Ltd. | | |
| | |
| | |
| | |
| | |
Woori Financial Group, Inc. | | |
| | |
|
|
| | |
| | |
Jardine Cycle & Carriage Ltd. | | |
| | |
| | |
Oversea-Chinese Banking Corp. Ltd. | | |
| | |
Singapore Telecommunications Ltd. | | |
United Overseas Bank Ltd. | | |
| | |
Wilmar International Ltd. | | |
| | |
|
|
| | |
| | |
ACS Actividades de Construccion y Servicios SA | | |
| | |
| | |
Banco Bilbao Vizcaya Argentaria SA | | |
| | |
| | |
| | |
| | |
| | |
| | |
| | |
| | |
Industria de Diseno Textil SA | | |
| | |
| | |
| | |
| | |
| | |
| | |
|
|
| | |
| | |
| | |
| | |
| | |
Electrolux AB, B Shares * | | |
| | |
| | |
| | |
| | |
H & M Hennes & Mauritz AB, B Shares (b) | | |
| | |
| | |
Industrivarden AB, A Shares | | |
Industrivarden AB, C Shares | | |
| | |
| | |
| | |
| | |
Skandinaviska Enskilda Banken AB, A Shares | | |
| | |
| | |
| | |
| | |
Svenska Cellulosa AB SCA, B Shares | | |
Svenska Handelsbanken AB, A Shares | | |
| | |
| | |
Telefonaktiebolaget LM Ericsson, B Shares | | |
| | |
| | |
| | |
| | |
| | |
| | |
|
|
| | |
| | |
| | |
| | |
| | |
Chocoladefabriken Lindt & Spruengli AG | | |
Chocoladefabriken Lindt & Spruengli AG, Participation Certificates | | |
Cie Financiere Richemont SA, Class A | | |
| | |
| | |
| | |
| | |
| | |
| | |
| | |
| | |
Kuehne & Nagel International AG | | |
Logitech International SA | | |
| | |
| | |
| | |
Partners Group Holding AG | | |
| | |
Roche Holding AG, Bearer Shares | | |
| | |
| | |
Schindler Holding AG, Participation Certificates | | |
| | |
| | |
| | |
| | |
Swatch Group AG, Bearer Shares | | |
| | |
| | |
Schwab Fundamental Index Funds | Annual Report55
Schwab Fundamental International Large Company Index Fund
Portfolio Holdings as of October 31, 2023 (continued)
| | |
| | |
| | |
| | |
Zurich Insurance Group AG | | |
| | |
|
|
| | |
| | |
| | |
| | |
| | |
| | |
Associated British Foods PLC | | |
| | |
| | |
B&M European Value Retail SA | | |
| | |
| | |
| | |
| | |
| | |
Berkeley Group Holdings PLC | | |
| | |
British American Tobacco PLC | | |
| | |
| | |
| | |
| | |
| | |
| | |
| | |
| | |
| | |
| | |
| | |
Direct Line Insurance Group PLC * | | |
| | |
| | |
| | |
| | |
| | |
| | |
Flutter Entertainment PLC * | | |
| | |
| | |
| | |
| | |
| | |
| | |
| | |
| | |
| | |
International Distributions Services PLC * | | |
| | |
| | |
| | |
| | |
| | |
| | |
Land Securities Group PLC | | |
Legal & General Group PLC | | |
| | |
London Stock Exchange Group PLC | | |
| | |
| | |
Marks & Spencer Group PLC * | | |
| | |
| | |
| | |
| | |
| | |
| | |
| | |
| | |
Phoenix Group Holdings PLC | | |
| | |
Reckitt Benckiser Group PLC | | |
| | |
| | |
| | |
| | |
| | |
| | |
| | |
| | |
| | |
| | |
| | |
| | |
| | |
| | |
| | |
| | |
| | |
| | |
United Utilities Group PLC | | |
| | |
| | |
| | |
| | |
Total Common Stocks
(Cost $1,815,154,057) | |
|
PREFERRED STOCKS 1.0% OF NET ASSETS |
|
|
Bayerische Motoren Werke AG | | |
| | |
| | |
| | |
| | |
|
|
| | |
|
|
| | |
| | |
| | |
| | |
Samsung Electronics Co. Ltd. | | |
| | |
|
|
| | |
Total Preferred Stocks
(Cost $24,369,456) | |
|
56
Schwab Fundamental Index Funds | Annual Report
Schwab Fundamental International Large Company Index Fund
Portfolio Holdings as of October 31, 2023 (continued)
| | |
WARRANTS 0.0% OF NET ASSETS |
|
|
Constellation Software, Inc. |
| | |
| |
| | |
SHORT-TERM INVESTMENTS 0.2% OF NET ASSETS |
|
|
State Street Institutional U.S. Government Money Market Fund, Premier Class 5.30% (c)(d) | | |
Total Short-Term Investments
(Cost $3,526,177) | |
Total Investments in Securities
(Cost $1,843,049,690) | |
| | | CURRENT VALUE/
UNREALIZED
DEPRECIATION
($) |
|
| | | |
MSCI EAFE Index, expires 12/15/23 | | | |
| Non-income producing security. |
| Fair valued using significant unobservable inputs (see financial note 2(a), Securities for which no quoted value is available, for additional information). |
| All or a portion of this security is on loan. Securities on loan were valued at $3,447,289. |
| The rate shown is the annualized 7-day yield. |
| Security purchased with cash collateral received for securities on loan. |
| Global Depositary Receipt |
| Real Estate Investment Trust |
The following is a summary of the inputs used to value the fund’s investments as of October 31, 2023 (see financial note 2(a) for additional information):
| QUOTED PRICES IN
ACTIVE MARKETS FOR
IDENTICAL ASSETS
(LEVEL 1) | OTHER SIGNIFICANT
OBSERVABLE INPUTS
(LEVEL 2) | SIGNIFICANT
UNOBSERVABLE INPUTS
(LEVEL 3) | |
| | | | |
| | | | |
| | | | |
| | | | |
| | | | |
| | | | |
| | | | |
| | | | |
| | | | |
| | | | |
| | | | |
| | | | |
| | | | |
| | | | |
| | | | |
| | | | |
| | | | |
| As categorized in the Portfolio Holdings. |
| Futures contracts are reported at cumulative unrealized appreciation or depreciation. |
Schwab Fundamental Index Funds | Annual Report57
Schwab Fundamental International Large Company Index Fund
Statement of Assets and Liabilities
As of October 31, 2023
|
Investments in securities, at value - unaffiliated (cost $1,843,049,690) including securities on loan of $3,447,289 | | |
| | |
Foreign currency, at value (cost $1,355,553) | | |
Deposit with broker for futures contracts | | |
| | |
| | |
| | |
| | |
Variation margin on future contracts | | |
Income from securities on loan | | |
| | |
|
|
Collateral held for securities on loan | | |
| | |
| | |
| | |
| | |
| | |
| | |
|
|
Capital received from investors | | |
Total distributable earnings | | |
| | |
58
Schwab Fundamental Index Funds | Annual Report
Schwab Fundamental International Large Company Index Fund
Statement of Operations
For the period November 1, 2022 through October 31, 2023 |
|
Dividends received from securities - unaffiliated (net of foreign withholding tax of $9,132,161) | | |
Interest received from securities - unaffiliated | | |
| | |
| | |
|
|
| | |
| | |
| | |
| | |
| | |
| | |
| | |
|
REALIZED AND UNREALIZED GAINS (LOSSES) |
Net realized losses on sales of securities - unaffiliated | | |
Net realized gains on futures contracts | | |
Net realized losses on foreign currency transactions | | |
| | |
Net change in unrealized appreciation (depreciation) on securities - unaffiliated | | |
Net change in unrealized appreciation (depreciation) on futures contracts | | |
Net change in unrealized appreciation (depreciation) on foreign currency translations | | |
Net change in unrealized appreciation (depreciation) | | |
Net realized and unrealized gains | | |
Increase in net assets resulting from operations | | |
| Professional fees associated with the filing of foreign withholding tax claims in the European Union are deemed to be non-contingent and non-routine expenses of the fund (see financial notes 2(d) and 4 for additional information). |
| Proxy fees are non-routine expenses (see financial note 2(e) for additional information). |
Schwab Fundamental Index Funds | Annual Report59
Schwab Fundamental International Large Company Index Fund
Statement of Changes in Net Assets
For the current and prior report periods
|
| | |
| | | |
| | | |
Net change in unrealized appreciation (depreciation) | | | |
Increase (decrease) in net assets resulting from operations | | | |
|
DISTRIBUTIONS TO SHAREHOLDERS |
| | | |
TRANSACTIONS IN FUND SHARES |
| | |
| | | | | |
| | | | | |
| | | | | |
| | | | | |
Net transactions in fund shares | | | | | |
|
SHARES OUTSTANDING AND NET ASSETS |
| | |
| | | | | |
| | | | | |
| | | | | |
| | | | | |
60
Schwab Fundamental Index Funds | Annual Report
Schwab Fundamental International Small Company Index Fund
Financial Statements
| | | | | | |
|
Net asset value at beginning of period | | | | | | |
Income (loss) from investment operations: | | | | | | |
Net investment income (loss)1 | | | | | | |
Net realized and unrealized gains (losses) | | | | | | |
Total from investment operations | | | | | | |
| | | | | | |
Distributions from net investment income | | | | | | |
Distributions from net realized gains | | | | | | |
| | | | | | |
Net asset value at end of period | | | | | | |
| | | | | | |
|
Ratios to average net assets: | | | | | | |
| | | | | | |
Net investment income (loss) | | | | | | |
| | | | | | |
Net assets, end of period (x 1,000) | | | | | | |
| Calculated based on the average shares outstanding during the period. |
| Ratio includes less than 0.005% of non-routine proxy expenses. |
Schwab Fundamental Index Funds | Annual Report61
Schwab Fundamental International Small Company Index Fund
Portfolio Holdings as of October 31, 2023
This section shows all the securities in the fund’s portfolio and their values as of the report date.
The fund files its complete schedule of portfolio holdings with the U.S. Securities and Exchange Commission (SEC) for the first and third quarters of each fiscal year on Form N-PORT Part F. The fund’s Form N-PORT Part F is available on the SEC’s website at www.sec.gov. You can also obtain this information at no cost on the fund’s website at www.schwabassetmanagement.com/schwabfunds_prospectus, by calling 1-866-414-6349, or by sending an email request to orders@mysummaryprospectus.com. The fund also makes available its complete schedule of portfolio holdings 15 to 20 days after the end of the month on the fund’s website.
| | |
COMMON STOCKS 99.1% OF NET ASSETS |
|
|
| | |
| | |
| | |
| | |
| | |
| | |
| | |
| | |
| | |
| | |
| | |
Bendigo & Adelaide Bank Ltd. | | |
| | |
| | |
| | |
| | |
| | |
| | |
| | |
Cleanaway Waste Management Ltd. | | |
| | |
| | |
Coronado Global Resources, Inc. | | |
Costa Group Holdings Ltd. | | |
| | |
| | |
| | |
| | |
Domino's Pizza Enterprises Ltd. | | |
| | |
| | |
| | |
| | |
FleetPartners Group Ltd. * | | |
Flight Centre Travel Group Ltd. | | |
| | |
| | |
| | |
| | |
Harvey Norman Holdings Ltd. | | |
| | |
| | |
| | |
| | |
| | |
| | |
| | |
| | |
Link Administration Holdings Ltd. | | |
| | |
| | |
Magellan Financial Group Ltd. | | |
McMillan Shakespeare Ltd. | | |
| | |
| | |
| | |
| | |
Nine Entertainment Co. Holdings Ltd. | | |
Northern Star Resources Ltd. | | |
| | |
| | |
| | |
| | |
| | |
| | |
| | |
Platinum Asset Management Ltd. | | |
| | |
| | |
| | |
| | |
| | |
| | |
| | |
| | |
Reliance Worldwide Corp. Ltd. | | |
Sandfire Resources Ltd. * | | |
| | |
| | |
Seven Group Holdings Ltd. | | |
| | |
Silver Lake Resources Ltd. * | | |
Southern Cross Media Group Ltd. | | |
| | |
Star Entertainment Group Ltd. * | | |
| | |
| | |
| | |
| | |
| | |
Virgin Australia Holdings Pty. Ltd. *(a) | | |
| | |
Washington H Soul Pattinson & Co. Ltd. | | |
| | |
Westgold Resources Ltd. * | | |
| | |
| | |
| | |
|
|
| | |
AT&S Austria Technologie & Systemtechnik AG | | |
| | |
| | |
| | |
| | |
| | |
| | |
| | |
| | |
62
Schwab Fundamental Index Funds | Annual Report
Schwab Fundamental International Small Company Index Fund
Portfolio Holdings as of October 31, 2023 (continued)
| | |
Vienna Insurance Group AG Wiener Versicherung Gruppe | | |
| | |
|
|
Ackermans & van Haaren NV | | |
| | |
| | |
| | |
| | |
| | |
| | |
| | |
| | |
| | |
| | |
| | |
| | |
| | |
| | |
| | |
| | |
| | |
| | |
|
|
| | |
| | |
| | |
Ag Growth International, Inc. | | |
| | |
Alamos Gold, Inc., Class A | | |
| | |
Allied Properties Real Estate Investment Trust | | |
| | |
| | |
Artis Real Estate Investment Trust | | |
| | |
| | |
Badger Infrastructure Solution | | |
| | |
| | |
| | |
Boardwalk Real Estate Investment Trust | | |
Bombardier, Inc., Class B * | | |
| | |
Boyd Group Services, Inc. | | |
Brookfield Business Corp., Class A | | |
Brookfield Infrastructure Corp., Class A | | |
Brookfield Reinsurance Ltd. * | | |
Brookfield Renewable Corp., Class A | | |
| | |
| | |
| | |
Canaccord Genuity Group, Inc. | | |
Canada Goose Holdings, Inc. * | | |
Canadian Apartment Properties REIT | | |
| | |
| | |
| | |
| | |
| | |
| | |
CES Energy Solutions Corp. | | |
Chartwell Retirement Residences | | |
| | |
Chemtrade Logistics Income Fund | | |
Choice Properties Real Estate Investment Trust | | |
| | |
| | |
Cogeco Communications, Inc. | | |
| | |
Colliers International Group, Inc. | | |
Crombie Real Estate Investment Trust | | |
| | |
Descartes Systems Group, Inc. * | | |
Doman Building Materials Group Ltd. | | |
Dorel Industries, Inc., Class B * | | |
Dream Industrial Real Estate Investment Trust | | |
Dream Office Real Estate Investment Trust | | |
Dundee Precious Metals, Inc. | | |
| | |
| | |
Element Fleet Management Corp. | | |
| | |
| | |
| | |
Ensign Energy Services, Inc. * | | |
| | |
| | |
| | |
| | |
| | |
Fiera Capital Corp., Class A | | |
First Capital Real Estate Investment Trust | | |
| | |
Fortuna Silver Mines, Inc. * | | |
| | |
| | |
| | |
| | |
Granite Real Estate Investment Trust | | |
H&R Real Estate Investment Trust | | |
| | |
| | |
| | |
Innergex Renewable Energy, Inc. | | |
| | |
International Petroleum Corp. * | | |
| | |
Killam Apartment Real Estate Investment Trust | | |
Laurentian Bank of Canada | | |
| | |
Martinrea International, Inc. | | |
| | |
| | |
| | |
| | |
NorthWest Healthcare Properties Real Estate Investment Trust | | |
| | |
| | |
| | |
Pan American Silver Corp. | | |
Paramount Resources Ltd., Class A | | |
| | |
| | |
Peyto Exploration & Development Corp. | | |
| | |
Precision Drilling Corp. * | | |
Premium Brands Holdings Corp., Class A | | |
Schwab Fundamental Index Funds | Annual Report63
Schwab Fundamental International Small Company Index Fund
Portfolio Holdings as of October 31, 2023 (continued)
| | |
Primaris Real Estate Investment Trust | | |
| | |
| | |
| | |
| | |
| | |
| | |
| | |
Secure Energy Services, Inc. | | |
| | |
| | |
Sienna Senior Living, Inc. | | |
Sleep Country Canada Holdings, Inc. | | |
SmartCentres Real Estate Investment Trust | | |
| | |
| | |
| | |
| | |
| | |
| | |
Torex Gold Resources, Inc. * | | |
| | |
| | |
Transcontinental, Inc., Class A | | |
| | |
| | |
| | |
| | |
Western Forest Products, Inc. | | |
Westshore Terminals Investment Corp. | | |
| | |
| | |
| | |
|
|
| | |
| | |
| | |
| | |
| | |
| | |
| | |
| | |
| | |
| | |
| | |
| | |
| | |
Ringkjoebing Landbobank AS | | |
| | |
| | |
Scandinavian Tobacco Group AS, A Shares | | |
| | |
| | |
| | |
| | |
| | |
| | |
| | |
|
|
| | |
| | |
| | |
| | |
| | |
| | |
| | |
| | |
Metsa Board OYJ, B Shares | | |
| | |
| | |
| | |
| | |
| | |
| | |
| | |
| | |
|
|
| | |
| | |
| | |
| | |
| | |
| | |
| | |
| | |
| | |
| | |
| | |
| | |
| | |
| | |
| | |
| | |
| | |
| | |
| | |
Gaztransport Et Technigaz SA | | |
| | |
| | |
| | |
| | |
| | |
| | |
| | |
La Francaise des Jeux SAEM | | |
| | |
| | |
| | |
| | |
| | |
| | |
| | |
| | |
| | |
| | |
| | |
| | |
| | |
| | |
Television Francaise 1 SA | | |
| | |
Ubisoft Entertainment SA * | | |
| | |
| | |
| | |
| | |
| | |
| | |
|
64
Schwab Fundamental Index Funds | Annual Report
Schwab Fundamental International Small Company Index Fund
Portfolio Holdings as of October 31, 2023 (continued)
| | |
|
| | |
| | |
| | |
| | |
| | |
| | |
| | |
| | |
| | |
| | |
| | |
Carl Zeiss Meditec AG, Bearer Shares | | |
| | |
CompuGroup Medical SE & Co. KgaA | | |
CTS Eventim AG & Co. KGaA | | |
| | |
Deutsche Pfandbriefbank AG | | |
| | |
| | |
| | |
DWS Group GmbH & Co. KGaA | | |
| | |
| | |
| | |
| | |
Fraport AG Frankfurt Airport Services Worldwide * | | |
| | |
Grand City Properties SA * | | |
| | |
Hamburger Hafen und Logistik AG | | |
Heidelberger Druckmaschinen AG * | | |
| | |
| | |
| | |
| | |
Hornbach Holding AG & Co. KGaA | | |
| | |
| | |
| | |
| | |
| | |
| | |
| | |
| | |
| | |
| | |
| | |
| | |
| | |
| | |
| | |
| | |
| | |
| | |
| | |
| | |
| | |
| | |
| | |
| | |
| | |
Vitesco Technologies Group AG, Class A * | | |
| | |
| | |
| | |
| | |
|
|
AAC Technologies Holdings, Inc. | | |
| | |
| | |
| | |
Brightoil Petroleum Holdings Ltd. *(a) | | |
Budweiser Brewing Co. APAC Ltd. | | |
Cathay Pacific Airways Ltd. *(b) | | |
Chow Tai Fook Jewellery Group Ltd. | | |
CITIC Telecom International Holdings Ltd. | | |
CK Infrastructure Holdings Ltd. | | |
Cowell e Holdings, Inc. * | | |
DFI Retail Group Holdings Ltd. | | |
| | |
Fortune Real Estate Investment Trust | | |
Hang Lung Properties Ltd. | | |
| | |
Huabao International Holdings Ltd. | | |
Hysan Development Co. Ltd. | | |
| | |
Jinchuan Group International Resources Co. Ltd. | | |
JS Global Lifestyle Co. Ltd. | | |
Kerry Logistics Network Ltd. | | |
| | |
L'Occitane International SA | | |
Luk Fook Holdings International Ltd. | | |
| | |
Melco International Development Ltd. * | | |
| | |
Nexteer Automotive Group Ltd. | | |
| | |
Pacific Basin Shipping Ltd. | | |
| | |
Power Assets Holdings Ltd. | | |
Powerlong Real Estate Holdings Ltd. *(b) | | |
| | |
Samsonite International SA * | | |
Singamas Container Holdings Ltd. | | |
SITC International Holdings Co. Ltd. | | |
| | |
| | |
Texhong International Group Ltd. * | | |
Truly International Holdings Ltd. | | |
| | |
United Laboratories International Holdings Ltd. | | |
Value Partners Group Ltd. | | |
Vitasoy International Holdings Ltd. | | |
| | |
| | |
| | |
| | |
| | |
|
|
| | |
| | |
| | |
| | |
Irish Continental Group PLC | | |
| | |
|
Schwab Fundamental Index Funds | Annual Report65
Schwab Fundamental International Small Company Index Fund
Portfolio Holdings as of October 31, 2023 (continued)
| | |
|
Alony Hetz Properties & Investments Ltd. | | |
| | |
| | |
| | |
Bezeq The Israeli Telecommunication Corp. Ltd. | | |
| | |
Clal Insurance Enterprises Holdings Ltd. * | | |
Delek Automotive Systems Ltd. | | |
| | |
| | |
| | |
| | |
First International Bank Of Israel Ltd. | | |
Formula Systems 1985 Ltd. | | |
| | |
Harel Insurance Investments & Financial Services Ltd. | | |
| | |
| | |
Mivne Real Estate KD Ltd. | | |
Mizrahi Tefahot Bank Ltd. | | |
Neto Malinda Trading Ltd. * | | |
| | |
| | |
Partner Communications Co. Ltd. * | | |
| | |
| | |
Rami Levy Chain Stores Hashikma Marketing 2006 Ltd. | | |
| | |
| | |
| | |
Tower Semiconductor Ltd. * | | |
| | |
|
|
| | |
Alitalia - Linee Aeree Italiane SpA *(a) | | |
| | |
| | |
| | |
| | |
| | |
| | |
Banca Monte dei Paschi di Siena SpA * | | |
Banca Popolare di Sondrio SPA | | |
| | |
| | |
| | |
| | |
| | |
| | |
Danieli & C Officine Meccaniche SpA | | |
| | |
| | |
| | |
| | |
| | |
| | |
| | |
| | |
FinecoBank Banca Fineco SpA | | |
Infrastrutture Wireless Italiane SpA | | |
| | |
| | |
| | |
| | |
| | |
| | |
MFE-MediaForEurope NV, Class A | | |
MFE-MediaForEurope NV, Class B | | |
| | |
| | |
| | |
| | |
Recordati Industria Chimica e Farmaceutica SpA | | |
| | |
| | |
| | |
| | |
| | |
| | |
UnipolSai Assicurazioni SpA | | |
| | |
| | |
|
|
| | |
| | |
| | |
| | |
| | |
| | |
Advance Residence Investment Corp. | | |
| | |
AEON Financial Service Co. Ltd. | | |
| | |
| | |
AEON REIT Investment Corp. | | |
| | |
| | |
| | |
| | |
| | |
| | |
| | |
| | |
| | |
| | |
| | |
| | |
| | |
| | |
| | |
| | |
| | |
| | |
| | |
| | |
Asahi Diamond Industrial Co. Ltd. | | |
| | |
| | |
| | |
| | |
| | |
| | |
| | |
| | |
BayCurrent Consulting, Inc. | | |
| | |
Bell System24 Holdings, Inc. * | | |
66
Schwab Fundamental Index Funds | Annual Report
Schwab Fundamental International Small Company Index Fund
Portfolio Holdings as of October 31, 2023 (continued)
| | |
| | |
| | |
| | |
| | |
| | |
| | |
| | |
| | |
| | |
Canon Marketing Japan, Inc. | | |
| | |
| | |
| | |
| | |
| | |
| | |
Chugoku Marine Paints Ltd. | | |
| | |
| | |
| | |
| | |
Comforia Residential REIT, Inc. | | |
Cosmos Pharmaceutical Corp. | | |
Create SD Holdings Co. Ltd. | | |
| | |
| | |
| | |
| | |
| | |
| | |
Daiki Aluminium Industry Co. Ltd. | | |
Daikokutenbussan Co. Ltd. | | |
| | |
| | |
Daishi Hokuetsu Financial Group, Inc. | | |
Daito Pharmaceutical Co. Ltd. | | |
Daiwa House REIT Investment Corp. | | |
Daiwa Office Investment Corp. | | |
Daiwa Securities Living Investments Corp. | | |
| | |
| | |
| | |
| | |
| | |
| | |
| | |
Doutor Nichires Holdings Co. Ltd. | | |
| | |
| | |
DyDo Group Holdings, Inc. | | |
| | |
| | |
| | |
| | |
| | |
| | |
| | |
| | |
| | |
| | |
| | |
| | |
| | |
| | |
Frontier Real Estate Investment Corp. | | |
| | |
| | |
Fuji Media Holdings, Inc. | | |
| | |
| | |
| | |
Fuji Seal International, Inc. | | |
| | |
| | |
| | |
| | |
| | |
| | |
Fukuoka Financial Group, Inc. | | |
| | |
Fukuyama Transporting Co. Ltd. | | |
| | |
Fuyo General Lease Co. Ltd. | | |
| | |
| | |
| | |
| | |
| | |
| | |
| | |
| | |
| | |
| | |
GungHo Online Entertainment, Inc. | | |
| | |
| | |
H.U. Group Holdings, Inc. | | |
| | |
| | |
| | |
| | |
| | |
Harmonic Drive Systems, Inc. | | |
| | |
| | |
Heiwa Real Estate Co. Ltd. | | |
| | |
| | |
| | |
| | |
| | |
Hisamitsu Pharmaceutical Co., Inc. | | |
| | |
| | |
| | |
Hokuhoku Financial Group, Inc. | | |
Hokuriku Electric Power Co. * | | |
| | |
| | |
| | |
| | |
| | |
| | |
| | |
| | |
| | |
| | |
| | |
| | |
| | |
| | |
Inaba Denki Sangyo Co. Ltd. | | |
| | |
Industrial & Infrastructure Fund Investment Corp. | | |
| | |
Schwab Fundamental Index Funds | Annual Report67
Schwab Fundamental International Small Company Index Fund
Portfolio Holdings as of October 31, 2023 (continued)
| | |
Integrated Design & Engineering Holdings Co. Ltd. | | |
Internet Initiative Japan, Inc. | | |
Invincible Investment Corp. | | |
Iriso Electronics Co. Ltd. | | |
Ishihara Sangyo Kaisha Ltd. | | |
| | |
| | |
Itochu Techno-Solutions Corp. | | |
| | |
| | |
| | |
| | |
Japan Airport Terminal Co. Ltd. | | |
Japan Aviation Electronics Industry Ltd. | | |
| | |
Japan Hotel REIT Investment Corp. | | |
| | |
Japan Logistics Fund, Inc. | | |
Japan Metropolitan Fund Invest | | |
Japan Petroleum Exploration Co. Ltd. | | |
| | |
Japan Prime Realty Investment Corp. | | |
Japan Real Estate Investment Corp. | | |
| | |
Japan Wool Textile Co. Ltd. | | |
| | |
| | |
| | |
| | |
| | |
| | |
Kaga Electronics Co. Ltd. | | |
| | |
| | |
Kaken Pharmaceutical Co. Ltd. | | |
| | |
| | |
| | |
| | |
| | |
Kanto Denka Kogyo Co. Ltd. | | |
| | |
| | |
| | |
| | |
| | |
Keisei Electric Railway Co. Ltd. | | |
| | |
Kenedix Office Investment Corp. | | |
Kenedix Residential Next Investment Corp. *(a) | | |
Kenedix Retail REIT Corp. *(a) | | |
| | |
| | |
Kissei Pharmaceutical Co. Ltd. | | |
| | |
| | |
| | |
Kobayashi Pharmaceutical Co. Ltd. | | |
| | |
Koei Tecmo Holdings Co. Ltd. | | |
| | |
| | |
| | |
| | |
| | |
Konoike Transport Co. Ltd. | | |
| | |
| | |
KPP Group Holdings Co. Ltd. | | |
| | |
Kumiai Chemical Industry Co. Ltd. | | |
| | |
| | |
Kusuri No. Aoki Holdings Co. Ltd. | | |
| | |
| | |
Kyokuto Kaihatsu Kogyo Co. Ltd. | | |
Kyorin Pharmaceutical Co. Ltd. | | |
Kyoritsu Maintenance Co. Ltd. | | |
Kyoto Financial Group, Inc. | | |
| | |
| | |
Kyushu Financial Group, Inc. | | |
| | |
| | |
| | |
| | |
| | |
| | |
| | |
| | |
Makino Milling Machine Co. Ltd. | | |
| | |
| | |
| | |
| | |
| | |
| | |
| | |
| | |
| | |
| | |
McDonald's Holdings Co. Japan Ltd. | | |
| | |
Mebuki Financial Group, Inc. | | |
| | |
Megmilk Snow Brand Co. Ltd. | | |
| | |
Meiko Electronics Co. Ltd. | | |
MEITEC Group Holdings, Inc. | | |
| | |
| | |
Mimasu Semiconductor Industry Co. Ltd. | | |
| | |
| | |
Mitsubishi HC Capital, Inc. | | |
Mitsubishi Logisnext Co. Ltd. | | |
Mitsubishi Logistics Corp. | | |
Mitsubishi Pencil Co. Ltd. | | |
| | |
| | |
| | |
Mitsui Matsushima Holdings Co. Ltd. | | |
Mitsui-Soko Holdings Co. Ltd. | | |
| | |
| | |
| | |
| | |
Mochida Pharmaceutical Co. Ltd. | | |
| | |
| | |
| | |
Mori Hills REIT Investment Corp. | | |
| | |
| | |
68
Schwab Fundamental Index Funds | Annual Report
Schwab Fundamental International Small Company Index Fund
Portfolio Holdings as of October 31, 2023 (continued)
| | |
Musashi Seimitsu Industry Co. Ltd. | | |
| | |
| | |
| | |
| | |
Nankai Electric Railway Co. Ltd. | | |
| | |
NEC Networks & System Integration Corp. | | |
| | |
| | |
| | |
| | |
| | |
| | |
| | |
| | |
| | |
Nihon M&A Center Holdings, Inc. | | |
Nihon Parkerizing Co. Ltd. | | |
| | |
| | |
| | |
Nippon Accommodations Fund, Inc. | | |
Nippon Building Fund, Inc. | | |
| | |
| | |
Nippon Coke & Engineering Co. Ltd. * | | |
| | |
Nippon Densetsu Kogyo Co. Ltd. | | |
| | |
Nippon Kanzai Holdings Co. Ltd. | | |
| | |
Nippon Paint Holdings Co. Ltd. | | |
Nippon Prologis REIT, Inc. * | | |
NIPPON REIT Investment Corp. | | |
| | |
Nippon Sanso Holdings Corp. | | |
Nippon Sheet Glass Co. Ltd. * | | |
| | |
| | |
| | |
| | |
Nippon Yakin Kogyo Co. Ltd. | | |
| | |
Nishimatsu Construction Co. Ltd. | | |
Nishimatsuya Chain Co. Ltd. | | |
Nishi-Nippon Financial Holdings, Inc. | | |
Nishi-Nippon Railroad Co. Ltd. | | |
| | |
| | |
Nisshin Oillio Group Ltd. | | |
| | |
| | |
| | |
| | |
| | |
| | |
| | |
| | |
| | |
| | |
Nomura Real Estate Master Fund, Inc. * | | |
| | |
| | |
| | |
| | |
NS United Kaiun Kaisha Ltd. | | |
| | |
| | |
| | |
NTT UD REIT Investment Corp. | | |
| | |
Odakyu Electric Railway Co. Ltd. | | |
| | |
| | |
| | |
Okasan Securities Group, Inc. | | |
Oki Electric Industry Co. Ltd. | | |
Okinawa Cellular Telephone Co. | | |
Okinawa Electric Power Co., Inc. | | |
| | |
| | |
| | |
| | |
Open House Group Co. Ltd. | | |
| | |
| | |
| | |
| | |
| | |
| | |
| | |
| | |
Pacific Industrial Co. Ltd. | | |
| | |
Paramount Bed Holdings Co. Ltd. | | |
| | |
| | |
| | |
| | |
| | |
| | |
Pola Orbis Holdings, Inc. | | |
| | |
| | |
| | |
| | |
| | |
| | |
| | |
| | |
| | |
Rohto Pharmaceutical Co. Ltd. | | |
| | |
| | |
| | |
| | |
| | |
Saibu Gas Holdings Co. Ltd. | | |
| | |
Sakai Chemical Industry Co. Ltd. | | |
Sakai Moving Service Co. Ltd. | | |
| | |
| | |
| | |
| | |
| | |
| | |
Sanki Engineering Co. Ltd. | | |
| | |
Sanoh Industrial Co. Ltd. | | |
Sanyo Chemical Industries Ltd. | | |
| | |
Sanyo Special Steel Co. Ltd. | | |
| | |
| | |
| | |
Schwab Fundamental Index Funds | Annual Report69
Schwab Fundamental International Small Company Index Fund
Portfolio Holdings as of October 31, 2023 (continued)
| | |
| | |
| | |
| | |
Sega Sammy Holdings, Inc. | | |
| | |
| | |
| | |
| | |
| | |
Senko Group Holdings Co. Ltd. | | |
Senshu Ikeda Holdings, Inc. | | |
| | |
| | |
Shibaura Machine Co. Ltd. | | |
| | |
Shindengen Electric Manufacturing Co. Ltd. | | |
Shin-Etsu Polymer Co. Ltd. | | |
Shinko Electric Industries Co. Ltd. | | |
Shinmaywa Industries Ltd. | | |
Ship Healthcare Holdings, Inc. | | |
| | |
SHO-BOND Holdings Co. Ltd. | | |
| | |
| | |
Sinfonia Technology Co. Ltd. | | |
SKY Perfect JSAT Holdings, Inc. | | |
Skylark Holdings Co. Ltd. * | | |
| | |
| | |
Square Enix Holdings Co. Ltd. | | |
| | |
| | |
| | |
| | |
Sumitomo Bakelite Co. Ltd. | | |
Sumitomo Mitsui Construction Co. Ltd. | | |
Sumitomo Osaka Cement Co. Ltd. | | |
| | |
Sumitomo Seika Chemicals Co. Ltd. | | |
Sumitomo Warehouse Co. Ltd. | | |
Sun Frontier Fudousan Co. Ltd. | | |
| | |
| | |
| | |
| | |
| | |
| | |
Taisho Pharmaceutical Holdings Co. Ltd. | | |
| | |
Takamatsu Construction Group Co. Ltd. | | |
| | |
| | |
| | |
Takasago Thermal Engineering Co. Ltd. | | |
Takeuchi Manufacturing Co. Ltd. | | |
| | |
| | |
| | |
| | |
| | |
| | |
| | |
| | |
| | |
| | |
| | |
| | |
| | |
| | |
| | |
| | |
| | |
| | |
| | |
| | |
Tokai Tokyo Financial Holdings, Inc. | | |
| | |
Tokushu Tokai Paper Co. Ltd. | | |
| | |
Tokyo Ohka Kogyo Co. Ltd. | | |
| | |
Tokyo Steel Manufacturing Co. Ltd. | | |
| | |
Tokyu Construction Co. Ltd. | | |
| | |
| | |
| | |
| | |
| | |
| | |
| | |
Towa Pharmaceutical Co. Ltd. | | |
Toyo Construction Co. Ltd. | | |
Toyo Ink SC Holdings Co. Ltd. | | |
| | |
| | |
| | |
| | |
| | |
| | |
| | |
| | |
| | |
Tsubaki Nakashima Co. Ltd. | | |
| | |
| | |
| | |
| | |
| | |
| | |
| | |
| | |
| | |
United Super Markets Holdings, Inc. | | |
United Urban Investment Corp. | | |
| | |
| | |
| | |
| | |
| | |
| | |
| | |
| | |
| | |
Warabeya Nichiyo Holdings Co. Ltd. | | |
| | |
| | |
| | |
| | |
Yachiyo Industry Co. Ltd. | | |
| | |
Yamaguchi Financial Group, Inc. | | |
| | |
| | |
| | |
| | |
70
Schwab Fundamental Index Funds | Annual Report
Schwab Fundamental International Small Company Index Fund
Portfolio Holdings as of October 31, 2023 (continued)
| | |
Yodogawa Steel Works Ltd. | | |
Yokogawa Bridge Holdings Corp. | | |
| | |
| | |
Yoshinoya Holdings Co. Ltd. | | |
| | |
| | |
| | |
| | |
ZERIA Pharmaceutical Co. Ltd. | | |
| | |
| | |
| | |
|
|
Espirito Santo Financial Group SA *(a) | | |
|
|
| | |
| | |
AMG Critical Materials NV | | |
| | |
| | |
| | |
BE Semiconductor Industries NV | | |
| | |
Eurocommercial Properties NV | | |
| | |
| | |
| | |
| | |
Just Eat Takeaway.com NV * | | |
| | |
| | |
| | |
| | |
| | |
| | |
| | |
| | |
| | |
| | |
|
|
| | |
Auckland International Airport Ltd. | | |
| | |
| | |
| | |
Fisher & Paykel Healthcare Corp. Ltd. | | |
| | |
| | |
| | |
| | |
| | |
| | |
| | |
|
|
| | |
| | |
| | |
| | |
| | |
| | |
| | |
| | |
| | |
| | |
| | |
| | |
| | |
Gjensidige Forsikring ASA | | |
| | |
Kongsberg Automotive ASA * | | |
| | |
| | |
| | |
| | |
| | |
| | |
| | |
| | |
| | |
| | |
| | |
| | |
| | |
| | |
| | |
| | |
| | |
| | |
|
|
| | |
| | |
| | |
| | |
Bank Polska Kasa Opieki SA | | |
| | |
| | |
| | |
| | |
| | |
| | |
| | |
Jastrzebska Spolka Weglowa SA * | | |
| | |
| | |
| | |
| | |
| | |
| | |
Santander Bank Polska SA * | | |
Tauron Polska Energia SA * | | |
| | |
|
|
CTT-Correios de Portugal SA | | |
| | |
| | |
| | |
REN - Redes Energeticas Nacionais SGPS SA | | |
| | |
| | |
|
Schwab Fundamental Index Funds | Annual Report71
Schwab Fundamental International Small Company Index Fund
Portfolio Holdings as of October 31, 2023 (continued)
| | |
|
| | |
| | |
Asia Paper Manufacturing Co. Ltd. | | |
| | |
| | |
| | |
Celltrion Healthcare Co. Ltd. | | |
| | |
| | |
Chong Kun Dang Pharmaceutical Corp. | | |
| | |
| | |
| | |
| | |
Daeduck Electronics Co. Ltd. | | |
Daehan Flour Mill Co. Ltd. | | |
| | |
Daesang Holdings Co. Ltd. | | |
Daewoo Engineering & Construction Co. Ltd. * | | |
| | |
| | |
DGB Financial Group, Inc. | | |
| | |
Dongjin Semichem Co. Ltd. | | |
| | |
Dongkuk Holdings Co. Ltd. | | |
Dongkuk Steel Mill Co. Ltd. * | | |
| | |
| | |
| | |
| | |
| | |
| | |
Green Cross Holdings Corp. | | |
| | |
| | |
| | |
| | |
| | |
| | |
Hanshin Construction Co. Ltd. | | |
| | |
| | |
| | |
Hanwha Aerospace Co. Ltd. | | |
Hanwha General Insurance Co. Ltd. * | | |
Hanwha Life Insurance Co. Ltd. * | | |
| | |
| | |
HD Hyundai Construction Equipment Co. Ltd. | | |
HD Hyundai Heavy Industries Co. Ltd. | | |
HD Hyundai Infracore Co. Ltd. | | |
HDC Hyundai Development Co-Engineering & Construction, Class E | | |
| | |
| | |
| | |
Hyosung Advanced Materials Corp. | | |
| | |
| | |
Hyosung Heavy Industries Corp. * | | |
| | |
| | |
| | |
Hyundai Department Store Co. Ltd. | | |
Hyundai Elevator Co. Ltd. | | |
| | |
| | |
Hyundai Mipo Dockyard Co. Ltd. * | | |
| | |
| | |
| | |
| | |
| | |
JB Financial Group Co. Ltd. | | |
| | |
| | |
| | |
| | |
KEPCO Plant Service & Engineering Co. Ltd. | | |
| | |
| | |
KIWOOM Securities Co. Ltd. | | |
| | |
| | |
| | |
Korea Aerospace Industries Ltd. | | |
Korea Electric Terminal Co. Ltd. | | |
Korea Investment Holdings Co. Ltd. | | |
| | |
Korea Petrochemical Ind Co. Ltd. | | |
| | |
| | |
| | |
| | |
| | |
Kwang Dong Pharmaceutical Co. Ltd. | | |
Kyeryong Construction Industrial Co. Ltd. | | |
LG Energy Solution Ltd. * | | |
Lotte Chilsung Beverage Co. Ltd. | | |
| | |
LOTTE Fine Chemical Co. Ltd. | | |
| | |
| | |
| | |
| | |
| | |
| | |
| | |
Meritz Financial Group, Inc. | | |
Mirae Asset Securities Co. Ltd. | | |
| | |
| | |
| | |
NH Investment & Securities Co. Ltd. | | |
| | |
| | |
| | |
| | |
| | |
| | |
| | |
| | |
| | |
| | |
| | |
| | |
| | |
Samsung Engineering Co. Ltd. * | | |
Samsung Heavy Industries Co. Ltd. * | | |
Samsung Securities Co. Ltd. | | |
72
Schwab Fundamental Index Funds | Annual Report
Schwab Fundamental International Small Company Index Fund
Portfolio Holdings as of October 31, 2023 (continued)
| | |
| | |
| | |
| | |
| | |
SeAH Besteel Holdings Corp. | | |
| | |
SeAH Steel Holdings Corp. | | |
Sebang Global Battery Co. Ltd. | | |
| | |
| | |
Seohee Construction Co. Ltd. | | |
Seoul Semiconductor Co. Ltd. | | |
| | |
| | |
| | |
| | |
| | |
| | |
| | |
| | |
| | |
| | |
| | |
Songwon Industrial Co. Ltd. | | |
| | |
| | |
| | |
| | |
| | |
| | |
| | |
| | |
Youngone Holdings Co. Ltd. | | |
| | |
| | |
|
|
| | |
| | |
| | |
CapitaLand Integrated Commercial Trust | | |
CapitaLand Investment Ltd. | | |
| | |
| | |
Frasers Logistics & Commercial Trust | | |
| | |
Hutchison Port Holdings Trust, Class U | | |
Keppel Infrastructure Trust | | |
Manulife U.S. Real Estate Investment Trust | | |
Mapletree Industrial Trust | | |
Mapletree Logistics Trust | | |
Mapletree Pan Asia Commercial Trust | | |
| | |
| | |
| | |
| | |
| | |
| | |
Singapore Technologies Engineering Ltd. | | |
Suntec Real Estate Investment Trust | | |
| | |
| | |
|
| | |
|
Abengoa SA, B Shares *(a) | | |
| | |
| | |
Atresmedia Corp. de Medios de Comunicacion SA | | |
| | |
Caja de Ahorros del Mediterraneo *(a) | | |
| | |
Cia de Distribucion Integral Logista Holdings SA | | |
| | |
Construcciones y Auxiliar de Ferrocarriles SA | | |
Corp. ACCIONA Energias Renovables SA | | |
| | |
Ence Energia y Celulosa SA | | |
| | |
| | |
| | |
| | |
Inmobiliaria Colonial Socimi SA | | |
Linea Directa Aseguradora SA Cia de Seguros y Reaseguros | | |
Melia Hotels International SA * | | |
Merlin Properties Socimi SA | | |
Obrascon Huarte Lain SA * | | |
Prosegur Compania de Seguridad SA | | |
| | |
| | |
| | |
| | |
| | |
|
|
| | |
| | |
| | |
| | |
| | |
| | |
| | |
| | |
| | |
| | |
| | |
| | |
| | |
| | |
| | |
| | |
| | |
| | |
| | |
| | |
Coor Service Management Holding AB | | |
| | |
| | |
Electrolux Professional AB, B Shares | | |
| | |
| | |
| | |
| | |
Fastighets AB Balder, B Shares * | | |
| | |
| | |
Schwab Fundamental Index Funds | Annual Report73
Schwab Fundamental International Small Company Index Fund
Portfolio Holdings as of October 31, 2023 (continued)
| | |
| | |
| | |
| | |
| | |
| | |
Investment AB Latour, B Shares | | |
| | |
| | |
| | |
L E Lundbergforetagen AB, B Shares | | |
Lagercrantz Group AB, B Shares | | |
| | |
| | |
| | |
| | |
| | |
| | |
New Wave Group AB, B Shares | | |
Nibe Industrier AB, B Shares | | |
| | |
| | |
| | |
| | |
| | |
| | |
| | |
| | |
Samhallsbyggnadsbolaget i Norden AB (b) | | |
Samhallsbyggnadsbolaget i Norden AB, D Shares | | |
| | |
Scandic Hotels Group AB * | | |
| | |
Storskogen Group AB, B Shares | | |
| | |
Swedish Orphan Biovitrum AB * | | |
| | |
| | |
Viaplay Group AB, B Shares * | | |
| | |
| | |
|
|
| | |
| | |
| | |
| | |
| | |
| | |
| | |
Banque Cantonale Vaudoise | | |
| | |
| | |
| | |
Burckhardt Compression Holding AG | | |
| | |
| | |
| | |
| | |
| | |
| | |
| | |
| | |
| | |
| | |
| | |
| | |
| | |
| | |
| | |
| | |
| | |
| | |
| | |
| | |
| | |
| | |
Schweiter Technologies AG | | |
| | |
| | |
| | |
| | |
St Galler Kantonalbank AG | | |
| | |
| | |
| | |
| | |
| | |
| | |
| | |
| | |
| | |
| | |
| | |
|
|
| | |
| | |
| | |
| | |
| | |
| | |
| | |
| | |
Babcock International Group PLC * | | |
Bank of Georgia Group PLC | | |
| | |
| | |
| | |
| | |
| | |
| | |
| | |
| | |
| | |
| | |
| | |
| | |
| | |
| | |
| | |
| | |
| | |
Crest Nicholson Holdings PLC | | |
Dechra Pharmaceuticals PLC | | |
Deliveroo PLC, Class A *(b) | | |
| | |
| | |
| | |
| | |
Diversified Energy Co. PLC | | |
| | |
| | |
| | |
| | |
74
Schwab Fundamental Index Funds | Annual Report
Schwab Fundamental International Small Company Index Fund
Portfolio Holdings as of October 31, 2023 (continued)
| | |
| | |
| | |
| | |
| | |
| | |
| | |
| | |
| | |
| | |
| | |
| | |
| | |
| | |
| | |
| | |
| | |
Great Portland Estates PLC | | |
| | |
| | |
Gulf Keystone Petroleum Ltd. | | |
| | |
| | |
| | |
| | |
| | |
Hikma Pharmaceuticals PLC | | |
| | |
| | |
| | |
| | |
| | |
| | |
| | |
| | |
| | |
InterContinental Hotels Group PLC | | |
Intermediate Capital Group PLC | | |
International Consolidated Airlines Group SA * | | |
| | |
| | |
| | |
| | |
Jupiter Fund Management PLC | | |
| | |
| | |
| | |
| | |
LondonMetric Property PLC | | |
| | |
| | |
| | |
Mitchells & Butlers PLC * | | |
| | |
| | |
| | |
Moneysupermarket.com Group PLC | | |
Morgan Advanced Materials PLC | | |
| | |
| | |
| | |
| | |
| | |
| | |
| | |
Paragon Banking Group PLC | | |
| | |
| | |
| | |
| | |
| | |
| | |
| | |
Primary Health Properties PLC | | |
| | |
| | |
| | |
| | |
| | |
| | |
| | |
| | |
| | |
| | |
| | |
Rolls-Royce Holdings PLC * | | |
| | |
| | |
Sabre Insurance Group PLC | | |
| | |
| | |
| | |
| | |
| | |
| | |
| | |
| | |
| | |
Spirax-Sarco Engineering PLC | | |
Spire Healthcare Group PLC | | |
Spirent Communications PLC | | |
| | |
| | |
| | |
| | |
| | |
| | |
| | |
| | |
| | |
| | |
| | |
| | |
| | |
| | |
Vanquis Banking Group PLC | | |
| | |
| | |
| | |
| | |
| | |
Watches of Switzerland Group PLC * | | |
| | |
| | |
| | |
| | |
| | |
| | |
Total Common Stocks
(Cost $484,262,470) | |
|
Schwab Fundamental Index Funds | Annual Report75
Schwab Fundamental International Small Company Index Fund
Portfolio Holdings as of October 31, 2023 (continued)
| | |
PREFERRED STOCKS 0.2% OF NET ASSETS |
|
|
Draegerwerk AG & Co. KGaA | | |
| | |
| | |
| | |
|
|
Danieli & C Officine Meccaniche SpA | | |
Total Preferred Stocks
(Cost $840,846) | |
|
RIGHTS 0.0% OF NET ASSETS |
|
|
|
expires 11/17/23, strike EUR 0.03 *(a) | | |
|
|
|
expires 11/09/23, strike KRW 16,730.00 *(a) | | |
|
|
|
| | |
Total Rights
(Cost $190,639) | |
|
WARRANTS 0.0% OF NET ASSETS |
|
|
|
| | |
| |
| | |
SHORT-TERM INVESTMENTS 0.6% OF NET ASSETS |
|
|
State Street Institutional U.S. Government Money Market Fund, Premier Class 5.30% (c)(d) | | |
Total Short-Term Investments
(Cost $3,173,192) | |
Total Investments in Securities
(Cost $488,467,147) | |
| | | CURRENT VALUE/
UNREALIZED
DEPRECIATION
($) |
|
| | | |
MSCI EAFE Index, expires 12/15/23 | | | |
| Non-income producing security. |
| Fair valued using significant unobservable inputs (see financial note 2(a), Securities for which no quoted value is available, for additional information). |
| All or a portion of this security is on loan. Securities on loan were valued at $2,942,587. |
| The rate shown is the annualized 7-day yield. |
| Security purchased with cash collateral received for securities on loan. |
| |
| Real Estate Investment Trust |
| |
| |
76
Schwab Fundamental Index Funds | Annual Report
Schwab Fundamental International Small Company Index Fund
Portfolio Holdings as of October 31, 2023 (continued)
The following is a summary of the inputs used to value the fund’s investments as of October 31, 2023 (see financial note 2(a) for additional information):
| QUOTED PRICES IN
ACTIVE MARKETS FOR
IDENTICAL ASSETS
(LEVEL 1) | OTHER SIGNIFICANT
OBSERVABLE INPUTS
(LEVEL 2) | SIGNIFICANT
UNOBSERVABLE INPUTS
(LEVEL 3) | |
| | | | |
| | | | |
| | | | |
| | | | |
| | | | |
| | | | |
| | | | |
| | | | |
| | | | |
| | | | |
| | | | |
| | | | |
| | | | |
| | | | |
| | | | |
| | | | |
| | | | |
| | | | |
| | | | |
| | | | |
| | | | |
| | | | |
| | | | |
| | | | |
| | | | |
| | | | |
| | | | |
| | | | |
| | | | |
| | | | |
| | | | |
| | | | |
| | | | |
| | | | |
| | | | |
| | | | |
| | | | |
| | | | |
| Level 3 amount shown includes securities determined to have no value at October 31, 2023. |
| As categorized in the Portfolio Holdings. |
| Futures contracts are reported at cumulative unrealized appreciation or depreciation. |
Schwab Fundamental Index Funds | Annual Report77
Schwab Fundamental International Small Company Index Fund
Statement of Assets and Liabilities
As of October 31, 2023
|
Investments in securities, at value - unaffiliated (cost $488,467,147) including securities on loan of $2,942,587 | | |
| | |
Foreign currency, at value (cost $503,727) | | |
Deposit with broker for futures contracts | | |
| | |
| | |
| | |
| | |
| | |
Income from securities on loan | | |
Variation margin on future contracts | | |
| | |
|
|
Collateral held for securities on loan | | |
| | |
| | |
| | |
| | |
| | |
|
|
Capital received from investors | | |
| | |
| | |
78
Schwab Fundamental Index Funds | Annual Report
Schwab Fundamental International Small Company Index Fund
Statement of Operations
For the period November 1, 2022 through October 31, 2023 |
|
Dividends received from securities - unaffiliated (net of foreign withholding tax of $2,544,270) | | |
| | |
| | |
|
|
| | |
| | |
| | |
| | |
| | |
| | |
|
REALIZED AND UNREALIZED GAINS (LOSSES) |
Net realized losses on sales of securities - unaffiliated | | |
Net realized gains on futures contracts | | |
Net realized losses on foreign currency transactions | | |
| | |
Net change in unrealized appreciation (depreciation) on securities - unaffiliated | | |
Net change in unrealized appreciation (depreciation) on futures contracts | | |
Net change in unrealized appreciation (depreciation) on foreign currency translations | | |
Net change in unrealized appreciation (depreciation) | | |
Net realized and unrealized gains | | |
Increase in net assets resulting from operations | | |
| Professional fees associated with the filing of foreign withholding tax claims in the European Union are deemed to be non-contingent and non-routine expenses of the fund (see financial notes 2(d) and 4 for additional information). |
Schwab Fundamental Index Funds | Annual Report79
Schwab Fundamental International Small Company Index Fund
Statement of Changes in Net Assets
For the current and prior report periods
|
| | |
| | | |
Net realized gains (losses) | | | |
Net change in unrealized appreciation (depreciation) | | | |
Increase (decrease) in net assets resulting from operations | | | |
|
DISTRIBUTIONS TO SHAREHOLDERS |
| | | |
TRANSACTIONS IN FUND SHARES |
| | |
| | | | | |
| | | | | |
| | | | | |
| | | | | |
Net transactions in fund shares | | | | | |
|
SHARES OUTSTANDING AND NET ASSETS |
| | |
| | | | | |
| | | | | |
Total increase (decrease) | | | | | |
| | | | | |
80
Schwab Fundamental Index Funds | Annual Report
Schwab Fundamental Emerging Markets Large Company Index Fund
Financial Statements
| | | | | | |
|
Net asset value at beginning of period | | | | | | |
Income (loss) from investment operations: | | | | | | |
Net investment income (loss)1 | | | | | | |
Net realized and unrealized gains (losses) | | | | | | |
Total from investment operations | | | | | | |
| | | | | | |
Distributions from net investment income | | | | | | |
Net asset value at end of period | | | | | | |
| | | | | | |
|
Ratios to average net assets: | | | | | | |
| | | | | | |
Net investment income (loss) | | | | | | |
| | | | | | |
Net assets, end of period (x 1,000) | | | | | | |
| Calculated based on the average shares outstanding during the period. |
| Ratio includes less than 0.005% of non-routine proxy expenses. |
Schwab Fundamental Index Funds | Annual Report81
Schwab Fundamental Emerging Markets Large Company Index Fund
Portfolio Holdings as of October 31, 2023
This section shows all the securities in the fund’s portfolio and their values as of the report date.
The fund files its complete schedule of portfolio holdings with the U.S. Securities and Exchange Commission (SEC) for the first and third quarters of each fiscal year on Form N-PORT Part F. The fund’s Form N-PORT Part F is available on the SEC’s website at www.sec.gov. You can also obtain this information at no cost on the fund’s website at www.schwabassetmanagement.com/schwabfunds_prospectus, by calling 1-866-414-6349, or by sending an email request to orders@mysummaryprospectus.com. The fund also makes available its complete schedule of portfolio holdings 15 to 20 days after the end of the month on the fund’s website.
| | |
COMMON STOCKS 94.4% OF NET ASSETS |
|
|
| | |
B3 SA - Brasil Bolsa Balcao | | |
| | |
| | |
Banco Santander Brasil SA | | |
| | |
Centrais Eletricas Brasileiras SA | | |
Cia de Saneamento Basico do Estado de Sao Paulo SABESP | | |
Cia Energetica de Minas Gerais | | |
Cia Siderurgica Nacional SA | | |
| | |
| | |
| | |
Natura & Co. Holding SA * | | |
| | |
| | |
| | |
Ultrapar Participacoes SA | | |
| | |
| | |
| | |
|
|
| | |
| | |
| | |
| | |
| | |
|
|
Agile Group Holdings Ltd. *(a) | | |
Agricultural Bank of China Ltd., A Shares | | |
Agricultural Bank of China Ltd., H Shares | | |
Alibaba Group Holding Ltd. * | | |
Aluminum Corp. of China Ltd., A Shares | | |
Aluminum Corp. of China Ltd., H Shares | | |
Anhui Conch Cement Co. Ltd., A Shares | | |
Anhui Conch Cement Co. Ltd., H Shares | | |
ANTA Sports Products Ltd. | | |
BAIC Motor Corp. Ltd., H Shares | | |
| | |
Bank of China Ltd., A Shares | | |
Bank of China Ltd., H Shares | | |
Bank of Communications Co. Ltd., A Shares | | |
Bank of Communications Co. Ltd., H Shares | | |
Baoshan Iron & Steel Co. Ltd., A Shares | | |
Beijing Enterprises Holdings Ltd. | | |
| | |
| | |
| | |
China Cinda Asset Management Co. Ltd., H Shares | | |
China CITIC Bank Corp. Ltd., A Shares | | |
China CITIC Bank Corp. Ltd., H Shares | | |
China Communications Services Corp. Ltd., H Shares | | |
China Construction Bank Corp., A Shares | | |
China Construction Bank Corp., H Shares | | |
China Everbright Bank Co. Ltd., A Shares | | |
China Everbright Bank Co. Ltd., H Shares | | |
China Everbright Environment Group Ltd. | | |
| | |
China Hongqiao Group Ltd. | | |
China Jinmao Holdings Group Ltd. (a) | | |
China Life Insurance Co. Ltd., H Shares | | |
China Mengniu Dairy Co. Ltd. | | |
China Merchants Bank Co. Ltd., A Shares | | |
China Merchants Bank Co. Ltd., H Shares | | |
China Minsheng Banking Corp. Ltd., A Shares | | |
China Minsheng Banking Corp. Ltd., H Shares | | |
China National Building Material Co. Ltd., H Shares | | |
China Overseas Land & Investment Ltd. | | |
China Pacific Insurance Group Co. Ltd., A Shares | | |
China Pacific Insurance Group Co. Ltd., H Shares | | |
China Petroleum & Chemical Corp., A Shares | | |
China Petroleum & Chemical Corp., H Shares | | |
China Railway Group Ltd., A Shares | | |
China Railway Group Ltd., H Shares | | |
China Resources Cement Holdings Ltd. | | |
China Resources Gas Group Ltd. | | |
China Resources Land Ltd. | | |
China Resources Power Holdings Co. Ltd. | | |
China Shenhua Energy Co. Ltd., A Shares | | |
China Shenhua Energy Co. Ltd., H Shares | | |
China State Construction Engineering Corp. Ltd., A Shares | | |
China Taiping Insurance Holdings Co. Ltd. | | |
China Tower Corp. Ltd., H Shares | | |
China United Network Communications Ltd., A Shares | | |
China Vanke Co. Ltd., A Shares | | |
China Vanke Co. Ltd., H Shares | | |
| | |
COSCO SHIPPING Holdings Co. Ltd., A Shares | | |
COSCO SHIPPING Holdings Co. Ltd., H Shares | | |
Country Garden Holdings Co. Ltd. *(a) | | |
CRRC Corp. Ltd., A Shares | | |
CRRC Corp. Ltd., H Shares | | |
82
Schwab Fundamental Index Funds | Annual Report
Schwab Fundamental Emerging Markets Large Company Index Fund
Portfolio Holdings as of October 31, 2023 (continued)
| | |
CSPC Pharmaceutical Group Ltd. | | |
Dongfeng Motor Group Co. Ltd., H Shares | | |
| | |
| | |
GCL Technology Holdings Ltd. | | |
Geely Automobile Holdings Ltd. | | |
Guangdong Investment Ltd. | | |
Guangzhou R&F Properties Co. Ltd., H Shares * | | |
Haier Smart Home Co. Ltd., A Shares | | |
Haier Smart Home Co. Ltd., H Shares | | |
Hengan International Group Co. Ltd. | | |
Huaneng Power International, Inc., A Shares * | | |
Huaneng Power International, Inc., H Shares * | | |
Industrial & Commercial Bank of China Ltd., A Shares | | |
Industrial & Commercial Bank of China Ltd., H Shares | | |
Industrial Bank Co. Ltd., A Shares | | |
| | |
Jiangxi Copper Co. Ltd., A Shares | | |
Jiangxi Copper Co. Ltd., H Shares | | |
| | |
| | |
Kweichow Moutai Co. Ltd., A Shares | | |
Legend Holdings Corp., H Shares | | |
Longfor Group Holdings Ltd. | | |
| | |
| | |
| | |
New China Life Insurance Co. Ltd., A Shares | | |
New China Life Insurance Co. Ltd., H Shares | | |
Nine Dragons Paper Holdings Ltd. * | | |
People's Insurance Co. Group of China Ltd., A Shares | | |
People's Insurance Co. Group of China Ltd., H Shares | | |
PetroChina Co. Ltd., A Shares | | |
PetroChina Co. Ltd., H Shares | | |
PICC Property & Casualty Co. Ltd., H Shares | | |
Ping An Bank Co. Ltd., A Shares | | |
Ping An Insurance Group Co. of China Ltd., A Shares | | |
Ping An Insurance Group Co. of China Ltd., H Shares | | |
Postal Savings Bank of China Co. Ltd., A Shares | | |
Postal Savings Bank of China Co. Ltd., H Shares | | |
SAIC Motor Corp. Ltd., A Shares | | |
| | |
Shanghai Pudong Development Bank Co. Ltd., A Shares | | |
Shenzhou International Group Holdings Ltd. | | |
Sinopharm Group Co. Ltd., H Shares | | |
Sunny Optical Technology Group Co. Ltd. | | |
| | |
Tingyi Cayman Islands Holding Corp. | | |
| | |
Vipshop Holdings Ltd., ADR * | | |
Weichai Power Co. Ltd., A Shares | | |
| | |
Weichai Power Co. Ltd., H Shares | | |
| | |
Yankuang Energy Group Co. Ltd., A Shares | | |
Yankuang Energy Group Co. Ltd., H Shares | | |
| | |
Zhongsheng Group Holdings Ltd. | | |
Zijin Mining Group Co. Ltd., A Shares | | |
Zijin Mining Group Co. Ltd., H Shares | | |
| | |
|
|
| | |
| | |
| | |
|
|
| | |
|
|
Alpha Services & Holdings SA * | | |
Hellenic Telecommunications Organization SA | | |
| | |
|
|
MOL Hungarian Oil & Gas PLC | | |
| | |
| | |
|
|
| | |
Bharat Petroleum Corp. Ltd. | | |
| | |
Bharti Airtel Ltd-Partly Paid Shares | | |
| | |
| | |
| | |
| | |
| | |
| | |
Hindustan Petroleum Corp. Ltd. * | | |
| | |
| | |
| | |
| | |
| | |
Jio Financial Services Ltd. * | | |
| | |
| | |
| | |
| | |
| | |
Oil & Natural Gas Corp. Ltd. | | |
| | |
| | |
Power Grid Corp. of India Ltd. | | |
| | |
| | |
| | |
| | |
Steel Authority of India Ltd. | | |
Schwab Fundamental Index Funds | Annual Report83
Schwab Fundamental Emerging Markets Large Company Index Fund
Portfolio Holdings as of October 31, 2023 (continued)
| | |
Sun Pharmaceutical Industries Ltd. | | |
Tata Consultancy Services Ltd. | | |
| | |
Tata Motors Ltd., A Shares, DVR | | |
| | |
| | |
| | |
| | |
| | |
| | |
| | |
|
|
Astra International Tbk. PT | | |
Bank Central Asia Tbk. PT | | |
Bank Mandiri Persero Tbk. PT | | |
Bank Rakyat Indonesia Persero Tbk. PT | | |
Telkom Indonesia Persero Tbk. PT | | |
| | |
| | |
|
|
Kuwait Finance House KSCP | | |
Mobile Telecommunications Co. KSCP | | |
National Bank of Kuwait SAKP | | |
| | |
|
|
| | |
| | |
| | |
| | |
Petronas Chemicals Group Bhd. | | |
| | |
| | |
| | |
| | |
|
|
| | |
| | |
Cemex SAB de CV, Series CPO * | | |
Controladora AXTEL SAB de CV * | | |
Fomento Economico Mexicano SAB de CV | | |
Grupo Bimbo SAB de CV, Series A | | |
Grupo Financiero Banorte SAB de CV, O Shares | | |
Grupo Mexico SAB de CV, Series B | | |
Grupo Televisa SAB, Series CPO | | |
Orbia Advance Corp. SAB de CV | | |
Wal-Mart de Mexico SAB de CV | | |
| | |
|
|
| | |
| | |
| | |
| | |
| | |
|
| | |
|
| | |
| | |
| | |
Saudi Basic Industries Corp. | | |
| | |
| | |
| | |
Yanbu National Petrochemical Co. | | |
| | |
|
|
| | |
Anglo American Platinum Ltd. | | |
| | |
| | |
| | |
| | |
| | |
| | |
Impala Platinum Holdings Ltd. | | |
| | |
| | |
| | |
| | |
| | |
| | |
| | |
| | |
| | |
| | |
| | |
| | |
| | |
|
|
| | |
ASE Technology Holding Co. Ltd. | | |
| | |
| | |
| | |
Catcher Technology Co. Ltd. | | |
Cathay Financial Holding Co. Ltd. | | |
Chailease Holding Co. Ltd. | | |
China Development Financial Holding Corp. * | | |
| | |
Chunghwa Telecom Co. Ltd. | | |
| | |
CTBC Financial Holding Co. Ltd. | | |
| | |
E.Sun Financial Holding Co. Ltd. | | |
Evergreen Marine Corp. Taiwan Ltd. | | |
Far Eastern New Century Corp. | | |
First Financial Holding Co. Ltd. | | |
Formosa Chemicals & Fibre Corp. | | |
Formosa Petrochemical Corp. | | |
| | |
Foxconn Technology Co. Ltd. | | |
Fubon Financial Holding Co. Ltd. | | |
Hon Hai Precision Industry Co. Ltd. | | |
| | |
| | |
| | |
Largan Precision Co. Ltd. | | |
84
Schwab Fundamental Index Funds | Annual Report
Schwab Fundamental Emerging Markets Large Company Index Fund
Portfolio Holdings as of October 31, 2023 (continued)
| | |
Lite-On Technology Corp., ADR | | |
| | |
Mega Financial Holding Co. Ltd. | | |
Micro-Star International Co. Ltd. | | |
| | |
Novatek Microelectronics Corp. | | |
| | |
| | |
Powertech Technology, Inc. | | |
President Chain Store Corp. | | |
| | |
Shin Kong Financial Holding Co. Ltd. * | | |
Synnex Technology International Corp. | | |
| | |
Taiwan Cooperative Financial Holding Co. Ltd. | | |
| | |
Taiwan Semiconductor Manufacturing Co. Ltd. | | |
Uni-President Enterprises Corp. | | |
United Microelectronics Corp. | | |
| | |
| | |
| | |
| | |
Yang Ming Marine Transport Corp. | | |
Yuanta Financial Holding Co. Ltd. | | |
Zhen Ding Technology Holding Ltd. | | |
| | |
|
|
Advanced Info Service PCL | | |
| | |
Charoen Pokphand Foods PCL | | |
| | |
| | |
| | |
PTT Exploration & Production PCL | | |
| | |
| | |
| | |
| | |
| | |
| | |
|
|
| | |
BIM Birlesik Magazalar AS | | |
Eregli Demir ve Celik Fabrikalari TAS * | | |
Haci Omer Sabanci Holding AS | | |
| | |
| | |
Turkcell Iletisim Hizmetleri AS * | | |
Turkiye Is Bankasi AS, Class C | | |
Turkiye Petrol Rafinerileri AS | | |
| | |
|
United Arab Emirates 1.1% |
Abu Dhabi Commercial Bank PJSC | | |
| | |
| | |
| | |
Emirates Telecommunications Group Co. PJSC | | |
First Abu Dhabi Bank PJSC | | |
| | |
Total Common Stocks
(Cost $599,500,558) | |
|
PREFERRED STOCKS 4.8% OF NET ASSETS |
|
|
| | |
Centrais Eletricas Brasileiras SA, B Shares | | |
Cia Energetica de Minas Gerais | | |
Cia Paranaense de Energia, B Shares | | |
| | |
| | |
| | |
| | |
| | |
|
|
| | |
Total Preferred Stocks
(Cost $24,236,560) | |
| | |
SHORT-TERM INVESTMENTS 0.4% OF NET ASSETS |
|
|
State Street Institutional U.S. Government Money Market Fund, Premier Class 5.30% (b)(c) | | |
Total Short-Term Investments
(Cost $2,678,463) | |
Total Investments in Securities
(Cost $626,415,581) | |
| | | CURRENT VALUE/
UNREALIZED
DEPRECIATION
($) |
|
| | | |
MSCI Emerging Markets Index, expires 12/15/23 | | | |
| Non-income producing security. |
| All or a portion of this security is on loan. Securities on loan were valued at $2,057,787. |
| The rate shown is the annualized 7-day yield. |
| Security purchased with cash collateral received for securities on loan. |
| American Depositary Receipt |
| Differential Voting Rights |
Schwab Fundamental Index Funds | Annual Report85
Schwab Fundamental Emerging Markets Large Company Index Fund
Portfolio Holdings as of October 31, 2023 (continued)
The following is a summary of the inputs used to value the fund’s investments as of October 31, 2023 (see financial note 2(a) for additional information):
| QUOTED PRICES IN
ACTIVE MARKETS FOR
IDENTICAL ASSETS
(LEVEL 1) | OTHER SIGNIFICANT
OBSERVABLE INPUTS
(LEVEL 2) | SIGNIFICANT
UNOBSERVABLE INPUTS
(LEVEL 3) | |
| | | | |
| | | | |
| | | | |
| | | | |
| | | | |
| | | | |
| | | | |
| | | | |
| | | | |
| | | | |
| | | | |
| | | | |
| | | | |
| | | | |
| | | | |
| | | | |
| | | | |
| | | | |
| | | | |
| | | | |
| | | | |
| As categorized in the Portfolio Holdings. |
| Futures contracts are reported at cumulative unrealized appreciation or depreciation. |
86
Schwab Fundamental Index Funds | Annual Report
Schwab Fundamental Emerging Markets Large Company Index Fund
Statement of Assets and Liabilities
As of October 31, 2023
|
Investments in securities, at value - unaffiliated (cost $626,415,581) including securities on loan of $2,057,787 | | |
| | |
Foreign currency, at value (cost $1,587,607) | | |
Deposit with broker for futures contracts | | |
| | |
| | |
| | |
Income from securities on loan | | |
| | |
|
|
Collateral held for securities on loan | | |
| | |
Foreign capital gains tax | | |
| | |
| | |
Variation margin on futures contracts | | |
| | |
| | |
|
|
Capital received from investors | | |
| | |
| | |
Schwab Fundamental Index Funds | Annual Report87
Schwab Fundamental Emerging Markets Large Company Index Fund
Statement of Operations
For the period November 1, 2022 through October 31, 2023 |
|
Dividends received from securities - unaffiliated (net of foreign withholding tax of $4,253,110) | | |
Interest received from securities - unaffiliated | | |
| | |
| | |
|
|
| | |
| | |
| | |
|
REALIZED AND UNREALIZED GAINS (LOSSES) |
Net realized losses on sales of securities - unaffiliated (net of foreign capital gains tax paid of $694,664) | | |
Net realized losses on futures contracts | | |
Net realized losses on foreign currency transactions | | |
| | |
Net change in unrealized appreciation (depreciation) on securities - unaffiliated (net of change in foreign capital gains tax of ($470,313)) | | |
Net change in unrealized appreciation (depreciation) on futures contracts | | |
Net change in unrealized appreciation (depreciation) on foreign currency translations | | |
Net change in unrealized appreciation (depreciation) | | |
Net realized and unrealized gains | | |
Increase in net assets resulting from operations | | |
88
Schwab Fundamental Index Funds | Annual Report
Schwab Fundamental Emerging Markets Large Company Index Fund
Statement of Changes in Net Assets
For the current and prior report periods
|
| | |
| | | |
| | | |
Net change in unrealized appreciation (depreciation) | | | |
Increase (decrease) in net assets resulting from operations | | | |
|
DISTRIBUTIONS TO SHAREHOLDERS |
| | | |
TRANSACTIONS IN FUND SHARES |
| | |
| | | | | |
| | | | | |
| | | | | |
| | | | | |
Net transactions in fund shares | | | | | |
|
SHARES OUTSTANDING AND NET ASSETS |
| | |
| | | | | |
| | | | | |
Total increase (decrease) | | | | | |
| | | | | |
Schwab Fundamental Index Funds | Annual Report89
Schwab Fundamental Index Funds
1. Business Structure of the Funds:
Each of the funds in this report is a series of Schwab Capital Trust (the trust), a no-load, open-end management investment company. The trust is organized as a Massachusetts business trust and is registered under the Investment Company Act of 1940, as amended (the 1940 Act). The list below shows all the funds in the trust as of the end of the period, including the funds discussed in this report, which are highlighted:
|
Schwab Fundamental US Large Company Index Fund | |
Schwab Fundamental US Small Company Index Fund | |
Schwab Fundamental International Large Company Index Fund | |
Schwab Fundamental International Small Company Index Fund | |
Schwab Fundamental Emerging Markets Large Company Index Fund | |
Schwab Fundamental Global Real Estate Index Fund | |
Schwab S&P 500 Index Fund | |
Schwab Small-Cap Index Fund® | |
Schwab U.S. Large-Cap Growth Index Fund | |
Schwab U.S. Large-Cap Value Index Fund | |
Schwab U.S. Mid-Cap Index Fund | |
Schwab Total Stock Market Index Fund® | Schwab Target 2010 Index Fund |
Schwab International Index Fund® | Schwab Target 2015 Index Fund |
Schwab MarketTrack All Equity Portfolio™ | Schwab Target 2020 Index Fund |
Schwab MarketTrack Growth Portfolio™ | Schwab Target 2025 Index Fund |
Schwab MarketTrack Balanced Portfolio™ | Schwab Target 2030 Index Fund |
Schwab MarketTrack Conservative Portfolio™ | Schwab Target 2035 Index Fund |
Schwab International Opportunities Fund | Schwab Target 2040 Index Fund |
| Schwab Target 2045 Index Fund |
| Schwab Target 2050 Index Fund |
Schwab Dividend Equity Fund | Schwab Target 2055 Index Fund |
Schwab Large-Cap Growth Fund | Schwab Target 2060 Index Fund |
Schwab Small-Cap Equity Fund | Schwab Target 2065 Index Fund |
| Schwab Monthly Income Fund - Target Payout |
Schwab International Core Equity Fund | Schwab Monthly Income Fund - Flexible Payout |
| Schwab Monthly Income Fund - Income Payout |
Each fund in this report offers one share class. Shares are bought and sold at closing net asset value per share (NAV), which is the price for all outstanding shares of a fund. Each share has a par value of 1/1,000 of a cent, and the funds’ Board of Trustees (the Board) may authorize the issuance of as many shares as necessary.
Each fund maintains its own account for purposes of holding assets and accounting, and is considered a separate entity for tax purposes. Within its account, each fund may also keep certain assets in segregated accounts, as required by securities law. The "Fund Complex" includes The Charles Schwab Family of Funds, Schwab Capital Trust, Schwab Investments, Schwab Annuity Portfolios, Schwab Strategic Trust and Laudus Trust.
2. Significant Accounting Policies:The following is a summary of the significant accounting policies the funds use in their preparation of financial statements. The funds follow the investment company accounting and reporting guidance of the Financial Accounting Standards Board (FASB) Accounting Standard Codification Topic 946 Financial Services — Investment Companies. The accounting policies are in conformity with accounting principles generally accepted in the United States of America (GAAP).
The funds may invest in certain mutual funds and exchange-traded funds (ETFs), which are referred to as "underlying funds". For more information about the underlying funds’ operations and policies, please refer to those funds’ semiannual and annual reports, which are filed with the U.S. Securities and Exchange Commission (SEC) and are available on the SEC’s website at www.sec.gov.
90
Schwab Fundamental Index Funds | Annual Report
Schwab Fundamental Index Funds
Financial Notes (continued)
2. Significant Accounting Policies (continued):
(a) Security Valuation:
Pursuant to Rule 2a-5 under the 1940 Act, the Board has designated authority to a Valuation Designee, the funds’ investment adviser, to make fair valuation determinations under adopted procedures, subject to Board oversight. The investment adviser has formed a Pricing Committee to administer the pricing and valuation of portfolio securities and other assets and liabilities as well as to ensure that prices used for internal purposes or provided by third parties reasonably reflect fair value. The Valuation Designee may utilize independent pricing services, quotations from securities and financial instrument dealers and other market sources to determine fair value.
Securities held in the funds’ portfolio are valued every business day. The following valuation policies and procedures are used by the Valuation Designee to value various types of securities:
• Securities traded on an exchange or over-the-counter: Traded securities are valued at the closing value for the day, or, on days when no closing value has been reported, at the mean of the most recent bid and ask quotes. Securities that are primarily traded on foreign exchanges are valued at the official closing price or the last sales price on the exchange where the securities are principally traded with these values then translated into U.S. dollars at the current exchange rate, unless these securities are fair valued as discussed below.
• Foreign equity security fair valuation: The Valuation Designee has adopted procedures to fair value foreign equity securities that are traded in markets that close prior to the valuation of a fund’s holdings. By fair valuing securities whose prices may have been affected by events occurring after the close of trading, the Valuation Designee seeks to establish prices that investors might expect to realize upon the current sales of these securities. This methodology is designed to deter “arbitrage” market timers, who seek to exploit delays between the change in the value of a fund’s portfolio holdings and the NAV of a fund’s shares and seeks to help ensure that the prices at which a fund’s shares are purchased and redeemed are fair and do not result in dilution of shareholder interest or other harm to shareholders. When fair value pricing is used at the open or close of a reporting period, it may cause a temporary divergence between the return of a fund and that of its comparative index or benchmark.
• Futures contracts: Futures contracts are valued at their settlement prices as of the close of their exchanges.
• Mutual funds: Mutual funds are valued at their respective NAVs.
• Securities for which no quoted value is available: The Valuation Designee has adopted procedures to fair value a fund’s securities when market prices are not “readily available” or are unreliable. For example, a security may be fair valued when it’s de-listed or its trading is halted or suspended; when a security’s primary pricing source is unable or unwilling to provide a price; or when a security’s primary trading market is closed during regular market hours. Fair value determinations are made in good faith in accordance with adopted valuation procedures. The Valuation Designee considers a number of factors, including unobservable market inputs, when arriving at fair value. The Valuation Designee may employ methods such as the review of related or comparable assets or liabilities, related market activities, recent transactions, market multiples, book values, transactional back-testing, disposition analysis and other relevant information. Due to the subjective and variable nature of fair value pricing, there can be no assurance that a fund could obtain the fair value assigned to the security upon the sale of such security.
In accordance with the authoritative guidance on fair value measurements and disclosures under GAAP, the funds disclose the fair value of their investments in a hierarchy that prioritizes the significant inputs to valuation methods used to measure the fair value. The hierarchy gives the highest priority to valuations based upon unadjusted quoted prices in active markets for identical assets or liabilities (Level 1 measurements) and the lowest priority to valuations based upon unobservable inputs that are significant to the valuation (Level 3 measurements). If inputs used to measure the financial instruments fall within different levels of the hierarchy, the categorization is based on the lowest level input that is significant to the valuation. If it is determined that either the volume and/or level of activity for an asset or liability has significantly decreased (from normal conditions for that asset or liability) or price quotations or observable inputs are not associated with orderly transactions, increased analysis and the Valuation Designee’s judgment will be required to estimate fair value.
The three levels of the fair value hierarchy are as follows:
• Level 1 — quoted prices in active markets for identical investments — Investments whose values are based on quoted market prices in active markets. These generally include active listed equities, mutual funds, ETFs and futures contracts. Mutual funds and ETFs are classified as Level 1 prices, without consideration to the classification level of the underlying securities held which could be Level 1, Level 2 or Level 3 in the fair value hierarchy.
Schwab Fundamental Index Funds | Annual Report91
Schwab Fundamental Index Funds
Financial Notes (continued)
2. Significant Accounting Policies (continued):
• Level 2 — other significant observable inputs (including quoted prices for similar securities, interest rates, prepayment speeds, credit risk, etc.) — Investments that trade in markets that are not considered to be active, but whose values are based on quoted market prices, dealer quotations or valuations provided by alternative pricing sources supported by observable inputs are classified as Level 2 prices. These generally include U.S. government and sovereign obligations, most government agency securities, investment-grade corporate bonds, certain mortgage products, less liquid listed equities, and state, municipal and provincial obligations. In addition, international securities whose markets close hours before the valuation of a fund’s holdings may require fair valuations due to significant movement in the U.S. markets occurring after the daily close of foreign markets. The Valuation Designee has approved a vendor that calculates fair valuations of international equity securities based on a number of factors that appear to correlate to the movements in the U.S. markets
• Level 3 — significant unobservable inputs (including the Valuation Designee’s assumptions in determining the fair value of investments) — Investments whose values are classified as Level 3 prices have significant unobservable inputs, as they may trade infrequently or not at all. When observable prices are not readily available for these securities, one or more valuation methods are used for which sufficient and reliable data is available. The inputs used in estimating the value of Level 3 prices may include the original transaction price, quoted prices for similar securities or assets in active markets, completed or pending third-party transactions in the underlying investment or comparable issuers, and changes in financial ratios or cash flows. Level 3 prices may also be adjusted to reflect illiquidity and/or non-transferability, with the amount of such discount estimated in the absence of market information. Assumptions used due to the lack of observable inputs may significantly impact the resulting fair value and therefore a fund’s results of operations.
The inputs or methodology used for valuing securities are not necessarily an indication of the risk associated with investing in those securities.
The levels associated with valuing the funds’ investments as of October 31, 2023, are disclosed in each fund’s Portfolio Holdings.
(b) Accounting Policies for certain Portfolio Investments (if held):
Futures Contracts: Futures contracts are instruments that represent an agreement between two parties that obligates one party to buy, and the other party to sell, specific instruments at an agreed upon price on a stipulated future date. A fund must give the broker a deposit of cash and/or securities (initial margin) whenever it enters into a futures contract. The amount of the deposit may vary from one contract to another. Subsequent payments (variation margin) are made or received by a fund depending on the daily fluctuations in the value of the futures contract and are accounted for as unrealized appreciation or depreciation until the contract is closed, at which time the gains or losses are realized. Futures contracts are traded publicly on exchanges, and their value may change daily.
Securities Lending: Under the trust’s Securities Lending Program, a fund (lender), may make short-term loans of its securities to another party (borrower) to generate additional revenue for the fund. The borrower pledges collateral in the form of cash, securities issued or fully guaranteed by the U.S. government or foreign governments, or letters of credit issued by a bank. Collateral at the individual loan level is required to be maintained on a daily marked-to-market basis in an amount at least equal to the current value of the securities loaned. The lending agent provides a fund with indemnification against borrower default (the borrower fails to return the security on loan) reducing the risk of loss as a result of default. The cash collateral of securities loaned is currently invested in money market portfolios operating pursuant to Rule 2a-7 under the 1940 Act. Each fund bears the risk of loss with respect to the investment of cash collateral. The terms of the securities lending agreement allow the funds or the lending agent to terminate any loan at any given time and the securities must be returned within the earlier of the standard trade settlement period or the specified time period under the relevant securities lending agreement. Securities lending income, as disclosed in each fund’s Statement of Operations, if applicable, represents the income earned from the investment of the cash collateral plus any fees paid by borrowers, less the fees paid to the lending agent and broker rebates which are subject to adjustments pursuant to the securities lending agreement. On loans not collateralized by cash, a fee is received from the borrower, and is allocated between a fund and the lending agent. The aggregate fair value of securities loaned will not at any time exceed one-third of the total assets of a fund, including collateral received from the loan. Securities lending fees paid to the unaffiliated lending agents start at 9% of gross lending revenue, with subsequent breakpoints to a low of 5%. In this context, the gross lending revenue equals the income received from the investment of cash collateral and fees paid by borrowers less any rebates paid to the borrowers. Any expenses charged by the cash collateral fund are in addition to these fees. All remaining revenue is retained by the fund, as applicable. No portion of lending revenue is paid to or retained by the investment adviser or any of its affiliates.
92
Schwab Fundamental Index Funds | Annual Report
Schwab Fundamental Index Funds
Financial Notes (continued)
2. Significant Accounting Policies (continued):
As of October 31, 2023, Schwab Fundamental US Large Company Index Fund, Schwab Fundamental US Small Company Index Fund, Schwab Fundamental International Large Company Index Fund, Schwab Fundamental International Small Company Index Fund and Schwab Fundamental Emerging Markets Large Company Index Fund had securities on loan, all of which were classified as common stocks. The value of the securities on loan and the related collateral as of October 31, 2023, if any, are disclosed in each fund’s Portfolio Holdings. The value of the securities on loan and the investment of cash collateral are disclosed in each fund’s Statement of Assets and Liabilities.
Cash Investments: The funds, except for the Schwab Fundamental US Large Company Index Fund and Schwab Fundamental US Small Company Index Fund, may invest a portion of their assets in cash. Cash includes cash bank balances in an interest-bearing demand deposit account with maturity on demand by the funds.
Passive Foreign Investment Companies: Certain funds may own shares in certain foreign corporations that meet the Internal Revenue Code, as amended, definition of a Passive Foreign Investment Company (PFIC). The funds may elect for tax purposes to mark-to-market annually the shares of each PFIC lot held and would be required to distribute as ordinary income to shareholders any such marked-to-market gains (as well as any gains realized on sale).
Central Securities Depositories Regulation: The Central Securities Depositories Regulation (CSDR) introduced measures for the authorization and supervision of European Union Central Security Depositories and created a common set of prudential, organizational, and conduct of business standards at a European level. CSDR is designed to support securities settlement and operational aspects of securities settlement, including the provision of shorter settlement periods; mandatory buy-ins; and cash penalties, to prevent and address settlement fails. CSDR measures are aimed to prevent settlement fails by ensuring that all transaction details are provided to facilitate settlement, as well as further incentivizing timely settlement by imposing cash penalty fines and buy-ins. The Schwab Fundamental International Large Company Index Fund, Schwab Fundamental International Small Company Index Fund and Schwab Fundamental Emerging Markets Large Company Index Fund may be subject to pay cash penalties and may also receive cash penalties with certain counterparties in instances where there are settlement fails. These cash penalties are included in the net realized gains (losses) on sales of securities in each fund’s Statement of Operations, if any.
(c) Security Transactions:
Security transactions are recorded as of the date the order to buy or sell the security is executed. Realized gains and losses from security transactions are based on the identified costs of the securities involved.
Assets and liabilities denominated in foreign currencies are reported in U.S. dollars. For assets and liabilities held on a given date, the dollar value is based on market exchange rates in effect on that date. Transactions involving foreign currencies, including purchases, sales, income receipts and expense payments, are calculated using exchange rates in effect on the transaction date. Realized foreign exchange gains or losses arise from sales of foreign currencies, currency gains or losses realized between the trade and settlement dates on securities transactions and the difference between the recorded amounts of dividends, interest, and foreign withholding taxes and the U.S. dollar equivalent of the amounts actually received or paid. Net unrealized foreign exchange appreciation or depreciation arises from changes in foreign exchange rates on foreign denominated assets and liabilities other than investments in securities held at the end of the reporting period. These realized and unrealized foreign exchange gains or losses are reported in foreign currency transactions or translations in each fund’s Statement of Operations, if any. The funds do not isolate the portion of the fluctuations on investments resulting from changes in foreign currency exchange rates from the fluctuations in market prices of investments held. Such fluctuations are included with the net realized and unrealized gain or loss from investments, if any.
Gains realized by the funds on the sale of securities in certain foreign countries may be subject to non-U.S. taxes. In those instances, the funds record a liability based on unrealized gains to provide for potential non-U.S. taxes payable upon the sale of these securities.
When a fund closes out a futures contract position, it calculates the difference between the value of the position at the beginning and at the end of the contract, and records a realized gain or loss accordingly.
(d) Investment Income:
Interest income is recorded as it accrues. Dividends, in the form of cash or non-cash income such as in the form of additional securities, and distributions from portfolio securities and underlying funds are recorded on the date they are effective (the ex-dividend date), although the funds record certain foreign security dividends on the date the ex-dividend is confirmed. Any distributions from underlying funds are recorded in accordance with the character of the distributions as designated by the underlying funds.
Schwab Fundamental Index Funds | Annual Report93
Schwab Fundamental Index Funds
Financial Notes (continued)
2. Significant Accounting Policies (continued):
Income received from foreign sources may result in withholding tax. Withholding taxes are accrued at the same time as the related income if the tax rate is fixed and known, unless a tax withheld is reclaimable from the local tax authorities in which case it is recorded as receivable. If the tax rate is not known or estimable, such expense or reclaim receivable is recorded when the net proceeds are received.
The Schwab Fundamental International Large Company Index Fund and Schwab Fundamental International Small Company Index Fund filed claims to recover taxes previously withheld in certain European Union countries on the basis that those countries had purportedly violated certain provisions in the Treaty on the Functioning of the European Union. These filings are subject to various administrative and judicial proceedings within these countries, and all professional fees associated with these filings have been paid by the investment adviser. The professional fees related to European Union foreign withholding tax claims are non-contingent and non-routine expenses which are subject to repayment to the investment adviser (see financial note 4 for additional information).
For U.S. income tax purposes, European Union reclaims received reduce the amounts of foreign taxes that the fund passes through to its shareholders. If European Union reclaims received exceed foreign withholding taxes paid, the Schwab Fundamental International Large Company Index Fund and Schwab Fundamental International Small Company Index Fund will evaluate the requirements for entering into a closing agreement with the Internal Revenue Service (IRS) to address any prior years’ U.S. income tax liabilities attributable to fund shareholders resulting from the recovery of foreign taxes. The closing agreement would result in the fund paying a compliance fee to the IRS, on behalf of its shareholders, representing the estimated tax savings generated from foreign tax credits claimed by fund shareholders on their tax returns in prior years. During the period ended October 31, 2023, the Schwab Fundamental International Large Company Index Fund and Schwab Fundamental International Small Company Index Fund did not incur any compliance fees.
(e) Expenses:
Pursuant to the Amended and Restated Advisory Agreement (Advisory Agreement) between the investment adviser and the trust, the investment adviser will pay the operating expenses of each fund, excluding taxes, any brokerage expenses, and extraordinary or non-routine expenses. Taxes, any brokerage expenses and extraordinary or non-routine expenses that are specific to a fund are charged directly to the fund. The Advisory Agreement excludes paying acquired fund fees and expenses, which are indirect expenses incurred by a fund through its investments in underlying funds.
(f) Distributions to Shareholders:
The funds make distributions from net investment income and net realized capital gains, if any, once a year. To receive a distribution, you must be a registered shareholder on the record date. Distributions are paid to shareholders on the payable date.
(g) Accounting Estimates:
The accounting policies described in this report conform to GAAP. Notwithstanding this, shareholders should understand that in order to follow these principles, fund management has to make estimates and assumptions that affect the information reported in the financial statements. It’s possible that once the results are known, they may turn out to be different from these estimates and these differences may be material.
(h) Federal Income Taxes:
The funds intend to meet federal income and excise tax requirements for regulated investment companies under subchapter M of the Internal Revenue Code, as amended. Accordingly, the funds distribute substantially all of their net investment income and net realized capital gains, if any, to their respective shareholders each year. As long as a fund meets the tax requirements, it is not required to pay federal income tax.
(i) Foreign Taxes:
The funds may be subject to foreign taxes (a portion of which may be reclaimable) on income, corporate events, foreign currency exchanges and capital gains on investments. All foreign taxes are recorded in accordance with the applicable foreign tax regulations and rates that exist in foreign markets in which the funds invest. These foreign taxes, if any, are paid by the funds and are disclosed in each fund’s Statement of Operations. Foreign taxes accrued as of October 31, 2023, if any, are reflected in each fund’s Statement of Assets and Liabilities.
94
Schwab Fundamental Index Funds | Annual Report
Schwab Fundamental Index Funds
Financial Notes (continued)
2. Significant Accounting Policies (continued):
(j) Indemnification:
Under the funds’ organizational documents, the officers and trustees are indemnified against certain liabilities arising out of the performance of their duties to the funds. In addition, in the normal course of business the funds enter into contracts with their vendors and others that provide general indemnifications. The funds’ maximum exposure under these arrangements is unknown as this would involve future claims that may be made against the funds. However, based on experience, the funds expect the risk of loss attributable to these arrangements to be remote.
(k) Regulatory Update:
Effective January 24, 2023, the SEC adopted rule and form amendments to require mutual funds and ETFs to transmit concise and visually engaging streamlined annual and semiannual reports to shareholders that highlight key information deemed important for retail investors to assess and monitor their fund investments. Other information, including financial statements, will no longer appear in a streamlined shareholder report but must be available online, delivered free of charge upon request, and filed on a semiannual basis on Form N-CSR. The rule and form amendments have a compliance date of July 24, 2024. At this time, management is evaluating the impact of these rule and form amendment changes on the content of the current shareholder report and the newly created annual and semiannual streamlined shareholder reports.
3. Risk Factors:Investing in the funds may involve certain risks, as discussed in the funds’ prospectus, including, but not limited to, those described below. Any of these risks could cause an investor to lose money.
Market Risk. Financial markets rise and fall in response to a variety of factors, sometimes rapidly and unpredictably. Markets may be impacted by economic, political, regulatory and other conditions, including economic sanctions and other government actions. In addition, the occurrence of global events, such as war, terrorism, environmental disasters, natural disasters and epidemics, may also negatively affect the financial markets. As with any investment whose performance is tied to these markets, the value of an investment in a fund will fluctuate, which means that an investor could lose money over short or long periods.
Equity Risk. The prices of equity securities rise and fall daily. These price movements may result from factors affecting individual companies, industries or the securities market as a whole. In addition, equity markets tend to move in cycles, which may cause stock prices to fall over short or extended periods of time.
Investment Style Risk. The funds are index funds. Therefore, each fund follows the securities included in its respective index during upturns as well as downturns. Because of its indexing strategy, a fund does not take steps to reduce market exposure or to lessen the effects of a declining market. In addition, because of a fund’s expenses, a fund’s performance may be below that of the index. Errors relating to the index may occur from time to time and may not be identified by the index provider for a period of time. In addition, market disruptions could cause delays in an index’s rebalancing schedule. Such errors and/or market disruptions may result in losses for a fund.
Market Capitalization Risk. Securities issued by companies of different market capitalizations tend to go in and out of favor based on market and economic conditions. During a period when securities of a particular market capitalization fall behind other types of investments, a fund’s performance could be impacted.
Large-Cap Company Risk. Large-cap companies are generally more mature and the securities issued by these companies may not be able to reach the same levels of growth as the securities issued by small- or mid-cap companies.
Small-Cap Company Risk. Securities issued by small-cap companies may be riskier than those issued by larger companies, and their prices may move sharply, especially during market upturns and downturns.
Tracking Error Risk. As index funds, each fund seeks to track the performance of its respective index, although it may not be successful in doing so. The divergence between the performance of a fund and the index, positive or negative, is called “tracking error.” Tracking error can be caused by many factors and it may be significant.
Concentration Risk. To the extent that a fund’s or its respective index’s portfolio is concentrated in the securities of issuers in a particular market, industry, group of industries, sector, country or asset class, the fund may be adversely affected by the performance of those securities, may be subject to increased price volatility and may be more vulnerable to adverse economic, market, political or regulatory occurrences affecting that market, industry, group of industries, sector, country or asset class.
Schwab Fundamental Index Funds | Annual Report95
Schwab Fundamental Index Funds
Financial Notes (continued)
3. Risk Factors (continued):
Foreign Investment Risk. A fund’s investments in securities of foreign issuers involve certain risks that may be greater than those associated with investments in securities of U.S. issuers. These include risks of adverse changes in foreign economic, political, regulatory and other conditions; changes in currency exchange rates or exchange control regulations (including limitations on currency movements and exchanges); the imposition of economic sanctions or other government restrictions; differing accounting, auditing, financial reporting and legal standards and practices; differing securities market structures; and higher transaction costs. These risks may negatively impact the value or liquidity of a fund’s investments, and could impair the fund’s ability to meet its investment objective or invest in accordance with its investment strategy. There is a risk that investments in securities denominated in, and/or receiving revenues in, foreign currencies will decline in value relative to the U.S. dollar. Foreign securities may also include American Depositary Receipts (ADRs), Global Depositary Receipts (GDRs) and European Depositary Receipts (EDRs), which may be less liquid than the underlying shares in their primary trading market, and GDRs, in particular, many of which are issued by companies in emerging markets, may be more volatile. Foreign securities may also include investments in variable interest entities (VIEs) structures, which are created by China-based operating companies in jurisdictions outside of China to obtain indirect financing due to Chinese regulations that prohibit non-Chinese ownership of those companies. To the extent a fund’s investments in a single country or a limited number of countries represent a large percentage of the fund’s assets, the fund’s performance may be adversely affected by the economic, political, regulatory and social conditions in those countries, and the fund’s price may be more volatile than the price of a fund that is geographically diversified.
Emerging Markets Risk. Emerging market countries may be more likely to experience political turmoil or rapid changes in market or economic conditions than more developed countries. Emerging market countries often have less uniformity in accounting, auditing, financial reporting and recordkeeping requirements and greater risk associated with the custody of securities. In addition, the financial stability of issuers (including governments) in emerging market countries may be more precarious than in developed countries. As a result, there may be an increased risk of illiquidity and price volatility associated with a fund’s investments in emerging market countries, which may be magnified by currency fluctuations relative to the U.S. dollar, and, at times, it may be difficult to value such investments.
Derivatives Risk. Each fund may use derivatives to enhance returns or hedge against market declines. Examples of derivatives are options, futures, options on futures and swaps. An option is the right to buy or sell an instrument at a specific price before a specific date. A future is an agreement to buy or sell a financial instrument at a specific price on a specific day. A swap is an agreement whereby two parties agree to exchange payment streams calculated in relation to a rate, index, instrument or certain securities and a predetermined amount. A fund’s use of derivatives that are subject to regulation by the Commodity Futures Trading Commission (CFTC) could cause the fund to become a commodity pool, which would require the fund to comply with certain CFTC rules.
A fund’s use of derivative instruments involves risks different from, or possibly greater than, the risks associated with investing directly in securities and other traditional investments. Certain of these risks, such as liquidity risk and market risk, are discussed elsewhere in this section. A fund’s use of derivatives is also subject to lack of availability risk, credit risk, leverage risk, valuation risk, correlation risk and tax risk. Lack of availability risk is the risk that suitable derivative transactions may not be available in all circumstances for risk management or other purposes. Credit risk is the risk that the counterparty to a derivatives transaction may not fulfill its obligations. Leverage risk is the risk that a small percentage of assets invested in derivatives can have a disproportionately large impact on the fund. Valuation risk is the risk that a particular derivative may be valued incorrectly. Correlation risk is the risk that changes in the value of the derivative may not correlate perfectly with the underlying asset, rate or index. Tax risk is the risk that the use of derivatives may cause the fund to realize higher amounts of short-term capital gains. A fund’s use of derivatives could reduce the fund’s performance, increase the fund’s volatility, and could cause the fund to lose more than the initial amount invested. A fund’s use of derivatives also could create a risk of counterparty default under certain transactions, risks that the fund would need to liquidate portfolio positions when it may not be advantageous to do so in order to meet margin and payment obligations, and legal risks relating to insufficient documentation, insufficient capacity or authority of a counterparty, or legality or enforceability of a contract.
Liquidity Risk. A fund may be unable to sell certain securities, such as illiquid securities, readily at a favorable time or price, or the fund may have to sell them at a loss.
Sampling Index Tracking Risk. To the extent a fund uses a sampling method, the fund may not fully replicate its respective index and may hold securities not included in the index. As a result, the fund is subject to the risk that the investment adviser’s investment management strategy, the implementation of which is subject to a number of constraints, may not produce the intended results. If a fund utilizes a sampling approach, it may not track the return of the index as well as it would if the fund purchased all of the securities in the index.
Securities Lending Risk. Securities lending involves the risk of loss of rights in, or delay in recovery of, the loaned securities if the borrower fails to return the security loaned or becomes insolvent.
96
Schwab Fundamental Index Funds | Annual Report
Schwab Fundamental Index Funds
Financial Notes (continued)
3. Risk Factors (continued):
Exchange Traded Funds (ETFs) Risk. Certain funds may purchase shares of ETFs to gain exposure to a particular portion of the market while awaiting an opportunity to purchase securities directly. When a fund invests in an ETF, in addition to directly bearing the expenses associated with its own operations, it will bear a proportionate share of the ETF’s expenses. Therefore, it may be more costly to own an ETF than to own the underlying securities directly. In addition, while the risks of owning shares of an ETF generally reflect the risks of owning the underlying securities the ETF holds, lack of liquidity in the market for an ETF’s shares can result in its value being more volatile than the underlying portfolio securities.
Please refer to the funds’ prospectus for a more complete description of the principal risks of investing in the funds.
4. Affiliates and Affiliated Transactions:Investment Adviser
Charles Schwab Investment Management, Inc., dba Schwab Asset Management, a wholly owned subsidiary of The Charles Schwab Corporation, serves as each fund’s investment adviser and administrator pursuant to the Advisory Agreement between the investment adviser and the trust.
For its advisory services to the funds, the investment adviser is entitled to receive an annual fee, payable monthly, based on a percentage of each fund’s average daily net assets as follows:
SCHWAB FUNDAMENTAL US LARGE COMPANY INDEX FUND | SCHWAB FUNDAMENTAL US SMALL COMPANY INDEX FUND | SCHWAB FUNDAMENTAL INTERNATIONAL LARGE COMPANY INDEX FUND | SCHWAB FUNDAMENTAL INTERNATIONAL SMALL COMPANY INDEX FUND | SCHWAB FUNDAMENTAL EMERGING MARKETS LARGE COMPANY INDEX FUND |
| | | | |
Schwab Fundamental Index Funds | Annual Report97
Schwab Fundamental Index Funds
Financial Notes (continued)
4. Affiliates and Affiliated Transactions (continued):
Investments from Affiliates
Certain funds in the Fund Complex may own shares of other funds in the Fund Complex. The table below reflects the percentages of shares of each fund in this report that are owned by other funds in the Fund Complex as of October 31, 2023, as applicable:
| |
| SCHWAB FUNDAMENTAL US LARGE COMPANY INDEX FUND | SCHWAB FUNDAMENTAL US SMALL COMPANY INDEX FUND | SCHWAB FUNDAMENTAL INTERNATIONAL LARGE COMPANY INDEX FUND | SCHWAB FUNDAMENTAL INTERNATIONAL SMALL COMPANY INDEX FUND | SCHWAB FUNDAMENTAL EMERGING MARKETS LARGE COMPANY INDEX FUND |
Schwab MarketTrack All Equity Portfolio | | | | | |
Schwab MarketTrack Balanced Portfolio | | | | | |
Schwab MarketTrack Conservative Portfolio | | | | | |
Schwab MarketTrack Growth Portfolio | | | | | |
| | | | | |
| | | | | |
| | | | | |
| | | | | |
| | | | | |
| | | | | |
| | | | | |
| | | | | |
| | | | | |
| | | | | |
| | | | | |
| | | | | |
Other Affiliated Transactions
The professional fees related to European Union foreign withholding tax claims discussed in financial note 2(d) are non-contingent and non-routine expenses. The investment adviser agreed to pay these professional fees, on behalf of the funds, subject to reimbursement by the funds to the extent the funds are able to successfully recover taxes withheld in the future.
During the period ended October 31, 2023, the professional fees incurred by the Schwab Fundamental International Large Company Index Fund and Schwab Fundamental International Small Company Index Fund and paid by the investment adviser were $19,021 and $1,046 respectively, as shown as Professional fees in each fund’s Statement of Operations.
During the period ended October 31, 2023, the Schwab Fundamental International Large Company Index Fund and Schwab Fundamental International Small Company Index Fund did not recover any previously withheld foreign taxes and made no reimbursements to the investment adviser.
As of October 31, 2023, the balance of professional fees related to foreign withholding tax claims subject to future reimbursement by the Schwab Fundamental International Large Company Index Fund and Schwab Fundamental International Small Company Index Fund to the investment adviser were $103,883 and $2,064 respectively.
No other amounts for additional foreign withholding tax claims are reflected in the financial statements due to the uncertainty surrounding the ultimate resolution of proceedings, the likelihood of receipt of these claims, and the potential timing of payment.
98
Schwab Fundamental Index Funds | Annual Report
Schwab Fundamental Index Funds
Financial Notes (continued)
4. Affiliates and Affiliated Transactions (continued):
Interfund Transactions
The funds may engage in direct transactions with certain other funds in the Fund Complex in accordance with procedures adopted by the Board pursuant to Rule 17a-7 under the 1940 Act. When one fund is seeking to sell a security that another is seeking to buy, an interfund transaction can allow both funds to benefit by reducing transaction costs. This practice is limited to funds that share the same investment adviser, trustees and/or officers. For the period ended October 31, 2023, each fund’s purchases and sales of securities with other funds in the Fund Complex as well as any realized gains (losses) were as follows:
| | | |
Schwab Fundamental US Large Company Index Fund | | | |
Schwab Fundamental US Small Company Index Fund | | | |
Schwab Fundamental International Large Company Index Fund | | | |
Schwab Fundamental International Small Company Index Fund | | | |
Schwab Fundamental Emerging Markets Large Company Index Fund | | | |
| | | |
Interfund Borrowing and Lending
Pursuant to an exemptive order issued by the SEC, the funds may enter into interfund borrowing and lending transactions with other funds in the Fund Complex. All loans are for temporary or emergency purposes and the interest rate to be charged will be the average of the overnight repurchase agreement rate and the short-term bank loan rate. All loans are subject to numerous conditions designed to ensure fair and equitable treatment of all participating funds. The interfund lending facility is subject to the oversight and periodic review by the Board. The funds had no interfund borrowing or lending activity during the period.
5. Board of Trustees:The Board may include people who are officers and/or directors of the investment adviser or its affiliates. Federal securities law limits the percentage of such “interested persons” who may serve on a trust’s board, and the trust was in compliance with these limitations throughout the report period. The funds did not pay any interested persons or non-interested persons (independent trustees). The independent trustees are paid by the investment adviser. For information regarding the trustees, please refer to the Trustees and Officers table at the end of this report.
6. Borrowing from Banks:During the period, the funds were participants with other funds in the Fund Complex in a joint, syndicated, committed $1 billion line of credit (the Syndicated Credit Facility), which matured on September 28, 2023. On September 28, 2023, the Syndicated Credit Facility was amended to run for a new 364 day period with the line of credit amount remaining unchanged, maturing on September 26, 2024. Under the terms of the Syndicated Credit Facility, in addition to the investment adviser paying the interest charged on any borrowings by a fund, the investment adviser paid a commitment fee of 0.15% per annum on the funds’ proportionate share of the unused portion of the Syndicated Credit Facility.
During the period, the funds were participants with other funds in the Fund Complex in a joint, unsecured, uncommitted $400 million line of credit (the Uncommitted Credit Facility), with State Street Bank and Trust Company which matured on September 28, 2023. On September 28, 2023, the Uncommitted Credit Facility was amended to run for a new 364 day period with the line of credit amount remaining unchanged, maturing on September 26, 2024. Under the terms of the Uncommitted Credit Facility, the investment adviser pays interest on the amount a fund borrows. There were no borrowings by any of the funds from either line of credit during the period.
The funds also have access to custodian overdraft facilities. A fund may have utilized the overdraft facility and incurred an interest expense, which is paid by the investment adviser. The interest expense is determined based on a negotiated rate above the current Federal Funds Rate.
Schwab Fundamental Index Funds | Annual Report99
Schwab Fundamental Index Funds
Financial Notes (continued)
The funds entered into equity index futures contracts during the report period. The funds invested in futures contracts to equitize available cash. The value and variation margin for futures contracts held at October 31, 2023, if any, are presented in each fund’s Portfolio Holdings and Statement of Assets and Liabilities, respectively. The net realized gains (losses) and net change in unrealized appreciation (depreciation) on futures contracts are presented in each fund’s Statement of Operations, if any. Refer to financial note 2(b) for the funds’ accounting policies with respect to futures contracts and financial note 3 for disclosures concerning the risks of investing in futures contracts. During the period ended October 31, 2023, the month-end average notional amounts of futures contracts held by the funds and the month-end average number of contracts held were as follows:
| | |
Schwab Fundamental US Large Company Index Fund | | |
Schwab Fundamental US Small Company Index Fund | | |
Schwab Fundamental International Large Company Index Fund | | |
Schwab Fundamental International Small Company Index Fund | | |
Schwab Fundamental Emerging Markets Large Company Index Fund | | |
8. Purchases and Sales of Investment Securities:For the period ended October 31, 2023, purchases and sales of securities (excluding in-kind transactions and short-term obligations) were as follows:
| | |
Schwab Fundamental US Large Company Index Fund | | |
Schwab Fundamental US Small Company Index Fund | | |
Schwab Fundamental International Large Company Index Fund | | |
Schwab Fundamental International Small Company Index Fund | | |
Schwab Fundamental Emerging Markets Large Company Index Fund | | |
During the period ended October 31, 2023, the following funds had transactions in connection with in-kind transactions:
| IN-KIND PURCHASES
OF SECURITIES | IN-KIND SALES
OF SECURITIES |
Schwab Fundamental US Large Company Index Fund | | |
Schwab Fundamental US Small Company Index Fund | | |
For the period ended October 31, 2023, where applicable, the funds realized net capital gains or losses resulting from in-kind redemptions. Because such gains or losses are not taxable to the funds and are not distributed to existing fund shareholders, the gains or losses are reclassified from accumulated net realized gains or losses to capital received from investors at the end of the funds’ tax year. These reclassifications have no effect on net assets or net asset values per share. The net realized gains or losses on sales of in-kind redemptions for the period ended October 31, 2023, are disclosed in the funds’ Statements of Operations, if any.
100
Schwab Fundamental Index Funds | Annual Report
Schwab Fundamental Index Funds
Financial Notes (continued)
As of October 31, 2023, the tax basis cost of the funds’ investments and gross unrealized appreciation and depreciation were as follows:
| | GROSS UNREALIZED
APPRECIATION | GROSS UNREALIZED
DEPRECIATION | NET UNREALIZED
APPRECIATION
(DEPRECIATION) |
Schwab Fundamental US Large Company Index Fund | | | | |
Schwab Fundamental US Small Company Index Fund | | | | |
Schwab Fundamental International Large Company Index Fund | | | | |
Schwab Fundamental International Small Company Index Fund | | | | |
Schwab Fundamental Emerging Markets Large Company Index Fund | | | | |
| | | | |
| | | | |
As of October 31, 2023, the components of distributable earnings on a tax basis were as follows:
| UNDISTRIBUTED
ORDINARY
INCOME | NET UNREALIZED
APPRECIATION
(DEPRECIATION)
ON INVESTMENTS | NET OTHER UNREALIZED
APPRECIATION
(DEPRECIATION) | CAPITAL LOSS
CARRYFORWARDS
AND OTHER LOSSES | |
Schwab Fundamental US Large Company Index Fund | | | | | |
Schwab Fundamental US Small Company Index Fund | | | | | |
Schwab Fundamental International Large Company Index Fund | | | | | |
Schwab Fundamental International Small Company Index Fund | | | | | |
Schwab Fundamental Emerging Markets Large Company Index Fund | | | | | |
The primary differences between book basis and tax basis unrealized appreciation or unrealized depreciation of investments are the tax deferral of losses on wash sales, the realization for tax purposes of unrealized appreciation or depreciation on futures contracts, the realization for tax purposes of unrealized appreciation on investments in PFICs and partnership investments. The tax cost of the funds’ investments, disclosed above, have been adjusted from their book amounts to reflect these unrealized appreciation or depreciation differences, as applicable.
Capital loss carryforwards have no expiration and may be used to offset future realized capital gains for federal income tax purposes. As of October 31, 2023, the funds had capital loss carryforwards available as follows:
| |
Schwab Fundamental US Large Company Index Fund | |
Schwab Fundamental US Small Company Index Fund | |
Schwab Fundamental International Large Company Index Fund | |
Schwab Fundamental International Small Company Index Fund | |
Schwab Fundamental Emerging Markets Large Company Index Fund | |
For the fiscal year ended October 31, 2023 the Schwab Fundamental Emerging Markets Large Company Index Fund had capital loss carryforwards utilized of $1,465,754.
Schwab Fundamental Index Funds | Annual Report101
Schwab Fundamental Index Funds
Financial Notes (continued)
9. Federal Income Taxes (continued):
The tax basis components of distributions paid during the current and prior fiscal years were as follows:
| CURRENT FISCAL YEAR END DISTRIBUTIONS | PRIOR FISCAL YEAR END DISTRIBUTIONS |
| | | | |
Schwab Fundamental US Large Company Index Fund | | | | |
Schwab Fundamental US Small Company Index Fund | | | | |
Schwab Fundamental International Large Company Index Fund | | | | |
Schwab Fundamental International Small Company Index Fund | | | | |
Schwab Fundamental Emerging Markets Large Company Index Fund | | | | |
Distributions paid to shareholders are based on net investment income and net realized gains determined on a tax basis, which may differ from net investment income and net realized gains for financial reporting purposes. These differences reflect the differing character of certain income items and net realized gains and losses for financial statement and tax purposes, and may result in reclassification among certain capital accounts in the financial statements. The funds may also designate a portion of the amount paid to redeeming shareholders as a distribution for tax purposes.
Permanent book and tax basis differences may result in reclassifications between components of net assets as required. The adjustments will have no impact on net assets or the results of operations.
As of October 31, 2023, management has reviewed the tax positions for open periods (for federal purposes, three years from the date of filing and for state purposes, four years from the date of filing) as applicable to the funds, and has determined that no provision for income tax is required in the funds’ financial statements. The funds recognize interest and penalties, if any, related to unrecognized tax benefits as income tax expense in each fund’s Statement of Operations. During the fiscal year ended October 31, 2023, the funds did not incur any interest or penalties.
10. Subsequent Events:Management has determined there are no subsequent events or transactions through the date the financial statements were issued that would have materially impacted the financial statements as presented.
102
Schwab Fundamental Index Funds | Annual Report
Schwab Fundamental Index Funds
Report of Independent Registered Public Accounting Firm
To the Board of Trustees of Schwab Capital Trust and Shareholders of Schwab Fundamental US Large Company Index Fund, Schwab Fundamental US Small Company Index Fund, Schwab Fundamental International Large Company Index Fund, Schwab Fundamental International Small Company Index Fund, and Schwab Fundamental Emerging Markets Large Company Index Fund:
Opinion on the Financial Statements and Financial Highlights
We have audited the accompanying statements of assets and liabilities, including the portfolio holdings, of Schwab Fundamental US Large Company Index Fund, Schwab Fundamental US Small Company Index Fund, Schwab Fundamental International Large Company Index Fund, Schwab Fundamental International Small Company Index Fund, and Schwab Fundamental Emerging Markets Large Company Index Fund (the “Funds”), five of the funds constituting Schwab Capital Trust, as of October 31, 2023, the related statements of operations for the year then ended, the statements of changes in net assets for each of the two years in the period then ended, the financial highlights for each of the four years in the period then ended, and the related notes. In our opinion, the financial statements and financial highlights present fairly, in all material respects, the financial position of each of the Funds constituting the Schwab Capital Trust as of October 31, 2023, and the results of their operations for the year then ended, the changes in their net assets for each of the two years in the period then ended, and the financial highlights for each of the four years in the period then ended in conformity with accounting principles generally accepted in the United States of America. The financial highlights for the year ended October 31, 2019 were audited by other auditors, whose report, dated December 16, 2019, expressed an unqualified opinion on such financial highlights.
Basis for Opinion
These financial statements and financial highlights are the responsibility of the Funds’ management. Our responsibility is to express an opinion on the Funds’ financial statements and financial highlights based on our audits. We are a public accounting firm registered with the Public Company Accounting Oversight Board (United States) (PCAOB) and are required to be independent with respect to the Funds in accordance with the U.S. federal securities laws and the applicable rules and regulations of the Securities and Exchange Commission and the PCAOB.
We conducted our audits in accordance with the standards of the PCAOB. Those standards require that we plan and perform the audit to obtain reasonable assurance about whether the financial statements and financial highlights are free of material misstatement, whether due to error or fraud. The Funds are not required to have, nor were we engaged to perform, an audit of their internal control over financial reporting. As part of our audits, we are required to obtain an understanding of internal control over financial reporting but not for the purpose of expressing an opinion on the effectiveness of the Funds’ internal control over financial reporting. Accordingly, we express no such opinion.
Our audits included performing procedures to assess the risks of material misstatement of the financial statements and financial highlights, whether due to error or fraud, and performing procedures that respond to those risks. Such procedures included examining, on a test basis, evidence regarding the amounts and disclosures in the financial statements and financial highlights. Our audits also included evaluating the accounting principles used and significant estimates made by management, as well as evaluating the overall presentation of the financial statements and financial highlights. Our procedures included confirmation of securities owned as of October 31, 2023, by correspondence with the custodian and brokers; when replies were not received from brokers, we performed other auditing procedures. We believe that our audits provide a reasonable basis for our opinion.
Deloitte & Touche LLP
Denver, Colorado
December 15, 2023
We have served as the auditor of one or more investment companies in the Schwab Funds Complex since 2020.
Schwab Fundamental Index Funds | Annual Report103
Schwab Fundamental Index Funds
Other Federal Tax Information (unaudited)
The funds may elect to pass through, under section 853(a) of the Internal Revenue Code, the foreign tax credit to shareholders. For the fiscal year ended October 31, 2023, the foreign tax credit and respective foreign source income on the funds were as follows:
| | |
Schwab Fundamental US Large Company Index Fund | | |
Schwab Fundamental US Small Company Index Fund | | |
Schwab Fundamental International Large Company Index Fund | | |
Schwab Fundamental International Small Company Index Fund | | |
Schwab Fundamental Emerging Markets Large Company Index Fund | | |
For corporate shareholders, the following percentage of the funds’ dividend distributions paid during the fiscal year ended October 31, 2023, qualify for the corporate dividends received deduction:
| |
Schwab Fundamental US Large Company Index Fund | |
Schwab Fundamental US Small Company Index Fund | |
Schwab Fundamental International Large Company Index Fund | |
Schwab Fundamental International Small Company Index Fund | |
Schwab Fundamental Emerging Markets Large Company Index Fund | |
For the fiscal year ended October 31, 2023, the funds designate the following amounts of the dividend distributions as qualified dividends for the purpose of the maximum rate under section 1(h)(11) of the Internal Revenue Code. Shareholders will be notified in January 2024 via IRS Form 1099 of the amounts for use in preparing their 2023 income tax return.
Schwab Fundamental US Large Company Index Fund | |
Schwab Fundamental US Small Company Index Fund | |
Schwab Fundamental International Large Company Index Fund | |
Schwab Fundamental International Small Company Index Fund | |
Schwab Fundamental Emerging Markets Large Company Index Fund | |
Under section 852(b)(3)(C) of the Internal Revenue Code, certain funds designate the following amounts as long-term capital gain dividends for the fiscal year ended October 31, 2023:
Schwab Fundamental US Large Company Index Fund | |
Schwab Fundamental US Small Company Index Fund | |
Schwab Fundamental International Large Company Index Fund | |
Schwab Fundamental International Small Company Index Fund | |
Schwab Fundamental Emerging Markets Large Company Index Fund | |
For the fiscal year ended October 31, 2023, the funds designate the following amounts of the dividends eligible for the 20% qualified business income deduction under section 199A of the Internal Revenue Code. Shareholders will be notified in January 2024 via IRS Form 1099 of the amount for use in preparing their 2023 income tax return.
Schwab Fundamental US Large Company Index Fund | |
Schwab Fundamental US Small Company Index Fund | |
Schwab Fundamental International Large Company Index Fund | |
Schwab Fundamental International Small Company Index Fund | |
Schwab Fundamental Emerging Markets Large Company Index Fund | |
104
Schwab Fundamental Index Funds | Annual Report
Schwab Fundamental Index Funds
Liquidity Risk Management Program (unaudited)
The funds have adopted and implemented a liquidity risk management program (the “program”) as required by Rule 22e-4 under the Investment Company Act of 1940, as amended. The funds’ Board of Trustees (the “Board”) has designated the funds’ investment adviser, Charles Schwab Investment Management, Inc., dba Schwab Asset Management, as the administrator of the program. Personnel of the investment adviser or its affiliates conduct the day-to-day operation of the program.
Under the program, the investment adviser manages a fund’s liquidity risk, which is the risk that the fund could not meet shareholder redemption requests without significant dilution of remaining shareholders’ interests in the fund. The program is reasonably designed to assess and manage a fund’s liquidity risk, taking into consideration the fund’s investment strategy and the liquidity of its portfolio investments during normal and reasonably foreseeable stressed conditions; its historical redemption history and shareholder concentrations; and its cash holdings and access to other funding sources, including the custodian overdraft facility and lines of credit. The investment adviser’s process of determining the degree of liquidity of each fund’s investments is supported by third-party liquidity assessment vendors.
The funds’ Board reviewed a report at its meeting held on September 19, 2023 prepared by the investment adviser regarding the operation and effectiveness of the program for the period June 1, 2022, through May 31, 2023, which included individual fund liquidity risk metrics. The report summarized the operation of the program and the information and factors considered by the investment adviser in assessing whether the program has been adequately and effectively implemented with respect to a fund. In addition, the investment adviser provided its assessment that the program had been operating effectively in managing each fund’s liquidity risk.
Schwab Fundamental Index Funds | Annual Report105
Schwab Fundamental Index Funds
Investment Advisory Agreement Approval
The Investment Company Act of 1940, as amended (the 1940 Act), requires that the continuation of a fund’s investment advisory agreement must be specifically approved (1) by the vote of the trustees or by a vote of the shareholders of the fund, and (2) by the vote of a majority of the trustees who are not parties to the investment advisory agreement or “interested persons” of any party thereto (the Independent Trustees), cast in person at a meeting called for the purpose of voting on such approval. In connection with such approvals, the fund’s trustees must request and evaluate, and the investment adviser is required to furnish, such information as may be reasonably necessary to evaluate the terms of the investment advisory agreement.
The Board of Trustees (the Board or the Trustees, as appropriate) calls and holds one or more meetings each year that are dedicated, in whole or in part, to considering whether to renew the investment advisory and administration agreement (the Agreement) between Schwab Capital Trust (the Trust) and Charles Schwab Investment Management, Inc. (dba Schwab Asset Management) (the investment adviser) with respect to the existing funds in the Trust, including Schwab Fundamental US Large Company Index Fund, Schwab Fundamental US Small Company Index Fund, Schwab Fundamental International Large Company Index Fund, Schwab Fundamental International Small Company Index Fund and Schwab Fundamental Emerging Markets Large Company Index Fund (each, a Fund and collectively, the Funds), and to review certain other agreements pursuant to which the investment adviser provides investment advisory services to certain other registered investment companies. In preparation for the meeting(s), the Board requests and reviews a wide variety of materials provided by the investment adviser, including information about the investment adviser’s affiliates, personnel, business goals and priorities, profitability, third-party oversight, corporate structure and operations. As part of the renewal process, the Independent Trustees’ legal counsel, on behalf of the Independent Trustees, sends an information request letter to the investment adviser seeking certain relevant information. The responses by the investment adviser are provided to the Trustees in the Board materials for their review prior to their meeting, and the Trustees are provided with the opportunity to request any additional materials. The Board also receives data provided by an independent provider of investment company data. This information is in addition to the detailed information about the Funds that the Board reviews during the course of each year, including information that relates to the Funds’ operations and performance, legal and compliance matters, risk management, portfolio turnover, and sales and marketing activity. In considering the renewal, the Independent Trustees receive advice from Independent Trustees’ legal counsel, including a memorandum regarding the responsibilities of trustees for the
approval of investment advisory agreements. In addition, the Independent Trustees participate in question and answer sessions with representatives of the investment adviser and meet in executive session outside the presence of Fund management.
The Board, including a majority of the Independent Trustees, considered information specifically relating to the continuance of the Agreement with respect to the Funds at meetings held on April 27, 2023 and June 7, 2023, and approved the renewal of the Agreement with respect to the Funds for an additional one-year term at the meeting on June 7, 2023 called for the purpose of voting on such approval.
The Board’s approval of the continuance of the Agreement with respect to the Funds was based on consideration and evaluation of a variety of specific factors discussed at these meetings and at prior meetings, including:
1.
the nature, extent and quality of the services provided to each Fund under the Agreement, including the resources of the investment adviser and its affiliates dedicated to the Funds;
2.
each Fund’s investment performance and how it compared to that of certain other comparable mutual funds and benchmark data;
3.
each Fund’s expenses and how those expenses compared to those of certain other similar mutual funds;
4.
the profitability of the investment adviser and its affiliates, including Charles Schwab & Co., Inc. (Schwab), with respect to each Fund, including both direct and indirect benefits accruing to the investment adviser and its affiliates; and
5.
the extent to which economies of scale would be realized as each Fund grows and whether fee levels in the Agreement reflect those economies of scale for the benefit of Fund investors.
Nature, Extent and Quality of Services. The Board considered the nature, extent and quality of the services provided by the investment adviser to the Funds and the resources of the investment adviser and its affiliates dedicated to the Funds. In this regard, the Trustees evaluated, among other things, the investment adviser’s experience, track record, compliance program, resources dedicated to hiring and retaining skilled personnel and specialized talent, and information security resources. The Trustees also considered information provided by the investment adviser relating to services and support provided with respect to each Fund’s portfolio management team, portfolio strategy, and internal investment guidelines, as well as trading infrastructure, liquidity management, product design and analysis, shareholder communications, securities valuation, and vendor and risk oversight. The Trustees also
106
Schwab Fundamental Index Funds | Annual Report
Schwab Fundamental Index Funds
considered investments the investment adviser has made in its infrastructure, including modernizing the investment adviser’s technology and use of data, increasing expertise in key areas (including portfolio management and trade operations), and improving business continuity, cybersecurity, due diligence, risk management processes, and information security programs, which are designed to provide enhanced services to the Funds and their shareholders. The Trustees considered Schwab’s overall financial condition and its reputation as a full service brokerage firm, as well as the wide range of products, services and account features that benefit Fund shareholders who are brokerage clients of Schwab. Following such evaluation, the Board concluded, within the context of its full deliberations, that the nature, extent and quality of services provided by the investment adviser to the Funds and the resources of the investment adviser and its affiliates dedicated to the Funds supported renewal of the Agreement with respect to the Funds.
Fund Performance. The Board considered each Fund’s performance in determining whether to renew the Agreement with respect to such Fund. Specifically, the Trustees considered each Fund’s performance relative to a peer category of other mutual funds and applicable indices/benchmarks, in light of total return and the market environment, as well as in consideration of each Fund’s investment style and strategy. As part of this review, the Trustees considered the composition of the peer category, selection criteria and the reputation of the independent provider of investment company data who prepared the peer category analysis. In evaluating the performance of each Fund, the Trustees considered the risk profile for such Fund and such Fund’s demonstrated performance in tracking its benchmark index. The Trustees further considered the level of Fund performance in the context of their review of Fund expenses and the investment adviser’s profitability discussed below and also noted that the Board and a designated committee of the Board review performance throughout the year. Following such evaluation, the Board concluded, within the context of its full deliberations, that the performance of each Fund supported renewal of the Agreement with respect to such Fund.
Fund Expenses. With respect to each Fund’s expenses, the Trustees considered the rate of compensation called for by the Agreement, and each Fund’s operating expense ratio, in each case, in comparison to those of other similar mutual funds, such peer groups and comparisons having been selected and calculated by an independent provider of investment company data. The investment adviser reported to the Board, and the Board took into account, the risk assumed by the investment adviser in the development of the Funds and provision of services as well as the competitive marketplace for financial products. The Trustees also considered fees charged by the investment adviser to ETFs, other mutual funds and to other types of accounts, but, with respect to such other types of accounts, accorded less weight to such comparisons due to the different legal, regulatory, compliance and operating
features of mutual funds as compared to these other types of accounts, and any differences in the nature and scope of the services the investment adviser provides to these other accounts, as well as differences in the market for these types of accounts. Following such evaluation, the Board concluded, within the context of its full deliberations, that the expenses of each Fund are reasonable and supported renewal of the Agreement with respect to such Fund.
Profitability. The Trustees considered the compensation flowing to the investment adviser and its affiliates, directly or indirectly and reviewed profitability on a pre-tax basis, without regard to distribution expenses. The Trustees reviewed the profitability of the investment adviser relating to the Schwab fund complex as a whole, noting the benefits to Fund shareholders of being part of the Schwab fund complex, including the allocations of certain costs across the Funds and other funds in the complex. The Trustees also considered any other benefits derived by the investment adviser from its relationship with the Funds, such as whether, by virtue of its management of the Funds, the investment adviser obtains investment information or other research resources that aid it in providing advisory services to other clients. The Trustees considered whether the compensation and profitability with respect to the Funds under the Agreement and other service agreements were reasonable in light of the quality of all services rendered to the Funds by the investment adviser and its affiliates. The Trustees noted that the investment adviser continues to invest substantial sums in its business in order to provide enhanced research capabilities, services and systems to benefit the Funds. Based on this evaluation, the Board concluded, within the context of its full deliberations, that the profitability of the investment adviser with respect to each Fund is reasonable and supported renewal of the Agreement with respect to such Fund.
Economies of Scale. Although the Trustees recognized the difficulty of determining economies of scale with precision, and although the Funds do not have breakpoints in their advisory fees, the Trustees considered the potential existence of any economies of scale by way of the relatively low advisory fee and unitary fee structure of the Funds and whether those are passed along to a Fund’s shareholders through (i) the enhancement of services provided to the Funds in return for fees paid, including through investments by the investment adviser in its infrastructure, including modernizing the investment adviser’s technology and use of data, increasing expertise and capabilities in key areas (including portfolio and trade operations), and improving business continuity, cybersecurity, due diligence and information security programs, which are designed to provide enhanced services to the Funds and their shareholders; and (ii) pricing a fund to scale and keeping overall expenses down as the fund grows. The Trustees acknowledged that the investment adviser has invested in its infrastructure, as discussed above, over time and that the investment adviser’s internal costs of providing investment management, technology, administrative, legal and
Schwab Fundamental Index Funds | Annual Report107
Schwab Fundamental Index Funds
compliance services to the Funds continue to increase as a result of regulatory or other developments. Based on this evaluation, the Board concluded, within the context of its full deliberations, that each Fund obtains reasonable benefits from economies of scale.
* * * * * * * * * * * * * * * * * * * * * * * * * * * * * * * * * * * * * * * *
In the course of their deliberations, the Trustees may have accorded different weights to various factors and did not identify any particular information or factor that was all
important or controlling. Based on the Trustees’ deliberation and their evaluation of the information described above, the Board, including all of the Independent Trustees, approved the continuation of the Agreement with respect to the Funds and concluded that the compensation under the Agreement with respect to the Funds is fair and reasonable in light of the services provided and the related expenses borne by the investment adviser and its affiliates and such other matters as the Trustees considered to be relevant in the exercise of their reasonable judgment.
108
Schwab Fundamental Index Funds | Annual Report
Schwab Fundamental Index Funds
Trustees and Officers
The tables below give information about the trustees and officers of Schwab Capital Trust, which includes the funds covered in this report. The “Fund Complex” includes The Charles Schwab Family of Funds, Schwab Capital Trust, Schwab Investments, Schwab Annuity Portfolios, Schwab Strategic Trust and Laudus Trust. The Fund Complex includes 106 funds.
The address for all trustees and officers is 211 Main Street, San Francisco, CA 94105. You can find more information about the trustees and officers in the funds’ Statement of Additional Information, which is available free by calling 1-877-824-5615.
|
Name, Year of Birth, and Position(s) with the trust (Terms of office, and length of Time Served1) | Principal Occupations During the Past Five Years | Number of Portfolios in Fund Complex Overseen by the Trustee | |
Michael J. Beer 1961 Trustee (Trustee of The Charles Schwab Family of Funds, Schwab Investments, Schwab Capital Trust, Schwab Annuity Portfolios, Schwab Strategic Trust and Laudus Trust since 2022) | Retired. Director, President and Chief Executive Officer (Dec. 2016 – Sept. 2019), Principal Funds (investment management). | | Director (2016 – 2019), Principal Funds, Inc. |
Robert W. Burns 1959 Trustee (Trustee of Schwab Strategic Trust since 2009; The Charles Schwab Family of Funds, Schwab Investments, Schwab Capital Trust, Schwab Annuity Portfolios and Laudus Trust since 2016) | Retired/Private Investor. | | |
Nancy F. Heller 1956 Trustee (Trustee of The Charles Schwab Family of Funds, Schwab Investments, Schwab Capital Trust, Schwab Annuity Portfolios, Schwab Strategic Trust and Laudus Trust since 2018) | | | |
David L. Mahoney 1954 Trustee (Trustee of The Charles Schwab Family of Funds, Schwab Investments, Schwab Capital Trust, Schwab Annuity Portfolios and Laudus Trust since 2011; Schwab Strategic Trust since 2016) | | | Director (2004 – present), Corcept Therapeutics Incorporated Director (2009 – 2021), Adamas Pharmaceuticals, Inc. Director (2003 – 2019), Symantec Corporation |
Jane P. Moncreiff 1961 Trustee (Trustee of The Charles Schwab Family of Funds, Schwab Investments, Schwab Capital Trust, Schwab Annuity Portfolios, Schwab Strategic Trust and Laudus Trust since 2019) | Consultant (2018 – present), Fulham Advisers LLC (management consulting); Chief Investment Officer (2009 – 2017), CareGroup Healthcare System, Inc. (healthcare). | | |
Schwab Fundamental Index Funds | Annual Report109
Schwab Fundamental Index Funds
Independent Trustees (continued) |
Name, Year of Birth, and Position(s) with the trust (Terms of office, and length of Time Served1) | Principal Occupations During the Past Five Years | Number of Portfolios in Fund Complex Overseen by the Trustee | |
Kimberly S. Patmore 1956 Trustee (Trustee of The Charles Schwab Family of Funds, Schwab Investments, Schwab Capital Trust, Schwab Annuity Portfolios, Schwab Strategic Trust and Laudus Trust since 2016) | Consultant (2008 – present), Patmore Management Consulting (management consulting). | | |
J. Derek Penn 1957 Trustee (Trustee of The Charles Schwab Family of Funds, Schwab Investments, Schwab Capital Trust, Schwab Annuity Portfolios, Schwab Strategic Trust and Laudus Trust since 2021) | Head of Equity Sales and Trading (2006 – 2018), BNY Mellon (financial services). | | |
|
Name, Year of Birth, and Position(s) with the trust (Terms of office, and length of Time Served1) | Principal Occupations During the Past Five Years | Number of Portfolios in Fund Complex Overseen by the Trustee | |
Walter W. Bettinger II2 1960 Chairman and Trustee (Trustee of The Charles Schwab Family of Funds, Schwab Investments, Schwab Capital Trust and Schwab Annuity Portfolios since 2008; Schwab Strategic Trust since 2009; Laudus Trust since 2010) | Co-Chairman of the Board (July 2022 – present), Director and Chief Executive Officer (Oct. 2008 – present) and President (Feb. 2007 – Oct. 2021), The Charles Schwab Corporation; President and Chief Executive Officer (Oct. 2008 – Oct. 2021) and Director (May 2008 – Oct. 2021), Charles Schwab & Co., Inc.; Co-Chairman of the Board (July 2022 – present) and Director (Apr. 2006 – present), Charles Schwab Bank, SSB; Co-Chairman of the Board (July 2022 – present) and Director (Nov. 2017 – present), Charles Schwab Premier Bank, SSB; Co-Chairman of the Board (July 2022 – present) and Director (July 2019 – present), Charles Schwab Trust Bank; Director (May 2008 – present), Chief Executive Officer (Aug. 2017 – present) and President (Aug. 2017 – Nov. 2021), Schwab Holdings, Inc.; Manager (Sept. 2023 – present), TD Ameritrade Holding LLC; Director (Oct. 2020 – Aug. 2023), TD Ameritrade Holding Corporation; Director (July 2016 – Oct. 2021), Charles Schwab Investment Management, Inc. | | Director (2008 – present), The Charles Schwab Corporation |
Richard A. Wurster2 1973 Trustee (Trustee of The Charles Schwab Family of Funds, Schwab Investments, Schwab Capital Trust, Schwab Annuity Portfolios, Schwab Strategic Trust and Laudus Trust since 2022) | President (Oct. 2021 – present) and Executive Vice President – Schwab Asset Management Solutions (Apr. 2019 – Oct. 2021), The Charles Schwab Corporation; President, Director (Oct. 2021 – present), Executive Vice President – Schwab Asset Management Solutions (July 2019 – Oct. 2021) and Senior Vice President – Advisory (May 2016 – July 2019), Charles Schwab & Co., Inc.; President (Nov. 2021 – present), Schwab Holdings, Inc.; Director (Oct. 2021 – present) and Chief Executive Officer (Nov. 2019 – Jan. 2022), Charles Schwab Investment Management, Inc.; Director, Chief Executive Officer and President (Mar. 2018 – Oct. 2022), Charles Schwab Investment Advisory, Inc.; Chief Executive Officer (July 2016 – Apr. 2018) and President (Mar. 2017 – Apr. 2018), ThomasPartners, Inc.; Chief Executive Officer (July 2016 – Apr. 2018), Windhaven Investment Management, Inc. | | |
110
Schwab Fundamental Index Funds | Annual Report
Schwab Fundamental Index Funds
|
Name, Year of Birth, and Position(s) with the trust (Terms of office, and length of Time Served3) | Principal Occupations During the Past Five Years |
Omar Aguilar 1970 Chief Executive Officer, President and Chief Investment Officer (Officer of The Charles Schwab Family of Funds, Schwab Investments, Schwab Capital Trust, Schwab Annuity Portfolios, Schwab Strategic Trust and Laudus Trust since 2011) | Chief Executive Officer (Jan. 2022 – present), President (Oct. 2023 – present), (Chief Investment Officer (Apr. 2011 – present) and Senior Vice President (Apr. 2011 – Jan. 2022), Charles Schwab Investment Management, Inc.; Director, Chief Executive Officer and President (Oct. 2022 – present), Charles Schwab Investment Advisory, Inc.; Chief Executive Officer (Sept. 2023 – present), President (Oct. 2023 – present), Chief Investment Officer (June 2011 – present) and Vice President (June 2011 – Sept. 2023), Schwab Funds, Laudus Trust and Schwab ETFs. |
Mark Fischer 1970 Chief Operating Officer (Officer of The Charles Schwab Family of Funds, Schwab Investments, Schwab Capital Trust, Schwab Annuity Portfolios, Schwab Strategic Trust and Laudus Trust since 2013) | Chief Operating Officer (Dec. 2020 – present) and Treasurer and Chief Financial Officer (Jan. 2016 – Dec. 2022), Schwab Funds, Laudus Trust and Schwab ETFs; Chief Financial Officer (Mar. 2020 – present), Chief Operating Officer (Oct. 2023 – present), Managing Director (Mar. 2023 – present) and Vice President (Oct. 2013 – Mar. 2023), Charles Schwab Investment Management, Inc. |
Dana Smith 1965 Treasurer and Chief Financial Officer (Officer of The Charles Schwab Family of Funds, Schwab Investments, Schwab Capital Trust, Schwab Annuity Portfolios, Schwab Strategic Trust and Laudus Trust since 2023) | Treasurer and Chief Financial Officer (Jan. 2023 – present) and Assistant Treasurer (Dec. 2015 – Dec. 2022), Schwab Funds, Laudus Trust and Schwab ETFs; Managing Director (Mar. 2023 – present), Vice President (Mar. 2022 – Mar. 2023) and Director (Oct. 2015 – Mar. 2022), Charles Schwab Investment Management, Inc.; Managing Director (May 2022 – present) and Vice President (Apr. 2022 – May 2022), Charles Schwab & Co., Inc. |
Patrick Cassidy 1964 Vice President and Chief Investment Officer (Officer of The Charles Schwab Family of Funds, Schwab Investments, Schwab Capital Trust, Schwab Annuity Portfolios, Schwab Strategic Trust and Laudus Trust since 2018) | Chief Investment Officer (Oct. 2023 – present) and Vice President (Feb. 2018 – present), Schwab Funds, Laudus Trust and Schwab ETFs; Managing Director (Mar. 2023 – present), Chief Investment Officer (Oct. 2023 – present), and Senior Vice President (Oct. 2012 – Mar. 2023), Charles Schwab Investment Management, Inc. |
William P. McMahon, Jr. 1972 Vice President and Chief Investment Officer (Officer of The Charles Schwab Family of Funds, Schwab Investments, Schwab Capital Trust, Schwab Annuity Portfolios, Schwab Strategic Trust and Laudus Trust since 2021) | Managing Director (Mar. 2023 – present), Senior Vice President (Jan. 2020 – Mar. 2023) and Chief Investment Officer (Jan. 2020 – present) Charles Schwab Investment Management, Inc.; Vice President and Chief Investment Officer (June 2021 – present), Schwab Funds, Laudus Trust and Schwab ETFs; Senior Vice President and Chief Investment Officer – ThomasPartners Strategies (Apr. 2018 – Dec. 2019), Charles Schwab Investment Advisory, Inc.; Senior Vice President and Chief Investment Officer (May 2001 – Apr. 2018), ThomasPartners, Inc. |
Catherine MacGregor 1964 Chief Legal Officer and Secretary, Schwab Funds and Schwab ETFs Chief Legal Officer, Vice President and Clerk, Laudus Trust (Officer of The Charles Schwab Family of Funds, Schwab Investments, Schwab Capital Trust, Schwab Annuity Portfolios and Laudus Trust since 2005; Schwab Strategic Trust since 2009) | Chief Legal Officer (Mar. 2022 – present), Managing Director (Mar. 2023 – present) and Vice President (Sept. 2005 – Mar. 2023), Charles Schwab Investment Management, Inc.; Managing Director (May 2022 – present) and Vice President (Aug. 2005 – May 2022), Charles Schwab & Co., Inc.; Vice President (Dec. 2005 – present) and Chief Legal Officer and Clerk (Mar. 2007 – present), Laudus Trust; Chief Legal Officer and Secretary (Oct. 2021 – present), Vice President (Nov. 2005 – Oct. 2021) and Assistant Secretary (June 2007 – Oct. 2021), Schwab Funds; Chief Legal Officer and Secretary (Oct. 2021 – present), Vice President and Assistant Secretary (Oct. 2009 – Oct. 2021), Schwab ETFs. |
1
Each Trustee shall hold office until the election and qualification of his or her successor, or until he or she dies, resigns or is removed. The retirement policy requires that each independent trustee retire by December 31 of the year in which the Trustee turns 74 or the Trustee’s twentieth year of service as an independent trustee on any trust in the Fund Complex, whichever occurs first.
2
Mr. Bettinger and Mr. Wurster are Interested Trustees. Mr. Bettinger and Mr. Wurster are Interested Trustees because each owns stock of The Charles Schwab Corporation (CSC), the parent company of Charles Schwab Investment Management, Inc., the investment adviser for the trusts in the Fund Complex, and is an employee of Charles Schwab & Co., Inc. (Schwab), the principal underwriter for The Charles Schwab Family of Funds, Schwab Investments, Schwab Capital Trust, Schwab Annuity Portfolios and Laudus Trust.
3
The President, Treasurer and Secretary/Clerk hold office until their respective successors are chosen and qualified or until he or she sooner dies, resigns, is removed or becomes disqualified. Each of the other officers serves at the pleasure of the Board.
Schwab Fundamental Index Funds | Annual Report111
Schwab Fundamental Index Funds
asset allocation The practice of dividing a portfolio among different asset classes, with each asset class assigned a particular percentage.
asset class A group of securities with similar structure and basic characteristics. Stocks, bonds and cash are the three main examples of asset classes.
Bloomberg US Aggregate Bond Index An index that is a broad-based benchmark measuring the performance of the U.S. investment grade, taxable bond market, including U.S. Treasuries, government-related and corporate bonds, mortgage pass-through securities, commercial mortgage-backed securities, and asset-backed securities that are publicly available for sale in the United States. To be eligible for inclusion in the index, securities must be fixed rate, non-convertible, U.S. dollar-denominated with at least $300 million or more of outstanding face value and have one or more years remaining to maturity. The index excludes certain types of securities, including tax-exempt state and local government series bonds, structured notes embedded with swaps or other special features, private placements, floating rate securities, inflation-linked bonds and Eurobonds. The index is market capitalization weighted and the securities in the index are updated on the last business day of each month.
Bloomberg US Treasury Bills 1–3 Month Index An index that includes all publicly issued zero-coupon U.S. Treasury Bills that have a remaining maturity of less than 3 months but more than 1 month, are rated investment grade and have $300 million or more of outstanding face value. It excludes zero-coupon STRIPS.
bond A security representing a loan from the investor to the issuer. A bond typically pays interest at a fixed rate (the coupon rate) until a specified date (the maturity date), at which time the issuer returns the money borrowed (principal or face value) to the bondholder. Because of their structure, bonds are sometimes called “fixed-income securities” or “debt securities.”
An individual bond is subject to the credit risk of the issuer. Changes in interest rates can affect a bond’s market value prior to call or maturity. There is no guarantee that a bond’s yield to call or maturity will provide a positive return over the rate of inflation.
bond fund A bond fund is subject to the same credit, interest rate, and inflation risks as bonds. In addition, a bond fund incurs ongoing fees and expenses. A bond fund’s net asset value will fluctuate with the price of the underlying bonds and the portfolio turnover activity; return of principal is not guaranteed.
cap, capitalization See “market cap.”
capital gain, capital loss the difference between the amount paid for an investment and its value at a later time. If the investment has been sold, the capital gain or loss is considered a realized gain or loss. If the investment is still held, the capital gain or loss is considered unrealized appreciation or depreciation.
expense ratio The amount that is taken from a mutual fund’s assets each year to cover the fund’s operating expenses. An expense ratio of 0.50% means that a fund’s expenses amount to half of one percent of its average net assets a year.
market cap, market capitalization The value of a company as determined by the total value of all shares of its stock outstanding.
MSCI EAFE Index (Net) A free float-adjusted market capitalization index that is designed to measure the equity market performance of developed markets in Europe, Australasia, and the Far East. The Net version of the index reflects reinvested dividends net of withholding taxes, but reflects no deductions for expenses or other taxes; returns are calculated applying dividend withholding rates applicable to non-resident persons who do not benefit from double taxation treaties.
MSCI Emerging Markets Index (Net) A free float-adjusted market capitalization weighted index that is designed to measure equity market performance in the global emerging markets. This series approximates the minimum possible dividend reinvestment. The returns are calculated applying dividend withholding rates applicable to non-resident persons who do not benefit from double taxation treaties.
net asset value (NAV) The value of one share of a mutual fund. NAV is calculated by taking the fund’s total assets, subtracting liabilities, and dividing by the number of shares outstanding.
outstanding shares, shares outstanding When speaking of a company or mutual fund, indicates all shares currently held by investors.
price-to-book ratio (P/B) The market price of a company’s stock compared with its “book value.” A mutual fund’s P/B is the weighted average of the P/B of all stocks in the fund’s portfolio.
price-to-earnings ratio (P/E) The market price of a company’s stock compared with earnings over the past year. A mutual fund’s P/E is the weighted average of the P/E of all stocks in the fund’s portfolio.
restricted and illiquid securities Restricted securities are securities that are subject to legal restrictions on their sale. Restricted securities generally can be sold in privately negotiated transactions, pursuant to an exemption from registration under the Securities Act of 1933 (the 1933 Act), or in a registered public offering. Certain restricted securities, such as Section 4(a)(2) commercial paper and Rule 144A securities under the 1933 Act, may be considered to be liquid if they meet the criteria for liquidity established by the Board. Illiquid securities generally are any securities that cannot be disposed of promptly and in the ordinary course of business at approximately the amount at which a fund has valued the instruments. The liquidity of a fund’s investments is monitored under the supervision and direction of the Board. Investments currently not considered liquid include repurchase agreements not maturing within seven days and certain restricted securities.
return on equity (ROE) The average yearly rate of return for each dollar of investors’ money, measured over the past five years.
Russell 1000 Growth Index An index that measures the performance of those Russell 1000 Index companies with higher price-to-book ratios and higher forecasted growth values.
Russell 1000 Index An index that measures the performance of the 1,000 largest companies in the Russell 3000 Index, and represents approximately 92% of the total market capitalization of the Russell 3000 Index. The Russell 3000 Index measures the performance of the largest 3,000 U.S. companies representing approximately 98% of the investable U.S. equity market.
Russell 1000 Value Index An index that measures the performance of the large-cap value segment of the U.S. equity universe. It includes those Russell 1000 Index companies with lower price-to-book ratios and lower expected growth values.
112
Schwab Fundamental Index Funds | Annual Report
Schwab Fundamental Index Funds
Russell 2000 Index An index that measures the performance of the 2,000 smallest companies in the Russell 3000 Index. The Russell 3000 Index measures the performance of the largest 3,000 U.S. companies representing approximately 98% of the investable U.S. equity market.
Russell RAFI Developed ex US Large Company Index (Net) An index that ranks developed ex-U.S. companies in the FTSE Global Total Cap Index by fundamental measures of size and tracks the performance of those companies whose fundamental scores are in the top 87.5%. The index uses a partial quarterly reconstitution methodology in which the index is split into four equal segments at the annual reconstitution and each segment is then rebalanced on a rolling quarterly basis. The Net series reduces index performance by adjusting for local taxes. Selecting the developed ex-U.S. companies in the FTSE Global Total Cap Index measures the performance of the largest investable securities in developed countries globally, excluding companies assigned to the United States.
Russell RAFI Developed ex US Small Company Index (Net) An index that ranks developed ex-U.S. companies in the FTSE Global Total Cap Index by fundamental measures of size and tracks the performance of those companies whose fundamental scores rank below the 87.5% threshold. The index uses a partial quarterly reconstitution methodology in which the index is split into four equal segments at the annual reconstitution and each segment is then rebalanced on a rolling quarterly basis. The Net series reduces index performance by adjusting for local taxes. Selecting the developed ex-U.S. companies in the FTSE Global Total Cap Index measures the performance of the smallest investable securities in developed countries globally, excluding companies assigned to the United States.
Russell RAFI Emerging Markets Large Company Index (Net) An index that ranks emerging market companies in the FTSE Global Total Cap Index by measures of fundamental size and tracks the performance of those companies whose fundamental scores are in the top 87.5%. The index uses a partial quarterly reconstitution methodology in which the index is split into four equal segments at the annual reconstitution and each segment is then rebalanced on a rolling quarterly basis. The Net series reduces index performance by adjusting for local taxes. Selecting the emerging companies in the FTSE Global Total Cap Index measures the performance of the investable securities in emerging markets globally.
Russell RAFI US Large Company Index An index that ranks U.S. companies in the FTSE Global Total Cap Index. The Russell RAFI US Large Company Index includes only those securities that are members of the U.S. portion whose fundamental scores are in the top 87.5%. The index uses a partial quarterly reconstitution methodology in which the index is split into four equal segments at the annual reconstitution and each segment is then rebalanced on a rolling quarterly basis.
Russell RAFI US Small Company Index An index that ranks U.S. companies in the FTSE Global Total Cap Index. The Russell RAFI US Small Company Index includes only those securities that are members of the U.S. portion and rank below the 87.5% fundamental score threshold. The index uses a partial quarterly reconstitution methodology in which the index is split into four equal segments at the annual reconstitution and each segment is then rebalanced on a rolling quarterly basis.
S&P 500 Index An index that is designed to measure the performance of 500 leading publicly traded companies from a broad range of industries.
S&P Developed ex-U.S. Small Cap Index (Net) An index composed of the stocks representing the lowest 15% of float-adjusted market cap in each developed market country, excluding the U.S. The returns are calculated applying dividend withholding rates applicable to non-resident persons who do not benefit from double taxation treaties.
stock A share of ownership, or equity, in the issuing company.
total return The percentage that an investor would have earned or lost on an investment in the fund assuming dividends and distributions were reinvested.
weighted average For mutual funds, an average that gives the same weight to each security as the security represents in the fund’s portfolio.
yield The income paid out by an investment, expressed as a percentage of the investment’s market value.
Schwab Fundamental Index Funds | Annual Report113
Schwab Fundamental Index Funds
Schwab Asset Management
With a straightforward lineup of core products and solutions for building the foundation of a portfolio, Schwab Asset Management advocates for investors of all sizes with a steadfast focus on lowering costs and reducing unnecessary complexity. The list below shows all currently available Schwab Funds®.
Investors should carefully consider information contained in the prospectus, or if available, the summary prospectus, including investment objectives, risks, charges and expenses before investing. Please call 1-877-824-5615 for a prospectus for any Schwab Fund. Please read the prospectus carefully before you invest. This report must be preceded or accompanied by a current prospectus.
Proxy Voting Policies, Procedures and Results
A description of the proxy voting policies and procedures used to determine how to vote proxies on behalf of the funds is available without charge, upon request, by visiting the Schwab Funds’ website at www.schwabassetmanagement.com/schwabfunds_prospectus, the SEC’s website at www.sec.gov, or by contacting Schwab Funds at 1-877-824-5615.
Information regarding how a fund voted proxies relating to portfolio securities during the most recent twelve-month period ended June 30 is available, without charge, by visiting the fund’s website at www.schwabassetmanagement.com/schwabfunds_prospectus or the SEC’s website at www.sec.gov.
Schwab Funds
Equity Funds
Schwab Core Equity Fund
Schwab Dividend Equity Fund
Schwab Large-Cap Growth Fund
Schwab Small-Cap Equity Fund
Schwab Health Care Fund
Schwab International Core Equity Fund
Schwab International Opportunities Fund
Schwab Select Large Cap Growth Fund
Schwab Fundamental US Large Company Index Fund
Schwab Fundamental US Small Company Index Fund
Schwab Fundamental International Large Company Index Fund
Schwab Fundamental International Small Company Index Fund
Schwab Fundamental Emerging Markets Large Company Index Fund
Schwab Fundamental Global Real Estate Index Fund
Schwab Global Real Estate Fund
Schwab S&P 500 Index Fund
Schwab 1000 Index® Fund
Schwab Small-Cap Index Fund®
Schwab Total Stock Market Index Fund®
Schwab U.S. Large-Cap Growth Index Fund
Schwab U.S. Large-Cap Value Index Fund
Schwab U.S. Mid-Cap Index Fund
Schwab International Index Fund®
Asset Allocation Funds
Schwab Balanced Fund
Schwab MarketTrack Portfolios®
Schwab Target Funds
Schwab Target Index Funds
Schwab Monthly Income Funds
Bond Funds
Schwab Treasury Inflation Protected Securities Index Fund
Schwab U.S. Aggregate Bond Index Fund
Schwab Short-Term Bond Index Fund
Schwab Tax-Free Bond Fund1
Schwab California Tax-Free Bond Fund1
Schwab Opportunistic Municipal Bond Fund
Schwab Money Funds2
Schwab provides a broad choice of taxable and tax-exempt money market funds for both retail and institutional client types.
Investment Adviser
Charles Schwab Investment Management, Inc., dba Schwab Asset Management
211 Main Street, San Francisco, CA 94105
Funds
Schwab Funds
1-877-824-5615
© 2023 Charles Schwab & Co., Inc. All rights reserved.
Member SIPC®
Printed on recycled paper.
¹
State, local, and the Federal Alternative Minimum Tax may apply. Capital gains are not exempt from Federal Taxation.
²
You could lose money by investing in the Schwab Money Funds. All Schwab Money Funds with the exception of Schwab Variable Share Price Money Fund seek to preserve the value of your investment at $1.00 per share, but cannot guarantee they will do so. Because the share price of Schwab Variable Share Price Money Fund will fluctuate, when you sell your shares they may be worth more or less than what you originally paid for them. All Schwab Money Funds with the exception of Schwab Government Money Fund, Schwab Retirement Government Money Fund, Schwab U.S. Treasury Money Fund, Schwab Treasury Obligations Money Fund and Schwab Government Money Market Portfolio may impose a fee upon the sale of your shares if the Fund’s Board determines that the fee is in the best interests of the Fund. An investment in the Schwab Money Funds is not insured or guaranteed by the Federal Deposit Insurance Corporation or any other government agency. The Schwab Money Funds’ sponsor has no legal obligation to provide financial support to the Funds, and you should not expect that the sponsor will provide financial support to the Funds at any time.
This page is intentionally left blank.
Annual Report | October 31, 2023
Schwab MarketTrack Portfolios®
Schwab MarketTrack
All Equity Portfolio™
Schwab MarketTrack
Growth Portfolio™
Schwab MarketTrack
Balanced Portfolio™
Schwab MarketTrack
Conservative Portfolio™
This page is intentionally left blank.
Schwab MarketTrack Portfolios
Fund investment adviser: Charles Schwab Investment Management, Inc., dba Schwab Asset Management®
Distributor: Charles Schwab & Co., Inc. (Schwab)
Schwab MarketTrack Portfolios | Annual Report1
Schwab MarketTrack Portfolios
The performance data quoted represents past performance. Past performance does not guarantee future results. Investment returns and principal value of an investment will fluctuate so that an investor’s shares may be worth more or less than their original cost. Current performance may be lower or higher than performance data quoted. To obtain performance information current to the most recent month end, please visit www.schwabassetmanagement.com/schwabfunds_prospectus.
Total Return for the 12 Months Ended October 31, 2023 |
Schwab MarketTrack All Equity Portfolio (Ticker Symbol: SWEGX) | |
All Equity Composite Index | |
Fund Category: Morningstar Aggressive Allocation1 | |
| |
| |
Schwab MarketTrack Growth Portfolio (Ticker Symbol: SWHGX) | |
| |
Fund Category: Morningstar Moderately Aggressive Allocation1 | |
| |
| |
Schwab MarketTrack Balanced Portfolio (Ticker Symbol: SWBGX) | |
| |
Fund Category: Morningstar Moderate Allocation1 | |
| |
| |
Schwab MarketTrack Conservative Portfolio (Ticker Symbol: SWCGX) | |
Conservative Composite Index | |
Fund Category: Morningstar Moderately Conservative Allocation1 | |
| |
All total returns on this page assume dividends and distributions were reinvested. Index figures do not include trading and management costs, which would lower performance. Indices are unmanaged and cannot be invested in directly. Performance results less than one year are not annualized.
The components that make up each of the composite indices may vary over time. For index definitions, please see the Glossary.
Fund expenses may have been partially absorbed by the investment adviser and its affiliates. Without these reductions, a fund’s total return would have been lower. Performance does not reflect the deduction of taxes that a shareholder would pay on fund distributions or on the redemption of fund shares.
1
Source for category information: Morningstar, Inc. The Morningstar Category return represents all active and index mutual funds and ETFs within the category as of the report date.
2
Schwab MarketTrack Portfolios | Annual Report
Schwab MarketTrack Portfolios
The Investment Environment
For the 12-month reporting period ended October 31, 2023, U.S. equity markets were mixed, and international equity markets posted positive returns. U.S. stocks were volatile for the first half of the reporting period as inflation remained elevated, the U.S. Federal Reserve (Fed) continued to raise interest rates, and the failure of three U.S. regional banks in early March raised concerns about the stability of the banking sector. Despite these headwinds, as inflation began to ease, U.S. stocks staged a relatively steady upswing through August driven primarily by performance of the “Magnificent Seven” (Alphabet, Inc., Amazon.com, Inc., Apple, Inc., Meta Platforms, Inc., Microsoft Corp., NVIDIA Corp., and Tesla, Inc.). U.S. stocks, particularly dividend paying stocks, began to falter over the final two months of the reporting period as soaring U.S. Treasury yields offered investors attractive alternatives to stocks. Outside the U.S., the ongoing war between Russia and Ukraine and the Israel-Hamas war that broke out following Hamas’ attack on Israel in early October weighed on the global economy. The U.S. dollar, as measured against a basket of international currencies, generally weakened until mid-July, when it hit a reporting-period low, then began to rise but ended the reporting period weaker than where it began. For the reporting period, the S&P 500® Index, a bellwether for the overall U.S. stock market, returned 10.14%. U.S. large-cap stocks outperformed U.S. small-cap stocks, with the Russell 1000® Index and the Russell 2000® Index returning 9.48% and -8.56%, respectively. Among U.S. large-cap stocks, growth stocks outperformed value stocks, with the Russell 1000® Growth Index and the Russell 1000® Value Index returning 18.95% and 0.13%, respectively. Outside the U.S., the MSCI EAFE® Index (Net)*, a broad measure of developed international equity performance, returned 14.40% and the MSCI Emerging Markets Index (Net)* returned 10.80%. U.S. and international bonds were relatively weak as economic uncertainty and rising interest rates over much of the period drove yields up and bond prices down. (Bond yields and bond prices typically move in opposite directions.) The Bloomberg US Aggregate Bond Index returned 0.36% and the FTSE non–US Dollar World Government Bond Index returned 1.32%.
Economies around the world grew out of sync as they wrestled with record levels of government debt, rising geopolitical tensions, and weak productivity gains that stifled economic growth. The U.S. economy continued to show unexpected resiliency. Surprisingly robust job growth and strong consumer spending helped propel U.S. gross domestic product (GDP) to a 5.2% annualized growth rate for the third quarter of 2023, up from roughly 2% over the prior three quarters. Inflation remained above the Fed’s historical 2% target over the reporting period but declined
Asset Class Performance Comparison % returns during the 12 months ended October 31, 2023
Index figures assume dividends and distributions were reinvested. Index figures do not include trading and management costs, which would lower performance. Indices are unmanaged and cannot be invested in directly. Performance results less than one year are not annualized. Past performance is not a guarantee of future results.
For index definitions, please see the Glossary.
Data source: Index provider websites and Schwab Asset Management.
Nothing in this report represents a recommendation of a security by the investment adviser.
Management views may have changed since the report date.
*
The net version of the index reflects reinvested dividends net of withholding taxes but reflects no deductions for expenses or other taxes.
Schwab MarketTrack Portfolios | Annual Report3
Schwab MarketTrack Portfolios
The Investment Environment (continued)
between November 2022 and June 2023 as rents and wage growth eased, profit margins declined, and monetary policy remained restrictive before ticking up slightly in July 2023 through September 2023. The unemployment rate remained low throughout the period despite inflationary pressures but did rise slightly in August and October. An increase in the labor force participation rate (the proportion of working-age Americans who have a job or are looking for one) in August and strike activity in October were large contributors to the increase in unemployment in the last three months of the reporting period.
Oil prices were volatile, ranging from a high of $92 per barrel at the beginning of the reporting period to a low of $66 and ending the period at just over $80 per barrel. Eurozone GDP growth contracted slightly in the fourth quarter of 2022 driven by manufacturing pressures and headwinds related to oil and commodity prices, was flat for the first quarter of 2023, expanded slightly for the second quarter of 2023 bolstered by a moderation in inflationary pressures, and contracted slightly for the third quarter of 2023 as financing conditions remained tight. The United Kingdom posted small gains in GDP growth throughout the reporting period, with household consumption expenditures and manufacturing output among key growth drivers. In Japan, following flat GDP growth in the fourth quarter of 2022, GDP rose for the first two quarters of 2023, primarily on rising exports and falling imports. Among emerging markets, China’s GDP grew throughout the reporting period as the government’s various policies seeking to help the economy have offset the impact of a prolonged property crisis and weak trade. India’s GDP grew in the fourth quarter of 2022 and the first two quarters of 2023, driven primarily by robust performance of the services sector along with strong consumer demand and increased government spending.
In its efforts to lower inflation, the Fed raised interest rates six times during the reporting period, increasing the federal funds rate from a range of 3.00% to 3.25% to a range of 5.25% to 5.50%. At its meetings in June, September, and October, the Fed maintained the then current rates, citing robust economic activity, strong—though moderating—job gains, and low unemployment while acknowledging tighter financial and credit conditions for households and businesses. The Fed also maintained its program to reduce the assets held on its balance sheet, though its balance sheet temporarily spiked in March 2023 when the Fed supported banks after the failure of three U.S. regional banks. Despite the spike, balance sheet assets declined over the reporting period. Central banks outside the United States also battled with persistently high, albeit waning, inflation. After raising rates eight times during the reporting period, the European Central Bank held its rate steady at its October meeting as inflation and pricing pressures finally showed signs of easing. Similarly, the Bank of England maintained its key official bank rate at its September meeting, after seven rate hikes during the reporting period, leaving borrowing costs at a 15-year high. In contrast, the Bank of Japan continued to uphold its short-term interest rate target of -0.1%, unchanged since 2016, despite inflationary pressures but relaxed its yield control policy. Monetary policies in emerging markets were mixed. Central banks in India, Indonesia, Mexico, Pakistan, and Russia all raised their rates two or more times over the reporting period. In contrast, both Brazil and China cut their key interest rate twice during the reporting period.
Among bond markets, shorter-term bonds generally outperformed longer-term bonds, and bond markets generally weakened over the second half of the reporting period. There were a few short-lived market-moving events over the reporting period. The failure of three U.S. regional banks in early March raised concerns about the stability of the banking sector. In addition, debt ceiling negotiations during the second quarter of 2023 created fear that the federal government could default on its obligations and on August 1, 2023, Fitch Ratings downgraded long-term U.S. debt from AAA to AA+ after indicating earlier in the year that a country refusing to pay its debts in a timely way was not entitled to a AAA rating. The U.S. Treasury increased auctions of U.S. Treasury securities over the reporting period and higher borrowing costs as a result of rising interest rates contributed to growth in the U.S. budget deficit. U.S. Treasury yields were volatile over the first half of the reporting period but rose sharply over the second half. The yield on the 10-year U.S. Treasury rose from 4.10% to 4.88% over the reporting period, briefly touching 5% in October—a level not seen since 2007. The yield on the three-month U.S. Treasury climbed from 4.22% to 5.59%, resulting in the yield curve inverting for a large portion of the reporting period. Outside the U.S., bond yields generally followed a similar trajectory.
4
Schwab MarketTrack Portfolios | Annual Report
Schwab MarketTrack Portfolios
| Zifan Tang, Ph.D., CFA, Senior Portfolio Manager for Schwab Asset Management, is responsible for the co-management of the funds. Prior to joining Schwab in 2012, Ms. Tang was a product manager at Thomson Reuters and from 1997 to 2009 worked as a portfolio manager at Barclays Global Investors (now known as BlackRock). |
| Drew Hayes, CFA, Portfolio Manager for Schwab Asset Management, is responsible for the co-management of the funds. Mr. Hayes has been with Schwab since 2006. Before becoming a portfolio manager, he spent seven years as a senior fixed income specialist for Schwab Wealth Advisory, Inc. Prior to that, he worked as a bond investment specialist for two years and as a registered representative for two years for Charles Schwab & Co., Inc. |
| Patrick Kwok, CFA, Portfolio Manager for Schwab Asset Management, is responsible for the co-management of the funds. Previously, Mr. Kwok served as an associate portfolio manager from 2012 to 2016. Prior to that, he worked as a fund administration manager, where he was responsible for oversight of sub-advisers, trading, cash management, and fund administration supporting the Charles Schwab Trust Bank Collective Investment Trusts and multi-asset Schwab Funds. Prior to joining Schwab Asset Management in 2008, Mr. Kwok spent two years as an asset operations specialist at Charles Schwab Trust Company. He also worked for one year at State Street Bank & Trust as a portfolio accountant and pricing specialist. |
Schwab MarketTrack Portfolios | Annual Report5
Schwab MarketTrack All Equity Portfolio as of October 31, 2023
The Schwab MarketTrack All Equity Portfolio (the fund) seeks high capital growth through an all-stock portfolio. To pursue its goal, the fund maintains a defined asset allocation. The fund’s target allocation is 100% in stock investments, with certain percentages for different segments of the stock market. For the 12-month reporting period ended October 31, 2023, the fund remained close to the target allocations of 50% in U.S. large-cap, 30% in international, and 15% in U.S. small cap-stocks. The fund invests mainly in other affiliated Schwab Funds, including index funds and exchange-traded funds (ETFs), which seek to track or replicate the total returns of various market indices. For more information concerning the fund’s investment objective, strategies, and risks, please see the fund’s prospectus.
Market Highlights. For the 12-month reporting period ended October 31, 2023, U.S. equity markets were mixed, and international equity markets posted positive returns. U.S. stocks were volatile for the first half of the reporting period as inflation remained elevated, the U.S. Federal Reserve (Fed) continued to raise interest rates, and the failure of three U.S. regional banks in early March raised concerns about the stability of the banking sector. Despite these headwinds, as inflation began to ease, U.S. stocks staged a relatively steady upswing through August driven primarily by performance of the “Magnificent Seven” (Alphabet, Inc., Amazon.com, Inc., Apple, Inc., Meta Platforms, Inc., Microsoft Corp., NVIDIA Corp., and Tesla, Inc.). U.S. stocks, particularly dividend paying stocks, began to falter over the final two months of the reporting period as soaring U.S. Treasury yields offered investors attractive alternatives to stocks. Outside the U.S., the ongoing war between Russia and Ukraine and the Israel-Hamas war that broke out following Hamas’ attack on Israel in early October weighed on the global economy. U.S. large-cap stocks outperformed U.S. small-cap stocks and among U.S. large-cap stocks, growth stocks outperformed value stocks. U.S. and international bonds were relatively weak as economic uncertainty and rising interest rates over much of the period drove yields up and bond prices down. (Bond yields and bond prices typically move in opposite directions.) The U.S. dollar, as measured against a basket of international currencies, generally weakened until mid-July, when it hit a reporting-period low, then began to rise but ended the reporting period weaker than where it began.
Performance. For the 12-month reporting period ended October 31, 2023, the fund returned 7.32%. The fund’s custom blended comparative index, the All Equity Composite Index (the composite index), returned 7.67%.
Positioning and Strategies. Over the reporting period, the fund’s asset allocations were broadly in line with those of the composite index.
The fund’s international equity allocations contributed the most to the total return of the fund. The Schwab International Index Fund, Schwab Fundamental International Large Company Index Fund, Schwab Fundamental Emerging Markets Large Company Index Fund, and Schwab Fundamental International Small Company Index Fund contributed to the total return of the fund, returning approximately 15%, 17%, 15%, and 12%, respectively, for the reporting period.
The fund’s U.S. equity allocations also contributed to the total return of the fund. The Schwab S&P 500 Index Fund was the largest contributor to the total return of the fund—largely due to the Schwab S&P 500 Index Fund’s large position within the fund—returning approximately 10% for the reporting period. The Schwab U.S. Large-Cap Growth Index Fund and Schwab Fundamental US Large Company Index Fund also contributed to the total return of the fund, returning approximately 19% and 4%, respectively, for the reporting period. The Schwab Small-Cap Index Fund was the largest detractor from the total return of the fund, returning approximately -8% for the reporting period. The Schwab Fundamental US Small Company Index Fund also detracted from the total return of the fund, returning approximately -3% for the reporting period.
The fund’s real estate allocation, the Schwab U.S. REIT ETF, detracted from the total return of the fund, returning approximately -8% for the reporting period.
Management views and portfolio holdings may have changed since the report date.
6
Schwab MarketTrack Portfolios | Annual Report
Schwab MarketTrack All Equity Portfolio
Performance and Fund Facts as of October 31, 2023
The performance data quoted represents past performance. Past performance does not guarantee future results. Investment returns and principal value of an investment will fluctuate so that an investor’s shares may be worth more or less than their original cost. Current performance may be lower or higher than performance data quoted. To obtain performance information current to the most recent month end, please visit www.schwabassetmanagement.com/schwabfunds_prospectus.
Performance of Hypothetical $10,000 Investment (October 31, 2013 – October 31, 2023)1
Average Annual Total Returns1
| | | |
Fund: Schwab MarketTrack All Equity Portfolio (5/19/98) | | | |
| | | |
All Equity Composite Index | | | |
Fund Category: Morningstar Aggressive Allocation2 | | | |
Fund Expense Ratio3: 0.51% |
All total returns on this page assume dividends and distributions were reinvested. Index figures do not include trading and management costs, which would lower performance. Indices are unmanaged and cannot be invested in directly. Performance results less than one year are not annualized.
For index definitions, please see the Glossary.
1
Fund expenses may have been partially absorbed by the investment adviser and its affiliates. Without these reductions, the fund’s returns would have been lower. These returns do not reflect the deduction of taxes that a shareholder would pay on fund distributions or the redemption of fund shares.
2
Source for category information: Morningstar, Inc. The Morningstar Category return represents all active and index mutual funds and ETFs within the category as of the report date.
3
As stated in the prospectus. Includes 0.12% of acquired fund fees and expenses (AFFE), which are indirect expenses incurred by the fund through its investments in the underlying funds. Reflects the total annual fund operating expenses without contractual fee waivers. For actual expense ratios during the period, not including AFFE, refer to the financial highlights section of the financial statements.
Schwab MarketTrack Portfolios | Annual Report7
Schwab MarketTrack All Equity Portfolio
Performance and Fund Facts as of October 31, 2023 (continued)
Asset Class Weightings % of Investments1
Top Holdings % of Net Assets2
Portfolio holdings may have changed since the report date.
Small-company stocks are subject to greater volatility than many other asset classes.
International investments are subject to additional risks such as currency fluctuation, geopolitical risk and the potential for illiquid markets.
1
The percentage may differ from the Portfolio Holdings because the above calculation is based on a percentage of total investments, whereas the calculation in the Portfolio Holdings is based on a percentage of net assets.
2
This list is not a recommendation of any security by the investment adviser.
8
Schwab MarketTrack Portfolios | Annual Report
Schwab MarketTrack Growth Portfolio as of October 31, 2023
The Schwab MarketTrack Growth Portfolio (the fund) seeks high capital growth with less volatility than an all-stock portfolio. To pursue its goal, the fund maintains a defined asset allocation. The fund’s target allocation includes stock, bond, and cash investments. For the 12-month reporting period ended October 31, 2023, the fund remained close to the target allocations of 80% equity, 16% fixed income, and 4% cash and cash equivalents (including money market funds). The fund invests mainly in other affiliated Schwab Funds, including index funds and exchange-traded funds (ETFs), which seek to track or replicate the total returns of various market indices. For more information concerning the fund’s investment objective, strategies, and risks, please see the fund’s prospectus.
Market Highlights. For the 12-month reporting period ended October 31, 2023, U.S. equity markets were mixed, and international equity markets posted positive returns. U.S. stocks were volatile for the first half of the reporting period as inflation remained elevated, the U.S. Federal Reserve (Fed) continued to raise interest rates, and the failure of three U.S. regional banks in early March raised concerns about the stability of the banking sector. Despite these headwinds, as inflation began to ease, U.S. stocks staged a relatively steady upswing through August driven primarily by performance of the “Magnificent Seven” (Alphabet, Inc., Amazon.com, Inc., Apple, Inc., Meta Platforms, Inc., Microsoft Corp., NVIDIA Corp., and Tesla, Inc.). U.S. stocks, particularly dividend paying stocks, began to falter over the final two months of the reporting period as soaring U.S. Treasury yields offered investors attractive alternatives to stocks. Outside the U.S., the ongoing war between Russia and Ukraine and the Israel-Hamas war that broke out following Hamas’ attack on Israel in early October weighed on the global economy. U.S. large-cap stocks outperformed U.S. small-cap stocks and among U.S. large-cap stocks, growth stocks outperformed value stocks. U.S. and international bonds were relatively weak as economic uncertainty and rising interest rates over much of the period drove yields up and bond prices down. (Bond yields and bond prices typically move in opposite directions.) The U.S. dollar, as measured against a basket of international currencies, generally weakened until mid-July, when it hit a reporting-period low, then began to rise but ended the reporting period weaker than where it began.
Performance. For the 12-month reporting period ended October 31, 2023, the fund returned 5.68%. The fund’s custom blended comparative index, the Growth Composite Index (the composite index), returned 6.04%.
Positioning and Strategies. Over the reporting period, the fund’s asset allocations were broadly in line with those of the composite index.
The fund’s U.S. equity allocations contributed the most to the total return of the fund. The Schwab S&P 500 Index Fund was the largest contributor to the total return of the fund—largely due to the Schwab S&P 500 Index Fund’s large position within the fund—returning approximately 10% for the reporting period. The Schwab U.S. Large-Cap Growth Index Fund and Schwab Fundamental US Large Company Index Fund also contributed to the total return of the fund, returning approximately 19% and 4%, respectively, for the reporting period. The Schwab Small-Cap Index Fund was the largest detractor from the total return of the fund, returning approximately -8% for the reporting period. The Schwab Fundamental US Small Company Index Fund also detracted from the total return of the fund, returning approximately -3% for the reporting period.
The fund’s international equity allocations also contributed to the total return of the fund. The Schwab International Index Fund, Schwab Fundamental International Large Company Index Fund, Schwab Fundamental Emerging Markets Large Company Index Fund, and Schwab Fundamental International Small Company Index Fund contributed to the total return of the fund, returning approximately 15%, 17%, 15%, and 12%, respectively, for the reporting period.
The fund’s real estate allocation, the Schwab U.S. REIT ETF, detracted from the total return of the fund, returning approximately -8% for the reporting period.
The fund’s fixed-income allocation, the Schwab U.S. Aggregate Bond Index Fund, also detracted from the total return of the fund, returning less than 1% for the reporting period.
Management views and portfolio holdings may have changed since the report date.
Schwab MarketTrack Portfolios | Annual Report9
Schwab MarketTrack Growth Portfolio
Performance and Fund Facts as of October 31, 2023
The performance data quoted represents past performance. Past performance does not guarantee future results. Investment returns and principal value of an investment will fluctuate so that an investor’s shares may be worth more or less than their original cost. Current performance may be lower or higher than performance data quoted. To obtain performance information current to the most recent month end, please visit www.schwabassetmanagement.com/schwabfunds_prospectus.
Performance of Hypothetical $10,000 Investment (October 31, 2013 – October 31, 2023)1
Average Annual Total Returns1
| | | |
Fund: Schwab MarketTrack Growth Portfolio (11/20/95) | | | |
| | | |
Bloomberg US Aggregate Bond Index | | | |
| | | |
Fund Category: Morningstar Moderately Aggressive Allocation2 | | | |
Fund Expense Ratio3: 0.50% |
All total returns on this page assume dividends and distributions were reinvested. Index figures do not include trading and management costs, which would lower performance. Indices are unmanaged and cannot be invested in directly. Performance results less than one year are not annualized.
For index definitions, please see the Glossary.
1
Fund expenses may have been partially absorbed by the investment adviser and its affiliates. Without these reductions, the fund’s returns would have been lower. These returns do not reflect the deduction of taxes that a shareholder would pay on fund distributions or the redemption of fund shares.
2
Source for category information: Morningstar, Inc. The Morningstar Category return represents all active and index mutual funds and ETFs within the category as of the report date.
3
As stated in the prospectus. Includes 0.11% of acquired fund fees and expenses (AFFE), which are indirect expenses incurred by the fund through its investments in the underlying funds. Reflects the total annual fund operating expenses without contractual fee waivers. For actual expense ratios during the period, not including AFFE, refer to the financial highlights section of the financial statements.
10
Schwab MarketTrack Portfolios | Annual Report
Schwab MarketTrack Growth Portfolio
Performance and Fund Facts as of October 31, 2023 (continued)
Asset Class Weightings % of Investments1
Top Holdings % of Net Assets2
Portfolio holdings may have changed since the report date.
Small-company stocks are subject to greater volatility than many other asset classes.
International investments are subject to additional risks such as currency fluctuation, geopolitical risk and the potential for illiquid markets.
1
The percentage may differ from the Portfolio Holdings because the above calculation is based on a percentage of total investments, whereas the calculation in the Portfolio Holdings is based on a percentage of net assets.
2
This list is not a recommendation of any security by the investment adviser.
Schwab MarketTrack Portfolios | Annual Report11
Schwab MarketTrack Balanced Portfolio as of October 31, 2023
The Schwab MarketTrack Balanced Portfolio (the fund) seeks both capital growth and income. To pursue its goal, the fund maintains a defined asset allocation. The fund’s target allocation includes bond, stock and cash investments. For the 12-month reporting period ended October 31, 2023, the fund remained close to the target allocations of 60% equity, 36% fixed income, and 4% cash and cash equivalents (including money market funds). The fund invests mainly in other affiliated Schwab Funds, including index funds and exchange-traded funds (ETFs), which seek to track or replicate the total returns of various market indices. For more information concerning the fund’s investment objective, strategies, and risks, please see the fund’s prospectus.
Market Highlights. For the 12-month reporting period ended October 31, 2023, U.S. equity markets were mixed, and international equity markets posted positive returns. U.S. stocks were volatile for the first half of the reporting period as inflation remained elevated, the U.S. Federal Reserve (Fed) continued to raise interest rates, and the failure of three U.S. regional banks in early March raised concerns about the stability of the banking sector. Despite these headwinds, as inflation began to ease, U.S. stocks staged a relatively steady upswing through August driven primarily by performance of the “Magnificent Seven” (Alphabet, Inc., Amazon.com, Inc., Apple, Inc., Meta Platforms, Inc., Microsoft Corp., NVIDIA Corp., and Tesla, Inc.). U.S. stocks, particularly dividend paying stocks, began to falter over the final two months of the reporting period as soaring U.S. Treasury yields offered investors attractive alternatives to stocks. Outside the U.S., the ongoing war between Russia and Ukraine and the Israel-Hamas war that broke out following Hamas’ attack on Israel in early October weighed on the global economy. U.S. large-cap stocks outperformed U.S. small-cap stocks and among U.S. large-cap stocks, growth stocks outperformed value stocks. U.S. and international bonds were relatively weak as economic uncertainty and rising interest rates over much of the period drove yields up and bond prices down. (Bond yields and bond prices typically move in opposite directions.) The U.S. dollar, as measured against a basket of international currencies, generally weakened until mid-July, when it hit a reporting-period low, then began to rise but ended the reporting period weaker than where it began.
Performance. For the 12-month reporting period ended October 31, 2023, the fund returned 4.47%. The fund’s custom blended comparative index, the Balanced Composite Index (the composite index), returned 4.87%.
Positioning and Strategies. Over the reporting period, the fund’s asset allocations were broadly in line with those of the composite index.
The fund’s U.S. equity allocations contributed the most to the total return of the fund. The Schwab S&P 500 Index Fund was the largest contributor to the total return of the fund returning approximately 10% for the reporting period. The Schwab U.S. Large-Cap Growth Index Fund and Schwab Fundamental US Large Company Index Fund also contributed to the total return of the fund, returning approximately 19% and 4%, respectively, for the reporting period. The Schwab Small-Cap Index Fund was the largest detractor from the total return of the fund, returning approximately -8% for the reporting period. The Schwab Fundamental US Small Company Index Fund also detracted from the total return of the fund, returning approximately -3% for the reporting period.
The fund’s international equity allocations also contributed to the total return of the fund. The Schwab International Index Fund, Schwab Fundamental International Large Company Index Fund, Schwab Fundamental Emerging Markets Large Company Index Fund, and Schwab Fundamental International Small Company Index Fund contributed to the total return of the fund, returning approximately 15%, 17%, 15%, and 12%, respectively, for the reporting period.
The fund’s fixed-income allocations also contributed to the total return of the fund. The Schwab Short-Term Bond Index Fund contributed to the total return of the fund, returning approximately 3% for the reporting period. The Schwab U.S. Aggregate Bond Index Fund detracted from the total return of the fund, returning less than 1% for the reporting period.
The fund’s real estate allocation, the Schwab U.S. REIT ETF, detracted from the total return of the fund, returning approximately -8% for the reporting period.
Management views and portfolio holdings may have changed since the report date.
12
Schwab MarketTrack Portfolios | Annual Report
Schwab MarketTrack Balanced Portfolio
Performance and Fund Facts as of October 31, 2023
The performance data quoted represents past performance. Past performance does not guarantee future results. Investment returns and principal value of an investment will fluctuate so that an investor’s shares may be worth more or less than their original cost. Current performance may be lower or higher than performance data quoted. To obtain performance information current to the most recent month end, please visit www.schwabassetmanagement.com/schwabfunds_prospectus.
Performance of Hypothetical $10,000 Investment (October 31, 2013 – October 31, 2023)1
Average Annual Total Returns1
| | | |
Fund: Schwab MarketTrack Balanced Portfolio (11/20/95) | | | |
| | | |
Bloomberg US Aggregate Bond Index | | | |
| | | |
Fund Category: Morningstar Moderate Allocation2 | | | |
Fund Expense Ratio3: 0.49% |
All total returns on this page assume dividends and distributions were reinvested. Index figures do not include trading and management costs, which would lower performance. Indices are unmanaged and cannot be invested in directly. Performance results less than one year are not annualized.
For index definitions, please see the Glossary.
1
Fund expenses may have been partially absorbed by the investment adviser and its affiliates. Without these reductions, the fund’s returns would have been lower. These returns do not reflect the deduction of taxes that a shareholder would pay on fund distributions or the redemption of fund shares.
2
Source for category information: Morningstar, Inc. The Morningstar Category return represents all active and index mutual funds and ETFs within the category as of the report date.
3
As stated in the prospectus. Includes 0.09% of acquired fund fees and expenses (AFFE), which are indirect expenses incurred by the fund through its investments in the underlying funds. Reflects the total annual fund operating expenses without contractual fee waivers. For actual expense ratios during the period, not including AFFE, refer to the financial highlights section of the financial statements.
Schwab MarketTrack Portfolios | Annual Report13
Schwab MarketTrack Balanced Portfolio
Performance and Fund Facts as of October 31, 2023 (continued)
Asset Class Weightings % of Investments1
Top Holdings % of Net Assets2
Portfolio holdings may have changed since the report date.
Small-company stocks are subject to greater volatility than many other asset classes.
International investments are subject to additional risks such as currency fluctuation, geopolitical risk and the potential for illiquid markets.
1
The percentage may differ from the Portfolio Holdings because the above calculation is based on a percentage of total investments, whereas the calculation in the Portfolio Holdings is based on a percentage of net assets.
2
This list is not a recommendation of any security by the investment adviser.
14
Schwab MarketTrack Portfolios | Annual Report
Schwab MarketTrack Conservative Portfolio as of October 31, 2023
The Schwab MarketTrack Conservative Portfolio (the fund) seeks income and more growth potential than an all-bond portfolio. To pursue its goal, the fund maintains a defined asset allocation. The fund’s target allocation includes bond, stock and cash investments. For the 12-month reporting period ended October 31, 2023, the fund remained close to the target allocations of 56% fixed income, 40% equity, and 4% cash and cash equivalents (including money market funds). The fund invests mainly in other affiliated Schwab Funds, including index funds and exchange-traded funds (ETFs), which seek to track or replicate the total returns of various market indices. For more information concerning the fund’s investment objective, strategies, and risks, please see the fund’s prospectus.
Market Highlights. For the 12-month reporting period ended October 31, 2023, U.S. equity markets were mixed, and international equity markets posted positive returns. U.S. stocks were volatile for the first half of the reporting period as inflation remained elevated, the U.S. Federal Reserve (Fed) continued to raise interest rates, and the failure of three U.S. regional banks in early March raised concerns about the stability of the banking sector. Despite these headwinds, as inflation began to ease, U.S. stocks staged a relatively steady upswing through August driven primarily by performance of the “Magnificent Seven” (Alphabet, Inc., Amazon.com, Inc., Apple, Inc., Meta Platforms, Inc., Microsoft Corp., NVIDIA Corp., and Tesla, Inc.). U.S. stocks, particularly dividend paying stocks, began to falter over the final two months of the reporting period as soaring U.S. Treasury yields offered investors attractive alternatives to stocks. Outside the U.S., the ongoing war between Russia and Ukraine and the Israel-Hamas war that broke out following Hamas’ attack on Israel in early October weighed on the global economy. U.S. large-cap stocks outperformed U.S. small-cap stocks and among U.S. large-cap stocks, growth stocks outperformed value stocks. U.S. and international bonds were relatively weak as economic uncertainty and rising interest rates over much of the period drove yields up and bond prices down. (Bond yields and bond prices typically move in opposite directions.) The U.S. dollar, as measured against a basket of international currencies, generally weakened until mid-July, when it hit a reporting-period low, then began to rise but ended the reporting period weaker than where it began.
Performance. For the 12-month reporting period ended October 31, 2023, the fund returned 3.01%. The fund’s custom blended comparative index, the Conservative Composite Index (the composite index), returned 3.46%.
Positioning and Strategies. Over the reporting period, the fund’s asset allocations were broadly in line with those of the composite index.
The fund’s U.S. equity allocations contributed the most to the total return of the fund. The Schwab S&P 500 Index Fund was the largest contributor to the total return of the fund returning approximately 10% for the reporting period. The Schwab U.S. Large-Cap Growth Index Fund and Schwab Fundamental US Large Company Index Fund also contributed to the total return of the fund, returning approximately 19% and 4%, respectively, for the reporting period. The Schwab Small-Cap Index Fund was the largest detractor from the total return of the fund, returning approximately -8% for the reporting period. The Schwab Fundamental US Small Company Index Fund also detracted from the total return of the fund, returning approximately -3% for the reporting period.
The fund’s international equity allocations also contributed to the total return of the fund. The Schwab Fundamental International Large Company Index Fund, Schwab Fundamental Emerging Markets Large Company Index Fund, and Schwab Fundamental International Small Company Index Fund contributed to the total return of the fund, returning approximately 17%, 15%, and 12%, respectively, for the reporting period.
The fund’s fixed-income allocations also contributed to the total return of the fund. The Schwab Short-Term Bond Index Fund and Schwab U.S. Aggregate Bond Index Fund contributed to the total return of the fund, returning approximately 3% and less than 1%, respectively, for the reporting period.
The fund’s real estate allocation, the Schwab U.S. REIT ETF, detracted from the total return of the fund, returning approximately -8% for the reporting period.
Management views and portfolio holdings may have changed since the report date.
Schwab MarketTrack Portfolios | Annual Report15
Schwab MarketTrack Conservative Portfolio
Performance and Fund Facts as of October 31, 2023
The performance data quoted represents past performance. Past performance does not guarantee future results. Investment returns and principal value of an investment will fluctuate so that an investor’s shares may be worth more or less than their original cost. Current performance may be lower or higher than performance data quoted. To obtain performance information current to the most recent month end, please visit www.schwabassetmanagement.com/schwabfunds_prospectus.
Performance of Hypothetical $10,000 Investment (October 31, 2013 – October 31, 2023)1
Average Annual Total Returns1
| | | |
Fund: Schwab MarketTrack Conservative Portfolio (11/20/95) | | | |
| | | |
Bloomberg US Aggregate Bond Index | | | |
Conservative Composite Index | | | |
Fund Category: Morningstar Moderately Conservative Allocation2 | | | |
Fund Expense Ratio3: 0.50% |
All total returns on this page assume dividends and distributions were reinvested. Index figures do not include trading and management costs, which would lower performance. Indices are unmanaged and cannot be invested in directly. Performance results less than one year are not annualized.
For index definitions, please see the Glossary.
1
Fund expenses may have been partially absorbed by the investment adviser and its affiliates. Without these reductions, the fund’s returns would have been lower. These returns do not reflect the deduction of taxes that a shareholder would pay on fund distributions or the redemption of fund shares.
2
Source for category information: Morningstar, Inc. The Morningstar Category return represents all active and index mutual funds and ETFs within the category as of the report date.
3
As stated in the prospectus. Includes 0.08% of acquired fund fees and expenses (AFFE), which are indirect expenses incurred by the fund through its investments in the underlying funds. Reflects the total annual fund operating expenses without contractual fee waivers. For actual expense ratios during the period, not including AFFE, refer to the financial highlights section of the financial statements.
16
Schwab MarketTrack Portfolios | Annual Report
Schwab MarketTrack Conservative Portfolio
Performance and Fund Facts as of October 31, 2023 (continued)
Asset Class Weightings % of Investments1
Top Holdings % of Net Assets2
Portfolio holdings may have changed since the report date.
Small-company stocks are subject to greater volatility than many other asset classes.
International investments are subject to additional risks such as currency fluctuation, geopolitical risk and the potential for illiquid markets.
1
The percentage may differ from the Portfolio Holdings because the above calculation is based on a percentage of total investments, whereas the calculation in the Portfolio Holdings is based on a percentage of net assets.
2
This list is not a recommendation of any security by the investment adviser.
Schwab MarketTrack Portfolios | Annual Report17
Schwab MarketTrack Portfolios
Fund Expenses (Unaudited)
Examples for a $1,000 Investment
As a fund shareholder, you may incur two types of costs: (1) transaction costs; and (2) ongoing costs, including management fees, transfer agent and shareholder services fees, and other fund expenses.
The expense examples below are intended to help you understand your ongoing cost (in dollars) of investing in a fund and to compare this cost with the ongoing cost of investing in other mutual funds. These examples are based on an investment of $1,000 invested for six months beginning May 1, 2023 and held through October 31, 2023.
Actual Return lines in the table below provide information about actual account values and actual expenses. You may use this information, together with the amount you invested, to estimate the expenses that you paid over the period. To do so, simply divide your account value by $1,000 (for example, an $8,600 account value ÷ $1,000 = 8.6), then multiply the result by the number given for your fund under the heading entitled “Expenses Paid During Period.”
Hypothetical Return lines in the table below provide information about hypothetical account values and hypothetical expenses based on a fund’s actual expense ratio and an assumed return of 5% per year before expenses. Because the return used is not an actual return, it may not be used to estimate the actual ending account value or expenses you paid for the period.
You may use this information to compare the ongoing costs of investing in a fund and other funds. To do so, compare this 5% hypothetical example with the 5% hypothetical examples that appear in the shareholder reports of the other funds.
Please note that the expenses shown in the table are meant to highlight your ongoing costs only and do not reflect any transactional costs. Therefore, the hypothetical return lines of the table are useful in comparing ongoing costs only and will not help you determine the relative total costs of owning different funds. In addition, if these transactional costs were included, your costs would have been higher.
| | | BEGINNING
ACCOUNT VALUE
AT 5/1/23 | ENDING
ACCOUNT VALUE
(NET OF EXPENSES)
AT 10/31/23 | EXPENSES PAID
DURING PERIOD
| EFFECTIVE
EXPENSES PAID
DURING PERIOD
|
Schwab MarketTrack All Equity Portfolio | | | | | | |
| | | | | | |
| | | | | | |
Schwab MarketTrack Growth Portfolio | | | | | | |
| | | | | | |
| | | | | | |
Schwab MarketTrack Balanced Portfolio | | | | | | |
| | | | | | |
| | | | | | |
Schwab MarketTrack Conservative Portfolio | | | | | | |
| | | | | | |
| | | | | | |
| Based on the most recent six-month expense ratio. |
| Excludes acquired fund fees and expenses, which are indirect expenses incurred by the fund through its investments in underlying funds. |
| Based on the most recent six-month acquired fund fees and expenses and the expense ratio; may differ from the acquired fund fees and expenses and the expense ratio in the prospectus. |
| Includes acquired fund fees and expenses, which are indirect expenses incurred by the fund through its investments in underlying funds. |
| Expenses for each fund are equal to its annualized expense ratio, multiplied by the average account value over the period, multiplied by the 184 days in the period, and divided by the 365 days in the fiscal year. |
18
Schwab MarketTrack Portfolios | Annual Report
Schwab MarketTrack All Equity Portfolio
Financial Statements
| | | | | | |
|
Net asset value at beginning of period | | | | | | |
Income (loss) from investment operations: | | | | | | |
Net investment income (loss)1 | | | | | | |
Net realized and unrealized gains (losses) | | | | | | |
Total from investment operations | | | | | | |
| | | | | | |
Distributions from net investment income | | | | | | |
Distributions from net realized gains | | | | | | |
| | | | | | |
Net asset value at end of period | | | | | | |
| | | | | | |
|
Ratios to average net assets: | | | | | | |
| | | | | | |
Gross operating expenses2 | | | | | | |
Net investment income (loss) | | | | | | |
| | | | | | |
Net assets, end of period (x 1,000) | | | | | | |
| Calculated based on the average shares outstanding during the period. |
| Ratio excludes acquired fund fees and expenses, which are indirect expenses incurred by the fund through its investments in underlying funds. |
| Ratio includes less than 0.005% of non-routine proxy expenses. |
Schwab MarketTrack Portfolios | Annual Report19
Schwab MarketTrack All Equity Portfolio
Portfolio Holdings as of October 31, 2023
This section shows all the securities in the fund’s portfolio and their values as of the report date, including a summary of the fund’s transactions with its affiliated underlying funds during the period.
The fund files its complete schedule of portfolio holdings with the U.S. Securities and Exchange Commission (SEC) for the first and third quarters of each fiscal year on Form N-PORT Part F. The fund’s Form N-PORT Part F is available on the SEC’s website at www.sec.gov. You can also obtain this information at no cost on the fund’s website at www.schwabassetmanagement.com/schwabfunds_prospectus, by calling 1-866-414-6349, or by sending an email request to orders@mysummaryprospectus.com. The fund also makes available its complete schedule of portfolio holdings 15 to 20 days after the end of the month on the fund’s website.
| | | | | NET CHANGE IN UNREALIZED APPRECIATION (DEPRECIATION) | | BALANCE OF SHARES HELD AT 10/31/23 | |
AFFILIATED UNDERLYING FUNDS 99.5% OF NET ASSETS |
|
|
|
Schwab Fundamental US Large Company Index Fund | | | | | | | | |
Schwab S&P 500 Index Fund | | | | | | | | |
Schwab U.S. Large-Cap Growth Index Fund | | | | | | | | |
| | | | | | | | |
|
Schwab Fundamental US Small Company Index Fund | | | | | | | | |
Schwab Small-Cap Index Fund | | | | | | | | |
| | | | | | | | |
| | | | | | | | |
|
International Stocks 29.8% |
|
Schwab Fundamental International Large Company Index Fund | | | | | | | | |
Schwab Fundamental International Small Company Index Fund | | | | | | | | |
Schwab International Index Fund | | | | | | | | |
| | | | | | | | |
|
Schwab Fundamental Emerging Markets Large Company Index Fund | | | | | | | | |
| | | | | | | | |
|
|
|
| | | | | | | | |
Total Affiliated Underlying Funds
(Cost $445,191,626) | | | | | | | | |
Total Investments in Securities
(Cost $445,191,626) | | | | | | | | |
| Distributions received include distributions from net investment income and capital gains, if any, from the underlying funds. Amounts shown are only presented for affiliated underlying funds, which are presented in the corresponding line-item in the Statement of Operations, if applicable (see financial note 2(d) for additional information). |
| |
| Real Estate Investment Trust |
At October 31, 2023, all of the fund’s investment securities were classified as Level 1 (see financial note 2(a) for additional
information).
20
Schwab MarketTrack Portfolios | Annual Report
Schwab MarketTrack All Equity Portfolio
Statement of Assets and Liabilities
As of October 31, 2023
|
Investments in securities, at value - affiliated (cost $445,191,626) | | |
| | |
| | |
| | |
| | |
| | |
| | |
|
|
| | |
| | |
| | |
| | |
Investment adviser and administrator fees | | |
| | |
| | |
| | |
|
|
Capital received from investors | | |
Total distributable earnings | | |
| | |
Schwab MarketTrack Portfolios | Annual Report21
Schwab MarketTrack All Equity Portfolio
Statement of Operations
For the period November 1, 2022 through October 31, 2023 |
|
Dividends received from securities - affiliated | | |
Interest received from securities - unaffiliated | | |
| | |
|
|
| | |
Investment adviser and administrator fees | | |
| | |
| | |
Portfolio accounting fees | | |
| | |
Independent trustees’ fees | | |
| | |
| | |
| | |
| | |
| | |
| | |
| | |
|
REALIZED AND UNREALIZED GAINS (LOSSES) |
Realized capital gain distributions received from underlying funds - affiliated | | |
Net realized gains on sales of securities - affiliated | | |
| | |
Net change in unrealized appreciation (depreciation) on securities - affiliated | | |
Net realized and unrealized gains | | |
Increase in net assets resulting from operations | | |
22
Schwab MarketTrack Portfolios | Annual Report
Schwab MarketTrack All Equity Portfolio
Statement of Changes in Net Assets
For the current and prior report periods
|
| | |
| | | |
| | | |
Net change in unrealized appreciation (depreciation) | | | |
Increase (decrease) in net assets resulting from operations | | | |
|
DISTRIBUTIONS TO SHAREHOLDERS |
| | | |
TRANSACTIONS IN FUND SHARES |
| | |
| | | | | |
| | | | | |
| | | | | |
| | | | | |
Net transactions in fund shares | | | | | |
|
SHARES OUTSTANDING AND NET ASSETS |
| | |
| | | | | |
| | | | | |
Total increase (decrease) | | | | | |
| | | | | |
Schwab MarketTrack Portfolios | Annual Report23
Schwab MarketTrack Growth Portfolio
Financial Statements
| | | | | | |
|
Net asset value at beginning of period | | | | | | |
Income (loss) from investment operations: | | | | | | |
Net investment income (loss)1 | | | | | | |
Net realized and unrealized gains (losses) | | | | | | |
Total from investment operations | | | | | | |
| | | | | | |
Distributions from net investment income | | | | | | |
Distributions from net realized gains | | | | | | |
| | | | | | |
Net asset value at end of period | | | | | | |
| | | | | | |
|
Ratios to average net assets: | | | | | | |
| | | | | | |
Gross operating expenses2 | | | | | | |
Net investment income (loss) | | | | | | |
| | | | | | |
Net assets, end of period (x 1,000) | | | | | | |
| Calculated based on the average shares outstanding during the period. |
| Ratio excludes acquired fund fees and expenses, which are indirect expenses incurred by the fund through its investments in underlying funds. |
| Ratio includes less than 0.005% of non-routine proxy expenses. |
24
Schwab MarketTrack Portfolios | Annual Report
Schwab MarketTrack Growth Portfolio
Portfolio Holdings as of October 31, 2023
This section shows all the securities in the fund’s portfolio and their values as of the report date, including a summary of the fund’s transactions with its affiliated underlying funds during the period.
The fund files its complete schedule of portfolio holdings with the U.S. Securities and Exchange Commission (SEC) for the first and third quarters of each fiscal year on Form N-PORT Part F. The fund’s Form N-PORT Part F is available on the SEC’s website at www.sec.gov. You can also obtain this information at no cost on the fund’s website at www.schwabassetmanagement.com/schwabfunds_prospectus, by calling 1-866-414-6349, or by sending an email request to orders@mysummaryprospectus.com. The fund also makes available its complete schedule of portfolio holdings 15 to 20 days after the end of the month on the fund’s website.
| | | | | NET CHANGE IN UNREALIZED APPRECIATION (DEPRECIATION) | | BALANCE OF SHARES HELD AT 10/31/23 | |
AFFILIATED UNDERLYING FUNDS 99.8% OF NET ASSETS |
|
|
|
Schwab Fundamental US Large Company Index Fund | | | | | | | | |
Schwab S&P 500 Index Fund | | | | | | | | |
Schwab U.S. Large-Cap Growth Index Fund | | | | | | | | |
| | | | | | | | |
|
Schwab Fundamental US Small Company Index Fund | | | | | | | | |
Schwab Small-Cap Index Fund | | | | | | | | |
| | | | | | | | |
| | | | | | | | |
|
International Stocks 20.0% |
|
Schwab Fundamental International Large Company Index Fund | | | | | | | | |
Schwab Fundamental International Small Company Index Fund | | | | | | | | |
Schwab International Index Fund | | | | | | | | |
| | | | | | | | |
|
Schwab Fundamental Emerging Markets Large Company Index Fund | | | | | | | | |
| | | | | | | | |
|
|
|
| | | | | | | | |
|
|
Intermediate-Term Bond 16.0% |
Schwab U.S. Aggregate Bond Index Fund | | | | | | | | |
|
|
Schwab Variable Share Price Money Fund, | | | | | | | | |
Total Affiliated Underlying Funds
(Cost $532,506,459) | | | | | | | | |
Total Investments in Securities
(Cost $532,506,459) | | | | | | | | |
Schwab MarketTrack Portfolios | Annual Report25
Schwab MarketTrack Growth Portfolio
Portfolio Holdings as of October 31, 2023 (continued)
| Distributions received include distributions from net investment income and capital gains, if any, from the underlying funds. Amounts shown are only presented for affiliated underlying funds, which are presented in the corresponding line-item in the Statement of Operations, if applicable (see financial note 2(d) for additional information). |
| The rate shown is the annualized 7-day yield. |
| |
| Real Estate Investment Trust |
At October 31, 2023, all of the fund’s investment securities were classified as Level 1 (see financial note 2(a) for additional
information).
26
Schwab MarketTrack Portfolios | Annual Report
Schwab MarketTrack Growth Portfolio
Statement of Assets and Liabilities
As of October 31, 2023
|
Investments in securities, at value - affiliated (cost $532,506,459) | | |
| | |
| | |
| | |
| | |
| | |
| | |
| | |
|
|
| | |
| | |
| | |
| | |
Investment adviser and administrator fees | | |
| | |
| | |
| | |
|
|
Capital received from investors | | |
Total distributable earnings | | |
| | |
Schwab MarketTrack Portfolios | Annual Report27
Schwab MarketTrack Growth Portfolio
Statement of Operations
For the period November 1, 2022 through October 31, 2023 |
|
Dividends received from securities - affiliated | | |
Interest received from securities - unaffiliated | | |
| | |
|
|
| | |
Investment adviser and administrator fees | | |
| | |
| | |
Portfolio accounting fees | | |
| | |
Independent trustees’ fees | | |
| | |
| | |
| | |
| | |
| | |
| | |
| | |
| | |
|
REALIZED AND UNREALIZED GAINS (LOSSES) |
Realized capital gain distributions received from underlying funds - affiliated | | |
Net realized gains on sales of securities - affiliated | | |
| | |
Net change in unrealized appreciation (depreciation) on securities - affiliated | | |
Net realized and unrealized gains | | |
Increase in net assets resulting from operations | | |
| Proxy fees are non-routine expenses (see financial note 4 for additional information). |
28
Schwab MarketTrack Portfolios | Annual Report
Schwab MarketTrack Growth Portfolio
Statement of Changes in Net Assets
For the current and prior report periods
|
| | |
| | | |
| | | |
Net change in unrealized appreciation (depreciation) | | | |
Increase (decrease) in net assets resulting from operations | | | |
|
DISTRIBUTIONS TO SHAREHOLDERS |
| | | |
TRANSACTIONS IN FUND SHARES |
| | |
| | | | | |
| | | | | |
| | | | | |
| | | | | |
Net transactions in fund shares | | | | | |
|
SHARES OUTSTANDING AND NET ASSETS |
| | |
| | | | | |
| | | | | |
Total increase (decrease) | | | | | |
| | | | | |
Schwab MarketTrack Portfolios | Annual Report29
Schwab MarketTrack Balanced Portfolio
Financial Statements
| | | | | | |
|
Net asset value at beginning of period | | | | | | |
Income (loss) from investment operations: | | | | | | |
Net investment income (loss)1 | | | | | | |
Net realized and unrealized gains (losses) | | | | | | |
Total from investment operations | | | | | | |
| | | | | | |
Distributions from net investment income | | | | | | |
Distributions from net realized gains | | | | | | |
| | | | | | |
Net asset value at end of period | | | | | | |
| | | | | | |
|
Ratios to average net assets: | | | | | | |
| | | | | | |
Gross operating expenses2 | | | | | | |
Net investment income (loss) | | | | | | |
| | | | | | |
Net assets, end of period (x 1,000) | | | | | | |
| Calculated based on the average shares outstanding during the period. |
| Ratio excludes acquired fund fees and expenses, which are indirect expenses incurred by the fund through its investments in underlying funds. |
| Ratio includes less than 0.005% of non-routine proxy expenses. |
30
Schwab MarketTrack Portfolios | Annual Report
Schwab MarketTrack Balanced Portfolio
Portfolio Holdings as of October 31, 2023
This section shows all the securities in the fund’s portfolio and their values as of the report date, including a summary of the fund’s transactions with its affiliated underlying funds during the period.
The fund files its complete schedule of portfolio holdings with the U.S. Securities and Exchange Commission (SEC) for the first and third quarters of each fiscal year on Form N-PORT Part F. The fund’s Form N-PORT Part F is available on the SEC’s website at www.sec.gov. You can also obtain this information at no cost on the fund’s website at www.schwabassetmanagement.com/schwabfunds_prospectus, by calling 1-866-414-6349, or by sending an email request to orders@mysummaryprospectus.com. The fund also makes available its complete schedule of portfolio holdings 15 to 20 days after the end of the month on the fund’s website.
| | | | | NET CHANGE IN UNREALIZED APPRECIATION (DEPRECIATION) | | BALANCE OF SHARES HELD AT 10/31/23 | |
AFFILIATED UNDERLYING FUNDS 99.6% OF NET ASSETS |
|
|
|
Schwab Fundamental US Large Company Index Fund | | | | | | | | |
Schwab S&P 500 Index Fund | | | | | | | | |
Schwab U.S. Large-Cap Growth Index Fund | | | | | | | | |
| | | | | | | | |
|
Schwab Fundamental US Small Company Index Fund | | | | | | | | |
Schwab Small-Cap Index Fund | | | | | | | | |
| | | | | | | | |
| | | | | | | | |
|
International Stocks 15.0% |
|
Schwab Fundamental International Large Company Index Fund | | | | | | | | |
Schwab Fundamental International Small Company Index Fund | | | | | | | | |
Schwab International Index Fund | | | | | | | | |
| | | | | | | | |
|
Schwab Fundamental Emerging Markets Large Company Index Fund | | | | | | | | |
| | | | | | | | |
|
|
|
| | | | | | | | |
|
|
Intermediate-Term Bond 35.0% |
Schwab U.S. Aggregate Bond Index Fund | | | | | | | | |
|
Schwab Short-Term Bond Index Fund | | | | | | | | |
| | | | | | | | |
|
Schwab MarketTrack Portfolios | Annual Report31
Schwab MarketTrack Balanced Portfolio
Portfolio Holdings as of October 31, 2023 (continued)
| | | | | NET CHANGE IN UNREALIZED APPRECIATION (DEPRECIATION) | | BALANCE OF SHARES HELD AT 10/31/23 | |
|
Schwab Variable Share Price Money Fund, | | | | | | | | |
Total Affiliated Underlying Funds
(Cost $400,731,792) | | | | | | | | |
Total Investments in Securities
(Cost $400,731,792) | | | | | | | | |
| Distributions received include distributions from net investment income and capital gains, if any, from the underlying funds. Amounts shown are only presented for affiliated underlying funds, which are presented in the corresponding line-item in the Statement of Operations, if applicable (see financial note 2(d) for additional information). |
| The rate shown is the annualized 7-day yield. |
| |
| Real Estate Investment Trust |
At October 31, 2023, all of the fund’s investment securities were classified as Level 1 (see financial note 2(a) for additional
information).
32
Schwab MarketTrack Portfolios | Annual Report
Schwab MarketTrack Balanced Portfolio
Statement of Assets and Liabilities
As of October 31, 2023
|
Investments in securities, at value - affiliated (cost $400,731,792) | | |
| | |
| | |
| | |
| | |
| | |
| | |
| | |
|
|
| | |
| | |
| | |
| | |
Investment adviser and administrator fees | | |
| | |
| | |
| | |
|
|
Capital received from investors | | |
Total distributable earnings | | |
| | |
Schwab MarketTrack Portfolios | Annual Report33
Schwab MarketTrack Balanced Portfolio
Statement of Operations
For the period November 1, 2022 through October 31, 2023 |
|
Dividends received from securities - affiliated | | |
Interest received from securities - unaffiliated | | |
| | |
|
|
| | |
Investment adviser and administrator fees | | |
| | |
| | |
Portfolio accounting fees | | |
| | |
Independent trustees’ fees | | |
| | |
| | |
| | |
| | |
| | |
| | |
| | |
|
REALIZED AND UNREALIZED GAINS (LOSSES) |
Realized capital gain distributions received from underlying funds - affiliated | | |
Net realized gains on sales of securities - affiliated | | |
| | |
Net change in unrealized appreciation (depreciation) on securities - affiliated | | |
Net realized and unrealized gains | | |
Increase in net assets resulting from operations | | |
34
Schwab MarketTrack Portfolios | Annual Report
Schwab MarketTrack Balanced Portfolio
Statement of Changes in Net Assets
For the current and prior report periods
|
| | |
| | | |
| | | |
Net change in unrealized appreciation (depreciation) | | | |
Increase (decrease) in net assets resulting from operations | | | |
|
DISTRIBUTIONS TO SHAREHOLDERS |
| | | |
TRANSACTIONS IN FUND SHARES |
| | |
| | | | | |
| | | | | |
| | | | | |
| | | | | |
Net transactions in fund shares | | | | | |
|
SHARES OUTSTANDING AND NET ASSETS |
| | |
| | | | | |
| | | | | |
Total increase (decrease) | | | | | |
| | | | | |
Schwab MarketTrack Portfolios | Annual Report35
Schwab MarketTrack Conservative Portfolio
Financial Statements
| | | | | | |
|
Net asset value at beginning of period | | | | | | |
Income (loss) from investment operations: | | | | | | |
Net investment income (loss)1 | | | | | | |
Net realized and unrealized gains (losses) | | | | | | |
Total from investment operations | | | | | | |
| | | | | | |
Distributions from net investment income | | | | | | |
Distributions from net realized gains | | | | | | |
| | | | | | |
Net asset value at end of period | | | | | | |
| | | | | | |
|
Ratios to average net assets: | | | | | | |
| | | | | | |
Gross operating expenses2 | | | | | | |
Net investment income (loss) | | | | | | |
| | | | | | |
Net assets, end of period (x 1,000) | | | | | | |
| Calculated based on the average shares outstanding during the period. |
| Ratio excludes acquired fund fees and expenses, which are indirect expenses incurred by the fund through its investments in underlying funds. |
| Ratio includes less than 0.005% of non-routine proxy expenses. |
36
Schwab MarketTrack Portfolios | Annual Report
Schwab MarketTrack Conservative Portfolio
Portfolio Holdings as of October 31, 2023
This section shows all the securities in the fund’s portfolio and their values as of the report date, including a summary of the fund’s transactions with its affiliated underlying funds during the period.
The fund files its complete schedule of portfolio holdings with the U.S. Securities and Exchange Commission (SEC) for the first and third quarters of each fiscal year on Form N-PORT Part F. The fund’s Form N-PORT Part F is available on the SEC’s website at www.sec.gov. You can also obtain this information at no cost on the fund’s website at www.schwabassetmanagement.com/schwabfunds_prospectus, by calling 1-866-414-6349, or by sending an email request to orders@mysummaryprospectus.com. The fund also makes available its complete schedule of portfolio holdings 15 to 20 days after the end of the month on the fund’s website.
| | | | | NET CHANGE IN UNREALIZED APPRECIATION (DEPRECIATION) | | BALANCE OF SHARES HELD AT 10/31/23 | |
AFFILIATED UNDERLYING FUNDS 99.9% OF NET ASSETS |
|
|
|
Schwab Fundamental US Large Company Index Fund | | | | | | | | |
Schwab S&P 500 Index Fund | | | | | | | | |
Schwab U.S. Large-Cap Growth Index Fund | | | | | | | | |
| | | | | | | | |
|
Schwab Fundamental US Small Company Index Fund | | | | | | | | |
Schwab Small-Cap Index Fund | | | | | | | | |
| | | | | | | | |
| | | | | | | | |
|
International Stocks 10.0% |
|
Schwab Fundamental International Large Company Index Fund | | | | | | | | |
Schwab Fundamental International Small Company Index Fund | | | | | | | | |
Schwab International Index Fund | | | | | | | | |
| | | | | | | | |
|
Schwab Fundamental Emerging Markets Large Company Index Fund | | | | | | | | |
| | | | | | | | |
|
|
|
| | | | | | | | |
|
|
Intermediate-Term Bond 55.0% |
Schwab U.S. Aggregate Bond Index Fund | | | | | | | | |
|
Schwab Short-Term Bond Index Fund | | | | | | | | |
| | | | | | | | |
|
Schwab MarketTrack Portfolios | Annual Report37
Schwab MarketTrack Conservative Portfolio
Portfolio Holdings as of October 31, 2023 (continued)
| | | | | NET CHANGE IN UNREALIZED APPRECIATION (DEPRECIATION) | | BALANCE OF SHARES HELD AT 10/31/23 | |
|
Schwab Variable Share Price Money Fund, | | | | | | | | |
Total Affiliated Underlying Funds
(Cost $174,078,029) | | | | | | | | |
Total Investments in Securities
(Cost $174,078,029) | | | | | | | | |
| Distributions received include distributions from net investment income and capital gains, if any, from the underlying funds. Amounts shown are only presented for affiliated underlying funds, which are presented in the corresponding line-item in the Statement of Operations, if applicable (see financial note 2(d) for additional information). |
| The rate shown is the annualized 7-day yield. |
| |
| Real Estate Investment Trust |
At October 31, 2023, all of the fund’s investment securities were classified as Level 1 (see financial note 2(a) for additional
information).
38
Schwab MarketTrack Portfolios | Annual Report
Schwab MarketTrack Conservative Portfolio
Statement of Assets and Liabilities
As of October 31, 2023
|
Investments in securities, at value - affiliated (cost $174,078,029) | | |
| | |
| | |
| | |
| | |
| | |
| | |
| | |
|
|
| | |
| | |
| | |
| | |
Investment adviser and administrator fees | | |
| | |
| | |
| | |
|
|
Capital received from investors | | |
Total distributable earnings | | |
| | |
Schwab MarketTrack Portfolios | Annual Report39
Schwab MarketTrack Conservative Portfolio
Statement of Operations
For the period November 1, 2022 through October 31, 2023 |
|
Dividends received from securities - affiliated | | |
Interest received from securities - unaffiliated | | |
| | |
|
|
| | |
Investment adviser and administrator fees | | |
| | |
| | |
Portfolio accounting fees | | |
| | |
Independent trustees’ fees | | |
| | |
| | |
| | |
| | |
| | |
| | |
| | |
|
REALIZED AND UNREALIZED GAINS (LOSSES) |
Realized capital gain distributions received from underlying funds - affiliated | | |
Net realized gains on sales of securities - affiliated | | |
| | |
Net change in unrealized appreciation (depreciation) on securities - affiliated | | |
Net realized and unrealized gains | | |
Increase in net assets resulting from operations | | |
40
Schwab MarketTrack Portfolios | Annual Report
Schwab MarketTrack Conservative Portfolio
Statement of Changes in Net Assets
For the current and prior report periods
|
| | |
| | | |
| | | |
Net change in unrealized appreciation (depreciation) | | | |
Increase (decrease) in net assets resulting from operations | | | |
|
DISTRIBUTIONS TO SHAREHOLDERS |
| | | |
TRANSACTIONS IN FUND SHARES |
| | |
| | | | | |
| | | | | |
| | | | | |
| | | | | |
Net transactions in fund shares | | | | | |
|
SHARES OUTSTANDING AND NET ASSETS |
| | |
| | | | | |
| | | | | |
| | | | | |
| | | | | |
Schwab MarketTrack Portfolios | Annual Report41
Schwab MarketTrack Portfolios
1. Business Structure of the Funds:
Schwab MarketTrack All Equity Portfolio, Schwab MarketTrack Growth Portfolio, Schwab MarketTrack Balanced Portfolio, and Schwab MarketTrack Conservative Portfolio (the funds) are each a series of Schwab Capital Trust (the trust), a no-load, open-end management investment company. The trust is organized as a Massachusetts business trust and is registered under the Investment Company Act of 1940, as amended (the 1940 Act). The list below shows all the funds in the trust as of the end of the period, including the funds discussed in this report, which are highlighted:
|
Schwab MarketTrack All Equity Portfolio | |
Schwab MarketTrack Growth Portfolio | |
Schwab MarketTrack Balanced Portfolio | |
Schwab MarketTrack Conservative Portfolio | |
Schwab S&P 500 Index Fund | |
Schwab Small-Cap Index Fund® | Schwab Fundamental US Large Company Index Fund |
Schwab Total Stock Market Index Fund® | Schwab Fundamental US Small Company Index Fund |
Schwab U.S. Large-Cap Growth Index Fund | Schwab Fundamental International Large Company Index Fund |
Schwab U.S. Large-Cap Value Index Fund | Schwab Fundamental International Small Company Index Fund |
Schwab U.S. Mid-Cap Index Fund | Schwab Fundamental Emerging Markets Large Company Index Fund |
Schwab International Index Fund® | Schwab Fundamental Global Real Estate Index Fund |
Schwab International Opportunities Fund | Schwab Target 2010 Index Fund |
| Schwab Target 2015 Index Fund |
| Schwab Target 2020 Index Fund |
Schwab Dividend Equity Fund | Schwab Target 2025 Index Fund |
Schwab Large-Cap Growth Fund | Schwab Target 2030 Index Fund |
Schwab Small-Cap Equity Fund | Schwab Target 2035 Index Fund |
| Schwab Target 2040 Index Fund |
Schwab International Core Equity Fund | Schwab Target 2045 Index Fund |
| Schwab Target 2050 Index Fund |
| Schwab Target 2055 Index Fund |
| Schwab Target 2060 Index Fund |
| Schwab Target 2065 Index Fund |
| Schwab Monthly Income Fund - Target Payout |
| Schwab Monthly Income Fund - Flexible Payout |
| Schwab Monthly Income Fund - Income Payout |
Each of the Schwab MarketTrack Portfolios is considered a “fund of funds” because it invests in other mutual funds or exchange-traded funds (ETFs). Each of the funds seeks to achieve its investment objective by investing mainly in a combination of other affiliated Schwab Funds, including Schwab index funds and ETFs (underlying funds), which use a variety of indexing strategies, in accordance with its target portfolio allocation.
Each fund in this report offers one share class. Shares are bought and sold at closing net asset value per share (NAV), which is the price for all outstanding shares of a fund. Each share has a par value of 1/1,000 of a cent, and the funds’ Board of Trustees (the Board) may authorize the issuance of as many shares as necessary.
Each fund maintains its own account for purposes of holding assets and accounting, and is considered a separate entity for tax purposes. Within its account, each fund may also keep certain assets in segregated accounts, as required by securities law. The "Fund Complex" includes The Charles Schwab Family of Funds, Schwab Capital Trust, Schwab Investments, Schwab Annuity Portfolios, Schwab Strategic Trust and Laudus Trust.
2. Significant Accounting Policies:The following is a summary of the significant accounting policies the funds use in their preparation of financial statements. The funds follow the investment company accounting and reporting guidance of the Financial Accounting Standards Board (FASB) Accounting Standard Codification Topic 946 Financial Services — Investment Companies. The accounting policies are in conformity with accounting principles generally accepted in the United States of America (GAAP).
The financial statements of the funds should be read in conjunction with the underlying funds’ financial statements. For more information about the underlying funds’ operations and policies, please refer to those funds’ semiannual and annual reports, which are filed with the U.S. Securities and Exchange Commission (SEC) and are available on the SEC’s website at www.sec.gov.
42
Schwab MarketTrack Portfolios | Annual Report
Schwab MarketTrack Portfolios
Financial Notes (continued)
2. Significant Accounting Policies (continued):
(a) Security Valuation:
Pursuant to Rule 2a-5 under the 1940 Act, the Board has designated authority to a Valuation Designee, the funds’ investment adviser, to make fair valuation determinations under adopted procedures, subject to Board oversight. The investment adviser has formed a Pricing Committee to administer the pricing and valuation of portfolio securities and other assets and liabilities as well as to ensure that prices used for internal purposes or provided by third parties reasonably reflect fair value. The Valuation Designee may utilize independent pricing services, quotations from securities and financial instrument dealers and other market sources to determine fair value.
Securities held in the funds’ portfolio are valued every business day. The following valuation policies and procedures are used by the Valuation Designee to value various types of securities:
• Securities traded on an exchange or over-the-counter: Traded securities are valued at the closing value for the day, or, on days when no closing value has been reported, at the mean of the most recent bid and ask quotes.
• Mutual funds: Mutual funds are valued at their respective NAVs.
• Securities for which no quoted value is available: The Valuation Designee has adopted procedures to fair value a fund’s securities when market prices are not “readily available” or are unreliable. For example, a security may be fair valued when it’s de-listed or its trading is halted or suspended; when a security’s primary pricing source is unable or unwilling to provide a price; or when a security’s primary trading market is closed during regular market hours. Fair value determinations are made in good faith in accordance with adopted valuation procedures. The Valuation Designee considers a number of factors, including unobservable market inputs, when arriving at fair value. The Valuation Designee may employ methods such as the review of related or comparable assets or liabilities, related market activities, recent transactions, market multiples, book values, transactional back-testing, disposition analysis and other relevant information. Due to the subjective and variable nature of fair value pricing, there can be no assurance that a fund could obtain the fair value assigned to the security upon the sale of such security.
In accordance with the authoritative guidance on fair value measurements and disclosures under GAAP, the funds disclose the fair value of their investments in a hierarchy that prioritizes the significant inputs to valuation methods used to measure the fair value. The hierarchy gives the highest priority to valuations based upon unadjusted quoted prices in active markets for identical assets or liabilities (Level 1 measurements) and the lowest priority to valuations based upon unobservable inputs that are significant to the valuation (Level 3 measurements). If inputs used to measure the financial instruments fall within different levels of the hierarchy, the categorization is based on the lowest level input that is significant to the valuation. If it is determined that either the volume and/or level of activity for an asset or liability has significantly decreased (from normal conditions for that asset or liability) or price quotations or observable inputs are not associated with orderly transactions, increased analysis and the Valuation Designee’s judgment will be required to estimate fair value.
The three levels of the fair value hierarchy are as follows:
• Level 1 — quoted prices in active markets for identical investments — Investments whose values are based on quoted market prices in active markets. These generally include active listed equities, mutual funds, ETFs and futures contracts. Mutual funds and ETFs are classified as Level 1 prices, without consideration to the classification level of the underlying securities held which could be Level 1, Level 2 or Level 3 in the fair value hierarchy.
• Level 2 — other significant observable inputs (including quoted prices for similar securities, interest rates, prepayment speeds, credit risk, etc.) — Investments that trade in markets that are not considered to be active, but whose values are based on quoted market prices, dealer quotations or valuations provided by alternative pricing sources supported by observable inputs are classified as Level 2 prices. These generally include U.S. government and sovereign obligations, most government agency securities, investment-grade corporate bonds, certain mortgage products, less liquid listed equities, and state, municipal and provincial obligations.
• Level 3 — significant unobservable inputs (including the Valuation Designee’s assumptions in determining the fair value of investments) — Investments whose values are classified as Level 3 prices have significant unobservable inputs, as they may trade infrequently or not at all. When observable prices are not readily available for these securities, one or more valuation methods are used for which sufficient and reliable data is available. The inputs used in estimating the value of Level 3 prices may include the original transaction price, quoted prices for similar securities or assets in active markets, completed or pending third-party transactions in the underlying investment or comparable issuers, and changes in financial ratios or cash
Schwab MarketTrack Portfolios | Annual Report43
Schwab MarketTrack Portfolios
Financial Notes (continued)
2. Significant Accounting Policies (continued):
flows. Level 3 prices may also be adjusted to reflect illiquidity and/or non-transferability, with the amount of such discount estimated in the absence of market information. Assumptions used due to the lack of observable inputs may significantly impact the resulting fair value and therefore a fund’s results of operations.
The inputs or methodology used for valuing securities are not necessarily an indication of the risk associated with investing in those securities.
The levels associated with valuing the funds’ investments as of October 31, 2023, are disclosed in each fund’s Portfolio Holdings.
(b) Accounting Policies for certain Portfolio Investments (if held):
Cash Investments: The funds may invest a portion of their assets in cash. Cash includes cash bank balances in an interest-bearing demand deposit account with maturity on demand by the funds.
(c) Security Transactions:
Security transactions are recorded as of the date the order to buy or sell the security is executed. Realized gains and losses from security transactions are based on the identified costs of the securities involved.
(d) Investment Income:
Interest income is recorded as it accrues. Dividends and distributions from portfolio securities and underlying funds are recorded on the date they are effective (the ex-dividend date). Any distributions from underlying funds are recorded in accordance with the character of the distributions as designated by the underlying funds.
(e) Expenses:
Expenses that are specific to a fund are charged directly to the fund. Expenses that are common to more than one fund in the trusts generally are allocated among those funds in proportion to their average daily net assets. The fund bears its share of the acquired fund fees and expenses of the underlying funds, which are indirect expenses incurred by the fund through its investments in the underlying funds. Such expenses are reflected in the net asset values of the underlying funds.
(f) Distributions to Shareholders:
The funds make distributions from net investment income and net realized capital gains, if any, once a year, except for the Schwab MarketTrack Conservative Portfolio, which typically makes distributions from net investment income at the end of each calendar quarter. To receive a distribution, you must be a registered shareholder on the record date. Distributions are paid to shareholders on the payable date.
(g) Accounting Estimates:
The accounting policies described in this report conform to GAAP. Notwithstanding this, shareholders should understand that in order to follow these principles, fund management has to make estimates and assumptions that affect the information reported in the financial statements. It’s possible that once the results are known, they may turn out to be different from these estimates and these differences may be material.
(h) Federal Income Taxes:
The funds intend to meet federal income and excise tax requirements for regulated investment companies under subchapter M of the Internal Revenue Code, as amended. Accordingly, the funds distribute substantially all of their net investment income and net realized capital gains, if any, to their respective shareholders each year. As long as a fund meets the tax requirements, it is not required to pay federal income tax.
(i) Indemnification:
Under the funds’ organizational documents, the officers and trustees are indemnified against certain liabilities arising out of the performance of their duties to the funds. In addition, in the normal course of business the funds enter into contracts with their vendors and others that provide general indemnifications. The funds’ maximum exposure under these arrangements is unknown as this would involve future claims that may be made against the funds. However, based on experience, the funds expect the risk of loss attributable to these arrangements to be remote.
44
Schwab MarketTrack Portfolios | Annual Report
Schwab MarketTrack Portfolios
Financial Notes (continued)
2. Significant Accounting Policies (continued):
(j) Regulatory Update:
Effective January 24, 2023, the SEC adopted rule and form amendments to require mutual funds and ETFs to transmit concise and visually engaging streamlined annual and semiannual reports to shareholders that highlight key information deemed important for retail investors to assess and monitor their fund investments. Other information, including financial statements, will no longer appear in a streamlined shareholder report but must be available online, delivered free of charge upon request, and filed on a semiannual basis on Form N-CSR. The rule and form amendments have a compliance date of July 24, 2024. At this time, management is evaluating the impact of these rule and form amendment changes on the content of the current shareholder report and the newly created annual and semiannual streamlined shareholder reports.
3. Risk Factors:Investing in the funds may involve certain risks, as discussed in the funds’ prospectus, including, but not limited to, those described below. Any of these risks could cause an investor to lose money.
Asset Allocation Risk. The funds are subject to the risk that the selection of the underlying funds and the allocation of a fund’s assets among the various asset classes and market segments may cause the funds to underperform other funds with a similar investment objective. The funds are not managed to maximize tax efficiency for taxable shareholder accounts. Investors should consider whether the funds are appropriate investments in light of their current financial position and retirement needs.
Conflicts of Interest Risk. The investment adviser’s authority to select and substitute underlying funds from a variety of affiliated and unaffiliated mutual funds and ETFs may create a conflict of interest because the fees paid to it and its affiliates by some underlying funds are higher than the fees paid by other underlying funds. The investment adviser also may have an incentive to select an affiliated underlying fund for other reasons, including to increase assets under management or to support new investment strategies. In addition, other conflicts of interest may exist where the best interests of the affiliated underlying fund may not be aligned with those of a fund. However, the investment adviser is a fiduciary to each fund and is legally obligated to act in each fund’s best interests when selecting underlying funds.
Market Risk. Financial markets rise and fall in response to a variety of factors, sometimes rapidly and unpredictably. Markets may be impacted by economic, political, regulatory and other conditions, including economic sanctions and other government actions. In addition, the occurrence of global events, such as war, terrorism, environmental disasters, natural disasters and epidemics, may also negatively affect the financial markets. As with any investment whose performance is tied to these markets, the value of an investment in a fund will fluctuate, which means that an investor could lose money over short or long periods.
Exchange-Traded Fund (ETF) Risk. When a fund invests in an ETF, it will bear a proportionate share of the ETF’s expenses. In addition, lack of liquidity in the market for an ETF’s shares can result in its value being more volatile than the underlying portfolio of securities.
Direct Investment Risk. The funds may invest directly in cash, cash equivalents and equity and fixed-income securities, including money market securities, to maintain their allocations. A fund’s direct investment in these securities is subject to the same or similar risks as an underlying fund’s investment in the same securities.
Securities Lending Risk. Securities lending involves the risk of loss of rights in, or delay in recovery of, the loaned securities if the borrower fails to return the security loaned or becomes insolvent.
Underlying Fund Investment Risk. Before investing in the funds, investors should assess the risks associated with the underlying funds in which the funds may invest, which include any combination of the risks described below.
• Investment Risk. The funds may experience losses with respect to their investment in an underlying fund. Further, there is no guarantee that an underlying fund will be able to achieve its objective.
• Investment Style Risk. Certain underlying funds seek to track the performance of various segments of the stock market, as measured by their respective indices. Such underlying funds follow these stocks during upturns as well as downturns. Because of their indexing strategy, these underlying funds do not take steps to reduce market exposure or to lessen the effects of a declining market. In addition, because of an underlying fund’s expenses, the underlying fund’s performance is normally below that of the index. Errors relating to an index may occur from time to time and may not be identified by the underlying fund’s index provider for a period of time. In addition, market disruptions could cause delays in an underlying fund’s index’s rebalancing schedule. Such errors and/or market disruptions may result in losses for an underlying fund.
Schwab MarketTrack Portfolios | Annual Report45
Schwab MarketTrack Portfolios
Financial Notes (continued)
3. Risk Factors (continued):
• Tracking Error Risk. Each underlying index fund seeks to track the performance of its respective index, although it may not be successful in doing so. The divergence between the performance of an underlying fund and its index, positive or negative, is called "tracking error." Tracking error can be caused by many factors and it may be significant. If an underlying fund utilizes a sampling approach, it may not track the return of the index as well as it would if the underlying fund purchased all of the securities in the index.
• Equity Risk. The prices of equity securities rise and fall daily. These price movements may result from factors affecting individual companies, industries or the securities market as a whole. In addition, equity markets tend to move in cycles, which may cause stock prices to fall over short or extended periods of time.
• Fixed-Income Risk. Interest rates rise and fall over time, which will affect an underlying fund’s yield and share price. A change in a central bank’s monetary policy or economic conditions, among other things, may result in a change in interest rates. A rise in interest rates could cause an underlying fund’s share price to fall. The credit quality of a portfolio investment could also cause an underlying fund’s share price to fall. An underlying fund could lose money if the issuer or guarantor of a portfolio investment or the counterparty to a derivatives contract fails to make timely principal or interest payments or otherwise honor its obligations. Fixed-income securities may be paid off earlier or later than expected. Either situation could cause an underlying fund to hold securities paying lower-than-market rates of interest, which could hurt an underlying fund’s yield or share price. Below investment-grade bonds (junk bonds) involve greater credit risk, are more volatile, involve greater risk of price declines and may be more susceptible to economic downturns than investment-grade securities.
• Market Capitalization Risk. Securities issued by companies of different market capitalizations tend to go in and out of favor based on market and economic conditions. During a period when securities of a particular market capitalization fall behind other types of investments, an underlying fund’s performance could be impacted.
• Real Estate Investment Risk. An underlying fund that has a policy of concentrating its investments in real estate companies and companies related to the real estate industry is subject to risks associated with the direct ownership of real estate securities. These risks include, among others, declines in the value of real estate; risks related to general and local economic conditions; possible lack of availability of mortgage funds or other limits to accessing the credit or capital markets; defaults by borrowers or tenants, particularly during an economic downturn; and changes in interest rates.
• Money Market Fund Risk. The funds may invest in underlying money market funds that either seek to maintain a stable $1.00 net asset value (“stable share price money market funds”) or that have a share price that fluctuates (“variable share price money market funds”). Although an underlying stable share price money market fund seeks to maintain a stable $1.00 net asset value, it is possible to lose money by investing in such a money market fund. Because the share price of an underlying variable share price money market fund will fluctuate, when a fund sells the shares it owns they may be worth more or less than what the fund originally paid for them. In addition, neither type of money market fund is designed to offer capital appreciation. Certain underlying money market funds may impose a fee upon the sale of shares or may temporarily suspend the ability to sell shares if such fund’s liquidity falls below required minimums.
• Concentration Risk. To the extent that an underlying fund’s or the index’s portfolio is concentrated in the securities of issuers in a particular market, industry, group of industries, sector, country or asset class, the underlying fund may be adversely affected by the performance of those securities, may be subject to increased price volatility and may be more vulnerable to adverse economic, market, political, or regulatory occurrences affecting that market, industry, group of industries, sector, country or asset class.
• Foreign Investment Risk. An underlying fund’s investments in securities of foreign issuers involve certain risks that may be greater than those associated with investments in securities of U.S. issuers. These include risks of adverse changes in foreign economic, political, regulatory and other conditions; changes in currency exchange rates or exchange control regulations (including limitations on currency movements and exchanges); the imposition of economic sanctions or other government restrictions; differing accounting, auditing, financial reporting and legal standards and practices; differing securities market structures; and higher transaction costs. These risks may negatively impact the value or liquidity of an underlying fund’s investments, and could impair the underlying fund’s ability to meet its investment objective or invest in accordance with its investment strategy. There is a risk that investments in securities denominated in, and/or receiving revenues in, foreign currencies will decline in value relative to the U.S. dollar.
• Emerging Markets Risk. Emerging market countries may be more likely to experience political turmoil or rapid changes in market or economic conditions than more developed countries. Emerging market countries often have less uniformity in accounting, auditing, financial reporting and recordkeeping requirements and greater risk associated with the custody of securities. In addition, the financial stability of issuers (including governments) in emerging market countries may be more
46
Schwab MarketTrack Portfolios | Annual Report
Schwab MarketTrack Portfolios
Financial Notes (continued)
3. Risk Factors (continued):
precarious than in developed countries. As a result, there may be an increased risk of illiquidity and price volatility associated with an underlying fund’s investments in emerging market countries, which may be magnified by currency fluctuations relative to the U.S. dollar, and, at times, it may be difficult to value such investments.
• Derivatives Risk. An underlying fund may use derivatives to enhance returns or hedge against market declines. Examples of derivatives are options, futures, options on futures and swaps. An option is the right, but not the obligation, to buy or sell an instrument at a specific price on or before a specific date. A future is an agreement to buy or sell a financial instrument at a specific price on a specific day. A swap is an agreement whereby two parties agree to exchange payment streams calculated in relation to a rate, index, instrument or certain securities and a predetermined amount. A credit default swap is an agreement in which the seller agrees to make a payment to the buyer in the event of a specified credit event in exchange for a fixed payment or series of fixed payments.
An underlying fund’s use of derivative instruments involves risks different from, or possibly greater than, the risks associated with investing directly in securities and other traditional investments. Certain of these risks, such as leverage risk, liquidity risk and market risk are discussed elsewhere in this section. An underlying fund’s use of derivatives is also subject to lack of availability risk, valuation risk, correlation risk and tax risk. Lack of availability risk is the risk that suitable derivative transactions may not be available in all circumstances for risk management or other purposes. Valuation risk is the risk that a particular derivative may be valued incorrectly. Correlation risk is the risk that changes in the value of the derivative may not correlate perfectly with the underlying asset, rate or index. Tax risk is the risk that the use of derivatives may cause an underlying fund to realize higher amounts of short-term capital gains. An underlying fund’s use of derivatives could reduce the underlying fund’s performance, increase its volatility, and could cause the underlying fund to lose more than the initial amount invested. The use of derivatives that are subject to regulation by the Commodity Futures Trading Commission (CFTC) by an underlying fund could cause a fund to become a commodity pool, which would require the fund to comply with certain CFTC rules. An underlying fund’s use of derivatives also could create a risk of counterparty default under certain transactions, risks that a fund would need to liquidate portfolio positions when it may not be advantageous to do so in order to meet margin and payment obligations, and legal risks relating to insufficient documentation, insufficient capacity or authority of a counterparty, or legality or enforceability of a contract.
• Leverage Risk. Certain underlying fund transactions, such as derivatives transactions, short sales, reverse repurchase agreements, and mortgage dollar rolls, may give rise to a form of leverage and may expose an underlying fund to greater risk. Leverage tends to magnify the effect of any decrease or increase in the value of an underlying fund’s portfolio securities, which means even a small amount of leverage can have a disproportionately large impact on the underlying fund.
• Liquidity Risk. An underlying fund may be unable to sell certain securities, such as illiquid securities, readily at a favorable time or price, or the underlying fund may have to sell them at a loss.
• Portfolio Turnover Risk. Certain of the underlying funds may buy and sell portfolio securities actively. If they do, their portfolio turnover rate and transaction costs will rise, which may lower the underlying fund’s performance and may increase the likelihood of capital gains distributions.
Please refer to the funds’ prospectus for a more complete description of the principal risks of investing in the funds.
4. Affiliates and Affiliated Transactions:Investment Adviser
Charles Schwab Investment Management, Inc., dba Schwab Asset Management, a wholly owned subsidiary of The Charles Schwab Corporation, serves as each fund’s investment adviser and administrator pursuant to an Investment Advisory and Administration Agreement between the investment adviser and the trust.
For its advisory and administrative services to the funds, the investment adviser is entitled to receive an annual fee of 0.13%, payable monthly, based on a percentage of each fund’s average daily net assets. The investment adviser also is entitled to receive an advisory and/or administrative services fee from each of the affiliated Schwab Funds that serve as underlying funds.
Schwab MarketTrack Portfolios | Annual Report47
Schwab MarketTrack Portfolios
Financial Notes (continued)
4. Affiliates and Affiliated Transactions (continued):
Shareholder Servicing
The Board has adopted a Shareholder Servicing Plan (the Plan) on behalf of the funds. The Plan enables each fund to bear expenses relating to the provision by financial intermediaries, including Charles Schwab & Co., Inc. (Schwab), a broker-dealer affiliate of the investment adviser, (together, service providers), of certain account maintenance, customer liaison and shareholder services to the current shareholders of the funds.
Pursuant to the Plan, each fund’s shares are subject to an annual shareholder servicing fee of up to 0.25%. The shareholder servicing fee paid to a particular service provider is made pursuant to its written agreement with Schwab, as distributor of the funds (or, in the case of payments made to Schwab acting as a service provider, pursuant to Schwab’s written agreement with the funds). Payments under the Plan are made as described above without regard to whether the fee is more or less than the service provider’s actual cost of providing the services, and if more, such excess may be retained as profit by the service provider.
Expense Limitation
The investment adviser and its affiliates have agreed with the funds, for so long as the investment adviser serves as the investment adviser to the funds, in which the agreement may only be amended or terminated with the approval of the Board, to limit the total annual fund operating expenses charged, excluding interest, taxes and certain non-routine expenses as a percentage of average daily net assets as follows:
SCHWAB MARKETTRACK ALL EQUITY PORTFOLIO | SCHWAB MARKETTRACK GROWTH PORTFOLIO | SCHWAB MARKETTRACK BALANCED PORTFOLIO | SCHWAB MARKETTRACK CONSERVATIVE PORTFOLIO |
| | | |
The agreement to limit the funds’ total expenses charged is limited to each fund’s direct operating expenses and, therefore, does not apply to acquired fund fees and expenses, which are indirect expenses incurred by each fund through its investments in the underlying funds.
Investments in Affiliates
The funds may engage in certain transactions involving related parties. Pursuant to an exemptive order issued by the SEC, the funds may invest in other related funds. As of October 31, 2023, each Schwab MarketTrack Portfolio’s ownership percentages of other related funds’ shares are as follows:
| SCHWAB MARKETTRACK ALL EQUITY PORTFOLIO | SCHWAB MARKETTRACK GROWTH PORTFOLIO | SCHWAB MARKETTRACK BALANCED PORTFOLIO | SCHWAB MARKETTRACK CONSERVATIVE PORTFOLIO |
Schwab Fundamental Emerging Markets Large Company Index Fund | | | | |
Schwab Fundamental International Large Company Index Fund | | | | |
Schwab Fundamental International Small Company Index Fund | | | | |
Schwab Fundamental US Large Company Index Fund | | | | |
Schwab Fundamental US Small Company Index Fund | | | | |
Schwab International Index Fund | | | | |
Schwab S&P 500 Index Fund | | | | |
Schwab Short-Term Bond Index Fund | | | | |
Schwab Small-Cap Index Fund | | | | |
Schwab U.S. Aggregate Bond Index Fund | | | | |
Schwab U.S. Large-Cap Growth Index Fund | | | | |
| | | | |
Schwab Variable Share Price Money Fund, Ultra Shares | | | | |
48
Schwab MarketTrack Portfolios | Annual Report
Schwab MarketTrack Portfolios
Financial Notes (continued)
4. Affiliates and Affiliated Transactions (continued):
Interfund Borrowing and Lending
Pursuant to an exemptive order issued by the SEC, the funds may enter into interfund borrowing and lending transactions with other funds in the Fund Complex. All loans are for temporary or emergency purposes and the interest rate to be charged will be the average of the overnight repurchase agreement rate and the short-term bank loan rate. All loans are subject to numerous conditions designed to ensure fair and equitable treatment of all participating funds. The interfund lending facility is subject to the oversight and periodic review by the Board. The funds had no interfund borrowing or lending activity during the period.
Interfund Transactions
The funds may engage in direct transactions with certain other funds in the Fund Complex in accordance with procedures adopted by the Board pursuant to Rule 17a-7 under the 1940 Act. When one fund is seeking to sell a security that another is seeking to buy, an interfund transaction can allow both funds to benefit by reducing transaction costs. This practice is limited to funds that share the same investment adviser, trustees and/or officers. For the period ended October 31, 2023, each fund’s purchases and sales of securities with other funds in the Fund Complex as well as any realized gains (losses) were as follows:
| | | |
Schwab MarketTrack All Equity Portfolio | | | |
Schwab MarketTrack Growth Portfolio | | | |
Schwab MarketTrack Balanced Portfolio | | | |
Schwab MarketTrack Conservative Portfolio | | | |
| | | |
5. Board of Trustees:The Board may include people who are officers and/or directors of the investment adviser or its affiliates. Federal securities law limits the percentage of such “interested persons” who may serve on a trust’s board, and the trust was in compliance with these limitations throughout the report period. The funds did not pay any of these interested persons for their services as trustees, but they did pay non-interested persons (independent trustees), as noted in each fund’s Statement of Operations. For information regarding the trustees, please refer to the Trustees and Officers table at the end of this report.
6. Borrowing from Banks:During the period, the funds were participants with other funds in the Fund Complex in a joint, syndicated, committed $1 billion line of credit (the Syndicated Credit Facility), which matured on September 28, 2023. On September 28, 2023, the Syndicated Credit Facility was amended to run for a new 364 day period with the line of credit amount remaining unchanged, maturing on September 26, 2024. Under the terms of the Syndicated Credit Facility, in addition to interest charged on any borrowings by a fund, each fund paid a commitment fee of 0.15% per annum on the funds’ proportionate share of the unused portion of the Syndicated Credit Facility.
During the period, the funds were participants with other funds in the Fund Complex in a joint, unsecured, uncommitted $400 million line of credit (the Uncommitted Credit Facility), with State Street Bank and Trust Company, which matured on September 28, 2023. On September 28, 2023, the Uncommitted Credit Facility was amended to run for a new 364 day period with the line of credit amount remaining unchanged, maturing on September 26, 2024. Under the terms of the Uncommitted Credit Facility, each fund pays interest on the amount a fund borrows. There were no borrowings by any of the funds from either line of credit during the period.
The funds also have access to custodian overdraft facilities. A fund may have utilized the overdraft facility and incurred an interest expense, which is disclosed in each fund’s Statement of Operations, if any. The interest expense is determined based on a negotiated rate above the current Federal Funds Rate.
Schwab MarketTrack Portfolios | Annual Report49
Schwab MarketTrack Portfolios
Financial Notes (continued)
7. Purchases and Sales of Investment Securities:
For the period ended October 31, 2023, purchases and sales of securities (excluding short-term obligations) were as follows:
| | |
Schwab MarketTrack All Equity Portfolio | | |
Schwab MarketTrack Growth Portfolio | | |
Schwab MarketTrack Balanced Portfolio | | |
Schwab MarketTrack Conservative Portfolio | | |
8. Federal Income Taxes:As of October 31, 2023, the tax basis cost of the funds’ investments and gross unrealized appreciation and depreciation were as follows:
| | GROSS UNREALIZED
APPRECIATION | GROSS UNREALIZED
DEPRECIATION | NET UNREALIZED
APPRECIATION
(DEPRECIATION) |
Schwab MarketTrack All Equity Portfolio | | | | |
Schwab MarketTrack Growth Portfolio | | | | |
Schwab MarketTrack Balanced Portfolio | | | | |
Schwab MarketTrack Conservative Portfolio | | | | |
| | | | |
| | | | |
As of October 31, 2023, the components of distributable earnings on a tax basis were as follows:
| UNDISTRIBUTED
ORDINARY
INCOME | UNDISTRIBUTED
LONG-TERM
CAPITAL GAINS | NET UNREALIZED
APPRECIATION
(DEPRECIATION)
ON INVESTMENTS | |
Schwab MarketTrack All Equity Portfolio | | | | |
Schwab MarketTrack Growth Portfolio | | | | |
Schwab MarketTrack Balanced Portfolio | | | | |
Schwab MarketTrack Conservative Portfolio | | | | |
The primary difference between book basis and tax basis unrealized appreciation or unrealized depreciation of investments is the tax deferral of losses on wash sales. The tax cost of the funds’ investments, disclosed above, have been adjusted from their book amounts to reflect these unrealized appreciation or depreciation differences, as applicable.
The tax basis components of distributions paid during the current and prior fiscal years were as follows:
| CURRENT FISCAL YEAR END DISTRIBUTIONS | PRIOR FISCAL YEAR END DISTRIBUTIONS |
| | | | |
Schwab MarketTrack All Equity Portfolio | | | | |
Schwab MarketTrack Growth Portfolio | | | | |
Schwab MarketTrack Balanced Portfolio | | | | |
Schwab MarketTrack Conservative Portfolio | | | | |
Distributions paid to shareholders are based on net investment income and net realized gains determined on a tax basis, which may differ from net investment income and net realized gains for financial reporting purposes. These differences reflect the differing character of certain income items and net realized gains and losses for financial statement and tax purposes, and may result in reclassification among certain capital accounts in the financial statements. The funds may also designate a portion of the amount paid to redeeming shareholders as a distribution for tax purposes.
50
Schwab MarketTrack Portfolios | Annual Report
Schwab MarketTrack Portfolios
Financial Notes (continued)
8. Federal Income Taxes (continued):
Permanent book and tax basis differences may result in reclassifications between components of net assets as required. The adjustments will have no impact on net assets or the results of operations.
As of October 31, 2023, management has reviewed the tax positions for open periods (for federal purposes, three years from the date of filing and for state purposes, four years from the date of filing) as applicable to the funds, and has determined that no provision for income tax is required in the funds’ financial statements. The funds recognize interest and penalties, if any, related to unrecognized tax benefits as income tax expense in each fund’s Statement of Operations. During the fiscal year ended October 31, 2023, the funds did not incur any interest or penalties.
9. Subsequent Events:Management has determined there are no subsequent events or transactions through the date the financial statements were issued that would have materially impacted the financial statements as presented.
Schwab MarketTrack Portfolios | Annual Report51
Schwab MarketTrack Portfolios
Report of Independent Registered Public Accounting Firm
To the Board of Trustees of Schwab Capital Trust and Shareholders of Schwab MarketTrack All Equity Portfolio, Schwab MarketTrack Growth Portfolio, Schwab MarketTrack Balanced Portfolio, and Schwab MarketTrack Conservative Portfolio:
Opinion on the Financial Statements and Financial Highlights
We have audited the accompanying statements of assets and liabilities, including the portfolio holdings, of Schwab MarketTrack All Equity Portfolio, Schwab MarketTrack Growth Portfolio, Schwab MarketTrack Balanced Portfolio, and Schwab MarketTrack Conservative Portfolio (the “Funds”), four of the funds constituting Schwab Capital Trust, as of October 31, 2023, the related statements of operations for the year then ended, the statements of changes in net assets for each of the two years in the period then ended, the financial highlights for each of the four years in the period then ended, and the related notes. In our opinion, the financial statements and financial highlights present fairly, in all material respects, the financial position of each of the Funds constituting the Schwab Capital Trust as of October 31, 2023, and the results of their operations for the year then ended, the changes in their net assets for each of the two years in the period then ended, and the financial highlights for each of the four years in the period then ended in conformity with accounting principles generally accepted in the United States of America. The financial highlights for the year ended October 31, 2019 were audited by other auditors, whose report, dated December 16, 2019, expressed an unqualified opinion on such financial highlights.
Basis for Opinion
These financial statements and financial highlights are the responsibility of the Funds’ management. Our responsibility is to express an opinion on the Funds’ financial statements and financial highlights based on our audits. We are a public accounting firm registered with the Public Company Accounting Oversight Board (United States) (PCAOB) and are required to be independent with respect to the Funds in accordance with the U.S. federal securities laws and the applicable rules and regulations of the Securities and Exchange Commission and the PCAOB.
We conducted our audits in accordance with the standards of the PCAOB. Those standards require that we plan and perform the audit to obtain reasonable assurance about whether the financial statements and financial highlights are free of material misstatement, whether due to error or fraud. The Funds are not required to have, nor were we engaged to perform, an audit of their internal control over financial reporting. As part of our audits, we are required to obtain an understanding of internal control over financial reporting but not for the purpose of expressing an opinion on the effectiveness of the Funds’ internal control over financial reporting. Accordingly, we express no such opinion.
Our audits included performing procedures to assess the risks of material misstatement of the financial statements and financial highlights, whether due to error or fraud, and performing procedures that respond to those risks. Such procedures included examining, on a test basis, evidence regarding the amounts and disclosures in the financial statements and financial highlights. Our audits also included evaluating the accounting principles used and significant estimates made by management, as well as evaluating the overall presentation of the financial statements and financial highlights. Our procedures included confirmation of securities owned as of October 31, 2023, by correspondence with the custodian and transfer agent. We believe that our audits provide a reasonable basis for our opinion.
Deloitte & Touche LLP
Denver, Colorado
December 15, 2023
We have served as the auditor of one or more investment companies in the Schwab Funds Complex since 2020.
52
Schwab MarketTrack Portfolios | Annual Report
Schwab MarketTrack Portfolios
Other Federal Tax Information (unaudited)
The funds may elect to pass on the benefits of the foreign tax credit to their shareholders for the fiscal year ended October 31, 2023. The foreign tax credit and the foreign source income amounts are as follows:
| | |
Schwab MarketTrack All Equity Portfolio | | |
Schwab MarketTrack Growth Portfolio | | |
Schwab MarketTrack Balanced Portfolio | | |
Schwab MarketTrack Conservative Portfolio | | |
For corporate shareholders, the following percentage of the funds’ dividend distributions paid during the fiscal year ended October 31, 2023, qualify for the corporate dividends received deduction:
| |
Schwab MarketTrack All Equity Portfolio | |
Schwab MarketTrack Growth Portfolio | |
Schwab MarketTrack Balanced Portfolio | |
Schwab MarketTrack Conservative Portfolio | |
For the fiscal year ended October 31, 2023, the funds designate the following amounts of the dividend distributions as qualified dividends for the purposes of the maximum rate under section 1(h)(11) of the Internal Revenue Code. Shareholders will be notified in January 2024 via IRS Form 1099 of the amounts for use in preparing their 2023 income tax return.
Schwab MarketTrack All Equity Portfolio | |
Schwab MarketTrack Growth Portfolio | |
Schwab MarketTrack Balanced Portfolio | |
Schwab MarketTrack Conservative Portfolio | |
Under section 852(b)(3)(C) of the Internal Revenue Code, certain funds designate the following amounts as long-term capital gain dividends for the fiscal year ended October 31, 2023:
Schwab MarketTrack All Equity Portfolio | |
Schwab MarketTrack Growth Portfolio | |
Schwab MarketTrack Balanced Portfolio | |
Schwab MarketTrack Conservative Portfolio | |
For the fiscal year ended October 31, 2023, the funds designate the following amounts as dividends eligible for the 20% qualified business income deduction under section 199A of the Internal Revenue Code. Shareholders will be notified in January 2024 via IRS Form 1099 of the amounts for use in preparing their 2023 income tax return.
Schwab MarketTrack All Equity Portfolio | |
Schwab MarketTrack Growth Portfolio | |
Schwab MarketTrack Balanced Portfolio | |
Schwab MarketTrack Conservative Portfolio | |
For the fiscal year ended October 31, 2023, the funds designate the following percentage of dividend income as business interest income under section 163(j) of the Internal Revenue Code:
| |
Schwab MarketTrack All Equity Portfolio | |
Schwab MarketTrack Growth Portfolio | |
Schwab MarketTrack Balanced Portfolio | |
Schwab MarketTrack Conservative Portfolio | |
| |
| |
Schwab MarketTrack Portfolios | Annual Report53
Schwab MarketTrack Portfolios
Liquidity Risk Management Program (unaudited)
The funds have adopted and implemented a liquidity risk management program (the “program”) as required by Rule 22e-4 under the Investment Company Act of 1940, as amended. The funds’ Board of Trustees (the “Board”) has designated the funds’ investment adviser, Charles Schwab Investment Management, Inc., dba Schwab Asset Management, as the administrator of the program. Personnel of the investment adviser or its affiliates conduct the day-to-day operation of the program.
Under the program, the investment adviser manages a fund’s liquidity risk, which is the risk that the fund could not meet shareholder redemption requests without significant dilution of remaining shareholders’ interests in the fund. The program is reasonably designed to assess and manage a fund’s liquidity risk, taking into consideration the fund’s investment strategy and the liquidity of its portfolio investments during normal and reasonably foreseeable stressed conditions; its historical redemption history and shareholder concentrations; and its cash holdings and access to other funding sources, including the custodian overdraft facility and lines of credit. The investment adviser’s process of determining the degree of liquidity of each fund’s investments is supported by third-party liquidity assessment vendors.
The funds’ Board reviewed a report at its meeting held on September 19, 2023 prepared by the investment adviser regarding the operation and effectiveness of the program for the period June 1, 2022, through May 31, 2023, which included individual fund liquidity risk metrics. The report summarized the operation of the program and the information and factors considered by the investment adviser in assessing whether the program has been adequately and effectively implemented with respect to a fund. In addition, the investment adviser provided its assessment that the program had been operating effectively in managing each fund’s liquidity risk.
54
Schwab MarketTrack Portfolios | Annual Report
Schwab MarketTrack Portfolios
Investment Advisory Agreement Approval
The Investment Company Act of 1940, as amended (the 1940 Act), requires that the continuation of a fund’s investment advisory agreement must be specifically approved (1) by the vote of the trustees or by a vote of the shareholders of the fund, and (2) by the vote of a majority of the trustees who are not parties to the investment advisory agreement or “interested persons” of any party thereto (the Independent Trustees), cast in person at a meeting called for the purpose of voting on such approval. In connection with such approvals, the fund’s trustees must request and evaluate, and the investment adviser is required to furnish, such information as may be reasonably necessary to evaluate the terms of the investment advisory agreement.
The Board of Trustees (the Board or the Trustees, as appropriate) calls and holds one or more meetings each year that are dedicated, in whole or in part, to considering whether to renew the investment advisory and administration agreement (the Agreement) between Schwab Capital Trust (the Trust) and Charles Schwab Investment Management, Inc. (dba Schwab Asset Management) (the investment adviser) with respect to the existing funds in the Trust, including Schwab MarketTrack All Equity Portfolio, Schwab MarketTrack Growth Portfolio, Schwab MarketTrack Balanced Portfolio and Schwab MarketTrack Conservative Portfolio (each, a Fund and collectively, the Funds), and to review certain other agreements pursuant to which the investment adviser provides investment advisory services to certain other registered investment companies. In preparation for the meeting(s), the Board requests and reviews a wide variety of materials provided by the investment adviser, including information about the investment adviser’s affiliates, personnel, business goals and priorities, profitability, third-party oversight, corporate structure and operations. As part of the renewal process, the Independent Trustees’ legal counsel, on behalf of the Independent Trustees, sends an information request letter to the investment adviser seeking certain relevant information. The responses by the investment adviser are provided to the Trustees in the Board materials for their review prior to their meeting, and the Trustees are provided with the opportunity to request any additional materials. The Board also receives data provided by an independent provider of investment company data. This information is in addition to the detailed information about the Funds that the Board reviews during the course of each year, including information that relates to the Funds’ operations and performance, legal and compliance matters, risk management, portfolio turnover, and sales and marketing activity. In considering the renewal, the Independent Trustees receive advice from Independent Trustees’ legal counsel, including a memorandum regarding the responsibilities of trustees for the approval of investment advisory agreements. In addition, the Independent Trustees participate in question and
answer sessions with representatives of the investment adviser and meet in executive session outside the presence of Fund management.
The Board, including a majority of the Independent Trustees, considered information specifically relating to the continuance of the Agreement with respect to the Funds at meetings held on April 27, 2023 and June 7, 2023, and approved the renewal of the Agreement with respect to the Funds for an additional one-year term at the meeting on June 7, 2023 called for the purpose of voting on such approval.
The Board’s approval of the continuance of the Agreement with respect to the Funds was based on consideration and evaluation of a variety of specific factors discussed at these meetings and at prior meetings, including:
1.
the nature, extent and quality of the services provided to each Fund under the Agreement, including the resources of the investment adviser and its affiliates dedicated to the Funds;
2.
each Fund’s investment performance and how it compared to that of certain other comparable mutual funds and benchmark data;
3.
each Fund’s expenses and how those expenses compared to those of certain other similar mutual funds;
4.
the profitability of the investment adviser and its affiliates, including Charles Schwab & Co., Inc. (Schwab), with respect to each Fund, including both direct and indirect benefits accruing to the investment adviser and its affiliates; and
5.
the extent to which economies of scale would be realized as each Fund grows and whether fee levels in the Agreement reflect those economies of scale for the benefit of Fund investors.
Nature, Extent and Quality of Services. The Board considered the nature, extent and quality of the services provided by the investment adviser to the Funds and the resources of the investment adviser and its affiliates dedicated to the Funds. In this regard, the Trustees evaluated, among other things, the investment adviser’s experience, track record, compliance program, resources dedicated to hiring and retaining skilled personnel and specialized talent, and information security resources. The Trustees also considered information provided by the investment adviser relating to services and support provided with respect to each Fund’s portfolio management team, portfolio strategy, and internal investment guidelines, as well as trading infrastructure, liquidity management, product design and analysis, shareholder communications, securities valuation, and vendor and risk oversight. The Trustees also considered investments the investment adviser has made in its infrastructure, including modernizing the investment adviser’s
Schwab MarketTrack Portfolios | Annual Report55
Schwab MarketTrack Portfolios
technology and use of data, increasing expertise in key areas (including portfolio management and trade operations), and improving business continuity, cybersecurity, due diligence, risk management processes, and information security programs, which are designed to provide enhanced services to the Funds and their shareholders. The Trustees considered Schwab’s overall financial condition and its reputation as a full service brokerage firm, as well as the wide range of products, services and account features that benefit Fund shareholders who are brokerage clients of Schwab. Following such evaluation, the Board concluded, within the context of its full deliberations, that the nature, extent and quality of services provided by the investment adviser to the Funds and the resources of the investment adviser and its affiliates dedicated to the Funds supported renewal of the Agreement with respect to the Funds.
Fund Performance. The Board considered each Fund’s performance in determining whether to renew the Agreement with respect to such Fund. Specifically, the Trustees considered each Fund’s performance relative to a peer category of other mutual funds and applicable indices/benchmarks, in light of total return and the market environment, as well as in consideration of each Fund’s investment style and strategy. As part of this review, the Trustees considered the composition of the peer category, selection criteria and the reputation of the independent provider of investment company data who prepared the peer category analysis. The Trustees further considered the level of Fund performance in the context of their review of Fund expenses and the investment adviser’s profitability discussed below and also noted that the Board and a designated committee of the Board review performance throughout the year. Although Schwab MarketTrack All Equity Portfolio had performance that ranked in the fourth quartile of a relevant peer group for more than one performance period considered, the Board concluded that other factors relevant to performance supported renewal of the Agreement with respect to the Fund including that the underperformance was attributable, to a significant extent, to investment decisions by the investment adviser that were reasonable and consistent with the Fund’s investment objective and policies and that the investment adviser had taken steps designed to help improve performance. Following such evaluation, the Board concluded, within the context of its full deliberations, that the performance of each Fund supported renewal of the Agreement with respect to such Fund.
Fund Expenses. With respect to each Fund’s expenses, the Trustees considered the rate of compensation called for by the Agreement, and each Fund’s operating expense ratio, in each case, in comparison to those of other similar mutual funds, such peer groups and comparisons having been selected and calculated by an independent provider of investment company data. The investment adviser reported to the Board, and the Board took into account, the risk assumed by the investment adviser in the development of the Funds and provision of
services as well as the competitive marketplace for financial products. The Trustees also considered the investment adviser’s contractual commitment to limit the operating expense of each Fund for so long as it serves as the adviser to the Fund. The Trustees also considered fees charged by the investment adviser to other mutual funds and to other types of accounts, but, with respect to such other types of accounts, accorded less weight to such comparisons due to the different legal, regulatory, compliance and operating features of mutual funds as compared to these other types of accounts, and any differences in the nature and scope of the services the investment adviser provides to these other accounts, and any differences in the market for these types of accounts. The Trustees noted that shareholders of the Funds indirectly pay their pro rata share of the fees and expenses of the underlying funds in which the Funds invest. Following such evaluation, the Board concluded, within the context of its full deliberations, that the expenses of each Fund are reasonable and supported renewal of the Agreement with respect to such Fund.
Profitability. The Trustees considered the compensation flowing to the investment adviser and its affiliates, directly or indirectly and reviewed profitability on a pre-tax basis, without regard to distribution expenses. The Trustees reviewed the profitability of the investment adviser relating to the Schwab fund complex as a whole, noting the benefits to Fund shareholders of being part of the Schwab fund complex, including the allocations of certain costs across the Funds and other funds in the complex. The Trustees also considered any other benefits derived by the investment adviser from its relationship with the Funds, such as whether, by virtue of its management of the Funds, the investment adviser obtains investment information or other research resources that aid it in providing advisory services to other clients. Also, because the Funds invest a portion of their assets in other funds within the Schwab fund complex, the Trustees considered that the investment adviser indirectly benefits from the Funds’ investments in other underlying funds managed by the investment adviser. The Trustees considered whether the compensation and profitability with respect to the Funds under the Agreement and other service agreements were reasonable and in light of the quality of all services rendered to the Funds by the investment adviser and its affiliates. The Trustees noted that the investment adviser continues to invest substantial sums in its business in order to provide enhanced research capabilities, services and systems to benefit the Funds. Based on this evaluation, the Board concluded, within the context of its full deliberations, that the profitability of the investment adviser with respect to each Fund is reasonable and supported renewal of the Agreement with respect to such Fund.
Economies of Scale. Although the Trustees recognized the difficulty of determining economies of scale with precision, and although the Funds do not have breakpoints in their advisory fees, the Trustees considered the potential existence of any economies of scale and whether those are passed along to a Fund’s shareholders through (i) the enhancement of services
56
Schwab MarketTrack Portfolios | Annual Report
Schwab MarketTrack Portfolios
provided to the Funds in return for fees paid, including through investments by the investment adviser in its infrastructure, including modernizing the investment adviser’s technology and use of data, increasing expertise and capabilities in key areas (including portfolio and trade operations), and improving business continuity, cybersecurity, due diligence and information security programs, which are designed to provide enhanced services to the Funds and their shareholders; and (ii) pricing a fund to scale and keeping overall expenses down as the fund grows. The Trustees acknowledged that the investment adviser has invested in its infrastructure, as discussed above, over time and that the investment adviser’s internal costs of providing investment management, technology, administrative, legal and compliance services to the Funds continue to increase as a result of regulatory or other developments. The Trustees considered that the investment adviser and its affiliates employ contractual expense caps to protect shareholders from higher fees, including for example, when fund assets are relatively small.
Based on this evaluation, the Board concluded, within the context of its full deliberations, that each Fund obtains reasonable benefits from economies of scale.
* * * * * * * * * * * * * * * * * * * * * * * * * * * * * * * * * * * * * * * *
In the course of their deliberations, the Trustees may have accorded different weights to various factors and did not identify any particular information or factor that was all important or controlling. Based on the Trustees’ deliberation and their evaluation of the information described above, the Board, including all of the Independent Trustees, approved the continuation of the Agreement with respect to the Funds and concluded that the compensation under the Agreement with respect to the Funds is fair and reasonable in light of the services provided and the related expenses borne by the investment adviser and its affiliates and such other matters as the Trustees considered to be relevant in the exercise of their reasonable judgment.
Schwab MarketTrack Portfolios | Annual Report57
Schwab MarketTrack Portfolios
Trustees and Officers
The tables below give information about the trustees and officers of Schwab Capital Trust, which includes the funds covered in this report. The “Fund Complex” includes The Charles Schwab Family of Funds, Schwab Capital Trust, Schwab Investments, Schwab Annuity Portfolios, Schwab Strategic Trust and Laudus Trust. The Fund Complex includes 106 funds.
The address for all trustees and officers is 211 Main Street, San Francisco, CA 94105. You can find more information about the trustees and officers in the funds’ Statement of Additional Information, which is available free by calling 1-877-824-5615.
|
Name, Year of Birth, and Position(s) with the trust (Terms of office, and length of Time Served1) | Principal Occupations During the Past Five Years | Number of Portfolios in Fund Complex Overseen by the Trustee | |
Michael J. Beer 1961 Trustee (Trustee of The Charles Schwab Family of Funds, Schwab Investments, Schwab Capital Trust, Schwab Annuity Portfolios, Schwab Strategic Trust and Laudus Trust since 2022) | Retired. Director, President and Chief Executive Officer (Dec. 2016 – Sept. 2019), Principal Funds (investment management). | | Director (2016 – 2019), Principal Funds, Inc. |
Robert W. Burns 1959 Trustee (Trustee of Schwab Strategic Trust since 2009; The Charles Schwab Family of Funds, Schwab Investments, Schwab Capital Trust, Schwab Annuity Portfolios and Laudus Trust since 2016) | Retired/Private Investor. | | |
Nancy F. Heller 1956 Trustee (Trustee of The Charles Schwab Family of Funds, Schwab Investments, Schwab Capital Trust, Schwab Annuity Portfolios, Schwab Strategic Trust and Laudus Trust since 2018) | | | |
David L. Mahoney 1954 Trustee (Trustee of The Charles Schwab Family of Funds, Schwab Investments, Schwab Capital Trust, Schwab Annuity Portfolios and Laudus Trust since 2011; Schwab Strategic Trust since 2016) | | | Director (2004 – present), Corcept Therapeutics Incorporated Director (2009 – 2021), Adamas Pharmaceuticals, Inc. Director (2003 – 2019), Symantec Corporation |
Jane P. Moncreiff 1961 Trustee (Trustee of The Charles Schwab Family of Funds, Schwab Investments, Schwab Capital Trust, Schwab Annuity Portfolios, Schwab Strategic Trust and Laudus Trust since 2019) | Consultant (2018 – present), Fulham Advisers LLC (management consulting); Chief Investment Officer (2009 – 2017), CareGroup Healthcare System, Inc. (healthcare). | | |
58
Schwab MarketTrack Portfolios | Annual Report
Schwab MarketTrack Portfolios
Independent Trustees (continued) |
Name, Year of Birth, and Position(s) with the trust (Terms of office, and length of Time Served1) | Principal Occupations During the Past Five Years | Number of Portfolios in Fund Complex Overseen by the Trustee | |
Kimberly S. Patmore 1956 Trustee (Trustee of The Charles Schwab Family of Funds, Schwab Investments, Schwab Capital Trust, Schwab Annuity Portfolios, Schwab Strategic Trust and Laudus Trust since 2016) | Consultant (2008 – present), Patmore Management Consulting (management consulting). | | |
J. Derek Penn 1957 Trustee (Trustee of The Charles Schwab Family of Funds, Schwab Investments, Schwab Capital Trust, Schwab Annuity Portfolios, Schwab Strategic Trust and Laudus Trust since 2021) | Head of Equity Sales and Trading (2006 – 2018), BNY Mellon (financial services). | | |
|
Name, Year of Birth, and Position(s) with the trust (Terms of office, and length of Time Served1) | Principal Occupations During the Past Five Years | Number of Portfolios in Fund Complex Overseen by the Trustee | |
Walter W. Bettinger II2 1960 Chairman and Trustee (Trustee of The Charles Schwab Family of Funds, Schwab Investments, Schwab Capital Trust and Schwab Annuity Portfolios since 2008; Schwab Strategic Trust since 2009; Laudus Trust since 2010) | Co-Chairman of the Board (July 2022 – present), Director and Chief Executive Officer (Oct. 2008 – present) and President (Feb. 2007 – Oct. 2021), The Charles Schwab Corporation; President and Chief Executive Officer (Oct. 2008 – Oct. 2021) and Director (May 2008 – Oct. 2021), Charles Schwab & Co., Inc.; Co-Chairman of the Board (July 2022 – present) and Director (Apr. 2006 – present), Charles Schwab Bank, SSB; Co-Chairman of the Board (July 2022 – present) and Director (Nov. 2017 – present), Charles Schwab Premier Bank, SSB; Co-Chairman of the Board (July 2022 – present) and Director (July 2019 – present), Charles Schwab Trust Bank; Director (May 2008 – present), Chief Executive Officer (Aug. 2017 – present) and President (Aug. 2017 – Nov. 2021), Schwab Holdings, Inc.; Manager (Sept. 2023 – present), TD Ameritrade Holding LLC; Director (Oct. 2020 – Aug. 2023), TD Ameritrade Holding Corporation; Director (July 2016 – Oct. 2021), Charles Schwab Investment Management, Inc. | | Director (2008 – present), The Charles Schwab Corporation |
Richard A. Wurster2 1973 Trustee (Trustee of The Charles Schwab Family of Funds, Schwab Investments, Schwab Capital Trust, Schwab Annuity Portfolios, Schwab Strategic Trust and Laudus Trust since 2022) | President (Oct. 2021 – present) and Executive Vice President – Schwab Asset Management Solutions (Apr. 2019 – Oct. 2021), The Charles Schwab Corporation; President, Director (Oct. 2021 – present), Executive Vice President – Schwab Asset Management Solutions (July 2019 – Oct. 2021) and Senior Vice President – Advisory (May 2016 – July 2019), Charles Schwab & Co., Inc.; President (Nov. 2021 – present), Schwab Holdings, Inc.; Director (Oct. 2021 – present) and Chief Executive Officer (Nov. 2019 – Jan. 2022), Charles Schwab Investment Management, Inc.; Director, Chief Executive Officer and President (Mar. 2018 – Oct. 2022), Charles Schwab Investment Advisory, Inc.; Chief Executive Officer (July 2016 – Apr. 2018) and President (Mar. 2017 – Apr. 2018), ThomasPartners, Inc.; Chief Executive Officer (July 2016 – Apr. 2018), Windhaven Investment Management, Inc. | | |
Schwab MarketTrack Portfolios | Annual Report59
Schwab MarketTrack Portfolios
|
Name, Year of Birth, and Position(s) with the trust (Terms of office, and length of Time Served3) | Principal Occupations During the Past Five Years |
Omar Aguilar 1970 Chief Executive Officer, President and Chief Investment Officer (Officer of The Charles Schwab Family of Funds, Schwab Investments, Schwab Capital Trust, Schwab Annuity Portfolios, Schwab Strategic Trust and Laudus Trust since 2011) | Chief Executive Officer (Jan. 2022 – present), President (Oct. 2023 – present), (Chief Investment Officer (Apr. 2011 – present) and Senior Vice President (Apr. 2011 – Jan. 2022), Charles Schwab Investment Management, Inc.; Director, Chief Executive Officer and President (Oct. 2022 – present), Charles Schwab Investment Advisory, Inc.; Chief Executive Officer (Sept. 2023 – present), President (Oct. 2023 – present), Chief Investment Officer (June 2011 – present) and Vice President (June 2011 – Sept. 2023), Schwab Funds, Laudus Trust and Schwab ETFs. |
Mark Fischer 1970 Chief Operating Officer (Officer of The Charles Schwab Family of Funds, Schwab Investments, Schwab Capital Trust, Schwab Annuity Portfolios, Schwab Strategic Trust and Laudus Trust since 2013) | Chief Operating Officer (Dec. 2020 – present) and Treasurer and Chief Financial Officer (Jan. 2016 – Dec. 2022), Schwab Funds, Laudus Trust and Schwab ETFs; Chief Financial Officer (Mar. 2020 – present), Chief Operating Officer (Oct. 2023 – present), Managing Director (Mar. 2023 – present) and Vice President (Oct. 2013 – Mar. 2023), Charles Schwab Investment Management, Inc. |
Dana Smith 1965 Treasurer and Chief Financial Officer (Officer of The Charles Schwab Family of Funds, Schwab Investments, Schwab Capital Trust, Schwab Annuity Portfolios, Schwab Strategic Trust and Laudus Trust since 2023) | Treasurer and Chief Financial Officer (Jan. 2023 – present) and Assistant Treasurer (Dec. 2015 – Dec. 2022), Schwab Funds, Laudus Trust and Schwab ETFs; Managing Director (Mar. 2023 – present), Vice President (Mar. 2022 – Mar. 2023) and Director (Oct. 2015 – Mar. 2022), Charles Schwab Investment Management, Inc.; Managing Director (May 2022 – present) and Vice President (Apr. 2022 – May 2022), Charles Schwab & Co., Inc. |
Patrick Cassidy 1964 Vice President and Chief Investment Officer (Officer of The Charles Schwab Family of Funds, Schwab Investments, Schwab Capital Trust, Schwab Annuity Portfolios, Schwab Strategic Trust and Laudus Trust since 2018) | Chief Investment Officer (Oct. 2023 – present) and Vice President (Feb. 2018 – present), Schwab Funds, Laudus Trust and Schwab ETFs; Managing Director (Mar. 2023 – present), Chief Investment Officer (Oct. 2023 – present), and Senior Vice President (Oct. 2012 – Mar. 2023), Charles Schwab Investment Management, Inc. |
William P. McMahon, Jr. 1972 Vice President and Chief Investment Officer (Officer of The Charles Schwab Family of Funds, Schwab Investments, Schwab Capital Trust, Schwab Annuity Portfolios, Schwab Strategic Trust and Laudus Trust since 2021) | Managing Director (Mar. 2023 – present), Senior Vice President (Jan. 2020 – Mar. 2023) and Chief Investment Officer (Jan. 2020 – present) Charles Schwab Investment Management, Inc.; Vice President and Chief Investment Officer (June 2021 – present), Schwab Funds, Laudus Trust and Schwab ETFs; Senior Vice President and Chief Investment Officer – ThomasPartners Strategies (Apr. 2018 – Dec. 2019), Charles Schwab Investment Advisory, Inc.; Senior Vice President and Chief Investment Officer (May 2001 – Apr. 2018), ThomasPartners, Inc. |
Catherine MacGregor 1964 Chief Legal Officer and Secretary, Schwab Funds and Schwab ETFs Chief Legal Officer, Vice President and Clerk, Laudus Trust (Officer of The Charles Schwab Family of Funds, Schwab Investments, Schwab Capital Trust, Schwab Annuity Portfolios and Laudus Trust since 2005; Schwab Strategic Trust since 2009) | Chief Legal Officer (Mar. 2022 – present), Managing Director (Mar. 2023 – present) and Vice President (Sept. 2005 – Mar. 2023), Charles Schwab Investment Management, Inc.; Managing Director (May 2022 – present) and Vice President (Aug. 2005 – May 2022), Charles Schwab & Co., Inc.; Vice President (Dec. 2005 – present) and Chief Legal Officer and Clerk (Mar. 2007 – present), Laudus Trust; Chief Legal Officer and Secretary (Oct. 2021 – present), Vice President (Nov. 2005 – Oct. 2021) and Assistant Secretary (June 2007 – Oct. 2021), Schwab Funds; Chief Legal Officer and Secretary (Oct. 2021 – present), Vice President and Assistant Secretary (Oct. 2009 – Oct. 2021), Schwab ETFs. |
1
Each Trustee shall hold office until the election and qualification of his or her successor, or until he or she dies, resigns or is removed. The retirement policy requires that each independent trustee retire by December 31 of the year in which the Trustee turns 74 or the Trustee’s twentieth year of service as an independent trustee on any trust in the Fund Complex, whichever occurs first.
2
Mr. Bettinger and Mr. Wurster are Interested Trustees. Mr. Bettinger and Mr. Wurster are Interested Trustees because each owns stock of The Charles Schwab Corporation (CSC), the parent company of Charles Schwab Investment Management, Inc., the investment adviser for the trusts in the Fund Complex, and is an employee of Charles Schwab & Co., Inc. (Schwab), the principal underwriter for The Charles Schwab Family of Funds, Schwab Investments, Schwab Capital Trust, Schwab Annuity Portfolios and Laudus Trust.
3
The President, Treasurer and Secretary/Clerk hold office until their respective successors are chosen and qualified or until he or she sooner dies, resigns, is removed or becomes disqualified. Each of the other officers serves at the pleasure of the Board.
60
Schwab MarketTrack Portfolios | Annual Report
Schwab MarketTrack Portfolios
All Equity Composite Index A custom blended index developed by Schwab Asset Management based on a comparable portfolio asset allocation. Effective July 1, 2020, the index is composed of 31.33% S&P 500 Index, 5.0% Russell 1000 Growth Index, 13.5% Russell RAFI US Large Company Index, 10.33% Russell 2000 Index, 4.5% Russell RAFI US Small Company Index, 13.83% MSCI EAFE Index (Net), 6.0% Russell RAFI Developed ex US Large Company Index (Net), 5.0% Russell RAFI Developed ex US Small Company Index (Net), 5.0% Russell RAFI Emerging Markets Large Company Index (Net), 5.0% Dow Jones Equity All REIT Capped Index, and 0.5% Bloomberg US Treasury Bills 1-3 Month Index. From February 28, 2020 through June 30, 2020, the index was composed of 31.33% S&P 500 Index, 5.0% Russell 1000 Growth Index, 13.5% Russell RAFI US Large Company Index, 10.33% Russell 2000 Index, 4.5% Russell RAFI US Small Company Index, 13.83% MSCI EAFE Index (Net), 6.0% Russell RAFI Developed ex US Large Company Index (Net), 5.0% Russell RAFI Developed ex US Small Company Index (Net), 5.0% Russell RAFI Emerging Markets Large Company Index (Net), 5.0% Dow Jones U.S. Select REIT Index, and 0.5% Bloomberg US Treasury Bills 1-3 Month Index. From December 1, 2014 through February 27, 2020, the index was composed of 31.33% S&P 500 Index, 17.33% Russell 2000 Index, 13.50% Russell RAFI US Large Company Index, 7.50% Russell RAFI US Small Company Index, 13.83% MSCI EAFE Index (Net), 6% Russell RAFI Developed ex US Large Company Index (Net), 5% Russell RAFI Developed ex US Small Company Index (Net), 5% Russell RAFI Emerging Markets Large Company Index (Net), and 0.5% Bloomberg US Treasury Bills 1-3 Month Index. From March 1, 2014 through November 30, 2014, the index was composed of 45% S&P 500 Index, 25% Russell 2000 Index and 30% MSCI EAFE Index (Net). On March 1, 2014, the combination of the S&P 500 Index and Russell 2000 Index replaced the Dow Jones U.S. Total Stock Market Index in the custom index. Prior to March 1, 2014, the index was composed of 70% Dow Jones U.S. Total Stock Market Index and 30% MSCI EAFE Index (Net). Percentages listed may not total to 100% due to rounding.
asset allocation The practice of dividing a portfolio among different asset classes, with each asset class assigned a particular percentage.
asset class A group of securities with similar structure and basic characteristics. Stocks, bonds and cash are the three main examples of asset classes.
Balanced Composite Index A custom blended index developed by Schwab Asset Management based on a comparable portfolio asset allocation. Effective July 1, 2020 the index is composed of 21.0% S&P 500 Index, 3.0% Russell 1000 Growth Index, 9.0% Russell RAFI US Large Company Index, 6.3% Russell 2000 Index, 2.7% Russell RAFI US Small Company Index, 7.0% MSCI EAFE Index (Net), 3.0% Russell RAFI Developed ex US Large Company Index (Net), 2.5% Russell RAFI Developed ex US Small Company Index (Net), 2.5% Russell RAFI Emerging Markets Large Company Index (Net), 3.0% Dow Jones Equity All REIT Capped Index, 35.0% Bloomberg US Aggregate Bond Index, 1.0% Bloomberg US Government/Credit 1-5 Year Index, and 4.0% Bloomberg US Treasury Bills 1-3 Month Index. From February 28, 2020 through June 30, 2020, the index was composed of 21% S&P 500 Index, 3.0% Russell 1000 Growth Index, 9.0% Russell RAFI US Large Company Index, 6.3% Russell 2000 Index, 2.7% Russell RAFI US Small Company Index, 7.0% MSCI EAFE Index (Net), 3.0% Russell RAFI Developed ex US Large Company Index (Net), 2.5% Russell RAFI Developed ex US Small Company Index (Net), 2.5% Russell RAFI Emerging Markets Large Company Index (Net), 3.0% Dow Jones U.S. Select REIT Index, 35.0% Bloomberg US Aggregate Bond Index, 1.0% Bloomberg US Government/Credit 1-5 Year Index, and 4.0% Bloomberg US Treasury Bills 1-3 Month Index. From December 1, 2014
through February 27, 2020, the Balanced Composite Index was composed of 21% S&P 500 Index, 10.5% Russell 2000 Index, 9% Russell RAFI US Large Company Index, 4.5% Russell RAFI US Small Company Index, 7% MSCI EAFE Index (Net), 3% Russell RAFI Developed ex US Large Company Index (Net), 2.5% Russell RAFI Developed ex US Small Company Index (Net), 2.5% Russell RAFI Emerging Markets Large Company Index (Net), 35% Bloomberg US Aggregate Bond Index, and 5% Bloomberg US Treasury Bills 1-3 Month Index. From March 1, 2014 through November 30, 2014, the index was composed of 30% S&P 500 Index, 15% Russell 2000 Index, 15% MSCI EAFE Index (Net), 35% Bloomberg US Aggregate Bond Index, and 5% Bloomberg US Treasury Bills 1-3 Month Index. On March 1, 2014, the combination of the S&P 500 Index and Russell 2000 Index replaced the Dow Jones U.S. Total Stock Market Index in the custom index. Prior to March 1, 2014, the index was composed of 45% Dow Jones U.S. Total Stock Market Index, 15% MSCI EAFE Index (Net), 35% Bloomberg US Aggregate Bond Index, and 5% Bloomberg US Treasury Bills 1-3 Month Index. Percentages listed may not total to 100% due to rounding.
Bloomberg US Aggregate Bond Index An index that is a broad-based benchmark measuring the performance of the U.S. investment grade, taxable bond market, including U.S. Treasuries, government-related and corporate bonds, mortgage pass-through securities, commercial mortgage-backed securities, and asset-backed securities that are publicly available for sale in the United States. To be eligible for inclusion in the index, securities must be fixed rate, non-convertible, U.S. dollar-denominated with at least $300 million or more of outstanding face value and have one or more years remaining to maturity. The index excludes certain types of securities, including tax-exempt state and local government series bonds, structured notes embedded with swaps or other special features, private placements, floating rate securities, inflation-linked bonds and Eurobonds. The index is market capitalization weighted and the securities in the index are updated on the last business day of each month.
Bloomberg US Government/Credit 1–5 Year Index An index that is a broad-based benchmark measuring the performance of U.S. dollar-denominated U.S. Treasury bonds, government related bonds (i.e., U.S. and non-U.S. agencies, sovereign, quasi-sovereign, supranational and local authority debt) and investment grade U.S. corporate bonds that have a remaining maturity of greater than or equal to one year and less than five years. To be eligible for inclusion in the index, securities must be fixed rate, non-convertible, U.S. dollar-denominated with at least $300 million or more of outstanding face value and have a remaining maturity greater than or equal to one year and less than five years. The index excludes certain types of securities, including, bonds with equity type features (e.g., warrants, convertibles and preferreds), tax-exempt municipal securities, inflation-linked bonds, floating rate issues, strips, private placements, U.S. dollar-denominated 25 and 50 par retail bonds, structured notes and pass-through certificates. The index is market capitalization weighted and the securities in the index are updated on the last business day of each month.
Bloomberg US Treasury Bills 1–3 Month Index An index that includes all publicly issued zero-coupon U.S. Treasury Bills that have a remaining maturity of less than 3 months but more than 1 month, are rated investment grade and have $300 million or more of outstanding face value. It excludes zero-coupon STRIPS.
Schwab MarketTrack Portfolios | Annual Report61
Schwab MarketTrack Portfolios
bond A security representing a loan from the investor to the issuer. A bond typically pays interest at a fixed rate (the coupon rate) until a specified date (the maturity date), at which time the issuer returns the money borrowed (principal or face value) to the bondholder. Because of their structure, bonds are sometimes called “fixed-income securities” or “debt securities.”
An individual bond is subject to the credit risk of the issuer. Changes in interest rates can affect a bond’s market value prior to call or maturity. There is no guarantee that a bond’s yield to call or maturity will provide a positive return over the rate of inflation.
bond fund A bond fund is subject to the same credit, interest rate, and inflation risks as bonds. In addition, a bond fund incurs ongoing fees and expenses. A bond fund’s net asset value will fluctuate with the price of the underlying bonds and the portfolio turnover activity; return of principal is not guaranteed.
cap, capitalization See “market cap.”
capital gain, capital loss the difference between the amount paid for an investment and its value at a later time. If the investment has been sold, the capital gain or loss is considered a realized gain or loss. If the investment is still held, the capital gain or loss is considered unrealized appreciation or depreciation.
Conservative Composite Index A custom blended index developed by Schwab Asset Management based on a comparable portfolio asset allocation. Effective July 1, 2020, the index is composed of 14.0% S&P 500 Index, 2.0% Russell 1000 Growth Index, 6.0% Russell RAFI US Large Company Index, 4.67% MSCI EAFE Index (Net), 4.2% Russell 2000 Index, 1.8% Russell RAFI US Small Company Index, 2.0% Russell RAFI Developed ex US Large Company Index (Net), 1.67% Russell RAFI Developed ex US Small Company Index (Net), 1.67% Russell RAFI Emerging Markets Large Company Index (Net), 2.0% Dow Jones Equity All REIT Capped Index, 55.0% Bloomberg US Aggregate Bond Index, 1.0% Bloomberg US Government/Credit 1-5 Year Index, and 4.0% Bloomberg US Treasury Bills 1-3 Month Index. From February 28, 2020 through June 30, 2020, the index was composed of 14.0% S&P 500 Index, 2.0% Russell 1000 Growth Index, 6.0% Russell RAFI US Large Company Index, 4.67% MSCI EAFE Index (Net), 4.2% Russell 2000 Index, 1.8% Russell RAFI US Small Company Index, 2.0% Russell RAFI Developed ex US Large Company Index (Net), 1.67% Russell RAFI Developed ex US Small Company Index (Net), 1.67% Russell RAFI Emerging Markets Large Company Index (Net), 2.0% Dow Jones U.S. Select REIT Index, 55.0% Bloomberg US Aggregate Bond Index, 1.0% Bloomberg US Government/Credit 1-5 Year Index, and 4.0% Bloomberg US Treasury Bills 1-3 Month Index. From December 1, 2014, through February 27, 2020, the index was composed of 14.0% S&P 500 Index, 7.0% Russell 2000 Index, 6.0% Russell RAFI US Large Company Index, 3.0% Russell RAFI US Small Company Index, 4.67% MSCI EAFE Index (Net), 2.0% Russell RAFI Developed ex US Large Company Index (Net), 1.67% Russell RAFI Developed ex US Small Company Index (Net), 1.67% Russell RAFI Emerging Markets Large Company Index (Net), 55.0% Bloomberg US Aggregate Bond Index, and 5.0% Bloomberg US Treasury Bills 1-3 Month Index. From March 1, 2014 through November 30, 2014, the index was composed of 20% S&P 500 Index, 10% Russell 2000 Index, 10% MSCI EAFE Index (Net), 55% Bloomberg US Aggregate Bond Index, and 5% Bloomberg US Treasury Bills 1-3 Month Index. On March 1, 2014, the combination of the S&P 500 Index and Russell 2000 Index replaced the Dow Jones U.S. Total Stock Market Index in the custom index. Prior to March 1, 2014, the index was composed of 30% Dow Jones U.S. Total Stock Market Index, 10% MSCI EAFE Index (Net), 55% Bloomberg US Aggregate Bond Index, and 5% Bloomberg US Treasury Bills 1-3 Month Index. Percentages listed may not total to 100% due to rounding.
Dow Jones Equity All REIT Capped Index A float-adjusted market cap weighted index that is designed to measure all equity real estate investment trusts (REITs) in the Dow Jones U.S. Total Stock Market Index, as defined by the S&P Dow Jones Indices REIT/RESI Industry Classification Hierarchy, that meet the minimum float market capitalization (FMC) and liquidity thresholds. The aggregate weight of all companies weighing more than 4.5% cannot exceed 22.5%, and no single company’s weight can exceed 10%. The index is reviewed daily based on each company’s capped market capitalization weight. Daily capping is only performed when the sum of companies with weights greater than 5% exceeds 25%.
Dow Jones U.S. Select REIT Index An index that is a float-adjusted market-capitalization weighted index comprised of income-producing commercial and/or residential real estate investment trusts (REITs). The index excludes mortgage REITs, net-lease REITs, real estate finance companies, mortgage brokers and bankers, commercial and residential real estate brokers and estate agents, homebuilders, large landowners and sub-dividers of unimproved land, hybrid REITs, timber REITs and companies that have more than 25% of their assets in direct mortgage investments.
Dow Jones U.S. Total Stock Market Index An index which includes all U.S. equity issues with readily available prices. The index is a float-adjusted market capitalization weighted index that reflects the shares of securities actually available to investors in the marketplace.
expense ratio The amount that is taken from a mutual fund’s assets each year to cover the fund’s operating expenses. An expense ratio of 0.50% means that a fund’s expenses amount to half of one percent of its average net assets a year.
FTSE non-US Dollar World Government Bond Index A market capitalization index that measures the total rate of return performance for the government bonds of 22 countries, excluding the U.S., with a remaining maturity of at least 1 year.
Growth Composite Index A custom blended index developed by Schwab Asset Management based on a comparable portfolio asset allocation. Effective July 1, 2020 the index is composed of 28.0% S&P 500 Index, 3.3% Russell 1000 Growth Index, 12.0% Russell RAFI US Large Company Index, 8.9% Russell 2000 Index, 3.8% Russell RAFI US Small Company Index, 9.33% MSCI EAFE Index (Net), 4.0% Russell RAFI Developed ex US Large Company Index (Net), 3.33% Russell RAFI Developed ex US Small Company Index (Net), 3.33% Russell RAFI Emerging Markets Large Company Index (Net), 4.0% Dow Jones Equity All REIT Capped Index, 16.0% Bloomberg US Aggregate Bond Index, and 4.0% Bloomberg US Treasury Bills 1-3 Month Index. From February 28, 2020 through June 30, 2020, the index was composed of 28.0% S&P 500 Index, 3.3% Russell 1000 Growth Index, 12.0% Russell RAFI US Large Company Index, 8.9% Russell 2000 Index, 3.8% Russell RAFI US Small Company Index, 9.33% MSCI EAFE Index (Net), 4.0% Russell RAFI Developed ex US Large Company Index (Net), 3.33% Russell RAFI Developed ex US Small Company Index (Net), 3.33% Russell RAFI Emerging Markets Large Company Index (Net), 4.0% Dow Jones U.S. Select REIT Index, 16.0% Bloomberg US Aggregate Bond Index, and 4.0% Bloomberg US Treasury Bills 1-3 Month Index. From December 1, 2014 through February 27, 2020, the Growth Composite Index was composed of 28% S&P 500 Index, 14% Russell 2000 Index, 12% Russell RAFI US Large Company Index, 6% Russell RAFI US Small Company Index, 9.33% MSCI EAFE Index (Net), 4% Russell RAFI Developed ex US Large Company Index (Net), 3.33% Russell RAFI Developed ex US Small Company Index (Net), 3.33% Russell RAFI Emerging Markets Large Company Index (Net), 15% Bloomberg US Aggregate Bond Index, and 5% Bloomberg US Treasury Bills 1-3 Month Index. From March 1, 2014 through November 30, 2014, the index was composed of 40% S&P 500 Index, 20% Russell 2000 Index, 20% MSCI EAFE Index (Net), 15% Bloomberg US Aggregate Bond Index, and 5% Bloomberg US Treasury Bills 1-3 Month Index. On March 1, 2014, the
62
Schwab MarketTrack Portfolios | Annual Report
Schwab MarketTrack Portfolios
combination of the S&P 500 Index and Russell 2000 Index replaced the Dow Jones U.S. Total Stock Market Index in the custom index. Prior to March 1, 2014 the index was composed of 60% Dow Jones U.S. Total Stock Market Index, 20% MSCI EAFE Index (Net), 15% Bloomberg US Aggregate Bond Index, and 5% Bloomberg US Treasury Bills 1-3 Month Index. Percentages listed may not total to 100% due to rounding.
market cap, market capitalization The value of a company as determined by the total value of all shares of its stock outstanding.
MSCI EAFE Index (Net) A free float-adjusted market capitalization index that is designed to measure the equity market performance of developed markets in Europe, Australasia, and the Far East. The Net version of the index reflects reinvested dividends net of withholding taxes, but reflects no deductions for expenses or other taxes; returns are calculated applying dividend withholding rates applicable to non-resident persons who do not benefit from double taxation treaties.
MSCI Emerging Markets Index (Net) A free float-adjusted market capitalization weighted index that is designed to measure equity market performance in the global emerging markets. This series approximates the minimum possible dividend reinvestment. The returns are calculated applying dividend withholding rates applicable to non-resident persons who do not benefit from double taxation treaties.
net asset value (NAV) The value of one share of a mutual fund. NAV is calculated by taking the fund’s total assets, subtracting liabilities, and dividing by the number of shares outstanding.
outstanding shares, shares outstanding When speaking of a company or mutual fund, indicates all shares currently held by investors.
price-to-book ratio (P/B) The market price of a company’s stock compared with its “book value.” A mutual fund’s P/B is the weighted average of the P/B of all stocks in the fund’s portfolio.
price-to-earnings ratio (P/E) The market price of a company’s stock compared with earnings over the past year. A mutual fund’s P/E is the weighted average of the P/E of all stocks in the fund’s portfolio.
return on equity (ROE) The average yearly rate of return for each dollar of investors’ money, measured over the past five years.
Russell 1000 Growth Index An index that measures the performance of those Russell 1000 Index companies with higher price-to-book ratios and higher forecasted growth values.
Russell 1000 Index An index that measures the performance of the 1,000 largest companies in the Russell 3000 Index, and represents approximately 92% of the total market capitalization of the Russell 3000 Index. The Russell 3000 Index measures the performance of the largest 3,000 U.S. companies representing approximately 98% of the investable U.S. equity market.
Russell 1000 Value Index An index that measures the performance of the large-cap value segment of the U.S. equity universe. It includes those Russell 1000 Index companies with lower price-to-book ratios and lower expected growth values.
Russell 2000 Index An index that measures the performance of the 2,000 smallest companies in the Russell 3000 Index. The Russell 3000 Index measures the performance of the largest 3,000 U.S. companies representing approximately 98% of the investable U.S. equity market.
Russell RAFI Developed ex US Large Company Index (Net) An index that ranks developed ex-U.S. companies in the FTSE Global Total Cap Index by fundamental measures of size and tracks the performance of those companies whose fundamental scores are in the top 87.5%. The index uses a partial quarterly reconstitution methodology in which the
index is split into four equal segments at the annual reconstitution and each segment is then rebalanced on a rolling quarterly basis. The Net series reduces index performance by adjusting for local taxes. Selecting the developed ex-U.S. companies in the FTSE Global Total Cap Index measures the performance of the largest investable securities in developed countries globally, excluding companies assigned to the United States.
Russell RAFI Developed ex US Small Company Index (Net) An index that ranks developed ex-U.S. companies in the FTSE Global Total Cap Index by fundamental measures of size and tracks the performance of those companies whose fundamental scores rank below the 87.5% threshold. The index uses a partial quarterly reconstitution methodology in which the index is split into four equal segments at the annual reconstitution and each segment is then rebalanced on a rolling quarterly basis. The Net series reduces index performance by adjusting for local taxes. Selecting the developed ex-U.S. companies in the FTSE Global Total Cap Index measures the performance of the smallest investable securities in developed countries globally, excluding companies assigned to the United States.
Russell RAFI Emerging Markets Large Company Index (Net) An index that ranks emerging market companies in the FTSE Global Total Cap Index by measures of fundamental size and tracks the performance of those companies whose fundamental scores are in the top 87.5%. The index uses a partial quarterly reconstitution methodology in which the index is split into four equal segments at the annual reconstitution and each segment is then rebalanced on a rolling quarterly basis. The Net series reduces index performance by adjusting for local taxes. Selecting the emerging companies in the FTSE Global Total Cap Index measures the performance of the investable securities in emerging markets globally.
Russell RAFI US Large Company Index An index that ranks U.S. companies in the FTSE Global Total Cap Index. The Russell RAFI US Large Company Index includes only those securities that are members of the U.S. portion whose fundamental scores are in the top 87.5%. The index uses a partial quarterly reconstitution methodology in which the index is split into four equal segments at the annual reconstitution and each segment is then rebalanced on a rolling quarterly basis.
Russell RAFI US Small Company Index An index that ranks U.S. companies in the FTSE Global Total Cap Index. The Russell RAFI US Small Company Index includes only those securities that are members of the U.S. portion and rank below the 87.5% fundamental score threshold. The index uses a partial quarterly reconstitution methodology in which the index is split into four equal segments at the annual reconstitution and each segment is then rebalanced on a rolling quarterly basis.
S&P 500 Index An index that is designed to measure the performance of 500 leading publicly traded companies from a broad range of industries.
stock A share of ownership, or equity, in the issuing company.
total return The percentage that an investor would have earned or lost on an investment in the fund assuming dividends and distributions were reinvested.
weighted average For mutual funds, an average that gives the same weight to each security as the security represents in the fund’s portfolio.
yield The income paid out by an investment, expressed as a percentage of the investment’s market value.
Schwab MarketTrack Portfolios | Annual Report63
Schwab MarketTrack Portfolios
Schwab Asset Management
With a straightforward lineup of core products and solutions for building the foundation of a portfolio, Schwab Asset Management advocates for investors of all sizes with a steadfast focus on lowering costs and reducing unnecessary complexity. The list below shows all currently available Schwab Funds®.
Investors should carefully consider information contained in the prospectus, or if available, the summary prospectus, including investment objectives, risks, charges and expenses before investing. Please call 1-877-824-5615 for a prospectus for any Schwab Fund. Please read the prospectus carefully before you invest. This report must be preceded or accompanied by a current prospectus.
Proxy Voting Policies, Procedures and Results
A description of the proxy voting policies and procedures used to determine how to vote proxies on behalf of the funds is available without charge, upon request, by visiting the Schwab Funds’ website at www.schwabassetmanagement.com/schwabfunds_prospectus, the SEC’s website at www.sec.gov, or by contacting Schwab Funds at 1-877-824-5615.
Information regarding how a fund voted proxies relating to portfolio securities during the most recent twelve-month period ended June 30 is available, without charge, by visiting the fund’s website at www.schwabassetmanagement.com/schwabfunds_prospectus or the SEC’s website at www.sec.gov.
Schwab Funds
Equity Funds
Schwab Core Equity Fund
Schwab Dividend Equity Fund
Schwab Large-Cap Growth Fund
Schwab Small-Cap Equity Fund
Schwab Health Care Fund
Schwab International Core Equity Fund
Schwab International Opportunities Fund
Schwab Select Large Cap Growth Fund
Schwab Fundamental US Large Company Index Fund
Schwab Fundamental US Small Company Index Fund
Schwab Fundamental International Large Company Index Fund
Schwab Fundamental International Small Company Index Fund
Schwab Fundamental Emerging Markets Large Company Index Fund
Schwab Fundamental Global Real Estate Index Fund
Schwab Global Real Estate Fund
Schwab S&P 500 Index Fund
Schwab 1000 Index® Fund
Schwab Small-Cap Index Fund®
Schwab Total Stock Market Index Fund®
Schwab U.S. Large-Cap Growth Index Fund
Schwab U.S. Large-Cap Value Index Fund
Schwab U.S. Mid-Cap Index Fund
Schwab International Index Fund®
Asset Allocation Funds
Schwab Balanced Fund
Schwab MarketTrack Portfolios®
Schwab Target Funds
Schwab Target Index Funds
Schwab Monthly Income Funds
Bond Funds
Schwab Treasury Inflation Protected Securities Index Fund
Schwab U.S. Aggregate Bond Index Fund
Schwab Short-Term Bond Index Fund
Schwab Tax-Free Bond Fund1
Schwab California Tax-Free Bond Fund1
Schwab Opportunistic Municipal Bond Fund
Schwab Money Funds2
Schwab provides a broad choice of taxable and tax-exempt money market funds for both retail and institutional client types.
Investment Adviser
Charles Schwab Investment Management, Inc., dba Schwab Asset Management
211 Main Street, San Francisco, CA 94105
Funds
Schwab Funds
1-877-824-5615
© 2023 Charles Schwab & Co., Inc. All rights reserved.
Member SIPC®
Printed on recycled paper.
¹
State, local, and the Federal Alternative Minimum Tax may apply. Capital gains are not exempt from Federal Taxation.
²
You could lose money by investing in the Schwab Money Funds. All Schwab Money Funds with the exception of Schwab Variable Share Price Money Fund seek to preserve the value of your investment at $1.00 per share, but cannot guarantee they will do so. Because the share price of Schwab Variable Share Price Money Fund will fluctuate, when you sell your shares they may be worth more or less than what you originally paid for them. All Schwab Money Funds with the exception of Schwab Government Money Fund, Schwab Retirement Government Money Fund, Schwab U.S. Treasury Money Fund, Schwab Treasury Obligations Money Fund and Schwab Government Money Market Portfolio may impose a fee upon the sale of your shares if the Fund’s Board determines that the fee is in the best interests of the Fund. An investment in the Schwab Money Funds is not insured or guaranteed by the Federal Deposit Insurance Corporation or any other government agency. The Schwab Money Funds’ sponsor has no legal obligation to provide financial support to the Funds, and you should not expect that the sponsor will provide financial support to the Funds at any time.
This page is intentionally left blank.
Annual Report | October 31, 2023
Schwab Target Funds
Schwab Target 2010 Fund
Schwab Target 2015 Fund
Schwab Target 2020 Fund
Schwab Target 2025 Fund
Schwab Target 2030 Fund
Schwab Target 2035 Fund
Schwab Target 2040 Fund
Schwab Target 2045 Fund
Schwab Target 2050 Fund
Schwab Target 2055 Fund
Schwab Target 2060 Fund
Schwab Target 2065 Fund
This page is intentionally left blank.
Fund investment adviser: Charles Schwab Investment Management, Inc., dba Schwab Asset Management®
Distributor: Charles Schwab & Co., Inc. (Schwab)
Schwab Target Funds | Annual Report1
The performance data quoted represents past performance. Past performance does not guarantee future results. Investment returns and principal value of an investment will fluctuate so that an investor’s shares may be worth more or less than their original cost. Current performance may be lower or higher than performance data quoted. To obtain performance information current to the most recent month end, please visit www.schwabassetmanagement.com/schwabfunds_prospectus.
Total Return for the 12 Months Ended October 31, 2023 |
Schwab Target 2010 Fund (Ticker Symbol: SWBRX) | |
Target 2010 Composite Index | |
Fund Category: Morningstar Target-Date 2000-20101 | |
| |
| |
Schwab Target 2015 Fund (Ticker Symbol: SWGRX) | |
Target 2015 Composite Index | |
Fund Category: Morningstar Target-Date 20151 | |
| |
| |
Schwab Target 2020 Fund (Ticker Symbol: SWCRX) | |
Target 2020 Composite Index | |
Fund Category: Morningstar Target-Date 20201 | |
| |
| |
Schwab Target 2025 Fund (Ticker Symbol: SWHRX) | |
Target 2025 Composite Index | |
Fund Category: Morningstar Target-Date 20251 | |
| |
| |
Schwab Target 2030 Fund (Ticker Symbol: SWDRX) | |
Target 2030 Composite Index | |
Fund Category: Morningstar Target-Date 20301 | |
| |
| |
Schwab Target 2035 Fund (Ticker Symbol: SWIRX) | |
Target 2035 Composite Index | |
Fund Category: Morningstar Target-Date 20351 | |
| |
All total returns on this page assume dividends and distributions were reinvested. Index figures do not include trading and management costs, which would lower performance. Indices are unmanaged and cannot be invested in directly. Performance results less than one year are not annualized.
The components that make up each of the composite indices may vary over time. For index definitions, please see the Glossary.
Fund expenses may have been partially absorbed by the investment adviser and its affiliates. Without these reductions, a fund’s total return would have been lower. Performance does not reflect the deduction of taxes that a shareholder would pay on fund distributions or on the redemption of fund shares.
1
Source for category information: Morningstar, Inc. The Morningstar Category return represents all active and index mutual funds and ETFs within the category as of the report date.
2
Schwab Target Funds | Annual Report
Performance at a Glance (continued)
Total Return for the 12 Months Ended October 31, 2023 |
Schwab Target 2040 Fund (Ticker Symbol: SWERX) | |
Target 2040 Composite Index | |
Fund Category: Morningstar Target-Date 20401 | |
| |
| |
Schwab Target 2045 Fund (Ticker Symbol: SWMRX) | |
Target 2045 Composite Index | |
Fund Category: Morningstar Target-Date 20451 | |
| |
| |
Schwab Target 2050 Fund (Ticker Symbol: SWNRX) | |
Target 2050 Composite Index | |
Fund Category: Morningstar Target-Date 20501 | |
| |
| |
Schwab Target 2055 Fund (Ticker Symbol: SWORX) | |
Target 2055 Composite Index | |
Fund Category: Morningstar Target-Date 20551 | |
| |
| |
Schwab Target 2060 Fund (Ticker Symbol: SWPRX) | |
Target 2060 Composite Index | |
Fund Category: Morningstar Target-Date 20601 | |
| |
| |
Schwab Target 2065 Fund (Ticker Symbol: SWQRX) | |
Target 2065 Composite Index | |
Fund Category: Morningstar Target-Date 2065+1 | |
| |
All total returns on this page assume dividends and distributions were reinvested. Index figures do not include trading and management costs, which would lower performance. Indices are unmanaged and cannot be invested in directly. Performance results less than one year are not annualized.
The components that make up each of the composite indices may vary over time. For index definitions, please see the Glossary.
Fund expenses may have been partially absorbed by the investment adviser and its affiliates. Without these reductions, a fund’s total return would have been lower. Performance does not reflect the deduction of taxes that a shareholder would pay on fund distributions or on the redemption of fund shares.
1
Source for category information: Morningstar, Inc. The Morningstar Category return represents all active and index mutual funds and ETFs within the category as of the report date.
Schwab Target Funds | Annual Report3
The Investment Environment
For the 12-month reporting period ended October 31, 2023, U.S. equity markets were mixed, and international equity markets posted positive returns. U.S. stocks were volatile for the first half of the reporting period as inflation remained elevated, the U.S. Federal Reserve (Fed) continued to raise interest rates, and the failure of three U.S. regional banks in early March raised concerns about the stability of the banking sector. Despite these headwinds, as inflation began to ease, U.S. stocks staged a relatively steady upswing through August driven primarily by performance of the “Magnificent Seven” (Alphabet, Inc., Amazon.com, Inc., Apple, Inc., Meta Platforms, Inc., Microsoft Corp., NVIDIA Corp., and Tesla, Inc.). U.S. stocks, particularly dividend paying stocks, began to falter over the final two months of the reporting period as soaring U.S. Treasury yields offered investors attractive alternatives to stocks. Outside the U.S., the ongoing war between Russia and Ukraine and the Israel-Hamas war that broke out following Hamas’ attack on Israel in early October weighed on the global economy. The U.S. dollar, as measured against a basket of international currencies, generally weakened until mid-July, when it hit a reporting-period low, then began to rise but ended the reporting period weaker than where it began. For the reporting period, the S&P 500® Index, a bellwether for the overall U.S. stock market, returned 10.14%. U.S. large-cap stocks outperformed U.S. small-cap stocks, with the Russell 1000® Index and the Russell 2000® Index returning 9.48% and -8.56%, respectively. Among U.S. large-cap stocks, growth stocks outperformed value stocks, with the Russell 1000® Growth Index and the Russell 1000® Value Index returning 18.95% and 0.13%, respectively. Outside the U.S., the MSCI EAFE® Index (Net)*, a broad measure of developed international equity performance, returned 14.40% and the MSCI Emerging Markets Index (Net)* returned 10.80%. U.S. and international bonds were relatively weak as economic uncertainty and rising interest rates over much of the period drove yields up and bond prices down. (Bond yields and bond prices typically move in opposite directions.) The Bloomberg US Aggregate Bond Index returned 0.36% and the FTSE non–US Dollar World Government Bond Index returned 1.32%.
Economies around the world grew out of sync as they wrestled with record levels of government debt, rising geopolitical tensions, and weak productivity gains that stifled economic growth. The U.S. economy continued to show unexpected resiliency. Surprisingly robust job growth and strong consumer spending helped propel U.S. gross domestic product (GDP) to a 5.2% annualized growth rate for the third quarter of 2023, up from roughly 2% over the prior three quarters. Inflation remained above the Fed’s historical 2% target over the reporting period but declined
Asset Class Performance Comparison % returns during the 12 months ended October 31, 2023
Index figures assume dividends and distributions were reinvested. Index figures do not include trading and management costs, which would lower performance. Indices are unmanaged and cannot be invested in directly. Performance results less than one year are not annualized. Past performance is not an indication of future results.
For index definitions, please see the Glossary.
Data source: Index provider websites and Schwab Asset Management.
Nothing in this report represents a recommendation of a security by the investment adviser.
Management views may have changed since the report date.
*
The net version of the index reflects reinvested dividends net of withholding taxes but reflects no deductions for expenses or other taxes.
4
Schwab Target Funds | Annual Report
The Investment Environment (continued)
between November 2022 and June 2023 as rents and wage growth eased, profit margins declined, and monetary policy remained restrictive before ticking up slightly in July 2023 through September 2023. The unemployment rate remained low throughout the period despite inflationary pressures but did rise slightly in August and October. An increase in the labor force participation rate (the proportion of working-age Americans who have a job or are looking for one) in August and strike activity in October were large contributors to the increase in unemployment in the last three months of the reporting period.
Oil prices were volatile, ranging from a high of $92 per barrel at the beginning of the reporting period to a low of $66 and ending the period at just over $80 per barrel. Eurozone GDP growth contracted slightly in the fourth quarter of 2022 driven by manufacturing pressures and headwinds related to oil and commodity prices, was flat for the first quarter of 2023, expanded slightly for the second quarter of 2023 bolstered by a moderation in inflationary pressures, and contracted slightly for the third quarter of 2023 as financing conditions remained tight. The United Kingdom posted small gains in GDP growth throughout the reporting period, with household consumption expenditures and manufacturing output among key growth drivers. In Japan, following flat GDP growth in the fourth quarter of 2022, GDP rose for the first two quarters of 2023, primarily on rising exports and falling imports. Among emerging markets, China’s GDP grew throughout the reporting period as the government’s various policies seeking to help the economy have offset the impact of a prolonged property crisis and weak trade. India’s GDP grew in the fourth quarter of 2022 and the first two quarters of 2023, driven primarily by robust performance of the services sector along with strong consumer demand and increased government spending.
In its efforts to lower inflation, the Fed raised interest rates six times during the reporting period, increasing the federal funds rate from a range of 3.00% to 3.25% to a range of 5.25% to 5.50%. At its meetings in June, September, and October, the Fed maintained the then current rates, citing robust economic activity, strong—though moderating—job gains, and low unemployment while acknowledging tighter financial and credit conditions for households and businesses. The Fed also maintained its program to reduce the assets held on its balance sheet, though its balance sheet temporarily spiked in March 2023 when the Fed supported banks after the failure of three U.S. regional banks. Despite the spike, balance sheet assets declined over the reporting period. Central banks outside the United States also battled with persistently high, albeit waning, inflation. After raising rates eight times during the reporting period, the European Central Bank held its rate steady at its October meeting as inflation and pricing pressures finally showed signs of easing. Similarly, the Bank of England maintained its key official bank rate at its September meeting, after seven rate hikes during the reporting period, leaving borrowing costs at a 15-year high. In contrast, the Bank of Japan continued to uphold its short-term interest rate target of -0.1%, unchanged since 2016, despite inflationary pressures but relaxed its yield control policy. Monetary policies in emerging markets were mixed. Central banks in India, Indonesia, Mexico, Pakistan, and Russia all raised their rates two or more times over the reporting period. In contrast, both Brazil and China cut their key interest rate twice during the reporting period.
Among bond markets, shorter-term bonds generally outperformed longer-term bonds, and bond markets generally weakened over the second half of the reporting period. There were a few short-lived market-moving events over the reporting period. The failure of three U.S. regional banks in early March raised concerns about the stability of the banking sector. In addition, debt ceiling negotiations during the second quarter of 2023 created fear that the federal government could default on its obligations and on August 1, 2023, Fitch Ratings downgraded long-term U.S. debt from AAA to AA+ after indicating earlier in the year that a country refusing to pay its debts in a timely way was not entitled to a AAA rating. The U.S. Treasury increased auctions of U.S. Treasury securities over the reporting period and higher borrowing costs as a result of rising interest rates contributed to growth in the U.S. budget deficit. U.S. Treasury yields were volatile over the first half of the reporting period but rose sharply over the second half. The yield on the 10-year U.S. Treasury rose from 4.10% to 4.88% over the reporting period, briefly touching 5% in October—a level not seen since 2007. The yield on the three-month U.S. Treasury climbed from 4.22% to 5.59%, resulting in the yield curve inverting for a large portion of the reporting period. Outside the U.S., bond yields generally followed a similar trajectory.
Schwab Target Funds | Annual Report5
| Zifan Tang, Ph.D., CFA, Senior Portfolio Manager for Schwab Asset Management, is responsible for the co-management of the funds. Prior to joining Schwab in 2012, Ms. Tang was a product manager at Thomson Reuters and from 1997 to 2009 worked as a portfolio manager at Barclays Global Investors (now known as BlackRock). |
| Drew Hayes, CFA, Portfolio Manager for Schwab Asset Management, is responsible for the co-management of the funds. Mr. Hayes has been with Schwab since 2006. Before becoming a portfolio manager, he spent seven years as a senior fixed income specialist for Schwab Wealth Advisory, Inc. Prior to that, he worked as a bond investment specialist for two years and as a registered representative for two years for Charles Schwab & Co., Inc. |
| Patrick Kwok, CFA, Portfolio Manager for Schwab Asset Management, is responsible for the co-management of the funds. Previously, Mr. Kwok served as an associate portfolio manager from 2012 to 2016. Prior to that, he worked as a fund administration manager, where he was responsible for oversight of sub-advisers, trading, cash management, and fund administration supporting the Charles Schwab Trust Bank Collective Investment Trusts and multi-asset Schwab Funds. Prior to joining Schwab Asset Management in 2008, Mr. Kwok spent two years as an asset operations specialist at Charles Schwab Trust Company. He also worked for one year at State Street Bank & Trust as a portfolio accountant and pricing specialist. |
6
Schwab Target Funds | Annual Report
Schwab Target 2010 Fund as of October 31, 2023
The Schwab Target 2010 Fund (the 2010 Fund) seeks to provide capital appreciation and income consistent with its current asset allocation. The 2010 Fund seeks to achieve its investment objective by investing primarily in a combination of other affiliated Schwab Funds. The 2010 Fund may also invest in affiliated Schwab ETFs and unaffiliated third-party mutual funds and ETFs. The target asset allocation is adjusted annually by the investment adviser; as of the last annual adjustment at the beginning of February 2023, the 2010 Fund’s asset allocation was approximately 36.5% equity securities, 58.8% fixed-income securities, and 4.6% cash and cash equivalents (including money market funds).1 (For portfolio allocations as of the end of this reporting period, please see the 2010 Fund’s Portfolio Holdings included in this report.)
Market Highlights. For the 12-month reporting period ended October 31, 2023, U.S. equity markets were mixed, and international equity markets posted positive returns. U.S. stocks were volatile for the first half of the reporting period as inflation remained elevated, the U.S. Federal Reserve (Fed) continued to raise interest rates, and the failure of three U.S. regional banks in early March raised concerns about the stability of the banking sector. Despite these headwinds, as inflation began to ease, U.S. stocks staged a relatively steady upswing through August driven primarily by performance of the “Magnificent Seven” (Alphabet, Inc., Amazon.com, Inc., Apple, Inc., Meta Platforms, Inc., Microsoft Corp., NVIDIA Corp., and Tesla, Inc.). U.S. stocks, particularly dividend paying stocks, began to falter over the final two months of the reporting period as soaring U.S. Treasury yields offered investors attractive alternatives to stocks. Outside the U.S., the ongoing war between Russia and Ukraine and the Israel-Hamas war that broke out following Hamas’ attack on Israel in early October weighed on the global economy. U.S. large-cap stocks outperformed U.S. small-cap stocks and among U.S. large-cap stocks, growth stocks outperformed value stocks. U.S. and international bonds were relatively weak as economic uncertainty and rising interest rates over much of the period drove yields up and bond prices down. (Bond yields and bond prices typically move in opposite directions.) The U.S. dollar, as measured against a basket of international currencies, generally weakened until mid-July, when it hit a reporting-period low, then began to rise but ended the reporting period weaker than where it began.
Performance. For the 12-month reporting period ended October 31, 2023, the 2010 Fund returned 4.24%. The 2010 Fund’s internally calculated comparative index, the Target 2010 Composite Index (the composite index), returned 4.02%.
Positioning and Strategies. The 2010 Fund’s asset allocations were broadly in line with those of the composite index over the reporting period.
The 2010 Fund’s U.S. equity allocations, particularly the 2010 Fund’s U.S. large-cap equity allocations, contributed the most to the total return of the 2010 Fund. The Schwab S&P 500 Index Fund was the largest contributor to the total return of the 2010 Fund, returning approximately 10% for the reporting period, generally tracking its comparative index, the S&P 500® Index.
The 2010 Fund’s international equity allocations also contributed to the total return of the 2010 Fund. The Schwab International Core Equity Fund contributed to the total return of the 2010 Fund, outperforming its comparative index, the MSCI EAFE® Index (Net)2. The Schwab International Core Equity Fund returned approximately 17% for the reporting period.
The 2010 Fund’s fixed-income allocations also contributed to the total return of the 2010 Fund. The Schwab Short-Term Bond Index Fund contributed to the total return of the 2010 Fund, returning approximately 3% for the reporting period, generally tracking its comparative index, the Bloomberg US Government/Credit 1-5 Year Index. The Schwab Treasury Inflation Protected Securities Index Fund detracted from the total return of the 2010 Fund, returning approximately -1% for the reporting period, generally tracking its comparative index, the Bloomberg US Treasury Inflation-Linked Bond Index (Series-L)TM.
The 2010 Fund’s real estate allocation, the Schwab Global Real Estate Fund, was the largest detractor from the total return of the 2010 Fund. The Schwab Global Real Estate Fund returned approximately -4% for the reporting period, outperforming its comparative index, the FTSE EPRA Nareit Global Index (Net)2.
Management views and portfolio holdings may have changed since the report date.
1
Percentages may not add up to 100% due to rounding.
2
The net version of the index reflects reinvested dividends net of withholding taxes but reflects no deductions for expenses or other taxes.
Schwab Target Funds | Annual Report7
Performance and Fund Facts as of October 31, 2023
The performance data quoted represents past performance. Past performance does not guarantee future results. Investment returns and principal value of an investment will fluctuate so that an investor’s shares may be worth more or less than their original cost. Current performance may be lower or higher than performance data quoted. To obtain performance information current to the most recent month end, please visit www.schwabassetmanagement.com/schwabfunds_prospectus.
Performance of Hypothetical $10,000 Investment (October 31, 2013 – October 31, 2023)1
Average Annual Total Returns1
| | | |
Fund: Schwab Target 2010 Fund (7/1/05) | | | |
Dow Jones U.S. Total Stock Market IndexSM | | | |
Bloomberg US Aggregate Bond Index | | | |
Target 2010 Composite Index | | | |
Fund Category: Morningstar Target-Date 2000-20102 | | | |
Fund Expense Ratios3: Net 0.26%; Gross 0.40% |
All total returns on this page assume dividends and distributions were reinvested. Index figures do not include trading and management costs, which would lower performance. Indices are unmanaged and cannot be invested in directly. Performance results less than one year are not annualized.
For index definitions, please see the Glossary.
1
Fund expenses may have been partially absorbed by the investment adviser and its affiliates. Without these reductions, the fund’s returns would have been lower. These returns do not reflect the deduction of taxes that a shareholder would pay on fund distributions or the redemption of fund shares.
2
Source for category information: Morningstar, Inc. The Morningstar Category return represents all active and index mutual funds and ETFs within the category as of the report date.
3
As stated in the prospectus. Includes 0.26% of acquired fund fees and expenses (AFFE), which are indirect expenses incurred by the fund through its investments in the underlying funds. Net Expense: Expenses reduced by a contractual fee waiver in effect for so long as Schwab Asset Management serves as the investment adviser to the fund. Gross Expense: Does not reflect the effect of contractual fee waivers. For actual expense ratios during the period, not including AFFE, refer to the financial highlights section of the financial statements.
8
Schwab Target Funds | Annual Report
Performance and Fund Facts as of October 31, 2023 (continued)
Asset Class Weightings % of Investments1,2
Top Holdings % of Net Assets1,3
Portfolio holdings may have changed since the report date.
1
The fund intends to invest in a combination of the underlying funds; however, the fund may also invest directly in equity and fixed-income securities and money market securities.
2
The percentage may differ from the Portfolio Holdings because the above calculation is based on a percentage of total investments, whereas the calculation in the Portfolio Holdings is based on a percentage of net assets.
3
This list is not a recommendation of any security by the investment adviser.
Schwab Target Funds | Annual Report9
Schwab Target 2015 Fund as of October 31, 2023
The Schwab Target 2015 Fund (the 2015 Fund) seeks to provide capital appreciation and income consistent with its current asset allocation. The 2015 Fund seeks to achieve its investment objective by investing primarily in a combination of other affiliated Schwab Funds. The 2015 Fund may also invest in affiliated Schwab ETFs and unaffiliated third-party mutual funds and Schwab ETFs. The target asset allocation is adjusted annually by the investment adviser; as of the last annual adjustment at the beginning of February 2023, the 2015 Fund’s asset allocation was approximately 40.3% equity securities, 55.5% fixed-income securities and 4.2% cash and cash equivalents (including money market funds). (For portfolio allocations as of the end of this reporting period, please see the 2015 Fund’s Portfolio Holdings included in this report.)
Market Highlights. For the 12-month reporting period ended October 31, 2023, U.S. equity markets were mixed, and international equity markets posted positive returns. U.S. stocks were volatile for the first half of the reporting period as inflation remained elevated, the U.S. Federal Reserve (Fed) continued to raise interest rates, and the failure of three U.S. regional banks in early March raised concerns about the stability of the banking sector. Despite these headwinds, as inflation began to ease, U.S. stocks staged a relatively steady upswing through August driven primarily by performance of the “Magnificent Seven” (Alphabet, Inc., Amazon.com, Inc., Apple, Inc., Meta Platforms, Inc., Microsoft Corp., NVIDIA Corp., and Tesla, Inc.). U.S. stocks, particularly dividend paying stocks, began to falter over the final two months of the reporting period as soaring U.S. Treasury yields offered investors attractive alternatives to stocks. Outside the U.S., the ongoing war between Russia and Ukraine and the Israel-Hamas war that broke out following Hamas’ attack on Israel in early October weighed on the global economy. U.S. large-cap stocks outperformed U.S. small-cap stocks and among U.S. large-cap stocks, growth stocks outperformed value stocks. U.S. and international bonds were relatively weak as economic uncertainty and rising interest rates over much of the period drove yields up and bond prices down. (Bond yields and bond prices typically move in opposite directions.) The U.S. dollar, as measured against a basket of international currencies, generally weakened until mid-July, when it hit a reporting-period low, then began to rise but ended the reporting period weaker than where it began.
Performance. For the 12-month reporting period ended October 31, 2023, the 2015 Fund returned 4.53%. The 2015 Fund’s internally calculated comparative index, the Target 2015 Composite Index (the composite index), returned 4.34%.
Positioning and Strategies. The 2015 Fund’s asset allocations were broadly in line with those of the composite index over the reporting period.
The 2015 Fund’s U.S. equity allocations, particularly the 2015 Fund’s U.S. large-cap equity allocations, contributed the most to the total return of the 2015 Fund. The Schwab S&P 500 Index Fund was the largest contributor to the total return of the 2015 Fund, returning approximately 10% for the reporting period, generally tracking its comparative index, the S&P 500® Index.
The 2015 Fund’s international equity allocations also contributed to the total return of the 2015 Fund. The Schwab International Core Equity Fund contributed to the total return of the 2015 Fund, outperforming its comparative index, the MSCI EAFE® Index (Net)1. The Schwab International Core Equity Fund returned approximately 17% for the reporting period.
The 2015 Fund’s fixed-income allocations also contributed to the total return of the 2015 Fund. The Schwab Short-Term Bond Index Fund contributed to the total return of the 2015 Fund, returning approximately 3% for the reporting period, generally tracking its comparative index, the Bloomberg US Government/Credit 1-5 Year Index. The Schwab Treasury Inflation Protected Securities Index Fund detracted from the total return of the 2015 Fund, returning approximately -1% for the reporting period, generally tracking its comparative index, the Bloomberg US Treasury Inflation-Linked Bond Index (Series-L)TM.
The 2015 Fund’s real estate allocation, the Schwab Global Real Estate Fund, was the largest detractor from the total return of the 2015 Fund. The Schwab Global Real Estate Fund returned approximately -4% for the reporting period, outperforming its comparative index, the FTSE EPRA Nareit Global Index (Net)1.
Management views and portfolio holdings may have changed since the report date.
1
The net version of the index reflects reinvested dividends net of withholding taxes but reflects no deductions for expenses or other taxes.
10
Schwab Target Funds | Annual Report
Performance and Fund Facts as of October 31, 2023
The performance data quoted represents past performance. Past performance does not guarantee future results. Investment returns and principal value of an investment will fluctuate so that an investor’s shares may be worth more or less than their original cost. Current performance may be lower or higher than performance data quoted. To obtain performance information current to the most recent month end, please visit www.schwabassetmanagement.com/schwabfunds_prospectus.
Performance of Hypothetical $10,000 Investment (October 31, 2013 – October 31, 2023)1
Average Annual Total Returns1
| | | |
Fund: Schwab Target 2015 Fund (3/12/08) | | | |
Dow Jones U.S. Total Stock Market IndexSM | | | |
Bloomberg US Aggregate Bond Index | | | |
Target 2015 Composite Index | | | |
Fund Category: Morningstar Target-Date 20152 | | | |
Fund Expense Ratios3: Net 0.28%; Gross 0.39% |
All total returns on this page assume dividends and distributions were reinvested. Index figures do not include trading and management costs, which would lower performance. Indices are unmanaged and cannot be invested in directly. Performance results less than one year are not annualized.
For index definitions, please see the Glossary.
1
Fund expenses may have been partially absorbed by the investment adviser and its affiliates. Without these reductions, the fund’s returns would have been lower. These returns do not reflect the deduction of taxes that a shareholder would pay on fund distributions or the redemption of fund shares.
2
Source for category information: Morningstar, Inc. The Morningstar Category return represents all active and index mutual funds and ETFs within the category as of the report date.
3
As stated in the prospectus. Includes 0.28% of acquired fund fees and expenses (AFFE), which are indirect expenses incurred by the fund through its investments in the underlying funds. Net Expense: Expenses reduced by a contractual fee waiver in effect for so long as Schwab Asset Management serves as the investment adviser to the fund. Gross Expense: Does not reflect the effect of contractual fee waivers. For actual expense ratios during the period, not including AFFE, refer to the financial highlights section of the financial statements.
Schwab Target Funds | Annual Report11
Performance and Fund Facts as of October 31, 2023 (continued)
Asset Class Weightings % of Investments1,2
Top Holdings % of Net Assets1,3
Portfolio holdings may have changed since the report date.
1
The fund intends to invest in a combination of the underlying funds; however, the fund may also invest directly in equity and fixed-income securities and money market securities.
2
The percentage may differ from the Portfolio Holdings because the above calculation is based on a percentage of total investments, whereas the calculation in the Portfolio Holdings is based on a percentage of net assets.
3
This list is not a recommendation of any security by the investment adviser.
12
Schwab Target Funds | Annual Report
Schwab Target 2020 Fund as of October 31, 2023
The Schwab Target 2020 Fund (the 2020 Fund) seeks to provide capital appreciation and income consistent with its current asset allocation. The 2020 Fund seeks to achieve its investment objective by investing primarily in a combination of other affiliated Schwab Funds. The 2020 Fund may also invest in affiliated Schwab ETFs and unaffiliated third-party mutual funds and ETFs. The target asset allocation is adjusted annually by the investment adviser; as of the last annual adjustment at the beginning of February 2023, the 2020 Fund’s asset allocation was approximately 42.9% equity securities, 53.3% fixed-income securities, and 3.8% cash and cash equivalents (including money market funds). (For portfolio allocations as of the end of this reporting period, please see the 2020 Fund’s Portfolio Holdings included in this report.)
Market Highlights. For the 12-month reporting period ended October 31, 2023, U.S. equity markets were mixed, and international equity markets posted positive returns. U.S. stocks were volatile for the first half of the reporting period as inflation remained elevated, the U.S. Federal Reserve (Fed) continued to raise interest rates, and the failure of three U.S. regional banks in early March raised concerns about the stability of the banking sector. Despite these headwinds, as inflation began to ease, U.S. stocks staged a relatively steady upswing through August driven primarily by performance of the “Magnificent Seven” (Alphabet, Inc., Amazon.com, Inc., Apple, Inc., Meta Platforms, Inc., Microsoft Corp., NVIDIA Corp., and Tesla, Inc.). U.S. stocks, particularly dividend paying stocks, began to falter over the final two months of the reporting period as soaring U.S. Treasury yields offered investors attractive alternatives to stocks. Outside the U.S., the ongoing war between Russia and Ukraine and the Israel-Hamas war that broke out following Hamas’ attack on Israel in early October weighed on the global economy. U.S. large-cap stocks outperformed U.S. small-cap stocks and among U.S. large-cap stocks, growth stocks outperformed value stocks. U.S. and international bonds were relatively weak as economic uncertainty and rising interest rates over much of the period drove yields up and bond prices down. (Bond yields and bond prices typically move in opposite directions.) The U.S. dollar, as measured against a basket of international currencies, generally weakened until mid-July, when it hit a reporting-period low, then began to rise but ended the reporting period weaker than where it began.
Performance. For the 12-month reporting period ended October 31, 2023, the 2020 Fund returned 4.68%. The 2020 Fund’s internally calculated comparative index, the Target 2020 Composite Index (the composite index), returned 4.56%.
Positioning and Strategies. The 2020 Fund’s asset allocations were broadly in line with those of the composite index over the reporting period.
The 2020 Fund’s U.S. equity allocations, particularly the 2020 Fund’s U.S. large-cap equity allocations, contributed the most to the total return of the 2020 Fund. The Schwab S&P 500 Index Fund was the largest contributor to the total return of the 2020 Fund, returning approximately 10% for the reporting period, generally tracking its comparative index, the S&P 500® Index. The ClearBridge Small Cap Growth Fund (Class IS) detracted from the total return of the 2020 Fund, returning approximately -13% for the reporting period.
The 2020 Fund’s international equity allocations also contributed to the total return of the 2020 Fund. The Schwab International Core Equity Fund contributed to the total return of the 2020 Fund, outperforming its comparative index, the MSCI EAFE® Index (Net)1. The Schwab International Core Equity Fund returned approximately 17% for the reporting period.
The 2020 Fund’s fixed-income allocations also contributed to the total return of the 2020 Fund. The Schwab Short-Term Bond Index Fund contributed to the total return of the 2020 Fund, returning approximately 3% for the reporting period, generally tracking its comparative index, the Bloomberg US Government/Credit 1-5 Year Index.
The 2020 Fund’s real estate allocation, the Schwab Global Real Estate Fund, was the largest detractor from the total return of the 2020 Fund. The Schwab Global Real Estate Fund returned approximately -4% for the reporting period, outperforming its comparative index, the FTSE EPRA Nareit Global Index (Net)1.
Management views and portfolio holdings may have changed since the report date.
1
The net version of the index reflects reinvested dividends net of withholding taxes but reflects no deductions for expenses or other taxes.
Schwab Target Funds | Annual Report13
Performance and Fund Facts as of October 31, 2023
The performance data quoted represents past performance. Past performance does not guarantee future results. Investment returns and principal value of an investment will fluctuate so that an investor’s shares may be worth more or less than their original cost. Current performance may be lower or higher than performance data quoted. To obtain performance information current to the most recent month end, please visit www.schwabassetmanagement.com/schwabfunds_prospectus.
Performance of Hypothetical $10,000 Investment (October 31, 2013 – October 31, 2023)1
Average Annual Total Returns1
| | | |
Fund: Schwab Target 2020 Fund (7/1/05) | | | |
Dow Jones U.S. Total Stock Market IndexSM | | | |
Bloomberg US Aggregate Bond Index | | | |
Target 2020 Composite Index | | | |
Fund Category: Morningstar Target-Date 20202 | | | |
Fund Expense Ratios3: Net 0.29%; Gross 0.32% |
All total returns on this page assume dividends and distributions were reinvested. Index figures do not include trading and management costs, which would lower performance. Indices are unmanaged and cannot be invested in directly. Performance results less than one year are not annualized.
For index definitions, please see the Glossary.
1
Fund expenses may have been partially absorbed by the investment adviser and its affiliates. Without these reductions, the fund’s returns would have been lower. These returns do not reflect the deduction of taxes that a shareholder would pay on fund distributions or the redemption of fund shares.
2
Source for category information: Morningstar, Inc. The Morningstar Category return represents all active and index mutual funds and ETFs within the category as of the report date.
3
As stated in the prospectus. Includes 0.29% of acquired fund fees and expenses (AFFE), which are indirect expenses incurred by the fund through its investments in the underlying funds. Net Expense: Expenses reduced by a contractual fee waiver in effect for so long as Schwab Asset Management serves as the investment adviser to the fund. Gross Expense: Does not reflect the effect of contractual fee waivers. For actual expense ratios during the period, not including AFFE, refer to the financial highlights section of the financial statements.
14
Schwab Target Funds | Annual Report
Performance and Fund Facts as of October 31, 2023 (continued)
Asset Class Weightings % of Investments1,2
Top Holdings % of Net Assets1,3
Portfolio holdings may have changed since the report date.
1
The fund intends to invest in a combination of the underlying funds; however, the fund may also invest directly in equity and fixed-income securities and money market securities.
2
The percentage may differ from the Portfolio Holdings because the above calculation is based on a percentage of total investments, whereas the calculation in the Portfolio Holdings is based on a percentage of net assets.
3
This list is not a recommendation of any security by the investment adviser.
Schwab Target Funds | Annual Report15
Schwab Target 2025 Fund as of October 31, 2023
The Schwab Target 2025 Fund (the 2025 Fund) seeks to provide capital appreciation and income consistent with its current asset allocation. The 2025 Fund seeks to achieve its investment objective by investing primarily in a combination of other affiliated Schwab Funds. The 2025 Fund may also invest in affiliated Schwab ETFs and unaffiliated third-party mutual funds and ETFs. The target asset allocation is adjusted annually by the investment adviser; as of the last annual adjustment at the beginning of February 2023, the 2025 Fund’s asset allocation was approximately 50.5% equity securities, 46.2% fixed-income securities, and 3.3% cash and cash equivalents (including money market funds). At its target date, the 2025 Fund’s allocation will be approximately 44.0% equity securities, 52.0% fixed-income securities, and 4.0% cash and cash equivalents (including money market funds). (For portfolio allocations as of the end of this reporting period, please see the 2025 Fund’s Portfolio Holdings included in this report.)
Market Highlights. For the 12-month reporting period ended October 31, 2023, U.S. equity markets were mixed, and international equity markets posted positive returns. U.S. stocks were volatile for the first half of the reporting period as inflation remained elevated, the U.S. Federal Reserve (Fed) continued to raise interest rates, and the failure of three U.S. regional banks in early March raised concerns about the stability of the banking sector. Despite these headwinds, as inflation began to ease, U.S. stocks staged a relatively steady upswing through August driven primarily by performance of the “Magnificent Seven” (Alphabet, Inc., Amazon.com, Inc., Apple, Inc., Meta Platforms, Inc., Microsoft Corp., NVIDIA Corp., and Tesla, Inc.). U.S. stocks, particularly dividend paying stocks, began to falter over the final two months of the reporting period as soaring U.S. Treasury yields offered investors attractive alternatives to stocks. Outside the U.S., the ongoing war between Russia and Ukraine and the Israel-Hamas war that broke out following Hamas’ attack on Israel in early October weighed on the global economy. U.S. large-cap stocks outperformed U.S. small-cap stocks and among U.S. large-cap stocks, growth stocks outperformed value stocks. U.S. and international bonds were relatively weak as economic uncertainty and rising interest rates over much of the period drove yields up and bond prices down. (Bond yields and bond prices typically move in opposite directions.) The U.S. dollar, as measured against a basket of international currencies, generally weakened until mid-July, when it hit a reporting-period low, then began to rise but ended the reporting period weaker than where it began.
Performance. For the 12-month reporting period ended October 31, 2023, the 2025 Fund returned 5.46%. The 2025 Fund’s internally calculated comparative index, the Target 2025 Composite Index (the composite index), returned 5.34%.
Positioning and Strategies. The 2025 Fund’s asset allocations were broadly in line with those of the composite index over the reporting period.
The 2025 Fund’s U.S. equity allocations, particularly the 2025 Fund’s U.S. large-cap equity allocations, contributed the most to the total return of the 2025 Fund. The Schwab S&P 500 Index Fund was the largest contributor to the total return of the 2025 Fund, returning approximately 10% for the reporting period, generally tracking its comparative index, the S&P 500® Index.
The 2025 Fund’s international equity allocations also contributed to the total return of the 2025 Fund. The Schwab International Core Equity Fund contributed to the total return of the 2025 Fund, outperforming its comparative index, the MSCI EAFE® Index (Net)1. The Schwab International Core Equity Fund returned approximately 17% for the reporting period.
The 2025 Fund’s fixed-income allocations also contributed to the total return of the 2025 Fund. The Schwab Short-Term Bond Index Fund contributed to the total return of the 2025 Fund, returning approximately 3% for the reporting period, generally tracking its comparative index, the Bloomberg US Government/Credit 1-5 Year Index. The Schwab U.S. Aggregate Bond Index Fund detracted from the total return of the 2025 Fund, returning less than 1% for the reporting period, generally tracking its comparative index, the Bloomberg US Aggregate Bond Index.
The 2025 Fund’s real estate allocation, the Schwab Global Real Estate Fund, was the largest detractor from the total return of the 2025 Fund. The Schwab Global Real Estate Fund returned approximately -4% for the reporting period, outperforming its comparative index, the FTSE EPRA Nareit Global Index (Net)1.
Management views and portfolio holdings may have changed since the report date.
1
The net version of the index reflects reinvested dividends net of withholding taxes but reflects no deductions for expenses or other taxes.
16
Schwab Target Funds | Annual Report
Performance and Fund Facts as of October 31, 2023
The performance data quoted represents past performance. Past performance does not guarantee future results. Investment returns and principal value of an investment will fluctuate so that an investor’s shares may be worth more or less than their original cost. Current performance may be lower or higher than performance data quoted. To obtain performance information current to the most recent month end, please visit www.schwabassetmanagement.com/schwabfunds_prospectus.
Performance of Hypothetical $10,000 Investment (October 31, 2013 – October 31, 2023)1
Average Annual Total Returns1
| | | |
Fund: Schwab Target 2025 Fund (3/12/08) | | | |
Dow Jones U.S. Total Stock Market IndexSM | | | |
Bloomberg US Aggregate Bond Index | | | |
Target 2025 Composite Index | | | |
Fund Category: Morningstar Target-Date 20252 | | | |
Fund Expense Ratios3: Net 0.35%; Gross 0.38% |
All total returns on this page assume dividends and distributions were reinvested. Index figures do not include trading and management costs, which would lower performance. Indices are unmanaged and cannot be invested in directly. Performance results less than one year are not annualized.
For index definitions, please see the Glossary.
1
Fund expenses may have been partially absorbed by the investment adviser and its affiliates. Without these reductions, the fund’s returns would have been lower. These returns do not reflect the deduction of taxes that a shareholder would pay on fund distributions or the redemption of fund shares.
2
Source for category information: Morningstar, Inc. The Morningstar Category return represents all active and index mutual funds and ETFs within the category as of the report date.
3
As stated in the prospectus. Includes 0.35% of acquired fund fees and expenses (AFFE), which are indirect expenses incurred by the fund through its investments in the underlying funds. Net Expense: Expenses reduced by a contractual fee waiver in effect for so long as Schwab Asset Management serves as the investment adviser to the fund. Gross Expense: Does not reflect the effect of contractual fee waivers. For actual expense ratios during the period, not including AFFE, refer to the financial highlights section of the financial statements.
Schwab Target Funds | Annual Report17
Performance and Fund Facts as of October 31, 2023 (continued)
Asset Class Weightings % of Investments1,2
Top Holdings % of Net Assets1,3
Portfolio holdings may have changed since the report date.
1
The fund intends to invest in a combination of the underlying funds; however, the fund may also invest directly in equity and fixed-income securities and money market securities.
2
The percentage may differ from the Portfolio Holdings because the above calculation is based on a percentage of total investments, whereas the calculation in the Portfolio Holdings is based on a percentage of net assets.
3
This list is not a recommendation of any security by the investment adviser.
18
Schwab Target Funds | Annual Report
Schwab Target 2030 Fund as of October 31, 2023
The Schwab Target 2030 Fund (the 2030 Fund) seeks to provide capital appreciation and income consistent with its current asset allocation. The 2030 Fund seeks to achieve its investment objective by investing primarily in a combination of other affiliated Schwab Funds. The 2030 Fund may also invest in affiliated Schwab ETFs and unaffiliated third-party mutual funds and ETFs. The target asset allocation is adjusted annually by the investment adviser; as of the last annual adjustment at the beginning of February 2023, the 2030 Fund’s asset allocation was approximately 63.5% equity securities, 34.0% fixed-income securities, and 2.5% cash and cash equivalents (including money market funds). At its target date, the 2030 Fund’s allocation will be approximately 44.0% equity securities, 52.0% fixed-income securities, and 4.0% cash and cash equivalents (including money market funds). (For portfolio allocations as of the end of this reporting period, please see the 2030 Fund’s Portfolio Holdings included in this report.)
Market Highlights. For the 12-month reporting period ended October 31, 2023, U.S. equity markets were mixed, and international equity markets posted positive returns. U.S. stocks were volatile for the first half of the reporting period as inflation remained elevated, the U.S. Federal Reserve (Fed) continued to raise interest rates, and the failure of three U.S. regional banks in early March raised concerns about the stability of the banking sector. Despite these headwinds, as inflation began to ease, U.S. stocks staged a relatively steady upswing through August driven primarily by performance of the “Magnificent Seven” (Alphabet, Inc., Amazon.com, Inc., Apple, Inc., Meta Platforms, Inc., Microsoft Corp., NVIDIA Corp., and Tesla, Inc.). U.S. stocks, particularly dividend paying stocks, began to falter over the final two months of the reporting period as soaring U.S. Treasury yields offered investors attractive alternatives to stocks. Outside the U.S., the ongoing war between Russia and Ukraine and the Israel-Hamas war that broke out following Hamas’ attack on Israel in early October weighed on the global economy. U.S. large-cap stocks outperformed U.S. small-cap stocks and among U.S. large-cap stocks, growth stocks outperformed value stocks. U.S. and international bonds were relatively weak as economic uncertainty and rising interest rates over much of the period drove yields up and bond prices down. (Bond yields and bond prices typically move in opposite directions.) The U.S. dollar, as measured against a basket of international currencies, generally weakened until mid-July, when it hit a reporting-period low, then began to rise but ended the reporting period weaker than where it began.
Performance. For the 12-month reporting period ended October 31, 2023, the 2030 Fund returned 6.52%. The 2030 Fund’s internally calculated comparative index, the Target 2030 Composite Index (the composite index), returned 6.33%.
Positioning and Strategies. The 2030 Fund’s asset allocations were broadly in line with those of the composite index over the reporting period.
The 2030 Fund’s U.S. equity allocations, particularly the 2030 Fund’s U.S. large-cap equity allocations, contributed the most to the total return of the 2030 Fund. The Schwab S&P 500 Index Fund was the largest contributor to the total return of the 2030 Fund, returning approximately 10% for the reporting period, generally tracking its comparative index, the S&P 500® Index. The ClearBridge Small Cap Growth Fund (Class IS) detracted from the total return of the 2030 Fund, returning approximately -13% for the reporting period.
The 2030 Fund’s international equity allocations also contributed to the total return of the 2030 Fund. The Schwab International Core Equity Fund contributed to the total return of the 2030 Fund, outperforming its comparative index, the MSCI EAFE® Index (Net)1. The Schwab International Core Equity Fund returned approximately 17% for the reporting period.
The 2030 Fund’s fixed-income allocations also contributed to the total return of the 2030 Fund. The PIMCO International Bond Fund (U.S. Dollar-Hedged) (Institutional Class) contributed to the total return of the 2030 Fund, returning approximately 3% for the reporting period.
The 2030 Fund’s real estate allocation, the Schwab Global Real Estate Fund, was the largest detractor from the total return of the 2030 Fund. The Schwab Global Real Estate Fund returned approximately -4% for the reporting period, outperforming its comparative index, the FTSE EPRA Nareit Global Index (Net)1.
Management views and portfolio holdings may have changed since the report date.
1
The net version of the index reflects reinvested dividends net of withholding taxes but reflects no deductions for expenses or other taxes.
Schwab Target Funds | Annual Report19
Performance and Fund Facts as of October 31, 2023
The performance data quoted represents past performance. Past performance does not guarantee future results. Investment returns and principal value of an investment will fluctuate so that an investor’s shares may be worth more or less than their original cost. Current performance may be lower or higher than performance data quoted. To obtain performance information current to the most recent month end, please visit www.schwabassetmanagement.com/schwabfunds_prospectus.
Performance of Hypothetical $10,000 Investment (October 31, 2013 – October 31, 2023)1
Average Annual Total Returns1
| | | |
Fund: Schwab Target 2030 Fund (7/1/05) | | | |
Dow Jones U.S. Total Stock Market IndexSM | | | |
Bloomberg US Aggregate Bond Index | | | |
Target 2030 Composite Index | | | |
Fund Category: Morningstar Target-Date 20302 | | | |
Fund Expense Ratios3: Net 0.42%; Gross 0.44% |
All total returns on this page assume dividends and distributions were reinvested. Index figures do not include trading and management costs, which would lower performance. Indices are unmanaged and cannot be invested in directly. Performance results less than one year are not annualized.
For index definitions, please see the Glossary.
1
Fund expenses may have been partially absorbed by the investment adviser and its affiliates. Without these reductions, the fund’s returns would have been lower. These returns do not reflect the deduction of taxes that a shareholder would pay on fund distributions or the redemption of fund shares.
2
Source for category information: Morningstar, Inc. The Morningstar Category return represents all active and index mutual funds and ETFs within the category as of the report date.
3
As stated in the prospectus. Includes 0.42% of acquired fund fees and expenses (AFFE), which are indirect expenses incurred by the fund through its investments in the underlying funds. Net Expense: Expenses reduced by a contractual fee waiver in effect for so long as Schwab Asset Management serves as the investment adviser to the fund. Gross Expense: Does not reflect the effect of contractual fee waivers. For actual expense ratios during the period, not including AFFE, refer to the financial highlights section of the financial statements.
20
Schwab Target Funds | Annual Report
Performance and Fund Facts as of October 31, 2023 (continued)
Asset Class Weightings % of Investments1,2
Top Holdings % of Net Assets1,3
Portfolio holdings may have changed since the report date.
1
The fund intends to invest in a combination of the underlying funds; however, the fund may also invest directly in equity and fixed-income securities and money market securities.
2
The percentage may differ from the Portfolio Holdings because the above calculation is based on a percentage of total investments, whereas the calculation in the Portfolio Holdings is based on a percentage of net assets.
3
This list is not a recommendation of any security by the investment adviser.
Schwab Target Funds | Annual Report21
Schwab Target 2035 Fund as of October 31, 2023
The Schwab Target 2035 Fund (the 2035 Fund) seeks to provide capital appreciation and income consistent with its current asset allocation. The 2035 Fund seeks to achieve its investment objective by investing primarily in a combination of other affiliated Schwab Funds. The 2035 Fund may also invest in affiliated Schwab ETFs and unaffiliated third-party mutual funds and ETFs. The target asset allocation is adjusted annually by the investment adviser; as of the last annual adjustment at the beginning of February 2023, the 2035 Fund’s asset allocation was approximately 73.1% equity securities, 25.0% fixed-income securities, and 1.9% cash and cash equivalents (including money market funds). At its target date, the 2035 Fund’s allocation will be approximately 44.0% equity securities, 52.0% fixed-income securities, and 4.0% cash and cash equivalents (including money market funds). (For portfolio allocations as of the end of this reporting period, please see the 2035 Fund’s Portfolio Holdings included in this report.)
Market Highlights. For the 12-month reporting period ended October 31, 2023, U.S. equity markets were mixed, and international equity markets posted positive returns. U.S. stocks were volatile for the first half of the reporting period as inflation remained elevated, the U.S. Federal Reserve (Fed) continued to raise interest rates and the failure of three U.S. regional banks in early March raised concerns about the stability of the banking sector. Despite these headwinds, as inflation began to ease, U.S. stocks staged a relatively steady upswing through August driven primarily by performance of the “Magnificent Seven” (Alphabet, Inc., Amazon.com, Inc., Apple, Inc., Meta Platforms, Inc., Microsoft Corp., NVIDIA Corp., and Tesla, Inc.). U.S. stocks, particularly dividend paying stocks, began to falter over the final two months of the reporting period as soaring U.S. Treasury yields offered investors attractive alternatives to stocks. Outside the U.S., the ongoing war between Russia and Ukraine and the Israel-Hamas war that broke out following Hamas’ attack on Israel in early October weighed on the global economy. U.S. large-cap stocks outperformed U.S. small-cap stocks and among U.S. large-cap stocks, growth stocks outperformed value stocks. U.S. and international bonds were relatively weak as economic uncertainty and rising interest rates over much of the period drove yields up and bond prices down. (Bond yields and bond prices typically move in opposite directions.) The U.S. dollar, as measured against a basket of international currencies, generally weakened until mid-July, when it hit a reporting-period low, then began to rise but ended the reporting period weaker than where it began.
Performance. For the 12-month reporting period ended October 31, 2023, the 2035 Fund returned 7.22%. The 2035 Fund’s internally calculated comparative index, the Target 2035 Composite Index (the composite index), returned 7.01%.
Positioning and Strategies. The 2035 Fund’s asset allocations were broadly in line with those of the composite index over the reporting period.
The 2035 Fund’s U.S. equity allocations, particularly the 2035 Fund’s U.S. large-cap equity allocations, contributed the most to the total return of the 2035 Fund. The Schwab S&P 500 Index Fund was the largest contributor to the total return of the 2035 Fund, returning approximately 10% for the reporting period, generally tracking its comparative index, the S&P 500® Index. The ClearBridge Small Cap Growth Fund (Class IS) detracted from the total return of the 2035 Fund, returning approximately -13% for the reporting period.
The 2035 Fund’s international equity allocations also contributed to the total return of the 2035 Fund. The Schwab International Core Equity Fund contributed to the total return of the 2035 Fund, outperforming its comparative index, the MSCI EAFE® Index (Net)1. The Schwab International Core Equity Fund returned approximately 17% for the reporting period.
The 2035 Fund’s fixed-income allocations also contributed to the total return of the 2035 Fund. The PIMCO International Bond Fund (U.S. Dollar-Hedged) (Institutional Class) contributed to the total return of the 2035 Fund, returning approximately 3% for the reporting period.
The 2035 Fund’s real estate allocation, the Schwab Global Real Estate Fund, was the largest detractor from the total return of the 2035 Fund. The Schwab Global Real Estate Fund returned approximately -4% for the reporting period, outperforming its comparative index, the FTSE EPRA Nareit Global Index (Net)1.
Management views and portfolio holdings may have changed since the report date.
1
The net version of the index reflects reinvested dividends net of withholding taxes but reflects no deductions for expenses or other taxes.
22
Schwab Target Funds | Annual Report
Performance and Fund Facts as of October 31, 2023
The performance data quoted represents past performance. Past performance does not guarantee future results. Investment returns and principal value of an investment will fluctuate so that an investor’s shares may be worth more or less than their original cost. Current performance may be lower or higher than performance data quoted. To obtain performance information current to the most recent month end, please visit www.schwabassetmanagement.com/schwabfunds_prospectus.
Performance of Hypothetical $10,000 Investment (October 31, 2013 – October 31, 2023)1
Average Annual Total Returns1
| | | |
Fund: Schwab Target 2035 Fund (3/12/08) | | | |
Dow Jones U.S. Total Stock Market IndexSM | | | |
Bloomberg US Aggregate Bond Index | | | |
Target 2035 Composite Index | | | |
Fund Category: Morningstar Target-Date 20352 | | | |
Fund Expense Ratios3: Net 0.47%; Gross 0.50% |
All total returns on this page assume dividends and distributions were reinvested. Index figures do not include trading and management costs, which would lower performance. Indices are unmanaged and cannot be invested in directly. Performance results less than one year are not annualized.
For index definitions, please see the Glossary.
1
Fund expenses may have been partially absorbed by the investment adviser and its affiliates. Without these reductions, the fund’s returns would have been lower. These returns do not reflect the deduction of taxes that a shareholder would pay on fund distributions or the redemption of fund shares.
2
Source for category information: Morningstar, Inc. The Morningstar Category return represents all active and index mutual funds and ETFs within the category as of the report date.
3
As stated in the prospectus. Includes 0.47% of acquired fund fees and expenses (AFFE), which are indirect expenses incurred by the fund through its investments in the underlying funds. Net Expense: Expenses reduced by a contractual fee waiver in effect for so long as Schwab Asset Management serves as the investment adviser to the fund. Gross Expense: Does not reflect the effect of contractual fee waivers. For actual expense ratios during the period, not including AFFE, refer to the financial highlights section of the financial statements.
Schwab Target Funds | Annual Report23
Performance and Fund Facts as of October 31, 2023 (continued)
Asset Class Weightings % of Investments1,2
Top Holdings % of Net Assets1,3
Portfolio holdings may have changed since the report date.
1
The fund intends to invest in a combination of the underlying funds; however, the fund may also invest directly in equity and fixed-income securities and money market securities.
2
The percentage may differ from the Portfolio Holdings because the above calculation is based on a percentage of total investments, whereas the calculation in the Portfolio Holdings is based on a percentage of net assets.
3
This list is not a recommendation of any security by the investment adviser.
24
Schwab Target Funds | Annual Report
Schwab Target 2040 Fund as of October 31, 2023
The Schwab Target 2040 Fund (the 2040 Fund) seeks to provide capital appreciation and income consistent with its current asset allocation. The 2040 Fund seeks to achieve its investment objective by investing primarily in a combination of other affiliated Schwab Funds. The 2040 Fund may also invest in affiliated Schwab ETFs and unaffiliated third-party mutual funds and ETFs. The target asset allocation is adjusted annually by the investment adviser; as of the last annual adjustment at the beginning of February 2023, the 2040 Fund’s asset allocation was approximately 80.9% equity securities, 17.7% fixed-income securities, and 1.4% cash and cash equivalents including money market funds). At its target date, the 2040 Fund’s allocation will be approximately 44.0% equity securities, 52.0% fixed-income securities, and 4.0% cash and cash equivalents (including money market funds). (For portfolio allocations as of the end of this reporting period, please see the 2040 Fund’s Portfolio Holdings included in this report.)
Market Highlights. For the 12-month reporting period ended October 31, 2023, U.S. equity markets were mixed, and international equity markets posted positive returns. U.S. stocks were volatile for the first half of the reporting period as inflation remained elevated, the U.S. Federal Reserve (Fed) continued to raise interest rates, and the failure of three U.S. regional banks in early March raised concerns about the stability of the banking sector. Despite these headwinds, as inflation began to ease, U.S. stocks staged a relatively steady upswing through August driven primarily by performance of the “Magnificent Seven” (Alphabet, Inc., Amazon.com, Inc., Apple, Inc., Meta Platforms, Inc., Microsoft Corp., NVIDIA Corp., and Tesla, Inc.). U.S. stocks, particularly dividend paying stocks, began to falter over the final two months of the reporting period as soaring U.S. Treasury yields offered investors attractive alternatives to stocks. Outside the U.S., the ongoing war between Russia and Ukraine and the Israel-Hamas war that broke out following Hamas’ attack on Israel in early October weighed on the global economy. U.S. large-cap stocks outperformed U.S. small-cap stocks and among U.S. large-cap stocks, growth stocks outperformed value stocks. U.S. and international bonds were relatively weak as economic uncertainty and rising interest rates over much of the period drove yields up and bond prices down. (Bond yields and bond prices typically move in opposite directions.) The U.S. dollar, as measured against a basket of international currencies, generally weakened until mid-July, when it hit a reporting-period low, then began to rise but ended the reporting period weaker than where it began.
Performance. For the 12-month reporting period ended October 31, 2023, the 2040 Fund returned 7.79%. The 2040 Fund’s internally calculated comparative index, the Target 2040 Composite Index (the composite index), returned 7.52%.
Positioning and Strategies. The 2040 Fund’s asset allocations were broadly in line with those of the composite index over the reporting period.
The 2040 Fund’s U.S. equity allocations, particularly the 2040 Fund’s U.S. large-cap equity allocations, contributed the most to the total return of the 2040 Fund. The Schwab S&P 500 Index Fund was the largest contributor to the total return of the 2040 Fund, returning approximately 10% for the reporting period, generally tracking its comparative index, the S&P 500® Index. The ClearBridge Small Cap Growth Fund (Class IS) detracted from the total return of the 2040 Fund, returning approximately -13% for the reporting period.
The 2040 Fund’s international equity allocations also contributed to the total return of the 2040 Fund. The Schwab International Core Equity Fund contributed to the total return of the 2040 Fund, outperforming its comparative index, the MSCI EAFE® Index (Net)1. The Schwab International Core Equity Fund returned approximately 17% for the reporting period.
The 2040 Fund’s fixed-income allocations also contributed to the total return of the 2040 Fund. The PIMCO International Bond Fund (U.S. Dollar-Hedged) (Institutional Class) contributed to the total return of the 2040 Fund, returning approximately 3% for the reporting period.
The 2040 Fund’s real estate allocation, the Schwab Global Real Estate Fund, was the largest detractor from the total return of the 2040 Fund. The Schwab Global Real Estate Fund returned approximately -4% for the reporting period, outperforming its comparative index, the FTSE EPRA Nareit Global Index (Net)1.
Management views and portfolio holdings may have changed since the report date.
1
The net version of the index reflects reinvested dividends net of withholding taxes but reflects no deductions for expenses or other taxes.
Schwab Target Funds | Annual Report25
Performance and Fund Facts as of October 31, 2023
The performance data quoted represents past performance. Past performance does not guarantee future results. Investment returns and principal value of an investment will fluctuate so that an investor’s shares may be worth more or less than their original cost. Current performance may be lower or higher than performance data quoted. To obtain performance information current to the most recent month end, please visit www.schwabassetmanagement.com/schwabfunds_prospectus.
Performance of Hypothetical $10,000 Investment (October 31, 2013 – October 31, 2023)1
Average Annual Total Returns1
| | | |
Fund: Schwab Target 2040 Fund (7/1/05) | | | |
Dow Jones U.S. Total Stock Market IndexSM | | | |
Bloomberg US Aggregate Bond Index | | | |
Target 2040 Composite Index | | | |
Fund Category: Morningstar Target-Date 20402 | | | |
Fund Expense Ratios3: Net 0.50%; Gross 0.52% |
All total returns on this page assume dividends and distributions were reinvested. Index figures do not include trading and management costs, which would lower performance. Indices are unmanaged and cannot be invested in directly. Performance results less than one year are not annualized.
For index definitions, please see the Glossary.
1
Fund expenses may have been partially absorbed by the investment adviser and its affiliates. Without these reductions, the fund’s returns would have been lower. These returns do not reflect the deduction of taxes that a shareholder would pay on fund distributions or the redemption of fund shares.
2
Source for category information: Morningstar, Inc. The Morningstar Category return represents all active and index mutual funds and ETFs within the category as of the report date.
3
As stated in the prospectus. Includes 0.50% of acquired fund fees and expenses (AFFE), which are indirect expenses incurred by the fund through its investments in the underlying funds. Net Expense: Expenses reduced by a contractual fee waiver in effect for so long as Schwab Asset Management serves as the investment adviser to the fund. Gross Expense: Does not reflect the effect of contractual fee waivers. For actual expense ratios during the period, not including AFFE, refer to the financial highlights section of the financial statements.
26
Schwab Target Funds | Annual Report
Performance and Fund Facts as of October 31, 2023 (continued)
Asset Class Weightings % of Investments1,2
Top Holdings % of Net Assets1,3
Portfolio holdings may have changed since the report date.
1
The fund intends to invest in a combination of the underlying funds; however, the fund may also invest directly in equity and fixed-income securities and money market securities.
2
The percentage may differ from the Portfolio Holdings because the above calculation is based on a percentage of total investments, whereas the calculation in the Portfolio Holdings is based on a percentage of net assets.
3
This list is not a recommendation of any security by the investment adviser.
Schwab Target Funds | Annual Report27
Schwab Target 2045 Fund as of October 31, 2023
The Schwab Target 2045 Fund (the 2045 Fund) seeks to provide capital appreciation and income consistent with its current asset allocation. The 2045 Fund seeks to achieve its investment objective by investing primarily in a combination of other affiliated Schwab Funds. The 2045 Fund may also invest in affiliated Schwab ETFs and unaffiliated third-party mutual funds and ETFs. The target asset allocation is adjusted annually by the investment adviser; as of the last annual adjustment at the beginning of February 2023, the 2045 Fund’s asset allocation was approximately 87.4% equity securities, 11.7% fixed-income securities, and 0.9% cash and cash equivalents (including money market funds). At its target date, the 2045 Fund’s allocation will be approximately 44.0% equity securities, 52.0% fixed-income securities, and 4.0% cash and cash equivalents (including money market funds). (For portfolio allocations as of the end of this reporting period, please see the 2045 Fund’s Portfolio Holdings included in this report.)
Market Highlights. For the 12-month reporting period ended October 31, 2023, U.S. equity markets were mixed, and international equity markets posted positive returns. U.S. stocks were volatile for the first half of the reporting period as inflation remained elevated, the U.S. Federal Reserve (Fed) continued to raise interest rates, and the failure of three U.S. regional banks in early March raised concerns about the stability of the banking sector. Despite these headwinds, as inflation began to ease, U.S. stocks staged a relatively steady upswing through August driven primarily by performance of the “Magnificent Seven” (Alphabet, Inc., Amazon.com, Inc., Apple, Inc., Meta Platforms, Inc., Microsoft Corp., NVIDIA Corp., and Tesla, Inc.). U.S. stocks, particularly dividend paying stocks, began to falter over the final two months of the reporting period as soaring U.S. Treasury yields offered investors attractive alternatives to stocks. Outside the U.S., the ongoing war between Russia and Ukraine and the Israel-Hamas war that broke out following Hamas’ attack on Israel in early October weighed on the global economy. U.S. large-cap stocks outperformed U.S. small-cap stocks and among U.S. large-cap stocks, growth stocks outperformed value stocks. U.S. and international bonds were relatively weak as economic uncertainty and rising interest rates over much of the period drove yields up and bond prices down. (Bond yields and bond prices typically move in opposite directions.) The U.S. dollar, as measured against a basket of international currencies, generally weakened until mid-July, when it hit a reporting-period low, then began to rise but ended the reporting period weaker than where it began.
Performance. For the 12-month reporting period ended October 31, 2023, the 2045 Fund returned 8.24%. The 2045 Fund’s internally calculated comparative index, the Target 2045 Composite Index (the composite index), returned 7.92%.
Positioning and Strategies. The 2045 Fund’s asset allocations were broadly in line with those of the composite index over the reporting period.
The 2045 Fund’s U.S. equity allocations, particularly the 2045 Fund’s U.S. large-cap equity allocations, contributed the most to the total return of the 2045 Fund. The Schwab S&P 500 Index Fund was the largest contributor to the total return of the 2045 Fund, returning approximately 10% for the reporting period, generally tracking its comparative index, the S&P 500® Index. The ClearBridge Small Cap Growth Fund (Class IS) detracted from the total return of the 2045 Fund, returning approximately -13% for the reporting period.
The 2045 Fund’s international equity allocations also contributed to the total return of the 2045 Fund. The Schwab International Core Equity Fund contributed to the total return of the 2045 Fund, outperforming its comparative index, the MSCI EAFE® Index (Net)1. The Schwab International Core Equity Fund returned approximately 17% for the reporting period.
The 2045 Fund’s fixed-income allocations also contributed to the total return of the 2045 Fund. The PIMCO International Bond Fund (U.S. Dollar-Hedged) (Institutional Class) contributed to the total return of the 2045 Fund, returning approximately 3% for the reporting period.
The 2045 Fund’s real estate allocation, the Schwab Global Real Estate Fund, was the largest detractor from the total return of the 2045 Fund. The Schwab Global Real Estate Fund returned approximately -4% for the reporting period, outperforming its comparative index, the FTSE EPRA Nareit Global Index (Net)1.
Management views and portfolio holdings may have changed since the report date.
1
The net version of the index reflects reinvested dividends net of withholding taxes but reflects no deductions for expenses or other taxes.
28
Schwab Target Funds | Annual Report
Performance and Fund Facts as of October 31, 2023
The performance data quoted represents past performance. Past performance does not guarantee future results. Investment returns and principal value of an investment will fluctuate so that an investor’s shares may be worth more or less than their original cost. Current performance may be lower or higher than performance data quoted. To obtain performance information current to the most recent month end, please visit www.schwabassetmanagement.com/schwabfunds_prospectus.
Performance of Hypothetical $10,000 Investment (October 31, 2013 – October 31, 2023)1
Average Annual Total Returns1
| | | |
Fund: Schwab Target 2045 Fund (1/23/13) | | | |
Dow Jones U.S. Total Stock Market IndexSM | | | |
Bloomberg US Aggregate Bond Index | | | |
Target 2045 Composite Index | | | |
Fund Category: Morningstar Target-Date 20452 | | | |
Fund Expense Ratios3: Net 0.54%; Gross 0.59% |
All total returns on this page assume dividends and distributions were reinvested. Index figures do not include trading and management costs, which would lower performance. Indices are unmanaged and cannot be invested in directly. Performance results less than one year are not annualized.
For index definitions, please see the Glossary.
1
Fund expenses may have been partially absorbed by the investment adviser and its affiliates. Without these reductions, the fund’s returns would have been lower. These returns do not reflect the deduction of taxes that a shareholder would pay on fund distributions or the redemption of fund shares.
2
Source for category information: Morningstar, Inc. The Morningstar Category return represents all active and index mutual funds and ETFs within the category as of the report date.
3
As stated in the prospectus. Includes 0.54% of acquired fund fees and expenses (AFFE), which are indirect expenses incurred by the fund through its investments in the underlying funds. Net Expense: Expenses reduced by a contractual fee waiver in effect for so long as Schwab Asset Management serves as the investment adviser to the fund. Gross Expense: Does not reflect the effect of contractual fee waivers. For actual expense ratios during the period, not including AFFE, refer to the financial highlights section of the financial statements.
Schwab Target Funds | Annual Report29
Performance and Fund Facts as of October 31, 2023 (continued)
Asset Class Weightings % of Investments1,2
Top Holdings % of Net Assets1,3
Portfolio holdings may have changed since the report date.
1
The fund intends to invest in a combination of the underlying funds; however, the fund may also invest directly in equity and fixed-income securities and money market securities.
2
The percentage may differ from the Portfolio Holdings because the above calculation is based on a percentage of total investments, whereas the calculation in the Portfolio Holdings is based on a percentage of net assets.
3
This list is not a recommendation of any security by the investment adviser.
30
Schwab Target Funds | Annual Report
Schwab Target 2050 Fund as of October 31, 2023
The Schwab Target 2050 Fund (the 2050 Fund) seeks to provide capital appreciation and income consistent with its current asset allocation. The 2050 Fund seeks to achieve its investment objective by investing primarily in a combination of other affiliated Schwab Funds. The 2050 Fund may also invest in affiliated Schwab ETFs and unaffiliated third-party mutual funds and ETFs. The target asset allocation is adjusted annually by the investment adviser; as of the last annual adjustment at the beginning of February 2023, the 2050 Fund’s asset allocation was approximately 91.5% equity securities, 7.8% fixed-income securities, and 0.7% cash and cash equivalents (including money market funds). At its target date, the 2050 Fund’s allocation will be approximately 44.0% equity securities, 54.0% fixed-income securities, and 4.0% cash and cash equivalents (including money market funds). (For portfolio allocations as of the end of this reporting period, please see the 2050 Fund’s Portfolio Holdings included in this report.)
Market Highlights. For the 12-month reporting period ended October 31, 2023, U.S. equity markets were mixed, and international equity markets posted positive returns. U.S. stocks were volatile for the first half of the reporting period as inflation remained elevated, the U.S. Federal Reserve (Fed) continued to raise interest rates, and the failure of three U.S. regional banks in early March raised concerns about the stability of the banking sector. Despite these headwinds, as inflation began to ease, U.S. stocks staged a relatively steady upswing through August driven primarily by performance of the “Magnificent Seven” (Alphabet, Inc., Amazon.com, Inc., Apple, Inc., Meta Platforms, Inc., Microsoft Corp., NVIDIA Corp., and Tesla, Inc.). U.S. stocks, particularly dividend paying stocks, began to falter over the final two months of the reporting period as soaring U.S. Treasury yields offered investors attractive alternatives to stocks. Outside the U.S., the ongoing war between Russia and Ukraine and the Israel-Hamas war that broke out following Hamas’ attack on Israel in early October weighed on the global economy. U.S. large-cap stocks outperformed U.S. small-cap stocks and among U.S. large-cap stocks, growth stocks outperformed value stocks. U.S. and international bonds were relatively weak as economic uncertainty and rising interest rates over much of the period drove yields up and bond prices down. (Bond yields and bond prices typically move in opposite directions.) The U.S. dollar, as measured against a basket of international currencies, generally weakened until mid-July, when it hit a reporting-period low, then began to rise but ended the reporting period weaker than where it began.
Performance. For the 12-month reporting period ended October 31, 2023, the 2050 Fund returned 8.62%. The 2050 Fund’s internally calculated comparative index, the Target 2050 Composite Index (the composite index), returned 8.13%.
Positioning and Strategies. The 2050 Fund’s asset allocations were broadly in line with those of the composite index over the reporting period.
The 2050 Fund’s U.S. equity allocations, particularly the 2050 Fund’s U.S. large-cap equity allocations, contributed the most to the total return of the 2050 Fund. The Schwab S&P 500 Index Fund was the largest contributor to the total return of the 2050 Fund, returning approximately 10% for the reporting period, generally tracking its comparative index, the S&P 500® Index. The ClearBridge Small Cap Growth Fund (Class IS) detracted from the total return of the 2050 Fund, returning approximately -13% for the reporting period.
The 2050 Fund’s international equity allocations also contributed to the total return of the 2050 Fund. The Schwab International Core Equity Fund contributed to the total return of the 2050 Fund, outperforming its comparative index, the MSCI EAFE® Index (Net)1. The Schwab International Core Equity Fund returned approximately 17% for the reporting period.
The 2050 Fund’s fixed-income allocations also contributed to the total return of the 2050 Fund. The PIMCO International Bond Fund (U.S. Dollar-Hedged) (Institutional Class) contributed to the total return of the 2050 Fund, returning approximately 3% for the reporting period.
The 2050 Fund’s real estate allocation, the Schwab Global Real Estate Fund, was the largest detractor from the total return of the 2050 Fund. The Schwab Global Real Estate Fund returned approximately -4% for the reporting period, outperforming its comparative index, the FTSE EPRA Nareit Global Index (Net)1.
Management views and portfolio holdings may have changed since the report date.
1
The net version of the index reflects reinvested dividends net of withholding taxes but reflects no deductions for expenses or other taxes.
Schwab Target Funds | Annual Report31
Performance and Fund Facts as of October 31, 2023
The performance data quoted represents past performance. Past performance does not guarantee future results. Investment returns and principal value of an investment will fluctuate so that an investor’s shares may be worth more or less than their original cost. Current performance may be lower or higher than performance data quoted. To obtain performance information current to the most recent month end, please visit www.schwabassetmanagement.com/schwabfunds_prospectus.
Performance of Hypothetical $10,000 Investment (October 31, 2013 – October 31, 2023)1
Average Annual Total Returns1
| | | |
Fund: Schwab Target 2050 Fund (1/23/13) | | | |
Dow Jones U.S. Total Stock Market IndexSM | | | |
Bloomberg US Aggregate Bond Index | | | |
Target 2050 Composite Index | | | |
Fund Category: Morningstar Target-Date 20502 | | | |
Fund Expense Ratios3: Net 0.56%; Gross 0.61% |
All total returns on this page assume dividends and distributions were reinvested. Index figures do not include trading and management costs, which would lower performance. Indices are unmanaged and cannot be invested in directly. Performance results less than one year are not annualized.
For index definitions, please see the Glossary.
1
Fund expenses may have been partially absorbed by the investment adviser and its affiliates. Without these reductions, the fund’s returns would have been lower. These returns do not reflect the deduction of taxes that a shareholder would pay on fund distributions or the redemption of fund shares.
2
Source for category information: Morningstar, Inc. The Morningstar Category return represents all active and index mutual funds and ETFs within the category as of the report date.
3
As stated in the prospectus. Includes 0.56% of acquired fund fees and expenses (AFFE), which are indirect expenses incurred by the fund through its investments in the underlying funds. Net Expense: Expenses reduced by a contractual fee waiver in effect for so long as Schwab Asset Management serves as the investment adviser to the fund. Gross Expense: Does not reflect the effect of contractual fee waivers. For actual expense ratios during the period, not including AFFE, refer to the financial highlights section of the financial statements.
32
Schwab Target Funds | Annual Report
Performance and Fund Facts as of October 31, 2023 (continued)
Asset Class Weightings % of Investments1,2
Top Holdings % of Net Assets1,3
Portfolio holdings may have changed since the report date.
1
The fund intends to invest in a combination of the underlying funds; however, the fund may also invest directly in equity and fixed-income securities and money market securities.
2
The percentage may differ from the Portfolio Holdings because the above calculation is based on a percentage of total investments, whereas the calculation in the Portfolio Holdings is based on a percentage of net assets.
3
This list is not a recommendation of any security by the investment adviser.
Schwab Target Funds | Annual Report33
Schwab Target 2055 Fund as of October 31, 2023
The Schwab Target 2055 Fund (the 2055 Fund) seeks to provide capital appreciation and income consistent with its current asset allocation. The 2055 Fund seeks to achieve its investment objective by investing primarily in a combination of other affiliated Schwab Funds. The 2055 Fund may also invest in affiliated Schwab ETFs and unaffiliated third-party mutual funds and ETFs. The target asset allocation is adjusted annually by the investment adviser; as of the last annual adjustment at the beginning of February 2023, the 2055 Fund’s asset allocation was approximately 93.8% equity securities, 5.7% fixed-income securities, and 0.5% cash and cash equivalents (including money market funds). At its target date, the 2055 Fund’s allocation will be approximately 44.0% equity securities, 52.0% fixed-income securities, and 4.0% cash and cash equivalents (including money market funds). (For portfolio allocations as of the end of this reporting period, please see the 2055 Fund’s Portfolio Holdings included in this report.)
Market Highlights. For the 12-month reporting period ended October 31, 2023, U.S. equity markets were mixed, and international equity markets posted positive returns. U.S. stocks were volatile for the first half of the reporting period as inflation remained elevated, the U.S. Federal Reserve (Fed) continued to raise interest rates, and the failure of three U.S. regional banks in early March raised concerns about the stability of the banking sector. Despite these headwinds, as inflation began to ease, U.S. stocks staged a relatively steady upswing through August driven primarily by performance of the “Magnificent Seven” (Alphabet, Inc., Amazon.com, Inc., Apple, Inc., Meta Platforms, Inc., Microsoft Corp., NVIDIA Corp., and Tesla, Inc.). U.S. stocks, particularly dividend paying stocks, began to falter over the final two months of the reporting period as soaring U.S. Treasury yields offered investors attractive alternatives to stocks. Outside the U.S., the ongoing war between Russia and Ukraine and the Israel-Hamas war that broke out following Hamas’ attack on Israel in early October weighed on the global economy. U.S. large-cap stocks outperformed U.S. small-cap stocks and among U.S. large-cap stocks, growth stocks outperformed value stocks. U.S. and international bonds were relatively weak as economic uncertainty and rising interest rates over much of the period drove yields up and bond prices down. (Bond yields and bond prices typically move in opposite directions.) The U.S. dollar, as measured against a basket of international currencies, generally weakened until mid-July, when it hit a reporting-period low, then began to rise but ended the reporting period weaker than where it began.
Performance. For the 12-month reporting period ended October 31, 2023, the 2055 Fund returned 8.62%. The 2055 Fund’s internally calculated comparative index, the Target 2055 Composite Index (the composite index), returned 8.25%.
Positioning and Strategies. The 2055 Fund’s asset allocations were broadly in line with those of the composite index over the reporting period.
The 2055 Fund’s U.S. equity allocations, particularly the 2055 Fund’s U.S. large-cap equity allocations, contributed the most to the total return of the 2055 Fund. The Schwab Select Large Cap Growth Fund was the largest contributor to the total return of the 2055 Fund, returning approximately 23% for the reporting period, outperforming the comparative index, the S&P 500® Index. The ClearBridge Small Cap Growth Fund (Class IS) detracted from the total return of the 2055 Fund, returning approximately -13% for the reporting period.
The 2055 Fund’s international equity allocations also contributed to the total return of the 2055 Fund. The Schwab International Core Equity Fund contributed to the total return of the 2055 Fund, outperforming its comparative index, the MSCI EAFE® Index (Net)1. The Schwab International Core Equity Fund returned approximately 17% for the reporting period.
The 2055 Fund’s fixed-income allocations also contributed to the total return of the 2055 Fund. The PIMCO International Bond Fund (U.S. Dollar-Hedged) (Institutional Class) contributed to the total return of the 2055 Fund, returning approximately 3% for the reporting period.
The 2055 Fund’s real estate allocation, the Schwab Global Real Estate Fund, was the largest detractor from the total return of the 2055 Fund. The Schwab Global Real Estate Fund returned approximately -4% for the reporting period, outperforming its comparative index, the FTSE EPRA Nareit Global Index (Net)1.
Management views and portfolio holdings may have changed since the report date.
1
The net version of the index reflects reinvested dividends net of withholding taxes but reflects no deductions for expenses or other taxes.
34
Schwab Target Funds | Annual Report
Performance and Fund Facts as of October 31, 2023
The performance data quoted represents past performance. Past performance does not guarantee future results. Investment returns and principal value of an investment will fluctuate so that an investor’s shares may be worth more or less than their original cost. Current performance may be lower or higher than performance data quoted. To obtain performance information current to the most recent month end, please visit www.schwabassetmanagement.com/schwabfunds_prospectus.
Performance of Hypothetical $10,000 Investment (October 31, 2013 – October 31, 2023)1
Average Annual Total Returns1
| | | |
Fund: Schwab Target 2055 Fund (1/23/13) | | | |
Dow Jones U.S. Total Stock Market IndexSM | | | |
Bloomberg US Aggregate Bond Index | | | |
Target 2055 Composite Index | | | |
Fund Category: Morningstar Target-Date 20552 | | | |
Fund Expense Ratios3: Net 0.58%; Gross 0.65% |
All total returns on this page assume dividends and distributions were reinvested. Index figures do not include trading and management costs, which would lower performance. Indices are unmanaged and cannot be invested in directly. Performance results less than one year are not annualized.
For index definitions, please see the Glossary.
1
Fund expenses may have been partially absorbed by the investment adviser and its affiliates. Without these reductions, the fund’s returns would have been lower. These returns do not reflect the deduction of taxes that a shareholder would pay on fund distributions or the redemption of fund shares.
2
Source for category information: Morningstar, Inc. The Morningstar Category return represents all active and index mutual funds and ETFs within the category as of the report date.
3
As stated in the prospectus. Includes 0.58% of acquired fund fees and expenses (AFFE), which are indirect expenses incurred by the fund through its investments in the underlying funds. Net Expense: Expenses reduced by a contractual fee waiver in effect for so long as Schwab Asset Management serves as the investment adviser to the fund. Gross Expense: Does not reflect the effect of contractual fee waivers. For actual expense ratios during the period, not including AFFE, refer to the financial highlights section of the financial statements.
Schwab Target Funds | Annual Report35
Performance and Fund Facts as of October 31, 2023 (continued)
Asset Class Weightings % of Investments1,2
Top Holdings % of Net Assets1,3
Portfolio holdings may have changed since the report date.
1
The fund intends to invest in a combination of the underlying funds; however, the fund may also invest directly in equity and fixed-income securities and money market securities.
2
The percentage may differ from the Portfolio Holdings because the above calculation is based on a percentage of total investments, whereas the calculation in the Portfolio Holdings is based on a percentage of net assets.
3
This list is not a recommendation of any security by the investment adviser.
36
Schwab Target Funds | Annual Report
Schwab Target 2060 Fund as of October 31, 2023
The Schwab Target 2060 Fund (the 2060 Fund) seeks to provide capital appreciation and income consistent with its current asset allocation. The 2060 Fund seeks to achieve its investment objective by investing primarily in a combination of other affiliated Schwab Funds. The 2060 Fund may also invest in affiliated Schwab ETFs and unaffiliated third-party mutual funds and ETFs. The target asset allocation is adjusted annually by the investment adviser; as of the last annual adjustment at the beginning of February 2023, the 2060 Fund’s asset allocation was approximately 95.8% equity securities, 3.7% fixed-income securities, and 0.5% cash and cash equivalents (including money market funds). At its target date, the 2060 Fund’s allocation will be approximately 44.0% equity securities, 52.0% fixed-income securities, and 4.0% cash and cash equivalents (including money market funds). (For portfolio allocations as of the end of this reporting period, please see the 2060 Fund’s Portfolio Holdings included in this report.)
Market Highlights. For the 12-month reporting period ended October 31, 2023, U.S. equity markets were mixed, and international equity markets posted positive returns. U.S. stocks were volatile for the first half of the reporting period as inflation remained elevated, the U.S. Federal Reserve (Fed) continued to raise interest rates, and the failure of three U.S. regional banks in early March raised concerns about the stability of the banking sector. Despite these headwinds, as inflation began to ease, U.S. stocks staged a relatively steady upswing through August driven primarily by performance of the “Magnificent Seven” (Alphabet, Inc., Amazon.com, Inc., Apple, Inc., Meta Platforms, Inc., Microsoft Corp., NVIDIA Corp., and Tesla, Inc.). U.S. stocks, particularly dividend paying stocks, began to falter over the final two months of the reporting period as soaring U.S. Treasury yields offered investors attractive alternatives to stocks. Outside the U.S., the ongoing war between Russia and Ukraine and the Israel-Hamas war that broke out following Hamas’ attack on Israel in early October weighed on the global economy. U.S. large-cap stocks outperformed U.S. small-cap stocks and among U.S. large-cap stocks, growth stocks outperformed value stocks. U.S. and international bonds were relatively weak as economic uncertainty and rising interest rates over much of the period drove yields up and bond prices down. (Bond yields and bond prices typically move in opposite directions.) The U.S. dollar, as measured against a basket of international currencies, generally weakened until mid-July, when it hit a reporting-period low, then began to rise but ended the reporting period weaker than where it began.
Performance. For the 12-month reporting period ended October 31, 2023, the 2060 Fund returned 8.82%. The 2060 Fund’s internally calculated comparative index, the Target 2060 Composite Index (the composite index), returned 8.37%.
Positioning and Strategies. The 2060 Fund’s asset allocations were broadly in line with those of the composite index over the reporting period.
The 2060 Fund’s U.S. equity allocations, particularly the 2060 Fund’s U.S. large-cap equity allocations, contributed the most to the total return of the 2060 Fund. The Schwab Select Large Cap Growth Fund was the largest contributor to the total return of the 2060 Fund, returning approximately 23% for the reporting period, outperforming the comparative index, the S&P 500® Index. The ClearBridge Small Cap Growth Fund (Class IS) detracted from the total return of the 2060 Fund, returning approximately -13% for the reporting period.
The 2060 Fund’s international equity allocations also contributed to the total return of the 2060 Fund. The Schwab International Core Equity Fund contributed to the total return of the 2060 Fund, outperforming its comparative index, the MSCI EAFE® Index (Net)1. The Schwab International Core Equity Fund returned approximately 17% for the reporting period.
The 2060 Fund’s fixed-income allocations slightly contributed to the total return of the 2060 Fund. The PIMCO International Bond Fund (U.S. Dollar-Hedged) (Institutional Class) contributed to the total return of the 2060 Fund, returning approximately 3% for the reporting period.
The 2060 Fund’s real estate allocation, the Schwab Global Real Estate Fund, was the largest detractor from the total return of the 2060 Fund. The Schwab Global Real Estate Fund returned approximately -4% for the reporting period, outperforming its comparative index, the FTSE EPRA Nareit Global Index (Net)1.
Management views and portfolio holdings may have changed since the report date.
1
The net version of the index reflects reinvested dividends net of withholding taxes but reflects no deductions for expenses or other taxes.
Schwab Target Funds | Annual Report37
Performance and Fund Facts as of October 31, 2023
The performance data quoted represents past performance. Past performance does not guarantee future results. Investment returns and principal value of an investment will fluctuate so that an investor’s shares may be worth more or less than their original cost. Current performance may be lower or higher than performance data quoted. To obtain performance information current to the most recent month end, please visit www.schwabassetmanagement.com/schwabfunds_prospectus.
Performance of Hypothetical $10,000 Investment (August 25, 2016 – October 31, 2023)1
Average Annual Total Returns1
| | | |
Fund: Schwab Target 2060 Fund (8/25/16) | | | |
Dow Jones U.S. Total Stock Market IndexSM | | | |
Bloomberg US Aggregate Bond Index | | | |
Target 2060 Composite Index | | | |
Fund Category: Morningstar Target-Date 20602 | | | |
Fund Expense Ratios3: Net 0.59%; Gross 0.79% |
All total returns on this page assume dividends and distributions were reinvested. Index figures do not include trading and management costs, which would lower performance. Indices are unmanaged and cannot be invested in directly. Performance results less than one year are not annualized.
For index definitions, please see the Glossary.
1
Fund expenses may have been partially absorbed by the investment adviser and its affiliates. Without these reductions, the fund’s returns would have been lower. These returns do not reflect the deduction of taxes that a shareholder would pay on fund distributions or the redemption of fund shares.
2
Source for category information: Morningstar, Inc. The Morningstar Category return represents all active and index mutual funds and ETFs within the category as of the report date.
3
As stated in the prospectus. Includes 0.59% of acquired fund fees and expenses (AFFE), which are indirect expenses incurred by the fund through its investments in the underlying funds. Net Expense: Expenses reduced by a contractual fee waiver in effect for so long as Schwab Asset Management serves as the investment adviser to the fund. Gross Expense: Does not reflect the effect of contractual fee waivers. For actual expense ratios during the period, not including AFFE, refer to the financial highlights section of the financial statements.
38
Schwab Target Funds | Annual Report
Performance and Fund Facts as of October 31, 2023 (continued)
Asset Class Weightings % of Investments1,2
Top Holdings % of Net Assets1,3
Portfolio holdings may have changed since the report date.
1
The fund intends to invest in a combination of the underlying funds; however, the fund may also invest directly in equity and fixed-income securities and money market securities.
2
The percentage may differ from the Portfolio Holdings because the above calculation is based on a percentage of total investments, whereas the calculation in the Portfolio Holdings is based on a percentage of net assets.
3
This list is not a recommendation of any security by the investment adviser.
Schwab Target Funds | Annual Report39
Schwab Target 2065 Fund as of October 31, 2023
The Schwab Target 2065 Fund (the 2065 Fund) seeks to provide capital appreciation and income consistent with its current asset allocation. The 2065 Fund seeks to achieve its investment objective by investing primarily in a combination of other affiliated Schwab Funds. The 2065 Fund may also invest in affiliated Schwab ETFs and unaffiliated third-party mutual funds and ETFs. The target asset allocation is adjusted annually by the investment adviser; as of the last annual adjustment at the beginning of February 2023, the 2065 Fund’s asset allocation was approximately 97.0% equity securities, 2.5% fixed-income securities, and 0.5% cash and cash equivalents (including money market funds). At its target date, the 2065 Fund’s allocation will be approximately 44.0% equity securities, 52.0% fixed-income securities, and 4.0% cash and cash equivalents (including money market funds). (For portfolio allocations as of the end of this reporting period, please see the 2065 Fund’s Portfolio Holdings included in this report.)
Market Highlights. For the 12-month reporting period ended October 31, 2023, U.S. equity markets were mixed, and international equity markets posted positive returns. U.S. stocks were volatile for the first half of the reporting period as inflation remained elevated, the U.S. Federal Reserve (Fed) continued to raise interest rates, and the failure of three U.S. regional banks in early March raised concerns about the stability of the banking sector. Despite these headwinds, as inflation began to ease, U.S. stocks staged a relatively steady upswing through August driven primarily by performance of the “Magnificent Seven” (Alphabet, Inc., Amazon.com, Inc., Apple, Inc., Meta Platforms, Inc., Microsoft Corp., NVIDIA Corp., and Tesla, Inc.). U.S. stocks, particularly dividend paying stocks, began to falter over the final two months of the reporting period as soaring U.S. Treasury yields offered investors attractive alternatives to stocks. Outside the U.S., the ongoing war between Russia and Ukraine and the Israel-Hamas war that broke out following Hamas’ attack on Israel in early October weighed on the global economy. U.S. large-cap stocks outperformed U.S. small-cap stocks and among U.S. large-cap stocks, growth stocks outperformed value stocks. U.S. and international bonds were relatively weak as economic uncertainty and rising interest rates over much of the period drove yields up and bond prices down. (Bond yields and bond prices typically move in opposite directions.) The U.S. dollar, as measured against a basket of international currencies, generally weakened until mid-July, when it hit a reporting-period low, then began to rise but ended the reporting period weaker than where it began.
Performance. For the 12-month reporting period ended October 31, 2023, the 2065 Fund returned 8.75%. The 2065 Fund’s internally calculated comparative index, the Target 2065 Composite Index (the composite index), returned 8.42%.
Positioning and Strategies. The 2065 Fund’s asset allocations were broadly in line with those of the composite index over the reporting period.
The 2065 Fund’s U.S. equity allocations, particularly the 2065 Fund’s U.S. large-cap equity allocations, contributed the most to the total return of the 2065 Fund. The Schwab Select Large Cap Growth Fund was the largest contributor to the total return of the 2065 Fund, returning approximately 23% for the reporting period, outperforming the comparative index, the S&P 500® Index. The ClearBridge Small Cap Growth Fund (Class IS) detracted from the total return of the 2065 Fund, returning approximately -13% for the reporting period.
The 2065 Fund’s international equity allocations also contributed to the total return of the 2065 Fund. The Schwab International Core Equity Fund contributed to the total return of the 2065 Fund, outperforming its comparative index, the MSCI EAFE® Index (Net)1. The Schwab International Core Equity Fund returned approximately 17% for the reporting period.
The 2065 Fund’s fixed-income allocations slightly contributed to the total return of the 2065 Fund. The PIMCO International Bond Fund (U.S. Dollar-Hedged) (Institutional Class) contributed to the total return of the 2065 Fund, returning approximately 3% for the reporting period.
The 2065 Fund’s real estate allocation, the Schwab Global Real Estate Fund, was the largest detractor from the total return of the 2065 Fund. The Schwab Global Real Estate Fund returned approximately -4% for the reporting period, outperforming its comparative index, the FTSE EPRA Nareit Global Index (Net)1.
Management views and portfolio holdings may have changed since the report date.
1
The net version of the index reflects reinvested dividends net of withholding taxes but reflects no deductions for expenses or other taxes.
40
Schwab Target Funds | Annual Report
Performance and Fund Facts as of October 31, 2023
The performance data quoted represents past performance. Past performance does not guarantee future results. Investment returns and principal value of an investment will fluctuate so that an investor’s shares may be worth more or less than their original cost. Current performance may be lower or higher than performance data quoted. To obtain performance information current to the most recent month end, please visit www.schwabassetmanagement.com/schwabfunds_prospectus.
Performance of Hypothetical $10,000 Investment (February 25, 2021 – October 31, 2023)1
Average Annual Total Returns1
| | |
Fund: Schwab Target 2065 Fund (2/25/21) | | |
Dow Jones U.S. Total Stock Market IndexSM | | |
Bloomberg US Aggregate Bond Index | | |
Target 2065 Composite Index | | |
Fund Category: Morningstar Target-Date 2065+2 | | |
Fund Expense Ratios3: Net 0.59%; Gross 1.69% |
All total returns on this page assume dividends and distributions were reinvested. Index figures do not include trading and management costs, which would lower performance. Indices are unmanaged and cannot be invested in directly. Performance results less than one year are not annualized.
For index definitions, please see the Glossary.
1
Fund expenses may have been partially absorbed by the investment adviser and its affiliates. Without these reductions, the fund’s returns would have been lower. These returns do not reflect the deduction of taxes that a shareholder would pay on fund distributions or the redemption of fund shares.
2
Source for category information: Morningstar, Inc. The Morningstar Category return represents all active and index mutual funds and ETFs within the category as of the report date.
3
As stated in the prospectus. Includes 0.59% of acquired fund fees and expenses (AFFE), which are indirect expenses incurred by the fund through its investments in the underlying funds. Net Expense: Expenses reduced by a contractual fee waiver in effect for so long as Schwab Asset Management serves as the investment adviser to the fund. Gross Expense: Does not reflect the effect of contractual fee waivers. For actual expense ratios during the period, not including AFFE, refer to the financial highlights section of the financial statements.
Schwab Target Funds | Annual Report41
Performance and Fund Facts as of October 31, 2023 (continued)
Asset Class Weightings % of Investments1,2
Top Holdings % of Net Assets1,3
Portfolio holdings may have changed since the report date.
1
The fund intends to invest in a combination of the underlying funds; however, the fund may also invest directly in equity and fixed-income securities and money market securities.
2
The percentage may differ from the Portfolio Holdings because the above calculation is based on a percentage of total investments, whereas the calculation in the Portfolio Holdings is based on a percentage of net assets.
3
This list is not a recommendation of any security by the investment adviser.
42
Schwab Target Funds | Annual Report
Fund Expenses (Unaudited)
Examples for a $1,000 Investment
As a fund shareholder, you may incur two types of costs: (1) transaction costs; and (2) ongoing costs, including transfer agent fees and other fund expenses.
The expense examples below are intended to help you understand your ongoing cost (in dollars) of investing in a fund and to compare this cost with the ongoing cost of investing in other mutual funds. These examples are based on an investment of $1,000 invested for six months beginning May 1, 2023 and held through October 31, 2023.
Actual Return lines in the table below provide information about actual account values and actual expenses. You may use this information, together with the amount you invested, to estimate the expenses that you paid over the period. To do so, simply divide your account value by $1,000 (for example, an $8,600 account value ÷ $1,000 = 8.6), then multiply the result by the number given for your fund under the heading entitled “Expenses Paid During Period.”
Hypothetical Return lines in the table below provide information about hypothetical account values and hypothetical expenses based on a fund’s actual expense ratio and an assumed return of 5% per year before expenses. Because the return used is not an actual return, it may not be used to estimate the actual ending account value or expenses you paid for the period.
You may use this information to compare the ongoing costs of investing in a fund and other funds. To do so, compare this 5% hypothetical example with the 5% hypothetical examples that appear in the shareholder reports of the other funds.
Please note that the expenses shown in the table are meant to highlight your ongoing costs only and do not reflect any transactional costs. Therefore, the hypothetical return lines of the table are useful in comparing ongoing costs only and will not help you determine the relative total costs of owning different funds. In addition, if these transactional costs were included, your costs would have been higher.
| | | BEGINNING
ACCOUNT VALUE
AT 5/1/23 | ENDING
ACCOUNT VALUE
(NET OF EXPENSES)
| EXPENSES PAID
DURING PERIOD
| EFFECTIVE
EXPENSES PAID
DURING PERIOD
|
| | | | | | |
| | | | | | |
| | | | | | |
| | | | | | |
| | | | | | |
| | | | | | |
| | | | | | |
| | | | | | |
| | | | | | |
| | | | | | |
| | | | | | |
| | | | | | |
| | | | | | |
| | | | | | |
| | | | | | |
| | | | | | |
| | | | | | |
| | | | | | |
| | | | | | |
| | | | | | |
| | | | | | |
| | | | | | |
| | | | | | |
| | | | | | |
| | | | | | |
| | | | | | |
| | | | | | |
| | | | | | |
| | | | | | |
| | | | | | |
Schwab Target Funds | Annual Report43
Fund Expenses (Unaudited) (continued)
| EXPENSE RATIO (ANNUALIZED)1,2 | EFFECTIVE EXPENSE RATIO (ANNUALIZED)3,4 | BEGINNING ACCOUNT VALUE AT 5/1/23 | ENDING ACCOUNT VALUE (NET OF EXPENSES) AT 10/31/232 | EXPENSES PAID DURING PERIOD 5/1/23-10/31/232,5 | EFFECTIVE EXPENSES PAID DURING PERIOD 5/1/23-10/31/234,5 |
| | | | | | |
| | | | | | |
| | | | | | |
| | | | | | |
| | | | | | |
| | | | | | |
| Based on the most recent six-month expense ratio. |
| Excludes acquired fund fees and expenses, which are indirect expenses incurred by the fund through its investments in underlying funds. |
| Based on the most recent six-month acquired fund fees and expenses and the expense ratio; may differ from the acquired fund fees and expenses and the expense ratio in the prospectus. |
| Includes acquired fund fees and expenses, which are indirect expenses incurred by the fund through its investments in underlying funds. |
| Expenses for each fund are equal to its annualized expense ratio, multiplied by the average account value over the period, multiplied by the 184 days in the period, and divided by the 365 days in the fiscal year. |
44
Schwab Target Funds | Annual Report
Financial Statements
| | | | | | |
|
Net asset value at beginning of period | | | | | | |
Income (loss) from investment operations: | | | | | | |
Net investment income (loss)1 | | | | | | |
Net realized and unrealized gains (losses) | | | | | | |
Total from investment operations | | | | | | |
| | | | | | |
Distributions from net investment income | | | | | | |
Distributions from net realized gains | | | | | | |
| | | | | | |
Net asset value at end of period | | | | | | |
| | | | | | |
|
Ratios to average net assets: | | | | | | |
| | | | | | |
Gross operating expenses2 | | | | | | |
Net investment income (loss) | | | | | | |
| | | | | | |
Net assets, end of period (x 1,000) | | | | | | |
| Calculated based on the average shares outstanding during the period. |
| Ratio excludes acquired fund fees and expenses, which are indirect expenses incurred by the fund through its investments in underlying funds. |
| Ratio includes less than 0.005% of non-routine proxy expenses. |
Schwab Target Funds | Annual Report45
Portfolio Holdings as of October 31, 2023
This section shows all the securities in the fund’s portfolio and their values as of the report date, including a summary of the fund’s transactions with its affiliated underlying funds during the period.
The fund files its complete schedule of portfolio holdings with the U.S. Securities and Exchange Commission (SEC) for the first and third quarters of each fiscal year on Form N-PORT Part F. The fund’s Form N-PORT Part F is available on the SEC’s website at www.sec.gov. You can also obtain this information at no cost on the fund’s website at www.schwabassetmanagement.com/schwabfunds_prospectus, by calling 1-866-414-6349, or by sending an email request to orders@mysummaryprospectus.com. The fund also makes available its complete schedule of portfolio holdings 15 to 20 days after the end of the month on the fund’s website.
| | | | | NET CHANGE IN UNREALIZED APPRECIATION (DEPRECIATION) | | BALANCE OF SHARES HELD AT 10/31/23 | |
AFFILIATED UNDERLYING FUNDS 75.8% OF NET ASSETS |
|
|
|
| | | | | | | | |
Schwab Fundamental US Large Company Index Fund | | | | | | | | |
Schwab S&P 500 Index Fund | | | | | | | | |
Schwab Select Large Cap Growth Fund * | | | | | | | | |
| | | | | | | | |
|
Schwab U.S. Mid-Cap Index Fund * | | | | | | | | |
|
Schwab Small-Cap Equity Fund | | | | | | | | |
| | | | | | | | |
|
International Stocks 7.7% |
|
Schwab Fundamental International Large Company Index Fund | | | | | | | | |
Schwab International Core Equity Fund | | | | | | | | |
Schwab International Opportunities Fund | | | | | | | | |
| | | | | | | | |
|
|
|
Schwab Global Real Estate Fund | | | | | | | | |
|
|
Inflation-Protected Bond 6.7% |
Schwab Treasury Inflation Protected Securities Index Fund | | | | | | | | |
Intermediate-Term Bond 25.9% |
Schwab U.S. Aggregate Bond Index Fund | | | | | | | | |
|
Schwab Short-Term Bond Index Fund | | | | | | | | |
| | | | | | | | |
|
|
Schwab Variable Share Price Money Fund, Ultra | | | | | | | | |
Total Affiliated Underlying Funds
(Cost $31,067,085) | | | | | | | | |
|
46
Schwab Target Funds | Annual Report
Portfolio Holdings as of October 31, 2023 (continued)
| | | | | NET CHANGE IN UNREALIZED APPRECIATION (DEPRECIATION) | | BALANCE OF SHARES HELD AT 10/31/23 | |
UNAFFILIATED UNDERLYING FUNDS 23.7% OF NET ASSETS |
|
|
|
ClearBridge Large Cap Growth Fund, Class IS * | | | | | | | | |
Dodge & Cox Stock Fund, Class I | | | | | | | | |
| | | | | | | | |
|
ClearBridge Small Cap Growth Fund, Class IS * | | | | | | | | |
| | | | | | | | |
|
|
Intermediate-Term Bond 16.2% |
Baird Aggregate Bond Fund, Institutional Class | | | | | | | | |
Loomis Sayles Investment Grade Bond Fund, Class Y | | | | | | | | |
Western Asset Core Plus Bond Fund, Class I | | | | | | | | |
| | | | | | | | |
|
PIMCO International Bond Fund (U.S. Dollar- Hedged), Institutional Class | | | | | | | | |
| | | | | | | | |
Total Unaffiliated Underlying Funds
(Cost $11,098,346) | | | | | | | | |
Total Investments in Securities
(Cost $42,165,431) | | | | | | | | |
| Non-income producing security. |
| Distributions received include distributions from net investment income and capital gains, if any, from the underlying funds. Amounts shown are only presented for affiliated underlying funds, which are presented in the corresponding line-item in the Statement of Operations, if applicable (see financial note 2(d) for additional information). |
| The rate shown is the annualized 7-day yield. |
At October 31, 2023, all of the fund’s investment securities were classified as Level 1 (see financial note 2(a) for additional
information).
Schwab Target Funds | Annual Report47
Statement of Assets and Liabilities
As of October 31, 2023
|
Investments in securities, at value - affiliated (cost $31,067,085) | | |
Investments in securities, at value - unaffiliated (cost $11,098,346) | | |
| | |
| | |
| | |
Due from investment adviser | | |
| | |
| | |
| | |
|
|
| | |
| | |
| | |
| | |
| | |
| | |
|
|
Capital received from investors | | |
Total distributable earnings | | |
| | |
48
Schwab Target Funds | Annual Report
Statement of Operations
For the period November 1, 2022 through October 31, 2023 |
|
Dividends received from securities - affiliated | | |
Dividends received from securities - unaffiliated | | |
Interest received from securities - unaffiliated | | |
| | |
|
|
| | |
| | |
Portfolio accounting fees | | |
Independent trustees’ fees | | |
| | |
| | |
| | |
| | |
| | |
| | |
| | |
| | |
|
REALIZED AND UNREALIZED GAINS (LOSSES) |
Realized capital gain distributions received from underlying funds - affiliated | | |
Realized capital gain distributions received from underlying funds - unaffiliated | | |
Net realized losses on sales of securities - affiliated | | |
Net realized losses on sales of securities - unaffiliated | | |
| | |
Net change in unrealized appreciation (depreciation) on securities - affiliated | | |
Net change in unrealized appreciation (depreciation) on securities - unaffiliated | | |
Net change in unrealized appreciation (depreciation) | | |
Net realized and unrealized gains | | |
Increase in net assets resulting from operations | | |
Schwab Target Funds | Annual Report49
Statement of Changes in Net Assets
For the current and prior report periods
|
| | |
| | | |
| | | |
Net change in unrealized appreciation (depreciation) | | | |
Increase (decrease) in net assets resulting from operations | | | |
|
DISTRIBUTIONS TO SHAREHOLDERS |
| | | |
TRANSACTIONS IN FUND SHARES |
| | |
| | | | | |
| | | | | |
| | | | | |
| | | | | |
Net transactions in fund shares | | | | | |
|
SHARES OUTSTANDING AND NET ASSETS |
| | |
| | | | | |
| | | | | |
| | | | | |
| | | | | |
50
Schwab Target Funds | Annual Report
Financial Statements
| | | | | | |
|
Net asset value at beginning of period | | | | | | |
Income (loss) from investment operations: | | | | | | |
Net investment income (loss)1 | | | | | | |
Net realized and unrealized gains (losses) | | | | | | |
Total from investment operations | | | | | | |
| | | | | | |
Distributions from net investment income | | | | | | |
Distributions from net realized gains | | | | | | |
| | | | | | |
Net asset value at end of period | | | | | | |
| | | | | | |
|
Ratios to average net assets: | | | | | | |
| | | | | | |
Gross operating expenses2 | | | | | | |
Net investment income (loss) | | | | | | |
| | | | | | |
Net assets, end of period (x 1,000) | | | | | | |
| Calculated based on the average shares outstanding during the period. |
| Ratio excludes acquired fund fees and expenses, which are indirect expenses incurred by the fund through its investments in underlying funds. |
| Ratio includes less than 0.005% of non-routine proxy expenses. |
Schwab Target Funds | Annual Report51
Portfolio Holdings as of October 31, 2023
This section shows all the securities in the fund’s portfolio and their values as of the report date, including a summary of the fund’s transactions with its affiliated underlying funds during the period.
The fund files its complete schedule of portfolio holdings with the U.S. Securities and Exchange Commission (SEC) for the first and third quarters of each fiscal year on Form N-PORT Part F. The fund’s Form N-PORT Part F is available on the SEC’s website at www.sec.gov. You can also obtain this information at no cost on the fund’s website at www.schwabassetmanagement.com/schwabfunds_prospectus, by calling 1-866-414-6349, or by sending an email request to orders@mysummaryprospectus.com. The fund also makes available its complete schedule of portfolio holdings 15 to 20 days after the end of the month on the fund’s website.
| | | | | NET CHANGE IN UNREALIZED APPRECIATION (DEPRECIATION) | | BALANCE OF SHARES HELD AT 10/31/23 | |
AFFILIATED UNDERLYING FUNDS 75.9% OF NET ASSETS |
|
|
|
| | | | | | | | |
Schwab Fundamental US Large Company Index Fund | | | | | | | | |
Schwab S&P 500 Index Fund | | | | | | | | |
Schwab Select Large Cap Growth Fund * | | | | | | | | |
| | | | | | | | |
|
Schwab U.S. Mid-Cap Index Fund * | | | | | | | | |
|
Schwab Small-Cap Equity Fund | | | | | | | | |
| | | | | | | | |
|
International Stocks 8.7% |
|
Schwab Fundamental International Large Company Index Fund | | | | | | | | |
Schwab International Core Equity Fund | | | | | | | | |
Schwab International Opportunities Fund | | | | | | | | |
| | | | | | | | |
|
|
|
Schwab Global Real Estate Fund | | | | | | | | |
|
|
Inflation-Protected Bond 6.3% |
Schwab Treasury Inflation Protected Securities Index Fund | | | | | | | | |
Intermediate-Term Bond 24.1% |
Schwab U.S. Aggregate Bond Index Fund | | | | | | | | |
|
Schwab Short-Term Bond Index Fund | | | | | | | | |
| | | | | | | | |
|
|
Schwab Variable Share Price Money Fund, | | | | | | | | |
Total Affiliated Underlying Funds
(Cost $34,657,999) | | | | | | | | |
|
52
Schwab Target Funds | Annual Report
Portfolio Holdings as of October 31, 2023 (continued)
| | | | | NET CHANGE IN UNREALIZED APPRECIATION (DEPRECIATION) | | BALANCE OF SHARES HELD AT 10/31/23 | |
UNAFFILIATED UNDERLYING FUNDS 24.0% OF NET ASSETS |
|
|
|
ClearBridge Large Cap Growth Fund, Class IS * | | | | | | | | |
Dodge & Cox Stock Fund, Class I | | | | | | | | |
| | | | | | | | |
|
ClearBridge Small Cap Growth Fund, Class IS * | | | | | | | | |
| | | | | | | | |
|
|
Intermediate-Term Bond 15.7% |
Baird Aggregate Bond Fund, Institutional Class | | | | | | | | |
Loomis Sayles Investment Grade Bond Fund, Class Y | | | | | | | | |
Western Asset Core Plus Bond Fund, Class I | | | | | | | | |
| | | | | | | | |
|
PIMCO International Bond Fund (U.S. Dollar-Hedged), Institutional Class | | | | | | | | |
| | | | | | | | |
Total Unaffiliated Underlying Funds
(Cost $12,812,984) | | | | | | | | |
Total Investments in Securities
(Cost $47,470,983) | | | | | | | | |
| Non-income producing security. |
| Distributions received include distributions from net investment income and capital gains, if any, from the underlying funds. Amounts shown are only presented for affiliated underlying funds, which are presented in the corresponding line-item in the Statement of Operations, if applicable (see financial note 2(d) for additional information). |
| The rate shown is the annualized 7-day yield. |
At October 31, 2023, all of the fund’s investment securities were classified as Level 1 (see financial note 2(a) for additional
information).
Schwab Target Funds | Annual Report53
Statement of Assets and Liabilities
As of October 31, 2023
|
Investments in securities, at value - affiliated (cost $34,657,999) | | |
Investments in securities, at value - unaffiliated (cost $12,812,984) | | |
| | |
| | |
| | |
Due from investment adviser | | |
| | |
| | |
| | |
|
|
| | |
| | |
| | |
| | |
| | |
| | |
| | |
|
|
Capital received from investors | | |
Total distributable earnings | | |
| | |
54
Schwab Target Funds | Annual Report
Statement of Operations
For the period November 1, 2022 through October 31, 2023 |
|
Dividends received from securities - affiliated | | |
Dividends received from securities - unaffiliated | | |
Interest received from securities - unaffiliated | | |
| | |
|
|
| | |
| | |
Portfolio accounting fees | | |
Independent trustees’ fees | | |
| | |
| | |
| | |
| | |
| | |
| | |
| | |
| | |
|
REALIZED AND UNREALIZED GAINS (LOSSES) |
Realized capital gain distributions received from underlying funds - affiliated | | |
Realized capital gain distributions received from underlying funds - unaffiliated | | |
Net realized gains on sales of securities - affiliated | | |
Net realized losses on sales of securities - unaffiliated | | |
| | |
Net change in unrealized appreciation (depreciation) on securities - affiliated | | |
Net change in unrealized appreciation (depreciation) on securities - unaffiliated | | |
Net change in unrealized appreciation (depreciation) | | |
Net realized and unrealized gains | | |
Increase in net assets resulting from operations | | |
Schwab Target Funds | Annual Report55
Statement of Changes in Net Assets
For the current and prior report periods
|
| | |
| | | |
| | | |
Net change in unrealized appreciation (depreciation) | | | |
Increase (decrease) in net assets resulting from operations | | | |
|
DISTRIBUTIONS TO SHAREHOLDERS |
| | | |
TRANSACTIONS IN FUND SHARES |
| | |
| | | | | |
| | | | | |
| | | | | |
| | | | | |
Net transactions in fund shares | | | | | |
|
SHARES OUTSTANDING AND NET ASSETS |
| | |
| | | | | |
| | | | | |
| | | | | |
| | | | | |
56
Schwab Target Funds | Annual Report
Financial Statements
| | | | | | |
|
Net asset value at beginning of period | | | | | | |
Income (loss) from investment operations: | | | | | | |
Net investment income (loss)1 | | | | | | |
Net realized and unrealized gains (losses) | | | | | | |
Total from investment operations | | | | | | |
| | | | | | |
Distributions from net investment income | | | | | | |
Distributions from net realized gains | | | | | | |
| | | | | | |
Net asset value at end of period | | | | | | |
| | | | | | |
|
Ratios to average net assets: | | | | | | |
| | | | | | |
Gross operating expenses2 | | | | | | |
Net investment income (loss) | | | | | | |
| | | | | | |
Net assets, end of period (x 1,000) | | | | | | |
| Calculated based on the average shares outstanding during the period. |
| Ratio excludes acquired fund fees and expenses, which are indirect expenses incurred by the fund through its investments in underlying funds. |
| Ratio includes less than 0.005% of non-routine proxy expenses. |
Schwab Target Funds | Annual Report57
Portfolio Holdings as of October 31, 2023
This section shows all the securities in the fund’s portfolio and their values as of the report date, including a summary of the fund’s transactions with its affiliated underlying funds during the period.
The fund files its complete schedule of portfolio holdings with the U.S. Securities and Exchange Commission (SEC) for the first and third quarters of each fiscal year on Form N-PORT Part F. The fund’s Form N-PORT Part F is available on the SEC’s website at www.sec.gov. You can also obtain this information at no cost on the fund’s website at www.schwabassetmanagement.com/schwabfunds_prospectus, by calling 1-866-414-6349, or by sending an email request to orders@mysummaryprospectus.com. The fund also makes available its complete schedule of portfolio holdings 15 to 20 days after the end of the month on the fund’s website.
| | | | | NET CHANGE IN UNREALIZED APPRECIATION (DEPRECIATION) | | BALANCE OF SHARES HELD AT 10/31/23 | |
AFFILIATED UNDERLYING FUNDS 75.9% OF NET ASSETS |
|
|
|
| | | | | | | | |
Schwab Fundamental US Large Company Index Fund | | | | | | | | |
Schwab S&P 500 Index Fund | | | | | | | | |
Schwab Select Large Cap Growth Fund * | | | | | | | | |
| | | | | | | | |
|
Schwab U.S. Mid-Cap Index Fund * | | | | | | | | |
|
Schwab Small-Cap Equity Fund | | | | | | | | |
| | | | | | | | |
|
International Stocks 9.6% |
|
Schwab Fundamental International Large Company Index Fund | | | | | | | | |
Schwab International Core Equity Fund | | | | | | | | |
Schwab International Opportunities Fund | | | | | | | | |
| | | | | | | | |
|
|
|
Schwab Global Real Estate Fund | | | | | | | | |
|
|
Inflation-Protected Bond 6.1% |
Schwab Treasury Inflation Protected Securities Index Fund | | | | | | | | |
Intermediate-Term Bond 22.9% |
Schwab U.S. Aggregate Bond Index Fund | | | | | | | | |
|
Schwab Short-Term Bond Index Fund | | | | | | | | |
| | | | | | | | |
|
|
Schwab Variable Share Price Money Fund, | | | | | | | | |
Total Affiliated Underlying Funds
(Cost $222,108,782) | | | | | | | | |
|
58
Schwab Target Funds | Annual Report
Portfolio Holdings as of October 31, 2023 (continued)
| | | | | NET CHANGE IN UNREALIZED APPRECIATION (DEPRECIATION) | | BALANCE OF SHARES HELD AT 10/31/23 | |
UNAFFILIATED UNDERLYING FUNDS 24.0% OF NET ASSETS |
|
|
|
ClearBridge Large Cap Growth Fund, Class IS * | | | | | | | | |
Dodge & Cox Stock Fund, Class I | | | | | | | | |
| | | | | | | | |
|
ClearBridge Small Cap Growth Fund, Class IS * | | | | | | | | |
| | | | | | | | |
|
|
Intermediate-Term Bond 15.2% |
Baird Aggregate Bond Fund, Institutional Class | | | | | | | | |
Loomis Sayles Investment Grade Bond Fund, Class Y | | | | | | | | |
Western Asset Core Plus Bond Fund, Class I | | | | | | | | |
| | | | | | | | |
|
PIMCO International Bond Fund (U.S. Dollar-Hedged), Institutional Class | | | | | | | | |
| | | | | | | | |
Total Unaffiliated Underlying Funds
(Cost $83,888,420) | | | | | | | | |
Total Investments in Securities
(Cost $305,997,202) | | | | | | | | |
| Non-income producing security. |
| Distributions received include distributions from net investment income and capital gains, if any, from the underlying funds. Amounts shown are only presented for affiliated underlying funds, which are presented in the corresponding line-item in the Statement of Operations, if applicable (see financial note 2(d) for additional information). |
| The rate shown is the annualized 7-day yield. |
At October 31, 2023, all of the fund’s investment securities were classified as Level 1 (see financial note 2(a) for additional
information).
Schwab Target Funds | Annual Report59
Statement of Assets and Liabilities
As of October 31, 2023
|
Investments in securities, at value - affiliated (cost $222,108,782) | | |
Investments in securities, at value - unaffiliated (cost $83,888,420) | | |
| | |
| | |
| | |
| | |
Due from investment adviser | | |
| | |
| | |
| | |
|
|
| | |
| | |
| | |
| | |
| | |
| | |
|
|
Capital received from investors | | |
Total distributable earnings | | |
| | |
60
Schwab Target Funds | Annual Report
Statement of Operations
For the period November 1, 2022 through October 31, 2023 |
|
Dividends received from securities - affiliated | | |
Dividends received from securities - unaffiliated | | |
Interest received from securities - unaffiliated | | |
| | |
|
|
| | |
| | |
Portfolio accounting fees | | |
| | |
Independent trustees’ fees | | |
| | |
| | |
| | |
| | |
| | |
| | |
| | |
|
REALIZED AND UNREALIZED GAINS (LOSSES) |
Realized capital gain distributions received from underlying funds - affiliated | | |
Realized capital gain distributions received from underlying funds - unaffiliated | | |
Net realized gains on sales of securities - affiliated | | |
Net realized losses on sales of securities - unaffiliated | | |
| | |
Net change in unrealized appreciation (depreciation) on securities - affiliated | | |
Net change in unrealized appreciation (depreciation) on securities - unaffiliated | | |
Net change in unrealized appreciation (depreciation) | | |
Net realized and unrealized gains | | |
Increase in net assets resulting from operations | | |
Schwab Target Funds | Annual Report61
Statement of Changes in Net Assets
For the current and prior report periods
|
| | |
| | | |
| | | |
Net change in unrealized appreciation (depreciation) | | | |
Increase (decrease) in net assets resulting from operations | | | |
|
DISTRIBUTIONS TO SHAREHOLDERS |
| | | |
TRANSACTIONS IN FUND SHARES |
| | |
| | | | | |
| | | | | |
| | | | | |
| | | | | |
Net transactions in fund shares | | | | | |
|
SHARES OUTSTANDING AND NET ASSETS |
| | |
| | | | | |
| | | | | |
| | | | | |
| | | | | |
62
Schwab Target Funds | Annual Report
Financial Statements
| | | | | | |
|
Net asset value at beginning of period | | | | | | |
Income (loss) from investment operations: | | | | | | |
Net investment income (loss)1 | | | | | | |
Net realized and unrealized gains (losses) | | | | | | |
Total from investment operations | | | | | | |
| | | | | | |
Distributions from net investment income | | | | | | |
Distributions from net realized gains | | | | | | |
| | | | | | |
Net asset value at end of period | | | | | | |
| | | | | | |
|
Ratios to average net assets: | | | | | | |
| | | | | | |
Gross operating expenses2 | | | | | | |
Net investment income (loss) | | | | | | |
| | | | | | |
Net assets, end of period (x 1,000) | | | | | | |
| Calculated based on the average shares outstanding during the period. |
| Ratio excludes acquired fund fees and expenses, which are indirect expenses incurred by the fund through its investments in underlying funds. |
| Ratio includes less than 0.005% of non-routine proxy expenses. |
Schwab Target Funds | Annual Report63
Portfolio Holdings as of October 31, 2023
This section shows all the securities in the fund’s portfolio and their values as of the report date, including a summary of the fund’s transactions with its affiliated underlying funds during the period.
The fund files its complete schedule of portfolio holdings with the U.S. Securities and Exchange Commission (SEC) for the first and third quarters of each fiscal year on Form N-PORT Part F. The fund’s Form N-PORT Part F is available on the SEC’s website at www.sec.gov. You can also obtain this information at no cost on the fund’s website at www.schwabassetmanagement.com/schwabfunds_prospectus, by calling 1-866-414-6349, or by sending an email request to orders@mysummaryprospectus.com. The fund also makes available its complete schedule of portfolio holdings 15 to 20 days after the end of the month on the fund’s website.
| | | | | NET CHANGE IN UNREALIZED APPRECIATION (DEPRECIATION) | | BALANCE OF SHARES HELD AT 10/31/23 | |
AFFILIATED UNDERLYING FUNDS 74.4% OF NET ASSETS |
|
|
|
| | | | | | | | |
Schwab Fundamental US Large Company Index Fund | | | | | | | | |
Schwab S&P 500 Index Fund | | | | | | | | |
Schwab Select Large Cap Growth Fund * | | | | | | | | |
| | | | | | | | |
|
Schwab U.S. Mid-Cap Index Fund * | | | | | | | | |
|
Schwab Small-Cap Equity Fund | | | | | | | | |
| | | | | | | | |
|
International Stocks 12.4% |
|
Schwab Fundamental International Large Company Index Fund | | | | | | | | |
Schwab International Core Equity Fund | | | | | | | | |
Schwab International Opportunities Fund | | | | | | | | |
| | | | | | | | |
|
|
|
Schwab Global Real Estate Fund | | | | | | | | |
|
|
Inflation-Protected Bond 4.2% |
Schwab Treasury Inflation Protected Securities Index Fund | | | | | | | | |
Intermediate-Term Bond 19.1% |
Schwab U.S. Aggregate Bond Index Fund | | | | | | | | |
|
Schwab Short-Term Bond Index Fund | | | | | | | | |
| | | | | | | | |
|
|
Schwab Variable Share Price Money Fund, | | | | | | | | |
Total Affiliated Underlying Funds
(Cost $302,980,488) | | | | | | | | |
|
64
Schwab Target Funds | Annual Report
Portfolio Holdings as of October 31, 2023 (continued)
| | | | | NET CHANGE IN UNREALIZED APPRECIATION (DEPRECIATION) | | BALANCE OF SHARES HELD AT 10/31/23 | |
UNAFFILIATED UNDERLYING FUNDS 25.3% OF NET ASSETS |
|
|
|
ClearBridge Large Cap Growth Fund, Class IS * | | | | | | | | |
Dodge & Cox Stock Fund, Class I | | | | | | | | |
| | | | | | | | |
|
ClearBridge Small Cap Growth Fund, Class IS * | | | | | | | | |
| | | | | | | | |
|
International Stocks 0.3% |
|
Goldman Sachs Emerging Markets Equity Insights Fund, Institutional Class | | | | | | | | |
|
|
Intermediate-Term Bond 14.0% |
Baird Aggregate Bond Fund, Institutional Class | | | | | | | | |
Loomis Sayles Investment Grade Bond Fund, Class Y | | | | | | | | |
Western Asset Core Plus Bond Fund, Class I | | | | | | | | |
| | | | | | | | |
|
PIMCO International Bond Fund (U.S. Dollar-Hedged), Institutional Class | | | | | | | | |
| | | | | | | | |
Total Unaffiliated Underlying Funds
(Cost $121,093,093) | | | | | | | | |
Total Investments in Securities
(Cost $424,073,581) | | | | | | | | |
| Non-income producing security. |
| Distributions received include distributions from net investment income and capital gains, if any, from the underlying funds. Amounts shown are only presented for affiliated underlying funds, which are presented in the corresponding line-item in the Statement of Operations, if applicable (see financial note 2(d) for additional information). |
| The rate shown is the annualized 7-day yield. |
At October 31, 2023, all of the fund’s investment securities were classified as Level 1 (see financial note 2(a) for additional
information).
Schwab Target Funds | Annual Report65
Statement of Assets and Liabilities
As of October 31, 2023
|
Investments in securities, at value - affiliated (cost $302,980,488) | | |
Investments in securities, at value - unaffiliated (cost $121,093,093) | | |
| | |
| | |
| | |
| | |
| | |
Due from investment adviser | | |
| | |
| | |
|
|
| | |
| | |
| | |
| | |
| | |
| | |
|
|
Capital received from investors | | |
Total distributable earnings | | |
| | |
66
Schwab Target Funds | Annual Report
Statement of Operations
For the period November 1, 2022 through October 31, 2023 |
|
Dividends received from securities - affiliated | | |
Dividends received from securities - unaffiliated | | |
Interest received from securities - unaffiliated | | |
| | |
|
|
| | |
| | |
Portfolio accounting fees | | |
| | |
Independent trustees’ fees | | |
| | |
| | |
| | |
| | |
| | |
| | |
| | |
|
REALIZED AND UNREALIZED GAINS (LOSSES) |
Realized capital gain distributions received from underlying funds - affiliated | | |
Realized capital gain distributions received from underlying funds - unaffiliated | | |
Net realized gains on sales of securities - affiliated | | |
Net realized losses on sales of securities - unaffiliated | | |
| | |
Net change in unrealized appreciation (depreciation) on securities - affiliated | | |
Net change in unrealized appreciation (depreciation) on securities - unaffiliated | | |
Net change in unrealized appreciation (depreciation) | | |
Net realized and unrealized gains | | |
Increase in net assets resulting from operations | | |
Schwab Target Funds | Annual Report67
Statement of Changes in Net Assets
For the current and prior report periods
|
| | |
| | | |
| | | |
Net change in unrealized appreciation (depreciation) | | | |
Increase (decrease) in net assets resulting from operations | | | |
|
DISTRIBUTIONS TO SHAREHOLDERS |
| | | |
TRANSACTIONS IN FUND SHARES |
| | |
| | | | | |
| | | | | |
| | | | | |
| | | | | |
Net transactions in fund shares | | | | | |
|
SHARES OUTSTANDING AND NET ASSETS |
| | |
| | | | | |
| | | | | |
| | | | | |
| | | | | |
68
Schwab Target Funds | Annual Report
Financial Statements
| | | | | | |
|
Net asset value at beginning of period | | | | | | |
Income (loss) from investment operations: | | | | | | |
Net investment income (loss)1 | | | | | | |
Net realized and unrealized gains (losses) | | | | | | |
Total from investment operations | | | | | | |
| | | | | | |
Distributions from net investment income | | | | | | |
Distributions from net realized gains | | | | | | |
| | | | | | |
Net asset value at end of period | | | | | | |
| | | | | | |
|
Ratios to average net assets: | | | | | | |
| | | | | | |
Gross operating expenses2 | | | | | | |
Net investment income (loss) | | | | | | |
| | | | | | |
Net assets, end of period (x 1,000) | | | | | | |
| Calculated based on the average shares outstanding during the period. |
| Ratio excludes acquired fund fees and expenses, which are indirect expenses incurred by the fund through its investments in underlying funds. |
| Ratio includes less than 0.005% of non-routine proxy expenses. |
Schwab Target Funds | Annual Report69
Portfolio Holdings as of October 31, 2023
This section shows all the securities in the fund’s portfolio and their values as of the report date, including a summary of the fund’s transactions with its affiliated underlying funds during the period.
The fund files its complete schedule of portfolio holdings with the U.S. Securities and Exchange Commission (SEC) for the first and third quarters of each fiscal year on Form N-PORT Part F. The fund’s Form N-PORT Part F is available on the SEC’s website at www.sec.gov. You can also obtain this information at no cost on the fund’s website at www.schwabassetmanagement.com/schwabfunds_prospectus, by calling 1-866-414-6349, or by sending an email request to orders@mysummaryprospectus.com. The fund also makes available its complete schedule of portfolio holdings 15 to 20 days after the end of the month on the fund’s website.
| | | | | NET CHANGE IN UNREALIZED APPRECIATION (DEPRECIATION) | | BALANCE OF SHARES HELD AT 10/31/23 | |
AFFILIATED UNDERLYING FUNDS 73.1% OF NET ASSETS |
|
|
|
| | | | | | | | |
Schwab Fundamental US Large Company Index Fund | | | | | | | | |
Schwab S&P 500 Index Fund | | | | | | | | |
Schwab Select Large Cap Growth Fund * | | | | | | | | |
| | | | | | | | |
|
Schwab U.S. Mid-Cap Index Fund * | | | | | | | | |
|
Schwab Small-Cap Equity Fund | | | | | | | | |
| | | | | | | | |
|
International Stocks 15.9% |
|
Schwab Fundamental International Large Company Index Fund | | | | | | | | |
Schwab International Core Equity Fund | | | | | | | | |
Schwab International Opportunities Fund | | | | | | | | |
| | | | | | | | |
|
|
|
Schwab Global Real Estate Fund | | | | | | | | |
|
|
Inflation-Protected Bond 1.4% |
Schwab Treasury Inflation Protected Securities Index Fund | | | | | | | | |
Intermediate-Term Bond 13.0% |
Schwab U.S. Aggregate Bond Index Fund | | | | | | | | |
|
Schwab Short-Term Bond Index Fund | | | | | | | | |
| | | | | | | | |
|
|
Schwab Variable Share Price Money Fund, | | | | | | | | |
Total Affiliated Underlying Funds
(Cost $544,140,130) | | | | | | | | |
|
70
Schwab Target Funds | Annual Report
Portfolio Holdings as of October 31, 2023 (continued)
| | | | | NET CHANGE IN UNREALIZED APPRECIATION (DEPRECIATION) | | BALANCE OF SHARES HELD AT 10/31/23 | |
UNAFFILIATED UNDERLYING FUNDS 26.4% OF NET ASSETS |
|
|
|
ClearBridge Large Cap Growth Fund, Class IS * | | | | | | | | |
Dodge & Cox Stock Fund, Class I | | | | | | | | |
| | | | | | | | |
|
ClearBridge Small Cap Growth Fund, Class IS * | | | | | | | | |
| | | | | | | | |
|
International Stocks 1.1% |
|
Goldman Sachs Emerging Markets Equity Insights Fund, Institutional Class | | | | | | | | |
|
|
Intermediate-Term Bond 11.7% |
Baird Aggregate Bond Fund, Institutional Class | | | | | | | | |
Loomis Sayles Investment Grade Bond Fund, Class Y | | | | | | | | |
Western Asset Core Plus Bond Fund, Class I | | | | | | | | |
| | | | | | | | |
|
PIMCO International Bond Fund (U.S. Dollar-Hedged), Institutional Class | | | | | | | | |
| | | | | | | | |
Total Unaffiliated Underlying Funds
(Cost $247,911,629) | | | | | | | | |
Total Investments in Securities
(Cost $792,051,759) | | | | | | | | |
| Non-income producing security. |
| Distributions received include distributions from net investment income and capital gains, if any, from the underlying funds. Amounts shown are only presented for affiliated underlying funds, which are presented in the corresponding line-item in the Statement of Operations, if applicable (see financial note 2(d) for additional information). |
| The rate shown is the annualized 7-day yield. |
At October 31, 2023, all of the fund’s investment securities were classified as Level 1 (see financial note 2(a) for additional
information).
Schwab Target Funds | Annual Report71
Statement of Assets and Liabilities
As of October 31, 2023
|
Investments in securities, at value - affiliated (cost $544,140,130) | | |
Investments in securities, at value - unaffiliated (cost $247,911,629) | | |
| | |
| | |
| | |
| | |
| | |
Due from investment adviser | | |
| | |
| | |
|
|
| | |
| | |
| | |
| | |
| | |
| | |
|
|
Capital received from investors | | |
Total distributable earnings | | |
| | |
72
Schwab Target Funds | Annual Report
Statement of Operations
For the period November 1, 2022 through October 31, 2023 |
|
Dividends received from securities - affiliated | | |
Dividends received from securities - unaffiliated | | |
Interest received from securities - unaffiliated | | |
| | |
|
|
| | |
| | |
Portfolio accounting fees | | |
| | |
Independent trustees’ fees | | |
| | |
| | |
| | |
| | |
| | |
| | |
| | |
|
REALIZED AND UNREALIZED GAINS (LOSSES) |
Realized capital gain distributions received from underlying funds - affiliated | | |
Realized capital gain distributions received from underlying funds - unaffiliated | | |
Net realized losses on sales of securities - affiliated | | |
Net realized losses on sales of securities - unaffiliated | | |
| | |
Net change in unrealized appreciation (depreciation) on securities - affiliated | | |
Net change in unrealized appreciation (depreciation) on securities - unaffiliated | | |
Net change in unrealized appreciation (depreciation) | | |
Net realized and unrealized gains | | |
Increase in net assets resulting from operations | | |
Schwab Target Funds | Annual Report73
Statement of Changes in Net Assets
For the current and prior report periods
|
| | |
| | | |
| | | |
Net change in unrealized appreciation (depreciation) | | | |
Increase (decrease) in net assets resulting from operations | | | |
|
DISTRIBUTIONS TO SHAREHOLDERS |
| | | |
TRANSACTIONS IN FUND SHARES |
| | |
| | | | | |
| | | | | |
| | | | | |
| | | | | |
Net transactions in fund shares | | | | | |
|
SHARES OUTSTANDING AND NET ASSETS |
| | |
| | | | | |
| | | | | |
Total increase (decrease) | | | | | |
| | | | | |
74
Schwab Target Funds | Annual Report
Financial Statements
| | | | | | |
|
Net asset value at beginning of period | | | | | | |
Income (loss) from investment operations: | | | | | | |
Net investment income (loss)1 | | | | | | |
Net realized and unrealized gains (losses) | | | | | | |
Total from investment operations | | | | | | |
| | | | | | |
Distributions from net investment income | | | | | | |
Distributions from net realized gains | | | | | | |
| | | | | | |
Net asset value at end of period | | | | | | |
| | | | | | |
|
Ratios to average net assets: | | | | | | |
| | | | | | |
Gross operating expenses2 | | | | | | |
Net investment income (loss) | | | | | | |
| | | | | | |
Net assets, end of period (x 1,000) | | | | | | |
| Calculated based on the average shares outstanding during the period. |
| Ratio excludes acquired fund fees and expenses, which are indirect expenses incurred by the fund through its investments in underlying funds. |
| Ratio includes less than 0.005% of non-routine proxy expenses. |
Schwab Target Funds | Annual Report75
Portfolio Holdings as of October 31, 2023
This section shows all the securities in the fund’s portfolio and their values as of the report date, including a summary of the fund’s transactions with its affiliated underlying funds during the period.
The fund files its complete schedule of portfolio holdings with the U.S. Securities and Exchange Commission (SEC) for the first and third quarters of each fiscal year on Form N-PORT Part F. The fund’s Form N-PORT Part F is available on the SEC’s website at www.sec.gov. You can also obtain this information at no cost on the fund’s website at www.schwabassetmanagement.com/schwabfunds_prospectus, by calling 1-866-414-6349, or by sending an email request to orders@mysummaryprospectus.com. The fund also makes available its complete schedule of portfolio holdings 15 to 20 days after the end of the month on the fund’s website.
| | | | | NET CHANGE IN UNREALIZED APPRECIATION (DEPRECIATION) | | BALANCE OF SHARES HELD AT 10/31/23 | |
AFFILIATED UNDERLYING FUNDS 73.7% OF NET ASSETS |
|
|
|
| | | | | | | | |
Schwab Fundamental US Large Company Index Fund | | | | | | | | |
Schwab S&P 500 Index Fund | | | | | | | | |
Schwab Select Large Cap Growth Fund * | | | | | | | | |
| | | | | | | | |
|
Schwab U.S. Mid-Cap Index Fund * | | | | | | | | |
|
Schwab Small-Cap Equity Fund | | | | | | | | |
| | | | | | | | |
|
International Stocks 18.8% |
|
Schwab Fundamental International Large Company Index Fund | | | | | | | | |
Schwab International Core Equity Fund | | | | | | | | |
Schwab International Opportunities Fund | | | | | | | | |
| | | | | | | | |
|
|
|
Schwab Global Real Estate Fund | | | | | | | | |
|
|
Intermediate-Term Bond 9.1% |
Schwab U.S. Aggregate Bond Index Fund | | | | | | | | |
|
Schwab Short-Term Bond Index Fund | | | | | | | | |
| | | | | | | | |
|
|
Schwab Variable Share Price Money Fund, | | | | | | | | |
Total Affiliated Underlying Funds
(Cost $324,554,538) | | | | | | | | |
|
76
Schwab Target Funds | Annual Report
Portfolio Holdings as of October 31, 2023 (continued)
| | | | | NET CHANGE IN UNREALIZED APPRECIATION (DEPRECIATION) | | BALANCE OF SHARES HELD AT 10/31/23 | |
UNAFFILIATED UNDERLYING FUNDS 26.0% OF NET ASSETS |
|
|
|
ClearBridge Large Cap Growth Fund, Class IS * | | | | | | | | |
Dodge & Cox Stock Fund, Class I | | | | | | | | |
| | | | | | | | |
|
ClearBridge Small Cap Growth Fund, Class IS * | | | | | | | | |
| | | | | | | | |
|
International Stocks 2.0% |
|
Goldman Sachs Emerging Markets Equity Insights Fund, Institutional Class | | | | | | | | |
|
|
Intermediate-Term Bond 9.6% |
Baird Aggregate Bond Fund, Institutional Class | | | | | | | | |
Loomis Sayles Investment Grade Bond Fund, Class Y | | | | | | | | |
Western Asset Core Plus Bond Fund, Class I | | | | | | | | |
| | | | | | | | |
|
PIMCO International Bond Fund (U.S. Dollar-Hedged), Institutional Class | | | | | | | | |
| | | | | | | | |
Total Unaffiliated Underlying Funds
(Cost $137,669,286) | | | | | | | | |
Total Investments in Securities
(Cost $462,223,824) | | | | | | | | |
| Non-income producing security. |
| Distributions received include distributions from net investment income and capital gains, if any, from the underlying funds. Amounts shown are only presented for affiliated underlying funds, which are presented in the corresponding line-item in the Statement of Operations, if applicable (see financial note 2(d) for additional information). |
| The rate shown is the annualized 7-day yield. |
At October 31, 2023, all of the fund’s investment securities were classified as Level 1 (see financial note 2(a) for additional
information).
Schwab Target Funds | Annual Report77
Statement of Assets and Liabilities
As of October 31, 2023
|
Investments in securities, at value - affiliated (cost $324,554,538) | | |
Investments in securities, at value - unaffiliated (cost $137,669,286) | | |
| | |
| | |
| | |
| | |
| | |
Due from investment adviser | | |
| | |
| | |
|
|
| | |
| | |
| | |
| | |
| | |
| | |
|
|
Capital received from investors | | |
Total distributable earnings | | |
| | |
78
Schwab Target Funds | Annual Report
Statement of Operations
For the period November 1, 2022 through October 31, 2023 |
|
Dividends received from securities - affiliated | | |
Dividends received from securities - unaffiliated | | |
Interest received from securities - unaffiliated | | |
| | |
|
|
| | |
| | |
Portfolio accounting fees | | |
| | |
| | |
Independent trustees’ fees | | |
| | |
| | |
| | |
| | |
| | |
| | |
|
REALIZED AND UNREALIZED GAINS (LOSSES) |
Realized capital gain distributions received from underlying funds - affiliated | | |
Realized capital gain distributions received from underlying funds - unaffiliated | | |
Net realized losses on sales of securities - affiliated | | |
Net realized losses on sales of securities - unaffiliated | | |
| | |
Net change in unrealized appreciation (depreciation) on securities - affiliated | | |
Net change in unrealized appreciation (depreciation) on securities - unaffiliated | | |
Net change in unrealized appreciation (depreciation) | | |
Net realized and unrealized gains | | |
Increase in net assets resulting from operations | | |
Schwab Target Funds | Annual Report79
Statement of Changes in Net Assets
For the current and prior report periods
|
| | |
| | | |
| | | |
Net change in unrealized appreciation (depreciation) | | | |
Increase (decrease) in net assets resulting from operations | | | |
|
DISTRIBUTIONS TO SHAREHOLDERS |
| | | |
TRANSACTIONS IN FUND SHARES |
| | |
| | | | | |
| | | | | |
| | | | | |
| | | | | |
Net transactions in fund shares | | | | | |
|
SHARES OUTSTANDING AND NET ASSETS |
| | |
| | | | | |
| | | | | |
Total increase (decrease) | | | | | |
| | | | | |
80
Schwab Target Funds | Annual Report
Financial Statements
| | | | | | |
|
Net asset value at beginning of period | | | | | | |
Income (loss) from investment operations: | | | | | | |
Net investment income (loss)1 | | | | | | |
Net realized and unrealized gains (losses) | | | | | | |
Total from investment operations | | | | | | |
| | | | | | |
Distributions from net investment income | | | | | | |
Distributions from net realized gains | | | | | | |
| | | | | | |
Net asset value at end of period | | | | | | |
| | | | | | |
|
Ratios to average net assets: | | | | | | |
| | | | | | |
Gross operating expenses2 | | | | | | |
Net investment income (loss) | | | | | | |
| | | | | | |
Net assets, end of period (x 1,000) | | | | | | |
| Calculated based on the average shares outstanding during the period. |
| Ratio excludes acquired fund fees and expenses, which are indirect expenses incurred by the fund through its investments in underlying funds. |
| Ratio includes less than 0.005% of non-routine proxy expenses. |
Schwab Target Funds | Annual Report81
Portfolio Holdings as of October 31, 2023
This section shows all the securities in the fund’s portfolio and their values as of the report date, including a summary of the fund’s transactions with its affiliated underlying funds during the period.
The fund files its complete schedule of portfolio holdings with the U.S. Securities and Exchange Commission (SEC) for the first and third quarters of each fiscal year on Form N-PORT Part F. The fund’s Form N-PORT Part F is available on the SEC’s website at www.sec.gov. You can also obtain this information at no cost on the fund’s website at www.schwabassetmanagement.com/schwabfunds_prospectus, by calling 1-866-414-6349, or by sending an email request to orders@mysummaryprospectus.com. The fund also makes available its complete schedule of portfolio holdings 15 to 20 days after the end of the month on the fund’s website.
| | | | | NET CHANGE IN UNREALIZED APPRECIATION (DEPRECIATION) | | BALANCE OF SHARES HELD AT 10/31/23 | |
AFFILIATED UNDERLYING FUNDS 74.4% OF NET ASSETS |
|
|
|
| | | | | | | | |
Schwab Fundamental US Large Company Index Fund | | | | | | | | |
Schwab S&P 500 Index Fund | | | | | | | | |
Schwab Select Large Cap Growth Fund * | | | | | | | | |
| | | | | | | | |
|
Schwab U.S. Mid-Cap Index Fund * | | | | | | | | |
|
Schwab Small-Cap Equity Fund | | | | | | | | |
| | | | | | | | |
|
International Stocks 20.7% |
|
Schwab Fundamental International Large Company Index Fund | | | | | | | | |
Schwab International Core Equity Fund | | | | | | | | |
Schwab International Opportunities Fund | | | | | | | | |
| | | | | | | | |
|
|
|
Schwab Global Real Estate Fund | | | | | | | | |
|
|
Intermediate-Term Bond 6.0% |
Schwab U.S. Aggregate Bond Index Fund | | | | | | | | |
|
Schwab Short-Term Bond Index Fund | | | | | | | | |
| | | | | | | | |
|
|
Schwab Variable Share Price Money Fund, | | | | | | | | |
Total Affiliated Underlying Funds
(Cost $592,627,024) | | | | | | | | |
|
82
Schwab Target Funds | Annual Report
Portfolio Holdings as of October 31, 2023 (continued)
| | | | | NET CHANGE IN UNREALIZED APPRECIATION (DEPRECIATION) | | BALANCE OF SHARES HELD AT 10/31/23 | |
UNAFFILIATED UNDERLYING FUNDS 25.1% OF NET ASSETS |
|
|
|
ClearBridge Large Cap Growth Fund, Class IS * | | | | | | | | |
Dodge & Cox Stock Fund, Class I | | | | | | | | |
| | | | | | | | |
|
ClearBridge Small Cap Growth Fund, Class IS * | | | | | | | | |
| | | | | | | | |
|
International Stocks 2.8% |
|
Goldman Sachs Emerging Markets Equity Insights Fund, Institutional Class | | | | | | | | |
|
|
Intermediate-Term Bond 7.3% |
Baird Aggregate Bond Fund, Institutional Class | | | | | | | | |
Loomis Sayles Investment Grade Bond Fund, Class Y | | | | | | | | |
Western Asset Core Plus Bond Fund, Class I | | | | | | | | |
| | | | | | | | |
|
PIMCO International Bond Fund (U.S. Dollar-Hedged), Institutional Class | | | | | | | | |
| | | | | | | | |
Total Unaffiliated Underlying Funds
(Cost $257,945,754) | | | | | | | | |
Total Investments in Securities
(Cost $850,572,778) | | | | | | | | |
| Non-income producing security. |
| Distributions received include distributions from net investment income and capital gains, if any, from the underlying funds. Amounts shown are only presented for affiliated underlying funds, which are presented in the corresponding line-item in the Statement of Operations, if applicable (see financial note 2(d) for additional information). |
| The rate shown is the annualized 7-day yield. |
At October 31, 2023, all of the fund’s investment securities were classified as Level 1 (see financial note 2(a) for additional
information).
Schwab Target Funds | Annual Report83
Statement of Assets and Liabilities
As of October 31, 2023
|
Investments in securities, at value - affiliated (cost $592,627,024) | | |
Investments in securities, at value - unaffiliated (cost $257,945,754) | | |
| | |
| | |
| | |
| | |
| | |
Due from investment adviser | | |
| | |
| | |
|
|
| | |
| | |
| | |
| | |
| | |
| | |
|
|
Capital received from investors | | |
Total distributable earnings | | |
| | |
84
Schwab Target Funds | Annual Report
Statement of Operations
For the period November 1, 2022 through October 31, 2023 |
|
Dividends received from securities - affiliated | | |
Dividends received from securities - unaffiliated | | |
Interest received from securities - unaffiliated | | |
| | |
|
|
| | |
| | |
Portfolio accounting fees | | |
| | |
Independent trustees’ fees | | |
| | |
| | |
| | |
| | |
| | |
| | |
| | |
|
REALIZED AND UNREALIZED GAINS (LOSSES) |
Realized capital gain distributions received from underlying funds - affiliated | | |
Realized capital gain distributions received from underlying funds - unaffiliated | | |
Net realized losses on sales of securities - affiliated | | |
Net realized losses on sales of securities - unaffiliated | | |
| | |
Net change in unrealized appreciation (depreciation) on securities - affiliated | | |
Net change in unrealized appreciation (depreciation) on securities - unaffiliated | | |
Net change in unrealized appreciation (depreciation) | | |
Net realized and unrealized gains | | |
Increase in net assets resulting from operations | | |
Schwab Target Funds | Annual Report85
Statement of Changes in Net Assets
For the current and prior report periods
|
| | |
| | | |
| | | |
Net change in unrealized appreciation (depreciation) | | | |
Increase (decrease) in net assets resulting from operations | | | |
|
DISTRIBUTIONS TO SHAREHOLDERS |
| | | |
TRANSACTIONS IN FUND SHARES |
| | |
| | | | | |
| | | | | |
| | | | | |
| | | | | |
Net transactions in fund shares | | | | | |
|
SHARES OUTSTANDING AND NET ASSETS |
| | |
| | | | | |
| | | | | |
Total increase (decrease) | | | | | |
| | | | | |
86
Schwab Target Funds | Annual Report
Financial Statements
| | | | | | |
|
Net asset value at beginning of period | | | | | | |
Income (loss) from investment operations: | | | | | | |
Net investment income (loss)1 | | | | | | |
Net realized and unrealized gains (losses) | | | | | | |
Total from investment operations | | | | | | |
| | | | | | |
Distributions from net investment income | | | | | | |
Distributions from net realized gains | | | | | | |
| | | | | | |
Net asset value at end of period | | | | | | |
| | | | | | |
|
Ratios to average net assets: | | | | | | |
| | | | | | |
Gross operating expenses2 | | | | | | |
Net investment income (loss) | | | | | | |
| | | | | | |
Net assets, end of period (x 1,000) | | | | | | |
| Calculated based on the average shares outstanding during the period. |
| Ratio excludes acquired fund fees and expenses, which are indirect expenses incurred by the fund through its investments in underlying funds. |
| Ratio includes less than 0.005% of non-routine proxy expenses. |
Schwab Target Funds | Annual Report87
Portfolio Holdings as of October 31, 2023
This section shows all the securities in the fund’s portfolio and their values as of the report date, including a summary of the fund’s transactions with its affiliated underlying funds during the period.
The fund files its complete schedule of portfolio holdings with the U.S. Securities and Exchange Commission (SEC) for the first and third quarters of each fiscal year on Form N-PORT Part F. The fund’s Form N-PORT Part F is available on the SEC’s website at www.sec.gov. You can also obtain this information at no cost on the fund’s website at www.schwabassetmanagement.com/schwabfunds_prospectus, by calling 1-866-414-6349, or by sending an email request to orders@mysummaryprospectus.com. The fund also makes available its complete schedule of portfolio holdings 15 to 20 days after the end of the month on the fund’s website.
| | | | | NET CHANGE IN UNREALIZED APPRECIATION (DEPRECIATION) | | BALANCE OF SHARES HELD AT 10/31/23 | |
AFFILIATED UNDERLYING FUNDS 76.9% OF NET ASSETS |
|
|
|
| | | | | | | | |
Schwab Fundamental US Large Company Index Fund | | | | | | | | |
Schwab S&P 500 Index Fund | | | | | | | | |
Schwab Select Large Cap Growth Fund * | | | | | | | | |
| | | | | | | | |
|
Schwab U.S. Mid-Cap Index Fund * | | | | | | | | |
|
Schwab Small-Cap Equity Fund | | | | | | | | |
| | | | | | | | |
|
International Stocks 22.6% |
|
Schwab Fundamental International Large Company Index Fund | | | | | | | | |
Schwab International Core Equity Fund | | | | | | | | |
Schwab International Opportunities Fund | | | | | | | | |
| | | | | | | | |
|
|
|
Schwab Global Real Estate Fund | | | | | | | | |
|
|
Intermediate-Term Bond 3.7% |
Schwab U.S. Aggregate Bond Index Fund | | | | | | | | |
|
Schwab Short-Term Bond Index Fund | | | | | | | | |
| | | | | | | | |
|
|
Schwab Variable Share Price Money Fund, | | | | | | | | |
Total Affiliated Underlying Funds
(Cost $173,361,899) | | | | | | | | |
|
88
Schwab Target Funds | Annual Report
Portfolio Holdings as of October 31, 2023 (continued)
| | | | | NET CHANGE IN UNREALIZED APPRECIATION (DEPRECIATION) | | BALANCE OF SHARES HELD AT 10/31/23 | |
UNAFFILIATED UNDERLYING FUNDS 22.8% OF NET ASSETS |
|
|
|
ClearBridge Large Cap Growth Fund, Class IS * | | | | | | | | |
Dodge & Cox Stock Fund, Class I | | | | | | | | |
| | | | | | | | |
|
ClearBridge Small Cap Growth Fund, Class IS * | | | | | | | | |
| | | | | | | | |
|
International Stocks 3.8% |
|
Goldman Sachs Emerging Markets Equity Insights Fund, Institutional Class | | | | | | | | |
|
|
Intermediate-Term Bond 5.3% |
Baird Aggregate Bond Fund, Institutional Class | | | | | | | | |
Loomis Sayles Investment Grade Bond Fund, Class Y | | | | | | | | |
Western Asset Core Plus Bond Fund, Class I | | | | | | | | |
| | | | | | | | |
|
PIMCO International Bond Fund (U.S. Dollar-Hedged), Institutional Class | | | | | | | | |
| | | | | | | | |
Total Unaffiliated Underlying Funds
(Cost $56,029,462) | | | | | | | | |
Total Investments in Securities
(Cost $229,391,361) | | | | | | | | |
| Non-income producing security. |
| Distributions received include distributions from net investment income and capital gains, if any, from the underlying funds. Amounts shown are only presented for affiliated underlying funds, which are presented in the corresponding line-item in the Statement of Operations, if applicable (see financial note 2(d) for additional information). |
| The rate shown is the annualized 7-day yield. |
At October 31, 2023, all of the fund’s investment securities were classified as Level 1 (see financial note 2(a) for additional
information).
Schwab Target Funds | Annual Report89
Statement of Assets and Liabilities
As of October 31, 2023
|
Investments in securities, at value - affiliated (cost $173,361,899) | | |
Investments in securities, at value - unaffiliated (cost $56,029,462) | | |
| | |
| | |
| | |
| | |
| | |
Due from investment adviser | | |
| | |
| | |
|
|
| | |
| | |
| | |
| | |
| | |
| | |
|
|
Capital received from investors | | |
Total distributable earnings | | |
| | |
90
Schwab Target Funds | Annual Report
Statement of Operations
For the period November 1, 2022 through October 31, 2023 |
|
Dividends received from securities - affiliated | | |
Dividends received from securities - unaffiliated | | |
Interest received from securities - unaffiliated | | |
| | |
|
|
| | |
| | |
Portfolio accounting fees | | |
| | |
Independent trustees’ fees | | |
| | |
| | |
| | |
| | |
| | |
| | |
| | |
|
REALIZED AND UNREALIZED GAINS (LOSSES) |
Realized capital gain distributions received from underlying funds - affiliated | | |
Realized capital gain distributions received from underlying funds - unaffiliated | | |
Net realized losses on sales of securities - affiliated | | |
Net realized losses on sales of securities - unaffiliated | | |
| | |
Net change in unrealized appreciation (depreciation) on securities - affiliated | | |
Net change in unrealized appreciation (depreciation) on securities - unaffiliated | | |
Net change in unrealized appreciation (depreciation) | | |
Net realized and unrealized gains | | |
Increase in net assets resulting from operations | | |
Schwab Target Funds | Annual Report91
Statement of Changes in Net Assets
For the current and prior report periods
|
| | |
| | | |
| | | |
Net change in unrealized appreciation (depreciation) | | | |
Increase (decrease) in net assets resulting from operations | | | |
|
DISTRIBUTIONS TO SHAREHOLDERS |
| | | |
TRANSACTIONS IN FUND SHARES |
| | |
| | | | | |
| | | | | |
| | | | | |
| | | | | |
Net transactions in fund shares | | | | | |
|
SHARES OUTSTANDING AND NET ASSETS |
| | |
| | | | | |
| | | | | |
Total increase (decrease) | | | | | |
| | | | | |
92
Schwab Target Funds | Annual Report
Financial Statements
| | | | | | |
|
Net asset value at beginning of period | | | | | | |
Income (loss) from investment operations: | | | | | | |
Net investment income (loss)1 | | | | | | |
Net realized and unrealized gains (losses) | | | | | | |
Total from investment operations | | | | | | |
| | | | | | |
Distributions from net investment income | | | | | | |
Distributions from net realized gains | | | | | | |
| | | | | | |
Net asset value at end of period | | | | | | |
| | | | | | |
|
Ratios to average net assets: | | | | | | |
| | | | | | |
Gross operating expenses2 | | | | | | |
Net investment income (loss) | | | | | | |
| | | | | | |
Net assets, end of period (x 1,000) | | | | | | |
| Calculated based on the average shares outstanding during the period. |
| Ratio excludes acquired fund fees and expenses, which are indirect expenses incurred by the fund through its investments in underlying funds. |
| Ratio includes less than 0.005% of non-routine proxy expenses. |
Schwab Target Funds | Annual Report93
Portfolio Holdings as of October 31, 2023
This section shows all the securities in the fund’s portfolio and their values as of the report date, including a summary of the fund’s transactions with its affiliated underlying funds during the period.
The fund files its complete schedule of portfolio holdings with the U.S. Securities and Exchange Commission (SEC) for the first and third quarters of each fiscal year on Form N-PORT Part F. The fund’s Form N-PORT Part F is available on the SEC’s website at www.sec.gov. You can also obtain this information at no cost on the fund’s website at www.schwabassetmanagement.com/schwabfunds_prospectus, by calling 1-866-414-6349, or by sending an email request to orders@mysummaryprospectus.com. The fund also makes available its complete schedule of portfolio holdings 15 to 20 days after the end of the month on the fund’s website.
| | | | | NET CHANGE IN UNREALIZED APPRECIATION (DEPRECIATION) | | BALANCE OF SHARES HELD AT 10/31/23 | |
AFFILIATED UNDERLYING FUNDS 78.5% OF NET ASSETS |
|
|
|
| | | | | | | | |
Schwab Fundamental US Large Company Index Fund | | | | | | | | |
Schwab S&P 500 Index Fund | | | | | | | | |
Schwab Select Large Cap Growth Fund * | | | | | | | | |
| | | | | | | | |
|
Schwab U.S. Mid-Cap Index Fund * | | | | | | | | |
|
Schwab Small-Cap Equity Fund | | | | | | | | |
| | | | | | | | |
|
International Stocks 23.9% |
|
Schwab Fundamental International Large Company Index Fund | | | | | | | | |
Schwab International Core Equity Fund | | | | | | | | |
Schwab International Opportunities Fund | | | | | | | | |
| | | | | | | | |
|
|
|
Schwab Global Real Estate Fund | | | | | | | | |
|
|
Intermediate-Term Bond 2.3% |
Schwab U.S. Aggregate Bond Index Fund | | | | | | | | |
|
Schwab Short-Term Bond Index Fund | | | | | | | | |
| | | | | | | | |
|
|
Schwab Variable Share Price Money Fund, | | | | | | | | |
Total Affiliated Underlying Funds
(Cost $179,096,121) | | | | | | | | |
|
94
Schwab Target Funds | Annual Report
Portfolio Holdings as of October 31, 2023 (continued)
| | | | | NET CHANGE IN UNREALIZED APPRECIATION (DEPRECIATION) | | BALANCE OF SHARES HELD AT 10/31/23 | |
UNAFFILIATED UNDERLYING FUNDS 21.1% OF NET ASSETS |
|
|
|
ClearBridge Large Cap Growth Fund, Class IS * | | | | | | | | |
Dodge & Cox Stock Fund, Class I | | | | | | | | |
| | | | | | | | |
|
ClearBridge Small Cap Growth Fund, Class IS * | | | | | | | | |
| | | | | | | | |
|
International Stocks 4.5% |
|
Goldman Sachs Emerging Markets Equity Insights Fund, Institutional Class | | | | | | | | |
|
|
Intermediate-Term Bond 3.8% |
Baird Aggregate Bond Fund, Institutional Class | | | | | | | | |
Loomis Sayles Investment Grade Bond Fund, Class Y | | | | | | | | |
Western Asset Core Plus Bond Fund, Class I | | | | | | | | |
| | | | | | | | |
|
PIMCO International Bond Fund (U.S. Dollar-Hedged), Institutional Class | | | | | | | | |
| | | | | | | | |
Total Unaffiliated Underlying Funds
(Cost $51,559,191) | | | | | | | | |
Total Investments in Securities
(Cost $230,655,312) | | | | | | | | |
| Non-income producing security. |
| Distributions received include distributions from net investment income and capital gains, if any, from the underlying funds. Amounts shown are only presented for affiliated underlying funds, which are presented in the corresponding line-item in the Statement of Operations, if applicable (see financial note 2(d) for additional information). |
| The rate shown is the annualized 7-day yield. |
At October 31, 2023, all of the fund’s investment securities were classified as Level 1 (see financial note 2(a) for additional
information).
Schwab Target Funds | Annual Report95
Statement of Assets and Liabilities
As of October 31, 2023
|
Investments in securities, at value - affiliated (cost $179,096,121) | | |
Investments in securities, at value - unaffiliated (cost $51,559,191) | | |
| | |
| | |
| | |
| | |
Due from investment adviser | | |
| | |
| | |
|
|
| | |
| | |
| | |
| | |
| | |
| | |
|
|
Capital received from investors | | |
Total distributable earnings | | |
| | |
96
Schwab Target Funds | Annual Report
Statement of Operations
For the period November 1, 2022 through October 31, 2023 |
|
Dividends received from securities - affiliated | | |
Dividends received from securities - unaffiliated | | |
Interest received from securities - unaffiliated | | |
| | |
|
|
| | |
| | |
Portfolio accounting fees | | |
| | |
Independent trustees’ fees | | |
| | |
| | |
| | |
| | |
| | |
| | |
| | |
|
REALIZED AND UNREALIZED GAINS (LOSSES) |
Realized capital gain distributions received from underlying funds - affiliated | | |
Realized capital gain distributions received from underlying funds - unaffiliated | | |
Net realized losses on sales of securities - affiliated | | |
Net realized losses on sales of securities - unaffiliated | | |
| | |
Net change in unrealized appreciation (depreciation) on securities - affiliated | | |
Net change in unrealized appreciation (depreciation) on securities - unaffiliated | | |
Net change in unrealized appreciation (depreciation) | | |
Net realized and unrealized gains | | |
Increase in net assets resulting from operations | | |
Schwab Target Funds | Annual Report97
Statement of Changes in Net Assets
For the current and prior report periods
|
| | |
| | | |
| | | |
Net change in unrealized appreciation (depreciation) | | | |
Increase (decrease) in net assets resulting from operations | | | |
|
DISTRIBUTIONS TO SHAREHOLDERS |
| | | |
TRANSACTIONS IN FUND SHARES |
| | |
| | | | | |
| | | | | |
| | | | | |
| | | | | |
Net transactions in fund shares | | | | | |
|
SHARES OUTSTANDING AND NET ASSETS |
| | |
| | | | | |
| | | | | |
Total increase (decrease) | | | | | |
| | | | | |
98
Schwab Target Funds | Annual Report
Financial Statements
| | | | | | |
|
Net asset value at beginning of period | | | | | | |
Income (loss) from investment operations: | | | | | | |
Net investment income (loss)1 | | | | | | |
Net realized and unrealized gains (losses) | | | | | | |
Total from investment operations | | | | | | |
| | | | | | |
Distributions from net investment income | | | | | | |
Distributions from net realized gains | | | | | | |
| | | | | | |
Net asset value at end of period | | | | | | |
| | | | | | |
|
Ratios to average net assets: | | | | | | |
| | | | | | |
Gross operating expenses2 | | | | | | |
Net investment income (loss) | | | | | | |
| | | | | | |
Net assets, end of period (x 1,000) | | | | | | |
| Calculated based on the average shares outstanding during the period. |
| Ratio excludes acquired fund fees and expenses, which are indirect expenses incurred by the fund through its investments in underlying funds. |
| Ratio includes less than 0.005% of non-routine proxy expenses. |
Schwab Target Funds | Annual Report99
Portfolio Holdings as of October 31, 2023
This section shows all the securities in the fund’s portfolio and their values as of the report date, including a summary of the fund’s transactions with its affiliated underlying funds during the period.
The fund files its complete schedule of portfolio holdings with the U.S. Securities and Exchange Commission (SEC) for the first and third quarters of each fiscal year on Form N-PORT Part F. The fund’s Form N-PORT Part F is available on the SEC’s website at www.sec.gov. You can also obtain this information at no cost on the fund’s website at www.schwabassetmanagement.com/schwabfunds_prospectus, by calling 1-866-414-6349, or by sending an email request to orders@mysummaryprospectus.com. The fund also makes available its complete schedule of portfolio holdings 15 to 20 days after the end of the month on the fund’s website.
| | | | | NET CHANGE IN UNREALIZED APPRECIATION (DEPRECIATION) | | BALANCE OF SHARES HELD AT 10/31/23 | |
AFFILIATED UNDERLYING FUNDS 79.7% OF NET ASSETS |
|
|
|
| | | | | | | | |
Schwab Fundamental US Large Company Index Fund | | | | | | | | |
Schwab S&P 500 Index Fund | | | | | | | | |
Schwab Select Large Cap Growth Fund * | | | | | | | | |
| | | | | | | | |
|
Schwab U.S. Mid-Cap Index Fund * | | | | | | | | |
|
Schwab Small-Cap Equity Fund | | | | | | | | |
| | | | | | | | |
|
International Stocks 24.6% |
|
Schwab Fundamental International Large Company Index Fund | | | | | | | | |
Schwab International Core Equity Fund | | | | | | | | |
Schwab International Opportunities Fund | | | | | | | | |
| | | | | | | | |
|
|
|
Schwab Global Real Estate Fund | | | | | | | | |
|
|
Intermediate-Term Bond 1.8% |
Schwab U.S. Aggregate Bond Index Fund | | | | | | | | |
|
Schwab Short-Term Bond Index Fund | | | | | | | | |
| | | | | | | | |
Total Affiliated Underlying Funds
(Cost $127,080,845) | | | | | | | | |
|
100
Schwab Target Funds | Annual Report
Portfolio Holdings as of October 31, 2023 (continued)
| | | | | NET CHANGE IN UNREALIZED APPRECIATION (DEPRECIATION) | | BALANCE OF SHARES HELD AT 10/31/23 | |
UNAFFILIATED UNDERLYING FUNDS 19.8% OF NET ASSETS |
|
|
|
ClearBridge Large Cap Growth Fund, Class IS * | | | | | | | | |
Dodge & Cox Stock Fund, Class I | | | | | | | | |
| | | | | | | | |
|
ClearBridge Small Cap Growth Fund, Class IS * | | | | | | | | |
| | | | | | | | |
|
International Stocks 5.0% |
|
Goldman Sachs Emerging Markets Equity Insights Fund, Institutional Class | | | | | | | | |
|
|
Intermediate-Term Bond 2.6% |
Baird Aggregate Bond Fund, Institutional Class | | | | | | | | |
Loomis Sayles Investment Grade Bond Fund, Class Y | | | | | | | | |
Western Asset Core Plus Bond Fund, Class I | | | | | | | | |
| | | | | | | | |
|
PIMCO International Bond Fund (U.S. Dollar-Hedged), Institutional Class | | | | | | | | |
| | | | | | | | |
Total Unaffiliated Underlying Funds
(Cost $33,387,236) | | | | | | | | |
Total Investments in Securities
(Cost $160,468,081) | | | | | | | | |
| Non-income producing security. |
| Distributions received include distributions from net investment income and capital gains, if any, from the underlying funds. Amounts shown are only presented for affiliated underlying funds, which are presented in the corresponding line-item in the Statement of Operations, if applicable (see financial note 2(d) for additional information). |
At October 31, 2023, all of the fund’s investment securities were classified as Level 1 (see financial note 2(a) for additional
information).
Schwab Target Funds | Annual Report101
Statement of Assets and Liabilities
As of October 31, 2023
|
Investments in securities, at value - affiliated (cost $127,080,845) | | |
Investments in securities, at value - unaffiliated (cost $33,387,236) | | |
| | |
| | |
| | |
| | |
Due from investment adviser | | |
| | |
| | |
|
|
| | |
| | |
| | |
| | |
| | |
| | |
|
|
Capital received from investors | | |
Total distributable earnings | | |
| | |
102
Schwab Target Funds | Annual Report
Statement of Operations
For the period November 1, 2022 through October 31, 2023 |
|
Dividends received from securities - affiliated | | |
Dividends received from securities - unaffiliated | | |
Interest received from securities - unaffiliated | | |
| | |
|
|
| | |
| | |
| | |
Portfolio accounting fees | | |
Independent trustees’ fees | | |
| | |
| | |
| | |
| | |
| | |
| | |
| | |
|
REALIZED AND UNREALIZED GAINS (LOSSES) |
Realized capital gain distributions received from underlying funds - affiliated | | |
Realized capital gain distributions received from underlying funds - unaffiliated | | |
Net realized losses on sales of securities - affiliated | | |
Net realized losses on sales of securities - unaffiliated | | |
| | |
Net change in unrealized appreciation (depreciation) on securities - affiliated | | |
Net change in unrealized appreciation (depreciation) on securities - unaffiliated | | |
Net change in unrealized appreciation (depreciation) | | |
Net realized and unrealized gains | | |
Increase in net assets resulting from operations | | |
Schwab Target Funds | Annual Report103
Statement of Changes in Net Assets
For the current and prior report periods
|
| | |
| | | |
| | | |
Net change in unrealized appreciation (depreciation) | | | |
Increase (decrease) in net assets resulting from operations | | | |
|
DISTRIBUTIONS TO SHAREHOLDERS |
| | | |
TRANSACTIONS IN FUND SHARES |
| | |
| | | | | |
| | | | | |
| | | | | |
| | | | | |
Net transactions in fund shares | | | | | |
|
SHARES OUTSTANDING AND NET ASSETS |
| | |
| | | | | |
| | | | | |
Total increase (decrease) | | | | | |
| | | | | |
104
Schwab Target Funds | Annual Report
Financial Statements
| | | | | | |
|
Net asset value at beginning of period | | | | | | |
Income (loss) from investment operations: | | | | | | |
Net investment income (loss)1 | | | | | | |
Net realized and unrealized gains (losses) | | | | | | |
Total from investment operations | | | | | | |
| | | | | | |
Distributions from net investment income | | | | | | |
Distributions from net realized gains | | | | | | |
| | | | | | |
Net asset value at end of period | | | | | | |
| | | | | | |
|
Ratios to average net assets: | | | | | | |
| | | | | | |
Gross operating expenses2 | | | | | | |
Net investment income (loss) | | | | | | |
| | | | | | |
Net assets, end of period (x 1,000) | | | | | | |
| Calculated based on the average shares outstanding during the period. |
| Ratio excludes acquired fund fees and expenses, which are indirect expenses incurred by the fund through its investments in underlying funds. |
| Ratio includes less than 0.005% of non-routine proxy expenses. |
Schwab Target Funds | Annual Report105
Portfolio Holdings as of October 31, 2023
This section shows all the securities in the fund’s portfolio and their values as of the report date, including a summary of the fund’s transactions with its affiliated underlying funds during the period.
The fund files its complete schedule of portfolio holdings with the U.S. Securities and Exchange Commission (SEC) for the first and third quarters of each fiscal year on Form N-PORT Part F. The fund’s Form N-PORT Part F is available on the SEC’s website at www.sec.gov. You can also obtain this information at no cost on the fund’s website at www.schwabassetmanagement.com/schwabfunds_prospectus, by calling 1-866-414-6349, or by sending an email request to orders@mysummaryprospectus.com. The fund also makes available its complete schedule of portfolio holdings 15 to 20 days after the end of the month on the fund’s website.
| | | | | NET CHANGE IN UNREALIZED APPRECIATION (DEPRECIATION) | | BALANCE OF SHARES HELD AT 10/31/23 | |
AFFILIATED UNDERLYING FUNDS 80.7% OF NET ASSETS |
|
|
|
| | | | | | | | |
Schwab Fundamental US Large Company Index Fund | | | | | | | | |
Schwab S&P 500 Index Fund | | | | | | | | |
Schwab Select Large Cap Growth Fund * | | | | | | | | |
| | | | | | | | |
|
Schwab U.S. Mid-Cap Index Fund * | | | | | | | | |
|
Schwab Small-Cap Equity Fund | | | | | | | | |
| | | | | | | | |
|
International Stocks 25.0% |
|
Schwab Fundamental International Large Company Index Fund | | | | | | | | |
Schwab International Core Equity Fund | | | | | | | | |
Schwab International Opportunities Fund | | | | | | | | |
| | | | | | | | |
|
|
|
Schwab Global Real Estate Fund | | | | | | | | |
|
|
Intermediate-Term Bond 1.2% |
Schwab U.S. Aggregate Bond Index Fund | | | | | | | | |
|
Schwab Short-Term Bond Index Fund | | | | | | | | |
| | | | | | | | |
Total Affiliated Underlying Funds
(Cost $44,745,577) | | | | | | | | |
|
106
Schwab Target Funds | Annual Report
Portfolio Holdings as of October 31, 2023 (continued)
| | | | | NET CHANGE IN UNREALIZED APPRECIATION (DEPRECIATION) | | BALANCE OF SHARES HELD AT 10/31/23 | |
UNAFFILIATED UNDERLYING FUNDS 18.9% OF NET ASSETS |
|
|
|
ClearBridge Large Cap Growth Fund, Class IS * | | | | | | | | |
Dodge & Cox Stock Fund, Class I | | | | | | | | |
| | | | | | | | |
|
ClearBridge Small Cap Growth Fund, Class IS * | | | | | | | | |
| | | | | | | | |
|
International Stocks 5.6% |
|
Goldman Sachs Emerging Markets Equity Insights Fund, Institutional Class | | | | | | | | |
|
|
Intermediate-Term Bond 1.5% |
Loomis Sayles Investment Grade Bond Fund, Class Y | | | | | | | | |
Western Asset Core Plus Bond Fund, Class I | | | | | | | | |
| | | | | | | | |
|
PIMCO International Bond Fund (U.S. Dollar-Hedged), Institutional Class | | | | | | | | |
| | | | | | | | |
Total Unaffiliated Underlying Funds
(Cost $10,753,621) | | | | | | | | |
Total Investments in Securities
(Cost $55,499,198) | | | | | | | | |
| Non-income producing security. |
| Distributions received include distributions from net investment income and capital gains, if any, from the underlying funds. Amounts shown are only presented for affiliated underlying funds, which are presented in the corresponding line-item in the Statement of Operations, if applicable (see financial note 2(d) for additional information). |
At October 31, 2023, all of the fund’s investment securities were classified as Level 1 (see financial note 2(a) for additional
information).
Schwab Target Funds | Annual Report107
Statement of Assets and Liabilities
As of October 31, 2023
|
Investments in securities, at value - affiliated (cost $44,745,577) | | |
Investments in securities, at value - unaffiliated (cost $10,753,621) | | |
| | |
| | |
| | |
Due from investment adviser | | |
| | |
| | |
| | |
|
|
| | |
| | |
| | |
| | |
| | |
| | |
|
|
Capital received from investors | | |
| | |
| | |
108
Schwab Target Funds | Annual Report
Statement of Operations
For the period November 1, 2022 through October 31, 2023 |
|
Dividends received from securities - affiliated | | |
Dividends received from securities - unaffiliated | | |
Interest received from securities - unaffiliated | | |
| | |
|
|
| | |
| | |
Portfolio accounting fees | | |
| | |
Independent trustees’ fees | | |
| | |
| | |
| | |
| | |
| | |
| | |
| | |
|
REALIZED AND UNREALIZED GAINS (LOSSES) |
Realized capital gain distributions received from underlying funds - affiliated | | |
Realized capital gain distributions received from underlying funds - unaffiliated | | |
Net realized losses on sales of securities - affiliated | | |
Net realized losses on sales of securities - unaffiliated | | |
| | |
Net change in unrealized appreciation (depreciation) on securities - affiliated | | |
Net change in unrealized appreciation (depreciation) on securities - unaffiliated | | |
Net change in unrealized appreciation (depreciation) | | |
Net realized and unrealized gains | | |
Increase in net assets resulting from operations | | |
Schwab Target Funds | Annual Report109
Statement of Changes in Net Assets
For the current and prior report periods
|
| | |
| | | |
| | | |
Net change in unrealized appreciation (depreciation) | | | |
Increase (decrease) in net assets resulting from operations | | | |
|
DISTRIBUTIONS TO SHAREHOLDERS |
| | | |
TRANSACTIONS IN FUND SHARES |
| | |
| | | | | |
| | | | | |
| | | | | |
| | | | | |
Net transactions in fund shares | | | | | |
|
SHARES OUTSTANDING AND NET ASSETS |
| | |
| | | | | |
| | | | | |
Total increase (decrease) | | | | | |
| | | | | |
110
Schwab Target Funds | Annual Report
Financial Statements
| | | | | | |
|
Net asset value at beginning of period | | | | | | |
Income (loss) from investment operations: | | | | | | |
Net investment income (loss)2 | | | | | | |
Net realized and unrealized gains (losses) | | | | | | |
Total from investment operations | | | | | | |
| | | | | | |
Distributions from net investment income | | | | | | |
Distributions from net realized gains | | | | | | |
| | | | | | |
Net asset value at end of period | | | | | | |
| | | | | | |
|
Ratios to average net assets: | | | | | | |
| | | | | | |
Gross operating expenses4 | | | | | | |
Net investment income (loss) | | | | | | |
| | | | | | |
Net assets, end of period (x 1,000) | | | | | | |
| Commencement of operations. |
| Calculated based on the average shares outstanding during the period. |
| |
| Ratio excludes acquired fund fees and expenses, which are indirect expenses incurred by the fund through its investments in underlying funds. |
| Ratio includes less than 0.005% of non-routine proxy expenses. |
| |
Schwab Target Funds | Annual Report111
Portfolio Holdings as of October 31, 2023
This section shows all the securities in the fund’s portfolio and their values as of the report date, including a summary of the fund’s transactions with its affiliated underlying funds during the period.
The fund files its complete schedule of portfolio holdings with the U.S. Securities and Exchange Commission (SEC) for the first and third quarters of each fiscal year on Form N-PORT Part F. The fund’s Form N-PORT Part F is available on the SEC’s website at www.sec.gov. You can also obtain this information at no cost on the fund’s website at www.schwabassetmanagement.com/schwabfunds_prospectus, by calling 1-866-414-6349, or by sending an email request to orders@mysummaryprospectus.com. The fund also makes available its complete schedule of portfolio holdings 15 to 20 days after the end of the month on the fund’s website.
| | | | | NET CHANGE IN UNREALIZED APPRECIATION (DEPRECIATION) | | BALANCE OF SHARES HELD AT 10/31/23 | |
AFFILIATED UNDERLYING FUNDS 81.6% OF NET ASSETS |
|
|
|
| | | | | | | | |
Schwab Fundamental US Large Company Index Fund | | | | | | | | |
Schwab S&P 500 Index Fund | | | | | | | | |
Schwab Select Large Cap Growth Fund * | | | | | | | | |
| | | | | | | | |
|
Schwab U.S. Mid-Cap Index Fund * | | | | | | | | |
|
Schwab Small-Cap Equity Fund | | | | | | | | |
| | | | | | | | |
|
International Stocks 25.4% |
|
Schwab Fundamental International Large Company Index Fund | | | | | | | | |
Schwab International Core Equity Fund | | | | | | | | |
Schwab International Opportunities Fund | | | | | | | | |
| | | | | | | | |
|
|
|
Schwab Global Real Estate Fund | | | | | | | | |
|
|
Intermediate-Term Bond 0.5% |
Schwab U.S. Aggregate Bond Index Fund | | | | | | | | |
|
Schwab Short-Term Bond Index Fund | | | | | | | | |
| | | | | | | | |
Total Affiliated Underlying Funds
(Cost $11,081,346) | | | | | | | | |
|
112
Schwab Target Funds | Annual Report
Portfolio Holdings as of October 31, 2023 (continued)
| | | | | NET CHANGE IN UNREALIZED APPRECIATION (DEPRECIATION) | | BALANCE OF SHARES HELD AT 10/31/23 | |
UNAFFILIATED UNDERLYING FUNDS 17.9% OF NET ASSETS |
|
|
|
ClearBridge Large Cap Growth Fund, Class IS * | | | | | | | | |
Dodge & Cox Stock Fund, Class I | | | | | | | | |
| | | | | | | | |
|
ClearBridge Small Cap Growth Fund, Class IS * | | | | | | | | |
| | | | | | | | |
|
International Stocks 5.6% |
|
Goldman Sachs Emerging Markets Equity Insights Fund, Institutional Class | | | | | | | | |
|
|
Intermediate-Term Bond 1.0% |
Loomis Sayles Investment Grade Bond Fund, Class Y | | | | | | | | |
|
PIMCO International Bond Fund (U.S. Dollar- Hedged), Institutional Class | | | | | | | | |
| | | | | | | | |
Total Unaffiliated Underlying Funds
(Cost $2,472,334) | | | | | | | | |
Total Investments in Securities
(Cost $13,553,680) | | | | | | | | |
| Non-income producing security. |
| Distributions received include distributions from net investment income and capital gains, if any, from the underlying funds. Amounts shown are only presented for affiliated underlying funds, which are presented in the corresponding line-item in the Statement of Operations, if applicable (see financial note 2(d) for additional information). |
At October 31, 2023, all of the fund’s investment securities were classified as Level 1 (see financial note 2(a) for additional
information).
Schwab Target Funds | Annual Report113
Statement of Assets and Liabilities
As of October 31, 2023
|
Investments in securities, at value - affiliated (cost $11,081,346) | | |
Investments in securities, at value - unaffiliated (cost $2,472,334) | | |
| | |
| | |
Due from investment adviser | | |
| | |
| | |
| | |
| | |
|
|
| | |
| | |
| | |
| | |
| | |
| | |
|
|
Capital received from investors | | |
| | |
| | |
114
Schwab Target Funds | Annual Report
Statement of Operations
For the period November 1, 2022 through October 31, 2023 |
|
Dividends received from securities - affiliated | | |
Dividends received from securities - unaffiliated | | |
| | |
|
|
| | |
| | |
Portfolio accounting fees | | |
Independent trustees’ fees | | |
| | |
| | |
| | |
| | |
| | |
| | |
| | |
| | |
|
REALIZED AND UNREALIZED GAINS (LOSSES) |
Realized capital gain distributions received from underlying funds - affiliated | | |
Realized capital gain distributions received from underlying funds - unaffiliated | | |
Net realized losses on sales of securities - affiliated | | |
Net realized losses on sales of securities - unaffiliated | | |
| | |
Net change in unrealized appreciation (depreciation) on securities - affiliated | | |
Net change in unrealized appreciation (depreciation) on securities - unaffiliated | | |
Net change in unrealized appreciation (depreciation) | | |
Net realized and unrealized gains | | |
Increase in net assets resulting from operations | | |
Schwab Target Funds | Annual Report115
Statement of Changes in Net Assets
For the current and prior report periods
|
| | |
| | | |
| | | |
Net change in unrealized appreciation (depreciation) | | | |
Increase (decrease) in net assets resulting from operations | | | |
|
DISTRIBUTIONS TO SHAREHOLDERS |
| | | |
TRANSACTIONS IN FUND SHARES |
| | |
| | | | | |
| | | | | |
| | | | | |
| | | | | |
Net transactions in fund shares | | | | | |
|
SHARES OUTSTANDING AND NET ASSETS |
| | |
| | | | | |
| | | | | |
| | | | | |
| | | | | |
116
Schwab Target Funds | Annual Report
1. Business Structure of the Funds:
Each of the funds in this report is a series of Schwab Capital Trust (the trust), a no-load, open-end management investment company. The trust is organized as a Massachusetts business trust and is registered under the Investment Company Act of 1940, as amended (the 1940 Act). The list below shows all the funds in the trust as of the end of the period, including the funds discussed in this report, which are highlighted:
|
| Schwab Dividend Equity Fund |
| Schwab Large-Cap Growth Fund |
| Schwab Small-Cap Equity Fund |
| |
| Schwab International Core Equity Fund |
| Schwab Fundamental US Large Company Index Fund |
| Schwab Fundamental US Small Company Index Fund |
| Schwab Fundamental International Large Company Index Fund |
| Schwab Fundamental International Small Company Index Fund |
| Schwab Fundamental Emerging Markets Large Company Index Fund |
| Schwab Fundamental Global Real Estate Index Fund |
| Schwab Target 2010 Index Fund |
Schwab S&P 500 Index Fund | Schwab Target 2015 Index Fund |
Schwab Small-Cap Index Fund® | Schwab Target 2020 Index Fund |
Schwab Total Stock Market Index Fund® | Schwab Target 2025 Index Fund |
Schwab U.S. Large-Cap Growth Index Fund | Schwab Target 2030 Index Fund |
Schwab U.S. Large-Cap Value Index Fund | Schwab Target 2035 Index Fund |
Schwab U.S. Mid-Cap Index Fund | Schwab Target 2040 Index Fund |
Schwab International Index Fund® | Schwab Target 2045 Index Fund |
Schwab MarketTrack All Equity Portfolio™ | Schwab Target 2050 Index Fund |
Schwab MarketTrack Growth Portfolio™ | Schwab Target 2055 Index Fund |
Schwab MarketTrack Balanced Portfolio™ | Schwab Target 2060 Index Fund |
Schwab MarketTrack Conservative Portfolio™ | Schwab Target 2065 Index Fund |
Schwab International Opportunities Fund | Schwab Monthly Income Fund - Target Payout |
| Schwab Monthly Income Fund - Flexible Payout |
| Schwab Monthly Income Fund - Income Payout |
Each of the Schwab Target Funds is considered a “fund of funds” because it invests in other mutual funds or exchange-traded funds (ETFs). Each of the funds seeks to achieve its investment objective by investing primarily in a combination of other affiliated Schwab mutual funds. Each fund may also invest in affiliated Schwab ETFs and unaffiliated third party mutual funds and ETFs (referred to herein as unaffiliated funds and, together with Schwab Funds and Schwab ETFs, as the underlying funds). Each fund invests in the underlying funds in accordance with its target portfolio allocation.
Each fund in this report offers one share class. Shares are bought and sold at closing net asset value per share (NAV), which is the price for all outstanding shares of a fund. Each share has a par value of 1/1,000 of a cent, and the funds’ Board of Trustees (the Board) may authorize the issuance of as many shares as necessary.
Each fund maintains its own account for purposes of holding assets and accounting, and is considered a separate entity for tax purposes. Within its account, each fund may also keep certain assets in segregated accounts, as required by securities law. The "Fund Complex" includes The Charles Schwab Family of Funds, Schwab Capital Trust, Schwab Investments, Schwab Annuity Portfolios, Schwab Strategic Trust and Laudus Trust.
2. Significant Accounting Policies:The following is a summary of the significant accounting policies the funds use in their preparation of financial statements. The funds follow the investment company accounting and reporting guidance of the Financial Accounting Standards Board (FASB) Accounting Standard Codification Topic 946 Financial Services — Investment Companies. The accounting policies are in conformity with accounting principles generally accepted in the United States of America (GAAP).
The financial statements of the funds should be read in conjunction with the underlying funds’ financial statements. For more information about the underlying funds’ operations and policies, please refer to those funds’ semiannual and annual reports, which are filed with the U.S. Securities and Exchange Commission (SEC) and are available on the SEC’s website at www.sec.gov.
Schwab Target Funds | Annual Report117
Financial Notes (continued)
2. Significant Accounting Policies (continued):
(a) Security Valuation:
Pursuant to Rule 2a-5 under the 1940 Act, the Board has designated authority to a Valuation Designee, the funds’ investment adviser, to make fair valuation determinations under adopted procedures, subject to Board oversight. The investment adviser has formed a Pricing Committee to administer the pricing and valuation of portfolio securities and other assets and liabilities as well as to ensure that prices used for internal purposes or provided by third parties reasonably reflect fair value. The Valuation Designee may utilize independent pricing services, quotations from securities and financial instrument dealers and other market sources to determine fair value.
Securities held in the funds’ portfolio are valued every business day. The following valuation policies and procedures are used by the Valuation Designee to value various types of securities:
• Securities traded on an exchange or over-the-counter: Traded securities are valued at the closing value for the day, or, on days when no closing value has been reported, at the mean of the most recent bid and ask quotes.
• Mutual funds: Mutual funds are valued at their respective NAVs.
• Securities for which no quoted value is available: The Valuation Designee has adopted procedures to fair value a fund’s securities when market prices are not “readily available” or are unreliable. For example, a security may be fair valued when it’s de-listed or its trading is halted or suspended; when a security’s primary pricing source is unable or unwilling to provide a price; or when a security’s primary trading market is closed during regular market hours. Fair value determinations are made in good faith in accordance with adopted valuation procedures. The Valuation Designee considers a number of factors, including unobservable market inputs, when arriving at fair value. The Valuation Designee may employ methods such as the review of related or comparable assets or liabilities, related market activities, recent transactions, market multiples, book values, transactional back-testing, disposition analysis and other relevant information. Due to the subjective and variable nature of fair value pricing, there can be no assurance that a fund could obtain the fair value assigned to the security upon the sale of such security.
In accordance with the authoritative guidance on fair value measurements and disclosures under GAAP, the funds disclose the fair value of their investments in a hierarchy that prioritizes the significant inputs to valuation methods used to measure the fair value. The hierarchy gives the highest priority to valuations based upon unadjusted quoted prices in active markets for identical assets or liabilities (Level 1 measurements) and the lowest priority to valuations based upon unobservable inputs that are significant to the valuation (Level 3 measurements). If inputs used to measure the financial instruments fall within different levels of the hierarchy, the categorization is based on the lowest level input that is significant to the valuation. If it is determined that either the volume and/or level of activity for an asset or liability has significantly decreased (from normal conditions for that asset or liability) or price quotations or observable inputs are not associated with orderly transactions, increased analysis and the Valuation Designee’s judgment will be required to estimate fair value.
The three levels of the fair value hierarchy are as follows:
• Level 1 — quoted prices in active markets for identical investments — Investments whose values are based on quoted market prices in active markets. These generally include active listed equities, mutual funds, ETFs and futures contracts. Mutual funds and ETFs are classified as Level 1 prices, without consideration to the classification level of the underlying securities held which could be Level 1, Level 2 or Level 3 in the fair value hierarchy.
• Level 2 — other significant observable inputs (including quoted prices for similar securities, interest rates, prepayment speeds, credit risk, etc.) — Investments that trade in markets that are not considered to be active, but whose values are based on quoted market prices, dealer quotations or valuations provided by alternative pricing sources supported by observable inputs are classified as Level 2 prices. These generally include U.S. government and sovereign obligations, most government agency securities, investment-grade corporate bonds, certain mortgage products, less liquid listed equities, and state, municipal and provincial obligations.
• Level 3 — significant unobservable inputs (including the Valuation Designee’s assumptions in determining the fair value of investments) — Investments whose values are classified as Level 3 prices have significant unobservable inputs, as they may trade infrequently or not at all. When observable prices are not readily available for these securities, one or more valuation methods are used for which sufficient and reliable data is available. The inputs used in estimating the value of Level 3 prices may include the original transaction price, quoted prices for similar securities or assets in active markets, completed or pending third-party transactions in the underlying investment or comparable issuers, and changes in financial ratios or cash
118
Schwab Target Funds | Annual Report
Financial Notes (continued)
2. Significant Accounting Policies (continued):
flows. Level 3 prices may also be adjusted to reflect illiquidity and/or non-transferability, with the amount of such discount estimated in the absence of market information. Assumptions used due to the lack of observable inputs may significantly impact the resulting fair value and therefore a fund’s results of operations.
The inputs or methodology used for valuing securities are not necessarily an indication of the risk associated with investing in those securities.
The levels associated with valuing the funds’ investments as of October 31, 2023, are disclosed in each fund’s Portfolio Holdings.
(b) Accounting Policies for certain Portfolio Investments (if held):
Cash Investments: The funds may invest a portion of their assets in cash. Cash includes cash bank balances in an interest-bearing demand deposit account with maturity on demand by the funds.
(c) Security Transactions:
Security transactions are recorded as of the date the order to buy or sell the security is executed. Realized gains and losses from security transactions are based on the identified costs of the securities involved.
(d) Investment Income:
Interest income is recorded as it accrues. Dividends and distributions from portfolio securities and underlying funds are recorded on the date they are effective (the ex-dividend date). Any distributions from underlying funds are recorded in accordance with the character of the distributions as designated by the underlying funds.
(e) Expenses:
Expenses that are specific to a fund are charged directly to the fund. Expenses that are common to more than one fund in the trusts generally are allocated among those funds in proportion to their average daily net assets. Each fund bears its share of the acquired fund fees and expenses of the underlying funds, which are indirect expenses incurred by a fund through its investments in the underlying funds. Such expenses are reflected in the net asset values of the underlying funds.
(f) Distributions to Shareholders:
The funds make distributions from net investment income and net realized capital gains, if any, once a year. To receive a distribution, you must be a registered shareholder on the record date. Distributions are paid to shareholders on the payable date.
(g) Accounting Estimates:
The accounting policies described in this report conform to GAAP. Notwithstanding this, shareholders should understand that in order to follow these principles, fund management has to make estimates and assumptions that affect the information reported in the financial statements. It’s possible that once the results are known, they may turn out to be different from these estimates and these differences may be material.
(h) Federal Income Taxes:
The funds intend to meet federal income and excise tax requirements for regulated investment companies under subchapter M of the Internal Revenue Code, as amended. Accordingly, the funds distribute substantially all of their net investment income and net realized capital gains, if any, to their respective shareholders each year. As long as a fund meets the tax requirements, it is not required to pay federal income tax.
(i) Indemnification:
Under the funds’ organizational documents, the officers and trustees are indemnified against certain liabilities arising out of the performance of their duties to the funds. In addition, in the normal course of business the funds enter into contracts with their vendors and others that provide general indemnifications. The funds’ maximum exposure under these arrangements is unknown as this would involve future claims that may be made against the funds. However, based on experience, the funds expect the risk of loss attributable to these arrangements to be remote.
Schwab Target Funds | Annual Report119
Financial Notes (continued)
2. Significant Accounting Policies (continued):
(j) Regulatory Update:
Effective January 24, 2023, the SEC adopted rule and form amendments to require mutual funds and ETFs to transmit concise and visually engaging streamlined annual and semiannual reports to shareholders that highlight key information deemed important for retail investors to assess and monitor their fund investments. Other information, including financial statements, will no longer appear in a streamlined shareholder report but must be available online, delivered free of charge upon request, and filed on a semiannual basis on Form N-CSR. The rule and form amendments have a compliance date of July 24, 2024. At this time, management is evaluating the impact of these rule and form amendment changes on the content of the current shareholder report and the newly created annual and semiannual streamlined shareholder reports.
3. Risk Factors:Investing in the funds may involve certain risks, as discussed in the funds’ prospectus, including, but not limited to, those described below. Any of these risks could cause an investor to lose money.
Asset Allocation Risk. The funds are subject to the risk that the selection of the underlying funds and the allocation of a fund’s assets among the various asset classes and market segments may cause the funds to underperform other funds with a similar investment objective. The funds are not managed to maximize tax efficiency for taxable shareholder accounts. Investors should consider whether the funds are an appropriate investment in light of their current financial position and retirement needs.
Conflicts of Interest Risk. The investment adviser’s authority to select and substitute underlying funds from a variety of affiliated and unaffiliated mutual funds and ETFs may create a conflict of interest because the fees paid to it and its affiliates by some underlying funds are higher than the fees paid by other underlying funds. The investment adviser also may have an incentive to select an affiliated underlying fund for other reasons, including to increase assets under management or to support new investment strategies. In addition, other conflicts of interest may exist where the best interests of the affiliated underlying fund may not be aligned with those of a fund. However, the investment adviser is a fiduciary to each fund and is legally obligated to act in each fund’s best interests when selecting underlying funds.
Market Risk. Financial markets rise and fall in response to a variety of factors, sometimes rapidly and unpredictably. Markets may be impacted by economic, political, regulatory and other conditions, including economic sanctions and other government actions. In addition, the occurrence of global events, such as war, terrorism, environmental disasters, natural disasters and epidemics, may also negatively affect the financial markets. As with any investment whose performance is tied to these markets, the value of an investment in the fund will fluctuate, which means that an investor could lose money over short or long periods.
Exchange-Traded Fund (ETF) Risk. When a fund invests in an ETF, it will bear a proportionate share of the ETF’s expenses. In addition, lack of liquidity in the market for an ETF’s shares can result in its value being more volatile than the underlying portfolio of securities.
Direct Investment Risk. The funds may invest directly in cash, cash equivalents and equity and fixed-income securities, including money market securities, to maintain their allocations. A fund’s direct investment in these securities is subject to the same or similar risks as an underlying fund’s investment in the same securities.
Underlying Fund Investment Risk. Before investing in the funds, investors should assess the risks associated with the underlying funds in which the funds may invest, which include any combination of the risks described below.
• Investment Risk. The funds may experience losses with respect to their investment in an underlying fund. Further, there is no guarantee that an underlying fund will be able to achieve its objective.
• Management Risk. Generally,the underlying funds are actively managed mutual funds. Any actively managed mutual fund is subject to the risk that its investment adviser (or subadviser(s)) will make poor security selections. An underlying fund’s adviser applies its own investment techniques and risk analyses in making investment decisions for the underlying fund, but there can be no guarantee that they will produce the desired results.
• Fixed-Income Risk. Interest rates rise and fall over time, which will affect an underlying fund’s yield and share price. A change in a central bank’s monetary policy or economic conditions, among other things, may result in a change in interest rates. A rise in interest rates could cause an underlying fund’s share price to fall. The credit quality of a portfolio investment could also cause an underlying fund’s share price to fall. An underlying fund could lose money if the issuer or guarantor of a portfolio investment or the counterparty to a derivatives contract fails to make timely principal or interest payments or otherwise honor its obligations. Fixed-income securities may be paid off earlier or later than expected. Either situation could cause an
120
Schwab Target Funds | Annual Report
Financial Notes (continued)
3. Risk Factors (continued):
underlying fund to hold securities paying lower-than-market rates of interest, which could hurt an underlying fund’s yield or share price. Below investment-grade bonds (junk bonds) involve greater credit risk, are more volatile, involve greater risk of price declines and may be more susceptible to economic downturns than investment-grade securities.
• Equity Risk. The prices of equity securities rise and fall daily. These price movements may result from factors affecting individual companies, industries or the securities market as a whole. In addition, equity markets tend to move in cycles, which may cause stock prices to fall over short or extended periods of time.
• Market Capitalization Risk. Securities issued by companies of different market capitalizations tend to go in and out of favor based on market and economic conditions. During a period when securities of a particular market capitalization fall behind other types of investments, an underlying fund’s performance could be impacted.
• Money Market Fund Risk. The funds may invest in underlying money market funds that either seek to maintain a stable $1.00 net asset value (“stable share price money market funds”) or that have a share price that fluctuates (“variable share price money market funds”). Although an underlying stable share price money market fund seeks to maintain a stable $1.00 net asset value, it is possible to lose money by investing in such a money market fund. Because the share price of an underlying variable share price money market fund will fluctuate, when a fund sells the shares it owns they may be worth more or less than what the fund originally paid for them. In addition, neither type of money market fund is designed to offer capital appreciation. Certain underlying money market funds may impose a fee upon the sale of shares or may temporarily suspend the ability to sell shares if such fund’s liquidity falls below required minimums.
• ETF Risk. When an underlying fund invests in an ETF, it will bear a proportionate share of the ETF’s expenses. In addition, lack of liquidity in the market for an ETF’s shares can result in its value being more volatile than the underlying portfolio of securities.
• Foreign Investment Risk. An underlying fund’s investments in securities of foreign issuers involve certain risks that may be greater than those associated with investments in securities of U.S. issuers. These include risks of adverse changes in foreign economic, political, regulatory and other conditions; changes in currency exchange rates or exchange control regulations (including limitations on currency movements and exchanges); the imposition of economic sanctions or other government restrictions; differing accounting, auditing, financial reporting and legal standards and practices; differing securities market structures; and higher transaction costs. These risks may negatively impact the value or liquidity of an underlying fund’s investments, and could impair the underlying fund’s ability to meet its investment objective or invest in accordance with its investment strategy. There is a risk that investments in securities denominated in, and/or receiving revenues in, foreign currencies will decline in value relative to the U.S. dollar.
• Emerging Markets Risk. Emerging market countries may be more likely to experience political turmoil or rapid changes in market or economic conditions than more developed countries. Emerging market countries often have less uniformity in accounting, auditing, financial reporting and recording requirements and greater risk associated with the custody of securities. In addition, the financial stability of issuers (including governments) in emerging market countries may be more precarious than in developed countries. As a result, there may be an increased risk of illiquidity and price volatility associated with an underlying fund’s investments in emerging market countries, which may be magnified by currency fluctuations relative to the U.S. dollar, and, at times, it may be difficult to value such investments.
• Derivatives Risk. An underlying fund may use derivatives to enhance returns or hedge against market declines. Examples of derivatives are options, futures, options on futures and swaps. An option is the right, but not the obligation, to buy or sell an instrument at a specific price on or before a specific date. A future is an agreement to buy or sell a financial instrument at a specific price on a specific day. A swap is an agreement whereby two parties agree to exchange payment streams calculated in relation to a rate, index, instrument or certain securities and a predetermined amount. A credit default swap is an agreement in which the seller agrees to make a payment to the buyer in the event of a specified credit event in exchange for a fixed payment or series of fixed payments.
An underlying fund’s use of derivative instruments involves risks different from, or possibly greater than, the risks associated with investing directly in securities and other traditional investments. Certain of these risks, such as leverage risk, liquidity risk, market risk and management risk are discussed elsewhere in this section. An underlying fund’s use of derivatives is also subject to lack of availability risk, valuation risk, correlation risk and tax risk. Lack of availability risk is the risk that suitable derivative transactions may not be available in all circumstances for risk management or other purposes. Valuation risk is the risk that a particular derivative may be valued incorrectly. Correlation risk is the risk that changes in the value of the derivative may not correlate perfectly with the underlying asset, rate or index. Tax risk is the risk that the use of derivatives may cause an underlying fund to realize higher amounts of short-term capital gains. An underlying fund’s use of derivatives could reduce the
Schwab Target Funds | Annual Report121
Financial Notes (continued)
3. Risk Factors (continued):
underlying fund’s performance, increase its volatility, and could cause the underlying fund to lose more than the initial amount invested. The use of derivatives that are subject to regulation by the Commodity Futures Trading Commission (CFTC) by an underlying fund could cause a fund to become a commodity pool, which would require the fund to comply with certain CFTC rules. An underlying fund’s use of derivatives also could create a risk of counterparty default under certain transactions, risks that a fund would need to liquidate portfolio positions when it may not be advantageous to do so in order to meet margin and payment obligations, and legal risks relating to insufficient documentation, insufficient capacity or authority of a counterparty, or legality or enforceability of a contract.
• Leverage Risk. Certain underlying fund transactions, such as derivatives transactions, short sales, reverse repurchase agreements, and mortgage dollar rolls, may give rise to a form of leverage and may expose an underlying fund to greater risk. Leverage tends to magnify the effect of any decrease or increase in the value of an underlying fund’s portfolio securities, which means even a small amount of leverage can have a disproportionately large impact on the underlying fund.
• Liquidity Risk. An underlying fund may be unable to sell certain securities, such as illiquid securities, readily at a favorable time or price, or the underlying fund may have to sell them at a loss.
• Portfolio Turnover Risk. Certain of the underlying funds may buy and sell portfolio securities actively. If they do, their portfolio turnover rate and transaction costs will rise, which may lower the underlying fund’s performance and may increase the likelihood of capital gains distributions.
• Securities Lending Risk. An underlying fund may lend its portfolio securities to brokers, dealers, and other financial institutions. Securities lending involves the risk of loss of rights in, or delay in recovery of, the loaned securities if the borrower fails to return the security loaned or becomes insolvent.
Please refer to the funds’ prospectus for a more complete description of the principal risks of investing in the funds.
4. Affiliates and Affiliated Transactions:Investment Adviser
Charles Schwab Investment Management, Inc., dba Schwab Asset Management, a wholly owned subsidiary of The Charles Schwab Corporation, serves as each fund’s investment adviser and administrator pursuant to the Investment Advisory and Administration Agreement between the investment adviser and the trust. The investment adviser does not receive a fee for the services it performs for the funds. However, the investment adviser is entitled to receive an annual management fee from each of the affiliated Schwab Funds that serve as underlying funds.
Shareholder Servicing
The Board has adopted a Shareholder Servicing Plan (the Plan) on behalf of the funds. The Plan enables each fund to bear expenses relating to the provision by financial intermediaries, including Charles Schwab & Co., Inc., a broker-dealer affiliate of an investment adviser (together, service providers), of certain account maintenance, customer liaison and shareholder services to the current shareholders of the funds. The funds are not subject to any fee under the Plan.
Expense Limitation
The investment adviser and its affiliates have agreed with the funds, for so long as the investment adviser serves as the investment adviser to the funds, in which the agreement may only be amended or terminated with the approval of the Board, to limit the total annual fund operating expenses charged, excluding interest, taxes and certain non-routine expenses to 0.00%.
The agreement to limit the funds’ total expenses charged is limited to each fund’s direct operating expenses and, therefore, does not apply to acquired fund fees and expenses, which are indirect expenses incurred by a fund through its investments in the underlying funds.
122
Schwab Target Funds | Annual Report
Financial Notes (continued)
4. Affiliates and Affiliated Transactions (continued):
Investments in Affiliates
The funds may engage in certain transactions involving related parties. Pursuant to an exemptive order issued by the SEC, the funds may invest in other related funds. As of October 31, 2023, each Schwab Target Fund’s ownership percentages of other related funds’ shares are as follows:
| | | | | | | | | | | | |
| | | | | | | | | | | | |
Schwab Fundamental International Large Company Index Fund | | | | | | | | | | | | |
Schwab Fundamental US Large Company Index Fund | | | | | | | | | | | | |
Schwab Global Real Estate Fund | | | | | | | | | | | | |
Schwab International Core Equity Fund | | | | | | | | | | | | |
Schwab International Opportunities Fund | | | | | | | | | | | | |
Schwab S&P 500 Index Fund | | | | | | | | | | | | |
Schwab Select Large Cap Growth Fund | | | | | | | | | | | | |
Schwab Short-Term Bond Index Fund | | | | | | | | | | | | |
Schwab Small-Cap Equity Fund | | | | | | | | | | | | |
Schwab Treasury Inflation Protected Securities Index Fund | | | | | | | | | | | | |
Schwab U.S. Aggregate Bond Index Fund | | | | | | | | | | | | |
Schwab U.S. Mid Cap Index Fund | | | | | | | | | | | | |
Schwab Variable Share Price Money Fund, Ultra Shares | | | | | | | | | | | | |
Interfund Borrowing and Lending
Pursuant to an exemptive order issued by the SEC, the funds may enter into interfund borrowing and lending transactions with other funds in the Fund Complex. All loans are for temporary or emergency purposes and the interest rate to be charged will be the average of the overnight repurchase agreement rate and the short-term bank loan rate. All loans are subject to numerous conditions designed to ensure fair and equitable treatment of all participating funds. The interfund lending facility is subject to the oversight and periodic review by the Board. The funds had no interfund borrowing or lending activity during the period.
5. Board of Trustees:The Board may include people who are officers and/or directors of the investment adviser or its affiliates. Federal securities law limits the percentage of such “interested persons” who may serve on a trust’s board, and the trusts were in compliance with these limitations throughout the report period. The funds did not pay any of these interested persons for their services as trustees, but they did pay non-interested persons (independent trustees), as noted in each fund’s Statement of Operations. For information regarding the trustees, please refer to the Trustees and Officers table at the end of this report.
Schwab Target Funds | Annual Report123
Financial Notes (continued)
During the period, the funds were participants with other funds in the Fund Complex in a joint, syndicated, committed $1 billion line of credit (the Syndicated Credit Facility), which matured on September 28, 2023. On September 28, 2023, the Syndicated Credit Facility was amended to run for a new 364 day period with the line of credit amount remaining unchanged, maturing on September 26, 2024. Under the terms of the Syndicated Credit Facility, in addition to interest charged on any borrowings by a fund, each fund paid a commitment fee of 0.15% per annum on the funds’ proportionate share of the unused portion of the Syndicated Credit Facility.
During the period, the funds were participants with other funds in the Fund Complex in a joint, unsecured, uncommitted $400 million line of credit (the Uncommitted Credit Facility), with State Street Bank and Trust Company, which matured on September 28, 2023. On September 28, 2023, Uncommitted Credit Facility was amended to run for a new 364 day period with the line of credit amount remaining unchanged, maturing on September 26, 2024. Under the terms of the Uncommitted Credit Facility, each fund pays interest on the amount a fund borrows. There were no borrowings by any of the funds from either line of credit during the period.
The funds also have access to custodian overdraft facilities. A fund may have utilized the overdraft facility and incurred an interest expense, which is disclosed in each fund’s Statement of Operations, if any. The interest expense is determined based on a negotiated rate above the current Federal Funds Rate.
7. Purchases and Sales of Investment Securities:For the period ended October 31, 2023, purchases and sales of securities (excluding short-term obligations) were as follows:
124
Schwab Target Funds | Annual Report
Financial Notes (continued)
As of October 31, 2023, the tax basis cost of the funds’ investments and gross unrealized appreciation and depreciation were as follows:
| | GROSS UNREALIZED
APPRECIATION | GROSS UNREALIZED
DEPRECIATION | NET UNREALIZED
APPRECIATION
(DEPRECIATION) |
| | | | |
| | | | |
| | | | |
| | | | |
| | | | |
| | | | |
| | | | |
| | | | |
| | | | |
| | | | |
| | | | |
| | | | |
| | | | |
| | | | |
As of October 31, 2023, the components of distributable earnings on a tax basis were as follows:
| UNDISTRIBUTED
ORDINARY
INCOME | UNDISTRIBUTED
LONG-TERM
CAPITAL GAINS | NET UNREALIZED
APPRECIATION
(DEPRECIATION)
ON INVESTMENTS | |
| | | | |
| | | | |
| | | | |
| | | | |
| | | | |
| | | | |
| | | | |
| | | | |
| | | | |
| | | | |
| | | | |
| | | | |
The primary difference between book basis and tax basis unrealized appreciation or unrealized depreciation of investments is the tax deferral of losses on wash sales. The tax cost of the funds’ investments, disclosed above, have been adjusted from their book amounts to reflect these unrealized appreciation or depreciation differences, as applicable.
Schwab Target Funds | Annual Report125
Financial Notes (continued)
8. Federal Income Taxes (continued):
The tax basis components of distributions paid during the current and prior fiscal years were as follows:
| CURRENT FISCAL YEAR END DISTRIBUTIONS | PRIOR FISCAL YEAR END DISTRIBUTIONS |
| | | | |
| | | | |
| | | | |
| | | | |
| | | | |
| | | | |
| | | | |
| | | | |
| | | | |
| | | | |
| | | | |
| | | | |
| | | | |
Distributions paid to shareholders are based on net investment income and net realized gains determined on a tax basis, which may differ from net investment income and net realized gains for financial reporting purposes. These differences reflect the differing character of certain income items and net realized gains and losses for financial statement and tax purposes, and may result in reclassification among certain capital accounts in the financial statements. The funds may also designate a portion of the amount paid to redeeming shareholders as a distribution for tax purposes.
Permanent book and tax basis differences may result in reclassifications between components of net assets as required. The adjustments will have no impact on net assets or the results of operations.
As of October 31, 2023, management has reviewed the tax positions for open periods (for federal purposes, three years from the date of filing and for state purposes, four years from the date of filing) as applicable to the funds, and has determined that no provision for income tax is required in the funds’ financial statements. The funds recognize interest and penalties, if any, related to unrecognized tax benefits as income tax expense in each fund’s Statement of Operations. During the fiscal year ended October 31, 2023, the funds did not incur any interest or penalties.
9. Subsequent Events:Management has determined there are no subsequent events or transactions through the date the financial statements were issued that would have materially impacted the financial statements as presented.
126
Schwab Target Funds | Annual Report
Report of Independent Registered Public Accounting Firm
To the Board of Trustees of Schwab Capital Trust and Shareholders of Schwab Target 2010 Fund, Schwab Target 2015 Fund, Schwab Target 2020 Fund, Schwab Target 2025 Fund, Schwab Target 2030 Fund, Schwab Target 2035 Fund, Schwab Target 2040 Fund, Schwab Target 2045 Fund, Schwab Target 2050 Fund, Schwab Target 2055 Fund, Schwab Target 2060 Fund, and Schwab Target 2065 Fund:
Opinion on the Financial Statements and Financial Highlights
We have audited the accompanying statements of assets and liabilities, including the portfolio holdings, of Schwab Target 2010 Fund, Schwab Target 2015 Fund, Schwab Target 2020 Fund, Schwab Target 2025 Fund, Schwab Target 2030 Fund, Schwab Target 2035 Fund, Schwab Target 2040 Fund, Schwab Target 2045 Fund, Schwab Target 2050 Fund, Schwab Target 2055 Fund, Schwab Target 2060 Fund, and Schwab Target 2065 Fund (the “Funds”), twelve of the funds constituting Schwab Capital Trust, as of October 31, 2023, the related statements of operations for the year then ended, the statements of changes in net assets for each of the two years in the period then ended, the financial highlights for each of the four years in the period then ended (excluding Schwab Target 2065 Fund); the related statement of operations for the year then ended, the statements of changes in net assets for each of the two years in the period then ended, the financial highlights for each of the two years in the period then ended and for the period from February 26, 2021 (commencement of operations) through October 31, 2021 for Schwab Target 2065 Fund; and the related notes. In our opinion, the financial statements and financial highlights present fairly, in all material respects, the financial position of each of the Funds constituting the Schwab Capital Trust (excluding Schwab Target 2065 Fund) as of October 31, 2023, and the results of their operations for the year then ended, the changes in their net assets for each of the two years in the period then ended, and the financial highlights for each of the four years in the period then ended in conformity with accounting principles generally accepted in the United States of America. Also, in our opinion, the financial statements and financial highlights present fairly, in all material respects, the financial position of Schwab Target 2065 Fund as of October 31, 2023, and the results of its operations for the year then ended, the changes in net assets for each of the two years in the period then ended, and financial highlights for each of the two years in the period then ended and for the period from February 26, 2021 (commencement of operations) through October 31, 2021 in conformity with accounting principles generally accepted in the United States of America. For each of the Funds (excluding Schwab Target 2065 Fund), the financial highlights for the year ended October 31, 2019 were audited by other auditors, whose report, dated December 16, 2019, expressed an unqualified opinion on such financial highlights.
Basis for Opinion
These financial statements and financial highlights are the responsibility of the Funds’ management. Our responsibility is to express an opinion on the Funds’ financial statements and financial highlights based on our audits. We are a public accounting firm registered with the Public Company Accounting Oversight Board (United States) (PCAOB) and are required to be independent with respect to the Funds in accordance with the U.S. federal securities laws and the applicable rules and regulations of the Securities and Exchange Commission and the PCAOB.
We conducted our audits in accordance with the standards of the PCAOB. Those standards require that we plan and perform the audit to obtain reasonable assurance about whether the financial statements and financial highlights are free of material misstatement, whether due to error or fraud. The Funds are not required to have, nor were we engaged to perform, an audit of their internal control over financial reporting. As part of our audits, we are required to obtain an understanding of internal control over financial reporting but not for the purpose of expressing an opinion on the effectiveness of the Funds’ internal control over financial reporting. Accordingly, we express no such opinion.
Our audits included performing procedures to assess the risks of material misstatement of the financial statements and financial highlights, whether due to error or fraud, and performing procedures that respond to those risks. Such procedures included examining, on a test basis, evidence regarding the amounts and disclosures in the financial statements and financial highlights. Our audits also included evaluating the accounting principles used and significant estimates made by management, as well as evaluating the overall presentation of the financial statements and financial highlights. Our procedures included confirmation of securities owned as of October 31, 2023, by correspondence with the custodian and transfer agent. We believe that our audits provide a reasonable basis for our opinion.
Deloitte & Touche LLP
Denver, Colorado
December 15, 2023
We have served as the auditor of one or more investment companies in the Schwab Funds Complex since 2020.
Schwab Target Funds | Annual Report127
Other Federal Tax Information (unaudited)
The funds may elect to pass on the benefits of the foreign tax credit to their shareholders for the fiscal year ended October 31, 2023. The foreign tax credit and the foreign source income amounts are as follows:
For corporate shareholders, the following percentage of the funds’ dividend distributions paid during the fiscal year ended October 31, 2023, qualify for the corporate dividends received deduction:
For the fiscal year ended October 31, 2023, the funds designate the following amounts of the dividend distributions as qualified dividends for the purpose of the maximum rate under section 1(h)(11) of the Internal Revenue Code. Shareholders will be notified in January 2024 via IRS Form 1099 of the amount for use in preparing their 2023 income tax return.
128
Schwab Target Funds | Annual Report
Other Federal Tax Information (unaudited) (continued)
Under section 852(b)(3)(C) of the Internal Revenue Code, the funds hereby designate the following amounts as long-term capital gain dividends for the fiscal year ended October 31, 2023.
For the fiscal year ended October 31, 2023, the funds designate the following amounts as dividends eligible for the 20% qualified business income deduction under section 199A of the Internal Revenue Code. Shareholders will be notified in January 2024 via IRS Form 1099 of the amounts for use in preparing their 2023 income tax return.
For the fiscal year ended October 31, 2023, the funds designate the following percentage of dividend income as business interest income under section 163(j) of the Internal Revenue Code:
Schwab Target Funds | Annual Report129
Liquidity Risk Management Program (unaudited)
The funds have adopted and implemented a liquidity risk management program (the “program”) as required by Rule 22e-4 under the Investment Company Act of 1940, as amended. The funds’ Board of Trustees (the “Board”) has designated the funds’ investment adviser, Charles Schwab Investment Management, Inc., dba Schwab Asset Management, as the administrator of the program. Personnel of the investment adviser or its affiliates conduct the day-to-day operation of the program.
Under the program, the investment adviser manages a fund’s liquidity risk, which is the risk that the fund could not meet shareholder redemption requests without significant dilution of remaining shareholders’ interests in the fund. The program is reasonably designed to assess and manage a fund’s liquidity risk, taking into consideration the fund’s investment strategy and the liquidity of its portfolio investments during normal and reasonably foreseeable stressed conditions; its historical redemption history and shareholder concentrations; and its cash holdings and access to other funding sources, including the custodian overdraft facility and lines of credit. The investment adviser’s process of determining the degree of liquidity of each fund’s investments is supported by third-party liquidity assessment vendors.
The funds’ Board reviewed a report at its meeting held on September 19, 2023 prepared by the investment adviser regarding the operation and effectiveness of the program for the period June 1, 2022, through May 31, 2023, which included individual fund liquidity risk metrics. The report summarized the operation of the program and the information and factors considered by the investment adviser in assessing whether the program has been adequately and effectively implemented with respect to a fund. In addition, the investment adviser provided its assessment that the program had been operating effectively in managing each fund’s liquidity risk.
130
Schwab Target Funds | Annual Report
Investment Advisory Agreement Approval
The Investment Company Act of 1940, as amended (the 1940 Act), requires that the continuation of a fund’s investment advisory agreement must be specifically approved (1) by the vote of the trustees or by a vote of the shareholders of the fund, and (2) by the vote of a majority of the trustees who are not parties to the investment advisory agreement or “interested persons” of any party thereto (the Independent Trustees), cast in person at a meeting called for the purpose of voting on such approval. In connection with such approvals, the fund’s trustees must request and evaluate, and the investment adviser is required to furnish, such information as may be reasonably necessary to evaluate the terms of the investment advisory agreement.
The Board of Trustees (the Board or the Trustees, as appropriate) calls and holds one or more meetings each year that are dedicated, in whole or in part, to considering whether to renew the investment advisory and administration agreement (the Agreement) between Schwab Capital Trust (the Trust) and Charles Schwab Investment Management, Inc. (dba Schwab Asset Management) (the investment adviser) with respect to the existing funds in the Trust, including Schwab Target 2010 Fund, Schwab Target 2015 Fund, Schwab Target 2020 Fund, Schwab Target 2025 Fund, Schwab Target 2030 Fund, Schwab Target 2035 Fund, Schwab Target 2040 Fund, Schwab Target 2045 Fund, Schwab Target 2050 Fund, Schwab Target 2055 Fund, Schwab Target 2060 Fund and Schwab Target 2065 Fund (the Funds), and to review certain other agreements pursuant to which the investment adviser provides investment advisory services to certain other registered investment companies. In preparation for the meeting(s), the Board requests and reviews a wide variety of materials provided by the investment adviser, including information about the investment adviser’s affiliates, personnel, business goals and priorities, profitability, third-party oversight, corporate structure and operations. As part of the renewal process, the Independent Trustees’ legal counsel, on behalf of the Independent Trustees, sends an information request letter to the investment adviser seeking certain relevant information. The responses by the investment adviser are provided to the Trustees in the Board materials for their review prior to their meeting, and the Trustees are provided with the opportunity to request any additional materials. The Board also receives data provided by an independent provider of investment company data. This information is in addition to the detailed information about the Funds that the Board reviews during the course of each year, including information that relates to the Funds’ operations and performance, legal and compliance matters, risk management, portfolio turnover, and sales and marketing activity. In considering the renewal, the Independent Trustees receive advice from Independent Trustees’ legal counsel, including a memorandum regarding the responsibilities of trustees for the
approval of investment advisory agreements. In addition, the Independent Trustees participate in question and answer sessions with representatives of the investment adviser and meet in executive session outside the presence of Fund management.
The Board, including a majority of the Independent Trustees, considered information specifically relating to the continuance of the Agreement with respect to the Funds at meetings held on April 27, 2023 and June 7, 2023, and approved the renewal of the Agreement with respect to the Funds for an additional one-year term at the meeting on June 7, 2023 called for the purpose of voting on such approval.
The Board’s approval of the continuance of the Agreement with respect to the Funds was based on consideration and evaluation of a variety of specific factors discussed at these meetings and at prior meetings, including:
1.
the nature, extent and quality of the services provided to each Fund under the Agreement, including the resources of the investment adviser and its affiliates dedicated to the Funds;
2.
each Fund’s investment performance and how it compared to that of certain other comparable mutual funds and benchmark data;
3.
each Fund’s expenses and how those expenses compared to those of certain other similar mutual funds;
4.
the profitability of the investment adviser and its affiliates, including Charles Schwab & Co., Inc. (Schwab), with respect to each Fund, including both direct and indirect benefits accruing to the investment adviser and its affiliates; and
5.
the extent to which economies of scale would be realized as each Fund grows and whether fee levels in the Agreement reflect those economies of scale for the benefit of Fund investors.
Nature, Extent and Quality of Services. The Board considered the nature, extent and quality of the services provided by the investment adviser to the Funds and the resources of the investment adviser and its affiliates dedicated to the Funds. In this regard, the Trustees evaluated, among other things, the investment adviser’s experience, track record, compliance program, resources dedicated to hiring and retaining skilled personnel and specialized talent, and information security resources. The Trustees also considered information provided by the investment adviser relating to services and support provided with respect to each Fund’s portfolio management team, portfolio strategy, and internal investment guidelines, as well as trading infrastructure, liquidity management, product design and analysis, shareholder communications, securities valuation, and vendor and risk oversight. The Trustees also
Schwab Target Funds | Annual Report131
considered investments the investment adviser has made in its infrastructure, including modernizing the investment adviser’s technology and use of data, increasing expertise in key areas (including portfolio management and trade operations), and improving business continuity, cybersecurity, due diligence, risk management processes, and information security programs, which are designed to provide enhanced services to the Funds and their shareholders. The Trustees considered Schwab’s overall financial condition and its reputation as a full service brokerage firm, as well as the wide range of products, services and account features that benefit Fund shareholders who are brokerage clients of Schwab. Following such evaluation, the Board concluded, within the context of its full deliberations, that the nature, extent and quality of services provided by the investment adviser to the Funds and the resources of the investment adviser and its affiliates dedicated to the Funds supported renewal of the Agreement with respect to the Funds.
Fund Performance. The Board considered each Fund’s performance in determining whether to renew the Agreement with respect to such Fund. Specifically, the Trustees considered each Fund’s performance relative to a peer category of other mutual funds and applicable indices/benchmarks, in light of total return and the market environment, as well as in consideration of each Fund’s investment style and strategy. As part of this review, the Trustees considered the composition of the peer category, selection criteria and the reputation of the independent provider of investment company data who prepared the peer category analysis. In evaluating the performance of each Fund, the Trustees considered the risk profile for such Fund and the appropriateness of the benchmark used to compare the performance of each Fund. The Trustees further considered the level of Fund performance in the context of their review of Fund expenses and the investment adviser’s profitability discussed below and also noted that the Board and a designated committee of the Board review performance throughout the year. Although Schwab Target 2015 Fund, Schwab Target 2035 Fund, Schwab Target 2040 Fund, Schwab Target 2045 Fund, Schwab Target 2050 Fund, Schwab Target 2055 Fund, and Schwab Target 2060 Fund each had performance that ranked in the fourth quartile of a relevant peer group for more than one performance period considered, the Board concluded that other factors relevant to performance supported renewal of the Agreement with respect to each Fund, including that the underperformance was attributable, to a significant extent, to investment decisions by the investment adviser that were reasonable and consistent with each Fund’s investment objective and policies and that the investment adviser had taken steps designed to help improve performance. Following such evaluation, the Board concluded, within the context of its full deliberations, that the performance of each Fund supported renewal of the Agreement with respect to such Fund.
Fund Expenses. With respect to each Fund’s expenses, the Trustees considered the rate of compensation called for by the Agreement and each Fund’s operating expense ratio, in each case, in comparison to those of other similar mutual funds, such peer groups and comparisons having been selected and calculated by an independent provider of investment company data. The investment adviser reported to the Board, and the Board took into account, the risk assumed by the investment adviser in the development of the Funds and provision of services as well as the competitive marketplace for financial products. The Trustees considered the effects of the investment adviser’s and Schwab’s practice of waiving certain fees to prevent total annual operating expenses of each Fund from exceeding a specified cap. The Trustees also considered the investment adviser’s contractual commitment to limit the total annual operating expenses of each Fund for so long as it serves as the adviser to the Fund. The Trustees also considered fees charged by the investment adviser to other mutual funds and to other types of accounts, but, with respect to such other types of accounts, accorded less weight to such comparisons due to the different legal, regulatory, compliance and operating features of mutual funds as compared to these other types of accounts, and any differences in the nature and scope of the services the investment adviser provides to these other accounts, and any differences in the market for these types of accounts. The Trustees noted that shareholders of the Funds indirectly pay their pro rata share of the fees and expenses of the underlying funds in which the Funds invest. Following such evaluation, the Board concluded, within the context of its full deliberations, that the expenses of each Fund are reasonable and supported renewal of the Agreement with respect to such Fund.
Profitability. The Trustees considered the compensation flowing to the investment adviser and its affiliates, directly or indirectly and reviewed profitability on a pre-tax basis, without regard to distribution expenses. The Trustees reviewed the profitability of the investment adviser relating to the Schwab fund complex as a whole, noting the benefits to Fund shareholders of being part of the Schwab fund complex, including the allocations of certain costs across the Funds and other funds in the complex. The Trustees also considered any other benefits derived by the investment adviser from its relationship with the Funds, such as whether, by virtue of its management of the Funds, the investment adviser obtains investment information or other research resources that aid it in providing advisory services to other clients. Also, because each Fund invests a portion of its assets in other funds within the Schwab fund complex, the Trustees considered the indirect benefits to the investment adviser from such Fund’s investments in other underlying funds managed by the investment adviser. The Trustees considered whether the compensation and profitability with respect to the Funds under the Agreement and other service agreements were reasonable in light of the quality of all services rendered to the Funds by the investment adviser and its affiliates. The Trustees noted that the investment adviser continues to invest substantial
132
Schwab Target Funds | Annual Report
sums in its business in order to provide enhanced research capabilities, services and systems to benefit the Funds. Based on this evaluation, the Board concluded, within the context of its full deliberations, that the profitability of the investment adviser with respect to each Fund is reasonable and supported renewal of the Agreement with respect to such Fund.
Economies of Scale. Although the Trustees recognized the difficulty of determining economies of scale with precision, the Trustees considered the potential existence of any economies of scale and whether those are passed along to a Fund’s shareholders through (i) the enhancement of services provided to the Funds in return for fees paid, including through investments by the investment adviser in its infrastructure, including modernizing the investment adviser’s technology and use of data, increasing expertise and capabilities in key areas (including portfolio and trade operations), and improving business continuity, cybersecurity, due diligence and information security programs, which are designed to provide enhanced services to the Funds and their shareholders; and (ii) pricing a fund to scale and keeping overall expenses down as the fund grows. The Trustees acknowledged that the investment adviser has invested in its infrastructure, as discussed above, over time and that the investment adviser’s internal costs of providing investment management,
technology, administrative, legal and compliance services to the Funds continue to increase as a result of regulatory or other developments. The Trustees considered that the investment adviser and its affiliates employ contractual expense caps to protect shareholders from higher fees, including for example, when fund assets are relatively small. Based on this evaluation, the Board concluded, within the context of its full deliberations, that each Fund obtains reasonable benefits from economies of scale.
* * * * * * * * * * * * * * * * * * * * * * * * * * * * * * * * * * * * * * * *
In the course of their deliberations, the Trustees may have accorded different weights to various factors and did not identify any particular information or factor that was all important or controlling. Based on the Trustees’ deliberation and their evaluation of the information described above, the Board, including all of the Independent Trustees, approved the continuation of the Agreement with respect to the Funds and concluded that the compensation under the Agreement with respect to the Funds is fair and reasonable in light of the services provided and the related expenses borne by the investment adviser and its affiliates and such other matters as the Trustees considered to be relevant in the exercise of their reasonable judgment.
Schwab Target Funds | Annual Report133
Trustees and Officers
The tables below give information about the trustees and officers of Schwab Capital Trust, which includes the funds covered in this report. The “Fund Complex” includes The Charles Schwab Family of Funds, Schwab Capital Trust, Schwab Investments, Schwab Annuity Portfolios, Schwab Strategic Trust and Laudus Trust. The Fund Complex includes 106 funds.
The address for all trustees and officers is 211 Main Street, San Francisco, CA 94105. You can find more information about the trustees and officers in the funds’ Statement of Additional Information, which is available free by calling 1-877-824-5615.
|
Name, Year of Birth, and Position(s) with the trust (Terms of office, and length of Time Served1) | Principal Occupations During the Past Five Years | Number of Portfolios in Fund Complex Overseen by the Trustee | |
Michael J. Beer 1961 Trustee (Trustee of The Charles Schwab Family of Funds, Schwab Investments, Schwab Capital Trust, Schwab Annuity Portfolios, Schwab Strategic Trust and Laudus Trust since 2022) | Retired. Director, President and Chief Executive Officer (Dec. 2016 – Sept. 2019), Principal Funds (investment management). | | Director (2016 – 2019), Principal Funds, Inc. |
Robert W. Burns 1959 Trustee (Trustee of Schwab Strategic Trust since 2009; The Charles Schwab Family of Funds, Schwab Investments, Schwab Capital Trust, Schwab Annuity Portfolios and Laudus Trust since 2016) | Retired/Private Investor. | | |
Nancy F. Heller 1956 Trustee (Trustee of The Charles Schwab Family of Funds, Schwab Investments, Schwab Capital Trust, Schwab Annuity Portfolios, Schwab Strategic Trust and Laudus Trust since 2018) | | | |
David L. Mahoney 1954 Trustee (Trustee of The Charles Schwab Family of Funds, Schwab Investments, Schwab Capital Trust, Schwab Annuity Portfolios and Laudus Trust since 2011; Schwab Strategic Trust since 2016) | | | Director (2004 – present), Corcept Therapeutics Incorporated Director (2009 – 2021), Adamas Pharmaceuticals, Inc. Director (2003 – 2019), Symantec Corporation |
Jane P. Moncreiff 1961 Trustee (Trustee of The Charles Schwab Family of Funds, Schwab Investments, Schwab Capital Trust, Schwab Annuity Portfolios, Schwab Strategic Trust and Laudus Trust since 2019) | Consultant (2018 – present), Fulham Advisers LLC (management consulting); Chief Investment Officer (2009 – 2017), CareGroup Healthcare System, Inc. (healthcare). | | |
134
Schwab Target Funds | Annual Report
Independent Trustees (continued) |
Name, Year of Birth, and Position(s) with the trust (Terms of office, and length of Time Served1) | Principal Occupations During the Past Five Years | Number of Portfolios in Fund Complex Overseen by the Trustee | |
Kimberly S. Patmore 1956 Trustee (Trustee of The Charles Schwab Family of Funds, Schwab Investments, Schwab Capital Trust, Schwab Annuity Portfolios, Schwab Strategic Trust and Laudus Trust since 2016) | Consultant (2008 – present), Patmore Management Consulting (management consulting). | | |
J. Derek Penn 1957 Trustee (Trustee of The Charles Schwab Family of Funds, Schwab Investments, Schwab Capital Trust, Schwab Annuity Portfolios, Schwab Strategic Trust and Laudus Trust since 2021) | Head of Equity Sales and Trading (2006 – 2018), BNY Mellon (financial services). | | |
|
Name, Year of Birth, and Position(s) with the trust (Terms of office, and length of Time Served1) | Principal Occupations During the Past Five Years | Number of Portfolios in Fund Complex Overseen by the Trustee | |
Walter W. Bettinger II2 1960 Chairman and Trustee (Trustee of The Charles Schwab Family of Funds, Schwab Investments, Schwab Capital Trust and Schwab Annuity Portfolios since 2008; Schwab Strategic Trust since 2009; Laudus Trust since 2010) | Co-Chairman of the Board (July 2022 – present), Director and Chief Executive Officer (Oct. 2008 – present) and President (Feb. 2007 – Oct. 2021), The Charles Schwab Corporation; President and Chief Executive Officer (Oct. 2008 – Oct. 2021) and Director (May 2008 – Oct. 2021), Charles Schwab & Co., Inc.; Co-Chairman of the Board (July 2022 – present) and Director (Apr. 2006 – present), Charles Schwab Bank, SSB; Co-Chairman of the Board (July 2022 – present) and Director (Nov. 2017 – present), Charles Schwab Premier Bank, SSB; Co-Chairman of the Board (July 2022 – present) and Director (July 2019 – present), Charles Schwab Trust Bank; Director (May 2008 – present), Chief Executive Officer (Aug. 2017 – present) and President (Aug. 2017 – Nov. 2021), Schwab Holdings, Inc.; Manager (Sept. 2023 – present), TD Ameritrade Holding LLC; Director (Oct. 2020 – Aug. 2023), TD Ameritrade Holding Corporation; Director (July 2016 – Oct. 2021), Charles Schwab Investment Management, Inc. | | Director (2008 – present), The Charles Schwab Corporation |
Richard A. Wurster2 1973 Trustee (Trustee of The Charles Schwab Family of Funds, Schwab Investments, Schwab Capital Trust, Schwab Annuity Portfolios, Schwab Strategic Trust and Laudus Trust since 2022) | President (Oct. 2021 – present) and Executive Vice President – Schwab Asset Management Solutions (Apr. 2019 – Oct. 2021), The Charles Schwab Corporation; President, Director (Oct. 2021 – present), Executive Vice President – Schwab Asset Management Solutions (July 2019 – Oct. 2021) and Senior Vice President – Advisory (May 2016 – July 2019), Charles Schwab & Co., Inc.; President (Nov. 2021 – present), Schwab Holdings, Inc.; Director (Oct. 2021 – present) and Chief Executive Officer (Nov. 2019 – Jan. 2022), Charles Schwab Investment Management, Inc.; Director, Chief Executive Officer and President (Mar. 2018 – Oct. 2022), Charles Schwab Investment Advisory, Inc.; Chief Executive Officer (July 2016 – Apr. 2018) and President (Mar. 2017 – Apr. 2018), ThomasPartners, Inc.; Chief Executive Officer (July 2016 – Apr. 2018), Windhaven Investment Management, Inc. | | |
Schwab Target Funds | Annual Report135
|
Name, Year of Birth, and Position(s) with the trust (Terms of office, and length of Time Served3) | Principal Occupations During the Past Five Years |
Omar Aguilar 1970 Chief Executive Officer, President and Chief Investment Officer (Officer of The Charles Schwab Family of Funds, Schwab Investments, Schwab Capital Trust, Schwab Annuity Portfolios, Schwab Strategic Trust and Laudus Trust since 2011) | Chief Executive Officer (Jan. 2022 – present), President (Oct. 2023 – present), (Chief Investment Officer (Apr. 2011 – present) and Senior Vice President (Apr. 2011 – Jan. 2022), Charles Schwab Investment Management, Inc.; Director, Chief Executive Officer and President (Oct. 2022 – present), Charles Schwab Investment Advisory, Inc.; Chief Executive Officer (Sept. 2023 – present), President (Oct. 2023 – present), Chief Investment Officer (June 2011 – present) and Vice President (June 2011 – Sept. 2023), Schwab Funds, Laudus Trust and Schwab ETFs. |
Mark Fischer 1970 Chief Operating Officer (Officer of The Charles Schwab Family of Funds, Schwab Investments, Schwab Capital Trust, Schwab Annuity Portfolios, Schwab Strategic Trust and Laudus Trust since 2013) | Chief Operating Officer (Dec. 2020 – present) and Treasurer and Chief Financial Officer (Jan. 2016 – Dec. 2022), Schwab Funds, Laudus Trust and Schwab ETFs; Chief Financial Officer (Mar. 2020 – present), Chief Operating Officer (Oct. 2023 – present), Managing Director (Mar. 2023 – present) and Vice President (Oct. 2013 – Mar. 2023), Charles Schwab Investment Management, Inc. |
Dana Smith 1965 Treasurer and Chief Financial Officer (Officer of The Charles Schwab Family of Funds, Schwab Investments, Schwab Capital Trust, Schwab Annuity Portfolios, Schwab Strategic Trust and Laudus Trust since 2023) | Treasurer and Chief Financial Officer (Jan. 2023 – present) and Assistant Treasurer (Dec. 2015 – Dec. 2022), Schwab Funds, Laudus Trust and Schwab ETFs; Managing Director (Mar. 2023 – present), Vice President (Mar. 2022 – Mar. 2023) and Director (Oct. 2015 – Mar. 2022), Charles Schwab Investment Management, Inc.; Managing Director (May 2022 – present) and Vice President (Apr. 2022 – May 2022), Charles Schwab & Co., Inc. |
Patrick Cassidy 1964 Vice President and Chief Investment Officer (Officer of The Charles Schwab Family of Funds, Schwab Investments, Schwab Capital Trust, Schwab Annuity Portfolios, Schwab Strategic Trust and Laudus Trust since 2018) | Chief Investment Officer (Oct. 2023 – present) and Vice President (Feb. 2018 – present), Schwab Funds, Laudus Trust and Schwab ETFs; Managing Director (Mar. 2023 – present), Chief Investment Officer (Oct. 2023 – present), and Senior Vice President (Oct. 2012 – Mar. 2023), Charles Schwab Investment Management, Inc. |
William P. McMahon, Jr. 1972 Vice President and Chief Investment Officer (Officer of The Charles Schwab Family of Funds, Schwab Investments, Schwab Capital Trust, Schwab Annuity Portfolios, Schwab Strategic Trust and Laudus Trust since 2021) | Managing Director (Mar. 2023 – present), Senior Vice President (Jan. 2020 – Mar. 2023) and Chief Investment Officer (Jan. 2020 – present) Charles Schwab Investment Management, Inc.; Vice President and Chief Investment Officer (June 2021 – present), Schwab Funds, Laudus Trust and Schwab ETFs; Senior Vice President and Chief Investment Officer – ThomasPartners Strategies (Apr. 2018 – Dec. 2019), Charles Schwab Investment Advisory, Inc.; Senior Vice President and Chief Investment Officer (May 2001 – Apr. 2018), ThomasPartners, Inc. |
Catherine MacGregor 1964 Chief Legal Officer and Secretary, Schwab Funds and Schwab ETFs Chief Legal Officer, Vice President and Clerk, Laudus Trust (Officer of The Charles Schwab Family of Funds, Schwab Investments, Schwab Capital Trust, Schwab Annuity Portfolios and Laudus Trust since 2005; Schwab Strategic Trust since 2009) | Chief Legal Officer (Mar. 2022 – present), Managing Director (Mar. 2023 – present) and Vice President (Sept. 2005 – Mar. 2023), Charles Schwab Investment Management, Inc.; Managing Director (May 2022 – present) and Vice President (Aug. 2005 – May 2022), Charles Schwab & Co., Inc.; Vice President (Dec. 2005 – present) and Chief Legal Officer and Clerk (Mar. 2007 – present), Laudus Trust; Chief Legal Officer and Secretary (Oct. 2021 – present), Vice President (Nov. 2005 – Oct. 2021) and Assistant Secretary (June 2007 – Oct. 2021), Schwab Funds; Chief Legal Officer and Secretary (Oct. 2021 – present), Vice President and Assistant Secretary (Oct. 2009 – Oct. 2021), Schwab ETFs. |
1
Each Trustee shall hold office until the election and qualification of his or her successor, or until he or she dies, resigns or is removed. The retirement policy requires that each independent trustee retire by December 31 of the year in which the Trustee turns 74 or the Trustee’s twentieth year of service as an independent trustee on any trust in the Fund Complex, whichever occurs first.
2
Mr. Bettinger and Mr. Wurster are Interested Trustees. Mr. Bettinger and Mr. Wurster are Interested Trustees because each owns stock of The Charles Schwab Corporation (CSC), the parent company of Charles Schwab Investment Management, Inc., the investment adviser for the trusts in the Fund Complex, and is an employee of Charles Schwab & Co., Inc. (Schwab), the principal underwriter for The Charles Schwab Family of Funds, Schwab Investments, Schwab Capital Trust, Schwab Annuity Portfolios and Laudus Trust.
3
The President, Treasurer and Secretary/Clerk hold office until their respective successors are chosen and qualified or until he or she sooner dies, resigns, is removed or becomes disqualified. Each of the other officers serves at the pleasure of the Board.
136
Schwab Target Funds | Annual Report
asset allocation The practice of dividing a portfolio among different asset classes, with each asset class assigned a particular percentage.
asset class A group of securities with similar structure and basic characteristics. Stocks, bonds and cash are the three main examples of asset classes.
Bloomberg US Aggregate Bond Index An index that is a broad-based benchmark measuring the performance of the U.S. investment grade, taxable bond market, including U.S. Treasuries, government-related and corporate bonds, mortgage pass-through securities, commercial mortgage-backed securities, and asset-backed securities that are publicly available for sale in the United States. To be eligible for inclusion in the index, securities must be fixed rate, non-convertible, U.S. dollar-denominated with at least $300 million or more of outstanding face value and have one or more years remaining to maturity. The index excludes certain types of securities, including tax-exempt state and local government series bonds, structured notes embedded with swaps or other special features, private placements, floating rate securities, inflation-linked bonds and Eurobonds. The index is market capitalization weighted and the securities in the index are updated on the last business day of each month.
Bloomberg US Government/Credit 1–5 Year Index An index that is a broad-based benchmark measuring the performance of U.S. dollar-denominated U.S. Treasury bonds, government related bonds (i.e., U.S. and non-U.S. agencies, sovereign, quasi-sovereign, supranational and local authority debt) and investment grade U.S. corporate bonds that have a remaining maturity of greater than or equal to one year and less than five years. To be eligible for inclusion in the index, securities must be fixed rate, non-convertible, U.S. dollar-denominated with at least $300 million or more of outstanding face value and have a remaining maturity greater than or equal to one year and less than five years. The index excludes certain types of securities, including, bonds with equity type features (e.g., warrants, convertibles and preferreds), tax-exempt municipal securities, inflation-linked bonds, floating rate issues, strips, private placements, U.S. dollar-denominated 25 and 50 par retail bonds, structured notes and pass-through certificates. The index is market capitalization weighted and the securities in the index are updated on the last business day of each month.
Bloomberg US Treasury Bills 1–3 Month Index An index that includes all publicly issued zero-coupon U.S. Treasury Bills that have a remaining maturity of less than 3 months but more than 1 month, are rated investment grade and have $300 million or more of outstanding face value. It excludes zero-coupon STRIPS.
Bloomberg US Treasury Inflation-Linked Bond Index (Series-L) An index which includes all publicly-issued U.S. Treasury Inflation-Protected Securities (TIPS) that have at least one year remaining to maturity, are rated investment grade and have $500 million or more of outstanding face value. The TIPS in the index must be denominated in U.S. dollars and must be fixed-rate and non-convertible. The index is market capitalization weighted and the TIPS in the index are updated on the last business day of each month. TIPS are publicly issued, dollar denominated U.S. Government securities issued by the U.S. Treasury that have principal and interest payments linked to an official inflation measure (as measured by the Consumer Price Index, or CPI) and their payments are supported by the full faith and credit of the United States.
bond A security representing a loan from the investor to the issuer. A bond typically pays interest at a fixed rate (the coupon rate) until a specified date (the maturity date), at which time the issuer returns the money borrowed (principal or face value) to the bondholder. Because of their structure, bonds are sometimes called “fixed-income securities” or “debt securities.”
An individual bond is subject to the credit risk of the issuer. Changes in interest rates can affect a bond’s market value prior to call or maturity. There is no guarantee that a bond’s yield to call or maturity will provide a positive return over the rate of inflation.
bond fund A bond fund is subject to the same credit, interest rate, and inflation risks as bonds. In addition, a bond fund incurs ongoing fees and expenses. A bond fund’s net asset value will fluctuate with the price of the underlying bonds and the portfolio turnover activity; return of principal is not guaranteed.
cap, capitalization See “market cap.”
capital gain, capital loss the difference between the amount paid for an investment and its value at a later time. If the investment has been sold, the capital gain or loss is considered a realized gain or loss. If the investment is still held, the capital gain or loss is considered unrealized appreciation or depreciation.
Dow Jones U.S. Total Stock Market Index An index which includes all U.S. equity issues with readily available prices. The index is a float-adjusted market capitalization weighted index that reflects the shares of securities actually available to investors in the marketplace.
expense ratio The amount that is taken from a mutual fund’s assets each year to cover the fund’s operating expenses. An expense ratio of 0.50% means that a fund’s expenses amount to half of one percent of its average net assets a year.
FTSE EPRA Nareit Global Index (Net) An index that provides a diverse representation of publicly traded equity real estate investment trusts (REITs) and listed property companies worldwide. The index constituents are free-float adjusted, and screened on liquidity, size and revenue. The index is comprised of countries in developed and emerging markets. The Net of Tax Index is calculated based on the maximum withholding tax rates applicable to dividends received by institutional investors who are not resident in the same country as the remitting company and who do not benefit from double taxation treaties.
FTSE non-US Dollar World Government Bond Index A market capitalization index that measures the total rate of return performance for the government bonds of 22 countries, excluding the U.S., with a remaining maturity of at least 1 year.
market cap, market capitalization The value of a company as determined by the total value of all shares of its stock outstanding.
MSCI EAFE Index (Net) A free float-adjusted market capitalization index that is designed to measure the equity market performance of developed markets in Europe, Australasia, and the Far East. The Net version of the index reflects reinvested dividends net of withholding taxes, but reflects no deductions for expenses or other taxes; returns are calculated applying dividend withholding rates applicable to non-resident persons who do not benefit from double taxation treaties.
Schwab Target Funds | Annual Report137
MSCI Emerging Markets Index (Net) A free float-adjusted market capitalization weighted index that is designed to measure equity market performance in the global emerging markets. This series approximates the minimum possible dividend reinvestment. The returns are calculated applying dividend withholding rates applicable to non-resident persons who do not benefit from double taxation treaties.
net asset value (NAV) The value of one share of a mutual fund. NAV is calculated by taking the fund’s total assets, subtracting liabilities, and dividing by the number of shares outstanding.
outstanding shares, shares outstanding When speaking of a company or mutual fund, indicates all shares currently held by investors.
Russell 1000 Growth Index An index that measures the performance of those Russell 1000 Index companies with higher price-to-book ratios and higher forecasted growth values.
Russell 1000 Index An index that measures the performance of the 1,000 largest companies in the Russell 3000 Index, and represents approximately 92% of the total market capitalization of the Russell 3000 Index. The Russell 3000 Index measures the performance of the largest 3,000 U.S. companies representing approximately 98% of the investable U.S. equity market.
Russell 1000 Value Index An index that measures the performance of the large-cap value segment of the U.S. equity universe. It includes those Russell 1000 Index companies with lower price-to-book ratios and lower expected growth values.
Russell 2000 Index An index that measures the performance of the 2,000 smallest companies in the Russell 3000 Index. The Russell 3000 Index measures the performance of the largest 3,000 U.S. companies representing approximately 98% of the investable U.S. equity market.
Russell Midcap Index An index that measures the performance of the mid-cap segment of the U.S. equity universe. The Russell Midcap Index is a subset of the Russell 1000 Index. It includes approximately 800 of the smallest securities based on a combination of their market cap and current index membership.
S&P 500 Index An index that is designed to measure the performance of 500 leading publicly traded companies from a broad range of industries.
stock A share of ownership, or equity, in the issuing company.
Target 2010 Composite Index A custom blended index developed by Schwab Asset Management based on the 2010 fund’s asset allocation glide schedule and will become more conservative as time elapses. Effective March 1, 2014, the Dow Jones U.S. Total Stock Market Index was replaced by a combination of the S&P 500 Index and the Russell 2000 Index. Effective August 24, 2018, the FTSE non-US Dollar World Government Bond Index was replaced by the Bloomberg Global Aggregate ex-US Hedged Index. Effective February 1, 2023, the composite is derived using the following portion allocations: 23.0% S&P 500 Index, 1.2% Russell Midcap Index, 1.8% Russell 2000 Index, 7.9% MSCI EAFE Index (Net), 41.3% Bloomberg US Aggregate Bond Index, 2.6% FTSE EPRA Nareit Global Index (Net), 6.7% Bloomberg US Treasury Inflation-Linked Bond Index (Series-L), 2.1% Bloomberg Global Aggregate ex-US Hedged Index, 0.8% Bloomberg US Government/Credit Index, 8.0% Bloomberg US Government/Credit 1-5 Year Index, and 4.6% Bloomberg US Treasury Bills 1-3 Month Index. The components that make up the composite index may vary over time. The composite index represents target allocations for 2023. Percentages listed may not total to 100% due to rounding.
Target 2015 Composite Index A custom blended index developed by Schwab Asset Management based on the 2015 fund’s asset allocation glide schedule and will become more conservative as time elapses. Effective March 1, 2014, the Dow Jones U.S. Total Stock Market Index
was replaced by a combination of the S&P 500 Index and the Russell 2000 Index. Effective August 24, 2018, the FTSE non-US Dollar World Government Bond Index was replaced by the Bloomberg Global Aggregate ex-US Hedged Index. Effective February 1, 2023, the composite is derived using the following portion allocations: 25.1% S&P 500 Index, 1.4% Russell Midcap Index, 2.0% Russell 2000 Index, 9.0% MSCI EAFE Index (Net), 38.5% Bloomberg US Aggregate Bond Index, 2.8% FTSE EPRA Nareit Global Index (Net), 6.3% Bloomberg US Treasury Inflation-Linked Bond Index (Series-L), 2.2% Bloomberg Global Aggregate ex-US Hedged Index, 1.1% Bloomberg US Government/Credit Index, 7.4% Bloomberg US Government/Credit 1-5 Year Index, and 4.2% Bloomberg US Treasury Bills 1-3 Month Index. The components that make up the composite index may vary over time. The composite index represents target allocations for 2023. Percentages listed may not total to 100% due to rounding.
Target 2020 Composite Index A custom blended index developed by Schwab Asset Management based on the 2020 fund’s asset allocation glide schedule and will become more conservative as time elapses. Effective March 1, 2014, the Dow Jones U.S. Total Stock Market Index was replaced by a combination of the S&P 500 Index and the Russell 2000 Index. Effective August 24, 2018, the FTSE non-US Dollar World Government Bond Index was replaced by the Bloomberg Global Aggregate ex-US Hedged Index. Effective February 1, 2023, the composite is derived using the following portion allocations: 26.4% S&P 500 Index, 1.5% Russell Midcap Index, 2.1% Russell 2000 Index, 9.9% MSCI EAFE Index (Net), 36.7% Bloomberg US Aggregate Bond Index, 3.0% FTSE EPRA Nareit Global Index (Net), 6.1% Bloomberg US Treasury Inflation-Linked Bond Index (Series-L), 2.2% Bloomberg Global Aggregate ex-US Hedged Index, 1.3% Bloomberg US Government/Credit Index, 7.0% Bloomberg US Government/Credit 1-5 Year Index, and 3.8% Bloomberg US Treasury Bills 1-3 Month Index. The components that make up the composite index may vary over time. The composite index represents target allocations for 2023. Percentages listed may not total to 100% due to rounding.
Target 2025 Composite Index A custom blended index developed by Schwab Asset Management based on the 2025 fund’s asset allocation glide schedule and will become more conservative as time elapses. Effective March 1, 2014, the Dow Jones U.S. Total Stock Market Index was replaced by a combination of the S&P 500 Index and the Russell 2000® Index. Effective August 24, 2018, the FTSE non-US Dollar World Government Bond Index was replaced by the Bloomberg Global Aggregate ex-US Hedged Index. Effective February 1, 2023, the composite is derived using the following portion allocations: 29.8% S&P 500 Index, 1.4% Russell Midcap Index, 2.6% Russell 2000 Index, 12.8% MSCI EAFE Index (Net), 31.2% Bloomberg US Aggregate Bond Index, 3.5% FTSE EPRA Nareit Global Index (Net), 0.3% MSCI Emerging Markets Index (Net), 4.2% Bloomberg US Treasury Inflation-Linked Bond Index (Series-L), 3.1% Bloomberg Global Aggregate ex-US Hedged Index, 1.8% Bloomberg US Government/Credit Index, 5.8% Bloomberg US Government/Credit 1-5 Year Index, and 3.3% Bloomberg US Treasury Bills 1-3 Month Index. The components that make up the composite index may vary over time. The composite index represents target allocations for 2023. Percentages listed may not total to 100% due to rounding.
Target 2030 Composite Index A custom blended index developed by Schwab Asset Management based on the 2030 fund’s asset allocation glide schedule and will become more conservative as time elapses. Effective March 1, 2014, the Dow Jones U.S. Total Stock Market Index was replaced by a combination of the S&P 500 Index and the Russell 2000 Index. Effective August 24, 2018, the FTSE non-US Dollar World Government Bond Index was replaced by the Bloomberg Global Aggregate ex-US Hedged Index. Effective February 1, 2023, the composite is derived using the following portion allocations: 36.1% S&P 500 Index, 1.6% Russell Midcap Index, 3.8% Russell 2000 Index, 16.5% MSCI EAFE Index (Net), 22.0% Bloomberg US Aggregate Bond Index,
138
Schwab Target Funds | Annual Report
4.4% FTSE EPRA Nareit Global Index (Net), 1.1% MSCI Emerging Markets Index (Net), 1.4% Bloomberg US Treasury Inflation-Linked Bond Index (Series-L), 4.1% Bloomberg Global Aggregate ex-US Hedged Index, 2.6% Bloomberg US Government/Credit Index, 3.9% Bloomberg US Government/Credit 1-5 Year Index, and 2.5% Bloomberg US Treasury Bills 1-3 Month Index. The components that make up the composite index may vary over time. The composite index represents target allocations for 2023. Percentages listed may not total to 100% due to rounding.
Target 2035 Composite Index A custom blended index developed by Schwab Asset Management based on the 2035 fund’s asset allocation glide schedule and will become more conservative as time elapses. Effective March 1, 2014, the Dow Jones U.S. Total Stock Market Index was replaced by a combination of the S&P 500 Index and the Russell 2000 Index. Effective August 24, 2018, the FTSE non-US Dollar World Government Bond Index was replaced by the Bloomberg Global Aggregate ex-US Hedged Index. Effective February 1, 2023, the composite is derived using the following portion allocations: 40.4% S&P 500 Index, 1.7% Russell Midcap Index, 4.7% Russell 2000 Index, 19.2% MSCI EAFE Index (Net), 15.6% Bloomberg US Aggregate Bond Index, 5.1% FTSE EPRA Nareit Global Index (Net), 2.0% MSCI Emerging Markets Index (Net), 3.8% Bloomberg Global Aggregate ex-US Hedged Index, 2.9% Bloomberg US Government/Credit Index, 2.7% Bloomberg US Government/Credit 1-5 Year Index, and 1.9% Bloomberg US Treasury Bills 1-3 Month Index. The components that make up the composite index may vary over time. The composite index represents target allocations for 2023. Percentages listed may not total to 100% due to rounding.
Target 2040 Composite Index A custom blended index developed by Schwab Asset Management based on the 2040 fund’s asset allocation glide schedule and will become more conservative as time elapses. Effective March 1, 2014, the Dow Jones U.S. Total Stock Market Index was replaced by a combination of the S&P 500 Index and the Russell 2000 Index. Effective August 24, 2018, the FTSE non-US Dollar World Government Bond Index was replaced by the Bloomberg Global Aggregate ex-US Hedged Index. Effective February 1, 2023, the composite is derived using the following portion allocations: 43.6% S&P 500 Index, 1.8% Russell Midcap Index, 5.6% Russell 2000 Index, 21.4% MSCI EAFE Index (Net), 10.4% Bloomberg US Aggregate Bond Index, 5.7% FTSE EPRA Nareit Global Index (Net), 2.9% MSCI Emerging Markets Index (Net), 2.8% Bloomberg Global Aggregate ex-US Hedged Index, 2.8% Bloomberg US Government/Credit Index, 1.8% Bloomberg US Government/Credit 1-5 Year Index, and 1.4% Bloomberg US Treasury Bills 1-3 Month Index. The components that make up the composite index may vary over time. The composite index represents target allocations for 2023. Percentages listed may not total to 100% due to rounding.
Target 2045 Composite Index A custom blended index developed by Schwab Asset Management based on the 2045 fund’s asset allocation glide schedule and will become more conservative as time elapses. Effective March 1, 2014, the Dow Jones U.S. Total Stock Market Index was replaced by a combination of the S&P 500 Index and the Russell 2000 Index. Effective August 24, 2018, the FTSE non-US Dollar World Government Bond Index was replaced by the Bloomberg Global Aggregate ex-US Hedged Index. Effective February 1, 2023, the composite is derived using the following portion allocations: 46.0% S&P 500 Index, 1.9% Russell Midcap Index, 6.4% Russell 2000 Index, 23.2% MSCI EAFE Index (Net), 6.2% Bloomberg US Aggregate Bond Index, 6.1% FTSE EPRA Nareit Global Index (Net), 3.8% MSCI Emerging Markets Index (Net), 1.8% Bloomberg Global Aggregate ex-US Hedged Index, 2.4% Bloomberg US Government/Credit Index, 1.1% Bloomberg
US Government/Credit 1-5 Year Index, and 0.9% Bloomberg US Treasury Bills 1-3 Month Index. The components that make up the composite index may vary over time. The composite index represents target allocations for 2023. Percentages listed may not total to 100% due to rounding.
Target 2050 Composite Index A custom blended index developed by Schwab Asset Management based on the 2050 fund’s asset allocation glide schedule and will become more conservative as time elapses. Effective March 1, 2014, the Dow Jones U.S. Total Stock Market Index was replaced by a combination of the S&P 500 Index and the Russell 2000 Index. Effective August 24, 2018, the FTSE non-US Dollar World Government Bond Index was replaced by the Bloomberg Global Aggregate ex-US Hedged Index. Effective February 1, 2023, the composite is derived using the following portion allocations: 47.2% S&P 500 Index, 2.0% Russell Midcap Index, 7.0% Russell 2000 Index, 24.3% MSCI EAFE Index (Net), 3.9% Bloomberg US Aggregate Bond Index, 6.4% FTSE EPRA Nareit Global Index (Net), 4.6% MSCI Emerging Markets Index (Net), 1.3% Bloomberg Global Aggregate ex-US Hedged Index, 2.0% Bloomberg US Government/Credit Index, 0.7% Bloomberg US Government/Credit 1-5 Year Index, and 0.7% Bloomberg US Treasury Bills 1-3 Month Index. The components that make up the composite index may vary over time. The composite index represents target allocations for 2023. Percentages listed may not total to 100% due to rounding.
Target 2055 Composite Index A custom blended index developed by Schwab Asset Management based on the 2055 fund’s asset allocation glide schedule and will become more conservative as time elapses. Effective March 1, 2014, the Dow Jones U.S. Total Stock Market Index was replaced by a combination of the S&P 500 Index and the Russell 2000 Index. Effective August 24, 2018, the FTSE non-US Dollar World Government Bond Index was replaced by the Bloomberg Global Aggregate ex-US Hedged Index. Effective February 1, 2023, the composite is derived using the following portion allocations: 47.9% S&P 500 Index, 2.0% Russell Midcap Index, 7.3% Russell 2000 Index, 24.9% MSCI EAFE Index (Net), 2.6% Bloomberg US Aggregate Bond Index, 6.6% FTSE EPRA Nareit Global Index (Net), 5.1% MSCI Emerging Markets Index (Net), 0.9% Bloomberg Global Aggregate ex-US Hedged Index, 1.6% Bloomberg US Government/Credit Index, 0.6% Bloomberg US Government/Credit 1-5 Year Index, and 0.5% Bloomberg US Treasury Bills 1-3 Month Index. The components that make up the composite index may vary over time. The composite index represents target allocations for 2023. Percentages listed may not total to 100% due to rounding.
Target 2060 Composite Index A custom blended index developed by Schwab Asset Management based on the 2060 fund’s asset allocation glide schedule and will become more conservative as time elapses. Effective August 24, 2018, the FTSE non-US Dollar World Government Bond Index was replaced by the Bloomberg Global Aggregate ex-US Hedged Index. Effective February 1, 2023, the composite is derived using the following portion allocations: 48.4% S&P 500 Index, 2.0% Russell Midcap Index, 7.6% Russell 2000 Index, 25.5% MSCI EAFE Index (Net), 1.3% Bloomberg US Aggregate Bond Index, 6.7% FTSE EPRA Nareit Global Index (Net), 5.6% MSCI Emerging Markets Index (Net), 0.6% Bloomberg Global Aggregate ex-US Hedged Index, 1.2% Bloomberg US Government/Credit Index, 0.5% Bloomberg US Government/Credit 1-5 Year Index, and 0.5% Bloomberg US Treasury Bills 1-3 Month Index. The components that make up the composite index may vary over time. The composite index represents target allocations for 2023. Percentages listed may not total to 100% due to rounding.
Target 2065 Composite Index A custom blended index developed by Schwab Asset Management based on the 2065 fund’s asset allocation glide schedule and will become more conservative as time elapses. Effective February 1, 2023, the composite is derived using the following
Schwab Target Funds | Annual Report139
portion allocations: 48.7% S&P 500 Index, 2.1% Russell Midcap Index, 7.8% Russell 2000 Index, 25.8% MSCI EAFE Index (Net), 0.5% Bloomberg US Aggregate Bond Index, 6.8% FTSE EPRA Nareit Global Index (Net), 5.8% MSCI Emerging Markets Index (Net), 0.5% Bloomberg Global Aggregate ex-US Hedged Index, 1.0% Bloomberg US Government/Credit Index, 0.5% Bloomberg US Government/Credit 1-5 Year Index, and 0.5% Bloomberg US Treasury Bills 1-3 Month Index. The components that make up the composite index may vary over time. The composite index represents target allocations for 2023. Percentages listed may not total to 100% due to rounding.
total return The percentage that an investor would have earned or lost on an investment in the fund assuming dividends and distributions were reinvested.
weighted average For mutual funds, an average that gives the same weight to each security as the security represents in the fund’s portfolio.
yield The income paid out by an investment, expressed as a percentage of the investment’s market value.
140
Schwab Target Funds | Annual Report
Schwab Asset Management
With a straightforward lineup of core products and solutions for building the foundation of a portfolio, Schwab Asset Management advocates for investors of all sizes with a steadfast focus on lowering costs and reducing unnecessary complexity. The list below shows all currently available Schwab Funds®.
Investors should carefully consider information contained in the prospectus, or if available, the summary prospectus, including investment objectives, risks, charges and expenses before investing. Please call 1-877-824-5615 for a prospectus for any Schwab Fund. Please read the prospectus carefully before you invest. This report must be preceded or accompanied by a current prospectus.
Proxy Voting Policies, Procedures and Results
A description of the proxy voting policies and procedures used to determine how to vote proxies on behalf of the funds is available without charge, upon request, by visiting the Schwab Funds’ website at www.schwabassetmanagement.com/schwabfunds_prospectus, the SEC’s website at www.sec.gov, or by contacting Schwab Funds at 1-877-824-5615.
Information regarding how a fund voted proxies relating to portfolio securities during the most recent twelve-month period ended June 30 is available, without charge, by visiting the fund’s website at www.schwabassetmanagement.com/schwabfunds_prospectus or the SEC’s website at www.sec.gov.
Schwab Funds
Equity Funds
Schwab Core Equity Fund
Schwab Dividend Equity Fund
Schwab Large-Cap Growth Fund
Schwab Small-Cap Equity Fund
Schwab Health Care Fund
Schwab International Core Equity Fund
Schwab International Opportunities Fund
Schwab Select Large Cap Growth Fund
Schwab Fundamental US Large Company Index Fund
Schwab Fundamental US Small Company Index Fund
Schwab Fundamental International Large Company Index Fund
Schwab Fundamental International Small Company Index Fund
Schwab Fundamental Emerging Markets Large Company Index Fund
Schwab Fundamental Global Real Estate Index Fund
Schwab Global Real Estate Fund
Schwab S&P 500 Index Fund
Schwab 1000 Index® Fund
Schwab Small-Cap Index Fund®
Schwab Total Stock Market Index Fund®
Schwab U.S. Large-Cap Growth Index Fund
Schwab U.S. Large-Cap Value Index Fund
Schwab U.S. Mid-Cap Index Fund
Schwab International Index Fund®
Asset Allocation Funds
Schwab Balanced Fund
Schwab MarketTrack Portfolios®
Schwab Target Funds
Schwab Target Index Funds
Schwab Monthly Income Funds
Bond Funds
Schwab Treasury Inflation Protected Securities Index Fund
Schwab U.S. Aggregate Bond Index Fund
Schwab Short-Term Bond Index Fund
Schwab Tax-Free Bond Fund1
Schwab California Tax-Free Bond Fund1
Schwab Opportunistic Municipal Bond Fund
Schwab Money Funds2
Schwab provides a broad choice of taxable and tax-exempt money market funds for both retail and institutional client types.
Investment Adviser
Charles Schwab Investment Management, Inc., dba Schwab Asset Management
211 Main Street, San Francisco, CA 94105
Funds
Schwab Funds
1-877-824-5615
© 2023 Charles Schwab & Co., Inc. All rights reserved.
Member SIPC®
Printed on recycled paper.
¹
State, local, and the Federal Alternative Minimum Tax may apply. Capital gains are not exempt from Federal Taxation.
²
You could lose money by investing in the Schwab Money Funds. All Schwab Money Funds with the exception of Schwab Variable Share Price Money Fund seek to preserve the value of your investment at $1.00 per share, but cannot guarantee they will do so. Because the share price of Schwab Variable Share Price Money Fund will fluctuate, when you sell your shares they may be worth more or less than what you originally paid for them. All Schwab Money Funds with the exception of Schwab Government Money Fund, Schwab Retirement Government Money Fund, Schwab U.S. Treasury Money Fund, Schwab Treasury Obligations Money Fund and Schwab Government Money Market Portfolio may impose a fee upon the sale of your shares if the Fund’s Board determines that the fee is in the best interests of the Fund. An investment in the Schwab Money Funds is not insured or guaranteed by the Federal Deposit Insurance Corporation or any other government agency. The Schwab Money Funds’ sponsor has no legal obligation to provide financial support to the Funds, and you should not expect that the sponsor will provide financial support to the Funds at any time.
This page is intentionally left blank.
Item 2: Code of Ethics.
| | |
| (a) | | Registrant has adopted a code of ethics that applies to its principal executive officer, principal financial officer, and any other persons who perform a similar function, regardless of whether these individuals are employed by Registrant or a third party. |
| |
| (c) | | During the period covered by the report, no amendments were made to the provisions of this code of ethics. |
| |
| (d) | | During the period covered by the report, Registrant did not grant any waivers, including implicit waivers, from the provisions of this code of ethics. |
| |
| (e) | | Not applicable. |
| |
| (f)(1) | | Registrant has filed this code of ethics as an exhibit pursuant to Item 13(a)(1) of Form N-CSR. |
Item 3: Audit Committee Financial Expert.
Registrant’s Board of Trustees has determined that Kimberly S. Patmore, Michael J. Beer and J. Derek Penn, each currently serving on its audit, compliance and valuation committee, are each an “audit committee financial expert,” as such term is defined in Item 3 of Form N-CSR. Each member of Registrant’s audit, compliance and valuation committee is “independent” under the standards set forth in Item 3 of Form N-CSR.
The designation of each of Ms. Patmore, Mr. Beer and Mr. Penn as an “audit committee financial expert” pursuant to Item 3 of Form N-CSR does not (i) impose upon such individual any duties, obligations, or liability that are greater than the duties, obligations and liability imposed upon such individual as a member of Registrant’s audit, compliance and valuation committee or Board of Trustees in the absence of such designation; and (ii) affect the duties, obligations or liability of any other member of Registrant’s audit, compliance and valuation committee or Board of Trustees.
Item 4: Principal Accountant Fees and Services.
Registrant is composed of fifty-two operational series. Thirty-six series have a fiscal year-end of October 31, whose annual financial statements are reported in Item 1, three series have a fiscal year-end of December 31, twelve series have a fiscal year-end of March 31, and one series has a fiscal year-end of the last day of February. Principal accountant fees disclosed in Items 4(a)-(d) and 4(g) include fees billed for services rendered to the fifty-two operational series during 2023/2024 and 2022/2023, based on their respective 2023/2024 and 2022/2023 fiscal years, as applicable.
The following table presents fees billed by the principal accountant in each of the last two fiscal years for the services rendered to the Funds:
| | | | | | | | | | | | | | | | | | | | | | | | | | | | | | |
| (a) Audit Fees1 | | | (b) Audit-Related Fees2 | | | (c) Tax Fees3 | | | (d) All Other Fees | |
Fiscal Year
2023/2024 | | | Fiscal Year
2022/2023 | | | Fiscal Year
2023/2024 | | | Fiscal Year
2022/2023 | | | Fiscal Year
2023/2024 | | | Fiscal Year
2022/2023 | | | Fiscal Year
2023/2024 | | | Fiscal Year
2022/2023 | |
| $ | 1,272,477 | | | $ | 1,195,825 | | | $ | 90,000 | | | $ | 90,000 | | | $ | 170,820 | | | $ | 161,200 | | | $ | 0 | | | $ | 0 | |
| 1 | The nature of the services includes audit of the registrant’s annual financial statements and normally provided services in connection with regulatory filings for those fiscal years. |
| 2 | The nature of the services includes assurance and related services reasonably related to the performance of the audit of financial statements not included in Audit Fees. |
| 3 | The nature of the services includes tax compliance, tax advice and tax planning. |
| | | | |
| (e) | | (1) | | Registrant’s audit, compliance and valuation committee does not have pre-approval policies and procedures as described in paragraph (c)(7) of Rule 2-01 of Regulation S-X. |
| | |
| | (2) | | There were no services described in each of paragraphs (b) through (d) above that were approved by Registrant’s audit, compliance and valuation committee pursuant to paragraph (c)(7)(i)(C) of Rule 2-01 of Regulation S-X. |
| (g) | Below are the aggregate non-audit fees billed in each of the last two fiscal years by Registrant’s principal accountant for services rendered to Registrant, to Registrant’s investment adviser, and to any entity controlling, controlled by, or under common control with Registrant’s investment adviser that provides ongoing services to Registrant. |
| | | | |
2022/2023: $3,651,860 | | 2021/2022: $ | 8,528,894 | |
| (h) | During the past fiscal year, all non-audit services provided by Registrant’s principal accountant to either Registrant’s investment adviser or to any entity controlling, controlled by, or under common control with Registrant’s investment adviser that provides ongoing services to Registrant were pre-approved. Included in the audit, compliance and valuation committee’s pre-approval was the review and consideration as to whether the provision of these non-audit services is compatible with maintaining the principal accountant’s independence. |
Item 5: Audit Committee of Listed Registrants.
Not applicable.
Item 6: Schedule of Investments.
The schedules of investments are included as part of the report to shareholders filed under Item 1 of this Form.
Item 7: Disclosure of Proxy Voting Policies and Procedures for Closed-End Management Investment Companies.
Not applicable.
Item 8: Portfolio Managers of Closed-End Management Investment Companies.
Not applicable.
Item 9: Purchases of Equity Securities by Closed-End Management Investment Company and Affiliated Purchasers.
Not applicable.
Item 10: Submission of Matters to a Vote of Security Holders.
Not applicable.
Item 11: Controls and Procedures.
| (a) | Based on their evaluation of Registrant’s disclosure controls and procedures, as of a date within 90 days of the filing date, Registrant’s Chief Executive Officer, Omar Aguilar and Registrant’s Chief Financial Officer, Dana Smith, have concluded that Registrant’s disclosure controls and procedures are: (i) reasonably designed to ensure that information required to be disclosed in this report is appropriately communicated to Registrant’s officers to allow timely decisions regarding disclosures required in this report; (ii) reasonably designed to ensure that information required to be disclosed in this report is recorded, processed, summarized and reported in a timely manner; and (iii) are effective in achieving the goals described in (i) and (ii) above. |
| (b) | During the period covered by this report, there have been no changes in Registrant’s internal control over financial reporting that the above officers believe to have materially affected, or to be reasonably likely to materially affect, Registrant’s internal control over financial reporting. |
Item 12: Disclosure of Securities Lending Activities for Closed-End Management Investment Companies.
Not applicable.
Item 13: Exhibits.
Pursuant to the requirements of the Securities Exchange Act of 1934 and the Investment Company Act of 1940, the registrant has duly caused this report to be signed on its behalf by the undersigned, thereunto duly authorized.
(Registrant) Schwab Capital Trust
| | |
| By: | | /s/ Omar Aguilar |
| | Omar Aguilar Chief Executive Officer |
| |
| Date: | | December 15, 2023 |
Pursuant to the requirements of the Securities Exchange Act of 1934 and the Investment Company Act of 1940, this report has been signed below by the following persons on behalf of the registrant and in the capacities and on the dates indicated.
| | |
| By: | | /s/ Omar Aguilar |
| | Omar Aguilar Chief Executive Officer |
| |
| Date: | | December 15, 2023 |
| |
| By: | | /s/ Dana Smith |
| | Dana Smith Chief Financial Officer |
| |
| Date: | | December 15, 2023 |