UNITED STATES
SECURITIES AND EXCHANGE COMMISSION
Washington, D.C. 20549
FORM N-CSR
CERTIFIED SHAREHOLDER REPORT OF REGISTERED
MANAGEMENT INVESTMENT COMPANIES
Investment Company Act file number: 811-07704
Schwab Capital Trust – Schwab Target Index Funds
(Exact name of registrant as specified in charter)
211 Main Street, San Francisco, California 94105
(Address of principal executive offices) (Zip code)
Jonathan de St. Paer
Schwab Capital Trust
211 Main Street, San Francisco, California 94105
(Name and address of agent for service)
Registrant’s telephone number, including area code: (415) 636-7000
Date of fiscal year end: March 31
Date of reporting period: March 31, 2023
| Item 1: | Report(s) to Shareholders. |

2 | |
4 | |
6 | |
7 | |
10 | |
13 | |
16 | |
19 | |
22 | |
25 | |
28 | |
31 | |
34 | |
37 | |
40 | |
43 | |
45 | |
50 | |
55 | |
60 | |
66 | |
72 | |
77 | |
82 | |
87 | |
92 | |
97 | |
102 | |
107 | |
118 | |
119 | |
121 | |
125 |
Total Returns For the 12 Months Ended March 31, 2023 | |
Schwab Target 2010 Index Fund (Ticker Symbol: SWYAX) | -4.96% |
Target 2010 Passive Composite Index | -5.01% |
Fund Category: Morningstar Target-Date 2000-20101 | -5.04% |
Performance Details | pages 7-9 |
Schwab Target 2015 Index Fund (Ticker Symbol: SWYBX) | -5.13% |
Target 2015 Passive Composite Index | -5.16% |
Fund Category: Morningstar Target-Date 20151 | -5.45% |
Performance Details | pages 10-12 |
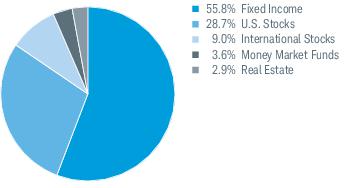
Schwab Target 2020 Index Fund (Ticker Symbol: SWYLX) | -5.17% |
Target 2020 Passive Composite Index | -5.26% |
Fund Category: Morningstar Target-Date 20201 | -5.76% |
Performance Details | pages 13-15 |
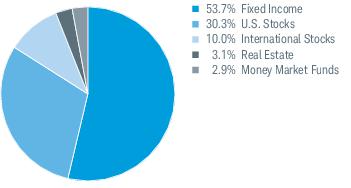
Schwab Target 2025 Index Fund (Ticker Symbol: SWYDX) | -5.67% |
Target 2025 Passive Composite Index | -5.72% |
Fund Category: Morningstar Target-Date 20251 | -6.08% |
Performance Details | pages 16-18 |
Schwab Target 2030 Index Fund (Ticker Symbol: SWYEX) | -6.19% |
Target 2030 Passive Composite Index | -6.32% |
Fund Category: Morningstar Target-Date 20301 | -6.44% |
Performance Details | pages 19-21 |
Schwab Target 2035 Index Fund (Ticker Symbol: SWYFX) | -6.59% |
Target 2035 Passive Composite Index | -6.75% |
Fund Category: Morningstar Target-Date 20351 | -6.77% |
Performance Details | pages 22-24 |
Total Returns For the 12 Months Ended March 31, 2023 | |
Schwab Target 2040 Index Fund (Ticker Symbol: SWYGX) | -6.96% |
Target 2040 Passive Composite Index | -7.12% |
Fund Category: Morningstar Target-Date 20401 | -6.97% |
Performance Details | pages 25-27 |
Schwab Target 2045 Index Fund (Ticker Symbol: SWYHX) | -7.21% |
Target 2045 Passive Composite Index | -7.42% |
Fund Category: Morningstar Target-Date 20451 | -6.98% |
Performance Details | pages 28-30 |
Schwab Target 2050 Index Fund (Ticker Symbol: SWYMX) | -7.41% |
Target 2050 Passive Composite Index | -7.62% |
Fund Category: Morningstar Target-Date 20501 | -7.10% |
Performance Details | pages 31-33 |
Schwab Target 2055 Index Fund (Ticker Symbol: SWYJX) | -7.47% |
Target 2055 Passive Composite Index | -7.73% |
Fund Category: Morningstar Target-Date 20551 | -7.10% |
Performance Details | pages 34-36 |
Schwab Target 2060 Index Fund (Ticker Symbol: SWYNX) | -7.56% |
Target 2060 Passive Composite Index | -7.81% |
Fund Category: Morningstar Target-Date 20601 | -7.11% |
Performance Details | pages 37-39 |
Schwab Target 2065 Index Fund (Ticker Symbol: SWYOX) | -7.58% |
Target 2065 Passive Composite Index | -7.85% |
Fund Category: Morningstar Target-Date 2065+1 | -7.22% |
Performance Details | pages 40-42 |
 | Zifan Tang, Ph.D., CFA, Senior Portfolio Manager for Schwab Asset Management, is responsible for the co-management of the funds. Prior to joining Schwab in 2012, Ms. Tang was a product manager at Thomson Reuters and from 1997 to 2009 worked as a portfolio manager at Barclays Global Investors (now known as BlackRock). |
 | Drew Hayes, CFA, Portfolio Manager for Schwab Asset Management, is responsible for the co-management of the funds. Mr. Hayes has been with Schwab since 2006. Before becoming a portfolio manager, he spent seven years as a senior fixed income specialist for Schwab Wealth Advisory, Inc. Prior to that, he worked as a bond investment specialist for two years and as a registered representative for two years for Charles Schwab & Co., Inc. |
 | Patrick Kwok, CFA, Portfolio Manager for Schwab Asset Management, is responsible for the co-management of the funds. Previously, Mr. Kwok served as an associate portfolio manager from 2012 to 2016. Prior to that, he worked as a fund administration manager, where he was responsible for oversight of sub-advisers, trading, cash management, and fund administration supporting the Charles Schwab Trust Bank Collective Investment Trusts and multi-asset Schwab Funds. Prior to joining Schwab Asset Management in 2008, Mr. Kwok spent two years as an asset operations specialist at Charles Schwab Trust Company. He also worked for one year at State Street Bank & Trust as a portfolio accountant and pricing specialist. |
Fund and Inception Date | 1 Year | 5 Years | Since Inception |
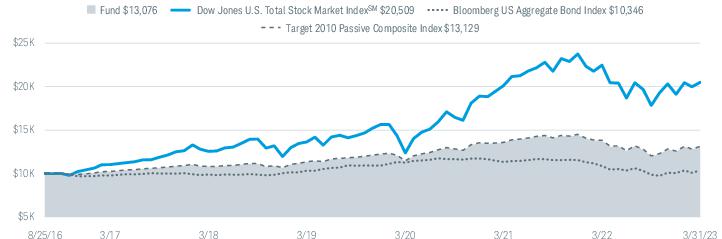
Schwab Target 2010 Index Fund (8/25/16) | -4.96% | 3.91% | 4.15% |
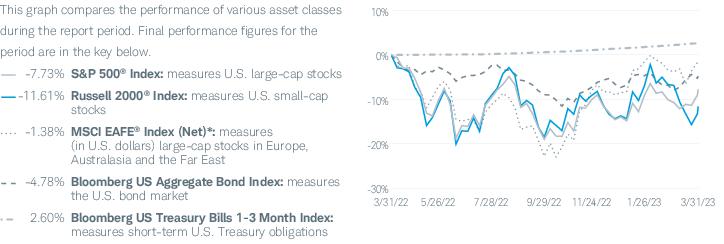
Dow Jones U.S. Total Stock Market IndexSM | -8.77% | 10.32% | 11.52% |
Bloomberg US Aggregate Bond Index | -4.78% | 0.91% | 0.53% |
Target 2010 Passive Composite Index | -5.01% | 3.95% | 4.21% |
Fund Category: Morningstar Target-Date 2000-20103 | -5.04% | 3.51% | N/A |
Fund Expense Ratios4: Net 0.08%; Gross 0.13% | |||
Number of Holdings | 8 |
Portfolio Turnover Rate | 15% |

Fund and Inception Date | 1 Year | 5 Years | Since Inception |
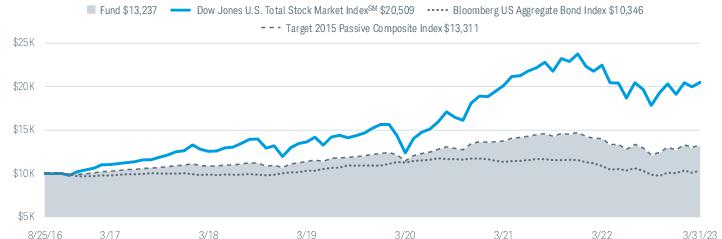
Schwab Target 2015 Index Fund (8/25/16) | -5.13% | 4.06% | 4.34% |
Dow Jones U.S. Total Stock Market IndexSM | -8.77% | 10.32% | 11.52% |
Bloomberg US Aggregate Bond Index | -4.78% | 0.91% | 0.53% |
Target 2015 Passive Composite Index | -5.16% | 4.14% | 4.43% |
Fund Category: Morningstar Target-Date 20153 | -5.45% | 3.82% | N/A |
Fund Expense Ratios4: Net 0.08%; Gross 0.13% | |||
Number of Holdings | 8 |
Portfolio Turnover Rate | 18% |

Fund and Inception Date | 1 Year | 5 Years | Since Inception |
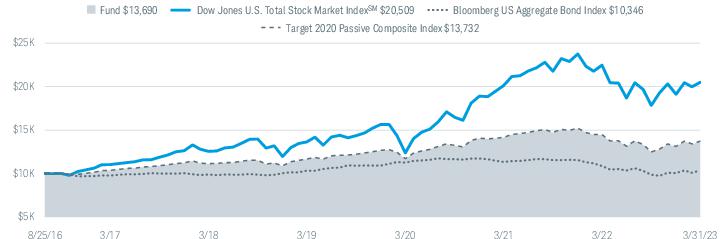
Schwab Target 2020 Index Fund (8/25/16) | -5.17% | 4.23% | 4.88% |
Dow Jones U.S. Total Stock Market IndexSM | -8.77% | 10.32% | 11.52% |
Bloomberg US Aggregate Bond Index | -4.78% | 0.91% | 0.53% |
Target 2020 Passive Composite Index | -5.26% | 4.27% | 4.93% |
Fund Category: Morningstar Target-Date 20203 | -5.76% | 3.99% | N/A |
Fund Expense Ratios4: Net 0.08%; Gross 0.13% | |||
Number of Holdings | 8 |
Portfolio Turnover Rate | 18% |

Fund and Inception Date | 1 Year | 5 Years | Since Inception |
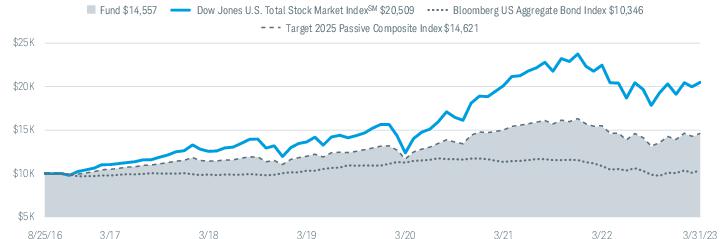
Schwab Target 2025 Index Fund (8/25/16) | -5.67% | 4.98% | 5.86% |
Dow Jones U.S. Total Stock Market IndexSM | -8.77% | 10.32% | 11.52% |
Bloomberg US Aggregate Bond Index | -4.78% | 0.91% | 0.53% |
Target 2025 Passive Composite Index | -5.72% | 5.06% | 5.93% |
Fund Category: Morningstar Target-Date 20253 | -6.08% | 4.33% | N/A |
Fund Expense Ratios4: Net 0.08%; Gross 0.12% | |||
Number of Holdings | 9 |
Portfolio Turnover Rate | 18% |
Fund and Inception Date | 1 Year | 5 Years | Since Inception |
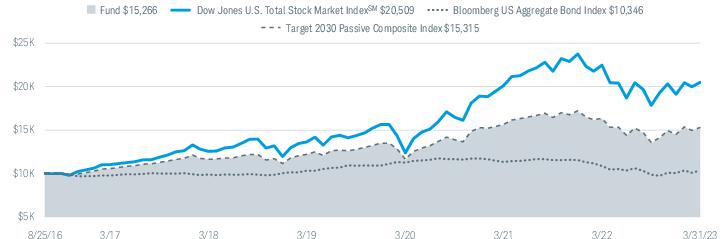
Schwab Target 2030 Index Fund (8/25/16) | -6.19% | 5.58% | 6.62% |
Dow Jones U.S. Total Stock Market IndexSM | -8.77% | 10.32% | 11.52% |
Bloomberg US Aggregate Bond Index | -4.78% | 0.91% | 0.53% |
Target 2030 Passive Composite Index | -6.32% | 5.65% | 6.68% |
Fund Category: Morningstar Target-Date 20303 | -6.44% | 4.95% | N/A |
Fund Expense Ratios4: Net 0.08%; Gross 0.12% | |||
Number of Holdings | 9 |
Portfolio Turnover Rate | 14% |
Fund and Inception Date | 1 Year | 5 Years | Since Inception |
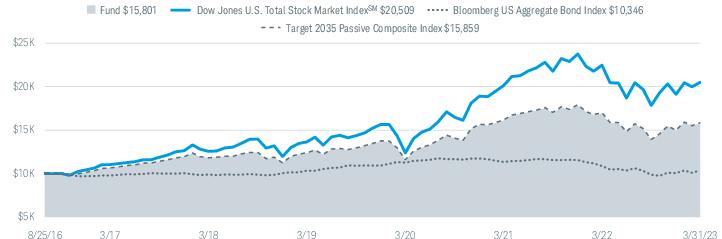
Schwab Target 2035 Index Fund (8/25/16) | -6.59% | 5.99% | 7.18% |
Dow Jones U.S. Total Stock Market IndexSM | -8.77% | 10.32% | 11.52% |
Bloomberg US Aggregate Bond Index | -4.78% | 0.91% | 0.53% |
Target 2035 Passive Composite Index | -6.75% | 6.07% | 7.24% |
Fund Category: Morningstar Target-Date 20353 | -6.77% | 5.50% | N/A |
Fund Expense Ratios4: Net 0.08%; Gross 0.12% | |||
Number of Holdings | 8 |
Portfolio Turnover Rate | 13% |

Fund and Inception Date | 1 Year | 5 Years | Since Inception |
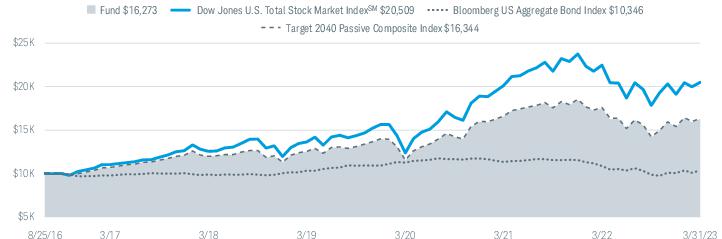
Schwab Target 2040 Index Fund (8/25/16) | -6.96% | 6.30% | 7.66% |
Dow Jones U.S. Total Stock Market IndexSM | -8.77% | 10.32% | 11.52% |
Bloomberg US Aggregate Bond Index | -4.78% | 0.91% | 0.53% |
Target 2040 Passive Composite Index | -7.12% | 6.40% | 7.73% |
Fund Category: Morningstar Target-Date 20403 | -6.97% | 5.92% | N/A |
Fund Expense Ratios4: Net 0.08%; Gross 0.12% | |||
Number of Holdings | 8 |
Portfolio Turnover Rate | 12% |

Fund and Inception Date | 1 Year | 5 Years | Since Inception |
Schwab Target 2045 Index Fund (8/25/16) | -7.21% | 6.59% | 8.03% |
Dow Jones U.S. Total Stock Market IndexSM | -8.77% | 10.32% | 11.52% |
Bloomberg US Aggregate Bond Index | -4.78% | 0.91% | 0.53% |
Target 2045 Passive Composite Index | -7.42% | 6.70% | 8.10% |
Fund Category: Morningstar Target-Date 20453 | -6.98% | 6.24% | N/A |
Fund Expense Ratios4: Net 0.08%; Gross 0.13% | |||
Number of Holdings | 8 |
Portfolio Turnover Rate | 10% |

Fund and Inception Date | 1 Year | 5 Years | Since Inception |
Schwab Target 2050 Index Fund (8/25/16) | -7.41% | 6.72% | 8.22% |
Dow Jones U.S. Total Stock Market IndexSM | -8.77% | 10.32% | 11.52% |
Bloomberg US Aggregate Bond Index | -4.78% | 0.91% | 0.53% |
Target 2050 Passive Composite Index | -7.62% | 6.85% | 8.31% |
Fund Category: Morningstar Target-Date 20503 | -7.10% | 6.31% | N/A |
Fund Expense Ratios4: Net 0.08%; Gross 0.13% | |||
Number of Holdings | 7 |
Portfolio Turnover Rate | 9% |
Fund and Inception Date | 1 Year | 5 Years | Since Inception |
Schwab Target 2055 Index Fund (8/25/16) | -7.47% | 6.83% | 8.40% |
Dow Jones U.S. Total Stock Market IndexSM | -8.77% | 10.32% | 11.52% |
Bloomberg US Aggregate Bond Index | -4.78% | 0.91% | 0.53% |
Target 2055 Passive Composite Index | -7.73% | 6.95% | 8.48% |
Fund Category: Morningstar Target-Date 20553 | -7.10% | 6.36% | N/A |
Fund Expense Ratios4: Net 0.08%; Gross 0.13% | |||
Number of Holdings | 7 |
Portfolio Turnover Rate | 8% |

Fund and Inception Date | 1 Year | 5 Years | Since Inception |
Schwab Target 2060 Index Fund (8/25/16) | -7.56% | 6.94% | 8.49% |
Dow Jones U.S. Total Stock Market IndexSM | -8.77% | 10.32% | 11.52% |
Bloomberg US Aggregate Bond Index | -4.78% | 0.91% | 0.53% |
Target 2060 Passive Composite Index | -7.81% | 7.06% | 8.58% |
Fund Category: Morningstar Target-Date 20603 | -7.11% | 6.40% | N/A |
Fund Expense Ratios4: Net 0.08%; Gross 0.13% | |||
Number of Holdings | 6 |
Portfolio Turnover Rate | 8% |
Fund and Inception Date | 1 Year | Since Inception |
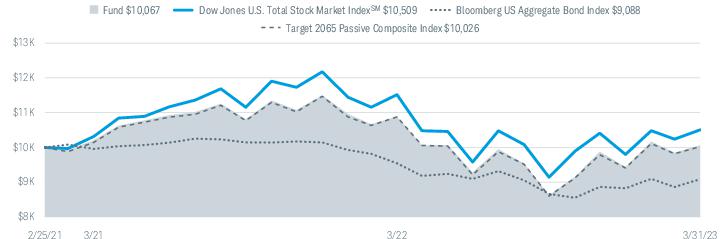
Schwab Target 2065 Index Fund (2/25/21) | -7.58% | 0.32% |
Dow Jones U.S. Total Stock Market IndexSM | -8.77% | 2.40% |
Bloomberg US Aggregate Bond Index | -4.78% | -4.47% |
Target 2065 Passive Composite Index | -7.85% | 0.12% |
Fund Category: Morningstar Target-Date 2065+2 | -7.22% | N/A |
Fund Expense Ratios3: Net 0.08%; Gross 0.13% | ||
Number of Holdings | 6 |
Portfolio Turnover Rate | 19% |

EXPENSE RATIO (ANNUALIZED)1,2 | EFFECTIVE EXPENSE RATIO (ANNUALIZED)3,4 | BEGINNING ACCOUNT VALUE AT 10/1/22 | ENDING ACCOUNT VALUE (NET OF EXPENSES) AT 3/31/232 | EXPENSES PAID DURING PERIOD 10/1/22-3/31/232,5 | EFFECTIVE EXPENSES PAID DURING PERIOD 10/1/22-3/31/234,5 | |
Schwab Target 2010 Index Fund | ||||||
Actual Return | 0.04% | 0.08% | $1,000.00 | $1,091.60 | $0.21 | $0.42 |
Hypothetical 5% Return | 0.04% | 0.08% | $1,000.00 | $1,024.73 | $0.20 | $0.40 |
Schwab Target 2015 Index Fund | ||||||
Actual Return | 0.04% | 0.08% | $1,000.00 | $1,097.30 | $0.21 | $0.42 |
Hypothetical 5% Return | 0.04% | 0.08% | $1,000.00 | $1,024.73 | $0.20 | $0.40 |
Schwab Target 2020 Index Fund | ||||||
Actual Return | 0.04% | 0.08% | $1,000.00 | $1,100.60 | $0.21 | $0.42 |
Hypothetical 5% Return | 0.04% | 0.08% | $1,000.00 | $1,024.73 | $0.20 | $0.40 |
Schwab Target 2025 Index Fund | ||||||
Actual Return | 0.04% | 0.08% | $1,000.00 | $1,113.80 | $0.21 | $0.42 |
Hypothetical 5% Return | 0.04% | 0.08% | $1,000.00 | $1,024.73 | $0.20 | $0.40 |
Schwab Target 2030 Index Fund | ||||||
Actual Return | 0.04% | 0.08% | $1,000.00 | $1,128.90 | $0.21 | $0.42 |
Hypothetical 5% Return | 0.04% | 0.08% | $1,000.00 | $1,024.73 | $0.20 | $0.40 |
Schwab Target 2035 Index Fund | ||||||
Actual Return | 0.04% | 0.08% | $1,000.00 | $1,139.50 | $0.21 | $0.43 |
Hypothetical 5% Return | 0.04% | 0.08% | $1,000.00 | $1,024.73 | $0.20 | $0.40 |
Schwab Target 2040 Index Fund | ||||||
Actual Return | 0.04% | 0.08% | $1,000.00 | $1,148.50 | $0.21 | $0.43 |
Hypothetical 5% Return | 0.04% | 0.08% | $1,000.00 | $1,024.73 | $0.20 | $0.40 |
Schwab Target 2045 Index Fund | ||||||
Actual Return | 0.04% | 0.08% | $1,000.00 | $1,156.70 | $0.22 | $0.43 |
Hypothetical 5% Return | 0.04% | 0.08% | $1,000.00 | $1,024.73 | $0.20 | $0.40 |
Schwab Target 2050 Index Fund | ||||||
Actual Return | 0.04% | 0.08% | $1,000.00 | $1,161.00 | $0.22 | $0.43 |
Hypothetical 5% Return | 0.04% | 0.08% | $1,000.00 | $1,024.73 | $0.20 | $0.40 |
Schwab Target 2055 Index Fund | ||||||
Actual Return | 0.04% | 0.08% | $1,000.00 | $1,163.30 | $0.22 | $0.43 |
Hypothetical 5% Return | 0.04% | 0.08% | $1,000.00 | $1,024.73 | $0.20 | $0.40 |
Schwab Target 2060 Index Fund | ||||||
Actual Return | 0.04% | 0.08% | $1,000.00 | $1,166.30 | $0.22 | $0.43 |
Hypothetical 5% Return | 0.04% | 0.08% | $1,000.00 | $1,024.73 | $0.20 | $0.40 |
EXPENSE RATIO (ANNUALIZED)1,2 | EFFECTIVE EXPENSE RATIO (ANNUALIZED)3,4 | BEGINNING ACCOUNT VALUE AT 10/1/22 | ENDING ACCOUNT VALUE (NET OF EXPENSES) AT 3/31/232 | EXPENSES PAID DURING PERIOD 10/1/22-3/31/232,5 | EFFECTIVE EXPENSES PAID DURING PERIOD 10/1/22-3/31/234,5 | |
Schwab Target 2065 Index Fund | ||||||
Actual Return | 0.03% | 0.08% | $1,000.00 | $1,167.20 | $0.16 | $0.43 |
Hypothetical 5% Return | 0.03% | 0.08% | $1,000.00 | $1,024.78 | $0.15 | $0.40 |
1 | Based on the most recent six-month expense ratio. |
2 | Excludes acquired fund fees and expenses, which are indirect expenses incurred by the fund through its investments in underlying funds. |
3 | Based on the most recent six-month acquired fund fees and expenses and the expense ratio; may differ from the acquired fund fees and expenses and the expense ratio in the prospectus. |
4 | Includes acquired fund fees and expenses, which are indirect expenses incurred by the fund through its investments in underlying funds. |
5 | Expenses for each fund are equal to its annualized expense ratio, multiplied by the average account value over the period, multiplied by the 182 days in the period, and divided by the 365 days in the fiscal year. |
4/1/22– 3/31/23 | 4/1/21– 3/31/22 | 4/1/20– 3/31/21 | 4/1/19– 3/31/20 | 4/1/18– 3/31/19 | ||
Per-Share Data | ||||||
Net asset value at beginning of period | $12.37 | $12.49 | $10.70 | $10.88 | $10.59 | |
Income (loss) from investment operations: | ||||||
Net investment income (loss)1 | 0.28 | 0.25 | 0.22 | 0.27 | 0.27 | |
Net realized and unrealized gains (losses) | (0.90 ) | (0.04 ) | 1.82 | (0.19 ) | 0.23 | |
Total from investment operations | (0.62 ) | 0.21 | 2.04 | 0.08 | 0.50 | |
Less distributions: | ||||||
Distributions from net investment income | (0.27 ) | (0.25 ) | (0.21 ) | (0.25 ) | (0.20 ) | |
Distributions from net realized gains | (0.03 ) | (0.08 ) | (0.04 ) | (0.01 ) | (0.01 ) | |
Total distributions | (0.30 ) | (0.33 ) | (0.25 ) | (0.26 ) | (0.21 ) | |
Net asset value at end of period | $11.45 | $12.37 | $12.49 | $10.70 | $10.88 | |
Total return | (4.96 %) | 1.55 % | 19.04 % | 0.58 % | 4.81 % | |
Ratios/Supplemental Data | ||||||
Ratios to average net assets: | ||||||
Net operating expenses2 | 0.04 %3 | 0.03 % | 0.03 % | 0.03 % | 0.03 % | |
Gross operating expenses2 | 0.08 %3 | 0.08 % | 0.08 % | 0.08 % | 0.08 % | |
Net investment income (loss) | 2.49 % | 1.90 % | 1.83 % | 2.43 % | 2.53 % | |
Portfolio turnover rate | 15 % | 27 % | 21 % | 19 % | 30 % | |
Net assets, end of period (x 1,000) | $44,032 | $55,048 | $55,137 | $35,614 | $25,391 | |
1 | Calculated based on the average shares outstanding during the period. |
2 | Ratio excludes acquired fund fees and expenses, which are indirect expenses incurred by the fund through its investments in underlying funds. If the expenses incurred by the underlying funds were included in these ratios they would have increased by 0.04%, 0.05%, 0.05%, 0.05% and 0.05%, respectively, for the periods ended March 31, 2023, March 31, 2022, March 31, 2021, March 31, 2020 and March 31, 2019 (see financial note 4 for additional information). |
3 | Ratio includes less than 0.005% of non-routine proxy expenses. |
SECURITY | VALUE AT 3/31/22 | PURCHASES | SALES | REALIZED GAINS (LOSSES) | NET CHANGE IN UNREALIZED APPRECIATION (DEPRECIATION) | VALUE AT 3/31/23 | BALANCE OF SHARES HELD AT 3/31/23 | DISTRIBUTIONS RECEIVED(a) |
AFFILIATED UNDERLYING FUNDS 99.2% OF NET ASSETS | ||||||||
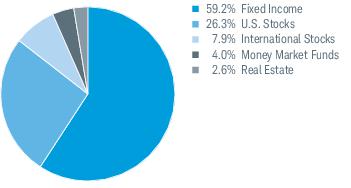
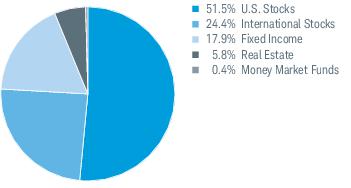
U.S. Stocks 26.1% | ||||||||
Large-Cap 24.7% | ||||||||
Schwab U.S. Large-Cap ETF | $13,059,648 | $2,240,871 | ($3,127,784) | $80,027 | ($1,377,493) | $10,875,269 | 224,835 | $178,891 |
Small-Cap 1.4% | ||||||||
Schwab U.S. Small-Cap ETF | 810,851 | 157,048 | (252,035) | 16,000 | (101,950) | 629,914 | 15,023 | 9,769 |
11,505,183 | ||||||||
International Stocks 7.8% | ||||||||
Developed Markets 7.8% | ||||||||
Schwab International Equity ETF | 5,261,462 | 619,882 | (2,159,919) | 74,158 | (343,562) | 3,452,021 | 99,196 | 117,899 |
Real Estate 2.6% | ||||||||
U.S. REITs 2.6% | ||||||||
Schwab U.S. REIT ETF | 1,442,898 | 238,818 | (249,069) | (41,252) | (255,890) | 1,135,505 | 58,231 | 33,017 |
Fixed Income 58.8% | ||||||||
Inflation-Protected Bond 6.4% | ||||||||
Schwab U.S. TIPS ETF | 3,438,675 | 214,433 | (458,426) | (58,250) | (335,256) | 2,801,176 | 52,251 | 188,288 |
Intermediate-Term Bond 45.6% | ||||||||
Schwab U.S. Aggregate Bond ETF | 23,774,980 | 3,233,362 | (5,209,262) | (816,820) | (900,746) | 20,081,514 | 428,086 | 542,403 |
Treasury Bond 6.8% | ||||||||
Schwab Short-Term U.S. Treasury ETF | 4,761,586 | 327,239 | (2,024,223) | (100,291) | 24,272 | 2,988,583 | 61,254 | 65,882 |
25,871,273 | ||||||||
Money Market Funds 3.9% | ||||||||
Schwab Variable Share Price Money Fund, Ultra Shares, 4.83% (b) | 2,037,571 | 46,117 | (350,000) | (70) | 302 | 1,733,920 | 1,733,747 | 50,234 |
Total Affiliated Underlying Funds (Cost $41,047,427) | $54,587,671 | $7,077,770 | ($13,830,718 ) | ($846,498 ) | ($3,290,323 ) | $43,697,902 | $1,186,383 | |
Total Investments in Securities (Cost $41,047,427) | $43,697,902 | |||||||
(a) | Distributions received include distributions from net investment income and capital gains, if any, from the underlying funds. Amounts shown are only presented for affiliated underlying funds, which are presented in the corresponding line-item in the Statement of Operations, if applicable (see financial note 2(d) for additional information). |
(b) | The rate shown is the annualized 7-day yield. |
ETF — | Exchange-traded fund |
REIT — | Real Estate Investment Trust |
TIPS — | Treasury Inflation Protected Securities |
Assets | ||
Investments in securities, at value - affiliated (cost $41,047,427) | $43,697,902 | |
Cash | 262,045 | |
Receivables: | ||
Investments sold | 136,024 | |
Fund shares sold | 41,181 | |
Dividends | + | 4,261 |
Total assets | 44,141,413 | |
Liabilities | ||
Payables: | ||
Investments bought | 106,197 | |
Fund shares redeemed | 2,177 | |
Investment adviser fees | + | 1,417 |
Total liabilities | 109,791 | |
Net assets | $44,031,622 | |
Net Assets by Source | ||
Capital received from investors | $42,625,102 | |
Total distributable earnings | + | 1,406,520 |
Net assets | $44,031,622 | |
Net Asset Value (NAV) | ||||
Net Assets | ÷ | Shares Outstanding | = | NAV |
$44,031,622 | 3,845,414 | $11.45 | ||
For the period April 1, 2022 through March 31, 2023 | ||
Investment Income | ||
Dividends received from securities - affiliated | $1,186,383 | |
Interest received from securities - unaffiliated | + | 2,306 |
Total investment income | 1,188,689 | |
Expenses | ||
Investment adviser fees | 37,760 | |
Proxy fees1 | + | 2,019 |
Total expenses | 39,779 | |
Expense reduction | – | 20,554 |
Net expenses | – | 19,225 |
Net investment income | 1,169,464 | |
REALIZED AND UNREALIZED GAINS (LOSSES) | ||
Net realized losses on sales of securities - affiliated | (846,498 ) | |
Net change in unrealized appreciation (depreciation) on securities - affiliated | + | (3,290,323 ) |
Net realized and unrealized losses | (4,136,821 ) | |
Decrease in net assets resulting from operations | ($2,967,357 ) | |
1 | Proxy fees are non-routine expenses (see financial note 2(e) for additional information). |
OPERATIONS | |||
4/1/22-3/31/23 | 4/1/21-3/31/22 | ||
Net investment income | $1,169,464 | $1,111,179 | |
Net realized gains (losses) | (846,498 ) | 190,119 | |
Net change in unrealized appreciation (depreciation) | + | (3,290,323 ) | (400,635 ) |
Increase (decrease) in net assets resulting from operations | ($2,967,357 ) | $900,663 | |
DISTRIBUTIONS TO SHAREHOLDERS | |||
Total distributions | ($1,129,436 ) | ($1,460,719 ) | |
TRANSACTIONS IN FUND SHARES | |||||
4/1/22-3/31/23 | 4/1/21-3/31/22 | ||||
SHARES | VALUE | SHARES | VALUE | ||
Shares sold | 523,269 | $6,009,667 | 1,420,137 | $18,277,254 | |
Shares reinvested | 92,142 | 1,013,558 | 104,962 | 1,363,444 | |
Shares redeemed | + | (1,221,052 ) | (13,943,038 ) | (1,490,015 ) | (19,169,445 ) |
Net transactions in fund shares | (605,641 ) | ($6,919,813 ) | 35,084 | $471,253 | |
SHARES OUTSTANDING AND NET ASSETS | |||||
4/1/22-3/31/23 | 4/1/21-3/31/22 | ||||
SHARES | NET ASSETS | SHARES | NET ASSETS | ||
Beginning of period | 4,451,055 | $55,048,228 | 4,415,971 | $55,137,031 | |
Total increase (decrease) | + | (605,641 ) | (11,016,606 ) | 35,084 | (88,803 ) |
End of period | 3,845,414 | $44,031,622 | 4,451,055 | $55,048,228 | |
4/1/22– 3/31/23 | 4/1/21– 3/31/22 | 4/1/20– 3/31/21 | 4/1/19– 3/31/20 | 4/1/18– 3/31/19 | ||
Per-Share Data | ||||||
Net asset value at beginning of period | $12.48 | $12.58 | $10.68 | $10.92 | $10.61 | |
Income (loss) from investment operations: | ||||||
Net investment income (loss)1 | 0.28 | 0.25 | 0.22 | 0.28 | 0.27 | |
Net realized and unrealized gains (losses) | (0.94 ) | 0.01 2 | 1.97 | (0.26 ) | 0.22 | |
Total from investment operations | (0.66 ) | 0.26 | 2.19 | 0.02 | 0.49 | |
Less distributions: | ||||||
Distributions from net investment income | (0.26 ) | (0.25 ) | (0.22 ) | (0.25 ) | (0.17 ) | |
Distributions from net realized gains | (0.02 ) | (0.11 ) | (0.07 ) | (0.01 ) | (0.01 ) | |
Total distributions | (0.28 ) | (0.36 ) | (0.29 ) | (0.26 ) | (0.18 ) | |
Net asset value at end of period | $11.54 | $12.48 | $12.58 | $10.68 | $10.92 | |
Total return | (5.13 %) | 1.92 % | 20.52 % | (0.02 %) | 4.74 % | |
Ratios/Supplemental Data | ||||||
Ratios to average net assets: | ||||||
Net operating expenses3 | 0.04 %4 | 0.03 % | 0.04 % | 0.03 % | 0.03 % | |
Gross operating expenses3 | 0.08 %4 | 0.08 % | 0.08 % | 0.08 % | 0.08 % | |
Net investment income (loss) | 2.48 % | 1.91 % | 1.85 % | 2.45 % | 2.54 % | |
Portfolio turnover rate | 18 % | 23 % | 30 % | 24 % | 29 % | |
Net assets, end of period (x 1,000) | $57,305 | $75,362 | $73,384 | $57,790 | $45,688 | |
1 | Calculated based on the average shares outstanding during the period. |
2 | The per share amount does not accord with the change in aggregate gains and losses in securities during the period because of the timing of fund transactions in relation to fluctuating market values. |
3 | Ratio excludes acquired fund fees and expenses, which are indirect expenses incurred by the fund through its investments in underlying funds. If the expenses incurred by the underlying funds were included in these ratios they would have increased by 0.04%, 0.05%, 0.04%, 0.05% and 0.05%, respectively, for the periods ended March 31, 2023, March 31, 2022, March 31, 2021, March 31, 2020 and March 31, 2019 (see financial note 4 for additional information). |
4 | Ratio includes less than 0.005% of non-routine proxy expenses. |
SECURITY | VALUE AT 3/31/22 | PURCHASES | SALES | REALIZED GAINS (LOSSES) | NET CHANGE IN UNREALIZED APPRECIATION (DEPRECIATION) | VALUE AT 3/31/23 | BALANCE OF SHARES HELD AT 3/31/23 | DISTRIBUTIONS RECEIVED(a) |
AFFILIATED UNDERLYING FUNDS 99.4% OF NET ASSETS | ||||||||
U.S. Stocks 28.5% | ||||||||
Large-Cap 26.9% | ||||||||
Schwab U.S. Large-Cap ETF | $19,284,923 | $3,916,772 | ($5,944,487) | $208,527 | ($2,047,943) | $15,417,792 | 318,747 | $256,040 |
Small-Cap 1.6% | ||||||||
Schwab U.S. Small-Cap ETF | 1,245,379 | 235,383 | (420,505) | 18,191 | (146,973) | 931,475 | 22,215 | 14,569 |
16,349,267 | ||||||||
International Stocks 9.0% | ||||||||
Developed Markets 9.0% | ||||||||
Schwab International Equity ETF | 8,151,546 | 1,009,911 | (3,593,633) | 57,324 | (472,521) | 5,152,627 | 148,064 | 181,467 |
Real Estate 2.8% | ||||||||
U.S. REITs 2.8% | ||||||||
Schwab U.S. REIT ETF | 2,170,358 | 433,331 | (572,366) | (43,827) | (354,975) | 1,632,521 | 83,719 | 47,694 |
Fixed Income 55.5% | ||||||||
Inflation-Protected Bond 6.0% | ||||||||
Schwab U.S. TIPS ETF | 4,438,933 | 363,092 | (889,960) | (76,488) | (420,888) | 3,414,689 | 63,695 | 237,521 |
Intermediate-Term Bond 43.1% | ||||||||
Schwab U.S. Aggregate Bond ETF | 30,953,897 | 4,532,629 | (8,549,918) | (1,240,057) | (972,495) | 24,724,056 | 527,053 | 684,111 |
Treasury Bond 6.4% | ||||||||
Schwab Short-Term U.S. Treasury ETF | 6,044,425 | 558,589 | (2,865,634) | (126,646) | 32,659 | 3,643,393 | 74,675 | 81,206 |
31,782,138 | ||||||||
Money Market Funds 3.6% | ||||||||
Schwab Variable Share Price Money Fund, Ultra Shares, 4.83% (b) | 2,436,557 | 54,579 | (450,000) | (90) | 371 | 2,041,417 | 2,041,212 | 59,422 |
Total Affiliated Underlying Funds (Cost $51,967,153) | $74,726,018 | $11,104,286 | ($23,286,503 ) | ($1,203,066 ) | ($4,382,765 ) | $56,957,970 | $1,562,030 | |
Total Investments in Securities (Cost $51,967,153) | $56,957,970 | |||||||
(a) | Distributions received include distributions from net investment income and capital gains, if any, from the underlying funds. Amounts shown are only presented for affiliated underlying funds, which are presented in the corresponding line-item in the Statement of Operations, if applicable (see financial note 2(d) for additional information). |
(b) | The rate shown is the annualized 7-day yield. |
ETF — | Exchange-traded fund |
REIT — | Real Estate Investment Trust |
TIPS — | Treasury Inflation Protected Securities |
Assets | ||
Investments in securities, at value - affiliated (cost $51,967,153) | $56,957,970 | |
Cash | 261,562 | |
Receivables: | ||
Investments sold | 175,893 | |
Fund shares sold | 94,060 | |
Dividends | + | 5,016 |
Total assets | 57,494,501 | |
Liabilities | ||
Payables: | ||
Investments bought | 180,752 | |
Fund shares redeemed | 6,649 | |
Investment adviser fees | + | 1,864 |
Total liabilities | 189,265 | |
Net assets | $57,305,236 | |
Net Assets by Source | ||
Capital received from investors | $54,024,601 | |
Total distributable earnings | + | 3,280,635 |
Net assets | $57,305,236 | |
Net Asset Value (NAV) | ||||
Net Assets | ÷ | Shares Outstanding | = | NAV |
$57,305,236 | 4,965,360 | $11.54 | ||
For the period April 1, 2022 through March 31, 2023 | ||
Investment Income | ||
Dividends received from securities - affiliated | $1,562,030 | |
Interest received from securities - unaffiliated | + | 2,594 |
Total investment income | 1,564,624 | |
Expenses | ||
Investment adviser fees | 50,004 | |
Proxy fees1 | + | 2,709 |
Total expenses | 52,713 | |
Expense reduction | – | 27,159 |
Net expenses | – | 25,554 |
Net investment income | 1,539,070 | |
REALIZED AND UNREALIZED GAINS (LOSSES) | ||
Net realized losses on sales of securities - affiliated | (1,203,066 ) | |
Net change in unrealized appreciation (depreciation) on securities - affiliated | + | (4,382,765 ) |
Net realized and unrealized losses | (5,585,831 ) | |
Decrease in net assets resulting from operations | ($4,046,761 ) | |
1 | Proxy fees are non-routine expenses (see financial note 2(e) for additional information). |
OPERATIONS | |||
4/1/22-3/31/23 | 4/1/21-3/31/22 | ||
Net investment income | $1,539,070 | $1,490,265 | |
Net realized gains (losses) | (1,203,066 ) | 333,576 | |
Net change in unrealized appreciation (depreciation) | + | (4,382,765 ) | (412,377 ) |
Increase (decrease) in net assets resulting from operations | ($4,046,761 ) | $1,411,464 | |
DISTRIBUTIONS TO SHAREHOLDERS | |||
Total distributions | ($1,498,773 ) | ($2,126,395 ) | |
TRANSACTIONS IN FUND SHARES | |||||
4/1/22-3/31/23 | 4/1/21-3/31/22 | ||||
SHARES | VALUE | SHARES | VALUE | ||
Shares sold | 779,418 | $8,911,545 | 1,612,364 | $20,853,291 | |
Shares reinvested | 126,993 | 1,405,807 | 153,206 | 2,008,520 | |
Shares redeemed | + | (1,981,817 ) | (22,829,003 ) | (1,559,156 ) | (20,168,590 ) |
Net transactions in fund shares | (1,075,406 ) | ($12,511,651 ) | 206,414 | $2,693,221 | |
SHARES OUTSTANDING AND NET ASSETS | |||||
4/1/22-3/31/23 | 4/1/21-3/31/22 | ||||
SHARES | NET ASSETS | SHARES | NET ASSETS | ||
Beginning of period | 6,040,766 | $75,362,421 | 5,834,352 | $73,384,131 | |
Total increase (decrease) | + | (1,075,406 ) | (18,057,185 ) | 206,414 | 1,978,290 |
End of period | 4,965,360 | $57,305,236 | 6,040,766 | $75,362,421 | |
4/1/22– 3/31/23 | 4/1/21– 3/31/22 | 4/1/20– 3/31/21 | 4/1/19– 3/31/20 | 4/1/18– 3/31/19 | ||
Per-Share Data | ||||||
Net asset value at beginning of period | $13.01 | $13.05 | $10.93 | $11.18 | $10.92 | |
Income (loss) from investment operations: | ||||||
Net investment income (loss)1 | 0.29 | 0.26 | 0.23 | 0.29 | 0.27 | |
Net realized and unrealized gains (losses) | (0.98 ) | 0.03 | 2.12 | (0.29 ) | 0.22 | |
Total from investment operations | (0.69 ) | 0.29 | 2.35 | 0.00 2 | 0.49 | |
Less distributions: | ||||||
Distributions from net investment income | (0.25 ) | (0.26 ) | (0.21 ) | (0.25 ) | (0.23 ) | |
Distributions from net realized gains | (0.03 ) | (0.07 ) | (0.02 ) | (0.00 )2 | (0.00 )2 | |
Total distributions | (0.28 ) | (0.33 ) | (0.23 ) | (0.25 ) | (0.23 ) | |
Net asset value at end of period | $12.04 | $13.01 | $13.05 | $10.93 | $11.18 | |
Total return | (5.17 %) | 2.13 % | 21.51 % | (0.17 %) | 4.73 % | |
Ratios/Supplemental Data | ||||||
Ratios to average net assets: | ||||||
Net operating expenses3 | 0.04 %4 | 0.03 % | 0.03 % | 0.03 % | 0.03 % | |
Gross operating expenses3 | 0.08 %4 | 0.08 % | 0.08 % | 0.08 % | 0.08 % | |
Net investment income (loss) | 2.45 % | 1.92 % | 1.86 % | 2.46 % | 2.48 % | |
Portfolio turnover rate | 18 % | 18 % | 13 % | 22 % | 13 % | |
Net assets, end of period (x 1,000) | $249,838 | $286,650 | $277,678 | $172,353 | $129,760 | |
1 | Calculated based on the average shares outstanding during the period. |
2 | Per-share amount was less than $0.005. |
3 | Ratio excludes acquired fund fees and expenses, which are indirect expenses incurred by the fund through its investments in underlying funds. If the expenses incurred by the underlying funds were included in these ratios they would have increased by 0.04%, 0.05%, 0.05%, 0.05% and 0.05%, respectively, for the periods ended March 31, 2023, March 31, 2022, March 31, 2021, March 31, 2020 and March 31, 2019 (see financial note 4 for additional information). |
4 | Ratio includes less than 0.005% of non-routine proxy expenses. |
SECURITY | VALUE AT 3/31/22 | PURCHASES | SALES | REALIZED GAINS (LOSSES) | NET CHANGE IN UNREALIZED APPRECIATION (DEPRECIATION) | VALUE AT 3/31/23 | BALANCE OF SHARES HELD AT 3/31/23 | DISTRIBUTIONS RECEIVED(a) |
AFFILIATED UNDERLYING FUNDS 99.0% OF NET ASSETS | ||||||||
U.S. Stocks 30.0% | ||||||||
Large-Cap 28.3% | ||||||||
Schwab U.S. Large-Cap ETF | $76,467,377 | $16,749,921 | ($15,121,886) | ($619,777) | ($6,864,432) | $70,611,203 | 1,459,814 | $1,114,098 |
Small-Cap 1.7% | ||||||||
Schwab U.S. Small-Cap ETF | 5,051,749 | 834,396 | (963,659) | (28,444) | (508,499) | 4,385,543 | 104,592 | 65,290 |
74,996,746 | ||||||||
International Stocks 9.9% | ||||||||
Developed Markets 9.9% | ||||||||
Schwab International Equity ETF | 33,920,614 | 4,190,789 | (11,762,763) | (242,793) | (1,359,463) | 24,746,384 | 711,103 | 820,330 |
Real Estate 3.1% | ||||||||
U.S. REITs 3.1% | ||||||||
Schwab U.S. REIT ETF | 8,710,604 | 1,813,240 | (1,139,732) | (143,360) | (1,666,972) | 7,573,780 | 388,399 | 210,544 |
Fixed Income 53.2% | ||||||||
Inflation-Protected Bond 5.7% | ||||||||
Schwab U.S. TIPS ETF | 16,230,636 | 1,539,199 | (1,637,288) | (210,186) | (1,674,753) | 14,247,608 | 265,764 | 921,557 |
Intermediate-Term Bond 41.5% | ||||||||
Schwab U.S. Aggregate Bond ETF | 113,876,864 | 17,776,486 | (19,739,931) | (3,370,188) | (4,844,735) | 103,698,496 | 2,210,584 | 2,716,336 |
Treasury Bond 6.0% | ||||||||
Schwab Short-Term U.S. Treasury ETF | 21,563,722 | 2,654,971 | (8,954,161) | (480,009) | 149,803 | 14,934,326 | 306,094 | 316,750 |
132,880,430 | ||||||||
Money Market Funds 2.8% | ||||||||
Schwab Variable Share Price Money Fund, Ultra Shares, 4.83% (b) | 8,381,809 | 188,622 | (1,500,000) | (303) | 1,263 | 7,071,391 | 7,070,683 | 205,402 |
Total Affiliated Underlying Funds (Cost $231,162,079) | $284,203,375 | $45,747,624 | ($60,819,420 ) | ($5,095,060 ) | ($16,767,788 ) | $247,268,731 | $6,370,307 | |
Total Investments in Securities (Cost $231,162,079) | $247,268,731 | |||||||
(a) | Distributions received include distributions from net investment income and capital gains, if any, from the underlying funds. Amounts shown are only presented for affiliated underlying funds, which are presented in the corresponding line-item in the Statement of Operations, if applicable (see financial note 2(d) for additional information). |
(b) | The rate shown is the annualized 7-day yield. |
ETF — | Exchange-traded fund |
REIT — | Real Estate Investment Trust |
TIPS — | Treasury Inflation Protected Securities |
Assets | ||
Investments in securities, at value - affiliated (cost $231,162,079) | $247,268,731 | |
Cash | 1,949,859 | |
Receivables: | ||
Investments sold | 1,402,163 | |
Fund shares sold | 46,135 | |
Dividends | + | 17,376 |
Total assets | 250,684,264 | |
Liabilities | ||
Payables: | ||
Investments bought | 732,721 | |
Fund shares redeemed | 105,478 | |
Investment adviser fees | + | 8,426 |
Total liabilities | 846,625 | |
Net assets | $249,837,639 | |
Net Assets by Source | ||
Capital received from investors | $239,512,069 | |
Total distributable earnings | + | 10,325,570 |
Net assets | $249,837,639 | |
Net Asset Value (NAV) | ||||
Net Assets | ÷ | Shares Outstanding | = | NAV |
$249,837,639 | 20,750,687 | $12.04 | ||
For the period April 1, 2022 through March 31, 2023 | ||
Investment Income | ||
Dividends received from securities - affiliated | $6,370,307 | |
Interest received from securities - unaffiliated | + | 21,983 |
Total investment income | 6,392,290 | |
Expenses | ||
Investment adviser fees | 205,954 | |
Proxy fees1 | + | 11,433 |
Total expenses | 217,387 | |
Expense reduction | – | 109,227 |
Net expenses | – | 108,160 |
Net investment income | 6,284,130 | |
REALIZED AND UNREALIZED GAINS (LOSSES) | ||
Net realized losses on sales of securities - affiliated | (5,095,060 ) | |
Net change in unrealized appreciation (depreciation) on securities - affiliated | + | (16,767,788 ) |
Net realized and unrealized losses | (21,862,848 ) | |
Decrease in net assets resulting from operations | ($15,578,718 ) | |
1 | Proxy fees are non-routine expenses (see financial note 2(e) for additional information). |
OPERATIONS | |||
4/1/22-3/31/23 | 4/1/21-3/31/22 | ||
Net investment income | $6,284,130 | $5,743,217 | |
Net realized gains (losses) | (5,095,060 ) | 1,175,272 | |
Net change in unrealized appreciation (depreciation) | + | (16,767,788 ) | (1,060,431 ) |
Increase (decrease) in net assets resulting from operations | ($15,578,718 ) | $5,858,058 | |
DISTRIBUTIONS TO SHAREHOLDERS | |||
Total distributions | ($6,020,477 ) | ($7,308,160 ) | |
TRANSACTIONS IN FUND SHARES | |||||
4/1/22-3/31/23 | 4/1/21-3/31/22 | ||||
SHARES | VALUE | SHARES | VALUE | ||
Shares sold | 3,928,458 | $47,307,076 | 6,413,180 | $86,878,636 | |
Shares reinvested | 487,538 | 5,626,189 | 504,832 | 6,906,111 | |
Shares redeemed | + | (5,697,110 ) | (68,146,747 ) | (6,165,206 ) | (83,362,548 ) |
Net transactions in fund shares | (1,281,114 ) | ($15,213,482 ) | 752,806 | $10,422,199 | |
SHARES OUTSTANDING AND NET ASSETS | |||||
4/1/22-3/31/23 | 4/1/21-3/31/22 | ||||
SHARES | NET ASSETS | SHARES | NET ASSETS | ||
Beginning of period | 22,031,801 | $286,650,316 | 21,278,995 | $277,678,219 | |
Total increase (decrease) | + | (1,281,114 ) | (36,812,677 ) | 752,806 | 8,972,097 |
End of period | 20,750,687 | $249,837,639 | 22,031,801 | $286,650,316 | |
4/1/22– 3/31/23 | 4/1/21– 3/31/22 | 4/1/20– 3/31/21 | 4/1/19– 3/31/20 | 4/1/18– 3/31/19 | ||
Per-Share Data | ||||||
Net asset value at beginning of period | $13.98 | $13.83 | $10.92 | $11.46 | $11.18 | |
Income (loss) from investment operations: | ||||||
Net investment income (loss)1 | 0.30 | 0.27 | 0.25 | 0.30 | 0.28 | |
Net realized and unrealized gains (losses) | (1.11 ) | 0.16 | 2.90 | (0.61 ) | 0.23 | |
Total from investment operations | (0.81 ) | 0.43 | 3.15 | (0.31 ) | 0.51 | |
Less distributions: | ||||||
Distributions from net investment income | (0.28 ) | (0.26 ) | (0.23 ) | (0.23 ) | (0.23 ) | |
Distributions from net realized gains | — | (0.02 ) | (0.01 ) | (0.00 )2 | (0.00 )2 | |
Total distributions | (0.28 ) | (0.28 ) | (0.24 ) | (0.23 ) | (0.23 ) | |
Net asset value at end of period | $12.89 | $13.98 | $13.83 | $10.92 | $11.46 | |
Total return | (5.67 %) | 3.02 % | 28.91 % | (2.89 %) | 4.79 % | |
Ratios/Supplemental Data | ||||||
Ratios to average net assets: | ||||||
Net operating expenses3 | 0.04 %4 | 0.04 % | 0.04 % | 0.03 % | 0.03 % | |
Gross operating expenses3 | 0.08 %4 | 0.08 % | 0.08 % | 0.08 % | 0.08 % | |
Net investment income (loss) | 2.34 % | 1.90 % | 1.90 % | 2.50 % | 2.46 % | |
Portfolio turnover rate | 18 % | 12 % | 15 % | 19 % | 13 % | |
Net assets, end of period (x 1,000) | $477,437 | $518,480 | $443,433 | $264,880 | $154,328 | |
1 | Calculated based on the average shares outstanding during the period. |
2 | Per-share amount was less than $0.005. |
3 | Ratio excludes acquired fund fees and expenses, which are indirect expenses incurred by the fund through its investments in underlying funds. If the expenses incurred by the underlying funds were included in these ratios they would have increased by 0.04%, 0.04%, 0.04%, 0.05% and 0.05%, respectively, for the periods ended March 31, 2023, March 31, 2022, March 31, 2021, March 31, 2020 and March 31, 2019 (see financial note 4 for additional information). |
4 | Ratio includes less than 0.005% of non-routine proxy expenses. |
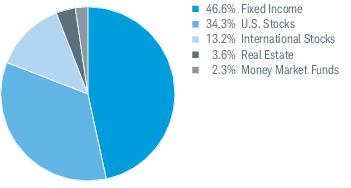
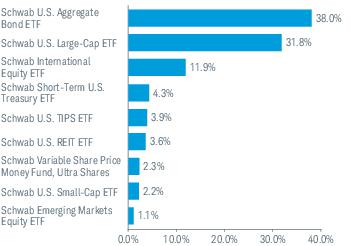
SECURITY | VALUE AT 3/31/22 | PURCHASES | SALES | REALIZED GAINS (LOSSES) | NET CHANGE IN UNREALIZED APPRECIATION (DEPRECIATION) | VALUE AT 3/31/23 | BALANCE OF SHARES HELD AT 3/31/23 | DISTRIBUTIONS RECEIVED(a) |
AFFILIATED UNDERLYING FUNDS 99.1% OF NET ASSETS | ||||||||
U.S. Stocks 34.0% | ||||||||
Large-Cap 31.8% | ||||||||
Schwab U.S. Large-Cap ETF | $163,687,953 | $23,397,373 | ($19,058,409) | ($989,276) | ($15,032,207) | $152,005,434 | 3,142,556 | $2,424,586 |
Small-Cap 2.2% | ||||||||
Schwab U.S. Small-Cap ETF | 11,945,328 | 2,106,112 | (2,500,023) | (174,307) | (1,055,076) | 10,322,034 | 246,173 | 158,124 |
162,327,468 | ||||||||
International Stocks 13.0% | ||||||||
Developed Markets 11.9% | ||||||||
Schwab International Equity ETF | 73,865,915 | 8,558,433 | (22,297,086) | (1,435,688) | (1,870,969) | 56,820,605 | 1,632,776 | 1,834,216 |
Emerging Markets 1.1% | ||||||||
Schwab Emerging Markets Equity ETF | 8,271,406 | 979,683 | (3,048,322) | (259,496) | (523,272) | 5,419,999 | 221,044 | 211,439 |
62,240,604 | ||||||||
Real Estate 3.6% | ||||||||
U.S. REITs 3.6% | ||||||||
Schwab U.S. REIT ETF | 19,464,428 | 4,329,923 | (2,691,669) | (333,404) | (3,723,704) | 17,045,574 | 874,132 | 475,920 |
Fixed Income 46.2% | ||||||||
Inflation-Protected Bond 3.9% | ||||||||
Schwab U.S. TIPS ETF | 16,350,781 | 5,638,345 | (1,409,138) | (183,264) | (1,707,581) | 18,689,143 | 348,613 | 951,285 |
Intermediate-Term Bond 38.0% | ||||||||
Schwab U.S. Aggregate Bond ETF | 182,965,092 | 39,490,542 | (27,591,617) | (4,716,380) | (8,587,267) | 181,560,370 | 3,870,398 | 4,491,133 |
Treasury Bond 4.3% | ||||||||
Schwab Short-Term U.S. Treasury ETF | 25,836,299 | 3,109,884 | (8,147,496) | (450,637) | 45,194 | 20,393,244 | 417,980 | 397,999 |
220,642,757 | ||||||||
Money Market Funds 2.3% | ||||||||
Schwab Variable Share Price Money Fund, Ultra Shares, 4.83% (b) | 9,721,920 | 1,268,315 | — | — | 830 | 10,991,065 | 10,989,966 | 294,634 |
Total Affiliated Underlying Funds (Cost $441,100,354) | $512,109,122 | $88,878,610 | ($86,743,760 ) | ($8,542,452 ) | ($32,454,052 ) | $473,247,468 | $11,239,336 | |
Total Investments in Securities (Cost $441,100,354) | $473,247,468 | |||||||
(a) | Distributions received include distributions from net investment income and capital gains, if any, from the underlying funds. Amounts shown are only presented for affiliated underlying funds, which are presented in the corresponding line-item in the Statement of Operations, if applicable (see financial note 2(d) for additional information). |
(b) | The rate shown is the annualized 7-day yield. |
ETF — | Exchange-traded fund |
REIT — | Real Estate Investment Trust |
TIPS — | Treasury Inflation Protected Securities |
Assets | ||
Investments in securities, at value - affiliated (cost $441,100,354) | $473,247,468 | |
Cash | 4,591,282 | |
Receivables: | ||
Investments sold | 1,458,851 | |
Fund shares sold | 302,726 | |
Dividends | + | 27,007 |
Total assets | 479,627,334 | |
Liabilities | ||
Payables: | ||
Investments bought | 1,605,887 | |
Fund shares redeemed | 569,574 | |
Investment adviser fees | + | 14,949 |
Total liabilities | 2,190,410 | |
Net assets | $477,436,924 | |
Net Assets by Source | ||
Capital received from investors | $456,998,711 | |
Total distributable earnings | + | 20,438,213 |
Net assets | $477,436,924 | |
Net Asset Value (NAV) | ||||
Net Assets | ÷ | Shares Outstanding | = | NAV |
$477,436,924 | 37,041,492 | $12.89 | ||
For the period April 1, 2022 through March 31, 2023 | ||
Investment Income | ||
Dividends received from securities - affiliated | $11,239,336 | |
Interest received from securities - unaffiliated | + | 49,335 |
Total investment income | 11,288,671 | |
Expenses | ||
Investment adviser fees | 380,667 | |
Proxy fees1 | + | 21,197 |
Total expenses | 401,864 | |
Expense reduction | – | 204,867 |
Net expenses | – | 196,997 |
Net investment income | 11,091,674 | |
REALIZED AND UNREALIZED GAINS (LOSSES) | ||
Net realized losses on sales of securities - affiliated | (8,542,452 ) | |
Net change in unrealized appreciation (depreciation) on securities - affiliated | + | (32,454,052 ) |
Net realized and unrealized losses | (40,996,504 ) | |
Decrease in net assets resulting from operations | ($29,904,830 ) | |
1 | Proxy fees are non-routine expenses (see financial note 2(e) for additional information). |
OPERATIONS | |||
4/1/22-3/31/23 | 4/1/21-3/31/22 | ||
Net investment income | $11,091,674 | $9,652,859 | |
Net realized losses | (8,542,452 ) | (815,809 ) | |
Net change in unrealized appreciation (depreciation) | + | (32,454,052 ) | 3,521,986 |
Increase (decrease) in net assets resulting from operations | ($29,904,830 ) | $12,359,036 | |
DISTRIBUTIONS TO SHAREHOLDERS | |||
Total distributions | ($10,489,514 ) | ($10,216,730 ) | |
TRANSACTIONS IN FUND SHARES | |||||
4/1/22-3/31/23 | 4/1/21-3/31/22 | ||||
SHARES | VALUE | SHARES | VALUE | ||
Shares sold | 8,390,855 | $107,504,791 | 12,707,739 | $183,306,333 | |
Shares reinvested | 813,000 | 10,008,029 | 668,095 | 9,841,042 | |
Shares redeemed | + | (9,262,234 ) | (118,162,006 ) | (8,345,429 ) | (120,242,319 ) |
Net transactions in fund shares | (58,379 ) | ($649,186 ) | 5,030,405 | $72,905,056 | |
SHARES OUTSTANDING AND NET ASSETS | |||||
4/1/22-3/31/23 | 4/1/21-3/31/22 | ||||
SHARES | NET ASSETS | SHARES | NET ASSETS | ||
Beginning of period | 37,099,871 | $518,480,454 | 32,069,466 | $443,433,092 | |
Total increase (decrease) | + | (58,379 ) | (41,043,530 ) | 5,030,405 | 75,047,362 |
End of period | 37,041,492 | $477,436,924 | 37,099,871 | $518,480,454 | |
4/1/22– 3/31/23 | 4/1/21– 3/31/22 | 4/1/20– 3/31/21 | 4/1/19– 3/31/20 | 4/1/18– 3/31/19 | ||
Per-Share Data | ||||||
Net asset value at beginning of period | $14.73 | $14.41 | $10.86 | $11.65 | $11.37 | |
Income (loss) from investment operations: | ||||||
Net investment income (loss)1 | 0.30 | 0.29 | 0.26 | 0.31 | 0.28 | |
Net realized and unrealized gains (losses) | (1.23 ) | 0.32 | 3.53 | (0.86 ) | 0.24 | |
Total from investment operations | (0.93 ) | 0.61 | 3.79 | (0.55 ) | 0.52 | |
Less distributions: | ||||||
Distributions from net investment income | (0.27 ) | (0.27 ) | (0.24 ) | (0.24 ) | (0.24 ) | |
Distributions from net realized gains | — | (0.02 ) | (0.00 )2 | (0.00 )2 | — | |
Total distributions | (0.27 ) | (0.29 ) | (0.24 ) | (0.24 ) | (0.24 ) | |
Net asset value at end of period | $13.53 | $14.73 | $14.41 | $10.86 | $11.65 | |
Total return | (6.19 %) | 4.11 % | 34.98 % | (4.99 %) | 4.76 % | |
Ratios/Supplemental Data | ||||||
Ratios to average net assets: | ||||||
Net operating expenses3 | 0.04 %4 | 0.04 % | 0.04 % | 0.03 % | 0.03 % | |
Gross operating expenses3 | 0.08 %4 | 0.08 % | 0.08 % | 0.08 % | 0.08 % | |
Net investment income (loss) | 2.23 % | 1.88 % | 1.94 % | 2.53 % | 2.46 % | |
Portfolio turnover rate | 14 % | 9 % | 13 % | 13 % | 8 % | |
Net assets, end of period (x 1,000) | $805,556 | $802,660 | $622,076 | $352,969 | $201,250 | |
1 | Calculated based on the average shares outstanding during the period. |
2 | Per-share amount was less than $0.005. |
3 | Ratio excludes acquired fund fees and expenses, which are indirect expenses incurred by the fund through its investments in underlying funds. If the expenses incurred by the underlying funds were included in these ratios they would have increased by 0.04%, 0.04%, 0.04%, 0.05% and 0.05%, respectively, for the periods ended March 31, 2023, March 31, 2022, March 31, 2021, March 31, 2020 and March 31, 2019 (see financial note 4 for additional information). |
4 | Ratio includes less than 0.005% of non-routine proxy expenses. |
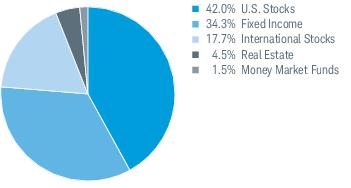
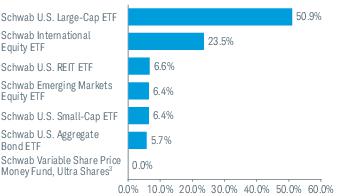
SECURITY | VALUE AT 3/31/22 | PURCHASES | SALES | REALIZED GAINS (LOSSES) | NET CHANGE IN UNREALIZED APPRECIATION (DEPRECIATION) | VALUE AT 3/31/23 | BALANCE OF SHARES HELD AT 3/31/23 | DISTRIBUTIONS RECEIVED(a) |
AFFILIATED UNDERLYING FUNDS 99.0% OF NET ASSETS | ||||||||
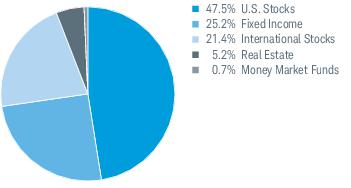
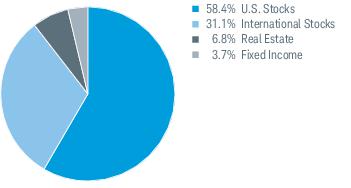
U.S. Stocks 41.5% | ||||||||
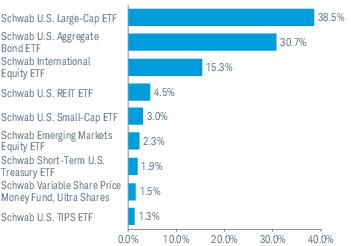
Large-Cap 38.5% | ||||||||
Schwab U.S. Large-Cap ETF | $302,984,548 | $59,781,801 | ($23,544,427) | ($2,966,032) | ($25,956,100) | $310,299,790 | 6,415,129 | $4,716,674 |
Small-Cap 3.0% | ||||||||
Schwab U.S. Small-Cap ETF | 25,427,584 | 5,207,890 | (3,708,369) | (632,059) | (2,013,467) | 24,281,579 | 579,098 | 347,685 |
334,581,369 | ||||||||
International Stocks 17.6% | ||||||||
Developed Markets 15.3% | ||||||||
Schwab International Equity ETF | 140,388,014 | 19,597,984 | (31,223,553) | (3,982,657) | (1,784,895) | 122,994,893 | 3,534,336 | 3,659,202 |
Emerging Markets 2.3% | ||||||||
Schwab Emerging Markets Equity ETF | 21,806,504 | 5,899,664 | (7,156,679) | (1,376,078) | (864,744) | 18,308,667 | 746,683 | 588,560 |
141,303,560 | ||||||||
Real Estate 4.5% | ||||||||
U.S. REITs 4.5% | ||||||||
Schwab U.S. REIT ETF | 37,140,858 | 9,963,434 | (3,103,484) | (338,440) | (7,522,647) | 36,139,721 | 1,853,319 | 954,510 |
Fixed Income 33.9% | ||||||||
Inflation-Protected Bond 1.3% | ||||||||
Schwab U.S. TIPS ETF | 7,546,800 | 4,163,317 | (403,704) | (52,726) | (803,758) | 10,449,929 | 194,925 | 452,091 |
Intermediate-Term Bond 30.7% | ||||||||
Schwab U.S. Aggregate Bond ETF | 227,772,539 | 62,267,927 | (26,331,790) | (4,037,605) | (12,605,717) | 247,065,354 | 5,266,795 | 5,812,978 |
Treasury Bond 1.9% | ||||||||
Schwab Short-Term U.S. Treasury ETF | 20,673,488 | 2,888,193 | (7,407,569) | (393,948) | 69,556 | 15,829,720 | 324,446 | 322,256 |
273,345,003 | ||||||||
Money Market Funds 1.5% | ||||||||
Schwab Variable Share Price Money Fund, Ultra Shares, 4.83% (b) | 8,989,620 | 2,776,589 | — | — | 603 | 11,766,812 | 11,765,636 | 304,865 |
Total Affiliated Underlying Funds (Cost $744,688,680) | $792,729,955 | $172,546,799 | ($102,879,575 ) | ($13,779,545 ) | ($51,481,169 ) | $797,136,465 | $17,158,821 | |
Total Investments in Securities (Cost $744,688,680) | $797,136,465 | |||||||
(a) | Distributions received include distributions from net investment income and capital gains, if any, from the underlying funds. Amounts shown are only presented for affiliated underlying funds, which are presented in the corresponding line-item in the Statement of Operations, if applicable (see financial note 2(d) for additional information). |
(b) | The rate shown is the annualized 7-day yield. |
ETF — | Exchange-traded fund |
REIT — | Real Estate Investment Trust |
TIPS — | Treasury Inflation Protected Securities |
Assets | ||
Investments in securities, at value - affiliated (cost $744,688,680) | $797,136,465 | |
Cash | 8,174,300 | |
Receivables: | ||
Investments sold | 3,530,118 | |
Fund shares sold | 863,588 | |
Dividends | + | 28,913 |
Total assets | 809,733,384 | |
Liabilities | ||
Payables: | ||
Investments bought | 3,581,218 | |
Fund shares redeemed | 570,862 | |
Investment adviser fees | + | 25,663 |
Total liabilities | 4,177,743 | |
Net assets | $805,555,641 | |
Net Assets by Source | ||
Capital received from investors | $770,153,453 | |
Total distributable earnings | + | 35,402,188 |
Net assets | $805,555,641 | |
Net Asset Value (NAV) | ||||
Net Assets | ÷ | Shares Outstanding | = | NAV |
$805,555,641 | 59,526,890 | $13.53 | ||
For the period April 1, 2022 through March 31, 2023 | ||
Investment Income | ||
Dividends received from securities - affiliated | $17,158,821 | |
Interest received from securities - unaffiliated | + | 90,008 |
Total investment income | 17,248,829 | |
Expenses | ||
Investment adviser fees | 611,369 | |
Proxy fees1 | + | 27,542 |
Total expenses | 638,911 | |
Expense reduction | – | 330,267 |
Net expenses | – | 308,644 |
Net investment income | 16,940,185 | |
REALIZED AND UNREALIZED GAINS (LOSSES) | ||
Net realized losses on sales of securities - affiliated | (13,779,545 ) | |
Net change in unrealized appreciation (depreciation) on securities - affiliated | + | (51,481,169 ) |
Net realized and unrealized losses | (65,260,714 ) | |
Decrease in net assets resulting from operations | ($48,320,529 ) | |
1 | Proxy fees are non-routine expenses (see financial note 2(e) for additional information). |
OPERATIONS | |||
4/1/22-3/31/23 | 4/1/21-3/31/22 | ||
Net investment income | $16,940,185 | $14,059,833 | |
Net realized losses | (13,779,545 ) | (1,211,263 ) | |
Net change in unrealized appreciation (depreciation) | + | (51,481,169 ) | 10,805,772 |
Increase (decrease) in net assets resulting from operations | ($48,320,529 ) | $23,654,342 | |
DISTRIBUTIONS TO SHAREHOLDERS | |||
Total distributions | ($15,856,833 ) | ($14,691,831 ) | |
TRANSACTIONS IN FUND SHARES | |||||
4/1/22-3/31/23 | 4/1/21-3/31/22 | ||||
SHARES | VALUE | SHARES | VALUE | ||
Shares sold | 14,406,249 | $192,423,626 | 19,317,474 | $292,518,601 | |
Shares reinvested | 1,190,037 | 15,315,776 | 916,429 | 14,250,471 | |
Shares redeemed | + | (10,565,240 ) | (140,666,686 ) | (8,912,051 ) | (135,147,065 ) |
Net transactions in fund shares | 5,031,046 | $67,072,716 | 11,321,852 | $171,622,007 | |
SHARES OUTSTANDING AND NET ASSETS | |||||
4/1/22-3/31/23 | 4/1/21-3/31/22 | ||||
SHARES | NET ASSETS | SHARES | NET ASSETS | ||
Beginning of period | 54,495,844 | $802,660,287 | 43,173,992 | $622,075,769 | |
Total increase | + | 5,031,046 | 2,895,354 | 11,321,852 | 180,584,518 |
End of period | 59,526,890 | $805,555,641 | 54,495,844 | $802,660,287 | |
4/1/22– 3/31/23 | 4/1/21– 3/31/22 | 4/1/20– 3/31/21 | 4/1/19– 3/31/20 | 4/1/18– 3/31/19 | ||
Per-Share Data | ||||||
Net asset value at beginning of period | $15.31 | $14.86 | $10.81 | $11.82 | $11.53 | |
Income (loss) from investment operations: | ||||||
Net investment income (loss)1 | 0.30 | 0.30 | 0.26 | 0.31 | 0.29 | |
Net realized and unrealized gains (losses) | (1.32 ) | 0.44 | 4.04 | (1.06 ) | 0.22 | |
Total from investment operations | (1.02 ) | 0.74 | 4.30 | (0.75 ) | 0.51 | |
Less distributions: | ||||||
Distributions from net investment income | (0.27 ) | (0.28 ) | (0.24 ) | (0.26 ) | (0.22 ) | |
Distributions from net realized gains | — | (0.01 ) | (0.01 ) | (0.00 )2 | (0.00 )2 | |
Total distributions | (0.27 ) | (0.29 ) | (0.25 ) | (0.26 ) | (0.22 ) | |
Net asset value at end of period | $14.02 | $15.31 | $14.86 | $10.81 | $11.82 | |
Total return | (6.59 %) | 4.88 % | 39.84 % | (6.72 %) | 4.68 % | |
Ratios/Supplemental Data | ||||||
Ratios to average net assets: | ||||||
Net operating expenses3 | 0.04 %4 | 0.04 % | 0.04 % | 0.03 % | 0.03 % | |
Gross operating expenses3 | 0.08 %4 | 0.08 % | 0.08 % | 0.08 % | 0.08 % | |
Net investment income (loss) | 2.16 % | 1.88 % | 1.93 % | 2.53 % | 2.49 % | |
Portfolio turnover rate | 13 % | 12 % | 12 % | 12 % | 6 % | |
Net assets, end of period (x 1,000) | $523,537 | $488,322 | $372,100 | $196,194 | $126,200 | |
1 | Calculated based on the average shares outstanding during the period. |
2 | Per-share amount was less than $0.005. |
3 | Ratio excludes acquired fund fees and expenses, which are indirect expenses incurred by the fund through its investments in underlying funds. If the expenses incurred by the underlying funds were included in these ratios they would have increased by 0.04%, 0.04%, 0.04%, 0.05% and 0.05%, respectively, for the periods ended March 31, 2023, March 31, 2022, March 31, 2021, March 31, 2020 and March 31, 2019 (see financial note 4 for additional information). |
4 | Ratio includes less than 0.005% of non-routine proxy expenses. |
SECURITY | VALUE AT 3/31/22 | PURCHASES | SALES | REALIZED GAINS (LOSSES) | NET CHANGE IN UNREALIZED APPRECIATION (DEPRECIATION) | VALUE AT 3/31/23 | BALANCE OF SHARES HELD AT 3/31/23 | DISTRIBUTIONS RECEIVED(a) |
AFFILIATED UNDERLYING FUNDS 98.8% OF NET ASSETS | ||||||||
U.S. Stocks 46.9% | ||||||||
Large-Cap 43.1% | ||||||||
Schwab U.S. Large-Cap ETF | $204,986,380 | $53,025,943 | ($13,281,876) | ($1,917,888) | ($17,425,772) | $225,386,787 | 4,659,640 | $3,289,980 |
Small-Cap 3.8% | ||||||||
Schwab U.S. Small-Cap ETF | 19,168,060 | 5,966,554 | (3,166,431) | (518,517) | (1,521,511) | 19,928,155 | 475,272 | 274,847 |
245,314,942 | ||||||||
International Stocks 21.1% | ||||||||
Developed Markets 17.8% | ||||||||
Schwab International Equity ETF | 97,393,925 | 20,972,499 | (21,155,286) | (2,844,836) | (838,588) | 93,527,714 | 2,687,578 | 2,578,035 |
Emerging Markets 3.3% | ||||||||
Schwab Emerging Markets Equity ETF | 18,265,634 | 5,641,303 | (4,835,240) | (1,011,956) | (893,779) | 17,165,962 | 700,080 | 504,860 |
110,693,676 | ||||||||
Real Estate 5.2% | ||||||||
U.S. REITs 5.2% | ||||||||
Schwab U.S. REIT ETF | 25,751,916 | 9,465,718 | (2,522,430) | (253,516) | (5,402,442) | 27,039,246 | 1,386,628 | 686,694 |
Fixed Income 24.9% | ||||||||
Intermediate-Term Bond 24.0% | ||||||||
Schwab U.S. Aggregate Bond ETF | 107,058,763 | 40,046,979 | (13,694,780) | (2,117,369) | (5,688,175) | 125,605,418 | 2,677,583 | 2,803,647 |
Treasury Bond 0.9% | ||||||||
Schwab Short-Term U.S. Treasury ETF | 7,082,734 | 1,293,026 | (3,397,651) | (189,080) | 75,139 | 4,864,168 | 99,696 | 110,110 |
130,469,586 | ||||||||
Money Market Funds 0.7% | ||||||||
Schwab Variable Share Price Money Fund, Ultra Shares, 4.83% (b) | 3,483,716 | 89,668 | — | — | 335 | 3,573,719 | 3,573,362 | 98,203 |
Total Affiliated Underlying Funds (Cost $477,721,035) | $483,191,128 | $136,501,690 | ($62,053,694 ) | ($8,853,162 ) | ($31,694,793 ) | $517,091,169 | $10,346,376 | |
Total Investments in Securities (Cost $477,721,035) | $517,091,169 | |||||||
(a) | Distributions received include distributions from net investment income and capital gains, if any, from the underlying funds. Amounts shown are only presented for affiliated underlying funds, which are presented in the corresponding line-item in the Statement of Operations, if applicable (see financial note 2(d) for additional information). |
(b) | The rate shown is the annualized 7-day yield. |
ETF — | Exchange-traded fund |
REIT — | Real Estate Investment Trust |
Assets | ||
Investments in securities, at value - affiliated (cost $477,721,035) | $517,091,169 | |
Cash | 6,635,248 | |
Receivables: | ||
Investments sold | 2,566,255 | |
Fund shares sold | 525,282 | |
Dividends | + | 8,781 |
Total assets | 526,826,735 | |
Liabilities | ||
Payables: | ||
Investments bought | 2,936,277 | |
Fund shares redeemed | 337,968 | |
Investment adviser fees | + | 15,789 |
Total liabilities | 3,290,034 | |
Net assets | $523,536,701 | |
Net Assets by Source | ||
Capital received from investors | $494,792,606 | |
Total distributable earnings | + | 28,744,095 |
Net assets | $523,536,701 | |
Net Asset Value (NAV) | ||||
Net Assets | ÷ | Shares Outstanding | = | NAV |
$523,536,701 | 37,337,066 | $14.02 | ||
For the period April 1, 2022 through March 31, 2023 | ||
Investment Income | ||
Dividends received from securities - affiliated | $10,346,376 | |
Interest received from securities - unaffiliated | + | 66,581 |
Total investment income | 10,412,957 | |
Expenses | ||
Investment adviser fees | 380,738 | |
Proxy fees1 | + | 20,650 |
Total expenses | 401,388 | |
Expense reduction | – | 210,379 |
Net expenses | – | 191,009 |
Net investment income | 10,221,948 | |
REALIZED AND UNREALIZED GAINS (LOSSES) | ||
Net realized losses on sales of securities - affiliated | (8,853,162 ) | |
Net change in unrealized appreciation (depreciation) on securities - affiliated | + | (31,694,793 ) |
Net realized and unrealized losses | (40,547,955 ) | |
Decrease in net assets resulting from operations | ($30,326,007 ) | |
1 | Proxy fees are non-routine expenses (see financial note 2(e) for additional information). |
OPERATIONS | |||
4/1/22-3/31/23 | 4/1/21-3/31/22 | ||
Net investment income | $10,221,948 | $8,458,833 | |
Net realized losses | (8,853,162 ) | (1,301,727 ) | |
Net change in unrealized appreciation (depreciation) | + | (31,694,793 ) | 9,760,137 |
Increase (decrease) in net assets resulting from operations | ($30,326,007 ) | $16,917,243 | |
DISTRIBUTIONS TO SHAREHOLDERS | |||
Total distributions | ($9,490,510 ) | ($8,650,986 ) | |
TRANSACTIONS IN FUND SHARES | |||||
4/1/22-3/31/23 | 4/1/21-3/31/22 | ||||
SHARES | VALUE | SHARES | VALUE | ||
Shares sold | 10,313,847 | $142,154,893 | 11,814,431 | $185,357,149 | |
Shares reinvested | 692,849 | 9,214,883 | 521,864 | 8,438,542 | |
Shares redeemed | + | (5,569,167 ) | (76,338,740 ) | (5,484,090 ) | (85,839,910 ) |
Net transactions in fund shares | 5,437,529 | $75,031,036 | 6,852,205 | $107,955,781 | |
SHARES OUTSTANDING AND NET ASSETS | |||||
4/1/22-3/31/23 | 4/1/21-3/31/22 | ||||
SHARES | NET ASSETS | SHARES | NET ASSETS | ||
Beginning of period | 31,899,537 | $488,322,182 | 25,047,332 | $372,100,144 | |
Total increase | + | 5,437,529 | 35,214,519 | 6,852,205 | 116,222,038 |
End of period | 37,337,066 | $523,536,701 | 31,899,537 | $488,322,182 | |
4/1/22– 3/31/23 | 4/1/21– 3/31/22 | 4/1/20– 3/31/21 | 4/1/19– 3/31/20 | 4/1/18– 3/31/19 | ||
Per-Share Data | ||||||
Net asset value at beginning of period | $15.80 | $15.24 | $10.76 | $11.95 | $11.69 | |
Income (loss) from investment operations: | ||||||
Net investment income (loss)1 | 0.30 | 0.31 | 0.26 | 0.32 | 0.29 | |
Net realized and unrealized gains (losses) | (1.41 ) | 0.55 | 4.48 | (1.26 ) | 0.21 | |
Total from investment operations | (1.11 ) | 0.86 | 4.74 | (0.94 ) | 0.50 | |
Less distributions: | ||||||
Distributions from net investment income | (0.28 ) | (0.29 ) | (0.25 ) | (0.25 ) | (0.24 ) | |
Distributions from net realized gains | — | (0.01 ) | (0.01 ) | (0.00 )2 | — | |
Total distributions | (0.28 ) | (0.30 ) | (0.26 ) | (0.25 ) | (0.24 ) | |
Net asset value at end of period | $14.41 | $15.80 | $15.24 | $10.76 | $11.95 | |
Total return | (6.96 %) | 5.53 % | 44.07 % | (8.20 %) | 4.49 % | |
Ratios/Supplemental Data | ||||||
Ratios to average net assets: | ||||||
Net operating expenses3 | 0.04 %4 | 0.04 % | 0.04 % | 0.03 % | 0.03 % | |
Gross operating expenses3 | 0.08 %4 | 0.08 % | 0.08 % | 0.08 % | 0.08 % | |
Net investment income (loss) | 2.13 % | 1.90 % | 1.93 % | 2.54 % | 2.48 % | |
Portfolio turnover rate | 12 % | 9 % | 9 % | 7 % | 2 % | |
Net assets, end of period (x 1,000) | $659,892 | $631,308 | $473,638 | $249,144 | $143,404 | |
1 | Calculated based on the average shares outstanding during the period. |
2 | Per-share amount was less than $0.005. |
3 | Ratio excludes acquired fund fees and expenses, which are indirect expenses incurred by the fund through its investments in underlying funds. If the expenses incurred by the underlying funds were included in these ratios they would have increased by 0.04%, 0.04%, 0.04%, 0.05% and 0.05%, respectively, for the periods ended March 31, 2023, March 31, 2022, March 31, 2021, March 31, 2020 and March 31, 2019 (see financial note 4 for additional information). |
4 | Ratio includes less than 0.005% of non-routine proxy expenses. |
SECURITY | VALUE AT 3/31/22 | PURCHASES | SALES | REALIZED GAINS (LOSSES) | NET CHANGE IN UNREALIZED APPRECIATION (DEPRECIATION) | VALUE AT 3/31/23 | BALANCE OF SHARES HELD AT 3/31/23 | DISTRIBUTIONS RECEIVED(a) |
AFFILIATED UNDERLYING FUNDS 99.0% OF NET ASSETS | ||||||||
U.S. Stocks 51.0% | ||||||||
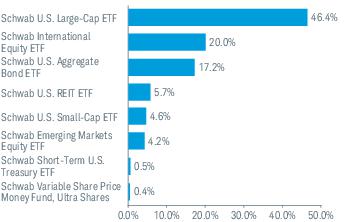
Large-Cap 46.4% | ||||||||
Schwab U.S. Large-Cap ETF | $284,637,314 | $66,607,885 | ($17,557,959) | ($2,482,892) | ($25,123,777) | $306,080,571 | 6,327,901 | $4,552,434 |
Small-Cap 4.6% | ||||||||
Schwab U.S. Small-Cap ETF | 30,345,731 | 7,396,186 | (3,805,007) | (658,606) | (2,559,589) | 30,718,715 | 732,619 | 429,281 |
336,799,286 | ||||||||
International Stocks 24.2% | ||||||||
Developed Markets 20.0% | ||||||||
Schwab International Equity ETF | 138,613,924 | 24,522,872 | (25,858,847) | (3,547,353) | (2,016,389) | 131,714,207 | 3,784,891 | 3,686,181 |
Emerging Markets 4.2% | ||||||||
Schwab Emerging Markets Equity ETF | 29,883,269 | 8,767,337 | (7,523,017) | (1,602,744) | (1,498,166) | 28,026,679 | 1,143,013 | 824,246 |
159,740,886 | ||||||||
Real Estate 5.7% | ||||||||
U.S. REITs 5.7% | ||||||||
Schwab U.S. REIT ETF | 36,835,284 | 11,465,707 | (2,581,952) | (276,917) | (7,731,072) | 37,711,050 | 1,933,900 | 971,390 |
Fixed Income 17.7% | ||||||||
Intermediate-Term Bond 17.2% | ||||||||
Schwab U.S. Aggregate Bond ETF | 97,678,281 | 33,387,370 | (10,537,146) | (1,647,328) | (5,487,323) | 113,393,854 | 2,417,264 | 2,559,787 |
Treasury Bond 0.5% | ||||||||
Schwab Short-Term U.S. Treasury ETF | 5,288,494 | 1,092,219 | (2,917,830) | (159,113) | 65,619 | 3,369,389 | 69,059 | 83,741 |
116,763,243 | ||||||||
Money Market Funds 0.4% | ||||||||
Schwab Variable Share Price Money Fund, Ultra Shares, 4.83% (b) | 2,364,319 | 60,856 | — | — | 227 | 2,425,402 | 2,425,160 | 66,648 |
Total Affiliated Underlying Funds (Cost $599,950,833) | $625,646,616 | $153,300,432 | ($70,781,758 ) | ($10,374,953 ) | ($44,350,470 ) | $653,439,867 | $13,173,708 | |
Total Investments in Securities (Cost $599,950,833) | $653,439,867 | |||||||
(a) | Distributions received include distributions from net investment income and capital gains, if any, from the underlying funds. Amounts shown are only presented for affiliated underlying funds, which are presented in the corresponding line-item in the Statement of Operations, if applicable (see financial note 2(d) for additional information). |
(b) | The rate shown is the annualized 7-day yield. |
ETF — | Exchange-traded fund |
REIT — | Real Estate Investment Trust |
Assets | ||
Investments in securities, at value - affiliated (cost $599,950,833) | $653,439,867 | |
Cash | 6,283,847 | |
Receivables: | ||
Investments sold | 3,573,332 | |
Fund shares sold | 747,858 | |
Dividends | + | 5,960 |
Total assets | 664,050,864 | |
Liabilities | ||
Payables: | ||
Investments bought | 3,720,658 | |
Fund shares redeemed | 419,387 | |
Investment adviser fees | + | 18,669 |
Total liabilities | 4,158,714 | |
Net assets | $659,892,150 | |
Net Assets by Source | ||
Capital received from investors | $618,330,177 | |
Total distributable earnings | + | 41,561,973 |
Net assets | $659,892,150 | |
Net Asset Value (NAV) | ||||
Net Assets | ÷ | Shares Outstanding | = | NAV |
$659,892,150 | 45,788,379 | $14.41 | ||
For the period April 1, 2022 through March 31, 2023 | ||
Investment Income | ||
Dividends received from securities - affiliated | $13,173,708 | |
Interest received from securities - unaffiliated | + | 70,352 |
Total investment income | 13,244,060 | |
Expenses | ||
Investment adviser fees | 490,175 | |
Proxy fees1 | + | 24,196 |
Total expenses | 514,371 | |
Expense reduction | – | 276,030 |
Net expenses | – | 238,341 |
Net investment income | 13,005,719 | |
REALIZED AND UNREALIZED GAINS (LOSSES) | ||
Net realized losses on sales of securities - affiliated | (10,374,953 ) | |
Net change in unrealized appreciation (depreciation) on securities - affiliated | + | (44,350,470 ) |
Net realized and unrealized losses | (54,725,423 ) | |
Decrease in net assets resulting from operations | ($41,719,704 ) | |
1 | Proxy fees are non-routine expenses (see financial note 2(e) for additional information). |
OPERATIONS | |||
4/1/22-3/31/23 | 4/1/21-3/31/22 | ||
Net investment income | $13,005,719 | $10,918,075 | |
Net realized losses | (10,374,953 ) | (1,552,332 ) | |
Net change in unrealized appreciation (depreciation) | + | (44,350,470 ) | 15,572,075 |
Increase (decrease) in net assets resulting from operations | ($41,719,704 ) | $24,937,818 | |
DISTRIBUTIONS TO SHAREHOLDERS | |||
Total distributions | ($12,175,890 ) | ($11,102,382 ) | |
TRANSACTIONS IN FUND SHARES | |||||
4/1/22-3/31/23 | 4/1/21-3/31/22 | ||||
SHARES | VALUE | SHARES | VALUE | ||
Shares sold | 11,739,938 | $166,584,592 | 13,419,419 | $216,624,618 | |
Shares reinvested | 873,881 | 11,910,999 | 652,842 | 10,895,926 | |
Shares redeemed | + | (6,792,556 ) | (96,016,059 ) | (5,187,654 ) | (83,686,188 ) |
Net transactions in fund shares | 5,821,263 | $82,479,532 | 8,884,607 | $143,834,356 | |
SHARES OUTSTANDING AND NET ASSETS | |||||
4/1/22-3/31/23 | 4/1/21-3/31/22 | ||||
SHARES | NET ASSETS | SHARES | NET ASSETS | ||
Beginning of period | 39,967,116 | $631,308,212 | 31,082,509 | $473,638,420 | |
Total increase | + | 5,821,263 | 28,583,938 | 8,884,607 | 157,669,792 |
End of period | 45,788,379 | $659,892,150 | 39,967,116 | $631,308,212 | |
4/1/22– 3/31/23 | 4/1/21– 3/31/22 | 4/1/20– 3/31/21 | 4/1/19– 3/31/20 | 4/1/18– 3/31/19 | ||
Per-Share Data | ||||||
Net asset value at beginning of period | $16.23 | $15.57 | $10.68 | $12.05 | $11.81 | |
Income (loss) from investment operations: | ||||||
Net investment income (loss)1 | 0.30 | 0.32 | 0.27 | 0.32 | 0.29 | |
Net realized and unrealized gains (losses) | (1.49 ) | 0.65 | 4.86 | (1.43 ) | 0.19 | |
Total from investment operations | (1.19 ) | 0.97 | 5.13 | (1.11 ) | 0.48 | |
Less distributions: | ||||||
Distributions from net investment income | (0.27 ) | (0.30 ) | (0.24 ) | (0.26 ) | (0.24 ) | |
Distributions from net realized gains | — | (0.01 ) | (0.00 )2 | (0.00 )2 | (0.00 )2 | |
Total distributions | (0.27 ) | (0.31 ) | (0.24 ) | (0.26 ) | (0.24 ) | |
Net asset value at end of period | $14.77 | $16.23 | $15.57 | $10.68 | $12.05 | |
Total return | (7.21 %) | 6.11 % | 48.20 % | (9.63 %) | 4.33 % | |
Ratios/Supplemental Data | ||||||
Ratios to average net assets: | ||||||
Net operating expenses3 | 0.04 %4 | 0.03 % | 0.03 % | 0.03 % | 0.03 % | |
Gross operating expenses3 | 0.08 %4 | 0.08 % | 0.08 % | 0.08 % | 0.08 % | |
Net investment income (loss) | 2.11 % | 1.92 % | 1.93 % | 2.54 % | 2.43 % | |
Portfolio turnover rate | 10 % | 10 % | 6 % | 6 % | 7 % | |
Net assets, end of period (x 1,000) | $410,566 | $361,870 | $274,502 | $135,960 | $84,790 | |
1 | Calculated based on the average shares outstanding during the period. |
2 | Per-share amount was less than $0.005. |
3 | Ratio excludes acquired fund fees and expenses, which are indirect expenses incurred by the fund through its investments in underlying funds. If the expenses incurred by the underlying funds were included in these ratios they would have increased by 0.04%, 0.05%, 0.05%, 0.05% and 0.05%, respectively, for the periods ended March 31, 2023, March 31, 2022, March 31, 2021, March 31, 2020 and March 31, 2019 (see financial note 4 for additional information). |
4 | Ratio includes less than 0.005% of non-routine proxy expenses. |
SECURITY | VALUE AT 3/31/22 | PURCHASES | SALES | REALIZED GAINS (LOSSES) | NET CHANGE IN UNREALIZED APPRECIATION (DEPRECIATION) | VALUE AT 3/31/23 | BALANCE OF SHARES HELD AT 3/31/23 | DISTRIBUTIONS RECEIVED(a) |
AFFILIATED UNDERLYING FUNDS 99.0% OF NET ASSETS | ||||||||
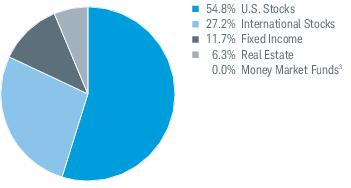
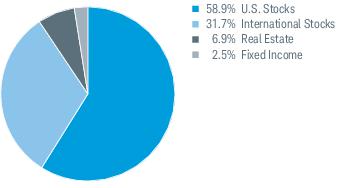
U.S. Stocks 54.3% | ||||||||
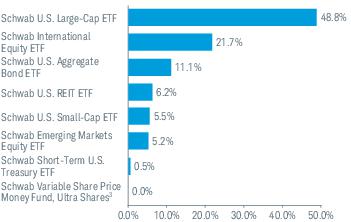
Large-Cap 48.8% | ||||||||
Schwab U.S. Large-Cap ETF | $171,177,411 | $55,619,947 | ($9,936,197) | ($1,325,200) | ($15,072,252) | $200,463,709 | 4,144,381 | $2,852,251 |
Small-Cap 5.5% | ||||||||
Schwab U.S. Small-Cap ETF | 20,291,676 | 6,637,471 | (2,322,123) | (415,471) | (1,829,529) | 22,362,024 | 533,318 | 297,623 |
222,825,733 | ||||||||
International Stocks 26.9% | ||||||||
Developed Markets 21.7% | ||||||||
Schwab International Equity ETF | 85,296,778 | 21,825,561 | (14,881,438) | (1,993,250) | (1,102,962) | 89,144,689 | 2,561,629 | 2,324,800 |
Emerging Markets 5.2% | ||||||||
Schwab Emerging Markets Equity ETF | 20,696,564 | 8,253,158 | (5,302,632) | (1,120,946) | (1,094,634) | 21,431,510 | 874,042 | 592,472 |
110,576,199 | ||||||||
Real Estate 6.2% | ||||||||
U.S. REITs 6.2% | ||||||||
Schwab U.S. REIT ETF | 22,666,278 | 9,106,600 | (1,331,941) | (127,907) | (4,989,687) | 25,323,343 | 1,298,633 | 625,216 |
Fixed Income 11.6% | ||||||||
Intermediate-Term Bond 11.1% | ||||||||
Schwab U.S. Aggregate Bond ETF | 36,708,763 | 15,321,277 | (3,670,136) | (579,690) | (2,134,110) | 45,646,104 | 973,057 | 995,224 |
Treasury Bond 0.5% | ||||||||
Schwab Short-Term U.S. Treasury ETF | 1,729,590 | 267,216 | — | — | (24,031) | 1,972,775 | 40,434 | 31,815 |
47,618,879 | ||||||||
Money Market Funds 0.0% | ||||||||
Schwab Variable Share Price Money Fund, Ultra Shares, 4.83% (b) | 45,994 | 1,184 | — | — | 4 | 47,182 | 47,178 | 1,297 |
Total Affiliated Underlying Funds (Cost $370,381,759) | $358,613,054 | $117,032,414 | ($37,444,467 ) | ($5,562,464 ) | ($26,247,201 ) | $406,391,336 | $7,720,698 | |
Total Investments in Securities (Cost $370,381,759) | $406,391,336 | |||||||
(a) | Distributions received include distributions from net investment income and capital gains, if any, from the underlying funds. Amounts shown are only presented for affiliated underlying funds, which are presented in the corresponding line-item in the Statement of Operations, if applicable (see financial note 2(d) for additional information). |
(b) | The rate shown is the annualized 7-day yield. |
ETF — | Exchange-traded fund |
REIT — | Real Estate Investment Trust |
Assets | ||
Investments in securities, at value - affiliated (cost $370,381,759) | $406,391,336 | |
Cash | 3,596,520 | |
Receivables: | ||
Investments sold | 2,764,400 | |
Fund shares sold | 724,559 | |
Dividends | + | 116 |
Total assets | 413,476,931 | |
Liabilities | ||
Payables: | ||
Investments bought | 2,657,910 | |
Fund shares redeemed | 242,276 | |
Investment adviser fees | + | 10,613 |
Total liabilities | 2,910,799 | |
Net assets | $410,566,132 | |
Net Assets by Source | ||
Capital received from investors | $381,077,768 | |
Total distributable earnings | + | 29,488,364 |
Net assets | $410,566,132 | |
Net Asset Value (NAV) | ||||
Net Assets | ÷ | Shares Outstanding | = | NAV |
$410,566,132 | 27,803,372 | $14.77 | ||
For the period April 1, 2022 through March 31, 2023 | ||
Investment Income | ||
Dividends received from securities - affiliated | $7,720,698 | |
Interest received from securities - unaffiliated | + | 44,890 |
Total investment income | 7,765,588 | |
Expenses | ||
Investment adviser fees | 290,621 | |
Proxy fees1 | + | 15,493 |
Total expenses | 306,114 | |
Expense reduction | – | 167,340 |
Net expenses | – | 138,774 |
Net investment income | 7,626,814 | |
REALIZED AND UNREALIZED GAINS (LOSSES) | ||
Net realized losses on sales of securities - affiliated | (5,562,464 ) | |
Net change in unrealized appreciation (depreciation) on securities - affiliated | + | (26,247,201 ) |
Net realized and unrealized losses | (31,809,665 ) | |
Decrease in net assets resulting from operations | ($24,182,851 ) | |
1 | Proxy fees are non-routine expenses (see financial note 2(e) for additional information). |
OPERATIONS | |||
4/1/22-3/31/23 | 4/1/21-3/31/22 | ||
Net investment income | $7,626,814 | $6,419,368 | |
Net realized losses | (5,562,464 ) | (782,759 ) | |
Net change in unrealized appreciation (depreciation) | + | (26,247,201 ) | 10,856,506 |
Increase (decrease) in net assets resulting from operations | ($24,182,851 ) | $16,493,115 | |
DISTRIBUTIONS TO SHAREHOLDERS | |||
Total distributions | ($7,098,974 ) | ($6,485,385 ) | |
TRANSACTIONS IN FUND SHARES | |||||
4/1/22-3/31/23 | 4/1/21-3/31/22 | ||||
SHARES | VALUE | SHARES | VALUE | ||
Shares sold | 8,058,666 | $117,091,678 | 7,697,234 | $127,427,006 | |
Shares reinvested | 495,210 | 6,908,182 | 369,233 | 6,336,041 | |
Shares redeemed | + | (3,044,724 ) | (44,021,515 ) | (3,397,304 ) | (56,403,521 ) |
Net transactions in fund shares | 5,509,152 | $79,978,345 | 4,669,163 | $77,359,526 | |
SHARES OUTSTANDING AND NET ASSETS | |||||
4/1/22-3/31/23 | 4/1/21-3/31/22 | ||||
SHARES | NET ASSETS | SHARES | NET ASSETS | ||
Beginning of period | 22,294,220 | $361,869,612 | 17,625,057 | $274,502,356 | |
Total increase | + | 5,509,152 | 48,696,520 | 4,669,163 | 87,367,256 |
End of period | 27,803,372 | $410,566,132 | 22,294,220 | $361,869,612 | |
4/1/22– 3/31/23 | 4/1/21– 3/31/22 | 4/1/20– 3/31/21 | 4/1/19– 3/31/20 | 4/1/18– 3/31/19 | ||
Per-Share Data | ||||||
Net asset value at beginning of period | $16.44 | $15.73 | $10.63 | $12.09 | $11.85 | |
Income (loss) from investment operations: | ||||||
Net investment income (loss)1 | 0.31 | 0.33 | 0.27 | 0.32 | 0.29 | |
Net realized and unrealized gains (losses) | (1.55 ) | 0.69 | 5.08 | (1.52 ) | 0.18 | |
Total from investment operations | (1.24 ) | 1.02 | 5.35 | (1.20 ) | 0.47 | |
Less distributions: | ||||||
Distributions from net investment income | (0.27 ) | (0.30 ) | (0.24 ) | (0.26 ) | (0.23 ) | |
Distributions from net realized gains | — | (0.01 ) | (0.01 ) | (0.00 )2 | — | |
Total distributions | (0.27 ) | (0.31 ) | (0.25 ) | (0.26 ) | (0.23 ) | |
Net asset value at end of period | $14.93 | $16.44 | $15.73 | $10.63 | $12.09 | |
Total return | (7.41 %) | 6.37 % | 50.43 % | (10.35 %) | 4.23 % | |
Ratios/Supplemental Data | ||||||
Ratios to average net assets: | ||||||
Net operating expenses3 | 0.04 %4 | 0.03 % | 0.03 % | 0.03 % | 0.03 % | |
Gross operating expenses3 | 0.08 %4 | 0.08 % | 0.08 % | 0.08 % | 0.08 % | |
Net investment income (loss) | 2.11 % | 1.94 % | 1.93 % | 2.55 % | 2.48 % | |
Portfolio turnover rate | 9 % | 8 % | 6 % | 3 % | 0 %5 | |
Net assets, end of period (x 1,000) | $511,144 | $449,921 | $321,048 | $146,944 | $88,727 | |
1 | Calculated based on the average shares outstanding during the period. |
2 | Per-share amount was less than $0.005. |
3 | Ratio excludes acquired fund fees and expenses, which are indirect expenses incurred by the fund through its investments in underlying funds. If the expenses incurred by the underlying funds were included in these ratios they would have increased by 0.04%, 0.05%, 0.05%, 0.05% and 0.05%, respectively, for the periods ended March 31, 2023, March 31, 2022, March 31, 2021, March 31, 2020 and March 31, 2019 (see financial note 4 for additional information). |
4 | Ratio includes less than 0.005% of non-routine proxy expenses. |
5 | Less than 0.5% |
SECURITY | VALUE AT 3/31/22 | PURCHASES | SALES | REALIZED GAINS (LOSSES) | NET CHANGE IN UNREALIZED APPRECIATION (DEPRECIATION) | VALUE AT 3/31/23 | BALANCE OF SHARES HELD AT 3/31/23 | DISTRIBUTIONS RECEIVED(a) |
AFFILIATED UNDERLYING FUNDS 99.3% OF NET ASSETS | ||||||||
U.S. Stocks 56.2% | ||||||||
Large-Cap 50.2% | ||||||||
Schwab U.S. Large-Cap ETF | $218,249,581 | $67,270,811 | ($8,343,040) | ($1,341,953) | ($19,324,210) | $256,511,189 | 5,303,105 | $3,593,585 |
Small-Cap 6.0% | ||||||||
Schwab U.S. Small-Cap ETF | 27,124,114 | 9,277,410 | (2,635,194) | (506,026) | (2,528,214) | 30,732,090 | 732,938 | 398,922 |
287,243,279 | ||||||||
International Stocks 28.8% | ||||||||
Developed Markets 22.8% | ||||||||
Schwab International Equity ETF | 110,560,028 | 28,270,176 | (18,003,156) | (2,614,721) | (1,358,138) | 116,854,189 | 3,357,879 | 2,994,205 |
Emerging Markets 6.0% | ||||||||
Schwab Emerging Markets Equity ETF | 28,832,813 | 10,268,571 | (5,580,590) | (1,234,770) | (1,802,269) | 30,483,755 | 1,243,220 | 814,225 |
147,337,944 | ||||||||
Real Estate 6.5% | ||||||||
U.S. REITs 6.5% | ||||||||
Schwab U.S. REIT ETF | 29,272,855 | 11,756,354 | (1,473,912) | (137,652) | (6,409,332) | 33,008,313 | 1,692,734 | 798,429 |
Fixed Income 7.8% | ||||||||
Intermediate-Term Bond 7.8% | ||||||||
Schwab U.S. Aggregate Bond ETF | 32,687,841 | 12,148,305 | (2,443,610) | (389,252) | (1,992,948) | 40,010,336 | 852,917 | 875,023 |
Money Market Funds 0.0% | ||||||||
Schwab Variable Share Price Money Fund, Ultra Shares, 4.83% (b) | 62,935 | 1,620 | — | — | 6 | 64,561 | 64,555 | 1,774 |
Total Affiliated Underlying Funds (Cost $468,672,365) | $446,790,167 | $138,993,247 | ($38,479,502 ) | ($6,224,374 ) | ($33,415,105 ) | $507,664,433 | $9,476,163 | |
Total Investments in Securities (Cost $468,672,365) | $507,664,433 | |||||||
(a) | Distributions received include distributions from net investment income and capital gains, if any, from the underlying funds. Amounts shown are only presented for affiliated underlying funds, which are presented in the corresponding line-item in the Statement of Operations, if applicable (see financial note 2(d) for additional information). |
(b) | The rate shown is the annualized 7-day yield. |
ETF — | Exchange-traded fund |
REIT — | Real Estate Investment Trust |
Assets | ||
Investments in securities, at value - affiliated (cost $468,672,365) | $507,664,433 | |
Cash | 4,374,485 | |
Receivables: | ||
Investments sold | 2,356,739 | |
Fund shares sold | 670,920 | |
Dividends | + | 159 |
Total assets | 515,066,736 | |
Liabilities | ||
Payables: | ||
Investments bought | 3,648,176 | |
Fund shares redeemed | 262,508 | |
Investment adviser fees | + | 12,517 |
Total liabilities | 3,923,201 | |
Net assets | $511,143,535 | |
Net Assets by Source | ||
Capital received from investors | $478,882,557 | |
Total distributable earnings | + | 32,260,978 |
Net assets | $511,143,535 | |
Net Asset Value (NAV) | ||||
Net Assets | ÷ | Shares Outstanding | = | NAV |
$511,143,535 | 34,232,170 | $14.93 | ||
For the period April 1, 2022 through March 31, 2023 | ||
Investment Income | ||
Dividends received from securities - affiliated | $9,476,163 | |
Interest received from securities - unaffiliated | + | 42,126 |
Total investment income | 9,518,289 | |
Expenses | ||
Investment adviser fees | 357,289 | |
Proxy fees1 | + | 18,993 |
Total expenses | 376,282 | |
Expense reduction | – | 210,224 |
Net expenses | – | 166,058 |
Net investment income | 9,352,231 | |
REALIZED AND UNREALIZED GAINS (LOSSES) | ||
Net realized losses on sales of securities - affiliated | (6,224,374 ) | |
Net change in unrealized appreciation (depreciation) on securities - affiliated | + | (33,415,105 ) |
Net realized and unrealized losses | (39,639,479 ) | |
Decrease in net assets resulting from operations | ($30,287,248 ) | |
1 | Proxy fees are non-routine expenses (see financial note 2(e) for additional information). |
OPERATIONS | |||
4/1/22-3/31/23 | 4/1/21-3/31/22 | ||
Net investment income | $9,352,231 | $7,695,423 | |
Net realized losses | (6,224,374 ) | (900,940 ) | |
Net change in unrealized appreciation (depreciation) | + | (33,415,105 ) | 12,823,606 |
Increase (decrease) in net assets resulting from operations | ($30,287,248 ) | $19,618,089 | |
DISTRIBUTIONS TO SHAREHOLDERS | |||
Total distributions | ($8,721,233 ) | ($7,672,924 ) | |
TRANSACTIONS IN FUND SHARES | |||||
4/1/22-3/31/23 | 4/1/21-3/31/22 | ||||
SHARES | VALUE | SHARES | VALUE | ||
Shares sold | 10,553,406 | $154,497,524 | 10,162,295 | $170,527,200 | |
Shares reinvested | 608,207 | 8,569,636 | 433,775 | 7,543,343 | |
Shares redeemed | + | (4,294,235 ) | (62,836,297 ) | (3,640,541 ) | (61,142,731 ) |
Net transactions in fund shares | 6,867,378 | $100,230,863 | 6,955,529 | $116,927,812 | |
SHARES OUTSTANDING AND NET ASSETS | |||||
4/1/22-3/31/23 | 4/1/21-3/31/22 | ||||
SHARES | NET ASSETS | SHARES | NET ASSETS | ||
Beginning of period | 27,364,792 | $449,921,153 | 20,409,263 | $321,048,176 | |
Total increase | + | 6,867,378 | 61,222,382 | 6,955,529 | 128,872,977 |
End of period | 34,232,170 | $511,143,535 | 27,364,792 | $449,921,153 | |
4/1/22– 3/31/23 | 4/1/21– 3/31/22 | 4/1/20– 3/31/21 | 4/1/19– 3/31/20 | 4/1/18– 3/31/19 | ||
Per-Share Data | ||||||
Net asset value at beginning of period | $16.62 | $15.88 | $10.60 | $12.14 | $11.91 | |
Income (loss) from investment operations: | ||||||
Net investment income (loss)1 | 0.31 | 0.33 | 0.27 | 0.32 | 0.31 | |
Net realized and unrealized gains (losses) | (1.57 ) | 0.73 | 5.25 | (1.60 ) | 0.15 | |
Total from investment operations | (1.26 ) | 1.06 | 5.52 | (1.28 ) | 0.46 | |
Less distributions: | ||||||
Distributions from net investment income | (0.27 ) | (0.31 ) | (0.24 ) | (0.26 ) | (0.23 ) | |
Distributions from net realized gains | — | (0.01 ) | (0.00 )2 | (0.00 )2 | — | |
Total distributions | (0.27 ) | (0.32 ) | (0.24 ) | (0.26 ) | (0.23 ) | |
Net asset value at end of period | $15.09 | $16.62 | $15.88 | $10.60 | $12.14 | |
Total return | (7.47 %) | 6.51 % | 52.24 % | (10.96 %) | 4.15 % | |
Ratios/Supplemental Data | ||||||
Ratios to average net assets: | ||||||
Net operating expenses3 | 0.04 %4 | 0.03 % | 0.03 % | 0.03 % | 0.03 % | |
Gross operating expenses3 | 0.08 %4 | 0.08 % | 0.08 % | 0.08 % | 0.08 % | |
Net investment income (loss) | 2.11 % | 1.94 % | 1.92 % | 2.57 % | 2.60 % | |
Portfolio turnover rate | 8 % | 7 % | 6 % | 3 % | 6 % | |
Net assets, end of period (x 1,000) | $335,615 | $278,992 | $189,841 | $84,957 | $50,403 | |
1 | Calculated based on the average shares outstanding during the period. |
2 | Per-share amount was less than $0.005. |
3 | Ratio excludes acquired fund fees and expenses, which are indirect expenses incurred by the fund through its investments in underlying funds. If the expenses incurred by the underlying funds were included in these ratios they would have increased by 0.04%, 0.05%, 0.05%, 0.05% and 0.05%, respectively, for the periods ended March 31, 2023, March 31, 2022, March 31, 2021, March 31, 2020 and March 31, 2019 (see financial note 4 for additional information). |
4 | Ratio includes less than 0.005% of non-routine proxy expenses. |
SECURITY | VALUE AT 3/31/22 | PURCHASES | SALES | REALIZED GAINS (LOSSES) | NET CHANGE IN UNREALIZED APPRECIATION (DEPRECIATION) | VALUE AT 3/31/23 | BALANCE OF SHARES HELD AT 3/31/23 | DISTRIBUTIONS RECEIVED(a) |
AFFILIATED UNDERLYING FUNDS 99.5% OF NET ASSETS | ||||||||
U.S. Stocks 57.3% | ||||||||
Large-Cap 50.9% | ||||||||
Schwab U.S. Large-Cap ETF | $137,049,489 | $52,220,518 | ($5,591,703) | ($888,360) | ($11,896,219) | $170,893,725 | 3,533,052 | $2,346,286 |
Small-Cap 6.4% | ||||||||
Schwab U.S. Small-Cap ETF | 17,625,876 | 7,180,401 | (1,541,633) | (295,948) | (1,678,864) | 21,289,832 | 507,747 | 270,069 |
192,183,557 | ||||||||
International Stocks 29.9% | ||||||||
Developed Markets 23.5% | ||||||||
Schwab International Equity ETF | 70,210,843 | 22,291,247 | (11,250,357) | (1,627,629) | (660,921) | 78,963,183 | 2,269,057 | 1,967,073 |
Emerging Markets 6.4% | ||||||||
Schwab Emerging Markets Equity ETF | 19,074,297 | 7,840,891 | (3,341,249) | (765,130) | (1,245,185) | 21,563,624 | 879,430 | 567,617 |
100,526,807 | ||||||||
Real Estate 6.6% | ||||||||
U.S. REITs 6.6% | ||||||||
Schwab U.S. REIT ETF | 18,630,588 | 8,753,286 | (903,632) | (93,112) | (4,155,609) | 22,231,521 | 1,140,078 | 527,500 |
Fixed Income 5.7% | ||||||||
Intermediate-Term Bond 5.7% | ||||||||
Schwab U.S. Aggregate Bond ETF | 14,668,991 | 6,049,063 | (626,373) | (103,378) | (957,807) | 19,030,496 | 405,681 | 406,134 |
Money Market Funds 0.0% | ||||||||
Schwab Variable Share Price Money Fund, Ultra Shares, 4.83% (b) | 66,699 | 1,717 | — | — | 6 | 68,422 | 68,415 | 1,880 |
Total Affiliated Underlying Funds (Cost $310,849,552) | $277,326,783 | $104,337,123 | ($23,254,947 ) | ($3,773,557 ) | ($20,594,599 ) | $334,040,803 | $6,086,559 | |
Total Investments in Securities (Cost $310,849,552) | $334,040,803 | |||||||
(a) | Distributions received include distributions from net investment income and capital gains, if any, from the underlying funds. Amounts shown are only presented for affiliated underlying funds, which are presented in the corresponding line-item in the Statement of Operations, if applicable (see financial note 2(d) for additional information). |
(b) | The rate shown is the annualized 7-day yield. |
ETF — | Exchange-traded fund |
REIT — | Real Estate Investment Trust |
Assets | ||
Investments in securities, at value - affiliated (cost $310,849,552) | $334,040,803 | |
Cash | 2,245,860 | |
Receivables: | ||
Investments sold | 1,740,511 | |
Fund shares sold | 500,095 | |
Dividends | + | 168 |
Total assets | 338,527,437 | |
Liabilities | ||
Payables: | ||
Investments bought | 2,575,953 | |
Fund shares redeemed | 328,736 | |
Investment adviser fees | + | 8,074 |
Total liabilities | 2,912,763 | |
Net assets | $335,614,674 | |
Net Assets by Source | ||
Capital received from investors | $316,693,775 | |
Total distributable earnings | + | 18,920,899 |
Net assets | $335,614,674 | |
Net Asset Value (NAV) | ||||
Net Assets | ÷ | Shares Outstanding | = | NAV |
$335,614,674 | 22,246,516 | $15.09 | ||
For the period April 1, 2022 through March 31, 2023 | ||
Investment Income | ||
Dividends received from securities - affiliated | $6,086,559 | |
Interest received from securities - unaffiliated | + | 22,628 |
Total investment income | 6,109,187 | |
Expenses | ||
Investment adviser fees | 228,671 | |
Proxy fees1 | + | 11,949 |
Total expenses | 240,620 | |
Expense reduction | – | 136,403 |
Net expenses | – | 104,217 |
Net investment income | 6,004,970 | |
REALIZED AND UNREALIZED GAINS (LOSSES) | ||
Net realized losses on sales of securities - affiliated | (3,773,557 ) | |
Net change in unrealized appreciation (depreciation) on securities - affiliated | + | (20,594,599 ) |
Net realized and unrealized losses | (24,368,156 ) | |
Decrease in net assets resulting from operations | ($18,363,186 ) | |
1 | Proxy fees are non-routine expenses (see financial note 2(e) for additional information). |
OPERATIONS | |||
4/1/22-3/31/23 | 4/1/21-3/31/22 | ||
Net investment income | $6,004,970 | $4,668,051 | |
Net realized losses | (3,773,557 ) | (499,859 ) | |
Net change in unrealized appreciation (depreciation) | + | (20,594,599 ) | 8,024,938 |
Increase (decrease) in net assets resulting from operations | ($18,363,186 ) | $12,193,130 | |
DISTRIBUTIONS TO SHAREHOLDERS | |||
Total distributions | ($5,564,651 ) | ($4,624,727 ) | |
TRANSACTIONS IN FUND SHARES | |||||
4/1/22-3/31/23 | 4/1/21-3/31/22 | ||||
SHARES | VALUE | SHARES | VALUE | ||
Shares sold | 7,374,138 | $109,006,129 | 6,778,512 | $114,807,471 | |
Shares reinvested | 378,477 | 5,385,728 | 254,269 | 4,472,592 | |
Shares redeemed | + | (2,292,071 ) | (33,841,112 ) | (2,205,164 ) | (37,697,947 ) |
Net transactions in fund shares | 5,460,544 | $80,550,745 | 4,827,617 | $81,582,116 | |
SHARES OUTSTANDING AND NET ASSETS | |||||
4/1/22-3/31/23 | 4/1/21-3/31/22 | ||||
SHARES | NET ASSETS | SHARES | NET ASSETS | ||
Beginning of period | 16,785,972 | $278,991,766 | 11,958,355 | $189,841,247 | |
Total increase | + | 5,460,544 | 56,622,908 | 4,827,617 | 89,150,519 |
End of period | 22,246,516 | $335,614,674 | 16,785,972 | $278,991,766 | |
4/1/22– 3/31/23 | 4/1/21– 3/31/22 | 4/1/20– 3/31/21 | 4/1/19– 3/31/20 | 4/1/18– 3/31/19 | ||
Per-Share Data | ||||||
Net asset value at beginning of period | $16.73 | $15.95 | $10.55 | $12.16 | $11.92 | |
Income (loss) from investment operations: | ||||||
Net investment income (loss)1 | 0.31 | 0.33 | 0.27 | 0.32 | 0.30 | |
Net realized and unrealized gains (losses) | (1.59 ) | 0.77 | 5.38 | (1.66 ) | 0.17 | |
Total from investment operations | (1.28 ) | 1.10 | 5.65 | (1.34 ) | 0.47 | |
Less distributions: | ||||||
Distributions from net investment income | (0.28 ) | (0.31 ) | (0.24 ) | (0.27 ) | (0.23 ) | |
Distributions from net realized gains | — | (0.01 ) | (0.01 ) | (0.00 )2 | (0.00 )2 | |
Total distributions | (0.28 ) | (0.32 ) | (0.25 ) | (0.27 ) | (0.23 ) | |
Net asset value at end of period | $15.17 | $16.73 | $15.95 | $10.55 | $12.16 | |
Total return | (7.56 %) | 6.74 % | 53.70 % | (11.50 %) | 4.23 % | |
Ratios/Supplemental Data | ||||||
Ratios to average net assets: | ||||||
Net operating expenses3 | 0.04 %4 | 0.03 % | 0.03 % | 0.03 % | 0.03 % | |
Gross operating expenses3 | 0.08 %4 | 0.08 % | 0.08 % | 0.08 % | 0.08 % | |
Net investment income (loss) | 2.10 % | 1.95 % | 1.92 % | 2.54 % | 2.50 % | |
Portfolio turnover rate | 8 % | 6 % | 7 % | 4 % | 2 % | |
Net assets, end of period (x 1,000) | $400,706 | $345,015 | $226,973 | $100,674 | $58,895 | |
1 | Calculated based on the average shares outstanding during the period. |
2 | Per-share amount was less than $0.005. |
3 | Ratio excludes acquired fund fees and expenses, which are indirect expenses incurred by the fund through its investments in underlying funds. If the expenses incurred by the underlying funds were included in these ratios they would have increased by 0.04%, 0.05%, 0.05%, 0.05% and 0.05%, respectively, for the periods ended March 31, 2023, March 31, 2022, March 31, 2021, March 31, 2020 and March 31, 2019 (see financial note 4 for additional information). |
4 | Ratio includes less than 0.005% of non-routine proxy expenses. |
SECURITY | VALUE AT 3/31/22 | PURCHASES | SALES | REALIZED GAINS (LOSSES) | NET CHANGE IN UNREALIZED APPRECIATION (DEPRECIATION) | VALUE AT 3/31/23 | BALANCE OF SHARES HELD AT 3/31/23 | DISTRIBUTIONS RECEIVED(a) |
AFFILIATED UNDERLYING FUNDS 99.5% OF NET ASSETS | ||||||||
U.S. Stocks 58.1% | ||||||||
Large-Cap 51.5% | ||||||||
Schwab U.S. Large-Cap ETF | $171,493,026 | $57,856,199 | ($6,691,093) | ($1,150,480) | ($15,225,709) | $206,281,943 | 4,264,667 | $2,869,586 |
Small-Cap 6.6% | ||||||||
Schwab U.S. Small-Cap ETF | 22,836,234 | 7,939,951 | (1,584,520) | (329,300) | (2,309,354) | 26,553,011 | 633,270 | 342,640 |
232,834,954 | ||||||||
International Stocks 30.9% | ||||||||
Developed Markets 24.1% | ||||||||
Schwab International Equity ETF | 88,809,523 | 24,312,951 | (13,423,543) | (1,979,464) | (1,217,083) | 96,502,384 | 2,773,057 | 2,438,165 |
Emerging Markets 6.8% | ||||||||
Schwab Emerging Markets Equity ETF | 25,014,772 | 10,275,012 | (5,349,190) | (1,296,928) | (1,334,443) | 27,309,223 | 1,113,753 | 714,642 |
123,811,607 | ||||||||
Real Estate 6.8% | ||||||||
U.S. REITs 6.8% | ||||||||
Schwab U.S. REIT ETF | 23,469,453 | 9,973,347 | (1,049,278) | (88,829) | (5,214,045) | 27,090,648 | 1,389,264 | 650,590 |
Fixed Income 3.7% | ||||||||
Intermediate-Term Bond 3.7% | ||||||||
Schwab U.S. Aggregate Bond ETF | 11,274,935 | 4,539,443 | (217,152) | (39,250) | (773,304) | 14,784,672 | 315,171 | 309,191 |
Total Affiliated Underlying Funds (Cost $371,842,451) | $342,897,943 | $114,896,903 | ($28,314,776 ) | ($4,884,251 ) | ($26,073,938 ) | $398,521,881 | $7,324,814 | |
Total Investments in Securities (Cost $371,842,451) | $398,521,881 | |||||||
(a) | Distributions received include distributions from net investment income and capital gains, if any, from the underlying funds. Amounts shown are only presented for affiliated underlying funds, which are presented in the corresponding line-item in the Statement of Operations, if applicable (see financial note 2(d) for additional information). |
ETF — | Exchange-traded fund |
REIT — | Real Estate Investment Trust |
Assets | ||
Investments in securities, at value - affiliated (cost $371,842,451) | $398,521,881 | |
Cash | 2,306,970 | |
Receivables: | ||
Investments sold | 2,763,842 | |
Fund shares sold | + | 612,495 |
Total assets | 404,205,188 | |
Liabilities | ||
Payables: | ||
Investments bought | 3,277,399 | |
Fund shares redeemed | 212,310 | |
Investment adviser fees | + | 9,643 |
Total liabilities | 3,499,352 | |
Net assets | $400,705,836 | |
Net Assets by Source | ||
Capital received from investors | $379,965,617 | |
Total distributable earnings | + | 20,740,219 |
Net assets | $400,705,836 | |
Net Asset Value (NAV) | ||||
Net Assets | ÷ | Shares Outstanding | = | NAV |
$400,705,836 | 26,418,686 | $15.17 | ||
For the period April 1, 2022 through March 31, 2023 | ||
Investment Income | ||
Dividends received from securities - affiliated | $7,324,814 | |
Interest received from securities - unaffiliated | + | 28,330 |
Total investment income | 7,353,144 | |
Expenses | ||
Investment adviser fees | 276,917 | |
Proxy fees1 | + | 14,665 |
Total expenses | 291,582 | |
Expense reduction | – | 166,886 |
Net expenses | – | 124,696 |
Net investment income | 7,228,448 | |
REALIZED AND UNREALIZED GAINS (LOSSES) | ||
Net realized losses on sales of securities - affiliated | (4,884,251 ) | |
Net change in unrealized appreciation (depreciation) on securities - affiliated | + | (26,073,938 ) |
Net realized and unrealized losses | (30,958,189 ) | |
Decrease in net assets resulting from operations | ($23,729,741 ) | |
1 | Proxy fees are non-routine expenses (see financial note 2(e) for additional information). |
OPERATIONS | |||
4/1/22-3/31/23 | 4/1/21-3/31/22 | ||
Net investment income | $7,228,448 | $5,754,499 | |
Net realized losses | (4,884,251 ) | (709,421 ) | |
Net change in unrealized appreciation (depreciation) | + | (26,073,938 ) | 9,723,828 |
Increase (decrease) in net assets resulting from operations | ($23,729,741 ) | $14,768,906 | |
DISTRIBUTIONS TO SHAREHOLDERS | |||
Total distributions | ($6,727,461 ) | ($5,689,319 ) | |
TRANSACTIONS IN FUND SHARES | |||||
4/1/22-3/31/23 | 4/1/21-3/31/22 | ||||
SHARES | VALUE | SHARES | VALUE | ||
Shares sold | 9,052,104 | $134,455,017 | 8,866,949 | $151,012,110 | |
Shares reinvested | 458,159 | 6,551,670 | 313,021 | 5,543,605 | |
Shares redeemed | + | (3,712,742 ) | (54,858,819 ) | (2,789,127 ) | (47,592,743 ) |
Net transactions in fund shares | 5,797,521 | $86,147,868 | 6,390,843 | $108,962,972 | |
SHARES OUTSTANDING AND NET ASSETS | |||||
4/1/22-3/31/23 | 4/1/21-3/31/22 | ||||
SHARES | NET ASSETS | SHARES | NET ASSETS | ||
Beginning of period | 20,621,165 | $345,015,170 | 14,230,322 | $226,972,611 | |
Total increase | + | 5,797,521 | 55,690,666 | 6,390,843 | 118,042,559 |
End of period | 26,418,686 | $400,705,836 | 20,621,165 | $345,015,170 | |
4/1/22– 3/31/23 | 4/1/21– 3/31/22 | 2/26/211– 3/31/21 | ||||
Per-Share Data | ||||||
Net asset value at beginning of period | $10.76 | $10.21 | $10.00 | |||
Income (loss) from investment operations: | ||||||
Net investment income (loss)2 | 0.20 | 0.25 | 0.02 | |||
Net realized and unrealized gains (losses) | (1.03 ) | 0.44 3 | 0.19 | |||
Total from investment operations | (0.83 ) | 0.69 | 0.21 | |||
Less distributions: | ||||||
Distributions from net investment income | (0.16 ) | (0.14 ) | — | |||
Net asset value at end of period | $9.77 | $10.76 | $10.21 | |||
Total return | (7.58 %) | 6.69 % | 2.10 %4 | |||
Ratios/Supplemental Data | ||||||
Ratios to average net assets: | ||||||
Net operating expenses5 | 0.03 %6 | 0.03 % | 0.04 %7 | |||
Gross operating expenses5 | 0.08 %6 | 0.08 % | 0.08 %7 | |||
Net investment income (loss) | 2.13 % | 2.30 % | 2.46 %7 | |||
Portfolio turnover rate | 19 % | 19 % | 0 %4,8 | |||
Net assets, end of period (x 1,000) | $48,311 | $29,071 | $1,820 | |||
1 | Commencement of operations. |
2 | Calculated based on the average shares outstanding during the period. |
3 | The per share amount does not accord with the change in aggregate gains and losses in securities during the period because of the timing of fund transactions in relation to fluctuating market values. |
4 | Not annualized. |
5 | Ratio excludes acquired fund fees and expenses, which are indirect expenses incurred by the fund through its investments in underlying funds. If the expenses incurred by the underlying funds were included in these ratios they would have increased by 0.05%, 0.05% and 0.04% (annualized), respectively, for the periods ended March 31, 2023, March 31, 2022 and March 31, 2021 (see financial note 4 for additional information). |
6 | Ratio includes less than 0.005% of non-routine proxy expenses. |
7 | Annualized. |
8 | Portfolio turnover was 0%; portfolio turnover is calculated by factoring in the lesser of long-term purchases or sales of securities. The fund had no sales of securities during the period. |
SECURITY | VALUE AT 3/31/22 | PURCHASES | SALES | REALIZED GAINS (LOSSES) | NET CHANGE IN UNREALIZED APPRECIATION (DEPRECIATION) | VALUE AT 3/31/23 | BALANCE OF SHARES HELD AT 3/31/23 | DISTRIBUTIONS RECEIVED(a) |
AFFILIATED UNDERLYING FUNDS 99.5% OF NET ASSETS | ||||||||
U.S. Stocks 58.7% | ||||||||
Large-Cap 51.9% | ||||||||
Schwab U.S. Large-Cap ETF | $14,477,626 | $14,850,873 | ($3,012,951) | ($558,483) | ($703,872) | $25,053,193 | 517,949 | $308,359 |
Small-Cap 6.8% | ||||||||
Schwab U.S. Small-Cap ETF | 1,973,302 | 1,986,773 | (434,344) | (89,185) | (148,940) | 3,287,606 | 78,407 | 37,073 |
28,340,799 | ||||||||
International Stocks 31.5% | ||||||||
Developed Markets 24.4% | ||||||||
Schwab International Equity ETF | 7,610,147 | 6,783,906 | (2,501,182) | (480,730) | 396,578 | 11,808,719 | 339,331 | 253,234 |
Emerging Markets 7.1% | ||||||||
Schwab Emerging Markets Equity ETF | 2,169,031 | 2,059,167 | (575,513) | (133,377) | (104,236) | 3,415,072 | 139,277 | 77,978 |
15,223,791 | ||||||||
Real Estate 6.8% | ||||||||
U.S. REITs 6.8% | ||||||||
Schwab U.S. REIT ETF | 1,970,168 | 2,185,248 | (311,666) | (58,735) | (475,846) | 3,309,169 | 169,701 | 69,795 |
Fixed Income 2.5% | ||||||||
Intermediate-Term Bond 2.5% | ||||||||
Schwab U.S. Aggregate Bond ETF | 703,580 | 540,450 | — | — | (54,299) | 1,189,731 | 25,362 | 23,354 |
Total Affiliated Underlying Funds (Cost $49,546,694) | $28,903,854 | $28,406,417 | ($6,835,656 ) | ($1,320,510 ) | ($1,090,615 ) | $48,063,490 | $769,793 | |
Total Investments in Securities (Cost $49,546,694) | $48,063,490 | |||||||
(a) | Distributions received include distributions from net investment income and capital gains, if any, from the underlying funds. Amounts shown are only presented for affiliated underlying funds, which are presented in the corresponding line-item in the Statement of Operations, if applicable (see financial note 2(d) for additional information). |
ETF — | Exchange-traded fund |
REIT — | Real Estate Investment Trust |
Assets | ||
Investments in securities, at value - affiliated (cost $49,546,694) | $48,063,490 | |
Cash | 321,467 | |
Receivables: | ||
Investments sold | 301,717 | |
Fund shares sold | + | 99,054 |
Total assets | 48,785,728 | |
Liabilities | ||
Payables: | ||
Investments bought | 400,079 | |
Fund shares redeemed | 73,944 | |
Investment adviser fees | + | 792 |
Total liabilities | 474,815 | |
Net assets | $48,310,913 | |
Net Assets by Source | ||
Capital received from investors | $51,163,005 | |
Total distributable loss | + | (2,852,092 ) |
Net assets | $48,310,913 | |
Net Asset Value (NAV) | ||||
Net Assets | ÷ | Shares Outstanding | = | NAV |
$48,310,913 | 4,944,435 | $9.77 | ||
For the period April 1, 2022 through March 31, 2023 | ||
Investment Income | ||
Dividends received from securities - affiliated | $769,793 | |
Interest received from securities - unaffiliated | + | 3,528 |
Total investment income | 773,321 | |
Expenses | ||
Investment adviser fees | 28,731 | |
Proxy fees1 | + | 1,327 |
Total expenses | 30,058 | |
Expense reduction | – | 18,185 |
Net expenses | – | 11,873 |
Net investment income | 761,448 | |
REALIZED AND UNREALIZED GAINS (LOSSES) | ||
Net realized losses on sales of securities - affiliated | (1,320,510 ) | |
Net change in unrealized appreciation (depreciation) on securities - affiliated | + | (1,090,615 ) |
Net realized and unrealized losses | (2,411,125 ) | |
Decrease in net assets resulting from operations | ($1,649,677 ) | |
1 | Proxy fees are non-routine expenses (see financial note 2(e) for additional information). |
OPERATIONS | |||
4/1/22-3/31/23 | 4/1/21-3/31/22 | ||
Net investment income | $761,448 | $340,443 | |
Net realized losses | (1,320,510 ) | (174,445 ) | |
Net change in unrealized appreciation (depreciation) | + | (1,090,615 ) | (409,849 ) |
Decrease in net assets from operations | ($1,649,677 ) | ($243,851 ) | |
DISTRIBUTIONS TO SHAREHOLDERS | |||
Total distributions | ($683,278 ) | ($294,976 ) | |
TRANSACTIONS IN FUND SHARES | |||||
4/1/22-3/31/23 | 4/1/21-3/31/22 | ||||
SHARES | VALUE | SHARES | VALUE | ||
Shares sold | 3,228,980 | $30,903,737 | 2,995,048 | $32,934,520 | |
Shares reinvested | 71,550 | 658,971 | 24,515 | 279,218 | |
Shares redeemed | + | (1,056,735 ) | (9,989,477 ) | (497,239 ) | (5,424,360 ) |
Net transactions in fund shares | 2,243,795 | $21,573,231 | 2,522,324 | $27,789,378 | |
SHARES OUTSTANDING AND NET ASSETS | |||||
4/1/22-3/31/23 | 4/1/21-3/31/22 | ||||
SHARES | NET ASSETS | SHARES | NET ASSETS | ||
Beginning of period | 2,700,640 | $29,070,637 | 178,316 | $1,820,086 | |
Total increase | + | 2,243,795 | 19,240,276 | 2,522,324 | 27,250,551 |
End of period | 4,944,435 | $48,310,913 | 2,700,640 | $29,070,637 | |
SCHWAB CAPITAL TRUST (ORGANIZED MAY 7, 1993) | |
Schwab Target 2010 Index Fund | Schwab Dividend Equity Fund |
Schwab Target 2015 Index Fund | Schwab Large-Cap Growth Fund |
Schwab Target 2020 Index Fund | Schwab Small-Cap Equity Fund |
Schwab Target 2025 Index Fund | Schwab Health Care Fund |
Schwab Target 2030 Index Fund | Schwab International Core Equity Fund |
Schwab Target 2035 Index Fund | Schwab Target 2010 Fund |
Schwab Target 2040 Index Fund | Schwab Target 2015 Fund |
Schwab Target 2045 Index Fund | Schwab Target 2020 Fund |
Schwab Target 2050 Index Fund | Schwab Target 2025 Fund |
Schwab Target 2055 Index Fund | Schwab Target 2030 Fund |
Schwab Target 2060 Index Fund | Schwab Target 2035 Fund |
Schwab Target 2065 Index Fund | Schwab Target 2040 Fund |
Schwab S&P 500 Index Fund | Schwab Target 2045 Fund |
Schwab Small-Cap Index Fund® | Schwab Target 2050 Fund |
Schwab Total Stock Market Index Fund® | Schwab Target 2055 Fund |
Schwab U.S. Large-Cap Growth Index Fund | Schwab Target 2060 Fund |
Schwab U.S. Large-Cap Value Index Fund | Schwab Target 2065 Fund |
Schwab U.S. Mid-Cap Index Fund | Schwab Fundamental US Large Company Index Fund |
Schwab International Index Fund® | Schwab Fundamental US Small Company Index Fund |
Schwab MarketTrack All Equity Portfolio™ | Schwab Fundamental International Large Company Index Fund |
Schwab MarketTrack Growth Portfolio™ | Schwab Fundamental International Small Company Index Fund |
Schwab MarketTrack Balanced Portfolio™ | Schwab Fundamental Emerging Markets Large Company Index Fund |
Schwab MarketTrack Conservative Portfolio™ | Schwab Fundamental Global Real Estate Index Fund |
Schwab International Opportunities Fund | Schwab Monthly Income Fund - Target Payout |
Schwab Balanced Fund | Schwab Monthly Income Fund - Flexible Payout |
Schwab Core Equity Fund | Schwab Monthly Income Fund - Income Payout |
2. Significant Accounting Policies:
3. Risk Factors:
4. Affiliates and Affiliated Transactions:
UNDERLYING FUNDS | SCHWAB TARGET 2010 INDEX FUND | SCHWAB TARGET 2015 INDEX FUND | SCHWAB TARGET 2020 INDEX FUND | SCHWAB TARGET 2025 INDEX FUND | SCHWAB TARGET 2030 INDEX FUND | SCHWAB TARGET 2035 INDEX FUND | SCHWAB TARGET 2040 INDEX FUND | SCHWAB TARGET 2045 INDEX FUND | SCHWAB TARGET 2050 INDEX FUND | SCHWAB TARGET 2055 INDEX FUND | SCHWAB TARGET 2060 INDEX FUND | SCHWAB TARGET 2065 INDEX FUND |
Schwab Emerging Markets Equity ETF | — % | — % | — % | 0.1 % | 0.2 % | 0.2 % | 0.3 % | 0.2 % | 0.4 % | 0.3 % | 0.3 % | 0.0 %* |
Schwab International Equity ETF | 0.0 %* | 0.0 %* | 0.1 % | 0.2 % | 0.4 % | 0.3 % | 0.4 % | 0.3 % | 0.4 % | 0.3 % | 0.3 % | 0.0 %* |
Schwab Short-Term U.S. Treasury ETF | 0.0 %* | 0.0 %* | 0.1 % | 0.2 % | 0.1 % | 0.0 %* | 0.0 %* | 0.0 %* | — % | — % | — % | — % |
Schwab U.S. Aggregate Bond ETF | 0.3 % | 0.3 % | 1.5 % | 2.5 % | 3.5 % | 1.8 % | 1.6 % | 0.6 % | 0.6 % | 0.3 % | 0.2 % | 0.0 %* |
Schwab U.S. Large-Cap ETF | 0.0 %* | 0.0 %* | 0.2 % | 0.5 % | 1.0 % | 0.7 % | 1.0 % | 0.6 % | 0.8 % | 0.6 % | 0.7 % | 0.1 % |
Schwab U.S. REIT ETF | 0.0 %* | 0.0 %* | 0.1 % | 0.3 % | 0.6 % | 0.5 % | 0.7 % | 0.4 % | 0.6 % | 0.4 % | 0.5 % | 0.1 % |
Schwab U.S. Small-Cap ETF | 0.0 %* | 0.0 %* | 0.0 %* | 0.1 % | 0.2 % | 0.1 % | 0.2 % | 0.2 % | 0.2 % | 0.2 % | 0.2 % | 0.0 %* |
Schwab U.S. TIPS ETF | 0.0 %* | 0.0 %* | 0.1 % | 0.2 % | 0.1 % | — % | — % | — % | — % | — % | — % | — % |
Schwab Variable Share Price Money Fund, Ultra Shares | 0.0 %* | 0.0 %* | 0.2 % | 0.2 % | 0.3 % | 0.1 % | 0.1 % | 0.0 %* | 0.0 %* | 0.0 %* | — % | — % |
* | Less than 0.05% |
PURCHASE COST | SALE PROCEEDS | REALIZED GAINS (LOSSES) | |
Schwab Target 2010 Index Fund | $141,449 | $2,184,633 | ($144,387) |
Schwab Target 2015 Index Fund | 195,603 | 4,176,079 | (113,940 ) |
Schwab Target 2020 Index Fund | 1,661,606 | 7,466,579 | (500,104 ) |
Schwab Target 2025 Index Fund | 1,409,442 | 9,437,993 | (896,879 ) |
Schwab Target 2030 Index Fund | 1,329,098 | 2,732,555 | (322,065 ) |
Schwab Target 2035 Index Fund | 4,644,934 | 1,563,495 | (258,299 ) |
Schwab Target 2040 Index Fund | 2,990,887 | 1,407,088 | (216,397 ) |
Schwab Target 2045 Index Fund | 2,627,159 | 1,953,763 | (299,787 ) |
Schwab Target 2050 Index Fund | 5,274,809 | 1,000,694 | (148,008 ) |
Schwab Target 2055 Index Fund | 5,610,703 | 182,035 | (32,720 ) |
Schwab Target 2060 Index Fund | 5,813,594 | 157,768 | (29,101 ) |
Schwab Target 2065 Index Fund | 2,051,018 | 911,573 | (198,261 ) |
6. Borrowing from Banks:
7. Purchases and Sales of Investment Securities:
PURCHASES OF SECURITIES | SALES OF SECURITIES | |
Schwab Target 2010 Index Fund | $7,077,770 | $13,830,718 |
Schwab Target 2015 Index Fund | 11,104,286 | 23,286,503 |
Schwab Target 2020 Index Fund | 45,747,624 | 60,819,420 |
Schwab Target 2025 Index Fund | 88,878,610 | 86,743,760 |
Schwab Target 2030 Index Fund | 172,546,799 | 102,879,575 |
Schwab Target 2035 Index Fund | 136,501,690 | 62,053,694 |
Schwab Target 2040 Index Fund | 153,300,432 | 70,781,758 |
Schwab Target 2045 Index Fund | 117,032,414 | 37,444,467 |
Schwab Target 2050 Index Fund | 138,993,247 | 38,479,502 |
Schwab Target 2055 Index Fund | 104,337,123 | 23,254,947 |
Schwab Target 2060 Index Fund | 114,896,903 | 28,314,776 |
Schwab Target 2065 Index Fund | 28,406,417 | 6,835,656 |
TAX COST | GROSS UNREALIZED APPRECIATION | GROSS UNREALIZED DEPRECIATION | NET UNREALIZED APPRECIATION (DEPRECIATION) | |
Schwab Target 2010 Index Fund | $42,070,960 | $4,719,345 | ($3,092,403) | $1,626,942 |
Schwab Target 2015 Index Fund | 53,425,750 | 6,925,109 | (3,392,889 ) | 3,532,220 |
Schwab Target 2020 Index Fund | 236,287,640 | 27,664,887 | (16,683,796 ) | 10,981,091 |
Schwab Target 2025 Index Fund | 450,521,772 | 53,853,164 | (31,127,468 ) | 22,725,696 |
Schwab Target 2030 Index Fund | 757,388,148 | 82,070,934 | (42,322,617 ) | 39,748,317 |
Schwab Target 2035 Index Fund | 487,075,754 | 53,613,581 | (23,598,166 ) | 30,015,415 |
Schwab Target 2040 Index Fund | 608,578,361 | 68,347,412 | (23,485,906 ) | 44,861,506 |
Schwab Target 2045 Index Fund | 376,235,609 | 42,880,325 | (12,724,598 ) | 30,155,727 |
Schwab Target 2050 Index Fund | 475,320,480 | 46,915,740 | (14,571,787 ) | 32,343,953 |
Schwab Target 2055 Index Fund | 315,484,383 | 27,876,910 | (9,320,490 ) | 18,556,420 |
Schwab Target 2060 Index Fund | 378,059,414 | 31,701,933 | (11,239,466 ) | 20,462,467 |
Schwab Target 2065 Index Fund | 51,028,076 | - | (2,964,586 ) | (2,964,586 ) |
UNDISTRIBUTED ORDINARY INCOME | NET UNREALIZED APPRECIATION (DEPRECIATION) ON INVESTMENTS | CAPITAL LOSS CARRYFORWARDS AND OTHER LOSSES | TOTAL | |
Schwab Target 2010 Index Fund | $285,015 | $1,626,942 | ($505,437) | $1,406,520 |
Schwab Target 2015 Index Fund | 357,954 | 3,532,220 | (609,539 ) | 3,280,635 |
Schwab Target 2020 Index Fund | 1,714,855 | 10,981,091 | (2,370,376 ) | 10,325,570 |
Schwab Target 2025 Index Fund | 1,824,074 | 22,725,696 | (4,111,557 ) | 20,438,213 |
Schwab Target 2030 Index Fund | 2,830,220 | 39,748,317 | (7,176,349 ) | 35,402,188 |
Schwab Target 2035 Index Fund | 1,719,016 | 30,015,415 | (2,990,336 ) | 28,744,095 |
Schwab Target 2040 Index Fund | 2,023,002 | 44,861,506 | (5,322,535 ) | 41,561,973 |
Schwab Target 2045 Index Fund | 1,179,248 | 30,155,727 | (1,846,611 ) | 29,488,364 |
Schwab Target 2050 Index Fund | 1,403,591 | 32,343,953 | (1,486,566 ) | 32,260,978 |
Schwab Target 2055 Index Fund | 903,884 | 18,556,420 | (539,405 ) | 18,920,899 |
Schwab Target 2060 Index Fund | 1,057,729 | 20,462,467 | (779,977 ) | 20,740,219 |
Schwab Target 2065 Index Fund | 126,067 | (2,964,586 ) | (13,573 ) | (2,852,092 ) |
Schwab Target 2010 Index Fund | $505,437 |
Schwab Target 2015 Index Fund | 609,539 |
Schwab Target 2020 Index Fund | 2,370,376 |
Schwab Target 2025 Index Fund | 4,111,557 |
Schwab Target 2030 Index Fund | 7,176,349 |
Schwab Target 2035 Index Fund | 2,990,336 |
Schwab Target 2040 Index Fund | 5,322,535 |
Schwab Target 2045 Index Fund | 1,846,611 |
Schwab Target 2050 Index Fund | 1,486,566 |
Schwab Target 2055 Index Fund | 539,405 |
Schwab Target 2060 Index Fund | 779,977 |
Schwab Target 2065 Index Fund | 13,573 |
CURRENT FISCAL YEAR END DISTRIBUTIONS | PRIOR FISCAL YEAR END DISTRIBUTIONS | |||
ORDINARY INCOME | LONG-TERM CAPITAL GAINS | ORDINARY INCOME | LONG-TERM CAPITAL GAINS | |
Schwab Target 2010 Index Fund | $1,027,269 | $102,167 | $1,158,303 | $302,416 |
Schwab Target 2015 Index Fund | 1,372,764 | 126,009 | 1,536,817 | 589,578 |
Schwab Target 2020 Index Fund | 5,290,898 | 729,579 | 6,195,620 | 1,112,540 |
Schwab Target 2025 Index Fund | 10,489,514 | — | 9,855,412 | 361,318 |
Schwab Target 2030 Index Fund | 15,856,833 | — | 14,401,824 | 290,007 |
Schwab Target 2035 Index Fund | 9,490,510 | — | 8,510,965 | 140,021 |
Schwab Target 2040 Index Fund | 12,175,890 | — | 10,942,651 | 159,731 |
Schwab Target 2045 Index Fund | 7,098,974 | — | 6,427,587 | 57,798 |
Schwab Target 2050 Index Fund | 8,721,233 | — | 7,629,666 | 43,258 |
Schwab Target 2055 Index Fund | 5,564,651 | — | 4,600,497 | 24,230 |
Schwab Target 2060 Index Fund | 6,727,461 | — | 5,654,421 | 34,898 |
Schwab Target 2065 Index Fund | 683,278 | — | 294,976 | — |
Denver, Colorado
May 17, 2023
FOREIGN TAX CREDIT | FOREIGN SOURCE INCOME | |
Schwab Target 2010 Index Fund | $8,388 | $116,514 |
Schwab Target 2015 Index Fund | 12,911 | 179,336 |
Schwab Target 2020 Index Fund | 58,366 | 810,697 |
Schwab Target 2025 Index Fund | 160,548 | 2,024,116 |
Schwab Target 2030 Index Fund | 343,983 | 4,204,792 |
Schwab Target 2035 Index Fund | 255,165 | 3,052,621 |
Schwab Target 2040 Index Fund | 379,394 | 4,467,141 |
Schwab Target 2045 Index Fund | 249,598 | 2,889,972 |
Schwab Target 2050 Index Fund | 328,736 | 3,773,269 |
Schwab Target 2055 Index Fund | 220,614 | 2,511,590 |
Schwab Target 2060 Index Fund | 275,024 | 3,124,176 |
Schwab Target 2065 Index Fund | 29,098 | 328,238 |
Schwab Target 2010 Index Fund | 14.64 % |
Schwab Target 2015 Index Fund | 15.82 % |
Schwab Target 2020 Index Fund | 16.85 % |
Schwab Target 2025 Index Fund | 20.91 % |
Schwab Target 2030 Index Fund | 26.48 % |
Schwab Target 2035 Index Fund | 30.59 % |
Schwab Target 2040 Index Fund | 33.39 % |
Schwab Target 2045 Index Fund | 35.79 % |
Schwab Target 2050 Index Fund | 36.85 % |
Schwab Target 2055 Index Fund | 37.53 % |
Schwab Target 2060 Index Fund | 38.25 % |
Schwab Target 2065 Index Fund | 38.52 % |
Schwab Target 2010 Index Fund | $261,636 |
Schwab Target 2015 Index Fund | 388,926 |
Schwab Target 2020 Index Fund | 1,613,413 |
Schwab Target 2025 Index Fund | 4,125,764 |
Schwab Target 2030 Index Fund | 8,045,903 |
Schwab Target 2035 Index Fund | 5,626,636 |
Schwab Target 2040 Index Fund | 8,035,270 |
Schwab Target 2045 Index Fund | 5,059,414 |
Schwab Target 2050 Index Fund | 6,483,004 |
Schwab Target 2055 Index Fund | 4,236,867 |
Schwab Target 2060 Index Fund | 5,249,322 |
Schwab Target 2065 Index Fund | 531,502 |
Schwab Target 2010 Index Fund | $102,167 |
Schwab Target 2015 Index Fund | 126,009 |
Schwab Target 2020 Index Fund | 729,579 |
Schwab Target 2025 Index Fund | — |
Schwab Target 2030 Index Fund | — |
Schwab Target 2035 Index Fund | — |
Schwab Target 2040 Index Fund | — |
Schwab Target 2045 Index Fund | — |
Schwab Target 2050 Index Fund | — |
Schwab Target 2055 Index Fund | — |
Schwab Target 2060 Index Fund | — |
Schwab Target 2065 Index Fund | — |
Schwab Target 2010 Index Fund | $32,114 |
Schwab Target 2015 Index Fund | 46,850 |
Schwab Target 2020 Index Fund | 194,861 |
Schwab Target 2025 Index Fund | 501,953 |
Schwab Target 2030 Index Fund | 997,317 |
Schwab Target 2035 Index Fund | 715,063 |
Schwab Target 2040 Index Fund | 1,028,673 |
Schwab Target 2045 Index Fund | 660,946 |
Schwab Target 2050 Index Fund | 851,865 |
Schwab Target 2055 Index Fund | 560,613 |
Schwab Target 2060 Index Fund | 696,710 |
Schwab Target 2065 Index Fund | 71,865 |
Schwab Target 2010 Index Fund | 70.10 % |
Schwab Target 2015 Index Fund | 66.60 % |
Schwab Target 2020 Index Fund | 63.87 % |
Schwab Target 2025 Index Fund | 53.13 % |
Schwab Target 2030 Index Fund | 39.06 % |
Schwab Target 2035 Index Fund | 28.40 % |
Schwab Target 2040 Index Fund | 20.20 % |
Schwab Target 2045 Index Fund | 13.13 % |
Schwab Target 2050 Index Fund | 9.15 % |
Schwab Target 2055 Index Fund | 6.65 % |
Schwab Target 2060 Index Fund | 4.21 % |
Schwab Target 2065 Index Fund | 3.00 % |
Independent Trustees | |||
Name, Year of Birth, and Position(s) with the trust (Terms of office, and length of Time Served1) | Principal Occupations During the Past Five Years | Number of Portfolios in Fund Complex Overseen by the Trustee | Other Directorships |
Michael J. Beer 1961 Trustee (Trustee of The Charles Schwab Family of Funds, Schwab Investments, Schwab Capital Trust, Schwab Annuity Portfolios, Schwab Strategic Trust and Laudus Trust since 2022) | Retired. Director, President and Chief Executive Officer (Dec. 2016 – Sept. 2019), Principal Funds (investment management). | 105 | Director (2016 – 2019), Principal Funds, Inc. |
Robert W. Burns 1959 Trustee (Trustee of Schwab Strategic Trust since 2009; The Charles Schwab Family of Funds, Schwab Investments, Schwab Capital Trust, Schwab Annuity Portfolios and Laudus Trust since 2016) | Retired/Private Investor. | 105 | None |
Nancy F. Heller 1956 Trustee (Trustee of The Charles Schwab Family of Funds, Schwab Investments, Schwab Capital Trust, Schwab Annuity Portfolios, Schwab Strategic Trust and Laudus Trust since 2018) | Retired. | 105 | None |
David L. Mahoney 1954 Trustee (Trustee of The Charles Schwab Family of Funds, Schwab Investments, Schwab Capital Trust, Schwab Annuity Portfolios and Laudus Trust since 2011; Schwab Strategic Trust since 2016) | Private Investor. | 105 | Director (2004 – present), Corcept Therapeutics Incorporated Director (2009 – 2021), Adamas Pharmaceuticals, Inc. Director (2003 – 2019), Symantec Corporation |
Jane P. Moncreiff 1961 Trustee (Trustee of The Charles Schwab Family of Funds, Schwab Investments, Schwab Capital Trust, Schwab Annuity Portfolios, Schwab Strategic Trust and Laudus Trust since 2019) | Consultant (2018 – present), Fulham Advisers LLC (management consulting); Chief Investment Officer (2009 – 2017), CareGroup Healthcare System, Inc. (healthcare). | 105 | None |
Independent Trustees (continued) | |||
Name, Year of Birth, and Position(s) with the trust (Terms of office, and length of Time Served1) | Principal Occupations During the Past Five Years | Number of Portfolios in Fund Complex Overseen by the Trustee | Other Directorships |
Kimberly S. Patmore 1956 Trustee (Trustee of The Charles Schwab Family of Funds, Schwab Investments, Schwab Capital Trust, Schwab Annuity Portfolios, Schwab Strategic Trust and Laudus Trust since 2016) | Consultant (2008 – present), Patmore Management Consulting (management consulting). | 105 | None |
J. Derek Penn 1957 Trustee (Trustee of The Charles Schwab Family of Funds, Schwab Investments, Schwab Capital Trust, Schwab Annuity Portfolios, Schwab Strategic Trust and Laudus Trust since 2021) | Head of Equity Sales and Trading (2006 – 2018), BNY Mellon (financial services). | 105 | None |
Interested Trustees | |||
Name, Year of Birth, and Position(s) with the trust (Terms of office, and length of Time Served1) | Principal Occupations During the Past Five Years | Number of Portfolios in Fund Complex Overseen by the Trustee | Other Directorships |
Walter W. Bettinger II2 1960 Chairman and Trustee (Trustee of The Charles Schwab Family of Funds, Schwab Investments, Schwab Capital Trust and Schwab Annuity Portfolios since 2008; Schwab Strategic Trust since 2009; Laudus Trust since 2010) | Co-Chairman of the Board (July 2022 – present), Director and Chief Executive Officer (Oct. 2008 – present) and President (Feb. 2007 – Oct. 2021), The Charles Schwab Corporation; President and Chief Executive Officer (Oct. 2008 – Oct. 2021) and Director (May 2008 – Oct. 2021), Charles Schwab & Co., Inc.; Director (Apr. 2006 – present), Charles Schwab Bank, SSB; Director (Nov. 2017 – present), Charles Schwab Premier Bank, SSB; Director (July 2019 – present), Charles Schwab Trust Bank; Director (May 2008 – present), Chief Executive Officer (Aug. 2017 – present) and President (Aug. 2017 – Nov. 2021), Schwab Holdings, Inc.; Director (Oct. 2020 – present), TD Ameritrade Holding Corporation; Director (July 2016 – Oct. 2021), Charles Schwab Investment Management, Inc. | 105 | Director (2008 – present), The Charles Schwab Corporation |
Richard A. Wurster2 1973 Trustee (Trustee of The Charles Schwab Family of Funds, Schwab Investments, Schwab Capital Trust, Schwab Annuity Portfolios, Schwab Strategic Trust and Laudus Trust since 2022) | President (Oct. 2021 – present) and Executive Vice President – Schwab Asset Management Solutions (Apr. 2019 – Oct. 2021), The Charles Schwab Corporation; President, Director (Oct. 2021 – present), Executive Vice President – Schwab Asset Management Solutions (July 2019 – Oct. 2021) and Senior Vice President – Advisory (May 2016 – July 2019), Charles Schwab & Co., Inc.; President (Nov. 2021 – present), Schwab Holdings, Inc.; Director (Oct. 2021 – present) and Chief Executive Officer (Nov. 2019 – Jan. 2022), Charles Schwab Investment Management, Inc.; Director, Chief Executive Officer and President (Mar. 2018 – Oct. 2022), Charles Schwab Investment Advisory, Inc.; Chief Executive Officer (July 2016 – Apr. 2018) and President (Mar. 2017 – Apr. 2018), ThomasPartners, Inc.; Chief Executive Officer (July 2016 – Apr. 2018), Windhaven Investment Management, Inc. | 105 | None |
Officers of the Trust | |
Name, Year of Birth, and Position(s) with the trust (Terms of office, and length of Time Served3) | Principal Occupations During the Past Five Years |
Jonathan de St. Paer 1973 President and Chief Executive Officer (Officer of The Charles Schwab Family of Funds, Schwab Investments, Schwab Capital Trust, Schwab Annuity Portfolios, Schwab Strategic Trust and Laudus Trust since 2018) | Director (Apr. 2019 – present), President (Oct. 2018 – present), Chief Operating Officer (Jan. 2021 – present), and Chief Executive Officer (Apr. 2019 – Nov. 2019), Charles Schwab Investment Management, Inc.; Senior Vice President (June 2020 – Mar. 2022) and Chief Operating Officer (Jan. 2021 – Mar. 2022), Charles Schwab Investment Advisory, Inc.; Chief Executive Officer (Apr. 2019 – present), President (Nov. 2018 – present) and Trustee (Apr. 2019 – Dec. 2020), Schwab Funds, Laudus Trust and Schwab ETFs; Managing Director (May 2022 – present), Senior Vice President (Apr. 2019 – May 2022) and Senior Vice President – Strategy and Product Development (CSIM) (Jan. 2014 – Mar. 2019), Charles Schwab & Co., Inc. |
Mark Fischer 1970 Chief Operating Officer (Officer of The Charles Schwab Family of Funds, Schwab Investments, Schwab Capital Trust, Schwab Annuity Portfolios, Schwab Strategic Trust and Laudus Trust since 2013) | Chief Operating Officer (Dec. 2020 – present) and Treasurer and Chief Financial Officer (Jan. 2016 – Dec. 2022), Schwab Funds, Laudus Trust and Schwab ETFs; Chief Financial Officer (Mar. 2020 – present) and Vice President (Oct. 2013 – present), Charles Schwab Investment Management, Inc. |
Dana Smith 1965 Treasurer and Chief Financial Officer (Officer of The Charles Schwab Family of Funds, Schwab Investments, Schwab Capital Trust, Schwab Annuity Portfolios, Schwab Strategic Trust and Laudus Trust since 2023) | Treasurer and Chief Financial Officer (Jan. 2023 – present) and Assistant Treasurer (Dec. 2015 – Dec. 2022), Schwab Funds, Laudus Trust and Schwab ETFs; Vice President (Mar. 2022 – present) and Director (Oct. 2015 – Mar. 2022), Charles Schwab Investment Management, Inc. |
Officers of the Trust (continued) | |
Name, Year of Birth, and Position(s) with the trust (Terms of office, and length of Time Served3) | Principal Occupations During the Past Five Years |
Omar Aguilar 1970 Vice President and Chief Investment Officer (Officer of The Charles Schwab Family of Funds, Schwab Investments, Schwab Capital Trust, Schwab Annuity Portfolios, Schwab Strategic Trust and Laudus Trust since 2011) | Chief Executive Officer (Jan. 2022 – present), Chief Investment Officer (Apr. 2011 – present) and Senior Vice President (Apr. 2011 – Dec. 2021), Charles Schwab Investment Management, Inc.; Director, Chief Executive Officer and President (Oct. 2022 – present), Charles Schwab Investment Advisory, Inc.; Vice President and Chief Investment Officer (June 2011 – present), Schwab Funds, Laudus Trust and Schwab ETFs. |
Brett Wander 1961 Vice President and Chief Investment Officer (Officer of The Charles Schwab Family of Funds, Schwab Investments, Schwab Capital Trust, Schwab Annuity Portfolios, Schwab Strategic Trust and Laudus Trust since 2011) | Senior Vice President and Chief Investment Officer (Apr. 2011 – present), Charles Schwab Investment Management, Inc.; Vice President and Chief Investment Officer (June 2011 – present), Schwab Funds, Laudus Trust and Schwab ETFs. |
William P. McMahon, Jr. 1972 Vice President and Chief Investment Officer (Officer of The Charles Schwab Family of Funds, Schwab Investments, Schwab Capital Trust, Schwab Annuity Portfolios, Schwab Strategic Trust and Laudus Trust since 2021) | Senior Vice President and Chief Investment Officer (Jan. 2020 – present), Charles Schwab Investment Management, Inc.; Vice President and Chief Investment Officer (June 2021 – present), Schwab Funds, Laudus Trust and Schwab ETFs; Senior Vice President and Chief Investment Officer – ThomasPartners Strategies (Apr. 2018 – Dec. 2019), Charles Schwab Investment Advisory, Inc.; Senior Vice President and Chief Investment Officer (May 2001 – Apr. 2018), ThomasPartners, Inc. |
Catherine MacGregor 1964 Chief Legal Officer and Secretary, Schwab Funds and Schwab ETFs Chief Legal Officer, Vice President and Clerk, Laudus Trust (Officer of The Charles Schwab Family of Funds, Schwab Investments, Schwab Capital Trust, Schwab Annuity Portfolios and Laudus Trust since 2005; Schwab Strategic Trust since 2009) | Chief Legal Officer (Mar. 2022 – present) and Vice President (Sept. 2005 – present), Charles Schwab Investment Management, Inc.; Managing Director (May 2022 – present) and Vice President (July 2005 – May 2022), Charles Schwab & Co., Inc.; Vice President (Dec. 2005 – present) and Chief Legal Officer and Clerk (Mar. 2007 – present), Laudus Trust; Chief Legal Officer and Secretary (Oct. 2021 – present), Vice President (Nov. 2005 – Oct. 2021) and Assistant Secretary (June 2007 – Oct. 2021), Schwab Funds; Chief Legal Officer and Secretary (Oct. 2021 – present), Vice President and Assistant Secretary (Oct. 2009 – Oct. 2021), Schwab ETFs. |
Schwab Funds
Member SIPC®
Printed on recycled paper.
| Item 2: | Code of Ethics. |
| (a) | Registrant has adopted a code of ethics that applies to its principal executive officer, principal financial officer, and any other persons who perform a similar function, regardless of whether these individuals are employed by Registrant or a third party. |
| (c) | During the period covered by the report, no amendments were made to the provisions of this code of ethics. |
| (d) | During the period covered by the report, Registrant did not grant any waivers, including implicit waivers, from the provisions of this code of ethics. |
| (f)(1) | Registrant has filed this code of ethics as an exhibit pursuant to Item 13(a)(1) of Form N-CSR. |
| Item 3: | Audit Committee Financial Expert. |
Registrant’s Board of Trustees has determined that Kimberly S. Patmore, Michael J. Beer and J. Derek Penn, each currently serving on its audit, compliance and valuation committee, are each an “audit committee financial expert,” as such term is defined in Item 3 of Form N-CSR. Each member of Registrant’s audit, compliance and valuation committee is “independent” under the standards set forth in Item 3 of Form N-CSR.
The designation of each of Ms. Patmore, Mr. Beer and Mr. Penn as an “audit committee financial expert” pursuant to Item 3 of Form N-CSR does not (i) impose upon such individual any duties, obligations, or liability that are greater than the duties, obligations and liability imposed upon such individual as a member of Registrant’s audit, compliance and valuation committee or Board of Trustees in the absence of such designation; and (ii) affect the duties, obligations or liability of any other member of Registrant’s audit, compliance and valuation committee or Board of Trustees.
| Item 4: | Principal Accountant Fees and Services. |
Registrant is composed of fifty-two operational series. Twelve series have a fiscal year-end of March 31, whose annual financial statements are reported in Item 1, three series have a fiscal year-end of December 31, thirty-six series have a fiscal year-end of October 31, and one series has a fiscal year-end of the last day of February. Principal accountant fees disclosed in Items 4(a)-(d) and 4(g) include fees billed for services rendered to the fifty-two operational series during 2022/2023 and 2021/2022, based on their respective 2022/2023 and 2021/2022 fiscal years, as applicable.
The following table presents fees billed by the principal accountant in each of the last two fiscal years for the services rendered to the Funds:
(a) Audit Fees1 | (b) Audit-Related Fees2 | (c) Tax Fees3 | (d) All Other Fees | |||||||||||||||||||||||||
Fiscal Year 2022/2023 | Fiscal Year 2021/ 2022 | Fiscal Year 2022/2023 | Fiscal Year 2021/2022 | Fiscal Year 2022/2023 | Fiscal Year 2021/2022 | Fiscal Year 2022/2023 | Fiscal Year 2021/2022 | |||||||||||||||||||||
$1,195,825 | $ | 1,187,075 | $ | 90,000 | $ | 90,000 | $ | 161,200 | $ | 161,200 | $ | 0 | $ | 0 | ||||||||||||||
| 1 | The nature of the services includes audit of the registrant’s annual financial statements and normally provided services in connection with regulatory filings for those fiscal years. |
| 2 | The nature of the services includes assurance and related services reasonably related to the performance of the audit of financial statements not included in Audit Fees. |
| 3 | The nature of the services includes tax compliance, tax advice and tax planning. |
(e) (1) Registrant’s audit, compliance and valuation committee does not have pre-approval policies and procedures as described in paragraph (c)(7) of Rule 2-01 of Regulation S-X.
(2) There were no services described in each of paragraphs (b) through (d) above that were approved by Registrant’s audit, compliance and valuation committee pursuant to paragraph (c)(7)(i)(C) of Rule 2-01 of Regulation S-X.
(f) Not applicable.
(g) Below are the aggregate non-audit fees billed in each of the last two fiscal years by Registrant’s principal accountant for services rendered to Registrant, to Registrant’s investment adviser, and to any entity controlling, controlled by, or under common control with Registrant’s investment adviser that provides ongoing services to Registrant.
2022/2023: $3,136,515 2021/2022: $2,320,631
(h) During the past fiscal year, all non-audit services provided by Registrant’s principal accountant to either Registrant’s investment adviser or to any entity controlling, controlled by, or under common control with Registrant’s investment adviser that provides ongoing services to Registrant were pre-approved. Included in the audit, compliance and valuation committee’s pre-approval was the review and consideration as to whether the provision of these non-audit services is compatible with maintaining the principal accountant’s independence.
(i) Not applicable.
(j) Not applicable.
| Item 5: | Audit Committee of Listed Registrants. |
Not applicable.
| Item 6: | Schedule of Investments. |
The schedules of investments are included as part of the report to shareholders filed under Item 1 of this Form.
| Item 7: | Disclosure of Proxy Voting Policies and Procedures for Closed-End Management Investment Companies. |
Not applicable.
| Item 8: | Portfolio Managers of Closed-End Management Investment Companies. |
Not applicable.
| Item 9: | Purchases of Equity Securities by Closed-End Management Investment Company and Affiliated Purchasers. |
Not applicable.
| Item 10: | Submission of Matters to a Vote of Security Holders. |
Not applicable.
| Item 11: | Controls and Procedures. |
| (a) | Based on their evaluation of Registrant’s disclosure controls and procedures, as of a date within 90 days of the filing date, Registrant’s Chief Executive Officer, Jonathan de St. Paer and Registrant’s Chief Financial Officer, Dana Smith, have concluded that Registrant’s disclosure controls and procedures are: (i) reasonably designed to ensure that information required to be disclosed in this report is appropriately communicated to Registrant’s officers to allow timely decisions regarding disclosures required in this report; (ii) reasonably designed to ensure that information required to be disclosed in this report is recorded, processed, summarized and reported in a timely manner; and (iii) are effective in achieving the goals described in (i) and (ii) above. |
| (b) | During the period covered by this report, there have been no changes in Registrant’s internal control over financial reporting that the above officers believe to have materially affected, or to be reasonably likely to materially affect, Registrant’s internal control over financial reporting. |
| Item 12: | Disclosure of Securities Lending Activities for Closed-End Management Investment Companies. |
Not applicable.
| Item 13: | Exhibits. |
| (a) |
| (2) |
| (b) |
Pursuant to the requirements of the Securities Exchange Act of 1934 and the Investment Company Act of 1940, the registrant has duly caused this report to be signed on its behalf by the undersigned, thereunto duly authorized.
(Registrant) Schwab Capital Trust – Schwab Target Index Funds
| By: | /s/ Jonathan de St. Paer | |
Jonathan de St. Paer Chief Executive Officer | ||
Date: | May 17, 2023 | |
Pursuant to the requirements of the Securities Exchange Act of 1934 and the Investment Company Act of 1940, this report has been signed below by the following persons on behalf of the registrant and in the capacities and on the dates indicated.
| By: | /s/ Jonathan de St. Paer | |
Jonathan de St. Paer Chief Executive Officer | ||
Date: | May 17, 2023 | |
| By: | /s/ Dana Smith | |
Dana Smith Chief Financial Officer | ||
Date: | May 17, 2023 | |