UNITED STATES
SECURITIES AND EXCHANGE COMMISSION
Washington, D.C. 20549
FORM N-CSR
CERTIFIED SHAREHOLDER REPORT OF REGISTERED
MANAGEMENT INVESTMENT COMPANIES
Investment Company Act file number: 811-07704
Schwab Capital Trust – Schwab Fundamental Global Real Estate Index Fund
(Exact name of registrant as specified in charter)
211 Main Street, San Francisco, California 94105
(Address of principal executive offices) (Zip code)
Omar Aguilar
Schwab Capital Trust
211 Main Street, San Francisco, California 94105
(Name and address of agent for service)
Registrant’s telephone number, including area code: (415) 636-7000
Date of fiscal year end: February 28
Date of reporting period: February 29, 2024
Item 1: Report(s) to Shareholders.

No Action Required – Notice Regarding Shareholder Report Delivery |
Beginning on July 24, 2024, fund shareholder reports will be streamlined to highlight key information deemed important for investors to assess and monitor their fund investments. Other information, including financial statements, will not appear in the streamlined shareholder reports but will available online and delivered free of charge upon request. |
• If you already receive the full shareholder reports, you will receive the streamlined shareholder reports in the same way that you currently receive the full shareholder reports (either in paper or electronically). |
• If you currently receive a notification when a shareholder report is available on a fund’s website, beginning July 24, 2024, you will begin to receive the streamlined shareholder report (in paper). |
2 | |
3 | |
5 | |
6 | |
9 | |
10 | |
19 | |
30 | |
31 | |
32 | |
33 | |
36 |
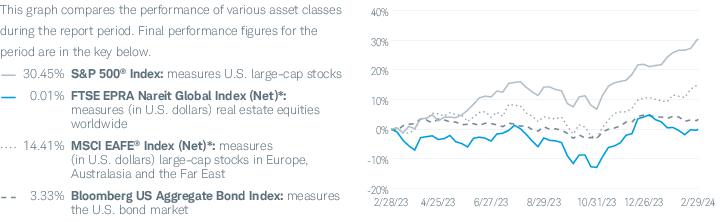
Total Returns for the 12 Months Ended February 29, 2024 | |
Schwab Fundamental Global Real Estate Index Fund (Ticker Symbol: SFREX) | -3.09% |
Russell RAFITM Global Select Real Estate Index (Net)1 | -3.67% |
FTSE EPRA Nareit Global Index (Net)1 | 0.01% |
Fund Category: Morningstar Global Real Estate2 | 1.69% |
Performance Details | pages 6-8 |
 | Christopher Bliss, CFA, Managing Director and Head of Passive Equity Strategies for Schwab Asset Management, is responsible for overseeing the investment process and portfolio management of investment strategies for passive equity Schwab Funds and Schwab ETFs, and Schwab Personalized Indexing™ separately managed accounts. Before joining Schwab in 2016, Mr. Bliss spent 12 years at BlackRock (formerly Barclays Global Investors) managing and leading institutional index teams, most recently as a managing director and the head of the Americas institutional index team. In this role, Mr. Bliss was responsible for overseeing a team of portfolio managers managing domestic, developed international and emerging markets index strategies. Prior to BlackRock, he worked as an equity analyst and portfolio manager for Harris Bretall and before that, as a research analyst for JP Morgan. |
 | David Rios, Portfolio Manager for Schwab Asset Management, is responsible for the day-to-day co-management of the fund. Prior to this role, Mr. Rios was an associate portfolio manager on the equity index strategies team for four years. His first role with Schwab Asset Management was as a trade operations specialist. Prior to joining Schwab in 2008, Mr. Rios was a senior fund accountant at Investors Bank & Trust (subsequently acquired by State Street Corporation). |
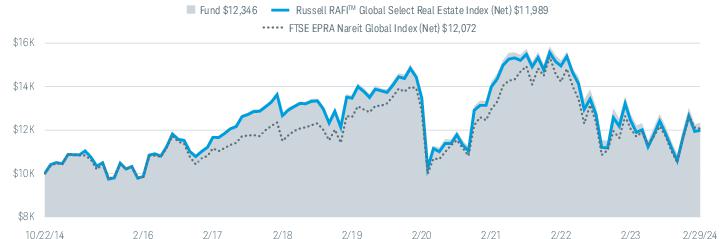
Fund and Inception Date | 1 Year | 5 Years | Since Inception |
Fund: Schwab Fundamental Global Real Estate Index Fund (10/22/14) | -3.09% | -1.90% | 2.28% |
Russell RAFITM Global Select Real Estate Index (Net)2 | -3.67% | -2.30% | 1.96% |
FTSE EPRA Nareit Global Index (Net)2 | 0.01% | -0.85% | 2.03% |
Fund Category: Morningstar Global Real Estate3 | 1.69% | 0.63% | N/A |
Fund Expense Ratio4: 0.39% | |||
Number of Holdings | 359 |
Weighted Average Market Cap (millions) | $19,079 |
Price/Earnings Ratio (P/E) | 16.5 |
Price/Book Ratio (P/B) | 0.7 |
Portfolio Turnover Rate | 16% |

EXPENSE RATIO (ANNUALIZED) 1 | BEGINNING ACCOUNT VALUE AT 9/1/23 | ENDING ACCOUNT VALUE (NET OF EXPENSES) AT 2/29/24 | EXPENSES PAID DURING PERIOD 9/1/23-2/29/24 2 | |
Schwab Fundamental Global Real Estate Index Fund | ||||
Actual Return | 0.39% | $1,000.00 | $1,015.00 | $1.95 |
Hypothetical 5% Return | 0.39% | $1,000.00 | $1,022.92 | $1.96 |
1 | Based on the most recent six-month expense ratio. |
2 | Expenses for the fund are equal to its annualized expense ratio, multiplied by the average account value over the period, multiplied by 182 days in the period, and divided by 366 days in the fiscal year. |
3/1/23– 2/29/24 | 3/1/22– 2/28/23 | 3/1/21– 2/28/22 | 3/1/20– 2/28/21 | 3/1/19– 2/29/20 | ||
Per-Share Data | ||||||
Net asset value at beginning of period | $9.35 | $11.48 | $11.05 | $11.06 | $11.43 | |
Income (loss) from investment operations: | ||||||
Net investment income (loss)1 | 0.30 | 0.30 | 0.34 | 0.30 | 0.37 | |
Net realized and unrealized gains (losses) | (0.58 ) | (2.16 ) | 0.44 | 0.05 | (0.24 ) | |
Total from investment operations | (0.28 ) | (1.86 ) | 0.78 | 0.35 | 0.13 | |
Less distributions: | ||||||
Distributions from net investment income | (0.33 ) | (0.27 ) | (0.35 ) | (0.34 ) | (0.47 ) | |
Distributions from net realized gains | — | — | — | (0.02 ) | (0.03 ) | |
Total distributions | (0.33 ) | (0.27 ) | (0.35 ) | (0.36 ) | (0.50 ) | |
Net asset value at end of period | $8.74 | $9.35 | $11.48 | $11.05 | $11.06 | |
Total return | (3.09 %) | (16.30 %) | 7.02 % | 3.62 % | 0.91 % | |
Ratios/Supplemental Data | ||||||
Ratios to average net assets: | ||||||
Total expenses | 0.39 % | 0.39 %2 | 0.39 % | 0.39 % | 0.39 % | |
Net investment income (loss) | 3.46 % | 3.01 % | 2.86 % | 3.17 % | 3.16 % | |
Portfolio turnover rate | 16 % | 32 % | 32 % | 25 % | 16 % | |
Net assets, end of period (x 1,000) | $79,215 | $104,272 | $134,050 | $156,761 | $195,717 | |
1 | Calculated based on the average shares outstanding during the period. |
2 | Ratio includes less than 0.005% of non-routine proxy expenses. |
SECURITY | NUMBER OF SHARES | VALUE ($) |
COMMON STOCKS 99.5% OF NET ASSETS | ||
Australia 3.7% | ||
Charter Hall Group | 12,312 | 100,374 |
Charter Hall Retail REIT | 18,846 | 43,310 |
Cromwell Property Group | 126,551 | 32,895 |
Dexus | 42,766 | 204,799 |
Goodman Group | 24,576 | 478,435 |
GPT Group | 63,682 | 180,107 |
Mirvac Group | 244,195 | 346,355 |
National Storage REIT | 24,982 | 36,694 |
REA Group Ltd. | 595 | 75,249 |
Region RE Ltd. | 39,609 | 56,940 |
Scentre Group | 308,652 | 624,669 |
Stockland | 168,888 | 493,460 |
Vicinity Ltd. | 201,596 | 254,582 |
Waypoint REIT Ltd. | 24,550 | 37,534 |
2,965,403 | ||
Belgium 0.2% | ||
Aedifica SA | 713 | 40,720 |
Cofinimmo SA * | 1,313 | 82,021 |
Warehouses De Pauw CVA | 2,364 | 63,319 |
186,060 | ||
Brazil 0.2% | ||
Cyrela Brazil Realty SA Empreendimentos e Participacoes | 20,555 | 99,444 |
Multiplan Empreendimentos Imobiliarios SA | 8,051 | 42,773 |
142,217 | ||
Canada 2.6% | ||
Allied Properties Real Estate Investment Trust | 7,958 | 99,625 |
Altus Group Ltd. | 1,275 | 47,058 |
Artis Real Estate Investment Trust | 13,890 | 57,417 |
Boardwalk Real Estate Investment Trust | 1,204 | 67,450 |
Canadian Apartment Properties REIT | 5,438 | 190,770 |
Chartwell Retirement Residences | 13,486 | 120,834 |
Choice Properties Real Estate Investment Trust | 9,393 | 92,674 |
Colliers International Group, Inc. | 760 | 88,440 |
Crombie Real Estate Investment Trust | 7,971 | 81,346 |
Dream Industrial Real Estate Investment Trust | 4,721 | 44,213 |
Dream Office Real Estate Investment Trust | 2,795 | 30,892 |
First Capital Real Estate Investment Trust | 15,038 | 172,192 |
FirstService Corp. | 803 | 132,146 |
Granite Real Estate Investment Trust | 1,284 | 68,185 |
H&R Real Estate Investment Trust | 26,127 | 171,145 |
Killam Apartment Real Estate Investment Trust | 4,305 | 60,365 |
SECURITY | NUMBER OF SHARES | VALUE ($) |
NorthWest Healthcare Properties Real Estate Investment Trust | 15,196 | 44,564 |
Primaris Real Estate Investment Trust | 3,981 | 39,571 |
RioCan Real Estate Investment Trust | 20,058 | 264,258 |
SmartCentres Real Estate Investment Trust | 7,461 | 127,598 |
Tricon Residential, Inc. | 7,353 | 81,757 |
2,082,500 | ||
China 8.5% | ||
Agile Group Holdings Ltd. * | 2,259,000 | 218,555 |
A-Living Smart City Services Co. Ltd. | 137,750 | 70,534 |
C&D International Investment Group Ltd. | 23,719 | 38,565 |
China Jinmao Holdings Group Ltd. | 2,231,000 | 181,294 |
China Merchants Shekou Industrial Zone Holdings Co. Ltd., A Shares | 48,500 | 63,282 |
China Overseas Grand Oceans Group Ltd. | 314,000 | 80,367 |
China Overseas Land & Investment Ltd. | 637,500 | 941,471 |
China Resources Land Ltd. | 284,500 | 868,964 |
China SCE Group Holdings Ltd. * | 2,763,000 | 54,344 |
China South City Holdings Ltd. | 1,430,000 | 30,378 |
China Vanke Co. Ltd., A Shares | 149,000 | 207,012 |
China Vanke Co. Ltd., H Shares | 476,900 | 367,682 |
Country Garden Holdings Co. Ltd. *(a) | 9,833,000 | 799,057 |
Country Garden Services Holdings Co. Ltd. | 131,900 | 100,400 |
Dexin China Holdings Co. Ltd. * | 1,549,000 | 18,399 |
Gemdale Corp., A Shares | 52,800 | 31,484 |
Gemdale Properties & Investment Corp. Ltd. | 1,938,000 | 65,398 |
Greentown China Holdings Ltd. | 147,000 | 117,540 |
Guangzhou R&F Properties Co. Ltd., H Shares * | 2,770,622 | 359,156 |
Hopson Development Holdings Ltd. * | 248,779 | 118,888 |
Jiayuan International Group Ltd. *(b) | 534,000 | 2,950 |
KE Holdings, Inc., ADR | 16,284 | 221,300 |
KWG Group Holdings Ltd. *(a) | 1,219,000 | 68,928 |
Longfor Group Holdings Ltd. | 323,000 | 404,559 |
Midea Real Estate Holding Ltd. | 68,800 | 38,329 |
Poly Developments & Holdings Group Co. Ltd., A Shares | 96,000 | 129,750 |
Poly Property Group Co. Ltd. | 803,000 | 147,538 |
Red Star Macalline Group Corp. Ltd., A Shares | 61,500 | 30,445 |
Redsun Properties Group Ltd. *(a) | 1,320,000 | 13,319 |
Seazen Group Ltd. * | 1,832,000 | 258,404 |
Seazen Holdings Co. Ltd., A Shares * | 30,900 | 44,409 |
Shanghai Lujiazui Finance & Trade Zone Development Co. Ltd., A Shares | 60,400 | 76,534 |
Shinsun Holdings Group Co. Ltd. *(b) | 1,290,000 | 18,742 |
Sino-Ocean Group Holding Ltd. *(a) | 3,717,500 | 158,761 |
Times China Holdings Ltd. *(a) | 2,538,498 | 80,767 |
Yuexiu Property Co. Ltd. | 185,359 | 123,267 |
Yuzhou Group Holdings Co. Ltd. *(a) | 3,860,963 | 41,916 |
Zhenro Properties Group Ltd. *(a) | 5,140,000 | 56,808 |
Zhongliang Holdings Group Co. Ltd. * | 1,405,000 | 50,859 |
6,700,355 | ||
SECURITY | NUMBER OF SHARES | VALUE ($) |
France 1.8% | ||
Altarea SCA | 361 | 26,359 |
Carmila SA | 3,951 | 63,325 |
Covivio SA | 3,510 | 157,606 |
Gecina SA | 1,850 | 178,695 |
ICADE | 4,423 | 132,145 |
Klepierre SA | 12,469 | 316,754 |
Mercialys SA | 10,604 | 115,201 |
Unibail-Rodamco-Westfield * | 5,952 | 435,230 |
1,425,315 | ||
Germany 2.6% | ||
ADLER Group SA * | 155,943 | 38,091 |
Aroundtown SA * | 86,945 | 153,300 |
BRANICKS Group AG | 6,567 | 8,834 |
Deutsche Wohnen SE | 2,418 | 49,915 |
Grand City Properties SA * | 10,880 | 101,434 |
LEG Immobilien SE * | 3,205 | 236,078 |
TAG Immobilien AG * | 15,380 | 188,030 |
Vonovia SE | 44,688 | 1,247,204 |
2,022,886 | ||
Hong Kong 6.3% | ||
CK Asset Holdings Ltd. | 182,450 | 839,273 |
Fortune Real Estate Investment Trust | 81,000 | 46,613 |
Hang Lung Properties Ltd. | 107,000 | 114,844 |
Henderson Land Development Co. Ltd. | 89,866 | 258,572 |
Hongkong Land Holdings Ltd. | 91,827 | 310,906 |
Hysan Development Co. Ltd. | 38,500 | 62,943 |
Kerry Properties Ltd. | 129,500 | 212,802 |
Link REIT | 82,500 | 409,085 |
New World Development Co. Ltd. | 313,460 | 393,826 |
Powerlong Real Estate Holdings Ltd. *(a) | 1,495,000 | 123,697 |
Sino Land Co. Ltd. | 234,204 | 252,223 |
Sun Hung Kai Properties Ltd. | 120,342 | 1,210,914 |
Swire Properties Ltd. | 54,000 | 111,076 |
Wharf Holdings Ltd. | 92,000 | 339,107 |
Wharf Real Estate Investment Co. Ltd. | 83,400 | 277,733 |
4,963,614 | ||
Japan 12.6% | ||
Activia Properties, Inc. | 26 | 67,639 |
Advance Residence Investment Corp. | 37 | 75,573 |
Aeon Mall Co. Ltd. | 14,500 | 169,292 |
AEON REIT Investment Corp. | 78 | 68,454 |
Comforia Residential REIT, Inc. | 19 | 36,369 |
Daito Trust Construction Co. Ltd. | 8,970 | 1,064,119 |
Daiwa House REIT Investment Corp. | 63 | 102,734 |
Daiwa Office Investment Corp. | 10 | 38,918 |
Daiwa Securities Living Investments Corp. | 57 | 38,334 |
Frontier Real Estate Investment Corp. | 15 | 43,005 |
Fukuoka REIT Corp. | 42 | 46,457 |
GLP J-Reit | 100 | 79,339 |
Heiwa Real Estate Co. Ltd. | 2,000 | 52,382 |
Hulic Co. Ltd. | 25,400 | 253,440 |
Hulic Reit, Inc. | 38 | 37,131 |
Industrial & Infrastructure Fund Investment Corp. | 56 | 47,100 |
Invincible Investment Corp. | 113 | 46,397 |
Japan Excellent, Inc. | 64 | 50,434 |
Japan Hotel REIT Investment Corp. | 108 | 52,359 |
Japan Logistics Fund, Inc. | 23 | 39,292 |
Japan Metropolitan Fund Invest | 252 | 148,516 |
Japan Prime Realty Investment Corp. | 34 | 74,565 |
SECURITY | NUMBER OF SHARES | VALUE ($) |
Japan Real Estate Investment Corp. | 46 | 165,815 |
KDX Realty Investment Corp. | 145 | 145,144 |
LaSalle Logiport REIT | 36 | 33,844 |
Mirarth Holdings, Inc. | 18,000 | 58,664 |
Mitsubishi Estate Co. Ltd. | 95,900 | 1,467,889 |
Mitsui Fudosan Co. Ltd. | 74,100 | 2,011,582 |
Mori Hills REIT Investment Corp. | 45 | 39,366 |
Nippon Accommodations Fund, Inc. | 13 | 49,284 |
Nippon Building Fund, Inc. | 49 | 188,709 |
Nippon Kanzai Holdings Co. Ltd. | 2,200 | 37,771 |
Nippon Prologis REIT, Inc. | 51 | 85,326 |
NIPPON REIT Investment Corp. | 18 | 39,402 |
Nomura Real Estate Holdings, Inc. | 12,600 | 313,651 |
Nomura Real Estate Master Fund, Inc. | 167 | 165,979 |
NTT UD REIT Investment Corp. | 52 | 41,189 |
Open House Group Co. Ltd. | 6,300 | 198,964 |
Orix JREIT, Inc. | 99 | 104,461 |
Relo Group, Inc. | 5,100 | 41,082 |
SAMTY Co. Ltd. | 2,500 | 41,212 |
Sekisui House REIT, Inc. | 117 | 57,882 |
Starts Corp., Inc. | 4,600 | 93,018 |
Sumitomo Realty & Development Co. Ltd. | 32,200 | 955,122 |
Sun Frontier Fudousan Co. Ltd. | 4,000 | 44,372 |
Tokyo Tatemono Co. Ltd. | 19,900 | 288,660 |
Tokyu Fudosan Holdings Corp. | 76,400 | 501,698 |
Tokyu REIT, Inc. | 29 | 31,414 |
United Urban Investment Corp. | 119 | 112,420 |
9,945,769 | ||
Mexico 0.6% | ||
Corp. Inmobiliaria Vesta SAB de CV | 12,140 | 42,558 |
FIBRA Macquarie Mexico | 33,727 | 66,349 |
Fibra Uno Administracion SA de CV | 149,113 | 269,456 |
TF Administradora Industrial S de Real de CV | 34,703 | 82,908 |
461,271 | ||
Netherlands 0.2% | ||
Eurocommercial Properties NV | 3,470 | 74,363 |
Wereldhave NV | 4,075 | 58,910 |
133,273 | ||
Philippines 0.8% | ||
Ayala Corp. | 16,930 | 204,316 |
Ayala Land, Inc. | 335,532 | 209,125 |
Robinsons Land Corp. | 169,900 | 49,485 |
SM Prime Holdings, Inc. | 238,100 | 133,842 |
596,768 | ||
Singapore 1.4% | ||
CapitaLand Ascendas REIT | 89,788 | 182,983 |
CapitaLand Ascott Trust | 77,680 | 51,751 |
CapitaLand China Trust | 58,600 | 32,223 |
CapitaLand Integrated Commercial Trust | 107,805 | 157,248 |
CapitaLand Investment Ltd. | 67,238 | 139,096 |
City Developments Ltd. | 24,500 | 103,266 |
Frasers Logistics & Commercial Trust | 57,900 | 44,317 |
Manulife U.S. Real Estate Investment Trust * | 390,100 | 21,513 |
Mapletree Industrial Trust | 43,144 | 73,474 |
Mapletree Logistics Trust | 67,031 | 73,841 |
Mapletree Pan Asia Commercial Trust | 44,327 | 44,538 |
Suntec Real Estate Investment Trust | 64,400 | 55,621 |
SECURITY | NUMBER OF SHARES | VALUE ($) |
UOL Group Ltd. | 29,380 | 128,711 |
1,108,582 | ||
South Africa 1.1% | ||
Fortress Real Estate Investments Ltd., Class B * | 91,650 | 79,417 |
Growthpoint Properties Ltd. | 397,204 | 242,506 |
Hyprop Investments Ltd. | 44,194 | 72,205 |
NEPI Rockcastle NV | 22,911 | 163,471 |
Redefine Properties Ltd. | 890,306 | 185,826 |
Resilient REIT Ltd. | 26,680 | 65,573 |
Vukile Property Fund Ltd. | 92,982 | 71,603 |
880,601 | ||
Sweden 0.7% | ||
Castellum AB * | 14,067 | 168,713 |
Fabege AB | 8,638 | 70,662 |
Fastighets AB Balder, B Shares * | 16,024 | 99,660 |
Pandox AB | 4,225 | 63,697 |
Sagax AB, B Shares | 1,803 | 42,646 |
Samhallsbyggnadsbolaget i Norden AB | 125,645 | 44,508 |
Samhallsbyggnadsbolaget i Norden AB, D Shares * | 434 | 187 |
Wihlborgs Fastigheter AB | 10,361 | 83,493 |
573,566 | ||
Switzerland 0.8% | ||
Allreal Holding AG | 755 | 129,846 |
Mobimo Holding AG | 280 | 81,950 |
PSP Swiss Property AG | 941 | 119,642 |
Swiss Prime Site AG | 3,384 | 323,413 |
654,851 | ||
Taiwan 0.4% | ||
Farglory Land Development Co. Ltd. | 26,000 | 46,229 |
Highwealth Construction Corp. | 82,986 | 104,234 |
Huaku Development Co. Ltd. | 19,000 | 59,395 |
Kindom Development Co. Ltd. | 41,000 | 51,226 |
Ruentex Development Co. Ltd. | 58,273 | 67,059 |
328,143 | ||
Thailand 0.7% | ||
AP Thailand PCL NVDR | 230,961 | 67,672 |
Central Pattana PCL NVDR | 64,500 | 116,441 |
Digital Telecommunications Infrastructure Fund, Class F | 200,600 | 44,928 |
Land & Houses PCL NVDR | 622,111 | 131,715 |
Sansiri PCL NVDR | 1,473,283 | 75,649 |
Supalai PCL NVDR | 142,182 | 83,248 |
519,653 | ||
United Arab Emirates 1.4% | ||
Aldar Properties PJSC | 130,270 | 196,135 |
Emaar Development PJSC | 55,102 | 118,666 |
Emaar Properties PJSC | 377,457 | 834,466 |
1,149,267 | ||
United Kingdom 2.1% | ||
Assura PLC | 76,689 | 40,324 |
Big Yellow Group PLC | 4,064 | 51,574 |
British Land Co. PLC | 49,994 | 219,977 |
SECURITY | NUMBER OF SHARES | VALUE ($) |
Derwent London PLC | 3,759 | 91,293 |
Grainger PLC | 24,377 | 76,682 |
Great Portland Estates PLC | 9,017 | 41,216 |
Hammerson PLC | 171,985 | 55,359 |
Land Securities Group PLC | 34,496 | 270,256 |
LondonMetric Property PLC | 19,335 | 44,243 |
Primary Health Properties PLC | 38,835 | 43,923 |
Rightmove PLC | 13,906 | 99,799 |
Safestore Holdings PLC | 5,451 | 52,848 |
Savills PLC | 13,634 | 158,764 |
Segro PLC | 19,288 | 206,295 |
Sirius Real Estate Ltd. | 45,084 | 49,227 |
Tritax Big Box REIT PLC | 39,069 | 72,463 |
UNITE Group PLC | 5,350 | 64,963 |
Workspace Group PLC | 7,155 | 44,164 |
1,683,370 | ||
United States 50.8% | ||
Acadia Realty Trust | 5,040 | 82,606 |
Agree Realty Corp. | 955 | 52,477 |
Alexander & Baldwin, Inc. | 6,465 | 105,121 |
Alexandria Real Estate Equities, Inc. | 3,865 | 482,081 |
American Assets Trust, Inc. | 3,248 | 70,059 |
American Homes 4 Rent, Class A | 5,962 | 220,654 |
American Tower Corp. | 9,365 | 1,862,324 |
Americold Realty Trust, Inc. | 7,887 | 199,541 |
Anywhere Real Estate, Inc. * | 56,628 | 355,058 |
Apartment Income REIT Corp. | 6,483 | 196,565 |
Apple Hospitality REIT, Inc. | 13,765 | 221,479 |
Ashford Hospitality Trust, Inc. * | 23,185 | 44,747 |
AvalonBay Communities, Inc. | 4,088 | 723,699 |
Boston Properties, Inc. | 11,536 | 746,610 |
Brandywine Realty Trust | 34,399 | 147,916 |
Brixmor Property Group, Inc. | 14,991 | 338,947 |
Broadstone Net Lease, Inc. | 3,378 | 50,366 |
Camden Property Trust | 2,997 | 283,157 |
CBRE Group, Inc., Class A * | 16,925 | 1,555,238 |
Centerspace | 727 | 40,414 |
Chatham Lodging Trust | 4,469 | 45,584 |
COPT Defense Properties | 6,223 | 150,783 |
CoStar Group, Inc. * | 2,740 | 238,462 |
Cousins Properties, Inc. | 8,371 | 190,943 |
Crown Castle, Inc. | 13,928 | 1,531,244 |
CubeSmart | 4,731 | 206,319 |
Cushman & Wakefield PLC * | 16,901 | 168,841 |
DiamondRock Hospitality Co. | 18,855 | 177,237 |
Digital Realty Trust, Inc. | 8,856 | 1,300,149 |
DigitalBridge Group, Inc. | 23,398 | 429,821 |
Diversified Healthcare Trust | 163,239 | 535,424 |
Douglas Elliman, Inc. | 18,648 | 34,312 |
Douglas Emmett, Inc. | 16,303 | 215,526 |
Easterly Government Properties, Inc. | 4,679 | 55,212 |
EastGroup Properties, Inc. | 565 | 99,265 |
Elme Communities | 5,188 | 66,821 |
Empire State Realty Trust, Inc., Class A | 13,500 | 134,595 |
EPR Properties | 3,807 | 156,392 |
Equinix, Inc. | 1,600 | 1,422,112 |
Equity Commonwealth * | 2,240 | 42,179 |
Equity LifeStyle Properties, Inc. | 3,673 | 247,266 |
Equity Residential | 12,917 | 777,733 |
Essential Properties Realty Trust, Inc. | 1,855 | 44,316 |
Essex Property Trust, Inc. | 1,953 | 451,924 |
eXp World Holdings, Inc. | 3,453 | 45,234 |
Extra Space Storage, Inc. | 4,082 | 575,440 |
Federal Realty Investment Trust | 2,724 | 274,715 |
First Industrial Realty Trust, Inc. | 2,606 | 138,118 |
Four Corners Property Trust, Inc. | 1,939 | 46,885 |
SECURITY | NUMBER OF SHARES | VALUE ($) |
Gaming & Leisure Properties, Inc. | 6,534 | 297,166 |
GEO Group, Inc. * | 26,189 | 321,339 |
Getty Realty Corp. | 1,290 | 34,004 |
Global Net Lease, Inc. | 14,577 | 105,100 |
Hannon Armstrong Sustainable Infrastructure Capital, Inc. | 1,576 | 39,668 |
Healthcare Realty Trust, Inc. | 12,425 | 171,217 |
Healthpeak Properties, Inc. | 23,812 | 398,851 |
Highwoods Properties, Inc. | 9,530 | 233,009 |
Host Hotels & Resorts, Inc. | 39,761 | 824,643 |
Howard Hughes Holdings, Inc. * | 1,021 | 78,004 |
Hudson Pacific Properties, Inc. | 31,036 | 196,768 |
Independence Realty Trust, Inc. | 3,621 | 53,011 |
Industrial Logistics Properties Trust | 21,822 | 83,578 |
Invitation Homes, Inc. | 12,611 | 429,657 |
Iron Mountain, Inc. | 12,166 | 956,734 |
JBG SMITH Properties | 9,652 | 160,030 |
Jones Lang LaSalle, Inc. * | 6,029 | 1,146,957 |
Kennedy-Wilson Holdings, Inc. | 8,699 | 76,377 |
Kilroy Realty Corp. | 6,942 | 263,032 |
Kimco Realty Corp. | 22,142 | 437,526 |
Kite Realty Group Trust | 4,644 | 99,428 |
Lamar Advertising Co., Class A | 3,289 | 363,599 |
LTC Properties, Inc. | 1,493 | 46,970 |
LXP Industrial Trust | 11,495 | 99,547 |
Macerich Co. | 23,359 | 383,321 |
Marcus & Millichap, Inc. | 1,911 | 70,115 |
Medical Properties Trust, Inc. (a) | 42,025 | 176,925 |
Mid-America Apartment Communities, Inc. | 3,452 | 433,847 |
National Health Investors, Inc. | 1,723 | 99,021 |
National Storage Affiliates Trust | 1,818 | 65,103 |
NET Lease Office Properties | 332 | 8,097 |
Newmark Group, Inc., Class A | 12,974 | 139,989 |
NNN REIT, Inc. | 4,897 | 199,259 |
Office Properties Income Trust | 17,263 | 46,092 |
Omega Healthcare Investors, Inc. | 9,509 | 295,920 |
Opendoor Technologies, Inc. * | 35,943 | 110,704 |
Outfront Media, Inc. | 12,002 | 172,469 |
Paramount Group, Inc. | 33,805 | 149,756 |
Park Hotels & Resorts, Inc. | 30,994 | 514,500 |
Pebblebrook Hotel Trust | 8,188 | 129,698 |
Phillips Edison & Co., Inc. | 3,586 | 128,092 |
Physicians Realty Trust | 9,952 | 111,761 |
Piedmont Office Realty Trust, Inc., Class A | 23,921 | 149,985 |
Prologis, Inc. | 9,534 | 1,270,596 |
Public Storage | 2,761 | 783,765 |
Realty Income Corp. | 11,292 | 588,426 |
Regency Centers Corp. | 5,575 | 345,371 |
Retail Opportunity Investments Corp. | 5,883 | 76,067 |
Rexford Industrial Realty, Inc. | 1,599 | 81,357 |
RLJ Lodging Trust | 17,420 | 206,775 |
RMR Group, Inc., Class A | 1,531 | 37,464 |
Ryman Hospitality Properties, Inc. | 1,254 | 148,574 |
Sabra Health Care REIT, Inc. | 14,620 | 202,926 |
SBA Communications Corp. | 1,250 | 261,538 |
Service Properties Trust | 39,077 | 265,724 |
Simon Property Group, Inc. | 12,339 | 1,827,899 |
SITE Centers Corp. | 11,266 | 152,992 |
SL Green Realty Corp. | 10,530 | 510,494 |
STAG Industrial, Inc. | 3,850 | 142,989 |
Sun Communities, Inc. | 2,705 | 361,821 |
Sunstone Hotel Investors, Inc. | 14,495 | 162,199 |
Tanger, Inc. | 5,045 | 145,346 |
Terreno Realty Corp. | 989 | 63,593 |
UDR, Inc. | 8,682 | 308,211 |
Uniti Group, Inc. | 47,100 | 276,006 |
Urban Edge Properties | 6,549 | 111,399 |
SECURITY | NUMBER OF SHARES | VALUE ($) |
Ventas, Inc. | 23,310 | 985,780 |
Veris Residential, Inc. | 4,400 | 64,240 |
VICI Properties, Inc. | 9,212 | 275,715 |
Vornado Realty Trust | 23,955 | 630,017 |
Welltower, Inc. | 15,603 | 1,437,973 |
WP Carey, Inc. | 5,023 | 282,946 |
Xenia Hotels & Resorts, Inc. | 10,631 | 163,080 |
Zillow Group, Inc., Class A * | 1,048 | 56,655 |
Zillow Group, Inc., Class C * | 2,927 | 164,351 |
40,275,069 | ||
Total Common Stocks (Cost $73,702,558) | 78,798,533 | |
INVESTMENT COMPANIES 0.0% OF NET ASSETS | ||
United States 0.0% | ||
iShares Core U.S. REIT ETF | 329 | 17,427 |
Total Investment Companies (Cost $17,300) | 17,427 | |
SHORT-TERM INVESTMENTS 1.5% OF NET ASSETS | ||
Money Market Funds 1.5% | ||
State Street Institutional U.S. Government Money Market Fund, Premier Class 5.28% (c)(d) | 1,223,269 | 1,223,269 |
Total Short-Term Investments (Cost $1,223,269) | 1,223,269 | |
Total Investments in Securities (Cost $74,943,127) | 80,039,229 | |
NUMBER OF CONTRACTS | NOTIONAL AMOUNT ($) | CURRENT VALUE/ UNREALIZED APPRECIATION (DEPRECIATION) ($) | |
FUTURES CONTRACTS | |||
Long | |||
Dow Jones U.S. Real Estate Index, expires 03/15/24 | 6 | 205,320 | 1,217 |
MSCI EAFE Index, expires 03/15/24 | 1 | 114,395 | (502 ) |
MSCI Emerging Markets Index, expires 03/15/24 | 1 | 50,840 | (236 ) |
479 | |||
* | Non-income producing security. |
(a) | All or a portion of this security is on loan. Securities on loan were valued at $1,014,138. |
(b) | Fair valued using significant unobservable inputs (see financial note 2(a), Securities for which no quoted value is available, for additional information). |
(c) | The rate shown is the annualized 7-day yield. |
(d) | Security purchased with cash collateral received for securities on loan. |
ADR — | American Depositary Receipt |
CVA — | Dutch Certificate |
ETF — | Exchange-Traded Fund |
NVDR — | Non-Voting Depositary Receipt |
REIT — | Real Estate Investment Trust |
DESCRIPTION | QUOTED PRICES IN ACTIVE MARKETS FOR IDENTICAL ASSETS (LEVEL 1) | OTHER SIGNIFICANT OBSERVABLE INPUTS (LEVEL 2) | SIGNIFICANT UNOBSERVABLE INPUTS (LEVEL 3) | TOTAL |
Assets | ||||
Common Stocks1 | $44,110,324 | $— | $— | $44,110,324 |
Australia | — | 2,965,403 | — | 2,965,403 |
Belgium | — | 186,060 | — | 186,060 |
China | 294,934 | 6,383,729 | 21,692 | 6,700,355 |
France | — | 1,425,315 | — | 1,425,315 |
Germany | 38,091 | 1,984,795 | — | 2,022,886 |
Hong Kong | — | 4,963,614 | — | 4,963,614 |
Japan | — | 9,945,769 | — | 9,945,769 |
Netherlands | — | 133,273 | — | 133,273 |
Philippines | 133,842 | 462,926 | — | 596,768 |
Singapore | — | 1,108,582 | — | 1,108,582 |
South Africa | 622,570 | 258,031 | — | 880,601 |
Sweden | 187 | 573,379 | — | 573,566 |
Switzerland | — | 654,851 | — | 654,851 |
Taiwan | — | 328,143 | — | 328,143 |
Thailand | — | 519,653 | — | 519,653 |
United Kingdom | 375,966 | 1,307,404 | — | 1,683,370 |
Investment Companies1 | 17,427 | — | — | 17,427 |
Short-Term Investments1 | 1,223,269 | — | — | 1,223,269 |
Futures Contracts2 | 1,217 | — | — | 1,217 |
Liabilities | ||||
Futures Contracts2 | (738 ) | — | — | (738 ) |
Total | $46,817,089 | $33,200,927 | $21,692 | $80,039,708 |
1 | As categorized in the Portfolio Holdings. |
2 | Futures contracts are reported at cumulative unrealized appreciation or depreciation. |
Assets | ||
Investments in securities, at value - unaffiliated (cost $74,943,127) including securities on loan of $1,014,138 | $80,039,229 | |
Foreign currency, at value (cost $111,697) | 111,565 | |
Deposit with broker for futures contracts | 18,218 | |
Receivables: | ||
Investments sold | 273,146 | |
Dividends | 132,348 | |
Foreign tax reclaims | 58,190 | |
Fund shares sold | 28,151 | |
Income from securities on loan | 21,270 | |
Variation margin on future contracts | 1,113 | |
Prepaid expenses | + | 16,150 |
Total assets | 80,699,380 | |
Liabilities | ||
Collateral held for securities on loan | 1,223,269 | |
Payables: | ||
Due to custodian | 120,788 | |
Fund shares redeemed | 106,525 | |
Investment adviser fees | 24,638 | |
Investments bought | + | 9,536 |
Total liabilities | 1,484,756 | |
Net assets | $79,214,624 | |
Net Assets by Source | ||
Capital received from investors | $106,924,102 | |
Total distributable loss | + | (27,709,478 ) |
Net assets | $79,214,624 | |
Net Asset Value (NAV) | ||||
Net Assets | ÷ | Shares Outstanding | = | NAV |
$79,214,624 | 9,061,588 | $8.74 | ||
For the period March 1, 2023 through February 29, 2024 | ||
Investment Income | ||
Dividends received from securities - unaffiliated (net of foreign withholding tax of $167,844) | $3,220,000 | |
Interest received from securities - unaffiliated | 2,049 | |
Securities on loan, net | + | 198,080 |
Total investment income | 3,420,129 | |
Expenses | ||
Investment adviser fees | 346,191 | |
Total expenses | – | 346,191 |
Net investment income | 3,073,938 | |
REALIZED AND UNREALIZED GAINS (LOSSES) | ||
Net realized losses on sales of securities - unaffiliated | (6,780,342 ) | |
Net realized losses on futures contracts | (38,192 ) | |
Net realized losses on foreign currency transactions | + | (1,834 ) |
Net realized losses | (6,820,368 ) | |
Net change in unrealized appreciation (depreciation) on securities - unaffiliated | (172,896 ) | |
Net change in unrealized appreciation (depreciation) on futures contracts | 14,408 | |
Net change in unrealized appreciation (depreciation) on foreign currency translations | + | 4,758 |
Net change in unrealized appreciation (depreciation) | + | (153,730 ) |
Net realized and unrealized losses | (6,974,098 ) | |
Decrease in net assets resulting from operations | ($3,900,160 ) | |
OPERATIONS | |||
3/1/23-2/29/24 | 3/1/22-2/28/23 | ||
Net investment income | $3,073,938 | $3,574,007 | |
Net realized losses | (6,820,368 ) | (6,071,023 ) | |
Net change in unrealized appreciation (depreciation) | + | (153,730 ) | (20,074,678 ) |
Decrease in net assets from operations | ($3,900,160 ) | ($22,571,694 ) | |
DISTRIBUTIONS TO SHAREHOLDERS | |||
Total distributions | ($3,225,879 ) | ($3,154,839 ) | |
TRANSACTIONS IN FUND SHARES | |||||
3/1/23-2/29/24 | 3/1/22-2/28/23 | ||||
SHARES | VALUE | SHARES | VALUE | ||
Shares sold | 1,591,908 | $13,942,158 | 3,601,848 | $35,951,779 | |
Shares reinvested | 259,725 | 2,328,187 | 224,488 | 2,169,157 | |
Shares redeemed | + | (3,937,424 ) | (34,201,396 ) | (4,360,523 ) | (42,173,011 ) |
Net transactions in fund shares | (2,085,791 ) | ($17,931,051 ) | (534,187 ) | ($4,052,075 ) | |
SHARES OUTSTANDING AND NET ASSETS | |||||
3/1/23-2/29/24 | 3/1/22-2/28/23 | ||||
SHARES | NET ASSETS | SHARES | NET ASSETS | ||
Beginning of period | 11,147,379 | $104,271,714 | 11,681,566 | $134,050,322 | |
Total decrease | + | (2,085,791 ) | (25,057,090 ) | (534,187 ) | (29,778,608 ) |
End of period | 9,061,588 | $79,214,624 | 11,147,379 | $104,271,714 | |
SCHWAB CAPITAL TRUST | |
Schwab Fundamental Global Real Estate Index Fund | Schwab Target 2015 Fund |
Schwab Fundamental US Large Company Index Fund | Schwab Target 2020 Fund |
Schwab Fundamental US Small Company Index Fund | Schwab Target 2025 Fund |
Schwab Fundamental International Large Company Index Fund | Schwab Target 2030 Fund |
Schwab Fundamental International Small Company Index Fund | Schwab Target 2035 Fund |
Schwab Fundamental Emerging Markets Large Company Index Fund | Schwab Target 2040 Fund |
Schwab S&P 500 Index Fund | Schwab Target 2045 Fund |
Schwab Small-Cap Index Fund® | Schwab Target 2050 Fund |
Schwab Total Stock Market Index Fund® | Schwab Target 2055 Fund |
Schwab U.S. Large-Cap Growth Index Fund | Schwab Target 2060 Fund |
Schwab U.S. Large-Cap Value Index Fund | Schwab Target 2065 Fund |
Schwab U.S. Mid-Cap Index Fund | Schwab Monthly Income Fund — Target Payout |
Schwab International Index Fund® | Schwab Monthly Income Fund — Flexible Payout |
Schwab MarketTrack All Equity Portfolio™ | Schwab Monthly Income Fund — Income Payout |
Schwab MarketTrack Growth Portfolio™ | Schwab Target 2010 Index Fund |
Schwab MarketTrack Balanced Portfolio™ | Schwab Target 2015 Index Fund |
Schwab MarketTrack Conservative Portfolio™ | Schwab Target 2020 Index Fund |
Schwab International Opportunities Fund™ | Schwab Target 2025 Index Fund |
Schwab Balanced Fund | Schwab Target 2030 Index Fund |
Schwab Core Equity Fund | Schwab Target 2035 Index Fund |
Schwab Dividend Equity Fund | Schwab Target 2040 Index Fund |
Schwab Large-Cap Growth Fund | Schwab Target 2045 Index Fund |
Schwab Small-Cap Equity Fund | Schwab Target 2050 Index Fund |
Schwab Health Care Fund | Schwab Target 2055 Index Fund |
Schwab International Core Equity Fund | Schwab Target 2060 Index Fund |
Schwab Target 2010 Fund | Schwab Target 2065 Index Fund |
2. Significant Accounting Policies:
3. Risk Factors:
4. Affiliates and Affiliated Transactions:
5. Board of Trustees:
6. Borrowing from Banks:
7. Derivatives:
EQUITY CONTRACTS | TOTAL | |
Asset Derivatives | ||
Futures Contracts1 | $1,217 | $1,217 |
Liability Derivatives | ||
Futures Contracts2 | ($738 ) | ($738 ) |
1 | Includes cumulative unrealized appreciation of futures contracts as reported in the fund’s Holdings. Only current day’s variation margin on futures contracts is reported within the Statement of Assets and Liabilities. |
2 | Includes cumulative unrealized depreciation of futures contracts as reported in the fund’s Holdings. Only current day’s variation margin on futures contracts is reported within the Statement of Assets and Liabilities. |
EQUITY CONTRACTS | TOTAL | |
Net Realized Gains (Losses) | ||
Futures Contracts1 | ($38,192 ) | ($38,192 ) |
Net Change in Unrealized Appreciation (Depreciation) | ||
Futures Contracts2 | $14,408 | $14,408 |
1 | Statement of Operations location: Net realized gains (losses) on futures contracts. |
2 | Statement of Operations location: Net change in unrealized appreciation (depreciation) on futures contracts. |
Notional Amount | Number of Contracts |
$508,478 | 11 |
PURCHASES OF SECURITIES | SALES OF SECURITIES |
$13,981,180 | $31,540,549 |
9. Federal Income Taxes:
TAX COST | GROSS UNREALIZED APPRECIATION | GROSS UNREALIZED DEPRECIATION | NET UNREALIZED APPRECIATION (DEPRECIATION) | |
$88,453,679 | $18,464,131 | ($26,878,102 ) | ($8,413,971 ) | |
UNDISTRIBUTED ORDINARY INCOME | NET UNREALIZED APPRECIATION (DEPRECIATION) ON INVESTMENTS | NET OTHER UNREALIZED APPRECIATION (DEPRECIATION) | CAPITAL LOSS CARRYFORWARDS AND OTHER LOSSES | TOTAL |
$559,955 | ($8,413,971 ) | ($2,415 ) | ($19,853,047 ) | ($27,709,478 ) |
CURRENT FISCAL YEAR END DISTRIBUTIONS | PRIOR FISCAL YEAR END DISTRIBUTIONS | |
ORDINARY INCOME | ORDINARY INCOME | |
$3,225,879 | $3,154,839 |
Denver, Colorado
April 16, 2024
Independent Trustees | |||
Name, Year of Birth, and Position(s) with the trust (Terms of office, and length of Time Served1) | Principal Occupations During the Past Five Years | Number of Portfolios in Fund Complex Overseen by the Trustee | Other Directorships |
Michael J. Beer 1961 Trustee (Trustee of The Charles Schwab Family of Funds, Schwab Investments, Schwab Capital Trust, Schwab Annuity Portfolios, Schwab Strategic Trust and Laudus Trust since 2022) | Retired. Director, President and Chief Executive Officer (Dec. 2016 – Sept. 2019), Principal Funds (investment management). | 106 | Director (2016 – 2019), Principal Funds, Inc. |
Robert W. Burns 1959 Trustee (Trustee of Schwab Strategic Trust since 2009; The Charles Schwab Family of Funds, Schwab Investments, Schwab Capital Trust, Schwab Annuity Portfolios and Laudus Trust since 2016) | Retired/Private Investor. | 106 | None |
Nancy F. Heller 1956 Trustee (Trustee of The Charles Schwab Family of Funds, Schwab Investments, Schwab Capital Trust, Schwab Annuity Portfolios, Schwab Strategic Trust and Laudus Trust since 2018) | Retired. | 106 | None |
David L. Mahoney 1954 Trustee (Trustee of The Charles Schwab Family of Funds, Schwab Investments, Schwab Capital Trust, Schwab Annuity Portfolios and Laudus Trust since 2011; Schwab Strategic Trust since 2016) | Private Investor. | 106 | Director (2004 – present), Corcept Therapeutics Incorporated Director (2009 – 2021), Adamas Pharmaceuticals, Inc. Director (2003 – 2019), Symantec Corporation |
Jane P. Moncreiff 1961 Trustee (Trustee of The Charles Schwab Family of Funds, Schwab Investments, Schwab Capital Trust, Schwab Annuity Portfolios, Schwab Strategic Trust and Laudus Trust since 2019) | Consultant (2018 – present), Fulham Advisers LLC (management consulting); Chief Investment Officer (2009 – 2017), CareGroup Healthcare System, Inc. (healthcare). | 106 | None |
Independent Trustees (continued) | |||
Name, Year of Birth, and Position(s) with the trust (Terms of office, and length of Time Served1) | Principal Occupations During the Past Five Years | Number of Portfolios in Fund Complex Overseen by the Trustee | Other Directorships |
Kimberly S. Patmore 1956 Trustee (Trustee of The Charles Schwab Family of Funds, Schwab Investments, Schwab Capital Trust, Schwab Annuity Portfolios, Schwab Strategic Trust and Laudus Trust since 2016) | Consultant (2008 – present), Patmore Management Consulting (management consulting). | 106 | None |
J. Derek Penn 1957 Trustee (Trustee of The Charles Schwab Family of Funds, Schwab Investments, Schwab Capital Trust, Schwab Annuity Portfolios, Schwab Strategic Trust and Laudus Trust since 2021) | Head of Equity Sales and Trading (2006 – 2018), BNY Mellon (financial services). | 106 | None |
Interested Trustees | |||
Name, Year of Birth, and Position(s) with the trust (Terms of office, and length of Time Served1) | Principal Occupations During the Past Five Years | Number of Portfolios in Fund Complex Overseen by the Trustee | Other Directorships |
Walter W. Bettinger II2 1960 Chairman and Trustee (Trustee of The Charles Schwab Family of Funds, Schwab Investments, Schwab Capital Trust and Schwab Annuity Portfolios since 2008; Schwab Strategic Trust since 2009; Laudus Trust since 2010) | Co-Chairman of the Board (July 2022 – present), Director and Chief Executive Officer (Oct. 2008 – present) and President (Feb. 2007 – Oct. 2021), The Charles Schwab Corporation; President and Chief Executive Officer (Oct. 2008 – Oct. 2021) and Director (May 2008 – Oct. 2021), Charles Schwab & Co., Inc.; Co-Chairman of the Board (July 2022 – present) and Director (Apr. 2006 – present), Charles Schwab Bank, SSB; Co-Chairman of the Board (July 2022 – present) and Director (Nov. 2017 – present), Charles Schwab Premier Bank, SSB; Co-Chairman of the Board (July 2022 – present) and Director (July 2019 – present), Charles Schwab Trust Bank; Director (May 2008 – present), Chief Executive Officer (Aug. 2017 – present) and President (Aug. 2017 – Nov. 2021), Schwab Holdings, Inc.; Manager (Sept. 2023 – present), TD Ameritrade Holding LLC; Director (Oct. 2020 – Aug. 2023), TD Ameritrade Holding Corporation; Director (July 2016 – Oct. 2021), Charles Schwab Investment Management, Inc. | 106 | Director (2008 – present), The Charles Schwab Corporation |
Richard A. Wurster2 1973 Trustee (Trustee of The Charles Schwab Family of Funds, Schwab Investments, Schwab Capital Trust, Schwab Annuity Portfolios, Schwab Strategic Trust and Laudus Trust since 2022) | President (Oct. 2021 – present) and Executive Vice President – Schwab Asset Management Solutions (Apr. 2019 – Oct. 2021), The Charles Schwab Corporation; President, Director (Oct. 2021 – present), Executive Vice President – Schwab Asset Management Solutions (July 2019 – Oct. 2021) and Senior Vice President – Advisory (May 2016 – July 2019), Charles Schwab & Co., Inc.; President (Nov. 2021 – present), Schwab Holdings, Inc.; Director (Oct. 2021 – present) and Chief Executive Officer (Nov. 2019 – Jan. 2022), Charles Schwab Investment Management, Inc.; Director, Chief Executive Officer and President (Mar. 2018 – Oct. 2022), Charles Schwab Investment Advisory, Inc.; Chief Executive Officer (July 2016 – Apr. 2018) and President (Mar. 2017 – Apr. 2018), ThomasPartners, Inc.; Chief Executive Officer (July 2016 – Apr. 2018), Windhaven Investment Management, Inc. | 106 | None |
Officers of the Trust | |
Name, Year of Birth, and Position(s) with the trust (Terms of office, and length of Time Served3) | Principal Occupations During the Past Five Years |
Omar Aguilar 1970 Chief Executive Officer, President and Chief Investment Officer (Officer of The Charles Schwab Family of Funds, Schwab Investments, Schwab Capital Trust, Schwab Annuity Portfolios, Schwab Strategic Trust and Laudus Trust since 2011) | Chief Executive Officer (Jan. 2022 – present), President (Oct. 2023 – present), (Chief Investment Officer (Apr. 2011 – present) and Senior Vice President (Apr. 2011 – Jan. 2022), Charles Schwab Investment Management, Inc.; Director, Chief Executive Officer and President (Oct. 2022 – present), Charles Schwab Investment Advisory, Inc.; Chief Executive Officer (Sept. 2023 – present), President (Oct. 2023 – present), Chief Investment Officer (June 2011 – present) and Vice President (June 2011 – Sept. 2023), Schwab Funds, Laudus Trust and Schwab ETFs. |
Mark Fischer 1970 Chief Operating Officer (Officer of The Charles Schwab Family of Funds, Schwab Investments, Schwab Capital Trust, Schwab Annuity Portfolios, Schwab Strategic Trust and Laudus Trust since 2013) | Chief Operating Officer (Dec. 2020 – present) and Treasurer and Chief Financial Officer (Jan. 2016 – Dec. 2022), Schwab Funds, Laudus Trust and Schwab ETFs; Chief Financial Officer (Mar. 2020 – present), Chief Operating Officer (Oct. 2023 – present), Managing Director (Mar. 2023 – present) and Vice President (Oct. 2013 – Mar. 2023), Charles Schwab Investment Management, Inc. |
Dana Smith 1965 Treasurer and Chief Financial Officer (Officer of The Charles Schwab Family of Funds, Schwab Investments, Schwab Capital Trust, Schwab Annuity Portfolios, Schwab Strategic Trust and Laudus Trust since 2023) | Treasurer and Chief Financial Officer (Jan. 2023 – present) and Assistant Treasurer (Dec. 2015 – Dec. 2022), Schwab Funds, Laudus Trust and Schwab ETFs; Managing Director (Mar. 2023 – present), Vice President (Mar. 2022 – Mar. 2023) and Director (Oct. 2015 – Mar. 2022), Charles Schwab Investment Management, Inc.; Managing Director (May 2022 – present) and Vice President (Apr. 2022 – May 2022), Charles Schwab & Co., Inc. |
Patrick Cassidy 1964 Vice President and Chief Investment Officer (Officer of The Charles Schwab Family of Funds, Schwab Investments, Schwab Capital Trust, Schwab Annuity Portfolios, Schwab Strategic Trust and Laudus Trust since 2018) | Chief Investment Officer (Oct. 2023 – present) and Vice President (Feb. 2018 – present), Schwab Funds, Laudus Trust and Schwab ETFs; Managing Director (Mar. 2023 – present), Chief Investment Officer (Oct. 2023 – present), and Senior Vice President (Oct. 2012 – Mar. 2023), Charles Schwab Investment Management, Inc. |
William P. McMahon, Jr. 1972 Vice President and Chief Investment Officer (Officer of The Charles Schwab Family of Funds, Schwab Investments, Schwab Capital Trust, Schwab Annuity Portfolios, Schwab Strategic Trust and Laudus Trust since 2021) | Managing Director (Mar. 2023 – present), Senior Vice President (Jan. 2020 – Mar. 2023) and Chief Investment Officer (Jan. 2020 – present) Charles Schwab Investment Management, Inc.; Vice President and Chief Investment Officer (June 2021 – present), Schwab Funds, Laudus Trust and Schwab ETFs; Senior Vice President and Chief Investment Officer – ThomasPartners Strategies (Apr. 2018 – Dec. 2019), Charles Schwab Investment Advisory, Inc.; Senior Vice President and Chief Investment Officer (May 2001 – Apr. 2018), ThomasPartners, Inc. |
Catherine MacGregor 1964 Chief Legal Officer and Secretary, Schwab Funds and Schwab ETFs Chief Legal Officer, Vice President and Clerk, Laudus Trust (Officer of The Charles Schwab Family of Funds, Schwab Investments, Schwab Capital Trust, Schwab Annuity Portfolios and Laudus Trust since 2005; Schwab Strategic Trust since 2009) | Chief Legal Officer (Mar. 2022 – present), Managing Director (Mar. 2023 – present) and Vice President (Sept. 2005 – Mar. 2023), Charles Schwab Investment Management, Inc.; Managing Director (May 2022 – present) and Vice President (Aug. 2005 – May 2022), Charles Schwab & Co., Inc.; Vice President (Dec. 2005 – present) and Chief Legal Officer and Clerk (Mar. 2007 – present), Laudus Trust; Chief Legal Officer and Secretary (Oct. 2021 – present), Vice President (Nov. 2005 – Oct. 2021) and Assistant Secretary (June 2007 – Oct. 2021), Schwab Funds; Chief Legal Officer and Secretary (Oct. 2021 – present), Vice President and Assistant Secretary (Oct. 2009 – Oct. 2021), Schwab ETFs. |
Member SIPC®
Printed on recycled paper.
Item 2: Code of Ethics.
| (a) | Registrant has adopted a code of ethics that applies to its principal executive officer, principal financial officer, and any other persons who perform a similar function, regardless of whether these individuals are employed by Registrant or a third party. |
| (c) | During the period covered by the report, no amendments were made to the provisions of this code of ethics. |
| (d) | During the period covered by the report, Registrant did not grant any waivers, including implicit waivers, from the provisions of this code of ethics. |
(f)(1) Registrant has filed this code of ethics as an exhibit pursuant to Item 19(a)(1) of Form N-CSR.
Item 3: Audit Committee Financial Expert.
Registrant’s Board of Trustees has determined that Kimberly S. Patmore, Michael J. Beer and J. Derek Penn, each currently serving on its audit, compliance and valuation committee, are each an “audit committee financial expert,” as such term is defined in Item 3 of Form N-CSR. Each member of Registrant’s audit, compliance and valuation committee is “independent” under the standards set forth in Item 3 of Form N-CSR.
The designation of each of Ms. Patmore, Mr. Beer and Mr. Penn as an “audit committee financial expert” pursuant to Item 3 of Form N-CSR does not (i) impose upon such individual any duties, obligations, or liability that are greater than the duties, obligations and liability imposed upon such individual as a member of Registrant’s audit, compliance and valuation committee or Board of Trustees in the absence of such designation; and (ii) affect the duties, obligations or liability of any other member of Registrant’s audit, compliance and valuation committee or Board of Trustees.
Item 4: Principal Accountant Fees and Services.
Registrant is composed of fifty-two operational series. One series has a fiscal year-end of the last day of February, whose annual financial statements are reported in Item 1, twelve series have a fiscal year-end of March 31, thirty-six series have a fiscal year-end of October 31, and three series have a fiscal year-end of December 31. Principal accountant fees disclosed in Items 4(a)-(d) and 4(g) include fees billed for services rendered to the fifty-two operational series during 2023/2024 and 2022/2023, based on their respective 2023/2024 and 2022/2023 fiscal years, as applicable.
The following table presents fees billed by the principal accountant in each of the last two fiscal years for the services rendered to the Funds:
(a)Audit Fees1 | (b)Audit-Related Fees2 | (c) Tax Fees3 | (d) All Other Fees | |||||||||||
Fiscal Year | Fiscal Year | Fiscal Year | Fiscal Year | Fiscal Year | Fiscal Year | Fiscal Year | Fiscal Year | |||||||
| $1,272,477 | $1,195,825 | $95,400 | $90,000 | $170,820 | $161,200 | $0 | $0 | |||||||
| 1 | The nature of the services includes audit of the registrant’s annual financial statements and normally provided services in connection with regulatory filings for those fiscal years. |
| 2 | The nature of the services includes assurance and related services reasonably related to the performance of the audit of financial statements not included in Audit Fees. |
| 3 | The nature of the services includes tax compliance, tax advice and tax planning. |
| (e) (1) | Registrant’s audit, compliance and valuation committee does not have pre-approval policies and procedures as described in paragraph (c)(7) of Rule 2-01 of Regulation S-X. |
| (2) | There were no services described in each of paragraphs (b) through (d) above that were approved by Registrant’s audit, compliance and valuation committee pursuant to paragraph (c)(7)(i)(C) of Rule 2-01 of Regulation S-X. |
| (f) | Not applicable. |
| (g) | Below are the aggregate non-audit fees billed in each of the last two fiscal years by Registrant’s principal accountant for services rendered to Registrant, to Registrant’s investment adviser, and to any entity controlling, controlled by, or under common control with Registrant’s investment adviser that provides ongoing services to Registrant. |
2023/2024: $4,105,914 | 2022/2023: $ | 2,859,315 |
| (h) | During the past fiscal year, all non-audit services provided by Registrant’s principal accountant to either Registrant’s investment adviser or to any entity controlling, controlled by, or under common control with Registrant’s investment adviser that provides ongoing services to Registrant were pre-approved. Included in the audit, compliance and valuation committee’s pre-approval was the review and consideration as to whether the provision of these non-audit services is compatible with maintaining the principal accountant’s independence. |
| (i) | Not applicable. |
| (j) | Not applicable. |
Item 5: Audit Committee of Listed Registrants.
Not applicable.
Item 6: Schedule of Investments.
The schedule of investments is included as part of the report to shareholders filed under Item 1 of this Form.
Item 7: Financial Statements and Financial Highlights for Open-End Management Investment Companies.
The financial statements and financial highlights are included as part of the report to shareholders filed under Item 1 of this Form.
Item 8: Changes in and Disagreements with Accountants for Open-End Management Investment Companies.
Not applicable.
Item 9: Proxy Disclosures for Open-End Management Investment Companies.
Not applicable.
Item 10: Remuneration Paid to Directors, Officers, and Others of Open-End Management Investment Companies.
The remuneration paid to directors, officers and others are included as part of the report to shareholders filed under Item 1 of this Form.
Item 11: Statement Regarding Basis for Approval of Investment Advisory Contract.
Not applicable.
Item 12: Disclosure of Proxy Voting Policies and Procedures for Closed-End Management Investment Companies.
Not applicable.
Item 13: Portfolio Managers of Closed-End Management Investment Companies.
Not applicable.
Item 14: Purchases of Equity Securities by Closed-End Management Investment Company and Affiliated Purchasers.
Not applicable.
Item 15: Submission of Matters to a Vote of Security Holders.
Not applicable.
Item 16: Controls and Procedures.
| (a) | Based on their evaluation of Registrant’s disclosure controls and procedures, as of a date within 90 days of the filing date, Registrant’s Principal Executive Officer, Omar Aguilar and Registrant’s Principal Financial Officer, Dana Smith, have concluded that Registrant’s disclosure controls and procedures are: (i) reasonably designed to ensure that information required to be disclosed in this report is appropriately communicated to Registrant’s officers to allow timely decisions regarding disclosures required in this report; (ii) reasonably designed to ensure that information required to be disclosed in this report is recorded, processed, summarized and reported in a timely manner; and (iii) are effective in achieving the goals described in (i) and (ii) above. |
| (b) | During the period covered by this report, there have been no changes in Registrant’s internal control over financial reporting that the above officers believe to have materially affected, or to be reasonably likely to materially affect, Registrant’s internal control over financial reporting. |
Item 17: Disclosure of Securities Lending Activities for Closed-End Management Investment Companies.
Not applicable.
Item 18: Recovery of Erroneously Awarded Compensation.
(a) Not applicable.
(b) Not applicable.
Item 19: Exhibits.
| (a) (1) |
| (2) | Not applicable. |
| (3) |
| (b) |
Pursuant to the requirements of the Securities Exchange Act of 1934 and the Investment Company Act of 1940, the registrant has duly caused this report to be signed on its behalf by the undersigned, thereunto duly authorized.
(Registrant) Schwab Capital Trust – Schwab Fundamental Global Real Estate Index Fund
| By: | /s/ Omar Aguilar | |
Omar Aguilar Principal Executive Officer | ||
| Date: | April 16, 2024 | |
Pursuant to the requirements of the Securities Exchange Act of 1934 and the Investment Company Act of 1940, this report has been signed below by the following persons on behalf of the registrant and in the capacities and on the dates indicated.
| By: | /s/ Omar Aguilar | |
Omar Aguilar Principal Executive Officer | ||
| Date: | April 16, 2024 | |
| By: | /s/ Dana Smith | |
Dana Smith Principal Financial Officer | ||
| Date: | April 16, 2024 | |