Janus Henderson VIT Flexible Bond Portfolio
Additional Information (unaudited)
management fees during periods of underperformance, the steps Janus Capital and Perkins had taken or were taking to improve performance, and that the performance trend was improving.
· For Janus Henderson Select Value Fund (formerly, Perkins Select Value Fund), the Trustees noted that the Fund’s performance was in the second Broadridge quartile for the 36 months ended May 31, 2016 and the first Broadridge quartile for the 12 months ended May 31, 2016.
· For Janus Henderson Small Cap Value Fund (formerly, Perkins Small Cap Value Fund), the Trustees noted that the Fund’s performance was in the first Broadridge quartile for the 36 months ended May 31, 2016 and the first Broadridge quartile for the 12 months ended May 31, 2016.
· For Janus Henderson Value Plus Income Fund (formerly, Perkins Value Plus Income Fund), the Trustees noted that the Fund’s performance was in the second Broadridge quartile for the 36 months ended May 31, 2016 and the second Broadridge quartile for the 12 months ended May 31, 2016.
Mathematical Funds
· For Janus Henderson Emerging Markets Managed Volatility Fund (formerly, INTECH Emerging Markets Managed Volatility Fund), the Trustees noted that the Fund’s performance was in the second Broadridge quartile for the 12 months ended May 31, 2016.
· For Janus Henderson Global Income Managed Volatility Fund (formerly, INTECH Global Income Managed Volatility Fund), the Trustees noted that the Fund’s performance was in the first Broadridge quartile for the 36 months ended May 31, 2016 and the first Broadridge quartile for the 12 months ended May 31, 2016.
· For Janus Henderson International Managed Volatility Fund (formerly, INTECH International Managed Volatility Fund), the Trustees noted that the Fund’s performance was in the first Broadridge quartile for the 36 months ended May 31, 2016 and the first Broadridge quartile for the 12 months ended May 31, 2016.
· For Janus Henderson U.S. Managed Volatility Fund (formerly, INTECH U.S. Managed Volatility Fund), the Trustees noted that the Fund’s performance was in the first Broadridge quartile for the 36 months ended May 31, 2016 and the first Broadridge quartile for the 12 months ended May 31, 2016.
Growth and Core Funds
· For Janus Henderson Balanced Fund (formerly, Janus Balanced Fund), the Trustees noted that the Fund’s performance was in the first Broadridge quartile for the 36 months ended May 31, 2016 and the third Broadridge quartile for the 12 months ended May 31, 2016.
· For Janus Henderson Contrarian Fund (formerly, Janus Contrarian Fund), the Trustees noted that the Fund’s performance was in the bottom Broadridge quartile for the 36 months ended May 31, 2016 and the bottom Broadridge quartile for the 12 months ended May 31, 2016. The Trustees noted the reasons for the Fund’s underperformance, noting that the Fund has a performance fee structure that results in lower management fees during periods of underperformance, and the steps Janus Capital had taken or was taking to improve performance.
· For Janus Henderson Enterprise Fund (formerly, Janus Enterprise Fund), the Trustees noted that the Fund’s performance was in the first Broadridge quartile for the 36 months ended May 31, 2016 and the first Broadridge quartile for the 12 months ended May 31, 2016.
· For Janus Henderson Forty Fund (formerly, Janus Forty Fund), the Trustees noted that the Fund’s performance was in the first Broadridge quartile for the 36 months ended May 31, 2016 and the first Broadridge quartile for the 12 months ended May 31, 2016.
· For Janus Henderson Growth and Income Fund (formerly, Janus Growth and Income Fund), the Trustees noted that the Fund’s performance was in the second Broadridge quartile for the 36 months ended May 31, 2016 and in the second Broadridge quartile for the 12 months ended May 31, 2016.
· For Janus Henderson Research Fund (formerly, Janus Research Fund), the Trustees noted that the Fund’s performance was in the first Broadridge quartile for the 36 months ended May 31, 2016 and the second Broadridge quartile for the 12 months ended May 31, 2016.
Janus Henderson VIT Flexible Bond Portfolio
Additional Information (unaudited)
· For Janus Henderson Triton Fund (formerly, Janus Triton Fund), the Trustees noted that the Fund’s performance was in the first Broadridge quartile for the 36 months ended May 31, 2016 and the first Broadridge quartile for the 12 months ended May 31, 2016.
· For Janus Henderson Venture Fund (formerly, Janus Venture Fund), the Trustees noted that the Fund’s performance was in the first Broadridge quartile for the 36 months ended May 31, 2016 and the second Broadridge quartile for the 12 months ended May 31, 2016.
Global and International Funds
· For Janus Henderson Adaptive Global Allocation Fund (formerly, Janus Adaptive Global Allocation Fund), the Trustees noted that, due to limited performance for the Fund, performance history was not a material factor.
· For Janus Henderson Asia Equity Fund (formerly, Janus Asia Equity Fund), the Trustees noted that the Fund’s performance was in the third Broadridge quartile for the 36 months ended May 31, 2016 and the bottom Broadridge quartile for the 12 months ended May 31, 2016. The Trustees noted the reasons for the Fund’s underperformance, noting that the Fund has a performance fee structure that results in lower management fees during periods of underperformance, and the steps Janus Capital had taken or was taking to improve performance.
· For Janus Henderson Global Life Sciences Fund (formerly, Janus Global Life Sciences Fund), the Trustees noted that the Fund’s performance was in the first Broadridge quartile for the 36 months ended May 31, 2016 and the bottom Broadridge quartile for the 12 months ended May 31, 2016.
· For Janus Henderson Global Real Estate Fund (formerly, Janus Global Real Estate Fund), the Trustees noted that the Fund’s performance was in the third Broadridge quartile for the 36 months ended May 31, 2016 and the bottom Broadridge quartile for the 12 months ended May 31, 2016. The Trustees noted the reasons for the Fund’s underperformance, noting that the Fund has a performance fee structure that results in lower management fees during periods of underperformance, and the steps Janus Capital had taken or was taking to improve performance.
· For Janus Henderson Global Research Fund (formerly, Janus Global Research Fund), the Trustees noted that the Fund’s performance was in the third Broadridge quartile for the 36 months ended May 31, 2016 and the bottom Broadridge quartile for the 12 months ended May 31, 2016. The Trustees noted the reasons for the Fund’s underperformance, noting that the Fund has a performance fee structure that results in lower management fees during periods of underperformance, and the steps Janus Capital had taken or was taking to improve performance.
· For Janus Henderson Global Select Fund (formerly, Janus Global Select Fund), the Trustees noted that the Fund’s performance was in the bottom Broadridge quartile for the 36 months ended May 31, 2016 and the bottom Broadridge quartile for the 12 months ended May 31, 2016. The Trustees noted the reasons for the Fund’s underperformance and the steps Janus Capital had taken or was taking to improve performance.
· For Janus Henderson Global Technology Fund (formerly, Janus Global Technology Fund), the Trustees noted that the Fund’s performance was in the third Broadridge quartile for the 36 months ended May 31, 2016 and the first Broadridge quartile for the 12 months ended May 31, 2016. The Trustees noted the reasons for the Fund’s underperformance, the steps Janus Capital had taken or was taking to improve performance, and that the performance trend was improving.
· For Janus Overseas Fund (formerly, Janus Henderson Overseas Fund), the Trustees noted that the Fund’s performance was in the bottom Broadridge quartile for the 36 months ended May 31, 2016 and the bottom Broadridge quartile for the 12 months ended May 31, 2016. The Trustees noted the reasons for the Fund’s underperformance, noting that the Fund has a performance fee structure that results in lower management fees during periods of underperformance, and the steps Janus Capital had taken or was taking to improve performance.
Janus Aspen Series
· For Janus Henderson Balanced Portfolio (formerly, Janus Aspen Balanced Portfolio), the Trustees noted that the Fund’s performance was in the first Broadridge quartile for the 36 months ended May 31, 2016 and the third Broadridge quartile for the 12 months ended May 31, 2016.
Janus Henderson VIT Flexible Bond Portfolio
Additional Information (unaudited)
· For Janus Henderson Enterprise Portfolio (formerly, Janus Aspen Enterprise Portfolio), the Trustees noted that the Fund’s performance was in the first Broadridge quartile for the 36 months ended May 31, 2016 and the first Broadridge quartile for the 12 months ended May 31, 2016.
· For Janus Henderson Flexible Bond Portfolio (formerly, Janus Aspen Flexible Bond Portfolio), the Trustees noted that the Fund’s performance was in the second Broadridge quartile for the 36 months ended May 31, 2016 and the bottom Broadridge quartile for the 12 months ended May 31, 2016.
· For Janus Henderson Forty Portfolio (formerly, Janus Aspen Forty Portfolio), the Trustees noted that the Fund’s performance was in the first Broadridge quartile for the 36 months ended May 31, 2016 and the first Broadridge quartile for the 12 months ended May 31, 2016.
· For Janus Henderson Global Allocation Portfolio – Moderate (formerly, Janus Aspen Global Allocation Portfolio – Moderate), the Trustees noted that the Fund’s performance was in the bottom Broadridge quartile for the 36 months ended May 31, 2016 and the bottom Broadridge quartile for the 12 months ended May 31, 2016. The Trustees noted the reasons for the Fund’s underperformance and the steps Janus Capital had taken or was taking to improve performance.
· For Janus Henderson Global Research Portfolio (formerly, Janus Aspen Global Research Portfolio), the Trustees noted that the Fund’s performance was in the third Broadridge quartile for the 36 months ended May 31, 2016 and the bottom Broadridge quartile for the 12 months ended May 31, 2016. The Trustees noted the reasons for the Fund’s underperformance, noting that the Fund has a performance fee structure that results in lower management fees during periods of underperformance, and the steps Janus Capital had taken or was taking to improve performance
· For Janus Henderson Global Technology Portfolio (formerly, Janus Aspen Global Technology Portfolio), the Trustees noted that the Fund’s performance was in the third Broadridge quartile for the 36 months ended May 31, 2016 and the second Broadridge quartile for the 12 months ended May 31, 2016. The Trustees noted the reasons for the Fund’s underperformance and the steps Janus Capital had taken or was taking to improve performance.
· For Janus Henderson Global Unconstrained Bond Portfolio (formerly, Janus Aspen Global Unconstrained Bond Portfolio), the Trustees noted that the Fund’s performance was in the second Broadridge quartile for the 12 months ended May 31, 2016.
· For Janus Henderson U.S. Low Volatility Portfolio (formerly, Janus Aspen INTECH U.S. Low Volatility Portfolio), the Trustees noted that the Fund’s performance was in the first Broadridge quartile for the 36 months ended May 31, 2016 and the first Broadridge quartile for the 12 months ended May 31, 2016.
· For Janus Henderson Research Portfolio (formerly, Janus Aspen Janus Portfolio), the Trustees noted that the Fund’s performance was in the first Broadridge quartile for the 36 months ended May 31, 2016 and the second Broadridge quartile for the 12 months ended May 31, 2016.
· For Janus Henderson Overseas Portfolio (formerly, Janus Aspen Overseas Portfolio), the Trustees noted that the Fund’s performance was in the bottom Broadridge quartile for the 36 months ended May 31, 2016 and the bottom Broadridge quartile for the 12 months ended May 31, 2016. The Trustees noted the reasons for the Fund’s underperformance, noting that the Fund has a performance fee structure that results in lower management fees during periods of underperformance, and the steps Janus Capital had taken or was taking to improve performance.
· For Janus Henderson Mid Cap Value Portfolio (formerly, Janus Aspen Perkins Mid Cap Value Portfolio), the Trustees noted that the Fund’s performance was in the bottom Broadridge quartile for the 36 months ended May 31, 2016 and the first Broadridge quartile for the 12 months ended May 31, 2016. The Trustees noted the reasons for the Fund’s underperformance, noting that the Fund has a performance fee structure that results in lower management fees during periods of underperformance, the steps Janus Capital and Perkins had taken or were taking to improve performance, and that the performance trend was improving.
In consideration of each Fund’s performance, the Trustees concluded that, taking into account the factors relevant to performance, as well as other considerations, including steps taken to improve performance, the Fund’s performance warranted continuation of the Fund’s investment advisory and subadvisory agreement(s).
Janus Henderson VIT Flexible Bond Portfolio
Additional Information (unaudited)
Costs of Services Provided
The Trustees examined information regarding the fees and expenses of each Fund in comparison to similar information for other comparable funds as provided by Broadridge, an independent data provider. They also reviewed an analysis of that information provided by their independent fee consultant and noted that the rate of management (investment advisory and any administration, but excluding out-of-pocket costs) fees for many of the Funds, after applicable waivers, was below the average management fee rate of the respective peer group of funds selected by an independent data provider. The Trustees also examined information regarding the subadvisory fees charged for subadvisory services, as applicable, noting that all such fees were paid by Janus Capital out of its management fees collected from such Fund.
The independent fee consultant provided its belief that the management fees charged by Janus Capital to each of the Funds under the current investment advisory and administration agreements are reasonable in relation to the services provided by Janus Capital. The independent fee consultant found: (1) the total expenses and management fees of the Funds to be reasonable relative to other mutual funds; (2) total expenses, on average, were 12% below the average total expenses of their respective Broadridge Expense Group peers and 20% below the average total expenses for their Broadridge Expense Universes; (3) management fees for the Funds, on average, were 11% below the average management fees for their Expense Groups and 13% below the average for their Expense Universes; and (4) Fund expenses at the functional level for each asset and share class category were reasonable. The Trustees also considered the total expenses for each share class of each Fund compared to the average total expenses for its Broadridge Expense Group peers and to average total expenses for its Broadridge Expense Universe.
The independent fee consultant concluded that, based on its strategic review of expenses at the complex, category and individual fund level, Fund expenses were found to be reasonable relative to both Expense Group and Expense Universe benchmarks. Further, for certain Funds, the independent fee consultant also performed a systematic “focus list” analysis of expenses in the context of the performance or service delivered to each set of investors in each share class in each selected Fund. Based on this analysis, the independent fee consultant found that the combination of service quality/performance and expenses on these individual Funds and share classes were reasonable in light of performance trends, performance histories, and existence of performance fees, breakpoints, and expense waivers on such Funds.
The Trustees considered the methodology used by Janus Capital and each subadviser in determining compensation payable to portfolio managers, the competitive environment for investment management talent, and the competitive market for mutual funds in different distribution channels.
The Trustees also reviewed management fees charged by Janus Capital and each subadviser to comparable separate account clients and to comparable non-affiliated funds subadvised by Janus Capital or by a subadviser (for which Janus Capital or the subadviser provides only or primarily portfolio management services). Although in most instances subadvisory and separate account fee rates for various investment strategies were lower than management fee rates for Funds having a similar strategy, the Trustees considered that Janus Capital noted that, under the terms of the management agreements with the Funds, Janus Capital performs significant additional services for the Funds that it does not provide to those other clients, including administration services, oversight of the Funds’ other service providers, trustee support, regulatory compliance and numerous other services, and that, in serving the Funds, Janus Capital assumes many legal risks and other costs that it does not assume in servicing its other clients. Moreover, they noted that the independent fee consultant found that: (1) the management fees Janus Capital charges to the Funds are reasonable in relation to the management fees Janus Capital charges to its institutional and subadvised accounts; (2) these institutional and subadvised accounts have different service and infrastructure needs; (3) Janus mutual fund investors enjoy reasonable fees relative to the fees charged to Janus institutional and subadvised fund investors; and (4) in the majority of cases, the Funds receive proportionally better pricing than the industry in relation to Janus institutional and subadvised accounts.
The Trustees considered the fees for each Fund for its fiscal year ended in 2015, and noted the following with regard to each Fund’s total expenses, net of applicable fee waivers (the Fund’s “total expenses”):
Fixed-Income Funds and Money Market Funds
· For Janus Henderson Flexible Bond Fund (formerly, Janus Flexible Bond Fund), the Trustees noted that, although the Fund’s total expenses exceeded the peer group average for certain share classes, overall the Fund’s total expenses were reasonable. The Trustees also noted that Janus Capital has contractually agreed to
Janus Henderson VIT Flexible Bond Portfolio
Additional Information (unaudited)
limit the Fund’s expenses, although this limit did not apply because the Fund’s total expenses were already below the applicable fee limit.
· For Janus Henderson Global Bond Fund (formerly, Janus Global Bond Fund), the Trustees noted that although the Fund’s total expenses exceeded the peer group average for certain share classes, overall the Fund’s total expenses were reasonable. The Trustees also noted that Janus Capital has contractually agreed to limit the Fund’s expenses.
· For Janus Henderson Global Unconstrained Bond Fund (formerly, Janus Global Unconstrained Bond Fund), the Trustees noted that although the Fund’s total expenses exceeded the peer group average for certain share classes, overall the Fund’s total expenses were reasonable. The Trustees also noted that Janus Capital has contractually agreed to limit the Fund’s expenses.
· For Janus Henderson High-Yield Fund (formerly, Janus High-Yield Fund), the Trustees noted that, although the Fund’s total expenses exceeded the peer group average for certain share classes, overall the Fund’s total expenses were reasonable. The Trustees also noted that Janus Capital has contractually agreed to limit the Fund’s expenses, although this limit did not apply because the Fund’s total expenses were already below the applicable fee limit.
· For Janus Henderson Multi-Sector Income Fund (formerly, Janus Multi-Sector Income Fund), the Trustees noted that, although the Fund’s total expenses exceeded the peer group average for one share class, overall the Fund’s total expenses were reasonable. The Trustees also noted that Janus has contractually agreed to limit the Fund’s expenses.
· For Janus Henderson Real Return Fund (formerly, Janus Real Return Fund), the Trustees noted that, although the Fund’s total expenses were equal to or exceeded the peer group average for all share classes, overall the Fund’s total expenses were reasonable. The Trustees also noted that Janus Capital has contractually agreed to limit the Fund’s expenses.
· For Janus Henderson Short-Term Bond Fund (formerly, Janus Short-Term Bond Fund), the Trustees noted that, although the Fund’s total expenses exceeded the peer group average for certain share classes, overall the Fund’s total expenses were reasonable. The Trustees also noted that Janus Capital has contractually agreed to limit the Fund’s expenses.
· For Janus Henderson Government Money Market Fund (formerly, Janus Government Money Market Fund), the Trustees noted that the Fund’s total expenses exceeded the peer group average for both share classes. The Trustees considered that management fees for this Fund are higher than the peer group average due to the Fund’s management fee including other costs, such as custody and transfer agent services, while many funds in the peer group pay these expenses separately from their management fee. In addition, the Trustees considered that Janus Capital voluntarily waives one-half of its advisory fee and other expenses in order to maintain a positive yield.
· For Janus Henderson Money Market Fund (formerly, Janus Money Market Fund), the Trustees noted that the Fund’s total expenses were below the peer group average for both share classes. In addition, the Trustees considered that Janus Capital voluntarily waives one- half of its advisory fee and other expenses in order to maintain a positive yield.
Asset Allocation Funds
· For Janus Henderson Global Allocation Fund – Conservative (formerly, Janus Global Allocation Fund – Conservative), the Trustees noted that, although the Fund’s total expenses exceeded the peer group median for one share class, overall the Fund’s total expenses were reasonable. The Trustees also noted that Janus Capital has contractually agreed to limit the Fund’s expenses, although this limit did not apply because the Fund’s total expenses were already below the applicable fee limit.
· For Janus Henderson Global Allocation Fund – Growth (formerly, Janus Global Allocation Fund – Growth), the Trustees noted that the Fund’s total expenses were below the peer group average for all share classes.
· For Janus Henderson Global Allocation Fund – Moderate (formerly, Janus Global Allocation Fund – Moderate), the Trustees noted that, although the Fund’s total expenses exceeded the peer group average for one share
Janus Henderson VIT Flexible Bond Portfolio
Additional Information (unaudited)
class, overall the Fund’s total expenses were reasonable. The Trustees also noted that Janus Capital has contractually agreed to limit the Fund’s expenses.
Alternative Fund
· For Janus Henderson Diversified Alternatives Fund (formerly, Janus Diversified Alternatives Fund), the Trustees noted that, although the Fund’s total expenses exceeded the peer group average for certain share classes, overall the Fund’s total expenses were reasonable. The Trustees also noted that Janus Capital has contractually agreed to limit the Fund’s expenses.
Value Funds
· For Janus Henderson International Value Fund (formerly, Perkins International Value Fund), the Trustees noted that, although the Fund’s total expenses exceeded the peer group average for one share class, overall the Fund’s total expenses were reasonable. The Trustees also noted that Janus Capital has contractually agreed to limit the Fund’s expenses.
· For Janus Henderson Global Value Fund (formerly, Perkins Global Value Fund), the Trustees noted that the Fund’s total expenses were below the peer group average for all share classes.
· For Janus Henderson Large Cap Value Fund (formerly, Perkins Large Cap Value Fund), the Trustees noted that, although the Fund’s total expenses exceeded the peer group average for one share class, overall the Fund’s total expenses were reasonable. The Trustees also noted that Janus Capital has contractually agreed to limit the Fund’s expenses.
· For Janus Henderson Mid Cap Value Fund (formerly, Perkins Mid Cap Value Fund), the Trustees noted that, although the Fund’s total expenses exceeded the peer group average for one share class, overall the Fund’s total expenses were reasonable. The Trustees also noted that Janus Capital has contractually agreed to limit the Fund’s expenses, although this limit did not apply because the Fund’s total expenses were already below the applicable fee limit.
· For Janus Henderson Select Value Fund (formerly, Perkins Select Value Fund), the Trustees noted that, although the Fund’s total expenses exceeded the peer group average for one share class, overall the Fund’s total expenses were reasonable. The Trustees also noted that Janus Capital has contractually agreed to limit the Fund’s expenses.
· For Janus Henderson Small Cap Value Fund (formerly, Perkins Small Cap Value Fund), the Trustees noted that the Fund’s total expenses were below the peer group average for all share classes.
· For Janus Henderson Value Plus Income Fund (formerly, Perkins Value Plus Income Fund), the Trustees noted that although the Fund’s total expenses exceeded the peer group average for one share class, overall the Fund’s total expenses were reasonable. The Trustees also noted that Janus Capital has contractually agreed to limit the Fund’s expenses.
Mathematical Funds
· For Janus Henderson Emerging Markets Managed Volatility Fund (formerly, INTECH Emerging Markets Managed Volatility Fund), the Trustees noted that although the Fund’s total expenses exceeded the peer group average for one share class, overall the Fund’s total expenses were reasonable. The Trustees also noted that Janus Capital has contractually agreed to limit the Fund’s expenses.
· For Janus Henderson Global Income Managed Volatility Fund (formerly, INTECH Global Income Managed Volatility Fund), the Trustees noted that the Fund’s total expenses were below the peer group average for all share classes.
· For Janus Henderson International Managed Volatility Fund (formerly, INTECH International Managed Volatility Fund), the Trustees noted that although the Fund’s total expenses exceeded the peer group average for one share class, overall the Fund’s total expenses were reasonable. The Trustees also noted that Janus Capital has contractually agreed to limit the Fund’s expenses.
· For Janus Henderson U.S. Managed Volatility Fund (formerly, INTECH U.S. Managed Volatility Fund), the Trustees noted that, although the Fund’s total expenses exceeded the peer group average for one share class,
Janus Henderson VIT Flexible Bond Portfolio
Additional Information (unaudited)
overall the Fund’s total expenses were reasonable. The Trustees also noted that Janus Capital has contractually agreed to limit the Fund’s expenses, although this limit did not apply because the Fund’s total expenses were already below the applicable fee limit.
Growth and Core Funds
· For Janus Henderson Balanced Fund (formerly, Janus Balanced Fund), the Trustees noted that, although the Fund’s total expenses exceeded the peer group average for one share class, overall the Fund’s total expenses were reasonable. The Trustees also noted that Janus Capital has contractually agreed to limit the Fund’s expenses, although this limit did not apply because the Fund’s total expenses were already below the applicable fee limit.
· For Janus Henderson Contrarian Fund (formerly, Janus Contrarian Fund), the Trustees noted that, although the Fund’s total expenses exceeded the peer group average for certain share classes, overall the Fund’s total expenses were reasonable. The Trustees also noted that Janus Capital has contractually agreed to limit the Fund’s expenses, although this limit did not apply because the Fund’s total expenses were already below the applicable fee limit.
· For Janus Henderson Enterprise Fund (formerly, Janus Enterprise Fund), the Trustees noted that, although the Fund’s total expenses exceeded the peer group average for one share class, overall the Fund’s total expenses were reasonable. The Trustees also noted that Janus Capital has contractually agreed to limit the Fund’s expenses, although this limit did not apply because the Fund’s total expenses were already below the applicable fee limit.
· For Janus Henderson Forty Fund (formerly, Janus Forty Fund), the Trustees noted that, although the Fund’s total expenses exceeded the peer group average for certain share classes, overall the Fund’s total expenses were reasonable. The Trustees also noted that Janus Capital has contractually agreed to limit the Fund’s expenses, although this limit did not apply because the Fund’s total expenses were already below the applicable fee limit.
· For Janus Henderson Growth and Income Fund (formerly, Janus Growth and Income Fund), the Trustees noted that, although the Fund’s total expenses exceeded the peer group average for certain share classes, overall the Fund’s total expenses were reasonable. The Trustees also noted that Janus Capital has contractually agreed to limit the Fund’s expenses, although this limit did not apply because the Fund’s total expenses were already below the applicable fee limit.
· For Janus Henderson Research Fund (formerly, Janus Research Fund), the Trustees noted that although the Fund’s total expenses exceeded the peer group average for certain share classes, overall the Fund’s total expenses were reasonable.
· For Janus Henderson Triton Fund (formerly, Janus Triton Fund), the Trustees noted that, although the Fund’s total expenses exceeded the peer group average for one share class, overall the Fund’s total expenses were reasonable. The Trustees also noted that Janus Capital has contractually agreed to limit the Fund’s expenses, although this limit did not apply because the Fund’s total expenses were already below the applicable fee limit.
· For Janus Henderson Venture Fund (formerly, Janus Venture Fund), the Trustees noted that, although the Fund’s total expenses exceeded the peer group average for one share class, overall the Fund’s total expenses were reasonable. The Trustees also noted that Janus Capital has contractually agreed to limit the Fund’s expenses, although this limit did not apply because the Fund’s total expenses were already below the applicable fee limit.
Global and International Funds
· For Janus Henderson Adaptive Global Allocation Fund (formerly, Janus Adaptive Global Allocation Fund), the Trustees noted that, although the Fund’s total expenses exceeded the peer group median for certain share classes, overall the Fund’s total expenses were reasonable. The Trustees also noted that Janus Capital has contractually agreed to limit the Fund’s expenses.
· For Janus Henderson Asia Equity Fund (formerly, Janus Asia Equity Fund), the Trustees noted that, although the Fund’s total expenses exceeded the peer group average for one share class, overall the Fund’s total
Janus Henderson VIT Flexible Bond Portfolio
Additional Information (unaudited)
expenses were reasonable. The Trustees also noted that Janus Capital has contractually agreed to limit the Fund’s expenses.
· For Janus Henderson Global Life Sciences Fund (formerly, Janus Global Life Sciences Fund), the Trustees noted that the Fund’s total expenses were below the peer group average for all share classes.
· For Janus Henderson Global Real Estate Fund (formerly, Janus Global Real Estate Fund), the Trustees noted that, although the Fund’s total expenses exceeded the peer group average for certain share classes, overall the Fund’s total expenses were reasonable. The Trustees also noted that Janus Capital has contractually agreed to limit the Fund’s expenses, although this limit did not apply because the Fund’s total expenses were already below the applicable fee limit.
· For Janus Henderson Global Research Fund (formerly, Janus Global Research Fund), the Trustees noted that the Fund’s total expenses were below the peer group average for all share classes.
· For Janus Henderson Global Select Fund (formerly, Janus Global Select Fund), the Trustees noted that the Fund’s total expenses were below the peer group average for all share classes.
· For Janus Henderson Global Technology Fund (formerly, Janus Global Technology Fund), the Trustees noted that the Fund’s total expenses were below the peer group average for all share classes.
· For Janus Henderson Overseas Fund (formerly, Janus Overseas Fund), the Trustees noted that the Fund’s total expenses were below the peer group average for all share classes.
Janus Aspen Series
· For Janus Henderson Balanced Portfolio (formerly, Janus Aspen Balanced Portfolio), the Trustees noted that the Fund’s total expenses were below the peer group average for both share classes.
· For Janus Henderson Enterprise Portfolio (formerly, Janus Aspen Enterprise Portfolio), the Trustees noted that the Fund’s total expenses were below the peer group average for both share classes.
· For Janus Henderson Flexible Bond Portfolio (formerly, Janus Aspen Flexible Bond Portfolio), the Trustees noted that, although the Fund’s total expenses exceeded the peer group average for both share classes, overall the Fund’s total expenses were reasonable. The Trustees also noted that Janus Capital has contractually agreed to limit the Fund’s expenses.
· For Janus Henderson Forty Portfolio (formerly, Janus Aspen Forty Portfolio), the Trustees noted that the Fund’s total expenses were below the peer group average for both share classes.
· For Janus Henderson Global Allocation Portfolio – Moderate (formerly, Janus Aspen Global Allocation Portfolio – Moderate), the Trustees noted that, although the Fund’s total expenses exceeded the peer group average for both share classes, overall the Fund’s total expenses were reasonable. The Trustees also noted that Janus Capital has contractually agreed to limit the Fund’s expenses.
· For Janus Henderson Global Research Portfolio (formerly, Janus Aspen Global Research Portfolio), the Trustees noted that the Fund’s total expenses were below the peer group average for both share classes.
· For Janus Henderson Global Technology Portfolio (formerly, Janus Aspen Global Technology Portfolio), the Trustees noted that the Fund’s total expenses were below the peer group average for both share classes.
· For Janus Henderson Global Unconstrained Bond Portfolio (formerly, Janus Aspen Global Unconstrained Bond Portfolio), the Trustees noted that, although the Fund’s total expenses exceeded the peer group average for both share classes, overall the Fund’s total expenses were reasonable. The Trustees also noted that Janus Capital has contractually agreed to limit the Fund’s expenses.
· For Janus Henderson U.S. Low Volatility Portfolio (formerly, Janus Aspen INTECH U.S. Low Volatility Portfolio), the Trustees noted that the Fund’s total expenses were below the peer group average for its sole share class.
· For Janus Henderson Research Portfolio (formerly, Janus Aspen Janus Portfolio), the Trustees noted that the Fund’s total expenses were below the peer group mean for both share classes.
Janus Henderson VIT Flexible Bond Portfolio
Additional Information (unaudited)
· For Janus Henderson Overseas Portfolio (formerly, Janus Aspen Overseas Portfolio), the Trustees noted that the Fund’s total expenses were below the peer group average for both share classes.
· For Janus Henderson Mid Cap Value Portfolio (formerly, Janus Aspen Perkins Mid Cap Value Portfolio), the Trustees noted that the Fund’s total expenses were below the peer group average for both share classes.
The Trustees reviewed information on the profitability to Janus Capital and its affiliates of their relationships with each Fund, as well as an explanation of the methodology utilized by Janus Capital when allocating various expenses of Janus Capital and its affiliates with respect to contractual relationships with the Funds and other clients. The Trustees also reviewed the financial statements and corporate structure of Janus Capital’s parent company. In their review, the Trustees considered whether Janus Capital and each subadviser receive adequate incentives and resources to manage the Funds effectively. The Trustees recognized that profitability comparisons among fund managers are difficult because very little comparative information is publicly available, and the profitability of any fund manager is affected by numerous factors, including the organizational structure of the particular fund manager, the types of funds and other accounts it manages, possible other lines of business, the methodology for allocating expenses, and the fund manager’s capital structure and cost of capital. However, taking into account those factors and the analysis provided by the Trustees’ independent fee consultant, and based on the information available, the Trustees concluded that Janus Capital’s profitability with respect to each Fund in relation to the services rendered was reasonable.
The independent fee consultant found that, while assessing the reasonableness of expenses in light of Janus Capital’s profits is dependent on comparisons with other publicly-traded mutual fund advisers, and that these comparisons are limited in accuracy by differences in complex size, business mix, institutional account orientation, and other factors, after accepting these limitations, the level of profit earned by Janus Capital from managing the Funds is reasonable.
The Trustees concluded that the management fees payable by each Fund to Janus Capital and its affiliates, as well as the fees paid by Janus Capital to the subadvisers of subadvised Funds, were reasonable in relation to the nature, extent, and quality of the services provided, taking into account the fees charged by other advisers for managing comparable mutual funds with similar strategies, the fees Janus Capital and the subadvisers charge to other clients, and, as applicable, the impact of fund performance on management fees payable by the Funds. The Trustees also concluded that each Fund’s total expenses were reasonable, taking into account the size of the Fund, the quality of services provided by Janus Capital and any subadviser, the investment performance of the Fund, and any expense limitations agreed to or provided by Janus Capital.
Economies of Scale
The Trustees considered information about the potential for Janus Capital to realize economies of scale as the assets of the Funds increase. They noted their independent fee consultant’s analysis of economies of scale in prior years. They also noted that, although many Funds pay advisory fees at a base fixed rate as a percentage of net assets, without any breakpoints, their independent fee consultant concluded that 91% of these Funds have contractual management fees (gross of waivers) below their Broadridge expense group averages and, overall, 83% of the Funds are below their respective expense group averages for contractual management fees. They also noted that for those Funds whose expenses are being reduced by the contractual expense limitations of Janus Capital, Janus Capital is subsidizing the Funds because they have not reached adequate scale. Moreover, as the assets of some of the Funds have declined in the past few years, certain Funds have benefited from having advisory fee rates that have remained constant rather than increasing as assets declined. In addition, performance fee structures have been implemented for various Funds that have caused the effective rate of advisory fees payable by such a Fund to vary depending on the investment performance of the Fund relative to its benchmark index over the measurement period; and a few Funds have fee schedules with breakpoints and reduced fee rates above certain asset levels. The Trustees also noted that the Funds share directly in economies of scale through the lower charges of third-party service providers that are based in part on the combined scale of all of the Funds. Based on all of the information they reviewed, including past research and analysis conducted by the Trustees’ independent fee consultant, the Trustees concluded that the current fee structure of each Fund was reasonable and that the current rates of fees do reflect a sharing between Janus Capital and the Fund of any economies of scale that may be present at the current asset level of the Fund.
The independent fee consultant concluded that, given the limitations of various analytical approaches to economies of scale considered in prior years, and their conflicting results, its analyses could not confirm or deny the existence of economies of scale in the Janus complex. Further, the independent fee consultant provided its belief that Fund
Janus Henderson VIT Flexible Bond Portfolio
Additional Information (unaudited)
investors are well-served by the fee levels and performance fee structures in place on the Funds in light of any economies of scale that may be present at Janus Capital.
Other Benefits to Janus Capital
The Trustees also considered benefits that accrue to Janus Capital and its affiliates and subadvisers to the Funds from their relationships with the Funds. They recognized that two affiliates of Janus Capital separately serve the Funds as transfer agent and distributor, respectively, and the transfer agent receives compensation directly from the non-money market funds for services provided. The Trustees also considered Janus Capital’s past and proposed use of commissions paid by the Funds on portfolio brokerage transactions to obtain proprietary and third-party research products and services benefiting the Fund and/or other clients of Janus Capital and/or Janus Capital, and/or a subadviser to a Fund. The Trustees concluded that Janus Capital’s and the subadvisers’ use of these types of client commission arrangements to obtain proprietary and third-party research products and services was consistent with regulatory requirements and guidelines and was likely to benefit each Fund. The Trustees also concluded that, other than the services provided by Janus Capital and its affiliates and subadvisers pursuant to the agreements and the fees to be paid by each Fund therefor, the Funds and Janus Capital and the subadvisers may potentially benefit from their relationship with each other in other ways. They concluded that Janus Capital and/or the subadvisers benefits from the receipt of research products and services acquired through commissions paid on portfolio transactions of the Funds and that the Funds benefit from Janus Capital’s and/or the subadvisers’ receipt of those products and services as well as research products and services acquired through commissions paid by other clients of Janus Capital and/or other clients of the subadvisers. They further concluded that the success of any Fund could attract other business to Janus Capital, the subadvisers or other Janus funds, and that the success of Janus Capital and the subadvisers could enhance Janus Capital’s and the subadvisers’ ability to serve the Funds.
Janus Henderson VIT Flexible Bond Portfolio
Useful Information About Your Portfolio Report (unaudited)
Management Commentary
The Management Commentary in this report includes valuable insight as well as statistical information to help you understand how your Portfolio’s performance and characteristics stack up against those of comparable indices.
If the Portfolio invests in foreign securities, this report may include information about country exposure. Country exposure is based primarily on the country of risk. A company may be allocated to a country based on other factors such as location of the company’s principal office, the location of the principal trading market for the company’s securities, or the country where a majority of the company’s revenues are derived.
Please keep in mind that the opinions expressed in the Management Commentary are just that: opinions. They are a reflection based on best judgment at the time this report was compiled, which was June 30, 2017. As the investing environment changes, so could opinions. These views are unique and are not necessarily shared by fellow employees or by Janus Henderson in general.
Performance Overviews
Performance overview graphs compare the performance of a hypothetical $10,000 investment in the Portfolio with one or more widely used market indices. When comparing the performance of the Portfolio with an index, keep in mind that market indices are not available for investment and do not reflect deduction of expenses.
Average annual total returns are quoted for a Portfolio with more than one year of performance history. Average annual total return is calculated by taking the growth or decline in value of an investment over a period of time, including reinvestment of dividends and distributions, then calculating the annual compounded percentage rate that would have produced the same result had the rate of growth been constant throughout the period. Average annual total return does not reflect the deduction of taxes that a shareholder would pay on Portfolio distributions or redemptions of Portfolio shares.
Cumulative total returns are quoted for a Portfolio with less than one year of performance history. Cumulative total return is the growth or decline in value of an investment over time, independent of the period of time involved. Cumulative total return does not reflect the deduction of taxes that a shareholder would pay on Portfolio distributions or redemptions of Portfolio shares.
Pursuant to federal securities rules, expense ratios shown in the performance chart reflect subsidized (if applicable) and unsubsidized ratios. The total annual fund operating expenses ratio is gross of any fee waivers, reflecting the Portfolio’s unsubsidized expense ratio. The net annual fund operating expenses ratio (if applicable) includes contractual waivers of Janus Capital and reflects the Portfolio’s subsidized expense ratio. Ratios may be higher or lower than those shown in the “Financial Highlights” in this report.
Schedule of Investments
Following the performance overview section is the Portfolio’s Schedule of Investments. This schedule reports the types of securities held in the Portfolio on the last day of the reporting period. Securities are usually listed by type (common stock, corporate bonds, U.S. Government obligations, etc.) and by industry classification (banking, communications, insurance, etc.). Holdings are subject to change without notice.
The value of each security is quoted as of the last day of the reporting period. The value of securities denominated in foreign currencies is converted into U.S. dollars.
If the Portfolio invests in foreign securities, it will also provide a summary of investments by country. This summary reports the Portfolio exposure to different countries by providing the percentage of securities invested in each country. The country of each security represents the country of risk. The Portfolio’s Schedule of Investments relies upon the industry group and country classifications published by Barclays and/or MSCI Inc.
Tables listing details of individual forward currency contracts, futures, written options, swaptions, and swaps follow the Portfolio’s Schedule of Investments (if applicable).
Statement of Assets and Liabilities
This statement is often referred to as the “balance sheet.” It lists the assets and liabilities of the Portfolio on the last day of the reporting period.
Janus Henderson VIT Flexible Bond Portfolio
Useful Information About Your Portfolio Report (unaudited)
The Portfolio’s assets are calculated by adding the value of the securities owned, the receivable for securities sold but not yet settled, the receivable for dividends declared but not yet received on securities owned, and the receivable for Portfolio shares sold to investors but not yet settled. The Portfolio’s liabilities include payables for securities purchased but not yet settled, Portfolio shares redeemed but not yet paid, and expenses owed but not yet paid. Additionally, there may be other assets and liabilities such as unrealized gain or loss on forward currency contracts.
The section entitled “Net Assets Consist of” breaks down the components of the Portfolio’s net assets. Because the Portfolio must distribute substantially all earnings, you will notice that a significant portion of net assets is shareholder capital.
The last section of this statement reports the net asset value (“NAV”) per share on the last day of the reporting period. The NAV is calculated by dividing the Portfolio’s net assets for each share class (assets minus liabilities) by the number of shares outstanding.
Statement of Operations
This statement details the Portfolio’s income, expenses, realized gains and losses on securities and currency transactions, and changes in unrealized appreciation or depreciation of Portfolio holdings.
The first section in this statement, entitled “Investment Income,” reports the dividends earned from securities and interest earned from interest-bearing securities in the Portfolio.
The next section reports the expenses incurred by the Portfolio, including the advisory fee paid to the investment adviser, transfer agent fees and expenses, and printing and postage for mailing statements, financial reports and prospectuses. Expense offsets and expense reimbursements, if any, are also shown.
The last section lists the amounts of realized gains or losses from investment and foreign currency transactions, and changes in unrealized appreciation or depreciation of investments and foreign currency-denominated assets and liabilities. The Portfolio will realize a gain (or loss) when it sells its position in a particular security. A change in unrealized gain (or loss) refers to the change in net appreciation or depreciation of the Portfolio during the reporting period. “Net Realized and Unrealized Gain/(Loss) on Investments” is affected both by changes in the market value of Portfolio holdings and by gains (or losses) realized during the reporting period.
Statements of Changes in Net Assets
These statements report the increase or decrease in the Portfolio’s net assets during the reporting period. Changes in the Portfolio’s net assets are attributable to investment operations, dividends and distributions to investors, and capital share transactions. This is important to investors because it shows exactly what caused the Portfolio’s net asset size to change during the period.
The first section summarizes the information from the Statement of Operations regarding changes in net assets due to the Portfolio’s investment operations. The Portfolio’s net assets may also change as a result of dividend and capital gains distributions to investors. If investors receive their dividends and/or distributions in cash, money is taken out of the Portfolio to pay the dividend and/or distribution. If investors reinvest their dividends and/or distributions, the Portfolio’s net assets will not be affected. If you compare the Portfolio’s “Net Decrease from Dividends and Distributions” to “Reinvested Dividends and Distributions,” you will notice that dividends and distributions have little effect on the Portfolio’s net assets. This is because the majority of the Portfolio’s investors reinvest their dividends and/or distributions.
The reinvestment of dividends and distributions is included under “Capital Share Transactions.” “Capital Shares” refers to the money investors contribute to the Portfolio through purchases or withdrawals via redemptions. The Portfolio’s net assets will increase and decrease in value as investors purchase and redeem shares from the Portfolio.
Financial Highlights
This schedule provides a per-share breakdown of the components that affect the Portfolio’s NAV for current and past reporting periods as well as total return, asset size, ratios, and portfolio turnover rate.
The first line in the table reflects the NAV per share at the beginning of the reporting period. The next line reports the net investment income/(loss) per share. Following is the per share total of net gains/(losses), realized and unrealized. Per share dividends and distributions to investors are then subtracted to arrive at the NAV per share at the end of the
Janus Henderson VIT Flexible Bond Portfolio
Useful Information About Your Portfolio Report (unaudited)
period. The next line reflects the total return for the period. Also included are ratios of expenses and net investment income to average net assets.
The Portfolio’s expenses may be reduced through expense offsets and expense reimbursements. The ratios shown reflect expenses before and after any such offsets and reimbursements.
The ratio of net investment income/(loss) summarizes the income earned less expenses, divided by the average net assets of the Portfolio during the reporting period. Do not confuse this ratio with the Portfolio’s yield. The net investment income ratio is not a true measure of the Portfolio’s yield because it does not take into account the dividends distributed to the Portfolio’s investors.
The next figure is the portfolio turnover rate, which measures the buying and selling activity in the Portfolio. Portfolio turnover is affected by market conditions, changes in the asset size of the Portfolio, fluctuating volume of shareholder purchase and redemption orders, the nature of the Portfolio’s investments, and the investment style and/or outlook of the portfolio manager(s) and/or investment personnel. A 100% rate implies that an amount equal to the value of the entire portfolio was replaced once during the fiscal year; a 50% rate means that an amount equal to the value of half the portfolio is traded in a year; and a 200% rate means that an amount equal to the value of the entire portfolio is traded every six months.
Janus Henderson VIT Flexible Bond Portfolio
Shareholder Meeting (unaudited)
| | | | | | | | | | | | | | | | | | | | | | | | | | | |
Special meetings of shareholders were held on April 6, 2017 and adjourned and reconvened on April 18, 2017 (together, the "meeting"). At the meeting, the following matters were voted on and approved by shareholders. Each vote reported represents one dollar of net asset value held on the record date for the meeting. The results of the meeting are noted below. |
| | | | | | | | | | |
Proposals | | | | | | | | | |
1. For all Portfolios, to approve a new investment advisory agreement between the Trust, on behalf of the Portfolio, and Janus Capital Management LLC. |
| | | | | | | | | | |
| Number of Votes ($) | | | | | | |
Record Date Votes ($) | Affirmative | Against | Abstain | BNV | Total | | | | |
736,301,557.196 | 567,562,568.942 | 15,243,633.532 | 31,189,299.238 | (0.002) | 613,995,501.711 | | | | |
| | | | | | | | | | |
| | | | | | | | | | |
Percentage of Total Outstanding Votes (%) | | Percentage Voted (%) |
Affirmative | Against | Abstain | BNV | Total | Affirmative | Against | Abstain | BNV | Total |
77.083 | 2.070 | 4.236 | 0.000 | 83.389 | 92.438 | 2.483 | 5.080 | 0.000 | 100.000 |
| | | | | | | | | | |
| | | | | | | | | | |
4. To elect an additional Trustee to the Board of Trustees of the Trust. - Diane L. Wallace. |
| | | | | | | | | | |
| Number of Votes ($) | | | | | | |
Record Date Votes ($) | Affirmative | Against | Abstain | BNV | Total | | | | |
7,198,647,378.476 | 6,547,141,899.530 | 651,505,478.947 | 0.000 | 0.000 | 7,198,647,378.476 | | | | |
| | | | | | | | | | |
| | | | | | | | | | |
Percentage of Total Outstanding Votes (%) | | Percentage Voted (%) |
Affirmative | Against | Abstain | BNV | Total | Affirmative | Against | Abstain | BNV | Total |
80.347 | 7.995 | 0.000 | 0.000 | 88.343 | 90.950 | 9.050 | 0.000 | 0.000 | 100.000 |
| | | | | | | | | | |
Alan A. Brown, William D. Cvengros, Raudline Etienne, William F. McCalpin, Gary A. Poliner, James T. Rothe, William D. Stewart and Linda S. Wolf continue to serve as Trustees following the meeting. |
| | | | | | | | | | |
| | | | | | | | | | |
5. For all Portfolios, except Global Unconstrained Bond Portfolio, to approve a proposal that would authorize the Adviser to enter into and materially amend sub-advisory agreements in the future with wholly-owned subadvisers and unaffiliated sub-advisers, with the approval of the Board of Trustees of the Trust, but without obtaining additional shareholder approval. |
| | | | | | | | | | |
| Number of Votes ($) | | | | | | |
Record Date Votes ($) | Affirmative | Against | Abstain | BNV | Total | | | | |
736,301,557.196 | 515,651,189.489 | 44,585,039.536 | 53,759,272.698 | (0.012) | 613,995,501.711 | | | | |
| | | | | | | | | | |
| | | | | | | | | | |
Percentage of Total Outstanding Votes (%) | | Percentage Voted (%) |
Affirmative | Against | Abstain | BNV | Total | Affirmative | Against | Abstain | BNV | Total |
70.033 | 6.055 | 7.301 | 0.000 | 83.389 | 83.983 | 7.261 | 8.756 | 0.000 | 100.000 |
Janus Henderson VIT Flexible Bond Portfolio
Notes
NotesPage1
Knowledge. Shared
At Janus Henderson, we believe in the sharing of expert insight for better investment and business decisions. We call this ethos Knowledge. Shared.
Learn more by visiting janushenderson.com.
| | | | | | | | | |
| | | | | |

| | | | |
This report is submitted for the general information of shareholders of the Portfolio. It is not an offer or solicitation for the Portfolio and is not authorized for distribution to prospective investors unless preceded or accompanied by an effective prospectus. |
Janus Henderson, Janus, Perkins and INTECH are trademarks or registered trademarks of Janus Henderson Investors. © Janus Henderson Investors. The name Janus Henderson Investors includes HGI Group Limited, Henderson Global Investors (Brand Management) Sarl and Janus International Holding LLC. Portfolios distributed by Janus Henderson Distributors |
| | | | | 109-24-81114 08-17 |
| | | | |
| | | |
| | | SEMIANNUAL REPORT June 30, 2017 |
| | |
| | Janus Henderson VIT Forty Portfolio (formerly named Janus Aspen Forty Portfolio) |
| | |
| | Janus Aspen Series |
| | | |
| | | HIGHLIGHTS · Portfolio management perspective · Investment strategy behind your portfolio · Portfolio performance, characteristics
and holdings |
| | | 
|
Table of Contents
Janus Henderson VIT Forty Portfolio
| | |
Management Commentary and Schedule of Investments | 1 |
Notes to Schedule of Investments and Other Information | 10 |
Statement of Assets and Liabilities | 11 |
Statement of Operations | 12 |
Statements of Changes in Net Assets | 13 |
Financial Highlights | 14 |
Notes to Financial Statements | 15 |
Additional Information | 24 |
Useful Information About Your Portfolio Report | 42 |
Shareholder Meeting | 45 |
Janus Henderson VIT Forty Portfolio (unaudited)
| | | | | | |
PORTFOLIO SNAPSHOT We believe that constructing a concentrated portfolio of quality growth companies will allow us to outperform our benchmark over time. We define quality as companies that enjoy sustainable “moats” around their businesses, potentially allowing companies to grow faster, with higher returns, than their competitors. We believe the market often underestimates these companies’ sustainable competitive advantage periods. | | | | 
Doug Rao co-portfolio manager | 
Nick Schommer co-portfolio manager |
| | | |
PERFORMANCE OVERVIEW
For the six-month period ended June 30, 2017, the Portfolio’s Institutional Shares and Service Shares returned 19.04% and 18.90%, respectively, versus a return of 13.99% for the Portfolio’s primary benchmark, the Russell 1000 Growth Index. The Portfolio’s secondary benchmark, the S&P 500 Index, returned 9.34% for the period.
INVESTMENT ENVIRONMENT
U.S. equities experienced strong gains during the period. Stocks rose in the first quarter, buoyed by economic data points that suggested global economic growth and hopes that the Trump administration’s proposed pro-growth initiatives would further jump-start the economy. During the second quarter, strong corporate earnings and a low global interest rate environment continued to support stocks. The technology sector was the best-performing sector within the Russell 1000 Growth Index. The energy sector lagged the broader index, due in large part to falling oil prices.
PERFORMANCE DISCUSSION
The Portfolio outperformed its primary benchmark, the Russell 1000 Growth Index, and its secondary benchmark, the S&P 500 Index, during the period. As part of our investment strategy, we seek companies that have built clear, sustainable competitive moats around their businesses, which should help them grow market share within their respective industries over time. Important competitive advantages could include a strong brand, network effects from a product or service that would be hard for a competitor to replicate, a lower cost structure than competitors in the industry, a distribution advantage or patent protection over valuable intellectual property. We think emphasizing these sustainable competitive advantages can be a meaningful driver of outperformance over longer time horizons because the market often underestimates the duration of growth for these companies and the long-term potential return to shareholders. This period we saw a number of companies in our portfolio put up impressive results, further validating our view that they are well positioned to grow in excess of the market.
Activision Blizzard was our largest contributor. Activision Blizzard’s stock has appreciated as the market has begun to recognize that the company’s digital transition enables a more durable cash flow stream and new avenues to monetize its franchises. We believe the trend toward digital gaming is a powerful tailwind for Activision. As gaming moves from physical game cartridges toward digital platforms, it reduces costs for Activision and makes it less reliant on the release of a new gaming console to drive game sales. Digital gaming also gives the company the ability to sell digital items to gamers in real-time. We also like that Activision has a number of popular game franchises, which makes the company less dependent on any single franchise and creates a loyal and receptive audience when a franchise launches a new release. We also believe Activision can improve monetization of games it acquired from King Digital by inserting advertisements into those games for the first time. Finally, we believe the company has an opportunity to monetize viewership of its games through eSports.
CSX Corp. also added to performance. The stock was up after an announcement that a new CEO with a history of improving operations at railroad companies was taking the helm at the company. We had long believed that CSX’s operating underperformance relative to other railroad companies left room for improvement, and believe better results will follow the new leadership. We believe a large rail network such as CSX’s is a valuable asset that would be hard, if not impossible, for other transportation and logistics companies to replicate. Railways also have a significant cost advantage over the trucking industry. As CSX focuses on improving its service and reliability to customers, we believe it will continue to drive more shippers to use the railway instead of trucking services.
Janus Henderson VIT Forty Portfolio (unaudited)
Adobe Systems was another large contributor to performance. The stock appreciated after the company announced better-than-expected earnings results and increased guidance in each of the last two quarters. We believe the company will continue to grow profitability as its digital media business moves from a perpetual license-based business model to a subscription-based business model. We also believe Adobe’s digital marketing business, which helps advertisers create digital content, is well positioned for the transition in advertising spending toward digital advertising platforms.
While pleased with our performance during the period, we still held stocks that detracted from our results. General Electric was our largest detractor. We have been disappointed in GE’s cash flow conversion from its industrial businesses, and sold the position during the period.
Goldman Sachs was also a negative contributor. The company had disappointing first quarter results, as its trading business underperformed relative to its investment banking competitors. This doesn’t change our long-term view. We believe the relationships Goldman has built with corporate clients and investors around the world give it a competitive advantage, and it can use that information to drive growth. We also like that Goldman has invested through the entire economic cycle, which should translate into market share gains.
Bristol Myers Squibb was another detractor. Disappointing clinical results for a trial pairing its cancer drug, Opdivo, with another treatment negatively affected the stock during the period. We sold the stock due to concerns the company’s cancer treatments would lose market share within the immuno-oncology space.
OUTLOOK
We believe stocks are fairly valued, given the context of a low interest rate environment and a resilient, albeit slow-growing, economy. We would not expect further multiple expansion, but instead, earnings and free cash flow per share growth to dictate the trajectory of individual stock prices. We feel our portfolio is well positioned for such an environment.
As we’ve highlighted in some of our commentaries, many of our holdings are enabling some of the most powerful secular growth themes in today’s economy: the shift from offline to online spending, the switch of enterprise software from on-premises data centers to the cloud and a proliferation of connected devices in the home and business, to name a few. These themes may be well known, but they remain nascent in their development. We believe our companies are still in the early innings of realizing their earnings potential as these themes push forward. We remain confident in their ability to grow earnings and welcome an environment where that growth is the key determinant of stock price appreciation.
Thank you for your investment in Janus Henderson VIT Forty Portfolio.
Janus Henderson VIT Forty Portfolio (unaudited)
Portfolio At A Glance
June 30, 2017
| | | | | | | |
| | | | | | | |
| | | | | | | |
| | | | | | | |
| | 5 Top Performers - Holdings | | | | 5 Bottom Performers - Holdings | |
| | | | Contribution | | | Contribution |
| | Activision Blizzard Inc | | 1.91% | | General Electric Co | -0.40% |
| | CSX Corp | | 1.38% | | Goldman Sachs Group Inc | -0.24% |
| | Adobe Systems Inc | | 1.11% | | Bristol-Myers Squibb Co | -0.22% |
| | Amazon.com Inc | | 1.08% | | Sealed Air Corp | -0.09% |
| | Alphabet Inc - C Class | | 1.00% | | Biogen Inc | -0.02% |
| | | | | | | |
| | 5 Top Performers - Sectors* | | | | | |
| | | | Portfolio | | Portfolio Weighting | Russell 1000 Growth Index |
| | | | Contribution | | (Average % of Equity) | Weighting |
| | Information Technology | | 3.10% | | 38.15% | 32.86% |
| | Consumer Discretionary | | 1.63% | | 15.10% | 20.72% |
| | Consumer Staples | | 0.52% | | 2.49% | 9.08% |
| | Industrials | | 0.43% | | 7.40% | 10.78% |
| | Health Care | | 0.31% | | 19.41% | 15.83% |
| | | | | | | |
| | 5 Bottom Performers - Sectors* | | | | | |
| | | | Portfolio | | Portfolio Weighting | Russell 1000 Growth Index |
| | | | Contribution | | (Average % of Equity) | Weighting |
| | Financials | | -0.50% | | 9.27% | 2.86% |
| | Materials | | -0.44% | | 2.96% | 3.56% |
| | Other** | | -0.42% | | 3.69% | 0.00% |
| | Utilities | | 0.00% | | 0.00% | 0.03% |
| | Energy | | 0.17% | | 0.00% | 0.52% |
| | | | | | | |
| | Security contribution to performance is measured by using an algorithm that multiplies the daily performance of each security with the previous day’s ending weight in the portfolio and is gross of advisory fees. Fixed income securities and certain equity securities, such as private placements and some share classes of equity securities, are excluded. |
* | Based on sector classification according to the Global Industry Classification Standard (“GICS”) codes, which are the exclusive property and a service mark of MSCI Inc. and Standard & Poor’s. |
** | Not a GICS classified sector. | | | | | |
Janus Henderson VIT Forty Portfolio (unaudited)
Portfolio At A Glance
June 30, 2017
| | |
5 Largest Equity Holdings - (% of Net Assets) |
Alphabet Inc - Class C | |
Internet Software & Services | 6.0% |
Microsoft Corp | |
Software | 5.0% |
Activision Blizzard Inc | |
Software | 4.6% |
Mastercard Inc | |
Information Technology Services | 4.5% |
salesforce.com Inc | |
Software | 4.3% |
| | 24.4% |
| | | | | | |
Asset Allocation - (% of Net Assets) |
Common Stocks | | 93.3% |
Investment Companies | | 6.0% |
Other | | 0.7% |
| | | 100.0% |
| | |
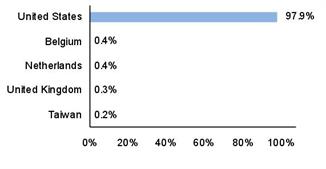
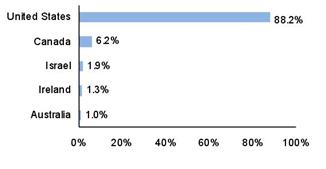
Top Country Allocations - Long Positions - (% of Investment Securities) |
As of June 30, 2017 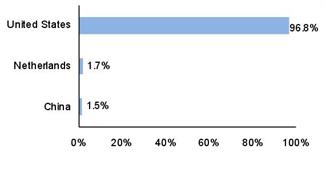
| As of December 31, 2016 
|
Janus Henderson VIT Forty Portfolio (unaudited)
Performance
| |
See important disclosures on the next page. |

| | | | | | | | | | | |
| | | | | | | | | | |
| | | | | | | | | | | Expense Ratios - |
Average Annual Total Return - for the periods ended June 30, 2017 | | | per the May 1, 2017 prospectuses |
| | Fiscal
Year-to-Date | One
Year | Five
Year | Ten
Year | Since
Inception* | | | Total Annual Fund
Operating Expenses |
Institutional Shares | | 19.04% | 23.49% | 15.89% | 9.31% | 11.24% | | | 0.74% |
Service Shares | | 18.90% | 23.22% | 15.60% | 9.04% | 10.93% | | | 0.99% |
Russell 1000 Growth Index | | 13.99% | 20.42% | 15.30% | 8.91% | 7.16% | | | |
S&P 500 Index | | 9.34% | 17.90% | 14.63% | 7.18% | 7.66% | | | |
Morningstar Quartile - Institutional Shares | | - | 1st | 1st | 1st | 1st | | | |
Morningstar Ranking - based on total returns for Large Growth Funds | | - | 279/1,490 | 170/1,409 | 127/1,175 | 17/660 | | | |
Returns quoted are past performance and do not guarantee future results; current performance may be lower or higher. Investment returns and principal value will vary; there may be a gain or loss when shares are sold. For the most recent month-end performance call 877.335.2687 or visit janushenderson.com/VITperformance
This Portfolio has a performance-based management fee that may adjust up or down based on the Portfolio’s performance.
Performance may be affected by risks that include those associated with non-diversification, portfolio turnover, short sales, potential conflicts of interest, foreign and emerging markets, initial public offerings (IPOs), high-yield and high-risk securities, undervalued, overlooked and smaller capitalization companies, real estate related securities including Real Estate Investment Trusts (REITs), derivatives, and commodity-linked investments. Each product has different risks. Please see the prospectus for more information about risks, holdings and other details.
Returns shown do not represent actual returns since they do not include insurance charges. Returns shown would have been lower had they included insurance charges.
Returns include reinvestment of all dividends and distributions and do not reflect the deduction of taxes that a shareholder would pay on Portfolio distributions or redemptions of Portfolio shares. The returns do not include adjustments in accordance with generally accepted accounting principles required at the period end for financial reporting purposes.
See Financial Highlights for actual expense ratios during the reporting period.
Performance for Service Shares prior to December 31, 1999 reflects the performance of Institutional Shares, adjusted to reflect the expenses of Service Shares.
Ranking is for the share class shown only; other classes may have different performance characteristics.
© 2017 Morningstar, Inc. All Rights Reserved.
There is no assurance that the investment process will consistently lead to successful investing.
Janus Henderson VIT Forty Portfolio (unaudited)
Performance
See Notes to Schedule of Investments and Other Information for index definitions.
Index performance does not reflect the expenses of managing a portfolio as an index is unmanaged and not available for direct investment.
See “Useful Information About Your Portfolio Report.”
*The Portfolio’s inception date – May 1, 1997
Janus Henderson VIT Forty Portfolio (unaudited)
Expense Examples
As a shareholder of the Portfolio, you incur two types of costs: (1) transaction costs and (2) ongoing costs, including management fees; 12b-1 distribution and shareholder servicing fees (applicable to Service Shares only); transfer agent fees and expenses payable pursuant to the Transfer Agency Agreement; and other Portfolio expenses. This example is intended to help you understand your ongoing costs (in dollars) of investing in the Portfolio and to compare these costs with the ongoing costs of investing in other mutual funds. To do so, compare this 5% hypothetical example with the 5% hypothetical examples that appear in the shareholder reports of the other funds. The example is based upon an investment of $1,000 invested at the beginning of the period and held for the six-months indicated, unless noted otherwise in the table and footnotes below.
Actual Expenses
The information in the table under the heading “Actual” provides information about actual account values and actual expenses. You may use the information in these columns, together with the amount you invested, to estimate the expenses that you paid over the period. Simply divide your account value by $1,000 (for example, an $8,600 account value divided by $1,000 = 8.6), then multiply the result by the number in the appropriate column for your share class under the heading entitled “Expenses Paid During Period” to estimate the expenses you paid on your account during the period.
Hypothetical Example for Comparison Purposes
The information in the table under the heading “Hypothetical (5% return before expenses)” provides information about hypothetical account values and hypothetical expenses based upon the Portfolio’s actual expense ratio and an assumed rate of return of 5% per year before expenses, which is not the Portfolio’s actual return. The hypothetical account values and expenses may not be used to estimate the actual ending account balance or expenses you paid for the period. You may use this information to compare the ongoing costs of investing in the Portfolio and other funds. To do so, compare this 5% hypothetical example with the 5% hypothetical examples that appear in the shareholder reports of the other funds. Additionally, for an analysis of the fees associated with an investment in either share class or other similar funds, please visit www.finra.org/fundanalyzer.
Please note that the expenses shown in the table are meant to highlight your ongoing costs only and do not reflect any transaction costs, such as any charges at the separate account level or contract level. These fees are fully described in the Portfolio’s prospectuses. Therefore, the hypothetical examples are useful in comparing ongoing costs only, and will not help you determine the relative total costs of owning different funds. In addition, if these transaction costs were included, your costs would have been higher.
| | | | | | | | | | | |
| | | | | | | | | |
| | | | Actual | | Hypothetical
(5% return before expenses) | |
| Beginning
Account
Value
(1/1/17) | Ending
Account
Value
(6/30/17) | Expenses
Paid During
Period
(1/1/17 - 6/30/17)† | | Beginning
Account
Value
(1/1/17) | Ending
Account
Value
(6/30/17) | Expenses
Paid During
Period
(1/1/17 - 6/30/17)† | Net Annualized
Expense Ratio
(1/1/17 - 6/30/17) |
Institutional Shares | $1,000.00 | $1,190.40 | $4.24 | | $1,000.00 | $1,020.93 | $3.91 | 0.78% |
Service Shares | $1,000.00 | $1,189.00 | $5.54 | | $1,000.00 | $1,019.74 | $5.11 | 1.02% |
† | Expenses Paid During Period are equal to the Net Annualized Expense Ratio multiplied by the average account value over the period, multiplied by 181/365 (to reflect the one-half year period). Expenses in the examples include the effect of applicable fee waivers and/or expense reimbursements, if any. Had such waivers and/or reimbursements not been in effect, your expenses would have been higher. Please refer to the Notes to Financial Statements or the Portfolio’s prospectuses for more information regarding waivers and/or reimbursements. |
Janus Henderson VIT Forty Portfolio
Schedule of Investments (unaudited)
June 30, 2017
| | | | | | | | |
Shares
| | | Value | |
Common Stocks – 93.3% | | | |
Aerospace & Defense – 1.6% | | | |
| | General Dynamics Corp | | .59,190 | | | $11,725,539 | |
Auto Components – 2.1% | | | |
| | Delphi Automotive PLC | | 182,068 | | | 15,958,260 | |
Automobiles – 0.5% | | | |
| | Tesla Inc* | | 10,251 | | | 3,706,864 | |
Biotechnology – 4.6% | | | |
| | Celgene Corp* | | 76,939 | | | 9,992,068 | |
| | Regeneron Pharmaceuticals Inc* | | 49,844 | | | 24,480,382 | |
| | | 34,472,450 | |
Capital Markets – 8.8% | | | |
| | Charles Schwab Corp | | 374,762 | | | 16,099,776 | |
| | Goldman Sachs Group Inc | | 87,752 | | | 19,472,169 | |
| | Intercontinental Exchange Inc | | 310,057 | | | 20,438,958 | |
| | S&P Global Inc | | 67,977 | | | 9,923,962 | |
| | | 65,934,865 | |
Chemicals – 1.7% | | | |
| | Sherwin-Williams Co | | 37,241 | | | 13,070,101 | |
Construction Materials – 1.8% | | | |
| | Vulcan Materials Co | | 103,252 | | | 13,079,963 | |
Equity Real Estate Investment Trusts (REITs) – 1.6% | | | |
| | Crown Castle International Corp | | 120,067 | | | 12,028,312 | |
Food & Staples Retailing – 1.4% | | | |
| | Costco Wholesale Corp | | 66,029 | | | 10,560,018 | |
Health Care Equipment & Supplies – 4.8% | | | |
| | Boston Scientific Corp* | | 695,753 | | | 19,286,273 | |
| | DexCom Inc* | | 75,893 | | | 5,551,573 | |
| | Intuitive Surgical Inc* | | 12,012 | | | 11,235,665 | |
| | | 36,073,511 | |
Health Care Providers & Services – 1.7% | | | |
| | Humana Inc | | 54,017 | | | 12,997,571 | |
Hotels, Restaurants & Leisure – 1.5% | | | |
| | Starbucks Corp | | 186,126 | | | 10,853,007 | |
Information Technology Services – 7.1% | | | |
| | Mastercard Inc | | 274,704 | | | 33,362,801 | |
| | PayPal Holdings Inc* | | 372,899 | | | 20,013,489 | |
| | | 53,376,290 | |
Internet & Direct Marketing Retail – 8.8% | | | |
| | Amazon.com Inc* | | 31,017 | | | 30,024,456 | |
| | Ctrip.com International Ltd (ADR)* | | 201,394 | | | 10,847,081 | |
| | Netflix Inc* | | 63,469 | | | 9,482,903 | |
| | Priceline Group Inc* | | 8,123 | | | 15,194,234 | |
| | | 65,548,674 | |
Internet Software & Services – 11.6% | | | |
| | Alphabet Inc - Class C* | | 49,016 | | | 44,542,310 | |
| | CoStar Group Inc* | | 62,227 | | | 16,403,037 | |
| | Facebook Inc | | 168,751 | | | 25,478,026 | |
| | | 86,423,373 | |
Pharmaceuticals – 6.6% | | | |
| | Allergan PLC | | 118,679 | | | 28,849,678 | |
| | Zoetis Inc | | 326,524 | | | 20,368,567 | |
| | | 49,218,245 | |
Road & Rail – 3.5% | | | |
| | CSX Corp | | 484,109 | | | 26,412,987 | |
Semiconductor & Semiconductor Equipment – 3.3% | | | |
| | ASML Holding NV | | 99,116 | | | 12,915,806 | |
| | Texas Instruments Inc | | 153,323 | | | 11,795,138 | |
| | | 24,710,944 | |
| | |
See Notes to Schedule of Investments and Other Information and Notes to Financial Statements. |
| |
8 | JUNE 30, 2017 |
Janus Henderson VIT Forty Portfolio
Schedule of Investments (unaudited)
June 30, 2017
| | | | | | | | |
Shares
| | | Value | |
Common Stocks – (continued) | | | |
Software – 18.1% | | | |
| | Activision Blizzard Inc | | .603,395 | | | $34,737,450 | |
| | Adobe Systems Inc* | | 144,940 | | | 20,500,314 | |
| | Microsoft Corp | | 543,155 | | | 37,439,674 | |
| | salesforce.com Inc* | | 375,333 | | | 32,503,838 | |
| | Workday Inc* | | 103,428 | | | 10,032,516 | |
| | | 135,213,792 | |
Textiles, Apparel & Luxury Goods – 2.2% | | | |
| | NIKE Inc | | 282,670 | | | 16,677,530 | |
Total Common Stocks (cost $477,937,093) | | 698,042,296 | |
Investment Companies – 6.0% | | | |
Money Markets – 6.0% | | | |
| | Janus Cash Liquidity Fund LLC, 0.9803%ºº,£ (cost $44,912,018) | | 44,912,018 | | | 44,912,018 | |
Total Investments (total cost $522,849,111) – 99.3% | | 742,954,314 | |
Cash, Receivables and Other Assets, net of Liabilities – 0.7% | | 5,088,664 | |
Net Assets – 100% | | $748,042,978 | |
| | | | | | |
Summary of Investments by Country - (Long Positions) (unaudited) |
| |
| | | | | % of | |
| | | | | Investment | |
Country | | Value | | Securities | |
United States | | $719,191,427 | | 96.8 | % |
Netherlands | | 12,915,806 | | 1.7 | |
China | | 10,847,081 | | 1.5 | |
| | | | | | |
| | | | | | |
Total | | $742,954,314 | | 100.0 | % |
| | |
See Notes to Schedule of Investments and Other Information and Notes to Financial Statements. |
| |
Janus Aspen Series | 9 |
Janus Henderson VIT Forty Portfolio
Notes to Schedule of Investments and Other Information (unaudited)
| | |
Russell 1000® Growth Index | Russell 1000® Growth Index reflects the performance of U.S. large-cap equities with higher price-to-book ratios and higher forecasted growth values. |
S&P 500® Index | S&P 500® Index reflects U.S. large-cap equity performance and represents broad U.S. equity market performance. |
| | |
ADR | American Depositary Receipt |
LLC | Limited Liability Company |
PLC | Public Limited Company |
| | |
* | Non-income producing security. |
| | |
ºº | Rate shown is the 7-day yield as of June 30, 2017. |
| | |
£ | The Portfolio may invest in certain securities that are considered affiliated companies. As defined by the Investment Company Act of 1940, as amended, an affiliated company is one in which the Portfolio owns 5% or more of the outstanding voting securities, or a company which is under common ownership or control. The following securities were considered affiliated companies for all or some portion of the period ended June 30, 2017. Unless otherwise indicated, all information in the table is for the period ended June 30, 2017. |
| | | | | | | | | | | | | | | | |
| | | Share | | | | | | Share | | | | | | |
| | | Balance | | | | | | Balance | | Realized | | Dividend | | Value |
| | | at 12/31/16 | | Purchases | | Sales | | at 6/30/17 | | Gain/(Loss) | | Income | | at 6/30/17 |
| | | | | | | | | | | | | | | |
Janus Cash Collateral Fund LLC | | — | | 16,693,600 | | (16,693,600) | | — | | $— | | $202(1) | | $— |
Janus Cash Liquidity Fund LLC | | 8,949,000 | | 169,477,018 | | (133,514,000) | | 44,912,018 | | — | | 92,167 | | 44,912,018 |
| | | | | | | | | | | | | | | |
Total | | | | | | | | | | $— | | $92,369 | | $44,912,018 |
(1) | Net of income paid to the securities lending agent and rebates paid to the borrowing counterparties. |
| | | | | | | | | | | | | |
The following is a summary of the inputs that were used to value the Portfolio’s investments in securities and other financial instruments as of June 30, 2017. See Notes to Financial Statements for more information. |
| |
Valuation Inputs Summary |
| | | | | | | |
| | | | | Level 2 - | | Level 3 - |
| | | Level 1 - | | Other Significant | | Significant |
| | | Quotes Prices | | Observable Inputs | | Unobservable Inputs |
| | | | | | | |
Assets | | | | | | |
Investments in Securities: | | | | | | |
Common Stocks | $ | 698,042,296 | $ | - | $ | - |
Investment Companies | | - | | 44,912,018 | | - |
Total Assets | $ | 698,042,296 | $ | 44,912,018 | $ | - |
| | | | | | | |
Janus Henderson VIT Forty Portfolio
Statement of Assets and Liabilities (unaudited)
June 30, 2017
| | | | | | | |
| | | | | | |
Assets: | | | | |
| | Investments, at cost | | $ | 522,849,111 | |
| | Unaffiliated investments, at value | | | 698,042,296 | |
| | Affiliated investments, at value | | | 44,912,018 | |
| | Cash | | | 533 | |
| | Non-interested Trustees' deferred compensation | | | 13,307 | |
| | Receivables: | | | | |
| | | Investments sold | | | 8,448,471 | |
| | | Portfolio shares sold | | | 280,269 | |
| | | Dividends | | | 219,067 | |
| | | Foreign tax reclaims | | | 68,884 | |
| | | Dividends from affiliates | | | 37,277 | |
| | Other assets | | | 1,777 | |
Total Assets | | | 752,023,899 | |
Liabilities: | | | | |
| | Payables: | | | — | |
| | | Investments purchased | | | 2,740,816 | |
| | | Advisory fees | | | 520,084 | |
| | | Portfolio shares repurchased | | | 453,748 | |
| | | 12b-1 Distribution and shareholder servicing fees | | | 99,535 | |
| | | Transfer agent fees and expenses | | | 35,549 | |
| | | Professional fees | | | 15,660 | |
| | | Non-interested Trustees' deferred compensation fees | | | 13,307 | |
| | | Portfolio administration fees | | | 6,289 | |
| | | Non-interested Trustees' fees and expenses | | | 4,097 | |
| | | Custodian fees | | | 71 | |
| | | Accrued expenses and other payables | | | 91,765 | |
Total Liabilities | | | 3,980,921 | |
Net Assets | | $ | 748,042,978 | |
Net Assets Consist of: | | | | |
| | Capital (par value and paid-in surplus) | | $ | 479,302,981 | |
| | Undistributed net investment income/(loss) | | | 663,938 | |
| | Undistributed net realized gain/(loss) from investments | | | 47,970,266 | |
| | Unrealized net appreciation/(depreciation) of investments, foreign currency translations and non-interested Trustees’ deferred compensation | | | 220,105,793 | |
Total Net Assets | | $ | 748,042,978 | |
Net Assets - Institutional Shares | | $ | 297,531,550 | |
| | Shares Outstanding, $0.01 Par Value (unlimited shares authorized) | | | 8,192,115 | |
Net Asset Value Per Share | | $ | 36.32 | |
Net Assets - Service Shares | | $ | 450,511,428 | |
| | Shares Outstanding, $0.01 Par Value (unlimited shares authorized) | | | 13,017,232 | |
Net Asset Value Per Share | | $ | 34.61 | |
| | |
See Notes to Financial Statements. |
| |
Janus Aspen Series | 11 |
Janus Henderson VIT Forty Portfolio
Statement of Operations (unaudited)
For the period ended June 30, 2017
| | | | | | |
| | | | | |
Investment Income: | | | |
| Dividends | $ | 3,854,013 | |
| | Dividends from affiliates | | 92,167 | |
| | Affiliated securities lending income, net | | 202 | |
| | Other income | | 22 | |
| | Foreign tax withheld | | (16,123) | |
Total Investment Income | | 3,930,281 | |
Expenses: | | | |
| | Advisory fees | | 2,479,846 | |
| | 12b-1Distribution and shareholder servicing fees: | | | |
| | | Service Shares | | 560,758 | |
| | Transfer agent administrative fees and expenses: | | | |
| | | Institutional Shares | | 70,629 | |
| | | Service Shares | | 112,152 | |
| | Other transfer agent fees and expenses: | | | |
| | | Institutional Shares | | 5,018 | |
| | | Service Shares | | 4,769 | |
| | Shareholder reports expense | | 42,998 | |
| | Portfolio administration fees | | 33,093 | |
| | Professional fees | | 19,386 | |
| | Registration fees | | 15,930 | |
| | Custodian fees | | 7,102 | |
| | Non-interested Trustees’ fees and expenses | | 6,686 | |
| | Other expenses | | 29,902 | |
Total Expenses | | 3,388,269 | |
Net Investment Income/(Loss) | | 542,012 | |
Net Realized Gain/(Loss) on Investments: | | | |
| | Investments | | 48,442,551 | |
Total Net Realized Gain/(Loss) on Investments | | 48,442,551 | |
Change in Unrealized Net Appreciation/Depreciation: | | | |
| | Investments, foreign currency translations and non-interested Trustees’ deferred compensation | | 76,702,623 | |
Total Change in Unrealized Net Appreciation/Depreciation | | 76,702,623 | |
Net Increase/(Decrease) in Net Assets Resulting from Operations | $ | 125,687,186 | |
| | | | | | |
| | |
See Notes to Financial Statements. |
| |
12 | JUNE 30, 2017 |
Janus Henderson VIT Forty Portfolio
Statements of Changes in Net Assets
| | | | | | | | | |
| | | | | | | | | |
| | | Period ended
June 30, 2017 (unaudited) | | Year ended
December 31, 2016 | |
| | | | | | | | | |
Operations: | | | | | | |
| | Net investment income/(loss) | $ | 542,012 | | $ | (19,397) | |
| | Net realized gain/(loss) on investments | | 48,442,551 | | | 40,288,179 | |
| | Change in unrealized net appreciation/depreciation | | 76,702,623 | | | (26,711,467) | |
Net Increase/(Decrease) in Net Assets Resulting from Operations | | 125,687,186 | | | 13,557,315 | |
Dividends and Distributions to Shareholders: | | | | | | |
| | Distributions from Net Realized Gain from Investment Transactions | | | | | | |
| | | Institutional Shares | | (15,738,032) | | | (37,062,653) | |
| | | Service Shares | | (24,926,390) | | | (65,123,788) | |
Net Decrease from Dividends and Distributions to Shareholders | | (40,664,422) | | | (102,186,441) | |
Capital Share Transactions: | | | | | | |
| | | Institutional Shares | | 7,612,434 | | | (7,170,480) | |
| | | Service Shares | | (32,110,730) | | | (13,410,718) | |
Net Increase/(Decrease) from Capital Share Transactions | | (24,498,296) | | | (20,581,198) | |
Net Increase/(Decrease) in Net Assets | | 60,524,468 | | | (109,210,324) | |
Net Assets: | | | | | | |
| | Beginning of period | | 687,518,510 | | | 796,728,834 | |
| End of period | $ | 748,042,978 | | $ | 687,518,510 | |
| | | | | | | | | |
Undistributed Net Investment Income/(Loss) | $ | 663,938 | | $ | 121,926 | |
| | |
See Notes to Financial Statements. |
| |
Janus Aspen Series | 13 |
Janus Henderson VIT Forty Portfolio
Financial Highlights
| | | | | | | | | | | | | | | | | | | | | | |
Institutional Shares | | | | | | | | | | | | | | | | | | |
For a share outstanding during the period ended June 30, 2017 (unaudited) and each year ended December 31 | 2017 | | | 2016 | | | 2015 | | | 2014 | | | 2013 | | | 2012 | |
| | Net Asset Value, Beginning of Period | | $32.19 | | | $36.37 | | | $40.27 | | | $53.34 | | | $40.95 | | | $33.22 | |
| | Income/(Loss) from Investment Operations: | | | | | | | | | | | | | | | | | | |
| | | Net investment income/(loss) | | 0.05(1) | | | 0.05(1) | | | 0.03(1) | | | 0.03(1) | | | 0.38 | | | 0.47 | |
| | | Net realized and unrealized gain/(loss) | | 6.11 | | | 0.58 | | | 4.77 | | | 3.08 | | | 12.34 | | | 7.54 | |
| | Total from Investment Operations | | 6.16 | | | 0.63 | | | 4.80 | | | 3.11 | | | 12.72 | | | 8.01 | |
| | Less Dividends and Distributions: | | | | | | | | | | | | | | | | | | |
| | | Dividends (from net investment income) | | — | | | — | | | — | | | (0.09) | | | (0.33) | | | (0.28) | |
| | | Distributions (from capital gains) | | (2.03) | | | (4.81) | | | (8.70) | | | (16.09) | | | — | | | — | |
| | Total Dividends and Distributions | | (2.03) | | | (4.81) | | | (8.70) | | | (16.18) | | | (0.33) | | | (0.28) | |
| | Net Asset Value, End of Period | | $36.32 | | | $32.19 | | | $36.37 | | | $40.27 | | | $53.34 | | | $40.95 | |
| | Total Return* | | 19.04% | | | 2.20% | | | 12.22% | | | 8.73% | | | 31.23% | | | 24.16% | |
| | Net Assets, End of Period (in thousands) | | $297,532 | | | $257,009 | | | $295,725 | | | $299,546 | | | $355,429 | | | $488,374 | |
| | Average Net Assets for the Period (in thousands) | | $284,515 | | | $273,374 | | | $298,904 | | | $307,359 | | | $491,231 | | | $512,799 | |
| | Ratios to Average Net Assets**: | | | | | | | | | | | | | | | | | | |
| | | Ratio of Gross Expenses | | 0.78% | | | 0.72% | | | 0.69% | | | 0.57% | | | 0.55% | | | 0.55% | |
| | | Ratio of Net Expenses (After Waivers and Expense Offsets) | | 0.78% | | | 0.72% | | | 0.69% | | | 0.57% | | | 0.55% | | | 0.55% | |
| | | Ratio of Net Investment Income/(Loss) | | 0.31% | | | 0.15% | | | 0.08% | | | 0.07% | | | 0.31% | | | 1.03% | |
| | Portfolio Turnover Rate | | 17% | | | 53% | | | 55% | | | 46% | | | 61% | | | 10% | |
| | | | | | | | | | | | | | 1 | | | | | | | | |
| | | | | | | | | | | | | | | | | | | | | | |
Service Shares | | | | | | | | | | | | | | �� | | | | |
For a share outstanding during the period ended June 30, 2017 (unaudited) and each year ended December 31 | 2017 | | | 2016 | | | 2015 | | | 2014 | | | 2013 | | | 2012 | |
| | Net Asset Value, Beginning of Period | | $30.79 | | | $35.08 | | | $39.21 | | | $52.40 | | | $40.28 | | | $32.72 | |
| | Income/(Loss) from Investment Operations: | | | | | | | | | | | | | | | | | | |
| | | Net investment income/(loss) | | 0.01(1) | | | (0.03)(1) | | | (0.06)(1) | | | (0.07)(1) | | | —(2) | | | 0.31 | |
| | | Net realized and unrealized gain/(loss) | | 5.84 | | | 0.55 | | | 4.63 | | | 2.99 | | | 12.38 | | | 7.47 | |
| | Total from Investment Operations | | 5.85 | | | 0.52 | | | 4.57 | | | 2.92 | | | 12.38 | | | 7.78 | |
| | Less Dividends and Distributions: | | | | | | | | | | | | | | | | | | |
| | | Dividends (from net investment income) | | — | | | — | | | — | | | (0.02) | | | (0.26) | | | (0.22) | |
| | | Distributions (from capital gains) | | (2.03) | | | (4.81) | | | (8.70) | | | (16.09) | | | — | | | — | |
| | Total Dividends and Distributions | | (2.03) | | | (4.81) | | | (8.70) | | | (16.11) | | | (0.26) | | | (0.22) | |
| | Net Asset Value, End of Period | | $34.61 | | | $30.79 | | | $35.08 | | | $39.21 | | | $52.40 | | | $40.28 | |
| | Total Return* | | 18.90% | | | 1.94% | | | 11.94% | | | 8.47% | | | 30.89% | | | 23.82% | |
| | Net Assets, End of Period (in thousands) | | $450,511 | | | $430,510 | | | $501,003 | | | $492,253 | | | $526,971 | | | $471,002 | |
| | Average Net Assets for the Period (in thousands) | | $452,149 | | | $464,943 | | | $501,868 | | | $493,575 | | | $486,845 | | | $468,967 | |
| | Ratios to Average Net Assets**: | | | | | | | | | | | | | | | | | | |
| | | Ratio of Gross Expenses | | 1.02% | | | 0.97% | | | 0.94% | | | 0.82% | | | 0.81% | | | 0.80% | |
| | | Ratio of Net Expenses (After Waivers and Expense Offsets) | | 1.02% | | | 0.97% | | | 0.94% | | | 0.82% | | | 0.81% | | | 0.80% | |
| | | Ratio of Net Investment Income/(Loss) | | 0.05% | | | (0.09)% | | | (0.17)% | | | (0.17)% | | | 0.04% | | | 0.81% | |
| | Portfolio Turnover Rate | | 17% | | | 53% | | | 55% | | | 46% | | | 61% | | | 10% | |
| | | | | | | | | | | | | | | | | | | | | | |
| |
* Total return not annualized for periods of less than one full year. ** Annualized for periods of less than one full year. (1) Per share amounts are calculated based on average shares outstanding during the year or period. (2) Less than $0.005 on a per share basis. |
| | |
See Notes to Financial Statements. |
| |
14 | JUNE 30, 2017 |
Janus Henderson VIT Forty Portfolio
Notes to Financial Statements (unaudited)
1. Organization and Significant Accounting Policies
Janus Henderson VIT Forty Portfolio (formerly named Janus Aspen Forty Portfolio) (the “Portfolio”) is a series of Janus Aspen Series (the “Trust”), which is organized as a Delaware statutory trust and is registered under the Investment Company Act of 1940, as amended (the “1940 Act”), as an open-end management investment company, and therefore has applied the specialized accounting and reporting guidance in Financial Accounting Standards Board (“FASB”) Accounting Standards Codification (“ASC”) Topic 946. The Trust offers twelve portfolios, each of which offers multiple share classes, with differing investment objectives and policies. The Portfolio seeks long-term growth of capital. The Portfolio is classified as nondiversified, as defined in the 1940 Act.
The Portfolio currently offers two classes of shares: Institutional Shares and Service Shares. Each class represents an interest in the same portfolio of investments. Institutional Shares are offered only in connection with investment in and payments under variable insurance contracts as well as certain qualified retirement plans. Service Shares are offered only in connection with investment in and payments under variable insurance contracts as well as certain qualified retirement plans that require a fee from Portfolio assets to procure distribution and administrative services to contract owners and plan participants.
Shareholders, including other portfolios, participating insurance companies, as well as accounts, may from time to time own (beneficially or of record) a significant percentage of the Portfolio’s Shares and can be considered to “control” the Portfolio when that ownership exceeds 25% of the Portfolio’s assets (and which may differ from control as determined in accordance with accounting principles generally accepted in the United States of America).
The following accounting policies have been followed by the Portfolio and are in conformity with accounting principles generally accepted in the United States of America.
Investment Valuation
Securities held by the Portfolio are valued in accordance with policies and procedures established by and under the supervision of the Trustees (the “Valuation Procedures”). Equity securities traded on a domestic securities exchange are generally valued at the closing prices on the primary market or exchange on which they trade. If such price is lacking for the trading period immediately preceding the time of determination, such securities are valued at their current bid price. Equity securities that are traded on a foreign exchange are generally valued at the closing prices on such markets. In the event that there is no current trading volume on a particular security in such foreign exchange, the bid price from the primary exchange is generally used to value the security. Securities that are traded on the over-the-counter (“OTC”) markets are generally valued at their closing or latest bid prices as available. Foreign securities and currencies are converted to U.S. dollars using the applicable exchange rate in effect at the close of the New York Stock Exchange (“NYSE”). The Portfolio will determine the market value of individual securities held by it by using prices provided by one or more approved professional pricing services or, as needed, by obtaining market quotations from independent broker-dealers. Most debt securities are valued in accordance with the evaluated bid price supplied by the pricing service that is intended to reflect market value. The evaluated bid price supplied by the pricing service is an evaluation that may consider factors such as security prices, yields, maturities and ratings. Certain short-term securities maturing within 60 days or less may be evaluated and valued on an amortized cost basis provided that the amortized cost determined approximates market value. Securities for which market quotations or evaluated prices are not readily available or deemed unreliable are valued at fair value determined in good faith under the Valuation Procedures. Circumstances in which fair value pricing may be utilized include, but are not limited to: (i) a significant event that may affect the securities of a single issuer, such as a merger, bankruptcy, or significant issuer-specific development; (ii) an event that may affect an entire market, such as a natural disaster or significant governmental action; (iii) a nonsignificant event such as a market closing early or not opening, or a security trading halt; and (iv) pricing of a nonvalued security and a restricted or nonpublic security. Special valuation considerations may apply with respect to “odd-lot” fixed-income transactions which, due to their small size, may receive evaluated prices by pricing services which reflect a large block trade and not what actually could be obtained for the odd-lot position. The Portfolio uses systematic fair valuation models provided by independent third parties to value international equity securities in order to adjust for stale pricing, which may occur between the close of certain foreign exchanges and the close of the NYSE.
Valuation Inputs Summary
FASB ASC 820, Fair Value Measurements and Disclosures (“ASC 820”), defines fair value, establishes a framework for measuring fair value, and expands disclosure requirements regarding fair value measurements. This standard emphasizes that fair value is a market-based measurement that should be determined based on the assumptions that
Janus Henderson VIT Forty Portfolio
Notes to Financial Statements (unaudited)
market participants would use in pricing an asset or liability and establishes a hierarchy that prioritizes inputs to valuation techniques used to measure fair value. These inputs are summarized into three broad levels:
Level 1 – Unadjusted quoted prices in active markets the Portfolio has the ability to access for identical assets or liabilities.
Level 2 – Observable inputs other than unadjusted quoted prices included in Level 1 that are observable for the asset or liability either directly or indirectly. These inputs may include quoted prices for the identical instrument on an inactive market, prices for similar instruments, interest rates, prepayment speeds, credit risk, yield curves, default rates and similar data.
Assets or liabilities categorized as Level 2 in the hierarchy generally include: debt securities fair valued in accordance with the evaluated bid or ask prices supplied by a pricing service; securities traded on OTC markets and listed securities for which no sales are reported that are fair valued at the latest bid price (or yield equivalent thereof) obtained from one or more dealers transacting in a market for such securities or by a pricing service approved by the Portfolio’s Trustees; certain short-term debt securities with maturities of 60 days or less that are fair valued at amortized cost; and equity securities of foreign issuers whose fair value is determined by using systematic fair valuation models provided by independent third parties in order to adjust for stale pricing which may occur between the close of certain foreign exchanges and the close of the NYSE. Other securities that may be categorized as Level 2 in the hierarchy include, but are not limited to, preferred stocks, bank loans, swaps, investments in unregistered investment companies, options, and forward contracts.
Level 3 – Unobservable inputs for the asset or liability to the extent that relevant observable inputs are not available, representing the Portfolio’s own assumptions about the assumptions that a market participant would use in valuing the asset or liability, and that would be based on the best information available.
There have been no significant changes in valuation techniques used in valuing any such positions held by the Portfolio since the beginning of the fiscal year.
The inputs or methodology used for fair valuing securities are not necessarily an indication of the risk associated with investing in those securities. The summary of inputs used as of June 30, 2017 to fair value the Portfolio’s investments in securities and other financial instruments is included in the “Valuation Inputs Summary” in the Notes to Schedule of Investments and Other Information.
There were no transfers between Level 1, Level 2 and Level 3 of the fair value hierarchy during the period. The Portfolio recognizes transfers between the levels as of the beginning of the fiscal year.
Investment Transactions and Investment Income
Investment transactions are accounted for as of the date purchased or sold (trade date). Dividend income is recorded on the ex-dividend date. Certain dividends from foreign securities will be recorded as soon as the Portfolio is informed of the dividend, if such information is obtained subsequent to the ex-dividend date. Dividends from foreign securities may be subject to withholding taxes in foreign jurisdictions. Interest income is recorded on the accrual basis and includes amortization of premiums and accretion of discounts. Gains and losses are determined on the identified cost basis, which is the same basis used for federal income tax purposes. Income, as well as gains and losses, both realized and unrealized, are allocated daily to each class of shares based upon the ratio of net assets represented by each class as a percentage of total net assets.
Expenses
The Portfolio bears expenses incurred specifically on its behalf. Each class of shares bears a portion of general expenses, which are allocated daily to each class of shares based upon the ratio of net assets represented by each class as a percentage of total net assets. Expenses directly attributable to a specific class of shares are charged against the operations of such class.
Estimates
The preparation of financial statements in conformity with accounting principles generally accepted in the United States of America requires management to make estimates and assumptions that affect the reported amount of assets and liabilities and disclosure of contingent assets and liabilities at the date of the financial statements, and the reported amounts of income and expenses during the reporting period. Actual results could differ from those estimates.
Janus Henderson VIT Forty Portfolio
Notes to Financial Statements (unaudited)
Indemnifications
In the normal course of business, the Portfolio may enter into contracts that contain provisions for indemnification of other parties against certain potential liabilities. The Portfolio’s maximum exposure under these arrangements is unknown, and would involve future claims that may be made against the Portfolio that have not yet occurred. Currently, the risk of material loss from such claims is considered remote.
Foreign Currency Translations
The Portfolio does not isolate that portion of the results of operations resulting from the effect of changes in foreign exchange rates on investments from the fluctuations arising from changes in market prices of securities held at the date of the financial statements. Net unrealized appreciation or depreciation of investments and foreign currency translations arise from changes in the value of assets and liabilities, including investments in securities held at the date of the financial statements, resulting from changes in the exchange rates and changes in market prices of securities held.
Currency gains and losses are also calculated on payables and receivables that are denominated in foreign currencies. The payables and receivables are generally related to foreign security transactions and income translations.
Foreign currency-denominated assets and forward currency contracts may involve more risks than domestic transactions, including currency risk, counterparty risk, political and economic risk, regulatory risk and equity risk. Risks may arise from unanticipated movements in the value of foreign currencies relative to the U.S. dollar.
Dividends and Distributions
The Portfolio may make semiannual distributions of substantially all of its investment income and an annual distribution of its net realized capital gains (if any).
The Portfolio may make certain investments in real estate investment trusts (“REITs”) which pay dividends to their shareholders based upon funds available from operations. It is quite common for these dividends to exceed the REITs’ taxable earnings and profits, resulting in the excess portion of such dividends being designated as a return of capital. If the Portfolio distributes such amounts, such distributions could constitute a return of capital to shareholders for federal income tax purposes.
Federal Income Taxes
The Portfolio intends to continue to qualify as a regulated investment company and distribute all of its taxable income in accordance with the requirements of Subchapter M of the Internal Revenue Code. Management has analyzed the Portfolio’s tax positions taken for all open federal income tax years, generally a three-year period, and has concluded that no provision for federal income tax is required in the Portfolio’s financial statements. The Portfolio is not aware of any tax positions for which it is reasonably possible that the total amounts of unrecognized tax benefits will significantly change in the next twelve months.
2. Other Investments and Strategies
Additional Investment Risk
The financial crisis in both the U.S. and global economies over the past several years has resulted, and may continue to result, in a significant decline in the value and liquidity of many securities of issuers worldwide in the equity and fixed-income/credit markets. In response to the crisis, the United States and certain foreign governments, along with the U.S. Federal Reserve and certain foreign central banks, took steps to support the financial markets. The withdrawal of this support, a failure of measures put in place to respond to the crisis, or investor perception that such efforts were not sufficient could each negatively affect financial markets generally, and the value and liquidity of specific securities. In addition, policy and legislative changes in the United States and in other countries continue to impact many aspects of financial regulation. The effect of these changes on the markets, and the practical implications for market participants, including the Portfolio, may not be fully known for some time. As a result, it may also be unusually difficult to identify both investment risks and opportunities, which could limit or preclude the Portfolio’s ability to achieve its investment objective. Therefore, it is important to understand that the value of your investment may fall, sometimes sharply, and you could lose money.
The enactment of the Dodd-Frank Wall Street Reform and Consumer Protection Act (the “Dodd-Frank Act”) of 2010 provided for widespread regulation of financial institutions, consumer financial products and services, broker-dealers, OTC derivatives, investment advisers, credit rating agencies, and mortgage lending, which expanded federal oversight in the financial sector, including the investment management industry. Many provisions of the Dodd-Frank Act remain
Janus Henderson VIT Forty Portfolio
Notes to Financial Statements (unaudited)
pending and will be implemented through future rulemaking. Therefore, the ultimate impact of the Dodd-Frank Act and the regulations under the Dodd-Frank Act on the Portfolio and the investment management industry as a whole, is not yet certain.
A number of countries in the European Union (“EU”) have experienced, and may continue to experience, severe economic and financial difficulties. In particular, many EU nations are susceptible to economic risks associated with high levels of debt, notably due to investments in sovereign debt of countries such as Greece, Italy, Spain, Portugal, and Ireland. Many non-governmental issuers, and even certain governments, have defaulted on, or been forced to restructure, their debts. Many other issuers have faced difficulties obtaining credit or refinancing existing obligations. Financial institutions have in many cases required government or central bank support, have needed to raise capital, and/or have been impaired in their ability to extend credit. As a result, financial markets in the EU experienced extreme volatility and declines in asset values and liquidity. Responses to these financial problems by European governments, central banks, and others, including austerity measures and reforms, may not work, may result in social unrest, and may limit future growth and economic recovery or have other unintended consequences. Further defaults or restructurings by governments and others of their debt could have additional adverse effects on economies, financial markets, and asset valuations around the world. Greece, Ireland, and Portugal have already received one or more "bailouts" from other Eurozone member states, and it is unclear how much additional funding they will require or if additional Eurozone member states will require bailouts in the future. The risk of investing in securities in the European markets may also be heightened due to the referendum in which the United Kingdom voted to exit the EU (known as “Brexit”). There is considerable uncertainty about how Brexit will be conducted, how negotiations of necessary treaties and trade agreements will proceed, or how financial markets will react. In addition, one or more other countries may also abandon the euro and/or withdraw from the EU, placing its currency and banking system in jeopardy.
Certain areas of the world have historically been prone to and economically sensitive to environmental events such as, but not limited to, hurricanes, earthquakes, typhoons, flooding, tidal waves, tsunamis, erupting volcanoes, wildfires or droughts, tornadoes, mudslides, or other weather-related phenomena. Such disasters, and the resulting physical or economic damage, could have a severe and negative impact on the Portfolio’s investment portfolio and, in the longer term, could impair the ability of issuers in which the Portfolio invests to conduct their businesses as they would under normal conditions. Adverse weather conditions may also have a particularly significant negative effect on issuers in the agricultural sector and on insurance companies that insure against the impact of natural disasters.
Counterparties
Portfolio transactions involving a counterparty are subject to the risk that the counterparty or a third party will not fulfill its obligation to the Portfolio (“counterparty risk”). Counterparty risk may arise because of the counterparty’s financial condition (i.e., financial difficulties, bankruptcy, or insolvency), market activities and developments, or other reasons, whether foreseen or not. A counterparty’s inability to fulfill its obligation may result in significant financial loss to the Portfolio. The Portfolio may be unable to recover its investment from the counterparty or may obtain a limited recovery, and/or recovery may be delayed. The extent of the Portfolio’s exposure to counterparty risk with respect to financial assets and liabilities approximates its carrying value.
The Portfolio may be exposed to counterparty risk through participation in various programs, including, but not limited to, lending its securities to third parties, cash sweep arrangements whereby the Portfolio’s cash balance is invested in one or more types of cash management vehicles, as well as investments in, but not limited to, repurchase agreements, debt securities, and derivatives, including various types of swaps, futures and options. The Portfolio intends to enter into financial transactions with counterparties that Janus Capital believes to be creditworthy at the time of the transaction. There is always the risk that Janus Capital’s analysis of a counterparty’s creditworthiness is incorrect or may change due to market conditions. To the extent that the Portfolio focuses its transactions with a limited number of counterparties, it will have greater exposure to the risks associated with one or more counterparties.
Real Estate Investing
The Portfolio may invest in equity and debt securities of real estate-related companies. Such companies may include those in the real estate industry or real estate-related industries. These securities may include common stocks, corporate bonds, preferred stocks, and other equity securities, including, but not limited to, mortgage-backed securities, real estate-backed securities, securities of REITs and similar REIT-like entities. A REIT is a trust that invests in real estate-related projects, such as properties, mortgage loans, and construction loans. REITs are generally categorized as equity, mortgage, or hybrid REITs. A REIT may be listed on an exchange or traded OTC.
Janus Henderson VIT Forty Portfolio
Notes to Financial Statements (unaudited)
Securities Lending
Under procedures adopted by the Trustees, the Portfolio may seek to earn additional income by lending securities to qualified parties. Deutsche Bank AG acts as securities lending agent and a limited purpose custodian or subcustodian to receive and disburse cash balances and cash collateral, hold short-term investments, hold collateral, and perform other custodian functions. The Portfolio may lend portfolio securities in an amount equal to up to 1/3 of its total assets as determined at the time of the loan origination. There is the risk of delay in recovering a loaned security or the risk of loss in collateral rights if the borrower fails financially. In addition, Janus Capital makes efforts to balance the benefits and risks from granting such loans. All loans will be continuously secured by collateral which may consist of cash, U.S. Government securities, domestic and foreign short-term debt instruments, letters of credit, time deposits, repurchase agreements, money market mutual funds or other money market accounts, or such other collateral as permitted by the SEC. If the Portfolio is unable to recover a security on loan, the Portfolio may use the collateral to purchase replacement securities in the market. There is a risk that the value of the collateral could decrease below the cost of the replacement security by the time the replacement investment is made, resulting in a loss to the Portfolio.
Upon receipt of cash collateral, Janus Capital may invest it in affiliated or non-affiliated cash management vehicles, whether registered or unregistered entities, as permitted by the 1940 Act and rules promulgated thereunder. Janus Capital currently intends to invest the cash collateral in a cash management vehicle for which Janus Capital serves as investment adviser, Janus Cash Collateral Fund LLC. An investment in Janus Cash Collateral Fund LLC is generally subject to the same risks that shareholders experience when investing in similarly structured vehicles, such as the potential for significant fluctuations in assets as a result of the purchase and redemption activity of the securities lending program, a decline in the value of the collateral, and possible liquidity issues. Such risks may delay the return of the cash collateral and cause the Portfolio to violate its agreement to return the cash collateral to a borrower in a timely manner. As adviser to the Portfolio and Janus Cash Collateral Fund LLC, Janus Capital has an inherent conflict of interest as a result of its fiduciary duties to both the Portfolio and Janus Cash Collateral Fund LLC. Additionally, Janus Capital receives an investment advisory fee of 0.05% for managing Janus Cash Collateral Fund LLC, but it may not receive a fee for managing certain other affiliated cash management vehicles in which the Portfolio may invest, and therefore may have an incentive to allocate preferred investment opportunities to investment vehicles for which it is receiving a fee.
The value of the collateral must be at least 102% of the market value of the loaned securities that are denominated in U.S. dollars and 105% of the market value of the loaned securities that are not denominated in U.S. dollars. Loaned securities and related collateral are marked-to-market each business day based upon the market value of the loaned securities at the close of business, employing the most recent available pricing information. Collateral levels are then adjusted based on this mark-to-market evaluation.
The cash collateral invested by Janus Capital is disclosed in the Schedule of Investments (if applicable). Income earned from the investment of the cash collateral, net of rebates paid to, or fees paid by, borrowers and less the fees paid to the lending agent are included as “Affiliated securities lending income, net” on the Statement of Operations. There were no securities on loan as of June 30, 2017.
3. Investment Advisory Agreements and Other Transactions with Affiliates
The Portfolio pays Janus Capital an investment advisory fee which is calculated daily and paid monthly. The Portfolio’s "base" fee rate prior to any performance adjustment (expressed as an annual rate) is 0.64%.
The investment advisory fee rate is determined by calculating a base fee and applying a performance adjustment. The base fee rate is the same as the contractual investment advisory fee rate. The performance adjustment either increases or decreases the base fee depending on how well the Portfolio has performed relative to its benchmark index. The Portfolio's benchmark index used in the calculation is the Russell 1000® Growth Index.
The calculation of the performance adjustment applies as follows:
Investment Advisory Fee = Base Fee Rate +/- Performance Adjustment
The investment advisory fee rate paid to Janus Capital by the Portfolio consists of two components: (1) a base fee calculated by applying the contractual fixed rate of the advisory fee to the Portfolio’s average daily net assets during the previous month (“Base Fee Rate”), plus or minus (2) a performance-fee adjustment (“Performance Adjustment”) calculated by applying a variable rate of up to 0.15% (positive or negative) to the Portfolio’s average daily net assets
Janus Henderson VIT Forty Portfolio
Notes to Financial Statements (unaudited)
based on the Portfolio’s relative performance compared to the cumulative investment record of its benchmark index over a 36-month performance measurement period or shorter time period, as applicable..
The Portfolio’s prospectuses and statement(s) of additional information contain additional information about performance-based fees. The amount shown as advisory fees on the Statement of Operations reflects the Base Fee Rate plus/minus any Performance Adjustment. For the period ended June 30, 2017, the performance adjusted investment advisory fee rate before any waivers and/or reimbursements of expenses is 0.68%.
Janus Services LLC (“Janus Services”), a wholly-owned subsidiary of Janus Capital, is the Portfolio’s transfer agent. Effective May 1, 2016, Janus Services receives an administrative services fee at an annual rate of 0.05% of the average daily net assets of the Portfolio for arranging for the provision by participating insurance companies and qualified plan service providers of administrative services, including recordkeeping, subaccounting, order processing, or other shareholder services provided on behalf of contract holders or plan participants investing in the Portfolio. Other shareholder services may include the provision of order confirmations, periodic account statements, forwarding prospectuses, shareholder reports, and other materials to existing investors, and answering inquiries regarding accounts. Janus Services expects to use this entire fee to compensate insurance companies and qualified plan service providers for providing these services to their customers who invest in the Portfolio. Any unused portion will be reimbursed to the applicable share class at least annually.
In addition, Janus Services provides or arranges for the provision of certain other internal administrative, recordkeeping, and shareholder relations services for the Portfolio. Janus Services is not compensated for these internal services related to the shares, except for out-of-pocket costs. These amounts are disclosed as “Other transfer agent fees and expenses” on the Statement of Operations.
Under a distribution and shareholder servicing plan (the “Plan”) adopted in accordance with Rule 12b-1 under the 1940 Act, the Service Shares may pay the Trust’s distributor, Janus Distributors LLC (“Janus Distributors”), a wholly-owned subsidiary of Janus Capital, a fee for the sale and distribution and/or shareholder servicing of the Service Shares at an annual rate of up to 0.25% of the average daily net assets of the Service Shares. Under the terms of the Plan, the Trust is authorized to make payments to Janus Distributors for remittance to insurance companies and qualified plan service providers as compensation for distribution and/or shareholder services performed by such entities. These amounts are disclosed as “12b-1 Distribution and shareholder servicing fees” on the Statement of Operations. Payments under the Plan are not tied exclusively to actual 12b-1 distribution and servicing fees, and the payments may exceed 12b-1 distribution and servicing fees actually incurred. If any of the Portfolio’s actual 12b-1 distribution and servicing fees incurred during a calendar year are less than the payments made during a calendar year, the Portfolio will be refunded the difference. Refunds, if any, are included in “12b-1 Distribution and shareholder servicing fees” in the Statement of Operations.
Janus Capital furnishes certain administration, compliance, and accounting services for the Portfolio and is reimbursed by the Portfolio for certain of its costs in providing those services (to the extent Janus Capital seeks reimbursement and such costs are not otherwise waived). In addition, employees of Janus Capital and/or its affiliates may serve as officers of the Trust. The Portfolio also pays for some or all of the salaries, fees, and expenses of certain Janus Capital employees and Portfolio officers, with respect to certain specified administration functions they perform on behalf of the Portfolio. The Portfolio pays these costs based on out-of-pocket expenses incurred by Janus Capital, and these costs are separate and apart from advisory fees and other expenses paid in connection with the investment advisory services Janus Capital provides to the Portfolio. These amounts are disclosed as “Portfolio administration fees” on the Statement of Operations. Some expenses related to compensation payable to the Portfolio's Chief Compliance Officer and compliance staff are shared with the Portfolio. Total compensation of $1,138 was paid to the Chief Compliance Officer and certain compliance staff by the Trust during the period ended June 30, 2017. The Portfolio's portion is reported as part of “Other expenses” on the Statement of Operations.
The Board of Trustees has adopted a deferred compensation plan (the “Deferred Plan”) for independent Trustees to elect to defer receipt of all or a portion of the annual compensation they are entitled to receive from the Portfolio. All deferred fees are credited to an account established in the name of the Trustees. The amounts credited to the account then increase or decrease, as the case may be, in accordance with the performance of one or more of the Janus Henderson funds that are selected by the Trustees. The account balance continues to fluctuate in accordance with the performance of the selected fund or funds until final payment of all amounts are credited to the account. The fluctuation of the account balance is recorded by the Portfolio as unrealized appreciation/(depreciation) and is included as of June
Janus Henderson VIT Forty Portfolio
Notes to Financial Statements (unaudited)
30, 2017 on the Statement of Assets and Liabilities in the asset, “Non-interested Trustees’ deferred compensation,” and liability, “Non-interested Trustees’ deferred compensation fees.” Additionally, the recorded unrealized appreciation/(depreciation) is included in “Unrealized net appreciation/(depreciation) of investments, foreign currency translations and non-interested Trustees’ deferred compensation” on the Statement of Assets and Liabilities. Deferred compensation expenses for the period ended June 30, 2017 are included in “Non-interested Trustees’ fees and expenses” on the Statement of Operations. Trustees are allowed to change their designation of mutual funds from time to time. Amounts will be deferred until distributed in accordance with the Deferred Plan. Deferred fees of $206,075 were paid by the Trust to the Trustees under the Deferred Plan during the period ended June 30, 2017.
Pursuant to the provisions of the 1940 Act and related rules, the Portfolio may participate in an affiliated or nonaffiliated cash sweep program. In the cash sweep program, uninvested cash balances of the Portfolio may be used to purchase shares of affiliated or nonaffiliated money market funds or cash management pooled investment vehicles. The Portfolio is eligible to participate in the cash sweep program (the “Investing Funds”). As adviser, Janus Capital has an inherent conflict of interest because of its fiduciary duties to the affiliated money market funds or cash management pooled investment vehicles and the Investing Funds. Janus Cash Liquidity Fund LLC is an affiliated unregistered cash management pooled investment vehicle that invests primarily in highly-rated short-term fixed-income securities. Janus Cash Liquidity Fund LLC currently maintains a NAV of $1.00 per share and distributes income daily in a manner consistent with a registered product compliant with Rule 2a-7 under the 1940 Act. There are no restrictions on the Portfolio's ability to withdraw investments from Janus Cash Liquidity Fund LLC at will, and there are no unfunded capital commitments due from the Portfolio to Janus Cash Liquidity Fund LLC. The units of Janus Cash Liquidity Fund LLC are not charged any management fee, sales charge or service fee.
Any purchases and sales, realized gains/losses and recorded dividends from affiliated investments during the period ended June 30, 2017 can be found in a table located in the Notes to Schedule of Investments and Other Information.
The Portfolio is permitted to purchase or sell securities (“cross-trade”) between itself and other funds or accounts managed by Janus Capital Management LLC in accordance with Rule 17a-7 under the Investment Company Act of 1940 (“Rule 17a-7”), when the transaction is consistent with the investment objectives and policies of the Portfolio and in accordance with the Internal Cross Trade Procedures adopted by the Trust’s Board of Trustees. These procedures have been designed to ensure that any cross-trade of securities by the Portfolio from or to another fund or account that is or could be considered an affiliate of the Portfolio under certain limited circumstances by virtue of having a common investment adviser, common Officer, or common Trustee complies with Rule 17a-7. Under these procedures, each cross-trade is effected at the current market price to save costs where allowed. During the period ended June 30, 2017, the Portfolio engaged in cross trades amounting to $30,054,882 in sales, resulting in a net realized gain of $7,687,771. The net realized gain is included within the “Net Realized Gain/(Loss) on Investments” section of the Portfolio’s Statement of Operations.
4. Federal Income Tax
Income and capital gains distributions are determined in accordance with income tax regulations that may differ from accounting principles generally accepted in the United States of America. These differences are due to differing treatments for items such as net short-term gains, deferral of wash sale losses, foreign currency transactions, net investment losses, and capital loss carryovers.
The Portfolio has elected to treat gains and losses on forward foreign currency contracts as capital gains and losses, if applicable. Other foreign currency gains and losses on debt instruments are treated as ordinary income for federal income tax purposes pursuant to Section 988 of the Internal Revenue Code.
The aggregate cost of investments and the composition of unrealized appreciation and depreciation of investment securities for federal income tax purposes as of June 30, 2017 are noted below.
Unrealized appreciation and unrealized depreciation in the table below exclude appreciation/depreciation on foreign currency translations. The primary differences between book and tax appreciation or depreciation of investments are wash sale loss deferrals and investments in partnerships.
| | | | |
Federal Tax Cost | Unrealized
Appreciation | Unrealized
(Depreciation) | Net Tax Appreciation/
(Depreciation) |
$ 523,462,397 | $219,514,445 | $ (22,528) | $ 219,491,917 |
| | | | |
Janus Henderson VIT Forty Portfolio
Notes to Financial Statements (unaudited)
5. Capital Share Transactions
| | | | | | | |
| | | | | | | |
| | | Period ended June 30, 2017 | | Year ended December 31, 2016 |
| | | Shares | Amount | | Shares | Amount |
| | | | | | | |
Institutional Shares: | | | | | |
Shares sold | 475,717 | $ 16,799,318 | | 699,774 | $ 23,356,199 |
Reinvested dividends and distributions | 427,548 | 15,738,032 | | 1,192,492 | 37,062,653 |
Shares repurchased | (695,905) | (24,924,916) | | (2,038,134) | (67,589,332) |
Net Increase/(Decrease) | 207,360 | $ 7,612,434 | | (145,868) | $ (7,170,480) |
Service Shares: | | | | | |
Shares sold | 720,628 | $ 24,643,727 | | 1,166,469 | $ 37,891,921 |
Reinvested dividends and distributions | 710,558 | 24,926,390 | | 2,187,564 | 65,123,788 |
Shares repurchased | (2,397,091) | (81,680,847) | | (3,651,743) | (116,426,427) |
Net Increase/(Decrease) | (965,905) | $(32,110,730) | | (297,710) | $(13,410,718) |
6. Purchases and Sales of Investment Securities
For the period ended June 30, 2017, the aggregate cost of purchases and proceeds from sales of investment securities (excluding any short-term securities, short-term options contracts, and in-kind transactions) was as follows:
| | | | |
Purchases of
Securities | Proceeds from Sales
of Securities | Purchases of Long-
Term U.S. Government
Obligations | Proceeds from Sales
of Long-Term U.S.
Government Obligations |
$119,303,857 | $ 232,577,047 | $ - | $ - |
7. Recent Accounting Pronouncements
The Securities and Exchange Commission ("SEC") adopted new rules as well as amendments to its rules to modernize the reporting and disclosure of information by registered investment companies. In addition, the SEC adopted amendments to Regulation S-X, which require standardized, enhanced disclosure about derivatives in investment company financial statements, as well as other amendments. The compliance date of the amendments to Regulation S-X is August 1, 2017. Management believes that many of the Regulation S-X amendments are consistent with the Portfolio’s current financial statement presentation and will not have a significant impact on the Portfolio.
The FASB issued Accounting Standards Update No. 2017-08, Receivables – Nonrefundable Fees and Other Costs (Subtopic 310-20), Premium Amortization on Purchased Callable Debt Securities ("ASU 2017-08") to amend the amortization period for certain purchased callable debt securities held at a premium. The guidance requires certain premiums on callable debt securities to be amortized to the earliest call date. The amortization period for callable debt securities purchased at a discount will not be impacted. The amendments are effective for fiscal years, and interim periods within those fiscal years, beginning after December 15, 2018. Early adoption is permitted, including adoption in an interim period. Management is currently evaluating the impacts of ASU 2017-08 on the financial statements.
8. Merger Related Matters
On October 3, 2016, Janus Capital Group Inc. (“JCGI”), the direct parent of Janus Capital, and Henderson Group plc (“Henderson”) announced that they had entered into an Agreement and Plan of Merger (“Merger Agreement”) relating to the strategic combination of Henderson and JCGI (the “Merger”). Pursuant to the Merger Agreement, a newly formed, direct wholly-owned subsidiary of Henderson will merge with and into JCGI, with JCGI as the surviving corporation and a direct wholly-owned subsidiary of Henderson.
The consummation of the Merger may be deemed to be an “assignment” (as defined in the 1940 Act) of the advisory agreement between the Portfolio and Janus Capital that is in effect as of the date of this Report. As a result, the consummation of the Merger will cause the investment advisory agreement to terminate automatically in accordance with its terms.
Janus Henderson VIT Forty Portfolio
Notes to Financial Statements (unaudited)
On December 8, 2016, the Trustees approved, subject to approval of shareholders, a new investment advisory agreement between the Portfolio and Janus Capital in order to permit Janus Capital to continue to provide advisory services to the Portfolio following the closing of the Merger (“Post-Merger Advisory Agreement”). The Post-Merger Advisory Agreement will have substantially similar terms as the corresponding investment advisory agreement that is in effect as of the date of this Report.
Approval of Advisory Agreements
On April 18, 2017, shareholders of the Portfolio approved the Post-Merger Advisory Agreement with Janus Capital. The Post- Merger Advisory Agreement took effect upon the consummation of the Merger.
9. Subsequent Event
Management has evaluated whether any events or transactions occurred subsequent to June 30, 2017 and through the date of issuance of the Portfolio’s financial statements and determined that there were no material events or transactions that would require recognition or disclosure in the Portfolio’s financial statements.
Janus Henderson VIT Forty Portfolio
Additional Information (unaudited)
Proxy Voting Policies and Voting Record
A description of the policies and procedures that the Portfolio uses to determine how to vote proxies relating to its portfolio securities is available without charge: (i) upon request, by calling 1-877-335-2687 (toll free); (ii) on the Portfolio’s website at janushenderson.com/proxyvoting; and (iii) on the SEC’s website at http://www.sec.gov. Additionally, information regarding the Portfolio’s proxy voting record for the most recent twelve-month period ended June 30 is also available, free of charge, through janushenderson.com/proxyvoting and from the SEC’s website at http://www.sec.gov.
Quarterly Portfolio Holdings
The Portfolio files its complete portfolio holdings (schedule of investments) with the SEC for the first and third quarters of each fiscal year on Form N-Q within 60 days of the end of such fiscal quarter. The Portfolio’s Form N-Q: (i) is available on the SEC’s website at http://www.sec.gov; (ii) may be reviewed and copied at the SEC’s Public Reference Room in Washington, D.C. (information on the Public Reference Room may be obtained by calling 1-800-SEC-0330); and (iii) is available without charge, upon request, by calling Janus Henderson at 1-877-335-2687 (toll free).
APPROVAL OF ADVISORY AGREEMENTS DURING THE PERIOD
What follows is a discussion of the material factors and conclusions with respect thereto that formed the basis for the Trustees of Janus Aspen Series’ approval of the investment advisory agreements for the Funds and the sub-advisory agreements for the Funds, as applicable, during the period. This discussion references a Transaction (as defined below) to combine the respective businesses of Henderson Group plc and Janus Capital Group, Inc., which resulted in the Trustees’ consideration of new investment advisory agreements for the Funds and sub-advisory agreements for the Funds, as applicable. During the period, the Trustees also approved the renewal of the existing investment advisory agreements for the Funds and the sub-advisory agreements for the Funds, as applicable, which were subsequently replaced by the new investment advisory and sub-advisory agreements at the close of the Transaction on May 30, 2017.
Approval of Advisory and Sub-Advisory Agreements with Janus and Janus Affiliates during the Period
On September 15, 2016, Janus Capital Group Inc. (“Janus”) advised the Trustees of Janus Aspen Series (the “Trust”), each of whom serves as an “independent” Trustee (the “Board” or the “Trustees”), of its intent to seek a strategic combination of its advisory business with Henderson Group plc (“Henderson”). The Board met with the Chief Executive Officer of Janus, who outlined the proposed combination and the potential benefits to Janus Capital Management LLC (“Janus Capital”) and each Fund of the Trust (each, a “Fund” and collectively, the “Funds”).
Subsequent to the September 15, 2016 meeting, the Trustees identified a list of basic principles, which they believed should serve as the foundation for their review of the organizational, operational and strategic issues involved with any potential change in control of Janus Capital, the investment adviser to the Funds. These basic principles were communicated to Janus Capital on September 27, 2016, and were intended to be shared with Henderson. On October 3, 2016, Janus announced that it had entered into a definitive Agreement and Plan of Merger with Henderson pursuant to which Janus and Henderson agreed to effect an all-stock merger of equals strategic combination of their respective businesses, with Janus Capital surviving the merger as a direct wholly-owned subsidiary of Henderson (the “Transaction”). The Board was advised that, subject to certain conditions, the Transaction is currently expected to close during the second quarter of 2017.
As part of its due diligence, the Board developed an initial list of questions related to the proposed transaction, which was provided to Janus Capital on October 6, 2016. At a special Board meeting held on October 19, 2016, the Board considered Janus Capital’s response to the initial information request and met with the management of Janus to discuss the impact of the Transaction on the nature, extent and quality of services Janus Capital is expected to provide to the Janus Funds following the Transaction, addressing, among other matters, the personnel expected to provide such services, and the resources available to do so. After its October 19, 2016 meeting, the Board developed a supplemental request for additional information, which was provided to Janus Capital on October 26, 2016. At another special Board meeting held on November 7-8, 2016, the Board considered Janus Capital’s response to the supplemental information request and again met with the management of Janus and Henderson to discuss the impact of the Transaction on the nature, extent and quality of services Janus Capital is expected to provide to the Janus Funds following the Transaction, and also met with various officers of the Funds and of Janus Capital including various Fund portfolio managers. After its November 7-8, 2016 meeting, the Board developed a second supplemental request for additional information, which was provided to Janus Capital on November 21, 2016. On December 7-8, 2016, the Board met to consider Janus
Janus Henderson VIT Forty Portfolio
Additional Information (unaudited)
Capital’s response to the second supplemental information request and to also consider the proposed new investment advisory agreements between the Trust, on behalf of each Fund, and Janus Capital (each, a “New Advisory Agreement” and collectively, the “New Advisory Agreements”) and the new sub-advisory agreements between Janus Capital and each of the Funds that utilize INTECH Investment Management LLC (“INTECH”) or Perkins Investment Management LLC (“Perkins”) as sub-advisers (each, a “New Sub-Advisory Agreement” and collectively, the “New Sub-Advisory Agreements”) to take effect immediately after the Transaction or shareholder approval, whichever is later. During each of these meetings, the Board sought additional and clarifying information as it deemed necessary or appropriate. Throughout the process, the Board had the assistance of its independent legal counsel, who advised them on, among other things, its duties and obligations.
In connection with the Board’s review, Janus Capital provided, and the Board obtained, substantial information regarding the following matters: the management, financial position and business of Henderson; the history of Henderson’s business and operations; the investment performance of the investment companies advised by Henderson; the proposed structure, operations and investment processes of the combined investment management organization after the Transaction and the strategy for operating and growing the business following the Transaction; the future plans of Janus and Henderson with respect to the Funds and any proposed changes to the operations or structure of the Funds; and the future plans of Janus and Henderson with respect to the provision of services to the Funds, and the entities providing such services, including those affiliated with Janus. The Board also received information regarding the terms of the Transaction, anticipated management of the combined organization, the resources that each of Janus and Henderson bring to the combined organization and the process being followed by Janus and Henderson to integrate their organizations. The Board also received information regarding the impact of the Transaction on each of INTECH and Perkins.
In connection with the Board’s approval of New Advisory Agreements and New Sub-Advisory Agreements at its December 8, 2016 meeting, the Board also continued its on-going annual process to determine whether to continue the existing investment advisory agreements between Janus Capital and the Trust on behalf of each Fund (each, a “Current Advisory Agreement” and collectively, the “Current Advisory Agreements”) and the existing sub-advisory agreements between Janus Capital and each of the Funds that utilize INTECH or Perkins as sub-advisers (each, a “Current Sub-Advisory Agreement” and collectively, the “Current Sub-Advisory Agreements”). In this regard, the Board received and reviewed information provided by Janus and the respective Sub-Advisers in response to requests of the Board and its independent legal counsel. The Board also received and reviewed information and analysis provided by, and in response to requests of, its independent fee consultant. The Board noted that as part of this annual process, the Board had considered and was in the process of considering, numerous factors, including the nature and quality of services provided by Janus Capital and each Sub-Adviser, as applicable; investment performance, on an absolute basis and relative to appropriate peer groups and one or a combination of market indices; investment management fees, expense ratios and asset sizes of the Funds and peer groups; investment management fees charged to comparable investment companies, separate accounts and non-fund clients; Janus Capital’s profitability from managing the Funds; fall-out benefits to Janus Capital from its relationship to the Funds, including revenues derived from services provided to the Funds by affiliates of Janus Capital; and the potential benefits to Janus Capital, the Funds of receiving research services from broker/dealer firms in connection with the allocation of portfolio transactions to such firms.
In determining whether to approve the New Advisory Agreement for each Fund and the New Sub-Advisory Agreement for Funds managed by INTECH or Perkins in connection with the Transaction, and whether to recommend approval to Fund shareholders, the Board received information and made inquiries into all matters as it deemed appropriate. The Board reviewed and analyzed various factors it deemed relevant, including the following factors, among others, none of which by itself was considered dispositive:
· The terms of the New Advisory Agreements are substantially similar to the corresponding Current Advisory Agreements, and the contractual fee rate will not change. In this regard, see the discussion of the Board’s considerations with respect to its most recent approval of the Current Advisory Agreements prior to December 8, 2016, as disclosed in each Fund’s most recent prior annual or semi-annual shareholder report, as applicable.
· The terms of the New Sub-Advisory Agreements are substantially similar to the corresponding Current Sub- Advisory Agreements, and the contractual fee rate will not change. In this regard, see the discussion of the Board’s considerations with respect to its most recent approval of the Current Sub-Advisory Agreements prior to December 8, 2016, as disclosed in each Fund’s most recent prior annual or semi-annual shareholder report, as applicable.
Janus Henderson VIT Forty Portfolio
Additional Information (unaudited)
· Janus Capital’s plans for the operation of the Funds, including its plans for the continued provision of all services currently provided to the Funds by Janus Capital and its affiliates, including, among others, investment advisory services, portfolio trading services, and Fund administrative and accounting services, and the personnel and resources proposed to support the provision of such services.
· The estimated profitability to Janus Capital from managing the Funds after the Transaction, including potential economies of scale and fall-out benefits to Janus Capital from its relationship to the Funds, including revenues derived from services provided to the Funds by affiliates of Janus Capital, and the potential benefits to Janus Capital, and the Funds of receiving research services from broker/dealer firms in connection with the allocation of portfolio transactions to such firms.
In connection with its deliberations, the Board received assurances from Janus, on behalf of itself and its affiliates (collectively, “Janus”) including the following:
· Janus has provided to the Board such information as it believes is reasonably necessary to evaluate the New Advisory Agreements and New Sub-Advisory Agreements.
· Janus is committed to the continuance, without interruption, of services to the Funds of at least the type and quality currently provided by Janus Capital and its affiliates, or superior thereto.
· The Transaction is not expected to affect negatively the nature, extent or quality of the investment advisory services provided by Janus Capital to the Funds following the Transaction, and the investment advisory services are expected to be at least comparable to the services being provided under the Current Advisory Agreements and Current Sub-Advisory Agreements. In this regard, the Board noted specific representations that Janus does not intend for the nature, extent or quality of investment advisory and other services to be provided to the Funds following the Transaction to change, and the extent of such services were expected to increase based on the combined resources of the combined investment management organization after the Transaction, and should the nature, extent or quality of such services decline, Janus would commit the resources needed to return such services to pre-Transaction levels.
· The Funds’ current operations were expected to remain largely unchanged, except for certain fund reorganizations which will be separately considered by the Board, and such other changes as were or will be presented to the Board.
· The Transaction is not expected to result in any changes to the portfolio managers providing services to the Funds.
· After the Transaction, the distribution and marketing services provided to the Janus Funds were expected to be improved or enhanced based on the combined resources of Janus and Henderson. In this regard, Janus Capital advised the Board that after the Transaction, the extent of distribution and marketing services provided to the Janus Funds are expected to increase based on the combined resources of Janus and Henderson. This is due primarily to the anticipated increase of sales related resources and expanded global presence of the combined Janus Henderson organization, which is expected to enhance visibility and brand recognition of the Janus Henderson Funds.
· The intent of Janus Capital to take the necessary and appropriate steps to retain and attract key investment advisory personnel.
· The intent of Janus to take the necessary and appropriate steps to retain and attract key compliance, financial, fund accounting and administrative personnel supporting the management and oversight of the Funds.
· Janus is not aware of any express or implied term, condition, arrangement or understanding that would impose in its best judgement an “unfair burden” on any Fund as a result of the Transaction, as defined in Section 15(f) of the 1940 Act, and that Janus will take no action that would have the effect of imposing such an “unfair burden” on any Fund in connection with the Transaction.
Janus assured the Board that it intended to comply with Section 15(f) of the Investment Company Act of 1940, as amended. Section 15(f) provides a non-exclusive safe harbor for an investment adviser to an investment company or any of its affiliated persons to receive any amount or benefit in connection with a change in control of the investment adviser so long as two conditions are met. First, for a period of three years after the transaction, at least 75% of the
Janus Henderson VIT Forty Portfolio
Additional Information (unaudited)
board members of the investment company must not be interested persons of such investment adviser (as defined under the 1940 Act). The composition of the Board is in compliance with this provision of Section 15(f). In addition, after careful review and consideration, the Board determined that it would be in the best interests of the Funds to add to the Board an individual who currently acts as a non-interested board member of the Henderson Trust. The Board believes that this change in the Board composition will provide perspective and insight relating to experience working with the Henderson organization. The Board’s Nominating and Governance Committee considered a number of candidates and recommended that the Board nominate one proposed new trustee from those candidates who currently act as non-interested board members of the Henderson Trust. The Board approved that trustee nominee to serve on the Board, subject to election by the shareholders of the Funds and contingent on the closing of the Transaction. If the new trustee is elected and serves on the Board, the Board composition would continue to satisfy the provisions of Section 15(f).
To meet the second condition of Section 15(f), an “unfair burden” must not be imposed upon the investment company as a result of such transaction or any express or implied terms, conditions or understandings applicable thereto. The term “unfair burden” is defined in Section 15(f) to include any arrangement during the two-year period after the transaction, whereby the investment adviser, or any interested person of such adviser, receives or is entitled to receive any compensation, directly or indirectly, from the investment company or its shareholders (other than fees for bona fide investment advisory or other services) or from any person in connection with the purchase or sale of securities or other property to, from or on behalf of the investment company (other than bona fide ordinary compensation as principal underwriter for such investment company).
Janus represented that it does not believe that an “unfair burden” will be placed on the Funds as a result of the Transaction. In furtherance thereof, Janus has undertaken to pay the costs of preparing and distributing proxy materials to, and of holding the meetings of, the Funds’ shareholders (the “Meetings”), as well as other fees and expenses in connection with the Transaction, including the reasonable fees and expenses of legal counsel and consultants to the Funds and the Trustees. In addition, Janus has agreed, for a period of two years following the closing of the Transaction, (i) not to request any increases to advisory fees for the Funds, other than those proposed to and approved by the Board prior to the close of the Transaction, and (ii) to continue to use the current process by which expense caps are set annually for the Funds.
As a result of its review and consideration of the New Investment Advisory Agreements and New Sub-Advisory Agreements in connection with the Transaction, at a meeting on December 8, 2016, the Board voted unanimously to approve a New Investment Advisory Agreement for each Fund and a New Sub-Advisory Agreement for each Fund managed by INTECH or Perkins, and to recommend such agreements to the Funds’ shareholders for their approval.
Approval of Interim Advisory and Sub-Advisory Agreements with Janus and Janus Affiliates during the Period
In the event shareholders of a Fund do not approve such Fund’s New Advisory Agreement and/or New Sub- Advisory Agreement at the Meetings prior to the closing of the Transaction, Janus Capital proposed that an interim investment advisory agreement between Janus Capital and such Fund (each, an “Interim Advisory Agreement” and collectively, the “Interim Advisory Agreements”) and an interim sub-advisory agreement between Janus Capital and the applicable Sub-Adviser (each, an “Interim Sub-Advisory Agreement” and collectively, the “Interim Sub- Advisory Agreements”) take effect upon the closing of the Transaction. At the December 8, 2016 meeting, the Board, all of whom are Independent Trustees, unanimously approved an Interim Advisory Agreement for each Fund and an Interim Sub-Advisory Agreement for each applicable Fund in order to assure continuity of investment advisory services to the Funds and sub-advisory services to the sub-advised Funds after the Transaction. The terms of each Interim Advisory Agreement are substantially identical to those of the applicable Current Advisory Agreement and New Advisory Agreement, except for the term and escrow provisions described below. Similarly, the terms of each Interim Sub-Advisory Agreement are substantially identical to those of the Current Sub-Advisory Agreements and New Sub-Advisory Agreements, except for the term and escrow provisions described below. The Interim Advisory Agreement and Interim Sub-Advisory Agreement will continue in effect for a term ending on the earlier of 150 days from the closing of the Transaction (the “150-day period”) or when shareholders of the Fund approve the New Advisory Agreement and/or New Sub-Advisory Agreement. Pursuant to Rule 15a-4 under the 1940 Act, compensation earned by Janus Capital under an Interim Advisory Agreement and compensation earned by a Sub-Adviser under an Interim Sub-Advisory Agreement will be held in an interest-bearing escrow account. If shareholders of a Fund approve the New Advisory Agreement prior to the end of the 150-day period, the amount held in the escrow account under the Interim Advisory Agreement will be paid to Janus Capital. If shareholders of a Fund approve the New Advisory Agreement and New Sub-Advisory Agreement prior to the
Janus Henderson VIT Forty Portfolio
Additional Information (unaudited)
end of the 150-day period, the amount held in the escrow account under the Interim Sub-Advisory Agreement will be paid to the Sub- Adviser. If shareholders of a Fund do not approve the New Advisory Agreement prior to the end of the 150-day period, the Board will take such action as it deems to be in the best interests of the Fund, and Janus Capital will be paid the lesser of its costs incurred in performing its services under the Interim Advisory Agreement or the total amount in the escrow account, plus interest earned. If shareholders of a Fund do not approve the New Advisory Agreement and/or New Sub-Advisory Agreement prior to the end of the 150-day period, the Board will take such action as it deems to be in the best interests of the Fund, and the Sub-Adviser will be paid the lesser of its costs incurred in performing its services under the Interim Sub-Advisory Agreement or the total amount in the escrow account, plus interest earned.
Approval of an Amended and Restated Investment Advisory Agreement for Janus Henderson Research Portfolio (formerly, Janus Portfolio)
Janus Capital met with the Trustees on December 7-8, 2016, to discuss the approval of an amended and restated investment advisory agreement (the “Amended Advisory Agreement”) between Janus Capital and the Trust on behalf of Janus Portfolio (for the purposes of this section, the “Fund” refers to Janus Portfolio) and other matters related to the proposed changes to the Fund’s name, principal investment strategies, and portfolio management team (the “Realignment”). At the meeting, the Trustees also discussed the Amended Advisory Agreement and other matters related to the Realignment with their independent counsel in executive session. During the course of this meeting, the Trustees requested and considered such information as they deemed relevant to their deliberations. In addition, at prior meetings and during the course of this meeting the Board also considered the proposal to merge the Janus Fund, a series of Janus Investment Fund, into the Janus Research Fund, another series of Janus Investment Fund, and undertook a comprehensive process to evaluate the impact of the Transaction on the nature, quality and extent of services expected to be provided by Janus Capital to the Fund, including after the completion of the Transaction. For a fuller discussion of the Board’s consideration of the approval of a new investment advisory agreement for the Fund in connection with the Transaction, see “Approval of Advisory and Sub-Advisory Agreements with Janus and Janus Affiliates during the Period” above.
At a meeting of the Board of Trustees held on December 8, 2016, the Trustees approved the Amended Advisory Agreement and other matters related to the Realignment. In determining whether to approve the Amended Advisory Agreement, and whether to recommend approval to Fund shareholders, the Board received information and made inquiries into all matters as it deemed appropriate. The Board reviewed and analyzed various factors it deemed relevant, including the following factors, among others, none of which by itself was considered dispositive:
· the terms of the Amended Advisory Agreement are substantially the same as the Current Advisory Agreement, except for the change to the advisory fee rate based on the amount of such outperformance or underperformance (the “Full Performance Rate”) and cumulative investment record of the Fund’s benchmark index (the “Performance Fee Benchmark”);
· the estimated impact of the change to the Full Performance Rate and Performance Fee Benchmark on the amount of advisory fees to be paid by the Fund, including consideration of comparative pro forma data showing the advisory fees payable if the Amended Advisory Agreement had been in place in prior years;
· the Fund’s investment team will be able to more efficiently manage the Fund’s portfolio, assuming the merger of the Janus Fund into Janus Research Fund is implemented, which may also provide benefits from opportunities to aggregate trading across funds that have similar investment strategies;
· Janus Capital’s belief that the Fund shareholders may benefit from the Realignment, as a result of the research- driven investment process to be implemented, which includes lower historical transaction costs and potential performance gains from securities lending as compared to the Fund’s current investment approach;
· the Realignment was being proposed as part of Janus Capital’s efforts to streamline its product line;
· Janus Capital’s belief that the Fund would benefit from Janus Capital’s operational efficiencies resulting from the merger of the Janus Fund into the Janus Research Fund and the Realignment, including a potentially more efficient and effective investment management approach providing the potential for a growing fund and improved performance after the Realignment;
· the costs of seeking approval of the Amended Advisory Agreement will be borne by Janus Capital;
Janus Henderson VIT Forty Portfolio
Additional Information (unaudited)
· the costs incurred to reposition the Fund’s portfolio in connection with the Realignment;
· the potential tax consequences of any repositioning of the Fund’s portfolio as a result of the Merger; and any potential benefits of Janus Capital and its affiliates as a result of the Realignment.
Renewal of Advisory and Sub-Advisory Agreements with Janus Capital and Janus Capital Affiliates during the Period
The Trustees of Janus Investment Fund and Janus Aspen Series, each of whom serves as an “independent” Trustee (the “Trustees”), oversee the management of each Fund of Janus Investment Fund and each Portfolio of Janus Aspen Series (each, a “Fund” and collectively, the “Funds”), and as required by law, determine annually whether to continue the investment advisory agreement for each Fund and the subadvisory agreements for the 16 Funds that utilize subadvisers.
In connection with their most recent consideration of those agreements for each Fund, the Trustees received and reviewed information provided by Janus Capital and the respective subadvisers in response to requests of the Trustees and their independent legal counsel. They also received and reviewed information and analysis provided by, and in response to requests of, their independent fee consultant. Throughout their consideration of the agreements, the Trustees were advised by their independent legal counsel. The Trustees met with management to consider the agreements, and also met separately in executive session with their independent legal counsel and their independent fee consultant.
Additionally, in connection with their consideration of whether to continue the investment advisory agreement and subadvisory agreement for each Fund, as applicable, the Trustees also received and reviewed information in connection with the proposed transaction to combine the respective businesses of Henderson Group plc and Janus Capital Group, Inc., the parent company of Janus Capital (the “Transaction”), announced in October 2016, which Janus Capital advised the Trustees was expected to close in the second quarter of 2017. In this regard, the Trustees reviewed information regarding the impact of the Transaction on the services to be provided by Janus Capital and each subadviser, as applicable, to the Funds under such agreements both prior to the close of the Transaction, and afterwards, if the Transaction were not to close. If the Transaction closes, all such agreements would be replaced by new investment advisory agreements and subadvisory agreements, as applicable, for each Fund, assuming requisite Fund shareholder approvals have been obtained.
At a meeting held on January 26, 2017, based on the Trustees’ evaluation of the information provided by Janus Capital, the subadvisers, and the independent fee consultant, as well as other information, the Trustees determined that the overall arrangements between each Fund and Janus Capital and each subadviser, as applicable, were fair and reasonable in light of the nature, extent and quality of the services provided by Janus Capital, its affiliates and the subadvisers, the fees charged for those services, and other matters that the Trustees considered relevant in the exercise of their business judgment. At that meeting, the Trustees unanimously approved the continuation of the investment advisory agreement for each Fund, and the subadvisory agreement for each subadvised Fund, for the period from February 1, 2017 through February 1, 2018, subject to earlier termination as provided for in each agreement.
In considering the continuation of those agreements, the Trustees reviewed and analyzed various factors that they determined were relevant, including the factors described below, none of which by itself was considered dispositive. However, the material factors and conclusions that formed the basis for the Trustees’ determination to approve the continuation of the agreements are discussed separately below. Also included is a summary of the independent fee consultant’s conclusions and opinions that arose during, and were included as part of, the Trustees’ consideration of the agreements. “Management fees,” as used herein, reflect actual annual advisory fees and any administration fees (excluding out of pocket costs), net of any waivers.
Nature, Extent and Quality of Services
The Trustees reviewed the nature, extent and quality of the services provided by Janus Capital and the subadvisers to the Funds, taking into account the investment objective, strategies and policies of each Fund, and the knowledge the Trustees gained from their regular meetings with management on at least a quarterly basis and their ongoing review of information related to the Funds. In addition, the Trustees reviewed the resources and key personnel of Janus Capital and each subadviser, particularly noting those employees who provide investment and risk management services to the Funds. The Trustees also considered other services provided to the Funds by Janus Capital or the subadvisers, such as
Janus Henderson VIT Forty Portfolio
Additional Information (unaudited)
managing the execution of portfolio transactions and the selection of broker-dealers for those transactions. The Trustees considered Janus Capital’s role as administrator to the Funds, noting that Janus Capital does not receive a fee for its services but is reimbursed for its out-of-pocket costs. The Trustees considered the role of Janus Capital in monitoring adherence to the Funds’ investment restrictions, providing support services for the Trustees and Trustee committees, and overseeing communications with shareholders and the activities of other service providers, including monitoring compliance with various policies and procedures of the Funds and with applicable securities laws and regulations.
In this regard, the independent fee consultant noted that Janus Capital provides a number of different services for the Funds and Fund shareholders, ranging from investment management services to various other servicing functions, and that, in its opinion, Janus Capital is a capable provider of those services. The independent fee consultant also provided its belief that Janus Capital has developed a number of institutional competitive advantages that should enable it to provide superior investment and service performance over the long term.
The Trustees concluded that the nature, extent and quality of the services provided by Janus Capital or the subadviser to each Fund were appropriate and consistent with the terms of the respective advisory and subadvisory agreements, and that, taking into account steps taken to address those Funds whose performance lagged that of their peers for certain periods, the Funds were likely to benefit from the continued provision of those services. They also concluded that Janus Capital and each subadviser had sufficient personnel, with the appropriate education and experience, to serve the Funds effectively and had demonstrated its ability to attract well-qualified personnel.
Performance of the Funds
The Trustees considered the performance results of each Fund over various time periods. They noted that they considered Fund performance data throughout the year, including periodic meetings with each Fund’s portfolio manager(s), and also reviewed information comparing each Fund’s performance with the performance of comparable funds and peer groups identified by Broadridge Financial Solutions, Inc. (“Broadridge”), an independent data provider, and with the Fund’s benchmark index. In this regard, the independent fee consultant found that the overall Funds’ performance has been strong: for the 36 months ended September 30, 2016, approximately 76% of the Funds were in the top two Broadridge quartiles of performance, and for the 12 months ended September 30, 2016, approximately 47% of the Funds were in the top two Broadridge quartiles of performance.
The Trustees considered the performance of each Fund, noting that performance may vary by share class, and noted the following:
Fixed-Income Funds and Money Market Funds
· For Janus Henderson Flexible Bond Fund (formerly, Janus Flexible Bond Fund), the Trustees noted that the Fund’s performance was in the second Broadridge quartile for the 36 months ended May 31, 2016 and the third Broadridge quartile for the 12 months ended May 31, 2016.
· For Janus Henderson Global Bond Fund (formerly, Janus Global Bond Fund), the Trustees noted that the Fund’s performance was in the second Broadridge quartile for the 36 months ended May 31, 2016 and the third Broadridge quartile for the 12 months ended May 31, 2016.
· For Janus Henderson Global Unconstrained Bond Fund (formerly, Janus Global Unconstrained Bond Fund), the Trustees noted that the Fund’s performance was in the first Broadridge quartile for the 12 months ended May 31, 2016.
· For Janus Henderson High-Yield Fund (formerly, Janus High-Yield Fund), the Trustees noted that the Fund’s performance was in the second Broadridge quartile for the 36 months ended May 31, 2016 and the second Broadridge quartile for the 12 months ended May 31, 2016.
· For Janus Henderson Multi-Sector Income Fund (formerly, Janus Multi-Sector Income Fund), the Trustees noted that the Fund’s performance was in the first Broadridge quartile for the 12 months ended May 31, 2016.
· For Janus Henderson Real Return Fund (formerly, Janus Real Return Fund), the Trustees noted that the Fund’s performance was in the first Broadridge quartile for the 36 months ended May 31, 2016 and the first Broadridge quartile for the 12 months ended May 31, 2016.
Janus Henderson VIT Forty Portfolio
Additional Information (unaudited)
· For Janus Henderson Short-Term Bond Fund (formerly, Janus Short-Term Bond Fund), the Trustees noted that the Fund’s performance was in the second Broadridge quartile for the 36 months ended May 31, 2016 and the third Broadridge quartile for the 12 months ended May 31, 2016.
· For Janus Henderson Government Money Market Fund (formerly, Janus Government Money Market Fund), the Trustees noted that the Fund’s performance was in the third Broadridge quartile for the 36 months ended May 31, 2016 and the third Broadridge quartile for the 12 months ended May 31, 2016. The Trustees noted the reasons for the Fund’s underperformance.
· For Janus Henderson Money Market Fund (formerly, Janus Money Market Fund), the Trustees noted that the Fund’s performance was in the bottom Broadridge quartile for the 36 months ended May 31, 2016 and the bottom Broadridge quartile for the 12 months ended May 31, 2016. The Trustees noted the reasons for the Fund’s underperformance.
Asset Allocation Funds
· For Janus Henderson Global Allocation Fund – Conservative (formerly, Janus Global Allocation Fund – Conservative), the Trustees noted that the Fund’s performance was in the second Broadridge quartile for the 36 months ended May 31, 2016 and the bottom Broadridge quartile for the 12 months ended May 31, 2016.
· For Janus Henderson Global Allocation Fund – Growth (formerly, Janus Global Allocation Fund – Growth), the Trustees noted that the Fund’s performance was in the bottom Broadridge quartile for the 36 months ended May 31, 2016 and the bottom Broadridge quartile for the 12 months ended May 31, 2016. The Trustees noted the reasons for the Fund’s underperformance and the steps Janus Capital had taken or was taking to improve performance.
· For Janus Henderson Global Allocation Fund – Moderate (formerly, Janus Global Allocation Fund – Moderate), the Trustees noted that the Fund’s performance was in the third Broadridge quartile for the 36 months ended May 31, 2016 and the bottom Broadridge quartile for the 12 months ended May 31, 2016. The Trustees noted the reasons for the Fund’s underperformance and the steps Janus Capital had taken or was taking to improve performance.
Alternative Fund
· For Janus Henderson Diversified Alternatives Fund (formerly, Janus Diversified Alternatives Fund), the Trustees noted that the Fund’s performance was in the third Broadridge quartile for the 36 months ended May 31, 2016 and the third Broadridge quartile for the 12 months ended May 31, 2016. The Trustees noted the reasons for the Fund’s underperformance and the steps Janus Capital had taken or was taking to improve performance.
Value Funds
· For Janus Henderson International Value Fund (formerly, Perkins International Value Fund), the Trustees noted that the Fund’s performance was in the second Broadridge quartile for the 36 months ended May 31, 2016 and the first Broadridge quartile for the 12 months ended May 31, 2016.
· For Janus Henderson Global Value Fund (formerly, Perkins Global Value Fund), the Trustees noted that the Fund’s performance was in the second Broadridge quartile for the 36 months ended May 31, 2016 and the first Broadridge quartile for the 12 months ended May 31, 2016.
· For Janus Henderson Large Cap Value Fund (formerly, Perkins Large Cap Value Fund), the Trustees noted that the Fund’s performance was in the third Broadridge quartile for the 36 months ended May 31, 2016 and the first Broadridge quartile for the 12 months ended May 31, 2016. The Trustees noted the reasons for the Fund’s underperformance, noting that the Fund has a performance fee structure that results in lower management fees during periods of underperformance, the steps Janus Capital and Perkins had taken or were taking to improve performance, and that the performance trend was improving.
· For Janus Henderson Mid Cap Value Fund (formerly, Perkins Mid Cap Value Fund), the Trustees noted that the Fund’s performance was in the bottom Broadridge quartile for the 36 months ended May 31, 2016 and the first Broadridge quartile for the 12 months ended May 31, 2016. The Trustees noted the reasons for the Fund’s underperformance, noting that the Fund has a performance fee structure that results in lower
Janus Henderson VIT Forty Portfolio
Additional Information (unaudited)
management fees during periods of underperformance, the steps Janus Capital and Perkins had taken or were taking to improve performance, and that the performance trend was improving.
· For Janus Henderson Select Value Fund (formerly, Perkins Select Value Fund), the Trustees noted that the Fund’s performance was in the second Broadridge quartile for the 36 months ended May 31, 2016 and the first Broadridge quartile for the 12 months ended May 31, 2016.
· For Janus Henderson Small Cap Value Fund (formerly, Perkins Small Cap Value Fund), the Trustees noted that the Fund’s performance was in the first Broadridge quartile for the 36 months ended May 31, 2016 and the first Broadridge quartile for the 12 months ended May 31, 2016.
· For Janus Henderson Value Plus Income Fund (formerly, Perkins Value Plus Income Fund), the Trustees noted that the Fund’s performance was in the second Broadridge quartile for the 36 months ended May 31, 2016 and the second Broadridge quartile for the 12 months ended May 31, 2016.
Mathematical Funds
· For Janus Henderson Emerging Markets Managed Volatility Fund (formerly, INTECH Emerging Markets Managed Volatility Fund), the Trustees noted that the Fund’s performance was in the second Broadridge quartile for the 12 months ended May 31, 2016.
· For Janus Henderson Global Income Managed Volatility Fund (formerly, INTECH Global Income Managed Volatility Fund), the Trustees noted that the Fund’s performance was in the first Broadridge quartile for the 36 months ended May 31, 2016 and the first Broadridge quartile for the 12 months ended May 31, 2016.
· For Janus Henderson International Managed Volatility Fund (formerly, INTECH International Managed Volatility Fund), the Trustees noted that the Fund’s performance was in the first Broadridge quartile for the 36 months ended May 31, 2016 and the first Broadridge quartile for the 12 months ended May 31, 2016.
· For Janus Henderson U.S. Managed Volatility Fund (formerly, INTECH U.S. Managed Volatility Fund), the Trustees noted that the Fund’s performance was in the first Broadridge quartile for the 36 months ended May 31, 2016 and the first Broadridge quartile for the 12 months ended May 31, 2016.
Growth and Core Funds
· For Janus Henderson Balanced Fund (formerly, Janus Balanced Fund), the Trustees noted that the Fund’s performance was in the first Broadridge quartile for the 36 months ended May 31, 2016 and the third Broadridge quartile for the 12 months ended May 31, 2016.
· For Janus Henderson Contrarian Fund (formerly, Janus Contrarian Fund), the Trustees noted that the Fund’s performance was in the bottom Broadridge quartile for the 36 months ended May 31, 2016 and the bottom Broadridge quartile for the 12 months ended May 31, 2016. The Trustees noted the reasons for the Fund’s underperformance, noting that the Fund has a performance fee structure that results in lower management fees during periods of underperformance, and the steps Janus Capital had taken or was taking to improve performance.
· For Janus Henderson Enterprise Fund (formerly, Janus Enterprise Fund), the Trustees noted that the Fund’s performance was in the first Broadridge quartile for the 36 months ended May 31, 2016 and the first Broadridge quartile for the 12 months ended May 31, 2016.
· For Janus Henderson Forty Fund (formerly, Janus Forty Fund), the Trustees noted that the Fund’s performance was in the first Broadridge quartile for the 36 months ended May 31, 2016 and the first Broadridge quartile for the 12 months ended May 31, 2016.
· For Janus Henderson Growth and Income Fund (formerly, Janus Growth and Income Fund), the Trustees noted that the Fund’s performance was in the second Broadridge quartile for the 36 months ended May 31, 2016 and in the second Broadridge quartile for the 12 months ended May 31, 2016.
· For Janus Henderson Research Fund (formerly, Janus Research Fund), the Trustees noted that the Fund’s performance was in the first Broadridge quartile for the 36 months ended May 31, 2016 and the second Broadridge quartile for the 12 months ended May 31, 2016.
Janus Henderson VIT Forty Portfolio
Additional Information (unaudited)
· For Janus Henderson Triton Fund (formerly, Janus Triton Fund), the Trustees noted that the Fund’s performance was in the first Broadridge quartile for the 36 months ended May 31, 2016 and the first Broadridge quartile for the 12 months ended May 31, 2016.
· For Janus Henderson Venture Fund (formerly, Janus Venture Fund), the Trustees noted that the Fund’s performance was in the first Broadridge quartile for the 36 months ended May 31, 2016 and the second Broadridge quartile for the 12 months ended May 31, 2016.
Global and International Funds
· For Janus Henderson Adaptive Global Allocation Fund (formerly, Janus Adaptive Global Allocation Fund), the Trustees noted that, due to limited performance for the Fund, performance history was not a material factor.
· For Janus Henderson Asia Equity Fund (formerly, Janus Asia Equity Fund), the Trustees noted that the Fund’s performance was in the third Broadridge quartile for the 36 months ended May 31, 2016 and the bottom Broadridge quartile for the 12 months ended May 31, 2016. The Trustees noted the reasons for the Fund’s underperformance, noting that the Fund has a performance fee structure that results in lower management fees during periods of underperformance, and the steps Janus Capital had taken or was taking to improve performance.
· For Janus Henderson Global Life Sciences Fund (formerly, Janus Global Life Sciences Fund), the Trustees noted that the Fund’s performance was in the first Broadridge quartile for the 36 months ended May 31, 2016 and the bottom Broadridge quartile for the 12 months ended May 31, 2016.
· For Janus Henderson Global Real Estate Fund (formerly, Janus Global Real Estate Fund), the Trustees noted that the Fund’s performance was in the third Broadridge quartile for the 36 months ended May 31, 2016 and the bottom Broadridge quartile for the 12 months ended May 31, 2016. The Trustees noted the reasons for the Fund’s underperformance, noting that the Fund has a performance fee structure that results in lower management fees during periods of underperformance, and the steps Janus Capital had taken or was taking to improve performance.
· For Janus Henderson Global Research Fund (formerly, Janus Global Research Fund), the Trustees noted that the Fund’s performance was in the third Broadridge quartile for the 36 months ended May 31, 2016 and the bottom Broadridge quartile for the 12 months ended May 31, 2016. The Trustees noted the reasons for the Fund’s underperformance, noting that the Fund has a performance fee structure that results in lower management fees during periods of underperformance, and the steps Janus Capital had taken or was taking to improve performance.
· For Janus Henderson Global Select Fund (formerly, Janus Global Select Fund), the Trustees noted that the Fund’s performance was in the bottom Broadridge quartile for the 36 months ended May 31, 2016 and the bottom Broadridge quartile for the 12 months ended May 31, 2016. The Trustees noted the reasons for the Fund’s underperformance and the steps Janus Capital had taken or was taking to improve performance.
· For Janus Henderson Global Technology Fund (formerly, Janus Global Technology Fund), the Trustees noted that the Fund’s performance was in the third Broadridge quartile for the 36 months ended May 31, 2016 and the first Broadridge quartile for the 12 months ended May 31, 2016. The Trustees noted the reasons for the Fund’s underperformance, the steps Janus Capital had taken or was taking to improve performance, and that the performance trend was improving.
· For Janus Overseas Fund (formerly, Janus Henderson Overseas Fund), the Trustees noted that the Fund’s performance was in the bottom Broadridge quartile for the 36 months ended May 31, 2016 and the bottom Broadridge quartile for the 12 months ended May 31, 2016. The Trustees noted the reasons for the Fund’s underperformance, noting that the Fund has a performance fee structure that results in lower management fees during periods of underperformance, and the steps Janus Capital had taken or was taking to improve performance.
Janus Aspen Series
· For Janus Henderson Balanced Portfolio (formerly, Janus Aspen Balanced Portfolio), the Trustees noted that the Fund’s performance was in the first Broadridge quartile for the 36 months ended May 31, 2016 and the third Broadridge quartile for the 12 months ended May 31, 2016.
Janus Henderson VIT Forty Portfolio
Additional Information (unaudited)
· For Janus Henderson Enterprise Portfolio (formerly, Janus Aspen Enterprise Portfolio), the Trustees noted that the Fund’s performance was in the first Broadridge quartile for the 36 months ended May 31, 2016 and the first Broadridge quartile for the 12 months ended May 31, 2016.
· For Janus Henderson Flexible Bond Portfolio (formerly, Janus Aspen Flexible Bond Portfolio), the Trustees noted that the Fund’s performance was in the second Broadridge quartile for the 36 months ended May 31, 2016 and the bottom Broadridge quartile for the 12 months ended May 31, 2016.
· For Janus Henderson Forty Portfolio (formerly, Janus Aspen Forty Portfolio), the Trustees noted that the Fund’s performance was in the first Broadridge quartile for the 36 months ended May 31, 2016 and the first Broadridge quartile for the 12 months ended May 31, 2016.
· For Janus Henderson Global Allocation Portfolio – Moderate (formerly, Janus Aspen Global Allocation Portfolio – Moderate), the Trustees noted that the Fund’s performance was in the bottom Broadridge quartile for the 36 months ended May 31, 2016 and the bottom Broadridge quartile for the 12 months ended May 31, 2016. The Trustees noted the reasons for the Fund’s underperformance and the steps Janus Capital had taken or was taking to improve performance.
· For Janus Henderson Global Research Portfolio (formerly, Janus Aspen Global Research Portfolio), the Trustees noted that the Fund’s performance was in the third Broadridge quartile for the 36 months ended May 31, 2016 and the bottom Broadridge quartile for the 12 months ended May 31, 2016. The Trustees noted the reasons for the Fund’s underperformance, noting that the Fund has a performance fee structure that results in lower management fees during periods of underperformance, and the steps Janus Capital had taken or was taking to improve performance
· For Janus Henderson Global Technology Portfolio (formerly, Janus Aspen Global Technology Portfolio), the Trustees noted that the Fund’s performance was in the third Broadridge quartile for the 36 months ended May 31, 2016 and the second Broadridge quartile for the 12 months ended May 31, 2016. The Trustees noted the reasons for the Fund’s underperformance and the steps Janus Capital had taken or was taking to improve performance.
· For Janus Henderson Global Unconstrained Bond Portfolio (formerly, Janus Aspen Global Unconstrained Bond Portfolio), the Trustees noted that the Fund’s performance was in the second Broadridge quartile for the 12 months ended May 31, 2016.
· For Janus Henderson U.S. Low Volatility Portfolio (formerly, Janus Aspen INTECH U.S. Low Volatility Portfolio), the Trustees noted that the Fund’s performance was in the first Broadridge quartile for the 36 months ended May 31, 2016 and the first Broadridge quartile for the 12 months ended May 31, 2016.
· For Janus Henderson Research Portfolio (formerly, Janus Aspen Janus Portfolio), the Trustees noted that the Fund’s performance was in the first Broadridge quartile for the 36 months ended May 31, 2016 and the second Broadridge quartile for the 12 months ended May 31, 2016.
· For Janus Henderson Overseas Portfolio (formerly, Janus Aspen Overseas Portfolio), the Trustees noted that the Fund’s performance was in the bottom Broadridge quartile for the 36 months ended May 31, 2016 and the bottom Broadridge quartile for the 12 months ended May 31, 2016. The Trustees noted the reasons for the Fund’s underperformance, noting that the Fund has a performance fee structure that results in lower management fees during periods of underperformance, and the steps Janus Capital had taken or was taking to improve performance.
· For Janus Henderson Mid Cap Value Portfolio (formerly, Janus Aspen Perkins Mid Cap Value Portfolio), the Trustees noted that the Fund’s performance was in the bottom Broadridge quartile for the 36 months ended May 31, 2016 and the first Broadridge quartile for the 12 months ended May 31, 2016. The Trustees noted the reasons for the Fund’s underperformance, noting that the Fund has a performance fee structure that results in lower management fees during periods of underperformance, the steps Janus Capital and Perkins had taken or were taking to improve performance, and that the performance trend was improving.
In consideration of each Fund’s performance, the Trustees concluded that, taking into account the factors relevant to performance, as well as other considerations, including steps taken to improve performance, the Fund’s performance warranted continuation of the Fund’s investment advisory and subadvisory agreement(s).
Janus Henderson VIT Forty Portfolio
Additional Information (unaudited)
Costs of Services Provided
The Trustees examined information regarding the fees and expenses of each Fund in comparison to similar information for other comparable funds as provided by Broadridge, an independent data provider. They also reviewed an analysis of that information provided by their independent fee consultant and noted that the rate of management (investment advisory and any administration, but excluding out-of-pocket costs) fees for many of the Funds, after applicable waivers, was below the average management fee rate of the respective peer group of funds selected by an independent data provider. The Trustees also examined information regarding the subadvisory fees charged for subadvisory services, as applicable, noting that all such fees were paid by Janus Capital out of its management fees collected from such Fund.
The independent fee consultant provided its belief that the management fees charged by Janus Capital to each of the Funds under the current investment advisory and administration agreements are reasonable in relation to the services provided by Janus Capital. The independent fee consultant found: (1) the total expenses and management fees of the Funds to be reasonable relative to other mutual funds; (2) total expenses, on average, were 12% below the average total expenses of their respective Broadridge Expense Group peers and 20% below the average total expenses for their Broadridge Expense Universes; (3) management fees for the Funds, on average, were 11% below the average management fees for their Expense Groups and 13% below the average for their Expense Universes; and (4) Fund expenses at the functional level for each asset and share class category were reasonable. The Trustees also considered the total expenses for each share class of each Fund compared to the average total expenses for its Broadridge Expense Group peers and to average total expenses for its Broadridge Expense Universe.
The independent fee consultant concluded that, based on its strategic review of expenses at the complex, category and individual fund level, Fund expenses were found to be reasonable relative to both Expense Group and Expense Universe benchmarks. Further, for certain Funds, the independent fee consultant also performed a systematic “focus list” analysis of expenses in the context of the performance or service delivered to each set of investors in each share class in each selected Fund. Based on this analysis, the independent fee consultant found that the combination of service quality/performance and expenses on these individual Funds and share classes were reasonable in light of performance trends, performance histories, and existence of performance fees, breakpoints, and expense waivers on such Funds.
The Trustees considered the methodology used by Janus Capital and each subadviser in determining compensation payable to portfolio managers, the competitive environment for investment management talent, and the competitive market for mutual funds in different distribution channels.
The Trustees also reviewed management fees charged by Janus Capital and each subadviser to comparable separate account clients and to comparable non-affiliated funds subadvised by Janus Capital or by a subadviser (for which Janus Capital or the subadviser provides only or primarily portfolio management services). Although in most instances subadvisory and separate account fee rates for various investment strategies were lower than management fee rates for Funds having a similar strategy, the Trustees considered that Janus Capital noted that, under the terms of the management agreements with the Funds, Janus Capital performs significant additional services for the Funds that it does not provide to those other clients, including administration services, oversight of the Funds’ other service providers, trustee support, regulatory compliance and numerous other services, and that, in serving the Funds, Janus Capital assumes many legal risks and other costs that it does not assume in servicing its other clients. Moreover, they noted that the independent fee consultant found that: (1) the management fees Janus Capital charges to the Funds are reasonable in relation to the management fees Janus Capital charges to its institutional and subadvised accounts; (2) these institutional and subadvised accounts have different service and infrastructure needs; (3) Janus mutual fund investors enjoy reasonable fees relative to the fees charged to Janus institutional and subadvised fund investors; and (4) in the majority of cases, the Funds receive proportionally better pricing than the industry in relation to Janus institutional and subadvised accounts.
The Trustees considered the fees for each Fund for its fiscal year ended in 2015, and noted the following with regard to each Fund’s total expenses, net of applicable fee waivers (the Fund’s “total expenses”):
Fixed-Income Funds and Money Market Funds
· For Janus Henderson Flexible Bond Fund (formerly, Janus Flexible Bond Fund), the Trustees noted that, although the Fund’s total expenses exceeded the peer group average for certain share classes, overall the Fund’s total expenses were reasonable. The Trustees also noted that Janus Capital has contractually agreed to
Janus Henderson VIT Forty Portfolio
Additional Information (unaudited)
limit the Fund’s expenses, although this limit did not apply because the Fund’s total expenses were already below the applicable fee limit.
· For Janus Henderson Global Bond Fund (formerly, Janus Global Bond Fund), the Trustees noted that although the Fund’s total expenses exceeded the peer group average for certain share classes, overall the Fund’s total expenses were reasonable. The Trustees also noted that Janus Capital has contractually agreed to limit the Fund’s expenses.
· For Janus Henderson Global Unconstrained Bond Fund (formerly, Janus Global Unconstrained Bond Fund), the Trustees noted that although the Fund’s total expenses exceeded the peer group average for certain share classes, overall the Fund’s total expenses were reasonable. The Trustees also noted that Janus Capital has contractually agreed to limit the Fund’s expenses.
· For Janus Henderson High-Yield Fund (formerly, Janus High-Yield Fund), the Trustees noted that, although the Fund’s total expenses exceeded the peer group average for certain share classes, overall the Fund’s total expenses were reasonable. The Trustees also noted that Janus Capital has contractually agreed to limit the Fund’s expenses, although this limit did not apply because the Fund’s total expenses were already below the applicable fee limit.
· For Janus Henderson Multi-Sector Income Fund (formerly, Janus Multi-Sector Income Fund), the Trustees noted that, although the Fund’s total expenses exceeded the peer group average for one share class, overall the Fund’s total expenses were reasonable. The Trustees also noted that Janus has contractually agreed to limit the Fund’s expenses.
· For Janus Henderson Real Return Fund (formerly, Janus Real Return Fund), the Trustees noted that, although the Fund’s total expenses were equal to or exceeded the peer group average for all share classes, overall the Fund’s total expenses were reasonable. The Trustees also noted that Janus Capital has contractually agreed to limit the Fund’s expenses.
· For Janus Henderson Short-Term Bond Fund (formerly, Janus Short-Term Bond Fund), the Trustees noted that, although the Fund’s total expenses exceeded the peer group average for certain share classes, overall the Fund’s total expenses were reasonable. The Trustees also noted that Janus Capital has contractually agreed to limit the Fund’s expenses.
· For Janus Henderson Government Money Market Fund (formerly, Janus Government Money Market Fund), the Trustees noted that the Fund’s total expenses exceeded the peer group average for both share classes. The Trustees considered that management fees for this Fund are higher than the peer group average due to the Fund’s management fee including other costs, such as custody and transfer agent services, while many funds in the peer group pay these expenses separately from their management fee. In addition, the Trustees considered that Janus Capital voluntarily waives one-half of its advisory fee and other expenses in order to maintain a positive yield.
· For Janus Henderson Money Market Fund (formerly, Janus Money Market Fund), the Trustees noted that the Fund’s total expenses were below the peer group average for both share classes. In addition, the Trustees considered that Janus Capital voluntarily waives one- half of its advisory fee and other expenses in order to maintain a positive yield.
Asset Allocation Funds
· For Janus Henderson Global Allocation Fund – Conservative (formerly, Janus Global Allocation Fund – Conservative), the Trustees noted that, although the Fund’s total expenses exceeded the peer group median for one share class, overall the Fund’s total expenses were reasonable. The Trustees also noted that Janus Capital has contractually agreed to limit the Fund’s expenses, although this limit did not apply because the Fund’s total expenses were already below the applicable fee limit.
· For Janus Henderson Global Allocation Fund – Growth (formerly, Janus Global Allocation Fund – Growth), the Trustees noted that the Fund’s total expenses were below the peer group average for all share classes.
· For Janus Henderson Global Allocation Fund – Moderate (formerly, Janus Global Allocation Fund – Moderate), the Trustees noted that, although the Fund’s total expenses exceeded the peer group average for one share
Janus Henderson VIT Forty Portfolio
Additional Information (unaudited)
class, overall the Fund’s total expenses were reasonable. The Trustees also noted that Janus Capital has contractually agreed to limit the Fund’s expenses.
Alternative Fund
· For Janus Henderson Diversified Alternatives Fund (formerly, Janus Diversified Alternatives Fund), the Trustees noted that, although the Fund’s total expenses exceeded the peer group average for certain share classes, overall the Fund’s total expenses were reasonable. The Trustees also noted that Janus Capital has contractually agreed to limit the Fund’s expenses.
Value Funds
· For Janus Henderson International Value Fund (formerly, Perkins International Value Fund), the Trustees noted that, although the Fund’s total expenses exceeded the peer group average for one share class, overall the Fund’s total expenses were reasonable. The Trustees also noted that Janus Capital has contractually agreed to limit the Fund’s expenses.
· For Janus Henderson Global Value Fund (formerly, Perkins Global Value Fund), the Trustees noted that the Fund’s total expenses were below the peer group average for all share classes.
· For Janus Henderson Large Cap Value Fund (formerly, Perkins Large Cap Value Fund), the Trustees noted that, although the Fund’s total expenses exceeded the peer group average for one share class, overall the Fund’s total expenses were reasonable. The Trustees also noted that Janus Capital has contractually agreed to limit the Fund’s expenses.
· For Janus Henderson Mid Cap Value Fund (formerly, Perkins Mid Cap Value Fund), the Trustees noted that, although the Fund’s total expenses exceeded the peer group average for one share class, overall the Fund’s total expenses were reasonable. The Trustees also noted that Janus Capital has contractually agreed to limit the Fund’s expenses, although this limit did not apply because the Fund’s total expenses were already below the applicable fee limit.
· For Janus Henderson Select Value Fund (formerly, Perkins Select Value Fund), the Trustees noted that, although the Fund’s total expenses exceeded the peer group average for one share class, overall the Fund’s total expenses were reasonable. The Trustees also noted that Janus Capital has contractually agreed to limit the Fund’s expenses.
· For Janus Henderson Small Cap Value Fund (formerly, Perkins Small Cap Value Fund), the Trustees noted that the Fund’s total expenses were below the peer group average for all share classes.
· For Janus Henderson Value Plus Income Fund (formerly, Perkins Value Plus Income Fund), the Trustees noted that although the Fund’s total expenses exceeded the peer group average for one share class, overall the Fund’s total expenses were reasonable. The Trustees also noted that Janus Capital has contractually agreed to limit the Fund’s expenses.
Mathematical Funds
· For Janus Henderson Emerging Markets Managed Volatility Fund (formerly, INTECH Emerging Markets Managed Volatility Fund), the Trustees noted that although the Fund’s total expenses exceeded the peer group average for one share class, overall the Fund’s total expenses were reasonable. The Trustees also noted that Janus Capital has contractually agreed to limit the Fund’s expenses.
· For Janus Henderson Global Income Managed Volatility Fund (formerly, INTECH Global Income Managed Volatility Fund), the Trustees noted that the Fund’s total expenses were below the peer group average for all share classes.
· For Janus Henderson International Managed Volatility Fund (formerly, INTECH International Managed Volatility Fund), the Trustees noted that although the Fund’s total expenses exceeded the peer group average for one share class, overall the Fund’s total expenses were reasonable. The Trustees also noted that Janus Capital has contractually agreed to limit the Fund’s expenses.
· For Janus Henderson U.S. Managed Volatility Fund (formerly, INTECH U.S. Managed Volatility Fund), the Trustees noted that, although the Fund’s total expenses exceeded the peer group average for one share class,
Janus Henderson VIT Forty Portfolio
Additional Information (unaudited)
overall the Fund’s total expenses were reasonable. The Trustees also noted that Janus Capital has contractually agreed to limit the Fund’s expenses, although this limit did not apply because the Fund’s total expenses were already below the applicable fee limit.
Growth and Core Funds
· For Janus Henderson Balanced Fund (formerly, Janus Balanced Fund), the Trustees noted that, although the Fund’s total expenses exceeded the peer group average for one share class, overall the Fund’s total expenses were reasonable. The Trustees also noted that Janus Capital has contractually agreed to limit the Fund’s expenses, although this limit did not apply because the Fund’s total expenses were already below the applicable fee limit.
· For Janus Henderson Contrarian Fund (formerly, Janus Contrarian Fund), the Trustees noted that, although the Fund’s total expenses exceeded the peer group average for certain share classes, overall the Fund’s total expenses were reasonable. The Trustees also noted that Janus Capital has contractually agreed to limit the Fund’s expenses, although this limit did not apply because the Fund’s total expenses were already below the applicable fee limit.
· For Janus Henderson Enterprise Fund (formerly, Janus Enterprise Fund), the Trustees noted that, although the Fund’s total expenses exceeded the peer group average for one share class, overall the Fund’s total expenses were reasonable. The Trustees also noted that Janus Capital has contractually agreed to limit the Fund’s expenses, although this limit did not apply because the Fund’s total expenses were already below the applicable fee limit.
· For Janus Henderson Forty Fund (formerly, Janus Forty Fund), the Trustees noted that, although the Fund’s total expenses exceeded the peer group average for certain share classes, overall the Fund’s total expenses were reasonable. The Trustees also noted that Janus Capital has contractually agreed to limit the Fund’s expenses, although this limit did not apply because the Fund’s total expenses were already below the applicable fee limit.
· For Janus Henderson Growth and Income Fund (formerly, Janus Growth and Income Fund), the Trustees noted that, although the Fund’s total expenses exceeded the peer group average for certain share classes, overall the Fund’s total expenses were reasonable. The Trustees also noted that Janus Capital has contractually agreed to limit the Fund’s expenses, although this limit did not apply because the Fund’s total expenses were already below the applicable fee limit.
· For Janus Henderson Research Fund (formerly, Janus Research Fund), the Trustees noted that although the Fund’s total expenses exceeded the peer group average for certain share classes, overall the Fund’s total expenses were reasonable.
· For Janus Henderson Triton Fund (formerly, Janus Triton Fund), the Trustees noted that, although the Fund’s total expenses exceeded the peer group average for one share class, overall the Fund’s total expenses were reasonable. The Trustees also noted that Janus Capital has contractually agreed to limit the Fund’s expenses, although this limit did not apply because the Fund’s total expenses were already below the applicable fee limit.
· For Janus Henderson Venture Fund (formerly, Janus Venture Fund), the Trustees noted that, although the Fund’s total expenses exceeded the peer group average for one share class, overall the Fund’s total expenses were reasonable. The Trustees also noted that Janus Capital has contractually agreed to limit the Fund’s expenses, although this limit did not apply because the Fund’s total expenses were already below the applicable fee limit.
Global and International Funds
· For Janus Henderson Adaptive Global Allocation Fund (formerly, Janus Adaptive Global Allocation Fund), the Trustees noted that, although the Fund’s total expenses exceeded the peer group median for certain share classes, overall the Fund’s total expenses were reasonable. The Trustees also noted that Janus Capital has contractually agreed to limit the Fund’s expenses.
· For Janus Henderson Asia Equity Fund (formerly, Janus Asia Equity Fund), the Trustees noted that, although the Fund’s total expenses exceeded the peer group average for one share class, overall the Fund’s total
Janus Henderson VIT Forty Portfolio
Additional Information (unaudited)
expenses were reasonable. The Trustees also noted that Janus Capital has contractually agreed to limit the Fund’s expenses.
· For Janus Henderson Global Life Sciences Fund (formerly, Janus Global Life Sciences Fund), the Trustees noted that the Fund’s total expenses were below the peer group average for all share classes.
· For Janus Henderson Global Real Estate Fund (formerly, Janus Global Real Estate Fund), the Trustees noted that, although the Fund’s total expenses exceeded the peer group average for certain share classes, overall the Fund’s total expenses were reasonable. The Trustees also noted that Janus Capital has contractually agreed to limit the Fund’s expenses, although this limit did not apply because the Fund’s total expenses were already below the applicable fee limit.
· For Janus Henderson Global Research Fund (formerly, Janus Global Research Fund), the Trustees noted that the Fund’s total expenses were below the peer group average for all share classes.
· For Janus Henderson Global Select Fund (formerly, Janus Global Select Fund), the Trustees noted that the Fund’s total expenses were below the peer group average for all share classes.
· For Janus Henderson Global Technology Fund (formerly, Janus Global Technology Fund), the Trustees noted that the Fund’s total expenses were below the peer group average for all share classes.
· For Janus Henderson Overseas Fund (formerly, Janus Overseas Fund), the Trustees noted that the Fund’s total expenses were below the peer group average for all share classes.
Janus Aspen Series
· For Janus Henderson Balanced Portfolio (formerly, Janus Aspen Balanced Portfolio), the Trustees noted that the Fund’s total expenses were below the peer group average for both share classes.
· For Janus Henderson Enterprise Portfolio (formerly, Janus Aspen Enterprise Portfolio), the Trustees noted that the Fund’s total expenses were below the peer group average for both share classes.
· For Janus Henderson Flexible Bond Portfolio (formerly, Janus Aspen Flexible Bond Portfolio), the Trustees noted that, although the Fund’s total expenses exceeded the peer group average for both share classes, overall the Fund’s total expenses were reasonable. The Trustees also noted that Janus Capital has contractually agreed to limit the Fund’s expenses.
· For Janus Henderson Forty Portfolio (formerly, Janus Aspen Forty Portfolio), the Trustees noted that the Fund’s total expenses were below the peer group average for both share classes.
· For Janus Henderson Global Allocation Portfolio – Moderate (formerly, Janus Aspen Global Allocation Portfolio – Moderate), the Trustees noted that, although the Fund’s total expenses exceeded the peer group average for both share classes, overall the Fund’s total expenses were reasonable. The Trustees also noted that Janus Capital has contractually agreed to limit the Fund’s expenses.
· For Janus Henderson Global Research Portfolio (formerly, Janus Aspen Global Research Portfolio), the Trustees noted that the Fund’s total expenses were below the peer group average for both share classes.
· For Janus Henderson Global Technology Portfolio (formerly, Janus Aspen Global Technology Portfolio), the Trustees noted that the Fund’s total expenses were below the peer group average for both share classes.
· For Janus Henderson Global Unconstrained Bond Portfolio (formerly, Janus Aspen Global Unconstrained Bond Portfolio), the Trustees noted that, although the Fund’s total expenses exceeded the peer group average for both share classes, overall the Fund’s total expenses were reasonable. The Trustees also noted that Janus Capital has contractually agreed to limit the Fund’s expenses.
· For Janus Henderson U.S. Low Volatility Portfolio (formerly, Janus Aspen INTECH U.S. Low Volatility Portfolio), the Trustees noted that the Fund’s total expenses were below the peer group average for its sole share class.
· For Janus Henderson Research Portfolio (formerly, Janus Aspen Janus Portfolio), the Trustees noted that the Fund’s total expenses were below the peer group mean for both share classes.
Janus Henderson VIT Forty Portfolio
Additional Information (unaudited)
· For Janus Henderson Overseas Portfolio (formerly, Janus Aspen Overseas Portfolio), the Trustees noted that the Fund’s total expenses were below the peer group average for both share classes.
· For Janus Henderson Mid Cap Value Portfolio (formerly, Janus Aspen Perkins Mid Cap Value Portfolio), the Trustees noted that the Fund’s total expenses were below the peer group average for both share classes.
The Trustees reviewed information on the profitability to Janus Capital and its affiliates of their relationships with each Fund, as well as an explanation of the methodology utilized by Janus Capital when allocating various expenses of Janus Capital and its affiliates with respect to contractual relationships with the Funds and other clients. The Trustees also reviewed the financial statements and corporate structure of Janus Capital’s parent company. In their review, the Trustees considered whether Janus Capital and each subadviser receive adequate incentives and resources to manage the Funds effectively. The Trustees recognized that profitability comparisons among fund managers are difficult because very little comparative information is publicly available, and the profitability of any fund manager is affected by numerous factors, including the organizational structure of the particular fund manager, the types of funds and other accounts it manages, possible other lines of business, the methodology for allocating expenses, and the fund manager’s capital structure and cost of capital. However, taking into account those factors and the analysis provided by the Trustees’ independent fee consultant, and based on the information available, the Trustees concluded that Janus Capital’s profitability with respect to each Fund in relation to the services rendered was reasonable.
The independent fee consultant found that, while assessing the reasonableness of expenses in light of Janus Capital’s profits is dependent on comparisons with other publicly-traded mutual fund advisers, and that these comparisons are limited in accuracy by differences in complex size, business mix, institutional account orientation, and other factors, after accepting these limitations, the level of profit earned by Janus Capital from managing the Funds is reasonable.
The Trustees concluded that the management fees payable by each Fund to Janus Capital and its affiliates, as well as the fees paid by Janus Capital to the subadvisers of subadvised Funds, were reasonable in relation to the nature, extent, and quality of the services provided, taking into account the fees charged by other advisers for managing comparable mutual funds with similar strategies, the fees Janus Capital and the subadvisers charge to other clients, and, as applicable, the impact of fund performance on management fees payable by the Funds. The Trustees also concluded that each Fund’s total expenses were reasonable, taking into account the size of the Fund, the quality of services provided by Janus Capital and any subadviser, the investment performance of the Fund, and any expense limitations agreed to or provided by Janus Capital.
Economies of Scale
The Trustees considered information about the potential for Janus Capital to realize economies of scale as the assets of the Funds increase. They noted their independent fee consultant’s analysis of economies of scale in prior years. They also noted that, although many Funds pay advisory fees at a base fixed rate as a percentage of net assets, without any breakpoints, their independent fee consultant concluded that 91% of these Funds have contractual management fees (gross of waivers) below their Broadridge expense group averages and, overall, 83% of the Funds are below their respective expense group averages for contractual management fees. They also noted that for those Funds whose expenses are being reduced by the contractual expense limitations of Janus Capital, Janus Capital is subsidizing the Funds because they have not reached adequate scale. Moreover, as the assets of some of the Funds have declined in the past few years, certain Funds have benefited from having advisory fee rates that have remained constant rather than increasing as assets declined. In addition, performance fee structures have been implemented for various Funds that have caused the effective rate of advisory fees payable by such a Fund to vary depending on the investment performance of the Fund relative to its benchmark index over the measurement period; and a few Funds have fee schedules with breakpoints and reduced fee rates above certain asset levels. The Trustees also noted that the Funds share directly in economies of scale through the lower charges of third-party service providers that are based in part on the combined scale of all of the Funds. Based on all of the information they reviewed, including past research and analysis conducted by the Trustees’ independent fee consultant, the Trustees concluded that the current fee structure of each Fund was reasonable and that the current rates of fees do reflect a sharing between Janus Capital and the Fund of any economies of scale that may be present at the current asset level of the Fund.
The independent fee consultant concluded that, given the limitations of various analytical approaches to economies of scale considered in prior years, and their conflicting results, its analyses could not confirm or deny the existence of economies of scale in the Janus complex. Further, the independent fee consultant provided its belief that Fund
Janus Henderson VIT Forty Portfolio
Additional Information (unaudited)
investors are well-served by the fee levels and performance fee structures in place on the Funds in light of any economies of scale that may be present at Janus Capital.
Other Benefits to Janus Capital
The Trustees also considered benefits that accrue to Janus Capital and its affiliates and subadvisers to the Funds from their relationships with the Funds. They recognized that two affiliates of Janus Capital separately serve the Funds as transfer agent and distributor, respectively, and the transfer agent receives compensation directly from the non-money market funds for services provided. The Trustees also considered Janus Capital’s past and proposed use of commissions paid by the Funds on portfolio brokerage transactions to obtain proprietary and third-party research products and services benefiting the Fund and/or other clients of Janus Capital and/or Janus Capital, and/or a subadviser to a Fund. The Trustees concluded that Janus Capital’s and the subadvisers’ use of these types of client commission arrangements to obtain proprietary and third-party research products and services was consistent with regulatory requirements and guidelines and was likely to benefit each Fund. The Trustees also concluded that, other than the services provided by Janus Capital and its affiliates and subadvisers pursuant to the agreements and the fees to be paid by each Fund therefor, the Funds and Janus Capital and the subadvisers may potentially benefit from their relationship with each other in other ways. They concluded that Janus Capital and/or the subadvisers benefits from the receipt of research products and services acquired through commissions paid on portfolio transactions of the Funds and that the Funds benefit from Janus Capital’s and/or the subadvisers’ receipt of those products and services as well as research products and services acquired through commissions paid by other clients of Janus Capital and/or other clients of the subadvisers. They further concluded that the success of any Fund could attract other business to Janus Capital, the subadvisers or other Janus funds, and that the success of Janus Capital and the subadvisers could enhance Janus Capital’s and the subadvisers’ ability to serve the Funds.
Janus Henderson VIT Forty Portfolio
Useful Information About Your Portfolio Report (unaudited)
Management Commentary
The Management Commentary in this report includes valuable insight as well as statistical information to help you understand how your Portfolio’s performance and characteristics stack up against those of comparable indices.
If the Portfolio invests in foreign securities, this report may include information about country exposure. Country exposure is based primarily on the country of risk. A company may be allocated to a country based on other factors such as location of the company’s principal office, the location of the principal trading market for the company’s securities, or the country where a majority of the company’s revenues are derived.
Please keep in mind that the opinions expressed in the Management Commentary are just that: opinions. They are a reflection based on best judgment at the time this report was compiled, which was June 30, 2017. As the investing environment changes, so could opinions. These views are unique and are not necessarily shared by fellow employees or by Janus Henderson in general.
Performance Overviews
Performance overview graphs compare the performance of a hypothetical $10,000 investment in the Portfolio with one or more widely used market indices. When comparing the performance of the Portfolio with an index, keep in mind that market indices are not available for investment and do not reflect deduction of expenses.
Average annual total returns are quoted for a Portfolio with more than one year of performance history. Average annual total return is calculated by taking the growth or decline in value of an investment over a period of time, including reinvestment of dividends and distributions, then calculating the annual compounded percentage rate that would have produced the same result had the rate of growth been constant throughout the period. Average annual total return does not reflect the deduction of taxes that a shareholder would pay on Portfolio distributions or redemptions of Portfolio shares.
Cumulative total returns are quoted for a Portfolio with less than one year of performance history. Cumulative total return is the growth or decline in value of an investment over time, independent of the period of time involved. Cumulative total return does not reflect the deduction of taxes that a shareholder would pay on Portfolio distributions or redemptions of Portfolio shares.
Pursuant to federal securities rules, expense ratios shown in the performance chart reflect subsidized (if applicable) and unsubsidized ratios. The total annual fund operating expenses ratio is gross of any fee waivers, reflecting the Portfolio’s unsubsidized expense ratio. The net annual fund operating expenses ratio (if applicable) includes contractual waivers of Janus Capital and reflects the Portfolio’s subsidized expense ratio. Ratios may be higher or lower than those shown in the “Financial Highlights” in this report.
Schedule of Investments
Following the performance overview section is the Portfolio’s Schedule of Investments. This schedule reports the types of securities held in the Portfolio on the last day of the reporting period. Securities are usually listed by type (common stock, corporate bonds, U.S. Government obligations, etc.) and by industry classification (banking, communications, insurance, etc.). Holdings are subject to change without notice.
The value of each security is quoted as of the last day of the reporting period. The value of securities denominated in foreign currencies is converted into U.S. dollars.
If the Portfolio invests in foreign securities, it will also provide a summary of investments by country. This summary reports the Portfolio exposure to different countries by providing the percentage of securities invested in each country. The country of each security represents the country of risk. The Portfolio’s Schedule of Investments relies upon the industry group and country classifications published by Barclays and/or MSCI Inc.
Tables listing details of individual forward currency contracts, futures, written options, swaptions, and swaps follow the Portfolio’s Schedule of Investments (if applicable).
Statement of Assets and Liabilities
This statement is often referred to as the “balance sheet.” It lists the assets and liabilities of the Portfolio on the last day of the reporting period.
Janus Henderson VIT Forty Portfolio
Useful Information About Your Portfolio Report (unaudited)
The Portfolio’s assets are calculated by adding the value of the securities owned, the receivable for securities sold but not yet settled, the receivable for dividends declared but not yet received on securities owned, and the receivable for Portfolio shares sold to investors but not yet settled. The Portfolio’s liabilities include payables for securities purchased but not yet settled, Portfolio shares redeemed but not yet paid, and expenses owed but not yet paid. Additionally, there may be other assets and liabilities such as unrealized gain or loss on forward currency contracts.
The section entitled “Net Assets Consist of” breaks down the components of the Portfolio’s net assets. Because the Portfolio must distribute substantially all earnings, you will notice that a significant portion of net assets is shareholder capital.
The last section of this statement reports the net asset value (“NAV”) per share on the last day of the reporting period. The NAV is calculated by dividing the Portfolio’s net assets for each share class (assets minus liabilities) by the number of shares outstanding.
Statement of Operations
This statement details the Portfolio’s income, expenses, realized gains and losses on securities and currency transactions, and changes in unrealized appreciation or depreciation of Portfolio holdings.
The first section in this statement, entitled “Investment Income,” reports the dividends earned from securities and interest earned from interest-bearing securities in the Portfolio.
The next section reports the expenses incurred by the Portfolio, including the advisory fee paid to the investment adviser, transfer agent fees and expenses, and printing and postage for mailing statements, financial reports and prospectuses. Expense offsets and expense reimbursements, if any, are also shown.
The last section lists the amounts of realized gains or losses from investment and foreign currency transactions, and changes in unrealized appreciation or depreciation of investments and foreign currency-denominated assets and liabilities. The Portfolio will realize a gain (or loss) when it sells its position in a particular security. A change in unrealized gain (or loss) refers to the change in net appreciation or depreciation of the Portfolio during the reporting period. “Net Realized and Unrealized Gain/(Loss) on Investments” is affected both by changes in the market value of Portfolio holdings and by gains (or losses) realized during the reporting period.
Statements of Changes in Net Assets
These statements report the increase or decrease in the Portfolio’s net assets during the reporting period. Changes in the Portfolio’s net assets are attributable to investment operations, dividends and distributions to investors, and capital share transactions. This is important to investors because it shows exactly what caused the Portfolio’s net asset size to change during the period.
The first section summarizes the information from the Statement of Operations regarding changes in net assets due to the Portfolio’s investment operations. The Portfolio’s net assets may also change as a result of dividend and capital gains distributions to investors. If investors receive their dividends and/or distributions in cash, money is taken out of the Portfolio to pay the dividend and/or distribution. If investors reinvest their dividends and/or distributions, the Portfolio’s net assets will not be affected. If you compare the Portfolio’s “Net Decrease from Dividends and Distributions” to “Reinvested Dividends and Distributions,” you will notice that dividends and distributions have little effect on the Portfolio’s net assets. This is because the majority of the Portfolio’s investors reinvest their dividends and/or distributions.
The reinvestment of dividends and distributions is included under “Capital Share Transactions.” “Capital Shares” refers to the money investors contribute to the Portfolio through purchases or withdrawals via redemptions. The Portfolio’s net assets will increase and decrease in value as investors purchase and redeem shares from the Portfolio.
Financial Highlights
This schedule provides a per-share breakdown of the components that affect the Portfolio’s NAV for current and past reporting periods as well as total return, asset size, ratios, and portfolio turnover rate.
The first line in the table reflects the NAV per share at the beginning of the reporting period. The next line reports the net investment income/(loss) per share. Following is the per share total of net gains/(losses), realized and unrealized. Per share dividends and distributions to investors are then subtracted to arrive at the NAV per share at the end of the
Janus Henderson VIT Forty Portfolio
Useful Information About Your Portfolio Report (unaudited)
period. The next line reflects the total return for the period. Also included are ratios of expenses and net investment income to average net assets.
The Portfolio’s expenses may be reduced through expense offsets and expense reimbursements. The ratios shown reflect expenses before and after any such offsets and reimbursements.
The ratio of net investment income/(loss) summarizes the income earned less expenses, divided by the average net assets of the Portfolio during the reporting period. Do not confuse this ratio with the Portfolio’s yield. The net investment income ratio is not a true measure of the Portfolio’s yield because it does not take into account the dividends distributed to the Portfolio’s investors.
The next figure is the portfolio turnover rate, which measures the buying and selling activity in the Portfolio. Portfolio turnover is affected by market conditions, changes in the asset size of the Portfolio, fluctuating volume of shareholder purchase and redemption orders, the nature of the Portfolio’s investments, and the investment style and/or outlook of the portfolio manager(s) and/or investment personnel. A 100% rate implies that an amount equal to the value of the entire portfolio was replaced once during the fiscal year; a 50% rate means that an amount equal to the value of half the portfolio is traded in a year; and a 200% rate means that an amount equal to the value of the entire portfolio is traded every six months.
Janus Henderson VIT Forty Portfolio
Shareholder Meeting (unaudited)
| | | | | | | | | | | |
Special meetings of shareholders were held on April 6, 2017 and adjourned and reconvened on April 18, 2017 (together, the "meeting"). At the meeting, the following matters were voted on and approved by shareholders. Each vote reported represents one dollar of net asset value held on the record date for the meeting. The results of the meeting are noted below. |
| | | | | | | | | | |
Proposals | | | | | | | | | |
1. For all Portfolios, to approve a new investment advisory agreement between the Trust, on behalf of the Portfolio, and Janus Capital Management LLC. |
| | | | | | | | | | |
| Number of Votes ($) | | | | | | |
Record Date Votes ($) | Affirmative | Against | Abstain | BNV | Total | | | | |
707,943,698.351 | 556,600,169.135 | 27,158,670.792 | 45,622,739.881 | (0.017) | 629,381,579.790 | | | | |
| | | | | | | | | | |
| | | | | | | | | | |
Percentage of Total Outstanding Votes (%) | | Percentage Voted (%) |
Affirmative | Against | Abstain | BNV | Total | Affirmative | Against | Abstain | BNV | Total |
78.622 | 3.836 | 6.444 | 0.000 | 88.903 | 88.436 | 4.315 | 7.249 | 0.000 | 100.000 |
| | | | | | | | | | |
| | | | | | | | | | |
4. To elect an additional Trustee to the Board of Trustees of the Trust. - Diane L. Wallace. |
| | | | | | | | | | |
| Number of Votes ($) | | | | | | |
Record Date Votes ($) | Affirmative | Against | Abstain | BNV | Total | | | | |
7,198,647,378.476 | 6,547,141,899.530 | 651,505,478.947 | 0.000 | 0.000 | 7,198,647,378.476 | | | | |
| | | | | | | | | | |
| | | | | | | | | | |
Percentage of Total Outstanding Votes (%) | | Percentage Voted (%) |
Affirmative | Against | Abstain | BNV | Total | Affirmative | Against | Abstain | BNV | Total |
80.347 | 7.995 | 0.000 | 0.000 | 88.343 | 90.950 | 9.050 | 0.000 | 0.000 | 100.000 |
| | | | | | | | | | |
Alan A. Brown, William D. Cvengros, Raudline Etienne, William F. McCalpin, Gary A. Poliner, James T. Rothe, William D. Stewart and Linda S. Wolf continue to serve as Trustees following the meeting. |
| | | | | | | | | | |
| | | | | | | | | | |
5. For all Portfolios, except Global Unconstrained Bond Portfolio, to approve a proposal that would authorize the Adviser to enter into and materially amend sub-advisory agreements in the future with wholly-owned subadvisers and unaffiliated sub-advisers, with the approval of the Board of Trustees of the Trust, but without obtaining additional shareholder approval. |
| | | | | | | | | | |
| Number of Votes ($) | | | | | | |
Record Date Votes ($) | Affirmative | Against | Abstain | BNV | Total | | | | |
707,943,698.351 | 481,385,104.460 | 82,767,258.705 | 65,229,216.623 | 0.003 | 629,381,579.790 | | | | |
| | | | | | | | | | |
| | | | | | | | | | |
Percentage of Total Outstanding Votes (%) | | Percentage Voted (%) |
Affirmative | Against | Abstain | BNV | Total | Affirmative | Against | Abstain | BNV | Total |
67.998 | 11.691 | 9.214 | 0.000 | 88.903 | 76.485 | 13.151 | 10.364 | 0.000 | 100.000 |
Knowledge. Shared
At Janus Henderson, we believe in the sharing of expert insight for better investment and business decisions. We call this ethos Knowledge. Shared.
Learn more by visiting janushenderson.com.
| | | | | | | | | |
| | | | | |

| | | | |
This report is submitted for the general information of shareholders of the Portfolio. It is not an offer or solicitation for the Portfolio and is not authorized for distribution to prospective investors unless preceded or accompanied by an effective prospectus. |
Janus Henderson, Janus, Perkins and INTECH are trademarks or registered trademarks of Janus Henderson Investors. © Janus Henderson Investors. The name Janus Henderson Investors includes HGI Group Limited, Henderson Global Investors (Brand Management) Sarl and Janus International Holding LLC. Portfolios distributed by Janus Henderson Distributors |
| | | | | 109-24-81115 08-17 |
| | | | |
| | | |
| | | SEMIANNUAL REPORT June 30, 2017 |
| | |
| | Janus Henderson VIT Global Allocation Portfolio - Moderate (formerly named Janus Aspen Global Allocation Portfolio - Moderate) |
| | |
| | Janus Aspen Series |
| | | |
| | | HIGHLIGHTS · Portfolio management perspective · Investment strategy behind your portfolio · Portfolio performance, characteristics
and holdings |
| | | 
|
Table of Contents
Janus Henderson VIT Global Allocation Portfolio - Moderate
| | |
Management Commentary and Schedule of Investments | 1 |
Notes to Schedule of Investments and Other Information | 8 |
Statement of Assets and Liabilities | 11 |
Statement of Operations | 12 |
Statements of Changes in Net Assets | 13 |
Financial Highlights | 14 |
Notes to Financial Statements | 15 |
Additional Information | 21 |
Useful Information About Your Portfolio Report | 39 |
Shareholder Meeting | 42 |
Janus Henderson VIT Global Allocation Portfolio - Moderate (unaudited)
| | | | | | |
PORTFOLIO SNAPSHOT This Fund of Funds offers broad global diversification for investors by utilizing the full spectrum of Janus Henderson’s investment expertise and solutions, with the goal of providing higher risk-adjusted returns than the broad markets. | | | | 
Enrique Chang co-portfolio manager | 
Ashwin Alankar co-portfolio manager |
| | | |
PERFORMANCE OVERVIEW
Janus Henderson Global Allocation Portfolio – Moderate’s Institutional Shares and Service Shares returned 8.98% and 8.81%, respectively, for the six-month period ended June 30, 2017. This compares with a return of 11.48% for its primary benchmark, the MSCI All Country World Index, and a 8.61% return for its secondary benchmark, the Global Moderate Allocation Index, an internally calculated, hypothetical combination of total returns from the MSCI All Country World Index (60%) and the Bloomberg Barclays Global Aggregate Bond Index (40%).
MARKET ENVIRONMENT
Risk assets rallied over the period, driven by improving optimism on the potential for synchronized global growth, a scenario that had proven elusive in the years since the Global Financial Crisis. U.S. stock markets continued their rally that started in the wake of November’s elections, when optimism increased that the new administration would enact a pro-growth agenda. European stocks rose as well, although investors exercised caution during France’s election cycle. The ascendency of Emmanuel Macron to the country’s presidency appeared to quell the tide of populism roiling the continent, which, in turn sent regional indices higher. In the aftermath, Germany’s blue chip benchmark hit a record high as did many U.S. indices in the period’s closing weeks. Emerging markets had their own rally, recovering from a sell-off that occurred in the waning months of 2016.
Segments of the global fixed income market diverged at first as a pro-growth bias and the expectation of interest rate hikes by the Federal Reserve (Fed) sent yields on safe-haven U.S. Treasurys higher. After cresting above 2.6% in March, the yield on the 10-year note slid over much of the remainder of the period as investors lowered their expectation for regulatory and tax reforms. The yield on the 2-year note rose over the entirety of the period as that segment of the curve tends to be more sensitive to rate hikes, which occurred twice during the period. Investment-grade corporate credits rallied as spreads on U.S. credits tightened to 109 basis points (bps) by period end. The higher risk high-yield segment of corporates performed well, with spreads finishing June at 364 bps. Benchmark crude oil rose to as high as $56 per barrel but fell by roughly 20% over the period’s final months.
PERFORMANCE DISSCUSSION
Janus Henderson Global Allocation Portfolio – Moderate invests across a broad set of Janus Henderson, INTECH and Perkins funds that span a wide range of global asset categories with a base allocation of 45% to 65% equity investments, 30% to 45% fixed income investments and 5% to 20% alternative investments that are rebalanced quarterly. The Portfolio is structured as a “fund of funds” portfolio that provides investors with broad, diversified exposure to various types of investments with an emphasis on managing investment risk. At the end of the period, the Portfolio had an allocation of 64.8% equities, 26.5% fixed income and 9.1% alternatives.
All components generated positive performance during the period. The strongest individual contributors were the Janus Henderson Overseas Fund and the Janus Henderson Global Bond Fund. Lagging within the portfolio – but still positive – were the Janus Henderson Contrarian Fund and the Janus Henderson Short-Term Bond Fund.
OUTLOOK
We view investment risk as having two components: drawdown risk and upside risk. Of course, while compound returns are most affected by drawdowns (left tail risk), we believe that not participating in upside opportunities (right tail risk) is also risky. During the first two quarters of 2017, investors wrestled with both types of risks. Globally – although the balance sheets of central banks have exploded from a “mere” $3 trillion in 2000, to $19 trillion currently – global growth remains subdued. In the case of the European Central Bank (ECB), it remains the largest single buyer of debt issued by major eurozone
Janus Henderson VIT Global Allocation Portfolio - Moderate (unaudited)
countries (e.g. Germany 17%, France 14% and Italy 12%). The question is: when the ECB slows or – stops – buying, where will the demand for sovereign debt come from?
On the other side of the Atlantic, the Federal Reserve (Fed) has so far increased its benchmark rate by 0.25% twice in 2017 and announced that it will begin to reduce its $4.0 trillion balance sheet later this year. Whether the unwinding can be accomplished in a smooth way is an open question. As important, against tightening monetary conditions, the potential for sudden, intensifying instability in the fixed income markets during the second half of 2017 can’t be ignored. The risk to bonds is moving from inflation to real rates. We believe investors will continue to struggle with rapidly shifting and volatile fixed income markets during the second half of the year.
With regard to equities, the appetite for this higher risk asset class remained strong during the first half of 2017. Indeed, equities surprised to the upside. That said, the earlier market confidence in the Trump administration to quickly pass promised reforms seems to be diminishing. In addition, stretched equity valuations, as well as the fact that a small number of stocks explain much of the equity returns year-to-date, could restrain investors’ appetite in equities in the coming quarters. Thus, investors’ interest for equities, as well as fixed income, could cool considerably during the second half of the year.
Thank you for investing in Janus Henderson Global Allocation Portfolio – Moderate.
Janus Henderson VIT Global Allocation Portfolio - Moderate (unaudited)
Portfolio At A Glance
June 30, 2017
| | | | |
Holdings - (% of Net Assets) | | | |
Janus Henderson Global Bond Fund - Class N Shares | | 21.7 | % |
Janus Henderson Overseas Fund - Class N Shares | | 12.0 | |
Janus Henderson Diversified Alternatives Fund - Class N Shares | | 9.1 | |
Janus Henderson International Value Fund - Class N Shares | | 7.8 | |
Janus Henderson Emerging Markets Fund - Class N Shares | | 6.3 | |
Janus Henderson Global Select Fund - Class I Shares | | 5.3 | |
Janus Henderson Adaptive Global Allocation Fund - Class N Shares | | 5.1 | |
Janus Henderson Short-Term Bond Fund - Class N Shares | | 4.8 | |
Janus Henderson Large Cap Value Fund - Class N Shares | | 4.0 | |
Janus Henderson Small Cap Value Fund - Class N Shares | | 3.8 | |
Janus Henderson Contrarian Fund - Class I Shares | | 3.6 | |
Janus Henderson Triton Fund - Class N Shares | | 3.5 | |
Janus Henderson Global Real Estate Fund - Class I Shares | | 3.3 | |
Janus Henderson International Managed Volatility Fund - Class N Shares | | 3.0 | |
Janus Henderson U.S. Managed Volatility Fund - Class N Shares | | 2.1 | |
Janus Henderson Forty Fund - Class N Shares | | 1.9 | |
Janus Henderson Asia Equity Fund - Class I Shares | | 1.8 | |
Janus Henderson VIT Global Research Portfolio - Institutional Shares | | 1.3 | |
| | | | | |
Asset Allocation - (% of Net Assets) |
Equity Funds | | 64.8% |
Fixed Income Funds | | 26.5% |
Alternative Funds | | 9.1% |
Other | | (0.4)% |
| | | 100.0% |
Janus Henderson VIT Global Allocation Portfolio - Moderate (unaudited)
Performance
| |
See important disclosures on the next page. |

| | | | | | | | | | | |
| | | | | | | | | | |
| | | | | | | | | | Expense Ratios - |
Average Annual Total Return - for the periods ended June 30, 2017 | | | per the May 1, 2017 prospectuses |
| | Fiscal
Year-to-Date | One
Year | Five
Year | Since
Inception* | | | Total Annual Fund
Operating Expenses | Net Annual Fund
Operating Expenses |
Institutional Shares | | 8.98% | 9.86% | 6.88% | 7.23% | | | 1.64% | 0.94% |
Service Shares | | 8.81% | 9.62% | 6.66% | 7.06% | | | 1.91% | 1.19% |
MSCI All Country World Index | | 11.48% | 18.78% | 10.54% | 9.44% | | | | |
Global Moderate Allocation Index | | 8.61% | 9.98% | 6.65% | 5.96% | | | | |
Morningstar Quartile - Institutional Shares | | - | 3rd | 2nd | 2nd | | | | |
Morningstar Ranking - based on total returns for World Allocation Funds | | - | 269/493 | 158/393 | 92/354 | | | | |
Returns quoted are past performance and do not guarantee future results; current performance may be lower or higher. Investment returns and principal value will vary; there may be a gain or loss when shares are sold. For the most recent month-end performance call 877.335.2687 or visit janushenderson.com/VITperformance
Performance may be affected by risks that include those associated with non-diversification, portfolio turnover, short sales, potential conflicts of interest, foreign and emerging markets, initial public offerings (IPOs), high-yield and high-risk securities, undervalued, overlooked and smaller capitalization companies, real estate related securities including Real Estate Investment Trusts (REITs), derivatives, and commodity-linked investments. Each product has different risks. Please see the prospectus for more information about risks, holdings and other details.
Performance of the Global Allocation Portfolio depends on that of the underlying funds. They are subject to the volatility of the financial markets. Because Janus Capital Management is the adviser to the Portfolio and to the underlying affiliated funds held within the Portfolio, it is subject to certain potential conflicts of interest.
Returns shown do not represent actual returns since they do not include insurance charges. Returns shown would have been lower had they included insurance charges.
Returns include reinvestment of all dividends and distributions and do not reflect the deduction of taxes that a shareholder would pay on Portfolio distributions or redemptions of Portfolio shares. The returns do not include adjustments in accordance with generally accepted accounting principles required at the period end for financial reporting purposes.
See Financial Highlights for actual expense ratios during the reporting period.
Janus Henderson VIT Global Allocation Portfolio - Moderate (unaudited)
Performance
Ranking is for the share class shown only; other classes may have different performance characteristics. When an expense waiver is in effect, it may have a material effect on the total return, and therefore the ranking for the period.
© 2017 Morningstar, Inc. All Rights Reserved.
There is no assurance that the investment process will consistently lead to successful investing.
See Notes to Schedule of Investments and Other Information for index definitions.
Index performance does not reflect the expenses of managing a portfolio as an index is unmanaged and not available for direct investment.
See “Useful Information About Your Portfolio Report.”
*The Portfolio’s inception date – August 31, 2011
Janus Henderson VIT Global Allocation Portfolio - Moderate (unaudited)
Expense Examples
As a shareholder of the Portfolio, you incur two types of costs: (1) transaction costs and (2) ongoing costs, including management fees; 12b-1 distribution and shareholder servicing fees (applicable to Service Shares only); transfer agent fees and expenses payable pursuant to the Transfer Agency Agreement; and other Portfolio expenses. This example is intended to help you understand your ongoing costs (in dollars) of investing in the Portfolio and to compare these costs with the ongoing costs of investing in other mutual funds. To do so, compare this 5% hypothetical example with the 5% hypothetical examples that appear in the shareholder reports of the other funds. The example is based upon an investment of $1,000 invested at the beginning of the period and held for the six-months indicated, unless noted otherwise in the table and footnotes below.
Actual Expenses
The information in the table under the heading “Actual” provides information about actual account values and actual expenses. You may use the information in these columns, together with the amount you invested, to estimate the expenses that you paid over the period. Simply divide your account value by $1,000 (for example, an $8,600 account value divided by $1,000 = 8.6), then multiply the result by the number in the appropriate column for your share class under the heading entitled “Expenses Paid During Period” to estimate the expenses you paid on your account during the period.
Hypothetical Example for Comparison Purposes
The information in the table under the heading “Hypothetical (5% return before expenses)” provides information about hypothetical account values and hypothetical expenses based upon the Portfolio’s actual expense ratio and an assumed rate of return of 5% per year before expenses, which is not the Portfolio’s actual return. The hypothetical account values and expenses may not be used to estimate the actual ending account balance or expenses you paid for the period. You may use this information to compare the ongoing costs of investing in the Portfolio and other funds. To do so, compare this 5% hypothetical example with the 5% hypothetical examples that appear in the shareholder reports of the other funds. Additionally, for an analysis of the fees associated with an investment in either share class or other similar funds, please visit www.finra.org/fundanalyzer.
Please note that the expenses shown in the table are meant to highlight your ongoing costs only and do not reflect any transaction costs, such as any charges at the separate account level or contract level. These fees are fully described in the Portfolio’s prospectuses. Therefore, the hypothetical examples are useful in comparing ongoing costs only, and will not help you determine the relative total costs of owning different funds. In addition, if these transaction costs were included, your costs would have been higher.
| | | | | | | | | | | |
| | | | | | | | | |
| | | | Actual | | Hypothetical
(5% return before expenses) | |
| Beginning
Account
Value
(1/1/17) | Ending
Account
Value
(6/30/17) | Expenses
Paid During
Period
(1/1/17 - 6/30/17)† | | Beginning
Account
Value
(1/1/17) | Ending
Account
Value
(6/30/17) | Expenses
Paid During
Period
(1/1/17 - 6/30/17)† | Net Annualized
Expense Ratio
(1/1/17 - 6/30/17)†† |
Institutional Shares | $1,000.00 | $1,089.80 | $1.09 | | $1,000.00 | $1,023.75 | $1.05 | 0.21% |
Service Shares | $1,000.00 | $1,088.10 | $2.33 | | $1,000.00 | $1,022.56 | $2.26 | 0.45% |
† | Expenses Paid During Period are equal to the Net Annualized Expense Ratio multiplied by the average account value over the period, multiplied by 181/365 (to reflect the one-half year period). Expenses in the examples include the effect of applicable fee waivers and/or expense reimbursements, if any. Had such waivers and/or reimbursements not been in effect, your expenses would have been higher. Please refer to the Notes to Financial Statements or the Portfolio’s prospectuses for more information regarding waivers and/or reimbursements. |
†† | Ratios do not include indirect expenses of the underlying funds and/or investment companies in which the Portfolio invests. |
Janus Henderson VIT Global Allocation Portfolio - Moderate
Schedule of Investments (unaudited)
June 30, 2017
| | | | | | | | |
Shares
| | | Value | |
Investment Companies£ – 100.4% | | | |
Alternative Funds – 9.1% | | | |
| | Janus Henderson Diversified Alternatives Fund - Class N Shares | | .59,313 | | | $608,555 | |
Equity Funds – 64.8% | | | |
| | Janus Henderson Adaptive Global Allocation Fund - Class N Shares | | 32,428 | | | 342,759 | |
| | Janus Henderson Asia Equity Fund - Class I Shares | | 10,622 | | | 117,580 | |
| | Janus Henderson Contrarian Fund - Class I Shares | | 12,061 | | | 240,746 | |
| | Janus Henderson Emerging Markets Fund - Class N Shares | | 42,834 | | | 423,633 | |
| | Janus Henderson Forty Fund - Class N Shares | | 3,953 | | | 127,510 | |
| | Janus Henderson Global Real Estate Fund - Class I Shares | | 19,940 | | | 219,541 | |
| | Janus Henderson Global Select Fund - Class I Shares | | 23,345 | | | 352,515 | |
| | Janus Henderson International Managed Volatility Fund - Class N Shares | | 23,712 | | | 200,363 | |
| | Janus Henderson International Value Fund - Class N Shares | | 47,039 | | | 517,904 | |
| | Janus Henderson Large Cap Value Fund - Class N Shares | | 16,362 | | | 268,659 | |
| | Janus Henderson Overseas Fund - Class N Shares | | 26,466 | | | 799,020 | |
| | Janus Henderson Small Cap Value Fund - Class N Shares | | 11,026 | | | 254,587 | |
| | Janus Henderson Triton Fund - Class N Shares | | 8,458 | | | 230,313 | |
| | Janus Henderson U.S. Managed Volatility Fund - Class N Shares | | 13,831 | | | 143,428 | |
| | Janus Henderson VIT Global Research Portfolio - Institutional Shares | | 1,879 | | | 87,592 | |
| | | 4,326,150 | |
Fixed Income Funds – 26.5% | | | |
| | Janus Henderson Global Bond Fund - Class N Shares | | 152,596 | | | 1,452,719 | |
| | Janus Henderson Short-Term Bond Fund - Class N Shares | | 105,752 | | | 319,370 | |
| | | 1,772,089 | |
Total Investments (total cost $6,344,678) – 100.4% | | 6,706,794 | |
Liabilities, net of Cash, Receivables and Other Assets – (0.4)% | | (28,806) | |
Net Assets – 100% | | $6,677,988 | |
| | |
See Notes to Schedule of Investments and Other Information and Notes to Financial Statements. |
| |
Janus Aspen Series | 7 |
Janus Henderson VIT Global Allocation Portfolio - Moderate
Notes to Schedule of Investments and Other Information (unaudited)
| | |
Bloomberg Barclays Global Aggregate Bond Index | Bloomberg Barclays Global Aggregate Bond Index is a broad-based measure of the global investment grade fixed-rate debt markets. |
Global Moderate Allocation Index | Global Moderate Allocation Index is an internally-calculated, hypothetical combination of total returns from the MSCI All Country World IndexSM (60%) and the Bloomberg Barclays Global Aggregate Bond Index (40%). |
MSCI All Country World IndexSM | MSCI All Country World IndexSM reflects the equity market performance of global developed and emerging markets. |
| | |
£ | The Portfolio may invest in certain securities that are considered affiliated companies. As defined by the Investment Company Act of 1940, as amended, an affiliated company is one in which the Portfolio owns 5% or more of the outstanding voting securities, or a company which is under common ownership or control. The following securities were considered affiliated companies for all or some portion of the period ended June 30, 2017. Unless otherwise indicated, all information in the table is for the period ended June 30, 2017. |
| | | | | | | | | | | | | | |
| | Share | | | | | | Share | | | | | | |
| | Balance | | | | | | Balance | | Realized | | Dividend | | Value |
| | at 12/31/16 | | Purchases | | Sales | | at 6/30/17 | | Gain/(Loss) | | Income | | at 6/30/17 |
| | | | | | | | | | | | | | |
Janus Fund - Class N Shares | | |
| | 3,853 | | 65 | | (3,918) | | — | | $8,432 | | $— | | $— |
Janus Henderson Adaptive Global Allocation Fund(1) - Class N Shares | | |
| | 39,604 | | 1,773 | | (8,949) | | 32,428 | | 2,573 | | — | | 342,759 |
Janus Henderson Asia Equity Fund(2) - Class I Shares | | |
| | 2,425 | | 9,710 | | (1,513) | | 10,622 | | 1,632 | | — | | 117,580 |
Janus Henderson Contrarian Fund(3)- Class I Shares | | |
| | 4,423 | | 9,581 | | (1,943) | | 12,061 | | 753 | | — | | 240,746 |
Janus Henderson Diversified Alternatives Fund(4) - Class N Shares | | |
| | 61,733 | | 12,514 | | (14,934) | | 59,313 | | 2,740 | | — | | 608,555 |
Janus Henderson Emerging Markets Fund(5) - Class I Shares | | |
| | 20,660 | | 75,776 | | (96,436) | | — | | 2,840 | | 2,378 | | — |
Janus Henderson Emerging Markets Fund(5) - Class N Shares | | |
| | — | | 43,623 | | (789) | | 42,834 | | (46) | | — | | 423,633 |
Janus Henderson Forty Fund(6) - Class N Shares | | |
| | 4,616 | | 397 | | (1,060) | | 3,953 | | (8,880) | | — | | 127,510 |
Janus Henderson Global Bond Fund(7) - Class N Shares | | |
| | 197,842 | | 10,597 | | (55,843) | | 152,596 | | (43,866) | | 19,642 | | 1,452,719 |
Janus Henderson Global Real Estate Fund(8) - Class I Shares | | |
| | 21,082 | | 3,913 | | (5,055) | | 19,940 | | (488) | | 1,818 | | 219,541 |
Janus Henderson Global Select Fund(9) - Class I Shares | | |
| | 5,054 | | 21,583 | | (3,292) | | 23,345 | | 6,633 | | — | | 352,515 |
Janus Henderson International Managed Volatility Fund(10) - Class N Shares | | |
| | 70,904 | | 2,005 | | (49,197) | | 23,712 | | (25,165) | | — | | 200,363 |
Janus Henderson International Value Fund(11) - Class N Shares | | |
| | — | | 52,301 | | (5,262) | | 47,039 | | 1,252 | | — | | 517,904 |
Janus Henderson Large Cap Value Fund(12) - Class N Shares | | |
| | 47,853 | | 1,365 | | (32,856) | | 16,362 | | 11,695 | | — | | 268,659 |
Janus Henderson Overseas Fund(13) - Class N Shares | | |
| | 8,048 | | 22,460 | | (4,042) | | 26,466 | | (27,460) | | — | | 799,020 |
Janus Henderson VIT Global Allocation Portfolio - Moderate
Notes to Schedule of Investments and Other Information (unaudited)
| | | | | | | | | | | | | | | | | | | | | | | | | | | | | | | | | | | | | | | |
Share | | | | | | Share | | | | | | |
Balance | | | | | | Balance | | Realized | | Dividend | | Value |
at 12/31/16 | | Purchases | | Sales | | at 6/30/17 | | Gain/(Loss) | | Income | | at 6/30/17 |
Janus Henderson Short-Term Bond Fund(14) - Class N Shares | | |
| | 108,287 | | 23,819 | | (26,354) | | 105,752 | | (1,087) | | 2,619 | | 319,370 |
Janus Henderson Small Cap Value Fund(15) - Class N Shares | | |
| | 8,933 | | 4,526 | | (2,433) | | 11,026 | | (1,117) | | — | | 254,587 |
Janus Henderson Triton Fund(16) - Class N Shares | | |
| | 8,581 | | 1,976 | | (2,099) | | 8,458 | | 3,443 | | — | | 230,313 |
Janus Henderson U.S. Managed Volatility Fund(17) - Class N Shares | | |
| | 69,928 | | 1,747 | | (57,844) | | 13,831 | | 136,212 | | 1,031 | | 143,428 |
Janus Henderson VIT Global Research Portfolio(18) - Institutional Shares | | |
| | 2,282 | | 113 | | (516) | | 1,879 | | 3,664 | | 495 | | 87,592 |
Janus International Equity Fund(19) - Class N Shares | | |
| | 73,511 | | 1,242 | | (74,753) | | — | | (45,026) | | — | | — |
Janus Twenty Fund - Class D Shares | | |
| | 1,980 | | 33 | | (2,013) | | — | | (1,180) | | — | | — |
| | | | | | | | | | | | | | | |
Total | | $27,554 | | $27,983 | | $6,706,794 |
(1) Formerly named Janus Adaptive Global Allocation Fund.
(2) Formerly named Janus Asia Equity Fund.
(3) Formerly named Janus Contrarian Fund.
(4) Formerly named Janus Diversified Alternatives Fund.
(5) Formerly named Janus Emerging Markets Fund.
(6) Formerly named Janus Forty Fund.
(7) Formerly named Janus Global Bond Fund.
(8) Formerly named Janus Global Real Estate Fund.
(9) Formerly named Janus Global Select Fund.
(10) Formerly named INTECH International Managed Volatility Fund.
(11) Formerly named Perkins International Value Fund.
(12) Formerly named Perkins Large Cap Value Fund.
(13) Formerly named Janus Overseas Fund
(14) Formerly named Janus Short-Term Bond Fund.
(15) Formerly named Perkins Small Cap Value Fund.
(16) Formerly named Janus Triton Fund.
(17) Formerly named INTECH U.S. Managed Volatility Fund.
(18) Formerly named Janus Aspen Global Research Portfolio.
(19) Formerly named INTECH International Equity Fund.
Janus Henderson VIT Global Allocation Portfolio - Moderate
Notes to Schedule of Investments and Other Information (unaudited)
| | | | | | | | | | | | | |
The following is a summary of the inputs that were used to value the Portfolio’s investments in securities and other financial instruments as of June 30, 2017. See Notes to Financial Statements for more information. |
| |
Valuation Inputs Summary |
| | | | | | | |
| | | | | Level 2 - | | Level 3 - |
| | | Level 1 - | | Other Significant | | Significant |
| | | Quotes Prices | | Observable Inputs | | Unobservable Inputs |
| | | | | | | |
Assets | | | | | | |
Investments in Securities: | | | | | | |
Investment Companies | | | | | | |
Alternative Funds | $ | 608,555 | $ | - | $ | - |
Equity Funds | | 4,326,150 | | - | | - |
Fixed Income Funds | | 1,772,089 | | - | | - |
Total Assets | $ | 6,706,794 | $ | - | $ | - |
| | | | | | | |
Janus Henderson VIT Global Allocation Portfolio - Moderate
Statement of Assets and Liabilities (unaudited)
June 30, 2017
| | | | | | | |
| | | | | | |
Assets: | | | | |
| | Investments, at cost | | $ | 6,344,678 | |
| | Affiliated investments, at value | | | 6,706,794 | |
| | Non-interested Trustees' deferred compensation | | | 121 | |
| | Receivables: | | | | |
| | | Investments sold | | | 98,786 | |
| | | Portfolio shares sold | | | 11,317 | |
| | | Due from adviser | | | 7,151 | |
| | | Dividends from affiliates | | | 4,635 | |
Total Assets | | | 6,828,804 | |
Liabilities: | | | | |
| | Payables: | | | — | |
| | | Portfolio shares repurchased | | | 110,040 | |
| | | Printing fees | | | 18,338 | |
| | | Professional fees | | | 9,359 | |
| | | Investments purchased | | | 4,635 | |
| | | 12b-1 Distribution and shareholder servicing fees | | | 1,464 | |
| | | Transfer agent fees and expenses | | | 428 | |
| | | Advisory fees | | | 296 | |
| | | Non-interested Trustees' deferred compensation fees | | | 121 | |
| | | Portfolio administration fees | | | 56 | |
| | | Non-interested Trustees' fees and expenses | | | 40 | |
| | | Accrued expenses and other payables | | | 6,039 | |
Total Liabilities | | | 150,816 | |
Net Assets | | $ | 6,677,988 | |
Net Assets Consist of: | | | | |
| | Capital (par value and paid-in surplus) | | $ | 6,745,686 | |
| | Undistributed net investment income/(loss) | | | 12,385 | |
| | Undistributed net realized gain/(loss) from investments | | | (442,229) | |
| | Unrealized net appreciation/(depreciation) of investments and non-interested Trustees’ deferred compensation | | | 362,146 | |
Total Net Assets | | $ | 6,677,988 | |
Net Assets - Institutional Shares | | $ | 70,875 | |
| | Shares Outstanding, $0.01 Par Value (unlimited shares authorized) | | | 5,841 | |
Net Asset Value Per Share | | $ | 12.13 | |
Net Assets - Service Shares | | $ | 6,607,113 | |
| | Shares Outstanding, $0.01 Par Value (unlimited shares authorized) | | | 545,963 | |
Net Asset Value Per Share | | $ | 12.10 | |
| | |
See Notes to Financial Statements. |
| |
Janus Aspen Series | 11 |
Janus Henderson VIT Global Allocation Portfolio - Moderate
Statement of Operations (unaudited)
For the period ended June 30, 2017
| | | | | | |
| | | | | |
Investment Income: | | | |
| Dividends from affiliates | $ | 27,983 | |
Total Investment Income | | 27,983 | |
Expenses: | | | |
| | Advisory fees | | 1,717 | |
| | 12b-1Distribution and shareholder servicing fees: | | | |
| | | Service Shares | | 8,462 | |
| | Transfer agent administrative fees and expenses: | | | |
| | | Institutional Shares | | 17 | |
| | | Service Shares | | 1,700 | |
| | Other transfer agent fees and expenses: | | | |
| | | Service Shares | | 411 | |
| | Shareholder reports expense | | 19,188 | |
| | Professional fees | | 12,070 | |
| | Registration fees | | 5,385 | |
| | Accounting systems fee | | 4,210 | |
| | Portfolio administration fees | | 305 | |
| | Non-interested Trustees’ fees and expenses | | 53 | |
| | Other expenses | | 124 | |
Total Expenses | | 53,642 | |
Less: Excess Expense Reimbursement | | (38,181) | |
Net Expenses | | 15,461 | |
Net Investment Income/(Loss) | | 12,522 | |
Net Realized Gain/(Loss) on Investments: | | | |
| | Investments in affiliates | | 27,554 | |
| | Capital gain distributions from underlying funds | | 16,250 | |
Total Net Realized Gain/(Loss) on Investments | | 43,804 | |
Change in Unrealized Net Appreciation/Depreciation: | | | |
| | Investments and non-interested Trustees’ deferred compensation | | 538,747 | |
Total Change in Unrealized Net Appreciation/Depreciation | | 538,747 | |
Net Increase/(Decrease) in Net Assets Resulting from Operations | $ | 595,073 | |
| | | | | | |
| | |
See Notes to Financial Statements. |
| |
12 | JUNE 30, 2017 |
Janus Henderson VIT Global Allocation Portfolio - Moderate
Statements of Changes in Net Assets
| | | | | | | | | |
| | | | | | | | | |
| | | Period ended
June 30, 2017 (unaudited) | | Year ended
December 31, 2016 | |
| | | | | | | | | |
Operations: | | | | | | |
| | Net investment income/(loss) | $ | 12,522 | | $ | 59,028 | |
| | Net realized gain/(loss) on investments | | 43,804 | | | (298,044) | |
| | Change in unrealized net appreciation/depreciation | | 538,747 | | | 517,122 | |
Net Increase/(Decrease) in Net Assets Resulting from Operations | | 595,073 | | | 278,106 | |
Dividends and Distributions to Shareholders: | | | | | | |
| | Dividends from Net Investment Income | | | | | | |
| | | Institutional Shares | | — | | | (864) | |
| | | Service Shares | | — | | | (98,782) | |
| Total Dividends from Net Investment Income | | — | | | (99,646) | |
| | Distributions from Net Realized Gain from Investment Transactions | | | | | | |
| | | Institutional Shares | | — | | | (1,593) | |
| | | Service Shares | | — | | | (245,764) | |
| Total Distributions from Net Realized Gain from Investment Transactions | — | | | (247,357) | |
Net Decrease from Dividends and Distributions to Shareholders | | — | | | (347,003) | |
Capital Share Transactions: | | | | | | |
| | | Institutional Shares | | — | | | 2,457 | |
| | | Service Shares | | (1,400,586) | | | (3,466,751) | |
Net Increase/(Decrease) from Capital Share Transactions | | (1,400,586) | | | (3,464,294) | |
Net Increase/(Decrease) in Net Assets | | (805,513) | | | (3,533,191) | |
Net Assets: | | | | | | |
| | Beginning of period | | 7,483,501 | | | 11,016,692 | |
| End of period | $ | 6,677,988 | | $ | 7,483,501 | |
| | | | | | | | | |
Undistributed Net Investment Income/(Loss) | $ | 12,385 | | $ | (137) | |
| | |
See Notes to Financial Statements. |
| |
Janus Aspen Series | 13 |
Janus Henderson VIT Global Allocation Portfolio - Moderate
Financial Highlights
| | | | | | | | | | | | | | | | | | | | | | |
Institutional Shares | | | | | | | | | | | | | | | | | | |
For a share outstanding during the period ended June 30, 2017 (unaudited) and each year ended December 31 | 2017 | | | 2016 | | | 2015 | | | 2014 | | | 2013 | | | 2012 | |
| | Net Asset Value, Beginning of Period | | $11.13 | | | $11.21 | | | $12.07 | | | $12.28 | | | $11.00 | | | $9.79 | |
| | Income/(Loss) from Investment Operations: | | | | | | | | | | | | | | | | | | |
| | | Net investment income/(loss) | | 0.01(1) | | | 0.13(1) | | | 0.16(1) | | | 0.21(1) | | | 0.17 | | | 0.20 | |
| | | Net realized and unrealized gain/(loss) | | 0.99 | | | 0.22 | | | (0.40) | | | 0.19 | | | 1.47 | | | 1.32 | |
| | Total from Investment Operations | | 1.00 | | | 0.35 | | | (0.24) | | | 0.40 | | | 1.64 | | | 1.52 | |
| | Less Dividends and Distributions: | | | | | | | | | | | | | | | | | | |
| | | Dividends (from net investment income) | | — | | | (0.15) | | | (0.10) | | | (0.35) | | | (0.20) | | | (0.18) | |
| | | Distributions (from capital gains) | | — | | | (0.28) | | | (0.52) | | | (0.26) | | | (0.16) | | | (0.13) | |
| | Total Dividends and Distributions | | — | | | (0.43) | | | (0.62) | | | (0.61) | | | (0.36) | | | (0.31) | |
| | Net Asset Value, End of Period | | $12.13 | | | $11.13 | | | $11.21 | | | $12.07 | | | $12.28 | | | $11.00 | |
| | Total Return* | | 8.98% | | | 3.20% | | | (2.08)% | | | 3.20% | | | 14.90% | | | 15.63% | |
| | Net Assets, End of Period (in thousands) | | $71 | | | $65 | | | $63 | | | $64 | | | $165 | | | $144 | |
| | Average Net Assets for the Period (in thousands) | | $68 | | | $64 | | | $65 | | | $126 | | | $154 | | | $137 | |
| | Ratios to Average Net Assets**: | | | | | | | | | | | | | | | | | | |
| | | Ratio of Gross Expenses(2) | | 1.33% | | | 0.88% | | | 1.18% | | | 1.06% | | | 2.92% | | | 24.54% | |
| | | Ratio of Net Expenses (After Waivers and Expense Offsets)(2) | | 0.21% | | | 0.19% | | | 0.15% | | | 0.39% | | | 0.49% | | | 0.60% | |
| | | Ratio of Net Investment Income/(Loss)(2) | | 0.11% | | | 1.12% | | | 1.35% | | | 1.71% | | | 1.45% | | | 1.87% | |
| | Portfolio Turnover Rate | | 38% | | | 14% | | | 27% | | | 27% | | | 68% | | | 42% | |
| | | | | | | | | | | | | | 1 | | | | | | | | |
| | | | | | | | | | | | | | | | | | | | | | |
Service Shares | | | | | | | | | | | | | | | | | | |
For a share outstanding during the period ended June 30, 2017 (unaudited) and each year ended December 31 | 2017 | | | 2016 | | | 2015 | | | 2014 | | | 2013 | | | 2012 | |
| | Net Asset Value, Beginning of Period | | $11.12 | | | $11.21 | | | $12.08 | | | $12.28 | | | $10.98 | | | $9.79 | |
| | Income/(Loss) from Investment Operations: | | | | | | | | | | | | | | | | | | |
| | | Net investment income/(loss) | | 0.02(1) | | | 0.07(1) | | | 0.13(1) | | | 0.35(1) | | | 0.16 | | | 0.17 | |
| | | Net realized and unrealized gain/(loss) | | 0.96 | | | 0.25 | | | (0.39) | | | 0.05 | | | 1.45 | | | 1.33 | |
| | Total from Investment Operations | | 0.98 | | | 0.32 | | | (0.26) | | | 0.40 | | | 1.61 | | | 1.50 | |
| | Less Dividends and Distributions: | | | | | | | | | | | �� | | | | | | | |
| | | Dividends (from net investment income) | | — | | | (0.13) | | | (0.09) | | | (0.34) | | | (0.15) | | | (0.18) | |
| | | Distributions (from capital gains) | | — | | | (0.28) | | | (0.52) | | | (0.26) | | | (0.16) | | | (0.13) | |
| | Total Dividends and Distributions | | — | | | (0.41) | | | (0.61) | | | (0.60) | | | (0.31) | | | (0.31) | |
| | Net Asset Value, End of Period | | $12.10 | | | $11.12 | | | $11.21 | | | $12.08 | | | $12.28 | | | $10.98 | |
| | Total Return* | | 8.81% | | | 2.95% | | | (2.37)% | | | 3.22% | | | 14.69% | | | 15.44% | |
| | Net Assets, End of Period (in thousands) | | $6,607 | | | $7,418 | | | $10,954 | | | $11,370 | | | $9,694 | | | $603 | |
| | Average Net Assets for the Period (in thousands) | | $6,863 | | | $9,387 | | | $11,534 | | | $10,761 | | | $4,800 | | | $316 | |
| | Ratios to Average Net Assets**: | | | | | | | | | | | | | | | | | | |
| | | Ratio of Gross Expenses(2) | | 1.56% | | | 1.15% | | | 1.42% | | | 1.15% | | | 2.42% | | | 26.76% | |
| | | Ratio of Net Expenses (After Waivers and Expense Offsets)(2) | | 0.45% | | | 0.43% | | | 0.40% | | | 0.47% | | | 0.66% | | | 0.73% | |
| | | Ratio of Net Investment Income/(Loss)(2) | | 0.37% | | | 0.62% | | | 1.11% | | | 2.78% | | | 2.58% | | | 2.78% | |
| | Portfolio Turnover Rate | | 38% | | | 14% | | | 27% | | | 27% | | | 68% | | | 42% | |
| | | | | | | | | | | | | | | | | | | | | | |
| |
* Total return not annualized for periods of less than one full year. ** Annualized for periods of less than one full year. (1) Per share amounts are calculated based on average shares outstanding during the year or period. (2) Ratios do not include indirect expenses of the underlying funds and/or investment companies in which the Portfolio invests. |
| | |
See Notes to Financial Statements. |
| |
14 | JUNE 30, 2017 |
Janus Henderson VIT Global Allocation Portfolio - Moderate
Notes to Financial Statements (unaudited)
1. Organization and Significant Accounting Policies
Janus Henderson VIT Global Allocation Portfolio - Moderate (formerly named Janus Aspen Global Allocation Portfolio - Moderate) (the “Portfolio”) is a series of Janus Aspen Series (the “Trust”), which is organized as a Delaware statutory trust and is registered under the Investment Company Act of 1940, as amended (the “1940 Act”), as an open-end management investment company, and therefore has applied the specialized accounting and reporting guidance in Financial Accounting Standards Board (“FASB”) Accounting Standards Codification (“ASC”) Topic 946. The Portfolio operates as a “fund of funds,” meaning substantially all of the Portfolio’s assets will be invested in other Janus Henderson funds (the “underlying funds”). The Trust offers twelve portfolios, each of which offers multiple share classes, with differing investment objectives and policies. The Portfolio seeks total return through growth of capital and income. The Portfolio is classified as diversified, as defined in the 1940 Act.
The Portfolio currently offers two classes of shares: Institutional Shares and Service Shares. Each class represents an interest in the same portfolio of investments. Institutional Shares are offered only in connection with investment in and payments under variable insurance contracts as well as certain qualified retirement plans. Service Shares are offered only in connection with investment in and payments under variable insurance contracts as well as certain qualified retirement plans that require a fee from Portfolio assets to procure distribution and administrative services to contract owners and plan participants.
Underlying Funds
The Portfolio invests in a variety of underlying funds to pursue a target allocation of equity investments, fixed-income securities, and alternative investments and may also invest in money market instruments or cash/cash equivalents. The Portfolio has a target allocation, which is how the Portfolio's investments generally will be allocated among the major asset classes over the long term, as well as normal ranges, under normal market conditions, within which the Portfolio's asset class allocations generally will vary over short-term periods. The Portfolio's long-term expected average asset allocation is as follows: 55% to equity investments, 35% to fixed-income securities and money market instruments, and 10% to alternative investments. Additional details and descriptions of the investment objectives and strategies of each of the underlying funds are available in the Portfolio’s and underlying funds’ prospectuses available at janushenderson.com. The Trustees of the underlying funds may change the investment objectives or strategies of the underlying funds at any time without prior notice to the Portfolio’s shareholders.
The following accounting policies have been followed by the Portfolio and are in conformity with accounting principles generally accepted in the United States of America.
Investment Valuation
The Portfolio’s net asset value (“NAV”) is calculated based upon the NAV of each of the underlying funds in which the Portfolio invests on the day of valuation. The NAV for each class of the underlying funds is computed by dividing the total value of securities and other assets allocated to the class, less liabilities allocated to that class, by the total number of shares outstanding for the class.
Valuation Inputs Summary
FASB ASC 820, Fair Value Measurements and Disclosures (“ASC 820”), defines fair value, establishes a framework for measuring fair value, and expands disclosure requirements regarding fair value measurements. This standard emphasizes that fair value is a market-based measurement that should be determined based on the assumptions that market participants would use in pricing an asset or liability and establishes a hierarchy that prioritizes inputs to valuation techniques used to measure fair value. These inputs are summarized into three broad levels:
Level 1 – Unadjusted quoted prices in active markets the Portfolio has the ability to access for identical assets or liabilities.
The Portfolio classifies each of its investments in underlying funds as Level 1, without consideration as to the classification level of the specific investments held by the underlying funds.
Level 2 – Observable inputs other than unadjusted quoted prices included in Level 1 that are observable for the asset or liability either directly or indirectly. These inputs may include quoted prices for the identical instrument on an inactive market, prices for similar instruments, interest rates, prepayment speeds, credit risk, yield curves, default rates and similar data.
Janus Henderson VIT Global Allocation Portfolio - Moderate
Notes to Financial Statements (unaudited)
Level 3 – Unobservable inputs for the asset or liability to the extent that relevant observable inputs are not available, representing the Portfolio’s own assumptions about the assumptions that a market participant would use in valuing the asset or liability, and that would be based on the best information available.
There have been no significant changes in valuation techniques used in valuing any such positions held by the Portfolio since the beginning of the fiscal year.
The inputs or methodology used for fair valuing securities are not necessarily an indication of the risk associated with investing in those securities. The summary of inputs used as of June 30, 2017 to fair value the Portfolio’s investments in securities and other financial instruments is included in the “Valuation Inputs Summary” in the Notes to Schedule of Investments and Other Information.
There were no transfers between Level 1, Level 2 and Level 3 of the fair value hierarchy during the period. The Portfolio recognizes transfers between the levels as of the beginning of the fiscal year.
Investment Transactions and Investment Income
Investment transactions are accounted for as of the date purchased or sold (trade date). Dividend income is recorded on the ex-dividend date. Certain dividends from foreign securities held by the underlying funds will be recorded as soon as the Portfolio is informed of the dividend, if such information is obtained subsequent to the ex-dividend date. Dividends from foreign securities may be subject to withholding taxes in foreign jurisdictions. Any distributions from the underlying funds are recorded in accordance with the character of the distributions as designated by the underlying funds. Gains and losses are determined on the identified cost basis, which is the same basis used for federal income tax purposes. Income, as well as gains and losses, both realized and unrealized, are allocated daily to each class of shares based upon the ratio of net assets represented by each class as a percentage of total net assets.
Expenses
The Portfolio bears expenses incurred specifically on its behalf. Additionally, the Portfolio, as a shareholder in the underlying funds, will also indirectly bear its pro rata share of the expenses incurred by the underlying funds. Each class of shares bears a portion of general expenses, which are allocated daily to each class of shares based upon the ratio of net assets represented by each class as a percentage of total net assets. Expenses directly attributable to a specific class of shares are charged against the operations of such class.
Estimates
The preparation of financial statements in conformity with accounting principles generally accepted in the United States of America requires management to make estimates and assumptions that affect the reported amount of assets and liabilities and disclosure of contingent assets and liabilities at the date of the financial statements, and the reported amounts of income and expenses during the reporting period. Actual results could differ from those estimates.
Indemnifications
In the normal course of business, the Portfolio may enter into contracts that contain provisions for indemnification of other parties against certain potential liabilities. The Portfolio’s maximum exposure under these arrangements is unknown, and would involve future claims that may be made against the Portfolio that have not yet occurred. Currently, the risk of material loss from such claims is considered remote.
Dividends and Distributions
The Portfolio may make semiannual distributions of substantially all of its investment income and an annual distribution of its net realized capital gains (if any).
The underlying funds may make certain investments in real estate investment trusts (“REITs”) which pay dividends to their shareholders based upon funds available from operations. It is quite common for these dividends to exceed the REITs’ taxable earnings and profits, resulting in the excess portion of such dividends being designated as a return of capital. If the underlying funds distribute such amounts, such distributions could constitute a return of capital to shareholders for federal income tax purposes.
Federal Income Taxes
The Portfolio intends to continue to qualify as a regulated investment company and distribute all of its taxable income in accordance with the requirements of Subchapter M of the Internal Revenue Code. Management has analyzed the Portfolio’s tax positions taken for all open federal income tax years, generally a three-year period, and has concluded that no provision for federal income tax is required in the Portfolio’s financial statements. The Portfolio is not aware of
Janus Henderson VIT Global Allocation Portfolio - Moderate
Notes to Financial Statements (unaudited)
any tax positions for which it is reasonably possible that the total amounts of unrecognized tax benefits will significantly change in the next twelve months.
2. Investment Advisory Agreements and Other Transactions with Affiliates
The Portfolio pays Janus Capital an investment advisory fee which is calculated daily and paid monthly. The Portfolio’s contractual investment advisory fee rate (expressed as an annual rate) is 0.05% of its average daily net assets.
Janus Capital has contractually agreed to waive the advisory fee payable by the Portfolio or reimburse expenses in an amount equal to the amount, if any, that the Portfolio’s normal operating expenses, including the investment advisory fee, but excluding any expenses of an underlying fund (acquired fund fees and expenses), the 12b-1 distribution and shareholder servicing fees (applicable to Service Shares), transfer agent fees and expenses payable pursuant to the Transfer Agency Agreement, brokerage commissions, interest, dividends, taxes, acquired fund fees and expenses, and extraordinary expenses, exceed the annual rate of 0.14% of the Portfolio’s average daily net assets. Janus Capital has agreed to continue the waivers until at least May 1, 2018. If applicable, amounts reimbursed to the Portfolio by Janus Capital are disclosed as “Excess Expense Reimbursement” on the Statement of Operations.
Janus Services LLC (“Janus Services”), a wholly-owned subsidiary of Janus Capital, is the Portfolio’s transfer agent. Effective May 1, 2016, Janus Services receives an administrative services fee at an annual rate of 0.05% of the average daily net assets of the Portfolio for arranging for the provision by participating insurance companies and qualified plan service providers of administrative services, including recordkeeping, subaccounting, order processing, or other shareholder services provided on behalf of contract holders or plan participants investing in the Portfolio. Other shareholder services may include the provision of order confirmations, periodic account statements, forwarding prospectuses, shareholder reports, and other materials to existing investors, and answering inquiries regarding accounts. Janus Services expects to use this entire fee to compensate insurance companies and qualified plan service providers for providing these services to their customers who invest in the Portfolio. Any unused portion will be reimbursed to the applicable share class at least annually.
In addition, Janus Services provides or arranges for the provision of certain other internal administrative, recordkeeping, and shareholder relations services for the Portfolio. Janus Services is not compensated for these internal services related to the shares, except for out-of-pocket costs. These amounts are disclosed as “Other transfer agent fees and expenses” on the Statement of Operations.
Under a distribution and shareholder servicing plan (the “Plan”) adopted in accordance with Rule 12b-1 under the 1940 Act, the Service Shares may pay the Trust’s distributor, Janus Distributors LLC (“Janus Distributors”), a wholly-owned subsidiary of Janus Capital, a fee for the sale and distribution and/or shareholder servicing of the Service Shares at an annual rate of up to 0.25% of the average daily net assets of the Service Shares. Under the terms of the Plan, the Trust is authorized to make payments to Janus Distributors for remittance to insurance companies and qualified plan service providers as compensation for distribution and/or shareholder services performed by such entities. These amounts are disclosed as “12b-1 Distribution and shareholder servicing fees” on the Statement of Operations. Payments under the Plan are not tied exclusively to actual 12b-1 distribution and servicing fees, and the payments may exceed 12b-1 distribution and servicing fees actually incurred. If any of the Portfolio’s actual 12b-1 distribution and servicing fees incurred during a calendar year are less than the payments made during a calendar year, the Portfolio will be refunded the difference. Refunds, if any, are included in “12b-1 Distribution and shareholder servicing fees” in the Statement of Operations.
Janus Capital furnishes certain administration, compliance, and accounting services for the Portfolio and is reimbursed by the Portfolio for certain of its costs in providing those services (to the extent Janus Capital seeks reimbursement and such costs are not otherwise waived). In addition, employees of Janus Capital and/or its affiliates may serve as officers of the Trust. The Portfolio also pays for some or all of the salaries, fees, and expenses of certain Janus Capital employees and Portfolio officers, with respect to certain specified administration functions they perform on behalf of the Portfolio. The Portfolio pays these costs based on out-of-pocket expenses incurred by Janus Capital, and these costs are separate and apart from advisory fees and other expenses paid in connection with the investment advisory services Janus Capital provides to the Portfolio. These amounts are disclosed as “Portfolio administration fees” on the Statement of Operations. Some expenses related to compensation payable to the Portfolio's Chief Compliance Officer and compliance staff are shared with the Portfolio. Total compensation of $1,138 was paid to the Chief Compliance Officer and certain compliance staff by the Trust during the period ended June 30, 2017. The Portfolio's portion is reported as part of “Other expenses” on the Statement of Operations.