Derivatives may generally be traded OTC or on an exchange. Derivatives traded OTC are agreements that are individually negotiated between parties and can be tailored to meet a purchaser’s needs. OTC derivatives are not guaranteed by a clearing agency and may be subject to increased credit risk.
In an effort to mitigate credit risk associated with derivatives traded OTC, the Portfolio may enter into collateral agreements with certain counterparties whereby, subject to certain minimum exposure requirements, the Portfolio may require the counterparty to post collateral if the Portfolio has a net aggregate unrealized gain on all OTC derivative contracts with a particular counterparty. Additionally, the Portfolio may deposit cash and/or treasuries as collateral with the counterparty and/or custodian daily (based on the daily valuation of the financial asset) if the Portfolio has a net aggregate unrealized loss on OTC derivative contracts with a particular counterparty. All liquid securities and restricted cash are considered to cover in an amount at all times equal to or greater than the Portfolio’s commitment with respect to certain exchange-traded derivatives, centrally cleared derivatives, forward foreign currency exchange contracts, short sales, and/or securities with extended settlement dates. There is no guarantee that counterparty exposure is reduced and these arrangements are dependent on Janus Capital's ability to establish and maintain appropriate systems and trading.
A futures contract is an exchange-traded agreement to take or make delivery of an underlying asset at a specific time in the future for a specific predetermined negotiated price. The Portfolio may enter into futures contracts to gain exposure to the stock market or other markets pending investment of cash balances or to meet liquidity needs. The Portfolio is subject to interest rate risk, equity risk, and currency risk in the normal course of pursuing its investment objective through its investments in futures contracts. The Portfolio may also use such derivative instruments to hedge or protect from adverse movements in securities prices, currency rates or interest rates. The use of futures contracts may involve risks such as the possibility of illiquid markets or imperfect correlation between the values of the contracts and the underlying securities, or that the counterparty will fail to perform its obligations.
Futures contracts on commodities are valued at the settlement price on valuation date on the commodities exchange as reported by an approved vendor. Mini contracts, as defined in the description of the contract, shall be valued using the Actual Settlement Price or “ASET” price type as reported by an approved vendor. In the event that foreign futures trade when the foreign equity markets are closed, the last foreign futures trade price shall be used.
Futures contracts are marked-to-market daily, and the daily variation margin is recorded as a receivable or payable on the Statement of Assets and Liabilities (if applicable). The change in unrealized net appreciation/depreciation is
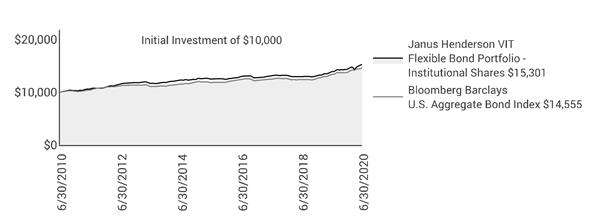
Janus Henderson VIT Flexible Bond Portfolio
Notes to Financial Statements (unaudited)
reported on the Statement of Operations (if applicable). When a contract is closed, a realized gain or loss is reported on the Statement of Operations (if applicable), equal to the difference between the opening and closing value of the contract.
Securities held by the Portfolio that are designated as collateral for market value on futures contracts are noted on the Schedule of Investments (if applicable). Such collateral is in the possession of the Portfolio’s futures commission merchant.
With futures, there is minimal counterparty credit risk to the Portfolio since futures are exchange-traded and the exchange’s clearinghouse, as counterparty to all exchange-traded futures, guarantees the futures against default.
During the period, the Portfolio purchased interest rate futures to increase exposure to interest rate risk.
During the period, the Portfolio sold interest rate futures to decrease exposure to interest rate risk.
3. Other Investments and Strategies
Additional Investment Risk
The Portfolio may be invested in lower-rated debt securities that have a higher risk of default or loss of value since these securities may be sensitive to economic changes, political changes, or adverse developments specific to the issuer.
In the aftermath of the 2007-2008 financial crisis, the financial sector experienced reduced liquidity in credit and other fixed-income markets, and an unusually high degree of volatility, both domestically and internationally. In response to the crisis, the United States and certain foreign governments, along with the U.S. Federal Reserve and certain foreign central banks, took a number of unprecedented steps designed to support the financial markets. For example, the enactment of the Dodd-Frank Act in 2010 provided for widespread regulation of financial institutions, consumer financial products and services, broker-dealers, over-the-counter derivatives, investment advisers, credit rating agencies, and mortgage lending, which expanded federal oversight in the financial sector, including the investment management industry. More recently, in response to the COVID-19 pandemic, the U.S. government and the Federal Reserve, as well as certain foreign governments and central banks, have taken extraordinary actions to support local and global economies and the financial markets, including reducing interest rates to record low levels. The withdrawal of this support, a failure of measures put in place in response to such economic uncertainty, or investor perception that such efforts were not sufficient could each negatively affect financial markets generally, and the value and liquidity of specific securities. In addition, policy and legislative changes in the United States and in other countries continue to impact many aspects of financial regulation.
Widespread disease, including pandemics and epidemics, and natural or environmental disasters, such as earthquakes, fires, floods, hurricanes, tsunamis and weather-related phenomena generally, have been and can be highly disruptive to economies and markets, adversely impacting individual companies, sectors, industries, markets, currencies, interest and inflation rates, credit ratings, investor sentiment, and other factors affecting the value of a Fund’s investments. Economies and financial markets throughout the world have become increasingly interconnected, which increases the likelihood that events or conditions in one region or country will adversely affect markets or issuers in other regions or countries, including the United States. These disruptions could prevent a Fund from executing advantageous investment decisions in a timely manner and negatively impact a Fund’s ability to achieve its investment objective(s). Any such event(s) could have a significant adverse impact on the value of a Fund. In addition, these disruptions could also impair the information technology and other operational systems upon which the Fund’s service providers, including Janus Capital or the subadviser (as applicable), rely, and could otherwise disrupt the ability of employees of the Fund’s service providers to perform essential tasks on behalf of the Fund.
A number of countries in the European Union (“EU”) have experienced, and may continue to experience, severe economic and financial difficulties. In particular, many EU nations are susceptible to economic risks associated with high levels of debt. Many non-governmental issuers, and even certain governments, have defaulted on, or been forced to restructure, their debts. Many other issuers have faced difficulties obtaining credit or refinancing existing obligations. Financial institutions have in many cases required government or central bank support, have needed to raise capital, and/or have been impaired in their ability to extend credit. As a result, financial markets in the EU have experienced extreme volatility and declines in asset values and liquidity. Responses to these financial problems by European governments, central banks, and others, including austerity measures and reforms, may not work, may result in social unrest, and may limit future growth and economic recovery or have other unintended consequences. The risk of
Janus Henderson VIT Flexible Bond Portfolio
Notes to Financial Statements (unaudited)
investing in securities in the European markets may also be heightened due to the referendum in which the United Kingdom voted to exit the EU (commonly known as “Brexit”). The United Kingdom formally left the EU on January 31, 2020 and entered into an eleven-month transition period, during which the United Kingdom will remain subject to EU laws and regulations. There is considerable uncertainty relating to the potential consequences of the United Kingdom’s exit and how negotiations for new trade agreements will be conducted or concluded.
Certain areas of the world have historically been prone to and economically sensitive to environmental events such as, but not limited to, hurricanes, earthquakes, typhoons, flooding, tidal waves, tsunamis, erupting volcanoes, wildfires or droughts, tornadoes, mudslides, or other weather-related phenomena. Such disasters, and the resulting physical or economic damage, could have a severe and negative impact on the Portfolio’s investment portfolio and, in the longer term, could impair the ability of issuers in which the Portfolio invests to conduct their businesses as they would under normal conditions. Adverse weather conditions may also have a particularly significant negative effect on issuers in the agricultural sector and on insurance and reinsurance companies that insure or reinsure against the impact of natural disasters.
LIBOR Replacement Risk
The Portfolio may invest in certain debt securities, derivatives or other financial instruments that utilize the London Interbank Offered Rate (LIBOR) as a reference rate for various rate calculations. On July 27, 2017, the U.K. Financial Conduct Authority announced that it intends to stop compelling or inducing banks to submit LIBOR rates after 2021. However, it remains unclear if LIBOR will continue to exist in its current, or a modified, form. Actions by regulators have resulted in the establishment of alternative reference rates to LIBOR in most major currencies. The U.S. Federal Reserve, based on the recommendations of the New York Federal Reserve’s Alternative Reference Rate Committee (comprised of major derivative market participants and their regulators), has begun publishing a Secured Overnight Financing Rate (SOFR), that is intended to replace U.S. dollar LIBOR. Proposals for alternative reference rates for other currencies have also been announced or have already begun publication. However, global consensus on alternative rates is lacking. The elimination of LIBOR or changes to other reference rates or any other changes or reforms to the determination or supervision of reference rates could adversely impact (i) volatility and liquidity in markets that are tied to LIBOR, (ii) the market for, or value of, specific securities or payments linked to those reference rates, (iii) availability or terms of borrowing or refinancing, or (iv) the effectiveness of hedging strategies. For these and other reasons, the elimination of LIBOR or changes to other interest rates may adversely affect the Portfolio’s performance and/or net asset value. Since the usefulness of LIBOR as a benchmark could deteriorate during the transition period, these effects could occur prior to the end of 2021. Markets are slowly developing in response to these new rates. Uncertainty regarding the process for amending existing contracts or instruments to transition away from LIBOR remains a concern for the Portfolio. The effect of any changes to, or discontinuation of, LIBOR on the Portfolio will vary depending, among other things, on (1) existing fallback or termination provisions in individual contracts and (2) whether, how, and when industry participants develop and adopt new reference rates and fallbacks for both legacy and new products and instruments. Accordingly, it is difficult to predict the full impact of the transition away from LIBOR on the Portfolio until new reference rates and fallbacks for both legacy and new products, instruments and contracts are commercially accepted.
Counterparties
Portfolio transactions involving a counterparty are subject to the risk that the counterparty or a third party will not fulfill its obligation to the Portfolio (“counterparty risk”). Counterparty risk may arise because of the counterparty’s financial condition (i.e., financial difficulties, bankruptcy, or insolvency), market activities and developments, or other reasons, whether foreseen or not. A counterparty’s inability to fulfill its obligation may result in significant financial loss to the Portfolio. The Portfolio may be unable to recover its investment from the counterparty or may obtain a limited recovery, and/or recovery may be delayed. The extent of the Portfolio’s exposure to counterparty risk with respect to financial assets and liabilities approximates its carrying value.
The Portfolio may be exposed to counterparty risk through participation in various programs, including, but not limited to, lending its securities to third parties, cash sweep arrangements whereby the Portfolio’s cash balance is invested in one or more types of cash management vehicles, as well as investments in, but not limited to, repurchase agreements, debt securities, and derivatives, including various types of swaps, futures and options. The Portfolio intends to enter into financial transactions with counterparties that Janus Capital Management LLC (“Janus Capital”) believes to be creditworthy at the time of the transaction. There is always the risk that Janus Capital’s analysis of a counterparty’s creditworthiness is incorrect or may change due to market conditions. To the extent that the Portfolio focuses its
Janus Henderson VIT Flexible Bond Portfolio
Notes to Financial Statements (unaudited)
transactions with a limited number of counterparties, it will have greater exposure to the risks associated with one or more counterparties.
Loans
The Portfolio may invest in various commercial loans, including bank loans, bridge loans, debtor-in-possession (“DIP”) loans, mezzanine loans, and other fixed and floating rate loans. These loans may be acquired through loan participations and assignments or on a when-issued basis. Commercial loans will comprise no more than 20% of the Portfolio’s total assets. Below are descriptions of the types of loans held by the Portfolio as of June 30, 2020.
· Bank Loans - Bank loans are obligations of companies or other entities entered into in connection with recapitalizations, acquisitions, and refinancings. The Portfolio’s investments in bank loans are generally acquired as a participation interest in, or assignment of, loans originated by a lender or other financial institution. These investments may include institutionally-traded floating and fixed-rate debt securities.
· Floating Rate Loans – Floating rate loans are debt securities that have floating interest rates, that adjust periodically, and are tied to a benchmark lending rate, such as London Interbank Offered Rate (“LIBOR”). In other cases, the lending rate could be tied to the prime rate offered by one or more major U.S. banks or the rate paid on large certificates of deposit traded in the secondary markets. If the benchmark lending rate changes, the rate payable to lenders under the loan will change at the next scheduled adjustment date specified in the loan agreement. Floating rate loans are typically issued to companies (‘‘borrowers’’) in connection with recapitalizations, acquisitions, and refinancings. Floating rate loan investments are generally below investment grade. Senior floating rate loans are secured by specific collateral of a borrower and are senior in the borrower’s capital structure. The senior position in the borrower’s capital structure generally gives holders of senior loans a claim on certain of the borrower’s assets that is senior to subordinated debt and preferred and common stock in the case of a borrower’s default. Floating rate loan investments may involve foreign borrowers, and investments may be denominated in foreign currencies. Floating rate loans often involve borrowers whose financial condition is troubled or uncertain and companies that are highly leveraged. The Portfolio may invest in obligations of borrowers who are in bankruptcy proceedings. While the Portfolio generally expects to invest in fully funded term loans, certain of the loans in which the Portfolio may invest include revolving loans, bridge loans, and delayed draw term loans.
Purchasers of floating rate loans may pay and/or receive certain fees. The Portfolio may receive fees such as covenant waiver fees or prepayment penalty fees. The Portfolio may pay fees such as facility fees. Such fees may affect the Portfolio’s return.
· Mezzanine Loans - Mezzanine loans are secured by the stock of the company that owns the assets. Mezzanine loans are a hybrid of debt and equity financing that is typically used to fund the expansion of existing companies. A mezzanine loan is composed of debt capital that gives the lender the right to convert to an ownership or equity interest in the company if the loan is not paid back in time and in full. Mezzanine loans typically are the most subordinated debt obligation in an issuer’s capital structure.
Mortgage- and Asset-Backed Securities
Mortgage- and asset-backed securities represent interests in “pools” of commercial or residential mortgages or other assets, including consumer loans or receivables. The Portfolio may purchase fixed or variable rate commercial or residential mortgage-backed securities issued by the Government National Mortgage Association (“Ginnie Mae”), the Federal National Mortgage Association (“Fannie Mae”), the Federal Home Loan Mortgage Corporation (“Freddie Mac”), or other governmental or government-related entities. Ginnie Mae’s guarantees are backed by the full faith and credit of the U.S. Government, which means that the U.S. Government guarantees that the interest and principal will be paid when due. Fannie Mae and Freddie Mac securities are not backed by the full faith and credit of the U.S. Government. In September 2008, the Federal Housing Finance Agency (“FHFA”), an agency of the U.S. Government, placed Fannie Mae and Freddie Mac under conservatorship. Since that time, Fannie Mae and Freddie Mac have received capital support through U.S. Treasury preferred stock purchases, and Treasury and Federal Reserve purchases of their mortgage-backed securities. The FHFA and the U.S. Treasury have imposed strict limits on the size of these entities’ mortgage portfolios. The FHFA has the power to cancel any contract entered into by Fannie Mae and Freddie Mac prior to FHFA’s appointment as conservator or receiver, including the guarantee obligations of Fannie Mae and Freddie Mac.
The Portfolio may also purchase other mortgage- and asset-backed securities through single- and multi-seller conduits, collateralized debt obligations, structured investment vehicles, and other similar securities. Asset-backed securities may
Janus Henderson VIT Flexible Bond Portfolio
Notes to Financial Statements (unaudited)
be backed by various consumer obligations, including automobile loans, equipment leases, credit card receivables, or other collateral. In the event the underlying loans are not paid, the securities’ issuer could be forced to sell the assets and recognize losses on such assets, which could impact your return. Unlike traditional debt instruments, payments on these securities include both interest and a partial payment of principal. Mortgage- and asset-backed securities are subject to both extension risk, where borrowers pay off their debt obligations more slowly in times of rising interest rates, and prepayment risk, where borrowers pay off their debt obligations sooner than expected in times of declining interest rates. These risks may reduce the Portfolio’s returns. In addition, investments in mortgage- and asset-backed securities, including those comprised of subprime mortgages, may be subject to a higher degree of credit risk, valuation risk, and liquidity risk than various other types of fixed-income securities. Additionally, although mortgage-backed securities are generally supported by some form of government or private guarantee and/or insurance, there is no assurance that guarantors or insurers will meet their obligations.
Real Estate Investing
The Portfolio may invest in equity and debt securities of real estate-related companies. Such companies may include those in the real estate industry or real estate-related industries. These securities may include common stocks, corporate bonds, preferred stocks, and other equity securities, including, but not limited to, mortgage-backed securities, real estate-backed securities, securities of REITs and similar REIT-like entities. A REIT is a trust that invests in real estate-related projects, such as properties, mortgage loans, and construction loans. REITs are generally categorized as equity, mortgage, or hybrid REITs. A REIT may be listed on an exchange or traded OTC.
Securities Lending
Under procedures adopted by the Trustees, the Portfolio may seek to earn additional income by lending securities to certain qualified broker-dealers and institutions. Effective December 16, 2019, JPMorgan Chase Bank, National Association replaced Deutsche Bank AG as securities lending agent for the Portfolio. JPMorgan Chase Bank, National Association acts as securities lending agent and a limited purpose custodian or subcustodian to receive and disburse cash balances and cash collateral, hold short-term investments, hold collateral, and perform other custodial functions in accordance with the Non-Custodial Securities Lending Agreement. The Portfolio may lend portfolio securities in an amount equal to up to 1/3 of its total assets as determined at the time of the loan origination. There is the risk of delay in recovering a loaned security or the risk of loss in collateral rights if the borrower fails financially. In addition, Janus Capital makes efforts to balance the benefits and risks from granting such loans. All loans will be continuously secured by collateral which may consist of cash, U.S. Government securities, domestic and foreign short-term debt instruments, letters of credit, time deposits, repurchase agreements, money market mutual funds or other money market accounts, or such other collateral as permitted by the Securities and Exchange Commission (the "SEC"). If the Portfolio is unable to recover a security on loan, the Portfolio may use the collateral to purchase replacement securities in the market. There is a risk that the value of the collateral could decrease below the cost of the replacement security by the time the replacement investment is made, resulting in a loss to the Portfolio. In certain circumstances individual loan transactions could yield negative returns.
Upon receipt of cash collateral, Janus Capital may invest it in affiliated or non-affiliated cash management vehicles, whether registered or unregistered entities, as permitted by the 1940 Act and rules promulgated thereunder. Janus Capital currently intends to primarily invest the cash collateral in a cash management vehicle for which Janus Capital serves as investment adviser, Janus Henderson Cash Collateral Fund LLC. An investment in Janus Henderson Cash Collateral Fund LLC is generally subject to the same risks that shareholders experience when investing in similarly structured vehicles, such as the potential for significant fluctuations in assets as a result of the purchase and redemption activity of the securities lending program, a decline in the value of the collateral, and possible liquidity issues. Such risks may delay the return of the cash collateral and cause the Portfolio to violate its agreement to return the cash collateral to a borrower in a timely manner. As adviser to the Portfolio and Janus Henderson Cash Collateral Fund LLC, Janus Capital has an inherent conflict of interest as a result of its fiduciary duties to both the Portfolio and Janus Henderson Cash Collateral Fund LLC. Additionally, Janus Capital receives an investment advisory fee of 0.05% for managing Janus Henderson Cash Collateral Fund LLC, but it may not receive a fee for managing certain other affiliated cash management vehicles in which the Portfolio may invest, and therefore may have an incentive to allocate preferred investment opportunities to investment vehicles for which it is receiving a fee.
The value of the collateral must be at least 102% of the market value of the loaned securities that are denominated in U.S. dollars and 105% of the market value of the loaned securities that are not denominated in U.S. dollars. Loaned securities and related collateral are marked-to-market each business day based upon the market value of the loaned
Janus Henderson VIT Flexible Bond Portfolio
Notes to Financial Statements (unaudited)
securities at the close of business, employing the most recent available pricing information. Collateral levels are then adjusted based on this mark-to-market evaluation.
The cash collateral invested by Janus Capital is disclosed in the Schedule of Investments (if applicable). Income earned from the investment of the cash collateral, net of rebates paid to, or fees paid by, borrowers and less the fees paid to the lending agent are included as “Affiliated securities lending income, net” on the Statement of Operations.
There were no securities on loan as of June 30, 2020.
Sovereign Debt
The Portfolio may invest in U.S. and non-U.S. government debt securities (“sovereign debt”). Some investments in sovereign debt, such as U.S. sovereign debt, are considered low risk. However, investments in sovereign debt, especially the debt of less developed countries, can involve a high degree of risk, including the risk that the governmental entity that controls the repayment of sovereign debt may not be willing or able to repay the principal and/or to pay the interest on its sovereign debt in a timely manner. A sovereign debtor’s willingness or ability to satisfy its debt obligation may be affected by various factors including, but not limited to, its cash flow situation, the extent of its foreign currency reserves, the availability of foreign exchange when a payment is due, the relative size of its debt position in relation to its economy as a whole, the sovereign debtor’s policy toward international lenders, and local political constraints to which the governmental entity may be subject. Sovereign debtors may also be dependent on expected disbursements from foreign governments, multilateral agencies, and other entities. The failure of a sovereign debtor to implement economic reforms, achieve specified levels of economic performance, or repay principal or interest when due may result in the cancellation of third party commitments to lend funds to the sovereign debtor, which may further impair such debtor’s ability or willingness to timely service its debts. The Portfolio may be requested to participate in the rescheduling of such sovereign debt and to extend further loans to governmental entities, which may adversely affect the Portfolio’s holdings. In the event of default, there may be limited or no legal remedies for collecting sovereign debt and there may be no bankruptcy proceedings through which the Portfolio may collect all or part of the sovereign debt that a governmental entity has not repaid. In addition, to the extent the Portfolio invests in non-U.S. sovereign debt, it may be subject to currency risk.
TBA Commitments
The Portfolio may enter into “to be announced” or “TBA” commitments. TBAs are forward agreements for the purchase or sale of securities, including mortgage-backed securities, for a fixed price, with payment and delivery on an agreed upon future settlement date. The specific securities to be delivered are not identified at the trade date. However, delivered securities must meet specified terms, including issuer, rate, and mortgage terms. Although the particular TBA securities must meet industry-accepted “good delivery” standards, there can be no assurance that a security purchased on forward commitment basis will ultimately be issued or delivered by the counterparty. During the settlement period, the Portfolio will still bear the risk of any decline in the value of the security to be delivered. Because TBA commitments do not require the purchase and sale of identical securities, the characteristics of the security delivered to the Portfolio may be less favorable than the security delivered to the dealer. If the counterparty to a transaction fails to deliver the security, the Portfolio could suffer a loss.
When-Issued, Delayed Delivery and Forward Commitment Transactions
The Portfolio may purchase or sell securities on a when-issued, delayed delivery, or forward commitment basis. When purchasing a security on a when-issued, delayed delivery, or forward commitment basis, the Portfolio assumes the rights and risks of ownership of the security, including the risk of price and yield fluctuations, and takes such fluctuations into account when determining its net asset value. Typically, no income accrues on securities the Portfolio has committed to purchase prior to the time delivery of the securities is made. Because the Portfolio is not required to pay for the security until the delivery date, these risks are in addition to the risks associated with the Portfolio’s other investments. If the other party to a transaction fails to deliver the securities, the Portfolio could miss a favorable price or yield opportunity. If the Portfolio remains substantially fully invested at a time when when-issued, delayed delivery, or forward commitment purchases are outstanding, the purchases may result in a form of leverage.
When the Portfolio has sold a security on a when-issued, delayed delivery, or forward commitment basis, the Portfolio does not participate in future gains or losses with respect to the security. If the other party to a transaction fails to pay for the securities, the Portfolio could suffer a loss. Additionally, when selling a security on a when-issued, delayed delivery, or forward commitment basis without owning the security, the Portfolio will incur a loss if the security’s price appreciates in value such that the security’s price is above the agreed upon price on the settlement date. The Portfolio
Janus Henderson VIT Flexible Bond Portfolio
Notes to Financial Statements (unaudited)
may dispose of or renegotiate a transaction after it is entered into, and may purchase or sell when-issued, delayed delivery or forward commitment securities before the settlement date, which may result in a gain or loss.
4. Investment Advisory Agreements and Other Transactions with Affiliates
The Portfolio pays Janus Capital an investment advisory fee which is calculated daily and paid monthly. The following table reflects the Portfolio’s contractual investment advisory fee rate (expressed as an annual rate).
| | |
Average Daily Net Assets of the Portfolio | Contractual Investment Advisory Fee (%) |
First $300 Million | 0.55 |
Over $300 Million | 0.45 |
The Fund’s actual investment advisory fee rate for the reporting period was 0.50% of average annual net assets before any applicable waivers.
Janus Capital has contractually agreed to waive the advisory fee payable by the Portfolio or reimburse expenses in an amount equal to the amount, if any, that the Portfolio’s total annual fund operating expenses, including the investment advisory fee, but excluding the 12b-1 distribution and shareholder servicing fees (applicable to Service Shares), transfer agent fees and expenses payable pursuant to the Transfer Agency Agreement, brokerage commissions, interest, dividends, taxes, acquired fund fees and expenses, and extraordinary expenses, exceed the annual rate of 0.52% of the Portfolio’s average daily net assets. Janus Capital has agreed to continue the waivers for at least a one-year period commencing April 29, 2020. The previous expense limit (until at least May 1, 2020) was 0.57%. If applicable, amounts waived and/or reimbursed to the Portfolio by Janus Capital are disclosed as “Excess Expense Reimbursement and Waivers” on the Statement of Operations.
Janus Services LLC (“Janus Services”), a wholly-owned subsidiary of Janus Capital, is the Portfolio’s transfer agent. Janus Services receives an administrative services fee at an annual rate of 0.05% of the average daily net assets of the Portfolio for arranging for the provision by participating insurance companies and qualified plan service providers of administrative services, including recordkeeping, subaccounting, order processing, or other shareholder services provided on behalf of contract holders or plan participants investing in the Portfolio. Other shareholder services may include the provision of order confirmations, periodic account statements, forwarding prospectuses, shareholder reports, and other materials to existing investors, and answering inquiries regarding accounts. Janus Services expects to use this entire fee to compensate insurance companies and qualified plan service providers for providing these services to their customers who invest in the Portfolio. Any unused portion will be reimbursed to the applicable share class at least annually.
In addition, Janus Services provides or arranges for the provision of certain other internal administrative, recordkeeping, and shareholder relations services for the Portfolio. Janus Services is not compensated for these internal services related to the shares, except for out-of-pocket costs. These amounts are disclosed as “Other transfer agent fees and expenses” on the Statement of Operations.
Under a distribution and shareholder servicing plan (the “Plan”) adopted in accordance with Rule 12b-1 under the 1940 Act, the Service Shares may pay the Trust’s distributor, Janus Distributors LLC (“Janus Distributors”), a wholly-owned subsidiary of Janus Capital, a fee for the sale and distribution and/or shareholder servicing of the Service Shares at an annual rate of up to 0.25% of the average daily net assets of the Service Shares. Under the terms of the Plan, the Trust is authorized to make payments to Janus Distributors for remittance to insurance companies and qualified plan service providers as compensation for distribution and/or shareholder services performed by such entities. These amounts are disclosed as “12b-1 Distribution and shareholder servicing fees” on the Statement of Operations. Payments under the Plan are not tied exclusively to actual 12b-1 distribution and servicing fees, and the payments may exceed 12b-1 distribution and servicing fees actually incurred. If any of the Portfolio’s actual 12b-1 distribution and servicing fees incurred during a calendar year are less than the payments made during a calendar year, the Portfolio will be refunded the difference. Refunds, if any, are included in “12b-1 Distribution and shareholder servicing fees” in the Statement of Operations.
Janus Capital serves as administrator to the Portfolio pursuant to an administration agreement between Janus Capital and the Trust. Under the administration agreement, Janus Capital is obligated to provide or arrange for the provision of certain administration, compliance, and accounting services to the Portfolio, including providing office space for the
Janus Henderson VIT Flexible Bond Portfolio
Notes to Financial Statements (unaudited)
Portfolio, and is reimbursed by the Portfolio for certain of its costs in providing these services (to the extent Janus Capital seeks reimbursement and such costs are not otherwise waived). In addition, employees of Janus Capital and/or its affiliates may serve as officers of the Trust. The Portfolio pays for some or all of the salaries, fees, and expenses of Janus Capital employees and Portfolio officers, with respect to certain specified administration functions they perform on behalf of the Portfolio. The Portfolio pays these costs based on out-of-pocket expenses incurred by Janus Capital, and these costs are separate and apart from advisory fees and other expenses paid in connection with the investment advisory services Janus Capital (or any subadvisor, as applicable) provides to the Portfolio. These amounts are disclosed as “Affiliated portfolio administration fees” on the Statement of Operations. In addition, some expenses related to compensation payable to the Portfolio’s Chief Compliance Officer and certain compliance staff, all of whom are employees of Janus Capital and/or its affiliates, are shared with the Portfolio. Total compensation of $20,422 was paid to the Chief Compliance Officer and certain compliance staff by the Trust during the period ended June 30, 2020. The Portfolio's portion is reported as part of “Other expenses” on the Statement of Operations.
The Board of Trustees has adopted a deferred compensation plan (the “Deferred Plan”) for independent Trustees to elect to defer receipt of all or a portion of the annual compensation they are entitled to receive from the Portfolio. All deferred fees are credited to an account established in the name of the Trustees. The amounts credited to the account then increase or decrease, as the case may be, in accordance with the performance of one or more of the Janus Henderson funds that are selected by the Trustees. The account balance continues to fluctuate in accordance with the performance of the selected fund or funds until final payment of all amounts are credited to the account. The fluctuation of the account balance is recorded by the Portfolio as unrealized appreciation/(depreciation) and is included as of June 30, 2020 on the Statement of Assets and Liabilities in the asset, “Non-interested Trustees’ deferred compensation,” and liability, “Non-interested Trustees’ deferred compensation fees.” Additionally, the recorded unrealized appreciation/(depreciation) is included in “Total distributable earnings (loss)” on the Statement of Assets and Liabilities. Deferred compensation expenses for the period ended June 30, 2020 are included in “Non-interested Trustees’ fees and expenses” on the Statement of Operations. Trustees are allowed to change their designation of mutual funds from time to time. Amounts will be deferred until distributed in accordance with the Deferred Plan. Deferred fees of $220,425 were paid by the Trust to the Trustees under the Deferred Plan during the period ended June 30, 2020.
Pursuant to the provisions of the 1940 Act and related rules, the Portfolio may participate in an affiliated or non-affiliated cash sweep program. In the cash sweep program, uninvested cash balances of the Portfolio may be used to purchase shares of affiliated or non-affiliated money market funds or cash management pooled investment vehicles that operate as money market funds. The Portfolio is eligible to participate in the cash sweep program (the “Investing Funds”). As adviser, Janus Capital has an inherent conflict of interest because of its fiduciary duties to the affiliated money market funds or cash management pooled investment vehicles and the Investing Funds. Janus Henderson Cash Liquidity Fund LLC (the “Sweep Vehicle”) is an affiliated unregistered cash management pooled investment vehicle that invests primarily in highly-rated short-term fixed-income securities. The Sweep Vehicle operates pursuant to the provisions of the 1940 Act that govern the operation of money market funds and prices its shares at NAV reflecting market-based values of its portfolio securities (i.e., a “floating” NAV) rounded to the fourth decimal place (e.g., $1.0000). The Sweep Vehicle is permitted to impose a liquidity fee (of up to 2%) on redemptions from the Sweep Vehicle or a redemption gate that temporarily suspends redemptions from the Sweep Vehicle for up to 10 business days during a 90 day period. There are no restrictions on the Portfolio's ability to withdraw investments from the Sweep Vehicle at will, and there are no unfunded capital commitments due from the Portfolio to the Sweep Vehicle. The Sweep Vehicle does not charge any management fee, sales charge or service fee.
Any purchases and sales, realized gains/losses and recorded dividends from affiliated investments during the period ended June 30, 2020 can be found in the “Schedules of Affiliated Investments” located in the Schedule of Investments.
The Portfolio is permitted to purchase or sell securities (“cross-trade”) between itself and other funds or accounts managed by Janus Capital in accordance with Rule 17a-7 under the Investment Company Act of 1940 (“Rule 17a-7”), when the transaction is consistent with the investment objectives and policies of the Portfolio and in accordance with the Internal Cross Trade Procedures adopted by the Trust’s Board of Trustees. These procedures have been designed to ensure that any cross-trade of securities by the Portfolio from or to another fund or account that is or could be considered an affiliate of the Portfolio under certain limited circumstances by virtue of having a common investment adviser, common Officer, or common Trustee complies with Rule 17a-7. Under these procedures, each cross-trade is effected at the current market price to save costs where allowed. During the period ended June 30, 2020, the Portfolio engaged in cross trades amounting to $2,833,951 in purchases and $6,480,238 in sales, resulting in a net realized
Janus Henderson VIT Flexible Bond Portfolio
Notes to Financial Statements (unaudited)
gain of $377,704. The net realized gain is included within the “Net Realized Gain/(Loss) on Investments” section of the Portfolio’s Statement of Operations.
5. Federal Income Tax
Income and capital gains distributions are determined in accordance with income tax regulations that may differ from US GAAP. These differences are due to differing treatments for items such as net short-term gains, deferral of wash sale losses, foreign currency transactions, net investment losses, and capital loss carryovers.
The Portfolio has elected to treat gains and losses on forward foreign currency contracts as capital gains and losses, if applicable. Other foreign currency gains and losses on debt instruments are treated as ordinary income for federal income tax purposes pursuant to Section 988 of the Internal Revenue Code.
Accumulated capital losses noted below represent net capital loss carryovers, as of December 31, 2019, that may be available to offset future realized capital gains and thereby reduce future taxable gains distributions. The following table shows these capital loss carryovers.
| | | | | | |
| | | | | |
Capital Loss Carryover Schedule | | |
For the year ended December 31, 2019 | | |
| No Expiration | | | |
| Short-Term | Long-Term | Accumulated
Capital Losses | | |
| $(11,564,717) | $ - | $ (11,564,717) | | |
The aggregate cost of investments and the composition of unrealized appreciation and depreciation of investment securities for federal income tax purposes as of June 30, 2020 are noted below. The primary differences between book and tax appreciation or depreciation of investments are wash sale loss deferrals and investments in partnerships.
| | | | |
Federal Tax Cost | Unrealized
Appreciation | Unrealized
(Depreciation) | Net Tax Appreciation/
(Depreciation) |
$ 575,213,779 | $30,903,893 | $ (3,275,141) | $ 27,628,752 |
Information on the tax components of derivatives as of June 30, 2020 is as follows:
| | | | |
Federal Tax Cost | Unrealized
Appreciation | Unrealized
(Depreciation) | Net Tax Appreciation/
(Depreciation) |
$ - | $ 3,445 | $ - | $ 3,445 |
Tax cost of investments and unrealized appreciation/(depreciation) may also include timing differences that do not constitute adjustments to tax basis.
Janus Henderson VIT Flexible Bond Portfolio
Notes to Financial Statements (unaudited)
6. Capital Share Transactions
| | | | | | | |
| | | | | | |
| | Period ended June 30, 2020 | | Year ended December 31, 2019 |
| | Shares | Amount | | Shares | Amount |
| | | | | | | |
Institutional Shares: | | | | | |
Shares sold | 1,100,560 | $ 13,318,197 | | 1,563,012 | $ 18,348,907 |
Reinvested dividends and distributions | 218,380 | 2,705,722 | | 562,738 | 6,558,390 |
Shares repurchased | (2,492,758) | (30,152,242) | | (9,884,146) | (115,751,110) |
Net Increase/(Decrease) | (1,173,818) | $(14,128,323) | | (7,758,396) | $(90,843,813) |
Service Shares: | | | | | |
Shares sold | 4,832,165 | $ 64,171,455 | | 5,747,545 | $ 73,366,642 |
Reinvested dividends and distributions | 436,460 | 5,927,120 | | 856,061 | 10,929,187 |
Shares repurchased | (5,154,954) | (67,990,031) | | (7,526,222) | (95,483,811) |
Net Increase/(Decrease) | 113,671 | $ 2,108,544 | | (922,616) | $(11,187,982) |
7. Purchases and Sales of Investment Securities
For the period ended June 30, 2020, the aggregate cost of purchases and proceeds from sales of investment securities (excluding any short-term securities, short-term options contracts, TBAs, and in-kind transactions, as applicable) was as follows:
| | | | |
Purchases of
Securities | Proceeds from Sales
of Securities | Purchases of Long-
Term U.S. Government
Obligations | Proceeds from Sales
of Long-Term U.S.
Government Obligations |
$305,388,744 | $ 294,214,973 | $ 179,227,422 | $ 204,503,450 |
8. Recent Accounting Pronouncements
The FASB issued Accounting Standards Update No. 2017-08, Receivables – Nonrefundable Fees and Other Costs (Subtopic 310-20), Premium Amortization on Purchased Callable Debt Securities ("ASU 2017-08") to amend the amortization period for certain purchased callable debt securities held at a premium. The guidance requires certain premiums on callable debt securities to be amortized to the earliest call date. The amortization period for callable debt securities purchased at a discount will not be impacted. The amendments are effective for fiscal years and interim periods within those fiscal years, beginning after December 15, 2018. Management has adopted the amendments as of the beginning of this fiscal period and concluded these changes do not have a material impact on the Portfolio’s financial statements.
The FASB issued Accounting Standards Update 2018-13, Fair Value Measurement (Topic 820), in August 2018. The new guidance removes, modifies and enhances the disclosures to Topic 820. For public entities, the amendments are effective for financial statements issued for fiscal years beginning after December 15, 2019, and interim periods within those fiscal years. An entity is permitted, and Management has decided, to early adopt the removed and modified disclosures in these financial statements. Management is also evaluating the implications related to the new disclosure requirements and has not yet determined the impact to the financial statements.
The FASB issued Accounting Standards Update 2020-04 Reference Rate Reform: Facilitation of the Effects of Reference Rate Reform on Financial Reporting (“ASU 2020-04”) in March 2020. The new guidance in the ASU provide optional temporary financial reporting relief from the effect of certain types of contract modifications due to the planned discontinuation of the LIBOR or other interbank-offered based reference rates as of the end of 2021. For new and existing contracts, Portfolios may elect to apply the guidance as of March 12, 2020 through December 31, 2022. Management is currently evaluating the impact, if any, of the ASU’s adoption to the Portfolio’s financial statements.
9. Other Matters
An outbreak of infectious respiratory illness caused by a novel coronavirus known as COVID-19 was first detected in China in December 2019 and has now been declared a pandemic by the World Health Organization. The impact of COVID-19 has been, and may continue to be, highly disruptive to economies and markets, adversely impacting
Janus Henderson VIT Flexible Bond Portfolio
Notes to Financial Statements (unaudited)
individual companies, sectors, industries, markets, currencies, interest and inflation rates, credit ratings, investor sentiment, and other factors affecting the value of a Portfolio's investments. This may impact liquidity in the marketplace, which in turn may affect the Portfolio's ability to meet redemption requests. Public health crises caused by the COVID-19 pandemic may exacerbate other pre-existing political, social, and economic risks in certain countries or globally. The duration of the COVID-19 pandemic and its effects cannot be determined with certainty, and could prevent a Portfolio from executing advantageous investment decisions in a timely manner and negatively impact a Portfolio's ability to achieve its investment objective.
10. Subsequent Event
Management has evaluated whether any events or transactions occurred subsequent to June 30, 2020 and through the date of issuance of the Portfolio’s financial statements and determined that there were no material events or transactions that would require recognition or disclosure in the Portfolio’s financial statements.
Janus Henderson VIT Flexible Bond Portfolio
Additional Information (unaudited)
Proxy Voting Policies and Voting Record
A description of the policies and procedures that the Portfolio uses to determine how to vote proxies relating to its portfolio securities is available without charge: (i) upon request, by calling 1-800-525-1093; (ii) on the Portfolio’s website at janushenderson.com/proxyvoting; and (iii) on the SEC’s website at http://www.sec.gov. Additionally, information regarding the Portfolio’s proxy voting record for the most recent twelve-month period ended June 30 is also available, free of charge, through janushenderson.com/proxyvoting and from the SEC’s website at http://www.sec.gov.
Full Holdings
The Portfolio is required to disclose its complete holdings as an exhibit to Form N-PORT within 60 days of the end of the first and third fiscal quarters, and in the annual report and semiannual report to Portfolio shareholders. Historically, the Portfolio filed its complete portfolio holdings (schedule of investments) with the SEC for the first and third quarters each fiscal year on Form N-Q. The Portfolio’s Form N-PORT and Form N-Q filings: (i) are available on the SEC’s website at http://www.sec.gov; (ii) may be reviewed and copied at the SEC’s Public Reference Room in Washington, D.C. (information on the Public Reference Room may be obtained by calling 1-800-SEC-0330); and (iii) are available without charge, upon request, by calling a Janus Henderson representative at 1-877-335-2687 (toll free) . Portfolio holdings consisting of at least the names of the holdings are generally available on a monthly basis with a 30-day lag. Holdings are generally posted approximately two business days thereafter under Full Holdings for the Portfolio at janushenderson.com/vit.
APPROVAL OF ADVISORY AGREEMENTS DURING THE PERIOD
The Trustees of Janus Aspen Series, each of whom serves as an “independent” Trustee (the “Trustees”), oversee the management of each Portfolio of Janus Aspen Series (each, a “VIT Portfolio,” and collectively, the “VIT Portfolios”), as well as each Fund of Janus Investment Fund (together with the VIT Portfolios, the “Janus Henderson Funds,” and each, a “Janus Henderson Fund”). As required by law, the Trustees determine annually whether to continue the investment advisory agreement for each Janus Henderson Fund and the subadvisory agreements for the Janus Henderson Funds that utilize subadvisers.
In connection with their most recent consideration of those agreements for each Janus Henderson Fund, the Trustees received and reviewed information provided by Janus Capital and the respective subadvisers in response to requests of the Trustees and their independent legal counsel. They also received and reviewed information and analysis provided by, and in response to requests of, their independent fee consultant. Throughout their consideration of the agreements, the Trustees were advised by their independent legal counsel. The Trustees met with management to consider the agreements, and also met separately in executive session with their independent legal counsel and their independent fee consultant.
At a meeting held on December 5, 2019, based on the Trustees’ evaluation of the information provided by Janus Capital, the subadvisers, and the independent fee consultant, as well as other information, the Trustees determined that the overall arrangements between each Janus Henderson Fund and Janus Capital and each subadviser, as applicable, were fair and reasonable in light of the nature, extent and quality of the services provided by Janus Capital, its affiliates and the subadvisers, the fees charged for those services, and other matters that the Trustees considered relevant in the exercise of their business judgment. At that meeting, the Trustees unanimously approved the continuation of the investment advisory agreement for each Janus Henderson Fund, and the subadvisory agreement for each subadvised Janus Henderson Fund, for the period from February 1, 2020 through February 1, 2021, subject to earlier termination as provided for in each agreement.
In considering the continuation of those agreements, the Trustees reviewed and analyzed various factors that they determined were relevant, including the factors described below, none of which by itself was considered dispositive. However, the material factors and conclusions that formed the basis for the Trustees’ determination to approve the continuation of the agreements are discussed separately below. Also included is a summary of the independent fee consultant’s conclusions and opinions that arose during, and were included as part of, the Trustees’ consideration of the agreements. “Management fees,” as used herein, reflect actual annual advisory fees and, for the purpose of peer comparisons, any administration fees (excluding out of pocket costs), net of any waivers, paid by a fund as a percentage of average net assets.
Janus Henderson VIT Flexible Bond Portfolio
Additional Information (unaudited)
Nature, Extent and Quality of Services
The Trustees reviewed the nature, extent and quality of the services provided by Janus Capital and the subadvisers to the Janus Henderson Funds, taking into account the investment objective, strategies and policies of each Janus Henderson Fund, and the knowledge the Trustees gained from their regular meetings with management on at least a quarterly basis and their ongoing review of information related to the Janus Henderson Funds. In addition, the Trustees reviewed the resources and key personnel of Janus Capital and each subadviser, particularly noting those employees who provide investment and risk management services to the Janus Henderson Funds. The Trustees also considered other services provided to the Janus Henderson Funds by Janus Capital or the subadvisers, such as managing the execution of portfolio transactions and the selection of broker-dealers for those transactions. The Trustees considered Janus Capital’s role as administrator to the Janus Henderson Funds, noting that Janus Capital generally does not receive a fee for its services but is reimbursed for its out-of-pocket costs. The Trustees considered the role of Janus Capital in monitoring adherence to the Janus Henderson Funds’ investment restrictions, providing support services for the Trustees and Trustee committees, and overseeing communications with shareholders and the activities of other service providers, including monitoring compliance with various policies and procedures of the Janus Henderson Funds and with applicable securities laws and regulations.
In this regard, the independent fee consultant noted that Janus Capital provides a number of different services for the Janus Henderson Funds and fund shareholders, ranging from investment management services to various other servicing functions, and that, in its view, Janus Capital is a capable provider of those services. The independent fee consultant also provided its belief that Janus Capital has developed a number of institutional competitive advantages that should enable it to provide superior investment and service performance over the long term.
The Trustees concluded that the nature, extent and quality of the services provided by Janus Capital or the subadviser to each Janus Henderson Fund were appropriate and consistent with the terms of the respective advisory and subadvisory agreements, and that, taking into account steps taken to address those Janus Henderson Funds whose performance lagged that of their peers for certain periods, the Janus Henderson Funds were likely to benefit from the continued provision of those services. They also concluded that Janus Capital and each subadviser had sufficient personnel, with the appropriate education and experience, to serve the Janus Henderson Funds effectively and had demonstrated its ability to attract well-qualified personnel.
Performance of the Funds
The Trustees considered the performance results of each Janus Henderson Fund over various time periods. They noted that they considered Janus Henderson Fund performance data throughout the year, including periodic meetings with each Janus Henderson Fund’s portfolio manager(s), and also reviewed information comparing each Janus Henderson Fund’s performance with the performance of comparable funds and peer groups identified by Broadridge Financial Solutions, Inc. (“Broadridge”), an independent data provider, and with the Janus Henderson Fund’s benchmark index. In this regard, the independent fee consultant found that the overall Janus Henderson Funds’ performance has been reasonable: for the 36 months ended September 30, 2019, approximately 69% of the Janus Henderson Funds were in the top two quartiles of performance, as reported by Morningstar, and for the 12 months ended September 30, 2019, approximately 71% of the Janus Henderson Funds were in the top two quartiles of performance, as reported by Morningstar.
The Trustees considered the performance of each Janus Henderson Fund, noting that performance may vary by share class, and noted the following with respect to the VIT Portfolios:
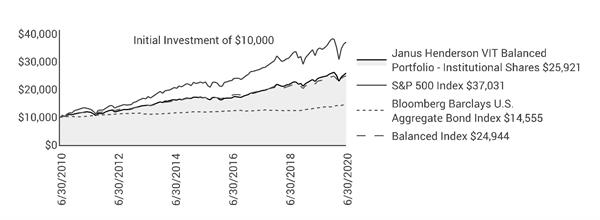
· For Janus Henderson Balanced Portfolio, the Trustees noted that the Fund’s performance was in the first Broadridge quartile for the 36 months ended May 31, 2019 and the first Broadridge quartile for the 12 months ended May 31, 2019.
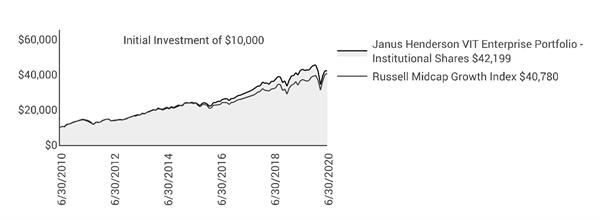
· For Janus Henderson Enterprise Portfolio, the Trustees noted that the Fund’s performance was in the second Broadridge quartile for the 36 months ended May 31, 2019 and the first Broadridge quartile for the 12 months ended May 31, 2019.
· For Janus Henderson Flexible Bond Portfolio, the Trustees noted that the Fund’s performance was in the bottom Broadridge quartile for the 36 months ended May 31, 2019 and the bottom Broadridge quartile for the 12 months ended May 31, 2019. The Trustees noted the reasons for the Fund’s underperformance and the steps Janus Capital had taken or was taking to improve performance.
Janus Henderson VIT Flexible Bond Portfolio
Additional Information (unaudited)
· For Janus Henderson Forty Portfolio, the Trustees noted that the Fund’s performance was in the second Broadridge quartile for the 36 months ended May 31, 2019 and the first Broadridge quartile for the 12 months ended May 31, 2019.
· For Janus Henderson Global Research Portfolio, the Trustees noted that the Fund’s performance was in the bottom Broadridge quartile for the 36 months ended May 31, 2019 and the second Broadridge quartile for the 12 months ended May 31, 2019. The Trustees noted the reasons for the Fund’s underperformance, while also noting that the Fund has a performance fee structure that results in lower management fees during periods of underperformance, and the steps Janus Capital had taken or was taking to improve performance, and that the performance trend was improving
· For Janus Henderson Global Technology Portfolio, the Trustees noted that the Fund’s performance was in the first Broadridge quartile for the 36 months ended May 31, 2019 and the first Broadridge quartile for the 12 months ended May 31, 2019.
· For Janus Henderson Mid Cap Value Portfolio, the Trustees noted that the Fund’s performance was in the second Broadridge quartile for the 36 months ended May 31, 2019 and the third Broadridge quartile for the 12 months ended May 31, 2019.
· For Janus Henderson Overseas Portfolio, the Trustees noted that the Fund’s performance was in the second Broadridge quartile for the 36 months ended May 31, 2019 and the bottom Broadridge quartile for the 12 months ended May 31, 2019.
· For Janus Henderson Research Portfolio, the Trustees noted that the Fund’s performance was in the third Broadridge quartile for the 36 months ended May 31, 2019 and the second Broadridge quartile for the 12 months ended May 31, 2019. The Trustees noted the reasons for the Fund’s underperformance, while also noting that the Fund has a performance fee structure that results in lower management fees during periods of underperformance, and the steps Janus Capital had taken or was taking to improve performance, and that the performance trend was improving
· For Janus Henderson U.S. Low Volatility Portfolio, the Trustees noted that the Fund’s performance was in the third Broadridge quartile for the 36 months ended May 31, 2019 and the first Broadridge quartile for the 12 months ended May 31, 2019. The Trustees noted the reasons for the Fund’s underperformance and the steps Janus Capital and Intech had taken or were taking to improve performance, and the performance trend was improving.
In consideration of each Janus Henderson Fund’s performance, the Trustees concluded that, taking into account the factors relevant to performance, as well as other considerations, including steps taken to improve performance, the Janus Henderson Fund’s performance warranted continuation of such Janus Henderson Fund’s investment advisory and subadvisory agreement(s).
Costs of Services Provided
The Trustees examined information regarding the fees and expenses of each Janus Henderson Fund in comparison to similar information for other comparable funds as provided by Broadridge, an independent data provider. They also reviewed an analysis of that information provided by their independent fee consultant and noted that the rate of management fees (investment advisory and any administration, but excluding out-of-pocket costs) for many of the Janus Henderson Funds, after applicable waivers, was below the average management fee rate of the respective peer group of funds selected by an independent data provider. The Trustees also examined information regarding the subadvisory fees charged for subadvisory services, as applicable, noting that all such fees were paid by Janus Capital out of its management fees collected from such Janus Henderson Fund.
The independent fee consultant provided its belief that the management fees charged by Janus Capital to each of the Janus Henderson Funds under the current investment advisory and administration agreements are reasonable in relation to the services provided by Janus Capital. The independent fee consultant found: (1) the total expenses and management fees of the Janus Henderson Funds to be reasonable relative to other mutual funds; (2) the total expenses, on average, were 10% under the average total expenses of their respective Broadridge Expense Group peers; and (3) and the management fees for the Janus Henderson Funds, on average, were 7% under the average management fees for their Expense Groups. The Trustees also considered the total expenses for each share class of
Janus Henderson VIT Flexible Bond Portfolio
Additional Information (unaudited)
each Janus Henderson Fund compared to the average total expenses for its Broadridge Expense Group peers and to average total expenses for its Broadridge Expense Universe.
For certain Janus Henderson Funds, the independent fee consultant also performed a systematic “focus list” analysis of expenses which assessed fund fees in the context of fund performance being delivered. Based on this analysis, the independent fee consultant found that the combination of service quality/performance and expenses on these individual Janus Henderson Funds was reasonable in light of performance trends, performance histories, and existence of performance fees, breakpoints, and/or expense waivers on such Janus Henderson Funds.
The Trustees considered the methodology used by Janus Capital and each subadviser in determining compensation payable to portfolio managers, the competitive environment for investment management talent, and the competitive market for mutual funds in different distribution channels.
The Trustees also reviewed management fees charged by Janus Capital and each subadviser to comparable separate account clients and to comparable non-affiliated funds subadvised by Janus Capital or by a subadviser (for which Janus Capital or the subadviser provides only or primarily portfolio management services). Although in most instances subadvisory and separate account fee rates for various investment strategies were lower than management fee rates for Janus Henderson Funds having a similar strategy, the Trustees considered that Janus Capital noted that, under the terms of the management agreements with the Janus Henderson Funds, Janus Capital performs significant additional services for the Janus Henderson Funds that it does not provide to those other clients, including administration services, oversight of the Janus Henderson Funds’ other service providers, trustee support, regulatory compliance and numerous other services, and that, in serving the Janus Henderson Funds, Janus Capital assumes many legal risks and other costs that it does not assume in servicing its other clients. Moreover, they noted that the independent fee consultant found that: (1) the management fees Janus Capital charges to the Janus Henderson Funds are reasonable in relation to the management fees Janus Capital charges to funds subadvised by Janus Capital and to the fees Janus Capital charges to its institutional separate account clients; (2) these subadvised and institutional separate accounts have different service and infrastructure needs; and (3) Janus Henderson mutual fund investors enjoy reasonable fees relative to the fees charged to Janus Henderson subadvised fund and separate account investors; (4) 11 of 12 Janus Henderson Funds have lower management fees than similar funds subadvised by Janus Capital; and (5) six of nine Janus Henderson Funds have lower management fees than similar separate accounts managed by Janus Capital.
The Trustees considered the fees for each Janus Henderson Fund for its fiscal year ended in 2018, including the VIT Portfolios, and noted the following with regard to each VIT Portfolio’s total expenses, net of applicable fee waivers (the VIT Portfolio’s “total expenses”):
· For Janus Henderson Balanced Portfolio, the Trustees noted that, although the Fund’s total expenses exceeded the peer group average for one share class, overall the Fund’s total expenses were reasonable.
· For Janus Henderson Enterprise Portfolio, the Trustees noted that, although the Fund’s total expenses exceeded the peer group average for one share class, overall the Fund’s total expenses were reasonable.
· For Janus Henderson Flexible Bond Portfolio, the Trustees noted that, although the Fund’s total expenses exceeded the peer group average for one share class, overall the Fund’s total expenses were reasonable. The Trustees also noted that Janus Capital has contractually agreed to limit the Fund’s expenses, although this limit did not apply because the Fund’s total expenses were already below the applicable fee limit.
· For Janus Henderson Forty Portfolio, the Trustees noted that, although the Fund’s total expenses exceeded the peer group average for one share class, overall the Fund’s total expenses were reasonable.
· For Janus Henderson Global Research Portfolio, the Trustees noted that the Fund’s total expenses were below the peer group average for both share classes.
· For Janus Henderson Global Technology Portfolio, the Trustees noted that the Fund’s total expenses were below the peer group average for both share classes.
· For Janus Henderson Mid Cap Value Portfolio, the Trustees noted that, although the Fund’s total expenses exceeded the peer group average for one share class, overall the Fund’s total expenses were reasonable. The Trustees also noted that Janus Capital has contractually agreed to limit the Fund’s expenses, although this limit did not apply because the Fund’s total expenses were already below the applicable fee limit.
Janus Henderson VIT Flexible Bond Portfolio
Additional Information (unaudited)
· For Janus Henderson Overseas Portfolio, the Trustees noted that the Fund’s total expenses were below the peer group average for both share classes.
· For Janus Henderson Research Portfolio, the Trustees noted that the Fund’s total expenses were below the peer group average for both share classes.
· For Janus Henderson U.S. Low Volatility Portfolio, the Trustees noted that the Fund’s total expenses were below the peer group average for its sole share class.
The Trustees reviewed information on the overall profitability to Janus Capital and its affiliates of their relationship with the Janus Henderson Funds, and considered profitability data of other publicly traded mutual fund advisers. The Trustees recognized that profitability comparisons among fund managers are difficult because of the variation in the type of comparative information that is publicly available, and the profitability of any fund manager is affected by numerous factors, including the organizational structure of the particular fund manager, differences in complex size, difference in product mix, difference in types of business (mutual fund, institutional and other), differences in the types of funds and other accounts it manages, possible other lines of business, the methodology for allocating expenses, and the fund manager’s capital structure and cost of capital.
Additionally, the Trustees considered the estimated profitability to Janus Capital from the investment management services it provided to each Janus Henderson Fund. In their review, the Trustees considered whether Janus Capital and each subadviser receive adequate incentives and resources to manage the Janus Henderson Funds effectively. In reviewing profitability, the Trustees noted that the estimated profitability for an individual Janus Henderson Fund is necessarily a product of the allocation methodology utilized by Janus Capital to allocate its expenses as part of the estimated profitability calculation. In this regard, the Trustees noted that the independent fee consultant found that (1) the expense allocation methodology and rationales utilized by Janus Capital were reasonable and (2) no clear correlation between expense allocations and operating margins. The Trustees also considered that the estimated profitability for an individual Janus Henderson Fund was influenced by a number of factors, including not only the allocation methodology selected, but also the presence of fee waivers and expense caps, and whether the Janus Henderson Fund’s investment management agreement contained breakpoints or a performance fee component. The Trustees determined, after taking into account these factors, among others, that Janus Capital’s estimated profitability with respect to each Janus Henderson Fund was not unreasonable in relation to the services provided, and that the variation in the range of such estimated profitability among the Janus Henderson Funds was not a material factor in the Board’s approval of the reasonableness of any Janus Henderson Fund’s investment management fees.
The Trustees concluded that the management fees payable by each Janus Henderson Fund to Janus Capital and its affiliates, as well as the fees paid by Janus Capital to the subadvisers of subadvised Janus Henderson Funds, were reasonable in relation to the nature, extent, and quality of the services provided, taking into account the fees charged by other advisers for managing comparable mutual funds with similar strategies, the fees Janus Capital and the subadvisers charge to other clients, and, as applicable, the impact of fund performance on management fees payable by the Janus Henderson Funds. The Trustees also concluded that each Janus Henderson Fund’s total expenses were reasonable, taking into account the size of the Janus Henderson Fund, the quality of services provided by Janus Capital and any subadviser, the investment performance of the Janus Henderson Fund, and any expense limitations agreed to or provided by Janus Capital.
Economies of Scale
The Trustees considered information about the potential for Janus Capital to realize economies of scale as the assets of the Janus Henderson Funds increase. They noted that their independent fee consultant published a report to the Trustees in November 2019 which provided its research and analysis into economies of scale. They also noted that, although many Janus Henderson Funds pay advisory fees at a base fixed rate as a percentage of net assets, without any breakpoints or performance fees, their independent fee consultant concluded that 64% of these Janus Henderson Funds’ share classes have contractual management fees (gross of waivers) below their Broadridge expense group averages. They also noted the following: (1) that for those Janus Henderson Funds whose expenses are being reduced by the contractual expense limitations of Janus Capital, Janus Capital is subsidizing certain of these Janus Henderson Funds because they have not reached adequate scale; (2) as the assets of some of the Janus Henderson Funds have declined in the past few years, certain Janus Henderson Funds have benefited from having advisory fee rates that have remained constant rather than increasing as assets declined; (3) performance fee structures have been implemented for various Janus Henderson Funds that have caused the effective rate of advisory fees payable by such a
Janus Henderson VIT Flexible Bond Portfolio
Additional Information (unaudited)
Janus Henderson Fund to vary depending on the investment performance of the Janus Henderson Fund relative to its benchmark index over the measurement period; and (4) a few Janus Henderson Funds have fee schedules with breakpoints and reduced fee rates above certain asset levels. The Trustees also noted that the Janus Henderson Funds share directly in economies of scale through the lower charges of third-party service providers that are based in part on the combined scale of all of the Janus Henderson Funds.
The Trustees also considered the independent fee consultant’s conclusion that, given the limitations of various analytical approaches to economies of scale and their conflicting results, it is difficult to analytically confirm or deny the existence of economies of scale in the Janus Henderson complex. In this regard, the independent consultant concluded that (1) to the extent there were economies of scale at Janus Capital, Janus Capital’s general strategy of setting fixed management fees below peers appeared to share any such economies with investors even on smaller Janus Henderson Funds which have not yet achieved those economies and (2) by setting lower fixed fees from the start on these Janus Henderson Funds, Janus Capital appeared to be investing to increase the likelihood that these Janus Henderson Funds will grow to a level to achieve any scale economies that may exist. Further, the independent fee consultant provided its belief that Janus Henderson Fund investors are well-served by the fee levels and performance fee structures in place on the Janus Henderson Funds in light of any economies of scale that may be present at Janus Capital.
Based on all of the information reviewed, including the recent and past research and analysis conducted by the Trustees’ independent fee consultant, the Trustees concluded that the current fee structure of each Janus Henderson Fund was reasonable and that the current rates of fees do reflect a sharing between Janus Capital and the Janus Henderson Fund of any economies of scale that may be present at the current asset level of the Janus Henderson Fund.
Other Benefits to Janus Capital
The Trustees also considered benefits that accrue to Janus Capital and its affiliates and subadvisers to the Janus Henderson Funds from their relationships with the Janus Henderson Funds. They recognized that two affiliates of Janus Capital separately serve the Janus Henderson Funds as transfer agent and distributor, respectively, and the transfer agent receives compensation directly from the non-money market funds for services provided, and that such compensation contributes to the overall profitability of Janus Capital and its affiliates that results from their relationship with the Janus Henderson Funds. The Trustees also considered Janus Capital’s past and proposed use of commissions paid by the Janus Henderson Funds on portfolio brokerage transactions to obtain proprietary and third-party research products and services benefiting the Janus Henderson Fund and/or other clients of Janus Capital and/or Janus Capital, and/or a subadviser to a Janus Henderson Fund. The Trustees concluded that Janus Capital’s and the subadvisers’ use of these types of client commission arrangements to obtain proprietary and third-party research products and services was consistent with regulatory requirements and guidelines and was likely to benefit each Janus Henderson Fund. The Trustees also concluded that, other than the services provided by Janus Capital and its affiliates and subadvisers pursuant to the agreements and the fees to be paid by each Janus Henderson Fund therefor, the Janus Henderson Funds and Janus Capital and the subadvisers may potentially benefit from their relationship with each other in other ways. They concluded that Janus Capital and its affiliates share directly in economies of scale through the lower charges of third-party service providers that are based in part on the combined scale of the Janus Henderson Funds and other clients serviced by Janus Capital and its affiliates. They also concluded that Janus Capital and/or the subadvisers benefit from the receipt of research products and services acquired through commissions paid on portfolio transactions of the Janus Henderson Funds and that the Janus Henderson Funds benefit from Janus Capital’s and/or the subadvisers’ receipt of those products and services as well as research products and services acquired through commissions paid by other clients of Janus Capital and/or other clients of the subadvisers. They further concluded that the success of any Janus Henderson Fund could attract other business to Janus Capital, the subadvisers or other Janus Henderson funds, and that the success of Janus Capital and the subadvisers could enhance Janus Capital’s and the subadvisers’ ability to serve the Janus Henderson Funds.
LIQUIDITY RISK MANAGEMENT PROGRAM
Janus Henderson Funds (other than the money market funds) have adopted and implemented a written liquidity risk management program (the “LRMP”) as required by Rule 22e-4 under the Investment Company Act of 1940, as amended (the “Liquidity Rule”). Rule 22e-4, requires open-end funds to adopt and implement a written liquidity risk management program that is reasonably designed to assess and manage liquidity risk, which is the risk that a fund could not meet redemption requests without significant dilution of remaining investors’ interest in the fund. The LRMP
Janus Henderson VIT Flexible Bond Portfolio
Additional Information (unaudited)
incorporates the following elements: (i) assessment, management, and periodic review of liquidity risk; (ii) classification of portfolio investments; (iii) the establishment and monitoring of a highly liquid investment minimum, as applicable; (iv) a 15% limitation on a Portfolio’s illiquid investments; (v) redemptions in-kind; and (vi) board oversight.
The Trustees have designated Janus Capital Management LLC, the Portfolio’s investment adviser (“Janus Capital”), as the Program Administrator for the LRMP responsible for administering the LRMP and carrying out the specific responsibilities of the LRMP. A working group comprised of various groups within Janus Capital’s business is responsible for administering the LRMP and carrying out the specific responsibilities of different aspects of the LRMP.
The Liquidity Rule requires the Trustees to review at least annually a written report provided by the Program Administrator that addresses the operation of the LRMP and assesses its adequacy and the effectiveness of its implementation, including, if applicable, the operation of the highly liquid investment minimum, and any material changes to the LRMP (the “Program Administrator Report”). During the semi-annual period ended June 30, 2020, the Program Administrator provided the Program Administrator Report to the Trustees which covered the operation of the LRMP from December 1, 2018 through December 31, 2019 (the “Reporting Period”). No significant liquidity events impacting the Portfolio were noted in the Program Administrator Report, and the Portfolio was able to process redemptions during the normal course of business during the Reporting Period. In addition, the Program Administrator expressed its belief in the Program Administrator Report that:
· the LRMP is reasonably designed and adequate to assess and manage the Portfolio’s liquidity risk, taking into account the Portfolio’s particular risks and circumstances, and includes policies and procedures reasonably designed to implement each required component of the Liquidity Rule; and
· the LRMP, including the Highly Liquid Investment Minimum where applicable, was implemented and operated effectively to achieve the goal of assessing and managing the Portfolio’s liquidity risk.
There can be no assurance that the LRMP will achieve its objectives in the future. Please refer to your Fund’s prospectus for more information regarding the risks to which an investment in the Fund may be subject.
Janus Henderson VIT Flexible Bond Portfolio
Useful Information About Your Portfolio Report (unaudited)
Management Commentary
The Management Commentary in this report includes valuable insight as well as statistical information to help you understand how your Portfolio’s performance and characteristics stack up against those of comparable indices.
If the Portfolio invests in foreign securities, this report may include information about country exposure. Country exposure is based primarily on the country of risk. A company may be allocated to a country based on other factors such as location of the company’s principal office, the location of the principal trading market for the company’s securities, or the country where a majority of the company’s revenues are derived.
Please keep in mind that the opinions expressed in the Management Commentary are just that: opinions. They are a reflection based on best judgment at the time this report was compiled, which was June 30, 2020. As the investing environment changes, so could opinions. These views are unique and are not necessarily shared by fellow employees or by Janus Henderson in general.
Performance Overviews
Performance overview graphs compare the performance of a hypothetical $10,000 investment in the Portfolio with one or more widely used market indices. When comparing the performance of the Portfolio with an index, keep in mind that market indices are not available for investment and do not reflect deduction of expenses.
Average annual total returns are quoted for a Portfolio with more than one year of performance history. Average annual total return is calculated by taking the growth or decline in value of an investment over a period of time, including reinvestment of dividends and distributions, then calculating the annual compounded percentage rate that would have produced the same result had the rate of growth been constant throughout the period. Average annual total return does not reflect the deduction of taxes that a shareholder would pay on Portfolio distributions or redemptions of Portfolio shares.
Cumulative total returns are quoted for a Portfolio with less than one year of performance history. Cumulative total return is the growth or decline in value of an investment over time, independent of the period of time involved. Cumulative total return does not reflect the deduction of taxes that a shareholder would pay on Portfolio distributions or redemptions of Portfolio shares.
Pursuant to federal securities rules, expense ratios shown in the performance chart reflect subsidized (if applicable) and unsubsidized ratios. The total annual fund operating expenses ratio is gross of any fee waivers, reflecting the Portfolio’s unsubsidized expense ratio. The net annual fund operating expenses ratio (if applicable) includes contractual waivers of Janus Capital and reflects the Portfolio’s subsidized expense ratio. Ratios may be higher or lower than those shown in the “Financial Highlights” in this report.
Schedule of Investments
Following the performance overview section is the Portfolio’s Schedule of Investments. This schedule reports the types of securities held in the Portfolio on the last day of the reporting period. Securities are usually listed by type (common stock, corporate bonds, U.S. Government obligations, etc.) and by industry classification (banking, communications, insurance, etc.). Holdings are subject to change without notice.
The value of each security is quoted as of the last day of the reporting period. The value of securities denominated in foreign currencies is converted into U.S. dollars.
If the Portfolio invests in foreign securities, it will also provide a summary of investments by country. This summary reports the Portfolio exposure to different countries by providing the percentage of securities invested in each country. The country of each security represents the country of risk. The Portfolio’s Schedule of Investments relies upon the industry group and country classifications published by Barclays and/or MSCI Inc.
Tables listing details of individual forward currency contracts, futures, written options, swaptions, and swaps follow the Portfolio’s Schedule of Investments (if applicable).
Statement of Assets and Liabilities
This statement is often referred to as the “balance sheet.” It lists the assets and liabilities of the Portfolio on the last day of the reporting period.
Janus Henderson VIT Flexible Bond Portfolio
Useful Information About Your Portfolio Report (unaudited)
The Portfolio’s assets are calculated by adding the value of the securities owned, the receivable for securities sold but not yet settled, the receivable for dividends declared but not yet received on securities owned, and the receivable for Portfolio shares sold to investors but not yet settled. The Portfolio’s liabilities include payables for securities purchased but not yet settled, Portfolio shares redeemed but not yet paid, and expenses owed but not yet paid. Additionally, there may be other assets and liabilities such as unrealized gain or loss on forward currency contracts.
The section entitled “Net Assets Consist of” breaks down the components of the Portfolio’s net assets. Because the Portfolio must distribute substantially all earnings, you will notice that a significant portion of net assets is shareholder capital.
The last section of this statement reports the net asset value (“NAV”) per share on the last day of the reporting period. The NAV is calculated by dividing the Portfolio’s net assets for each share class (assets minus liabilities) by the number of shares outstanding.
Statement of Operations
This statement details the Portfolio’s income, expenses, realized gains and losses on securities and currency transactions, and changes in unrealized appreciation or depreciation of Portfolio holdings.
The first section in this statement, entitled “Investment Income,” reports the dividends earned from securities and interest earned from interest-bearing securities in the Portfolio.
The next section reports the expenses incurred by the Portfolio, including the advisory fee paid to the investment adviser, transfer agent fees and expenses, and printing and postage for mailing statements, financial reports and prospectuses. Expense offsets and expense reimbursements, if any, are also shown.
The last section lists the amounts of realized gains or losses from investment and foreign currency transactions, and changes in unrealized appreciation or depreciation of investments and foreign currency-denominated assets and liabilities. The Portfolio will realize a gain (or loss) when it sells its position in a particular security. A change in unrealized gain (or loss) refers to the change in net appreciation or depreciation of the Portfolio during the reporting period. “Net Realized and Unrealized Gain/(Loss) on Investments” is affected both by changes in the market value of Portfolio holdings and by gains (or losses) realized during the reporting period.
Statements of Changes in Net Assets
These statements report the increase or decrease in the Portfolio’s net assets during the reporting period. Changes in the Portfolio’s net assets are attributable to investment operations, dividends and distributions to investors, and capital share transactions. This is important to investors because it shows exactly what caused the Portfolio’s net asset size to change during the period.
The first section summarizes the information from the Statement of Operations regarding changes in net assets due to the Portfolio’s investment operations. The Portfolio’s net assets may also change as a result of dividend and capital gains distributions to investors. If investors receive their dividends and/or distributions in cash, money is taken out of the Portfolio to pay the dividend and/or distribution. If investors reinvest their dividends and/or distributions, the Portfolio’s net assets will not be affected. If you compare the Portfolio’s “Net Decrease from Dividends and Distributions” to “Reinvested Dividends and Distributions,” you will notice that dividends and distributions have little effect on the Portfolio’s net assets. This is because the majority of the Portfolio’s investors reinvest their dividends and/or distributions.
The reinvestment of dividends and distributions is included under “Capital Share Transactions.” “Capital Shares” refers to the money investors contribute to the Portfolio through purchases or withdrawals via redemptions. The Portfolio’s net assets will increase and decrease in value as investors purchase and redeem shares from the Portfolio.
Financial Highlights
This schedule provides a per-share breakdown of the components that affect the Portfolio’s NAV for current and past reporting periods as well as total return, asset size, ratios, and portfolio turnover rate.
The first line in the table reflects the NAV per share at the beginning of the reporting period. The next line reports the net investment income/(loss) per share. Following is the per share total of net gains/(losses), realized and unrealized. Per share dividends and distributions to investors are then subtracted to arrive at the NAV per share at the end of the period. The next line reflects the total return for the period. The total return may include adjustments in accordance with
Janus Henderson VIT Flexible Bond Portfolio
Useful Information About Your Portfolio Report (unaudited)
generally accepted accounting principles required at the period end for financial reporting purposes. As a result, the total return may differ from the total return reflected for individual shareholder transactions. Also included are ratios of expenses and net investment income to average net assets.
The Portfolio’s expenses may be reduced through expense offsets and expense reimbursements. The ratios shown reflect expenses before and after any such offsets and reimbursements.
The ratio of net investment income/(loss) summarizes the income earned less expenses, divided by the average net assets of the Portfolio during the reporting period. Do not confuse this ratio with the Portfolio’s yield. The net investment income ratio is not a true measure of the Portfolio’s yield because it does not take into account the dividends distributed to the Portfolio’s investors.
The next figure is the portfolio turnover rate, which measures the buying and selling activity in the Portfolio. Portfolio turnover is affected by market conditions, changes in the asset size of the Portfolio, fluctuating volume of shareholder purchase and redemption orders, the nature of the Portfolio’s investments, and the investment style and/or outlook of the portfolio manager(s) and/or investment personnel. A 100% rate implies that an amount equal to the value of the entire portfolio was replaced once during the fiscal year; a 50% rate means that an amount equal to the value of half the portfolio is traded in a year; and a 200% rate means that an amount equal to the value of the entire portfolio is traded every six months.
Janus Henderson VIT Flexible Bond Portfolio
Notes
NotesPage1
Janus Henderson VIT Flexible Bond Portfolio
Notes
NotesPage2
Knowledge Shared
At Janus Henderson, we believe in the sharing of expert insight for better investment and business decisions. We call this ethos Knowledge Shared.
Learn more by visiting janushenderson.com.
| | | | | | | | | |
| | | | | |

| | | | |
This report is submitted for the general information of shareholders of the Portfolio. It is not an offer or solicitation for the Portfolio and is not authorized for distribution to prospective investors unless preceded or accompanied by an effective prospectus. |
Janus Henderson, Janus, Henderson, Perkins, Intech and Knowledge Shared are trademarks of Janus Henderson Group plc or one of its subsidiaries. © Janus Henderson Group plc Janus Henderson Distributors |
| | | | | 109-24-81114 08-20 |
| | | |
| | | |
| | | SEMIANNUAL REPORT June 30, 2020 |
| | |
| | Janus Henderson VIT Forty Portfolio |
| | |
| | Janus Aspen Series |
Beginning on January 1, 2021, as permitted by regulations adopted by the Securities and Exchange Commission, the insurance company that offers your variable life insurance contract or variable annuity contract, may determine that it will no longer send you paper copies of the Portfolio’s shareholder reports, unless you specifically request paper copies of the reports. Beginning on January 1, 2021, for shareholders who are not insurance contract holders, paper copies of the Portfolio’s shareholder reports will no longer be sent by mail unless you specifically request paper copies of the reports. Instead, the reports will be made available on a website, and your insurance company or plan sponsor, broker-dealer, or financial intermediary will notify you by mail each time a report is posted and provide you with a website link to access the report. Instructions for requesting paper copies will be provided by your insurance company or plan sponsor, broker-dealer, or financial intermediary. If you already elected to receive shareholder reports electronically, you will not be affected by this change and you need not take any action. You may elect to receive shareholder reports and other communications from the Portfolio electronically by contacting your insurance company or plan sponsor, broker-dealer, or other financial intermediary. You may elect to receive all future reports in paper free of charge by contacting your insurance company or plan sponsor, broker dealer or other financial intermediary. Your election to receive reports in paper will apply to all funds held in your account with your insurance company or plan sponsor, broker dealer or other financial intermediary. |
| | | |
| | | HIGHLIGHTS · Portfolio management perspective · Investment strategy behind your portfolio · Portfolio performance, characteristics
and holdings |
| | | |
| | | 
|
Table of Contents
Janus Henderson VIT Forty Portfolio
Janus Henderson VIT Forty Portfolio (unaudited)
| | | | | | |
PORTFOLIO SNAPSHOT We believe that constructing a concentrated portfolio of quality growth companies will allow us to outperform our benchmark over time. We define quality as companies that enjoy sustainable “moats” around their businesses, potentially allowing them to grow faster, with higher returns, than their competitors. We believe the market often underestimates these companies’ sustainable competitive advantage periods. | �� | | | 
Doug Rao co-portfolio manager | 
Nick Schommer co-portfolio manager |
| | | |
PERFORMANCE OVERVIEW
For the six-month period ended June 30, 2020, the Portfolio’s Institutional Shares and Service Shares returned 10.84% and 10.68%, respectively, versus a return of 9.81% for the Portfolio’s primary benchmark, the Russell 1000® Growth Index. The Portfolio’s secondary benchmark, the S&P 500® Index, returned -3.08% for the period.
INVESTMENT ENVIRONMENT
The Russell 1000 Growth Index staged an impressive rebound on the heels of a near-total shutdown of the economy as the U.S. government and Federal Reserve (Fed) implemented massive stimulus and liquidity measures to backstop markets. Growth stocks, driven primarily by large-cap technology firms, significantly outperformed value stocks and the broader market. The unemployment rate, which had previously risen to an extremely high level, eventually showed signs of recovery but remained elevated. Relatively positive economic data toward the end of the period, including an uptick in consumer spending, pointed to a nascent recovery; however, the development of virus hot spots, particularly in the Southern and Western regions of the country, underscored the challenges that remain as the economy reopens amid the ongoing COVID-19 pandemic.
PERFORMANCE DISCUSSION
The Portfolio outperformed its primary benchmark, the Russell 1000 Growth Index, and its secondary benchmark, the S&P 500 Index, during the period. As part of our investment strategy, we seek companies that have built clear, sustainable competitive moats around their businesses, which should help them grow market share within their respective industries over time. Important competitive advantages could include a strong brand, network effects from a product or service that would be hard for a competitor to replicate, a lower cost structure than competitors in the industry, a distribution advantage or patent protection over valuable intellectual property. We think emphasizing these sustainable competitive advantages can be a meaningful driver of outperformance over longer time horizons because the market often underestimates the duration of growth for these companies and the long-term potential return to shareholders.
Avalara was a top contributor for the period relative to the benchmark. The Software as a Service company is a provider of tax calculation solutions for medium-size e-commerce businesses. Companies that sell goods online are now required to collect the appropriate sales tax for each state they sell into, even if they do not have a physical presence in that state. This requirement, combined with the complexity of the U.S. tax code, makes Avalara’s software an essential service for many online businesses. The stock was up during the period after reporting strong earnings and a growing customer base through a challenging economic environment.
Netflix, Inc., another top contributor, has been a clear beneficiary of shelter-in-place orders, with a fairly low-priced product that has seen a spike in demand amid social distancing. As business activity slowed and advertising decreased, Netflix’s business model also benefited due to its ad-free structure, while competitors more reliant on advertising revenue were negatively impacted.
Amazon was another top contributor, as almost every business line has continued to benefit from the disrupted environment. E-commerce (traditional and Whole Foods) benefited from increased deliveries. Amazon’s extensive and sophisticated direct-to-consumer distribution network and Prime Video streaming were welcomed by consumers in this environment. Amazon Web Services (AWS) also benefited from an accelerated transition to the cloud, driven by the need to provide knowledge workers remote access to corporate information technology (IT) applications.
Janus Henderson VIT Forty Portfolio (unaudited)
Boston Scientific, a cardiovascular-focused medical device company, was among the top detractors. The company has suffered as some surgeries have been pushed back until the COVID-19 pandemic slows down. Procedures like heart surgery are not seen as elective, but many operations have been delayed in the near term.
Another detractor relative to the benchmark was defense contractor L3Harris Technologies. Defense stocks in general held up better during the initial market sell-off but have struggled more recently. Huge levels of fiscal stimulus will likely lead to strained government budgets for the foreseeable future. As a result, fears that defense spending will be negatively impacted weighed on the stock during the period.
Elanco Animal Health also detracted from relative performance. The stock declined after the company reported lower-than-expected quarterly revenues and withdrew fiscal year guidance because of COVID-19. Elanco is a top participant in the expanding animal food and health market. The firm’s planned acquisition of Bayer Animal Health remains targeted for a midyear close and should help diversify Elanco’s portfolio and distribution channels.
OUTLOOK
Massive fiscal and monetary stimulus measures have thus far helped cushion the blow from shelter-in-place orders and provided much-needed liquidity for markets, Main Street businesses and consumers. As a result, the individual savings rate has gone up dramatically, and many companies with impaired balance sheets have likewise been able to raise inexpensive capital and deleverage. Interest rates (and therefore company cost of capital) are likely to remain at or near zero for the foreseeable future. This could eventually lead to price extremes for both equities and fixed income and will present investors with significant challenges in assessing corporate valuations.
The economy has shown signs of a budding recovery as it reopens, but it is clear that COVID-19 infection rates will need to be kept in check, as large spikes could necessitate renewed shutdowns and create risks to the developing recovery. Thus, the path back to normalcy will likely be extended and volatile until there is an effective and widely implemented vaccine. Adding to short-term market volatility is a recent spike in retail trading volume and accounts, spurred by zero-cost commissions across the retail brokerage industry and an increase in hours spent at home for individual investors.
While we can’t predict macroeconomic outlooks, nor the trajectory of COVID-19, we believe many of the themes we have discussed in the past, specifically the widespread digitization of sectors across the economy, will not only persist but also get stronger over the coming months and years. Now more than ever, we think it is important to own companies that can benefit from long-term secular trends and that can continue to invest and grow. These are firms that have durable business models with deeply rooted competitive advantages, including strong balance sheets. Such qualities should allow these companies to allocate capital to growth opportunities despite a recessionary environment.
Thank you for your investment in Janus Henderson VIT Forty Portfolio.
Janus Henderson VIT Forty Portfolio (unaudited)
Portfolio At A Glance
June 30, 2020
| | | | | | | | | | |
| | | | | | | | | |
| | | | | | | | | |
| | | | | | | | | |
| 5 Top Contributors - Holdings | 5 Top Detractors - Holdings |
| | Average
Weight | | Relative
Contribution | | | Average
Weight | | Relative
Contribution |
| Avalara Inc | 1.09% | | 0.62% | | Boston Scientific Corp | 3.28% | | -1.11% |
| Netflix Inc | 2.84% | | 0.55% | | Walt Disney Co | 1.71% | | -0.68% |
| Amazon.com Inc | 7.24% | | 0.51% | | L3Harris Technologies Inc | 2.99% | | -0.61% |
| Adobe Inc | 3.43% | | 0.46% | | Elanco Animal Health Inc | 1.05% | | -0.61% |
| ASML Holding NV | 2.13% | | 0.31% | | Mastercard Inc | 5.81% | | -0.43% |
| | | | | | | |
| 5 Top Contributors - Sectors* | | | | | |
| | | Relative | | Portfolio | Russell 1000 Growth Index |
| | | Contribution | | Average Weight | Average Weight |
| Information Technology | | 1.21% | | 38.10% | 39.94% |
| Consumer Discretionary | | 1.02% | | 13.43% | 14.35% |
| Industrials | | 0.54% | | 6.97% | 8.18% |
| Consumer Staples | | 0.49% | | 1.21% | 4.48% |
| Real Estate | | 0.25% | | 3.01% | 2.37% |
| | | | | | |
| | | | | | |
| 5 Top Detractors - Sectors* | | | | | |
| | | Relative | | Portfolio | Russell 1000 Growth Index |
| | | Contribution | | Average Weight | Average Weight |
| Health Care | | -1.93% | | 13.07% | 14.54% |
| Materials | | -0.47% | | 3.49% | 1.25% |
| Financials | | -0.34% | | 3.85% | 2.96% |
| Other** | | 0.04% | | 2.42% | 0.00% |
| Energy | | 0.12% | | 0.00% | 0.18% |
| | | | | | | |
| Relative contribution reflects how the portolio's holdings impacted return relative to the benchmark. Cash and securities not held in the portfolio are not shown. For equity portfolios, relative contribution compares the performance of a security in the portfolio to the benchmark's total return, factoring in the difference in weight of that security in the benchmark. Returns are calculated using daily returns and previous day ending weights rolled up by ticker, excluding fixed income securities, gross of advisory fees, may exclude certain derivatives and will differ from actual performance.
Performance attribution reflects returns gross of advisory fees and may differ from actual returns as they are based on end of day holdings. Attribution is calculated by geometrically linking daily returns for the portfolio and index. |
* | Based on sector classification according to the Global Industry Classification Standard (“GICS”) codes, which are the exclusive property and a service mark of MSCI Inc. and Standard & Poor’s. |
** | Not a GICS classified sector. |
Janus Henderson VIT Forty Portfolio (unaudited)
Portfolio At A Glance
June 30, 2020
| | |
5 Largest Equity Holdings - (% of Net Assets) |
Microsoft Corp | |
Software | 9.0% |
Amazon.com Inc | |
Internet & Direct Marketing Retail | 8.7% |
Apple Inc | |
Technology Hardware, Storage & Peripherals | 5.9% |
Mastercard Inc | |
Information Technology Services | 5.8% |
Alphabet Inc - Class C | |
Interactive Media & Services | 3.9% |
| | 33.3% |
| | | | | | |
Asset Allocation - (% of Net Assets) |
Common Stocks | | 99.5% |
Investments Purchased with Cash Collateral from Securities Lending | | 0.9% |
Investment Companies | | 0.8% |
Other | | (1.2)% |
| | | 100.0% |
| | |
Top Country Allocations - Long Positions - (% of Investment Securities) |
As of June 30, 2020 
| As of December 31, 2019 
|
Janus Henderson VIT Forty Portfolio (unaudited)
Performance
| |
See important disclosures on the next page. |
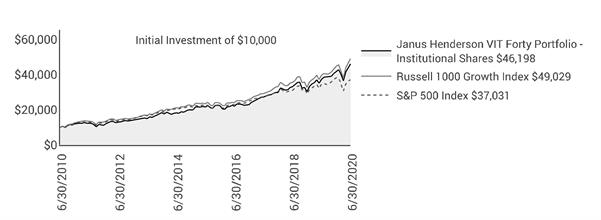
| | | | | | | | | | | |
| | | | | | | | | |
| | | | | | | | | | |
Average Annual Total Return - for the periods ended June 30, 2020 | | | Expense Ratios |
| | Fiscal
Year-to-Date | One
Year | Five
Year | Ten
Year | Since
Inception* | | | Total Annual Fund
Operating Expenses‡ |
Institutional Shares | | 10.84% | 23.10% | 16.48% | 16.54% | 12.25% | | | 0.77% |
Service Shares | | 10.68% | 22.79% | 16.19% | 16.24% | 11.94% | | | 1.02% |
Russell 1000 Growth Index | | 9.81% | 23.28% | 15.89% | 17.23% | 8.62% | | | |
S&P 500 Index | | -3.08% | 7.51% | 10.73% | 13.99% | 8.05% | | | |
Morningstar Quartile - Institutional Shares | | - | 1st | 1st | 2nd | 1st | | | |
Morningstar Ranking - based on total returns for Large Growth Funds | | - | 319/1,366 | 161/1,251 | 305/1,100 | 14/587 | | | |
Returns quoted are past performance and do not guarantee future results; current performance may be lower or higher. Investment returns and principal value will vary; there may be a gain or loss when shares are sold. For the most recent month-end performance call 800.668.0434 or visit janushenderson.com/VITperformance.
This Portfolio has a performance-based management fee that may adjust up or down based on the Portfolio’s performance.
Performance may be affected by risks that include those associated with non-diversification, portfolio turnover, short sales, potential conflicts of interest, foreign and emerging markets, initial public offerings (IPOs), high-yield and high-risk securities, undervalued, overlooked and smaller capitalization companies, real estate related securities including Real Estate Investment Trusts (REITs), derivatives, and commodity-linked investments. Each product has different risks. Please see the prospectus for more information about risks, holdings and other details.
Returns do not reflect the deduction of fees, charges or expenses of any insurance product or qualified plan. If applied, returns would have been lower.
Returns include reinvestment of all dividends and distributions and do not reflect the deduction of taxes that a shareholder would pay on Portfolio distributions or redemptions of Portfolio shares. The returns do not include adjustments in accordance with generally accepted accounting principles required at the period end for financial reporting purposes.
Performance for Service Shares prior to December 31, 1999 reflects the performance of Institutional Shares, adjusted to reflect the expenses of Service Shares.
Ranking is for the share class shown only; other classes may have different performance characteristics.
© 2020 Morningstar, Inc. All Rights Reserved.
There is no assurance that the investment process will consistently lead to successful investing.
See Notes to Schedule of Investments and Other Information for index definitions.
Janus Henderson VIT Forty Portfolio (unaudited)
Performance
Index performance does not reflect the expenses of managing a portfolio as an index is unmanaged and not available for direct investment.
See “Useful Information About Your Portfolio Report.”
*The Portfolio’s inception date – May 1 ,1997
‡ As stated in the prospectus. See Financial Highlights for actual expense ratios during the reporting period.
Janus Henderson VIT Forty Portfolio (unaudited)
Expense Examples
As a shareholder of the Portfolio, you incur two types of costs: (1) transaction costs and (2) ongoing costs, including management fees; 12b-1 distribution and shareholder servicing fees (applicable to Service Shares only); transfer agent fees and expenses payable pursuant to the Transfer Agency Agreement; and other Portfolio expenses. This example is intended to help you understand your ongoing costs (in dollars) of investing in the Portfolio and to compare these costs with the ongoing costs of investing in other mutual funds. To do so, compare this 5% hypothetical example with the 5% hypothetical examples that appear in the shareholder reports of the other funds. The example is based upon an investment of $1,000 invested at the beginning of the period and held for the six-months indicated, unless noted otherwise in the table and footnotes below.
Actual Expenses
The information in the table under the heading “Actual” provides information about actual account values and actual expenses. You may use the information in these columns, together with the amount you invested, to estimate the expenses that you paid over the period. Simply divide your account value by $1,000 (for example, an $8,600 account value divided by $1,000 = 8.6), then multiply the result by the number in the appropriate column for your share class under the heading entitled “Expenses Paid During Period” to estimate the expenses you paid on your account during the period.
Hypothetical Example for Comparison Purposes
The information in the table under the heading “Hypothetical (5% return before expenses)” provides information about hypothetical account values and hypothetical expenses based upon the Portfolio’s actual expense ratio and an assumed rate of return of 5% per year before expenses, which is not the Portfolio’s actual return. The hypothetical account values and expenses may not be used to estimate the actual ending account balance or expenses you paid for the period. You may use this information to compare the ongoing costs of investing in the Portfolio and other funds. To do so, compare this 5% hypothetical example with the 5% hypothetical examples that appear in the shareholder reports of the other funds. Additionally, for an analysis of the fees associated with an investment in either share class or other similar funds, please visit www.finra.org/fundanalyzer.
Please note that the expenses shown in the table are meant to highlight your ongoing costs only and do not reflect any transaction costs, such as any charges at the separate account level or contract level. These fees are fully described in the Portfolio’s prospectuses. Therefore, the hypothetical examples are useful in comparing ongoing costs only, and will not help you determine the relative total costs of owning different funds. In addition, if these transaction costs were included, your costs would have been higher.
| | | | | | | | | | | |
| | | | | | | | |
| | | Actual | | Hypothetical
(5% return before expenses) | |
| Beginning
Account
Value
(1/1/20) | Ending
Account
Value
(6/30/20) | Expenses
Paid During
Period
(1/1/20 - 6/30/20)† | | Beginning
Account
Value
(1/1/20) | Ending
Account
Value
(6/30/20) | Expenses
Paid During
Period
(1/1/20 - 6/30/20)† | Net Annualized
Expense Ratio
(1/1/20 - 6/30/20) |
Institutional Shares | $1,000.00 | $1,108.40 | $4.09 | | $1,000.00 | $1,020.98 | $3.92 | 0.78% |
Service Shares | $1,000.00 | $1,106.80 | $5.34 | | $1,000.00 | $1,019.79 | $5.12 | 1.02% |
† | Expenses Paid During Period are equal to the Net Annualized Expense Ratio multiplied by the average account value over the period, multiplied by 182/366 (to reflect the one-half year period). Expenses in the examples include the effect of applicable fee waivers and/or expense reimbursements, if any. Had such waivers and/or reimbursements not been in effect, your expenses would have been higher. Please refer to the Notes to Financial Statements or the Portfolio’s prospectuses for more information regarding waivers and/or reimbursements. |
Janus Henderson VIT Forty Portfolio
Schedule of Investments (unaudited)
June 30, 2020
| | | | | | | | |
Shares or
Principal Amounts | | | Value | |
Common Stocks – 99.5% | | | |
Aerospace & Defense – 2.2% | | | |
| | L3Harris Technologies Inc | | 118,258 | | | $20,064,835 | |
Capital Markets – 2.3% | | | |
| | Blackstone Group Inc | | 377,230 | | | 21,373,852 | |
Chemicals – 2.0% | | | |
| | Sherwin-Williams Co | | 32,071 | | | 18,532,227 | |
Construction Materials – 0.8% | | | |
| | Vulcan Materials Co | | 60,230 | | | 6,977,646 | |
Electronic Equipment, Instruments & Components – 0.6% | | | |
| | Cognex Corp | | 97,030 | | | 5,794,632 | |
Entertainment – 4.0% | | | |
| | Netflix Inc* | | 56,422 | | | 25,674,267 | |
| | Walt Disney Co | | 101,830 | | | 11,355,063 | |
| | | 37,029,330 | |
Equity Real Estate Investment Trusts (REITs) – 3.0% | | | |
| | American Tower Corp | | 107,415 | | | 27,771,074 | |
Health Care Equipment & Supplies – 8.6% | | | |
| | Boston Scientific Corp* | | 894,478 | | | 31,405,123 | |
| | Danaher Corp | | 143,461 | | | 25,368,209 | |
| | Edwards Lifesciences Corp* | | 92,124 | | | 6,366,690 | |
| | Intuitive Surgical Inc* | | 28,895 | | | 16,465,238 | |
| | | 79,605,260 | |
Household Products – 1.9% | | | |
| | Procter & Gamble Co | | 149,413 | | | 17,865,312 | |
Information Technology Services – 7.3% | | | |
| | Mastercard Inc | | 181,878 | | | 53,781,325 | |
| | PayPal Holdings Inc* | | 77,802 | | | 13,555,442 | |
| | | 67,336,767 | |
Interactive Media & Services – 9.2% | | | |
| | Alphabet Inc - Class C* | | 25,682 | | | 36,304,332 | |
| | Facebook Inc* | | 105,041 | | | 23,851,660 | |
| | Match Group Inc*,# | | 104,099 | | | 11,143,798 | |
| | Snap Inc* | | 581,763 | | | 13,665,613 | |
| | | 84,965,403 | |
Internet & Direct Marketing Retail – 9.9% | | | |
| | Amazon.com Inc* | | 29,018 | | | 80,055,439 | |
| | Booking Holdings Inc* | | 7,125 | | | 11,345,422 | |
| | | 91,400,861 | |
Pharmaceuticals – 4.4% | | | |
| | Elanco Animal Health Inc* | | 453,220 | | | 9,721,569 | |
| | Merck & Co Inc | | 207,128 | | | 16,017,208 | |
| | Zoetis Inc | | 107,998 | | | 14,800,046 | |
| | | 40,538,823 | |
Professional Services – 2.1% | | | |
| | CoStar Group Inc* | | 27,655 | | | 19,653,579 | |
Semiconductor & Semiconductor Equipment – 8.5% | | | |
| | ASML Holding NV | | 56,609 | | | 20,833,810 | |
| | Lam Research Corp | | 29,219 | | | 9,451,178 | |
| | Microchip Technology Inc | | 74,542 | | | 7,850,018 | |
| | NVIDIA Corp | | 50,564 | | | 19,209,769 | |
| | Texas Instruments Inc | | 165,868 | | | 21,060,260 | |
| | | 78,405,035 | |
Software – 17.4% | | | |
| | Adobe Inc* | | 74,698 | | | 32,516,786 | |
| | Avalara Inc* | | 89,312 | | | 11,886,534 | |
| | Microsoft Corp | | 407,075 | | | 82,843,833 | |
| | salesforce.com Inc* | | 180,945 | | | 33,896,427 | |
| | | 161,143,580 | |
| | |
See Notes to Schedule of Investments and Other Information and Notes to Financial Statements. |
| |
8 | JUNE 30, 2020 |
Janus Henderson VIT Forty Portfolio
Schedule of Investments (unaudited)
June 30, 2020
| | | | | | | | |
Shares or
Principal Amounts | | | Value | |
Common Stocks – (continued) | | | |
Specialty Retail – 2.6% | | | |
| | Home Depot Inc | | 96,149 | | | $24,086,286 | |
Technology Hardware, Storage & Peripherals – 5.9% | | | |
| | Apple Inc | | 148,379 | | | 54,128,659 | |
Textiles, Apparel & Luxury Goods – 4.4% | | | |
| | Lululemon Athletica Inc* | | 21,321 | | | 6,652,365 | |
| | LVMH Moet Hennessy Louis Vuitton SE | | 44,143 | | | 19,332,971 | |
| | NIKE Inc | | 147,294 | | | 14,442,177 | |
| | | 40,427,513 | |
Wireless Telecommunication Services – 2.4% | | | |
| | T-Mobile US Inc* | | 214,575 | | | 22,347,986 | |
Total Common Stocks (cost $525,472,235) | | 919,448,660 | |
Investment Companies – 0.8% | | | |
Money Markets – 0.8% | | | |
| | Janus Henderson Cash Liquidity Fund LLC, 0.1535%ºº,£ (cost $7,687,698) | | 7,687,556 | | | 7,688,325 | |
Investments Purchased with Cash Collateral from Securities Lending – 0.9% | | | |
Investment Companies – 0.7% | | | |
| | Janus Henderson Cash Collateral Fund LLC, 0.0368%ºº,£ | | 6,398,181 | | | 6,398,181 | |
Time Deposits – 0.2% | | | |
| | Royal Bank of Canada, 0.0900%, 7/1/20 | | $1,599,545 | | | 1,599,545 | |
Total Investments Purchased with Cash Collateral from Securities Lending (cost $7,997,726) | | 7,997,726 | |
Total Investments (total cost $541,157,659) – 101.2% | | 935,134,711 | |
Liabilities, net of Cash, Receivables and Other Assets – (1.2)% | | (10,901,244) | |
Net Assets – 100% | | $924,233,467 | |
| | | | | | |
Summary of Investments by Country - (Long Positions) (unaudited) |
| |
| | | | | % of | |
| | | | | Investment | |
Country | | Value | | Securities | |
United States | | $894,967,930 | | 95.7 | % |
Netherlands | | 20,833,810 | | 2.2 | |
France | | 19,332,971 | | 2.1 | |
| | | | | | |
| | | | | | |
Total | | $935,134,711 | | 100.0 | % |
| | |
See Notes to Schedule of Investments and Other Information and Notes to Financial Statements. |
| |
Janus Aspen Series | 9 |
Janus Henderson VIT Forty Portfolio
Schedule of Investments (unaudited)
June 30, 2020
Schedules of Affiliated Investments – (% of Net Assets)
| | | | | | | | | | | |
| | Dividend Income | Realized Gain/(Loss) | Change in Unrealized Appreciation/ Depreciation | Value at 6/30/20 |
Investment Companies - 0.8% |
Money Markets - 0.8% |
| | Janus Henderson Cash Liquidity Fund LLC, 0.1535%ºº | $ | 97,840 | $ | 5,174 | $ | 850 | $ | 7,688,325 |
Investments Purchased with Cash Collateral from Securities Lending - 0.7% |
Investment Companies - 0.7% |
| | Janus Henderson Cash Collateral Fund LLC, 0.0368%ºº | | 278,585∆ | | - | | - | | 6,398,181 |
Total Affiliated Investments - 1.5% | $ | 376,425 | $ | 5,174- | $ | 850 | $ | 14,086,506 |
| | | | | | | | | | | |
| | Value at 12/31/19 | Purchases | Sales Proceeds | Value at 6/30/20 |
Investment Companies - 0.8% |
Money Markets - 0.8% |
| | Janus Henderson Cash Liquidity Fund LLC, 0.1535%ºº | | 17,377,343 | | 157,584,891 | | (167,279,933) | | 7,688,325 |
Investments Purchased with Cash Collateral from Securities Lending - 0.7% |
Investment Companies - 0.7% |
| | Janus Henderson Cash Collateral Fund LLC, 0.0368%ºº | | - | | 19,515,652 | | (13,117,471) | | 6,398,181 |
| | |
See Notes to Schedule of Investments and Other Information and Notes to Financial Statements. |
| |
10 | JUNE 30, 2020 |
Janus Henderson VIT Forty Portfolio
Notes to Schedule of Investments and Other Information (unaudited)
| | |
Russell 1000® Growth Index | Russell 1000® Growth Index reflects the performance of U.S. large-cap equities with higher price-to-book ratios and higher forecasted growth values. |
S&P 500® Index | S&P 500® Index reflects U.S. large-cap equity performance and represents broad U.S. equity market performance. |
| | |
LLC | Limited Liability Company |
| | |
* | Non-income producing security. |
| | |
ºº | Rate shown is the 7-day yield as of June 30, 2020. |
| | |
# | Loaned security; a portion of the security is on loan at June 30, 2020. |
| | |
£ | The Portfolio may invest in certain securities that are considered affiliated companies. As defined by the Investment Company Act of 1940, as amended, an affiliated company is one in which the Portfolio owns 5% or more of the outstanding voting securities, or a company which is under common ownership or control. |
| | |
∆ | Net of income paid to the securities lending agent and rebates paid to the borrowing counterparties. |
| | | | | | | | | | | | | |
The following is a summary of the inputs that were used to value the Portfolio’s investments in securities and other financial instruments as of June 30, 2020. See Notes to Financial Statements for more information. |
| |
Valuation Inputs Summary |
| | | | | | | |
| | | | | Level 2 - | | Level 3 - |
| | | Level 1 - | | Other Significant | | Significant |
| | | Quoted Prices | | Observable Inputs | | Unobservable Inputs |
| | | | | | | |
Assets | | | | | | |
Investments In Securities: | | | | | | |
Common Stocks | | | | | | |
Textiles, Apparel & Luxury Goods | $ | 21,094,542 | $ | 19,332,971 | $ | - |
All Other | | 879,021,147 | | - | | - |
Investment Companies | | - | | 7,688,325 | | - |
Investments Purchased with Cash Collateral from Securities Lending | | - | | 7,997,726 | | - |
Total Assets | $ | 900,115,689 | $ | 35,019,022 | $ | - |
| | | | | | | |
Janus Henderson VIT Forty Portfolio
Statement of Assets and Liabilities (unaudited)
June 30, 2020
| | | | | | | |
| | | | | | |
Assets: | | | | |
| Unaffiliated investments, at value(1)(2) | | $ | 921,048,205 | |
| Affiliated investments, at value(3) | | | 14,086,506 | |
| Cash | | | 347 | |
| Non-interested Trustees' deferred compensation | | | 19,045 | |
| Receivables: | | | | |
| | Dividends | | | 340,016 | |
| | Portfolio shares sold | | | 176,377 | |
| | Foreign tax reclaims | | | 7,160 | |
| | Dividends from affiliates | | | 2,159 | |
| Other assets | | | 93,149 | |
Total Assets | | | 935,772,964 | |
Liabilities: | | | | |
| Collateral for securities loaned (Note 2) | | | 7,997,726 | |
| Payables: | | | — | |
| | Portfolio shares repurchased | | | 2,791,461 | |
| | Advisory fees | | | 475,478 | |
| | 12b-1 Distribution and shareholder servicing fees | | | 109,260 | |
| | Transfer agent fees and expenses | | | 39,604 | |
| | Non-interested Trustees' deferred compensation fees | | | 19,045 | |
| | Non-affiliated portfolio administration fees payable | | | 18,898 | |
| | Professional fees | | | 17,335 | |
| | Non-interested Trustees' fees and expenses | | | 4,277 | |
| | Affiliated portfolio administration fees payable | | | 1,857 | |
| | Custodian fees | | | 1,693 | |
| | Accrued expenses and other payables | | | 62,863 | |
Total Liabilities | | | 11,539,497 | |
Net Assets | | $ | 924,233,467 | |
Net Assets Consist of: | | | | |
| Capital (par value and paid-in surplus) | | $ | 479,180,586 | |
| Total distributable earnings (loss) | | | 445,052,881 | |
Total Net Assets | | $ | 924,233,467 | |
Net Assets - Institutional Shares | | $ | 381,570,831 | |
| Shares Outstanding, $0.01 Par Value (unlimited shares authorized) | | | 8,418,855 | |
Net Asset Value Per Share | | $ | 45.32 | |
Net Assets - Service Shares | | $ | 542,662,636 | |
| Shares Outstanding, $0.01 Par Value (unlimited shares authorized) | | | 12,869,814 | |
Net Asset Value Per Share | | $ | 42.17 | |
| |
(1) Includes cost of $527,071,780. (2) Includes $7,831,492 of securities on loan. See Note 2 in Notes to Financial Statements. (3) Includes cost of $14,085,879. |
| | |
See Notes to Financial Statements. |
| |
12 | JUNE 30, 2020 |
Janus Henderson VIT Forty Portfolio
Statement of Operations (unaudited)
For the period ended June 30, 2020
| | | | | | |
| | | | | |
Investment Income: | | | |
| Dividends | $ | 3,383,310 | |
| Affiliated securities lending income, net | | 278,585 | |
| Dividends from affiliates | | 97,840 | |
| Unaffiliated securities lending income, net | | 3,142 | |
| Foreign tax withheld | | (13,670) | |
Total Investment Income | | 3,749,207 | |
Expenses: | | | |
| Advisory fees | | 2,964,550 | |
| 12b-1 Distribution and shareholder servicing fees: | | | |
| | Service Shares | | 626,658 | |
| Transfer agent administrative fees and expenses: | | | |
| | Institutional Shares | | 87,260 | |
| | Service Shares | | 125,332 | |
| Other transfer agent fees and expenses: | | | |
| | Institutional Shares | | 8,511 | |
| | Service Shares | | 5,762 | |
| Shareholder reports expense | | 20,346 | |
| Professional fees | | 19,834 | |
| Registration fees | | 11,740 | |
| Affiliated portfolio administration fees | | 10,630 | |
| Non-interested Trustees’ fees and expenses | | 7,710 | |
| Custodian fees | | 5,539 | |
| Other expenses | | 45,664 | |
Total Expenses | | 3,939,536 | |
Net Investment Income/(Loss) | | (190,329) | |
Net Realized Gain/(Loss) on Investments: | | | |
| Investments and foreign currency transactions | | 51,282,171 | |
| Investments in affiliates | | 5,174 | |
Total Net Realized Gain/(Loss) on Investments | | 51,287,345 | |
Change in Unrealized Net Appreciation/Depreciation: | | | |
| Investments, foreign currency translations and non-interested Trustees’ deferred compensation | | 37,904,505 | |
| Investments in affiliates | | 850 | |
Total Change in Unrealized Net Appreciation/Depreciation | | 37,905,355 | |
Net Increase/(Decrease) in Net Assets Resulting from Operations | $ | 89,002,371 | |
| | | | | |
| | |
See Notes to Financial Statements. |
| |
Janus Aspen Series | 13 |
Janus Henderson VIT Forty Portfolio
Statements of Changes in Net Assets
| | | | | | | | | |
| | | | | | | | |
| | | Period ended
June 30, 2020 (unaudited) | | Year ended
December 31, 2019 | |
| | | | | | | | | |
Operations: | | | | | | |
| Net investment income/(loss) | $ | (190,329) | | $ | 678,107 | |
| Net realized gain/(loss) on investments | | 51,287,345 | | | 71,678,445 | |
| Change in unrealized net appreciation/depreciation | | 37,905,355 | | | 183,133,171 | |
Net Increase/(Decrease) in Net Assets Resulting from Operations | | 89,002,371 | | | 255,489,723 | |
Dividends and Distributions to Shareholders | | | | | | |
| | Institutional Shares | | (28,629,140) | | | (27,749,524) | |
| | Service Shares | | (43,209,494) | | | (42,198,627) | |
Net Decrease from Dividends and Distributions to Shareholders | | (71,838,634) | | | (69,948,151) | |
Capital Share Transactions: | | | | | | |
| | Institutional Shares | | 11,410,846 | | | (6,219,350) | |
| | Service Shares | | 8,545,667 | | | (11,662,110) | |
Net Increase/(Decrease) from Capital Share Transactions | | 19,956,513 | | | (17,881,460) | |
Net Increase/(Decrease) in Net Assets | | 37,120,250 | | | 167,660,112 | |
Net Assets: | | | | | | |
| Beginning of period | | 887,113,217 | | | 719,453,105 | |
| End of period | $ | 924,233,467 | | $ | 887,113,217 | |
| | | | | | | | |
| | |
See Notes to Financial Statements. |
| |
14 | JUNE 30, 2020 |
Janus Henderson VIT Forty Portfolio
Financial Highlights
| | | | | | | | | | | | | | | | | | | | | | |
Institutional Shares | | | | | | | | | | | | | | | | | | |
For a share outstanding during the period ended June 30, 2020 (unaudited) and the year ended December 31 | 2020 | | | 2019 | | | 2018 | | | 2017 | | | 2016 | | | 2015 | |
| Net Asset Value, Beginning of Period | | $44.38 | | | $35.20 | | | $39.76 | | | $32.19 | | | $36.37 | | | $40.27 | |
| Income/(Loss) from Investment Operations: | | | | | | | | | | | | | | | | | | |
| | Net investment income/(loss)(1) | | 0.02 | | | 0.09 | | | 0.07 | | | 0.02 | | | 0.05 | | | 0.03 | |
| | Net realized and unrealized gain/(loss) | | 4.58 | | | 12.55 | | | 1.31 | | | 9.58 | | | 0.58 | | | 4.77 | |
| Total from Investment Operations | | 4.60 | | | 12.64 | | | 1.38 | | | 9.60 | | | 0.63 | | | 4.80 | |
| Less Dividends and Distributions: | | | | | | | | | | | | | | | | | | |
| | Dividends (from net investment income) | | (0.14) | | | (0.06) | | | — | | | — | | | — | | | — | |
| | Distributions (from capital gains) | | (3.52) | | | (3.40) | | | (5.94) | | | (2.03) | | | (4.81) | | | (8.70) | |
| Total Dividends and Distributions | | (3.66) | | | (3.46) | | | (5.94) | | | (2.03) | | | (4.81) | | | (8.70) | |
| Net Asset Value, End of Period | | $45.32 | | | $44.38 | | | $35.20 | | | $39.76 | | | $32.19 | | | $36.37 | |
| Total Return* | | 10.84% | | | 37.16% | | | 1.98% | | | 30.31% | | | 2.20% | | | 12.22% | |
| Net Assets, End of Period (in thousands) | | $381,571 | | | $362,001 | | | $292,132 | | | $309,258 | | | $257,009 | | | $295,725 | |
| Average Net Assets for the Period (in thousands) | | $352,946 | | | $337,416 | | | $327,962 | | | $297,125 | | | $273,374 | | | $298,904 | |
| Ratios to Average Net Assets**: | | | | | | | | | | | | | | | | | | |
| | Ratio of Gross Expenses | | 0.78% | | | 0.77% | | | 0.71% | | | 0.82% | | | 0.72% | | | 0.69% | |
| | Ratio of Net Expenses (After Waivers and Expense Offsets) | | 0.78% | | | 0.77% | | | 0.71% | | | 0.82% | | | 0.72% | | | 0.69% | |
| | Ratio of Net Investment Income/(Loss) | | 0.10% | | | 0.23% | | | 0.17% | | | 0.05% | | | 0.15% | | | 0.08% | |
| Portfolio Turnover Rate | | 26% | | | 35% | | | 41% | | | 39% | | | 53% | | | 55% | |
| | | | | | | | | | | | | | | | | | | | | | |
| | | | | | | | | | | | | | | | | | | | | | |
Service Shares | | | | | | | | | | | | | | | | | | |
For a share outstanding during the period ended June 30, 2020 (unaudited) and the year ended December 31 | 2020 | | | 2019 | | | 2018 | | | 2017 | | | 2016 | | | 2015 | |
| Net Asset Value, Beginning of Period | | $41.53 | | | $33.15 | | | $37.84 | | | $30.79 | | | $35.08 | | | $39.21 | |
| Income/(Loss) from Investment Operations: | | | | | | | | | | | | | | | | | | |
| | Net investment income/(loss)(1) | | (0.03) | | | (0.01) | | | (0.03) | | | (0.07) | | | (0.03) | | | (0.06) | |
| | Net realized and unrealized gain/(loss) | | 4.27 | | | 11.80 | | | 1.28 | | | 9.15 | | | 0.55 | | | 4.63 | |
| Total from Investment Operations | | 4.24 | | | 11.79 | | | 1.25 | | | 9.08 | | | 0.52 | | | 4.57 | |
| Less Dividends and Distributions: | | | | | | | | | | | | | | | | | | |
| | Dividends (from net investment income) | | (0.08) | | | (0.01) | | | — | | | — | | | — | | | — | |
| | Distributions (from capital gains) | | (3.52) | | | (3.40) | | | (5.94) | | | (2.03) | | | (4.81) | | | (8.70) | |
| Total Dividends and Distributions | | (3.60) | | | (3.41) | | | (5.94) | | | (2.03) | | | (4.81) | | | (8.70) | |
| Net Asset Value, End of Period | | $42.17 | | | $41.53 | | | $33.15 | | | $37.84 | | | $30.79 | | | $35.08 | |
| Total Return* | | 10.71% | | | 36.85% | | | 1.72% | | | 29.99% | | | 1.94% | | | 11.94% | |
| Net Assets, End of Period (in thousands) | | $542,663 | | | $525,112 | | | $427,321 | | | $466,969 | | | $430,510 | | | $501,003 | |
| Average Net Assets for the Period (in thousands) | | $506,966 | | | $495,465 | | | $487,559 | | | $457,168 | | | $464,943 | | | $501,868 | |
| Ratios to Average Net Assets**: | | | | | | | | | | | | | | | | | | |
| | Ratio of Gross Expenses | | 1.02% | | | 1.02% | | | 0.96% | | | 1.06% | | | 0.97% | | | 0.94% | |
| | Ratio of Net Expenses (After Waivers and Expense Offsets) | | 1.02% | | | 1.02% | | | 0.96% | | | 1.06% | | | 0.97% | | | 0.94% | |
| | Ratio of Net Investment Income/(Loss) | | (0.15)% | | | (0.02)% | | | (0.08)% | | | (0.19)% | | | (0.09)% | | | (0.17)% | |
| Portfolio Turnover Rate | | 26% | | | 35% | | | 41% | | | 39% | | | 53% | | | 55% | |
| | | | | | | | | | | | | | | | | | | | | | |
| |
* Total return includes adjustments in accordance with generally accepted accounting principles required at the year or period end and are not annualized for periods of less than one full year. Total return does not include fees, charges, or expenses imposed by the variable annuity and life insurance contracts for which Janus Aspen Series serves as an underlying investment vehicle. ** Annualized for periods of less than one full year. (1) Per share amounts are calculated based on average shares outstanding during the year or period. |
| | |
See Notes to Financial Statements. |
| |
Janus Aspen Series | 15 |
Janus Henderson VIT Forty Portfolio
Notes to Financial Statements (unaudited)
1. Organization and Significant Accounting Policies
Janus Henderson VIT Forty Portfolio (the “Portfolio”) is a series of Janus Aspen Series (the “Trust”), which is organized as a Delaware statutory trust and is registered under the Investment Company Act of 1940, as amended (the “1940 Act”), as an open-end management investment company, and therefore has applied the specialized accounting and reporting guidance in Financial Accounting Standards Board (“FASB”) Accounting Standards Codification (“ASC”) Topic 946. The Trust offers 11 portfolios, each of which offers multiple share classes, with differing investment objectives and policies. The Portfolio seeks long-term growth of capital. The Portfolio is classified as nondiversified, as defined in the 1940 Act.
The Portfolio currently offers two classes of shares: Institutional Shares and Service Shares. Each class represents an interest in the same portfolio of investments. Institutional Shares are offered only in connection with investment in and payments under variable insurance contracts as well as certain qualified retirement plans. Service Shares are offered only in connection with investment in and payments under variable insurance contracts as well as certain qualified retirement plans that require a fee from Portfolio assets to procure distribution and administrative services to contract owners and plan participants.
Shareholders, including other portfolios, participating insurance companies, as well as accounts, may from time to time own (beneficially or of record) a significant percentage of the Portfolio’s Shares and can be considered to “control” the Portfolio when that ownership exceeds 25% of the Portfolio’s assets (and which may differ from control as determined in accordance with United States of America generally accepted accounting priciples ("US GAAP")).
The following accounting policies have been followed by the Portfolio and are in conformity with US GAAP.
Investment Valuation
Securities held by the Portfolio are valued in accordance with policies and procedures established by and under the supervision of the Trustees (the “Valuation Procedures”). Equity securities traded on a domestic securities exchange are generally valued at the closing prices on the primary market or exchange on which they trade. If such price is lacking for the trading period immediately preceding the time of determination, such securities are valued at their current bid price. Equity securities that are traded on a foreign exchange are generally valued at the closing prices on such markets. In the event that there is no current trading volume on a particular security in such foreign exchange, the bid price from the primary exchange is generally used to value the security. Securities that are traded on the over-the-counter (“OTC”) markets are generally valued at their closing or latest bid prices as available. Foreign securities and currencies are converted to U.S. dollars using the applicable exchange rate in effect at the close of the New York Stock Exchange (“NYSE”). The Portfolio will determine the market value of individual securities held by it by using prices provided by one or more approved professional pricing services or, as needed, by obtaining market quotations from independent broker-dealers. Most debt securities are valued in accordance with the evaluated bid price supplied by the pricing service that is intended to reflect market value. The evaluated bid price supplied by the pricing service is an evaluation that may consider factors such as security prices, yields, maturities and ratings. Certain short-term securities maturing within 60 days or less may be evaluated and valued on an amortized cost basis provided that the amortized cost determined approximates market value. Securities for which market quotations or evaluated prices are not readily available or deemed unreliable are valued at fair value determined in good faith under the Valuation Procedures. Circumstances in which fair value pricing may be utilized include, but are not limited to: (i) a significant event that may affect the securities of a single issuer, such as a merger, bankruptcy, or significant issuer-specific development; (ii) an event that may affect an entire market, such as a natural disaster or significant governmental action; (iii) a nonsignificant event such as a market closing early or not opening, or a security trading halt; and (iv) pricing of a nonvalued security and a restricted or nonpublic security. Special valuation considerations may apply with respect to “odd-lot” fixed-income transactions which, due to their small size, may receive evaluated prices by pricing services which reflect a large block trade and not what actually could be obtained for the odd-lot position. The Portfolio uses systematic fair valuation models provided by independent third parties to value international equity securities in order to adjust for stale pricing, which may occur between the close of certain foreign exchanges and the close of the NYSE.
Valuation Inputs Summary
FASB ASC 820, Fair Value Measurements and Disclosures (“ASC 820”), defines fair value, establishes a framework for measuring fair value, and expands disclosure requirements regarding fair value measurements. This standard emphasizes that fair value is a market-based measurement that should be determined based on the assumptions that
Janus Henderson VIT Forty Portfolio
Notes to Financial Statements (unaudited)
market participants would use in pricing an asset or liability and establishes a hierarchy that prioritizes inputs to valuation techniques used to measure fair value. These inputs are summarized into three broad levels:
Level 1 – Unadjusted quoted prices in active markets the Portfolio has the ability to access for identical assets or liabilities.
Level 2 – Observable inputs other than unadjusted quoted prices included in Level 1 that are observable for the asset or liability either directly or indirectly. These inputs may include quoted prices for the identical instrument on an inactive market, prices for similar instruments, interest rates, prepayment speeds, credit risk, yield curves, default rates and similar data.
Assets or liabilities categorized as Level 2 in the hierarchy generally include: debt securities fair valued in accordance with the evaluated bid or ask prices supplied by a pricing service; securities traded on OTC markets and listed securities for which no sales are reported that are fair valued at the latest bid price (or yield equivalent thereof) obtained from one or more dealers transacting in a market for such securities or by a pricing service approved by the Portfolio’s Trustees; certain short-term debt securities with maturities of 60 days or less that are fair valued at amortized cost; and equity securities of foreign issuers whose fair value is determined by using systematic fair valuation models provided by independent third parties in order to adjust for stale pricing which may occur between the close of certain foreign exchanges and the close of the NYSE. Other securities that may be categorized as Level 2 in the hierarchy include, but are not limited to, preferred stocks, bank loans, swaps, investments in unregistered investment companies, options, and forward contracts.
Level 3 – Unobservable inputs for the asset or liability to the extent that relevant observable inputs are not available, representing the Portfolio’s own assumptions about the assumptions that a market participant would use in valuing the asset or liability, and that would be based on the best information available.
There have been no significant changes in valuation techniques used in valuing any such positions held by the Portfolio since the beginning of the fiscal year.
The inputs or methodology used for fair valuing securities are not necessarily an indication of the risk associated with investing in those securities. The summary of inputs used as of June 30, 2020 to fair value the Portfolio’s investments in securities and other financial instruments is included in the “Valuation Inputs Summary” in the Notes to Schedule of Investments and Other Information.
Investment Transactions and Investment Income
Investment transactions are accounted for as of the date purchased or sold (trade date). Dividend income is recorded on the ex-dividend date. Certain dividends from foreign securities will be recorded as soon as the Portfolio is informed of the dividend, if such information is obtained subsequent to the ex-dividend date. Dividends from foreign securities may be subject to withholding taxes in foreign jurisdictions. Interest income is recorded daily on the accrual basis and includes amortization of premiums and accretion of discounts. The Portfolio classifies gains and losses on prepayments received as an adjustment to interest income. Debt securities may be placed in non-accrual status and related interest income may be reduced by stopping current accruals and writing off interest receivables when collection of all or a portion of interest has become doubtful. Gains and losses are determined on the identified cost basis, which is the same basis used for federal income tax purposes.
Expenses
The Portfolio bears expenses incurred specifically on its behalf. Each class of shares bears a portion of general expenses, which are allocated daily to each class of shares based upon the ratio of net assets represented by each class as a percentage of total net assets. Expenses directly attributable to a specific class of shares are charged against the operations of such class.
Estimates
The preparation of financial statements in conformity with US GAAP requires management to make estimates and assumptions that affect the reported amount of assets and liabilities and disclosure of contingent assets and liabilities at the date of the financial statements, and the reported amounts of income and expenses during the reporting period. Actual results could differ from those estimates.
Janus Henderson VIT Forty Portfolio
Notes to Financial Statements (unaudited)
Indemnifications
In the normal course of business, the Portfolio may enter into contracts that contain provisions for indemnification of other parties against certain potential liabilities. The Portfolio’s maximum exposure under these arrangements is unknown, and would involve future claims that may be made against the Portfolio that have not yet occurred. Currently, the risk of material loss from such claims is considered remote.
Foreign Currency Translations
The Portfolio does not isolate that portion of the results of operations resulting from the effect of changes in foreign exchange rates on investments from the fluctuations arising from changes in market prices of securities held at the date of the financial statements. Net unrealized appreciation or depreciation of investments and foreign currency translations arise from changes in the value of assets and liabilities, including investments in securities held at the date of the financial statements, resulting from changes in the exchange rates and changes in market prices of securities held.
Currency gains and losses are also calculated on payables and receivables that are denominated in foreign currencies. The payables and receivables are generally related to foreign security transactions and income translations.
Foreign currency-denominated assets and forward currency contracts may involve more risks than domestic transactions, including currency risk, counterparty risk, political and economic risk, regulatory risk and equity risk. Risks may arise from unanticipated movements in the value of foreign currencies relative to the U.S. dollar.
Dividends and Distributions
The Portfolio may make semiannual distributions of substantially all of its investment income and an annual distribution of its net realized capital gains (if any).
The Portfolio may make certain investments in real estate investment trusts (“REITs”) which pay dividends to their shareholders based upon funds available from operations. It is quite common for these dividends to exceed the REITs’ taxable earnings and profits, resulting in the excess portion of such dividends being designated as a return of capital. If the Portfolio distributes such amounts, such distributions could constitute a return of capital to shareholders for federal income tax purposes.
Federal Income Taxes
The Portfolio intends to continue to qualify as a regulated investment company and distribute all of its taxable income in accordance with the requirements of Subchapter M of the Internal Revenue Code. Management has analyzed the Portfolio’s tax positions taken for all open federal income tax years, generally a three-year period, and has concluded that no provision for federal income tax is required in the Portfolio’s financial statements. The Portfolio is not aware of any tax positions for which it is reasonably possible that the total amounts of unrecognized tax benefits will significantly change in the next twelve months.
2. Other Investments and Strategies
Additional Investment Risk
In the aftermath of the 2007-2008 financial crisis, the financial sector experienced reduced liquidity in credit and other fixed-income markets, and an unusually high degree of volatility, both domestically and internationally. In response to the crisis, the United States and certain foreign governments, along with the U.S. Federal Reserve and certain foreign central banks, took a number of unprecedented steps designed to support the financial markets. For example, the enactment of the Dodd-Frank Act in 2010 provided for widespread regulation of financial institutions, consumer financial products and services, broker-dealers, over-the-counter derivatives, investment advisers, credit rating agencies, and mortgage lending, which expanded federal oversight in the financial sector, including the investment management industry. More recently, in response to the COVID-19 pandemic, the U.S. government and the Federal Reserve, as well as certain foreign governments and central banks, have taken extraordinary actions to support local and global economies and the financial markets, including reducing interest rates to record low levels. The withdrawal of this support, a failure of measures put in place in response to such economic uncertainty, or investor perception that such efforts were not sufficient could each negatively affect financial markets generally, and the value and liquidity of specific securities. In addition, policy and legislative changes in the United States and in other countries continue to impact many aspects of financial regulation.
Widespread disease, including pandemics and epidemics, and natural or environmental disasters, such as earthquakes, fires, floods, hurricanes, tsunamis and weather-related phenomena generally, have been and can be highly disruptive to
Janus Henderson VIT Forty Portfolio
Notes to Financial Statements (unaudited)
economies and markets, adversely impacting individual companies, sectors, industries, markets, currencies, interest and inflation rates, credit ratings, investor sentiment, and other factors affecting the value of a Fund’s investments. Economies and financial markets throughout the world have become increasingly interconnected, which increases the likelihood that events or conditions in one region or country will adversely affect markets or issuers in other regions or countries, including the United States. These disruptions could prevent a Fund from executing advantageous investment decisions in a timely manner and negatively impact a Fund’s ability to achieve its investment objective(s). Any such event(s) could have a significant adverse impact on the value of a Fund. In addition, these disruptions could also impair the information technology and other operational systems upon which the Fund’s service providers, including Janus Capital or the subadviser (as applicable), rely, and could otherwise disrupt the ability of employees of the Fund’s service providers to perform essential tasks on behalf of the Fund.
A number of countries in the European Union (“EU”) have experienced, and may continue to experience, severe economic and financial difficulties. In particular, many EU nations are susceptible to economic risks associated with high levels of debt. Many non-governmental issuers, and even certain governments, have defaulted on, or been forced to restructure, their debts. Many other issuers have faced difficulties obtaining credit or refinancing existing obligations. Financial institutions have in many cases required government or central bank support, have needed to raise capital, and/or have been impaired in their ability to extend credit. As a result, financial markets in the EU have experienced extreme volatility and declines in asset values and liquidity. Responses to these financial problems by European governments, central banks, and others, including austerity measures and reforms, may not work, may result in social unrest, and may limit future growth and economic recovery or have other unintended consequences. The risk of investing in securities in the European markets may also be heightened due to the referendum in which the United Kingdom voted to exit the EU (commonly known as “Brexit”). The United Kingdom formally left the EU on January 31, 2020 and entered into an eleven-month transition period, during which the United Kingdom will remain subject to EU laws and regulations. There is considerable uncertainty relating to the potential consequences of the United Kingdom’s exit and how negotiations for new trade agreements will be conducted or concluded.
Certain areas of the world have historically been prone to and economically sensitive to environmental events such as, but not limited to, hurricanes, earthquakes, typhoons, flooding, tidal waves, tsunamis, erupting volcanoes, wildfires or droughts, tornadoes, mudslides, or other weather-related phenomena. Such disasters, and the resulting physical or economic damage, could have a severe and negative impact on the Portfolio’s investment portfolio and, in the longer term, could impair the ability of issuers in which the Portfolio invests to conduct their businesses as they would under normal conditions. Adverse weather conditions may also have a particularly significant negative effect on issuers in the agricultural sector and on insurance and reinsurance companies that insure or reinsure against the impact of natural disasters.
Counterparties
Portfolio transactions involving a counterparty are subject to the risk that the counterparty or a third party will not fulfill its obligation to the Portfolio (“counterparty risk”). Counterparty risk may arise because of the counterparty’s financial condition (i.e., financial difficulties, bankruptcy, or insolvency), market activities and developments, or other reasons, whether foreseen or not. A counterparty’s inability to fulfill its obligation may result in significant financial loss to the Portfolio. The Portfolio may be unable to recover its investment from the counterparty or may obtain a limited recovery, and/or recovery may be delayed. The extent of the Portfolio’s exposure to counterparty risk with respect to financial assets and liabilities approximates its carrying value.
The Portfolio may be exposed to counterparty risk through participation in various programs, including, but not limited to, lending its securities to third parties, cash sweep arrangements whereby the Portfolio’s cash balance is invested in one or more types of cash management vehicles, as well as investments in, but not limited to, repurchase agreements, debt securities, and derivatives, including various types of swaps, futures and options. The Portfolio intends to enter into financial transactions with counterparties that Janus Capital believes to be creditworthy at the time of the transaction. There is always the risk that Janus Capital’s analysis of a counterparty’s creditworthiness is incorrect or may change due to market conditions. To the extent that the Portfolio focuses its transactions with a limited number of counterparties, it will have greater exposure to the risks associated with one or more counterparties.
Real Estate Investing
The Portfolio may invest in equity and debt securities of real estate-related companies. Such companies may include those in the real estate industry or real estate-related industries. These securities may include common stocks, corporate bonds, preferred stocks, and other equity securities, including, but not limited to, mortgage-backed securities,
Janus Henderson VIT Forty Portfolio
Notes to Financial Statements (unaudited)
real estate-backed securities, securities of REITs and similar REIT-like entities. A REIT is a trust that invests in real estate-related projects, such as properties, mortgage loans, and construction loans. REITs are generally categorized as equity, mortgage, or hybrid REITs. A REIT may be listed on an exchange or traded OTC.
Offsetting Assets and Liabilities
The Portfolio presents gross and net information about transactions that are either offset in the financial statements or subject to an enforceable master netting arrangement or similar agreement with a designated counterparty, regardless of whether the transactions are actually offset in the Statement of Assets and Liabilities.
The following table presents gross amounts of recognized assets and/or liabilities and the net amounts after deducting collateral that has been pledged by counterparties or has been pledged to counterparties (if applicable). For corresponding information grouped by type of instrument, see the Portfolio's Schedule of Investments.
| | | | | | | | | | |
Offsetting of Financial Assets and Derivative Assets |
| |
| | | Gross Amounts | | | | | | |
| | | of Recognized | | Offsetting Asset | | Collateral | | |
Counterparty | | Assets | | or Liability(a) | | Pledged(b) | | Net Amount |
| | | | | | | | | |
JPMorgan Chase Bank, National Association | $ | 7,831,492 | $ | — | $ | (7,831,492) | $ | — |
| | | | | | | | | |
(a) | Represents the amount of assets or liabilities that could be offset with the same counterparty under master netting or similar agreements that management elects not to offset on the Statement of Assets and Liabilities. |
(b) | Collateral pledged is limited to the net outstanding amount due to/from an individual counterparty. The actual collateral amounts pledged may exceed these amounts and may fluctuate in value. |
JPMorgan Chase Bank, National Association acts as securities lending agent and a limited purpose custodian or subcustodian to receive and disburse cash balances and cash collateral, hold short-term investments, hold collateral, and perform other custodial functions in accordance with the Non-Custodial Securities Lending Agreement. For financial reporting purposes, the Portfolio does not offset financial instruments' payables and receivables and related collateral on the Statement of Assets and Liabilities. Securities on loan will be continuously secured by collateral which may consist of cash, U.S. Government securities, domestic and foreign short-term debt instruments, letters of credit, time deposits, repurchase agreements, money market mutual funds or other money market accounts, or such other collateral as permitted by the Securities and Exchange Commission (the “SEC”). See “Securities Lending” in the “Notes to Financial Statements” for additional information.
Securities Lending
Under procedures adopted by the Trustees, the Portfolio may seek to earn additional income by lending securities to certain qualified broker-dealers and institutions. Effective December 16, 2019, JPMorgan Chase Bank, National Association replaced Deutsche Bank AG as securities lending agent for the Portfolio. JPMorgan Chase Bank, National Association acts as securities lending agent and a limited purpose custodian or subcustodian to receive and disburse cash balances and cash collateral, hold short-term investments, hold collateral, and perform other custodial functions in accordance with the Non-Custodial Securities Lending Agreement. The Portfolio may lend portfolio securities in an amount equal to up to 1/3 of its total assets as determined at the time of the loan origination. There is the risk of delay in recovering a loaned security or the risk of loss in collateral rights if the borrower fails financially. In addition, Janus Capital makes efforts to balance the benefits and risks from granting such loans. All loans will be continuously secured by collateral which may consist of cash, U.S. Government securities, domestic and foreign short-term debt instruments, letters of credit, time deposits, repurchase agreements, money market mutual funds or other money market accounts, or such other collateral as permitted by the SEC. If the Portfolio is unable to recover a security on loan, the Portfolio may use the collateral to purchase replacement securities in the market. There is a risk that the value of the collateral could decrease below the cost of the replacement security by the time the replacement investment is made, resulting in a loss to the Portfolio. In certain circumstances individual loan transactions could yield negative returns.
Upon receipt of cash collateral, Janus Capital may invest it in affiliated or non-affiliated cash management vehicles, whether registered or unregistered entities, as permitted by the 1940 Act and rules promulgated thereunder. Janus Capital currently intends to primarily invest the cash collateral in a cash management vehicle for which Janus Capital serves as investment adviser, Janus Henderson Cash Collateral Fund LLC. An investment in Janus Henderson Cash
Janus Henderson VIT Forty Portfolio
Notes to Financial Statements (unaudited)
Collateral Fund LLC is generally subject to the same risks that shareholders experience when investing in similarly structured vehicles, such as the potential for significant fluctuations in assets as a result of the purchase and redemption activity of the securities lending program, a decline in the value of the collateral, and possible liquidity issues. Such risks may delay the return of the cash collateral and cause the Portfolio to violate its agreement to return the cash collateral to a borrower in a timely manner. As adviser to the Portfolio and Janus Henderson Cash Collateral Fund LLC, Janus Capital has an inherent conflict of interest as a result of its fiduciary duties to both the Portfolio and Janus Henderson Cash Collateral Fund LLC. Additionally, Janus Capital receives an investment advisory fee of 0.05% for managing Janus Henderson Cash Collateral Fund LLC, but it may not receive a fee for managing certain other affiliated cash management vehicles in which the Portfolio may invest, and therefore may have an incentive to allocate preferred investment opportunities to investment vehicles for which it is receiving a fee.
The value of the collateral must be at least 102% of the market value of the loaned securities that are denominated in U.S. dollars and 105% of the market value of the loaned securities that are not denominated in U.S. dollars. Loaned securities and related collateral are marked-to-market each business day based upon the market value of the loaned securities at the close of business, employing the most recent available pricing information. Collateral levels are then adjusted based on this mark-to-market evaluation.
The cash collateral invested by Janus Capital is disclosed in the Schedule of Investments (if applicable). Income earned from the investment of the cash collateral, net of rebates paid to, or fees paid by, borrowers and less the fees paid to the lending agent are included as “Affiliated securities lending income, net” on the Statement of Operations. As of June 30, 2020, securities lending transactions accounted for as secured borrowings with an overnight and continuous contractual maturity are $7,831,492. Gross amounts of recognized liabilities for securities lending (collateral received) as of June 30, 2020 is $7,997,726, resulting in the net amount due to the counterparty of $166,234.
3. Investment Advisory Agreements and Other Transactions with Affiliates
The Portfolio pays Janus Capital Management LLC (“Janus Capital”) an investment advisory fee which is calculated daily and paid monthly. The Portfolio’s "base" fee rate prior to any performance adjustment (expressed as an annual rate) is 0.64%.
The investment advisory fee rate is determined by calculating a base fee and applying a performance adjustment. The base fee rate is the same as the contractual investment advisory fee rate. The performance adjustment either increases or decreases the base fee depending on how well the Portfolio has performed relative to its benchmark index. The Portfolio's benchmark index used in the calculation is the Russell 1000® Growth Index.
The calculation of the performance adjustment applies as follows:
Investment Advisory Fee = Base Fee Rate +/- Performance Adjustment
The investment advisory fee rate paid to Janus Capital by the Portfolio consists of two components: (1) a base fee calculated by applying the contractual fixed rate of the advisory fee to the Portfolio’s average daily net assets during the previous month (“Base Fee Rate”), plus or minus (2) a performance-fee adjustment (“Performance Adjustment”) calculated by applying a variable rate of up to 0.15% (positive or negative) to the Portfolio’s average daily net assets based on the Portfolio’s relative performance compared to the cumulative investment record of its benchmark index over a 36-month performance measurement period or shorter time period, as applicable. The investment performance of a Portfolio’s Service Shares, for the performance measurement period is used to calculate the Performance Adjustment. No Performance Adjustment is applied unless the difference between the Portfolio’s investment performance and the cumulative investment record of the Portfolio’s benchmark index is 0.50% or greater (positive or negative) during the applicable performance measurement period.
The Portfolio’s prospectuses and statement(s) of additional information contain additional information about performance-based fees. The amount shown as advisory fees on the Statement of Operations reflects the Base Fee Rate plus/minus any Performance Adjustment. For the period ended June 30, 2020, the performance adjusted investment advisory fee rate before any waivers and/or reimbursements of expenses is 0.70%.
Janus Services LLC (“Janus Services”), a wholly-owned subsidiary of Janus Capital, is the Portfolio’s transfer agent. Janus Services receives an administrative services fee at an annual rate of 0.05% of the average daily net assets of the Portfolio for arranging for the provision by participating insurance companies and qualified plan service providers of administrative services, including recordkeeping, subaccounting, order processing, or other shareholder services
Janus Henderson VIT Forty Portfolio
Notes to Financial Statements (unaudited)
provided on behalf of contract holders or plan participants investing in the Portfolio. Other shareholder services may include the provision of order confirmations, periodic account statements, forwarding prospectuses, shareholder reports, and other materials to existing investors, and answering inquiries regarding accounts. Janus Services expects to use this entire fee to compensate insurance companies and qualified plan service providers for providing these services to their customers who invest in the Portfolio. Any unused portion will be reimbursed to the applicable share class at least annually.
In addition, Janus Services provides or arranges for the provision of certain other internal administrative, recordkeeping, and shareholder relations services for the Portfolio. Janus Services is not compensated for these internal services related to the shares, except for out-of-pocket costs. These amounts are disclosed as “Other transfer agent fees and expenses” on the Statement of Operations.
Under a distribution and shareholder servicing plan (the “Plan”) adopted in accordance with Rule 12b-1 under the 1940 Act, the Service Shares may pay the Trust’s distributor, Janus Distributors LLC (“Janus Distributors”), a wholly-owned subsidiary of Janus Capital, a fee for the sale and distribution and/or shareholder servicing of the Service Shares at an annual rate of up to 0.25% of the average daily net assets of the Service Shares. Under the terms of the Plan, the Trust is authorized to make payments to Janus Distributors for remittance to insurance companies and qualified plan service providers as compensation for distribution and/or shareholder services performed by such entities. These amounts are disclosed as “12b-1 Distribution and shareholder servicing fees” on the Statement of Operations. Payments under the Plan are not tied exclusively to actual 12b-1 distribution and servicing fees, and the payments may exceed 12b-1 distribution and servicing fees actually incurred. If any of the Portfolio’s actual 12b-1 distribution and servicing fees incurred during a calendar year are less than the payments made during a calendar year, the Portfolio will be refunded the difference. Refunds, if any, are included in “12b-1 Distribution and shareholder servicing fees” in the Statement of Operations.
Janus Capital serves as administrator to the Portfolio pursuant to an administration agreement between Janus Capital and the Trust. Under the administration agreement, Janus Capital is obligated to provide or arrange for the provision of certain administration, compliance, and accounting services to the Portfolio, including providing office space for the Portfolio, and is reimbursed by the Portfolio for certain of its costs in providing these services (to the extent Janus Capital seeks reimbursement and such costs are not otherwise waived). In addition, employees of Janus Capital and/or its affiliates may serve as officers of the Trust. The Portfolio pays for some or all of the salaries, fees, and expenses of Janus Capital employees and Portfolio officers, with respect to certain specified administration functions they perform on behalf of the Portfolio. The Portfolio pays these costs based on out-of-pocket expenses incurred by Janus Capital, and these costs are separate and apart from advisory fees and other expenses paid in connection with the investment advisory services Janus Capital (or any subadvisor, as applicable) provides to the Portfolio. These amounts are disclosed as “Affiliated portfolio administration fees” on the Statement of Operations. In addition, some expenses related to compensation payable to the Portfolio’s Chief Compliance Officer and certain compliance staff, all of whom are employees of Janus Capital and/or its affiliates, are shared with the Portfolio. Total compensation of $20,422 was paid to the Chief Compliance Officer and certain compliance staff by the Trust during the period ended June 30, 2020. The Portfolio's portion is reported as part of “Other expenses” on the Statement of Operations.
The Board of Trustees has adopted a deferred compensation plan (the “Deferred Plan”) for independent Trustees to elect to defer receipt of all or a portion of the annual compensation they are entitled to receive from the Portfolio. All deferred fees are credited to an account established in the name of the Trustees. The amounts credited to the account then increase or decrease, as the case may be, in accordance with the performance of one or more of the Janus Henderson funds that are selected by the Trustees. The account balance continues to fluctuate in accordance with the performance of the selected fund or funds until final payment of all amounts are credited to the account. The fluctuation of the account balance is recorded by the Portfolio as unrealized appreciation/(depreciation) and is included as of June 30, 2020 on the Statement of Assets and Liabilities in the asset, “Non-interested Trustees’ deferred compensation,” and liability, “Non-interested Trustees’ deferred compensation fees.” Additionally, the recorded unrealized appreciation/(depreciation) is included in “Total distributable earnings (loss)” on the Statement of Assets and Liabilities. Deferred compensation expenses for the period ended June 30, 2020 are included in “Non-interested Trustees’ fees and expenses” on the Statement of Operations. Trustees are allowed to change their designation of mutual funds from time to time. Amounts will be deferred until distributed in accordance with the Deferred Plan. Deferred fees of $220,425 were paid by the Trust to the Trustees under the Deferred Plan during the period ended June 30, 2020.
Janus Henderson VIT Forty Portfolio
Notes to Financial Statements (unaudited)
Pursuant to the provisions of the 1940 Act and related rules, the Portfolio may participate in an affiliated or non-affiliated cash sweep program. In the cash sweep program, uninvested cash balances of the Portfolio may be used to purchase shares of affiliated or non-affiliated money market funds or cash management pooled investment vehicles that operate as money market funds. The Portfolio is eligible to participate in the cash sweep program (the “Investing Funds”). As adviser, Janus Capital has an inherent conflict of interest because of its fiduciary duties to the affiliated money market funds or cash management pooled investment vehicles and the Investing Funds. Janus Henderson Cash Liquidity Fund LLC (the “Sweep Vehicle”) is an affiliated unregistered cash management pooled investment vehicle that invests primarily in highly-rated short-term fixed-income securities. The Sweep Vehicle operates pursuant to the provisions of the 1940 Act that govern the operation of money market funds and prices its shares at NAV reflecting market-based values of its portfolio securities (i.e., a “floating” NAV) rounded to the fourth decimal place (e.g., $1.0000). The Sweep Vehicle is permitted to impose a liquidity fee (of up to 2%) on redemptions from the Sweep Vehicle or a redemption gate that temporarily suspends redemptions from the Sweep Vehicle for up to 10 business days during a 90 day period. There are no restrictions on the Portfolio's ability to withdraw investments from the Sweep Vehicle at will, and there are no unfunded capital commitments due from the Portfolio to the Sweep Vehicle. The Sweep Vehicle does not charge any management fee, sales charge or service fee.
Any purchases and sales, realized gains/losses and recorded dividends from affiliated investments during the period ended June 30, 2020 can be found in the “Schedules of Affiliated Investments” located in the Schedule of Investments.
The Portfolio is permitted to purchase or sell securities (“cross-trade”) between itself and other funds or accounts managed by Janus Capital in accordance with Rule 17a-7 under the Investment Company Act of 1940 (“Rule 17a-7”), when the transaction is consistent with the investment objectives and policies of the Portfolio and in accordance with the Internal Cross Trade Procedures adopted by the Trust’s Board of Trustees. These procedures have been designed to ensure that any cross-trade of securities by the Portfolio from or to another fund or account that is or could be considered an affiliate of the Portfolio under certain limited circumstances by virtue of having a common investment adviser, common Officer, or common Trustee complies with Rule 17a-7. Under these procedures, each cross-trade is effected at the current market price to save costs where allowed. During the period ended June 30, 2020, the Portfolio engaged in cross trades amounting to $1,075,151 in sales, resulting in a net realized loss of $565,414. The net realized loss is included within the “Net Realized Gain/(Loss) on Investments” section of the Portfolio’s Statement of Operations.
4. Federal Income Tax
Income and capital gains distributions are determined in accordance with income tax regulations that may differ from US GAAP. These differences are due to differing treatments for items such as net short-term gains, deferral of wash sale losses, foreign currency transactions, net investment losses, and capital loss carryovers.
The Portfolio has elected to treat gains and losses on forward foreign currency contracts as capital gains and losses, if applicable. Other foreign currency gains and losses on debt instruments are treated as ordinary income for federal income tax purposes pursuant to Section 988 of the Internal Revenue Code.
The aggregate cost of investments and the composition of unrealized appreciation and depreciation of investment securities for federal income tax purposes as of June 30, 2020 are noted below. The primary differences between book and tax appreciation or depreciation of investments are wash sale loss deferrals and investments in partnerships.
| | | | |
Federal Tax Cost | Unrealized
Appreciation | Unrealized
(Depreciation) | Net Tax Appreciation/
(Depreciation) |
$ 543,831,297 | $398,248,584 | $ (6,945,170) | $ 391,303,414 |
Janus Henderson VIT Forty Portfolio
Notes to Financial Statements (unaudited)
5. Capital Share Transactions
| | | | | | | |
| | | | | | |
| | Period ended June 30, 2020 | | Year ended December 31, 2019 |
| | Shares | Amount | | Shares | Amount |
| | | | | | | |
Institutional Shares: | | | | | |
Shares sold | 671,671 | $29,694,016 | | 1,174,768 | $ 48,016,950 |
Reinvested dividends and distributions | 667,502 | 28,629,140 | | 703,924 | 27,749,524 |
Shares repurchased | (1,076,765) | (46,912,310) | | (2,021,587) | (81,985,824) |
Net Increase/(Decrease) | 262,408 | $11,410,846 | | (142,895) | $ (6,219,350) |
Service Shares: | | | | | |
Shares sold | 570,659 | $23,537,173 | | 919,315 | $ 34,835,599 |
Reinvested dividends and distributions | 1,082,945 | 43,209,494 | | 1,143,734 | 42,198,627 |
Shares repurchased | (1,428,767) | (58,201,000) | | (2,307,562) | (88,696,336) |
Net Increase/(Decrease) | 224,837 | $ 8,545,667 | | (244,513) | $(11,662,110) |
6. Purchases and Sales of Investment Securities
For the period ended June 30, 2020, the aggregate cost of purchases and proceeds from sales of investment securities (excluding any short-term securities, short-term options contracts, TBAs, and in-kind transactions, as applicable) was as follows:
| | | | |
Purchases of
Securities | Proceeds from Sales
of Securities | Purchases of Long-
Term U.S. Government
Obligations | Proceeds from Sales
of Long-Term U.S.
Government Obligations |
$218,319,160 | $ 258,876,098 | $ - | $ - |
7. Recent Accounting Pronouncements
The FASB issued Accounting Standards Update 2018-13, Fair Value Measurement (Topic 820), in August 2018. The new guidance removes, modifies and enhances the disclosures to Topic 820. For public entities, the amendments are effective for financial statements issued for fiscal years beginning after December 15, 2019, and interim periods within those fiscal years. An entity is permitted, and Management has decided, to early adopt the removed and modified disclosures in these financial statements. Management is also evaluating the implications related to the new disclosure requirements and has not yet determined the impact to the financial statements.
8. Other Matters
An outbreak of infectious respiratory illness caused by a novel coronavirus known as COVID-19 was first detected in China in December 2019 and has now been declared a pandemic by the World Health Organization. The impact of COVID-19 has been, and may continue to be, highly disruptive to economies and markets, adversely impacting individual companies, sectors, industries, markets, currencies, interest and inflation rates, credit ratings, investor sentiment, and other factors affecting the value of a Portfolio's investments. This may impact liquidity in the marketplace, which in turn may affect the Portfolio's ability to meet redemption requests. Public health crises caused by the COVID-19 pandemic may exacerbate other pre-existing political, social, and economic risks in certain countries or globally. The duration of the COVID-19 pandemic and its effects cannot be determined with certainty, and could prevent a Portfolio from executing advantageous investment decisions in a timely manner and negatively impact a Portfolio's ability to achieve its investment objective.
9. Subsequent Event
Management has evaluated whether any events or transactions occurred subsequent to June 30, 2020 and through the date of issuance of the Portfolio’s financial statements and determined that there were no material events or transactions that would require recognition or disclosure in the Portfolio’s financial statements.
Janus Henderson VIT Forty Portfolio
Additional Information (unaudited)
Proxy Voting Policies and Voting Record
A description of the policies and procedures that the Portfolio uses to determine how to vote proxies relating to its portfolio securities is available without charge: (i) upon request, by calling 1-800-525-1093; (ii) on the Portfolio’s website at janushenderson.com/proxyvoting; and (iii) on the SEC’s website at http://www.sec.gov. Additionally, information regarding the Portfolio’s proxy voting record for the most recent twelve-month period ended June 30 is also available, free of charge, through janushenderson.com/proxyvoting and from the SEC’s website at http://www.sec.gov.
Full Holdings
The Portfolio is required to disclose its complete holdings as an exhibit to Form N-PORT within 60 days of the end of the first and third fiscal quarters, and in the annual report and semiannual report to Portfolio shareholders. Historically, the Portfolio filed its complete portfolio holdings (schedule of investments) with the SEC for the first and third quarters each fiscal year on Form N-Q. The Portfolio’s Form N-PORT and Form N-Q filings: (i) are available on the SEC’s website at http://www.sec.gov; (ii) may be reviewed and copied at the SEC’s Public Reference Room in Washington, D.C. (information on the Public Reference Room may be obtained by calling 1-800-SEC-0330); and (iii) are available without charge, upon request, by calling a Janus Henderson representative at 1-877-335-2687 (toll free) . Portfolio holdings consisting of at least the names of the holdings are generally available on a monthly basis with a 30-day lag. Holdings are generally posted approximately two business days thereafter under Full Holdings for the Portfolio at janushenderson.com/vit.
APPROVAL OF ADVISORY AGREEMENTS DURING THE PERIOD
The Trustees of Janus Aspen Series, each of whom serves as an “independent” Trustee (the “Trustees”), oversee the management of each Portfolio of Janus Aspen Series (each, a “VIT Portfolio,” and collectively, the “VIT Portfolios”), as well as each Fund of Janus Investment Fund (together with the VIT Portfolios, the “Janus Henderson Funds,” and each, a “Janus Henderson Fund”). As required by law, the Trustees determine annually whether to continue the investment advisory agreement for each Janus Henderson Fund and the subadvisory agreements for the Janus Henderson Funds that utilize subadvisers.
In connection with their most recent consideration of those agreements for each Janus Henderson Fund, the Trustees received and reviewed information provided by Janus Capital and the respective subadvisers in response to requests of the Trustees and their independent legal counsel. They also received and reviewed information and analysis provided by, and in response to requests of, their independent fee consultant. Throughout their consideration of the agreements, the Trustees were advised by their independent legal counsel. The Trustees met with management to consider the agreements, and also met separately in executive session with their independent legal counsel and their independent fee consultant.
At a meeting held on December 5, 2019, based on the Trustees’ evaluation of the information provided by Janus Capital, the subadvisers, and the independent fee consultant, as well as other information, the Trustees determined that the overall arrangements between each Janus Henderson Fund and Janus Capital and each subadviser, as applicable, were fair and reasonable in light of the nature, extent and quality of the services provided by Janus Capital, its affiliates and the subadvisers, the fees charged for those services, and other matters that the Trustees considered relevant in the exercise of their business judgment. At that meeting, the Trustees unanimously approved the continuation of the investment advisory agreement for each Janus Henderson Fund, and the subadvisory agreement for each subadvised Janus Henderson Fund, for the period from February 1, 2020 through February 1, 2021, subject to earlier termination as provided for in each agreement.
In considering the continuation of those agreements, the Trustees reviewed and analyzed various factors that they determined were relevant, including the factors described below, none of which by itself was considered dispositive. However, the material factors and conclusions that formed the basis for the Trustees’ determination to approve the continuation of the agreements are discussed separately below. Also included is a summary of the independent fee consultant’s conclusions and opinions that arose during, and were included as part of, the Trustees’ consideration of the agreements. “Management fees,” as used herein, reflect actual annual advisory fees and, for the purpose of peer comparisons, any administration fees (excluding out of pocket costs), net of any waivers, paid by a fund as a percentage of average net assets.
Janus Henderson VIT Forty Portfolio
Additional Information (unaudited)
Nature, Extent and Quality of Services
The Trustees reviewed the nature, extent and quality of the services provided by Janus Capital and the subadvisers to the Janus Henderson Funds, taking into account the investment objective, strategies and policies of each Janus Henderson Fund, and the knowledge the Trustees gained from their regular meetings with management on at least a quarterly basis and their ongoing review of information related to the Janus Henderson Funds. In addition, the Trustees reviewed the resources and key personnel of Janus Capital and each subadviser, particularly noting those employees who provide investment and risk management services to the Janus Henderson Funds. The Trustees also considered other services provided to the Janus Henderson Funds by Janus Capital or the subadvisers, such as managing the execution of portfolio transactions and the selection of broker-dealers for those transactions. The Trustees considered Janus Capital’s role as administrator to the Janus Henderson Funds, noting that Janus Capital generally does not receive a fee for its services but is reimbursed for its out-of-pocket costs. The Trustees considered the role of Janus Capital in monitoring adherence to the Janus Henderson Funds’ investment restrictions, providing support services for the Trustees and Trustee committees, and overseeing communications with shareholders and the activities of other service providers, including monitoring compliance with various policies and procedures of the Janus Henderson Funds and with applicable securities laws and regulations.
In this regard, the independent fee consultant noted that Janus Capital provides a number of different services for the Janus Henderson Funds and fund shareholders, ranging from investment management services to various other servicing functions, and that, in its view, Janus Capital is a capable provider of those services. The independent fee consultant also provided its belief that Janus Capital has developed a number of institutional competitive advantages that should enable it to provide superior investment and service performance over the long term.
The Trustees concluded that the nature, extent and quality of the services provided by Janus Capital or the subadviser to each Janus Henderson Fund were appropriate and consistent with the terms of the respective advisory and subadvisory agreements, and that, taking into account steps taken to address those Janus Henderson Funds whose performance lagged that of their peers for certain periods, the Janus Henderson Funds were likely to benefit from the continued provision of those services. They also concluded that Janus Capital and each subadviser had sufficient personnel, with the appropriate education and experience, to serve the Janus Henderson Funds effectively and had demonstrated its ability to attract well-qualified personnel.
Performance of the Funds
The Trustees considered the performance results of each Janus Henderson Fund over various time periods. They noted that they considered Janus Henderson Fund performance data throughout the year, including periodic meetings with each Janus Henderson Fund’s portfolio manager(s), and also reviewed information comparing each Janus Henderson Fund’s performance with the performance of comparable funds and peer groups identified by Broadridge Financial Solutions, Inc. (“Broadridge”), an independent data provider, and with the Janus Henderson Fund’s benchmark index. In this regard, the independent fee consultant found that the overall Janus Henderson Funds’ performance has been reasonable: for the 36 months ended September 30, 2019, approximately 69% of the Janus Henderson Funds were in the top two quartiles of performance, as reported by Morningstar, and for the 12 months ended September 30, 2019, approximately 71% of the Janus Henderson Funds were in the top two quartiles of performance, as reported by Morningstar.
The Trustees considered the performance of each Janus Henderson Fund, noting that performance may vary by share class, and noted the following with respect to the VIT Portfolios:
· For Janus Henderson Balanced Portfolio, the Trustees noted that the Fund’s performance was in the first Broadridge quartile for the 36 months ended May 31, 2019 and the first Broadridge quartile for the 12 months ended May 31, 2019.
· For Janus Henderson Enterprise Portfolio, the Trustees noted that the Fund’s performance was in the second Broadridge quartile for the 36 months ended May 31, 2019 and the first Broadridge quartile for the 12 months ended May 31, 2019.
· For Janus Henderson Flexible Bond Portfolio, the Trustees noted that the Fund’s performance was in the bottom Broadridge quartile for the 36 months ended May 31, 2019 and the bottom Broadridge quartile for the 12 months ended May 31, 2019. The Trustees noted the reasons for the Fund’s underperformance and the steps Janus Capital had taken or was taking to improve performance.
Janus Henderson VIT Forty Portfolio
Additional Information (unaudited)
· For Janus Henderson Forty Portfolio, the Trustees noted that the Fund’s performance was in the second Broadridge quartile for the 36 months ended May 31, 2019 and the first Broadridge quartile for the 12 months ended May 31, 2019.
· For Janus Henderson Global Research Portfolio, the Trustees noted that the Fund’s performance was in the bottom Broadridge quartile for the 36 months ended May 31, 2019 and the second Broadridge quartile for the 12 months ended May 31, 2019. The Trustees noted the reasons for the Fund’s underperformance, while also noting that the Fund has a performance fee structure that results in lower management fees during periods of underperformance, and the steps Janus Capital had taken or was taking to improve performance, and that the performance trend was improving
· For Janus Henderson Global Technology Portfolio, the Trustees noted that the Fund’s performance was in the first Broadridge quartile for the 36 months ended May 31, 2019 and the first Broadridge quartile for the 12 months ended May 31, 2019.
· For Janus Henderson Mid Cap Value Portfolio, the Trustees noted that the Fund’s performance was in the second Broadridge quartile for the 36 months ended May 31, 2019 and the third Broadridge quartile for the 12 months ended May 31, 2019.
· For Janus Henderson Overseas Portfolio, the Trustees noted that the Fund’s performance was in the second Broadridge quartile for the 36 months ended May 31, 2019 and the bottom Broadridge quartile for the 12 months ended May 31, 2019.
· For Janus Henderson Research Portfolio, the Trustees noted that the Fund’s performance was in the third Broadridge quartile for the 36 months ended May 31, 2019 and the second Broadridge quartile for the 12 months ended May 31, 2019. The Trustees noted the reasons for the Fund’s underperformance, while also noting that the Fund has a performance fee structure that results in lower management fees during periods of underperformance, and the steps Janus Capital had taken or was taking to improve performance, and that the performance trend was improving
· For Janus Henderson U.S. Low Volatility Portfolio, the Trustees noted that the Fund’s performance was in the third Broadridge quartile for the 36 months ended May 31, 2019 and the first Broadridge quartile for the 12 months ended May 31, 2019. The Trustees noted the reasons for the Fund’s underperformance and the steps Janus Capital and Intech had taken or were taking to improve performance, and the performance trend was improving.
In consideration of each Janus Henderson Fund’s performance, the Trustees concluded that, taking into account the factors relevant to performance, as well as other considerations, including steps taken to improve performance, the Janus Henderson Fund’s performance warranted continuation of such Janus Henderson Fund’s investment advisory and subadvisory agreement(s).
Costs of Services Provided
The Trustees examined information regarding the fees and expenses of each Janus Henderson Fund in comparison to similar information for other comparable funds as provided by Broadridge, an independent data provider. They also reviewed an analysis of that information provided by their independent fee consultant and noted that the rate of management fees (investment advisory and any administration, but excluding out-of-pocket costs) for many of the Janus Henderson Funds, after applicable waivers, was below the average management fee rate of the respective peer group of funds selected by an independent data provider. The Trustees also examined information regarding the subadvisory fees charged for subadvisory services, as applicable, noting that all such fees were paid by Janus Capital out of its management fees collected from such Janus Henderson Fund.
The independent fee consultant provided its belief that the management fees charged by Janus Capital to each of the Janus Henderson Funds under the current investment advisory and administration agreements are reasonable in relation to the services provided by Janus Capital. The independent fee consultant found: (1) the total expenses and management fees of the Janus Henderson Funds to be reasonable relative to other mutual funds; (2) the total expenses, on average, were 10% under the average total expenses of their respective Broadridge Expense Group peers; and (3) and the management fees for the Janus Henderson Funds, on average, were 7% under the average management fees for their Expense Groups. The Trustees also considered the total expenses for each share class of
Janus Henderson VIT Forty Portfolio
Additional Information (unaudited)
each Janus Henderson Fund compared to the average total expenses for its Broadridge Expense Group peers and to average total expenses for its Broadridge Expense Universe.
For certain Janus Henderson Funds, the independent fee consultant also performed a systematic “focus list” analysis of expenses which assessed fund fees in the context of fund performance being delivered. Based on this analysis, the independent fee consultant found that the combination of service quality/performance and expenses on these individual Janus Henderson Funds was reasonable in light of performance trends, performance histories, and existence of performance fees, breakpoints, and/or expense waivers on such Janus Henderson Funds.
The Trustees considered the methodology used by Janus Capital and each subadviser in determining compensation payable to portfolio managers, the competitive environment for investment management talent, and the competitive market for mutual funds in different distribution channels.
The Trustees also reviewed management fees charged by Janus Capital and each subadviser to comparable separate account clients and to comparable non-affiliated funds subadvised by Janus Capital or by a subadviser (for which Janus Capital or the subadviser provides only or primarily portfolio management services). Although in most instances subadvisory and separate account fee rates for various investment strategies were lower than management fee rates for Janus Henderson Funds having a similar strategy, the Trustees considered that Janus Capital noted that, under the terms of the management agreements with the Janus Henderson Funds, Janus Capital performs significant additional services for the Janus Henderson Funds that it does not provide to those other clients, including administration services, oversight of the Janus Henderson Funds’ other service providers, trustee support, regulatory compliance and numerous other services, and that, in serving the Janus Henderson Funds, Janus Capital assumes many legal risks and other costs that it does not assume in servicing its other clients. Moreover, they noted that the independent fee consultant found that: (1) the management fees Janus Capital charges to the Janus Henderson Funds are reasonable in relation to the management fees Janus Capital charges to funds subadvised by Janus Capital and to the fees Janus Capital charges to its institutional separate account clients; (2) these subadvised and institutional separate accounts have different service and infrastructure needs; and (3) Janus Henderson mutual fund investors enjoy reasonable fees relative to the fees charged to Janus Henderson subadvised fund and separate account investors; (4) 11 of 12 Janus Henderson Funds have lower management fees than similar funds subadvised by Janus Capital; and (5) six of nine Janus Henderson Funds have lower management fees than similar separate accounts managed by Janus Capital.
The Trustees considered the fees for each Janus Henderson Fund for its fiscal year ended in 2018, including the VIT Portfolios, and noted the following with regard to each VIT Portfolio’s total expenses, net of applicable fee waivers (the VIT Portfolio’s “total expenses”):
· For Janus Henderson Balanced Portfolio, the Trustees noted that, although the Fund’s total expenses exceeded the peer group average for one share class, overall the Fund’s total expenses were reasonable.
· For Janus Henderson Enterprise Portfolio, the Trustees noted that, although the Fund’s total expenses exceeded the peer group average for one share class, overall the Fund’s total expenses were reasonable.
· For Janus Henderson Flexible Bond Portfolio, the Trustees noted that, although the Fund’s total expenses exceeded the peer group average for one share class, overall the Fund’s total expenses were reasonable. The Trustees also noted that Janus Capital has contractually agreed to limit the Fund’s expenses, although this limit did not apply because the Fund’s total expenses were already below the applicable fee limit.
· For Janus Henderson Forty Portfolio, the Trustees noted that, although the Fund’s total expenses exceeded the peer group average for one share class, overall the Fund’s total expenses were reasonable.
· For Janus Henderson Global Research Portfolio, the Trustees noted that the Fund’s total expenses were below the peer group average for both share classes.
· For Janus Henderson Global Technology Portfolio, the Trustees noted that the Fund’s total expenses were below the peer group average for both share classes.
· For Janus Henderson Mid Cap Value Portfolio, the Trustees noted that, although the Fund’s total expenses exceeded the peer group average for one share class, overall the Fund’s total expenses were reasonable. The Trustees also noted that Janus Capital has contractually agreed to limit the Fund’s expenses, although this limit did not apply because the Fund’s total expenses were already below the applicable fee limit.
Janus Henderson VIT Forty Portfolio
Additional Information (unaudited)
· For Janus Henderson Overseas Portfolio, the Trustees noted that the Fund’s total expenses were below the peer group average for both share classes.
· For Janus Henderson Research Portfolio, the Trustees noted that the Fund’s total expenses were below the peer group average for both share classes.
· For Janus Henderson U.S. Low Volatility Portfolio, the Trustees noted that the Fund’s total expenses were below the peer group average for its sole share class.
The Trustees reviewed information on the overall profitability to Janus Capital and its affiliates of their relationship with the Janus Henderson Funds, and considered profitability data of other publicly traded mutual fund advisers. The Trustees recognized that profitability comparisons among fund managers are difficult because of the variation in the type of comparative information that is publicly available, and the profitability of any fund manager is affected by numerous factors, including the organizational structure of the particular fund manager, differences in complex size, difference in product mix, difference in types of business (mutual fund, institutional and other), differences in the types of funds and other accounts it manages, possible other lines of business, the methodology for allocating expenses, and the fund manager’s capital structure and cost of capital.
Additionally, the Trustees considered the estimated profitability to Janus Capital from the investment management services it provided to each Janus Henderson Fund. In their review, the Trustees considered whether Janus Capital and each subadviser receive adequate incentives and resources to manage the Janus Henderson Funds effectively. In reviewing profitability, the Trustees noted that the estimated profitability for an individual Janus Henderson Fund is necessarily a product of the allocation methodology utilized by Janus Capital to allocate its expenses as part of the estimated profitability calculation. In this regard, the Trustees noted that the independent fee consultant found that (1) the expense allocation methodology and rationales utilized by Janus Capital were reasonable and (2) no clear correlation between expense allocations and operating margins. The Trustees also considered that the estimated profitability for an individual Janus Henderson Fund was influenced by a number of factors, including not only the allocation methodology selected, but also the presence of fee waivers and expense caps, and whether the Janus Henderson Fund’s investment management agreement contained breakpoints or a performance fee component. The Trustees determined, after taking into account these factors, among others, that Janus Capital’s estimated profitability with respect to each Janus Henderson Fund was not unreasonable in relation to the services provided, and that the variation in the range of such estimated profitability among the Janus Henderson Funds was not a material factor in the Board’s approval of the reasonableness of any Janus Henderson Fund’s investment management fees.
The Trustees concluded that the management fees payable by each Janus Henderson Fund to Janus Capital and its affiliates, as well as the fees paid by Janus Capital to the subadvisers of subadvised Janus Henderson Funds, were reasonable in relation to the nature, extent, and quality of the services provided, taking into account the fees charged by other advisers for managing comparable mutual funds with similar strategies, the fees Janus Capital and the subadvisers charge to other clients, and, as applicable, the impact of fund performance on management fees payable by the Janus Henderson Funds. The Trustees also concluded that each Janus Henderson Fund’s total expenses were reasonable, taking into account the size of the Janus Henderson Fund, the quality of services provided by Janus Capital and any subadviser, the investment performance of the Janus Henderson Fund, and any expense limitations agreed to or provided by Janus Capital.
Economies of Scale
The Trustees considered information about the potential for Janus Capital to realize economies of scale as the assets of the Janus Henderson Funds increase. They noted that their independent fee consultant published a report to the Trustees in November 2019 which provided its research and analysis into economies of scale. They also noted that, although many Janus Henderson Funds pay advisory fees at a base fixed rate as a percentage of net assets, without any breakpoints or performance fees, their independent fee consultant concluded that 64% of these Janus Henderson Funds’ share classes have contractual management fees (gross of waivers) below their Broadridge expense group averages. They also noted the following: (1) that for those Janus Henderson Funds whose expenses are being reduced by the contractual expense limitations of Janus Capital, Janus Capital is subsidizing certain of these Janus Henderson Funds because they have not reached adequate scale; (2) as the assets of some of the Janus Henderson Funds have declined in the past few years, certain Janus Henderson Funds have benefited from having advisory fee rates that have remained constant rather than increasing as assets declined; (3) performance fee structures have been implemented for various Janus Henderson Funds that have caused the effective rate of advisory fees payable by such a
Janus Henderson VIT Forty Portfolio
Additional Information (unaudited)
Janus Henderson Fund to vary depending on the investment performance of the Janus Henderson Fund relative to its benchmark index over the measurement period; and (4) a few Janus Henderson Funds have fee schedules with breakpoints and reduced fee rates above certain asset levels. The Trustees also noted that the Janus Henderson Funds share directly in economies of scale through the lower charges of third-party service providers that are based in part on the combined scale of all of the Janus Henderson Funds.
The Trustees also considered the independent fee consultant’s conclusion that, given the limitations of various analytical approaches to economies of scale and their conflicting results, it is difficult to analytically confirm or deny the existence of economies of scale in the Janus Henderson complex. In this regard, the independent consultant concluded that (1) to the extent there were economies of scale at Janus Capital, Janus Capital’s general strategy of setting fixed management fees below peers appeared to share any such economies with investors even on smaller Janus Henderson Funds which have not yet achieved those economies and (2) by setting lower fixed fees from the start on these Janus Henderson Funds, Janus Capital appeared to be investing to increase the likelihood that these Janus Henderson Funds will grow to a level to achieve any scale economies that may exist. Further, the independent fee consultant provided its belief that Janus Henderson Fund investors are well-served by the fee levels and performance fee structures in place on the Janus Henderson Funds in light of any economies of scale that may be present at Janus Capital.
Based on all of the information reviewed, including the recent and past research and analysis conducted by the Trustees’ independent fee consultant, the Trustees concluded that the current fee structure of each Janus Henderson Fund was reasonable and that the current rates of fees do reflect a sharing between Janus Capital and the Janus Henderson Fund of any economies of scale that may be present at the current asset level of the Janus Henderson Fund.
Other Benefits to Janus Capital
The Trustees also considered benefits that accrue to Janus Capital and its affiliates and subadvisers to the Janus Henderson Funds from their relationships with the Janus Henderson Funds. They recognized that two affiliates of Janus Capital separately serve the Janus Henderson Funds as transfer agent and distributor, respectively, and the transfer agent receives compensation directly from the non-money market funds for services provided, and that such compensation contributes to the overall profitability of Janus Capital and its affiliates that results from their relationship with the Janus Henderson Funds. The Trustees also considered Janus Capital’s past and proposed use of commissions paid by the Janus Henderson Funds on portfolio brokerage transactions to obtain proprietary and third-party research products and services benefiting the Janus Henderson Fund and/or other clients of Janus Capital and/or Janus Capital, and/or a subadviser to a Janus Henderson Fund. The Trustees concluded that Janus Capital’s and the subadvisers’ use of these types of client commission arrangements to obtain proprietary and third-party research products and services was consistent with regulatory requirements and guidelines and was likely to benefit each Janus Henderson Fund. The Trustees also concluded that, other than the services provided by Janus Capital and its affiliates and subadvisers pursuant to the agreements and the fees to be paid by each Janus Henderson Fund therefor, the Janus Henderson Funds and Janus Capital and the subadvisers may potentially benefit from their relationship with each other in other ways. They concluded that Janus Capital and its affiliates share directly in economies of scale through the lower charges of third-party service providers that are based in part on the combined scale of the Janus Henderson Funds and other clients serviced by Janus Capital and its affiliates. They also concluded that Janus Capital and/or the subadvisers benefit from the receipt of research products and services acquired through commissions paid on portfolio transactions of the Janus Henderson Funds and that the Janus Henderson Funds benefit from Janus Capital’s and/or the subadvisers’ receipt of those products and services as well as research products and services acquired through commissions paid by other clients of Janus Capital and/or other clients of the subadvisers. They further concluded that the success of any Janus Henderson Fund could attract other business to Janus Capital, the subadvisers or other Janus Henderson funds, and that the success of Janus Capital and the subadvisers could enhance Janus Capital’s and the subadvisers’ ability to serve the Janus Henderson Funds.
LIQUIDITY RISK MANAGEMENT PROGRAM
Janus Henderson Funds (other than the money market funds) have adopted and implemented a written liquidity risk management program (the “LRMP”) as required by Rule 22e-4 under the Investment Company Act of 1940, as amended (the “Liquidity Rule”). Rule 22e-4, requires open-end funds to adopt and implement a written liquidity risk management program that is reasonably designed to assess and manage liquidity risk, which is the risk that a fund could not meet redemption requests without significant dilution of remaining investors’ interest in the fund. The LRMP
Janus Henderson VIT Forty Portfolio
Additional Information (unaudited)
incorporates the following elements: (i) assessment, management, and periodic review of liquidity risk; (ii) classification of portfolio investments; (iii) the establishment and monitoring of a highly liquid investment minimum, as applicable; (iv) a 15% limitation on a Portfolio’s illiquid investments; (v) redemptions in-kind; and (vi) board oversight.
The Trustees have designated Janus Capital Management LLC, the Portfolio’s investment adviser (“Janus Capital”), as the Program Administrator for the LRMP responsible for administering the LRMP and carrying out the specific responsibilities of the LRMP. A working group comprised of various groups within Janus Capital’s business is responsible for administering the LRMP and carrying out the specific responsibilities of different aspects of the LRMP.
The Liquidity Rule requires the Trustees to review at least annually a written report provided by the Program Administrator that addresses the operation of the LRMP and assesses its adequacy and the effectiveness of its implementation, including, if applicable, the operation of the highly liquid investment minimum, and any material changes to the LRMP (the “Program Administrator Report”). During the semi-annual period ended June 30, 2020, the Program Administrator provided the Program Administrator Report to the Trustees which covered the operation of the LRMP from December 1, 2018 through December 31, 2019 (the “Reporting Period”). No significant liquidity events impacting the Portfolio were noted in the Program Administrator Report, and the Portfolio was able to process redemptions during the normal course of business during the Reporting Period. In addition, the Program Administrator expressed its belief in the Program Administrator Report that:
· the LRMP is reasonably designed and adequate to assess and manage the Portfolio’s liquidity risk, taking into account the Portfolio’s particular risks and circumstances, and includes policies and procedures reasonably designed to implement each required component of the Liquidity Rule; and
· the LRMP, including the Highly Liquid Investment Minimum where applicable, was implemented and operated effectively to achieve the goal of assessing and managing the Portfolio’s liquidity risk.
There can be no assurance that the LRMP will achieve its objectives in the future. Please refer to your Fund’s prospectus for more information regarding the risks to which an investment in the Fund may be subject.
Janus Henderson VIT Forty Portfolio
Useful Information About Your Portfolio Report (unaudited)
Management Commentary
The Management Commentary in this report includes valuable insight as well as statistical information to help you understand how your Portfolio’s performance and characteristics stack up against those of comparable indices.
If the Portfolio invests in foreign securities, this report may include information about country exposure. Country exposure is based primarily on the country of risk. A company may be allocated to a country based on other factors such as location of the company’s principal office, the location of the principal trading market for the company’s securities, or the country where a majority of the company’s revenues are derived.
Please keep in mind that the opinions expressed in the Management Commentary are just that: opinions. They are a reflection based on best judgment at the time this report was compiled, which was June 30, 2020. As the investing environment changes, so could opinions. These views are unique and are not necessarily shared by fellow employees or by Janus Henderson in general.
Performance Overviews
Performance overview graphs compare the performance of a hypothetical $10,000 investment in the Portfolio with one or more widely used market indices. When comparing the performance of the Portfolio with an index, keep in mind that market indices are not available for investment and do not reflect deduction of expenses.
Average annual total returns are quoted for a Portfolio with more than one year of performance history. Average annual total return is calculated by taking the growth or decline in value of an investment over a period of time, including reinvestment of dividends and distributions, then calculating the annual compounded percentage rate that would have produced the same result had the rate of growth been constant throughout the period. Average annual total return does not reflect the deduction of taxes that a shareholder would pay on Portfolio distributions or redemptions of Portfolio shares.
Cumulative total returns are quoted for a Portfolio with less than one year of performance history. Cumulative total return is the growth or decline in value of an investment over time, independent of the period of time involved. Cumulative total return does not reflect the deduction of taxes that a shareholder would pay on Portfolio distributions or redemptions of Portfolio shares.
Pursuant to federal securities rules, expense ratios shown in the performance chart reflect subsidized (if applicable) and unsubsidized ratios. The total annual fund operating expenses ratio is gross of any fee waivers, reflecting the Portfolio’s unsubsidized expense ratio. The net annual fund operating expenses ratio (if applicable) includes contractual waivers of Janus Capital and reflects the Portfolio’s subsidized expense ratio. Ratios may be higher or lower than those shown in the “Financial Highlights” in this report.
Schedule of Investments
Following the performance overview section is the Portfolio’s Schedule of Investments. This schedule reports the types of securities held in the Portfolio on the last day of the reporting period. Securities are usually listed by type (common stock, corporate bonds, U.S. Government obligations, etc.) and by industry classification (banking, communications, insurance, etc.). Holdings are subject to change without notice.
The value of each security is quoted as of the last day of the reporting period. The value of securities denominated in foreign currencies is converted into U.S. dollars.
If the Portfolio invests in foreign securities, it will also provide a summary of investments by country. This summary reports the Portfolio exposure to different countries by providing the percentage of securities invested in each country. The country of each security represents the country of risk. The Portfolio’s Schedule of Investments relies upon the industry group and country classifications published by Barclays and/or MSCI Inc.
Tables listing details of individual forward currency contracts, futures, written options, swaptions, and swaps follow the Portfolio’s Schedule of Investments (if applicable).
Statement of Assets and Liabilities
This statement is often referred to as the “balance sheet.” It lists the assets and liabilities of the Portfolio on the last day of the reporting period.
Janus Henderson VIT Forty Portfolio
Useful Information About Your Portfolio Report (unaudited)
The Portfolio’s assets are calculated by adding the value of the securities owned, the receivable for securities sold but not yet settled, the receivable for dividends declared but not yet received on securities owned, and the receivable for Portfolio shares sold to investors but not yet settled. The Portfolio’s liabilities include payables for securities purchased but not yet settled, Portfolio shares redeemed but not yet paid, and expenses owed but not yet paid. Additionally, there may be other assets and liabilities such as unrealized gain or loss on forward currency contracts.
The section entitled “Net Assets Consist of” breaks down the components of the Portfolio’s net assets. Because the Portfolio must distribute substantially all earnings, you will notice that a significant portion of net assets is shareholder capital.
The last section of this statement reports the net asset value (“NAV”) per share on the last day of the reporting period. The NAV is calculated by dividing the Portfolio’s net assets for each share class (assets minus liabilities) by the number of shares outstanding.
Statement of Operations
This statement details the Portfolio’s income, expenses, realized gains and losses on securities and currency transactions, and changes in unrealized appreciation or depreciation of Portfolio holdings.
The first section in this statement, entitled “Investment Income,” reports the dividends earned from securities and interest earned from interest-bearing securities in the Portfolio.
The next section reports the expenses incurred by the Portfolio, including the advisory fee paid to the investment adviser, transfer agent fees and expenses, and printing and postage for mailing statements, financial reports and prospectuses. Expense offsets and expense reimbursements, if any, are also shown.
The last section lists the amounts of realized gains or losses from investment and foreign currency transactions, and changes in unrealized appreciation or depreciation of investments and foreign currency-denominated assets and liabilities. The Portfolio will realize a gain (or loss) when it sells its position in a particular security. A change in unrealized gain (or loss) refers to the change in net appreciation or depreciation of the Portfolio during the reporting period. “Net Realized and Unrealized Gain/(Loss) on Investments” is affected both by changes in the market value of Portfolio holdings and by gains (or losses) realized during the reporting period.
Statements of Changes in Net Assets
These statements report the increase or decrease in the Portfolio’s net assets during the reporting period. Changes in the Portfolio’s net assets are attributable to investment operations, dividends and distributions to investors, and capital share transactions. This is important to investors because it shows exactly what caused the Portfolio’s net asset size to change during the period.
The first section summarizes the information from the Statement of Operations regarding changes in net assets due to the Portfolio’s investment operations. The Portfolio’s net assets may also change as a result of dividend and capital gains distributions to investors. If investors receive their dividends and/or distributions in cash, money is taken out of the Portfolio to pay the dividend and/or distribution. If investors reinvest their dividends and/or distributions, the Portfolio’s net assets will not be affected. If you compare the Portfolio’s “Net Decrease from Dividends and Distributions” to “Reinvested Dividends and Distributions,” you will notice that dividends and distributions have little effect on the Portfolio’s net assets. This is because the majority of the Portfolio’s investors reinvest their dividends and/or distributions.
The reinvestment of dividends and distributions is included under “Capital Share Transactions.” “Capital Shares” refers to the money investors contribute to the Portfolio through purchases or withdrawals via redemptions. The Portfolio’s net assets will increase and decrease in value as investors purchase and redeem shares from the Portfolio.
Financial Highlights
This schedule provides a per-share breakdown of the components that affect the Portfolio’s NAV for current and past reporting periods as well as total return, asset size, ratios, and portfolio turnover rate.
The first line in the table reflects the NAV per share at the beginning of the reporting period. The next line reports the net investment income/(loss) per share. Following is the per share total of net gains/(losses), realized and unrealized. Per share dividends and distributions to investors are then subtracted to arrive at the NAV per share at the end of the period. The next line reflects the total return for the period. The total return may include adjustments in accordance with
Janus Henderson VIT Forty Portfolio
Useful Information About Your Portfolio Report (unaudited)
generally accepted accounting principles required at the period end for financial reporting purposes. As a result, the total return may differ from the total return reflected for individual shareholder transactions. Also included are ratios of expenses and net investment income to average net assets.
The Portfolio’s expenses may be reduced through expense offsets and expense reimbursements. The ratios shown reflect expenses before and after any such offsets and reimbursements.
The ratio of net investment income/(loss) summarizes the income earned less expenses, divided by the average net assets of the Portfolio during the reporting period. Do not confuse this ratio with the Portfolio’s yield. The net investment income ratio is not a true measure of the Portfolio’s yield because it does not take into account the dividends distributed to the Portfolio’s investors.
The next figure is the portfolio turnover rate, which measures the buying and selling activity in the Portfolio. Portfolio turnover is affected by market conditions, changes in the asset size of the Portfolio, fluctuating volume of shareholder purchase and redemption orders, the nature of the Portfolio’s investments, and the investment style and/or outlook of the portfolio manager(s) and/or investment personnel. A 100% rate implies that an amount equal to the value of the entire portfolio was replaced once during the fiscal year; a 50% rate means that an amount equal to the value of half the portfolio is traded in a year; and a 200% rate means that an amount equal to the value of the entire portfolio is traded every six months.
Janus Henderson VIT Forty Portfolio
Notes
NotesPage1
Janus Henderson VIT Forty Portfolio
Notes
NotesPage2
Janus Henderson VIT Forty Portfolio
Notes
NotesPage3
Knowledge Shared
At Janus Henderson, we believe in the sharing of expert insight for better investment and business decisions. We call this ethos Knowledge Shared.
Learn more by visiting janushenderson.com.
| | | | | | | | | |
| | | | | |

| | | | |
This report is submitted for the general information of shareholders of the Portfolio. It is not an offer or solicitation for the Portfolio and is not authorized for distribution to prospective investors unless preceded or accompanied by an effective prospectus. |
Janus Henderson, Janus, Henderson, Perkins, Intech and Knowledge Shared are trademarks of Janus Henderson Group plc or one of its subsidiaries. © Janus Henderson Group plc Janus Henderson Distributors |
| | | | | 109-24-81115 08-20 |
| | | |
| | | |
| | | SEMIANNUAL REPORT June 30, 2020 |
| | |
| | Janus Henderson VIT Global Research Portfolio |
| | |
| | Janus Aspen Series |
Beginning on January 1, 2021, as permitted by regulations adopted by the Securities and Exchange Commission, the insurance company that offers your variable life insurance contract or variable annuity contract, may determine that it will no longer send you paper copies of the Portfolio’s shareholder reports, unless you specifically request paper copies of the reports. Beginning on January 1, 2021, for shareholders who are not insurance contract holders, paper copies of the Portfolio’s shareholder reports will no longer be sent by mail unless you specifically request paper copies of the reports. Instead, the reports will be made available on a website, and your insurance company or plan sponsor, broker-dealer, or financial intermediary will notify you by mail each time a report is posted and provide you with a website link to access the report. Instructions for requesting paper copies will be provided by your insurance company or plan sponsor, broker-dealer, or financial intermediary. If you already elected to receive shareholder reports electronically, you will not be affected by this change and you need not take any action. You may elect to receive shareholder reports and other communications from the Portfolio electronically by contacting your insurance company or plan sponsor, broker-dealer, or other financial intermediary. You may elect to receive all future reports in paper free of charge by contacting your insurance company or plan sponsor, broker dealer or other financial intermediary. Your election to receive reports in paper will apply to all funds held in your account with your insurance company or plan sponsor, broker dealer or other financial intermediary. |
| | | |
| | | HIGHLIGHTS · Portfolio management perspective · Investment strategy behind your portfolio · Portfolio performance, characteristics
and holdings |
| | | |
| | | 
|
Table of Contents
Janus Henderson VIT Global Research Portfolio
Janus Henderson VIT Global Research Portfolio (unaudited)
| | | | | | |
PORTFOLIO SNAPSHOT By investing in the best ideas from each global research sector team, this global all-cap growth portfolio seeks long-term growth of capital with volatility similar to its peers. Our analysts scour the globe to identify industry-leading companies with brand power, enduring business models and strong competitive positioning. | | | | | Team-Based Approach Led by Matthew Peron, Director of Research |
| | | |
Performance Overview
Janus Henderson VIT Global Research Portfolio’s Institutional Shares and Service Shares returned -3.70% and -3.82%, respectively, over the six-month period ended June 30, 2020, outperforming its primary benchmark, the MSCI World Index®, and its secondary benchmark, the MSCI All Country World Index®, which returned -5.77% and -6.25%, respectively.
Market Environment
After falling precipitously in the first quarter due to severe economic uncertainty triggered by the COVID-19 pandemic, global markets recouped much of their losses in the second quarter as the rate of infections leveled off and several countries reopened their economies. Unprecedented monetary and fiscal stimulus, as well as progress toward developing a vaccine, contributed to the rebound. Despite signs of economic improvement late in the period, however, the pace of a global economic recovery lagged that of the market recovery.
Performance Discussion
While we aim to outperform over shorter periods, our goal is to provide consistent outperformance long term by focusing on what we consider our strength: picking stocks and avoiding macroeconomic risks. Stocks are selected by our seven global sector teams, which employ a bottom-up, fundamental approach to identify what we believe are the best global opportunities.
Positive stock selection within the financials and communications sectors drove outperformance for the period. Conversely, our energy and technology holdings detracted from the Portfolio’s relative results.
Top relative contributors included technology holdings ASML and Adobe. As a leading manufacturer of chip-making equipment, ASML benefited from continued robust demand for semiconductors in multiple end markets, notably servers. Strong growth in digital media – across both creative and document clouds – drove gains for software maker Adobe, which reported record revenue for its most recent quarter. Work from home accelerated demand for certain of these products. Additionally, Adobe showed strong operating margin leverage.
Amazon also contributed to relative gains. Nearly all its business lines continued to benefit from the disrupted environment caused by the pandemic. E-commerce, both traditional and Whole Foods grocers, saw increased demand for deliveries. Amazon’s extensive direct-to-consumer distribution network proved to be a significant area of strength. Its Amazon Web Services (AWS) cloud computing platform has seen continued strength, driven in part by an increase in the number of people working from home.
While pleased to outperform the benchmark this period, we were disappointed by the weak relative results of select holdings, including Apple. The technology hardware and services company was part of a cohort of mega cap technology stocks that drove equity markets during the period. We are positive on the stock, but our weighting, while material, was underweight the Portfolio’ primary benchmark. As a result, we were unable to benefit from the rally in Apple’s stock to the same degree as our primary benchmark.
Relative detractors also included companies that experienced the greatest disruption to their businesses due to the pandemic. For example, Norwegian Cruise Line saw a significant increase in cancellations and decrease in new bookings as a result of travel bans. Given the severity of the stock’s decline and looming uncertainty about when the virus will be contained, we sold our position.
Air travel also declined sharply. Our exposure to jet engine manufacturer Safran consequently detracted from relative returns. As major airlines grounded planes, investors became concerned that Safran’s aftermarket revenues (engine service and spare parts) would decrease. We believe company fundamentals remain strong and that
Janus Henderson VIT Global Research Portfolio (unaudited)
aerospace will be one of the first industries to recover from the downturn.
Outlook
While we were encouraged by the stock market’s rebound during the second quarter, in our view, recent gains do not reflect economic reality. Notably, while several key economies enjoyed stronger-than-expected increases in manufacturing output in June, global manufacturing activity remains in a contractionary mode, suggesting the road to a broad recovery will be uneven and gradual.
What market gains did reflect was that the same mega cap technology and communications stocks that drove indices to record highs in February remained the leaders during the second quarter. Although we expect these stocks to stay in favor, we anticipate the recovery will eventually broaden and include companies whose prospects are underappreciated, including those with business models that could add value in a post-COVID-19 world or experience rebounding demand as pandemic-related lockdowns ease. Conversely, other businesses could see end markets wither away as consumer and enterprise behaviors permanently change.
In each of these scenarios, we believe long-term stock performance will be determined by a company’s underlying merits rather than by the sector in which it is categorized. With this in mind, we continue to rely on the rigorous fundamental research of our equity analysts and the capital structure expertise of our fixed income team to scrutinize the long-term viability of a company’s growth prospects and financial strength.
To that end, we have identified a number of companies with stock prices that, in our opinion, do not fully reflect their exposure to secular growth themes or ability to participate in an economic recovery. At the same time, we reduced our exposure to business models that we believe may be fundamentally challenged as the economy struggles to regain its footing. While it is too early to identify a clear path out of the COVID-19-impacted downturn, we believe our fine-tuning of the Portfolio has positioned it for a variety of economic outcomes.
Thank you for your investment in Janus Henderson VIT Global Research Portfolio.
Janus Henderson VIT Global Research Portfolio (unaudited)
Portfolio At A Glance
June 30, 2020
| | | | | | | | | | |
| | | | | | | | | |
| | | | | | | | | |
| | | | | | | | | |
| 5 Top Contributors - Holdings | 5 Top Detractors - Holdings |
| | Average
Weight | | Relative
Contribution | | | Average
Weight | | Relative
Contribution |
| Adobe Inc | 2.12% | | 0.54% | | Apple Inc | 0.02% | | -0.91% |
| Amazon.com Inc | 3.46% | | 0.50% | | Norwegian Cruise Line Holdings Ltd | 0.26% | | -0.48% |
| ASML Holding NV | 1.88% | | 0.43% | | Safran SA | 1.30% | | -0.45% |
| Netflix Inc | 1.45% | | 0.39% | | Microsoft Corp | 1.79% | | -0.43% |
| Tencent Holdings Ltd | 0.98% | | 0.34% | | Suncor Energy Inc | 0.77% | | -0.41% |
| | | | | | | |
| 3 Top Contributors - Sectors* | | | | | |
| | | Relative | | Portfolio | MSCI World Index |
| | | Contribution | | Average Weight | Average Weight |
| Financials | | 2.60% | | 19.59% | 19.34% |
| Communications | | 1.63% | | 10.67% | 10.43% |
| Other** | | -0.19% | | 0.49% | 0.02% |
| | | | | | |
| | | | | | |
| 5 Top Detractors - Sectors* | | | | | |
| | | Relative | | Portfolio | MSCI World Index |
| | | Contribution | | Average Weight | Average Weight |
| Energy | | -0.66% | | 7.32% | 7.39% |
| Technology | | -0.43% | | 15.15% | 15.59% |
| Industrials | | -0.34% | | 16.01% | 16.08% |
| Healthcare | | -0.27% | | 13.84% | 14.04% |
| Consumer | | -0.23% | | 16.93% | 17.11% |
| | | | | | | |
| Relative contribution reflects how the portolio's holdings impacted return relative to the benchmark. Cash and securities not held in the portfolio are not shown. For equity portfolios, relative contribution compares the performance of a security in the portfolio to the benchmark's total return, factoring in the difference in weight of that security in the benchmark. Returns are calculated using daily returns and previous day ending weights rolled up by ticker, excluding fixed income securities, gross of advisory fees, may exclude certain derivatives and will differ from actual performance.
Performance attribution reflects returns gross of advisory fees and may differ from actual returns as they are based on end of day holdings. Attribution is calculated by geometrically linking daily returns for the portfolio and index. |
* | The sectors listed above reflect those covered by the six analyst teams who comprise the Janus Henderson Research Team. |
** | Not a GICS classified sector. |
Janus Henderson VIT Global Research Portfolio (unaudited)
Portfolio At A Glance
June 30, 2020
| | |
5 Largest Equity Holdings - (% of Net Assets) |
Amazon.com Inc | |
Internet & Direct Marketing Retail | 4.0% |
Microsoft Corp | |
Software | 3.4% |
Apple Inc | |
Technology Hardware, Storage & Peripherals | 2.7% |
Alphabet Inc - Class C | |
Interactive Media & Services | 2.5% |
Adobe Inc | |
Software | 2.3% |
| | 14.9% |
| | | | | | |
Asset Allocation - (% of Net Assets) |
Common Stocks | | 99.6% |
Investments Purchased with Cash Collateral from Securities Lending | | 0.5% |
Rights | | 0.0% |
Other | | (0.1)% |
| | | 100.0% |
| | |
Top Country Allocations - Long Positions - (% of Investment Securities) |
As of June 30, 2020 
| As of December 31, 2019 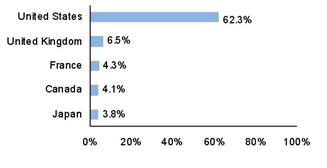
|
Janus Henderson VIT Global Research Portfolio (unaudited)
Performance
| |
See important disclosures on the next page. |

| | | | | | | | | | | |
| | | | | | | | | |
| | | | | | | | | | |
Average Annual Total Return - for the periods ended June 30, 2020 | | | Expense Ratios |
| | Fiscal
Year-to-Date | One
Year | Five
Year | Ten
Year | Since
Inception* | | | Total Annual Fund
Operating Expenses‡ |
Institutional Shares | | -3.70% | 5.05% | 6.96% | 9.86% | 8.20% | | | 0.79% |
Service Shares | | -3.82% | 4.78% | 6.70% | 9.58% | 7.92% | | | 1.04% |
MSCI World Index | | -5.77% | 2.84% | 6.90% | 9.95% | 6.86% | | | |
MSCI All Country World Index | | -6.25% | 2.11% | 6.46% | 9.16% | N/A** | | | |
Morningstar Quartile - Institutional Shares | | - | 2nd | 2nd | 2nd | 2nd | | | |
Morningstar Ranking - based on total returns for World Large Stock Funds | | - | 316/890 | 273/730 | 191/515 | 65/144 | | | |
Returns quoted are past performance and do not guarantee future results; current performance may be lower or higher. Investment returns and principal value will vary; there may be a gain or loss when shares are sold. For the most recent month-end performance call 800.668.0434 or visit janushenderson.com/VITperformance.
This Portfolio has a performance-based management fee that may adjust up or down based on the Portfolio’s performance.
Performance may be affected by risks that include those associated with non-diversification, portfolio turnover, short sales, potential conflicts of interest, foreign and emerging markets, initial public offerings (IPOs), high-yield and high-risk securities, undervalued, overlooked and smaller capitalization companies, real estate related securities including Real Estate Investment Trusts (REITs), derivatives, and commodity-linked investments. Each product has different risks. Please see the prospectus for more information about risks, holdings and other details.
Returns do not reflect the deduction of fees, charges or expenses of any insurance product or qualified plan. If applied, returns would have been lower.
Returns include reinvestment of all dividends and distributions and do not reflect the deduction of taxes that a shareholder would pay on Portfolio distributions or redemptions of Portfolio shares. The returns do not include adjustments in accordance with generally accepted accounting principles required at the period end for financial reporting purposes.
Performance for Service Shares prior to December 31, 1999 reflects the performance of Institutional Shares adjusted to reflect the expenses of Service Shares.
Ranking is for the share class shown only; other classes may have different performance characteristics.
© 2020 Morningstar, Inc. All Rights Reserved.
There is no assurance that the investment process will consistently lead to successful investing.
See Notes to Schedule of Investments and Other Information for index definitions.
Janus Henderson VIT Global Research Portfolio (unaudited)
Performance
Index performance does not reflect the expenses of managing a portfolio as an index is unmanaged and not available for direct investment.
See “Useful Information About Your Portfolio Report.”
Effective April 13, 2020, Matthew Peron is the Portfolio Manager of the Portfolio and provides general oversight of the Research Team.
*The Portfolio’s inception date – September 13, 1993
‡ As stated in the prospectus. See Financial Highlights for actual expense ratios during the reporting period.
**Since inception return is not shown for the index because the index’s inception date differs significantly from the Portfolio’s inception date.
Janus Henderson VIT Global Research Portfolio (unaudited)
Expense Examples
As a shareholder of the Portfolio, you incur two types of costs: (1) transaction costs and (2) ongoing costs, including management fees; 12b-1 distribution and shareholder servicing fees (applicable to Service Shares only); transfer agent fees and expenses payable pursuant to the Transfer Agency Agreement; and other Portfolio expenses. This example is intended to help you understand your ongoing costs (in dollars) of investing in the Portfolio and to compare these costs with the ongoing costs of investing in other mutual funds. To do so, compare this 5% hypothetical example with the 5% hypothetical examples that appear in the shareholder reports of the other funds. The example is based upon an investment of $1,000 invested at the beginning of the period and held for the six-months indicated, unless noted otherwise in the table and footnotes below.
Actual Expenses
The information in the table under the heading “Actual” provides information about actual account values and actual expenses. You may use the information in these columns, together with the amount you invested, to estimate the expenses that you paid over the period. Simply divide your account value by $1,000 (for example, an $8,600 account value divided by $1,000 = 8.6), then multiply the result by the number in the appropriate column for your share class under the heading entitled “Expenses Paid During Period” to estimate the expenses you paid on your account during the period.
Hypothetical Example for Comparison Purposes
The information in the table under the heading “Hypothetical (5% return before expenses)” provides information about hypothetical account values and hypothetical expenses based upon the Portfolio’s actual expense ratio and an assumed rate of return of 5% per year before expenses, which is not the Portfolio’s actual return. The hypothetical account values and expenses may not be used to estimate the actual ending account balance or expenses you paid for the period. You may use this information to compare the ongoing costs of investing in the Portfolio and other funds. To do so, compare this 5% hypothetical example with the 5% hypothetical examples that appear in the shareholder reports of the other funds. Additionally, for an analysis of the fees associated with an investment in either share class or other similar funds, please visit www.finra.org/fundanalyzer.
Please note that the expenses shown in the table are meant to highlight your ongoing costs only and do not reflect any transaction costs, such as any charges at the separate account level or contract level. These fees are fully described in the Portfolio’s prospectuses. Therefore, the hypothetical examples are useful in comparing ongoing costs only, and will not help you determine the relative total costs of owning different funds. In addition, if these transaction costs were included, your costs would have been higher.
| | | | | | | | | | | |
| | | | | | | | |
| | | Actual | | Hypothetical
(5% return before expenses) | |
| Beginning
Account
Value
(1/1/20) | Ending
Account
Value
(6/30/20) | Expenses
Paid During
Period
(1/1/20 - 6/30/20)† | | Beginning
Account
Value
(1/1/20) | Ending
Account
Value
(6/30/20) | Expenses
Paid During
Period
(1/1/20 - 6/30/20)† | Net Annualized
Expense Ratio
(1/1/20 - 6/30/20) |
Institutional Shares | $1,000.00 | $963.00 | $4.10 | | $1,000.00 | $1,020.69 | $4.22 | 0.84% |
Service Shares | $1,000.00 | $961.80 | $5.32 | | $1,000.00 | $1,019.44 | $5.47 | 1.09% |
† | Expenses Paid During Period are equal to the Net Annualized Expense Ratio multiplied by the average account value over the period, multiplied by 182/366 (to reflect the one-half year period). Expenses in the examples include the effect of applicable fee waivers and/or expense reimbursements, if any. Had such waivers and/or reimbursements not been in effect, your expenses would have been higher. Please refer to the Notes to Financial Statements or the Portfolio’s prospectuses for more information regarding waivers and/or reimbursements. |
Janus Henderson VIT Global Research Portfolio
Schedule of Investments (unaudited)
June 30, 2020
| | | | | | | | |
Shares or
Principal Amounts | | | Value | |
Common Stocks – 99.6% | | | |
Aerospace & Defense – 2.8% | | | |
| | CAE Inc | | 274,798 | | | $4,457,825 | |
| | L3Harris Technologies Inc | | 44,207 | | | 7,500,602 | |
| | Safran SA* | | 78,016 | | | 7,803,466 | |
| | | 19,761,893 | |
Airlines – 0.6% | | | |
| | Ryanair Holdings PLC (ADR)* | | 60,328 | | | 4,002,160 | |
Auto Components – 0.7% | | | |
| | Aptiv PLC | | 65,187 | | | 5,079,371 | |
Automobiles – 0.3% | | | |
| | Maruti Suzuki India Ltd | | 27,689 | | | 2,152,353 | |
Banks – 3.3% | | | |
| | BNP Paribas SA* | | 74,830 | | | 2,966,246 | |
| | Citigroup Inc | | 93,258 | | | 4,765,484 | |
| | HDFC Bank Ltd | | 272,691 | | | 3,887,363 | |
| | JPMorgan Chase & Co | | 122,431 | | | 11,515,860 | |
| | | 23,134,953 | |
Beverages – 3.3% | | | |
| | Constellation Brands Inc | | 74,476 | | | 13,029,576 | |
| | Pernod Ricard SA | | 65,396 | | | 10,277,386 | |
| | | 23,306,962 | |
Biotechnology – 3.6% | | | |
| | AbbVie Inc | | 79,898 | | | 7,844,386 | |
| | Ascendis Pharma A/S (ADR)* | | 16,916 | | | 2,501,876 | |
| | Global Blood Therapeutics Inc* | | 29,778 | | | 1,879,885 | |
| | Mirati Therapeutics Inc* | | 21,079 | | | 2,406,589 | |
| | Neurocrine Biosciences Inc* | | 33,321 | | | 4,065,162 | |
| | Sarepta Therapeutics Inc* | | 20,137 | | | 3,228,767 | |
| | Vertex Pharmaceuticals Inc* | | 11,513 | | | 3,342,339 | |
| | | 25,269,004 | |
Building Products – 1.2% | | | |
| | Daikin Industries Ltd | | 51,800 | | | 8,330,918 | |
Capital Markets – 3.0% | | | |
| | Blackstone Group Inc | | 121,011 | | | 6,856,483 | |
| | Hong Kong Exchanges & Clearing Ltd | | 87,300 | | | 3,720,707 | |
| | London Stock Exchange Group PLC | | 64,075 | | | 6,627,075 | |
| | Morgan Stanley | | 81,917 | | | 3,956,591 | |
| | | 21,160,856 | |
Chemicals – 2.0% | | | |
| | Air Products & Chemicals Inc | | 30,174 | | | 7,285,814 | |
| | Sherwin-Williams Co | | 11,055 | | | 6,388,132 | |
| | | 13,673,946 | |
Construction Materials – 0.2% | | | |
| | Vulcan Materials Co | | 14,207 | | | 1,645,881 | |
Consumer Finance – 1.5% | | | |
| | Nexi SpA (144A)* | | 391,752 | | | 6,766,759 | |
| | Synchrony Financial | | 172,231 | | | 3,816,639 | |
| | | 10,583,398 | |
Electronic Equipment, Instruments & Components – 2.3% | | | |
| | Hexagon AB* | | 160,868 | | | 9,379,553 | |
| | Keyence Corp | | 15,500 | | | 6,472,494 | |
| | | 15,852,047 | |
Entertainment – 2.3% | | | |
| | Liberty Media Corp-Liberty Formula One* | | 171,583 | | | 5,440,897 | |
| | Netflix Inc* | | 23,704 | | | 10,786,268 | |
| | | 16,227,165 | |
Equity Real Estate Investment Trusts (REITs) – 2.0% | | | |
| | American Tower Corp | | 19,667 | | | 5,084,706 | |
| | Crown Castle International Corp | | 28,825 | | | 4,823,864 | |
| | |
See Notes to Schedule of Investments and Other Information and Notes to Financial Statements. |
| |
8 | JUNE 30, 2020 |
Janus Henderson VIT Global Research Portfolio
Schedule of Investments (unaudited)
June 30, 2020
| | | | | | | | |
Shares or
Principal Amounts | | | Value | |
Common Stocks – (continued) | | | |
Equity Real Estate Investment Trusts (REITs) – (continued) | | | |
| | Equinix Inc | | 5,786 | | | $4,063,508 | |
| | | 13,972,078 | |
Health Care Equipment & Supplies – 2.5% | | | |
| | Abbott Laboratories | | 91,045 | | | 8,324,244 | |
| | Boston Scientific Corp* | | 182,410 | | | 6,404,415 | |
| | Dentsply Sirona Inc | | 53,536 | | | 2,358,796 | |
| | | 17,087,455 | |
Health Care Providers & Services – 1.4% | | | |
| | Centene Corp* | | 63,097 | | | 4,009,814 | |
| | Humana Inc | | 14,419 | | | 5,590,967 | |
| | | 9,600,781 | |
Hotels, Restaurants & Leisure – 2.5% | | | |
| | GVC Holdings PLC | | 633,168 | | | 5,800,405 | |
| | McDonald's Corp | | 35,887 | | | 6,620,075 | |
| | Sands China Ltd | | 1,328,400 | | | 5,198,461 | |
| | | 17,618,941 | |
Independent Power and Renewable Electricity Producers – 2.1% | | | |
| | NRG Energy Inc | | 261,378 | | | 8,510,468 | |
| | Vistra Energy Corp | | 345,495 | | | 6,433,117 | |
| | | 14,943,585 | |
Industrial Conglomerates – 0.9% | | | |
| | Honeywell International Inc | | 45,449 | | | 6,571,471 | |
Information Technology Services – 4.6% | | | |
| | Fidelity National Information Services Inc | | 56,610 | | | 7,590,835 | |
| | Mastercard Inc | | 39,838 | | | 11,780,097 | |
| | Visa Inc | | 65,027 | | | 12,561,266 | |
| | | 31,932,198 | |
Insurance – 4.9% | | | |
| | AIA Group Ltd | | 944,000 | | | 8,786,099 | |
| | Aon PLC | | 35,131 | | | 6,766,231 | |
| | Beazley PLC | | 355,692 | | | 1,804,940 | |
| | Intact Financial Corp | | 52,026 | | | 4,952,320 | |
| | Progressive Corp | | 104,869 | | | 8,401,056 | |
| | Prudential PLC | | 207,786 | | | 3,128,672 | |
| | | 33,839,318 | |
Interactive Media & Services – 5.3% | | | |
| | Alphabet Inc - Class C* | | 12,219 | | | 17,272,901 | |
| | Facebook Inc* | | 54,837 | | | 12,451,838 | |
| | Tencent Holdings Ltd | | 108,500 | | | 6,969,548 | |
| | | 36,694,287 | |
Internet & Direct Marketing Retail – 4.8% | | | |
| | Alibaba Group Holding Ltd (ADR)* | | 27,494 | | | 5,930,456 | |
| | Amazon.com Inc* | | 10,088 | | | 27,830,976 | |
| | | 33,761,432 | |
Life Sciences Tools & Services – 0.9% | | | |
| | Thermo Fisher Scientific Inc | | 16,913 | | | 6,128,256 | |
Machinery – 1.1% | | | |
| | Parker-Hannifin Corp | | 40,914 | | | 7,498,309 | |
Metals & Mining – 1.4% | | | |
| | Rio Tinto PLC | | 113,673 | | | 6,395,321 | |
| | Teck Resources Ltd | | 305,446 | | | 3,199,825 | |
| | | 9,595,146 | |
Multi-Utilities – 1.9% | | | |
| | National Grid PLC | | 394,709 | | | 4,832,502 | |
| | RWE AG | | 242,994 | | | 8,500,157 | |
| | | 13,332,659 | |
Oil, Gas & Consumable Fuels – 2.7% | | | |
| | Canadian Natural Resources Ltd | | 85,908 | | | 1,490,447 | |
| | |
See Notes to Schedule of Investments and Other Information and Notes to Financial Statements. |
| |
Janus Aspen Series | 9 |
Janus Henderson VIT Global Research Portfolio
Schedule of Investments (unaudited)
June 30, 2020
| | | | | | | | |
Shares or
Principal Amounts | | | Value | |
Common Stocks – (continued) | | | |
Oil, Gas & Consumable Fuels – (continued) | | | |
| | Cheniere Energy Inc* | | 59,686 | | | $2,884,028 | |
| | Enterprise Products Partners LP | | 127,260 | | | 2,312,314 | |
| | Marathon Petroleum Corp | | 98,101 | | | 3,667,015 | |
| | Suncor Energy Inc | | 230,665 | | | 3,889,732 | |
| | TOTAL SA# | | 120,023 | | | 4,571,247 | |
| | | 18,814,783 | |
Personal Products – 1.8% | | | |
| | Unilever NV | | 242,098 | | | 12,838,684 | |
Pharmaceuticals – 5.7% | | | |
| | AstraZeneca PLC | | 65,678 | | | 6,845,585 | |
| | Bristol-Myers Squibb Co | | 77,772 | | | 4,572,994 | |
| | Catalent Inc* | | 81,255 | | | 5,955,991 | |
| | Elanco Animal Health Inc* | | 168,004 | | | 3,603,686 | |
| | Merck & Co Inc | | 112,954 | | | 8,734,733 | |
| | Novartis AG | | 88,388 | | | 7,682,119 | |
| | Takeda Pharmaceutical Co Ltd | | 71,550 | | | 2,554,021 | |
| | | 39,949,129 | |
Road & Rail – 1.7% | | | |
| | CSX Corp | | 98,796 | | | 6,890,033 | |
| | Uber Technologies Inc* | | 156,144 | | | 4,852,956 | |
| | | 11,742,989 | |
Semiconductor & Semiconductor Equipment – 5.8% | | | |
| | ASML Holding NV | | 40,885 | | | 14,986,305 | |
| | Microchip Technology Inc | | 61,092 | | | 6,433,599 | |
| | Taiwan Semiconductor Manufacturing Co Ltd | | 822,000 | | | 8,701,239 | |
| | Texas Instruments Inc | | 78,718 | | | 9,994,824 | |
| | | 40,115,967 | |
Software – 9.7% | | | |
| | Adobe Inc* | | 37,567 | | | 16,353,291 | |
| | Autodesk Inc* | | 29,960 | | | 7,166,132 | |
| | Constellation Software Inc/Canada | | 5,110 | | | 5,770,641 | |
| | Microsoft Corp | | 116,691 | | | 23,747,785 | |
| | salesforce.com Inc* | | 47,671 | | | 8,930,208 | |
| | SS&C Technologies Holdings Inc | | 99,183 | | | 5,601,856 | |
| | | 67,569,913 | |
Technology Hardware, Storage & Peripherals – 2.7% | | | |
| | Apple Inc | | 52,299 | | | 19,078,675 | |
Textiles, Apparel & Luxury Goods – 1.8% | | | |
| | adidas AG* | | 23,682 | | | 6,195,161 | |
| | NIKE Inc | | 67,239 | | | 6,592,784 | |
| | | 12,787,945 | |
Tobacco – 1.8% | | | |
| | British American Tobacco PLC | | 331,051 | | | 12,717,362 | |
Trading Companies & Distributors – 1.4% | | | |
| | Ferguson PLC | | 122,926 | | | 10,054,300 | |
Wireless Telecommunication Services – 1.1% | | | |
| | T-Mobile US Inc* | | 72,317 | | | 7,531,816 | |
Total Common Stocks (cost $516,871,166) | | 695,958,386 | |
Rights – 0% | | | |
Wireless Telecommunication Services – 0% | | | |
| | T-Mobile US Inc* (cost $0) | | 81,648 | | | 13,717 | |
Investments Purchased with Cash Collateral from Securities Lending – 0.5% | | | |
Investment Companies – 0.4% | | | |
| | Janus Henderson Cash Collateral Fund LLC, 0.0368%ºº,£ | | 2,643,840 | | | 2,643,840 | |
| | |
See Notes to Schedule of Investments and Other Information and Notes to Financial Statements. |
| |
10 | JUNE 30, 2020 |
Janus Henderson VIT Global Research Portfolio
Schedule of Investments (unaudited)
June 30, 2020
| | | | | | | | |
Shares or
Principal Amounts | | | Value | |
Investments Purchased with Cash Collateral from Securities Lending – (continued) | | | |
Time Deposits – 0.1% | | | |
| | Royal Bank of Canada, 0.0900%, 7/1/20 | | $660,960 | | | $660,960 | |
Total Investments Purchased with Cash Collateral from Securities Lending (cost $3,304,800) | | 3,304,800 | |
Total Investments (total cost $520,175,966) – 100.1% | | 699,276,903 | |
Liabilities, net of Cash, Receivables and Other Assets – (0.1)% | | (867,505) | |
Net Assets – 100% | | $698,409,398 | |
| | | | | | |
Summary of Investments by Country - (Long Positions) (unaudited) |
| |
| | | | | % of | |
| | | | | Investment | |
Country | | Value | | Securities | |
United States | | $466,189,473 | | 66.7 | % |
United Kingdom | | 48,151,862 | | 6.9 | |
Netherlands | | 27,824,989 | | 4.0 | |
France | | 25,618,345 | | 3.7 | |
Canada | | 23,760,790 | | 3.4 | |
Hong Kong | | 17,705,267 | | 2.5 | |
Japan | | 17,357,433 | | 2.5 | |
Germany | | 14,695,318 | | 2.1 | |
China | | 12,900,004 | | 1.8 | |
Sweden | | 9,379,553 | | 1.3 | |
Taiwan | | 8,701,239 | | 1.2 | |
Switzerland | | 7,682,119 | | 1.1 | |
Italy | | 6,766,759 | | 1.0 | |
India | | 6,039,716 | | 0.9 | |
Ireland | | 4,002,160 | | 0.6 | |
Denmark | | 2,501,876 | | 0.3 | |
| | | | | | |
| | | | | | |
Total | | $699,276,903 | | 100.0 | % |
| | |
See Notes to Schedule of Investments and Other Information and Notes to Financial Statements. |
| |
Janus Aspen Series | 11 |
Janus Henderson VIT Global Research Portfolio
Schedule of Investments (unaudited)
June 30, 2020
Schedules of Affiliated Investments – (% of Net Assets)
| | | | | | | | | | | |
| | Dividend Income | Realized Gain/(Loss) | Change in Unrealized Appreciation/ Depreciation | Value at 6/30/20 |
Investment Companies - N/A |
Money Markets - N/A |
| | Janus Henderson Cash Liquidity Fund LLC, 0.1535%ºº | $ | 8,869 | $ | 373 | $ | - | $ | - |
Investments Purchased with Cash Collateral from Securities Lending - 0.4% |
Investment Companies - 0.4% |
| | Janus Henderson Cash Collateral Fund LLC, 0.0368%ºº | | 176∆ | | - | | - | | 2,643,840 |
Total Affiliated Investments - 0.4% | $ | 9,045 | $ | 373 | $ | - | $ | 2,643,840 |
| | | | | | | | | | | |
| | Value at 12/31/19 | Purchases | Sales Proceeds | Value at 6/30/20 |
Investment Companies - N/A |
Money Markets - N/A |
| | Janus Henderson Cash Liquidity Fund LLC, 0.1535%ºº | | - | | 36,716,322 | | (36,716,695) | | - |
Investments Purchased with Cash Collateral from Securities Lending - 0.4% |
Investment Companies - 0.4% |
| | Janus Henderson Cash Collateral Fund LLC, 0.0368%ºº | | - | | 2,715,120 | | (71,280) | | 2,643,840 |
| | |
See Notes to Schedule of Investments and Other Information and Notes to Financial Statements. |
| |
12 | JUNE 30, 2020 |
Janus Henderson VIT Global Research Portfolio
Notes to Schedule of Investments and Other Information (unaudited)
| | |
MSCI All Country World IndexSM | MSCI All Country World IndexSM reflects the equity market performance of global developed and emerging markets. |
MSCI World IndexSM | MSCI World IndexSM reflects the equity market performance of global developed markets. |
| | |
ADR | American Depositary Receipt |
LLC | Limited Liability Company |
LP | Limited Partnership |
PLC | Public Limited Company |
| | |
144A | Securities sold under Rule 144A of the Securities Act of 1933, as amended, are subject to legal and/or contractual restrictions on resale and may not be publicly sold without registration under the 1933 Act. Unless otherwise noted, these securities have been determined to be liquid under guidelines established by the Board of Trustees. The total value of 144A securities as of the period ended June 30, 2020 is $6,766,759, which represents 1.0% of net assets. |
| | |
* | Non-income producing security. |
| | |
ºº | Rate shown is the 7-day yield as of June 30, 2020. |
| | |
# | Loaned security; a portion of the security is on loan at June 30, 2020. |
| | |
£ | The Portfolio may invest in certain securities that are considered affiliated companies. As defined by the Investment Company Act of 1940, as amended, an affiliated company is one in which the Portfolio owns 5% or more of the outstanding voting securities, or a company which is under common ownership or control. |
| | |
∆ | Net of income paid to the securities lending agent and rebates paid to the borrowing counterparties. |
Janus Henderson VIT Global Research Portfolio
Notes to Schedule of Investments and Other Information (unaudited)
| | | | | | | | | | | | | |
The following is a summary of the inputs that were used to value the Portfolio’s investments in securities and other financial instruments as of June 30, 2020. See Notes to Financial Statements for more information. |
| |
Valuation Inputs Summary |
| | | | | | | |
| | | | | Level 2 - | | Level 3 - |
| | | Level 1 - | | Other Significant | | Significant |
| | | Quoted Prices | | Observable Inputs | | Unobservable Inputs |
| | | | | | | |
Assets | | | | | | |
Investments In Securities: | | | | | | |
Common Stocks | | | | | | |
Aerospace & Defense | $ | 11,958,427 | $ | 7,803,466 | $ | - |
Automobiles | | - | | 2,152,353 | | - |
Banks | | 16,281,344 | | 6,853,609 | | - |
Beverages | | 13,029,576 | | 10,277,386 | | - |
Building Products | | - | | 8,330,918 | | - |
Capital Markets | | 10,813,074 | | 10,347,782 | | - |
Consumer Finance | | 3,816,639 | | 6,766,759 | | - |
Electronic Equipment, Instruments & Components | | - | | 15,852,047 | | - |
Hotels, Restaurants & Leisure | | 6,620,075 | | 10,998,866 | | - |
Insurance | | 20,119,607 | | 13,719,711 | | - |
Interactive Media & Services | | 29,724,739 | | 6,969,548 | | - |
Metals & Mining | | 3,199,825 | | 6,395,321 | | - |
Multi-Utilities | | - | | 13,332,659 | | - |
Oil, Gas & Consumable Fuels | | 14,243,536 | | 4,571,247 | | - |
Personal Products | | - | | 12,838,684 | | - |
Pharmaceuticals | | 22,867,404 | | 17,081,725 | | - |
Semiconductor & Semiconductor Equipment | | 16,428,423 | | 23,687,544 | | - |
Textiles, Apparel & Luxury Goods | | 6,592,784 | | 6,195,161 | | - |
Tobacco | | - | | 12,717,362 | | - |
Trading Companies & Distributors | | - | | 10,054,300 | | - |
All Other | | 313,316,485 | | - | | - |
Rights | | 13,717 | | - | | - |
Investments Purchased with Cash Collateral from Securities Lending | | - | | 3,304,800 | | - |
Total Assets | $ | 489,025,655 | $ | 210,251,248 | $ | - |
| | | | | | | |
Janus Henderson VIT Global Research Portfolio
Statement of Assets and Liabilities (unaudited)
June 30, 2020
| | | | | | | |
| | | | | | |
Assets: | | | | |
| Unaffiliated investments, at value(1)(2) | | $ | 696,633,063 | |
| Affiliated investments, at value(3) | | | 2,643,840 | |
| Non-interested Trustees' deferred compensation | | | 14,355 | |
| Receivables: | | | | |
| | Investments sold | | | 29,725,643 | |
| | Dividends | | | 527,205 | |
| | Portfolio shares sold | | | 285,771 | |
| | Foreign tax reclaims | | | 229,239 | |
| Other assets | | | 2,982 | |
Total Assets | | | 730,062,098 | |
Liabilities: | | | | |
| Due to custodian | | | 65,919 | |
| Collateral for securities loaned (Note 2) | | | 3,304,800 | |
| Payables: | | | — | |
| | Investments purchased | | | 27,237,722 | |
| | Advisory fees | | | 425,051 | |
| | Portfolio shares repurchased | | | 407,635 | |
| | 12b-1 Distribution and shareholder servicing fees | | | 41,193 | |
| | Transfer agent fees and expenses | | | 30,946 | |
| | Professional fees | | | 17,143 | |
| | Non-interested Trustees' deferred compensation fees | | | 14,355 | |
| | Custodian fees | | | 7,180 | |
| | Non-interested Trustees' fees and expenses | | | 3,521 | |
| | Affiliated portfolio administration fees payable | | | 1,428 | |
| | Accrued expenses and other payables | | | 95,807 | |
Total Liabilities | | | 31,652,700 | |
Net Assets | | $ | 698,409,398 | |
Net Assets Consist of: | | | | |
| Capital (par value and paid-in surplus) | | $ | 509,361,345 | |
| Total distributable earnings (loss) | | | 189,048,053 | |
Total Net Assets | | $ | 698,409,398 | |
Net Assets - Institutional Shares | | $ | 497,079,620 | |
| Shares Outstanding, $0.01 Par Value (unlimited shares authorized) | | | 9,710,517 | |
Net Asset Value Per Share | | $ | 51.19 | |
Net Assets - Service Shares | | $ | 201,329,778 | |
| Shares Outstanding, $0.01 Par Value (unlimited shares authorized) | | | 4,034,018 | |
Net Asset Value Per Share | | $ | 49.91 | |
| |
(1) Includes cost of $517,532,126. (2) Includes $3,147,182 of securities on loan. See Note 2 in Notes to Financial Statements. (3) Includes cost of $2,643,840. |
| | |
See Notes to Financial Statements. |
| |
Janus Aspen Series | 15 |
Janus Henderson VIT Global Research Portfolio
Statement of Operations (unaudited)
For the period ended June 30, 2020
| | | | | | |
| | | | | |
Investment Income: | | | |
| Dividends | $ | 5,969,489 | |
| Dividends from affiliates | | 8,869 | |
| Affiliated securities lending income, net | | 176 | |
| Unaffiliated securities lending income, net | | 48 | |
| Foreign tax withheld | | (299,615) | |
Total Investment Income | | 5,678,967 | |
Expenses: | | | |
| Advisory fees | | 2,540,738 | |
| 12b-1 Distribution and shareholder servicing fees: | | | |
| | Service Shares | | 240,729 | |
| Transfer agent administrative fees and expenses: | | | |
| | Institutional Shares | | 120,387 | |
| | Service Shares | | 48,146 | |
| Other transfer agent fees and expenses: | | | |
| | Institutional Shares | | 12,978 | |
| | Service Shares | | 2,663 | |
| Professional fees | | 23,121 | |
| Shareholder reports expense | | 21,393 | |
| Custodian fees | | 18,215 | |
| Registration fees | | 11,586 | |
| Affiliated portfolio administration fees | | 8,426 | |
| Non-interested Trustees’ fees and expenses | | 6,231 | |
| Other expenses | | 40,700 | |
Total Expenses | | 3,095,313 | |
Net Investment Income/(Loss) | | 2,583,654 | |
Net Realized Gain/(Loss) on Investments: | | | |
| Investments and foreign currency transactions | | 6,359,784 | |
| Investments in affiliates | | 373 | |
Total Net Realized Gain/(Loss) on Investments | | 6,360,157 | |
Change in Unrealized Net Appreciation/Depreciation: | | | |
| Investments, foreign currency translations and non-interested Trustees’ deferred compensation(1) | | (38,360,397) | |
Total Change in Unrealized Net Appreciation/Depreciation | | (38,360,397) | |
Net Increase/(Decrease) in Net Assets Resulting from Operations | $ | (29,416,586) | |
| | | | | |
| |
(1) Includes change in unrealized appreciation/depreciation of $577 due to foreign capital gains tax on investments. |
| | |
See Notes to Financial Statements. |
| |
16 | JUNE 30, 2020 |
Janus Henderson VIT Global Research Portfolio
Statements of Changes in Net Assets
| | | | | | | | | |
| | | | | | | | |
| | | Period ended
June 30, 2020 (unaudited) | | Year ended
December 31, 2019 | |
| | | | | | | | | |
Operations: | | | | | | |
| Net investment income/(loss) | $ | 2,583,654 | | $ | 7,549,236 | |
| Net realized gain/(loss) on investments | | 6,360,157 | | | 39,064,185 | |
| Change in unrealized net appreciation/depreciation | | (38,360,397) | | | 132,017,612 | |
Net Increase/(Decrease) in Net Assets Resulting from Operations | | (29,416,586) | | | 178,631,033 | |
Dividends and Distributions to Shareholders | | | | | | |
| | Institutional Shares | | (29,357,266) | | | (35,853,466) | |
| | Service Shares | | (12,003,638) | | | (13,833,812) | |
Net Decrease from Dividends and Distributions to Shareholders | | (41,360,904) | | | (49,687,278) | |
Capital Share Transactions: | | | | | | |
| | Institutional Shares | | 7,634,515 | | | (16,577,616) | |
| | Service Shares | | 7,213,176 | | | (1,596,518) | |
Net Increase/(Decrease) from Capital Share Transactions | | 14,847,691 | | | (18,174,134) | |
Net Increase/(Decrease) in Net Assets | | (55,929,799) | | | 110,769,621 | |
Net Assets: | | | | | | |
| Beginning of period | | 754,339,197 | | | 643,569,576 | |
�� | End of period | $ | 698,409,398 | | $ | 754,339,197 | |
| | | | | | | | |
| | |
See Notes to Financial Statements. |
| |
Janus Aspen Series | 17 |
Janus Henderson VIT Global Research Portfolio
Financial Highlights
| | | | | | | | | | | | | | | | | | | | | | |
Institutional Shares | | | | | | | | | | | | | | | | | | |
For a share outstanding during the period ended June 30, 2020 (unaudited) and the year ended December 31 | 2020 | | | 2019 | | | 2018 | | | 2017 | | | 2016 | | | 2015 | |
| Net Asset Value, Beginning of Period | | $56.59 | | | $47.13 | | | $51.20 | | | $40.63 | | | $40.24 | | | $41.45 | |
| Income/(Loss) from Investment Operations: | | | | | | | | | | | | | | | | | | |
| | Net investment income/(loss)(1) | | 0.22 | | | 0.60 | | | 0.62 | | | 0.51 | | | 0.45 | | | 0.35 | |
| | Net realized and unrealized gain/(loss) | | (2.42) | | | 12.67 | | | (4.09) | | | 10.45 | | | 0.37 | | | (1.28) | |
| Total from Investment Operations | | (2.20) | | | 13.27 | | | (3.47) | | | 10.96 | | | 0.82 | | | (0.93) | |
| Less Dividends and Distributions: | | | | | | | | | | | | | | | | | | |
| | Dividends (from net investment income) | | (0.21) | | | (0.54) | | | (0.60) | | | (0.39) | | | (0.43) | | | (0.28) | |
| | Distributions (from capital gains) | | (2.99) | | | (3.27) | | | — | | | — | | | — | | | — | |
| Total Dividends and Distributions | | (3.20) | | | (3.81) | | | (0.60) | | | (0.39) | | | (0.43) | | | (0.28) | |
| Net Asset Value, End of Period | | $51.19 | | | $56.59 | | | $47.13 | | | $51.20 | | | $40.63 | | | $40.24 | |
| Total Return* | | (3.70)% | | | 29.04% | | | (6.87)% | | | 27.03% | | | 2.07% | | | (2.29)% | |
| Net Assets, End of Period (in thousands) | | $497,080 | | | $539,915 | | | $463,402 | | | $540,594 | | | $469,321 | | | $509,494 | |
| Average Net Assets for the Period (in thousands) | | $487,159 | | | $511,859 | | | $533,418 | | | $512,287 | | | $478,402 | | | $560,660 | |
| Ratios to Average Net Assets**: | | | | | | | | | | | | | | | | | | |
| | Ratio of Gross Expenses | | 0.84% | | | 0.79% | | | 0.60% | | | 0.64% | | | 0.65% | | | 0.80% | |
| | Ratio of Net Expenses (After Waivers and Expense Offsets) | | 0.84% | | | 0.79% | | | 0.60% | | | 0.64% | | | 0.65% | | | 0.80% | |
| | Ratio of Net Investment Income/(Loss) | | 0.83% | | | 1.13% | | | 1.19% | | | 1.05% | | | 1.15% | | | 0.83% | |
| Portfolio Turnover Rate | | 21% | | | 36% | | | 36% | | | 41% | | | 45% | | | 50% | |
| | | | | | | | | | | | | | | | | | | | | | |
| | | | | | | | | | | | | | | | | | | | | | |
Service Shares | | | | | | | | | | | | | | | | | | |
For a share outstanding during the period ended June 30, 2020 (unaudited) and the year ended December 31 | 2020 | | | 2019 | | | 2018 | | | 2017 | | | 2016 | | | 2015 | |
| Net Asset Value, Beginning of Period | | $55.27 | | | $46.15 | | | $50.17 | | | $39.87 | | | $39.53 | | | $40.77 | |
| Income/(Loss) from Investment Operations: | | | | | | | | | | | | | | | | | | |
| | Net investment income/(loss)(1) | | 0.15 | | | 0.45 | | | 0.48 | | | 0.38 | | | 0.35 | | | 0.24 | |
| | Net realized and unrealized gain/(loss) | | (2.36) | | | 12.39 | | | (4.00) | | | 10.24 | | | 0.36 | | | (1.26) | |
| Total from Investment Operations | | (2.21) | | | 12.84 | | | (3.52) | | | 10.62 | | | 0.71 | | | (1.02) | |
| Less Dividends and Distributions: | | | | | | | | | | | | | | | | | | |
| | Dividends (from net investment income) | | (0.16) | | | (0.45) | | | (0.50) | | | (0.32) | | | (0.37) | | | (0.22) | |
| | Distributions (from capital gains) | | (2.99) | | | (3.27) | | | — | | | — | | | — | | | — | |
| Total Dividends and Distributions | | (3.15) | | | (3.72) | | | (0.50) | | | (0.32) | | | (0.37) | | | (0.22) | |
| Net Asset Value, End of Period | | $49.91 | | | $55.27 | | | $46.15 | | | $50.17 | | | $39.87 | | | $39.53 | |
| Total Return* | | (3.82)% | | | 28.71% | | | (7.08)% | | | 26.68% | | | 1.82% | | | (2.53)% | |
| Net Assets, End of Period (in thousands) | | $201,330 | | | $214,425 | | | $180,168 | | | $210,318 | | | $179,125 | | | $202,896 | |
| Average Net Assets for the Period (in thousands) | | $194,818 | | | $198,883 | | | $206,497 | | | $197,483 | | | $186,563 | | | $218,006 | |
| Ratios to Average Net Assets**: | | | | | | | | | | | | | | | | | | |
| | Ratio of Gross Expenses | | 1.09% | | | 1.04% | | | 0.85% | | | 0.89% | | | 0.90% | | | 1.05% | |
| | Ratio of Net Expenses (After Waivers and Expense Offsets) | | 1.09% | | | 1.04% | | | 0.85% | | | 0.89% | | | 0.90% | | | 1.05% | |
| | Ratio of Net Investment Income/(Loss) | | 0.58% | | | 0.88% | | | 0.94% | | | 0.81% | | | 0.91% | | | 0.57% | |
| Portfolio Turnover Rate | | 21% | | | 36% | | | 36% | | | 41% | | | 45% | | | 50% | |
| | | | | | | | | | | | | | | | | | | | | | |
| |
* Total return includes adjustments in accordance with generally accepted accounting principles required at the year or period end and are not annualized for periods of less than one full year. Total return does not include fees, charges, or expenses imposed by the variable annuity and life insurance contracts for which Janus Aspen Series serves as an underlying investment vehicle. ** Annualized for periods of less than one full year. (1) Per share amounts are calculated based on average shares outstanding during the year or period. |
| | |
See Notes to Financial Statements. |
| |
18 | JUNE 30, 2020 |
Janus Henderson VIT Global Research Portfolio
Notes to Financial Statements (unaudited)
1. Organization and Significant Accounting Policies
Janus Henderson VIT Global Research Portfolio (the “Portfolio”) is a series of Janus Aspen Series (the “Trust”), which is organized as a Delaware statutory trust and is registered under the Investment Company Act of 1940, as amended (the “1940 Act”), as an open-end management investment company, and therefore has applied the specialized accounting and reporting guidance in Financial Accounting Standards Board (“FASB”) Accounting Standards Codification (“ASC”) Topic 946. The Trust offers 11 portfolios, each of which offers multiple share classes, with differing investment objectives and policies. The Portfolio seeks long-term growth of capital. The Portfolio is classified as diversified, as defined in the 1940 Act.
The Portfolio currently offers two classes of shares: Institutional Shares and Service Shares. Each class represents an interest in the same portfolio of investments. Institutional Shares are offered only in connection with investment in and payments under variable insurance contracts as well as certain qualified retirement plans. Service Shares are offered only in connection with investment in and payments under variable insurance contracts as well as certain qualified retirement plans that require a fee from Portfolio assets to procure distribution and administrative services to contract owners and plan participants.
Shareholders, including other portfolios, participating insurance companies, as well as accounts, may from time to time own (beneficially or of record) a significant percentage of the Portfolio’s Shares and can be considered to “control” the Portfolio when that ownership exceeds 25% of the Portfolio’s assets (and which may differ from control as determined in accordance with United States of America generally accepted accounting priciples ("US GAAP")).
The following accounting policies have been followed by the Portfolio and are in conformity with US GAAP.
Investment Valuation
Securities held by the Portfolio are valued in accordance with policies and procedures established by and under the supervision of the Trustees (the “Valuation Procedures”). Equity securities traded on a domestic securities exchange are generally valued at the closing prices on the primary market or exchange on which they trade. If such price is lacking for the trading period immediately preceding the time of determination, such securities are valued at their current bid price. Equity securities that are traded on a foreign exchange are generally valued at the closing prices on such markets. In the event that there is no current trading volume on a particular security in such foreign exchange, the bid price from the primary exchange is generally used to value the security. Securities that are traded on the over-the-counter (“OTC”) markets are generally valued at their closing or latest bid prices as available. Foreign securities and currencies are converted to U.S. dollars using the applicable exchange rate in effect at the close of the New York Stock Exchange (“NYSE”). The Portfolio will determine the market value of individual securities held by it by using prices provided by one or more approved professional pricing services or, as needed, by obtaining market quotations from independent broker-dealers. Most debt securities are valued in accordance with the evaluated bid price supplied by the pricing service that is intended to reflect market value. The evaluated bid price supplied by the pricing service is an evaluation that may consider factors such as security prices, yields, maturities and ratings. Certain short-term securities maturing within 60 days or less may be evaluated and valued on an amortized cost basis provided that the amortized cost determined approximates market value. Securities for which market quotations or evaluated prices are not readily available or deemed unreliable are valued at fair value determined in good faith under the Valuation Procedures. Circumstances in which fair value pricing may be utilized include, but are not limited to: (i) a significant event that may affect the securities of a single issuer, such as a merger, bankruptcy, or significant issuer-specific development; (ii) an event that may affect an entire market, such as a natural disaster or significant governmental action; (iii) a nonsignificant event such as a market closing early or not opening, or a security trading halt; and (iv) pricing of a nonvalued security and a restricted or nonpublic security. Special valuation considerations may apply with respect to “odd-lot” fixed-income transactions which, due to their small size, may receive evaluated prices by pricing services which reflect a large block trade and not what actually could be obtained for the odd-lot position. The Portfolio uses systematic fair valuation models provided by independent third parties to value international equity securities in order to adjust for stale pricing, which may occur between the close of certain foreign exchanges and the close of the NYSE.
Valuation Inputs Summary
FASB ASC 820, Fair Value Measurements and Disclosures (“ASC 820”), defines fair value, establishes a framework for measuring fair value, and expands disclosure requirements regarding fair value measurements. This standard emphasizes that fair value is a market-based measurement that should be determined based on the assumptions that
Janus Henderson VIT Global Research Portfolio
Notes to Financial Statements (unaudited)
market participants would use in pricing an asset or liability and establishes a hierarchy that prioritizes inputs to valuation techniques used to measure fair value. These inputs are summarized into three broad levels:
Level 1 – Unadjusted quoted prices in active markets the Portfolio has the ability to access for identical assets or liabilities.
Level 2 – Observable inputs other than unadjusted quoted prices included in Level 1 that are observable for the asset or liability either directly or indirectly. These inputs may include quoted prices for the identical instrument on an inactive market, prices for similar instruments, interest rates, prepayment speeds, credit risk, yield curves, default rates and similar data.
Assets or liabilities categorized as Level 2 in the hierarchy generally include: debt securities fair valued in accordance with the evaluated bid or ask prices supplied by a pricing service; securities traded on OTC markets and listed securities for which no sales are reported that are fair valued at the latest bid price (or yield equivalent thereof) obtained from one or more dealers transacting in a market for such securities or by a pricing service approved by the Portfolio’s Trustees; certain short-term debt securities with maturities of 60 days or less that are fair valued at amortized cost; and equity securities of foreign issuers whose fair value is determined by using systematic fair valuation models provided by independent third parties in order to adjust for stale pricing which may occur between the close of certain foreign exchanges and the close of the NYSE. Other securities that may be categorized as Level 2 in the hierarchy include, but are not limited to, preferred stocks, bank loans, swaps, investments in unregistered investment companies, options, and forward contracts.
Level 3 – Unobservable inputs for the asset or liability to the extent that relevant observable inputs are not available, representing the Portfolio’s own assumptions about the assumptions that a market participant would use in valuing the asset or liability, and that would be based on the best information available.
There have been no significant changes in valuation techniques used in valuing any such positions held by the Portfolio since the beginning of the fiscal year.
The inputs or methodology used for fair valuing securities are not necessarily an indication of the risk associated with investing in those securities. The summary of inputs used as of June 30, 2020 to fair value the Portfolio’s investments in securities and other financial instruments is included in the “Valuation Inputs Summary” in the Notes to Schedule of Investments and Other Information.
Investment Transactions and Investment Income
Investment transactions are accounted for as of the date purchased or sold (trade date). Dividend income is recorded on the ex-dividend date. Certain dividends from foreign securities will be recorded as soon as the Portfolio is informed of the dividend, if such information is obtained subsequent to the ex-dividend date. Dividends from foreign securities may be subject to withholding taxes in foreign jurisdictions. Interest income is recorded daily on the accrual basis and includes amortization of premiums and accretion of discounts. The Portfolio classifies gains and losses on prepayments received as an adjustment to interest income. Debt securities may be placed in non-accrual status and related interest income may be reduced by stopping current accruals and writing off interest receivables when collection of all or a portion of interest has become doubtful. Gains and losses are determined on the identified cost basis, which is the same basis used for federal income tax purposes. Income, as well as gains and losses, both realized and unrealized, are allocated daily to each class of shares based upon the ratio of net assets represented by each class as a percentage of total net assets.
Expenses
The Portfolio bears expenses incurred specifically on its behalf. Each class of shares bears a portion of general expenses, which are allocated daily to each class of shares based upon the ratio of net assets represented by each class as a percentage of total net assets. Expenses directly attributable to a specific class of shares are charged against the operations of such class.
Estimates
The preparation of financial statements in conformity with US GAAP requires management to make estimates and assumptions that affect the reported amount of assets and liabilities and disclosure of contingent assets and liabilities at the date of the financial statements, and the reported amounts of income and expenses during the reporting period. Actual results could differ from those estimates.
Janus Henderson VIT Global Research Portfolio
Notes to Financial Statements (unaudited)
Indemnifications
In the normal course of business, the Portfolio may enter into contracts that contain provisions for indemnification of other parties against certain potential liabilities. The Portfolio’s maximum exposure under these arrangements is unknown, and would involve future claims that may be made against the Portfolio that have not yet occurred. Currently, the risk of material loss from such claims is considered remote.
Foreign Currency Translations
The Portfolio does not isolate that portion of the results of operations resulting from the effect of changes in foreign exchange rates on investments from the fluctuations arising from changes in market prices of securities held at the date of the financial statements. Net unrealized appreciation or depreciation of investments and foreign currency translations arise from changes in the value of assets and liabilities, including investments in securities held at the date of the financial statements, resulting from changes in the exchange rates and changes in market prices of securities held.
Currency gains and losses are also calculated on payables and receivables that are denominated in foreign currencies. The payables and receivables are generally related to foreign security transactions and income translations.
Foreign currency-denominated assets and forward currency contracts may involve more risks than domestic transactions, including currency risk, counterparty risk, political and economic risk, regulatory risk and equity risk. Risks may arise from unanticipated movements in the value of foreign currencies relative to the U.S. dollar.
Dividends and Distributions
The Portfolio may make semiannual distributions of substantially all of its investment income and an annual distribution of its net realized capital gains (if any).
The Portfolio may make certain investments in real estate investment trusts (“REITs”) which pay dividends to their shareholders based upon funds available from operations. It is quite common for these dividends to exceed the REITs’ taxable earnings and profits, resulting in the excess portion of such dividends being designated as a return of capital. If the Portfolio distributes such amounts, such distributions could constitute a return of capital to shareholders for federal income tax purposes.
Federal Income Taxes
The Portfolio intends to continue to qualify as a regulated investment company and distribute all of its taxable income in accordance with the requirements of Subchapter M of the Internal Revenue Code. Management has analyzed the Portfolio’s tax positions taken for all open federal income tax years, generally a three-year period, and has concluded that no provision for federal income tax is required in the Portfolio’s financial statements. The Portfolio is not aware of any tax positions for which it is reasonably possible that the total amounts of unrecognized tax benefits will significantly change in the next twelve months.
2. Other Investments and Strategies
Additional Investment Risk
In the aftermath of the 2007-2008 financial crisis, the financial sector experienced reduced liquidity in credit and other fixed-income markets, and an unusually high degree of volatility, both domestically and internationally. In response to the crisis, the United States and certain foreign governments, along with the U.S. Federal Reserve and certain foreign central banks, took a number of unprecedented steps designed to support the financial markets. For example, the enactment of the Dodd-Frank Act in 2010 provided for widespread regulation of financial institutions, consumer financial products and services, broker-dealers, over-the-counter derivatives, investment advisers, credit rating agencies, and mortgage lending, which expanded federal oversight in the financial sector, including the investment management industry. More recently, in response to the COVID-19 pandemic, the U.S. government and the Federal Reserve, as well as certain foreign governments and central banks, have taken extraordinary actions to support local and global economies and the financial markets, including reducing interest rates to record low levels. The withdrawal of this support, a failure of measures put in place in response to such economic uncertainty, or investor perception that such efforts were not sufficient could each negatively affect financial markets generally, and the value and liquidity of specific securities. In addition, policy and legislative changes in the United States and in other countries continue to impact many aspects of financial regulation.
Widespread disease, including pandemics and epidemics, and natural or environmental disasters, such as earthquakes, fires, floods, hurricanes, tsunamis and weather-related phenomena generally, have been and can be highly disruptive to
Janus Henderson VIT Global Research Portfolio
Notes to Financial Statements (unaudited)
economies and markets, adversely impacting individual companies, sectors, industries, markets, currencies, interest and inflation rates, credit ratings, investor sentiment, and other factors affecting the value of a Fund’s investments. Economies and financial markets throughout the world have become increasingly interconnected, which increases the likelihood that events or conditions in one region or country will adversely affect markets or issuers in other regions or countries, including the United States. These disruptions could prevent a Fund from executing advantageous investment decisions in a timely manner and negatively impact a Fund’s ability to achieve its investment objective(s). Any such event(s) could have a significant adverse impact on the value of a Fund. In addition, these disruptions could also impair the information technology and other operational systems upon which the Fund’s service providers, including Janus Capital or the subadviser (as applicable), rely, and could otherwise disrupt the ability of employees of the Fund’s service providers to perform essential tasks on behalf of the Fund.
A number of countries in the European Union (“EU”) have experienced, and may continue to experience, severe economic and financial difficulties. In particular, many EU nations are susceptible to economic risks associated with high levels of debt. Many non-governmental issuers, and even certain governments, have defaulted on, or been forced to restructure, their debts. Many other issuers have faced difficulties obtaining credit or refinancing existing obligations. Financial institutions have in many cases required government or central bank support, have needed to raise capital, and/or have been impaired in their ability to extend credit. As a result, financial markets in the EU have experienced extreme volatility and declines in asset values and liquidity. Responses to these financial problems by European governments, central banks, and others, including austerity measures and reforms, may not work, may result in social unrest, and may limit future growth and economic recovery or have other unintended consequences. The risk of investing in securities in the European markets may also be heightened due to the referendum in which the United Kingdom voted to exit the EU (commonly known as “Brexit”). The United Kingdom formally left the EU on January 31, 2020 and entered into an eleven-month transition period, during which the United Kingdom will remain subject to EU laws and regulations. There is considerable uncertainty relating to the potential consequences of the United Kingdom’s exit and how negotiations for new trade agreements will be conducted or concluded.
Certain areas of the world have historically been prone to and economically sensitive to environmental events such as, but not limited to, hurricanes, earthquakes, typhoons, flooding, tidal waves, tsunamis, erupting volcanoes, wildfires or droughts, tornadoes, mudslides, or other weather-related phenomena. Such disasters, and the resulting physical or economic damage, could have a severe and negative impact on the Portfolio’s investment portfolio and, in the longer term, could impair the ability of issuers in which the Portfolio invests to conduct their businesses as they would under normal conditions. Adverse weather conditions may also have a particularly significant negative effect on issuers in the agricultural sector and on insurance and reinsurance companies that insure or reinsure against the impact of natural disasters.
Counterparties
Portfolio transactions involving a counterparty are subject to the risk that the counterparty or a third party will not fulfill its obligation to the Portfolio (“counterparty risk”). Counterparty risk may arise because of the counterparty’s financial condition (i.e., financial difficulties, bankruptcy, or insolvency), market activities and developments, or other reasons, whether foreseen or not. A counterparty’s inability to fulfill its obligation may result in significant financial loss to the Portfolio. The Portfolio may be unable to recover its investment from the counterparty or may obtain a limited recovery, and/or recovery may be delayed. The extent of the Portfolio’s exposure to counterparty risk with respect to financial assets and liabilities approximates its carrying value.
The Portfolio may be exposed to counterparty risk through participation in various programs, including, but not limited to, lending its securities to third parties, cash sweep arrangements whereby the Portfolio’s cash balance is invested in one or more types of cash management vehicles, as well as investments in, but not limited to, repurchase agreements, debt securities, and derivatives, including various types of swaps, futures and options. The Portfolio intends to enter into financial transactions with counterparties that Janus Capital Management LLC (“Janus Capital”) believes to be creditworthy at the time of the transaction. There is always the risk that Janus Capital’s analysis of a counterparty’s creditworthiness is incorrect or may change due to market conditions. To the extent that the Portfolio focuses its transactions with a limited number of counterparties, it will have greater exposure to the risks associated with one or more counterparties.
Emerging Market Investing
Within the parameters of its specific investment policies, the Portfolio may invest in securities of issuers or companies from or with exposure to one or more “developing countries” or “emerging market countries.” To the extent that the
Janus Henderson VIT Global Research Portfolio
Notes to Financial Statements (unaudited)
Portfolio invests a significant amount of its assets in one or more of these countries, its returns and net asset value may be affected to a large degree by events and economic conditions in such countries. The risks of foreign investing are heightened when investing in emerging markets, which may result in the price of investments in emerging markets experiencing sudden and sharp price swings. In many developing markets, there is less government supervision and regulation of business and industry practices (including the potential lack of strict finance and accounting controls and standards), stock exchanges, brokers, and listed companies, making these investments potentially more volatile in price and less liquid than investments in developed securities markets, resulting in greater risk to investors. There is a risk in developing countries that a future economic or political crisis could lead to price controls, forced mergers of companies, expropriation or confiscatory taxation, imposition or enforcement of foreign ownership limits, seizure, nationalization, sanctions or imposition of restrictions by various governmental entities on investment and trading, or creation of government monopolies, any of which may have a detrimental effect on the Portfolio’s investments. In addition, the Portfolio’s investments may be denominated in foreign currencies and therefore, changes in the value of a country’s currency compared to the U.S. dollar may affect the value of the Portfolio’s investments. To the extent that the Portfolio invests a significant portion of its assets in the securities of issuers in or companies of a single country or region, it is more likely to be impacted by events or conditions affecting that country or region, which could have a negative impact on the Portfolio’s performance.
Offsetting Assets and Liabilities
The Portfolio presents gross and net information about transactions that are either offset in the financial statements or subject to an enforceable master netting arrangement or similar agreement with a designated counterparty, regardless of whether the transactions are actually offset in the Statement of Assets and Liabilities.
The following table presents gross amounts of recognized assets and/or liabilities and the net amounts after deducting collateral that has been pledged by counterparties or has been pledged to counterparties (if applicable). For corresponding information grouped by type of instrument, see the Portfolio's Schedule of Investments.
| | | | | | | | | | |
Offsetting of Financial Assets and Derivative Assets |
| |
| | | Gross Amounts | | | | | | |
| | | of Recognized | | Offsetting Asset | | Collateral | | |
Counterparty | | Assets | | or Liability(a) | | Pledged(b) | | Net Amount |
| | | | | | | | | |
JPMorgan Chase Bank, National Association | $ | 3,147,182 | $ | — | $ | (3,147,182) | $ | — |
| | | | | | | | | |
(a) | Represents the amount of assets or liabilities that could be offset with the same counterparty under master netting or similar agreements that management elects not to offset on the Statement of Assets and Liabilities. |
(b) | Collateral pledged is limited to the net outstanding amount due to/from an individual counterparty. The actual collateral amounts pledged may exceed these amounts and may fluctuate in value. |
JPMorgan Chase Bank, National Association acts as securities lending agent and a limited purpose custodian or subcustodian to receive and disburse cash balances and cash collateral, hold short-term investments, hold collateral, and perform other custodial functions in accordance with the Non-Custodial Securities Lending Agreement. For financial reporting purposes, the Portfolio does not offset financial instruments' payables and receivables and related collateral on the Statement of Assets and Liabilities. Securities on loan will be continuously secured by collateral which may consist of cash, U.S. Government securities, domestic and foreign short-term debt instruments, letters of credit, time deposits, repurchase agreements, money market mutual funds or other money market accounts, or such other collateral as permitted by the Securities and Exchange Commission (the “SEC”). See “Securities Lending” in the “Notes to Financial Statements” for additional information.
Real Estate Investing
The Portfolio may invest in equity and debt securities of real estate-related companies. Such companies may include those in the real estate industry or real estate-related industries. These securities may include common stocks, corporate bonds, preferred stocks, and other equity securities, including, but not limited to, mortgage-backed securities, real estate-backed securities, securities of REITs and similar REIT-like entities. A REIT is a trust that invests in real estate-related projects, such as properties, mortgage loans, and construction loans. REITs are generally categorized as equity, mortgage, or hybrid REITs. A REIT may be listed on an exchange or traded OTC.
Janus Henderson VIT Global Research Portfolio
Notes to Financial Statements (unaudited)
Securities Lending
Under procedures adopted by the Trustees, the Portfolio may seek to earn additional income by lending securities to certain qualified broker-dealers and institutions. Effective December 16, 2019, JPMorgan Chase Bank, National Association replaced Deutsche Bank AG as securities lending agent for the Portfolio. JPMorgan Chase Bank, National Association acts as securities lending agent and a limited purpose custodian or subcustodian to receive and disburse cash balances and cash collateral, hold short-term investments, hold collateral, and perform other custodial functions in accordance with the Non-Custodial Securities Lending Agreement. The Portfolio may lend portfolio securities in an amount equal to up to 1/3 of its total assets as determined at the time of the loan origination. There is the risk of delay in recovering a loaned security or the risk of loss in collateral rights if the borrower fails financially. In addition, Janus Capital makes efforts to balance the benefits and risks from granting such loans. All loans will be continuously secured by collateral which may consist of cash, U.S. Government securities, domestic and foreign short-term debt instruments, letters of credit, time deposits, repurchase agreements, money market mutual funds or other money market accounts, or such other collateral as permitted by the SEC. If the Portfolio is unable to recover a security on loan, the Portfolio may use the collateral to purchase replacement securities in the market. There is a risk that the value of the collateral could decrease below the cost of the replacement security by the time the replacement investment is made, resulting in a loss to the Portfolio. In certain circumstances individual loan transactions could yield negative returns.
Upon receipt of cash collateral, Janus Capital may invest it in affiliated or non-affiliated cash management vehicles, whether registered or unregistered entities, as permitted by the 1940 Act and rules promulgated thereunder. Janus Capital currently intends to primarily invest the cash collateral in a cash management vehicle for which Janus Capital serves as investment adviser, Janus Henderson Cash Collateral Fund LLC. An investment in Janus Henderson Cash Collateral Fund LLC is generally subject to the same risks that shareholders experience when investing in similarly structured vehicles, such as the potential for significant fluctuations in assets as a result of the purchase and redemption activity of the securities lending program, a decline in the value of the collateral, and possible liquidity issues. Such risks may delay the return of the cash collateral and cause the Portfolio to violate its agreement to return the cash collateral to a borrower in a timely manner. As adviser to the Portfolio and Janus Henderson Cash Collateral Fund LLC, Janus Capital has an inherent conflict of interest as a result of its fiduciary duties to both the Portfolio and Janus Henderson Cash Collateral Fund LLC. Additionally, Janus Capital receives an investment advisory fee of 0.05% for managing Janus Henderson Cash Collateral Fund LLC, but it may not receive a fee for managing certain other affiliated cash management vehicles in which the Portfolio may invest, and therefore may have an incentive to allocate preferred investment opportunities to investment vehicles for which it is receiving a fee.
The value of the collateral must be at least 102% of the market value of the loaned securities that are denominated in U.S. dollars and 105% of the market value of the loaned securities that are not denominated in U.S. dollars. Loaned securities and related collateral are marked-to-market each business day based upon the market value of the loaned securities at the close of business, employing the most recent available pricing information. Collateral levels are then adjusted based on this mark-to-market evaluation.
The cash collateral invested by Janus Capital is disclosed in the Schedule of Investments (if applicable). Income earned from the investment of the cash collateral, net of rebates paid to, or fees paid by, borrowers and less the fees paid to the lending agent are included as “Affiliated securities lending income, net” on the Statement of Operations. As of June 30, 2020, securities lending transactions accounted for as secured borrowings with an overnight and continuous contractual maturity are $3,147,182. Gross amounts of recognized liabilities for securities lending (collateral received) as of June 30, 2020 is $3,304,800, resulting in the net amount due to the counterparty of $157,618.
3. Investment Advisory Agreements and Other Transactions with Affiliates
The Portfolio pays Janus Capital an investment advisory fee which is calculated daily and paid monthly. The Portfolio’s "base" fee rate prior to any performance adjustment (expressed as an annual rate) is 0.60%.
The investment advisory fee rate is determined by calculating a base fee and applying a performance adjustment. The base fee rate is the same as the contractual investment advisory fee rate. The performance adjustment either increases or decreases the base fee depending on how well the Portfolio has performed relative to its benchmark index. The Portfolio's benchmark index used in the calculation is the MSCI World IndexSM.
The calculation of the performance adjustment applies as follows:
Investment Advisory Fee = Base Fee Rate +/- Performance Adjustment
Janus Henderson VIT Global Research Portfolio
Notes to Financial Statements (unaudited)
The investment advisory fee rate paid to Janus Capital by the Portfolio consists of two components: (1) a base fee calculated by applying the contractual fixed rate of the advisory fee to the Portfolio’s average daily net assets during the previous month (“Base Fee Rate”), plus or minus (2) a performance-fee adjustment (“Performance Adjustment”) calculated by applying a variable rate of up to 0.15% (positive or negative) to the Portfolio’s average daily net assets based on the Portfolio’s relative performance compared to the cumulative investment record of its benchmark index over a 36-month performance measurement period or shorter time period, as applicable. The investment performance of a Portfolio’s Service Shares, for the performance measurement period is used to calculate the Performance Adjustment. No Performance Adjustment is applied unless the difference between the Portfolio’s investment performance and the cumulative investment record of the Portfolio’s benchmark index is 0.50% or greater (positive or negative) during the applicable performance measurement period.
The Portfolio’s prospectuses and statement(s) of additional information contain additional information about performance-based fees. The amount shown as advisory fees on the Statement of Operations reflects the Base Fee Rate plus/minus any Performance Adjustment. For the period ended June 30, 2020, the performance adjusted investment advisory fee rate before any waivers and/or reimbursements of expenses is 0.75%.
Janus Services LLC (“Janus Services”), a wholly-owned subsidiary of Janus Capital, is the Portfolio’s transfer agent. Janus Services receives an administrative services fee at an annual rate of 0.05% of the average daily net assets of the Portfolio for arranging for the provision by participating insurance companies and qualified plan service providers of administrative services, including recordkeeping, subaccounting, order processing, or other shareholder services provided on behalf of contract holders or plan participants investing in the Portfolio. Other shareholder services may include the provision of order confirmations, periodic account statements, forwarding prospectuses, shareholder reports, and other materials to existing investors, and answering inquiries regarding accounts. Janus Services expects to use this entire fee to compensate insurance companies and qualified plan service providers for providing these services to their customers who invest in the Portfolio. Any unused portion will be reimbursed to the applicable share class at least annually.
In addition, Janus Services provides or arranges for the provision of certain other internal administrative, recordkeeping, and shareholder relations services for the Portfolio. Janus Services is not compensated for these internal services related to the shares, except for out-of-pocket costs. These amounts are disclosed as “Other transfer agent fees and expenses” on the Statement of Operations.
Under a distribution and shareholder servicing plan (the “Plan”) adopted in accordance with Rule 12b-1 under the 1940 Act, the Service Shares may pay the Trust’s distributor, Janus Distributors LLC (“Janus Distributors”), a wholly-owned subsidiary of Janus Capital, a fee for the sale and distribution and/or shareholder servicing of the Service Shares at an annual rate of up to 0.25% of the average daily net assets of the Service Shares. Under the terms of the Plan, the Trust is authorized to make payments to Janus Distributors for remittance to insurance companies and qualified plan service providers as compensation for distribution and/or shareholder services performed by such entities. These amounts are disclosed as “12b-1 Distribution and shareholder servicing fees” on the Statement of Operations. Payments under the Plan are not tied exclusively to actual 12b-1 distribution and servicing fees, and the payments may exceed 12b-1 distribution and servicing fees actually incurred. If any of the Portfolio’s actual 12b-1 distribution and servicing fees incurred during a calendar year are less than the payments made during a calendar year, the Portfolio will be refunded the difference. Refunds, if any, are included in “12b-1 Distribution and shareholder servicing fees” in the Statement of Operations.
Janus Capital serves as administrator to the Portfolio pursuant to an administration agreement between Janus Capital and the Trust. Under the administration agreement, Janus Capital is obligated to provide or arrange for the provision of certain administration, compliance, and accounting services to the Portfolio, including providing office space for the Portfolio, and is reimbursed by the Portfolio for certain of its costs in providing these services (to the extent Janus Capital seeks reimbursement and such costs are not otherwise waived). In addition, employees of Janus Capital and/or its affiliates may serve as officers of the Trust. The Portfolio pays for some or all of the salaries, fees, and expenses of Janus Capital employees and Portfolio officers, with respect to certain specified administration functions they perform on behalf of the Portfolio. The Portfolio pays these costs based on out-of-pocket expenses incurred by Janus Capital, and these costs are separate and apart from advisory fees and other expenses paid in connection with the investment advisory services Janus Capital (or any subadvisor, as applicable) provides to the Portfolio. These amounts are disclosed as “Affiliated portfolio administration fees” on the Statement of Operations. In addition, some expenses related to compensation payable to the Portfolio’s Chief Compliance Officer and certain compliance staff, all of whom are
Janus Henderson VIT Global Research Portfolio
Notes to Financial Statements (unaudited)
employees of Janus Capital and/or its affiliates, are shared with the Portfolio. Total compensation of $20,422 was paid to the Chief Compliance Officer and certain compliance staff by the Trust during the period ended June 30, 2020. The Portfolio's portion is reported as part of “Other expenses” on the Statement of Operations.
The Board of Trustees has adopted a deferred compensation plan (the “Deferred Plan”) for independent Trustees to elect to defer receipt of all or a portion of the annual compensation they are entitled to receive from the Portfolio. All deferred fees are credited to an account established in the name of the Trustees. The amounts credited to the account then increase or decrease, as the case may be, in accordance with the performance of one or more of the Janus Henderson funds that are selected by the Trustees. The account balance continues to fluctuate in accordance with the performance of the selected fund or funds until final payment of all amounts are credited to the account. The fluctuation of the account balance is recorded by the Portfolio as unrealized appreciation/(depreciation) and is included as of June 30, 2020 on the Statement of Assets and Liabilities in the asset, “Non-interested Trustees’ deferred compensation,” and liability, “Non-interested Trustees’ deferred compensation fees.” Additionally, the recorded unrealized appreciation/(depreciation) is included in “Total distributable earnings (loss)” on the Statement of Assets and Liabilities. Deferred compensation expenses for the period ended June 30, 2020 are included in “Non-interested Trustees’ fees and expenses” on the Statement of Operations. Trustees are allowed to change their designation of mutual funds from time to time. Amounts will be deferred until distributed in accordance with the Deferred Plan. Deferred fees of $220,425 were paid by the Trust to the Trustees under the Deferred Plan during the period ended June 30, 2020.
Pursuant to the provisions of the 1940 Act and related rules, the Portfolio may participate in an affiliated or non-affiliated cash sweep program. In the cash sweep program, uninvested cash balances of the Portfolio may be used to purchase shares of affiliated or non-affiliated money market funds or cash management pooled investment vehicles that operate as money market funds. The Portfolio is eligible to participate in the cash sweep program (the “Investing Funds”). As adviser, Janus Capital has an inherent conflict of interest because of its fiduciary duties to the affiliated money market funds or cash management pooled investment vehicles and the Investing Funds. Janus Henderson Cash Liquidity Fund LLC (the “Sweep Vehicle”) is an affiliated unregistered cash management pooled investment vehicle that invests primarily in highly-rated short-term fixed-income securities. The Sweep Vehicle operates pursuant to the provisions of the 1940 Act that govern the operation of money market funds and prices its shares at NAV reflecting market-based values of its portfolio securities (i.e., a “floating” NAV) rounded to the fourth decimal place (e.g., $1.0000). The Sweep Vehicle is permitted to impose a liquidity fee (of up to 2%) on redemptions from the Sweep Vehicle or a redemption gate that temporarily suspends redemptions from the Sweep Vehicle for up to 10 business days during a 90 day period. There are no restrictions on the Portfolio's ability to withdraw investments from the Sweep Vehicle at will, and there are no unfunded capital commitments due from the Portfolio to the Sweep Vehicle. The Sweep Vehicle does not charge any management fee, sales charge or service fee.
Any purchases and sales, realized gains/losses and recorded dividends from affiliated investments during the period ended June 30, 2020 can be found in the “Schedules of Affiliated Investments” located in the Schedule of Investments.
The Portfolio is permitted to purchase or sell securities (“cross-trade”) between itself and other funds or accounts managed by Janus Capital in accordance with Rule 17a-7 under the Investment Company Act of 1940 (“Rule 17a-7”), when the transaction is consistent with the investment objectives and policies of the Portfolio and in accordance with the Internal Cross Trade Procedures adopted by the Trust’s Board of Trustees. These procedures have been designed to ensure that any cross-trade of securities by the Portfolio from or to another fund or account that is or could be considered an affiliate of the Portfolio under certain limited circumstances by virtue of having a common investment adviser, common Officer, or common Trustee complies with Rule 17a-7. Under these procedures, each cross-trade is effected at the current market price to save costs where allowed. During the period ended June 30, 2020, the Portfolio engaged in cross trades amounting to $1,321,672 in purchases.
4. Federal Income Tax
Income and capital gains distributions are determined in accordance with income tax regulations that may differ from US GAAP. These differences are due to differing treatments for items such as net short-term gains, deferral of wash sale losses, foreign currency transactions, net investment losses, and capital loss carryovers.
The Portfolio has elected to treat gains and losses on forward foreign currency contracts as capital gains and losses, if applicable. Other foreign currency gains and losses on debt instruments are treated as ordinary income for federal income tax purposes pursuant to Section 988 of the Internal Revenue Code.
Janus Henderson VIT Global Research Portfolio
Notes to Financial Statements (unaudited)
The aggregate cost of investments and the composition of unrealized appreciation and depreciation of investment securities for federal income tax purposes as of June 30, 2020 are noted below. The primary differences between book and tax appreciation or depreciation of investments are wash sale loss deferrals and investments in partnerships.
| | | | |
Federal Tax Cost | Unrealized
Appreciation | Unrealized
(Depreciation) | Net Tax Appreciation/
(Depreciation) |
$ 518,507,338 | $207,575,776 | $(26,806,211) | $ 180,769,565 |
5. Capital Share Transactions
| | | | | | | |
| | | | | | |
| | Period ended June 30, 2020 | | Year ended December 31, 2019 |
| | Shares | Amount | | Shares | Amount |
| | | | | | | |
Institutional Shares: | | | | | |
Shares sold | 142,679 | $ 7,419,828 | | 211,898 | $ 11,104,330 |
Reinvested dividends and distributions | 592,119 | 29,357,266 | | 700,470 | 35,853,466 |
Shares repurchased | (564,449) | (29,142,579) | | (1,204,072) | (63,535,412) |
Net Increase/(Decrease) | 170,349 | $ 7,634,515 | | (291,704) | $(16,577,616) |
Service Shares: | | | | | |
Shares sold | 154,225 | $ 7,610,131 | | 230,603 | $ 11,845,436 |
Reinvested dividends and distributions | 248,317 | 12,003,638 | | 276,671 | 13,833,812 |
Shares repurchased | (248,031) | (12,400,593) | | (531,967) | (27,275,766) |
Net Increase/(Decrease) | 154,511 | $ 7,213,176 | | (24,693) | $ (1,596,518) |
6. Purchases and Sales of Investment Securities
For the period ended June 30, 2020, the aggregate cost of purchases and proceeds from sales of investment securities (excluding any short-term securities, short-term options contracts, TBAs, and in-kind transactions, as applicable) was as follows:
| | | | |
Purchases of
Securities | Proceeds from Sales
of Securities | Purchases of Long-
Term U.S. Government
Obligations | Proceeds from Sales
of Long-Term U.S.
Government Obligations |
$142,494,168 | $ 168,069,513 | $ - | $ - |
7. Recent Accounting Pronouncements
The FASB issued Accounting Standards Update 2018-13, Fair Value Measurement (Topic 820), in August 2018. The new guidance removes, modifies and enhances the disclosures to Topic 820. For public entities, the amendments are effective for financial statements issued for fiscal years beginning after December 15, 2019, and interim periods within those fiscal years. An entity is permitted, and Management has decided, to early adopt the removed and modified disclosures in these financial statements. Management is also evaluating the implications related to the new disclosure requirements and has not yet determined the impact to the financial statements.
8. Other Matters
An outbreak of infectious respiratory illness caused by a novel coronavirus known as COVID-19 was first detected in China in December 2019 and has now been declared a pandemic by the World Health Organization. The impact of COVID-19 has been, and may continue to be, highly disruptive to economies and markets, adversely impacting individual companies, sectors, industries, markets, currencies, interest and inflation rates, credit ratings, investor sentiment, and other factors affecting the value of a Portfolio's investments. This may impact liquidity in the marketplace, which in turn may affect the Portfolio's ability to meet redemption requests. Public health crises caused by the COVID-19 pandemic may exacerbate other pre-existing political, social, and economic risks in certain countries or globally. The duration of the COVID-19 pandemic and its effects cannot be determined with certainty, and could prevent
Janus Henderson VIT Global Research Portfolio
Notes to Financial Statements (unaudited)
a Portfolio from executing advantageous investment decisions in a timely manner and negatively impact a Portfolio's ability to achieve its investment objective.
9. Subsequent Event
Management has evaluated whether any events or transactions occurred subsequent to June 30, 2020 and through the date of issuance of the Portfolio’s financial statements and determined that there were no material events or transactions that would require recognition or disclosure in the Portfolio’s financial statements.
Janus Henderson VIT Global Research Portfolio
Additional Information (unaudited)
Proxy Voting Policies and Voting Record
A description of the policies and procedures that the Portfolio uses to determine how to vote proxies relating to its portfolio securities is available without charge: (i) upon request, by calling 1-800-525-1093; (ii) on the Portfolio’s website at janushenderson.com/proxyvoting; and (iii) on the SEC’s website at http://www.sec.gov. Additionally, information regarding the Portfolio’s proxy voting record for the most recent twelve-month period ended June 30 is also available, free of charge, through janushenderson.com/proxyvoting and from the SEC’s website at http://www.sec.gov.
Full Holdings
The Portfolio is required to disclose its complete holdings as an exhibit to Form N-PORT within 60 days of the end of the first and third fiscal quarters, and in the annual report and semiannual report to Portfolio shareholders. Historically, the Portfolio filed its complete portfolio holdings (schedule of investments) with the SEC for the first and third quarters each fiscal year on Form N-Q. The Portfolio’s Form N-PORT and Form N-Q filings: (i) are available on the SEC’s website at http://www.sec.gov; (ii) may be reviewed and copied at the SEC’s Public Reference Room in Washington, D.C. (information on the Public Reference Room may be obtained by calling 1-800-SEC-0330); and (iii) are available without charge, upon request, by calling a Janus Henderson representative at 1-877-335-2687 (toll free) . Portfolio holdings consisting of at least the names of the holdings are generally available on a monthly basis with a 30-day lag. Holdings are generally posted approximately two business days thereafter under Full Holdings for the Portfolio at janushenderson.com/vit.
APPROVAL OF ADVISORY AGREEMENTS DURING THE PERIOD
The Trustees of Janus Aspen Series, each of whom serves as an “independent” Trustee (the “Trustees”), oversee the management of each Portfolio of Janus Aspen Series (each, a “VIT Portfolio,” and collectively, the “VIT Portfolios”), as well as each Fund of Janus Investment Fund (together with the VIT Portfolios, the “Janus Henderson Funds,” and each, a “Janus Henderson Fund”). As required by law, the Trustees determine annually whether to continue the investment advisory agreement for each Janus Henderson Fund and the subadvisory agreements for the Janus Henderson Funds that utilize subadvisers.
In connection with their most recent consideration of those agreements for each Janus Henderson Fund, the Trustees received and reviewed information provided by Janus Capital and the respective subadvisers in response to requests of the Trustees and their independent legal counsel. They also received and reviewed information and analysis provided by, and in response to requests of, their independent fee consultant. Throughout their consideration of the agreements, the Trustees were advised by their independent legal counsel. The Trustees met with management to consider the agreements, and also met separately in executive session with their independent legal counsel and their independent fee consultant.
At a meeting held on December 5, 2019, based on the Trustees’ evaluation of the information provided by Janus Capital, the subadvisers, and the independent fee consultant, as well as other information, the Trustees determined that the overall arrangements between each Janus Henderson Fund and Janus Capital and each subadviser, as applicable, were fair and reasonable in light of the nature, extent and quality of the services provided by Janus Capital, its affiliates and the subadvisers, the fees charged for those services, and other matters that the Trustees considered relevant in the exercise of their business judgment. At that meeting, the Trustees unanimously approved the continuation of the investment advisory agreement for each Janus Henderson Fund, and the subadvisory agreement for each subadvised Janus Henderson Fund, for the period from February 1, 2020 through February 1, 2021, subject to earlier termination as provided for in each agreement.
In considering the continuation of those agreements, the Trustees reviewed and analyzed various factors that they determined were relevant, including the factors described below, none of which by itself was considered dispositive. However, the material factors and conclusions that formed the basis for the Trustees’ determination to approve the continuation of the agreements are discussed separately below. Also included is a summary of the independent fee consultant’s conclusions and opinions that arose during, and were included as part of, the Trustees’ consideration of the agreements. “Management fees,” as used herein, reflect actual annual advisory fees and, for the purpose of peer comparisons, any administration fees (excluding out of pocket costs), net of any waivers, paid by a fund as a percentage of average net assets.
Janus Henderson VIT Global Research Portfolio
Additional Information (unaudited)
Nature, Extent and Quality of Services
The Trustees reviewed the nature, extent and quality of the services provided by Janus Capital and the subadvisers to the Janus Henderson Funds, taking into account the investment objective, strategies and policies of each Janus Henderson Fund, and the knowledge the Trustees gained from their regular meetings with management on at least a quarterly basis and their ongoing review of information related to the Janus Henderson Funds. In addition, the Trustees reviewed the resources and key personnel of Janus Capital and each subadviser, particularly noting those employees who provide investment and risk management services to the Janus Henderson Funds. The Trustees also considered other services provided to the Janus Henderson Funds by Janus Capital or the subadvisers, such as managing the execution of portfolio transactions and the selection of broker-dealers for those transactions. The Trustees considered Janus Capital’s role as administrator to the Janus Henderson Funds, noting that Janus Capital generally does not receive a fee for its services but is reimbursed for its out-of-pocket costs. The Trustees considered the role of Janus Capital in monitoring adherence to the Janus Henderson Funds’ investment restrictions, providing support services for the Trustees and Trustee committees, and overseeing communications with shareholders and the activities of other service providers, including monitoring compliance with various policies and procedures of the Janus Henderson Funds and with applicable securities laws and regulations.
In this regard, the independent fee consultant noted that Janus Capital provides a number of different services for the Janus Henderson Funds and fund shareholders, ranging from investment management services to various other servicing functions, and that, in its view, Janus Capital is a capable provider of those services. The independent fee consultant also provided its belief that Janus Capital has developed a number of institutional competitive advantages that should enable it to provide superior investment and service performance over the long term.
The Trustees concluded that the nature, extent and quality of the services provided by Janus Capital or the subadviser to each Janus Henderson Fund were appropriate and consistent with the terms of the respective advisory and subadvisory agreements, and that, taking into account steps taken to address those Janus Henderson Funds whose performance lagged that of their peers for certain periods, the Janus Henderson Funds were likely to benefit from the continued provision of those services. They also concluded that Janus Capital and each subadviser had sufficient personnel, with the appropriate education and experience, to serve the Janus Henderson Funds effectively and had demonstrated its ability to attract well-qualified personnel.
Performance of the Funds
The Trustees considered the performance results of each Janus Henderson Fund over various time periods. They noted that they considered Janus Henderson Fund performance data throughout the year, including periodic meetings with each Janus Henderson Fund’s portfolio manager(s), and also reviewed information comparing each Janus Henderson Fund’s performance with the performance of comparable funds and peer groups identified by Broadridge Financial Solutions, Inc. (“Broadridge”), an independent data provider, and with the Janus Henderson Fund’s benchmark index. In this regard, the independent fee consultant found that the overall Janus Henderson Funds’ performance has been reasonable: for the 36 months ended September 30, 2019, approximately 69% of the Janus Henderson Funds were in the top two quartiles of performance, as reported by Morningstar, and for the 12 months ended September 30, 2019, approximately 71% of the Janus Henderson Funds were in the top two quartiles of performance, as reported by Morningstar.
The Trustees considered the performance of each Janus Henderson Fund, noting that performance may vary by share class, and noted the following with respect to the VIT Portfolios:
· For Janus Henderson Balanced Portfolio, the Trustees noted that the Fund’s performance was in the first Broadridge quartile for the 36 months ended May 31, 2019 and the first Broadridge quartile for the 12 months ended May 31, 2019.
· For Janus Henderson Enterprise Portfolio, the Trustees noted that the Fund’s performance was in the second Broadridge quartile for the 36 months ended May 31, 2019 and the first Broadridge quartile for the 12 months ended May 31, 2019.
· For Janus Henderson Flexible Bond Portfolio, the Trustees noted that the Fund’s performance was in the bottom Broadridge quartile for the 36 months ended May 31, 2019 and the bottom Broadridge quartile for the 12 months ended May 31, 2019. The Trustees noted the reasons for the Fund’s underperformance and the steps Janus Capital had taken or was taking to improve performance.
Janus Henderson VIT Global Research Portfolio
Additional Information (unaudited)
· For Janus Henderson Forty Portfolio, the Trustees noted that the Fund’s performance was in the second Broadridge quartile for the 36 months ended May 31, 2019 and the first Broadridge quartile for the 12 months ended May 31, 2019.
· For Janus Henderson Global Research Portfolio, the Trustees noted that the Fund’s performance was in the bottom Broadridge quartile for the 36 months ended May 31, 2019 and the second Broadridge quartile for the 12 months ended May 31, 2019. The Trustees noted the reasons for the Fund’s underperformance, while also noting that the Fund has a performance fee structure that results in lower management fees during periods of underperformance, and the steps Janus Capital had taken or was taking to improve performance, and that the performance trend was improving
· For Janus Henderson Global Technology Portfolio, the Trustees noted that the Fund’s performance was in the first Broadridge quartile for the 36 months ended May 31, 2019 and the first Broadridge quartile for the 12 months ended May 31, 2019.
· For Janus Henderson Mid Cap Value Portfolio, the Trustees noted that the Fund’s performance was in the second Broadridge quartile for the 36 months ended May 31, 2019 and the third Broadridge quartile for the 12 months ended May 31, 2019.
· For Janus Henderson Overseas Portfolio, the Trustees noted that the Fund’s performance was in the second Broadridge quartile for the 36 months ended May 31, 2019 and the bottom Broadridge quartile for the 12 months ended May 31, 2019.
· For Janus Henderson Research Portfolio, the Trustees noted that the Fund’s performance was in the third Broadridge quartile for the 36 months ended May 31, 2019 and the second Broadridge quartile for the 12 months ended May 31, 2019. The Trustees noted the reasons for the Fund’s underperformance, while also noting that the Fund has a performance fee structure that results in lower management fees during periods of underperformance, and the steps Janus Capital had taken or was taking to improve performance, and that the performance trend was improving
· For Janus Henderson U.S. Low Volatility Portfolio, the Trustees noted that the Fund’s performance was in the third Broadridge quartile for the 36 months ended May 31, 2019 and the first Broadridge quartile for the 12 months ended May 31, 2019. The Trustees noted the reasons for the Fund’s underperformance and the steps Janus Capital and Intech had taken or were taking to improve performance, and the performance trend was improving.
In consideration of each Janus Henderson Fund’s performance, the Trustees concluded that, taking into account the factors relevant to performance, as well as other considerations, including steps taken to improve performance, the Janus Henderson Fund’s performance warranted continuation of such Janus Henderson Fund’s investment advisory and subadvisory agreement(s).
Costs of Services Provided
The Trustees examined information regarding the fees and expenses of each Janus Henderson Fund in comparison to similar information for other comparable funds as provided by Broadridge, an independent data provider. They also reviewed an analysis of that information provided by their independent fee consultant and noted that the rate of management fees (investment advisory and any administration, but excluding out-of-pocket costs) for many of the Janus Henderson Funds, after applicable waivers, was below the average management fee rate of the respective peer group of funds selected by an independent data provider. The Trustees also examined information regarding the subadvisory fees charged for subadvisory services, as applicable, noting that all such fees were paid by Janus Capital out of its management fees collected from such Janus Henderson Fund.
The independent fee consultant provided its belief that the management fees charged by Janus Capital to each of the Janus Henderson Funds under the current investment advisory and administration agreements are reasonable in relation to the services provided by Janus Capital. The independent fee consultant found: (1) the total expenses and management fees of the Janus Henderson Funds to be reasonable relative to other mutual funds; (2) the total expenses, on average, were 10% under the average total expenses of their respective Broadridge Expense Group peers; and (3) and the management fees for the Janus Henderson Funds, on average, were 7% under the average management fees for their Expense Groups. The Trustees also considered the total expenses for each share class of
Janus Henderson VIT Global Research Portfolio
Additional Information (unaudited)
each Janus Henderson Fund compared to the average total expenses for its Broadridge Expense Group peers and to average total expenses for its Broadridge Expense Universe.
For certain Janus Henderson Funds, the independent fee consultant also performed a systematic “focus list” analysis of expenses which assessed fund fees in the context of fund performance being delivered. Based on this analysis, the independent fee consultant found that the combination of service quality/performance and expenses on these individual Janus Henderson Funds was reasonable in light of performance trends, performance histories, and existence of performance fees, breakpoints, and/or expense waivers on such Janus Henderson Funds.
The Trustees considered the methodology used by Janus Capital and each subadviser in determining compensation payable to portfolio managers, the competitive environment for investment management talent, and the competitive market for mutual funds in different distribution channels.
The Trustees also reviewed management fees charged by Janus Capital and each subadviser to comparable separate account clients and to comparable non-affiliated funds subadvised by Janus Capital or by a subadviser (for which Janus Capital or the subadviser provides only or primarily portfolio management services). Although in most instances subadvisory and separate account fee rates for various investment strategies were lower than management fee rates for Janus Henderson Funds having a similar strategy, the Trustees considered that Janus Capital noted that, under the terms of the management agreements with the Janus Henderson Funds, Janus Capital performs significant additional services for the Janus Henderson Funds that it does not provide to those other clients, including administration services, oversight of the Janus Henderson Funds’ other service providers, trustee support, regulatory compliance and numerous other services, and that, in serving the Janus Henderson Funds, Janus Capital assumes many legal risks and other costs that it does not assume in servicing its other clients. Moreover, they noted that the independent fee consultant found that: (1) the management fees Janus Capital charges to the Janus Henderson Funds are reasonable in relation to the management fees Janus Capital charges to funds subadvised by Janus Capital and to the fees Janus Capital charges to its institutional separate account clients; (2) these subadvised and institutional separate accounts have different service and infrastructure needs; and (3) Janus Henderson mutual fund investors enjoy reasonable fees relative to the fees charged to Janus Henderson subadvised fund and separate account investors; (4) 11 of 12 Janus Henderson Funds have lower management fees than similar funds subadvised by Janus Capital; and (5) six of nine Janus Henderson Funds have lower management fees than similar separate accounts managed by Janus Capital.
The Trustees considered the fees for each Janus Henderson Fund for its fiscal year ended in 2018, including the VIT Portfolios, and noted the following with regard to each VIT Portfolio’s total expenses, net of applicable fee waivers (the VIT Portfolio’s “total expenses”):
· For Janus Henderson Balanced Portfolio, the Trustees noted that, although the Fund’s total expenses exceeded the peer group average for one share class, overall the Fund’s total expenses were reasonable.
· For Janus Henderson Enterprise Portfolio, the Trustees noted that, although the Fund’s total expenses exceeded the peer group average for one share class, overall the Fund’s total expenses were reasonable.
· For Janus Henderson Flexible Bond Portfolio, the Trustees noted that, although the Fund’s total expenses exceeded the peer group average for one share class, overall the Fund’s total expenses were reasonable. The Trustees also noted that Janus Capital has contractually agreed to limit the Fund’s expenses, although this limit did not apply because the Fund’s total expenses were already below the applicable fee limit.
· For Janus Henderson Forty Portfolio, the Trustees noted that, although the Fund’s total expenses exceeded the peer group average for one share class, overall the Fund’s total expenses were reasonable.
· For Janus Henderson Global Research Portfolio, the Trustees noted that the Fund’s total expenses were below the peer group average for both share classes.
· For Janus Henderson Global Technology Portfolio, the Trustees noted that the Fund’s total expenses were below the peer group average for both share classes.
· For Janus Henderson Mid Cap Value Portfolio, the Trustees noted that, although the Fund’s total expenses exceeded the peer group average for one share class, overall the Fund’s total expenses were reasonable. The Trustees also noted that Janus Capital has contractually agreed to limit the Fund’s expenses, although this limit did not apply because the Fund’s total expenses were already below the applicable fee limit.
Janus Henderson VIT Global Research Portfolio
Additional Information (unaudited)
· For Janus Henderson Overseas Portfolio, the Trustees noted that the Fund’s total expenses were below the peer group average for both share classes.
· For Janus Henderson Research Portfolio, the Trustees noted that the Fund’s total expenses were below the peer group average for both share classes.
· For Janus Henderson U.S. Low Volatility Portfolio, the Trustees noted that the Fund’s total expenses were below the peer group average for its sole share class.
The Trustees reviewed information on the overall profitability to Janus Capital and its affiliates of their relationship with the Janus Henderson Funds, and considered profitability data of other publicly traded mutual fund advisers. The Trustees recognized that profitability comparisons among fund managers are difficult because of the variation in the type of comparative information that is publicly available, and the profitability of any fund manager is affected by numerous factors, including the organizational structure of the particular fund manager, differences in complex size, difference in product mix, difference in types of business (mutual fund, institutional and other), differences in the types of funds and other accounts it manages, possible other lines of business, the methodology for allocating expenses, and the fund manager’s capital structure and cost of capital.
Additionally, the Trustees considered the estimated profitability to Janus Capital from the investment management services it provided to each Janus Henderson Fund. In their review, the Trustees considered whether Janus Capital and each subadviser receive adequate incentives and resources to manage the Janus Henderson Funds effectively. In reviewing profitability, the Trustees noted that the estimated profitability for an individual Janus Henderson Fund is necessarily a product of the allocation methodology utilized by Janus Capital to allocate its expenses as part of the estimated profitability calculation. In this regard, the Trustees noted that the independent fee consultant found that (1) the expense allocation methodology and rationales utilized by Janus Capital were reasonable and (2) no clear correlation between expense allocations and operating margins. The Trustees also considered that the estimated profitability for an individual Janus Henderson Fund was influenced by a number of factors, including not only the allocation methodology selected, but also the presence of fee waivers and expense caps, and whether the Janus Henderson Fund’s investment management agreement contained breakpoints or a performance fee component. The Trustees determined, after taking into account these factors, among others, that Janus Capital’s estimated profitability with respect to each Janus Henderson Fund was not unreasonable in relation to the services provided, and that the variation in the range of such estimated profitability among the Janus Henderson Funds was not a material factor in the Board’s approval of the reasonableness of any Janus Henderson Fund’s investment management fees.
The Trustees concluded that the management fees payable by each Janus Henderson Fund to Janus Capital and its affiliates, as well as the fees paid by Janus Capital to the subadvisers of subadvised Janus Henderson Funds, were reasonable in relation to the nature, extent, and quality of the services provided, taking into account the fees charged by other advisers for managing comparable mutual funds with similar strategies, the fees Janus Capital and the subadvisers charge to other clients, and, as applicable, the impact of fund performance on management fees payable by the Janus Henderson Funds. The Trustees also concluded that each Janus Henderson Fund’s total expenses were reasonable, taking into account the size of the Janus Henderson Fund, the quality of services provided by Janus Capital and any subadviser, the investment performance of the Janus Henderson Fund, and any expense limitations agreed to or provided by Janus Capital.
Economies of Scale
The Trustees considered information about the potential for Janus Capital to realize economies of scale as the assets of the Janus Henderson Funds increase. They noted that their independent fee consultant published a report to the Trustees in November 2019 which provided its research and analysis into economies of scale. They also noted that, although many Janus Henderson Funds pay advisory fees at a base fixed rate as a percentage of net assets, without any breakpoints or performance fees, their independent fee consultant concluded that 64% of these Janus Henderson Funds’ share classes have contractual management fees (gross of waivers) below their Broadridge expense group averages. They also noted the following: (1) that for those Janus Henderson Funds whose expenses are being reduced by the contractual expense limitations of Janus Capital, Janus Capital is subsidizing certain of these Janus Henderson Funds because they have not reached adequate scale; (2) as the assets of some of the Janus Henderson Funds have declined in the past few years, certain Janus Henderson Funds have benefited from having advisory fee rates that have remained constant rather than increasing as assets declined; (3) performance fee structures have been implemented for various Janus Henderson Funds that have caused the effective rate of advisory fees payable by such a
Janus Henderson VIT Global Research Portfolio
Additional Information (unaudited)
Janus Henderson Fund to vary depending on the investment performance of the Janus Henderson Fund relative to its benchmark index over the measurement period; and (4) a few Janus Henderson Funds have fee schedules with breakpoints and reduced fee rates above certain asset levels. The Trustees also noted that the Janus Henderson Funds share directly in economies of scale through the lower charges of third-party service providers that are based in part on the combined scale of all of the Janus Henderson Funds.
The Trustees also considered the independent fee consultant’s conclusion that, given the limitations of various analytical approaches to economies of scale and their conflicting results, it is difficult to analytically confirm or deny the existence of economies of scale in the Janus Henderson complex. In this regard, the independent consultant concluded that (1) to the extent there were economies of scale at Janus Capital, Janus Capital’s general strategy of setting fixed management fees below peers appeared to share any such economies with investors even on smaller Janus Henderson Funds which have not yet achieved those economies and (2) by setting lower fixed fees from the start on these Janus Henderson Funds, Janus Capital appeared to be investing to increase the likelihood that these Janus Henderson Funds will grow to a level to achieve any scale economies that may exist. Further, the independent fee consultant provided its belief that Janus Henderson Fund investors are well-served by the fee levels and performance fee structures in place on the Janus Henderson Funds in light of any economies of scale that may be present at Janus Capital.
Based on all of the information reviewed, including the recent and past research and analysis conducted by the Trustees’ independent fee consultant, the Trustees concluded that the current fee structure of each Janus Henderson Fund was reasonable and that the current rates of fees do reflect a sharing between Janus Capital and the Janus Henderson Fund of any economies of scale that may be present at the current asset level of the Janus Henderson Fund.
Other Benefits to Janus Capital
The Trustees also considered benefits that accrue to Janus Capital and its affiliates and subadvisers to the Janus Henderson Funds from their relationships with the Janus Henderson Funds. They recognized that two affiliates of Janus Capital separately serve the Janus Henderson Funds as transfer agent and distributor, respectively, and the transfer agent receives compensation directly from the non-money market funds for services provided, and that such compensation contributes to the overall profitability of Janus Capital and its affiliates that results from their relationship with the Janus Henderson Funds. The Trustees also considered Janus Capital’s past and proposed use of commissions paid by the Janus Henderson Funds on portfolio brokerage transactions to obtain proprietary and third-party research products and services benefiting the Janus Henderson Fund and/or other clients of Janus Capital and/or Janus Capital, and/or a subadviser to a Janus Henderson Fund. The Trustees concluded that Janus Capital’s and the subadvisers’ use of these types of client commission arrangements to obtain proprietary and third-party research products and services was consistent with regulatory requirements and guidelines and was likely to benefit each Janus Henderson Fund. The Trustees also concluded that, other than the services provided by Janus Capital and its affiliates and subadvisers pursuant to the agreements and the fees to be paid by each Janus Henderson Fund therefor, the Janus Henderson Funds and Janus Capital and the subadvisers may potentially benefit from their relationship with each other in other ways. They concluded that Janus Capital and its affiliates share directly in economies of scale through the lower charges of third-party service providers that are based in part on the combined scale of the Janus Henderson Funds and other clients serviced by Janus Capital and its affiliates. They also concluded that Janus Capital and/or the subadvisers benefit from the receipt of research products and services acquired through commissions paid on portfolio transactions of the Janus Henderson Funds and that the Janus Henderson Funds benefit from Janus Capital’s and/or the subadvisers’ receipt of those products and services as well as research products and services acquired through commissions paid by other clients of Janus Capital and/or other clients of the subadvisers. They further concluded that the success of any Janus Henderson Fund could attract other business to Janus Capital, the subadvisers or other Janus Henderson funds, and that the success of Janus Capital and the subadvisers could enhance Janus Capital’s and the subadvisers’ ability to serve the Janus Henderson Funds.
LIQUIDITY RISK MANAGEMENT PROGRAM
Janus Henderson Funds (other than the money market funds) have adopted and implemented a written liquidity risk management program (the “LRMP”) as required by Rule 22e-4 under the Investment Company Act of 1940, as amended (the “Liquidity Rule”). Rule 22e-4, requires open-end funds to adopt and implement a written liquidity risk management program that is reasonably designed to assess and manage liquidity risk, which is the risk that a fund could not meet redemption requests without significant dilution of remaining investors’ interest in the fund. The LRMP
Janus Henderson VIT Global Research Portfolio
Additional Information (unaudited)
incorporates the following elements: (i) assessment, management, and periodic review of liquidity risk; (ii) classification of portfolio investments; (iii) the establishment and monitoring of a highly liquid investment minimum, as applicable; (iv) a 15% limitation on a Portfolio’s illiquid investments; (v) redemptions in-kind; and (vi) board oversight.
The Trustees have designated Janus Capital Management LLC, the Portfolio’s investment adviser (“Janus Capital”), as the Program Administrator for the LRMP responsible for administering the LRMP and carrying out the specific responsibilities of the LRMP. A working group comprised of various groups within Janus Capital’s business is responsible for administering the LRMP and carrying out the specific responsibilities of different aspects of the LRMP.
The Liquidity Rule requires the Trustees to review at least annually a written report provided by the Program Administrator that addresses the operation of the LRMP and assesses its adequacy and the effectiveness of its implementation, including, if applicable, the operation of the highly liquid investment minimum, and any material changes to the LRMP (the “Program Administrator Report”). During the semi-annual period ended June 30, 2020, the Program Administrator provided the Program Administrator Report to the Trustees which covered the operation of the LRMP from December 1, 2018 through December 31, 2019 (the “Reporting Period”). No significant liquidity events impacting the Portfolio were noted in the Program Administrator Report, and the Portfolio was able to process redemptions during the normal course of business during the Reporting Period. In addition, the Program Administrator expressed its belief in the Program Administrator Report that:
· the LRMP is reasonably designed and adequate to assess and manage the Portfolio’s liquidity risk, taking into account the Portfolio’s particular risks and circumstances, and includes policies and procedures reasonably designed to implement each required component of the Liquidity Rule; and
· the LRMP, including the Highly Liquid Investment Minimum where applicable, was implemented and operated effectively to achieve the goal of assessing and managing the Portfolio’s liquidity risk.
There can be no assurance that the LRMP will achieve its objectives in the future. Please refer to your Fund’s prospectus for more information regarding the risks to which an investment in the Fund may be subject.
Janus Henderson VIT Global Research Portfolio
Useful Information About Your Portfolio Report (unaudited)
Management Commentary
The Management Commentary in this report includes valuable insight as well as statistical information to help you understand how your Portfolio’s performance and characteristics stack up against those of comparable indices.
If the Portfolio invests in foreign securities, this report may include information about country exposure. Country exposure is based primarily on the country of risk. A company may be allocated to a country based on other factors such as location of the company’s principal office, the location of the principal trading market for the company’s securities, or the country where a majority of the company’s revenues are derived.
Please keep in mind that the opinions expressed in the Management Commentary are just that: opinions. They are a reflection based on best judgment at the time this report was compiled, which was June 30, 2020. As the investing environment changes, so could opinions. These views are unique and are not necessarily shared by fellow employees or by Janus Henderson in general.
Performance Overviews
Performance overview graphs compare the performance of a hypothetical $10,000 investment in the Portfolio with one or more widely used market indices. When comparing the performance of the Portfolio with an index, keep in mind that market indices are not available for investment and do not reflect deduction of expenses.
Average annual total returns are quoted for a Portfolio with more than one year of performance history. Average annual total return is calculated by taking the growth or decline in value of an investment over a period of time, including reinvestment of dividends and distributions, then calculating the annual compounded percentage rate that would have produced the same result had the rate of growth been constant throughout the period. Average annual total return does not reflect the deduction of taxes that a shareholder would pay on Portfolio distributions or redemptions of Portfolio shares.
Cumulative total returns are quoted for a Portfolio with less than one year of performance history. Cumulative total return is the growth or decline in value of an investment over time, independent of the period of time involved. Cumulative total return does not reflect the deduction of taxes that a shareholder would pay on Portfolio distributions or redemptions of Portfolio shares.
Pursuant to federal securities rules, expense ratios shown in the performance chart reflect subsidized (if applicable) and unsubsidized ratios. The total annual fund operating expenses ratio is gross of any fee waivers, reflecting the Portfolio’s unsubsidized expense ratio. The net annual fund operating expenses ratio (if applicable) includes contractual waivers of Janus Capital and reflects the Portfolio’s subsidized expense ratio. Ratios may be higher or lower than those shown in the “Financial Highlights” in this report.
Schedule of Investments
Following the performance overview section is the Portfolio’s Schedule of Investments. This schedule reports the types of securities held in the Portfolio on the last day of the reporting period. Securities are usually listed by type (common stock, corporate bonds, U.S. Government obligations, etc.) and by industry classification (banking, communications, insurance, etc.). Holdings are subject to change without notice.
The value of each security is quoted as of the last day of the reporting period. The value of securities denominated in foreign currencies is converted into U.S. dollars.
If the Portfolio invests in foreign securities, it will also provide a summary of investments by country. This summary reports the Portfolio exposure to different countries by providing the percentage of securities invested in each country. The country of each security represents the country of risk. The Portfolio’s Schedule of Investments relies upon the industry group and country classifications published by Barclays and/or MSCI Inc.
Tables listing details of individual forward currency contracts, futures, written options, swaptions, and swaps follow the Portfolio’s Schedule of Investments (if applicable).
Statement of Assets and Liabilities
This statement is often referred to as the “balance sheet.” It lists the assets and liabilities of the Portfolio on the last day of the reporting period.
Janus Henderson VIT Global Research Portfolio
Useful Information About Your Portfolio Report (unaudited)
The Portfolio’s assets are calculated by adding the value of the securities owned, the receivable for securities sold but not yet settled, the receivable for dividends declared but not yet received on securities owned, and the receivable for Portfolio shares sold to investors but not yet settled. The Portfolio’s liabilities include payables for securities purchased but not yet settled, Portfolio shares redeemed but not yet paid, and expenses owed but not yet paid. Additionally, there may be other assets and liabilities such as unrealized gain or loss on forward currency contracts.
The section entitled “Net Assets Consist of” breaks down the components of the Portfolio’s net assets. Because the Portfolio must distribute substantially all earnings, you will notice that a significant portion of net assets is shareholder capital.
The last section of this statement reports the net asset value (“NAV”) per share on the last day of the reporting period. The NAV is calculated by dividing the Portfolio’s net assets for each share class (assets minus liabilities) by the number of shares outstanding.
Statement of Operations
This statement details the Portfolio’s income, expenses, realized gains and losses on securities and currency transactions, and changes in unrealized appreciation or depreciation of Portfolio holdings.
The first section in this statement, entitled “Investment Income,” reports the dividends earned from securities and interest earned from interest-bearing securities in the Portfolio.
The next section reports the expenses incurred by the Portfolio, including the advisory fee paid to the investment adviser, transfer agent fees and expenses, and printing and postage for mailing statements, financial reports and prospectuses. Expense offsets and expense reimbursements, if any, are also shown.
The last section lists the amounts of realized gains or losses from investment and foreign currency transactions, and changes in unrealized appreciation or depreciation of investments and foreign currency-denominated assets and liabilities. The Portfolio will realize a gain (or loss) when it sells its position in a particular security. A change in unrealized gain (or loss) refers to the change in net appreciation or depreciation of the Portfolio during the reporting period. “Net Realized and Unrealized Gain/(Loss) on Investments” is affected both by changes in the market value of Portfolio holdings and by gains (or losses) realized during the reporting period.
Statements of Changes in Net Assets
These statements report the increase or decrease in the Portfolio’s net assets during the reporting period. Changes in the Portfolio’s net assets are attributable to investment operations, dividends and distributions to investors, and capital share transactions. This is important to investors because it shows exactly what caused the Portfolio’s net asset size to change during the period.
The first section summarizes the information from the Statement of Operations regarding changes in net assets due to the Portfolio’s investment operations. The Portfolio’s net assets may also change as a result of dividend and capital gains distributions to investors. If investors receive their dividends and/or distributions in cash, money is taken out of the Portfolio to pay the dividend and/or distribution. If investors reinvest their dividends and/or distributions, the Portfolio’s net assets will not be affected. If you compare the Portfolio’s “Net Decrease from Dividends and Distributions” to “Reinvested Dividends and Distributions,” you will notice that dividends and distributions have little effect on the Portfolio’s net assets. This is because the majority of the Portfolio’s investors reinvest their dividends and/or distributions.
The reinvestment of dividends and distributions is included under “Capital Share Transactions.” “Capital Shares” refers to the money investors contribute to the Portfolio through purchases or withdrawals via redemptions. The Portfolio’s net assets will increase and decrease in value as investors purchase and redeem shares from the Portfolio.
Financial Highlights
This schedule provides a per-share breakdown of the components that affect the Portfolio’s NAV for current and past reporting periods as well as total return, asset size, ratios, and portfolio turnover rate.
The first line in the table reflects the NAV per share at the beginning of the reporting period. The next line reports the net investment income/(loss) per share. Following is the per share total of net gains/(losses), realized and unrealized. Per share dividends and distributions to investors are then subtracted to arrive at the NAV per share at the end of the period. The next line reflects the total return for the period. The total return may include adjustments in accordance with
Janus Henderson VIT Global Research Portfolio
Useful Information About Your Portfolio Report (unaudited)
generally accepted accounting principles required at the period end for financial reporting purposes. As a result, the total return may differ from the total return reflected for individual shareholder transactions. Also included are ratios of expenses and net investment income to average net assets.
The Portfolio’s expenses may be reduced through expense offsets and expense reimbursements. The ratios shown reflect expenses before and after any such offsets and reimbursements.
The ratio of net investment income/(loss) summarizes the income earned less expenses, divided by the average net assets of the Portfolio during the reporting period. Do not confuse this ratio with the Portfolio’s yield. The net investment income ratio is not a true measure of the Portfolio’s yield because it does not take into account the dividends distributed to the Portfolio’s investors.
The next figure is the portfolio turnover rate, which measures the buying and selling activity in the Portfolio. Portfolio turnover is affected by market conditions, changes in the asset size of the Portfolio, fluctuating volume of shareholder purchase and redemption orders, the nature of the Portfolio’s investments, and the investment style and/or outlook of the portfolio manager(s) and/or investment personnel. A 100% rate implies that an amount equal to the value of the entire portfolio was replaced once during the fiscal year; a 50% rate means that an amount equal to the value of half the portfolio is traded in a year; and a 200% rate means that an amount equal to the value of the entire portfolio is traded every six months.
Janus Henderson VIT Global Research Portfolio
Notes
NotesPage1
Janus Henderson VIT Global Research Portfolio
Notes
NotesPage2
Janus Henderson VIT Global Research Portfolio
Notes
NotesPage3
Knowledge Shared
At Janus Henderson, we believe in the sharing of expert insight for better investment and business decisions. We call this ethos Knowledge Shared.
Learn more by visiting janushenderson.com.
| | | | | | | | | |
| | | | | |

| | | | |
This report is submitted for the general information of shareholders of the Portfolio. It is not an offer or solicitation for the Portfolio and is not authorized for distribution to prospective investors unless preceded or accompanied by an effective prospectus. |
Janus Henderson, Janus, Henderson, Perkins, Intech and Knowledge Shared are trademarks of Janus Henderson Group plc or one of its subsidiaries. © Janus Henderson Group plc Janus Henderson Distributors |
| | | | | 109-24-81112 08-20 |
| | | | | | |
| | | |
| | | SEMIANNUAL REPORT June 30, 2020 |
| | |
| | Janus Henderson VIT Global Technology and Innovation Portfolio (formerly Janus Henderson VIT Global Technology Portfolio) |
| | |
| | Janus Aspen Series |
Beginning on January 1, 2021, as permitted by regulations adopted by the Securities and Exchange Commission, the insurance company that offers your variable life insurance contract or variable annuity contract, may determine that it will no longer send you paper copies of the Portfolio’s shareholder reports, unless you specifically request paper copies of the reports. Beginning on January 1, 2021, for shareholders who are not insurance contract holders, paper copies of the Portfolio’s shareholder reports will no longer be sent by mail unless you specifically request paper copies of the reports. Instead, the reports will be made available on a website, and your insurance company or plan sponsor, broker-dealer, or financial intermediary will notify you by mail each time a report is posted and provide you with a website link to access the report. Instructions for requesting paper copies will be provided by your insurance company or plan sponsor, broker-dealer, or financial intermediary. If you already elected to receive shareholder reports electronically, you will not be affected by this change and you need not take any action. You may elect to receive shareholder reports and other communications from the Portfolio electronically by contacting your insurance company or plan sponsor, broker-dealer, or other financial intermediary. You may elect to receive all future reports in paper free of charge by contacting your insurance company or plan sponsor, broker dealer or other financial intermediary. Your election to receive reports in paper will apply to all funds held in your account with your insurance company or plan sponsor, broker dealer or other financial intermediary. |
| | | HIGHLIGHTS · Portfolio management perspective · Investment strategy behind your portfolio · Portfolio performance, characteristics
and holdings |
| | | |
| | | 
|
Table of Contents
Janus Henderson VIT Global Technology and Innovation Portfolio
Janus Henderson VIT Global Technology and Innovation Portfolio (unaudited)
| | | | | | |
PORTFOLIO SNAPSHOT Our mission is to find companies that benefit from the high pace of change in technology. We believe technology markets are complex, adaptive systems that demonstrate emergent properties and inherently unpredictable changes. Combined with deep fundamental industry analysis and thoughtful valuation and scenario analysis, we seek to invest in stocks that have the potential to outperform without relying on difficult predictions about the future. | | | | | 
Denny Fish portfolio manager |
| | | |
PERFORMANCE OVERVIEW
During the six months ended June 30, 2020, Janus Henderson VIT Global Technology Portfolio’s Institutional Shares and Service Shares returned 17.75% and 17.49%, respectively. By comparison, the Portfolio’s benchmarks, the S&P 500® Index and the MSCI All Country World Information Technology IndexSM, returned -3.08% and 12.21%, respectively.
INVESTMENT ENVIRONMENT
Global equity markets endured a tumultuous period as economic activity across much of the world contracted as countries dealt with the COVID-19 pandemic. Later, stocks surged on large-scale policy responses. Throughout both the sell-off and recovery, tech stocks outperformed broader equities as many of the sector’s products were relied upon to help consumers and businesses navigate social distancing measures.
PERFORMANCE DISCUSSION
Since we believe technology markets are complex, we construct a Portfolio with special attention to downside risk that seeks to balance resilience and optionality. Resilience positions tend to be larger, established companies with more stable, long duration growth profiles. Positions that exhibit optionality tend to be companies earlier in their growth cycle with potential for higher sustainable growth. We believe our focus on stocks that are less volatile on a risk-adjusted basis than those in the MSCI benchmark and that are well positioned to benefit from the rapid rate of change in technology will provide better performance for our shareholders over the long term.
Perhaps no other company registered an increase in demand for its products more than Amazon. E-commerce went mainstream as households sheltered in place and slow adopters of online shopping became reliant on digital purchases. Similarly, the company’s cloud business proved to be a valuable tool for companies seeking to increase their capabilities as customers and employees adapted to working remotely.
The increased usage of e-commerce also aided Brazil’s MercadoLibre. The company registered a marked increase in transactions on its digital payments platform as well. This payments platform and e-commerce activity are primed to grow in coming years as the penetration of these services in Latin America rises toward the levels registered in the U.S. and China.
Given the large share of the Index that Apple commands, we maintain an underweight in the stock. This can detract from Fund results when the stock outperforms, as was the case this quarter. We have increased our exposure to Apple given our favorable view of the company’s transition to a model geared more to services and wearables.
Another detractor was Alibaba. The company is undergoing a significant investment cycle, but so far, few of its potential new endeavors have convinced shareholders that these investments will result in lucrative new products or markets. On a positive note, Alibaba could be one of the key beneficiaries of a move to Hong Kong listing whereby Chinese investors will have the ability to directly invest in it.
Please see the Derivative Instruments section in the “Notes to Financial Statements” for a discussion of derivatives used by the Portfolio.
OUTLOOK
The technology sector finds itself in a unique position as the global economy continues to navigate the COVID-19 pandemic. The recent broad equities rally indicates that investors believe economic growth is close to finding sound footing. Should that be the case, we’d expect more economically sensitive segments of tech to perform well.
Janus Henderson VIT Global Technology and Innovation Portfolio (unaudited)
Among these are semiconductors, digital advertising and payments. The latter category is of note, as we’d expect it to behave more like software than semis. But while we believe digital payments are a durable, secular theme, these businesses weren’t constructed to withstand a shutdown of the global economy. While this has resulted in payment stocks lagging, we believe these business models are well positioned to participate in an increasingly digital economy.
Should an economic recovery remain elusive, however, we’d expect other secular growth themes to remain favored investment destinations. Among these are e-commerce, the cloud, the Internet of Things and artificial intelligence.
Thank you for your investment in Janus Henderson VIT Global Technology Portfolio.
Janus Henderson VIT Global Technology and Innovation Portfolio (unaudited)
Portfolio At A Glance
June 30, 2020
| | | | | | | | | | |
| | | | | | | | | |
| | | | | | | | | |
| | | | | | | | | |
| 5 Top Contributors - Holdings | 5 Top Detractors - Holdings |
| | Average
Weight | | Relative
Contribution | | | Average
Weight | | Relative
Contribution |
| Amazon.com Inc | 4.64% | | 1.53% | | Microsoft Corp | 7.91% | | -1.03% |
| Cadence Design Systems Inc | 1.79% | | 0.51% | | Apple Inc | 5.69% | | -1.02% |
| Avalara Inc | 0.87% | | 0.49% | | PayPal Holdings Inc | 0.45% | | -0.50% |
| Samsung Electronics Co Ltd | 0.62% | | 0.48% | | ON Semiconductor Corporation | 0.40% | | -0.44% |
| Adobe Inc | 4.49% | | 0.47% | | Amphenol Corporation Class A | 0.95% | | -0.43% |
| | | | | | | |
| 4 Top Contributors - Sectors* | | | | | |
| | | Relative | | Portfolio | MSCI All Country World Information Technology Index |
| | | Contribution | | Average Weight | Average Weight |
| Information Technology | | 3.18% | | 70.49% | 100.00% |
| Consumer Discretionary | | 2.44% | | 9.89% | 0.00% |
| Communication Services | | 0.67% | | 10.48% | 0.00% |
| Real Estate | | 0.45% | | 4.46% | 0.00% |
| | | | | | |
| | | | | | |
| 2 Top Detractors - Sectors* | | | | | |
| | | Relative | | Portfolio | MSCI All Country World Information Technology Index |
| | | Contribution | | Average Weight | Average Weight |
| Other** | | -0.98% | | 3.17% | 0.00% |
| Industrials | | -0.25% | | 1.51% | 0.00% |
| | | | | | | |
| Relative contribution reflects how the portolio's holdings impacted return relative to the benchmark. Cash and securities not held in the portfolio are not shown. For equity portfolios, relative contribution compares the performance of a security in the portfolio to the benchmark's total return, factoring in the difference in weight of that security in the benchmark. Returns are calculated using daily returns and previous day ending weights rolled up by ticker, excluding fixed income securities, gross of advisory fees, may exclude certain derivatives and will differ from actual performance.
Performance attribution reflects returns gross of advisory fees and may differ from actual returns as they are based on end of day holdings. Attribution is calculated by geometrically linking daily returns for the portfolio and index. |
* | Based on sector classification according to the Global Industry Classification Standard (“GICS”) codes, which are the exclusive property and a service mark of MSCI Inc. and Standard & Poor’s. |
** | Not a GICS classified sector. |
Janus Henderson VIT Global Technology and Innovation Portfolio (unaudited)
Portfolio At A Glance
June 30, 2020